Volume 10, Issue 3, March 2021

Welcome message from author
This document is posted to help you gain knowledge. Please leave a comment to let me know what you think about it! Share it to your friends and learn new things together.
Transcript

Volume 10, Issue 3, March 2021

International Journal of Innovative Research in Science, Engineering and Technology (IJIRSET)
| e-ISSN: 2319-8753, p-ISSN: 2320-6710| www.ijirset.com | Impact Factor: 7.512|
|| Volume 10, Issue 3, March 2021 ||
DOI:10.15680/IJIRSET.2021.1003170
IJIRSET © 2021 | An ISO 9001:2008 Certified Journal | 2450
Analysis of Power Flow Solution with Unified Power Flow Controller
Deepika Prajapati, Manish Awasthi
Department of Electrical Engineering, Jawaharlal Nehru College of Technology, Rewa, Madhya Pradesh, India
ABSTRACT: The electric power system function is to maintain the power plants under pool operation and utility centres to supply the active and reactive powers demanded by the loads connected to the system. Now a day’s transmission systems are difficult to operate as well as more stressed due to unscheduled power flows and more losses of growing demand. However many HV systems are operating below thermal rating due to the voltage and stability limit. Later on rapid development in the technology introduces high rating and fast acting switching devices with power electronic components. Flexible AC transmission system (FACTs) controllers equipped with fast acting semi conductor devices designed to control one or more power system parameters for the effective operation of system. In this paper, a novel FACTs controller namely, unified power flow controller (UPFC) is proposed with its current injection model along with its incorporation procedure. The effect of this device on system parameters is analysed on standard test systems with its graphical and numerical results. KEYWORDS: UPFC, FACT , GTO ,STATCOM, SSSC, MATLAB Simulink.
I.INTRODUCTION
The modern power system has developed in to large scale AC-DC interconnected power grid, while the imbalance of regional power generation and load distribution as well as the uneven distribution of power transmission have become more and more severe, making it difficult for power supply capability to be fully utilized, besides owning to restriction of urban planning, the difficult of line and grid renovation and expansion keeps increasing and with the constraints of complex system structure, heavy operational task ,high requirements of power quality, as well as environmental protection there has been a growing demand for economic and reliable operation of the transmission grid however the lack of tradition control measure and low level of automation are the main factor restraining power transmission and are the potential risk factor for system crashes [1] As a new solution UPFC brings out an unprecedented opportunity to power flow control as well as improving system stability and transmission capacity, Unified power flow controller (UPFC) has been the most versatile Flexible AC Transmission System (FACTS) device due to its ability to control real and reactive power flow on transmission lines while controlling the voltage of the bus to which it is connected. UPFC being a multi-variable power system controller it is necessary to analyse its effect on power system operation. To study the performance of the UPFC in damping power oscillations using MATLAB software, a de-coupled control system has been designed for the shunt inverter to control the UPFC bus voltage and the DC link capacitor voltage. The series inverter of a UPFC controls the real power flow in the transmission line. [1][2] 1.1 GENERAL POWER FLOW CONCEPTS : The power flow problem, is solved to determine the steady-state complex voltages at all buses of the network, from which the active and reactive power flows in every transmission line and transformer are calculated (Stagg and El-Abiad, 1968). The set of equations representing the power system are nonlinear. For most practical purposes, all power flow methods exploit the well-conformed nodal properties of the power network and equipment. In its most basic form, these equations are derived by assuming that a perfect symmetry exists between the phases of the three-phase power system (Arrillaga and Arnold, 1990). Owing to the nonlinear nature of the power flow equations, the numerical solution is reached by iteration (Grainger and Stevenson, 1994). This is a problem of great engineering complexity where the following operational policies must be observed: (1) nodal voltage magnitudes and system frequency must be kept within narrow boundaries; (2) the alternating current (AC) voltage and current waveforms must remain largely sinusoida l; (3) transmission lines must be operated well below their thermal and stability limits; and (4) even short -term interruptions must be kept to a minimum. Moreover, because of the very competitive nature of the electricity supply business in an era of dere gulation and open access, transmission costs must be kept as low as possible[21].

International Journal of Innovative Research in Science, Engineering and Technology (IJIRSET)
| e-ISSN: 2319-8753, p-ISSN: 2320-6710| www.ijirset.com | Impact Factor: 7.512|
|| Volume 10, Issue 3, March 2021 ||
DOI:10.15680/IJIRSET.2021.1003170
IJIRSET © 2021 | An ISO 9001:2008 Certified Journal | 2451
Fig 1.1(a) simple two-machine system
The power flow on transmission line from location 1 and 2 could be any transmission substations connected by a transmission line shown in [figure 1.1(a)] Substations may have loads, generation, or may be interconnecting points on the system and for simplicity they are assumed to be stiff busses. E1 and E2 are the magnitudes of the bus voltages with an angle 6 between the two. The line is assumed to have inductive impedance X, and the line resistance and capacitance are ignored.
Fig 1.1(b) active and reactive power flow phasor diagram;
II. WORKING PRINCIPLE OF OUPFC
The Unified Power Flow Controller (UPFC) concept was proposed by Gyugyi in 1991. The UPFC was devised for the real-time control and dynamic compensation of ac transmission systems, providing multifunctional flexibility required to solve many of the problems facing the power delivery industry. Within the framework of tra ditional power transmission concepts, the UPFC is able to control, simultaneously or selectively, all the parameters affecting power flow in the transmission line (i.e., voltage, impedance, and phase angle), and this unique capability is signified by the adjective "unified" in its name. Alternatively, it can independently control both the real and .reactive power flow in the line. The reader should recall that, for all the Controllers discussed in the previous chapters, the control of real power is associated with similar change in reactive power, i.e., increased real power flow also resulted in increased reactive line power. Voltage source V, is connected to the transmission line through a transformer represented as a reactance X,. It is assumed that the voltage sources denoted by Vsh and Vse have the capabilities of varying their magnitude and their phase angle[2][3]
International Journal of Innovative Research in Science, Engineering and Technology (IJIRSET)
| e-ISSN: 2319-8753, p-ISSN: 2320-6710| www.ijirset.com | Impact Factor: 7.512|
|| Volume 10, Issue 3, March 2021 ||
DOI:10.15680/IJIRSET.2021.1003170
IJIRSET © 2021 | An ISO 9001:2008 Certified Journal | 2452
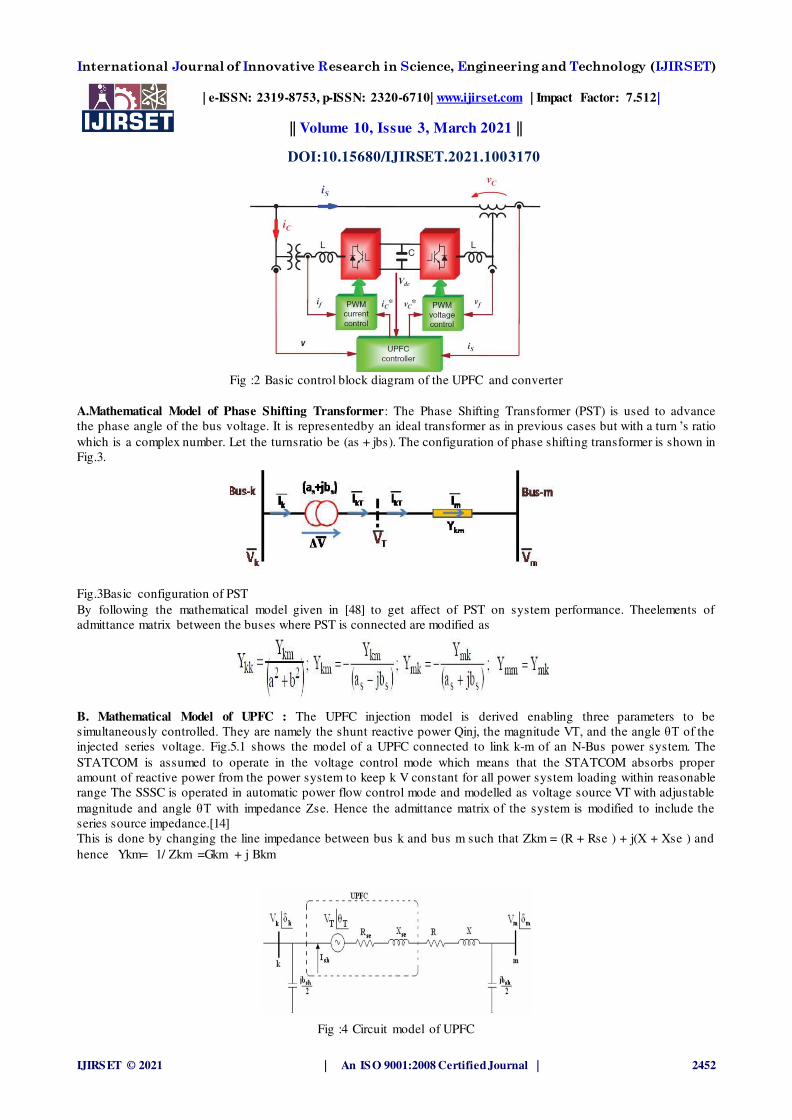
Fig :2 Basic control block diagram of the UPFC and converter
A.Mathematical Model of Phase Shifting Transformer: The Phase Shifting Transformer (PST) is used to advance the phase angle of the bus voltage. It is representedby an ideal transformer as in previous cases but with a turn ’s ratio which is a complex number. Let the turnsratio be (as + jbs). The configuration of phase shifting transformer is shown in Fig.3.
Fig.3Basic configuration of PST By following the mathematical model given in [48] to get affect of PST on system performance. Theelements of admittance matrix between the buses where PST is connected are modified as
B. Mathematical Model of UPFC : The UPFC injection model is derived enabling three parameters to be simultaneously controlled. They are namely the shunt reactive power Qinj, the magnitude VT, and the angle θT of the injected series voltage. Fig.5.1 shows the model of a UPFC connected to link k-m of an N-Bus power system. The STATCOM is assumed to operate in the voltage control mode which means that the STATCOM absorbs proper amount of reactive power from the power system to keep k V constant for all power system loading within reasonable range The SSSC is operated in automatic power flow control mode and modelled as voltage source VT with adjustable magnitude and angle θT with impedance Zse. Hence the admittance matrix of the system is modified to include the series source impedance.[14] This is done by changing the line impedance between bus k and bus m such that Zkm = (R + Rse ) + j(X + Xse ) and hence Ykm= 1/ Zkm =Gkm + j Bkm
Fig :4 Circuit model of UPFC

International Journal of Innovative Research in Science, Engineering and Technology (IJIRSET)
| e-ISSN: 2319-8753, p-ISSN: 2320-6710| www.ijirset.com | Impact Factor: 7.512|
|| Volume 10, Issue 3, March 2021 ||
DOI:10.15680/IJIRSET.2021.1003170
IJIRSET © 2021 | An ISO 9001:2008 Certified Journal | 2453
The power flow equations for all the nodes in the system with UPFC in place, are the same as those of the system without UPFC except for buses k and m, which are as follows Pk = 𝑃𝑘𝑚 + ∑ |𝑉𝑘||𝑉𝑗||𝑌𝑘𝑗| cos(𝛿𝑘 − 𝛿𝑗 − 𝜃𝑘𝑗)𝑁𝐽=1 ……..1
Qk = Q km + ∑ |𝑉𝑘||𝑉𝑗||𝑌𝑘𝑗| sin(𝛿𝑘 − 𝛿𝑗 − 𝜃𝑘𝑗)𝑁𝐽=1 ……2
Pm = Pm + ∑ |𝑉𝑚||𝑉𝑗||𝑌𝑚𝑗| cos(𝛿𝑚 − 𝛿𝑗 − 𝜃𝑚𝑗)𝑁𝐽=1 ……3
Qm = Q m + ∑ |𝑉𝑚| |𝑉𝑗||𝑌𝑚𝑗| sin(𝛿𝑚 − 𝛿𝑗 − 𝜃𝑚𝑗)𝑁𝐽=1 …..4
The network equations (1-.4) are rewritten, incorporating the influence ofUPFC as: |𝑃𝐾𝑀 | = |𝐺𝐾𝑀 | + |𝑉𝑘|2 + |𝑉𝑘| |𝑉𝑇 ||𝑌𝐾𝑀| cos(𝛿𝐾 − 𝜃𝑇 − 𝜃𝐾𝑀 ) -|𝑉𝐾 ||𝑉𝑀 ||𝑌𝐾𝑀| cos(𝛿𝐾 − 𝛿𝑀 − 𝜃𝐾𝑀 )……..5
𝑄𝐾𝑀 = |𝑉𝐾 |𝐼𝑠ℎ − 𝐵𝐾𝑀 |𝑉𝑘|2 + |𝑉𝑘||𝑉𝑇 ||𝑌𝐾𝑀| sin(𝛿𝐾 − 𝜃𝑇 − 𝜃𝐾𝑀 ) - |𝑉𝐾 ||𝑉𝑀 ||𝑌𝐾𝑀| sin(𝛿𝐾 − 𝛿𝑀 − 𝜃𝐾𝑀 )………6
𝑝𝑚𝑘 = 𝐺𝐾𝑀 |𝑉𝑀 |2 -𝑉𝑀 |𝑉𝑇 ||𝑌𝐾𝑀| cos(𝛿𝑀 − 𝜃𝑇 − 𝜃𝐾𝑀 ) - |𝑉𝑀 ||𝑉𝐾 ||𝑌𝐾𝑀| cos(𝛿𝑀 − 𝛿𝐾 − 𝜃𝐾𝑀 )……..7
𝑄𝐾𝑀 = −𝐵𝐾𝑀 |𝑉𝑀 |2 + |𝑉𝑀 ||𝑉𝐾 ||𝑌𝐾𝑀| sin(𝛿𝑀 − 𝜃𝐾 − 𝜃𝐾𝑀 ) - |𝑉𝑀 ||𝑉𝑇 ||𝑌𝐾𝑀| sin(𝛿𝑀 − 𝛿𝑇 − 𝜃𝐾𝑀 )…….8
The linearised Jacobian equation is (∆𝑃∆𝑄) = (𝐽1 𝐽2𝐽3 𝐽4) ( ∆𝛿∆|𝑉|)…….9
Where ∆𝑝 =𝑝𝑠𝑝𝑒𝑐 - 𝑝𝑐𝑎𝑙 ∆𝑄 = 𝑄 𝑠𝑝𝑒𝑐 -𝑄 𝑐𝑎𝑙 ΔP and ΔQ are the real and reactive power mismatches Δδ and Δ׀V׀ are the errors in phase angles and magnitudes of the voltage to be minimized J1-J4 are the partial derivatives of ΔP and ΔQ with respect to Δδ and ΔV Respectively The equations (5-8) are inserted in the above equation as follows (∆𝑃∆𝑄) = 𝐽𝑜𝑙𝑑 ( ∆𝛿∆|𝑉|) + 𝐽𝑛𝑒𝑤 ( ∆𝛿∆|𝑉|)…….10
where Jold is the normal N-R power flow Jacobian matrix.Jnew is the partial derivative matrix of the UPFC injected power with respectto the variables. The elements of Jnew are described below 𝜕𝑃𝐾𝑀𝜕𝛿𝐾 = |𝑉𝑘||𝑉𝑇 ||𝑌𝐾𝑀| sin(𝛿𝐾 − 𝜃𝑇 − 𝜃𝐾𝑀 )-|𝑉𝐾 ||𝑉𝑀 ||𝑌𝐾𝑀| sin(𝛿𝐾 − 𝛿𝑀 − 𝜃𝐾𝑀 )……………………..11 𝜕𝑃𝐾𝑀𝜕𝛿𝑚 = −|𝑉𝐾 ||𝑉𝑀 ||𝑌𝐾𝑀| sin(𝛿𝐾 − 𝛿𝑀 − 𝜃𝐾𝑀 )……………12
𝜕𝑃𝐾𝑀𝜕𝑣𝐾 = 2|𝐺𝐾𝑀 ||𝑉𝐾 | + |𝑉𝑇 ||𝑌𝐾𝑀| cos(𝛿𝐾 − 𝜃𝑇 − 𝜃𝐾𝑀 ) -|𝑉𝑀 ||𝑌𝐾𝑀| cos(𝛿𝐾 − 𝛿𝑀 − 𝜃𝐾𝑀 )……………13
𝜕𝑃𝐾𝑀𝜕𝑉𝑀 = - |𝑉𝐾 ||𝑌𝐾𝑀| cos(𝛿𝐾 − 𝛿𝑀 − 𝜃𝐾𝑀 )…………..14
International Journal of Innovative Research in Science, Engineering and Technology (IJIRSET)
| e-ISSN: 2319-8753, p-ISSN: 2320-6710| www.ijirset.com | Impact Factor: 7.512|
|| Volume 10, Issue 3, March 2021 ||
DOI:10.15680/IJIRSET.2021.1003170
IJIRSET © 2021 | An ISO 9001:2008 Certified Journal | 2454
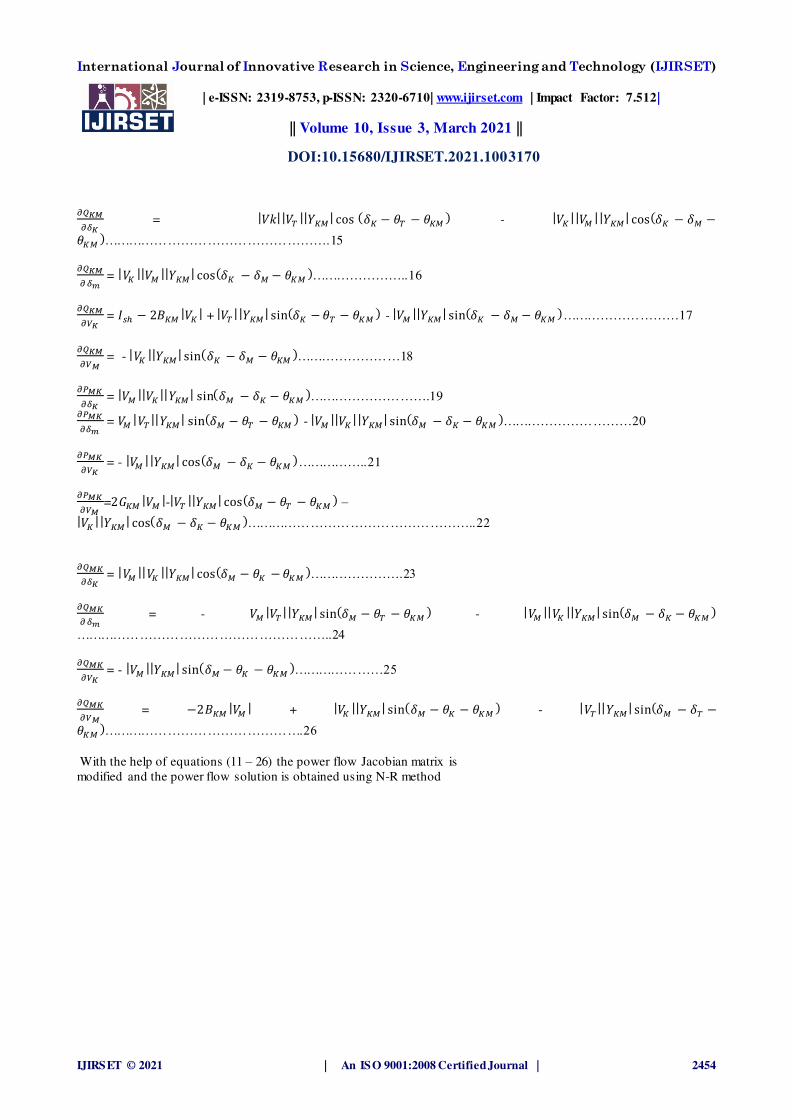
𝜕𝑄𝐾𝑀𝜕𝛿𝐾 = |𝑉𝑘||𝑉𝑇 ||𝑌𝐾𝑀| cos (𝛿𝐾 − 𝜃𝑇 − 𝜃𝐾𝑀 ) - |𝑉𝐾 ||𝑉𝑀 ||𝑌𝐾𝑀| cos(𝛿𝐾 − 𝛿𝑀 −𝜃𝐾𝑀 )…………………………………………….15 𝜕𝑄𝐾𝑀𝜕 𝛿𝑚 = |𝑉𝐾 ||𝑉𝑀 ||𝑌𝐾𝑀| cos(𝛿𝐾 − 𝛿𝑀 − 𝜃𝐾𝑀 )…………………..16
𝜕𝑄𝐾𝑀𝜕𝑉𝐾 = 𝐼𝑠ℎ − 2𝐵𝐾𝑀 |𝑉𝐾 | + |𝑉𝑇 ||𝑌𝐾𝑀| sin(𝛿𝐾 − 𝜃𝑇 − 𝜃𝐾𝑀 ) - |𝑉𝑀 ||𝑌𝐾𝑀| sin(𝛿𝐾 − 𝛿𝑀 − 𝜃𝐾𝑀 )………………………17
𝜕𝑄𝐾𝑀𝜕𝑉𝑀 = - |𝑉𝐾 ||𝑌𝐾𝑀| sin(𝛿𝐾 − 𝛿𝑀 − 𝜃𝐾𝑀 )……………………18
𝜕𝑃𝑀𝐾𝜕𝛿𝐾 = |𝑉𝑀 ||𝑉𝐾 ||𝑌𝐾𝑀| sin(𝛿𝑀 − 𝛿𝐾 − 𝜃𝐾𝑀 )……………………….19 𝜕𝑃𝑀𝐾𝜕𝛿𝑚 = 𝑉𝑀 |𝑉𝑇 ||𝑌𝐾𝑀| sin(𝛿𝑀 − 𝜃𝑇 − 𝜃𝐾𝑀 ) - |𝑉𝑀 ||𝑉𝐾 ||𝑌𝐾𝑀| sin(𝛿𝑀 − 𝛿𝐾 − 𝜃𝐾𝑀 )…………………………20
𝜕𝑃𝑀𝐾𝜕𝑉𝐾 = - |𝑉𝑀 ||𝑌𝐾𝑀| cos(𝛿𝑀 − 𝛿𝐾 − 𝜃𝐾𝑀 )……………..21
𝜕𝑃𝑀𝐾𝜕𝑉𝑀 =2𝐺𝐾𝑀 |𝑉𝑀 |-|𝑉𝑇 ||𝑌𝐾𝑀| cos(𝛿𝑀 − 𝜃𝑇 − 𝜃𝐾𝑀 ) – |𝑉𝐾 ||𝑌𝐾𝑀| cos(𝛿𝑀 − 𝛿𝐾 − 𝜃𝐾𝑀 )……………………………………………..22 𝜕𝑄𝑀𝐾𝜕𝛿𝐾 = |𝑉𝑀 ||𝑉𝐾 ||𝑌𝐾𝑀| cos(𝛿𝑀 − 𝜃𝐾 − 𝜃𝐾𝑀 )………………….23
𝜕𝑄𝑀𝐾𝜕 𝛿𝑚 = - 𝑉𝑀 |𝑉𝑇 ||𝑌𝐾𝑀| sin(𝛿𝑀 − 𝜃𝑇 − 𝜃𝐾𝑀 ) - |𝑉𝑀 ||𝑉𝐾 ||𝑌𝐾𝑀| sin(𝛿𝑀 − 𝛿𝐾 − 𝜃𝐾𝑀 )
…………………………………………………..24 𝜕𝑄𝑀𝐾𝜕𝑉𝐾 = - |𝑉𝑀 ||𝑌𝐾𝑀| sin(𝛿𝑀 − 𝜃𝐾 − 𝜃𝐾𝑀 )…………………25
𝜕𝑄𝑀𝐾𝜕𝑉𝑀 = −2𝐵𝐾𝑀 |𝑉𝑀 | + |𝑉𝐾 ||𝑌𝐾𝑀| sin(𝛿𝑀 − 𝜃𝐾 − 𝜃𝐾𝑀 ) - |𝑉𝑇 ||𝑌𝐾𝑀| sin(𝛿𝑀 − 𝛿𝑇 −𝜃𝐾𝑀 )……………………………………….26 With the help of equations (11 – 26) the power flow Jacobian matrix is modified and the power flow solution is obtained using N-R method

International Journal of Innovative Research in Science, Engineering and Technology (IJIRSET)
| e-ISSN: 2319-8753, p-ISSN: 2320-6710| www.ijirset.com | Impact Factor: 7.512|
|| Volume 10, Issue 3, March 2021 ||
DOI:10.15680/IJIRSET.2021.1003170
IJIRSET © 2021 | An ISO 9001:2008 Certified Journal | 2455
III.COMPARISON BETWEEM UPFC, STATCOM, SSSC
Fig 5 simulation model to study different model of UPFC
A Unified Power Flow Controller (UPFC) is used to control the power flow in a 500 kV transmission system. The UPFC located at the left end of the 75-km line L2, between the 500 kV buses B1 and B2, is used to control the active and reactive powers flowing through bus B2 while controlling voltage at bus B1. It consists of two 100-MVA, three-level, 48-pulse GTO-based converters, one connected in shunt at bus B1 and one connected in series between buses B1 and B2. The shunt and series converters can exchange power through a DC bus. The series converter can inject a maximum of 10% of nominal line-to-ground voltage (28.87 kV) in series with line L2 This pair of converters can be operated in three modes:
Unified Power Flow Controller (UPFC) mode, when the shunt and series converters are interconnected through the DC bus. When the disconnect switches between the DC buses of the shunt and series converter are opened, two additional modes are available:
Shunt converter operating as a Static Synchronous Compensator (STATCOM) controlling voltage at bus B1
Series converter operating as a Static Synchronous Series Capacitor (SSSC) controlling injected voltage, while keeping injected voltage in quadrature with current
"Three-phase 48-pulse GTO converter". When the two converters are operated in UPFC mode, the shunt converter operates as a STATCOM. It controls the bus B1 voltage by controlling the absorbed or generated reactive power while also allowing active power transfer to the series converter through the DC bus. The reactive power variation is obtained by varying the DC bus voltage. The four three -level shunt converters operate at a constant conduction angle (Sigma= 180-7.5 = 172.5 degrees), thus generating a quasi-sinusoidal 48-step voltage waveform. The first significant harmonics are the 47th and the 49th.[14]
When operating in UPFC mode, the magnitude of the series injected voltage is varied by varying the Sigma conduction angle, therefore generating higher harmonic contents than the shunt converter. As illustrated in this example, when the series converter operates in SSSC mode it generates a "true" 48-pulse waveform.
The natural power flow through bus B2 when zero voltage is generated by the series converter (zero voltage on converter side of the four converter transformers) is P=+870 MW and Q=-70 Mvar. In UPFC mode, both the magnitude and phase angle and the series injected voltage can be varied, thus allowing control of P and Q. The UPFC controllable region is obtained by keeping the injected voltage to its maximum value (0.1 pu) and varying its phase angle from zero to 360 degrees. To see the resulting P-Q trajectory, double click the "Show UPFC Controllable Region". Any point located inside the PQ elliptic region can be obtained in UPFC mode [14,13]

International Journal of Innovative Research in Science, Engineering and Technology (IJIRSET)
| e-ISSN: 2319-8753, p-ISSN: 2320-6710| www.ijirset.com | Impact Factor: 7.512|
|| Volume 10, Issue 3, March 2021 ||
DOI:10.15680/IJIRSET.2021.1003170
IJIRSET © 2021 | An ISO 9001:2008 Certified Journal | 2456
1 Case 1 :Power control in UPFC mode Make sure that the operation mode is set to "UPFC (Power Flow Control)". The reference active and reactive powers are specified in the last two lines of the GUI menu. Initially, Pref= +8.7 pu/100MVA (+870 MW) and Qref=-0.6 pu/100MVA (-60 Mvar). At t=0.25 sec Pref is changed to +10 pu (+1000MW). Then, at t=0.5 sec, Qref is changed to +0.7 pu (+70 Mvar). The reference voltage of the shunt converter (specified in the 2nd line of the GUI) will be kept constant at Vref=1 pu during the whole simulation (Step Time=0.3*100> Simulation stop time (0.8 sec). When the UPFC is in power control mode, the changes in STATCOM reference reactive power and in SSSC injected voltage (specified respectively in 1st and 3rd line of the GUI) as are not used.
Fig 6 simulation model of UPFC in operating power flow control
Run the simulation for 0.8 sec . Observe on traces 1 and 2 of the UPFC scope the variations of P and Q. After a transient period lasting approximately 0.15 sec, the steady state is reached (P=+8.7 pu; Q=-0.6 pu). Then P and Q are ramped to the new settings (P=+10 pu Q=+0.7 pu). Observe on traces 3 and 4 the resulting changes in P Q on the three transmission lines. The performance of the shunt and series converters can be observed respectively on the STATCOM and SSSC scopes. If you zoom on the first trace of the STATCOM scope, you can observe the 48-step voltage waveform Vs generated on the secondary side of the shunt converter transformers (yellow trace) superimposed with the primary voltage Vp (magenta) and the primary current Ip (cyan). The dc bus voltage (trace 2) varies in the 19kV-21kV range. If you zoom on the first trace of the SSSC scope, you can observe the injected voltage waveforms Vinj measured between buses B1 and B2.
Fig 7 effect on UPFC in operating power flow control

International Journal of Innovative Research in Science, Engineering and Technology (IJIRSET)
| e-ISSN: 2319-8753, p-ISSN: 2320-6710| www.ijirset.com | Impact Factor: 7.512|
|| Volume 10, Issue 3, March 2021 ||
DOI:10.15680/IJIRSET.2021.1003170
IJIRSET © 2021 | An ISO 9001:2008 Certified Journal | 2457
Case 2 Var control in STATCOM mode: The operation mode to "STATCOM (Var Control)". Make sure that the STATCOM references values (1st line of parameters, [T1 T2 Q1 Q2]) are set to [0.3 0.5 +0.8 -0.8 ]. In this mode, the STATCOM is operated as a variable source of reactive power. Initially, Q is set to zero, then at T1=0.3 sec Q is increased to +0.8 pu (STATCOM absorbing reactive power) and at T2=0.5 sec, Q is reversed to -0.8 pu (STATCOM generating reactive power).The simulation and observe on the STATCOM scope the dynamic response of the STATCOM. Zoom on the first trace around t=0.5 sec when Q is changed from +0.8 pu to -0.8 pu. When Q=+0.8 pu, the current flowing into the STATCOM (cyan trace) is lagging voltage (magenta trace), indicating that STATCOM is absorbing reactive power. When Qref is changed from +0.8 to -0.8, the current phase shift with respect to voltage changes from 90 degrees lagging to 90 degrees leading within one cycle. This control of reactive power is obtained by varying the magnitude of the secondary voltage Vs generated by the shunt converter while keeping it in phase with the bus B1 voltage Vp. This change of Vs magnitude is performed by controlling the dc bus voltage. When Q is changing from +0.8 pu to -0.8 pu, Vdc (trace 3) increases from 17.5 kV to 21 kV.
Fig 8 effect on STATCOM
Case 3 Series voltage injection in SSSC mode The operation mode to "SSSC (Voltage injection)". Make sure that the SSSC references values (3rd line of parameters) [Vinj_Initial Vinj_Final StepTime] ) are set to [0.0 0.08 0.3 ]. The initial voltage is set to 0 pu, then at t=0.3 sec it will be ramped to 0.8 pu. The operation mode to "SSSC (Voltage injection)". Make sure that the SSSC references values (3rd line of parameters) [Vinj_Initial Vinj_Final StepTime] ) are set to [0.0 0.08 0.3 ]. The initial voltage is set to 0 pu, then at t=0.3 sec it will be ramped to 0.8 pu. The simulation and observe on the SSSC scope the impact of injected voltage on P and Q flowing in the 3 transmission lines. Contrary to the UPFC mode, in SSCC mode the series inverter operates with a constant conduction angle (Sigma= 172.5 degrees). The magnitude of the injected voltage is controlled by varying the dc voltage which is proportional to Vinj (3rd trace). Also, observe the waveforms of injected voltages (1st trace) and currents flowing through theSSSC (2nd trace). Voltages and currents stay in quadrature so that the SSSC operates as a variable inductance or capacitance.
International Journal of Innovative Research in Science, Engineering and Technology (IJIRSET)
| e-ISSN: 2319-8753, p-ISSN: 2320-6710| www.ijirset.com | Impact Factor: 7.512|
|| Volume 10, Issue 3, March 2021 ||
DOI:10.15680/IJIRSET.2021.1003170
IJIRSET © 2021 | An ISO 9001:2008 Certified Journal | 2458
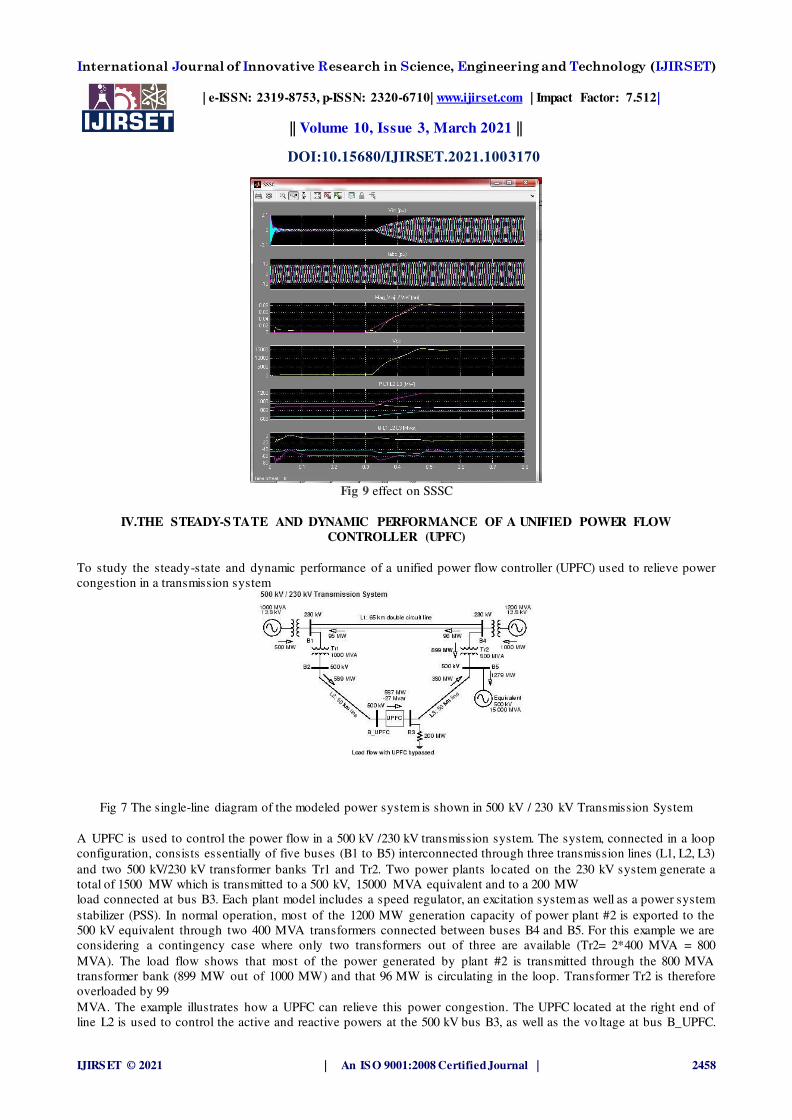
Fig 9 effect on SSSC
IV.THE STEADY-S TATE AND DYNAMIC PERFORMANCE OF A UNIFIED POWER FLOW
CONTROLLER (UPFC)
To study the steady-state and dynamic performance of a unified power flow controller (UPFC) used to relieve power congestion in a transmission system
Fig 7 The single-line diagram of the modeled power system is shown in 500 kV / 230 kV Transmission System
A UPFC is used to control the power flow in a 500 kV /230 kV transmission system. The system, connected in a loop configuration, consists essentially of five buses (B1 to B5) interconnected through three transmission lines (L1, L2, L3) and two 500 kV/230 kV transformer banks Tr1 and Tr2. Two power plants located on the 230 kV system generate a total of 1500 MW which is transmitted to a 500 kV, 15000 MVA equivalent and to a 200 MW load connected at bus B3. Each plant model includes a speed regulator, an excitation system as well as a power system stabilizer (PSS). In normal operation, most of the 1200 MW generation capacity of power plant #2 is exported to the 500 kV equivalent through two 400 MVA transformers connected between buses B4 and B5. For this example we are considering a contingency case where only two transformers out of three are available (Tr2= 2*400 MVA = 800 MVA). The load flow shows that most of the power generated by plant #2 is transmitted through the 800 MVA transformer bank (899 MW out of 1000 MW) and that 96 MW is circulating in the loop. Transformer Tr2 is therefore overloaded by 99 MVA. The example illustrates how a UPFC can relieve this power congestion. The UPFC located at the right end of line L2 is used to control the active and reactive powers at the 500 kV bus B3, as well as the vo ltage at bus B_UPFC.
International Journal of Innovative Research in Science, Engineering and Technology (IJIRSET)
| e-ISSN: 2319-8753, p-ISSN: 2320-6710| www.ijirset.com | Impact Factor: 7.512|
|| Volume 10, Issue 3, March 2021 ||
DOI:10.15680/IJIRSET.2021.1003170
IJIRSET © 2021 | An ISO 9001:2008 Certified Journal | 2459
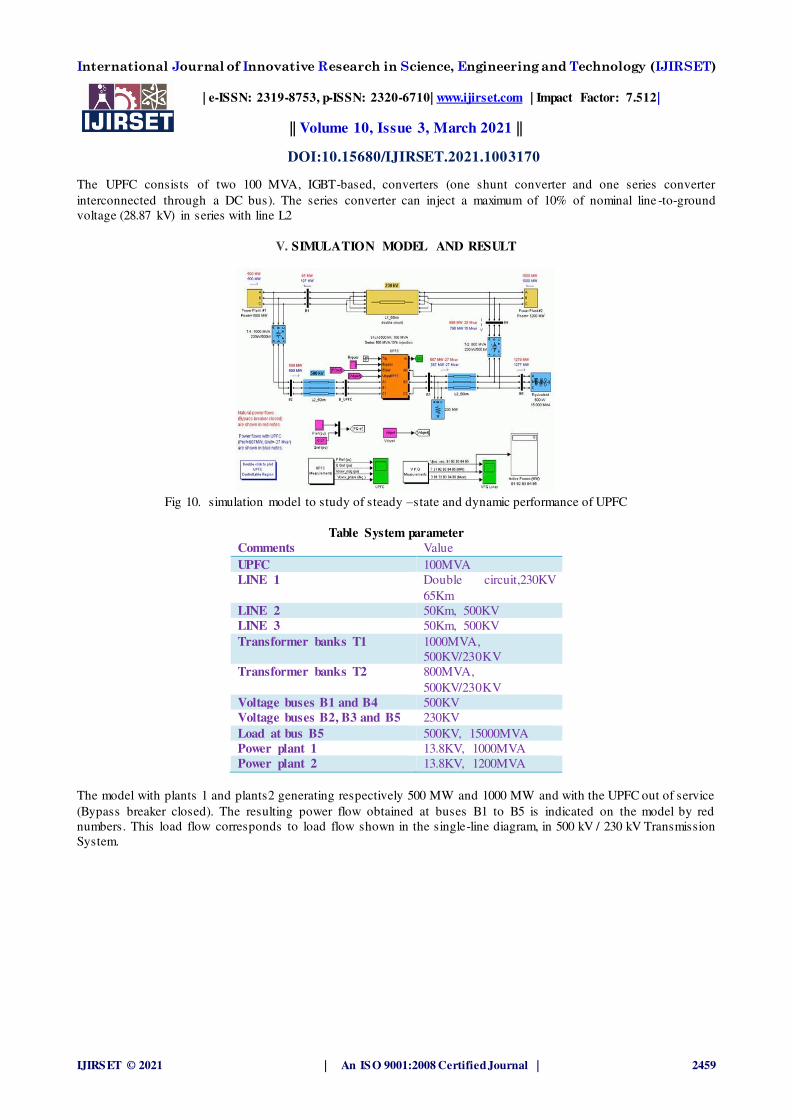
The UPFC consists of two 100 MVA, IGBT-based, converters (one shunt converter and one series converter interconnected through a DC bus). The series converter can inject a maximum of 10% of nominal line -to-ground voltage (28.87 kV) in series with line L2
V. SIMULATION MODEL AND RESULT
Fig 10. simulation model to study of steady –state and dynamic performance of UPFC
Table System parameter
Comments Value
UPFC 100MVA LINE 1 Double circuit,230KV
65Km LINE 2 50Km, 500KV LINE 3 50Km, 500KV Transformer banks T1 1000MVA,
500KV/230KV Transformer banks T2 800MVA,
500KV/230KV Voltage buses B1 and B4 500KV Voltage buses B2, B3 and B5 230KV Load at bus B5 500KV, 15000MVA Power plant 1 13.8KV, 1000MVA Power plant 2 13.8KV, 1200MVA
The model with plants 1 and plants2 generating respectively 500 MW and 1000 MW and with the UPFC out of service (Bypass breaker closed). The resulting power flow obtained at buses B1 to B5 is indicated on the model by red numbers. This load flow corresponds to load flow shown in the single-line diagram, in 500 kV / 230 kV Transmission System.

International Journal of Innovative Research in Science, Engineering and Technology (IJIRSET)
| e-ISSN: 2319-8753, p-ISSN: 2320-6710| www.ijirset.com | Impact Factor: 7.512|
|| Volume 10, Issue 3, March 2021 ||
DOI:10.15680/IJIRSET.2021.1003170
IJIRSET © 2021 | An ISO 9001:2008 Certified Journal | 2460
Power Flow Control with the UPFC :Parameters of the UPFC are given in the dialog box. Verify, in the Power data parameters, that the series converter is rated 100 MVA with a maximum voltage injection of 0.1 pu. The shunt converter is also rated 100 MVA. Also verify, in the control parameters, that the shunt converter is in Voltage regulation mode and that the series converter is in Power flow control mode. The UPFC reference active and reactive powers are set in the magenta blocks labeled Pref(pu) and Qref(pu). Initially the Bypass breaker is closed and the resulting natural power flow at bus B3 is 587 MW and -27 Mvar. The Pref block is programmed with an initial active power of 5.87 pu corresponding to the natural power flow. Then, at t=10s, Pref is increased by 1 pu (100 MW), from 5.87 pu to 6.87 pu, while Qref is kept constant at -0.27 pu. UPFC Dynamic Response to a Change in Reference Power from 587 MW to 687 MW
Fig.11UPFC Dynamic Response to a Change in Reference Power

International Journal of Innovative Research in Science, Engineering and Technology (IJIRSET)
| e-ISSN: 2319-8753, p-ISSN: 2320-6710| www.ijirset.com | Impact Factor: 7.512|
|| Volume 10, Issue 3, March 2021 ||
DOI:10.15680/IJIRSET.2021.1003170
IJIRSET © 2021 | An ISO 9001:2008 Certified Journal | 2461
At t=5 s, when the Bypass breaker is opened, the natural power is diverted from the Bypass breaker to the UPFC series branch without noticeable transient. At t=10 s, the power increases at a rate of 1 pu/s. It takes one second for the power to increase to 687 MW. This 100 MW increase of active power at bus B3 is achieved by injecting a series voltage of 0.089 pu with an angle of 94 degrees. This results in an approximate 100 MW decrease in the active power flowing through Tr2 (from 899 MW to 796 MW), which now carries an acceptable load. See the variations of active powers at buses B1 to B5 on the VPQ Lines scope
Fig.12 UPFC P-Q Controllable Region
VI. SIMULATION RESULT
The test system and UPFC data are given in table.1 Thevoltage generated by the series inverter is controlled by twoexternal signals. The power regulator gains are KP=0.025 andKI=1.5. Maximum rate of change for reference active powerand reactive power are 1 pu/s. Initially the bypass breaker isclosed and the resulting natural power flow at bus B3 is 587MW and -27 MVar. The blue numbers on the block diagram of the power system with UPFC in service, show the power flowwith controlling the B3 active and reactive powers respectivelyat 687 MW and -27 MVar. The trajectory of the UPFC reactivepower as function of its active power, measured at bus B3 is show in Fig. 11 The area located inside the ellipse representsthe UPFC controllable region. For the first five seconds the PQtrajectory stays at the -27Mvar, 587 MW point (bypass breakerstays closed). The magnitude and phase of the injected seriesvoltage. When the breaker opens,the magnitude of the injected series voltage is ramped, from0.0094 to 0.1 pu. At 10 s, the angle of the injected voltagestarts varying at a rate of 45 degree/s.Fig. 12 show the reactivepower measured at bus B3 follow the reference values. At t=5s, when the bypass breaker is opened the natural power is divertedfrom the bypass breaker to the UPFC series branch withoutnoticeable transient. The variations of active powers at busesB1, B2, B4 and B5 is show in Fig.11 and the variations ofreactive powers at buses B1, B2, B4 and B5 is show in Fig.11
VII. CONCLUSION AND FUTURE SCOPE Their main capabilities are voltage control, reactive power compensation and power flow control. The FACTS are integrated in power system to control the power flow in specific lines and improve the security of transmission line. UPFC is one of the most promising FACTS devices to power flow control and enhancing the stability. This thesis describes the effect of UPFCto enhance the dynamic stability of power systems. UPFC can improve power system dynamic performance through its supplementary control. Different simulations are carried out inMatlab Simulink environment. The future scope of power flow control to use UPQCs (unified power quality conditioner) UPQCs consist of combined series and shunt active power filters for simultaneous compensation of voltage and current . They are applicable to power distribution systems, being connected close to loads that generate harmonic currents. The harmonic-producing loads may affect other harmonic sensitive loads connected atthe same ac bus terminal The UPQC constitutes one of the most flexible devices for harmonic compensation in the new concept of “custom power” . The UPQC can compensate not only harmonic currents and imbalances of a nonlinear load, but alsoharmonic voltages and imbalances of the power supply. Hence, it improves the power quality delivered for other harmonic-sensitive loadsThus, the UPQC joins both principles of shunt current compensation and series voltage compensation into a single device

International Journal of Innovative Research in Science, Engineering and Technology (IJIRSET)
| e-ISSN: 2319-8753, p-ISSN: 2320-6710| www.ijirset.com | Impact Factor: 7.512|
|| Volume 10, Issue 3, March 2021 ||
DOI:10.15680/IJIRSET.2021.1003170
IJIRSET © 2021 | An ISO 9001:2008 Certified Journal | 2462
REFERENCES
[1] Understanding FACTS Concepts and Technology of Flexible AC Transmission Systems Narain G. Hingoranl Hingorani Power Electronics Los Altos Hills, CA A JOHN WILEY & SONS, INC. PUBLICATION 2001 [2] FACTS Modelling and Simulation in Power Networks Enrique Acha University of Glasgow, UK 2004 John Wiley & Sons Ltd, [3] Multi-mode Coordination System Control Strategy and Its Operation Performance of Western Nanjing Power Grid UPFC Project POWERCON2018 Paper NO. 201804270000658 2018 IEEE [4] ENHANCING THE PERFORMANCE AND STABILITY OF UPFC CONTROL BY CREATING CO-ORDINATION BETWEEN SERIES AND SHUNT CONVERTERS international Research Journal of Engineering and Technology (IRJET) e-ISSN: 2395-0056 Volume: 04 Issue: 12 | Dec-2017 [5] Analysing Powe Flow Solution with Optimal Unified Power.Flow Controller D. Srilatha 10.21817/ijet/2017/v9i3/170903341 Vol 9 No 3 Jun-Jul 2017 [6] D – Q model of Fuzzy based UPFC to control power flow in transmission network Fadi M. Albatsha, Shameem Ahmada, Saad Mekhilef a, Hazlie Mokhlisb, M. A. Hassanc [7] Analysis and Design of UPFC Damping Stabilizers for Power System Stability Enhancement by M. A. A bido IEEE ISIE 2006, July 9-12, 2006, Montreal, Quebec, Canada [8] FAST RELIABLE UNIFIED POWER FLOW CONTROLLER (UPFC) ALGORITHM E. M. Saied M. A. EL-Shibini Faculty of Engineering, Egypt AC-DC Power Transmission, 28-30 November 2001 Conference Publication No. 485 0 IEE 2001 [9] Instantaneous Power Theory and Applications to Power Conditioning, Second Edition. Hirofumi Akagi, Edson Hirokazu Watanabe and Maur´ ıcio Aredes. © 2017 by The Institute of Electrical and Electronics Engineers, Inc. Published 2017 by John Wiley & Sons, Inc. [10] B. K. Bose, Power Electronics andAC Drives, Prentice-Hall, 1986, pp. 130–140. ISBN 0-13686882 [11] W. J. Lyman, “Controlling power flow with phase shifting equipment,” A.I.E.E. Transactions, vol. 49, July 1930, pp. 825–831. [12] Review on Comparison of FACTS Controllers for Power System Stability Enhancement Vireshkumar G. Mathad, Basangouda F. Ronad Member IEEE, Suresh H. Jangamshetti Senior Member IEEES [13] DATA FOR IEEE-30 BUS TEST SYSTEM [14]https://in.mathworks.com/help/physmod/sps/examples/upfc detailedmodel.html#d118e28139 [15] G. Shahgholian, A. Etesami, "The effect of thyristor controlled series compensator on power system oscillation damping control", Int. Review of Elec. Eng., Vol. 5, No. 2, pp. 1822-1830, Aug. 2011 [16] G. Shahgholian, P. Shafaghi, S. Moalem, M. Mahdavian, "Damping power system oscillations in single -machine infinite-bus power system using a STATCOM", IEEE/ICCEE, pp.130-134, Dubai, Dec. 2009 [17] G. Shahgholian, M. Arezoomand, H. Mahmoodian, "Analysis and simulation of the single machine infinite bus power system stabilizer and parameters variation effects", IEEE/ICIAS, pp.167-171, Kuala Lumpur, Nov. 2007 [18] D.B. Valle, P.B. Araujo, "The influence of GUPFC FACTS device on small signal stability of the electrical power systems", Int. J. of Elec. Pow. and Ene. Sys., Vol. 65, pp. 299–306, Feb. 2015 [19] A.A. Eldamaty, "Damping interarea and torsional oscillations using FACTS devices", Ph.D. Thesis, Saskatchewan, May 2005. [20] L.H. Hassan, M. Moghavvemi, H.A.F. Almurib, K.M. Muttaqi, "A coordinated design of PSSs and UPFC-based stabilizer using genetic algorithm", IEEE Trans. on Ind. Appl., 50(5), pp. 2957-2966, Feb. 2014. [21] C. P. Arnold, R. M. Duke, and J. Arrillaga, “Transient stability improvement using thyristor controlled quadrature voltage injection,” IEEE Transactions on Power Applications and Systems, vol.PAS-100, no. 3, March. 1981, pp. 1382–1388. [22] G. G¨uth and M. H¨ausler, “Simulator Investigations of Thyristor Controlled Static Phase Shifter and Advanced Static VAr Compensator,” EPRI TR-100504, in Proceedings of FACTS Conference The Future in High-Voltage Transmission, November 1990

Related Documents