Volume 10, Issue 1, January 2021 2020

Welcome message from author
This document is posted to help you gain knowledge. Please leave a comment to let me know what you think about it! Share it to your friends and learn new things together.
Transcript

Volume 10, Issue 1, January 2021
2020

International Journal of Innovative Research in Science, Engineering and Technology (IJIRSET)
| e-ISSN: 2319-8753, p-ISSN: 2320-6710| www.ijirset.com | Impact Factor: 7.512|
|| Volume 10, Issue 1, January 2021 ||
DOI:10.15680/IJIRSET.2021.1001052
IJIRSET © 2021 | An ISO 9001:2008 Certified Journal | 304
Stockwell–Synchrosqueezing Transform based
Spectral Decomposition for Ground Motion
Signal Analysis Gayatri Devi
1, P. Sumathi
2, A. Kumar
3
Sr. Tech. Officer, CSIR-Central Building Research Institute, Roorkee, Uttarakhand-247 667, India 1
Professor, Department of Electrical Engineering, Indian Institute of Technology, Roorkee, Uttarakhand-247 667, India2
Assistant Professor, H.V.M. PG College, Raisi, Haridwar, Uttarakhand- 247671, India3
ABSTRACT: Joint time-frequency representation technique is a good tool to analyze the ground motion signals having
non-stationary properties. Some conventional techniques like STFT and Wavelet transform have limitations of t-f
resolution. S-transform (ST) has superiority on STFT and WT as having good time localization. On the other hand
Synchrosqueezing transform (SST) is a welldefined JTFtechnique. Continuous wavelet transform(CWT) based
synchrosqueezing (SST) is developed by computing the CWT coefficients and then following the reassignment procedure.
By considering the superiority of ST over CWT, Stockwell transform (ST) and Synchrosqueezing transform (SST) are
carefully combined recently and called as Stockwell Synchrosqueezing transform (S-SST). The S-SST is introduced for the
time-frequency analysis of ground motion signals. S-SST performance is demonstrated over ST and SST, by producing
promising results on one synthetic signal and tworeal time ground motion signals of Uttarkashi earthquake (1991), in
Himalayan Region,India. The better time and frequency localization are observed in the S-SST.
KEYWORDS—Ground motion signal,Synchrosqueezing transform, S-transform, Stockwell-synchrosqueezing transform,
Time-frequency representation, Signal processing.
I. INTRODUCTION
Ground motionsignals show non-stationary characteristics due to attenuation and absorption of seismic energy [1]. By
evaluating the spectral variation properly and accurately many characteristics of these signals like any underlying
periodicities may be detected[2]. A proper analysis of these signals help to study the response of different sites in
occurrence of big earthquake, It becomes very much useful for Infrastructure development in seismically active areas,
predicting earthquakes, and quantification of damage from the recorded motions.
Fourier transform is the most fundamental tool, which is used for the analysis of seismic signals, however, the time
information of these signal cannot be obtained from the spectrum. For example, the same frequency vibrations at two
different intervals present in the seismic signal are represented as single peak in the spectrum, the Fourier transform could
not differentiate between the two.To circumvent this problem, joint time-frequency representations have been introduced
which unfold the temporal information as well[3]. These transforms are able to map the time series into two dimensional
quantity of time and frequency. Numerous methods have been proposed toextend the Fourier analysis to non-stationary
signals and those are referred as T-F methods. The commonly used T-F representations employed in spectral decomposition
of seismic signals are: Short TimeFourier Transform, Continuous Wavelet Transform, and Stockwell Transform . Using
these linear transforms, the transformed spectral values may scatter over a strip in time-freq. plane whose geometry based
on the window and signal [4]. This may lead to incorrect interpretation of spectral energies. Theseerrors can be minimized
by improving the time-frequency resolution [5]. Synchrosqueezing transform proposed in[6]has been applied for time-
frequency analysis of seismic data [7]. Its application has been introduced to highlight individual components in seismic
signals[8]and to find channels from a sedimentary basin [9]. A micro-seismic signal is separated into its individual
constitutive phases and reconstructed as individual waveforms [10]. Inverse Q filtering is introduced to compensate the

International Journal of Innovative Research in Science, Engineering and Technology (IJIRSET)
| e-ISSN: 2319-8753, p-ISSN: 2320-6710| www.ijirset.com | Impact Factor: 7.512|
|| Volume 10, Issue 1, January 2021 ||
DOI:10.15680/IJIRSET.2021.1001052
IJIRSET © 2021 | An ISO 9001:2008 Certified Journal | 305
attenuation of seismic waves using the synchrosqueezing transform (SST)[11].An Applications of synchrosqueezing
transform has been introduced in attenuation estimation of seismic signal [12].
A detailed analysis of SST and other transforms with their comparison can be found in[13]. An application of
synchrosqueezing transform based on CWT has been introduced to detect frequency shifting of earthquake damaged
structure[3]. Hence, the challenge lies in choosingan appropriate time-frequency method for the analysis, because many
time-frequency representations show limitations in terms of time and frequency localization. The leakage and frequency
smearing are limitations in some recently developed T-F representations. Synchrosqueezing transform has a firmtheoretical
foundation and it even allows the reconstruction of non-stationary signal[14]. The S-transform offers better time resolution
than the wavelet based transform and the lossless inverse transformation is also possible. It has the property of maintaining
the original signal phase as well[15]. In the processing of ground motions, a good T-F resolutionas well as proper time
localization is needed to analyze theduration and frequency of most of the energy concentrations ina particular site where
earthquake has occurred. Consideringthe superiority of S-transform over wavelet, Stockwell basedsqueezing which is
referred as Stockwellsynchrosqueezingtransform (S-SST) was proposed in [5]. In this paper, this new time–frequency
method is introduced. This transform improvesthe temporal resolution and spectral smearing so that it provesto be the better
transform for spectral analysis of seismicsignals.
II. PRINCIPLE
A.CWT Based Synchrosqueezing transform (SST)
The CWT of a signal x(t) is represented as
---------(1)
where is complex conjugate of a mother wavelet, which is stretched by scale a and is shifted in time by . Equation (1)
computes the CWT on uniformly sampled signal. The length variation of the mother wavelet permitsaadded flexible
tradeoff among frequency and time localization, however, it doesnot stop spectral smearing in the Time - Frequency plane.
This smearing occurs in the scale axis. To compute frequency variations with time, the instantaneous frequency should be
computed in the wavelet domain. The derivatives of these wavelet coefficients ( are computed to estimate the
instantaneousfrequency [2]. So the instantaneous frequency at point with regard to for all ≠0 is
----(2)
where is the instantaneous frequency at each point on the spectrogram. To decrease the smearing, the
frequencies are squeezed around the instantaneous frequencieswhich areridges in the time-frequency representation. Each
point of is changed to . The ( coefficients are computed only at discrete scale values , and -
= . As a third step, the values of t-f spectrogram is squeezed over a region where the phase transform CWT is
constant. The resulting instantaneous frequency is reassigned,to a single value which is at the centroid of the CWT t-f
region. The synchrosqueezing transform is calculated only at centers of the frequency range
with
- .
---(3)
here which is the scale is bounded by . To construct again the concentrated frequency map at time a
band of small frequency centered at and less than half of the bandwidth is used.
International Journal of Innovative Research in Science, Engineering and Technology (IJIRSET)
| e-ISSN: 2319-8753, p-ISSN: 2320-6710| www.ijirset.com | Impact Factor: 7.512|
|| Volume 10, Issue 1, January 2021 ||
DOI:10.15680/IJIRSET.2021.1001052
IJIRSET © 2021 | An ISO 9001:2008 Certified Journal | 306
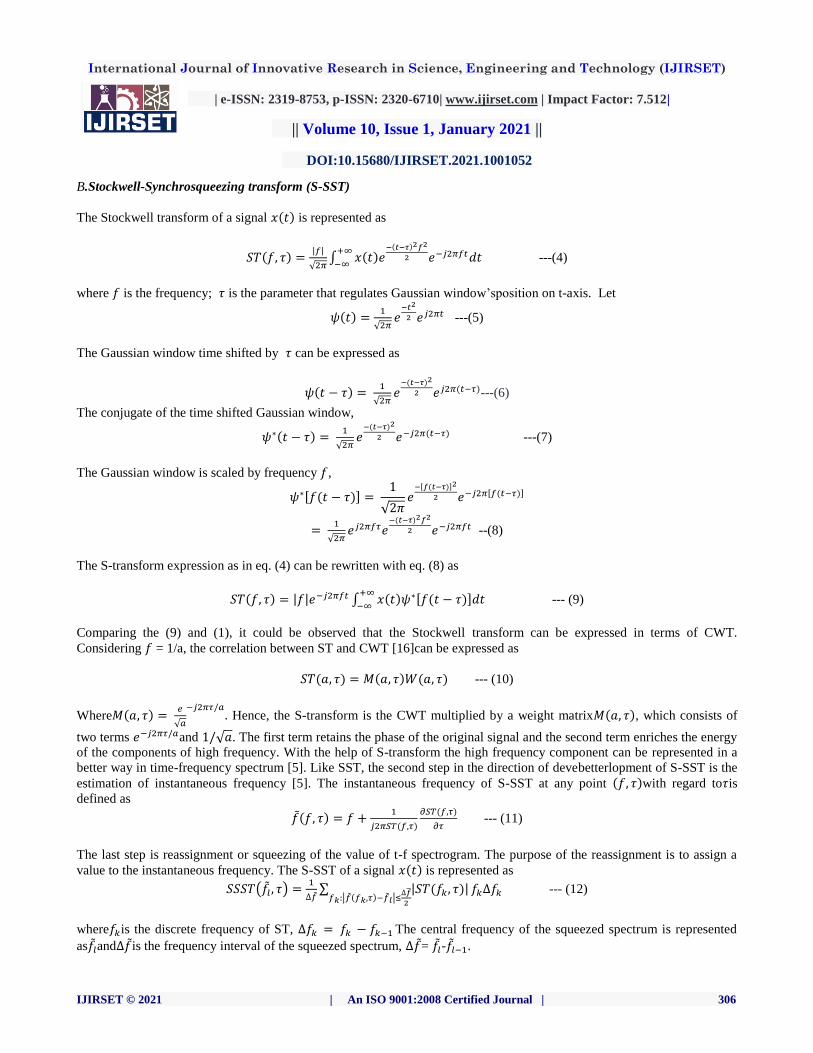
B.Stockwell-Synchrosqueezing transform (S-SST)
The Stockwell transform of a signal is represented as
---(4)
where is the frequency; is the parameter that regulates Gaussian window’sposition on t-axis. Let
---(5)
The Gaussian window time shifted by can be expressed as
---(6)
The conjugate of the time shifted Gaussian window,
---(7)
The Gaussian window is scaled by frequency ,
--(8)
The S-transform expression as in eq. (4) can be rewritten with eq. (8) as
--- (9)
Comparing the (9) and (1), it could be observed that the Stockwell transform can be expressed in terms of CWT.
Considering = 1/a, the correlation between ST and CWT [16]can be expressed as
--- (10)
Where
Hence, the S-transform is the CWT multiplied by a weight matrix , which consists of
two terms and . The first term retains the phase of the original signal and the second term enriches the energy
of the components of high frequency. With the help of S-transform the high frequency component can be represented in a
better way in time-frequency spectrum [5]. Like SST, the second step in the direction of devebetterlopment of S-SST is the
estimation of instantaneous frequency [5]. The instantaneous frequency of S-SST at any point with regard to is
defined as
--- (11)
The last step is reassignment or squeezing of the value of t-f spectrogram. The purpose of the reassignment is to assign a
value to the instantaneous frequency. The S-SST of a signal is represented as
--- (12)
where is the discrete frequency of ST, The central frequency of the squeezed spectrum is represented
as and is the frequency interval of the squeezed spectrum, = - .

International Journal of Innovative Research in Science, Engineering and Technology (IJIRSET)
| e-ISSN: 2319-8753, p-ISSN: 2320-6710| www.ijirset.com | Impact Factor: 7.512|
|| Volume 10, Issue 1, January 2021 ||
DOI:10.15680/IJIRSET.2021.1001052
IJIRSET © 2021 | An ISO 9001:2008 Certified Journal | 307
III. RESULT AND DISCUSSION
The S-SST performances is demonstrated in comparison with ST and SST. For this purpose, one non-stationary synthetic
signal and three real-time recorded earthquake signals are considered.
The parameters chosen in various T-F representations are listed in Table I. TABLE I
PARAMETER USED IN T-F REPRESENTATION OF SYNTHETIC & REALTIME SIGNAL
Signal ST (window
width factor =
k)
SST (number
of voices per
octave = nv )
S-SST (number
of voices per
octave = nv )
Synthetic
signal
3 64 64
Seismic
record
1,2
3 64 64
i.Non stationary Synthetic Signal
A synthetic signal is developed with three sinusoidal components to demonstrate the features of S-SST. Sampling
frequency of the signal is 500 Hz and the signal noise ratio is 10 dB. The signal length is considered for 10 sec. The
generated synthetic signal is represented as
------ (13)
where is the Gaussian noise, the signal to noise ratio of 10 dB is added to the signal. Figure1 (a) shows the synthetic
signal and its components considered for the analysis.

International Journal of Innovative Research in Science, Engineering and Technology (IJIRSET)
| e-ISSN: 2319-8753, p-ISSN: 2320-6710| www.ijirset.com | Impact Factor: 7.512|
|| Volume 10, Issue 1, January 2021 ||
DOI:10.15680/IJIRSET.2021.1001052
IJIRSET © 2021 | An ISO 9001:2008 Certified Journal | 308

International Journal of Innovative Research in Science, Engineering and Technology (IJIRSET)
| e-ISSN: 2319-8753, p-ISSN: 2320-6710| www.ijirset.com | Impact Factor: 7.512|
|| Volume 10, Issue 1, January 2021 ||
DOI:10.15680/IJIRSET.2021.1001052
IJIRSET © 2021 | An ISO 9001:2008 Certified Journal | 309
Figure 1. Time-Frequency representations of synthetic signal (a) x(t) signal, and its components x1(t), x2(t), x3(t) and x4(t) (b) S-transform (c) SST (d) S-
SST
The time-frequency representations of synthetic signal-1 based on ST, SST, SSST are displayed in Figure 1 (b), Figure 1
(c), and Figure 1 (d) respectively. Morlet wavelet is used to perform SST. The four components of
namely , , , and are shown in Figure1 (a). These four components are visible in all the three
analysis of ST, SST, and S-SST T-F spectra. The component is frequency modulated with low amplitude and high
carrier frequency (30 Hz) with an interval of 0 ≤ t ≤ 3, is also an AM-FM component present for an interval of 3 ≤ t
≤6, and the third component is an AM-FM component with low frequency component and high amplitude modulated
signal, exists for an interval of 6 ≤ t ≤ 10. The fourth component is chirp signal with increasing amplitude. The S-transform
T-F spectrashows the good time localization, however, it exhibits frequency smearing characteristics which could be
observed from the Figure 1 (b). It could distinguish between the low energy and high energy signals. The fourth component
is also extracted from the synthetic signal with increasing amplitude except the frequency smearing. The time localization is
clear at t = 3 sec, however at t = 6 sec shows an interference between the switching of second to third and fourth
components. The CWT based synchrosqueezing with Morlet wavelet is computed for synthetic signal. The SST T-F
spectraof synthetic signal is displayed in Figure 1 (c), which rectifies the problem of frequency smearing. The time
localization is also good, however the interference at t = 6 is still present. The amplitude information of the four
components are fairly distinguishable. The Stockwell-synchrosqueezing transform clearly distinguishes the four
components with time localization and frequency localization, it could be observed from Figure 1 (d). The interference
between thecomponents is nullified at t = 6 sec. The amplitudes of each component, energy concentration are
distinguishable between the components.

International Journal of Innovative Research in Science, Engineering and Technology (IJIRSET)
| e-ISSN: 2319-8753, p-ISSN: 2320-6710| www.ijirset.com | Impact Factor: 7.512|
|| Volume 10, Issue 1, January 2021 ||
DOI:10.15680/IJIRSET.2021.1001052
IJIRSET © 2021 | An ISO 9001:2008 Certified Journal | 310
ii.Real-Time Earthquake Record 1
A strong motion array of 28 strong motion accelerographs were installed by Department of Earthquake Engineering, Indian
Institute of Technology, Roorkee, India in 1991 in Garwhal Himalaya, under the research scheme of strong motion array
funded by Department of Science and Technology, Govt of India. This network recorded many earthquake events including
one catastrophic earthquake of Uttarkashi (1991). This first earthquake ground motion signal is of that drastic Uttarkashi
earthquake occurred 20 October1991 at 02:53 IST with a moment magnitude of 6.8, recorded at Badkot station (30.48N
78.13 E), one station of that SMA network. The signal was recorded by three component strong motion accelerograph made
of Kinemetrics, USA. Instrument damping was 0.62 and the North-South component of seismogram is used for joint time-
frequency representation. The signal was recorded having sampling frequency of 50 Hz and signal length is 31.74 sec. The
acceleration time-history is shown in Fig. 2 (a) and Time-Freq. spectra of this seismic ground motion using ST, SST and S-
SST is shown here in Figure 2 (b), Figure 2 (c), and Figure 2 (d).
The obtained result of S transform identified spots of concentration in energy with smearing between two frequency
components and spectral overlap. The smearing effect is also appearing in the results of SST in both 2 to 3 hz frequency
component, and in 6.5 to 10 hz frequency band.
The Figure 2 (e) shows the S-SST spectra with data cursor markings of region of interest. The S-SST spectra of the first
record clearly shows the three concentrated energies of 2.3 - 2.26 Hz for 4.8 - 6.8 sec, 6.6 - 7.8 Hz for 4.55 - 5.05 sec, and
8.8 - 7.9 Hz for 6.25 - 6.79 sec.

International Journal of Innovative Research in Science, Engineering and Technology (IJIRSET)
| e-ISSN: 2319-8753, p-ISSN: 2320-6710| www.ijirset.com | Impact Factor: 7.512|
|| Volume 10, Issue 1, January 2021 ||
DOI:10.15680/IJIRSET.2021.1001052
IJIRSET © 2021 | An ISO 9001:2008 Certified Journal | 311
Figure 2. Time-Frequency representations of Badkot station time-history (a) Accelerogram (b) S-transform (c) SST (d) S-SST (e) S-SST with data cursor
iii.Real-Time Earthquake Record 2
The second ground motion record used in our analysis is of same Uttarkashi Earthquake recorded at another station named
Purola, Uttarakhand,India 30.52 N 78.50 E. The signal was recorded by three component strong motion accelerograph
made of Kinemetrics, USA. Instrument damping was 0.58 and the North-South component of seismogram is used for
obtaining the JTF representation. The signal was recorded with a sampling frequency of 50 Hz and the record time was
35.70 sec. The acceleration timehistory is shown in Figure 3 (a) and the t-f spectra of seismic signal using ST, SSTas well
as S-SST is shown in Figure 3 (b), Figure 3 (c), and Figure 3 (d) respectively. Because of reduced spectral overlapping
comparatively ST and reduced smearing effect comparatively SST, the S-SST spectra of the second record shows the two
predominant concentrated energies of 5.42 - 4.32 Hz for 4.52 - 5.68 sec, 4.32 - 4.25 Hz for 6.6 - 7.7 sec

International Journal of Innovative Research in Science, Engineering and Technology (IJIRSET)
| e-ISSN: 2319-8753, p-ISSN: 2320-6710| www.ijirset.com | Impact Factor: 7.512|
|| Volume 10, Issue 1, January 2021 ||
DOI:10.15680/IJIRSET.2021.1001052
IJIRSET © 2021 | An ISO 9001:2008 Certified Journal | 312
Figure 3. Time-Frequency representations of Purola station time-history (a) Accelerogram (b) S-transform (c) SST (d) S-SST (e) S-SST with data cursor
IV. CONCLUSION
The Stockwell transform based synchrosqueezing approach has been introduced for seismic signals and validated for real-
time ground motion signals. The qualities of S-transformand synchrosqueezing are combined by exploiting the
relationbetween S-transform and CWT. The relation between themreveals that a weight matrix could change the CWT
basedsynchrosqueezing to ST based synchrosqueezing. The clearenergy concentrations present in the T-F spectra of S-
SSTreveal the meaningful interpretation of the seismic signal.Moreover, the S-SST offers good frequency localization
andtime localization. It could be concluded that the S-SST is apotential tool for analyzing the seismic signals.

International Journal of Innovative Research in Science, Engineering and Technology (IJIRSET)
| e-ISSN: 2319-8753, p-ISSN: 2320-6710| www.ijirset.com | Impact Factor: 7.512|
|| Volume 10, Issue 1, January 2021 ||
DOI:10.15680/IJIRSET.2021.1001052
IJIRSET © 2021 | An ISO 9001:2008 Certified Journal | 313
V.ACKNOWLEDGEMENT
The authors is thankful to Dr. E. Brevdo for his MATLAB Synchrosqueezing Toolbox,
https://web.math.princeton.edu/ebrevdo/ and Earthquake Department IIT Roorkee (India) for data support.
REFERENCES
[1] Peter Bormann, “Seismic Signals and Noise”, New manual of seismological observatory practice (NMSOP), pp.1-34,
2009.
[2] J. B. Tary, R. H. Herrera, J. Han, and M. Van Der Baan, “Spectral estimation-What is new? What is next?”, Review
of Geophysics., vol. 52, no. 4, pp. 723749, Dec. 2014.
[3] R. Kumar, P. Sumathi, A. Kumar, “Synchrosqueezing transform based frequency shifting detection for earthquake
damaged structures”, IEEE Geoscience and Remote Sensing letters, vol. 14, no. 8, August 2017.
[4] F. Auger et al., “Time- Frequency reassignment and synchrosqueezing: An overview”, IEEE Signal Processing.
Magazine, vol. 30, no.6, pp. 32-41, Nov.2013.
[5] Zhonglai Huang, J. Zhang, Tie-hu Zhao and Y. Sun, “Synchrosqueezing S-transform and its application in seismic
spectral decomposition”, IEEE Trans. Geoscience and Remote Sensing, vol. 54, no. 2, pp. 817-825, Feb. 2016.
[6] I. Daubechies, J. Lu, and H. T.Wu, “Synchrosqueezed wavelet transforms: An empirical mode decomposition-like
tool”, Applied & Computational Harmonic Analysis, vol. 30, no. 2, pp. 243-261, Mar. 2011
[7] Y. Chen, T.Liu, X. Chen, J. li, E.Wang, “ Time-frequency analysis of seismic data using synchrosqueezing wavelet
transform”, Journal of Seismic Exploration, vol.23,no.4, pp.303-312,Sep.2014
[8] Herrera, R. H., J. Han, and M. van der Baan, “Applications of the synchrosqueezing transform in seismic time-
frequency analysis”,Geophysics, 79(3), V55–V64, 2014, doi:10.1190/geo2013-0204.1.
[9] P. Wang, J. Gao, and Z. Wang, “Time-frequency analysis of seismic data using Synchrosqueezing transform”, IEEE
Geoscience and Remote Sensing Letters, vol. 11, no. 12, pp. 2042-2044, Dec. 2014.
[10] R. H. Herrera, J. B. Tary, M. van der Baan, and D. W. Eaton, “Body wave separation in the time- frequency
domain”, IEEE Geosci. Remote Sens. Lett., vol. 12, no. 2, pp. 364-368, Feb. 2015.
[11] Y. Yang, J Gao, G Zhang, Q. Wang, “An efficient attenuation compensation method using the synchrosqueezing
transform,” Journal of seismic exploration, vol. 27, no.6, pp 577-591, Dec 18.
[12] J.B. Tary, VD Baan, RH Harrera, “Application of high resolution time frequency transforms to attenuation
estimation,”Geophysics, vol.82, no.1, pp 7-20, Jan 2017.
[13] D. Iatsenko, P. V. E. Mclintock and A. Stefanovska, “Linear and synchrosqueezed time-frequency representations
revisited: Overview, standards of use, resolution, reconstruction, concentration and algorithms,” Digital Signal
Process., vol. 42, pp. 126, Jul. 2015.
[14] G. Thakur, E. Brevdo, N. S. Fuckar and H.T.Wu, “The synchrosqueezing algorithm for time-varying spectral
analysis: Robustness properties and new paleoclimate applications,” Signal Process., vol. 93, no.5, pp. 1079- 1094,
May 2013.
[15] R. G. Stockwell, L. Mansinha and R. P. Lowe, “Localization of the complex specturm: The S transform,” IEEE
Trans. Signal process., vol. 44, no. 4, pp. 998-1001, April 1996.
[16] S. Ventosa, C. Simon, M. Schimmel, J.J. Danobeitia and A. Manuel, “The S-Transform from a Wavelet Point of
View,” IEEE Trans. Signal Process., vol. 56, no.7, pp. 2771-2780, July 2008.

Related Documents