Preface As part of its research activities of building and disseminating macroeconomic and sectoral data series, the EPW Research Foundation (EPWRF) has been focusing on the data base of central and state finances. In this scheme, the first comprehensive study presenting continuous time series on aggregate and individual state-level finances for the whole decade of the 1990s (1990-91 to 2000-01) was published in the Economic and Political Weekly of May 19, 2001. It brought out how, in the emerging fiscal crisis of India, the deteriorating state government finances seemed to play a major role. The gross fiscal deficit (GFD) of all states together, which was a little more than one-third of that of the Centre in the early 1990s, had already come close to it towards the end of the decade. While this was the overall scenario, there were vast differences in budgetary performances across states, as there were in many aspects of social and economic development. This was as much true of tax and non-tax revenue collections as it was true of the extent and quality of resource deployment under developmental and non- developmental, or Plan and non-Plan, heads of expenditures. The study of the EPW Research Foundation (EPWRF), along with its vast data base on other macroeconomic sectors, had the potential of linking budgetary performances of states to their overall social and economic outcomes. The Planning Commission (Government of India) evinced some interest in the EPWRF data base study on state finances, but they preferred a much more expanded version of the study both in terms of the period covered and the state-wise nature of the tabulations. Accordingly, they approached the EPWRF with a suggestion that the Research Foundation tabulate long and consistent time series on state finances. This was only possible from the RBI’s annual studies on the subject, which constitute the most detailed and comparable data set available in the public domain. The RBI tabulates these statistics every year essentially from budget documents of state governments; it also uses other supplementary data received specially from the states and the Planning Commission, as also additional information from the Bank’s own internal records. The Planning Commission’s assignment to the EPWRF entailed the tabulation and analysis of state finances data in the aggregate and also for the states individually for the whole of the 1980s and the 1990s (for 22 years from 1980-81 to 2001-02). With the publication of one more year’s study for 2002-03 (BE) by the RBI, the coverage got extended from 22 years to 23 years. Accordingly, the study has generated a massive set of data base in respect of state finances, both aggregate and by states, for a period of 23 years from 1980-81 to 2002-03 (BE). In fact, after the completion of the bulk of this study, the RBI has published its annual study for yet another year 2003-04, which we could cover only cursorily as explained below. A special feature of the study is the construction of time series for each item of budgetary receipts and disbursements for all the 23 years (and for 24 years in a few

Volume 1
Nov 01, 2014
statewse revenues, it details abt state wise revenue figures and the percentages
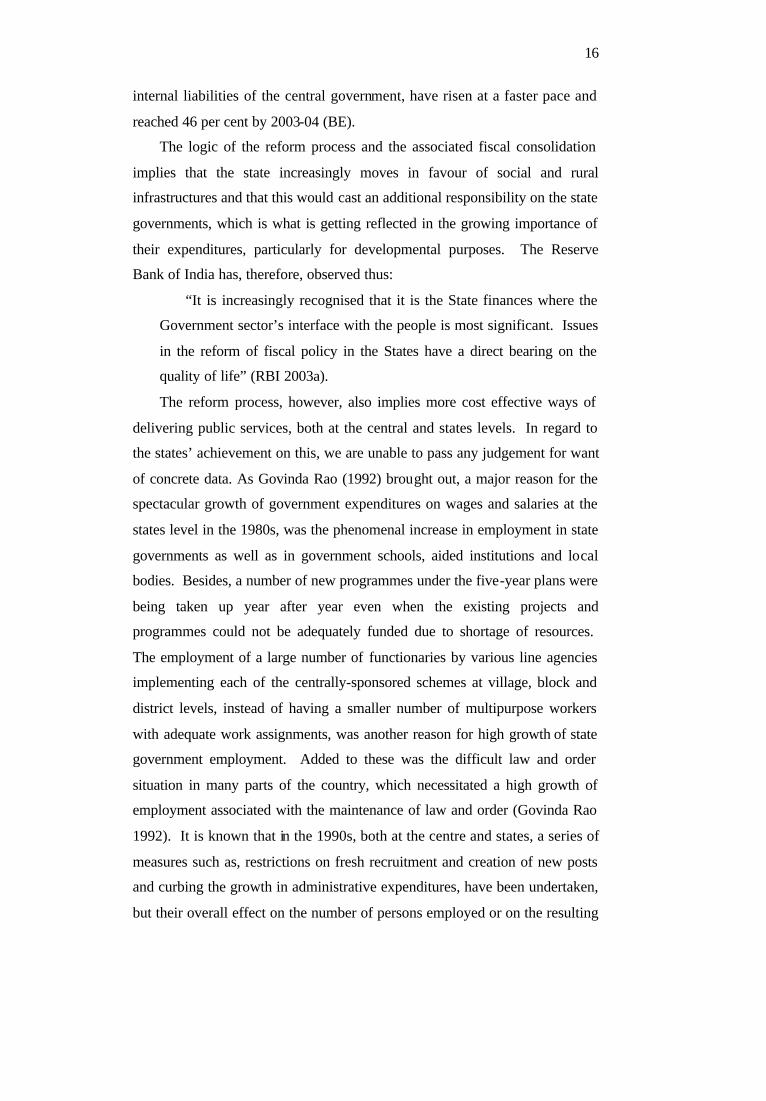
Welcome message from author
This document is posted to help you gain knowledge. Please leave a comment to let me know what you think about it! Share it to your friends and learn new things together.
Transcript
Preface As part of its research activities of building and disseminating macroeconomic
and sectoral data series, the EPW Research Foundation (EPWRF) has been focusing on the data base of central and state finances. In this scheme, the first comprehensive study presenting continuous time series on aggregate and individual state- level finances for the whole decade of the 1990s (1990-91 to 2000-01) was published in the Economic and Political Weekly of May 19, 2001. It brought out how, in the emerging fiscal crisis of India, the deteriorating state government finances seemed to play a major role. The gross fiscal deficit (GFD) of all states together, which was a little more than one-third of that of the Centre in the early 1990s, had already come close to it towards the end of the decade. While this was the overall scenario, there were vast differences in budgetary performances across states, as there were in many aspects of social and economic development. This was as much true of tax and non-tax revenue collections as it was true of the extent and quality of resource deployment under developmental and non-developmental, or Plan and non-Plan, heads of expenditures. The study of the EPW Research Foundation (EPWRF), along with its vast data base on other macroeconomic sectors, had the potential of linking budgetary performances of states to their overall social and economic outcomes.
The Planning Commission (Government of India) evinced some interest in the
EPWRF data base study on state finances, but they preferred a much more expanded version of the study both in terms of the period covered and the state-wise nature of the tabulations. Accordingly, they approached the EPWRF with a suggestion that the Research Foundation tabulate long and consistent time series on state finances. This was only possible from the RBI’s annual studies on the subject, which constitute the most detailed and comparable data set available in the public domain. The RBI tabulates these statistics every year essentially from budget documents of state governments; it also uses other supplementary data received specially from the states and the Planning Commission, as also additional information from the Bank’s own internal records.
The Planning Commission’s assignment to the EPWRF entailed the tabulation
and analysis of state finances data in the aggregate and also for the states individually for the whole of the 1980s and the 1990s (for 22 years from 1980-81 to 2001-02). With the publication of one more year’s study for 2002-03 (BE) by the RBI, the coverage got extended from 22 years to 23 years. Accordingly, the study has generated a massive set of data base in respect of state finances, both aggregate and by states, for a period of 23 years from 1980-81 to 2002-03 (BE). In fact, after the completion of the bulk of this study, the RBI has published its annual study for yet another year 2003-04, which we could cover only cursorily as explained below.
A special feature of the study is the construction of time series for each item of
budgetary receipts and disbursements for all the 23 years (and for 24 years in a few
cases). Each one of RBI studies presents annual data for the last three years – Accounts, Budget and Revised Estimates, and Budget Estimates for the latest year, respectively. In the time series, the most crucial data set obviously has been the Accounts for the first 21 years which have been meticulously tabulated from each of the 21 annual studies, with the latest study providing also the Revised Estimates and Budget Estimates for the latest two years.
The creation of the above time series has been facilitated by the fact that the
classification of budgetary heads and sub-heads have by and large remained uniform over years, but it must be admitted that in the compilation of the data series, we have faced two problems, which we have sought to resolve thus. First, there have been occasional breaks in classification; whenever we found that it was not possible for us to extend the series with the same classification, we have retained the additional items as they are and presented the time series for the truncated periods. In some instances, we have used our own judgement to place the new items against the relevant series of earlier years. Second, there have been clerical errors in the original data set which created inconsistencies in totals as between sub-heads and heads of receipts/expenditures. In a majority of the cases we have been able to locate the errors, but in those cases where this was not possible, the discrepancies have been left as they are and pointed out in the notes attached to the four annexures as detailed below. These processes of reconciling and cleaning of data has been an arduous task, which our colleagues associated with tabulation as well as page-making have accomplished with meticulous care. The notes attached to annexures narrate such cleaning of data series for different years and for different states.
The scope and coverage of the study, as also its summary and conclusions and
policy implications, have been explained in relevant sections. Briefly, the study is being presented in two volumes. Volume I presents the Main Report consisting of 14 sections along with a series of analytical charts and appendix tables. Apart from the fiscal health of states, collectively and individually, Volume I has two special features: first, a section of it is devoted to an inter-state comparison of fiscal performance against the backdrop of the states’ growth outcomes in their respective social and economic spheres (Section XII); and second, another section dilates a while on a narration of efforts being made by individual state governments to introduce reforms in different dimensions of their finances (Section XIII). Volume I contains a brief Executive Summary.
Volume II contains four detailed Annexure Tables for each of the 28 states
extensively covering all available data series on revenue receipts and revenue expenditures and capital receipts and capital disbursements for the 23-year period (1980-81 to 2002-03). The disaggregation is so detailed that each state data occupy 36 pages of tables. Together, they cover 1,212 pages. With a view to making the latest data also readily available for the users of this study, we have attached Annexure V presenting the RBI’s latest three-year data series from its study for 2003-04 (BE).
After the Interim Report was submitted to the Planning Commission in December
2003, we received valuable and encouraging comments from Dr. N.J. Kurian, Adviser (FR) and Ms. Sushmita Dasgupta, Director (FR) of the Planning Commission, which we cherish the most. We are thankful to them for their constant support and encouragement.
As part of our professional etiquette, we were anxious to complete this research
project within the time frame stipulated by the Planning Commission which we have by and large adhered to. This would not have been possible but for the dedicated efforts put in by a large team of research staff led by Dr. S.A. Shetty, our Senior Consultant. Many persons worked under him for different purposes at different stages of the project: Dr. Mihir Kumar Mahapatra, Dr. Sabyasachi Ray, Dr. P.S. Leela, Mrs. Suneethy Nair, Mr. U. Raghunathan, Mr. Sandeep Shetty and Mr. Tushar Dhara. Mrs. Rema K. Nair and Ms. Seema S. Shetty have been extremely helpful not only in undertaking production of Volume II in page-making formats which is their area of specialisation, but also in cross-checking totals and preparing comprehensive notes on discrepancies and mismatches. Mr. K. Srinivasan undertook the task of typesetting Volume I of the Report both at its interim and final stages. Ms. Abhilasha Maheshwari has helped us in scrutinising the draft and making valuable suggestions. To all of them, we convey profound thanks and take this opportunity to place on record our sincere appreciation of their contribution to the success of the project.
S L Shetty Mumbai Director
July 10, 2004 EPW Research Foundation
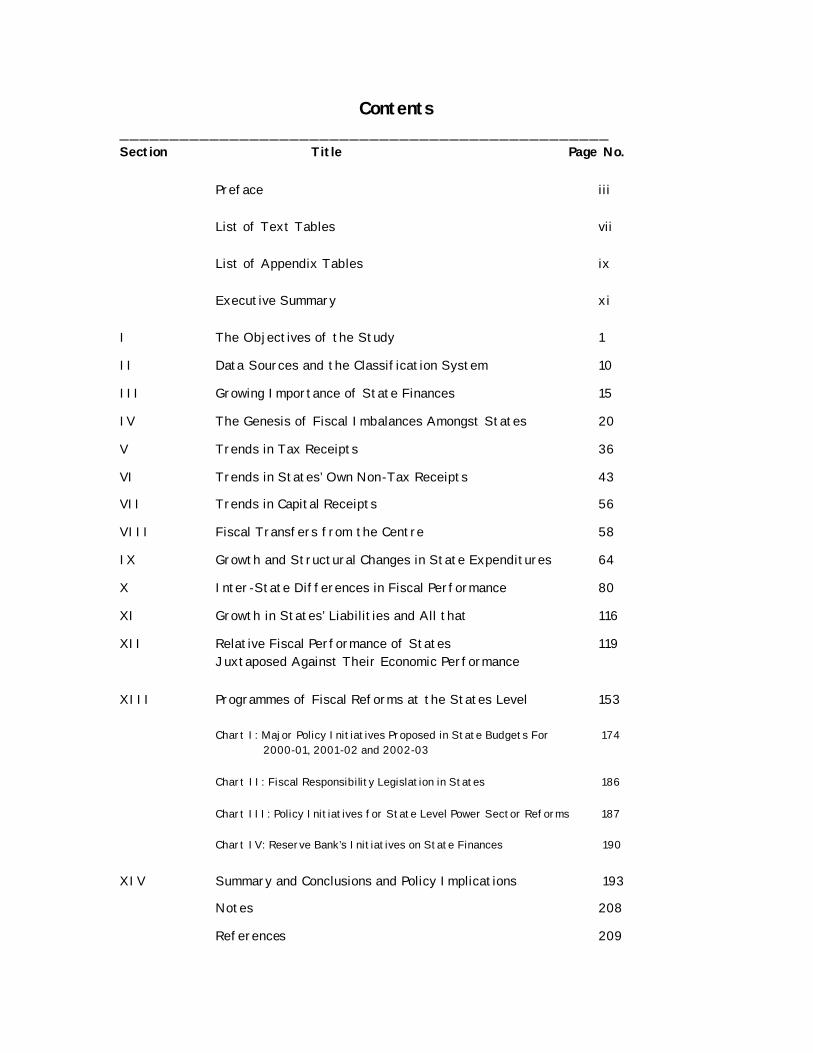
Contents _________________________________________________ Section Title Page No. Preface iii List of Text Tables vii List of Appendix Tables ix Executive Summary xi I The Objectives of the Study 1
II Data Sources and the Classification System 10
III Growing Importance of State Finances 15
IV The Genesis of Fiscal Imbalances Amongst States 20
V Trends in Tax Receipts 36
VI Trends in States’ Own Non-Tax Receipts 43
VII Trends in Capital Receipts 56
VIII Fiscal Transfers from the Centre 58
IX Growth and Structural Changes in State Expenditures 64
X Inter-State Differences in Fiscal Performance 80
XI Growth in States’ Liabilities and All that 116
XII Relative Fiscal Performance of States 119 Juxtaposed Against Their Economic Performance
XIII Programmes of Fiscal Reforms at the States Level 153
Chart I: Major Policy Initiatives Proposed in State Budgets For 174
2000-01, 2001-02 and 2002-03 Chart II: Fiscal Responsibility Legislation in States 186 Chart III: Policy Initiatives for State Level Power Sector Reforms 187 Chart IV: Reserve Bank’s Initiatives on State Finances 190
XIV Summary and Conclusions and Policy Implications 193
Notes 208
References 209
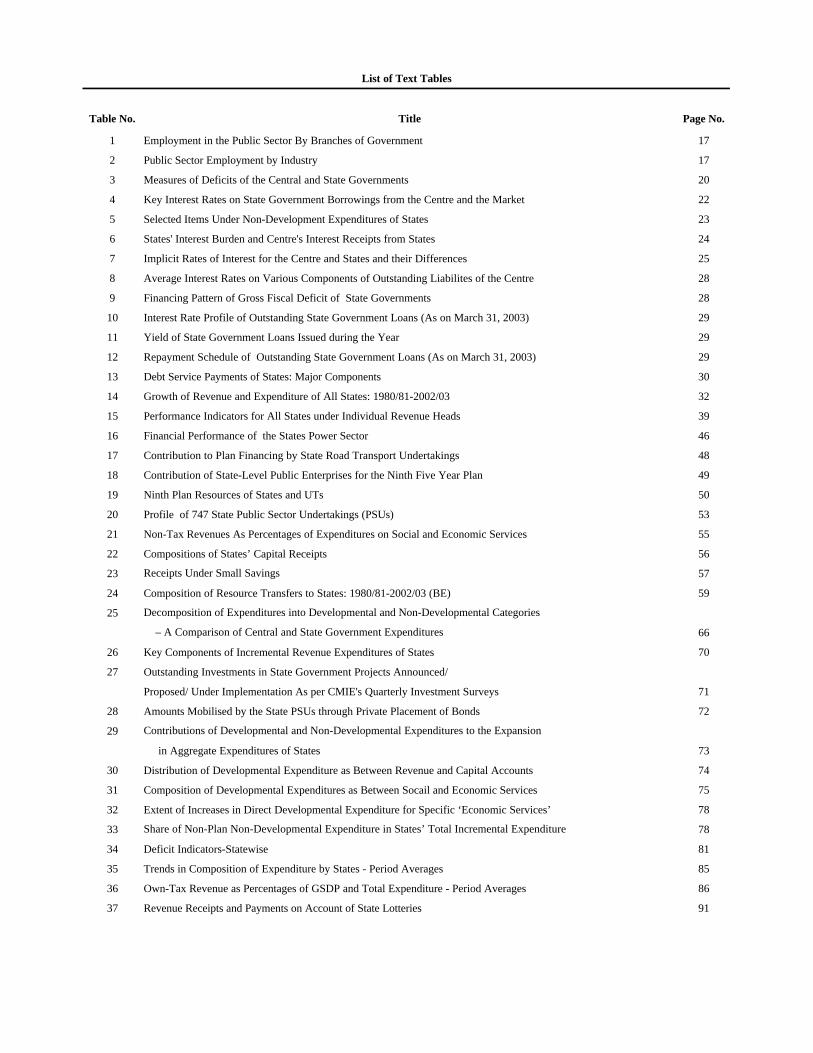
Table No. Title Page No.
1 Employment in the Public Sector By Branches of Government 17
2 Public Sector Employment by Industry 17
3 Measures of Deficits of the Central and State Governments 20
4 Key Interest Rates on State Government Borrowings from the Centre and the Market 22
5 Selected Items Under Non-Development Expenditures of States 23
6 States' Interest Burden and Centre's Interest Receipts from States 24
7 Implicit Rates of Interest for the Centre and States and their Differences 25
8 Average Interest Rates on Various Components of Outstanding Liabilites of the Centre 28
9 Financing Pattern of Gross Fiscal Deficit of State Governments 28
10 Interest Rate Profile of Outstanding State Government Loans (As on March 31, 2003) 29
11 Yield of State Government Loans Issued during the Year 29
12 Repayment Schedule of Outstanding State Government Loans (As on March 31, 2003) 29
13 Debt Service Payments of States: Major Components 30
14 Growth of Revenue and Expenditure of All States: 1980/81-2002/03 32
15 Performance Indicators for All States under Individual Revenue Heads 39
16 Financial Performance of the States Power Sector 46
17 Contribution to Plan Financing by State Road Transport Undertakings 48
18 Contribution of State-Level Public Enterprises for the Ninth Five Year Plan 49
19 Ninth Plan Resources of States and UTs 50
20 Profile of 747 State Public Sector Undertakings (PSUs) 53
21 Non-Tax Revenues As Percentages of Expenditures on Social and Economic Services 55
22 Compositions of States’ Capital Receipts 56
23 Receipts Under Small Savings 57
24 Composition of Resource Transfers to States: 1980/81-2002/03 (BE) 59
25 Decomposition of Expenditures into Developmental and Non-Developmental Categories
– A Comparison of Central and State Government Expenditures 66
26 Key Components of Incremental Revenue Expenditures of States 70
27 Outstanding Investments in State Government Projects Announced/
Proposed/ Under Implementation As per CMIE's Quarterly Investment Surveys 71
28 Amounts Mobilised by the State PSUs through Private Placement of Bonds 72
29 Contributions of Developmental and Non-Developmental Expenditures to the Expansion
in Aggregate Expenditures of States 73
30 Distribution of Developmental Expenditure as Between Revenue and Capital Accounts 74
31 Composition of Developmental Expenditures as Between Socail and Economic Services 75
32 Extent of Increases in Direct Developmental Expenditure for Specific ‘Economic Services’ 78
33 Share of Non-Plan Non-Developmental Expenditure in States’ Total Incremental Expenditure 78
34 Deficit Indicators-Statewise 81
35 Trends in Composition of Expenditure by States - Period Averages 85
36 Own-Tax Revenue as Percentages of GSDP and Total Expenditure - Period Averages 86
37 Revenue Receipts and Payments on Account of State Lotteries 91
List of Text Tables
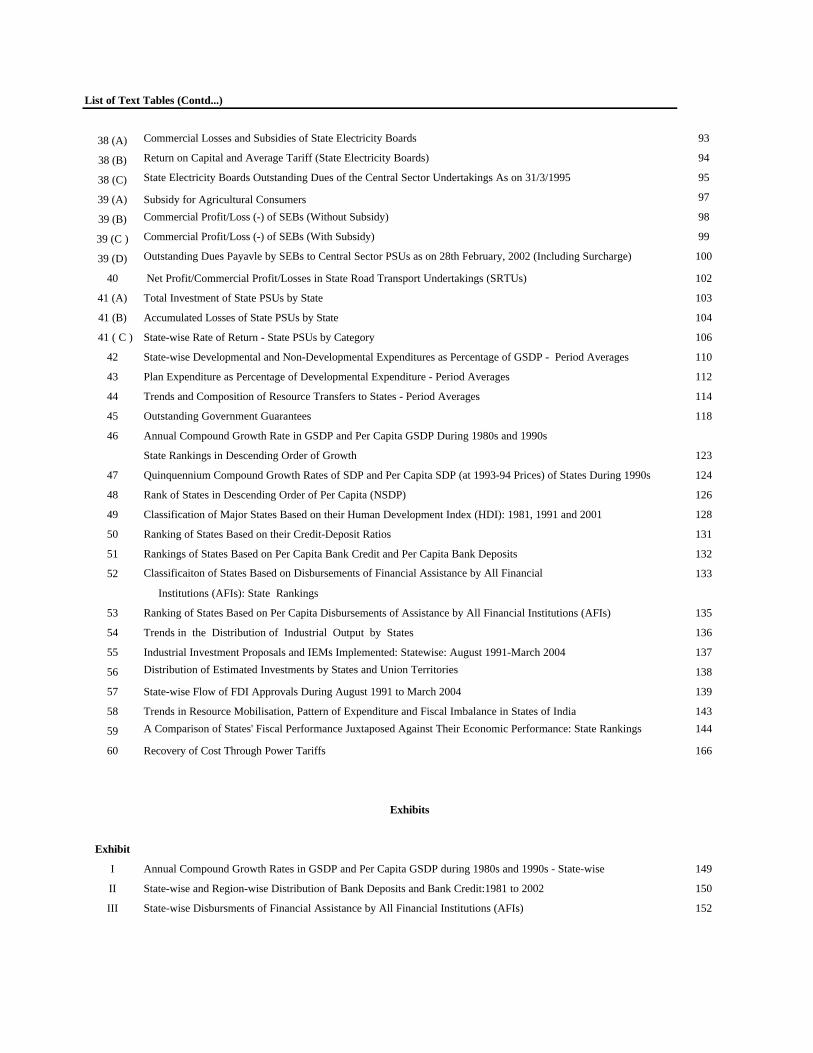
List of Text Tables (Contd...)
38 (A) Commercial Losses and Subsidies of State Electricity Boards 93
38 (B) Return on Capital and Average Tariff (State Electricity Boards) 94
38 (C) State Electricity Boards Outstanding Dues of the Central Sector Undertakings As on 31/3/1995 95
39 (A) Subsidy for Agricultural Consumers 97
39 (B) Commercial Profit/Loss (-) of SEBs (Without Subsidy) 98
39 (C ) Commercial Profit/Loss (-) of SEBs (With Subsidy) 99
39 (D) Outstanding Dues Payavle by SEBs to Central Sector PSUs as on 28th February, 2002 (Including Surcharge) 100
40 Net Profit/Commercial Profit/Losses in State Road Transport Undertakings (SRTUs) 102
41 (A) Total Investment of State PSUs by State 103
41 (B) Accumulated Losses of State PSUs by State 104
41 ( C ) State-wise Rate of Return - State PSUs by Category 106
42 State-wise Developmental and Non-Developmental Expenditures as Percentage of GSDP - Period Averages 110
43 Plan Expenditure as Percentage of Developmental Expenditure - Period Averages 112
44 Trends and Composition of Resource Transfers to States - Period Averages 114
45 Outstanding Government Guarantees 118
46 Annual Compound Growth Rate in GSDP and Per Capita GSDP During 1980s and 1990s
State Rankings in Descending Order of Growth 123
47 Quinquennium Compound Growth Rates of SDP and Per Capita SDP (at 1993-94 Prices) of States During 1990s 124
48 Rank of States in Descending Order of Per Capita (NSDP) 126
49 Classification of Major States Based on their Human Development Index (HDI): 1981, 1991 and 2001 128
50 Ranking of States Based on their Credit-Deposit Ratios 131
51 Rankings of States Based on Per Capita Bank Credit and Per Capita Bank Deposits 132
52 Classificaiton of States Based on Disbursements of Financial Assistance by All Financial 133
Institutions (AFIs): State Rankings
53 Ranking of States Based on Per Capita Disbursements of Assistance by All Financial Institutions (AFIs) 135
54 Trends in the Distribution of Industrial Output by States 136
55 Industrial Investment Proposals and IEMs Implemented: Statewise: August 1991-March 2004 137
56 Distribution of Estimated Investments by States and Union Territories 138
57 State-wise Flow of FDI Approvals During August 1991 to March 2004 139
58 Trends in Resource Mobilisation, Pattern of Expenditure and Fiscal Imbalance in States of India 143
59 A Comparison of States' Fiscal Performance Juxtaposed Against Their Economic Performance: State Rankings 144
60 Recovery of Cost Through Power Tariffs 166
Exhibits
Exhibit
I Annual Compound Growth Rates in GSDP and Per Capita GSDP during 1980s and 1990s - State-wise 149
II State-wise and Region-wise Distribution of Bank Deposits and Bank Credit:1981 to 2002 150
III State-wise Disbursments of Financial Assistance by All Financial Institutions (AFIs) 152
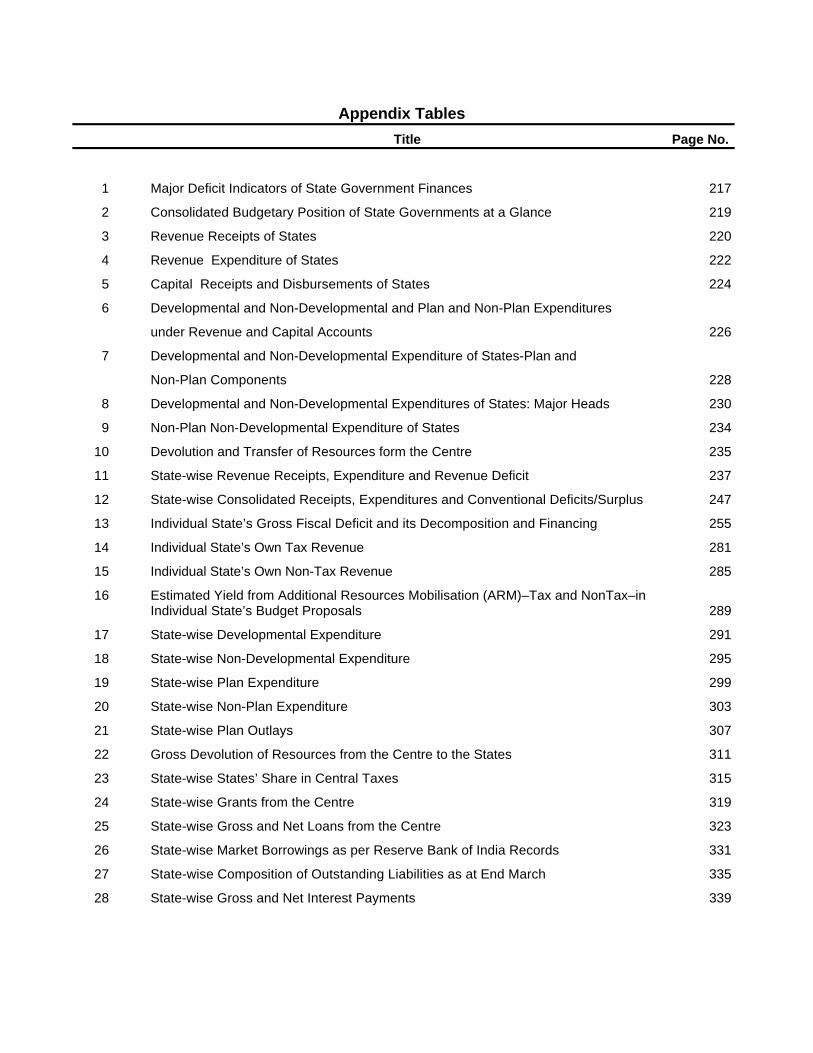
Title Page No.
1 Major Deficit Indicators of State Government Finances 217
2 Consolidated Budgetary Position of State Governments at a Glance 219
3 Revenue Receipts of States 220
4 Revenue Expenditure of States 222
5 Capital Receipts and Disbursements of States 224
6 Developmental and Non-Developmental and Plan and Non-Plan Expenditures
under Revenue and Capital Accounts 226
7 Developmental and Non-Developmental Expenditure of States-Plan and
Non-Plan Components 228
8 Developmental and Non-Developmental Expenditures of States: Major Heads 230
9 Non-Plan Non-Developmental Expenditure of States 234
10 Devolution and Transfer of Resources form the Centre 235
11 State-wise Revenue Receipts, Expenditure and Revenue Deficit 237
12 State-wise Consolidated Receipts, Expenditures and Conventional Deficits/Surplus 247
13 Individual State’s Gross Fiscal Deficit and its Decomposition and Financing 255
14 Individual State’s Own Tax Revenue 281
15 Individual State’s Own Non-Tax Revenue 285
16 Estimated Yield from Additional Resources Mobilisation (ARM)–Tax and NonTax–inIndividual State’s Budget Proposals 289
17 State-wise Developmental Expenditure 291
18 State-wise Non-Developmental Expenditure 295
19 State-wise Plan Expenditure 299
20 State-wise Non-Plan Expenditure 303
21 State-wise Plan Outlays 307
22 Gross Devolution of Resources from the Centre to the States 311
23 State-wise States’ Share in Central Taxes 315
24 State-wise Grants from the Centre 319
25 State-wise Gross and Net Loans from the Centre 323
26 State-wise Market Borrowings as per Reserve Bank of India Records 331
27 State-wise Composition of Outstanding Liabilities as at End March 335
28 State-wise Gross and Net Interest Payments 339
Appendix Tables
Executive Summary
Objectives of the Study
1. The objectives of this study are: (i) to build a fairly comprehensive data base
for a long period; (ii) to interpret the trends in various components of state finances in
terms of their determinants; (iii) to identify the major policy decisions taken at the
central as well as the states level that have contributed to the given trends in state
finances; (iv) to make an inter-state comparison of fiscal performance against the
backdrop of their growth outcomes in social and economic spheres; and (v) to put
together a narrative of efforts being made by individual state governments to
introduce reforms in their finances. (pages 8-10)
2. An aspect noticed in the study is the growing importance of states’ fiscal
operations relative to the size of central finances, with the aggregate expenditure of
states together overtaking the centre’s total expenditure in 1999-2000 and
considerable widening of the difference in developmental expenditures over years.
(pages 15-19)
Genesis of Fiscal Imbalances
3. (i) Tracing the genesis of growing fiscal imbalances, the paper argues that
though the deficit on revenue account began in the year 1987-88, it
was following the impact of the fifth pay commission
recommendations, that the states’ revenue deficit experienced a
quantum leap.
(ii) Apart from the impact of the fifth pay commission recommendations
and the classificatory change in respect of small savings, the drastic
upward revision in interest rates effected by the Reserve Bank of India
in the first half of the 1990s on the consideration of moving to market-
related rates of interest, that contributed to the fiscal malaise after the
end of that decade.
(iii) On the revenue side, the states’ own tax receipts, which had stood the
ground throughout the 1990s, became somewhat sluggish in the latter
half of the 1990s, but the sharpest fall has occurred in non-tax
revenues.
(iv) As a fallout of the fiscal adjustment and reduced revenue growth at the
central government level, following also the recessionary conditions in
Indian industry, the growth in states’ share in central taxes has slowed
down rather drastically. As against it, non-plan statutory grants have
shown some rise, but overall there has occurred a relative shift in
favour of loans as aga inst grants. Also, with a rise in debt servicing on
central loans, net transfers from the centre have been getting narrowed.
4. In recent years, revenue deficit constitutes a major part (60 per cent) of fiscal
deficit though it was in the range of 20-30 per cent during the early 1990s. A
substantial rise in current consumption primarily to meet non-developmental
expenditure has reduced the share of capital expenditure and this may have been a
factor in retarding the growth of state economies over years.
5. (i) A question mark on the sustainability of states’ debt position, however,
has arisen from the fact that (a) the recent debt has occurred at
relatively high interest rates, (b) it has been accompanied by a
significant slowdown in revenue growth, and (c) an increasing
proportion of it is being used for non-developmental purposes as
indicated earlier. Therefore, the capacity of public expenditure to
augment the growth potentials of the state economies and thus help
augment tax revenues, appears limited.
(ii) In recent years, the range of coupon rates and their weighted averages
have steadily declined; they were at a peak of 14 per cent and now
they have fallen to a range of 6.67 to 8 per cent or to a weighted
average of 7.50 per cent in 2002-03. But, their benefits will not accrue
to state budgets in the immediate period due to two to three reasons.
First, for some years to come, the outstandings of loans contracted
earlier at higher rates of interest will remain to be serviced. Secondly,
a rising proportion of borrowing requirements will be met, from the
high cost small savings and state provident funds – a disquieting
feature reflected in the financing pattern of gross fiscal deficits. Third,
as a result of the rising interest burden, interest outgo in the state
budgets has shot up to over 80 per cent of total debt servicing. (pages
20-30)
The Influence of Competitive Politics
6. What stands out in the overall fiscal performance of states has been the
sudden deterioration that began after 1997-98, following the influence of ‘competitive
politics’ playing an upper hand in the general governance of the country and in fiscal
operations in particular. (pages 30-33)
Structural Weaknesses
7. Yet another dimension to the fiscal problems of states has been that some of
the structural weaknesses, highlighted by the RBI (1999a) and further amplified by
the Eleventh Finance Commission (2000), have got accentuated in the recent period,
thus contributing to the severity of state- level fiscal imbalances: limited tax base of
the states, the growing services sector being outside the ambit of the states,
tremendous pressure on states to expand their expenditure commitments on
agriculture, irrigation and other rural infrastructures, as also on social infrastructures,
and there has always been a cap on the size of the market borrowings of the states.
(pages 34-35)
Sluggish Revenue Trends
8. It is significant that the year of turning point in the fiscal performance of
states, namely, 1998-99, saw the relative dip in receipts under all revenue heads.
This was so even under the states’ own tax receipts.
9. Sales tax, which is the major revenue earner for the states with over 60 per
cent of revenue accruing from it, faces a complex set of issues. (pages 36-42)
10. The share of states in central taxes has experienced a slow but steady fall
(from 2.7 per cent of GDP in 1997-98 to 2.4 per cent in 2001-02). (pages 58-63)
11. Simultaneously, there has occurred slowdown in the rate of growth of other
non-tax receipts, particularly revenues earned from economic and social services.
12. (i) Even the above meagre receipts under non-tax revenues hide the
potential losses under (a) potential returns on state government
investments, and (b) recovery of cost of public services. Power sector
has been a major drag on state finances.
(ii) State road transport corporations/undertakings (SRTUs) constitute the
second largest enterprises of the states and they also serve as a drag on
the state budgets. (pages 43-55)
Declining Shares of Capital, Developmental and Plan Expenditures
13. (i) States’ total expenditure trends over the past two decades since the
early 1980s have seen their steady growth at about 14 to 14.5 per cent
per annum.
(ii) A disconcerting aspect of the Indian fiscal performance has thus been
the erosion in development momentum as reflected in a declining
share of developmental expenditure in total expenditure both at the
centre and state levels in the 1990s, but the erosion at the states’ level
has been more moderate.
(iii) The declining trend in developmental expenditure is found in both
revenue and capital expenditures.
(iv) The loss of developmental momentum is better seen in the declining
ratio of developmental expenditure under revenue account as
percentage of GDP.
(v) Incrementally, one-half of the increase in total expenditure of the
states after 1997-98 has been due to non-developmental expenditures,
whereas in the preceding seven-year period, the corresponding ratio
was only about 40 per cent.
(vi) If overall development expenditure as a proportion of states’ total
expenditure has steadily receded since the beginning of the 1990s, it is
the ‘economic services’ expenditure which has faced this slide.
14. (i) In the latest phase between 1997-98 and 2002-03, plan and non-plan
disposition of states’ expenditures has followed a somewhat different
pattern, with plan expenditure rising by 81.7 per cent while non-plan
expenditure rising by 91.7 per cent in contrast to increases of 69.4 per
cent in developmental expenditures and 123.5 per cent in non-
development expenditures.
(ii) About 43 per cent of the incremental aggregate expenditures of states
has been absorbed by non-plan non-development expenditure, in
which three major heads of expenditure, namely, interest payments,
administrative services and pension and miscellaneous general
services, accounted for the bulk during the latest period – about 90 per
cent of non-plan non-development expenditure or nearly 40 per cent of
the increase in aggregate expenditure. (pages 64-79)
Inter-State Differences in Fiscal Performance
15. The aggregate picture of all-states data obviously hides the vast inter-state
differences in fiscal performance. The ten special category states have exhibited
unusual fiscal indicators such as overall revenue surpluses and low levels of fiscal
deficits because of relatively high levels of plan and non-plan grants that they have
enjoyed from the central government.
16. (i) As for 15 major states, a majority – 8 out of 15 – had annual averages
of revenue deficits during 1998-99 to 2002-03 (BE), ranging from 4
per cent to 5.7 per cent of SDP which are higher than the all-states
average, while the other 7 states had this ratio ranging from 1.9 per
cent to 3.0 per cent. Three southern states of Karnataka, Andhra
Pradesh and Tamil Nadu, belonging to the middle- income groups,
have managed with relatively lower revenue deficit.
(ii) The second important revelation at the individual states level has been
the sharp deterioration in revenue deficit as between the two phases of
1993-94 to 1997-98 and 1998-99 to 2002-03 (BE), with Gujarat
amongst high- income states facing the sharpest 10-fold rise, while
Madhya Pradesh and Haryana experiencing the lowest rise, between
the phases.
17. At the same time, very many common causes dominate the fiscal
performances of major states which explain the rapid deterioration in revenue and
fiscal deficits of all states in recent years. These common causes of fiscal imbalances
amongst 15 major states are: (i) a sudden jump in non-development expenditure
including the incidence of interest on debt; (ii) sharp reductions in the growth of own
non-tax revenues; and (ii) similar deceleration in the rate of growth of resource
transfers from the central government. All of them face the structural issues
enumerated above.
18. (i) The major states’ overall performance in regard to mobilisation of own
taxes has not been as weak as it is generally believed.
(ii) The mobilisation of non-tax revenue has been meagre amongst all
states without exception.
(iii) The severest drain on state finances has emanated from the
discouraging performances of state electricity boards (SEBs) with
large commercial losses.
19. (i) The sudden jump in non-development expenditure during the recent
period following the upward revision of pay and pensions of state
government as well as local bodies’ employees, has been striking.
(ii) Yet another important factor in the growth of non-development
expenditures of states has been the acceleration in the growth of
interest payments.
20. If the proportions of 58 per cent to 60 per cent of aggregate expenditures,
which are all-states averages, are considered as the benchmark for developmental
expenditure purposes for recent years, all the southern states of Karnataka, Andhra
Pradesh, Kerala and Tamil Nadu (ranging from 63 per cent to 58 per cent) as well as
Haryana (63 per cent), Gujarat (68 per cent), Madhya Pradesh (62 per cent) and
Rajasthan (58 per cent), show better record in their attempt to devote higher
proportions of expenditures for developmental purposes.
21. Amongst the southern states, Andhra Pradesh, Karnataka and Kerala enjoy
better plan expenditure to GSDP ratios of 5 to 6 per cent too, but Tamil Nadu has a
lower ratio of a little above 3 per cent.
22. It is also significant that plan expenditures of states as percentages of total
developmental expenditures generally vary with their income levels, the high- income
states having lower proportions of plan expenditures and the low-income ones higher
proportions. (pages 80-115)
Fiscal Performance and Performances in Social and Economic Spheres
23. (i) Abstracting from aberrations and occasional divergences, there is an
amazing consistency in the varied rankings of states based on major
indicators of social and economic development. From this it is clear
that an overwhelming number of states appear common in all the three
top, middle, and bottom rankings pertaining to five different measures
of economic, financial and fiscal performances.
(ii) While there is thus link between fiscal performance and performances
of states, in economic, social and financial sector spheres, the
causation seems to be surprisingly generally unidirectional and seems
to run from the overall economic performance to fiscal performance
and also to the partaking of benefits of financial sector development
and not the other way about. States enjoying high income levels and
relatively high rates of income growth have generally succeeded in
producing better own-tax mobilisation and in minimising fiscal
imbalances. Likewise, such are the very states which have generated
better deposit resources for banks and also succeeded in producing a
conducive environment for absorbing relatively higher levels of bank
credit as well as other institutional form of credit. (pages 120-152)
Measures of Fiscal Reforms
24. (i) A number of states have initiated steps to address some of the long-run
problems in mobilisation of tax and non-tax revenues and reforming
public enterprises.
(ii) Three substantive programmes have been in operation at the initiative
of the central government. First, on the advice of the National
Development Council (NDC), the centre instituted a one-time ‘fiscal
reform facility’ for the year 1999-2000 associated with the clearance
of states’ ways and means advances from the RBI conditional upon
structural reforms in their finances being undertaken by them. Second,
the start of a monitorable medium-term fiscal reform programme
(MTFRP) for five years from 2000-01 to 2004-05 based on the
supplementary recommendation obtained from the Eleventh Finance
Commission. Third, in order to address the growing debt burden of
states and to supplement the efforts of states in the direction of
evolving their medium-term fiscal reform programme, a Debt-Swap
Scheme has been formulated by the Government of India.
(iii) Besides, in recent years, states have initiated and begun to implement
on their own several reform measures aimed at fiscal consolidation.
(iv) Finally, at the initiative of the central government and at the states’
own initiative, concerted efforts have been made to reform the power
sector which has been a sizeable and growing drain on states’ finances.
25. In the same vein of fiscal reforms, the RBI has taken a number of initiatives to
reform the state level fiscal processes. Amongst them, the most visible has been the
measures to contain the growth of state guarantees. With resource constraints faced
by state governments, capital budgets have been hurt rather drastically and hence
some of the state governments have taken initiative to implement capital projects
outside their budgets through off-budget borrowings which required state guarantees.
(pages 153-192)
Policy Implications
26. (i) The package of measures that have been set out under various reform
programmes suggests itself as a fairly comprehensive set of policies
that the states have to pursue to put their fiscal house in order. The
results of the present study throw up precisely the same set of measures
that are necessary to achieve the targeted goals. In this respect, two
issues that stand out are: first, the number of states that have proposed to
undertake substantive fiscal responsibility measures is very few; and
second, the series of measures that have been promised so far
themselves are not being implemented in their entirety.
(ii) On the whole, it is not proper to blame the states alone for their fiscal
malaise. Many of the budgetary decisions taken at the central level have
impacted the state level finances. In fairness, it must be said that the
states cannot resist, for example, the demands for pay and pension
revisions in response to pay commission recommendations for central
government employees. On both the last two occasions, the response had
to be ad hoc as the implications for the state finances were not
considered in advance. Also, states have done reasonably well in
pursuing the mobilisation of their own taxes. In the recent period, states
have also joined together to organise their tax systems by co-ordinating
and introducing floor rates of taxes and easing out existing concessions
and tax holidays. It is the transfer of central taxes wherein there has
occurred deceleration in growth. Even so, there is still scope for
rationalising their tax rates, modernising the taxation system and
widening their tax base. On the VAT, in view of the apprehensions
entertained by the states, the central government has agreed to
compensate 100 per cent of the loss in the first-year, 75 per cent of the
loss in the second year, and 50 per cent in the third year. The central
government has also proposed a constitutional amendment to enable the
levy of tax on services with sufficient powers for both the central and
state governments to collect the proceeds. These should go a long way
in helping the states to minimise some of the structural problems in their
finances and widen their tax base.
(iii) A crying need at the states level today is administrative reform.
Repetitive reports of the Comptroller and Auditor General of India and
other documents suggest that there is excessive staff and consequential
inefficiency and corrupt practices which result in inoptimal
performances at various levels of state government administration.
Above all, these are reflected in inordinate delays in clearance of
investment proposals of domestic entrepreneurs and those of foreign
direct investment. Despite many government initiatives to bring about
better industrial dispersals regionally, the existing manufacturing base
and more importantly, the new IEMs and FDI are acutely concentrated
in a few states. Likewise, banks and financial institutions are reluctant
to expand their lending activities in vast areas of central India and
eastern and north- eastern regions. The administrative reforms will thus
have not only healthy effects on finances of state governments but also
on the general performances of state economies.
(iv) Apart from administrative reforms, an important reform which the states
have to undertake relates to their pension arrangements. Some states
have proposed introduction of contributory pension schemes for their
newly recruited staff. This is a necessary programme for all states to
emulate.
(v) On the revenue front, apart from the implementation of Value Added
Taxes (VAT), tightening of the tax administration, modernisation,
normal of loopholes and expanding the tax base by facilitating the
inclusion of services in the states’ tax net, are some of the obvious
measures that stand out as crucial for improving state finances. (pages
205-207)
1
Finances of State Governments in India
A Time Series Analysis of State-wise Budgetary
Performances During the 1980s and 1990s I
The Objectives of the Study
The fiscal area has been a much researched field of economic analysis in
India. This has been so particularly after the initiation of economic reforms in
the early 1990s. Studies on fiscal issues have been stimulated by the fact that
fiscal adjustment has constituted a critical component of the reforms package
(Ministry of Finance 1993). The fiscal adjustment in turn has been influenced
by a whole gamut of macro economic policies which are constituent parts of
stabilization programmes and structural reforms – policies concerning size
and composition of public expenditures, reform of the public sector in general
and that of the system of subsidies and recovery of user charges in particular,
comprehensive tax reform which also involved drastic reductions in the rates
of effective protection for Indian industry and establishment of competitive
conditions for attracting foreign direct investment, and reductions in real rates
of interest.
Recent Literature
The initial focus on policy reform, as also in policy discourses and
research, was essentially on reforming the central finances. Two key papers
of the period, sponsored by official agencies and enunciating policy contours
and the tasks ahead had hardly made any reference to the fiscal (or even other)
reforms at the states level: (i) Ministry of Finance (1993): Discussion Paper
on Economic Reforms: Two Years After and the Task Ahead; (ii) Bhagwati,
Jagdish and T.N. Srinivasan (1993): India’s Economic Reforms, July. It must
be admitted that very early on, that is, as early as in June 1990, a seminar on
state finances was planned by the Government of India and the World Bank
and that, in fact, it was held on April 19-20 1991 in New Delhi, under the
auspices of the National Institute of Public Finance and Policy which played a
2
pivotal role in the organisation of the seminar contributing its expertise on
state finances (Bagchi, Bajaj and Byrd 1992). A general refrain at the seminar
was that “state finances have been facing a squeeze that predates the current
fiscal crisis, severely affecting their development expenditures’ (ibid, p.492).
The second exception at the professional level was a pioneering study,
anticipating many of the impending maladies of state level finances, was that
of Govinda Rao (1992), also undertaken at the NIPFP and it was published in
the initial period of fiscal reforms. Govinda Rao (1992) contended that since
1987-88, states as a group had begun to face dissaving of a significant
magnitude, which increased year after year mainly due to high growth of
revenue expenditures. This rise in revenue expenditures, placed at an alarming
rate of 17.6 per cent per annum in the 1980s, was due to an explosive rise of
31.2 per cent in net interest payments (or 22.7 per cent in gross terms), as also
rapid increases in wages and salaries bill and subsidies. Govinda Rao (1992)
drew attention to the impact of the recommendations of the then Fourth Pay
Commission on pay revisions for state government employees. Noting that
states’ own tax revenue growth at 15.6 per cent per annum (sales tax revenue
at 16 per cent per annum) was reasonable, the fiscal adjustment, in his view,
had to come about by compressing revenue expenditures, and by targeting
subsidies and user charges for social and economic services. He suggested a
series of measures on compressing revenue expenditures including reductions
in the number of government employees, as also adjustments in subsidies; in
the taxation sphere, Govinda Rao (1992) suggested simplification and
rationalisation of taxes, particularly states’ sales taxes.
Except for the above efforts, the ailments of state finances were
relegated to the background in the tempo of implementing fiscal adjustment1.
Thereafter, it was towards the end of the 1990s that more concerted attention
begun to be bestowed on the deteriorating state finances and the imperatives
of reforms in them, particularly after 1998-99 when the revenue deficit of
states more than doubled on pay revision of their employees (Reserve Bank of
India 1999a, p.90). Since then there has been a spate of studies on state
finances which have surveyed the recent trends in their various aspects and
raised very many issues and challenges faced by the states as well as the
3
centre in restructuring state finances. The period began with a series of
articles by Vithal and Sastry in the years 1995, 1996 and 1997, which were
combined to produce a comprehensive study on Fiscal Federalism in India by
Vithal and Sastry (2001). True to its caption, the study dealt at length with the
entire gamut of resource transfers from the centre to the states - horizontal and
vertical devolutions, statutory grants and plan and non-plan transfers and also
the functioning of the first ten finance commissions. This was followed by a
study by Kurian (1999) bringing out the deteriorating trend in state finances,
particularly after the implementation of the recommendations of the fifth pay
commission for central government employees began to cast their shadow
over state finances as well. Kurian (1999) also sought to place the inter-state
and inter-group disparities in fiscal performance against the backdrop of
variations in states’ overall SDP and SDP per capita growth, which were in
turn sought to be explained by the relative performance of states in attracting
private investment as reflected in disparities in the absorption of institutional
credit.
Seeking to throw light on how fiscal federalism has functioned in
India, Ashok Lahiri (2000) sought to argue that the fiscal arrangement had
kept state deficits in check and that in fact the centre’s performance had been
considerably poorer in regard to both revenue and fiscal deficits. Lahiri
focused further on the extent of appropriate expenditure prioritisation by the
states and on the series of issues concerning reforms and harmonisation of
state taxes. Lahiri (2000) preferred a leadership role for the centre in fiscal
consolidation. On the other hand, Parthasarathi Shome (2000) sought a policy
review in centre-state fiscal relations on the ground of a negative relationship
between decentralisation and fiscal deficit; decentralisation in expenditure is
also said to have led to both higher economic growth and reduced fiscal
deficit of states. To take advantage of such a relationship, Shome (2000) has
suggested a reduction in the share of overall revenue transfer in central taxes
from the centre to the states, which according to him will leave greater room
for the states to collect their own revenue, ‘giving them more responsibility to
handle their own affairs’. Shome (2000) also sought to argue that the drain on
the states’ financial resources emanated from extensive subsidies and the
4
reductions in non-tax revenues including user charges on the provision of
electricity, road transport and irrigation. Overall, the quality of states’ fiscal
performance, reflecting both revenue and expenditure heads, had worsened
significantly during the decade of the 1990s. Yet another substantive study in
this series has been that of Saumitra Chaudhuri (2000). He also noted that it
was in 1998, and through 1999, that ‘perhaps for the first time’ concerns about
the financial health of state governments drew considerable public attention.
Chaudhuri (2000) divided the decades of the 1980s and 1990s into four
phases:
• The first is that of the early 1980s ending with 1984-85 –
beginning with low administered interest costs, relatively low
fiscal deficits and a significant revenue surplus.
• The second covers the latter part of the 1980s and up to 1990-
91, the year before the reforms began. This was a period
characterized by persistent high leverage, interest rates that had
already moved up, although the benefit of pre-existing cheap
debt masked the impact of high debt on finances and a small
erosion on the receipts side.
• The third starts from the beginning of the reform period (1991-
92) and runs up to 1995-96, a period of what turned out to be a
temporary and short-lived stabilization.
• The fourth begins with 1996-97 and continues up to 1999-
2000. Also in the second half of the nineties, unlike in the first
half, revenues fell more than did expenditures, leading to a
reversal of the trend of declining deficits and of debt levels
(Money and Finance, ICRA Bulletin, May-June 2000, p.40 and
44).
There were two interesting thoughts in Chaudhuri’s paper which are worth
highlighting. First, he noted that there were signific ant positive developments
in that the states were willing to cooperate with each other, the evidence of
which was the sales tax concordant amongst them entered into in November
1999. The states were also inclined to adopt a more aggressive reform agenda
(explained in Section XIII of this study). The second thought concerned the
5
states’ attempt to undertake extra-budgetary capital projects which meant
accepting greater commercial liabilities such as guarantees; this was done with
a view to offsetting the curtailment of capital expenditures which bore the
brunt of fiscal adjustment; we have to note that this aspect of states’ response
arose out of the imperatives of fiscal adjustment, particularly when they had
limitations of borrowings either from the centre or from the market.
Three other substantive studies on state finances were those of the
Reserve Bank of India (1999b), the Eleventh Finance Commission (2000) and
the EPW Research Foundation (2001a). The RBI study emphasized the
structural nature of imbalances in state finances, stemming from the limited
resource base in relation to the growing expenditure commitments. “While
the state governments”, said the RBI (1999b), “collect about one-third of the
consolidated combined government sector receipts, they incur more than
three-fourths of the total (consolidated) expenditure on social services and
more than half of the total expenditure on economic services” (p.V-7).
Commending the RBI stance of highlighting structural weaknesses of state
(and central) finances, the Eleventh Finance Commission (2000) focused on a
series of immediate and longer term issues of fiscal ailments. The
phenomenon of expenditure growth outpacing the growth of revenues, noticed
in the eighties, got widened in the mid-nineties with stagnating revenue
growth and fast expansion of expenditure. The Commission reasoned that
apart from the immediate causes of revisions in the salaries and pensions of
government employees and the cyclical recession in economic activity
retarding the growth of tax revenues at the central as well as state levels in the
second half of the 1990s, the factors influencing the budget outcomes have
been structural. On the revenue side, erosion in tax buoyancy particularly in
the 1990s, virtual stagnation in the level of non-tax revenues, and the drop in
the growth of central taxes adversely affecting the flow of tax devolution,
stood out. On the expenditure front, the underlying causes of deterioration
have been identified as:
(i) upward revision of emoluments and the convergence of salary
structures of central and state government employees, on the
6
one hand, and those of local governments and aided
institutions, on the other;
(ii) burgeoning subsidies, explicit and implicit;
(iii) upward shift in rates of interest with increasing dependence on
high-cost borrowings; and
(iv) the widening gap between revenue and expenditure resulting in
a cut-back on expenditures of developmental and investment
nature.
The Eleventh Finance Commission presented a fairly detailed account of the
rise in interest rates on borrowings (the average rate rising from 6.75 per cent
in the early 1980s to 12.35 per cent in 1998-99), increase in the share of
liabilities on public account (provident funds and small savings), the rise in
subsidies, and very rapid growth of “pension” liabilities (the annual growth
of such liabilities at the states’ level being 19.6 per cent during 1990-95 and
26.6 per cent during 1995-99). The Commission also reckoned that the
structural weaknesses in the fiscal area stemmed to a large extent from the
infirmities in the institutional framework, whether of legal and administrative
nature or of political institutions.
Of course, the Reserve Bank’s analysis of fiscal operations of central and
state governments has been an annual feature, even from a longer term
perspective. The latest one (RBI 2003b, p.IV-II), for instance, presents state-
wise estimates of buoyancy of state taxes and stated that the fall in tax
buoyancies was attributable to competitive tax reductions by states to attract
trade and industry. The decline in buoyancies also followed from higher
growth in services which were not adequately taxed. Even so, on average,
tax-GDP ratio for states during the reform period was higher than that in the
1980s. The decline in non-tax revenue to GDP ratio rather hide the unduly
low level of user charges collected by the states. It also followed from
persistently inadequate returns on states’ investments in their enterprises –
State Electricity Boards, State Road Transport Undertakings and other
segments attracting public investments. Earlier, the RBI had sponsored under
its Development Research Group (DRG) studies, a research paper on A Study
7
of State Public Accounts in India (Hemlata Rao, Abha Prasad and Arnab
Gupta 2001), which brought out how resources mobilised through small
savings, provident funds and special deposits were being serviced at a high
effective cost at the states level.
The EPW Research Foundation (2001a) reviewed the trends in state
finances in the 1990s and brought out how: (i) trends in revenue receipts
suffered a setback because of reductions in the share of central taxes as well as
grants from the centre as percentage of GDP, while the states’ own tax efforts
were sustained if not improved; (ii) the erosion in the development
momentum was reflected in the declining share of states’ development
expenditure in their total expenditure; (iii) the sliding down of development
expenditure was more in infrastructure and other ‘economic services’,
whereas the share of ‘social services’ generally remained unchanged; and
(iv) different indicators of fiscal performance showed deterioration in all
states without exception, though there were still significant inter-state
disparities. The EPWRF article also drew attention to the series of fresh
initiatives taken by the states, the centre and the RBI to reform the totality of
state finances.
In the meantime, there was an extensive debate on the ‘nature of the
fiscal crisis in the Indian federation’ between Mih ir Rakshit (2000), Saumitra
Chaudhuri (2000a) and Amaresh Bagchi (2001); there were also independent
contributions on the same theme by Raja Chelliah (2001) and Mihir Rakshit
(2001). All of these essentially addressed India’s fiscal crisis in its totality
without focusing on state finances in particular except for Raja Chelliah’s
(2001) brief reference to the question of “the fiscal sustainability at the level
of the states” (p.65). Applying the same yardstick of fiscal sustainability as
the one applied by Mihir Rakshit (2000), viz., the growth rate of the economy
to be higher than the average rate of interest on government borrowings,
Chelliah (2001) came to the conclusion that some state governments were
already in a debt trap, “because they cannot carry on normal financial
operations without extra borrowings, and such extra borrowing is not possible
without the central government’s consent” (p.66).
8
In the series of studies, a recent one which has been very
comprehensive is that of Govinda Rao (2002). Govinda Rao (2002) revisited
the theme after a decade and has sought to dissect the issues and challenges
before the states and the centre against the background of a sharp deterioration
in state finances: the increase in fiscal deficit is accompanied by a worsening
of the quality of deficits, with the share of revenue deficit in fiscal deficit
galloping; and fiscal imbalances, which have constrained the provision of
social and physical infrastructures, have been accentuated by the vast losses
incurred by public enterprises. Govinda Rao (2002) has built a systematic
theme of fiscal imbalances: varied reasons for the slow growth of tax
revenues as well as for the declining non-tax revenues; causes for the
perennial increases in non-development expenditures and stagnation in social
services expenditures to GDP ratios accompanied by sharp declines in the
proportions of capital expenditure to GDP and economic services
expenditures to GDP; gross inefficiencies in tax and expenditure systems; and
inequity and dis incentive effects of fiscal transfers from the centre.
Elsewhere, Govinda Rao and Singh (2001) have discerned the influence of
political considerations, including “the clout of a state in terms of its size” or
the lagged effect of the “proportion of ruling party/coalition MPs on per capita
statutory transfers” (Bagchi 2003) 2 .
Case for a Fresh Data Base
Thus, there have been a plethora of studies on state finances which have
dealt at length with the varied issues and challenges in this area of public
policy. There is nevertheless scope for a comprehensive study in this respect
with a few specific objectives in view, which is what is attempted in this
study. The objectives are broadly four-fold. First, it is to build a fairly
comprehensive data base for long period of 23 years from 1980-81 to 2002-03
for all 25 states (and NCT Delhi; now 28), with fairly disaggregated statistics
covering the details of individual tax and non-tax revenue receipts as well as
capital receipts, as also those of individual developmental and non-
developmental heads of expenditures. The purpose of this data base with long
time series, state-wise and in very many details, will be to facilitate alternative
9
forms of analysis and hypotheses testing with various permutations and
combinations. Secondly, an attempt will be made to interpret the trends in
various components of state finances in terms of their determinants. Thirdly,
studies on inter-state comparison of fiscal achievements in relation to states’
growth outcomes have been fewer. Following the method adopted by Kurian
(1999, 2002) and the EPW Research Foundation’s study on state domestic
product (EPWRF 2003a), an attempt will be made to undertake such a
comparison of fiscal performance against the backdrop of states’ growth in
social and economic spheres. Finally, it is known that growing imbalances in
state finances reflect the crisis of the polity as a whole and the consequential
drift and deterioration in fiscal management at the centre as well as in states
(EPWRF 2001a). In this light, it is proposed to identify the major policy
decisions taken at the central and states levels that have contributed to the
deterioration in state finances. This in turn leads us to identifying the nature
of policy and institutional reforms that are required to achieve fiscal
consolidation at the states’ level. We no doubt recognise that considerable
advance has already been made in putting in place various fiscal, institutional
and sectoral measures to achieve fiscal corrections. States have also
responded to the fiscal crisis by shifting the adjustment in capital expenditures
to projects financed by extra-budgetary resources with loans guaranteed by
them – a somewhat innovative method. Besides, attempts have been made to
reform the power sector, the losses in which have been a major source of
fiscal imbalance at the states’ level. The study will therefore present an
inventory of various fiscal and other policy initiatives taken in recent years.
10
II
Data Sources and the Classification System
The primary aim of this study is thus to assemble and present a consistent
set of time series on state government finances for a fairly long period. The
time period covered in the study is from 1980-81 to 2002-03 (BE) in respect
of all states, during which the configuration and organisation of state
boundaries have generally remained unchanged except for Mizoram which
was created in 1987; they together consisted of 25 states, including the
national capital territory of Delhi3. The data have been principally sourced
from Reserve Bank of India (RBI)’s annual studies on state finances4, which
constitute the most detailed state-wise and consistent data set available in the
public domain. The RBI tabulates these statistics from budget documents of
state governments. Though the analysis strictly conforms to the data
presented in the state budgets and the accounting classification thereof (RBI
2000), the RBI uses other supplementary data received from the states and the
Planning Commission and also the data from the Bank’s own internal records
(RBI 2003). Therefore, there may be some differences in data as published in
the state budget documents and those presented in the present data base.
Standard Classification
The state government budgets are organised along the lines of the
Comptroller and Auditor General’s four digit accounting classification with
disaggregation into the traditional revenue and capital accounts and with
additional decomposition of expenditures into plan and non-plan categories,
the latter available right from the advent of planning in 1951-52. In addition,
the RBI has been classifying budget heads into functional categories such as,
developmental and non-developmental items under expenditures from the
beginning of the early 1950s (Krishnaswamy 1953) and taxes on incomes and
properties and taxes on commodities and services, on the taxes side, as from
the 1980s. All expenditures under revenue and capital accounts are broadly
categorised into general services, social services and economic services.
Expenditures on economic services (agriculture and rural development,
11
industry, physical infrastructure, etc.) and social services (education, health,
housing, labour-welfare, etc.) constitute developmental expenditures, while
those on general services comprising all services of an administrative nature
including pensions as well as interest payments and debt redemptions are
covered under the category of non-developmental expenditures. Under
developmental expenditure (revenue and capital combined), there are direct
expenditures for social and economic services, but there are also loans and
advances by state governments described as developmental advances
(consisting about 5 to 6 per cent of total developmental expenditures). Again,
each category of revenue and capital accounts as well as developmental and
non-developmental heads, is decomposed into ‘plan’ and ‘non-plan’
expenditure categories. ‘Plan’ expenditures, as the name implies, relate to
expenditures on annual plan projects, programmes and schemes approved by
the Planning Commission and time-phased under each year of a state’s five-
year plan; these include centrally-sponsored schemes or central sector plan
schemes routed through state budgets with or without matching state
expenditures5; the latter are outside the state plan outlays.
‘Non-plan’ expenditure is a generic term, which is used to cover all
expenditures of government not included in its annual plan programmes (GoI,
February 2003a); it may either be revenue expenditure or capital expenditure.
Such non-plan expenditure is incurred under both developmental and non-
developmental heads6. For all states together, as depicted in varied tabular
data presented in this data base, over 97 per cent of ‘plan’ expenditures are
under ‘developmental’ heads, but 55 per cent of such ‘plan’ expenditures are
under revenue account and 45 per cent under capital account7. Apart from
administrative expenditures and expenditures of an obligatory nature incurred
by states (police, pensions and interest payments), an important component of
the non-plan expenditure relates to expenditures on maintenance of assets
created in the previous plan programmes. Also, not only that maintenance
expenditures subsequent to the completion of plan programmes are non-plan,
but even “expenditure on continuing services and activities at levels already
reached in a Plan period is classified as non-plan expenditure in the next Plan
period, e.g., continuing research projects and operating expenses of power

12
stations. Thus, as more Plans are completed, in addition to the interest on
borrowings to finance the Plan, a large amount of expenditure on operations
and maintenance of facilities and services created gets added to non-plan
expenditure” (GoI February 2001, Expenditure Budget, Vol.I, Part- II, p.12)8.
Newer Fiscal Indicators
Until recently (2000-01), the crucial macro-economic variables such as,
revenue deficit, gross fiscal deficit and primary deficit, were being computed
and published by the RBI in their annual publication on state government
finances. Perceiving that transparency in government operations was an
important pre-condition for macro-economic fiscal sustainability and for
overall fiscal rectitude, a committee of state finance secretaries was
constituted during 1999-2000 on the issue of transparency and voluntary
disclosure norms for state budgets - one of the many initiatives the RBI has
taken in recent years in the areas of state finances (RBI 2003). Based on the
model format prescribed by the committee, many state governments have
published key fiscal indicators in their budgets along the lines of the central
government’s Budget at a Glance as a first step (RBI 2000) (more on fiscal
responsibility legislations later).
Nature of Data Base
Based on the above sources, a massive set of data base has been created
in respect of state finances, both aggregate and state-wise, for a period of 23
years from 1980-81 to 2002-03 (BE) in this study. The first set of detailed
data consists of four annexures (Annexure I to IV), presenting state-wise
revenue receipts and revenue expenditures and capital receipts and capital
disbursements for the 23-year period; the disaggregation is so detailed that
each state has 36 pages of data sheets in this set of annexures (except for the
three newly created ones). Though the data contained in the most recent study
of the RBI on State Finances (RBI April 2004) have not been dovetailed into
the analytical content of this study as the data were released subsequent to the
finalisation of the Report, the same have, however, been reproduced as a
separate annexure (Annexure V) for ready reference. Together for 28 states,
13
these budgetary data extend to over 1,300 pages and the same are presented in
Volume II of this study.
The second set is a system of analytical tables – 28 Appendix Tables –
which present the aggregative and state-wise summary pictures of different
dimensions of state finances mainly for the 23-year period. However, for the
first two tables in this set (Appendix Tables 1 and 2), data contained in the
most recent study of the RBI for 2003-04 (RBI April 2004) have been
incorporated thus increasing the coverage to 24 years, 1980-81 to 2003-04
(BE); figures for 2002-03 also accordingly cover Revised Estimates in these
two appendices.
A third set of tabular data consists of summary results presented along
with the text; they are either derived from the Appendix Tables or are based
on other independent sources of data which have been specified.
Section Scheme
Apart from the two introductory sections and the series of annexures and
appendices, the results of the study are presented in the subsequent 12 key
analytical sections. While Section III pinpoints how, with their growing
importance, states’ fiscal operations have overtaken the size of central
finances, Section IV focuses on the genesis of fiscal imbalances amongst
states. The subsequent four sections critically examine the trends in budgetary
receipts of states – tax receipts (Section V), non-tax receipts (Section VI)
capital receipts (Section VII) and central transfers (Section VIII). A highlight
of the section on non-tax receipts is the brief sojourn to a review of the
financial performances of the states’ power sector and other state PSUs.
Section IX attempts a detailed review of the growth and structural
changes that have occurred since the early 1980s in the budgetary
expenditures of states, while Section X is devoted to presenting highlights of
inter-state differences in fiscal performance. Section XI seeks to bring out
how the end product of fiscal laxity has been reflected in growing outstanding
liabilities of state governments. In addition, states’ attempts to undertake
capital projects outside their budgets have resulted in sizebale increases in
contingent liabilities, which are highlighted in the same section.
14
In section XII, a somewhat heroic attempt has been made to juxtapose
fiscal performance of states against their growth profile. Substantial amounts
of empirical evidences on the rankings of states as per their performances in
income growth, improvement in human development, indicators of banking
and financial sector development, as also in attracting investment proposals
and their execution, are adduced here in this section.
Finally, Section XIII is devoted to a review of the states’ performances in
recent years in regard to the reform of state finances, including their power
and other PSU sectors.
The study concludes with a summing up of its results and a brief
enunciation of policy implications in Section XIV.
15
III
Growing Importance of State Finances
An aspect of change that has occurred in the totality of fiscal operations
in India, which has generally been neglected in literature, concerns the
growing importance of the states’ fiscal operations relative to the size of
central finances. The first evidence of this is to be seen in the fact that the
aggregate expenditure of state governments together, which has always been
lower than that of the centre until 1998-99, has overtaken the centre’s total
expenditure in 1999-2000; in the latter year it has touched Rs 325,634 crore or
16.6 per cent of GDP at current market prices as against the centre’s total
expenditure of Rs 312,258 crore or 16.0 per cent of GDP (EPWRF 2003,
p.1907). Thereafter, not only that the states’ aggregate expenditure has
remained higher than that of the centre, but also that the relative difference has
widened though rather gradually; it has expanded from 4.3 percent to 9.6
percent in 2002-03 (RE) (RBI 2003a, pp. 62 and 70).
Secondly, the growing importance of state finances in the macro-
economy is reflected in the relatively more rapid growth of their overall
developmental expenditure. The size of the total developmental expenditure
of the states has always been higher than that of the centre because of the
differing nature of responsibilities in the federal set up, with some of the most
important sectors of the economy – agriculture and irrigation, rural
infrastructure, health, education, and other social services – being state
subjects. The relative importance of states’ development expenditure further
increased in the 1990s and the difference has got widened rather significantly.
In 1990-91, the states’ development expenditure exceeded that of the centre
by less than 10 per cent, but by 2001-02 (RE), it had exceeded by near 50 per
cent. What is more, in total government expenditure on ‘social services’, the
share of state governments now constitutes over 85 per cent; thus, for social
services, the central government expenditure accounts for less than 15 per
cent. Correspondingly, on the resources side, the outstanding liabilities of
state governments, which had constituted less than 40 per cent of the total
16
internal liabilities of the central government, have risen at a faster pace and
reached 46 per cent by 2003-04 (BE).
The logic of the reform process and the associated fiscal consolidation
implies that the state increasingly moves in favour of social and rural
infrastructures and that this would cast an additional responsibility on the state
governments, which is what is getting reflected in the growing importance of
their expenditures, particularly for developmental purposes. The Reserve
Bank of India has, therefore, observed thus:
“It is increasingly recognised that it is the State finances where the
Government sector’s interface with the people is most significant. Issues
in the reform of fiscal policy in the States have a direct bearing on the
quality of life” (RBI 2003a).
The reform process, however, also implies more cost effective ways of
delivering public services, both at the central and states levels. In regard to
the states’ achievement on this, we are unable to pass any judgement for want
of concrete data. As Govinda Rao (1992) brought out, a major reason for the
spectacular growth of government expenditures on wages and salaries at the
states level in the 1980s, was the phenomenal increase in employment in state
governments as well as in government schools, aided institutions and local
bodies. Besides, a number of new programmes under the five-year plans were
being taken up year after year even when the existing projects and
programmes could not be adequately funded due to shortage of resources.
The employment of a large number of functionaries by various line agencies
implementing each of the centrally-sponsored schemes at village, block and
district levels, instead of having a smaller number of multipurpose workers
with adequate work assignments, was another reason for high growth of state
government employment. Added to these was the difficult law and order
situation in many parts of the country, which necessitated a high growth of
employment associated with the maintenance of law and order (Govinda Rao
1992). It is known that in the 1990s, both at the centre and states, a series of
measures such as, restrictions on fresh recruitment and creation of new posts
and curbing the growth in administrative expenditures, have been undertaken,
but their overall effect on the number of persons employed or on the resulting
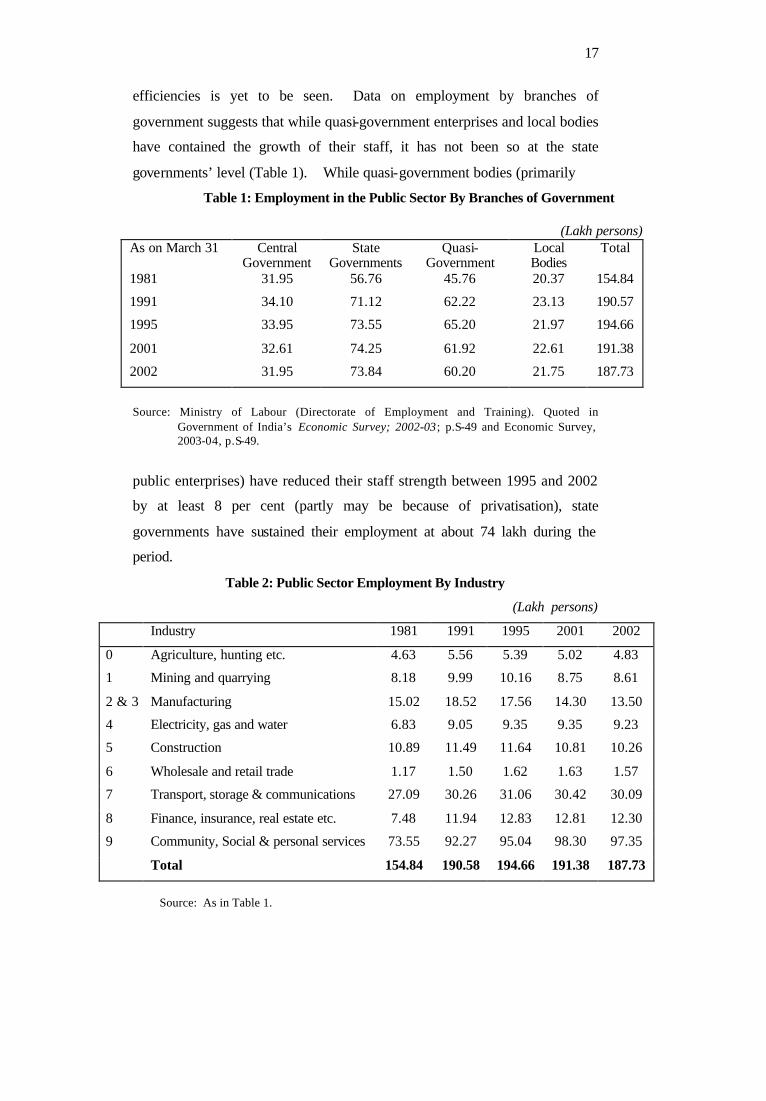
17
efficiencies is yet to be seen. Data on employment by branches of
government suggests that while quasi-government enterprises and local bodies
have contained the growth of their staff, it has not been so at the state
governments’ level (Table 1). While quasi-government bodies (primarily
Table 1: Employment in the Public Sector By Branches of Government
(Lakh persons) As on March 31
Central
Government State
Governments Quasi-
Government Local Bodies
Total
1981 31.95 56.76 45.76 20.37 154.84
1991 34.10 71.12 62.22 23.13 190.57
1995 33.95 73.55 65.20 21.97 194.66
2001 32.61 74.25 61.92 22.61 191.38
2002 31.95 73.84 60.20 21.75 187.73
Source: Ministry of Labour (Directorate of Employment and Training). Quoted in
Government of India’s Economic Survey; 2002-03; p.S-49 and Economic Survey, 2003-04, p.S-49.
public enterprises) have reduced their staff strength between 1995 and 2002
by at least 8 per cent (partly may be because of privatisation), state
governments have sustained their employment at about 74 lakh during the
period.
Table 2: Public Sector Employment By Industry
(Lakh persons)
Industry 1981 1991 1995 2001 2002
0 Agriculture, hunting etc. 4.63 5.56 5.39 5.02 4.83
1 Mining and quarrying 8.18 9.99 10.16 8.75 8.61
2 & 3 Manufacturing 15.02 18.52 17.56 14.30 13.50
4 Electricity, gas and water 6.83 9.05 9.35 9.35 9.23
5 Construction 10.89 11.49 11.64 10.81 10.26
6 Wholesale and retail trade 1.17 1.50 1.62 1.63 1.57
7 Transport, storage & communications 27.09 30.26 31.06 30.42 30.09
8 Finance, insurance, real estate etc. 7.48 11.94 12.83 12.81 12.30
9 Community, Social & personal services 73.55 92.27 95.04 98.30 97.35
Total 154.84 190.58 194.66 191.38 187.73
Source: As in Table 1.
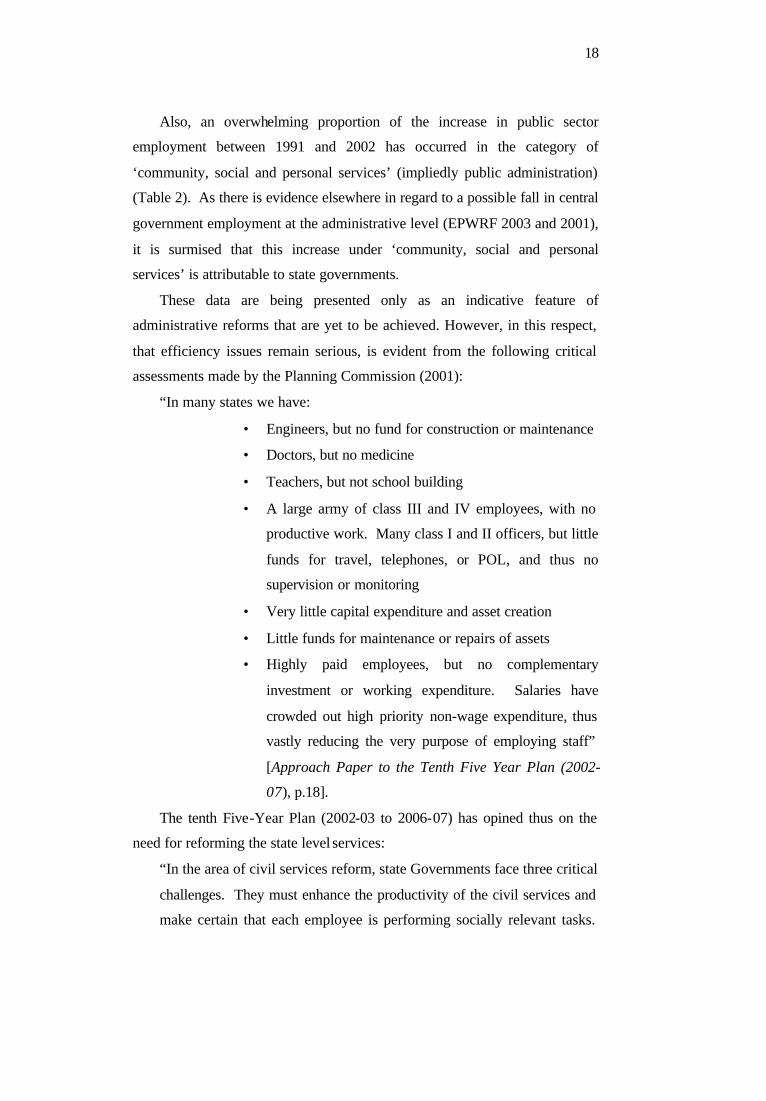
18
Also, an overwhelming proportion of the increase in public sector
employment between 1991 and 2002 has occurred in the category of
‘community, social and personal services’ (impliedly public administration)
(Table 2). As there is evidence elsewhere in regard to a possible fall in central
government employment at the administrative level (EPWRF 2003 and 2001),
it is surmised that this increase under ‘community, social and personal
services’ is attributable to state governments.
These data are being presented only as an indicative feature of
administrative reforms that are yet to be achieved. However, in this respect,
that efficiency issues remain serious, is evident from the following critical
assessments made by the Planning Commission (2001):
“In many states we have:
• Engineers, but no fund for construction or maintenance
• Doctors, but no medicine
• Teachers, but not school building
• A large army of class III and IV employees, with no
productive work. Many class I and II officers, but little
funds for travel, telephones, or POL, and thus no
supervision or monitoring
• Very little capital expenditure and asset creation
• Little funds for maintenance or repairs of assets
• Highly paid employees, but no complementary
investment or working expenditure. Salaries have
crowded out high priority non-wage expenditure, thus
vastly reducing the very purpose of employing staff”
[Approach Paper to the Tenth Five Year Plan (2002-
07), p.18].
The tenth Five-Year Plan (2002-03 to 2006-07) has opined thus on the
need for reforming the state level services:
“In the area of civil services reform, state Governments face three critical
challenges. They must enhance the productivity of the civil services and
make certain that each employee is performing socially relevant tasks.
19
They must ensure the long- term affordability of the civil services, and
must enforce procedures for rewarding and promoting merit, and
disciplining malfunction and misconduct, in order to strengthen
accountability and enhance performance quality [Planning Commission
(2002b), Volume III, p.106].
It must also be noted that the mere rise in the number of staff strength is
no conclusive evidence of persisting inefficiency and cost ineffectiveness,
particularly at the states level because they also have to shoulder expanding
responsibilities in rendering social and economic infrastructures. Besides,
fiscal consolidation requires actions on many other areas such as, improving
tax buoyancy through better administration of taxes and plugging of
loopholes, collection of more appropria te user charges, reforms of public
sector undertakings and institutional reforms, as subsequent sections bring
out.
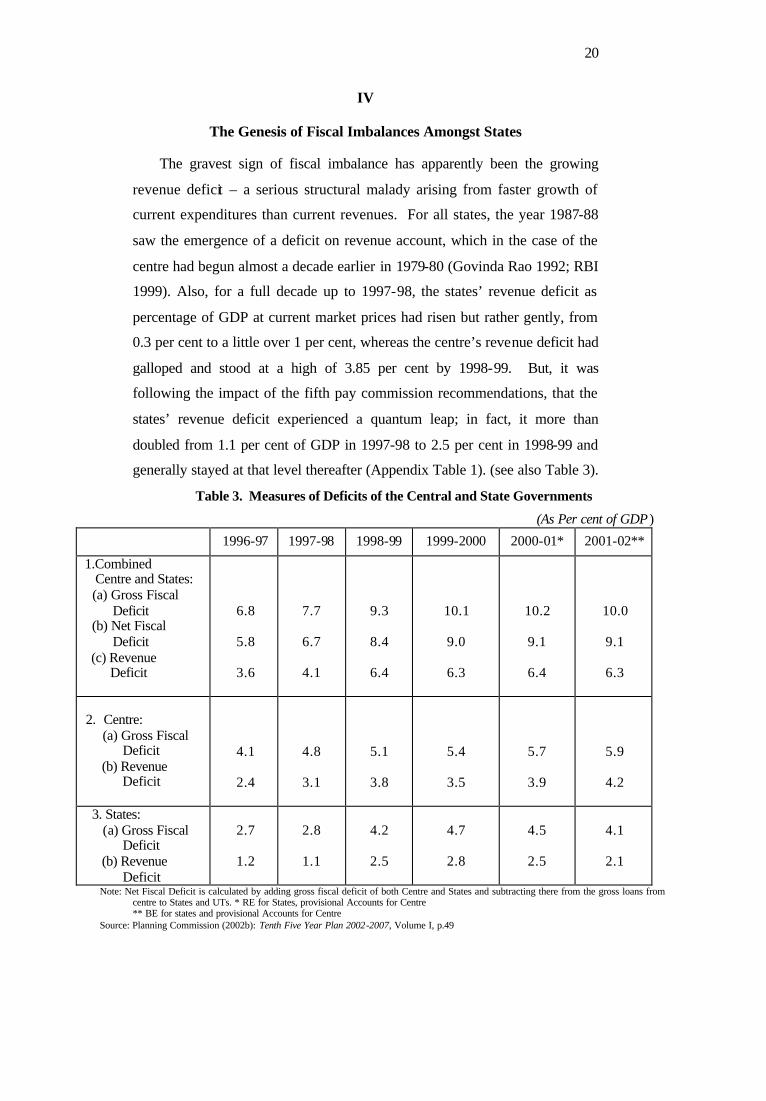
20
IV
The Genesis of Fiscal Imbalances Amongst States
The gravest sign of fiscal imbalance has apparently been the growing
revenue deficit – a serious structural malady arising from faster growth of
current expenditures than current revenues. For all states, the year 1987-88
saw the emergence of a deficit on revenue account, which in the case of the
centre had begun almost a decade earlier in 1979-80 (Govinda Rao 1992; RBI
1999). Also, for a full decade up to 1997-98, the states’ revenue deficit as
percentage of GDP at current market prices had risen but rather gently, from
0.3 per cent to a little over 1 per cent, whereas the centre’s revenue deficit had
galloped and stood at a high of 3.85 per cent by 1998-99. But, it was
following the impact of the fifth pay commission recommendations, that the
states’ revenue deficit experienced a quantum leap; in fact, it more than
doubled from 1.1 per cent of GDP in 1997-98 to 2.5 per cent in 1998-99 and
generally stayed at that level thereafter (Appendix Table 1). (see also Table 3).
Table 3. Measures of Deficits of the Central and State Governments
(As Per cent of GDP )
1996-97 1997-98 1998-99 1999-2000 2000-01* 2001-02**
1.Combined Centre and States: (a) Gross Fiscal Deficit (b) Net Fiscal Deficit (c) Revenue
Deficit
6.8
5.8
3.6
7.7
6.7
4.1
9.3
8.4
6.4
10.1
9.0
6.3
10.2
9.1
6.4
10.0
9.1
6.3
2. Centre: (a) Gross Fiscal Deficit (b) Revenue Deficit
4.1
2.4
4.8
3.1
5.1
3.8
5.4
3.5
5.7
3.9
5.9
4.2
3. States: (a) Gross Fiscal Deficit (b) Revenue Deficit
2.7
1.2
2.8
1.1
4.2
2.5
4.7
2.8
4.5
2.5
4.1
2.1
Note: Net Fiscal Deficit is calculated by adding gross fiscal deficit of both Centre and States and subtracting there from the gross loans from centre to States and UTs. * RE for States, provisional Accounts for Centre
** BE for states and provisional Accounts for Centre Source: Planning Commission (2002b): Tenth Five Year Plan 2002-2007, Volume I, p.49
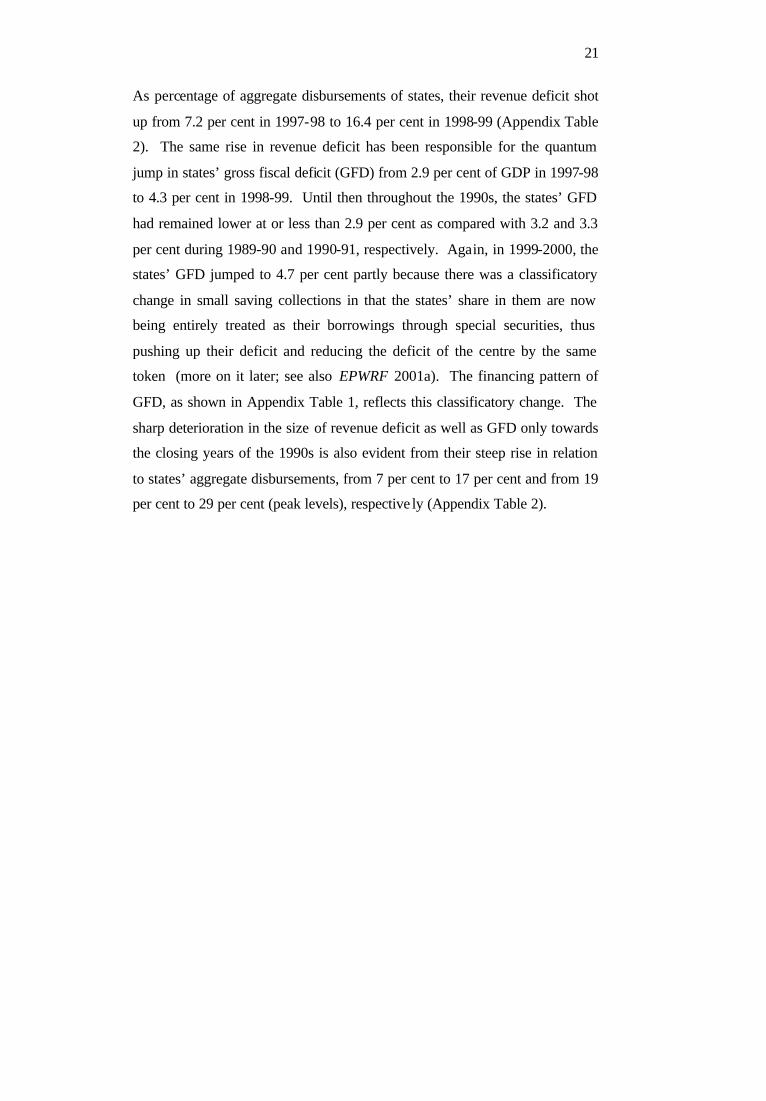
21
As percentage of aggregate disbursements of states, their revenue deficit shot
up from 7.2 per cent in 1997-98 to 16.4 per cent in 1998-99 (Appendix Table
2). The same rise in revenue deficit has been responsible for the quantum
jump in states’ gross fiscal deficit (GFD) from 2.9 per cent of GDP in 1997-98
to 4.3 per cent in 1998-99. Until then throughout the 1990s, the states’ GFD
had remained lower at or less than 2.9 per cent as compared with 3.2 and 3.3
per cent during 1989-90 and 1990-91, respectively. Again, in 1999-2000, the
states’ GFD jumped to 4.7 per cent partly because there was a classificatory
change in small saving collections in that the states’ share in them are now
being entirely treated as their borrowings through special securities, thus
pushing up their deficit and reducing the deficit of the centre by the same
token (more on it later; see also EPWRF 2001a). The financing pattern of
GFD, as shown in Appendix Table 1, reflects this classificatory change. The
sharp deterioration in the size of revenue deficit as well as GFD only towards
the closing years of the 1990s is also evident from their steep rise in relation
to states’ aggregate disbursements, from 7 per cent to 17 per cent and from 19
per cent to 29 per cent (peak levels), respective ly (Appendix Table 2).
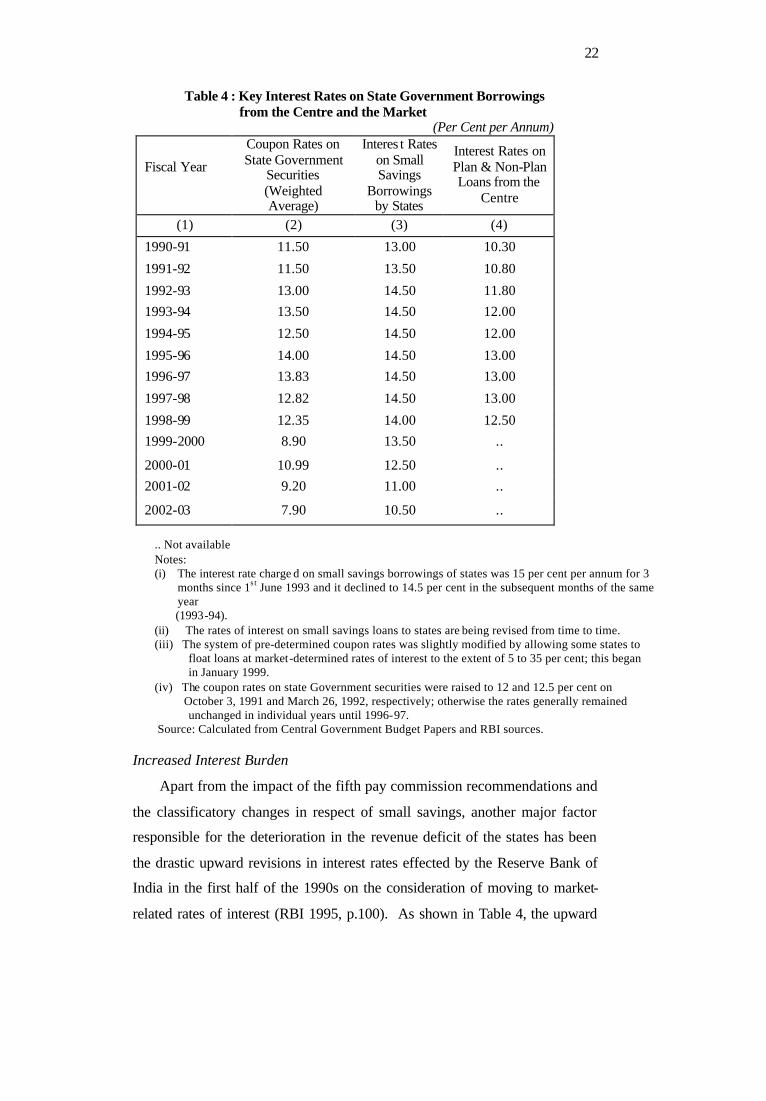
22
Table 4 : Key Interest Rates on State Government Borrowings from the Centre and the Market
(Per Cent per Annum)
Fiscal Year
Coupon Rates on State Government
Securities (Weighted Average)
Interes t Rates on Small Savings
Borrowings by States
Interest Rates on Plan & Non-Plan Loans from the
Centre
(1) (2) (3) (4)
1990-91 11.50 13.00 10.30
1991-92 11.50 13.50 10.80
1992-93 13.00 14.50 11.80
1993-94 13.50 14.50 12.00
1994-95 12.50 14.50 12.00
1995-96 14.00 14.50 13.00
1996-97 13.83 14.50 13.00
1997-98 12.82 14.50 13.00
1998-99 12.35 14.00 12.50
1999-2000 8.90 13.50 ..
2000-01 10.99 12.50 ..
2001-02 9.20 11.00 ..
2002-03 7.90 10.50 ..
.. Not available Notes: (i) The interest rate charge d on small savings borrowings of states was 15 per cent per annum for 3
months since 1s t June 1993 and it declined to 14.5 per cent in the subsequent months of the same year
(1993-94). (ii) The rates of interest on small savings loans to states are being revised from time to time. (iii) The system of pre-determined coupon rates was slightly modified by allowing some states to
float loans at market-determined rates of interest to the extent of 5 to 35 per cent; this began in January 1999.
(iv) The coupon rates on state Government securities were raised to 12 and 12.5 per cent on October 3, 1991 and March 26, 1992, respectively; otherwise the rates generally remained
unchanged in individual years until 1996-97. Source: Calculated from Central Government Budget Papers and RBI sources.
Increased Interest Burden
Apart from the impact of the fifth pay commission recommendations and
the classificatory changes in respect of small savings, another major factor
responsible for the deterioration in the revenue deficit of the states has been
the drastic upward revisions in interest rates effected by the Reserve Bank of
India in the first half of the 1990s on the consideration of moving to market-
related rates of interest (RBI 1995, p.100). As shown in Table 4, the upward
23
movement in interest rates began with the RBI pushing up coupon rates on
central and state government securities sharply to touch the peak of 14 per
cent in 1995-96. As is evident from the same table, there were also
corresponding increases effected by the central government in interest rates
charged on its loans to the states. This is reflected in three other concrete
indicators. First, interest payments by the states has galloped more than three-
fold from Rs. 21,932 crore (or 16.0 per cent of their total revenue receipts) in
1995-96 to Rs 82,287 crore (or 24.7 per cent of revenue receipts) in 2003-04
(BE) (Table 5).
Table 5: Selected Items under Non-Development Expenditures of States
Year Interest Pensions Administrative Services
Total (2+3+4)
(1) (2)
(3)
(4)
(5)
(Rupees, crore)
1990-91 8,655 3,593 7,018 19,266
1995-96 21,932 7,813 13,391 43,136
2001-02 62,489 28,197 27,069 117,755
2002-03 (RE) 74,147 31,989 28,740 134,876
2003-04 (BE) 82,287 35,723 30,490 148,501
As Per Cent of Total Revenue Receipts
1990-91 13.0 5.4 10.6 29.0
1995-96 16.0 9.4 9.8 35.2
2001-02 24.4 11.0 10.6 46.1
2002-03 (RE) 25.2 10.9 9.8 45.9
2003-04 (BE) 24.7 10.7 9.2 44.6 RE: Revised Estimates BE: Budget Estimates Source: Budget Documents of State Governments quoted in RBI (2003a, p.70)
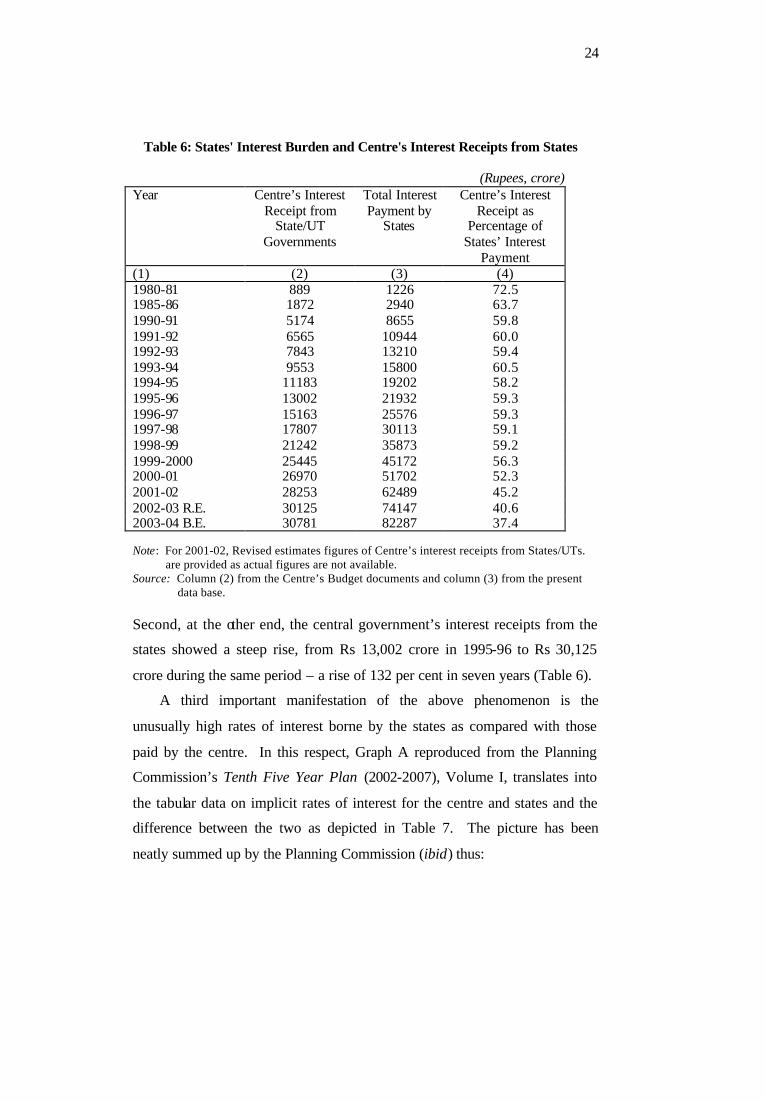
24
Table 6: States' Interest Burden and Centre's Interest Receipts from States
(Rupees, crore) Year Centre’s Interest
Receipt from State/UT
Governments
Total Interest Payment by
States
Centre’s Interest Receipt as
Percentage of States’ Interest
Payment (1) (2) (3) (4) 1980-81 889 1226 72.5 1985-86 1872 2940 63.7 1990-91 5174 8655 59.8 1991-92 6565 10944 60.0 1992-93 7843 13210 59.4 1993-94 9553 15800 60.5 1994-95 11183 19202 58.2 1995-96 13002 21932 59.3 1996-97 15163 25576 59.3 1997-98 17807 30113 59.1 1998-99 21242 35873 59.2 1999-2000 25445 45172 56.3 2000-01 26970 51702 52.3 2001-02 28253 62489 45.2 2002-03 R.E. 30125 74147 40.6 2003-04 B.E. 30781 82287 37.4 Note: For 2001-02, Revised estimates figures of Centre’s interest receipts from States/UTs.
are provided as actual figures are not available. Source: Column (2) from the Centre’s Budget documents and column (3) from the present
data base.
Second, at the other end, the central government’s interest receipts from the
states showed a steep rise, from Rs 13,002 crore in 1995-96 to Rs 30,125
crore during the same period – a rise of 132 per cent in seven years (Table 6).
A third important manifestation of the above phenomenon is the
unusually high rates of interest borne by the states as compared with those
paid by the centre. In this respect, Graph A reproduced from the Planning
Commission’s Tenth Five Year Plan (2002-2007), Volume I, translates into
the tabular data on implicit rates of interest for the centre and states and the
difference between the two as depicted in Table 7. The picture has been
neatly summed up by the Planning Commission (ibid) thus:
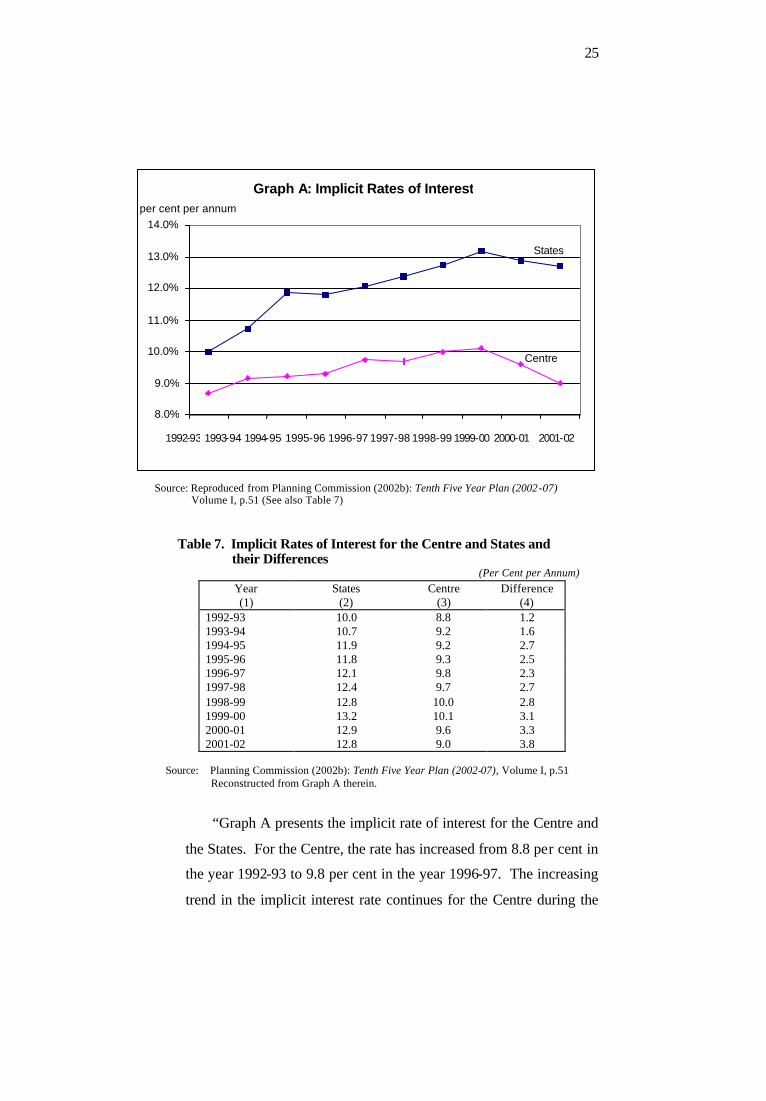
25
Source: Reproduced from Planning Commission (2002b): Tenth Five Year Plan (2002-07)
Volume I, p.51 (See also Table 7)
Table 7. Implicit Rates of Interest for the Centre and States and their Differences (Per Cent per Annum)
Year (1)
States (2)
Centre (3)
Difference (4)
1992-93 10.0 8.8 1.2 1993-94 10.7 9.2 1.6 1994-95 11.9 9.2 2.7 1995-96 11.8 9.3 2.5 1996-97 12.1 9.8 2.3 1997-98 12.4 9.7 2.7 1998-99 12.8 10.0 2.8 1999-00 13.2 10.1 3.1 2000-01 12.9 9.6 3.3 2001-02 12.8 9.0 3.8
Source: Planning Commission (2002b): Tenth Five Year Plan (2002-07), Volume I, p.51
Reconstructed from Graph A therein.
“Graph A presents the implicit rate of interest for the Centre and
the States. For the Centre, the rate has increased from 8.8 per cent in
the year 1992-93 to 9.8 per cent in the year 1996-97. The increasing
trend in the implicit interest rate continues for the Centre during the
Graph A: Implicit Rates of Interest
8.0%
9.0%
10.0%
11.0%
12.0%
13.0%
14.0%
1992-93 1993-94 1994-95 1995-96 1996-97 1997-98 1998-99 1999-00 2000-01 2001-02
per cent per annum
States
Centre
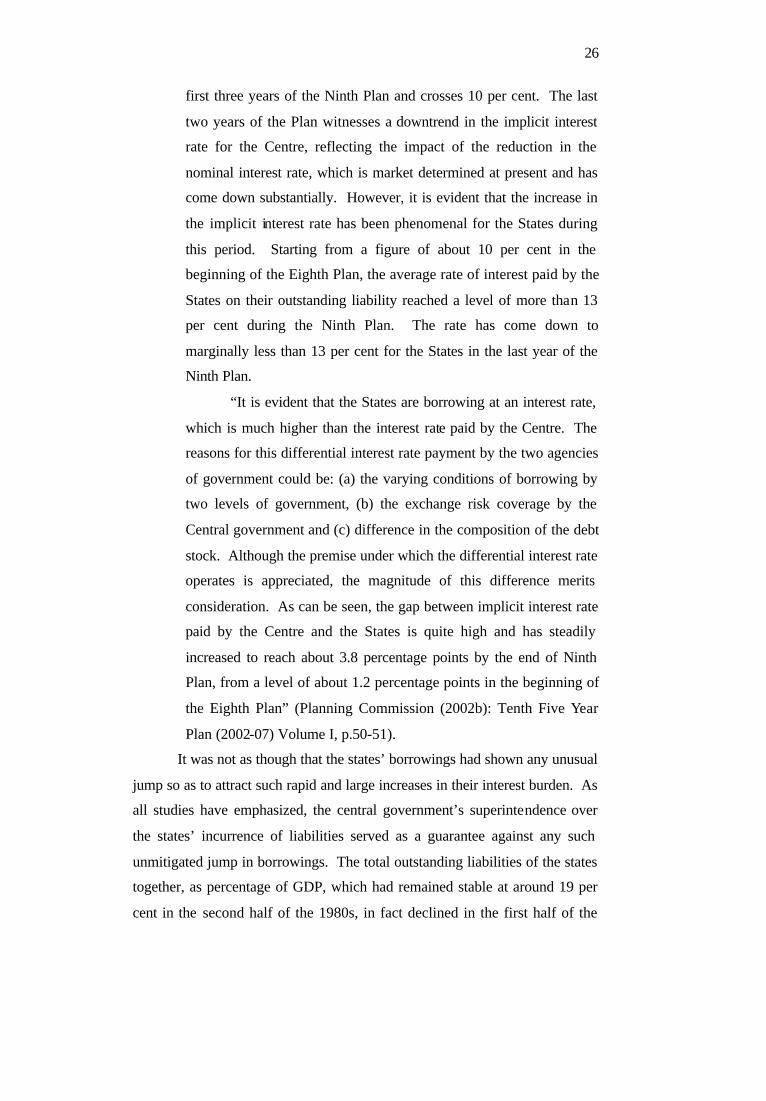
26
first three years of the Ninth Plan and crosses 10 per cent. The last
two years of the Plan witnesses a downtrend in the implicit interest
rate for the Centre, reflecting the impact of the reduction in the
nominal interest rate, which is market determined at present and has
come down substantially. However, it is evident that the increase in
the implicit interest rate has been phenomenal for the States during
this period. Starting from a figure of about 10 per cent in the
beginning of the Eighth Plan, the average rate of interest paid by the
States on their outstanding liability reached a level of more than 13
per cent during the Ninth Plan. The rate has come down to
marginally less than 13 per cent for the States in the last year of the
Ninth Plan.
“It is evident that the States are borrowing at an interest rate,
which is much higher than the interest rate paid by the Centre. The
reasons for this differential interest rate payment by the two agencies
of government could be: (a) the varying conditions of borrowing by
two levels of government, (b) the exchange risk coverage by the
Central government and (c) difference in the composition of the debt
stock. Although the premise under which the differential interest rate
operates is appreciated, the magnitude of this difference merits
consideration. As can be seen, the gap between implicit interest rate
paid by the Centre and the States is quite high and has steadily
increased to reach about 3.8 percentage points by the end of Ninth
Plan, from a level of about 1.2 percentage points in the beginning of
the Eighth Plan” (Planning Commission (2002b): Tenth Five Year
Plan (2002-07) Volume I, p.50-51).
It was not as though that the states’ borrowings had shown any unusual
jump so as to attract such rapid and large increases in their interest burden. As
all studies have emphasized, the central government’s superintendence over
the states’ incurrence of liabilities served as a guarantee against any such
unmitigated jump in borrowings. The total outstanding liabilities of the states
together, as percentage of GDP, which had remained stable at around 19 per
cent in the second half of the 1980s, in fact declined in the first half of the
27
1990s to less than 18 per cent until 1997-98 (Appendix Table 27). It was only
thereafter, when the impact of pay increases (and interest burden) began to be
felt, that the states’ liabilities began to move up and their ratio to GDP reached
27.9 per cent in 2002-03 (BE).
As shown in Appendix Table 1, it is the vicious circle of higher
revenue deficit leading to increased borrowings and to higher fiscal deficit,
that has distorted the quality of fiscal deficit as well. In the first half of the
1990s, the states’ revenue deficit used to constitute only about a little over
one-fifth of gross fiscal deficit, but after 1998-99 it has crossed one-half.
In the financing of gross fiscal deficit too, the states are increasingly
made to rely on special securities issued from the national small savings fund
(NSSF) and staff provident funds, the costs of borrowings of which have not
fallen commensurate with the decline in, say, the weighted average of coupon
rates on market loans (Table 4). The states will continue to have to bear a
relatively higher interest rate burden on their borrowings. As is evident from
Table 8, the highest average rate of interest prevails on such instruments
which will increasingly constitute the bulk of state governments’ liabilities.
Also, nearly 75 per cent of GFD of state governments is now being financed
through such high-cost sources (Table 9).
In order to bring home further the importance of the emerging interest
cost scenario for the state government liabilities, the relevant data have been
culled out from the RBI sources and presented briefly in Tables 10,11,12 and
13. These data relate to market borrowings of state governments and related
debt service burden. First, over two-thirds of outstanding state government
loans as on March 31, 2003 have been at coupon rates of 10 per cent and
above (Table 10). The bulk of these loans were contracted in the middle of
the 1990s. In recent years, the range of coupon rates and their weighted
averages have steadily declined; they were at a peak of 14 per cent and now
they have fallen to a range of 6.67 to 8 per cent or to a weighted average of
7.50 per cent (Table 11). Such benefits will not accrue in the immediate
period due to two to three reasons. First, for some years to come, the
outstanding of loans contracted earlier at higher rates of interest will remain to
be serviced (Table 12). This is one of the reasons why the implicit rates of
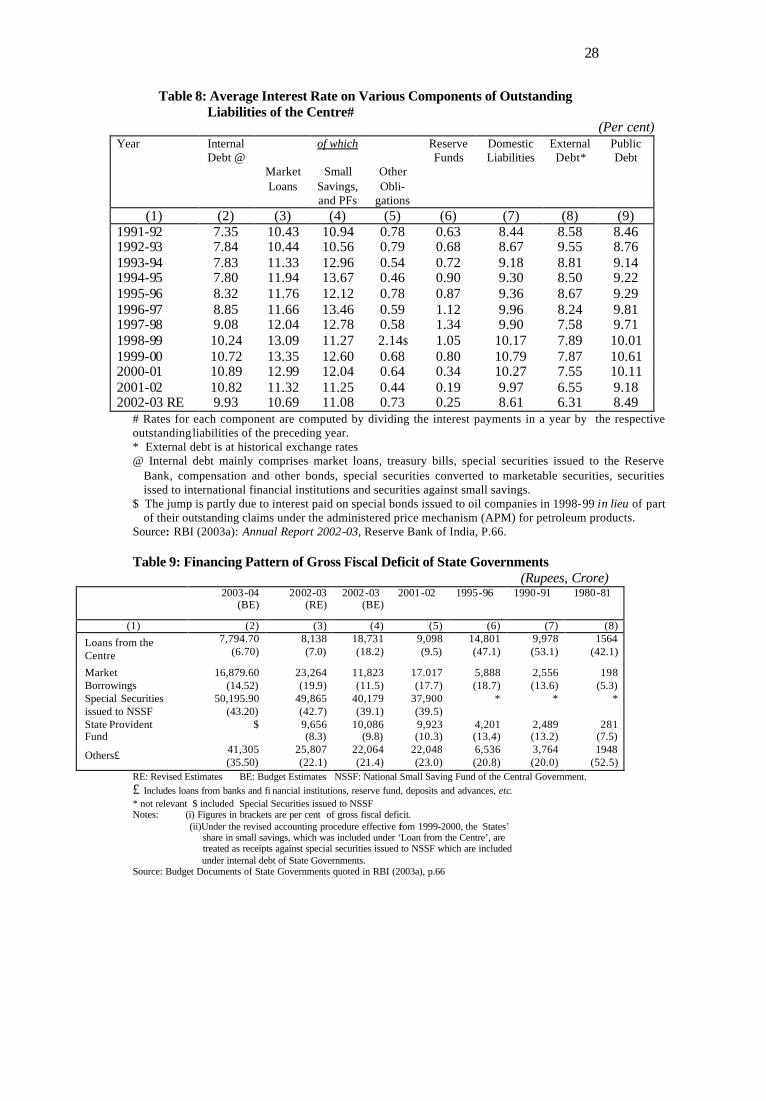
28
Table 8: Average Interest Rate on Various Components of Outstanding Liabilities of the Centre#
(Per cent) Year Internal
Debt @
Market Loans
of which
Small Savings, and PFs
Other Obli-
gations
Reserve Funds
Domestic Liabilities
External Debt*
Public Debt
(1) (2) (3) (4) (5) (6) (7) (8) (9) 1991-92 7.35 10.43 10.94 0.78 0.63 8.44 8.58 8.46 1992-93 7.84 10.44 10.56 0.79 0.68 8.67 9.55 8.76 1993-94 7.83 11.33 12.96 0.54 0.72 9.18 8.81 9.14 1994-95 7.80 11.94 13.67 0.46 0.90 9.30 8.50 9.22 1995-96 8.32 11.76 12.12 0.78 0.87 9.36 8.67 9.29 1996-97 8.85 11.66 13.46 0.59 1.12 9.96 8.24 9.81 1997-98 9.08 12.04 12.78 0.58 1.34 9.90 7.58 9.71 1998-99 10.24 13.09 11.27 2.14$ 1.05 10.17 7.89 10.01 1999-00 10.72 13.35 12.60 0.68 0.80 10.79 7.87 10.61 2000-01 10.89 12.99 12.04 0.64 0.34 10.27 7.55 10.11 2001-02 10.82 11.32 11.25 0.44 0.19 9.97 6.55 9.18 2002-03 RE 9.93 10.69 11.08 0.73 0.25 8.61 6.31 8.49
# Rates for each component are computed by dividing the interest payments in a year by the respective outstanding liabilities of the preceding year. * External debt is at historical exchange rates @ Internal debt mainly comprises market loans, treasury bills, special securities issued to the Reserve
Bank, compensation and other bonds, special securities converted to marketable securities, securities issed to international financial institutions and securities against small savings.
$ The jump is partly due to interest paid on special bonds issued to oil companies in 1998-99 in lieu of part of their outstanding claims under the administered price mechanism (APM) for petroleum products.
Source: RBI (2003a): Annual Report 2002-03, Reserve Bank of India, P.66. Table 9: Financing Pattern of Gross Fiscal Deficit of State Governments
(Rupees, Crore) 2003-04
(BE) 2002-03
(RE) 2002-03 (BE)
2001-02 1995-96 1990-91 1980-81
(1) (2) (3) (4) (5) (6) (7) (8)
Loans from the Centre
7,794.70 (6.70)
8,138 (7.0)
18,731 (18.2)
9,098 (9.5)
14,801 (47.1)
9,978 (53.1)
1564 (42.1)
Market Borrowings
16,879.60 (14.52)
23,264 (19.9)
11,823 (11.5)
17.017 (17.7)
5,888 (18.7)
2,556 (13.6)
198 (5.3)
Special Securities issued to NSSF
50,195.90 (43.20)
49,865 (42.7)
40,179 (39.1)
37,900 (39.5)
* * *
State Provident Fund
$ 9,656 (8.3)
10,086 (9.8)
9,923 (10.3)
4,201 (13.4)
2,489 (13.2)
281 (7.5)
Others£ 41,305 (35.50)
25,807 (22.1)
22,064 (21.4)
22,048 (23.0)
6,536 (20.8)
3,764 (20.0)
1948 (52.5)
RE: Revised Estimates BE: Budget Estimates NSSF: National Small Saving Fund of the Central Government. £ Includes loans from banks and fi nancial institutions, reserve fund, deposits and advances, etc. * not relevant $ included Special Securities issued to NSSF Notes: (i) Figures in brackets are per cent of gross fiscal deficit.
(ii)Under the revised accounting procedure effective from 1999-2000, the States’ share in small savings, which was included under ‘Loan from the Centre’, are treated as receipts against special securities issued to NSSF which are included under internal debt of State Governments.
Source: Budget Documents of State Governments quoted in RBI (2003a), p.66
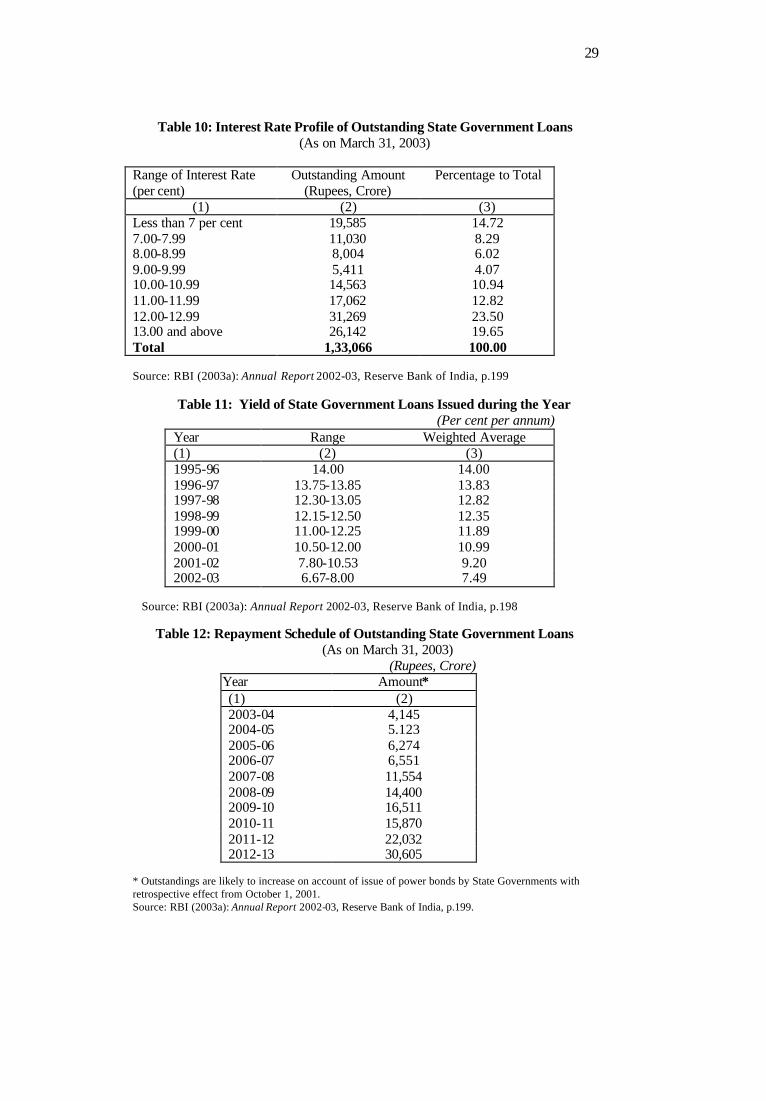
29
Table 10: Interest Rate Profile of Outstanding State Government Loans (As on March 31, 2003)
Range of Interest Rate (per cent)
Outstanding Amount (Rupees, Crore)
Percentage to Total
(1) (2) (3) Less than 7 per cent 19,585 14.72 7.00-7.99 11,030 8.29 8.00-8.99 8,004 6.02 9.00-9.99 5,411 4.07 10.00-10.99 14,563 10.94 11.00-11.99 17,062 12.82 12.00-12.99 31,269 23.50 13.00 and above 26,142 19.65 Total 1,33,066 100.00
Source: RBI (2003a): Annual Report 2002-03, Reserve Bank of India, p.199
Table 11: Yield of State Government Loans Issued during the Year (Per cent per annum)
Year Range Weighted Average (1) (2) (3) 1995-96 14.00 14.00 1996-97 13.75-13.85 13.83 1997-98 12.30-13.05 12.82 1998-99 12.15-12.50 12.35 1999-00 11.00-12.25 11.89 2000-01 10.50-12.00 10.99 2001-02 7.80-10.53 9.20 2002-03 6.67-8.00 7.49
Source: RBI (2003a): Annual Report 2002-03, Reserve Bank of India, p.198
Table 12: Repayment Schedule of Outstanding State Government Loans
(As on March 31, 2003) (Rupees, Crore)
Year Amount* (1) (2) 2003-04 4,145 2004-05 5.123 2005-06 6,274 2006-07 6,551 2007-08 11,554 2008-09 14,400 2009-10 16,511 2010-11 15,870 2011-12 22,032 2012-13 30,605
* Outstandings are likely to increase on account of issue of power bonds by State Governments with retrospective effect from October 1, 2001. Source: RBI (2003a): Annual Report 2002-03, Reserve Bank of India, p.199.
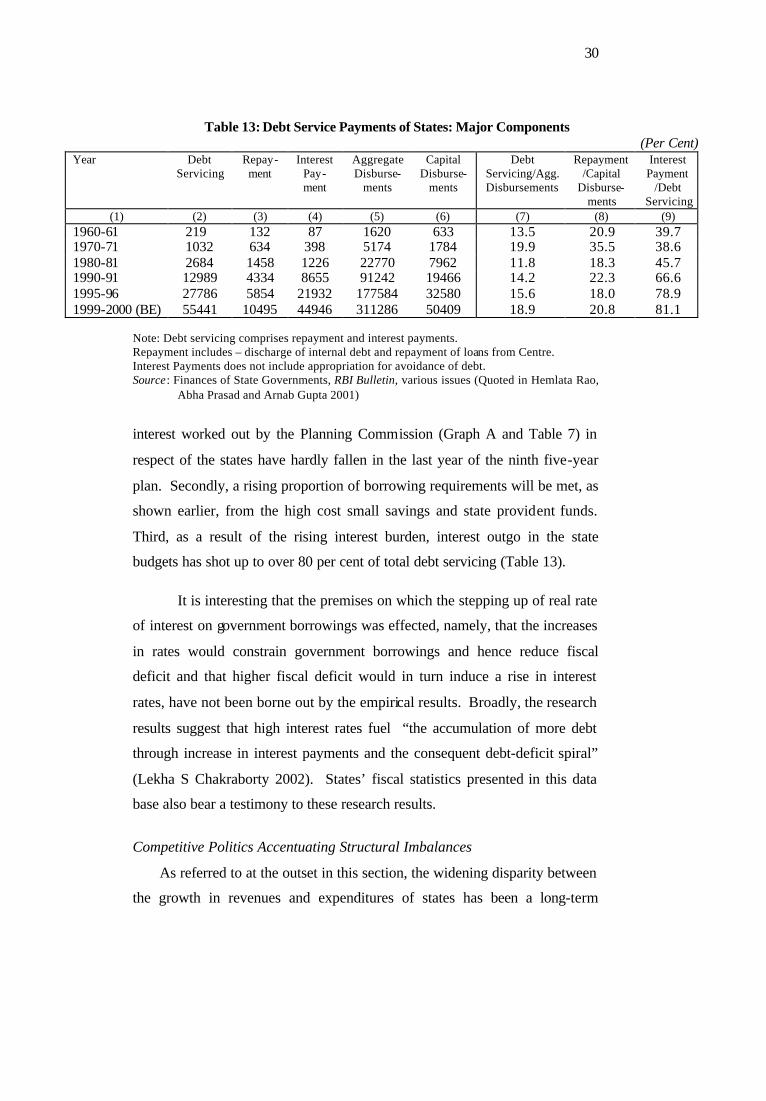
30
Table 13: Debt Service Payments of States: Major Components (Per Cent)
Year Debt Servicing
Repay-ment
Interest Pay- ment
Aggregate Disburse-
ments
Capital Disburse-
ments
Debt Servicing/Agg. Disbursements
Repayment /Capital
Disburse-ments
Interest Payment
/Debt Servicing
(1) (2) (3) (4) (5) (6) (7) (8) (9) 1960-61 219 132 87 1620 633 13.5 20.9 39.7 1970-71 1032 634 398 5174 1784 19.9 35.5 38.6 1980-81 2684 1458 1226 22770 7962 11.8 18.3 45.7 1990-91 12989 4334 8655 91242 19466 14.2 22.3 66.6 1995-96 27786 5854 21932 177584 32580 15.6 18.0 78.9 1999-2000 (BE) 55441 10495 44946 311286 50409 18.9 20.8 81.1
Note: Debt servicing comprises repayment and interest payments. Repayment includes – discharge of internal debt and repayment of loans from Centre. Interest Payments does not include appropriation for avoidance of debt. Source: Finances of State Governments, RBI Bulletin, various issues (Quoted in Hemlata Rao,
Abha Prasad and Arnab Gupta 2001) interest worked out by the Planning Commission (Graph A and Table 7) in
respect of the states have hardly fallen in the last year of the ninth five-year
plan. Secondly, a rising proportion of borrowing requirements will be met, as
shown earlier, from the high cost small savings and state provident funds.
Third, as a result of the rising interest burden, interest outgo in the state
budgets has shot up to over 80 per cent of total debt servicing (Table 13).
It is interesting that the premises on which the stepping up of real rate
of interest on government borrowings was effected, namely, that the increases
in rates would constrain government borrowings and hence reduce fiscal
deficit and that higher fiscal deficit would in turn induce a rise in interest
rates, have not been borne out by the empirical results. Broadly, the research
results suggest that high interest rates fuel “the accumulation of more debt
through increase in interest payments and the consequent debt-deficit spiral”
(Lekha S Chakraborty 2002). States’ fiscal statistics presented in this data
base also bear a testimony to these research results.
Competitive Politics Accentuating Structural Imbalances
As referred to at the outset in this section, the widening disparity between
the growth in revenues and expenditures of states has been a long-term
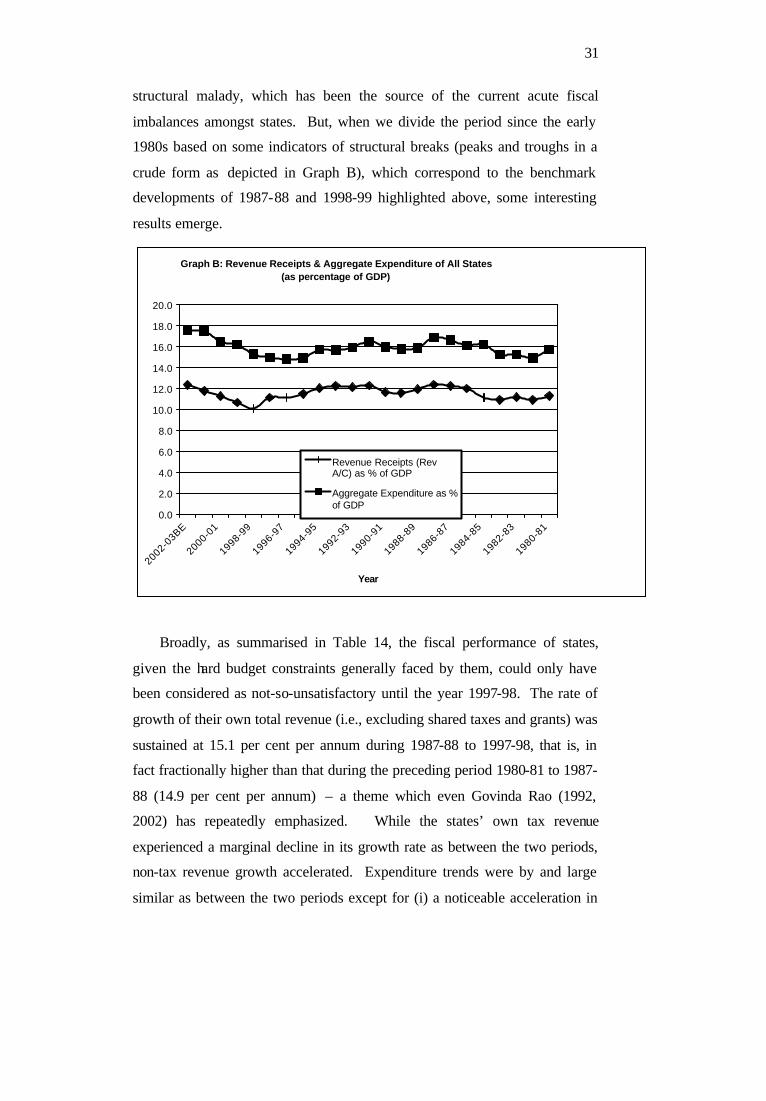
31
structural malady, which has been the source of the current acute fiscal
imbalances amongst states. But, when we divide the period since the early
1980s based on some indicators of structural breaks (peaks and troughs in a
crude form as depicted in Graph B), which correspond to the benchmark
developments of 1987-88 and 1998-99 highlighted above, some interesting
results emerge.
Graph B: Revenue Receipts & Aggregate Expenditure of All States (as percentage of GDP)
0.0
2.0
4.0
6.0
8.0
10.0
12.0
14.0
16.0
18.0
20.0
2002-03BE
2000-01
1998-99
1996-97
1994-95
1992-93
1990-91
1988-89
1986-87
1984-85
1982-83
1980-81
Year
Revenue Receipts (RevA/C) as % of GDP
Aggregate Expenditure as %of GDP
Broadly, as summarised in Table 14, the fiscal performance of states,
given the hard budget constraints generally faced by them, could only have
been considered as not-so-unsatisfactory until the year 1997-98. The rate of
growth of their own total revenue (i.e., excluding shared taxes and grants) was
sustained at 15.1 per cent per annum during 1987-88 to 1997-98, that is, in
fact fractionally higher than that during the preceding period 1980-81 to 1987-
88 (14.9 per cent per annum) – a theme which even Govinda Rao (1992,
2002) has repeatedly emphasized. While the states’ own tax revenue
experienced a marginal decline in its growth rate as between the two periods,
non-tax revenue growth accelerated. Expenditure trends were by and large
similar as between the two periods except for (i) a noticeable acceleration in
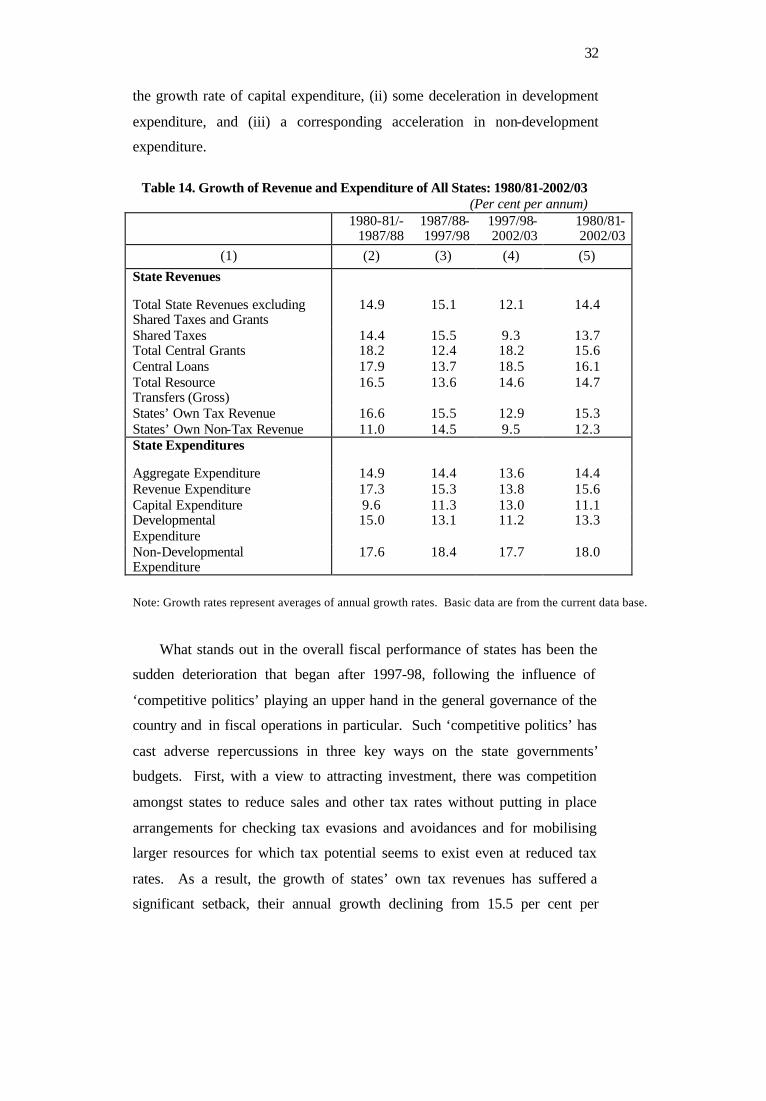
32
the growth rate of capital expenditure, (ii) some deceleration in development
expenditure, and (iii) a corresponding acceleration in non-development
expenditure.
Table 14. Growth of Revenue and Expenditure of All States: 1980/81-2002/03
(Per cent per annum) 1980-81/-
1987/88 1987/88- 1997/98
1997/98- 2002/03
1980/81- 2002/03
(1) (2) (3) (4) (5)
State Revenues
Total State Revenues excluding Shared Taxes and Grants
14.9 15.1 12.1 14.4
Shared Taxes 14.4 15.5 9.3 13.7 Total Central Grants 18.2 12.4 18.2 15.6 Central Loans 17.9 13.7 18.5 16.1 Total Resource Transfers (Gross)
16.5 13.6 14.6 14.7
States’ Own Tax Revenue 16.6 15.5 12.9 15.3 States’ Own Non-Tax Revenue 11.0 14.5 9.5 12.3 State Expenditures
Aggregate Expenditure 14.9 14.4 13.6 14.4 Revenue Expenditure 17.3 15.3 13.8 15.6 Capital Expenditure 9.6 11.3 13.0 11.1 Developmental Expenditure
15.0 13.1 11.2 13.3
Non-Developmental Expenditure
17.6 18.4 17.7 18.0
Note: Growth rates represent averages of annual growth rates. Basic data are from the current data base.
What stands out in the overall fiscal performance of states has been the
sudden deterioration that began after 1997-98, following the influence of
‘competitive politics’ playing an upper hand in the general governance of the
country and in fiscal operations in particular. Such ‘competitive politics’ has
cast adverse repercussions in three key ways on the state governments’
budgets. First, with a view to attracting investment, there was competition
amongst states to reduce sales and other tax rates without putting in place
arrangements for checking tax evasions and avoidances and for mobilising
larger resources for which tax potential seems to exist even at reduced tax
rates. As a result, the growth of states’ own tax revenues has suffered a
significant setback, their annual growth declining from 15.5 per cent per
33
annum during the decade 1987-88 to 1997-98 to 12.9 per cent per annum
during the period 1997-98 to 2002-03. It was for this reason that the Eleventh
Finance Commission Report (2000) observed thus:
“On the states side, the dip in tax buoyancy occurred as revenue from
sales tax, the principal component of their own tax sources, showed a
declining growth trend owing to tax competition amongst the states to
attract trade and industry” (p.100).
Second, states have conferred further concessions in tariffs on power supplies
to farmers and undertook various other forms of liberal measures leading to a
drastic reduction also in the growth of states’ own non-tax revenues – from
14.5 per cent to 9.5 per cent per annum as between the above two periods
(Table 14). As explained in a subsequent section, both the sources of non-tax
revenue, namely, returns on government investments and recovery of user
charges on public services, have suffered an added setback during this period.
Finally, the same set of political compulsions have induced the state
governments to adopt, for their employees, the pay and pension revisions
recommended by the fifth pay commission for the central government
employees. Again, as the Eleventh Finance Commission (2000) has noted, the
impact of these salary and pension revisions in the case of states has been
even more severe because, (a) the revisions were extended not only to
employees of the government administration but also to those of aided
institutions and local bodies; and (b) for certain categories of employees in
some states, the pay-scales are higher than those of the central government
employees. Pensions were said to have been the fastest growing item in state
budgets, with the growth rates shooting up from 19.6 per cent per annum
during 1990-95 to 26.6 per cent per annum during 1995-99 (Eleventh Finance
Commission Report, p.85). These were done in years when there was drastic
slowdown in revenue growth due to recessionary conditions in Indian
industry. Growth of revenue receipts of states has decelerated from 17 per
cent in 1997-98 to 2 per cent in 1998-99 and to 5 per cent in 1999-2000 (See
Appendix Table 2).
34
Deepening of Structural Causes
While noting that the immediate causes of ‘competitive politics’ and
slowdown in revenue growth due to recession have contributed to the sudden
deterioration in states’ fiscal balances after 1998-99, there is no doubt that
some of the structural weaknesses, highlighted by the RBI (1999b) and further
amplified by the Eleventh Finance Commission (2000), have got accentuated
in the recent period, thus contributing to the severity of state level fiscal
imbalances. First, there is the limited tax base of the states, which has been
further narrowed by the rising proportion of service sector incomes in total
GDP – a large proportion of which is generally outside the ambit of the tax
base for the major indirect taxes even at the national level but more so for
taxes under the states’ jurisdiction. Second, there has occurred in recent years
tremendous pressure on the states to expand their expenditure commitments
on agriculture, irrigation and other rural infrastructures, as also on social
infrastructures, as part of their constitutional responsibilities. Third, there has
always been a cap on the size of the market borrowings of the states. Lastly,
deficiencies in the mechanism of federal transfers to the states have been
responded to in an ad hoc manner from time to time. Segmentation of the
flow of federal transfers – tax devolution of only a fraction of the divisible
pool and statutory grants-in-aid for states in need of assistance, Planning
Commission transfers as assistance for state plans, transfers to implement
centrally-sponsored schemes under the central sector plan, and other
discretionary transfers – has willy nilly resulted in not only some reduction in
the growth of transfers but also some degree of inequity and ad hocism in such
transfers. Despite attempts made by the Finance Commissions to expand the
divisible pool, the rate of growth of shared taxes has drastically come down
from 15.5 per cent per annum during the decade 1987-88 to 1997-98 to 9.3 per
cent thereafter (Table 14). Gaps in such transfers have been to an extent
replaced by different types of grants and loans, but (a) their overall size has
been small; (b) substantial parts of loans like the loans from the small savings
fund (SSF) have constituted a relatively high-cost source; and (c) there are
said to be ad hocism and inequity in such transfers. Studies have shown that
35
there can be the effect of political clout of states based on their ‘economic and
demographic size’ or the relative importance of ruling party or coalition
members, on such resource transfers [Govinda Rao and Singh 2001 quoted in
Bagchi (2003)].
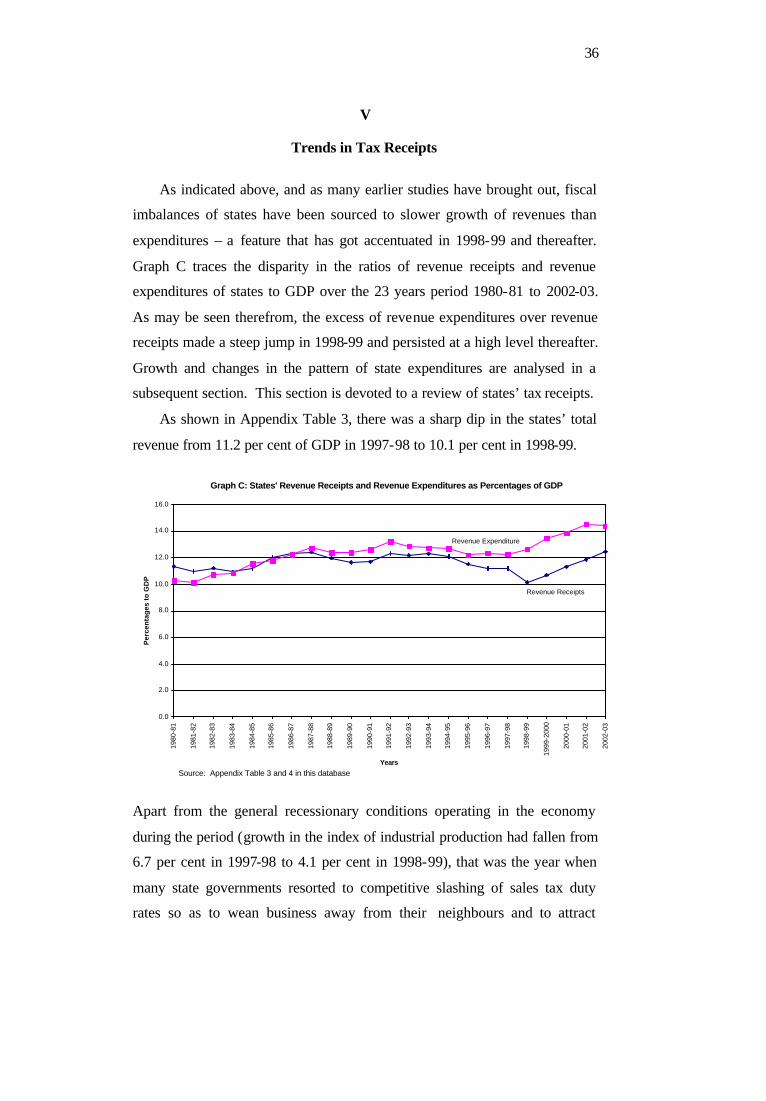
36
V
Trends in Tax Receipts
As indicated above, and as many earlier studies have brought out, fiscal
imbalances of states have been sourced to slower growth of revenues than
expenditures – a feature that has got accentuated in 1998-99 and thereafter.
Graph C traces the disparity in the ratios of revenue receipts and revenue
expenditures of states to GDP over the 23 years period 1980-81 to 2002-03.
As may be seen therefrom, the excess of revenue expenditures over revenue
receipts made a steep jump in 1998-99 and persisted at a high level thereafter.
Growth and changes in the pattern of state expenditures are analysed in a
subsequent section. This section is devoted to a review of states’ tax receipts.
As shown in Appendix Table 3, there was a sharp dip in the states’ total
revenue from 11.2 per cent of GDP in 1997-98 to 10.1 per cent in 1998-99.
Graph C: States' Revenue Receipts and Revenue Expenditures as Percentages of GDP
0.0
2.0
4.0
6.0
8.0
10.0
12.0
14.0
16.0
19
80
-81
19
81
-82
19
82
-83
19
83
-84
19
84
-85
19
85
-86
19
86
-87
19
87
-88
19
88
-89
19
89
-90
19
90
-91
19
91
-92
19
92
-93
19
93
-94
19
94
-95
19
95
-96
19
96
-97
19
97
-98
19
98
-99
19
99
-20
00
20
00
-01
20
01
-02
20
02
-03
Years
Per
cen
tag
es t
o G
DP
Revenue Expenditure
Revenue Receipts
Source: Appendix Table 3 and 4 in this database
Apart from the general recessionary conditions operating in the economy
during the period (growth in the index of industrial production had fallen from
6.7 per cent in 1997-98 to 4.1 per cent in 1998-99), that was the year when
many state governments resorted to competitive slashing of sales tax duty
rates so as to wean business away from their neighbours and to attract
37
investment. The surfacing of this competitive tax laxity has had the
consequence of considerable revenue loss without commensurate gains in
terms of increased private investments and associated economic gains (Kurian
1999 and Chaudhuri 2000).
It is significant that the year of deterioration in fiscal performance of
states, namely, 1998-99, saw the relative dip in receipts under all revenue
heads. This was so even under the states’ own tax receipts which otherwise
stood the ground throughout the 1990s (Appendix Table 3). States’ total tax
revenue, which generally stood around 8.0 per cent of GDP, fell to 7.4 per
cent in 1998-99 but recovered gradually thereafter to 8.2 per cent in 2001-02
(RE) and to 8.8 per cent in 2002-03 (B E)9. A substantial part of the increase
in recent years has taken place in the states’ own taxes (from 5.1 per cent of
GDP to 6.2 per cent), and amongst them, in taxes on commodities and
services (from 4.5 per cent to 5.5 per cent), particularly in sales tax (from 3.1
per cent to 3.8 per cent).
As a result of the persistent decline in the tax revenue of the central
government in relation to GDP, the share of states in central taxes has
experienced a slow but steady fall (from 2.7 per cent of GDP in 1997-98 to
2.4 per cent in 2001-02). No doubt, there have been some compensating
revenue grants from the centre, which as percentage of GDP have edged up
from 1.4 per cent in 1998-99 to 2.2 per cent in the latest two years. But, to an
extent, these grants have a political story associated with them resulting in
charges of unequal distribution; at any rate, as explained in a subsequent
section, the relatively poorer states have received a relatively lower proportion
of federal transfers in the form of grants.
And yet another source of states’ revenue to experience a relative fall
rather noticeably is the states’ own non-tax revenue; it was ruling at around 2
per cent of GDP between 1980-81 to 1987-89; it gradually fell thereafter to
1.6 per cent in 1990-91 and again edged up and ruled around 2.0 per cent;
until 1995-96 thereafter it has steadily declined to around 1.5 per cent
(Appendix Table 3). Even this decline hides to an extent, the more serious
erosion in the recovery of user charges on social and economic services and
the poor return on government investments. This category of non-tax
38
revenues includes some special categories like interest receipts (which have a
natural tendency to grow in a regime of generally high interest rates) and state
lotteries which some of the state governments have resorted to. But for these
special receipts, the collection of non-tax revenues would have been still
lower. Also, the increases in gross receipts under these two heads appear
notional, for there are outgoes on account of interest and lotteries and their net
receipts are comparatively negligible.
Causes of Sluggish Growth in Tax Revenues
As brought out in Table 15, all major state taxes have suffered a setback
as per all the three measures of performance: revenue – GDP ratios, average
annual growth rates, and revenue buoyancy – and this has happened
particularly in the latest period since 1998-99 (or in the 1990s as a whole, in
revenue buoyancy).
A major structural problem faced by the states in tax revenues, has been
the extremely narrow tax base, with about 88 per cent of the total tax revenue
being obtained from indirect taxes – taxes on commodities and services,
whereas in the case of the central government, such indirect taxes constitute
about 62 per cent of its gross tax revenue; this explains the vast differences in
tax base that exist between the two layers of the federal system. On the face
of it, taxes on land and agricultural income ought to be considered as having a
large tax base, but unduly low revenue collected from land revenue and the
general neglect of taxation on agricultural incomes, have been debated ad
nauseum. It has been argued that “from the viewpoint of horizontal equity
and revenue productivity, levying a tax on agricultural incomes is necessary”
(Govinda Rao 2003). However, this contention ignores very many practical,
administrative and inter-sectoral equity, let alone socio-political,
considerations which weigh against the possibility of mobilising any sizeable
amount of revenue from any agricultural income tax. Foremost objection
arises from the fact that in the non-farm sector, the exemption level for
income taxes has been considerably liberalised, and from the viewpoint of
inter-sectoral equity, if the same exemption limit in terms of net taxable
income, has to be adhered to, and if the system of separate returns are to be
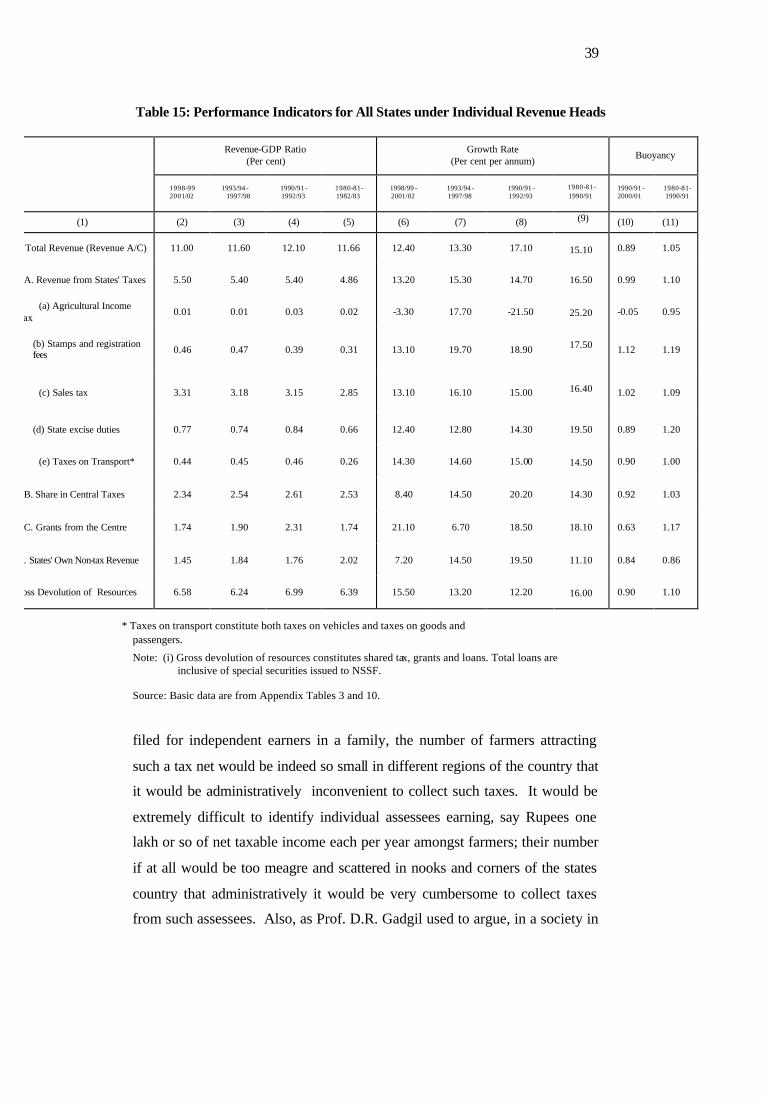
39
Table 15: Performance Indicators for All States under Individual Revenue Heads
Revenue-GDP Ratio
(Per cent) Growth Rate
(Per cent per annum) Buoyancy
1998-99 2001/02
1993/94 - 1997/98
1990/91 - 1992/93
1980-81-1982/83
1998/99 - 2001/02
1993/94 - 1997/98
1990/91 - 1992/93
1980-81-1990/91
1990/91 - 2000/01
1980-81- 1990/91
(1) (2) (3) (4) (5) (6) (7) (8) (9) (10) (11)
I. Total Revenue (Revenue A/C) 11.00 11.60 12.10 11.66 12.40 13.30 17.10
15.10 0.89 1.05
A. Revenue from States' Taxes 5.50 5.40 5.40 4.86 13.20 15.30 14.70
16.50 0.99 1.10
(a) Agricultural Income Tax
0.01 0.01 0.03 0.02 -3.30 17.70 -21.50
25.20 -0.05 0.95
(b) Stamps and registration fees 0.46 0.47 0.39 0.31 13.10 19.70 18.90
17.50 1.12 1.19
(c) Sales tax 3.31 3.18 3.15 2.85 13.10 16.10 15.00
16.40 1.02 1.09
(d) State excise duties 0.77 0.74 0.84 0.66 12.40 12.80 14.30
19.50 0.89 1.20
(e) Taxes on Transport* 0.44 0.45 0.46 0.26 14.30 14.60 15.00
14.50 0.90 1.00
B. Share in Central Taxes 2.34 2.54 2.61 2.53 8.40 14.50 20.20
14.30 0.92 1.03
C. Grants from the Centre 1.74 1.90 2.31 1.74 21.10 6.70 18.50
18.10 0.63 1.17
D. States' Own Non-tax Revenue 1.45 1.84 1.76 2.02 7.20 14.50 19.50
11.10 0.84 0.86
E. Gross Devolution of Resources 6.58 6.24 6.99 6.39 15.50 13.20 12.20
16.00 0.90 1.10
* Taxes on transport constitute both taxes on vehicles and taxes on goods and
passengers.
Note: (i) Gross devolution of resources constitutes shared tax, grants and loans. Total loans are inclusive of special securities issued to NSSF.
Source: Basic data are from Appendix Tables 3 and 10.
filed for independent earners in a family, the number of farmers attracting
such a tax net would be indeed so small in different regions of the country that
it would be administratively inconvenient to collect such taxes. It would be
extremely difficult to identify individual assessees earning, say Rupees one
lakh or so of net taxable income each per year amongst farmers; their number
if at all would be too meagre and scattered in nooks and corners of the states
country that administratively it would be very cumbersome to collect taxes
from such assessees. Also, as Prof. D.R. Gadgil used to argue, in a society in
40
which development is blatantly urban-oriented, the state would find it
extremely difficult to convince the farming community of the genuineness of
the case for imposing a tax on agricultural incomes, when health and
educational facilities and physical infrastructures remain weak in rural areas,
and what is more, indisputably unequal as compared with urban areas (Gadgil
1965)10. This is borne out of an important development, which is that while
the central government has no jurisdiction over the taxation on agricultural
incomes, the central income-tax law has compelled the assesses having both
non-farm and farm incomes, to declare the size of their incomes from farm
sources so that at least appropriate tax brackets could be applied to them, but
it is said that the states have not been able to levy the tax on even such farm
incomes declared in the central income tax returns. Apparently, even the
proposal to assign the tax to the rural local governments (Rajaraman and
Bhende 1998) has not found favour with the states (Govinda Rao 2003).
Against the above background, it is not surprising that taxes on land and
agricultural income have shown decreasing buoyancy. Even within the taxes
on agricultural income and property at present collected by the states as a
group, over 70 per cent accrues from stamps and registration fees, which is
also akin to an indirect tax and the bulk of which is ascribable to urban
transactions and instruments (Appendix Table 3). Next to sales tax and state
excise duties, it is the levy on court affidavits and on registration of transfer of
immovable property, which stands as an important source of revenue for the
states. It is said that levying of this tax at a high and differentiated rates has
led to widespread evasion of the tax by undervaluing the value of the property
transacted (Govinda Rao 2003). In fact, the problem is said to be much
deeper than this, for there is the vicious circle of under-declaration of property
values in the beginning for payment purposes in the form of ‘black’ and
‘white’ parts, which in turn originates in under-declaration of incomes by
contractors, other property dealers and by non-salary income earners
generally. It is true that some of the state governments have sought to
establish benchmark values for different groups of properties classified on the
basis of the factors influencing their values such as location, the nature of
construction and the reported market values, but this does not seem to have
41
made any significant impact on the growth of revenue pari passu with the
growth of transactions and reported values of urban properties. There is
undoubtedly widespread evasion and avoidance of the fees for the registration
of immovable property.
Sales tax, which is the major revenue earner for the states with over 60
per cent of revenue accruing from it, faces a complex set of issues. It should
be said at the outset that states’ revenue mobilisation through this tax has not
been as discouraging as it is made out. Sales tax revenue as percentage of
GDP has shown a gentle rise, unlike other heads of revenue; it has increased
from 2.7 per cent in 1980-81 to 3.1 per cent in 1990-91 and further to 3.2 per
cent in 1997-98 and to 3.8 per cent in 2002-03 (BE). As the RBI (2003) in its
review of state finances for 2002-03 has pointed out, the growth rate in sales
tax has averaged 15.4 per cent per annum during the 1990s which was higher
than that of the Union excise duties (10.8 per cent); this trend has continued
even in the current decade with the sales tax revenue growth placed at 13.3
per cent per annum against that of Union excise at 9.7 per cent during 2000-
01/2001-02. Even so, a common theme articulated by commentators
(Govinda Rao 2002; the Eleventh Finance Commission 2000) has been that
sales tax, which is the most important constituent item under states’ own tax
receipts, has not been fully exploited by the states as a source of revenue. The
tax competition amongst states has hurt the revenue productivity of sales tax.
Apart from competition amongst bigger states, low rates of sales taxes in the
Union territories adds to this unhealthy competition. As the Eleventh Finance
Commission (2000) has noted, it is encouraging to note that the states have
joined together at last to organise their tax system by coordinating and
introducing floor rates of tax and easing out existing concessions and tax
holidays (see also Chaudhuri 2000 and RBI 2003b, p.IV-7).
Be that as it may, it must be recognised that the system of sales taxation
at the states’ level has faced some serious structural problems. First, the
absence of constitutional provisions for the states to extend the sales tax base
to the services sector is inhibiting its buoyancy. The services sector is by far
the fastest growing sector in India (EPWRF 2002); it is said that over 70 per
cent of the growth of the national economy since the mid-1990s has been in
42
this sector (Acharya 2001). As the states are allowed to levy taxes on only
physical goods, the production and consumption of services remains outside
the tax net (Govinda Rao 2002). Govinda Rao (2002) has also pointed at
another important factor responsible for rendering the sales tax base narrow;
these are wide-ranging and large-scale exemptions and generous schemes of
fiscal incentives, the efficacy of which in promoting industrialisation is
limited, but in curtailing tax buoyancy it is significant. Above all, these
exemptions and incentives have provided a conduit for large-scale evasion and
avoidance of taxes, which otherwise also exist on a rampant scale.
Tightening of the tax administration, its modernisation, plugging of
loopholes and expanding the tax base by facilitating the inclusion of services
in the states’ tax net, are some of the obvious measures that stand out as
crucial for improving state finances. In this respect, the constitutional
amendment proposed in the Union budget for 2003-04 to grant the central
government to levy tax on services and to give sufficient powers to both the
central and state governments to collect the proceeds, will go a long way in
revenue augmentation; the Interim Budget for 2004-05 also made a mention of
the amendment to the Constitution already in progress [GoI (2004a),
February].
43
VI
Trends in States’ Own Non-Tax Receipts
The most logical step, both for the central and state governments, in the
current stage of development would have been to reduce the rates of taxation
which were per force kept high for financing development in its initial phases,
and to rely more on (i) appropriate application of user charges on public
services rendered, and (ii) extract reasonable returns on the stock of
investments. On both the latter counts, the performance has been abysmal.
As detailed in Appendix Table 3, the states’ own non-tax revenue had
always remained less than one-fourth of their own tax revenue, that is, at
about 1.6 to 1.8 per cent of GDP in the early 1990s as compared with 7.8 per
cent to 8.0 per cent of GDP in the form of tax revenue. A queer development
had been that this ratio of non-tax revenue to GDP improved after some of the
state governments began introducing state government lotteries during 1993-
94/1994-95; thereafter for a while the ratio improved to over 2 per cent of
GDP. This improvement, shown only on the revenue side, is very much
artificial because there is a substantial outgo on account of lotteries’ prize
money offered by the concerned states, thus producing puny net revenue for
the states as shown in Table 37 subsequently. As shown therein, for all states
together, gross revenue receipts under state lotteries were Rs 2,699.7 crore and
Rs 3,896.9 crore during 2000-01 and 2001-02, respectively, but net revenues
under the head were (-) Rs 71.4 crore and Rs 204.8 crore in the respective
years because of large outgo as payment of prize money and probably agency
costs on account of the lotteries. Be that as it may, simultaneously there has
occurred slowdown in the rate of growth of other non-tax receipts, particularly
revenues earned from economic and social services; the latter has receded
from 0.9 per cent of GDP in 1994-95 to 0.6 per cent by 1998-99; it has
remained stuck at that ratio since then. It is as a result of this that the overall
trends in non-tax revenues have suffered a setback after the latter half of the
1990s.
44
PSUs – A Drag on State Finances
Even the above meagre receipts under non-tax revenues hide the potential
losses under (a) returns on state government investments, and (b) recovery of
cost of public services. As brought out by the Eleventh Finance Commission
(2000), “poor financial performance of public sector enterprises has been the
most debilitating drag on the public finances of our country” (p.11). In the
case of states, nearly Rs 75,000 crore had been invested in statutory
corporations and nearly Rs 42,000 crore in government companies, and on
these investments, the rate of return generated has been nearly zero.
Alternatively, as on March 31, 2001, there were 834 state-level PSUs, and of
them, 185 enterprises were non-working and 358 were loss-making. The
Eleventh Finance Commission revealed that the state PSUs were heavily in
arrears in finalising their accounts and hence it was difficult to obtain any firm
figure of their rates of return, but the available information suggested that the
overall rate of return on state-level PSUs ‘was nearly zero’ (p.11).
Amongst the state PSUs, almost 85 per cent of investment is in electricity
utilities. Studies made in the Planning Commission suggest that the financial
performance of the state electricity boards (SEBs) has been a major cause of
drain on state finances. Far from generating the 3 per cent rate of return on
SEBs’ net fixed assets in service at the beginning of a year as stipulated under
Section 59 of the Electricity (Supply) Act, 1948 (a provision which had
become operative from the accounting year 1985-86, with the return being
measured after providing for interest and depreciation charges), the rate of
return in reality has not only remained negative but has steadily deteriorated
over the 1990s. With the SEBs’ value of fixed assets at Rs 68,000 crore, they
should have contributed Rs 2,040 crore (Govinda Rao 2003) but in actual
practice, they suffered a commercial loss at a peak level of Rs 25,395 crore in
2000-01, which worked out to a negative rate of return of (-)41.8 per cent;
this negative rate of return was about (-)12 per cent in the early 1990s, which
speaks of the extent of deterioration that has taken place in the power sector
finances. Apart from the average cost of power exceeding by over 40 per cent
due to inefficiencies in the SEBs’ operations, irrational pricing policies, and
45
transmission and distribution losses including theft of power, which is said to
have been endemic, have been a bane of the power sector. Partly because of
these reasons and partly independent of them because of socio-political
reasons, gross subsidy involved in the sale of electricity to farmers and
domestic consumers has galloped particularly since 1997-98 when
competitive political strains began to develop. Such subsidy amount was Rs
19,862 crore in 1996-97 and it shot up to Rs 34,042 crore in 200-01 and to Rs
34,360 crore in 2001-02. Interestingly, even the surplus generated by power
sale to industrial and commercial sectors has drastically come down during
this period, thus resulting in the uncovered subsidy amount shooting up from
Rs 6,014 crore in 1996-97 to Rs 22,172 crore in 2000-01 and to Rs 22,209
crore in 2001-02 (Table 16).
State road transport corporations/undertakings (SRTUs) constitute the
second largest enterprises of the states and they also serve as a drag on the
state budgets. As a group, these SRTUs suffer negative returns on their fixed
capital partly because they are required to render social obligations of serving
transport needs of non-viable routes; very often they make do with moderate
fares and do not raise fares pari passu with the rise in costs. Unlike in the
case of the power sector, there is no subvention provided by the state
governments for the social obligations of SRTUs. The Eleventh Finance
Commission (2000) revealed that during 1997-98, the losses of all the SRTCs
taken together were reported to be Rs 1,282 crore, “reflecting organisational
inefficiencies, on the one hand and the uncompensated burden of social
obligations on the other. While there has been some improvement in their
physical performance of late, the loss per bus has increased from Rs 425 in
1997-98 to Rs 565 in 1998-99. In several states, the SRTUs are in extremely
bad shape, with the bulk of their fleet of buses off the road and employees
going without pay for years”. Earlier, in a comprehensive study by the
Planning Commission (September 1995), it was brought out how despite a
steady improvement in the overall indices of physical performance, viz.,
vehicle productivity, bus-staff ratio, staff productivity and fuel efficiency, the
financial position of 46 SRTUs had not shown any improvement; the net loss
per bus was estimated at Rs 44,000 in 1994-95 as against Rs 29,000 in
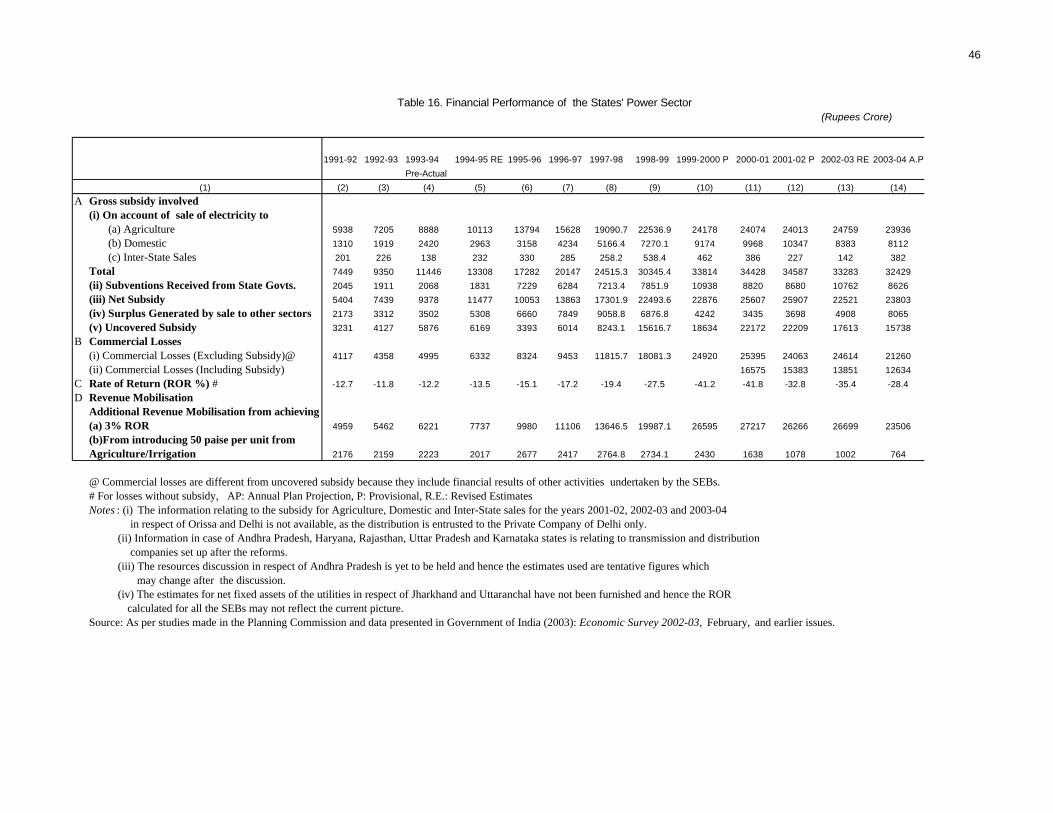
46
Table 16. Financial Performance of the States' Power Sector(Rupees Crore)
1991-92 1992-93 1993-94 1994-95 RE 1995-96 1996-97 1997-98 1998-99 1999-2000 P 2000-01 P2001-02 P 2002-03 RE 2003-04 A.P
Pre-Actual
(1) (2) (3) (4) (5) (6) (7) (8) (9) (10) (11) (12) (13) (14)
A Gross subsidy involved(i) On account of sale of electricity to
(a) Agriculture 5938 7205 8888 10113 13794 15628 19090.7 22536.9 24178 24074 24013 24759 23936
(b) Domestic 1310 1919 2420 2963 3158 4234 5166.4 7270.1 9174 9968 10347 8383 8112
(c) Inter-State Sales 201 226 138 232 330 285 258.2 538.4 462 386 227 142 382
Total 7449 9350 11446 13308 17282 20147 24515.3 30345.4 33814 34428 34587 33283 32429
(ii) Subventions Received from State Govts. 2045 1911 2068 1831 7229 6284 7213.4 7851.9 10938 8820 8680 10762 8626
(iii) Net Subsidy 5404 7439 9378 11477 10053 13863 17301.9 22493.6 22876 25607 25907 22521 23803
(iv) Surplus Generated by sale to other sectors 2173 3312 3502 5308 6660 7849 9058.8 6876.8 4242 3435 3698 4908 8065
(v) Uncovered Subsidy 3231 4127 5876 6169 3393 6014 8243.1 15616.7 18634 22172 22209 17613 15738
B Commercial Losses(i) Commercial Losses (Excluding Subsidy)@ 4117 4358 4995 6332 8324 9453 11815.7 18081.3 24920 25395 24063 24614 21260
(ii) Commercial Losses (Including Subsidy) 16575 15383 13851 12634
C Rate of Return (ROR %) # -12.7 -11.8 -12.2 -13.5 -15.1 -17.2 -19.4 -27.5 -41.2 -41.8 -32.8 -35.4 -28.4
D Revenue MobilisationAdditional Revenue Mobilisation from achieving(a) 3% ROR 4959 5462 6221 7737 9980 11106 13646.5 19987.1 26595 27217 26266 26699 23506
(b)From introducing 50 paise per unit from Agriculture/Irrigation 2176 2159 2223 2017 2677 2417 2764.8 2734.1 2430 1638 1078 1002 764
@ Commercial losses are different from uncovered subsidy because they include financial results of other activities undertaken by the SEBs.# For losses without subsidy, AP: Annual Plan Projection, P: Provisional, R.E.: Revised EstimatesNotes : (i) The information relating to the subsidy for Agriculture, Domestic and Inter-State sales for the years 2001-02, 2002-03 and 2003-04
in respect of Orissa and Delhi is not available, as the distribution is entrusted to the Private Company of Delhi only.(ii) Information in case of Andhra Pradesh, Haryana, Rajasthan, Uttar Pradesh and Karnataka states is relating to transmission and distribution
companies set up after the reforms.(iii) The resources discussion in respect of Andhra Pradesh is yet to be held and hence the estimates used are tentative figures which
may change after the discussion.(iv) The estimates for net fixed assets of the utilities in respect of Jharkhand and Uttaranchal have not been furnished and hence the ROR
calculated for all the SEBs may not reflect the current picture.
Source: As per studies made in the Planning Commission and data presented in Government of India (2003): Economic Survey 2002-03, February, and earlier issues.
47
1984-85. The SRTU finances have shown further steady deterioration over
the years, which is evident from the following assessment made on the
financial health of SRTUs in Planning Commission (2000): Mid-Term
Appraisal of Ninth Five year Plan (1997-2002):
“The financial performance of 48 SRTUs whose resources are
assessed in the Planning Commission continued to be unsatisfactory.
Their losses are increasing year after year. In the beginning of the
Ninth Plan, they recorded a net loss Rs 770 crore which increased to
Rs 1,196.08 crore in 1997-98 and Rs 1,385.79 crore in 1998-99 and Rs
1,576.60 crore in 1999-2000 (LE).
“Main reasons for the loss are uneconomic fare, delay in revision of
fares, concessional travel, operations on uneconomic routes, impact of
pay revisions and higher bus-staff ratio. There is urgent need to
improve productivity of SRTUs through measures like replacement of
overaged buses, improvement in the productivity of operational staff
and improved management practices. The States should also allow
timely increase in fares and bring down bus-staff ratio and
reimbursement of concessions” (p.377).
The Planning Commission has been making critical reviews of the
SRTUs at the time of finalising the state Annual Plans. As a result of the
pressures thus brought to bear on the SRTUs, there have been some attempts
made by them to obtain additional resource mobilisation through passenger
fare revisions. However, as against the target of Rs 10,190 crore to be so
mobilised during the ninth five-year plan (1997-2002), the states have
mobilised Rs 3,939 crore in the first three years, thus leaving a gap of as much
as Rs 6,251 crore to be achieved in two years 2000-01 and 2001-02 (Table
17). Also, this concerns the total contribution of resources to the plan; the
share of internal resources in this respect appears to be negative.
The situation is said to be similar with other state enterprises as well; the
accountant generals’ reports in many of the states point out that there are a
number of state level public enterprises with accumulated losses amounting to
several times the value of their fixed assets (Govinda Rao 2002).
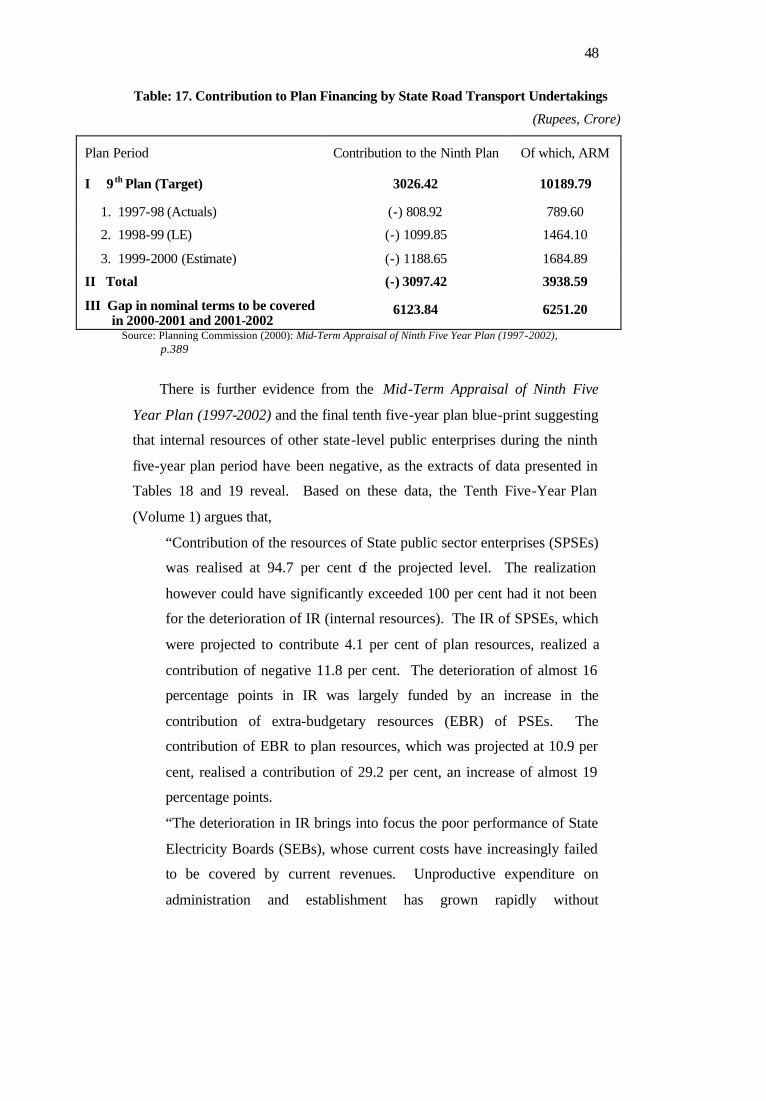
48
Table: 17. Contribution to Plan Financing by State Road Transport Undertakings
(Rupees, Crore)
Plan Period Contribution to the Ninth Plan Of which, ARM
I 9 th Plan (Target) 3026.42 10189.79
1. 1997-98 (Actuals) (-) 808.92 789.60
2. 1998-99 (LE) (-) 1099.85 1464.10
3. 1999-2000 (Estimate) (-) 1188.65 1684.89
II Total (-) 3097.42 3938.59
III Gap in nominal terms to be covered in 2000-2001 and 2001-2002
6123.84 6251.20
Source: Planning Commission (2000): Mid-Term Appraisal of Ninth Five Year Plan (1997-2002), p.389
There is further evidence from the Mid-Term Appraisal of Ninth Five
Year Plan (1997-2002) and the final tenth five-year plan blue-print suggesting
that internal resources of other state-level public enterprises during the ninth
five-year plan period have been negative, as the extracts of data presented in
Tables 18 and 19 reveal. Based on these data, the Tenth Five-Year Plan
(Volume 1) argues that,
“Contribution of the resources of State public sector enterprises (SPSEs)
was realised at 94.7 per cent of the projected level. The realization
however could have significantly exceeded 100 per cent had it not been
for the deterioration of IR (internal resources). The IR of SPSEs, which
were projected to contribute 4.1 per cent of plan resources, realized a
contribution of negative 11.8 per cent. The deterioration of almost 16
percentage points in IR was largely funded by an increase in the
contribution of extra-budgetary resources (EBR) of PSEs. The
contribution of EBR to plan resources, which was projected at 10.9 per
cent, realised a contribution of 29.2 per cent, an increase of almost 19
percentage points.
“The deterioration in IR brings into focus the poor performance of State
Electricity Boards (SEBs), whose current costs have increasingly failed
to be covered by current revenues. Unproductive expenditure on
administration and establishment has grown rapidly without
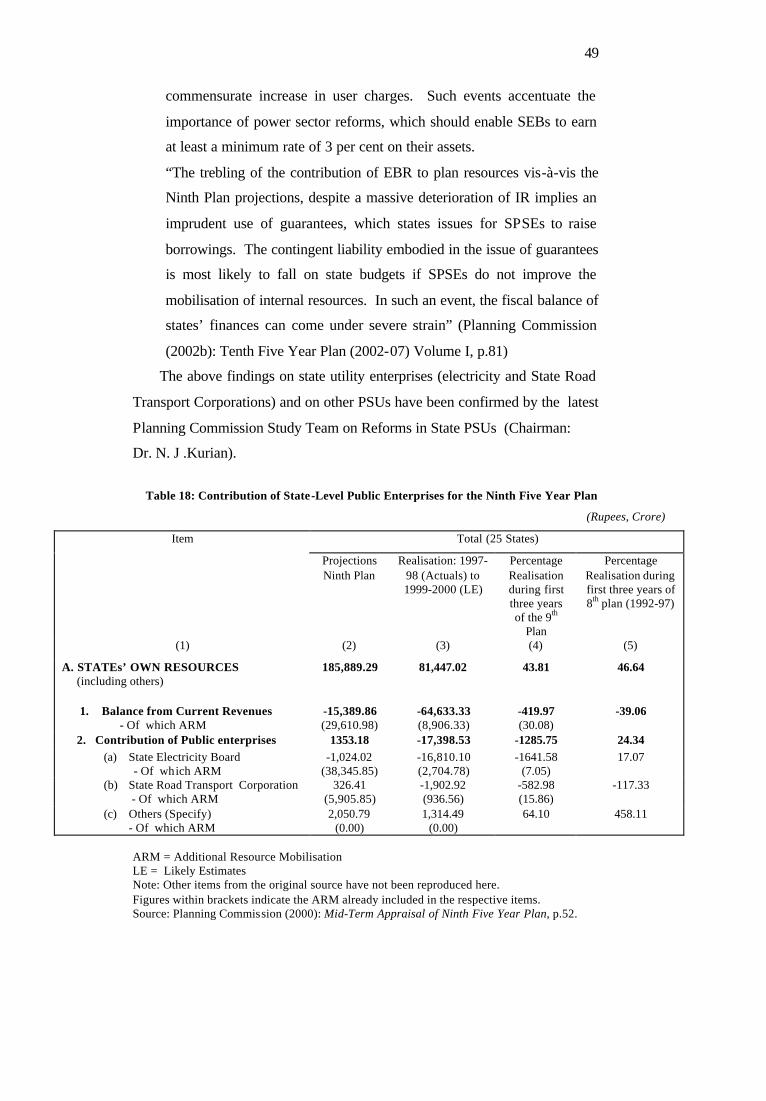
49
commensurate increase in user charges. Such events accentuate the
importance of power sector reforms, which should enable SEBs to earn
at least a minimum rate of 3 per cent on their assets.
“The trebling of the contribution of EBR to plan resources vis-à-vis the
Ninth Plan projections, despite a massive deterioration of IR implies an
imprudent use of guarantees, which states issues for SPSEs to raise
borrowings. The contingent liability embodied in the issue of guarantees
is most likely to fall on state budgets if SPSEs do not improve the
mobilisation of internal resources. In such an event, the fiscal balance of
states’ finances can come under severe strain” (Planning Commission
(2002b): Tenth Five Year Plan (2002-07) Volume I, p.81)
The above findings on state utility enterprises (electricity and State Road
Transport Corporations) and on other PSUs have been confirmed by the latest
Planning Commission Study Team on Reforms in State PSUs (Chairman:
Dr. N. J .Kurian).
Table 18: Contribution of State-Level Public Enterprises for the Ninth Five Year Plan
(Rupees, Crore)
Item Total (25 States)
Projections Ninth Plan
Realisation: 1997-98 (Actuals) to 1999-2000 (LE)
Percentage Realisation during first three years of the 9th
Plan
Percentage Realisation during first three years of 8th plan (1992-97)
(1) (2) (3) (4) (5)
A. STATEs’ OWN RESOURCES (including others)
185,889.29 81,447.02 43.81 46.64
1. Balance from Current Revenues - Of which ARM
-15,389.86 (29,610.98)
-64,633.33 (8,906.33)
-419.97 (30.08)
-39.06
2. Contribution of Public enterprises 1353.18 -17,398.53 -1285.75 24.34 (a) State Electricity Board - Of which ARM
-1,024.02 (38,345.85)
-16,810.10 (2,704.78)
-1641.58 (7.05)
17.07
(b) State Road Transport Corporation - Of which ARM
326.41 (5,905.85)
-1,902.92 (936.56)
-582.98 (15.86)
-117.33
(c) Others (Specify) - Of which ARM
2,050.79 (0.00)
1,314.49 (0.00)
64.10 458.11
ARM = Additional Resource Mobilisation LE = Likely Estimates Note: Other items from the original source have not been reproduced here. Figures within brackets indicate the ARM already included in the respective items. Source: Planning Commission (2000): Mid-Term Appraisal of Ninth Five Year Plan, p.52.
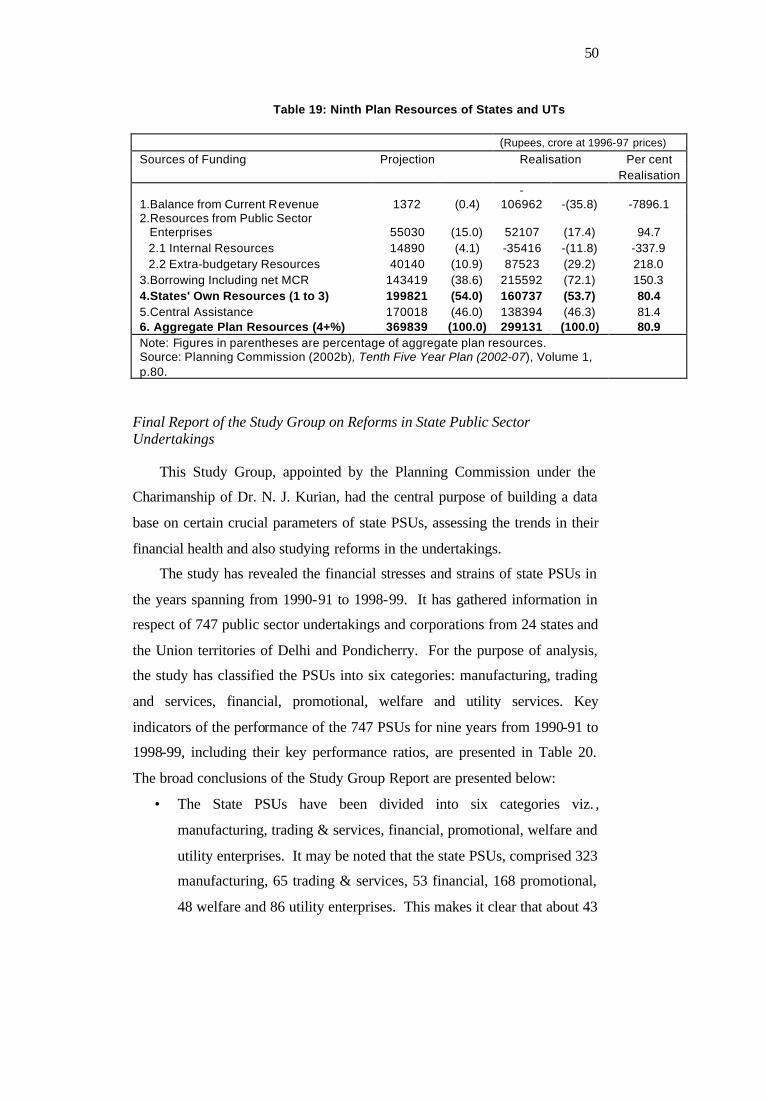
50
Table 19: Ninth Plan Resources of States and UTs
(Rupees, crore at 1996-97 prices)
Sources of Funding Projection Realisation Per cent Realisation
1.Balance from Current Revenue 1372 (0.4) -
106962 -(35.8) -7896.1 2.Resources from Public Sector Enterprises 55030 (15.0) 52107 (17.4) 94.7 2.1 Internal Resources 14890 (4.1) -35416 -(11.8) -337.9 2.2 Extra-budgetary Resources 40140 (10.9) 87523 (29.2) 218.0 3.Borrowing Including net MCR 143419 (38.6) 215592 (72.1) 150.3 4.States' Own Resources (1 to 3) 199821 (54.0) 160737 (53.7) 80.4 5.Central Assistance 170018 (46.0) 138394 (46.3) 81.4 6. Aggregate Plan Resources (4+%) 369839 (100.0) 299131 (100.0) 80.9 Note: Figures in parentheses are percentage of aggregate plan resources. Source: Planning Commission (2002b), Tenth Five Year Plan (2002-07), Volume 1, p.80.
Final Report of the Study Group on Reforms in State Public Sector Undertakings This Study Group, appointed by the Planning Commission under the
Charimanship of Dr. N. J. Kurian, had the central purpose of building a data
base on certain crucial parameters of state PSUs, assessing the trends in their
financial health and also studying reforms in the undertakings.
The study has revealed the financial stresses and strains of state PSUs in
the years spanning from 1990-91 to 1998-99. It has gathered information in
respect of 747 public sector undertakings and corporations from 24 states and
the Union territories of Delhi and Pondicherry. For the purpose of analysis,
the study has classified the PSUs into six categories: manufacturing, trading
and services, financial, promotional, welfare and utility services. Key
indicators of the performance of the 747 PSUs for nine years from 1990-91 to
1998-99, including their key performance ratios, are presented in Table 20.
The broad conclusions of the Study Group Report are presented below:
• The State PSUs have been divided into six categories viz. ,
manufacturing, trading & services, financial, promotional, welfare and
utility enterprises. It may be noted that the state PSUs, comprised 323
manufacturing, 65 trading & services, 53 financial, 168 promotional,
48 welfare and 86 utility enterprises. This makes it clear that about 43
51
per cent of the State PSUs have been set up to promote the
entrepreneurial role of the State to fill in the void arising out of
absence of private sector initiatives. Further about 9 per cent of the
State PSUs are undertaking the trading operations. About 7 per cent of
the enterprises are engaged in financial operations. The promotional
and welfare enterprises, numbering 216 constituted about 29 per cent
of the total enterprises indicating thereby that the State PSUs have
been largely expected to play the role of a catalyst in accelerating the
pace of economic development. In other words, the evaluation of the
performance needs to be judged not only by profit making yardsticks
but also in terms of the fulfilment of non-financial goals, if any, laid
down for them.
• Total investment in state PSUs increased at a compound annual rate of
growth (CARG) of 12.3 per cent during the 1990s, from Rs 77,760
crore in 1990-91 to Rs 197,105 crore in 1998-99. The net worth
increased from Rs 14,564 crore in 1990-91 to Rs 53,579 crore in 1998-
99 (CARG of 17.7 per cent). However, net worth was about Rs
1,49,727 crore short of capital employed during 1998-99 indicating a
tremendous erosion of the capital base over the period. The total
revenue earned was only around 55 per cent of the capital employed
and about 57 per cent of total investment.
• The cash profits/contributions (sales minus direct costs) declined from
about 20 per cent of the total revenue in 1990-91 to 16.6 per cent in
1998-99 as against the warranted norm of 40 per cent. The gross
margin as a percentage of sales declined from 13 per cent in 1990-91
to 11.2 per cent in 1998-99 as against the stipulated norm of 30 per
cent. The percentage of profit before interest and taxes to total revenue
declined from 10.2 in 1990-91 to 6.6 in 1998-99 against the popular
norm of 20 per cent.
• The net profits were in the negative throughout the period of the study
excepting for 1994-95 and 1995-96. Dividends as a percentage of
equity were miniscule at 0.6 per cent in 1998-99 (For details; see
52
Table 20). The prime lending rate (of banks) during this period was
13.5 per cent implying heavy implicit subsidies to the State PSUs.
• The utility enterprises were major loss makers. On the other hand,
enterprises in sectors such as financial, trading and services and
welfare enterprises (excepting for 1990-91) earned profits all through.
Promotional enterprises have shown mixed performance. The
manufacturing and utility (excepting for 1994-95) categorie s of
enterprises incurred losses consistently. These findings contradict the
general perception that all State PSUs are in losses. Further, it goes
against the belief that welfare and promotional State PSUs are
necessarily loss-making propositions.
• About 80 per cent of the total investment in State PSUs in 1998-99
was shared by nine states, namely, Andhra Pradesh, Delhi, Gujarat,
Karnataka, Kerala, Maharashtra, Tamil Nadu, Uttar Pradesh &West
Bengal, Delhi topped the table followed by Andhra Pradesh,
Maharashtra and Uttar Pradesh.
• Over 90 per cent of the accumulated losses were incurred by 12 states:
Andhra Pradesh, Assam, Delhi, Gujarat, Karnataka, Kerala,
Maharashtra, Orissa, Punjab, Tamil Nadu, Uttar Pradesh & West
Bengal. Delhi and West Bengal were the loss leaders with Assam,
Uttar Pradesh, Kerala and Tamil Nadu as their followers (Data on
state-wise profiles of state PSUs are presented in a subsequent section
of the present study).
• Capital employed by the State PSUs was only marginally higher than
the total investment during the period of the study indicating lack of
organic growth of these enterprises.
• Against the generally accepted norm of about 20 per cent of revenue
earned, profits before interest and taxes for the State PSUs ranged
from a high of 12.11 per cent in 1994-95 to 6.64 per cent in 1998-99.
None of the States earned the benchmark profit before interest and
taxes.
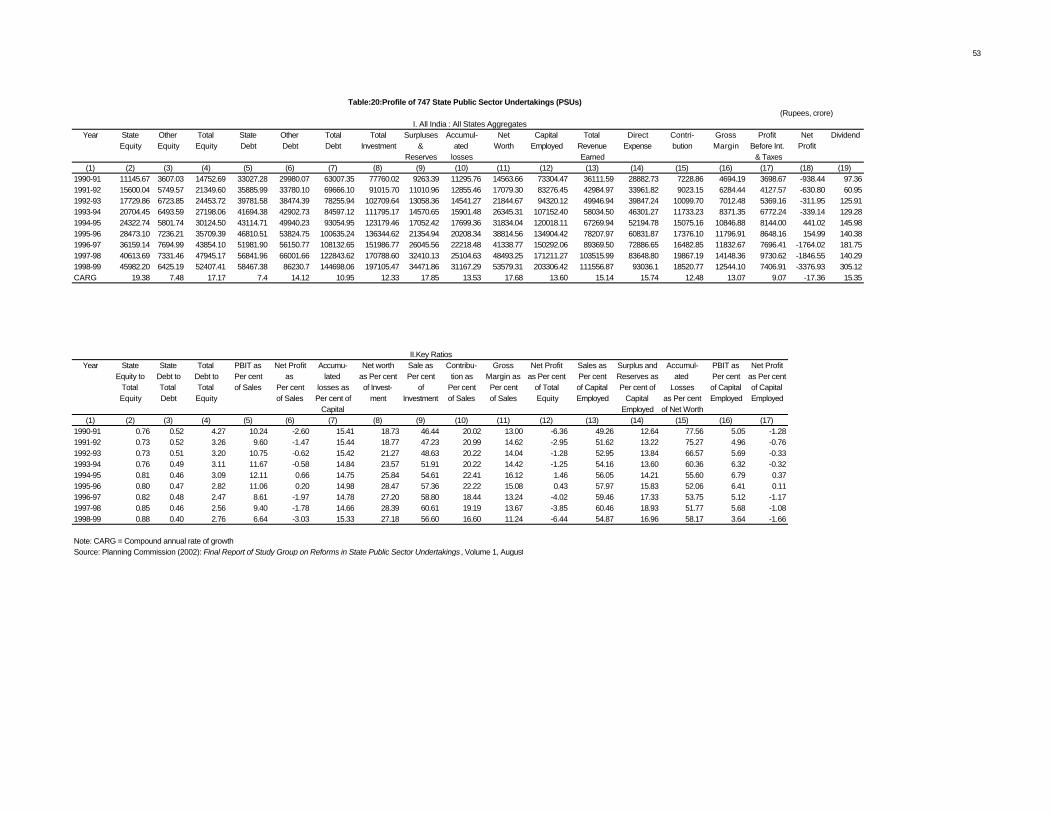
53
(Rupees, crore)
Year State Other Total State Other Total Total Surpluses Accumul- Net Capital Total Direct Contri- Gross Profit Net DividendEquity Equity Equity Debt Debt Debt Investment & ated Worth Employed Revenue Expense bution Margin Before Int. Profit
Reserves losses Earned & Taxes(1) (2) (3) (4) (5) (6) (7) (8) (9) (10) (11) (12) (13) (14) (15) (16) (17) (18) (19)
1990-91 11145.67 3607.03 14752.69 33027.28 29980.07 63007.35 77760.02 9263.39 11295.76 14563.66 73304.47 36111.59 28882.73 7228.86 4694.19 3698.67 -938.44 97.361991-92 15600.04 5749.57 21349.60 35885.99 33780.10 69666.10 91015.70 11010.96 12855.46 17079.30 83276.45 42984.97 33961.82 9023.15 6284.44 4127.57 -630.80 60.951992-93 17729.86 6723.85 24453.72 39781.58 38474.39 78255.94 102709.64 13058.36 14541.27 21844.67 94320.12 49946.94 39847.24 10099.70 7012.48 5369.16 -311.95 125.911993-94 20704.45 6493.59 27198.06 41694.38 42902.73 84597.12 111795.17 14570.65 15901.48 26345.31 107152.40 58034.50 46301.27 11733.23 8371.35 6772.24 -339.14 129.281994-95 24322.74 5801.74 30124.50 43114.71 49940.23 93054.95 123179.46 17052.42 17699.36 31834.04 120018.11 67269.94 52194.78 15075.16 10846.88 8144.00 441.02 145.981995-96 28473.10 7236.21 35709.39 46810.51 53824.75 100635.24 136344.62 21354.94 20208.34 38814.56 134904.42 78207.97 60831.87 17376.10 11796.91 8648.16 154.99 140.381996-97 36159.14 7694.99 43854.10 51981.90 56150.77 108132.65 151986.77 26045.56 22218.48 41338.77 150292.06 89369.50 72886.65 16482.85 11832.67 7696.41 -1764.02 181.751997-98 40613.69 7331.46 47945.17 56841.96 66001.66 122843.62 170788.60 32410.13 25104.63 48493.25 171211.27 103515.99 83648.80 19867.19 14148.36 9730.62 -1846.55 140.291998-99 45982.20 6425.19 52407.41 58467.38 86230.7 144698.06 197105.47 34471.86 31167.29 53579.31 203306.42 111556.87 93036.1 18520.77 12544.10 7406.91 -3376.93 305.12CARG 19.38 7.48 17.17 7.4 14.12 10.95 12.33 17.85 13.53 17.68 13.60 15.14 15.74 12.48 13.07 9.07 -17.36 15.35
Year State State Total PBIT as Net Profit Accumu- Net worth Sale as Contribu- Gross Net Profit Sales as Surplus and Accumul- PBIT as Net ProfitEquity to Debt to Debt to Per cent as lated as Per cent Per cent tion as Margin as as Per cent Per cent Reserves as ated Per cent as Per cent
Total Total Total of Sales Per cent losses as of Invest- of Per cent Per cent of Total of Capital Per cent of Losses of Capital of CapitalEquity Debt Equity of Sales Per cent of ment Investment of Sales of Sales Equity Employed Capital as Per cent Employed Employed
Capital Employed of Net Worth(1) (2) (3) (4) (5) (6) (7) (8) (9) (10) (11) (12) (13) (14) (15) (16) (17)
1990-91 0.76 0.52 4.27 10.24 -2.60 15.41 18.73 46.44 20.02 13.00 -6.36 49.26 12.64 77.56 5.05 -1.281991-92 0.73 0.52 3.26 9.60 -1.47 15.44 18.77 47.23 20.99 14.62 -2.95 51.62 13.22 75.27 4.96 -0.761992-93 0.73 0.51 3.20 10.75 -0.62 15.42 21.27 48.63 20.22 14.04 -1.28 52.95 13.84 66.57 5.69 -0.331993-94 0.76 0.49 3.11 11.67 -0.58 14.84 23.57 51.91 20.22 14.42 -1.25 54.16 13.60 60.36 6.32 -0.321994-95 0.81 0.46 3.09 12.11 0.66 14.75 25.84 54.61 22.41 16.12 1.46 56.05 14.21 55.60 6.79 0.371995-96 0.80 0.47 2.82 11.06 0.20 14.98 28.47 57.36 22.22 15.08 0.43 57.97 15.83 52.06 6.41 0.111996-97 0.82 0.48 2.47 8.61 -1.97 14.78 27.20 58.80 18.44 13.24 -4.02 59.46 17.33 53.75 5.12 -1.171997-98 0.85 0.46 2.56 9.40 -1.78 14.66 28.39 60.61 19.19 13.67 -3.85 60.46 18.93 51.77 5.68 -1.081998-99 0.88 0.40 2.76 6.64 -3.03 15.33 27.18 56.60 16.60 11.24 -6.44 54.87 16.96 58.17 3.64 -1.66
Note: CARG = Compound annual rate of growthSource: Planning Commission (2002): Final Report of Study Group on Reforms in State Public Sector Undertakings , Volume 1, August.
Table:20:Profile of 747 State Public Sector Undertakings (PSUs)
I. All India : All States Aggregates
II.Key Ratios
54
• Net profits should at least be equivalent to prime lending rate or 10 per
cent of the revenue earned. However, the net profits for all the States
taken together for the various years of the study excepting 1994-95
and 1995-96 were negative. Net prof its for all the States taken
together have averaged around (-)1.2 per cent of the total revenue
earned over the study period (1990-91 to 1998-99); almost all years
have shown negative net returns..
• Total dividends distributed by the profit-making State PSUs in 1998-
99 turned out to be 0.58 per cent of the total equity. Taking the
opportunity cost of equity as 10 per cent, this implies that the State
Governments subsidise the State PSUs by a huge amount which was
approximately Rs.4,900 crore in 1998-99. [Planning Commission
(2002): Final Report of Study Group on Reforms in State Public Sector
Undertakings, Volume 1, August]
To sum up, the state PSUs have been a gross drain on the states’ exchequer.
Poor Cost Recovery in Public Services An equally distressing aspect of state finances has been, as pointed out
above, the poor cost recovery of public services, which on the face of it
appears as a simple lapse, but it is not so for, it is not merely a question of
uneconomic pricing of services; the administration is said to be also guilty of
inefficiency, delay, corruption and nepotism – all put together inflate the cost
of services, and any increase in the user charges would mean simply passing
on the burden of inefficiency in service delivery to the consumers. Even so,
an NIPFP study (Ministry of Finance 1997) places the level of cost recovery
as of 1994-95 at such a meagre level as 2.15 per cent for social services and
10.75 per cent for economic services. As an extension of this assessment,
crude ratios are worked out in Table 21 representing non-tax revenues as
percentages of total expenditures on ‘social’ and ‘economic’ services in
individual years. These reveal that non-tax revenues obtained from ‘social
services’ are stuck at 2.0 per cent of state expenditures throughout the period
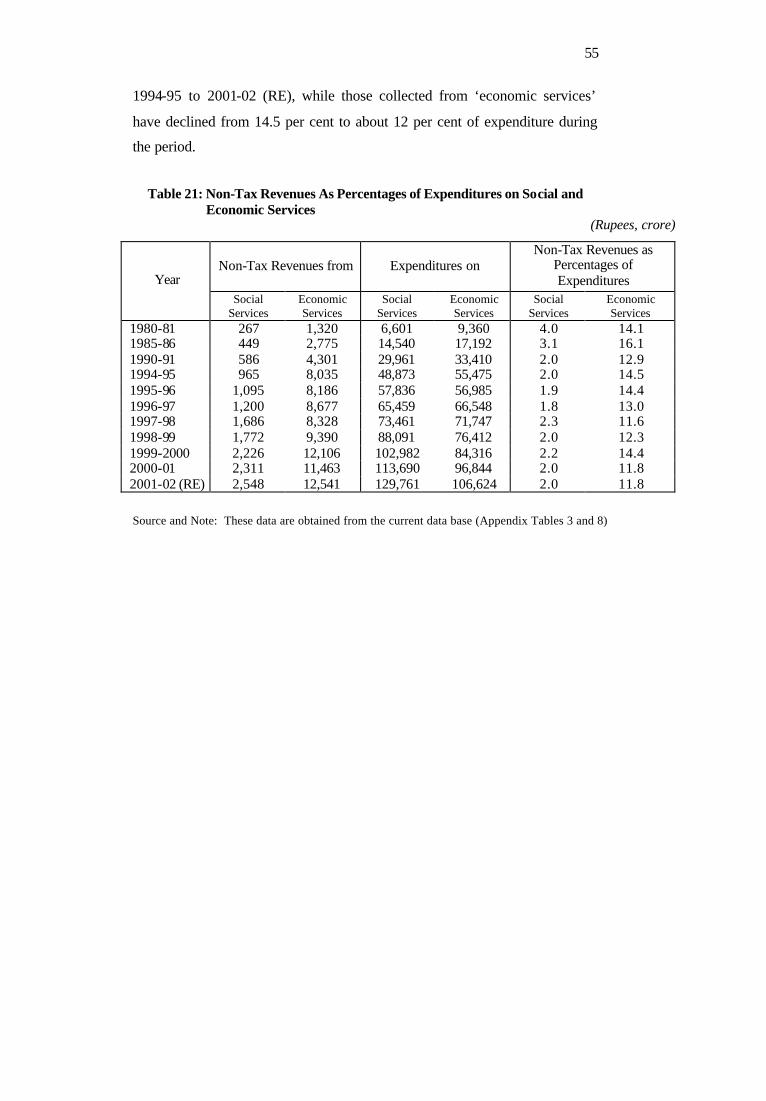
55
1994-95 to 2001-02 (RE), while those collected from ‘economic services’
have declined from 14.5 per cent to about 12 per cent of expenditure during
the period.
Table 21: Non-Tax Revenues As Percentages of Expenditures on Social and Economic Services
(Rupees, crore)
Non-Tax Revenues from Expenditures on Non-Tax Revenues as
Percentages of Expenditures
Year Social
Services Economic Services
Social Services
Economic Services
Social Services
Economic Services
1980-81 267 1,320 6,601 9,360 4.0 14.1 1985-86 449 2,775 14,540 17,192 3.1 16.1 1990-91 586 4,301 29,961 33,410 2.0 12.9 1994-95 965 8,035 48,873 55,475 2.0 14.5 1995-96 1,095 8,186 57,836 56,985 1.9 14.4 1996-97 1,200 8,677 65,459 66,548 1.8 13.0 1997-98 1,686 8,328 73,461 71,747 2.3 11.6 1998-99 1,772 9,390 88,091 76,412 2.0 12.3 1999-2000 2,226 12,106 102,982 84,316 2.2 14.4 2000-01 2,311 11,463 113,690 96,844 2.0 11.8 2001-02 (RE) 2,548 12,541 129,761 106,624 2.0 11.8
Source and Note: These data are obtained from the current data base (Appendix Tables 3 and 8)
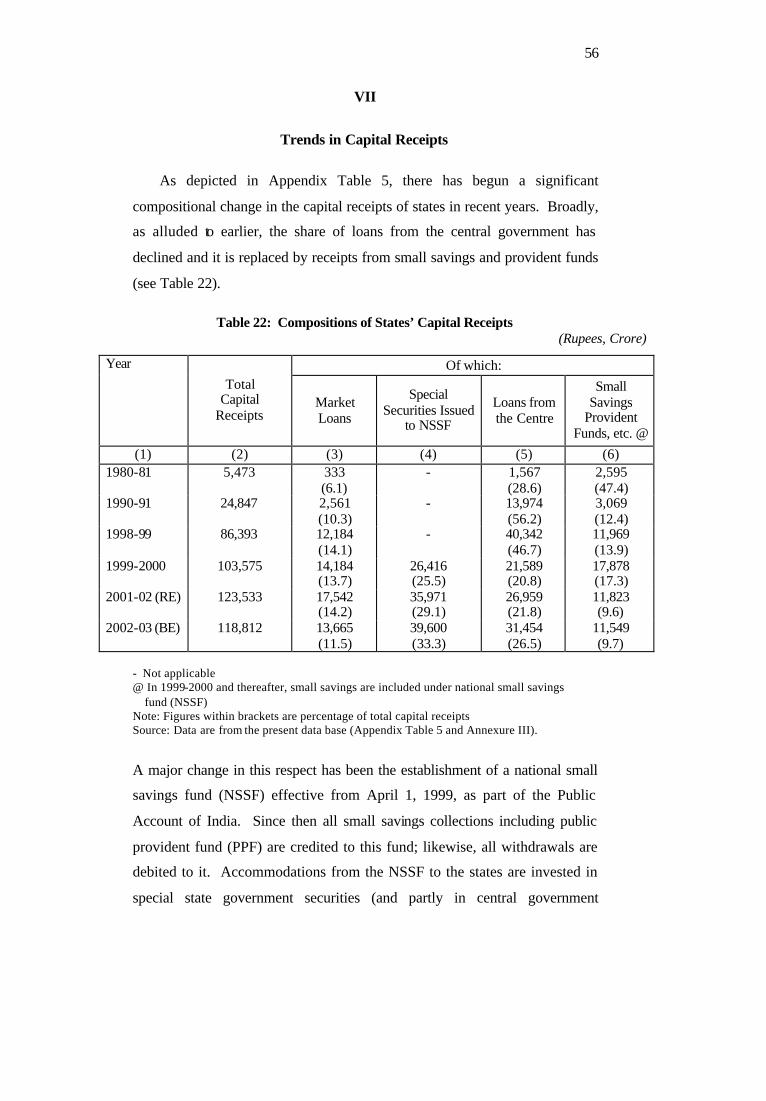
56
VII
Trends in Capital Receipts
As depicted in Appendix Table 5, there has begun a significant
compositional change in the capital receipts of states in recent years. Broadly,
as alluded to earlier, the share of loans from the central government has
declined and it is replaced by receipts from small savings and provident funds
(see Table 22).
Table 22: Compositions of States’ Capital Receipts
(Rupees, Crore)
Of which: Year
Total Capital
Receipts Market Loans
Special Securities Issued
to NSSF
Loans from the Centre
Small Savings
Provident Funds, etc. @
(1) (2) (3) (4) (5) (6) 1980-81 5,473 333
(6.1) - 1,567
(28.6) 2,595 (47.4)
1990-91 24,847 2,561 (10.3)
- 13,974 (56.2)
3,069 (12.4)
1998-99 86,393 12,184 (14.1)
- 40,342 (46.7)
11,969 (13.9)
1999-2000 103,575 14,184 (13.7)
26,416 (25.5)
21,589 (20.8)
17,878 (17.3)
2001-02 (RE) 123,533 17,542 (14.2)
35,971 (29.1)
26,959 (21.8)
11,823 (9.6)
2002-03 (BE) 118,812 13,665 (11.5)
39,600 (33.3)
31,454 (26.5)
11,549 (9.7)
- Not applicable @ In 1999-2000 and thereafter, small savings are included under national small savings fund (NSSF) Note: Figures within brackets are percentage of total capital receipts Source: Data are from the present data base (Appendix Table 5 and Annexure III).
A major change in this respect has been the establishment of a national small
savings fund (NSSF) effective from April 1, 1999, as part of the Public
Account of India. Since then all small savings collections including public
provident fund (PPF) are credited to this fund; likewise, all withdrawals are
debited to it. Accommodations from the NSSF to the states are invested in
special state government securities (and partly in central government
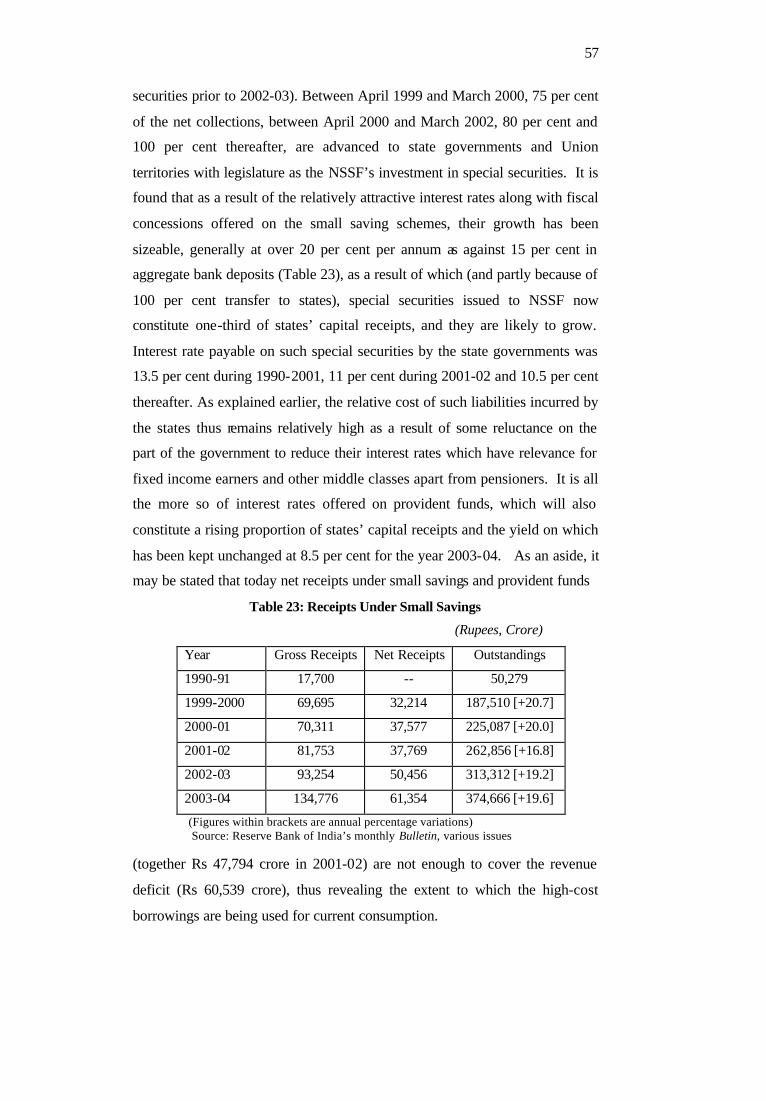
57
securities prior to 2002-03). Between April 1999 and March 2000, 75 per cent
of the net collections, between April 2000 and March 2002, 80 per cent and
100 per cent thereafter, are advanced to state governments and Union
territories with legislature as the NSSF’s investment in special securities. It is
found that as a result of the relatively attractive interest rates along with fiscal
concessions offered on the small saving schemes, their growth has been
sizeable, generally at over 20 per cent per annum as against 15 per cent in
aggregate bank deposits (Table 23), as a result of which (and partly because of
100 per cent transfer to states), special securities issued to NSSF now
constitute one-third of states’ capital receipts, and they are likely to grow.
Interest rate payable on such special securities by the state governments was
13.5 per cent during 1990-2001, 11 per cent during 2001-02 and 10.5 per cent
thereafter. As explained earlier, the relative cost of such liabilities incurred by
the states thus remains relatively high as a result of some reluctance on the
part of the government to reduce their interest rates which have relevance for
fixed income earners and other middle classes apart from pensioners. It is all
the more so of interest rates offered on provident funds, which will also
constitute a rising proportion of states’ capital receipts and the yield on which
has been kept unchanged at 8.5 per cent for the year 2003-04. As an aside, it
may be stated that today net receipts under small savings and provident funds
Table 23: Receipts Under Small Savings
(Rupees, Crore)
Year Gross Receipts Net Receipts Outstandings
1990-91 17,700 -- 50,279
1999-2000 69,695 32,214 187,510 [+20.7]
2000-01 70,311 37,577 225,087 [+20.0]
2001-02 81,753 37,769 262,856 [+16.8]
2002-03 93,254 50,456 313,312 [+19.2]
2003-04 134,776 61,354 374,666 [+19.6]
(Figures within brackets are annual percentage variations) Source: Reserve Bank of India’s monthly Bulletin, various issues
(together Rs 47,794 crore in 2001-02) are not enough to cover the revenue
deficit (Rs 60,539 crore), thus revealing the extent to which the high-cost
borrowings are being used for current consumption.
58
VIII
Fiscal Transfers from the Centre
A few distinct changes are discernible in the composition of federal transfers
in recent years. First, as a fall out of the fiscal adjustment by the central
government level, the growth rate of states’ share in central taxes has
drastically slipped to 9.3 per cent per annum during 1997-98 to 2002-03 as
compared with about 15 per cent per annum during the previous decade and a
half since the early 1980s (see earlier Table 14). This is not surprising as the
centre’s gross tax revenue has experienced some deceleration in growth and
also as percentage of GDP partly because of the slowdown in the economy
(Chaudhuri 2000). The states’ share in central taxes as percentage of states’
aggregate expenditure had reached a peak of 17.7 per cent in 1997-98 but
thereafter it has dipped to as low a ratio as 13.8 per cent 2001-02 (RE) (see
Appendix Table 10), despite some deceleration in the annual growth of
aggregate expenditure itself during the period (Table 14). Second, following
the recommendations of the Eleventh Finance Commission (2000-01 to 2004-
05), non-plan statutory grants have shown a sizeable increase from 2000-01
onwards; they have risen from Rs 1,988 crore in 1999-2000 to Rs 8,327 crore
the next year and further to Rs 10,531 crore in 2001-02 (RE). Until then, the
statutory grants were falling both in absolute amounts and as percentage of
aggregate expenditure. In recent years, the size of centrally-sponsored
schemes has been gaining in importance, and after 2001-02, there has
occurred a quantum leap in them too, from Rs 7,182 crore in 2000-01 to Rs
12,173 crore (Appendix Table 10). Consequently, state-plan grants, which
were 2.20 times the centrally-sponsored plan grants in 1997-98, dipped to 1.62
times the latter in 2002-03 (BE) (Table 24). As a result, the total grants from
the centre as a ratio of aggregate expenditure, which was receding up to 1998-
99 when it fell to 9 per cent, has begun to look up and reached 12.6 per cent in
the latest two years (2001-02 and 2002-03) (Appendix Table 10).
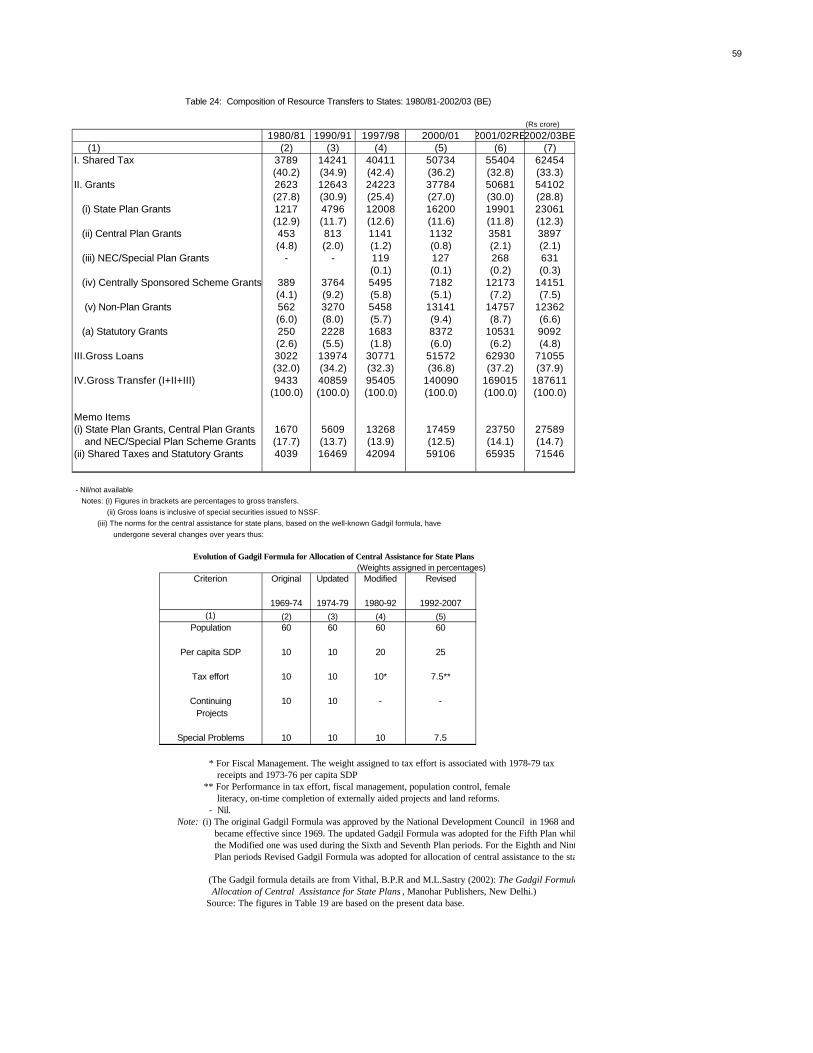
59
Table 24: Composition of Resource Transfers to States: 1980/81-2002/03 (BE)
(Rs crore)
1980/81 1990/91 1997/98 2000/01 2001/02RE2002/03BE(1) (2) (3) (4) (5) (6) (7)
I. Shared Tax 3789 14241 40411 50734 55404 62454(40.2) (34.9) (42.4) (36.2) (32.8) (33.3)
II. Grants 2623 12643 24223 37784 50681 54102(27.8) (30.9) (25.4) (27.0) (30.0) (28.8)
(i) State Plan Grants 1217 4796 12008 16200 19901 23061(12.9) (11.7) (12.6) (11.6) (11.8) (12.3)
(ii) Central Plan Grants 453 813 1141 1132 3581 3897(4.8) (2.0) (1.2) (0.8) (2.1) (2.1)
(iii) NEC/Special Plan Grants - - 119 127 268 631(0.1) (0.1) (0.2) (0.3)
(iv) Centrally Sponsored Scheme Grants 389 3764 5495 7182 12173 14151(4.1) (9.2) (5.8) (5.1) (7.2) (7.5)
(v) Non-Plan Grants 562 3270 5458 13141 14757 12362(6.0) (8.0) (5.7) (9.4) (8.7) (6.6)
(a) Statutory Grants 250 2228 1683 8372 10531 9092(2.6) (5.5) (1.8) (6.0) (6.2) (4.8)
III.Gross Loans 3022 13974 30771 51572 62930 71055(32.0) (34.2) (32.3) (36.8) (37.2) (37.9)
IV.Gross Transfer (I+II+III) 9433 40859 95405 140090 169015 187611(100.0) (100.0) (100.0) (100.0) (100.0) (100.0)
Memo Items(i) State Plan Grants, Central Plan Grants 1670 5609 13268 17459 23750 27589 and NEC/Special Plan Scheme Grants (17.7) (13.7) (13.9) (12.5) (14.1) (14.7)(ii) Shared Taxes and Statutory Grants 4039 16469 42094 59106 65935 71546
- Nil/not available
Notes: (i) Figures in brackets are percentages to gross transfers.
(ii) Gross loans is inclusive of special securities issued to NSSF.
(iii) The norms for the central assistance for state plans, based on the well-known Gadgil formula, have
undergone several changes over years thus:
Evolution of Gadgil Formula for Allocation of Central Assistance for State Plans(Weights assigned in percentages)
Original Updated Modified Revised
1969-74 1974-79 1980-92 1992-2007(1) (2) (3) (4) (5)
Population 60 60 60 60
Per capita SDP 10 10 20 25
Tax effort 10 10 10* 7.5**
Continuing Projects
Special Problems 10 10 10 7.5
* For Fiscal Management. The weight assigned to tax effort is associated with 1978-79 tax receipts and 1973-76 per capita SDP ** For Performance in tax effort, fiscal management, population control, female literacy, on-time completion of externally aided projects and land reforms. - Nil.Note: (i) The original Gadgil Formula was approved by the National Development Council in 1968 and became effective since 1969. The updated Gadgil Formula was adopted for the Fifth Plan while the Modified one was used during the Sixth and Seventh Plan periods. For the Eighth and Ninth Plan periods Revised Gadgil Formula was adopted for allocation of central assistance to the states.
(The Gadgil formula details are from Vithal, B.P.R and M.L.Sastry (2002): The Gadgil Formula, For Allocation of Central Assistance for State Plans , Manohar Publishers, New Delhi.)
Source: The figures in Table 19 are based on the present data base.
-
Criterion
10 10 -
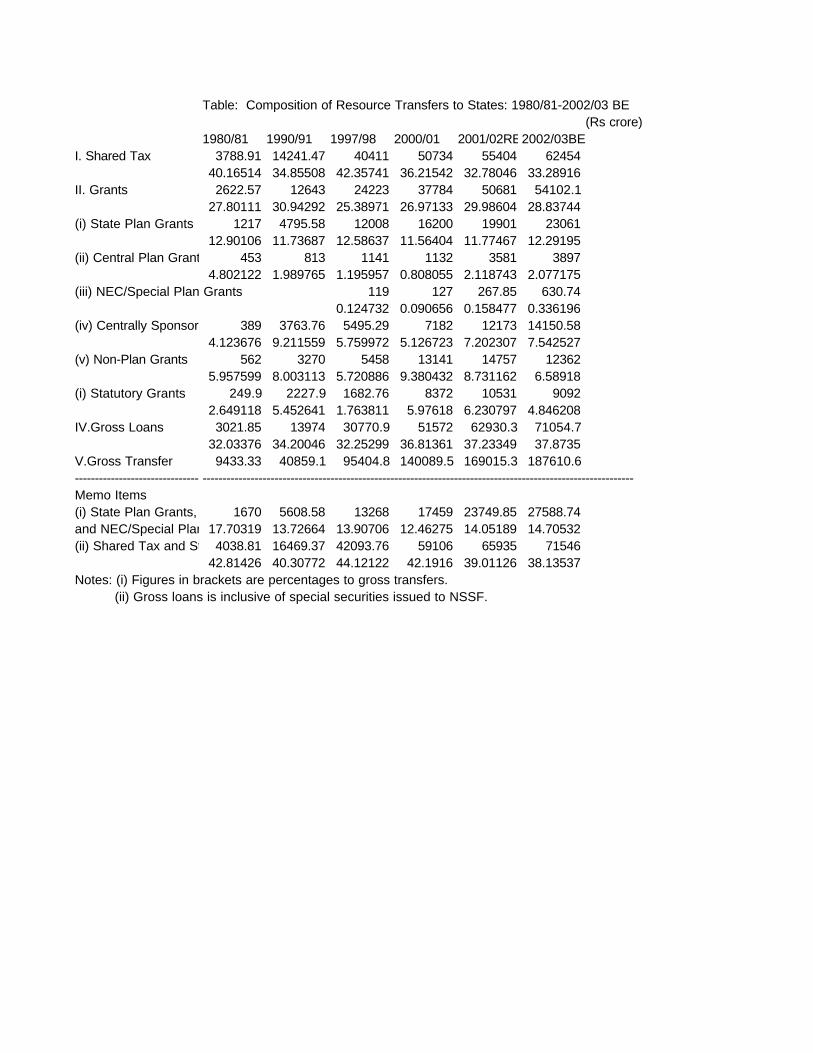
Table: Composition of Resource Transfers to States: 1980/81-2002/03 BE(Rs crore)
1980/81 1990/91 1997/98 2000/01 2001/02RE2002/03BEI. Shared Tax 3788.91 14241.47 40411 50734 55404 62454
40.16514 34.85508 42.35741 36.21542 32.78046 33.28916II. Grants 2622.57 12643 24223 37784 50681 54102.1
27.80111 30.94292 25.38971 26.97133 29.98604 28.83744(i) State Plan Grants 1217 4795.58 12008 16200 19901 23061
12.90106 11.73687 12.58637 11.56404 11.77467 12.29195(ii) Central Plan Grants 453 813 1141 1132 3581 3897
4.802122 1.989765 1.195957 0.808055 2.118743 2.077175(iii) NEC/Special Plan Grants 119 127 267.85 630.74
0.124732 0.090656 0.158477 0.336196(iv) Centrally Sponsored Scheme Grants389 3763.76 5495.29 7182 12173 14150.58
4.123676 9.211559 5.759972 5.126723 7.202307 7.542527(v) Non-Plan Grants 562 3270 5458 13141 14757 12362
5.957599 8.003113 5.720886 9.380432 8.731162 6.58918(i) Statutory Grants 249.9 2227.9 1682.76 8372 10531 9092
2.649118 5.452641 1.763811 5.97618 6.230797 4.846208IV.Gross Loans 3021.85 13974 30770.9 51572 62930.3 71054.7
32.03376 34.20046 32.25299 36.81361 37.23349 37.8735V.Gross Transfer 9433.33 40859.1 95404.8 140089.5 169015.3 187610.6----------------------------------------------------------------------------------------------------------------------------------------------------------------------Memo Items(i) State Plan Grants, Central Plan Grants1670 5608.58 13268 17459 23749.85 27588.74and NEC/Special Plan Scheme Grants17.70319 13.72664 13.90706 12.46275 14.05189 14.70532(ii) Shared Tax and Statutory Grants4038.81 16469.37 42093.76 59106 65935 71546
42.81426 40.30772 44.12122 42.1916 39.01126 38.13537Notes: (i) Figures in brackets are percentages to gross transfers. (ii) Gross loans is inclusive of special securities issued to NSSF.
60
The third – and a major-development in federal transfers - has been the
relative shift in favour of loans as against grants. Until 1995-96, the
beginning of the Tenth Finance Commission period, the total size of grants
from the centre (at about Rs 20,966 crore) had exceeded that of loans (Rs
19,600 crore), but thereafter the quantum of loans began to outstrip grants
such that in 2001-02 (RE), the ratio of loans to grants crossed 1.24:1.00. The
loan component has been further increased by the rising proportion of net
small saving accruals being assigned to states (from 80 per cent in 2000-01 to
100 per cent in 2002-03). As a result, the share of gross loans in total central
transfers has risen from 28 per cent in 1995-96 to 38 per cent in 2002-03 (BE).
No doubt, the earlier increases in interest rates paid to the centre have
been arrested, which is reflected in the fact that states’ interest payments to the
centre, which grew at the rate of 20 per cent per annum between 1990-91 and
1995-96 and 16 per cent per annum between 1995-96 and 2000-01, has grown
at the rate of 6.5 per cent per annum during the next two years (Appendix
Table 10). Overall, while the gross transfer of central resources constitutes
about 43.5 per cent of states’ aggregate expenditure, net transfer accounts for
about 33 per cent, thus absorbing about 10 to 11 per cent for total debt
servicing on the central loans (ibid).
The strengths and weaknesses of the system of federal transfers have been
debated in India rather extensively (Vithal and Sastry 2001; Chelliah 2001;
Kurian 1999; Bagchi 2003; and Govinda Rao 2002). As summed up by the
Eleventh Finance Commission (2000), many deficiencies have surfaced in the
working of the transfer system; primarily the problems have arisen from:
(i) segmentation of the flow of federal revenue to the states and
multiplicity of agencies dispensing Central funds;
(ii) shortcomings in the design of vertical and horizontal sharing of
federal revenues; and
(iii) inadequacy of institutional arrangements for intergovernmental
consultation and policy co-ordination on an operational footing
(p.13).
61
Despite specific recommendations made by the Eleventh Finance
Commission, the following picturesque description of the frailties in the
federal transfer system in India, as given by the Commission itself in 2000,
appears valid even now:
“The most serious flaw in the current system of federal transfers in
India is the flow of the Centre’s revenue to the States in segments, viz.,
devolution of a fraction of the Centre’s divisible taxes and grants-in-
aid of revenue of States in need of assistance under article 275 of the
Constitution through the Finance Commission (FC), transfers through
the Planning Commission (PC) in the form of assistance for State
Plans, transfers to implement Centrally Sponsored Schemes (CSS)
under the Central Sector Plan, and other discretionary transfers. The
statutory transfers also have several components, viz., tax devolution,
revenue deficit grants, grants for upgradation and special problems and
grants meant for local bodies and calamity relief. The dominance of
tax devolution in these transfers weakens the equalising capacity of
Finance Commission transfer, even though successive Finance
Commissions have tried to redress the weakness by introducing
progressive elements in the devolution formula. A more complicating
factor has been the emergence of plan grants as a parallel channel of
transfer of Central funds dispensed by a different agency, viz., the
Planning Commission. Some revenue transfers take place also in the
form of discretionary grants administered by the Ministry of Finance
But they constitute a small proportion of the total, currently only about
2 per cent. Statutory transfers made up of tax devolution and grants
under article 275 accounts for the bulk (about 65 to 70 per cent).
However, plan grants also form a sizeable proportion (about 30 to 35
per cent)” (ibid, p.13).
One of the recommendations of the Eleventh Finance Commission
(2000), which has begun to reflect in the fiscal performance of states,
concerns the linking of central grants to monitorable fiscal reforms
programmes. Key elements of this linkage are:
62
• In its Supplementary Report, the majority view has
recommended monitorable fiscal reforms programmes for all
states. Fifteen per cent of the revenue deficit grants meant for
15 states during 2000-05 and a matching contribution by
Central Government be credited into an Incentive Fund from
which fiscal performance based grants should be made
available to all 25 states. Total amount of the Fund comprising
both parts is recommended at Rs 10,607.72 crore for a five-
year period to be apportioned at the rate of Rs 2,121.54 crore
per annum. The grants for specific purposes like upgradation,
special problems and local bodies, which remain unutilised due
to non-observance of conditionalities attached to the release of
these grants may also be credited to the Incentive Fund during
2004-05.
• For the purpose of drawing up state-specific monitorable fiscal
reforms programmes, a monitorable fiscal reforms programme
aimed at reduction of revenue deficit of the states is envisaged.
• A group designated as Monitoring Agency may be constituted
by the Government of India for drawing up state-specific
monitorable fiscal reforms programmes for all states in the
context of the broad parameters suggested by the Eleventh
Finance Commission and as accepted by Government of India.
The monitorable programme should give equal weight to the
raising of revenue and control of expenditure.
• Eighty five per cent of the revenue deficit grant recommended
by the Commission and accepted by the Government of India
may be released to the relevant states without linking it to
performance under the monitorable fiscal reforms programme.
Only 15 per cent of the revenue deficit grant to which a state is
entitled may be withheld and linked with the progress in
performance.
63
Apart from the fiscal performance–based grants which has given an
impetus to fiscal reforms at the states level, a number of other initiatives taken
by the central government and the Reserve Bank of India, have culminated in
important blue-prints for (i) power sector reforms at the states level; (ii)
institutional reforms in the form of fiscal responsibility bills and medium-term
fiscal plans, aimed at fiscal stability and sustainability; and (iii) the RBI
initiative for containing state guarantees – all of which are discussed in
Section XIII of this study.
64
IX
Growth and Structural Changes in State Expenditures
An interesting aspect of total expenditure trends in respect of states over
the past two decades since the early 1980s has been its steady growth at about
14 to 14.5 per cent per annum. During the three phases identified earlier, the
average annual growth rates in states’ total expenditure have decelerated but
rather fractionally from 14.9 per cent during 1980-81 to 1987-88 to 14.4 per
cent during 1987-88 to 1997-98 and further to 13.6 per cent during the latest
period of state-level fiscal reforms 1997-98 to 2002-03 (BE) (see earlier Table
14).
Revenue and Capital Expenditures
Amongst the broad components of total expenditure, the highest rate
of growth has always been in revenue expenditure and the lowest in capital
expenditure (see also Table 14). During the past two decades, while revenue
expenditure has expanded at an annual rate of 15.6 per cent, capital
expenditure has risen at 11.1 per cent per annum. It is also interesting that the
annual rate of growth in states’ capital expenditure has accelerated during the
three phases identified above – from 9.6 per cent during 1980-81 to 1987-88
to 11.3 per cent during 1987-88 to 1997-98 and further to 13.0 per cent during
1997-98 to 2002-03 (BE). However, the acceleration in the rate of increase in
the latest phase has been to an extent contributed by discharge of debt
(increase of over 380 per cent between 1997-98 and 2002-03) and repayment
of loans to the centre (79 per cent), while developmental outlays (90 per cent)
and loans for developmental purposes (41 per cent) have shown lower
increases. It must be recognised that in the last few years, the states have
sought to expand their capital outlays somewhat. This has happened in
addition to the implementation of off-budget projects. As referred to earlier,
states had responded to their difficulties in generating resources for capital
projects by resorting to off-budget borrowings through commercial bonds of
state PSUs for projects (see also Chaudhury 2000). This continued for a few
65
years up to 2001-02 and thereabout, but thereafter, as some of the states failed
to honour their debt obligations, off-budget borrowings and hence the
associated outstanding guarantees have declined, from Rs 168,712 crore or 8.1
per cent of GDP at the end of March 2001 to Rs 166,116 crore or 7.2 per cent
at the end of March 2002 (RBI 2003c, p.763).
Developmental versus Non-Developmental
When both revenue and capital expenditures are combined, the
average annual growth has not only been higher but also accelerating in non-
development expenditure as compared with development expenditure in
successive periods specified above. Even during the latest reform period
when attempts have been made to contain the growth of expenditures, the
growth of non-development expenditure has remained at near 18 per cent
which has been the average annual growth rate in it since the early 1980s. On
the other hand, the growth of development expenditure has steadily
decelerated from 15.0 per cent per annum in the first phase to 13.1 per cent in
the second phase and to 11.2 per cent in the latest phase (earlier Table 14).
A disconcerting aspect of the Indian fiscal performance has thus been
the erosion in development momentum as reflected in a declining share of
developmental expenditure in total expenditure both at the centre and state
levels in the 1990s and the erosion has occurred both at the central and states’
levels (Table 25). As shown in Appendix Table 4, in the case of all states,
developmental expenditure under revenue account as percentage of GDP and
as a share in total revenue expenditure has receded in the recent period. As a
proportion of aggregate expenditure consisting of both revenue and capital
accounts also, development expenditure has experienced a steady fall from
about 70 per cent in the early 1990s to less than 64 per cent in 1997-98, but
thereafter, following the implementation of the Pay Commission
recommendations, there has occurred a precipitate fall and reached 57.1 per
cent in 2002-03 (BE); such an erosion in developmental expenditure has
occurred even as proportion of GDP (Appendix Table 6).
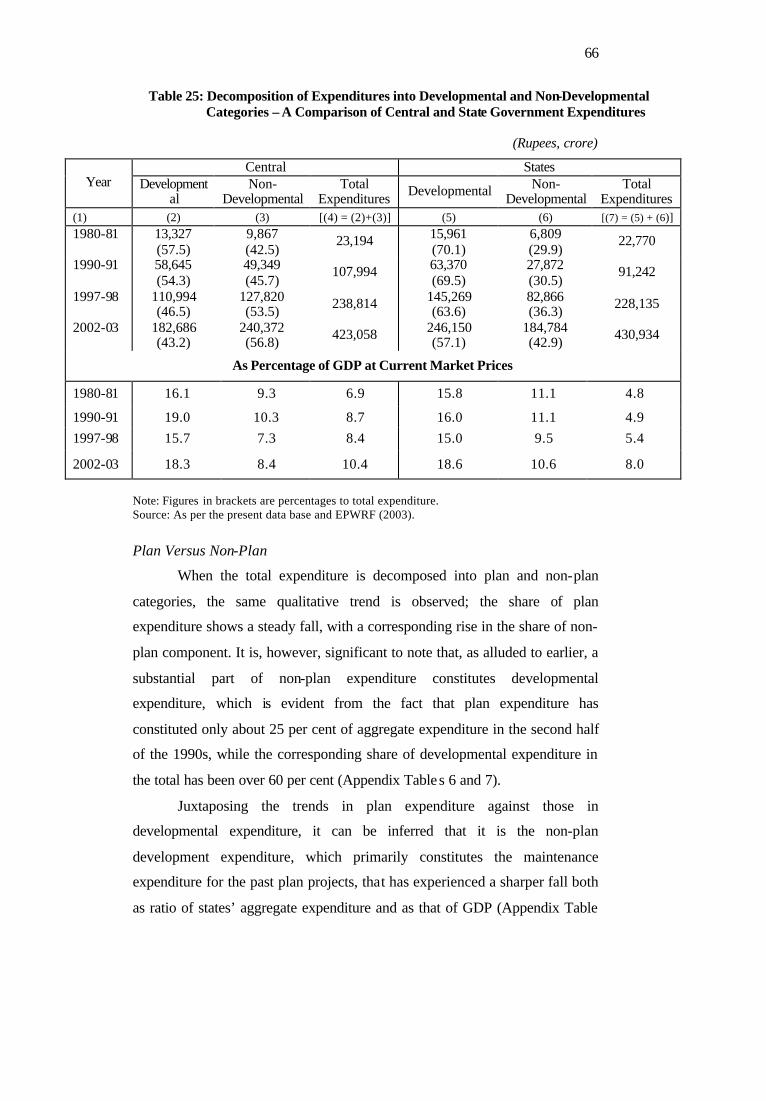
66
Table 25: Decomposition of Expenditures into Developmental and Non-Developmental Categories – A Comparison of Central and State Government Expenditures
(Rupees, crore)
Central States Year Development
al Non-
Developmental Total
Expenditures Developmental Non-Developmental
Total Expenditures
(1) (2) (3) [(4) = (2)+(3)] (5) (6) [(7) = (5) + (6)] 1980-81 13,327
(57.5) 9,867 (42.5)
23,194 15,961 (70.1)
6,809 (29.9)
22,770
1990-91 58,645 (54.3)
49,349 (45.7)
107,994 63,370 (69.5)
27,872 (30.5)
91,242
1997-98 110,994 (46.5)
127,820 (53.5) 238,814 145,269
(63.6) 82,866 (36.3) 228,135
2002-03 182,686 (43.2)
240,372 (56.8) 423,058 246,150
(57.1) 184,784 (42.9) 430,934
As Percentage of GDP at Current Market Prices
1980-81 16.1 9.3 6.9 15.8 11.1 4.8
1990-91 19.0 10.3 8.7 16.0 11.1 4.9
1997-98 15.7 7.3 8.4 15.0 9.5 5.4
2002-03 18.3 8.4 10.4 18.6 10.6 8.0
Note: Figures in brackets are percentages to total expenditure. Source: As per the present data base and EPWRF (2003).
Plan Versus Non-Plan
When the total expenditure is decomposed into plan and non-plan
categories, the same qualitative trend is observed; the share of plan
expenditure shows a steady fall, with a corresponding rise in the share of non-
plan component. It is, however, significant to note that, as alluded to earlier, a
substantial part of non-plan expenditure constitutes developmental
expenditure, which is evident from the fact that plan expenditure has
constituted only about 25 per cent of aggregate expenditure in the second half
of the 1990s, while the corresponding share of developmental expenditure in
the total has been over 60 per cent (Appendix Tables 6 and 7).
Juxtaposing the trends in plan expenditure against those in
developmental expenditure, it can be inferred that it is the non-plan
development expenditure, which primarily constitutes the maintenance
expenditure for the past plan projects, that has experienced a sharper fall both
as ratio of states’ aggregate expenditure and as that of GDP (Appendix Table
67
7). In the latest period after 1997-98 when the states have faced hard budget
constraints, it appears obvious that they have cut back on non-plan
development expenditure, that is, the continuing developmental and
maintenance expenditures. Between 1997-98 and 2002-03(BE), while plan
expenditure has risen by 80 per cent, non-plan development expenditure has
risen by 62 per cent, thus suggesting that the share of the latter category in
total developmental expenditure has been declining.
The ‘plan’ component under developmental expenditure constitutes only
about 40 per cent. There is a small (less than 2 per cent) component of ‘plan’
expenditure even under the non-development head, which is to upgrade the
administrative capabilities of some states and also to extend compensation and
assignments to local bodies (Appendix Table 7). Non-plan non-development
expenditure as percentage of GDP has been steadily increasing since the
middle of the 1980s. It galloped from a range of 0.7 per cent to 2.6 per cent
up to 1984-85 to a range of 3.4 per cent to 3.9 per cent in the second half of
the 1980s (Appendix Table 9). So did the total non-development expenditure
from 3.0 per cent in 1980-81 to 4 per cent of GDP in 1990-91 and further to
4.7 per cent in 1997-98, but thereafter, it exhibited a more rapid increase to
reach 6.5 per cent of GDP in 2002-03 (BE) (Appendix Table 6).
Economic and Social Services
The declining trend in developmental expenditure is found in both
revenue and capital expenditures (Appendix Tables 4 and 5). However, a
noteworthy aspect is that there has been a significant difference as between
‘social services’ and ‘economic servic es’, particularly under the revenue
heads. The sliding down of the developmental expenditure share has
essentially been due to ‘economic services’; its ratio to GDP has slipped from
over 5 per cent between the early 1980s as well as early 1990s to 4 per cent in
the latter part of the 1990s, whereas the share of ‘social services’ has generally
remained unchanged at a little over 5 per cent except for a fractional slippage
from it in the first half of the 1990s (Appendix Table 8). These do not include
small amounts of loans and advances of state governments under these two
sub-heads, in the range of 3 to 10 per cent (ibid).
68
More Detailed Disaggregation of State Expenditures
The data base created here has provided a diverse set of classifications of
states’ expenditures – revenue and capital accounts, developmental and non-
developmental, plan and non-plan - and each one of them sub-divided into
cross-classifications and other very minute details. Appendix Table 4 presents
the details of states’ revenue expenditures divided between developmental and
non-developmental expenditures, and developmental expenditures in turn
between ‘social services’ and ‘economic services’. There are 11 sub
categories of ‘social services’ and 9 sub-categories of ‘economic services’, for
which separate information is provided. Likewise, Appendix Table 5 provides
distribution of capital disbursements, again divided between developmental
and non-developmental outlays of a direct nature and loans and advances by
states for developmental and non-developmental purposes; there are also in
this appendix table details of internal debt discharge and repayment of loans to
the centre.
A more noteworthy aspect of the data base relates to the wide array of
sub-classifications in the following manner:
(a) the consolidation of revenue and capital disbursements so as to
produce detailed economic classifications such as, the division of
developmental and non-developmental expenditures into plan
and non-plan categories, which in turn are presented separately
under revenue and capital accounts (Appendix Tables 6 and 7);
(b) further division of development expenditures with details of
social and economic services and that of non-development
expenditure with those of interest payments, repayment of debt,
administrative services and pension expenditures, and non-
development expenditures under revenue and capital accounts
(Appendix Table 8); and
(c) the distribution of non-plan non-developmental expenditure
between ‘revenue’ (99 per cent) and capital (less than 1 per cent)
disbursements (Appendix Table 9).
69
These classifications provide a wide ranging sets of results regarding trends in
states’ expenditures and changes in the composition of expenditures.
First, the rising trend in states’ revenue expenditure as per cent of GDP
(from 10.3 per cent in 1980-81 to 13.2 per cent in 1991-92) was arrested in the
early 1990s. Thus, until 1997-98/1998-99 when the impact of central fifth pay
commission recommendations began to be felt, the states’ total revenue
expenditure as a ratio of GDP was gradually falling, from 13.2 per cent in
1991-92 to 12.2/12.3 per cent during the three-year period 1995-96 to 1997-
98, but it began to rise rapidly thereafter. Two factors which have contributed
to the bulk of the incremental revenue expenditures are: (i) administrative
services and pensions; and (ii) interest payments. As shown in Table 26 here,
about 44 per cent of incremental expenditure under the revenue account was
contributed by just the above two items during the recent years after 1997-98
as compared with the comparable incremental share of these two items at 34
per cent in the preceding seven-year period 1990-91 to 1997-98 and 26.4 per
cent in the decade of the 1980s. It should be noted that the expansion in
pension liabilities of the states after the fifth pay commission has been
phenomenal, that is, by 162 per cent from Rs 11,599 crore in 1997-98 to Rs
30,396 crore in 2002-03 (BE); this is even much higher than the rise of 76 per
cent from Rs 17,075 crore to Rs 30,100 crore under ‘administrative services’
during the same period (Appendix Table 8). Thus, in recent years, the burden
of adjustment has increasingly fallen on developmental expenditures in the
form of social and economic services. If about 67 per cent of the incremental
revenue expenditure in the decade of the 1980s was accounted for by
developmental expenditure, or about 57 per cent was so accounted for in the
period 1990-91 to 1997-98, the comparable proportion has fallen to just 46 per
cent in the latest period (Table 26). We should hasten to add, however, that
between 1990-91 to1997-98 when the growth of revenue expenditure was
being constrained under the impulse of economic reforms at the central
government level, the burden of adjustment had already begun to be felt by
developmental expenditure even at the states level.
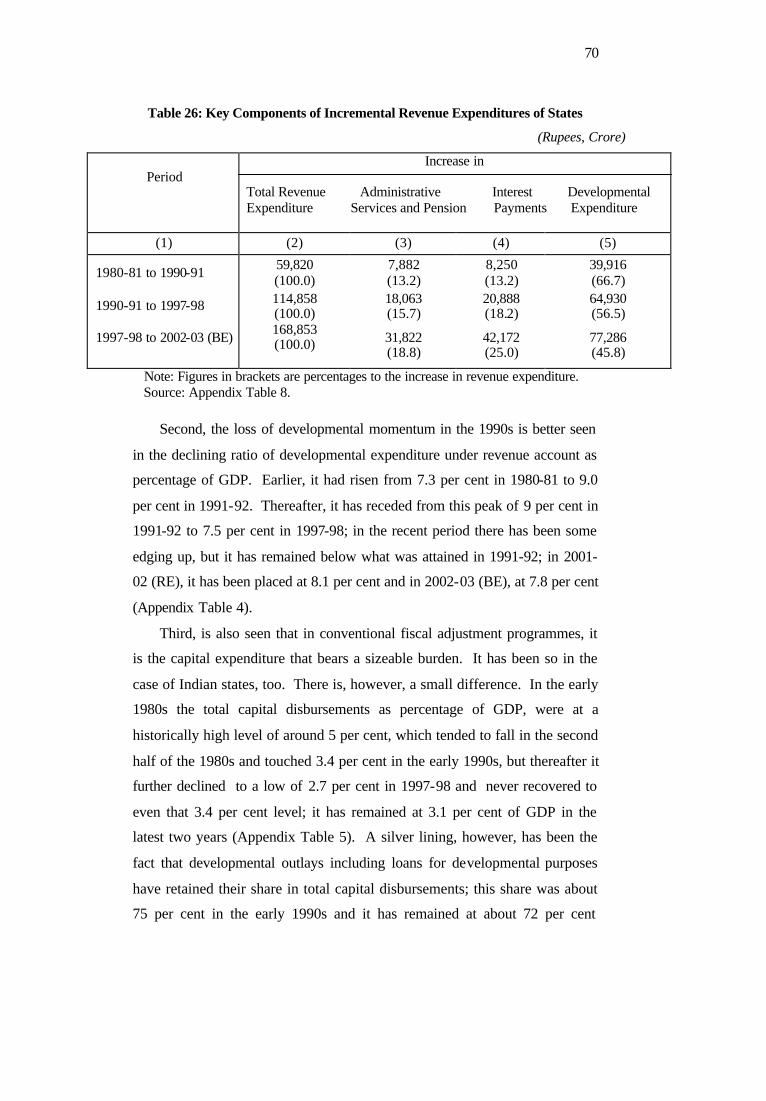
70
Table 26: Key Components of Incremental Revenue Expenditures of States
(Rupees, Crore)
Period
Increase in Total Revenue Administrative Interest Developmental Expenditure Services and Pension Payments Expenditure
(1) (2) (3) (4) (5)
1980-81 to 1990-91 59,820 (100.0)
7,882 (13.2)
8,250 (13.2)
39,916 (66.7)
1990-91 to 1997-98 114,858 (100.0)
18,063 (15.7)
20,888 (18.2)
64,930 (56.5)
1997-98 to 2002-03 (BE)
168,853 (100.0)
31,822 (18.8)
42,172 (25.0)
77,286 (45.8)
Note: Figures in brackets are percentages to the increase in revenue expenditure. Source: Appendix Table 8.
Second, the loss of developmental momentum in the 1990s is better seen
in the declining ratio of developmental expenditure under revenue account as
percentage of GDP. Earlier, it had risen from 7.3 per cent in 1980-81 to 9.0
per cent in 1991-92. Thereafter, it has receded from this peak of 9 per cent in
1991-92 to 7.5 per cent in 1997-98; in the recent period there has been some
edging up, but it has remained below what was attained in 1991-92; in 2001-
02 (RE), it has been placed at 8.1 per cent and in 2002-03 (BE), at 7.8 per cent
(Appendix Table 4).
Third, is also seen that in conventional fiscal adjustment programmes, it
is the capital expenditure that bears a sizeable burden. It has been so in the
case of Indian states, too. There is, however, a small difference. In the early
1980s the total capital disbursements as percentage of GDP, were at a
historically high level of around 5 per cent, which tended to fall in the second
half of the 1980s and touched 3.4 per cent in the early 1990s, but thereafter it
further declined to a low of 2.7 per cent in 1997-98 and never recovered to
even that 3.4 per cent level; it has remained at 3.1 per cent of GDP in the
latest two years (Appendix Table 5). A silver lining, however, has been the
fact that developmental outlays including loans for developmental purposes
have retained their share in total capital disbursements; this share was about
75 per cent in the early 1990s and it has remained at about 72 per cent
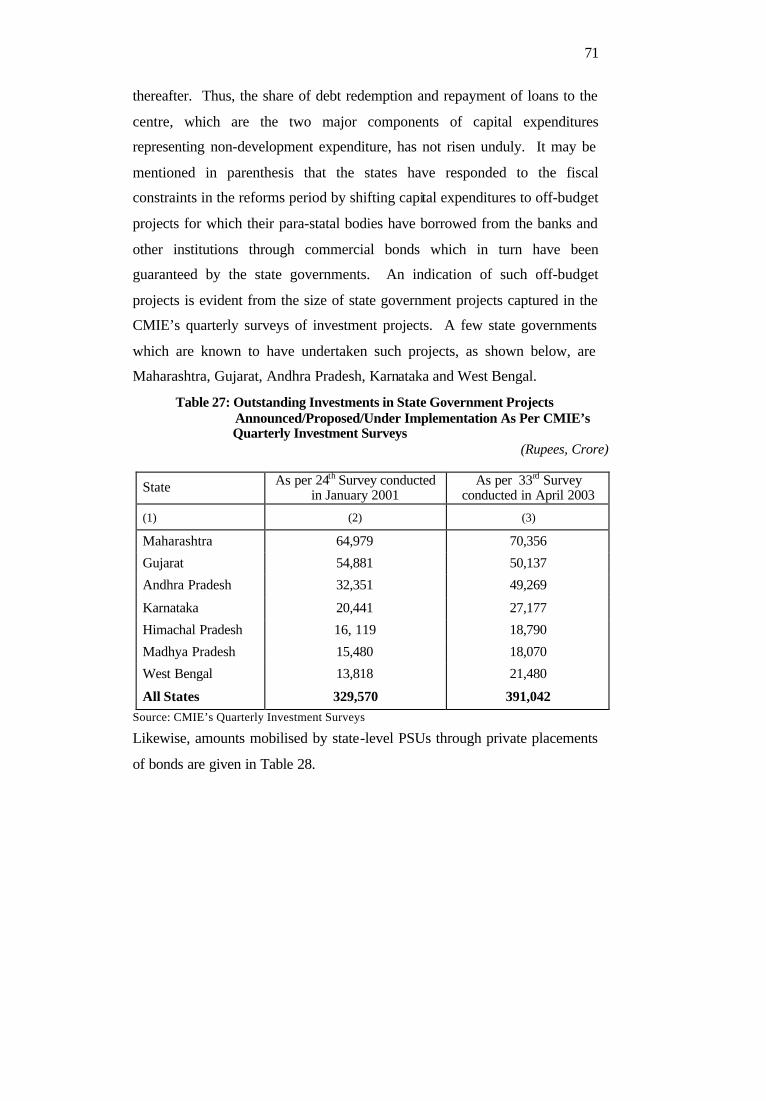
71
thereafter. Thus, the share of debt redemption and repayment of loans to the
centre, which are the two major components of capital expenditures
representing non-development expenditure, has not risen unduly. It may be
mentioned in parenthesis that the states have responded to the fiscal
constraints in the reforms period by shifting capital expenditures to off-budget
projects for which their para-statal bodies have borrowed from the banks and
other institutions through commercial bonds which in turn have been
guaranteed by the state governments. An indication of such off-budget
projects is evident from the size of state government projects captured in the
CMIE’s quarterly surveys of investment projects. A few state governments
which are known to have undertaken such projects, as shown below, are
Maharashtra, Gujarat, Andhra Pradesh, Karnataka and West Bengal.
Table 27: Outstanding Investments in State Government Projects Announced/Proposed/Under Implementation As Per CMIE’s
Quarterly Investment Surveys (Rupees, Crore)
State As per 24th Survey conducted in January 2001
As per 33rd Survey conducted in April 2003
(1) (2) (3)
Maharashtra 64,979 70,356
Gujarat 54,881 50,137
Andhra Pradesh 32,351 49,269
Karnataka 20,441 27,177
Himachal Pradesh 16, 119 18,790
Madhya Pradesh 15,480 18,070
West Bengal 13,818 21,480
All States 329,570 391,042 Source: CMIE’s Quarterly Investment Surveys
Likewise, amounts mobilised by state-level PSUs through private placements
of bonds are given in Table 28.
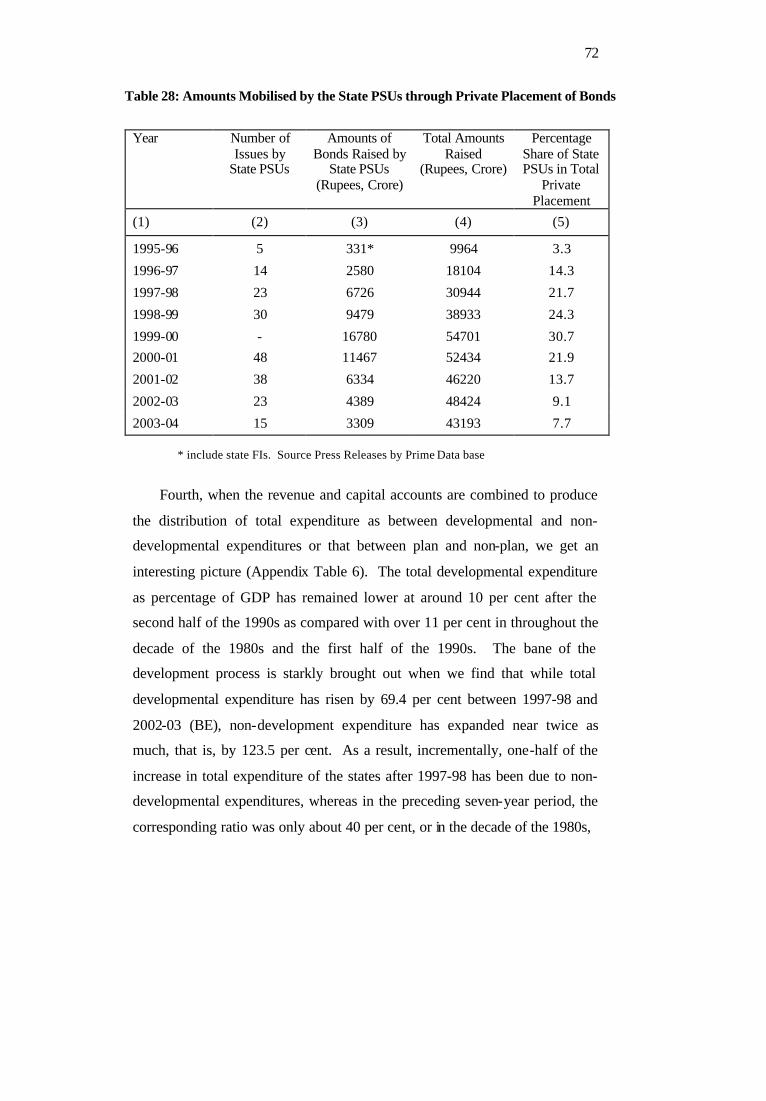
72
Table 28: Amounts Mobilised by the State PSUs through Private Placement of Bonds
Year Number of Issues by
State PSUs
Amounts of Bonds Raised by
State PSUs (Rupees, Crore)
Total Amounts Raised
(Rupees, Crore)
Percentage Share of State PSUs in Total
Private Placement
(1) (2) (3) (4) (5)
1995-96 5 331* 9964 3.3
1996-97 14 2580 18104 14.3
1997-98 23 6726 30944 21.7
1998-99 30 9479 38933 24.3
1999-00 - 16780 54701 30.7
2000-01 48 11467 52434 21.9
2001-02 38 6334 46220 13.7
2002-03 23 4389 48424 9.1
2003-04 15 3309 43193 7.7
* include state FIs. Source Press Releases by Prime Data base
Fourth, when the revenue and capital accounts are combined to produce
the distribution of total expenditure as between developmental and non-
developmental expenditures or that between plan and non-plan, we get an
interesting picture (Appendix Table 6). The total developmental expenditure
as percentage of GDP has remained lower at around 10 per cent after the
second half of the 1990s as compared with over 11 per cent in throughout the
decade of the 1980s and the first half of the 1990s. The bane of the
development process is starkly brought out when we find that while total
developmental expenditure has risen by 69.4 per cent between 1997-98 and
2002-03 (BE), non-development expenditure has expanded near twice as
much, that is, by 123.5 per cent. As a result, incrementally, one-half of the
increase in total expenditure of the states after 1997-98 has been due to non-
developmental expenditures, whereas in the preceding seven-year period, the
corresponding ratio was only about 40 per cent, or in the decade of the 1980s,
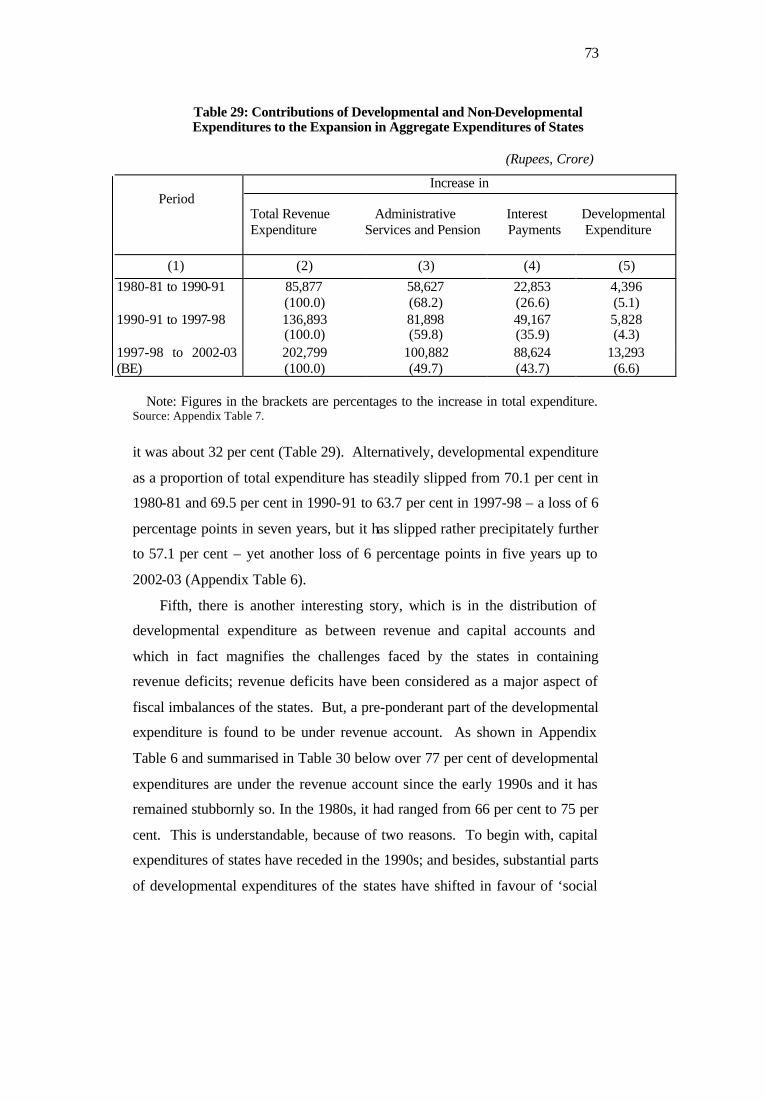
73
Table 29: Contributions of Developmental and Non-Developmental Expenditures to the Expansion in Aggregate Expenditures of States
(Rupees, Crore)
Note: Figures in the brackets are percentages to the increase in total expenditure. Source: Appendix Table 7.
it was about 32 per cent (Table 29). Alternatively, developmental expenditure
as a proportion of total expenditure has steadily slipped from 70.1 per cent in
1980-81 and 69.5 per cent in 1990-91 to 63.7 per cent in 1997-98 – a loss of 6
percentage points in seven years, but it has slipped rather precipitately further
to 57.1 per cent – yet another loss of 6 percentage points in five years up to
2002-03 (Appendix Table 6).
Fifth, there is another interesting story, which is in the distribution of
developmental expenditure as between revenue and capital accounts and
which in fact magnifies the challenges faced by the states in containing
revenue deficits; revenue deficits have been considered as a major aspect of
fiscal imbalances of the states. But, a pre-ponderant part of the developmental
expenditure is found to be under revenue account. As shown in Appendix
Table 6 and summarised in Table 30 below over 77 per cent of developmental
expenditures are under the revenue account since the early 1990s and it has
remained stubbornly so. In the 1980s, it had ranged from 66 per cent to 75 per
cent. This is understandable, because of two reasons. To begin with, capital
expenditures of states have receded in the 1990s; and besides, substantial parts
of developmental expenditures of the states have shifted in favour of ‘social
Period
Increase in Total Revenue Administrative Interest Developmental Expenditure Services and Pension Payments Expenditure
(1) (2) (3) (4) (5)
1980-81 to 1990-91 85,877 (100.0)
58,627 (68.2)
22,853 (26.6)
4,396 (5.1)
1990-91 to 1997-98 136,893 (100.0)
81,898 (59.8)
49,167 (35.9)
5,828 (4.3)
1997-98 to 2002-03 (BE)
202,799 (100.0)
100,882 (49.7)
88,624 (43.7)
13,293 (6.6)
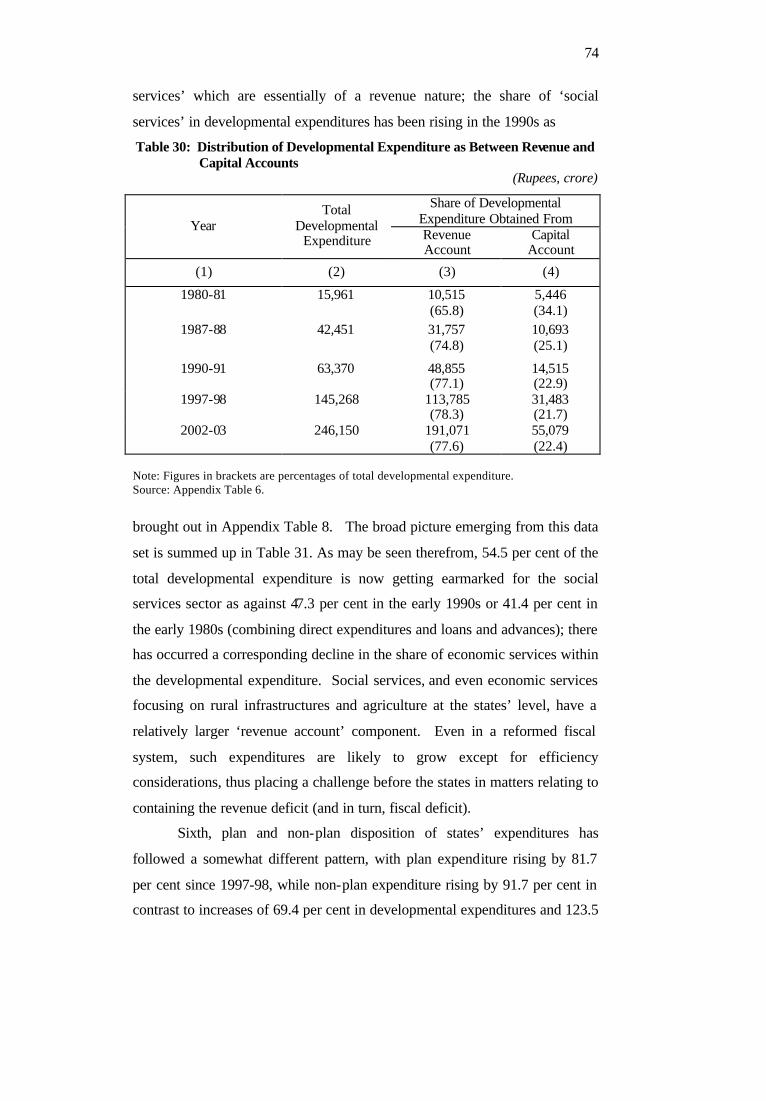
74
services’ which are essentially of a revenue nature; the share of ‘social
services’ in developmental expenditures has been rising in the 1990s as
Table 30: Distribution of Developmental Expenditure as Between Revenue and Capital Accounts
(Rupees, crore)
Share of Developmental Expenditure Obtained From Year
Total Developmental
Expenditure Revenue Account
Capital Account
(1) (2) (3) (4)
1980-81 15,961 10,515 (65.8)
5,446 (34.1)
1987-88 42,451 31,757 (74.8)
10,693 (25.1)
1990-91 63,370 48,855 (77.1)
14,515 (22.9)
1997-98 145,268 113,785 (78.3)
31,483 (21.7)
2002-03 246,150 191,071 (77.6)
55,079 (22.4)
Note: Figures in brackets are percentages of total developmental expenditure. Source: Appendix Table 6.
brought out in Appendix Table 8. The broad picture emerging from this data
set is summed up in Table 31. As may be seen therefrom, 54.5 per cent of the
total developmental expenditure is now getting earmarked for the social
services sector as against 47.3 per cent in the early 1990s or 41.4 per cent in
the early 1980s (combining direct expenditures and loans and advances); there
has occurred a corresponding decline in the share of economic services within
the developmental expenditure. Social services, and even economic services
focusing on rural infrastructures and agriculture at the states’ level, have a
relatively larger ‘revenue account’ component. Even in a reformed fiscal
system, such expenditures are likely to grow except for efficiency
considerations, thus placing a challenge before the states in matters relating to
containing the revenue deficit (and in turn, fiscal deficit).
Sixth, plan and non-plan disposition of states’ expenditures has
followed a somewhat different pattern, with plan expenditure rising by 81.7
per cent since 1997-98, while non-plan expenditure rising by 91.7 per cent in
contrast to increases of 69.4 per cent in developmental expenditures and 123.5
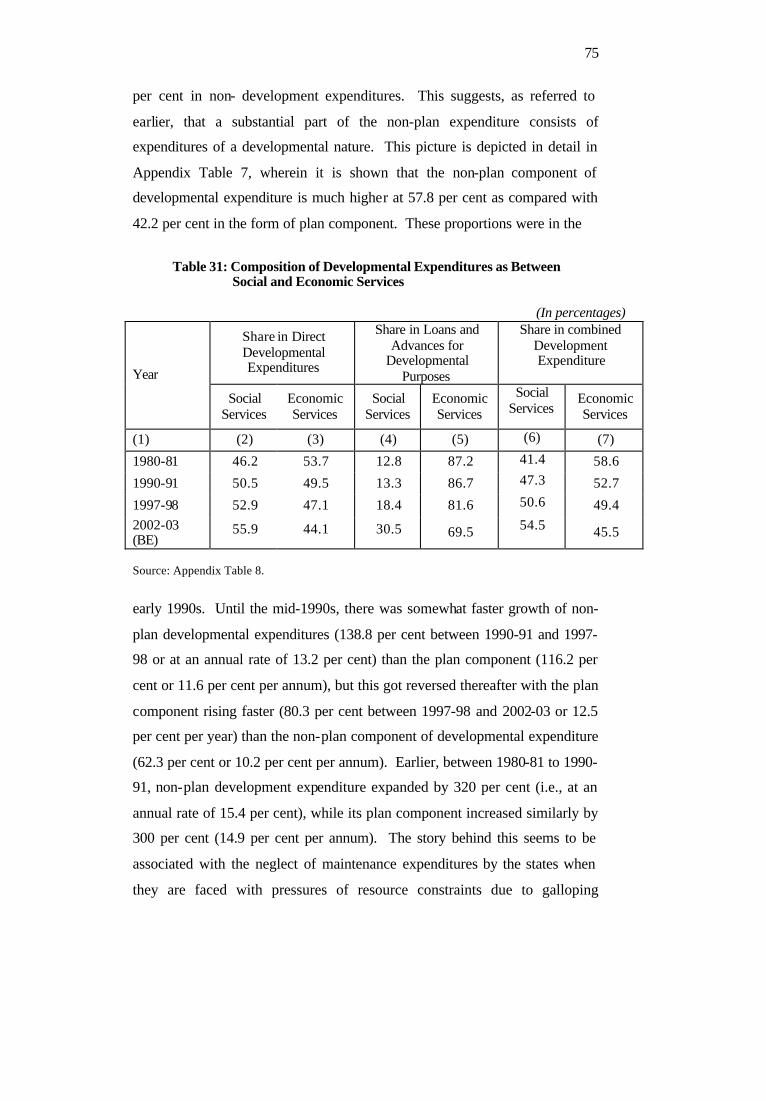
75
per cent in non- development expenditures. This suggests, as referred to
earlier, that a substantial part of the non-plan expenditure consists of
expenditures of a developmental nature. This picture is depicted in detail in
Appendix Table 7, wherein it is shown that the non-plan component of
developmental expenditure is much higher at 57.8 per cent as compared with
42.2 per cent in the form of plan component. These proportions were in the
Table 31: Composition of Developmental Expenditures as Between
Social and Economic Services
(In percentages)
Share in Direct Developmental Expenditures
Share in Loans and Advances for
Developmental Purposes
Share in combined Development Expenditure
Year
Social Services
Economic Services
Social Services
Economic Services
Social Services
Economic Services
(1) (2) (3) (4) (5) (6) (7)
1980-81 46.2 53.7 12.8 87.2 41.4 58.6
1990-91 50.5 49.5 13.3 86.7 47.3 52.7
1997-98 52.9 47.1 18.4 81.6 50.6 49.4 2002-03 (BE)
55.9 44.1 30.5 69.5 54.5 45.5
Source: Appendix Table 8.
early 1990s. Until the mid-1990s, there was somewhat faster growth of non-
plan developmental expenditures (138.8 per cent between 1990-91 and 1997-
98 or at an annual rate of 13.2 per cent) than the plan component (116.2 per
cent or 11.6 per cent per annum), but this got reversed thereafter with the plan
component rising faster (80.3 per cent between 1997-98 and 2002-03 or 12.5
per cent per year) than the non-plan component of developmental expenditure
(62.3 per cent or 10.2 per cent per annum). Earlier, between 1980-81 to 1990-
91, non-plan development expenditure expanded by 320 per cent (i.e., at an
annual rate of 15.4 per cent), while its plan component increased similarly by
300 per cent (14.9 per cent per annum). The story behind this seems to be
associated with the neglect of maintenance expenditures by the states when
they are faced with pressures of resource constraints due to galloping
76
increases in pay and allowances and pension liabilities as well as interest
burden – a severe situation faced in the second half of the 1990s.
The above is also evident from the fact that there has been a significant
difference as between economic and social services expenditures insofar as
their distribution between plan and non-plan categories is concerned. In social
services, non-plan expenditures of the states had constituted about 75 per cent
of their total social services expenditures in the early 1990s but due to
financial stringency at the states’ level, the funds earmarked for social services
as part of non-plan expenditures have been relatively less than plan
expenditures; as a result, by 2002-03 (BE), the share of non-plan expenditure
in social services has receded to 70.3 per cent. Overall, this pattern has been
consistent in social services expenditures but not so in plan and non-plan
expenditures under economic services. In the latter respect, in years of
relative financial stringency as in the early 1990s, the non-plan expenditures
for economic services were curtailed and hence they remained lower than plan
expenditures. This happened up to 1992-93 but thereafter, following the
increased release of central assistance beginning with 1993-94 but particularly
after the Ninth Finance Commission’s report began to be implemented in
1995-96, the states’ non-plan expenditures for economic services experienced
a substantial increase, which resulted in non-plan expenditure outstripping
plan expenditures for economic services at the states’ level until 2000-01.
Thereafter, the process of reforms in expenditures began as a result of the
implementation of the programme of monitorable fiscal reforms as
recommended by the Eleventh Finance Commission (2000-01 to 2004-05) and
hence something similar to what happened to the central finances immediately
after the fiscal adjustment programme began to be implemented in the early
1990s. To quote an official document in this respect:
“For many years, the growth of non-Plan expenditure has been faster
than the growth of Plan expenditure. Non-Plan expenditure, which
was Rs 13,062 crore in 1980-81, increased by approximate ly five
times to Rs 65,388 crore in 1989-90, against an increase of three times
in Plan expenditure over the same period. During 1990-91, a further
increase of 17.7 per cent was recorded in non-Plan expenditure,
77
against 3.1 per cent in Plan expenditure. However, with the
introduction of reforms this trend has been reversed. During the first
two years of reform process, the increase in non-Plan expenditure was
only 11.7 per cent against an increase of 29.2 per cent in Plan
expenditure. As per the revised estimates of 1993-94, the growth in
Plan expenditure at 25.6 per cent has been almost double the growth of
13.8 per cent in non-Plan expenditure. A check on the fast growth of
non-Plan expenditure, has been possible as a result of a number of
steps taken by the Government. These include reduction of posts at
various levels, overall cut on consumption of petrol/diesel, reduction
in expenditure on telephone and restrictions on purchases of additional
vehicles. The strength of the staff of the Central Government, which
was growing over the years, showed an estimated decline of about fifty
thousand from 39.8 lakh in March 1992 to 39.49 lakh in March, 1994”
[Government of India (1995): Economic Survey 1994-95, p.16].
It is significant that in the case of the states, such a process began only around
a decade later in 2000-01.
Seventh, if overall development expenditure as a proportion of states’
total expenditure has steadily receded since the beginning of the 1990s, it is
the ‘economic services’ expenditure which has faced this slide. Such
‘economic services’ expenditure as percentage of total development
expenditure has steadily fallen from 47.8 per cent in 1991-92 to 41 per cent
during the latest two years; in contrast to it, the expenditure on ‘social
services’ has experienced a corresponding rise from 43.9 per cent to 52.8 per
cent during the same period. In the 1980s, both economic and social service
expenditures had shown steady increases, but increases in the share of “social
services” had been much steeper, from 39.5 per cent in 1980-81 to 46.1 per
cent in 1990-91. The share of ‘loans and advances’ for developmental
purposes has persistently fallen since the early 1980s, from 14.5 per cent in
1980-81 to 8.8 per cent in 1990-91 and further to 5.5 per cent of total
developmental expenditure (Appendix Table 8). Sectorally, within ‘economic
services’, there has occurred a noticeable shift in emphasis from energy,
irrigation and flood control and transport and communications to rural
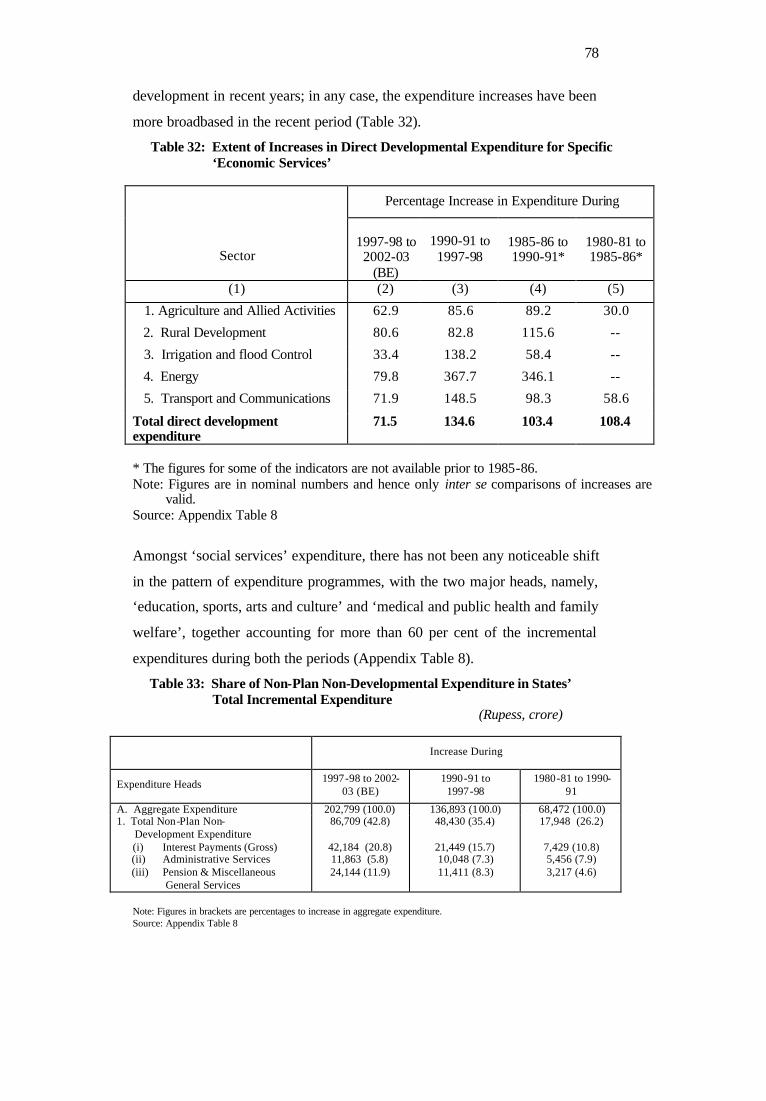
78
development in recent years; in any case, the expenditure increases have been
more broadbased in the recent period (Table 32).
Table 32: Extent of Increases in Direct Developmental Expenditure for Specific ‘Economic Services’
Percentage Increase in Expenditure During
Sector
1997-98 to 2002-03
(BE)
1990-91 to 1997-98
1985-86 to 1990-91*
1980-81 to 1985-86*
(1) (2) (3) (4) (5)
1. Agriculture and Allied Activities 62.9 85.6 89.2 30.0
2. Rural Development 80.6 82.8 115.6 --
3. Irrigation and flood Control 33.4 138.2 58.4 --
4. Energy 79.8 367.7 346.1 --
5. Transport and Communications 71.9 148.5 98.3 58.6
Total direct development expenditure
71.5 134.6 103.4 108.4
* The figures for some of the indicators are not available prior to 1985-86. Note: Figures are in nominal numbers and hence only inter se comparisons of increases are
valid. Source: Appendix Table 8
Amongst ‘social services’ expenditure, there has not been any noticeable shift
in the pattern of expenditure programmes, with the two major heads, namely,
‘education, sports, arts and culture’ and ‘medical and public health and family
welfare’, together accounting for more than 60 per cent of the incremental
expenditures during both the periods (Appendix Table 8).
Table 33: Share of Non-Plan Non-Developmental Expenditure in States’ Total Incremental Expenditure (Rupess, crore)
Increase During
Expenditure Heads 1997-98 to 2002-03 (BE)
1990-91 to 1997-98
1980-81 to 1990-91
A. Aggregate Expenditure 202,799 (100.0) 136,893 (100.0) 68,472 (100.0) 1. Total Non-Plan Non- Development Expenditure
(i) Interest Payments (Gross) (ii) Administrative Services (iii) Pension & Miscellaneous
General Services
86,709 (42.8)
42,184 (20.8) 11,863 (5.8) 24,144 (11.9)
48,430 (35.4)
21,449 (15.7) 10,048 (7.3) 11,411 (8.3)
17,948 (26.2)
7,429 (10.8) 5,456 (7.9) 3,217 (4.6)
Note: Figures in brackets are percentages to increase in aggregate expenditure. Source: Appendix Table 8
79
Finally, about 43 per cent of the incremental aggregate expenditures of
states have been absorbed by non-plan non-development expenditure in the
latest period 1997-98 to 2002-03(BE), in which three major heads of
expenditure, namely, interest payments, administrative services and pension
and miscellaneous general services, accounted for the bulk – about 90 per cent
of non-plan non-development expenditure or nearly 40 per cent of the increase
in aggregate expenditure (Table 33). What is also striking is the rising
proportion of non-plan non-development expenditure in the incremental
aggregate expenditure, from 26 per cent in the decade of the 1980s to 35 per
cent during 1990-91 to 1997-98 and further to about 43 per cent during 1997-
98 to 2002-03 (BE).
80
X
Inter-State Differences in Fiscal Performance
The picture of state finances described so far based on aggregate picture
of all-states data obviously hides the vast inter-state differences in fiscal
performance. The ten special category states classified as such by the Finance
Commissions due to their hilly terrains and overall economic backwardness –
eight north-eastern states of Arunachal Pradesh, Assam, Manipur, Meghalaya,
Mizoram, Nagaland, Sikkim and Tripura as well as Jammu and Kashmir and
Himachal Pradesh - have exhibited unusual fiscal indicators such as overall
revenue surpluses and low levels of fiscal deficits because of relatively high
levels of plan and non-plan grants that they have enjoyed from the central
government. However, it must be recognised at the outset that statistically, the
fiscal indicators of these ten special category states cannot overtly influence
the average picture for all states because the ten states together constitute a
small fraction of the all-states total – about 5.37 per cent in terms of
population (2001), 3.82 per cent in terms of gross state domestic product
(GSDP) (2000-01) and 8.5 per cent in terms of states’ aggregate expenditures
for recent years. While these ten states thus stand apart though miniscule in
their overall effect on the states’ fiscal scene, it is the considerable diversity in
fiscal performances amongst the other major states that is primarily the story
of this section. Nevertheless, it is worth noting at this stage a few key features
of the finances of these special category states.
Special Category States
Almost all special category states had enjoyed revenue surpluses and
relatively low levels of fiscal deficits until 1997-98 (Appendix Tables 11 and
12). Thereafter, with the rapid increases in the relative sizes of non-
developmental expenditures of these states (Appendix Table 18), the surplus
situation has given way to allround revenue deficits and also sizeable
increases in gross fiscal deficits as percentages of their respective SDP during
1998-99 to 2002-03 (BE) (Table 34). Their actual revenue gaps as well as
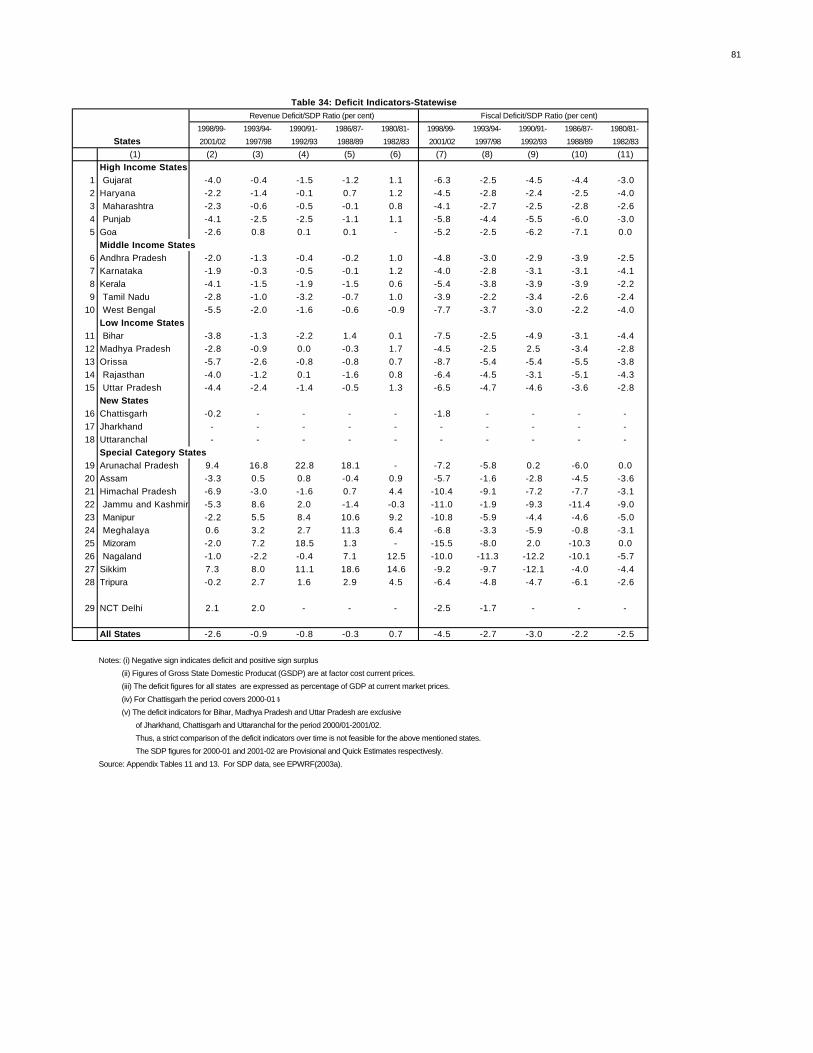
81
1998/99- 1993/94- 1990/91- 1986/87- 1980/81- 1998/99- 1993/94- 1990/91- 1986/87- 1980/81-
States 2001/02 1997/98 1992/93 1988/89 1982/83 2001/02 1997/98 1992/93 1988/89 1982/83
(1) (2) (3) (4) (5) (6) (7) (8) (9) (10) (11)
High Income States1 Gujarat -4.0 -0.4 -1.5 -1.2 1.1 -6.3 -2.5 -4.5 -4.4 -3.0
2 Haryana -2.2 -1.4 -0.1 0.7 1.2 -4.5 -2.8 -2.4 -2.5 -4.0
3 Maharashtra -2.3 -0.6 -0.5 -0.1 0.8 -4.1 -2.7 -2.5 -2.8 -2.6
4 Punjab -4.1 -2.5 -2.5 -1.1 1.1 -5.8 -4.4 -5.5 -6.0 -3.0
5 Goa -2.6 0.8 0.1 0.1 - -5.2 -2.5 -6.2 -7.1 0.0
Middle Income States6 Andhra Pradesh -2.0 -1.3 -0.4 -0.2 1.0 -4.8 -3.0 -2.9 -3.9 -2.5
7 Karnataka -1.9 -0.3 -0.5 -0.1 1.2 -4.0 -2.8 -3.1 -3.1 -4.1
8 Kerala -4.1 -1.5 -1.9 -1.5 0.6 -5.4 -3.8 -3.9 -3.9 -2.2
9 Tamil Nadu -2.8 -1.0 -3.2 -0.7 1.0 -3.9 -2.2 -3.4 -2.6 -2.4
10 West Bengal -5.5 -2.0 -1.6 -0.6 -0.9 -7.7 -3.7 -3.0 -2.2 -4.0
Low Income States11 Bihar -3.8 -1.3 -2.2 1.4 0.1 -7.5 -2.5 -4.9 -3.1 -4.4
12 Madhya Pradesh -2.8 -0.9 0.0 -0.3 1.7 -4.5 -2.5 2.5 -3.4 -2.8
13 Orissa -5.7 -2.6 -0.8 -0.8 0.7 -8.7 -5.4 -5.4 -5.5 -3.8
14 Rajasthan -4.0 -1.2 0.1 -1.6 0.8 -6.4 -4.5 -3.1 -5.1 -4.3
15 Uttar Pradesh -4.4 -2.4 -1.4 -0.5 1.3 -6.5 -4.7 -4.6 -3.6 -2.8
New States16 Chattisgarh -0.2 - - - - -1.8 - - - -
17 Jharkhand - - - - - - - - - -
18 Uttaranchal - - - - - - - - - -
Special Category States19 Arunachal Pradesh 9.4 16.8 22.8 18.1 - -7.2 -5.8 0.2 -6.0 0.0
20 Assam -3.3 0.5 0.8 -0.4 0.9 -5.7 -1.6 -2.8 -4.5 -3.6
21 Himachal Pradesh -6.9 -3.0 -1.6 0.7 4.4 -10.4 -9.1 -7.2 -7.7 -3.1
22 Jammu and Kashmir -5.3 8.6 2.0 -1.4 -0.3 -11.0 -1.9 -9.3 -11.4 -9.0
23 Manipur -2.2 5.5 8.4 10.6 9.2 -10.8 -5.9 -4.4 -4.6 -5.0
24 Meghalaya 0.6 3.2 2.7 11.3 6.4 -6.8 -3.3 -5.9 -0.8 -3.1
25 Mizoram -2.0 7.2 18.5 1.3 - -15.5 -8.0 2.0 -10.3 0.0
26 Nagaland -1.0 -2.2 -0.4 7.1 12.5 -10.0 -11.3 -12.2 -10.1 -5.7
27 Sikkim 7.3 8.0 11.1 18.6 14.6 -9.2 -9.7 -12.1 -4.0 -4.4
28 Tripura -0.2 2.7 1.6 2.9 4.5 -6.4 -4.8 -4.7 -6.1 -2.6
29 NCT Delhi 2.1 2.0 - - - -2.5 -1.7 - - -
All States -2.6 -0.9 -0.8 -0.3 0.7 -4.5 -2.7 -3.0 -2.2 -2.5
Notes: (i) Negative sign indicates deficit and positive sign surplus
(ii) Figures of Gross State Domestic Producat (GSDP) are at factor cost current prices.
(iii) The deficit figures for all states are expressed as percentage of GDP at current market prices.
(iv) For Chattisgarh the period covers 2000-01 to 2001-02
(v) The deficit indicators for Bihar, Madhya Pradesh and Uttar Pradesh are exclusive
of Jharkhand, Chattisgarh and Uttaranchal for the period 2000/01-2001/02.
Thus, a strict comparison of the deficit indicators over time is not feasible for the above mentioned states.
The SDP figures for 2000-01 and 2001-02 are Provisional and Quick Estimates respectivesly.
Source: Appendix Tables 11 and 13. For SDP data, see EPWRF(2003a).
Table 34: Deficit Indicators-Statewise Revenue Deficit/SDP Ratio (per cent) Fiscal Deficit/SDP Ratio (per cent)
82
borrowing requirements are met by grants from the centre (Appendix Table
24). As a result, their total revenue receipts and expenditures are far out of
proportion to their gross state domestic product (GSDP) - ranging from 33 per
cent to 67 per cent, whereas the average for all the states is in the range of 11
to 13 per cent.
The following observations contained in the Report of the Eleventh
Finance Commission (2000) sums up the position of special category states
and explain the reasons for the recent changes in their fiscal structures:
“Out of 25 states currently forming the Indian Union, 10 are grouped
under a “special category “for various purposes, particularly plan
financing. Unlike the general category States, States of the special
category get Central plan assistance for their plans in the form of 90 per
cent grants and only 10 per cent as loan. Such special consideration is
given to this category of States presumably in view of their weak
economic bases. Their own revenue sources meet on an average a small
percentage of their revenue expenditure. The bulk of their revenues come
from the Centre. Because of their weak revenue base, all the special
category States have large deficits on their non-Plan revenue account
before devolution. With 90 per cent of Central assistance for the State
Plans in the form of grants, the revenue budgets of the States are left with
sizeable surpluses. Even so, all the special category States have large
fiscal deficits. Even with massive infusion of Central funds, the finances
of these States remain under acute stress with fiscal deficits running at
over 10 per cent of their GSDP in some cases. Evidently, the system of
financing of the expenditure of these States needs a fundamental
restructuring. In our view, such restructuring should proceed on the
following lines:
(i) The non-plan revenue gap of these States assessed on the basis of
norms relevant in their case after taking into account their share
in Central taxes should be met out of Finance Commission
grants. There should be no need for any Plan grant to meet these
gaps.
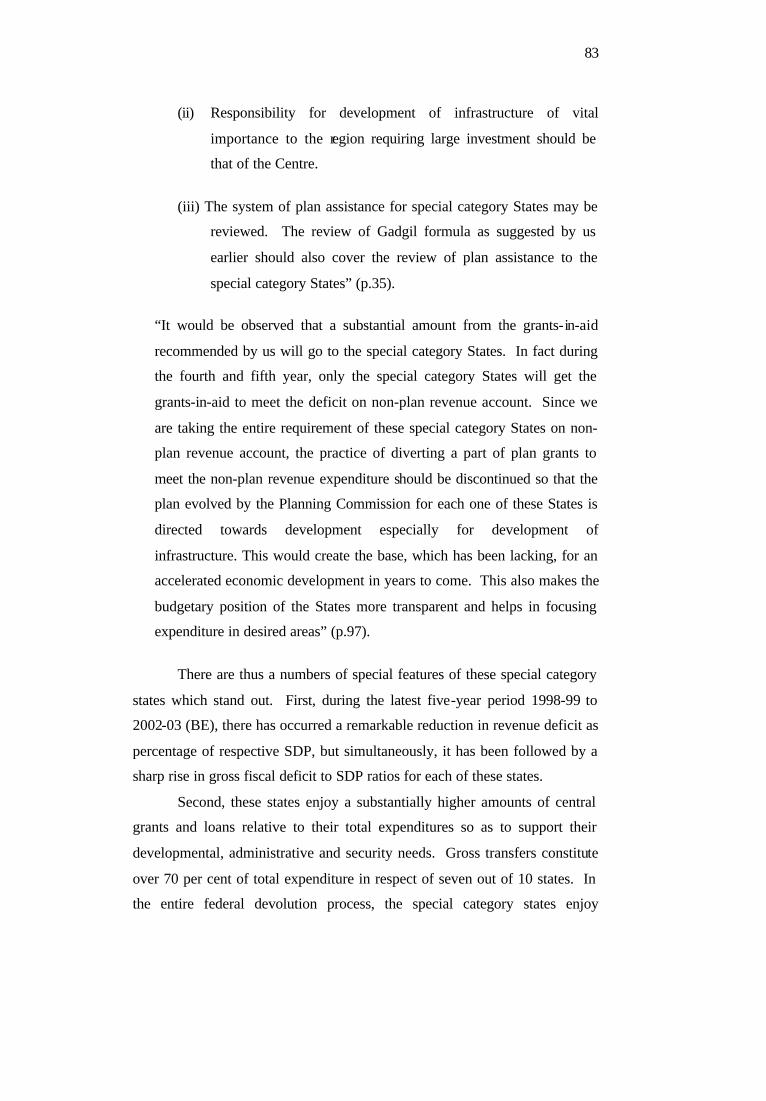
83
(ii) Responsibility for development of infrastructure of vital
importance to the region requiring large investment should be
that of the Centre.
(iii) The system of plan assistance for special category States may be
reviewed. The review of Gadgil formula as suggested by us
earlier should also cover the review of plan assistance to the
special category States” (p.35).
“It would be observed that a substantial amount from the grants-in-aid
recommended by us will go to the special category States. In fact during
the fourth and fifth year, only the special category States will get the
grants-in-aid to meet the deficit on non-plan revenue account. Since we
are taking the entire requirement of these special category States on non-
plan revenue account, the practice of diverting a part of plan grants to
meet the non-plan revenue expenditure should be discontinued so that the
plan evolved by the Planning Commission for each one of these States is
directed towards development especially for development of
infrastructure. This would create the base, which has been lacking, for an
accelerated economic development in years to come. This also makes the
budgetary position of the States more transparent and helps in focusing
expenditure in desired areas” (p.97).
There are thus a numbers of special features of these special category
states which stand out. First, during the latest five-year period 1998-99 to
2002-03 (BE), there has occurred a remarkable reduction in revenue deficit as
percentage of respective SDP, but simultaneously, it has been followed by a
sharp rise in gross fiscal deficit to SDP ratios for each of these states.
Second, these states enjoy a substantially higher amounts of central
grants and loans relative to their total expenditures so as to support their
developmental, administrative and security needs. Gross transfers constitute
over 70 per cent of total expenditure in respect of seven out of 10 states. In
the entire federal devolution process, the special category states enjoy
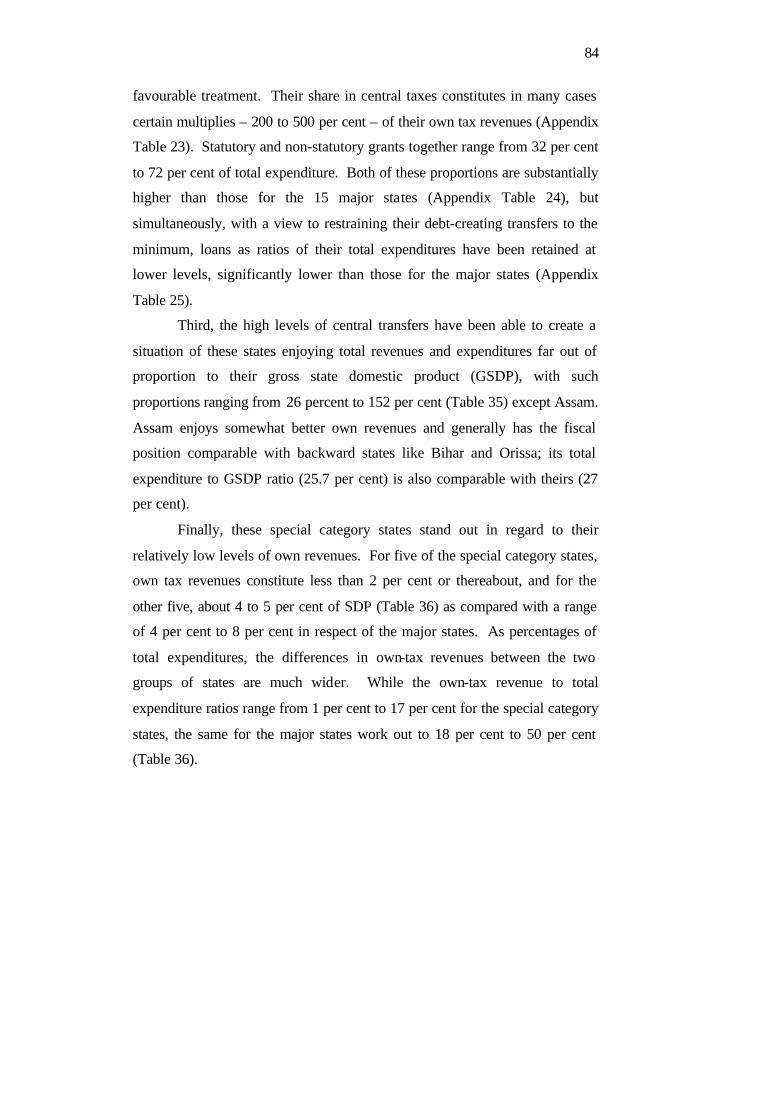
84
favourable treatment. Their share in central taxes constitutes in many cases
certain multiplies – 200 to 500 per cent – of their own tax revenues (Appendix
Table 23). Statutory and non-statutory grants together range from 32 per cent
to 72 per cent of total expenditure. Both of these proportions are substantially
higher than those for the 15 major states (Appendix Table 24), but
simultaneously, with a view to restraining their debt-creating transfers to the
minimum, loans as ratios of their total expenditures have been retained at
lower levels, significantly lower than those for the major states (Appendix
Table 25).
Third, the high levels of central transfers have been able to create a
situation of these states enjoying total revenues and expenditures far out of
proportion to their gross state domestic product (GSDP), with such
proportions ranging from 26 percent to 152 per cent (Table 35) except Assam.
Assam enjoys somewhat better own revenues and generally has the fiscal
position comparable with backward states like Bihar and Orissa; its total
expenditure to GSDP ratio (25.7 per cent) is also comparable with theirs (27
per cent).
Finally, these special category states stand out in regard to their
relatively low levels of own revenues. For five of the special category states,
own tax revenues constitute less than 2 per cent or thereabout, and for the
other five, about 4 to 5 per cent of SDP (Table 36) as compared with a range
of 4 per cent to 8 per cent in respect of the major states. As percentages of
total expenditures, the differences in own-tax revenues between the two
groups of states are much wider. While the own-tax revenue to total
expenditure ratios range from 1 per cent to 17 per cent for the special category
states, the same for the major states work out to 18 per cent to 50 per cent
(Table 36).
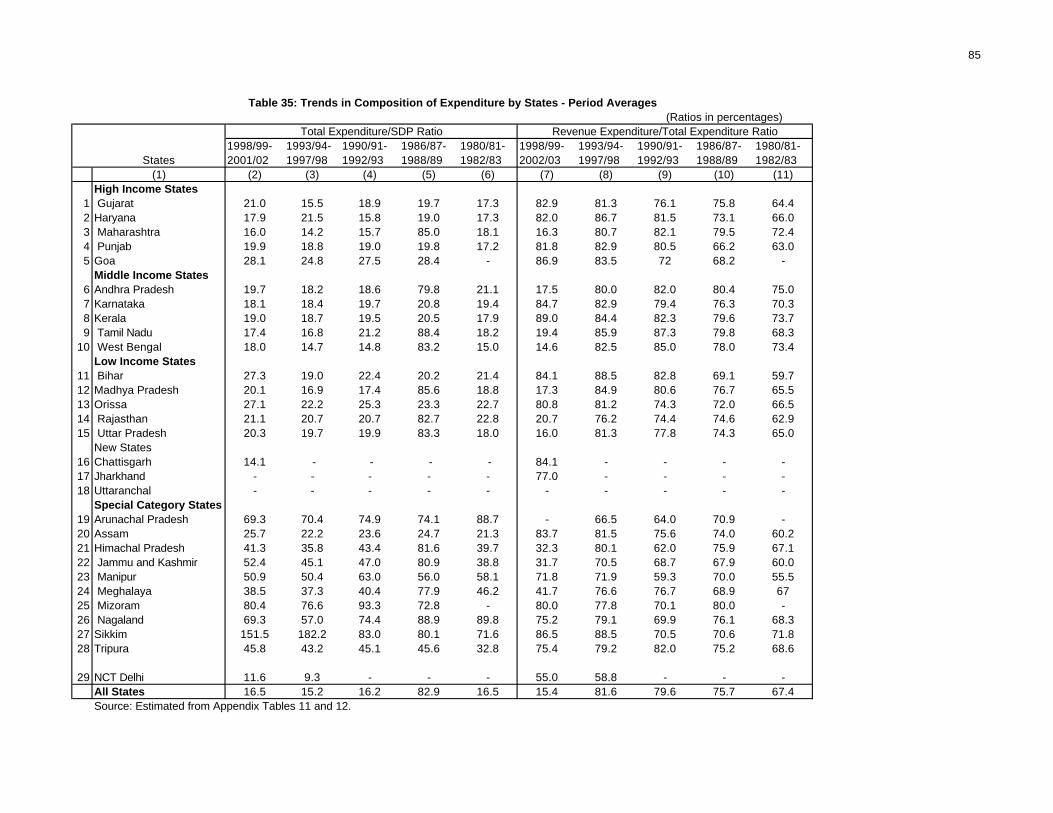
85
(Ratios in percentages)
1998/99- 1993/94- 1990/91- 1986/87- 1980/81- 1998/99- 1993/94- 1990/91- 1986/87- 1980/81-States 2001/02 1997/98 1992/93 1988/89 1982/83 2002/03 1997/98 1992/93 1988/89 1982/83
(1) (2) (3) (4) (5) (6) (7) (8) (9) (10) (11)High Income States
1 Gujarat 21.0 15.5 18.9 19.7 17.3 82.9 81.3 76.1 75.8 64.42 Haryana 17.9 21.5 15.8 19.0 17.3 82.0 86.7 81.5 73.1 66.03 Maharashtra 16.0 14.2 15.7 85.0 18.1 16.3 80.7 82.1 79.5 72.44 Punjab 19.9 18.8 19.0 19.8 17.2 81.8 82.9 80.5 66.2 63.05 Goa 28.1 24.8 27.5 28.4 - 86.9 83.5 72 68.2 -
Middle Income States 6 Andhra Pradesh 19.7 18.2 18.6 79.8 21.1 17.5 80.0 82.0 80.4 75.07 Karnataka 18.1 18.4 19.7 20.8 19.4 84.7 82.9 79.4 76.3 70.38 Kerala 19.0 18.7 19.5 20.5 17.9 89.0 84.4 82.3 79.6 73.79 Tamil Nadu 17.4 16.8 21.2 88.4 18.2 19.4 85.9 87.3 79.8 68.3
10 West Bengal 18.0 14.7 14.8 83.2 15.0 14.6 82.5 85.0 78.0 73.4Low Income States
11 Bihar 27.3 19.0 22.4 20.2 21.4 84.1 88.5 82.8 69.1 59.712 Madhya Pradesh 20.1 16.9 17.4 85.6 18.8 17.3 84.9 80.6 76.7 65.513 Orissa 27.1 22.2 25.3 23.3 22.7 80.8 81.2 74.3 72.0 66.514 Rajasthan 21.1 20.7 20.7 82.7 22.8 20.7 76.2 74.4 74.6 62.915 Uttar Pradesh 20.3 19.7 19.9 83.3 18.0 16.0 81.3 77.8 74.3 65.0
New States 16 Chattisgarh 14.1 - - - - 84.1 - - - -17 Jharkhand - - - - - 77.0 - - - -18 Uttaranchal - - - - - - - - - -
Special Category States 19 Arunachal Pradesh 69.3 70.4 74.9 74.1 88.7 - 66.5 64.0 70.9 -20 Assam 25.7 22.2 23.6 24.7 21.3 83.7 81.5 75.6 74.0 60.221 Himachal Pradesh 41.3 35.8 43.4 81.6 39.7 32.3 80.1 62.0 75.9 67.122 Jammu and Kashmir 52.4 45.1 47.0 80.9 38.8 31.7 70.5 68.7 67.9 60.023 Manipur 50.9 50.4 63.0 56.0 58.1 71.8 71.9 59.3 70.0 55.524 Meghalaya 38.5 37.3 40.4 77.9 46.2 41.7 76.6 76.7 68.9 6725 Mizoram 80.4 76.6 93.3 72.8 - 80.0 77.8 70.1 80.0 -26 Nagaland 69.3 57.0 74.4 88.9 89.8 75.2 79.1 69.9 76.1 68.327 Sikkim 151.5 182.2 83.0 80.1 71.6 86.5 88.5 70.5 70.6 71.828 Tripura 45.8 43.2 45.1 45.6 32.8 75.4 79.2 82.0 75.2 68.6
29 NCT Delhi 11.6 9.3 - - - 55.0 58.8 - - -
All States 16.5 15.2 16.2 82.9 16.5 15.4 81.6 79.6 75.7 67.4Source: Estimated from Appendix Tables 11 and 12.
Total Expenditure/SDP Ratio Revenue Expenditure/Total Expenditure Ratio
Table 35: Trends in Composition of Expenditure by States - Period Averages
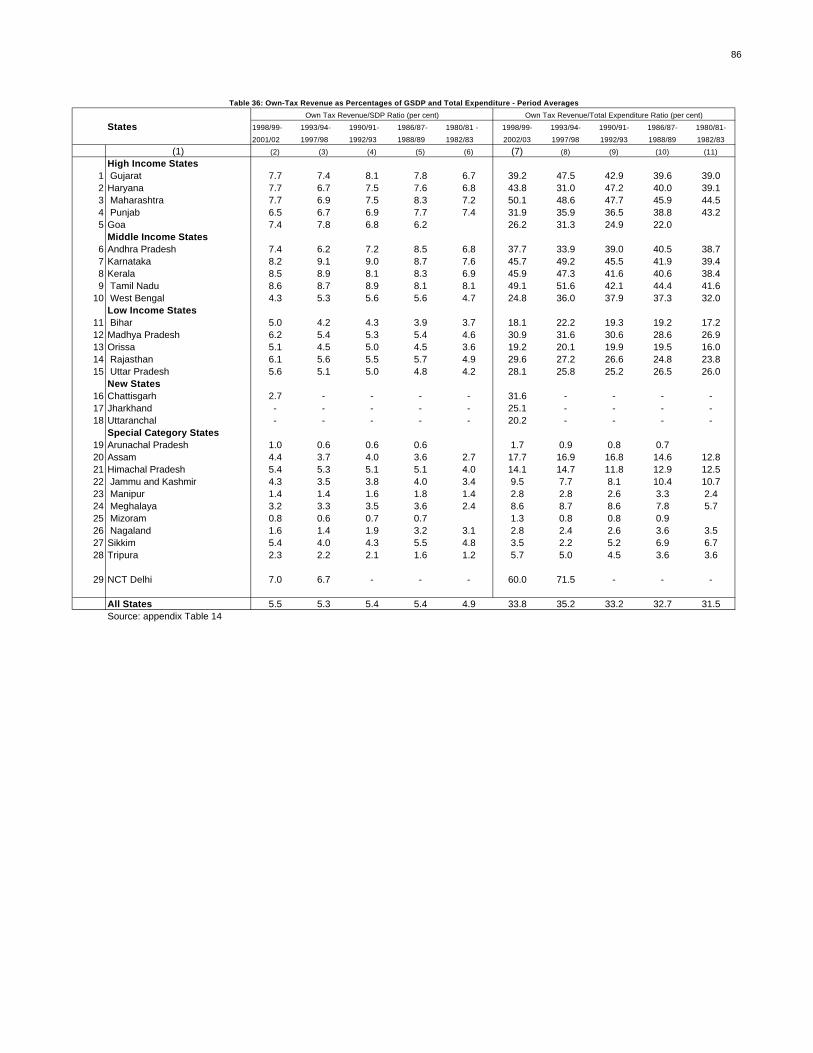
86
States 1998/99- 1993/94- 1990/91- 1986/87- 1980/81 - 1998/99- 1993/94- 1990/91- 1986/87- 1980/81-
2001/02 1997/98 1992/93 1988/89 1982/83 2002/03 1997/98 1992/93 1988/89 1982/83
(1) (2) (3) (4) (5) (6) (7) (8) (9) (10) (11)
High Income States1 Gujarat 7.7 7.4 8.1 7.8 6.7 39.2 47.5 42.9 39.6 39.02 Haryana 7.7 6.7 7.5 7.6 6.8 43.8 31.0 47.2 40.0 39.13 Maharashtra 7.7 6.9 7.5 8.3 7.2 50.1 48.6 47.7 45.9 44.54 Punjab 6.5 6.7 6.9 7.7 7.4 31.9 35.9 36.5 38.8 43.25 Goa 7.4 7.8 6.8 6.2 26.2 31.3 24.9 22.0
Middle Income States6 Andhra Pradesh 7.4 6.2 7.2 8.5 6.8 37.7 33.9 39.0 40.5 38.77 Karnataka 8.2 9.1 9.0 8.7 7.6 45.7 49.2 45.5 41.9 39.48 Kerala 8.5 8.9 8.1 8.3 6.9 45.9 47.3 41.6 40.6 38.49 Tamil Nadu 8.6 8.7 8.9 8.1 8.1 49.1 51.6 42.1 44.4 41.6
10 West Bengal 4.3 5.3 5.6 5.6 4.7 24.8 36.0 37.9 37.3 32.0Low Income States
11 Bihar 5.0 4.2 4.3 3.9 3.7 18.1 22.2 19.3 19.2 17.212 Madhya Pradesh 6.2 5.4 5.3 5.4 4.6 30.9 31.6 30.6 28.6 26.913 Orissa 5.1 4.5 5.0 4.5 3.6 19.2 20.1 19.9 19.5 16.014 Rajasthan 6.1 5.6 5.5 5.7 4.9 29.6 27.2 26.6 24.8 23.815 Uttar Pradesh 5.6 5.1 5.0 4.8 4.2 28.1 25.8 25.2 26.5 26.0
New States16 Chattisgarh 2.7 - - - - 31.6 - - - -17 Jharkhand - - - - - 25.1 - - - -18 Uttaranchal - - - - - 20.2 - - - -
Special Category States19 Arunachal Pradesh 1.0 0.6 0.6 0.6 1.7 0.9 0.8 0.720 Assam 4.4 3.7 4.0 3.6 2.7 17.7 16.9 16.8 14.6 12.821 Himachal Pradesh 5.4 5.3 5.1 5.1 4.0 14.1 14.7 11.8 12.9 12.522 Jammu and Kashmir 4.3 3.5 3.8 4.0 3.4 9.5 7.7 8.1 10.4 10.723 Manipur 1.4 1.4 1.6 1.8 1.4 2.8 2.8 2.6 3.3 2.424 Meghalaya 3.2 3.3 3.5 3.6 2.4 8.6 8.7 8.6 7.8 5.725 Mizoram 0.8 0.6 0.7 0.7 1.3 0.8 0.8 0.926 Nagaland 1.6 1.4 1.9 3.2 3.1 2.8 2.4 2.6 3.6 3.527 Sikkim 5.4 4.0 4.3 5.5 4.8 3.5 2.2 5.2 6.9 6.728 Tripura 2.3 2.2 2.1 1.6 1.2 5.7 5.0 4.5 3.6 3.6
29 NCT Delhi 7.0 6.7 - - - 60.0 71.5 - - -
All States 5.5 5.3 5.4 5.4 4.9 33.8 35.2 33.2 32.7 31.5Source: appendix Table 14
Table 36: Own-Tax Revenue as Percentages of GSDP and Total Expenditure - Period Averages
Own Tax Revenue/SDP Ratio (per cent) Own Tax Revenue/Total Expenditure Ratio (per cent)
87
Major States
Deficit Indicators With regard to the deficit indicators of the 15 major states, there are a few
interesting features that are noteworthy. First, a majority – 8 out of 15 – had
annual averages of revenue deficits during 1998-99 to 2002-03 (BE), ranging
from 4 per cent to 5.7 per cent of SDP which are higher than the all-states
average, while the other 7 states had this ratio ranging from 1.9 per cent to 2.8
per cent (Table 34). Interestingly, the high-deficit states are spread over all
the three income categories – low, middle and high. Amongst the high-
income states, Gujarat and Punjab, in the middle -income ones, Kerala and
West Bengal, and amongst the low-income states, four out of five, namely,
Uttar Pradesh, Bihar, Orissa and Rajasthan, have high revenue deficits.
Madhya Pradesh is the only one amongst low-income states to make do with a
comparatively lower revenue deficit ratio (-2.8 per cent). Three southern
states of Karnataka, Andhra Pradesh and Tamil Nadu, belonging to the
middle-income groups, have managed with relatively lower revenue deficit,
while Haryana and Goa amongst the high-income states have done so. This is
also broadly true of gross fiscal deficit to GSDP ratio, in which the same
aforesaid nine states have experienced relatively high ratios.
The second important revelation has been the sharp deterioration in
revenue deficit as between 1993-94 to 1997-98 and 1998-99 to 2002-03 (BE),
with Gujarat amongst high-income states facing the sharpest 10-fold rise,
while Madhya Pradesh and Haryana experiencing the lowest rise. If the
arithmetic average of revenue deficit to GSDP ratios for all states during the
first period was less than 1.0 per cent, the same for the second period was 2.6
per cent. Likewise, the gross fiscal deficit to GSDP ratio has shot up from
2.7 per cent to 4.5 per cent; earlier since the beginning of the 1980s, the ratio
had ranged from 2.2 per cent to 3.0 per cent. Interestingly, the phenomenon
of revenue surplus was observed by every major state in the early 1980s
except West Bengal.
Finally, a more complex set of inter-state scenario is discernible when we
compare absolute sizes of gross fiscal deficits (GFD) of states and their
88
decomposition into sources and financing patterns (Appendix Table 13). In
2001-02 (RE), UP had the largest amount of GFD (Rs 12,431 crore) followed
by West Bengal (Rs 11,586 crore), Maharashtra (Rs 11,239 crore) and Andhra
Pradesh (Rs 7,336 crore). But, their capital outlay figures (shown in the same
Appendix Table 13), which are an important purpose for which the
borrowings are made, appear unrelated to their GFD numbers. In many such
cases, capital outlay figures are relatively low and the borrowings are used to
finance revenue deficit which is comparatively high. West Bengal’s is a
distinct case in point; it has a relatively lower level of capital outlay (Rs 1,716
crore in 2001-02) but a far higher level of revenue deficit (Rs 7,959 crore)
than UP (Rs 4,230 crore and Rs 7,757 crore, respectively). On the other hand,
Andhra Pradesh and Maharashtra have broadly closer levels of capital outlays
(Rs 3,666 crore and Rs 3,315 crore) and revenue deficits (Rs 2,993 crore and
Rs 6,245 crore, respectively). Circumstances faced by individual states as
much as differences in governance explain the differing fiscal outcomes.
Thus, there is no doubt that there are differences in the levels of fiscal
imbalances amongst the 15 major states and there are different causes for
those imbalances. But, at the same time, very many common causes dominate
the fiscal performances of major states which explain the rapid deterioration
in revenue and fiscal deficits of states in recent years. These common causes
of fiscal imbalances amongst 15 major states are: (i) a sudden jump in non-
development expenditure; (ii) sharp reductions in the growth of own non-tax
revenue; and (ii) similar deceleration in the rate of growth of resource
transfers from the central government.
Own-Tax Revenues
Before we deal with the above causes, it is necessary to point out that
the major states’ overall performance in regard to mobilisation of own-tax
revenues has not been as weak as it is generally believed. As shown in Table
36, ten out of 15 states have achieved an improvement in their own-tax
revenue to GSDP ratios , or at least have sustained them during the recent
period, as compared with the situation that prevailed in the previous two
phases; the ratios have certainly improved as compared with those in the
89
1980s. Amongst the major states, Tamil Nadu and Karnataka get the credit for
mobilising the highest level of own-tax revenues and generally for sustaining
the incidence (at about 8 to 9 per cent of the state’s domestic product) over the
entire two-decade period of the 1980s and 1990s (Appendix Table 14 and the
text Table 36). All other major states have gradually reduced their own-tax to
SDP ratios from those that obtained in the early 1990s. Other southern states
also have had a tradition of high ratios of own taxes, ranging from 8 to 10 per
cent, in the early 1990s. They have also tended to reduce the proportions in
recent years: Karnataka and Kerala from over 10 per cent of GSDP to 8 per
cent, and Andhra Pradesh from about 8 to 9 per cent to 7 per cent; in some
years even less than 5 per cent in the face of reform and competition. Andhra
Pradesh’s has been a steady reduction since the early 1980s. Bihar, amongst
the big-size states, has the lowest level of own taxation, generally a little over
4 per cent; there has been a slight improvement from 4.2 per cent of SDP
during 1993-94/1997-98 to 5.0 per cent during 1998-99 to 2001-02 (Table
36). UP and West Bengal are the other two states having low own-tax to
GSDP ratios; they were a little over 6 per cent for West Bengal and 5 per cent
in respect of UP until the early 1990s but have steadily fallen to around
4.5/5.0 per cent in respect of both the states by now; the steepest fall has
occurred in the case of West Bengal from 5.6 per cent in the mid-1980s to 4.3
per cent in the latest period. In respect of other important states like
Maharashtra, MP, Rajasthan, Gujarat, Punjab and Haryana, the own-tax ratios
in the range of 8 to 9 per cent in the early 1980s have generally declined to a
little over 6 per cent in the latest period (Appendix Table 14 and the text Table
36).
Own-tax revenue as percentage of total expenditure has also been high
ranging from 38 per cent to 49 per cent in respect of the four southern states,
all of which are in the middle -income category, and there is also the high-
income state of Maharashtra which enjoys the highest 50 per cent own-tax to
expenditure ratio (Table 36). Amongst the other high-income states, Gujarat
and Haryana have enjoyed generally high own-tax revenue to total
expenditure ratios, but Punjab is the one that has experienced the steepest fall
90
from 43 per cent in the early 1980s to 32 per cent in the latest period (Table
36).
Low and Declining Non-Tax Revenues
Overall, the states’ performance in generating own-tax revenues in
relation to GSDP or total expenditure has not been discouraging, particularly
in the context of the pressures to move away from high rates of taxation of the
planning era. Therefore, the sources of fiscal imbalances are to be found in
the three key areas of fiscal performance in respect of these major states, as
indicated above. The first and foremost has been the inability of state
governments to mobilise non-tax revenues in the form of (a) improved user
charges for various social and economic services rendered, and (b) higher
returns on states’ investments. Data presented in Appendix Table 15 bring out
how sluggish and receding have been individual states’ own non-tax revenues
in recent years. Some exceptions to this general feature have been a few
states which have introduced state lotteries as detailed in Table 37; otherwise,
the non-tax revenue mobilisation has been very meagre amongst all states
without exception. Also, amongst non-tax revenue receipts, some increase
has occurred because the states have increased their interest receipts on their
lendings to commercial undertakings, local bodies and cooperatives.
As alluded to earlier, net revenues mobilised by state lotteries have
been truly meagre: Rs 204.80 crore in 2001-02 (RE) against a gross
mobilisation of Rs 3,897 crore, or just about 5.3 per cent for the eleven states
involved in this game. In absolute terms, the highest net amount has been
mobilised by Tamil Nadu (Rs 53.71 crore ) followed by Goa (Rs 46.26 crore),
Kerala (Rs 37.45 crore) and Karnataka (Rs 26.84 crore). In gross terms, the
top mobilser has been Punjab (Rs 2,020 crore in 2002-03) followed by Goa
(Rs 694.6 crore), Haryana (Rs 433.9 crore) and Sikkim (Rs 206.5 crore).
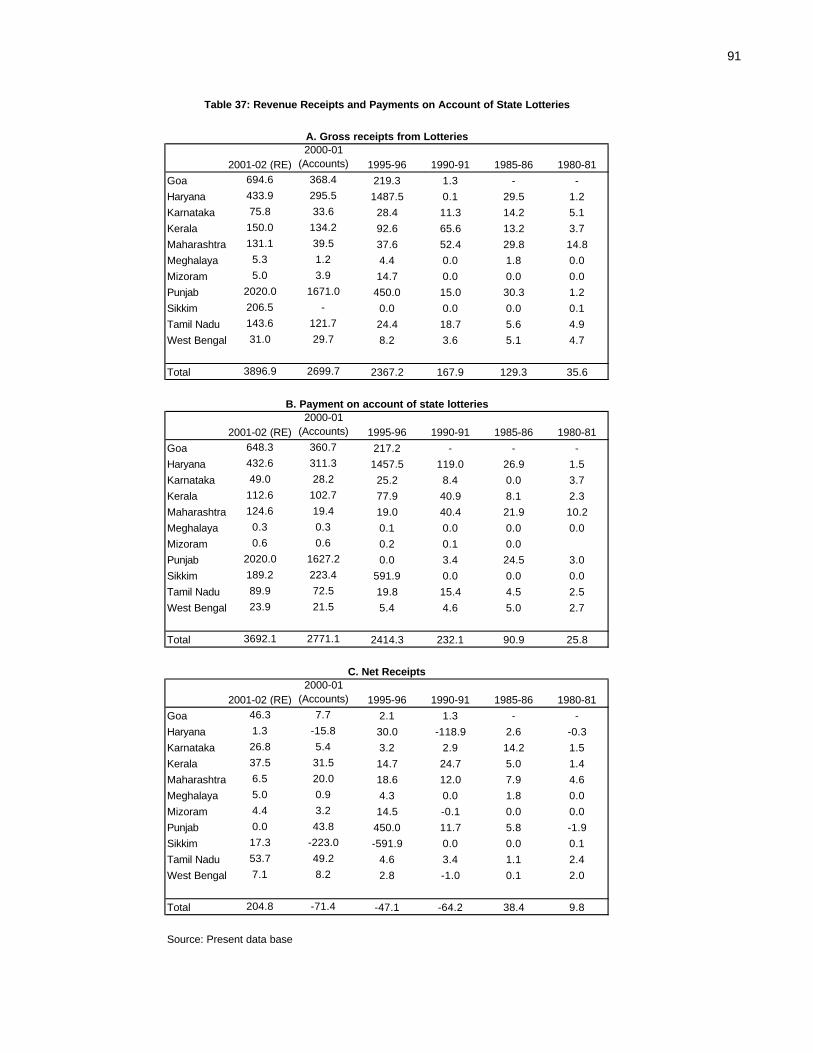
91
2001-02 (RE)
2000-01 (Accounts) 1995-96 1990-91 1985-86 1980-81
Goa 694.6 368.4 219.3 1.3 - -
Haryana 433.9 295.5 1487.5 0.1 29.5 1.2
Karnataka 75.8 33.6 28.4 11.3 14.2 5.1
Kerala 150.0 134.2 92.6 65.6 13.2 3.7
Maharashtra 131.1 39.5 37.6 52.4 29.8 14.8
Meghalaya 5.3 1.2 4.4 0.0 1.8 0.0
Mizoram 5.0 3.9 14.7 0.0 0.0 0.0
Punjab 2020.0 1671.0 450.0 15.0 30.3 1.2
Sikkim 206.5 - 0.0 0.0 0.0 0.1
Tamil Nadu 143.6 121.7 24.4 18.7 5.6 4.9
West Bengal 31.0 29.7 8.2 3.6 5.1 4.7
Total 3896.9 2699.7 2367.2 167.9 129.3 35.6
2001-02 (RE)
2000-01 (Accounts) 1995-96 1990-91 1985-86 1980-81
Goa 648.3 360.7 217.2 - - -
Haryana 432.6 311.3 1457.5 119.0 26.9 1.5
Karnataka 49.0 28.2 25.2 8.4 0.0 3.7
Kerala 112.6 102.7 77.9 40.9 8.1 2.3
Maharashtra 124.6 19.4 19.0 40.4 21.9 10.2
Meghalaya 0.3 0.3 0.1 0.0 0.0 0.0
Mizoram 0.6 0.6 0.2 0.1 0.0
Punjab 2020.0 1627.2 0.0 3.4 24.5 3.0
Sikkim 189.2 223.4 591.9 0.0 0.0 0.0
Tamil Nadu 89.9 72.5 19.8 15.4 4.5 2.5
West Bengal 23.9 21.5 5.4 4.6 5.0 2.7
Total 3692.1 2771.1 2414.3 232.1 90.9 25.8
2001-02 (RE)
2000-01 (Accounts) 1995-96 1990-91 1985-86 1980-81
Goa 46.3 7.7 2.1 1.3 - -
Haryana 1.3 -15.8 30.0 -118.9 2.6 -0.3
Karnataka 26.8 5.4 3.2 2.9 14.2 1.5
Kerala 37.5 31.5 14.7 24.7 5.0 1.4
Maharashtra 6.5 20.0 18.6 12.0 7.9 4.6
Meghalaya 5.0 0.9 4.3 0.0 1.8 0.0
Mizoram 4.4 3.2 14.5 -0.1 0.0 0.0
Punjab 0.0 43.8 450.0 11.7 5.8 -1.9
Sikkim 17.3 -223.0 -591.9 0.0 0.0 0.1
Tamil Nadu 53.7 49.2 4.6 3.4 1.1 2.4
West Bengal 7.1 8.2 2.8 -1.0 0.1 2.0
Total 204.8 -71.4 -47.1 -64.2 38.4 9.8
Source: Present data base
Table 37: Revenue Receipts and Payments on Account of State Lotteries
A. Gross receipts from Lotteries
B. Payment on account of state lotteries
C. Net Receipts
92
Power Sector as a Drain on State Finances
As explained at length earlier, the failure to achieve an adequate recovery
of the cost of public services and to obtain similar returns on investments in
statutory corporations and government companies, has been the most crucial
factor in the niggardly growth of the states’ non-tax revenues. Amongst them,
the most damaging drain on the finances has emanated from the discouraging
performances of State Electricity Boards (SEBs) and other electricity utilities
that account for 85 per cent of the states’ investment in PSUs; their financial
health has deteriorated over the years due to low tariffs and large subsidies.
Total subsidies have risen five-fold from Rs 7,449 crore in 1991-92 to Rs
34,587 crore in 2001-02 but the state governments have provided subventions
only to the extent of Rs 8,600 crore in 2001-02 and hence commercial losses
including uncovered subsidies have crossed Rs 25,000 crore in 2001-02, as
depicted in Table 12 earlier.
State-wise information regarding the SEBs’ financial performance is now
regularly made available by the Planning Commission in its Annual Reports
on the Working of State Electricity Boards and Electricity Departments, the
latest one being for the year 2001-02 (Planning Commission, May 2002c) the
picture it has presented has generally been a sad one, amongst other things, of
rapidly weakening financial performances of State Electricity Boards (SEBs)
at the states’ level. Persistent increases in commercial losses, large increases
in subsidies, puny amounts of subsidy subventions received from the state
governments, and negative rates of return on capital employed, as also the
estimates of sizeable tariff increases required to achieve the statutory 3 per
cent rate of return on capital and outstandings dues of the central sector
undertakings [Tables 38(A), 38(B) and 38(C)] – all of these estimates state-
wise are presented in the study.
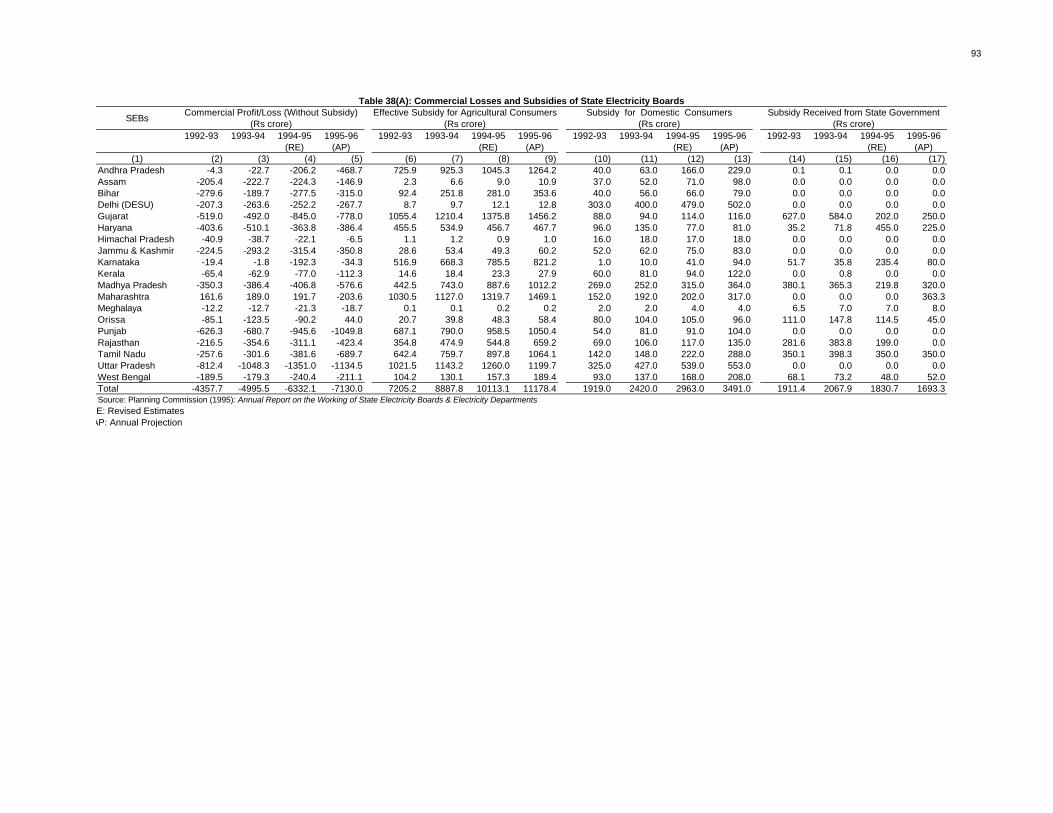
93
1992-93 1993-94 1994-95 1995-96 1992-93 1993-94 1994-95 1995-96 1992-93 1993-94 1994-95 1995-96 1992-93 1993-94 1994-95 1995-96(RE) (AP) (RE) (AP) (RE) (AP) (RE) (AP)
(1) (2) (3) (4) (5) (6) (7) (8) (9) (10) (11) (12) (13) (14) (15) (16) (17)Andhra Pradesh -4.3 -22.7 -206.2 -468.7 725.9 925.3 1045.3 1264.2 40.0 63.0 166.0 229.0 0.1 0.1 0.0 0.0Assam -205.4 -222.7 -224.3 -146.9 2.3 6.6 9.0 10.9 37.0 52.0 71.0 98.0 0.0 0.0 0.0 0.0Bihar -279.6 -189.7 -277.5 -315.0 92.4 251.8 281.0 353.6 40.0 56.0 66.0 79.0 0.0 0.0 0.0 0.0Delhi (DESU) -207.3 -263.6 -252.2 -267.7 8.7 9.7 12.1 12.8 303.0 400.0 479.0 502.0 0.0 0.0 0.0 0.0Gujarat -519.0 -492.0 -845.0 -778.0 1055.4 1210.4 1375.8 1456.2 88.0 94.0 114.0 116.0 627.0 584.0 202.0 250.0Haryana -403.6 -510.1 -363.8 -386.4 455.5 534.9 456.7 467.7 96.0 135.0 77.0 81.0 35.2 71.8 455.0 225.0Himachal Pradesh -40.9 -38.7 -22.1 -6.5 1.1 1.2 0.9 1.0 16.0 18.0 17.0 18.0 0.0 0.0 0.0 0.0Jammu & Kashmir -224.5 -293.2 -315.4 -350.8 28.6 53.4 49.3 60.2 52.0 62.0 75.0 83.0 0.0 0.0 0.0 0.0Karnataka -19.4 -1.8 -192.3 -34.3 516.9 668.3 785.5 821.2 1.0 10.0 41.0 94.0 51.7 35.8 235.4 80.0Kerala -65.4 -62.9 -77.0 -112.3 14.6 18.4 23.3 27.9 60.0 81.0 94.0 122.0 0.0 0.8 0.0 0.0Madhya Pradesh -350.3 -386.4 -406.8 -576.6 442.5 743.0 887.6 1012.2 269.0 252.0 315.0 364.0 380.1 365.3 219.8 320.0Maharashtra 161.6 189.0 191.7 -203.6 1030.5 1127.0 1319.7 1469.1 152.0 192.0 202.0 317.0 0.0 0.0 0.0 363.3Meghalaya -12.2 -12.7 -21.3 -18.7 0.1 0.1 0.2 0.2 2.0 2.0 4.0 4.0 6.5 7.0 7.0 8.0Orissa -85.1 -123.5 -90.2 44.0 20.7 39.8 48.3 58.4 80.0 104.0 105.0 96.0 111.0 147.8 114.5 45.0Punjab -626.3 -680.7 -945.6 -1049.8 687.1 790.0 958.5 1050.4 54.0 81.0 91.0 104.0 0.0 0.0 0.0 0.0Rajasthan -216.5 -354.6 -311.1 -423.4 354.8 474.9 544.8 659.2 69.0 106.0 117.0 135.0 281.6 383.8 199.0 0.0Tamil Nadu -257.6 -301.6 -381.6 -689.7 642.4 759.7 897.8 1064.1 142.0 148.0 222.0 288.0 350.1 398.3 350.0 350.0Uttar Pradesh -812.4 -1048.3 -1351.0 -1134.5 1021.5 1143.2 1260.0 1199.7 325.0 427.0 539.0 553.0 0.0 0.0 0.0 0.0West Bengal -189.5 -179.3 -240.4 -211.1 104.2 130.1 157.3 189.4 93.0 137.0 168.0 208.0 68.1 73.2 48.0 52.0Total -4357.7 -4995.5 -6332.1 -7130.0 7205.2 8887.8 10113.1 11178.4 1919.0 2420.0 2963.0 3491.0 1911.4 2067.9 1830.7 1693.3Source: Planning Commission (1995): Annual Report on the Working of State Electricity Boards & Electricity Departments
RE: Revised EstimatesAP: Annual Projection
Subsidy for Domestic Consumers (Rs crore)
Subsidy Received from State Government (Rs crore)
Table 38(A): Commercial Losses and Subsidies of State Electricity Boards
SEBsCommercial Profit/Loss (Without Subsidy)
(Rs crore)Effective Subsidy for Agricultural Consumers
(Rs crore)
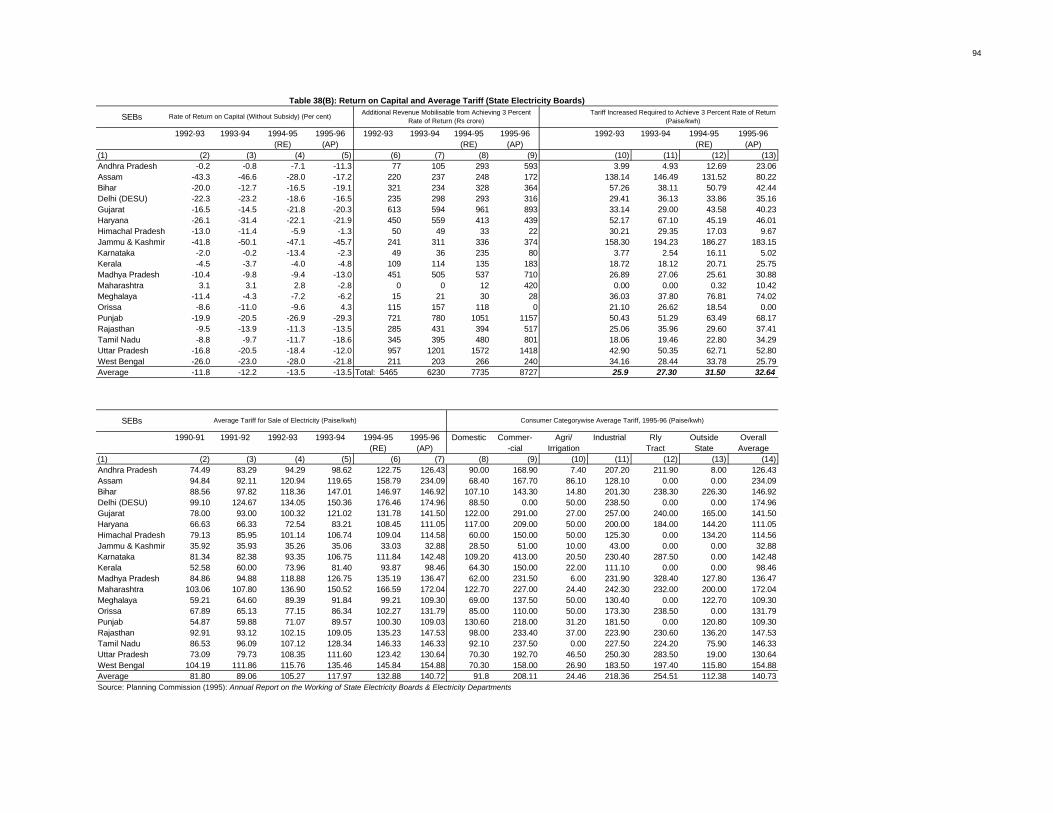
94
1992-93 1993-94 1994-95 1995-96 1992-93 1993-94 1994-95 1995-96 1992-93 1993-94 1994-95 1995-96(RE) (AP) (RE) (AP) (RE) (AP)
(1) (2) (3) (4) (5) (6) (7) (8) (9) (10) (11) (12) (13)Andhra Pradesh -0.2 -0.8 -7.1 -11.3 77 105 293 593 3.99 4.93 12.69 23.06Assam -43.3 -46.6 -28.0 -17.2 220 237 248 172 138.14 146.49 131.52 80.22Bihar -20.0 -12.7 -16.5 -19.1 321 234 328 364 57.26 38.11 50.79 42.44Delhi (DESU) -22.3 -23.2 -18.6 -16.5 235 298 293 316 29.41 36.13 33.86 35.16Gujarat -16.5 -14.5 -21.8 -20.3 613 594 961 893 33.14 29.00 43.58 40.23Haryana -26.1 -31.4 -22.1 -21.9 450 559 413 439 52.17 67.10 45.19 46.01Himachal Pradesh -13.0 -11.4 -5.9 -1.3 50 49 33 22 30.21 29.35 17.03 9.67Jammu & Kashmir -41.8 -50.1 -47.1 -45.7 241 311 336 374 158.30 194.23 186.27 183.15Karnataka -2.0 -0.2 -13.4 -2.3 49 36 235 80 3.77 2.54 16.11 5.02Kerala -4.5 -3.7 -4.0 -4.8 109 114 135 183 18.72 18.12 20.71 25.75Madhya Pradesh -10.4 -9.8 -9.4 -13.0 451 505 537 710 26.89 27.06 25.61 30.88Maharashtra 3.1 3.1 2.8 -2.8 0 0 12 420 0.00 0.00 0.32 10.42Meghalaya -11.4 -4.3 -7.2 -6.2 15 21 30 28 36.03 37.80 76.81 74.02Orissa -8.6 -11.0 -9.6 4.3 115 157 118 0 21.10 26.62 18.54 0.00Punjab -19.9 -20.5 -26.9 -29.3 721 780 1051 1157 50.43 51.29 63.49 68.17Rajasthan -9.5 -13.9 -11.3 -13.5 285 431 394 517 25.06 35.96 29.60 37.41Tamil Nadu -8.8 -9.7 -11.7 -18.6 345 395 480 801 18.06 19.46 22.80 34.29Uttar Pradesh -16.8 -20.5 -18.4 -12.0 957 1201 1572 1418 42.90 50.35 62.71 52.80West Bengal -26.0 -23.0 -28.0 -21.8 211 203 266 240 34.16 28.44 33.78 25.79Average -11.8 -12.2 -13.5 -13.5 Total: 5465 6230 7735 8727 25.9 27.30 31.50 32.64
1990-91 1991-92 1992-93 1993-94 1994-95 1995-96 Domestic Commer- Agri/ Industrial Rly Outside Overall(RE) (AP) -cial Irrigation Tract State Average
(1) (2) (3) (4) (5) (6) (7) (8) (9) (10) (11) (12) (13) (14)Andhra Pradesh 74.49 83.29 94.29 98.62 122.75 126.43 90.00 168.90 7.40 207.20 211.90 8.00 126.43Assam 94.84 92.11 120.94 119.65 158.79 234.09 68.40 167.70 86.10 128.10 0.00 0.00 234.09Bihar 88.56 97.82 118.36 147.01 146.97 146.92 107.10 143.30 14.80 201.30 238.30 226.30 146.92Delhi (DESU) 99.10 124.67 134.05 150.36 176.46 174.96 88.50 0.00 50.00 238.50 0.00 0.00 174.96Gujarat 78.00 93.00 100.32 121.02 131.78 141.50 122.00 291.00 27.00 257.00 240.00 165.00 141.50Haryana 66.63 66.33 72.54 83.21 108.45 111.05 117.00 209.00 50.00 200.00 184.00 144.20 111.05Himachal Pradesh 79.13 85.95 101.14 106.74 109.04 114.58 60.00 150.00 50.00 125.30 0.00 134.20 114.56Jammu & Kashmir 35.92 35.93 35.26 35.06 33.03 32.88 28.50 51.00 10.00 43.00 0.00 0.00 32.88Karnataka 81.34 82.38 93.35 106.75 111.84 142.48 109.20 413.00 20.50 230.40 287.50 0.00 142.48Kerala 52.58 60.00 73.96 81.40 93.87 98.46 64.30 150.00 22.00 111.10 0.00 0.00 98.46Madhya Pradesh 84.86 94.88 118.88 126.75 135.19 136.47 62.00 231.50 6.00 231.90 328.40 127.80 136.47Maharashtra 103.06 107.80 136.90 150.52 166.59 172.04 122.70 227.00 24.40 242.30 232.00 200.00 172.04Meghalaya 59.21 64.60 89.39 91.84 99.21 109.30 69.00 137.50 50.00 130.40 0.00 122.70 109.30Orissa 67.89 65.13 77.15 86.34 102.27 131.79 85.00 110.00 50.00 173.30 238.50 0.00 131.79Punjab 54.87 59.88 71.07 89.57 100.30 109.03 130.60 218.00 31.20 181.50 0.00 120.80 109.30Rajasthan 92.91 93.12 102.15 109.05 135.23 147.53 98.00 233.40 37.00 223.90 230.60 136.20 147.53Tamil Nadu 86.53 96.09 107.12 128.34 146.33 146.33 92.10 237.50 0.00 227.50 224.20 75.90 146.33Uttar Pradesh 73.09 79.73 108.35 111.60 123.42 130.64 70.30 192.70 46.50 250.30 283.50 19.00 130.64West Bengal 104.19 111.86 115.76 135.46 145.84 154.88 70.30 158.00 26.90 183.50 197.40 115.80 154.88Average 81.80 89.06 105.27 117.97 132.88 140.72 91.8 208.11 24.46 218.36 254.51 112.38 140.73Source: Planning Commission (1995): Annual Report on the Working of State Electricity Boards & Electricity Departments
SEBs Rate of Return on Capital (Without Subsidy) (Per cent)
SEBs
Table 38(B): Return on Capital and Average Tariff (State Electricity Boards)
Average Tariff for Sale of Electricity (Paise/kwh) Consumer Categorywise Average Tariff, 1995-96 (Paise/kwh)
Tariff Increased Required to Achieve 3 Percent Rate of Return (Paise/kwh)
Additional Revenue Mobilisable from Achieving 3 Percent Rate of Return (Rs crore)
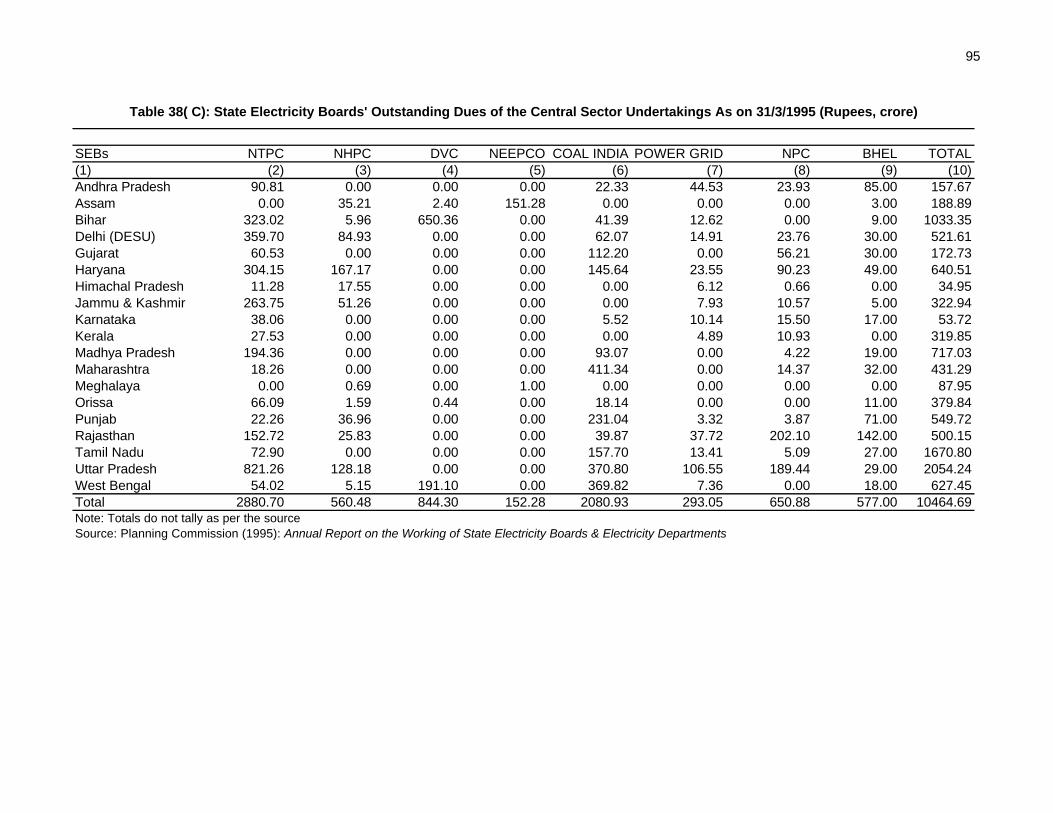
95
SEBs NTPC NHPC DVC NEEPCO COAL INDIA POWER GRID NPC BHEL TOTAL(1) (2) (3) (4) (5) (6) (7) (8) (9) (10)Andhra Pradesh 90.81 0.00 0.00 0.00 22.33 44.53 23.93 85.00 157.67Assam 0.00 35.21 2.40 151.28 0.00 0.00 0.00 3.00 188.89Bihar 323.02 5.96 650.36 0.00 41.39 12.62 0.00 9.00 1033.35Delhi (DESU) 359.70 84.93 0.00 0.00 62.07 14.91 23.76 30.00 521.61Gujarat 60.53 0.00 0.00 0.00 112.20 0.00 56.21 30.00 172.73Haryana 304.15 167.17 0.00 0.00 145.64 23.55 90.23 49.00 640.51Himachal Pradesh 11.28 17.55 0.00 0.00 0.00 6.12 0.66 0.00 34.95Jammu & Kashmir 263.75 51.26 0.00 0.00 0.00 7.93 10.57 5.00 322.94Karnataka 38.06 0.00 0.00 0.00 5.52 10.14 15.50 17.00 53.72Kerala 27.53 0.00 0.00 0.00 0.00 4.89 10.93 0.00 319.85Madhya Pradesh 194.36 0.00 0.00 0.00 93.07 0.00 4.22 19.00 717.03Maharashtra 18.26 0.00 0.00 0.00 411.34 0.00 14.37 32.00 431.29Meghalaya 0.00 0.69 0.00 1.00 0.00 0.00 0.00 0.00 87.95Orissa 66.09 1.59 0.44 0.00 18.14 0.00 0.00 11.00 379.84Punjab 22.26 36.96 0.00 0.00 231.04 3.32 3.87 71.00 549.72Rajasthan 152.72 25.83 0.00 0.00 39.87 37.72 202.10 142.00 500.15Tamil Nadu 72.90 0.00 0.00 0.00 157.70 13.41 5.09 27.00 1670.80Uttar Pradesh 821.26 128.18 0.00 0.00 370.80 106.55 189.44 29.00 2054.24West Bengal 54.02 5.15 191.10 0.00 369.82 7.36 0.00 18.00 627.45Total 2880.70 560.48 844.30 152.28 2080.93 293.05 650.88 577.00 10464.69Note: Totals do not tally as per the sourceSource: Planning Commission (1995): Annual Report on the Working of State Electricity Boards & Electricity Departments
Table 38( C): State Electricity Boards' Outstanding Dues of the Central Sector Undertakings As on 31/3/1995 (Rupees, crore)
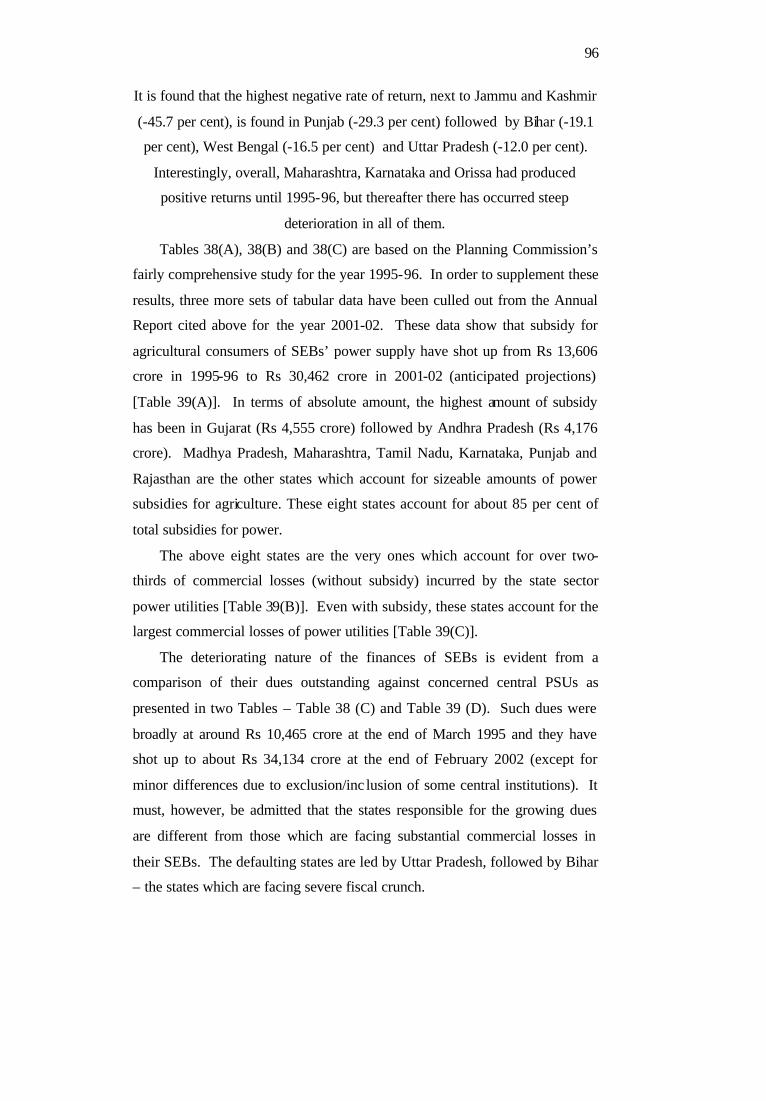
96
It is found that the highest negative rate of return, next to Jammu and Kashmir
(-45.7 per cent), is found in Punjab (-29.3 per cent) followed by Bihar (-19.1
per cent), West Bengal (-16.5 per cent) and Uttar Pradesh (-12.0 per cent).
Interestingly, overall, Maharashtra, Karnataka and Orissa had produced
positive returns until 1995-96, but thereafter there has occurred steep
deterioration in all of them.
Tables 38(A), 38(B) and 38(C) are based on the Planning Commission’s
fairly comprehensive study for the year 1995-96. In order to supplement these
results, three more sets of tabular data have been culled out from the Annual
Report cited above for the year 2001-02. These data show that subsidy for
agricultural consumers of SEBs’ power supply have shot up from Rs 13,606
crore in 1995-96 to Rs 30,462 crore in 2001-02 (anticipated projections)
[Table 39(A)]. In terms of absolute amount, the highest amount of subsidy
has been in Gujarat (Rs 4,555 crore) followed by Andhra Pradesh (Rs 4,176
crore). Madhya Pradesh, Maharashtra, Tamil Nadu, Karnataka, Punjab and
Rajasthan are the other states which account for sizeable amounts of power
subsidies for agriculture. These eight states account for about 85 per cent of
total subsidies for power.
The above eight states are the very ones which account for over two-
thirds of commercial losses (without subsidy) incurred by the state sector
power utilities [Table 39(B)]. Even with subsidy, these states account for the
largest commercial losses of power utilities [Table 39(C)].
The deteriorating nature of the finances of SEBs is evident from a
comparison of their dues outstanding against concerned central PSUs as
presented in two Tables – Table 38 (C) and Table 39 (D). Such dues were
broadly at around Rs 10,465 crore at the end of March 1995 and they have
shot up to about Rs 34,134 crore at the end of February 2002 (except for
minor differences due to exclusion/inc lusion of some central institutions). It
must, however, be admitted that the states responsible for the growing dues
are different from those which are facing substantial commercial losses in
their SEBs. The defaulting states are led by Uttar Pradesh, followed by Bihar
– the states which are facing severe fiscal crunch.
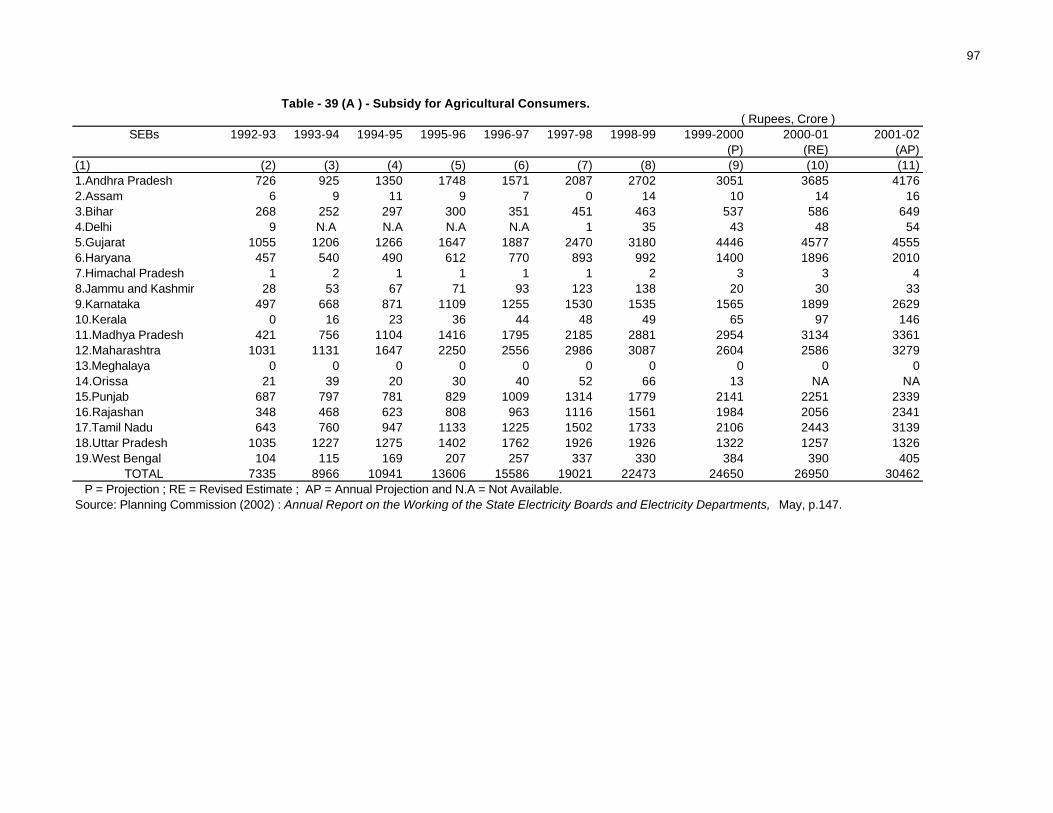
97
Table - 39 (A ) - Subsidy for Agricultural Consumers. ( Rupees, Crore )
SEBs 1992-93 1993-94 1994-95 1995-96 1996-97 1997-98 1998-99 1999-2000 2000-01 2001-02(P) (RE) (AP)
(1) (2) (3) (4) (5) (6) (7) (8) (9) (10) (11)1.Andhra Pradesh 726 925 1350 1748 1571 2087 2702 3051 3685 41762.Assam 6 9 11 9 7 0 14 10 14 163.Bihar 268 252 297 300 351 451 463 537 586 6494.Delhi 9 N.A N.A N.A N.A 1 35 43 48 545.Gujarat 1055 1206 1266 1647 1887 2470 3180 4446 4577 45556.Haryana 457 540 490 612 770 893 992 1400 1896 20107.Himachal Pradesh 1 2 1 1 1 1 2 3 3 48.Jammu and Kashmir 28 53 67 71 93 123 138 20 30 339.Karnataka 497 668 871 1109 1255 1530 1535 1565 1899 262910.Kerala 0 16 23 36 44 48 49 65 97 14611.Madhya Pradesh 421 756 1104 1416 1795 2185 2881 2954 3134 336112.Maharashtra 1031 1131 1647 2250 2556 2986 3087 2604 2586 327913.Meghalaya 0 0 0 0 0 0 0 0 0 014.Orissa 21 39 20 30 40 52 66 13 NA NA15.Punjab 687 797 781 829 1009 1314 1779 2141 2251 233916.Rajashan 348 468 623 808 963 1116 1561 1984 2056 234117.Tamil Nadu 643 760 947 1133 1225 1502 1733 2106 2443 313918.Uttar Pradesh 1035 1227 1275 1402 1762 1926 1926 1322 1257 132619.West Bengal 104 115 169 207 257 337 330 384 390 405
TOTAL 7335 8966 10941 13606 15586 19021 22473 24650 26950 30462 P = Projection ; RE = Revised Estimate ; AP = Annual Projection and N.A = Not Available.Source: Planning Commission (2002) : Annual Report on the Working of the State Electricity Boards and Electricity Departments, May, p.147.
97
Table -39(B) - Commercial Profit / Loss (-) of SEBs (Without Subsidy)( Rupees, Crore )
SEBs 1992-93 1993-94 1994-95 1995-96 1996-97 1997-98 1998-99 1999-2000 2000-01(P) (RE)
(1) (2) (3) (4) (5) (6) (7) (8) (9) (10)1.Andhra Pradesh -4 -23 -981 -1255 -939 -1376 -2679 -3117 -25592.Assam -205 -197 -255 -261 -244 -439 -322 -214 -3793.Bihar -280 -190 -189 -211 -442 -495 -605 -511 -6704.Delhi -207 N.A. 0 -578 -626 -760 -1039 -1103 -10555.Gujarat -519 -493 -550 -1003 -952 -1364 -2039 -3778 -39206.Haryana -404 -507 -468 -554 -635 -765 -704 -1247 -19607.Himachal Pradesh 2 -51 19 11 -19 -33 -88 -206 -928.Jammu and Kashmir -225 -293 -347 -363 -507 -661 -835 -793 -9909.Karnataka -19 -2 -164 -502 -652 -322 -847 -975 -167510.Kerala -65 -75 -129 -183 -208 -199 -411 -646 -112911.Madhya Pradesh -493 -377 -594 -602 -464 -1058 -2655 -3151 -326412.Maharashtra 162 189 276 -408 -92 -11 160 -1479 -140413.Meghalaya -8 -3 -21 -20 -15 -26 -50 -53 -4414.Orissa -85 -196 -136 -231 -375 -392 -538 -187 -21615.Punjab -626 -693 -681 -644 -603 -943 -1354 -2113 -147716.Rajashan -260 -415 -412 -430 -498 -640 -1331 -1899 -61517.Tamil Nadu -258 -302 -2 -77 -257 -296 -741 -1442 -144718.Uttar Pradesh -808 -1202 -1152 -1136 -3378 -3692 -3692 -2596 -253419.West Bengal -258 -231 -339 -322 -398 -492 -1089 -842 -1059TOTAL -4560 -5060 -6125 -8770 -11305 -13963 -20860 -26353 -25259 P = Projection ; RE = Revised Estimate ; AP = Annual Projection and N.A = Not Available.Source: Planning Commission (2002) : Annual Report on the Working of State Electricity Boards and Electricity Departments, May, p.146
97
( Rupees, Crore )2001-02
(AP)(11)
-2820-370-753
-1092-3491-1949
-48-1141-2340-1354-3682-3527
-49-230
-1633-2412-2510-2687-1086
-33177
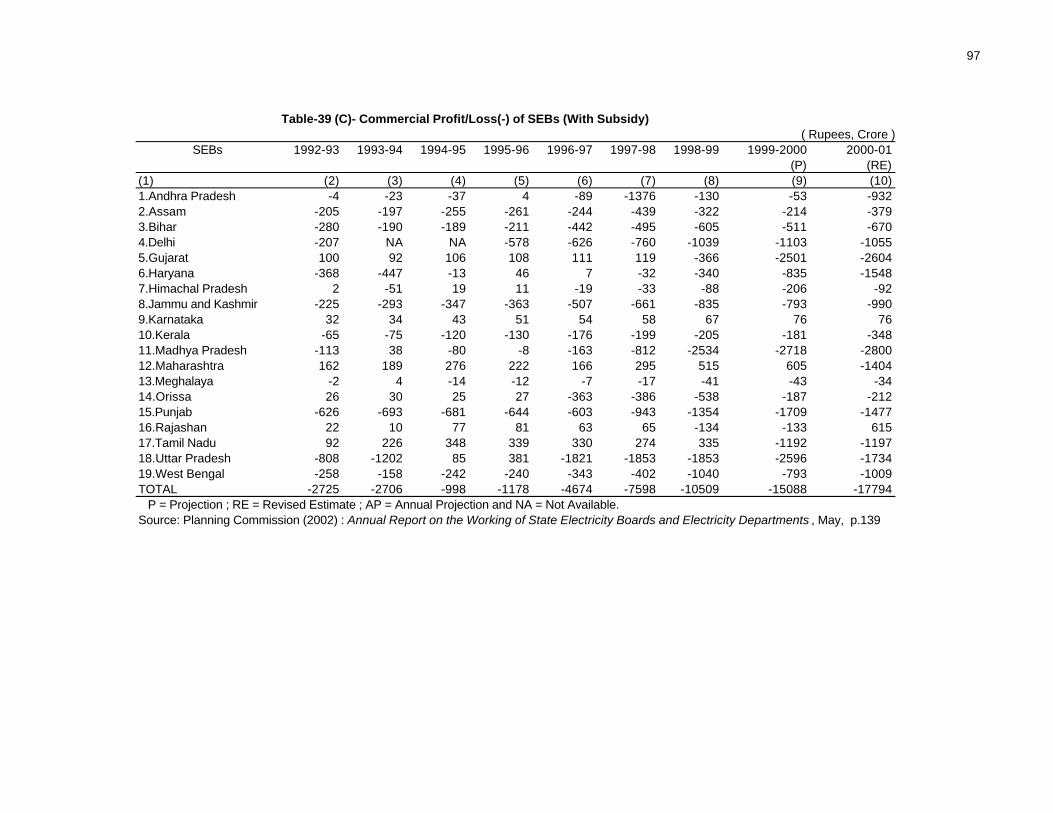
97
Table-39 (C)- Commercial Profit/Loss(-) of SEBs (With Subsidy) ( Rupees, Crore )
SEBs 1992-93 1993-94 1994-95 1995-96 1996-97 1997-98 1998-99 1999-2000 2000-01(P) (RE)
(1) (2) (3) (4) (5) (6) (7) (8) (9) (10)1.Andhra Pradesh -4 -23 -37 4 -89 -1376 -130 -53 -9322.Assam -205 -197 -255 -261 -244 -439 -322 -214 -3793.Bihar -280 -190 -189 -211 -442 -495 -605 -511 -6704.Delhi -207 NA NA -578 -626 -760 -1039 -1103 -10555.Gujarat 100 92 106 108 111 119 -366 -2501 -26046.Haryana -368 -447 -13 46 7 -32 -340 -835 -15487.Himachal Pradesh 2 -51 19 11 -19 -33 -88 -206 -928.Jammu and Kashmir -225 -293 -347 -363 -507 -661 -835 -793 -9909.Karnataka 32 34 43 51 54 58 67 76 7610.Kerala -65 -75 -120 -130 -176 -199 -205 -181 -34811.Madhya Pradesh -113 38 -80 -8 -163 -812 -2534 -2718 -280012.Maharashtra 162 189 276 222 166 295 515 605 -140413.Meghalaya -2 4 -14 -12 -7 -17 -41 -43 -3414.Orissa 26 30 25 27 -363 -386 -538 -187 -21215.Punjab -626 -693 -681 -644 -603 -943 -1354 -1709 -147716.Rajashan 22 10 77 81 63 65 -134 -133 61517.Tamil Nadu 92 226 348 339 330 274 335 -1192 -119718.Uttar Pradesh -808 -1202 85 381 -1821 -1853 -1853 -2596 -173419.West Bengal -258 -158 -242 -240 -343 -402 -1040 -793 -1009TOTAL -2725 -2706 -998 -1178 -4674 -7598 -10509 -15088 -17794 P = Projection ; RE = Revised Estimate ; AP = Annual Projection and NA = Not Available.Source: Planning Commission (2002) : Annual Report on the Working of State Electricity Boards and Electricity Departments , May, p.139
97
( Rupees, Crore )2001-02
(AP)(11)
-1194-370-753
-1092-2135-1537
-48-1141
86-445
-3183-3527
-38-230
-1633-2412-2260-1887-1036
-24837
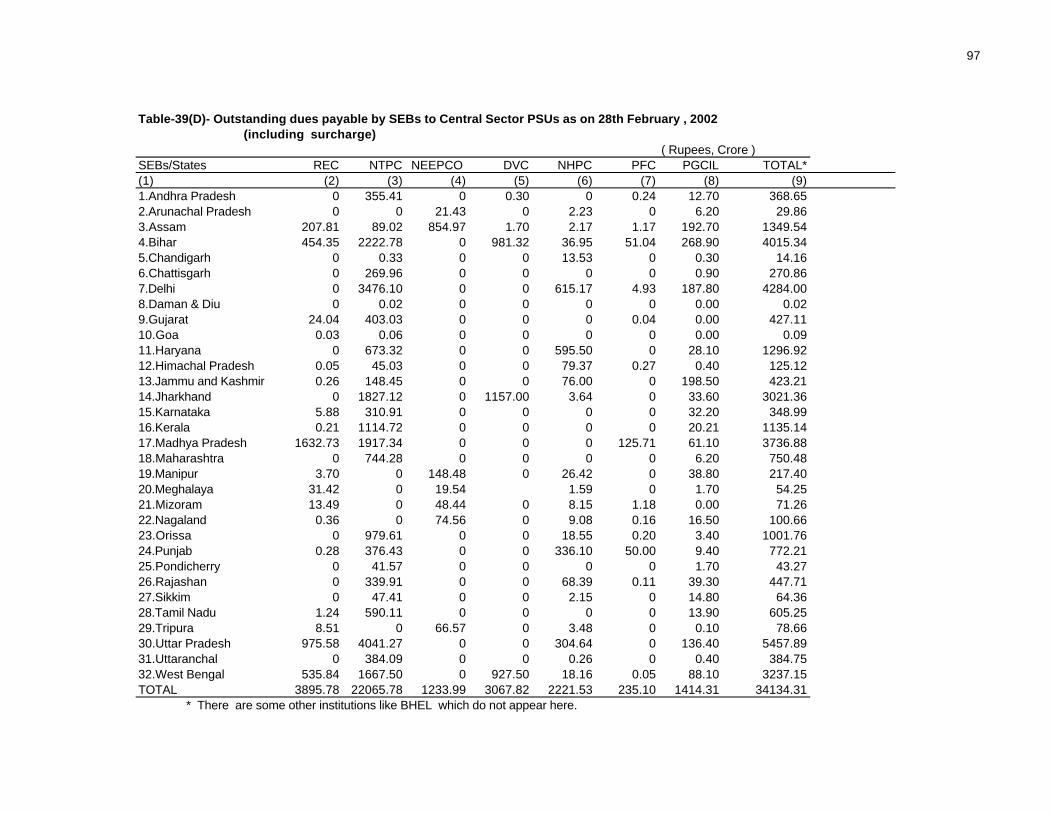
97
Table-39(D)- Outstanding dues payable by SEBs to Central Sector PSUs as on 28th February , 2002 (including surcharge)
( Rupees, Crore )SEBs/States REC NTPC NEEPCO DVC NHPC PFC PGCIL TOTAL*(1) (2) (3) (4) (5) (6) (7) (8) (9)1.Andhra Pradesh 0 355.41 0 0.30 0 0.24 12.70 368.652.Arunachal Pradesh 0 0 21.43 0 2.23 0 6.20 29.863.Assam 207.81 89.02 854.97 1.70 2.17 1.17 192.70 1349.544.Bihar 454.35 2222.78 0 981.32 36.95 51.04 268.90 4015.345.Chandigarh 0 0.33 0 0 13.53 0 0.30 14.166.Chattisgarh 0 269.96 0 0 0 0 0.90 270.867.Delhi 0 3476.10 0 0 615.17 4.93 187.80 4284.008.Daman & Diu 0 0.02 0 0 0 0 0.00 0.029.Gujarat 24.04 403.03 0 0 0 0.04 0.00 427.1110.Goa 0.03 0.06 0 0 0 0 0.00 0.0911.Haryana 0 673.32 0 0 595.50 0 28.10 1296.9212.Himachal Pradesh 0.05 45.03 0 0 79.37 0.27 0.40 125.1213.Jammu and Kashmir 0.26 148.45 0 0 76.00 0 198.50 423.2114.Jharkhand 0 1827.12 0 1157.00 3.64 0 33.60 3021.3615.Karnataka 5.88 310.91 0 0 0 0 32.20 348.9916.Kerala 0.21 1114.72 0 0 0 0 20.21 1135.1417.Madhya Pradesh 1632.73 1917.34 0 0 0 125.71 61.10 3736.8818.Maharashtra 0 744.28 0 0 0 0 6.20 750.4819.Manipur 3.70 0 148.48 0 26.42 0 38.80 217.4020.Meghalaya 31.42 0 19.54 1.59 0 1.70 54.2521.Mizoram 13.49 0 48.44 0 8.15 1.18 0.00 71.2622.Nagaland 0.36 0 74.56 0 9.08 0.16 16.50 100.6623.Orissa 0 979.61 0 0 18.55 0.20 3.40 1001.7624.Punjab 0.28 376.43 0 0 336.10 50.00 9.40 772.2125.Pondicherry 0 41.57 0 0 0 0 1.70 43.2726.Rajashan 0 339.91 0 0 68.39 0.11 39.30 447.7127.Sikkim 0 47.41 0 0 2.15 0 14.80 64.3628.Tamil Nadu 1.24 590.11 0 0 0 0 13.90 605.2529.Tripura 8.51 0 66.57 0 3.48 0 0.10 78.6630.Uttar Pradesh 975.58 4041.27 0 0 304.64 0 136.40 5457.8931.Uttaranchal 0 384.09 0 0 0.26 0 0.40 384.7532.West Bengal 535.84 1667.50 0 927.50 18.16 0.05 88.10 3237.15TOTAL 3895.78 22065.78 1233.99 3067.82 2221.53 235.10 1414.31 34134.31 * There are some other institutions like BHEL which do not appear here.
97
Source: Planning Commission (2002) : Annual Report on the Working of State Electricity Boards and Electricity Departments , May, p.176
101
State Road Transport Undertakings
The other major PSUs to suffer poor financial performance are State
Road Transport Undertakings (SRTUs). As shown in Table 40, every state
has faced losses in its SRTU, with relatively the largest amount of loss
occurring in Tamil Nadu (-Rs 925 crore) followed by Maharashtra (-Rs 656
crore) and Gujarat (-Rs 527 crore) during 1997-2000. These losses have
occurred during the first three years of the ninth plan, for which the states had
projected instead revenue surpluses from their SRTUs. Similar backlog in
achievement is seen in Andhra Pradesh, Haryana, Karnataka, Kerala, Madhya
Pradesh and Orissa. Relatively better performance as compared with the ninth
plan target has been shown by West Bengal and Punjab, but all of them conti-
nued to show financial losses (Table 40).
Performance of State PSUs as a Group
The N. J. Kurian Study Group cited earlier has provided very many state-
level details on the performances of their PSUs. The broad conclusions of the
Study Group Report are summarised below:
• The total investment in State PSUs. Andhra Pradesh, Delhi,
Gujarat, Karnataka, Kerala, Maharashtra, Tamil Nadu, Uttar
Pradesh and West Bengal accounted for about 80 per cent of the
total investment in State PSUs in 1998-99 [Table 41 (A)]. Delhi
topped followed by Andhra Pradesh, Maharashtra and Uttar
Pradesh. Each year investments were shooting up by more than
Rs 10,000 crore. In 1998-99, the incremental investment were to
the tune of Rs 26,316.68 crore.
• Accumulated losses continued to be the bane of the State PSUs
[Table 41(B)]. They were a common occurrence for all the States
during all the years. Over 90 per cent of the accumulated losses
were incurred by twelve States that included Andhra Pradesh,
Assam, Delhi (UT), Gujarat, Karnataka, Kerala, Maharashtra,
Orissa, Punjab, Tamil Nadu, Uttar Pradesh and West Bengal.
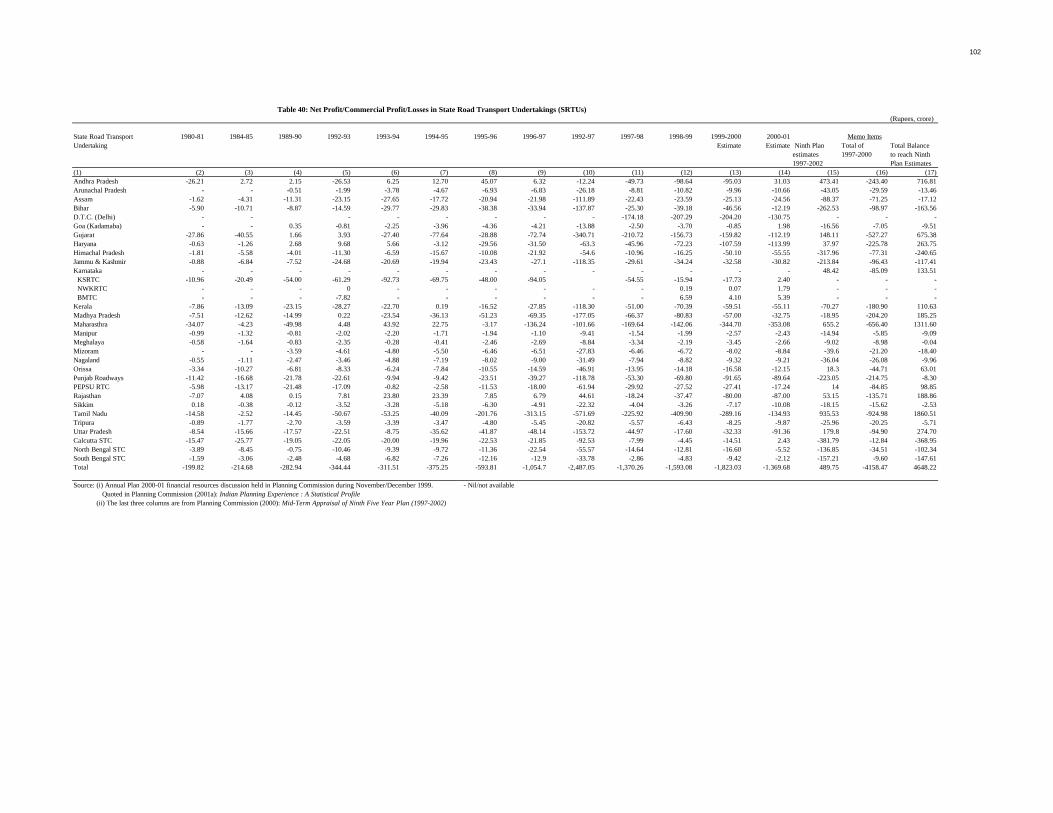
102
(Rupees, crore)
State Road Transport 1980-81 1984-85 1989-90 1992-93 1993-94 1994-95 1995-96 1996-97 1992-97 1997-98 1998-99 1999-2000 2000-01Undertaking Estimate Estimate Ninth Plan Total of Total Balance
estimates 1997-2000 to reach Ninth1997-2002 Plan Estimates
(1) (2) (3) (4) (5) (6) (7) (8) (9) (10) (11) (12) (13) (14) (15) (16) (17)Andhra Pradesh -26.21 2.72 2.15 -26.53 6.25 12.70 45.07 6.32 -12.24 -49.73 -98.64 -95.03 31.03 473.41 -243.40 716.81Arunachal Pradesh - - -0.51 -1.99 -3.78 -4.67 -6.93 -6.83 -26.18 -8.81 -10.82 -9.96 -10.66 -43.05 -29.59 -13.46Assam -1.62 -4.31 -11.31 -23.15 -27.65 -17.72 -20.94 -21.98 -111.89 -22.43 -23.59 -25.13 -24.56 -88.37 -71.25 -17.12Bihar -5.90 -10.71 -8.87 -14.59 -29.77 -29.83 -38.38 -33.94 -137.87 -25.30 -39.18 -46.56 -12.19 -262.53 -98.97 -163.56D.T.C. (Delhi) - - - - - - - - -174.18 -207.29 -204.20 -130.75 - - -Goa (Kadamaba) - - 0.35 -0.81 -2.25 -3.96 -4.36 -4.21 -13.88 -2.50 -3.70 -0.85 1.98 -16.56 -7.05 -9.51Gujarat -27.86 -40.55 1.66 3.93 -27.40 -77.64 -28.88 -72.74 -340.71 -210.72 -156.73 -159.82 -112.19 148.11 -527.27 675.38Haryana -0.63 -1.26 2.68 9.68 5.66 -3.12 -29.56 -31.50 -63.3 -45.96 -72.23 -107.59 -113.99 37.97 -225.78 263.75Himachal Pradesh -1.81 -5.58 -4.01 -11.30 -6.59 -15.67 -10.08 -21.92 -54.6 -10.96 -16.25 -50.10 -55.55 -317.96 -77.31 -240.65Jammu & Kashmir -0.88 -6.84 -7.52 -24.68 -20.69 -19.94 -23.43 -27.1 -118.35 -29.61 -34.24 -32.58 -30.82 -213.84 -96.43 -117.41Karnataka - - - - - - - - - - - - - 48.42 -85.09 133.51 KSRTC -10.96 -20.49 -54.00 -61.29 -92.73 -69.75 -48.00 -94.05 -54.55 -15.94 -17.73 2.40 - - - NWKRTC - - - 0 - - - - - - 0.19 0.07 1.79 - - - BMTC - - - -7.82 - - - - - - 6.59 4.10 5.39 - - -Kerala -7.86 -13.09 -23.15 -28.27 -22.70 0.19 -16.52 -27.85 -118.30 -51.00 -70.39 -59.51 -55.11 -70.27 -180.90 110.63Madhya Pradesh -7.51 -12.62 -14.99 0.22 -23.54 -36.13 -51.23 -69.35 -177.05 -66.37 -80.83 -57.00 -32.75 -18.95 -204.20 185.25Maharasthra -34.07 -4.23 -49.98 4.48 43.92 22.75 -3.17 -136.24 -101.66 -169.64 -142.06 -344.70 -353.08 655.2 -656.40 1311.60Manipur -0.99 -1.32 -0.81 -2.02 -2.20 -1.71 -1.94 -1.10 -9.41 -1.54 -1.99 -2.57 -2.43 -14.94 -5.85 -9.09Meghalaya -0.58 -1.64 -0.83 -2.35 -0.28 -0.41 -2.46 -2.69 -8.84 -3.34 -2.19 -3.45 -2.66 -9.02 -8.98 -0.04Mizoram - - -3.59 -4.61 -4.80 -5.50 -6.46 -6.51 -27.83 -6.46 -6.72 -8.02 -8.84 -39.6 -21.20 -18.40Nagaland -0.55 -1.11 -2.47 -3.46 -4.88 -7.19 -8.02 -9.00 -31.49 -7.94 -8.82 -9.32 -9.21 -36.04 -26.08 -9.96Orissa -3.34 -10.27 -6.81 -8.33 -6.24 -7.84 -10.55 -14.59 -46.91 -13.95 -14.18 -16.58 -12.15 18.3 -44.71 63.01Punjab Roadways -11.42 -16.68 -21.78 -22.61 -9.94 -9.42 -23.51 -39.27 -118.78 -53.30 -69.80 -91.65 -89.64 -223.05 -214.75 -8.30PEPSU RTC -5.98 -13.17 -21.48 -17.09 -0.82 -2.58 -11.53 -18.00 -61.94 -29.92 -27.52 -27.41 -17.24 14 -84.85 98.85Rajasthan -7.07 4.08 0.15 7.81 23.80 23.39 7.85 6.79 44.61 -18.24 -37.47 -80.00 -87.00 53.15 -135.71 188.86Sikkim 0.18 -0.38 -0.12 -3.52 -3.28 -5.18 -6.30 -4.91 -22.32 -4.04 -3.26 -7.17 -10.08 -18.15 -15.62 -2.53Tamil Nadu -14.58 -2.52 -14.45 -50.67 -53.25 -40.09 -201.76 -313.15 -571.69 -225.92 -409.90 -289.16 -134.93 935.53 -924.98 1860.51Tripura -0.89 -1.77 -2.70 -3.59 -3.39 -3.47 -4.80 -5.45 -20.82 -5.57 -6.43 -8.25 -9.87 -25.96 -20.25 -5.71Uttar Pradesh -8.54 -15.66 -17.57 -22.51 -8.75 -35.62 -41.87 -48.14 -153.72 -44.97 -17.60 -32.33 -91.36 179.8 -94.90 274.70Calcutta STC -15.47 -25.77 -19.05 -22.05 -20.00 -19.96 -22.53 -21.85 -92.53 -7.99 -4.45 -14.51 2.43 -381.79 -12.84 -368.95North Bengal STC -3.89 -8.45 -0.75 -10.46 -9.39 -9.72 -11.36 -22.54 -55.57 -14.64 -12.81 -16.60 -5.52 -136.85 -34.51 -102.34South Bengal STC -1.59 -3.06 -2.48 -4.68 -6.82 -7.26 -12.16 -12.9 -33.78 -2.86 -4.83 -9.42 -2.12 -157.21 -9.60 -147.61Total -199.82 -214.68 -282.94 -344.44 -311.51 -375.25 -593.81 -1,054.7 -2,487.05 -1,370.26 -1,593.08 -1,823.03 -1.369.68 489.75 -4158.47 4648.22
Source: (i) Annual Plan 2000-01 financial resources discussion held in Planning Commission during November/December 1999. - Nil/not availableQuoted in Planning Commission (2001a): Indian Planning Experience : A Statistical Profile
(ii) The last three columns are from Planning Commission (2000): Mid-Term Appraisal of Ninth Five Year Plan (1997-2002)
Memo Items
Table 40: Net Profit/Commercial Profit/Losses in State Road Transport Undertakings (SRTUs)
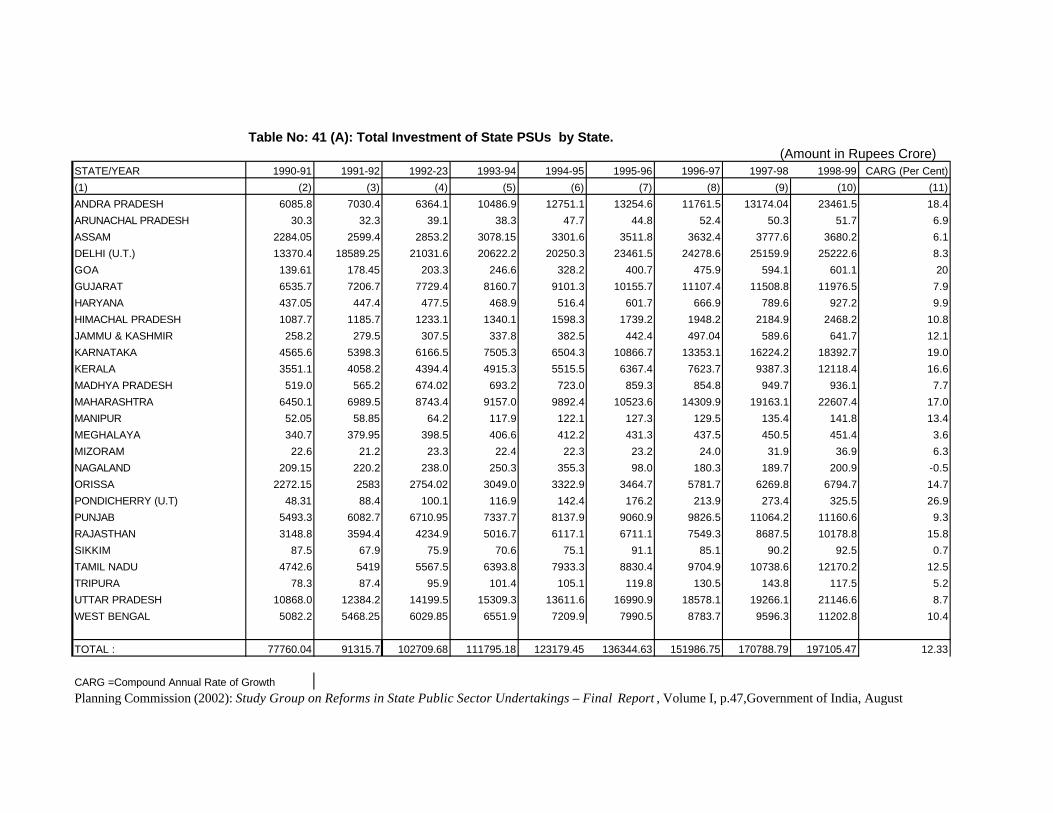
Table No: 41 (A): Total Investment of State PSUs by State. (Amount in Rupees Crore)
STATE/YEAR 1990-91 1991-92 1992-23 1993-94 1994-95 1995-96 1996-97 1997-98 1998-99 CARG (Per Cent)
(1) (2) (3) (4) (5) (6) (7) (8) (9) (10) (11)
ANDRA PRADESH 6085.8 7030.4 6364.1 10486.9 12751.1 13254.6 11761.5 13174.04 23461.5 18.4
ARUNACHAL PRADESH 30.3 32.3 39.1 38.3 47.7 44.8 52.4 50.3 51.7 6.9
ASSAM 2284.05 2599.4 2853.2 3078.15 3301.6 3511.8 3632.4 3777.6 3680.2 6.1
DELHI (U.T.) 13370.4 18589.25 21031.6 20622.2 20250.3 23461.5 24278.6 25159.9 25222.6 8.3
GOA 139.61 178.45 203.3 246.6 328.2 400.7 475.9 594.1 601.1 20
GUJARAT 6535.7 7206.7 7729.4 8160.7 9101.3 10155.7 11107.4 11508.8 11976.5 7.9
HARYANA 437.05 447.4 477.5 468.9 516.4 601.7 666.9 789.6 927.2 9.9
HIMACHAL PRADESH 1087.7 1185.7 1233.1 1340.1 1598.3 1739.2 1948.2 2184.9 2468.2 10.8
JAMMU & KASHMIR 258.2 279.5 307.5 337.8 382.5 442.4 497.04 589.6 641.7 12.1
KARNATAKA 4565.6 5398.3 6166.5 7505.3 6504.3 10866.7 13353.1 16224.2 18392.7 19.0
KERALA 3551.1 4058.2 4394.4 4915.3 5515.5 6367.4 7623.7 9387.3 12118.4 16.6
MADHYA PRADESH 519.0 565.2 674.02 693.2 723.0 859.3 854.8 949.7 936.1 7.7
MAHARASHTRA 6450.1 6989.5 8743.4 9157.0 9892.4 10523.6 14309.9 19163.1 22607.4 17.0
MANIPUR 52.05 58.85 64.2 117.9 122.1 127.3 129.5 135.4 141.8 13.4
MEGHALAYA 340.7 379.95 398.5 406.6 412.2 431.3 437.5 450.5 451.4 3.6
MIZORAM 22.6 21.2 23.3 22.4 22.3 23.2 24.0 31.9 36.9 6.3
NAGALAND 209.15 220.2 238.0 250.3 355.3 98.0 180.3 189.7 200.9 -0.5
ORISSA 2272.15 2583 2754.02 3049.0 3322.9 3464.7 5781.7 6269.8 6794.7 14.7
PONDICHERRY (U.T) 48.31 88.4 100.1 116.9 142.4 176.2 213.9 273.4 325.5 26.9
PUNJAB 5493.3 6082.7 6710.95 7337.7 8137.9 9060.9 9826.5 11064.2 11160.6 9.3
RAJASTHAN 3148.8 3594.4 4234.9 5016.7 6117.1 6711.1 7549.3 8687.5 10178.8 15.8
SIKKIM 87.5 67.9 75.9 70.6 75.1 91.1 85.1 90.2 92.5 0.7
TAMIL NADU 4742.6 5419 5567.5 6393.8 7933.3 8830.4 9704.9 10738.6 12170.2 12.5
TRIPURA 78.3 87.4 95.9 101.4 105.1 119.8 130.5 143.8 117.5 5.2
UTTAR PRADESH 10868.0 12384.2 14199.5 15309.3 13611.6 16990.9 18578.1 19266.1 21146.6 8.7
WEST BENGAL 5082.2 5468.25 6029.85 6551.9 7209.9 7990.5 8783.7 9596.3 11202.8 10.4
TOTAL : 77760.04 91315.7 102709.68 111795.18 123179.45 136344.63 151986.75 170788.79 197105.47 12.33
CARG =Compound Annual Rate of Growth
Planning Commission (2002): Study Group on Reforms in State Public Sector Undertakings – Final Report , Volume I, p.47,Government of India, August
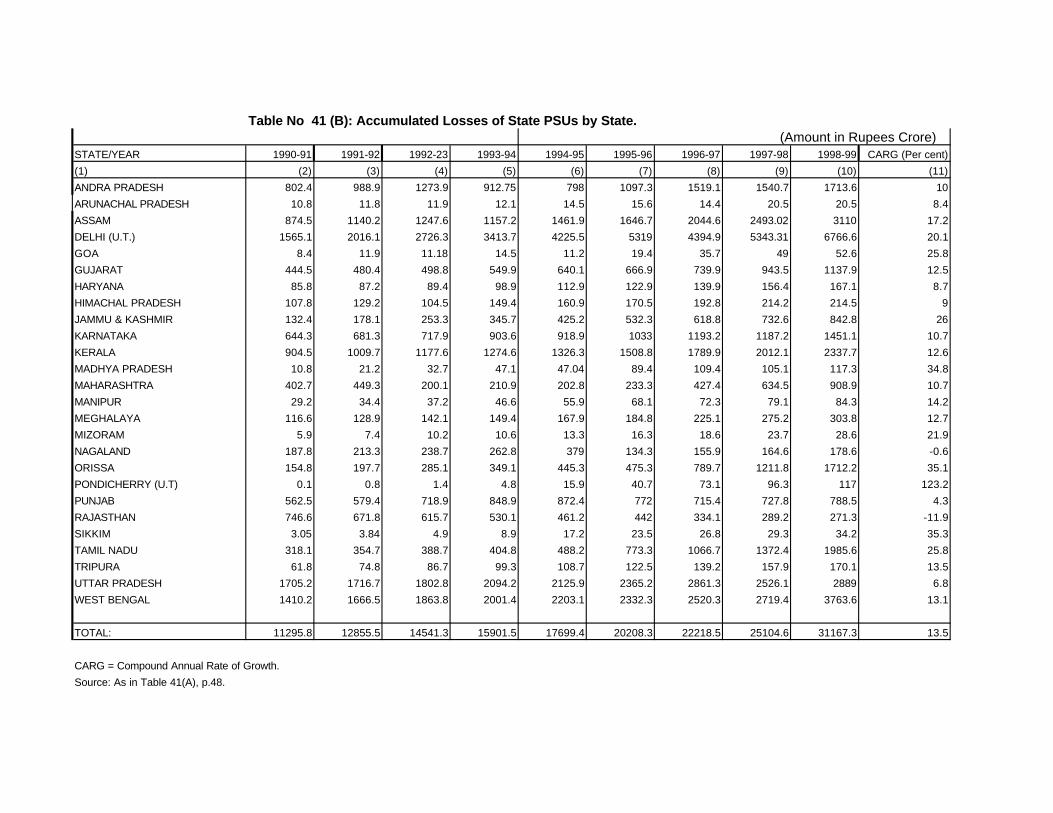
Table No 41 (B): Accumulated Losses of State PSUs by State. (Amount in Rupees Crore)
STATE/YEAR 1990-91 1991-92 1992-23 1993-94 1994-95 1995-96 1996-97 1997-98 1998-99 CARG (Per cent)
(1) (2) (3) (4) (5) (6) (7) (8) (9) (10) (11)
ANDRA PRADESH 802.4 988.9 1273.9 912.75 798 1097.3 1519.1 1540.7 1713.6 10
ARUNACHAL PRADESH 10.8 11.8 11.9 12.1 14.5 15.6 14.4 20.5 20.5 8.4
ASSAM 874.5 1140.2 1247.6 1157.2 1461.9 1646.7 2044.6 2493.02 3110 17.2
DELHI (U.T.) 1565.1 2016.1 2726.3 3413.7 4225.5 5319 4394.9 5343.31 6766.6 20.1
GOA 8.4 11.9 11.18 14.5 11.2 19.4 35.7 49 52.6 25.8
GUJARAT 444.5 480.4 498.8 549.9 640.1 666.9 739.9 943.5 1137.9 12.5
HARYANA 85.8 87.2 89.4 98.9 112.9 122.9 139.9 156.4 167.1 8.7
HIMACHAL PRADESH 107.8 129.2 104.5 149.4 160.9 170.5 192.8 214.2 214.5 9
JAMMU & KASHMIR 132.4 178.1 253.3 345.7 425.2 532.3 618.8 732.6 842.8 26
KARNATAKA 644.3 681.3 717.9 903.6 918.9 1033 1193.2 1187.2 1451.1 10.7
KERALA 904.5 1009.7 1177.6 1274.6 1326.3 1508.8 1789.9 2012.1 2337.7 12.6
MADHYA PRADESH 10.8 21.2 32.7 47.1 47.04 89.4 109.4 105.1 117.3 34.8
MAHARASHTRA 402.7 449.3 200.1 210.9 202.8 233.3 427.4 634.5 908.9 10.7
MANIPUR 29.2 34.4 37.2 46.6 55.9 68.1 72.3 79.1 84.3 14.2
MEGHALAYA 116.6 128.9 142.1 149.4 167.9 184.8 225.1 275.2 303.8 12.7
MIZORAM 5.9 7.4 10.2 10.6 13.3 16.3 18.6 23.7 28.6 21.9
NAGALAND 187.8 213.3 238.7 262.8 379 134.3 155.9 164.6 178.6 -0.6
ORISSA 154.8 197.7 285.1 349.1 445.3 475.3 789.7 1211.8 1712.2 35.1
PONDICHERRY (U.T) 0.1 0.8 1.4 4.8 15.9 40.7 73.1 96.3 117 123.2
PUNJAB 562.5 579.4 718.9 848.9 872.4 772 715.4 727.8 788.5 4.3
RAJASTHAN 746.6 671.8 615.7 530.1 461.2 442 334.1 289.2 271.3 -11.9
SIKKIM 3.05 3.84 4.9 8.9 17.2 23.5 26.8 29.3 34.2 35.3
TAMIL NADU 318.1 354.7 388.7 404.8 488.2 773.3 1066.7 1372.4 1985.6 25.8
TRIPURA 61.8 74.8 86.7 99.3 108.7 122.5 139.2 157.9 170.1 13.5
UTTAR PRADESH 1705.2 1716.7 1802.8 2094.2 2125.9 2365.2 2861.3 2526.1 2889 6.8
WEST BENGAL 1410.2 1666.5 1863.8 2001.4 2203.1 2332.3 2520.3 2719.4 3763.6 13.1
TOTAL: 11295.8 12855.5 14541.3 15901.5 17699.4 20208.3 22218.5 25104.6 31167.3 13.5
CARG = Compound Annual Rate of Growth.
Source: As in Table 41(A), p.48.
105
Delhi and West Bengal were the loss leaders with Assam, Uttar Pradesh, Kerala and
Tamil Nadu as their ardent followers.
• All the State PSUs taken in different years of the study were not
able to earn the expected return on investment. Sectorally, the
position was not different. The benchmark rate of return for the
manufacturing State PSUs is 12 per cent per annum on their
investment. The enterprises in trading & services category need to
earn an optimum rate of return of 10 per cent per annum on their
investment. The financial category of enterprises are expected to
earn a rate of return of 9 per cent on their investment. The
promotiona l State PSUs are expected to earn a rate of return of 8
per cent per annum. The utility enterprises should earn a rate of
return of 12 per cent.
Data presented in Table 41(C) brings out the extent of gap in the sectoral rates
of return. For instance, in the case of the most important utility enterprises, it
is observed that Andhra Pradesh, Gujarat, Himachal Pradesh, Karnataka,
Kerala, Maharashtra, Pondicherry, Punjab, Rajasthan, Tamil Nadu and Uttar
Pradesh are the states where utility enterprises have consistently showed a
positive return although the returns have generally been below the benchmark
rate. Delhi, Mizoram and Tripura experienced a consistently negative rate of
return in case of the utility enterprises. Other states exhibited a mixed trend.
As for the return on capital investments is concerned, the following
extracts from the Reports of the Comptroller and Auditor General of India are
illustrative of the malaise at the states’ PSUs and statutory corporations:
Karnataka State
“(i) As on 31 March 2002, the total investment in 76 Public
Sector Undertakings (70 government companies and 6
statutory corporations) was Rs 22,678.03 crore (equity: Rs
5,104.00 crore; long-term loans Rs 14,980.70 crore; and
share application money: Rs 2,593.33 crore).
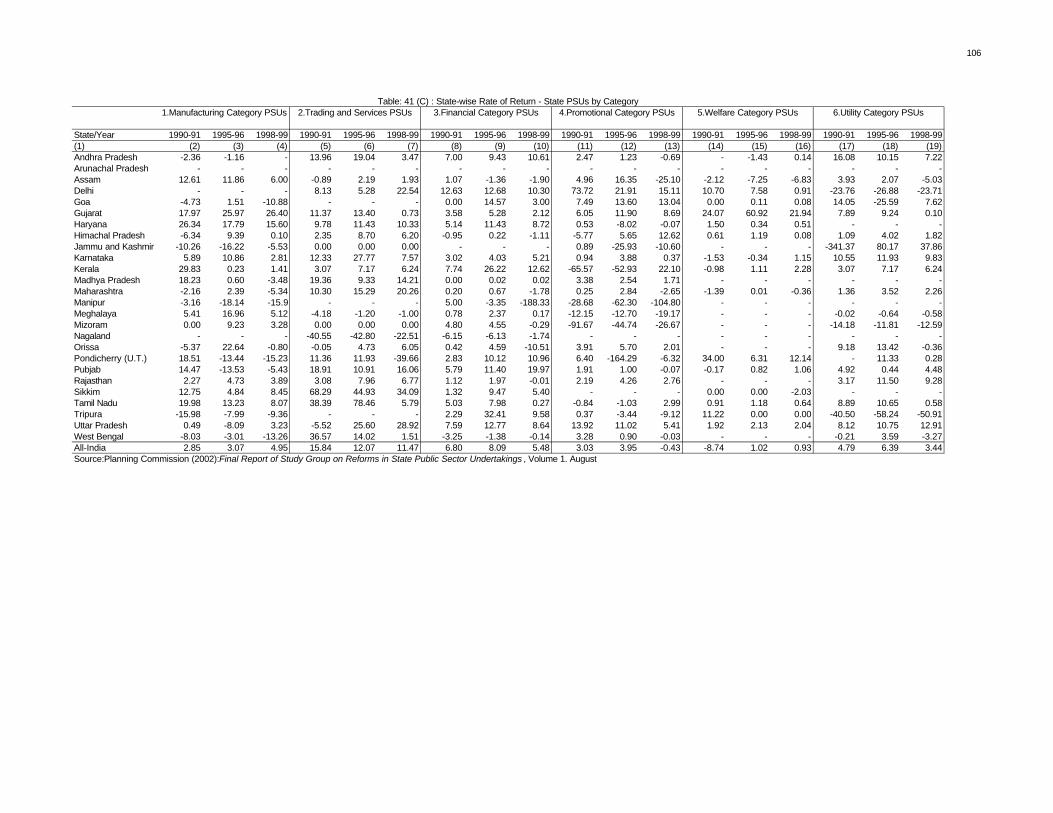
106
State/Year 1990-91 1995-96 1998-99 1990-91 1995-96 1998-99 1990-91 1995-96 1998-99 1990-91 1995-96 1998-99 1990-91 1995-96 1998-99 1990-91 1995-96 1998-99(1) (2) (3) (4) (5) (6) (7) (8) (9) (10) (11) (12) (13) (14) (15) (16) (17) (18) (19)Andhra Pradesh -2.36 -1.16 - 13.96 19.04 3.47 7.00 9.43 10.61 2.47 1.23 -0.69 - -1.43 0.14 16.08 10.15 7.22Arunachal Pradesh - - - - - - - - - - - - - - - - - -Assam 12.61 11.86 6.00 -0.89 2.19 1.93 1.07 -1.36 -1.90 4.96 16.35 -25.10 -2.12 -7.25 -6.83 3.93 2.07 -5.03Delhi - - - 8.13 5.28 22.54 12.63 12.68 10.30 73.72 21.91 15.11 10.70 7.58 0.91 -23.76 -26.88 -23.71Goa -4.73 1.51 -10.88 - - - 0.00 14.57 3.00 7.49 13.60 13.04 0.00 0.11 0.08 14.05 -25.59 7.62Gujarat 17.97 25.97 26.40 11.37 13.40 0.73 3.58 5.28 2.12 6.05 11.90 8.69 24.07 60.92 21.94 7.89 9.24 0.10Haryana 26.34 17.79 15.60 9.78 11.43 10.33 5.14 11.43 8.72 0.53 -8.02 -0.07 1.50 0.34 0.51 - - -Himachal Pradesh -6.34 9.39 0.10 2.35 8.70 6.20 -0.95 0.22 -1.11 -5.77 5.65 12.62 0.61 1.19 0.08 1.09 4.02 1.82Jammu and Kashmir -10.26 -16.22 -5.53 0.00 0.00 0.00 - - - 0.89 -25.93 -10.60 - - - -341.37 80.17 37.86Karnataka 5.89 10.86 2.81 12.33 27.77 7.57 3.02 4.03 5.21 0.94 3.88 0.37 -1.53 -0.34 1.15 10.55 11.93 9.83Kerala 29.83 0.23 1.41 3.07 7.17 6.24 7.74 26.22 12.62 -65.57 -52.93 22.10 -0.98 1.11 2.28 3.07 7.17 6.24Madhya Pradesh 18.23 0.60 -3.48 19.36 9.33 14.21 0.00 0.02 0.02 3.38 2.54 1.71 - - - - - -Maharashtra -2.16 2.39 -5.34 10.30 15.29 20.26 0.20 0.67 -1.78 0.25 2.84 -2.65 -1.39 0.01 -0.36 1.36 3.52 2.26Manipur -3.16 -18.14 -15.9 - - - 5.00 -3.35 -188.33 -28.68 -62.30 -104.80 - - - - - -Meghalaya 5.41 16.96 5.12 -4.18 -1.20 -1.00 0.78 2.37 0.17 -12.15 -12.70 -19.17 - - - -0.02 -0.64 -0.58Mizoram 0.00 9.23 3.28 0.00 0.00 0.00 4.80 4.55 -0.29 -91.67 -44.74 -26.67 - - - -14.18 -11.81 -12.59Nagaland - - - -40.55 -42.80 -22.51 -6.15 -6.13 -1.74 - - - - - - - - -Orissa -5.37 22.64 -0.80 -0.05 4.73 6.05 0.42 4.59 -10.51 3.91 5.70 2.01 - - - 9.18 13.42 -0.36Pondicherry (U.T.) 18.51 -13.44 -15.23 11.36 11.93 -39.66 2.83 10.12 10.96 6.40 -164.29 -6.32 34.00 6.31 12.14 - 11.33 0.28Pubjab 14.47 -13.53 -5.43 18.91 10.91 16.06 5.79 11.40 19.97 1.91 1.00 -0.07 -0.17 0.82 1.06 4.92 0.44 4.48Rajasthan 2.27 4.73 3.89 3.08 7.96 6.77 1.12 1.97 -0.01 2.19 4.26 2.76 - - - 3.17 11.50 9.28Sikkim 12.75 4.84 8.45 68.29 44.93 34.09 1.32 9.47 5.40 - - - 0.00 0.00 -2.03 - - -Tamil Nadu 19.98 13.23 8.07 38.39 78.46 5.79 5.03 7.98 0.27 -0.84 -1.03 2.99 0.91 1.18 0.64 8.89 10.65 0.58Tripura -15.98 -7.99 -9.36 - - - 2.29 32.41 9.58 0.37 -3.44 -9.12 11.22 0.00 0.00 -40.50 -58.24 -50.91Uttar Pradesh 0.49 -8.09 3.23 -5.52 25.60 28.92 7.59 12.77 8.64 13.92 11.02 5.41 1.92 2.13 2.04 8.12 10.75 12.91West Bengal -8.03 -3.01 -13.26 36.57 14.02 1.51 -3.25 -1.38 -0.14 3.28 0.90 -0.03 - - - -0.21 3.59 -3.27All-India 2.85 3.07 4.95 15.84 12.07 11.47 6.80 8.09 5.48 3.03 3.95 -0.43 -8.74 1.02 0.93 4.79 6.39 3.44Source:Planning Commission (2002):Final Report of Study Group on Reforms in State Public Sector Undertakings , Volume 1. August
Table: 41 (C) : State-wise Rate of Return - State PSUs by Category1.Manufacturing Category PSUs 2.Trading and Services PSUs 3.Financial Category PSUs 4.Promotional Category PSUs 5.Welfare Category PSUs 6.Utility Category PSUs
107
“Out of 57 working and 13 non-working government companies
only 37 working government companies and 5 non-working
government companies have finalised their accounts for 2001-02
by September 2002. Accounts of all 6 statutory corporations
were in arrears for one year. The aggregate profit of 17
government companies, which finalised their accounts for the
year 2001-02, was Rs 279.79 crore. The accumulated losses of
13 companies and 3 corporations had far exceeded their paid up
capital” (Epitome of GAG’s Reports on the Government of
Karnataka, For the year ended 31 March 2002)
Rajasthan
“In the State of Rajasthan there were twenty government
companies (including three subsidiaries) and four statutory
corporations as on 31 March 2000. The aggregate investment in
these PSUs was Rs 10,838.49 crore (share capital Rs 2,266.65
crore and loan Rs 8,571.84 crore). During the year 1999-2000,
the state government received dividend of Rs 3.20 crore from
two government companies representing a return of 1.06 per cent
on its total equity as against 1.49 per cent received in previous
year.
“Out of 20 government companies, only 9 companies have
finalised (September 2000) accounts for the year 1999-2000. Six
of these companies earned profits aggregating Rs 40.24 crore,
while the losses of the three others were Rs 0.28 crore. The
accounts of the remaining 11 companies were in arrears for
periods ranging from one year to four years. Based on the latest
available accounts, the accumulated losses (Rs 46.49 crore) of
six government companies had exceeded their paid-up capital
(Rs 14.06 crore)” (Report of the Comptroller and Auditor
General of India , For the year ended 31 March 2000,
Commercial, Government of Rajasthan).
108
State-Wise Expenditure Profiles
Rapid Expansion in Non-Developmental Expenditure
The second major factor contributing to the deterioration in the fiscal
balance of the major states during the recent period has been the sudden jump
in non-development expenditures following the upward revision of pay and
pensions of state government as well as local bodies’ employees. As shown
by the Eleventh Finance Commission (p.185), substantial revisions were
effected in the pension payments of major states, with the average increase
working out to 38.5 per cent during 1998-99 as against an increase of 17.7 per
cent in the previous year. Amongst the states, which effected the highest
revisions in pension, payments in 1998-99 were Goa (113.0 per cent) followed
by Haryana (106.0 per cent), Uttar Pradesh (68.6 per cent), Punjab (65.6 per
cent), Gujarat (62.3 per cent) and Madhya Pradesh (51.9 per cent).
Yet another important component of non-development expenditures of
states has been the acceleration in the growth of interest payments. As shown
in Appendix Table 28, gross interest payments as percentage of revenue
receipts of states has steadily increased, with the average for all the states
rising from 17.7 per cent in 1997-98 to 23.6 per cent in 2002-03 (BE). Earlier,
the relevant ratio had risen rather rapidly from 7.5 per cent in 1980-81 to 13.0
per cent in 1990-91 and further to 17.7 per cent in 1997-98. The states facing
these ratios more than the all-states average (23.6 per cent) in the latest year
are: West Bengal (41.8 per cent), Uttar Pradesh (31 per cent), Punjab (24.8 per
cent), Gujarat (26.7 per cent), Bihar (23.8 per cent) and Andhra Pradesh (24.8
per cent).
Developmental Versus Non-Developmental Expenditures of States
In the decomposition of aggregate expenditure as between developmental
and non-developmental expenditures (Appendix Tables 17 and 18), all states
have experienced some erosion in their proportions of expenditure earmarked
for developmental purposes, and their proportions of non-developmental
expenditures have expanded as a result of, as repeatedly emphasized earlier,
salary and pension revisions and increasing debt servicing.
109
If the proportions of 58 per cent to 60 per cent of aggregate expenditures,
which are all-states averages, are considered as the benchmark for
developmental expenditure purposes for recent years, all the southern states of
Karnataka, Andhra Pradesh, Kerala and Tamil Nadu (ranging from 63 per cent
to 58 per cent) as well as Haryana (63 per cent), Gujarat (68 per cent),
Madhya Pradesh (62 per cent) and Rajasthan (58 per cent), show better record
in their attempt to devote higher proportions of expenditures for
developmental purposes. Amongst the major states, Punjab has been having
the lowest share of developmental expenditure at about 45-46 per cent in
recent years, probably because of the diversion of resources in favour of the
forces of law and order, apart from the general causes as applicable to all
other states; in the 1980s its share of developmental expenditure was as high
as 73 per cent to 75 per cent when the all-states average stood at 69-70 per
cent. Uttar Pradesh (49 per cent in 2002-03), Maharashtra (49 per cent), West
Bengal (54 per cent) and Orissa (54 per cent) are the other states to experience
low and sharply declining proportions of state expenditures earmarked for
social and economic developmental purposes. In the case of Maharashtra, the
proportions were about 72 per cent in the late 1980s and until the early 1990s;
in its case, a precipitate fall has occurred in the second half of the 1990s.
Likewise, Uttar Pradesh, West Bengal and Orissa too had these ratios at 67
per cent to 69 per cent in the late 1980s.
Looking at it differently, however, the ratio of development expenditure
to GSDP statewise presents a somewhat contrasting picture (Table 42). While
three of the four southern states, namely, Karnataka, Kerala and Tamil Nadu,
have experienced lower developmental expenditures to GSDP ratios during
the latest period 1998-99 to 2002-03 (BE) as compared with the previous
decade, the low income states of Bihar, Madhya Pradesh and Orissa as well as
West Bengal in the middle -income category have shown higher proportions in
recent years as compared with the past decade. One explanation could be
that this is partly statistical because these are the very states which have faced,
as explained in a subsequent section, lower rates of growth of SDP and hence
their ratios are based on relatively lower SDP numbers.
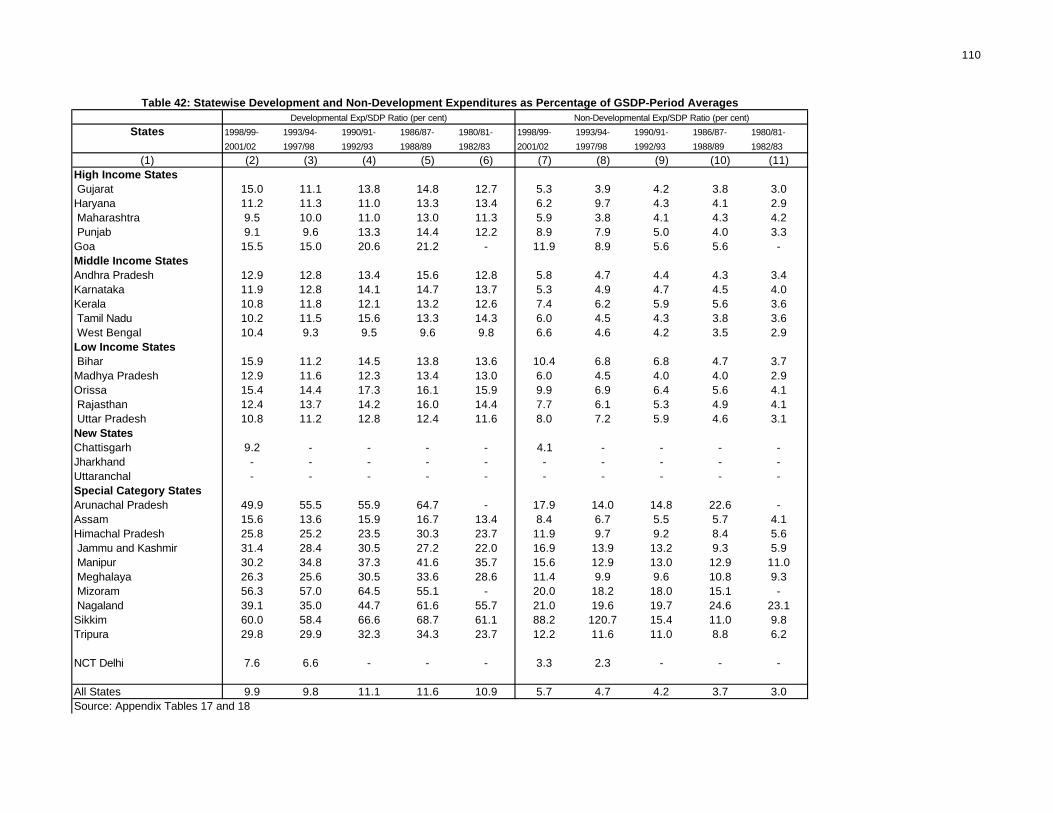
110
1998/99- 1993/94- 1990/91- 1986/87- 1980/81- 1998/99- 1993/94- 1990/91- 1986/87- 1980/81-
2001/02 1997/98 1992/93 1988/89 1982/83 2001/02 1997/98 1992/93 1988/89 1982/83
(2) (3) (4) (5) (6) (7) (8) (9) (10) (11)High Income States Gujarat 15.0 11.1 13.8 14.8 12.7 5.3 3.9 4.2 3.8 3.0Haryana 11.2 11.3 11.0 13.3 13.4 6.2 9.7 4.3 4.1 2.9 Maharashtra 9.5 10.0 11.0 13.0 11.3 5.9 3.8 4.1 4.3 4.2 Punjab 9.1 9.6 13.3 14.4 12.2 8.9 7.9 5.0 4.0 3.3Goa 15.5 15.0 20.6 21.2 - 11.9 8.9 5.6 5.6 -Middle Income StatesAndhra Pradesh 12.9 12.8 13.4 15.6 12.8 5.8 4.7 4.4 4.3 3.4Karnataka 11.9 12.8 14.1 14.7 13.7 5.3 4.9 4.7 4.5 4.0Kerala 10.8 11.8 12.1 13.2 12.6 7.4 6.2 5.9 5.6 3.6 Tamil Nadu 10.2 11.5 15.6 13.3 14.3 6.0 4.5 4.3 3.8 3.6 West Bengal 10.4 9.3 9.5 9.6 9.8 6.6 4.6 4.2 3.5 2.9Low Income States Bihar 15.9 11.2 14.5 13.8 13.6 10.4 6.8 6.8 4.7 3.7Madhya Pradesh 12.9 11.6 12.3 13.4 13.0 6.0 4.5 4.0 4.0 2.9Orissa 15.4 14.4 17.3 16.1 15.9 9.9 6.9 6.4 5.6 4.1 Rajasthan 12.4 13.7 14.2 16.0 14.4 7.7 6.1 5.3 4.9 4.1 Uttar Pradesh 10.8 11.2 12.8 12.4 11.6 8.0 7.2 5.9 4.6 3.1New StatesChattisgarh 9.2 - - - - 4.1 - - - -Jharkhand - - - - - - - - - -Uttaranchal - - - - - - - - - -Special Category StatesArunachal Pradesh 49.9 55.5 55.9 64.7 - 17.9 14.0 14.8 22.6 -Assam 15.6 13.6 15.9 16.7 13.4 8.4 6.7 5.5 5.7 4.1Himachal Pradesh 25.8 25.2 23.5 30.3 23.7 11.9 9.7 9.2 8.4 5.6 Jammu and Kashmir 31.4 28.4 30.5 27.2 22.0 16.9 13.9 13.2 9.3 5.9 Manipur 30.2 34.8 37.3 41.6 35.7 15.6 12.9 13.0 12.9 11.0 Meghalaya 26.3 25.6 30.5 33.6 28.6 11.4 9.9 9.6 10.8 9.3 Mizoram 56.3 57.0 64.5 55.1 - 20.0 18.2 18.0 15.1 - Nagaland 39.1 35.0 44.7 61.6 55.7 21.0 19.6 19.7 24.6 23.1Sikkim 60.0 58.4 66.6 68.7 61.1 88.2 120.7 15.4 11.0 9.8Tripura 29.8 29.9 32.3 34.3 23.7 12.2 11.6 11.0 8.8 6.2
NCT Delhi 7.6 6.6 - - - 3.3 2.3 - - -
All States 9.9 9.8 11.1 11.6 10.9 5.7 4.7 4.2 3.7 3.0Source: Appendix Tables 17 and 18
(1)
Table 42: Statewise Development and Non-Development Expenditures as Percentage of GSDP-Period AveragesDevelopmental Exp/SDP Ratio (per cent) Non-Developmental Exp/SDP Ratio (per cent)
States
111
States’ Plan Expenditures
States’ plan expenditures to GSDP ratios generally trace the same path
as development expenditure proportions. However, there are some surprising
differences. Maharashtra is getting bracketed with Bihar and Punjab, with all
the three states having the lowest plan expenditures to GSDP ratios of about
3-4 per cent. These states had enjoyed about 7 per cent of plan expenditures to
GSDP ratios for some years in the 1980s, but they have shown precipitate
declines in recent years (Appendix Table 19). Amongst the southern states,
Andhra Pradesh, Karnataka and Kerala enjoy better plan expenditure to GSDP
ratios of 5 to 6 per cent now and that was what they had in the early 1980s.
Amongst them, Tamil Nadu, which had a ratio of 5 to 6 per cent in the 1980s,
has a lower ratio of a little above 3 per cent now. Similar declines in relative
plan expenditures, or increases in non-plan expenditure ratios, have taken
place in all major states (Appendix Tables 19 and 20).
Significantly, in respect of some of the states like Andhra Pradesh, Bihar,
Haryana, Kerala and Punjab, the annual plan outlays approved by the
Planning Commission (Appendix Table 21) are lower than the plan
expenditures (revenue and capital accounts together) shown in the respective
state budgets (Appendix Table 19). It appears that the centrally-sponsored
plan schemes and central plan schemes earmarked for specific states, which
are routed through the state budgets fully or on a matching basis, are included
in plan expenditures and not in plan outlays (see Eleventh Finance
Commission Report, p.32). If so, it is interesting that in the case of some
states like Maharashtra, approved plan outlay is nearly thrice the amount of
plan expenditure shown in the budget for 2002-03.
It is also significant that plan expenditures of states as percentages of total
development expenditures generally vary with their income levels, the high-
income states having lower proportions of plan expenditures and the low-
income ones higher proportions. This has been generally so since the
beginning of the 1980s (Table 43). But, there are some noticeable
divergences in this respect too. First, Bihar, which is undoubtedly slow-
growing and a low income state, has also the lowest proportion of plan
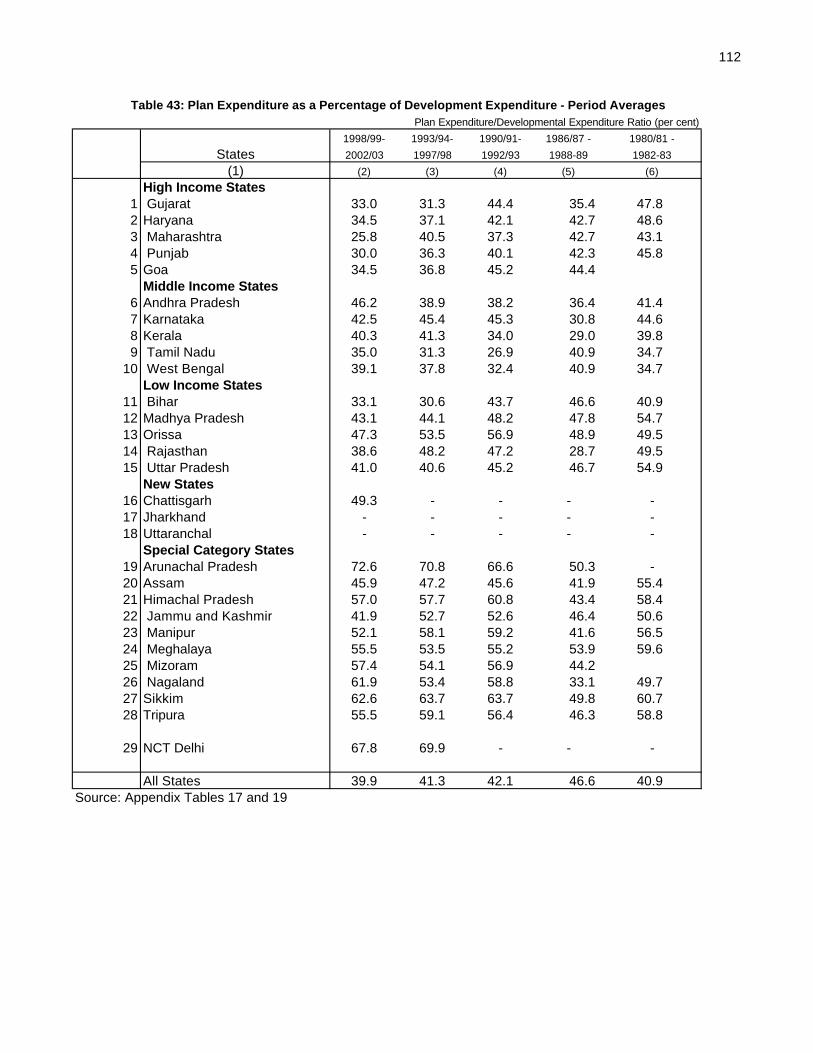
112
1998/99- 1993/94- 1990/91- 1986/87 - 1980/81 -
2002/03 1997/98 1992/93 1988-89 1982-83
(2) (3) (4) (5) (6)
High Income States1 Gujarat 33.0 31.3 44.4 35.4 47.82 Haryana 34.5 37.1 42.1 42.7 48.63 Maharashtra 25.8 40.5 37.3 42.7 43.14 Punjab 30.0 36.3 40.1 42.3 45.85 Goa 34.5 36.8 45.2 44.4
Middle Income States6 Andhra Pradesh 46.2 38.9 38.2 36.4 41.47 Karnataka 42.5 45.4 45.3 30.8 44.68 Kerala 40.3 41.3 34.0 29.0 39.89 Tamil Nadu 35.0 31.3 26.9 40.9 34.7
10 West Bengal 39.1 37.8 32.4 40.9 34.7Low Income States
11 Bihar 33.1 30.6 43.7 46.6 40.912 Madhya Pradesh 43.1 44.1 48.2 47.8 54.713 Orissa 47.3 53.5 56.9 48.9 49.514 Rajasthan 38.6 48.2 47.2 28.7 49.515 Uttar Pradesh 41.0 40.6 45.2 46.7 54.9
New States16 Chattisgarh 49.3 - - - -17 Jharkhand - - - - -18 Uttaranchal - - - - -
Special Category States19 Arunachal Pradesh 72.6 70.8 66.6 50.3 -20 Assam 45.9 47.2 45.6 41.9 55.421 Himachal Pradesh 57.0 57.7 60.8 43.4 58.422 Jammu and Kashmir 41.9 52.7 52.6 46.4 50.623 Manipur 52.1 58.1 59.2 41.6 56.524 Meghalaya 55.5 53.5 55.2 53.9 59.625 Mizoram 57.4 54.1 56.9 44.226 Nagaland 61.9 53.4 58.8 33.1 49.727 Sikkim 62.6 63.7 63.7 49.8 60.728 Tripura 55.5 59.1 56.4 46.3 58.8
29 NCT Delhi 67.8 69.9 - - -
All States 39.9 41.3 42.1 46.6 40.9Source: Appendix Tables 17 and 19
Table 43: Plan Expenditure as a Percentage of Development Expenditure - Period Averages Plan Expenditure/Developmental Expenditure Ratio (per cent)
States(1)
113
expenditure in total development expenditure, that is, 33 per cent as against
the national average of 40 per cent. This deterioration has occurred in the
1990s. Earlier, in the 1980s, Bihar’s plan expenditure as percentage of
development expenditure (ranging from 41 per cent to 44 per cent) always
matched the national average. Second, while the highest plan expenditure to
development expenditure ratio in recent years is that of Orissa – a low-income
state (47 per cent), it is closely followed by Andhra Pradesh, a middle -income
state, that enjoys a ratio as high as 46.2 per cent; the latter is higher than the
ratio for all the other low-income states of Uttar Pradesh, Madhya Pradesh and
Rajasthan. Finally, the low-income states have experienced the steepest fall in
plan expenditure to development expenditure ratios. While Orissa’s ratio has
shown a steady fall since the beginning of the 1980s, Andhra Pradesh’s has
experienced an improvement.
Devolutions and Revenue Growth
Appendix Tables 22 to 25 present data on gross devolution of resources
from the centre to the states and their disaggregation in the form of share in
central taxes, grants and loans. Gross resource transfers constitute about 70 to
80 per cent of total expenditures of special category states. Besides, there are
also some big-size states facing special problems of one kind or the other –
generally one of backwardness - like West Bengal, Uttar Pradesh, Rajasthan,
Punjab, Madhya Pradesh, and Andhra Pradesh, which have central resource
transfers forming 43 to 65 per cent of their aggregate expenditures (see Table
24). The bulk of these transfers are in the form of loans (Appendix Table 25)
and not grants (Appendix Table 24). For the general category states, the share
of loans in gross transfers has increased and that of grants fallen over years.
The loan component has risen in recent years rather sizeably in the case
of high-income states followed by middle-income states. Even in the case of
low incomes states, the share of loans (14 per cent to 27 per cent) has been
higher than that for special category states (5 per cent to 20 per cent).
Amongst the major states, the grant component does not show any wide
variation. If 25 per cent to 27 per cent is the norm for the grant component in
total transfers, there is one state figuring in high-income category (Haryana,
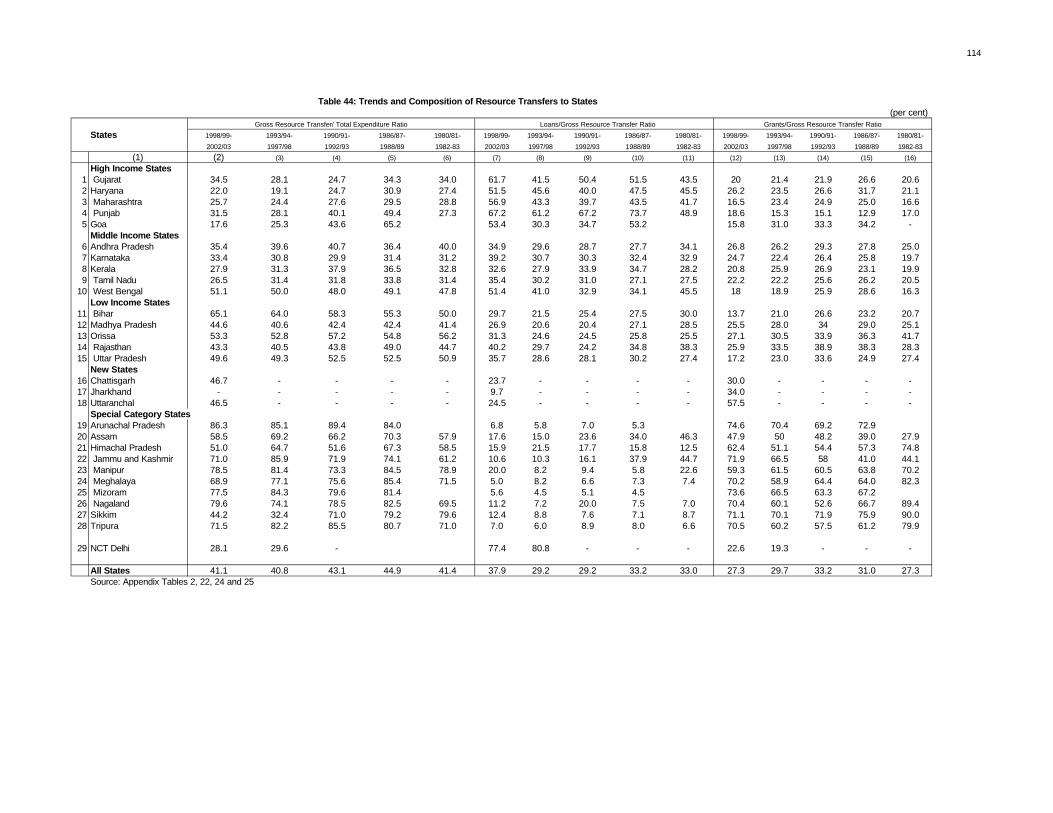
114
(per cent)
States 1998/99- 1993/94- 1990/91- 1986/87- 1980/81- 1998/99- 1993/94- 1990/91- 1986/87- 1980/81- 1998/99- 1993/94- 1990/91- 1986/87- 1980/81-
2002/03 1997/98 1992/93 1988/89 1982-83 2002/03 1997/98 1992/93 1988/89 1982-83 2002/03 1997/98 1992/93 1988/89 1982-83
(1) (2) (3) (4) (5) (6) (7) (8) (9) (10) (11) (12) (13) (14) (15) (16)
High Income States1 Gujarat 34.5 28.1 24.7 34.3 34.0 61.7 41.5 50.4 51.5 43.5 20 21.4 21.9 26.6 20.62 Haryana 22.0 19.1 24.7 30.9 27.4 51.5 45.6 40.0 47.5 45.5 26.2 23.5 26.6 31.7 21.13 Maharashtra 25.7 24.4 27.6 29.5 28.8 56.9 43.3 39.7 43.5 41.7 16.5 23.4 24.9 25.0 16.64 Punjab 31.5 28.1 40.1 49.4 27.3 67.2 61.2 67.2 73.7 48.9 18.6 15.3 15.1 12.9 17.05 Goa 17.6 25.3 43.6 65.2 53.4 30.3 34.7 53.2 15.8 31.0 33.3 34.2 -
Middle Income States6 Andhra Pradesh 35.4 39.6 40.7 36.4 40.0 34.9 29.6 28.7 27.7 34.1 26.8 26.2 29.3 27.8 25.07 Karnataka 33.4 30.8 29.9 31.4 31.2 39.2 30.7 30.3 32.4 32.9 24.7 22.4 26.4 25.8 19.78 Kerala 27.9 31.3 37.9 36.5 32.8 32.6 27.9 33.9 34.7 28.2 20.8 25.9 26.9 23.1 19.99 Tamil Nadu 26.5 31.4 31.8 33.8 31.4 35.4 30.2 31.0 27.1 27.5 22.2 22.2 25.6 26.2 20.5
10 West Bengal 51.1 50.0 48.0 49.1 47.8 51.4 41.0 32.9 34.1 45.5 18 18.9 25.9 28.6 16.3Low Income States
11 Bihar 65.1 64.0 58.3 55.3 50.0 29.7 21.5 25.4 27.5 30.0 13.7 21.0 26.6 23.2 20.712 Madhya Pradesh 44.6 40.6 42.4 42.4 41.4 26.9 20.6 20.4 27.1 28.5 25.5 28.0 34 29.0 25.113 Orissa 53.3 52.8 57.2 54.8 56.2 31.3 24.6 24.5 25.8 25.5 27.1 30.5 33.9 36.3 41.714 Rajasthan 43.3 40.5 43.8 49.0 44.7 40.2 29.7 24.2 34.8 38.3 25.9 33.5 38.9 38.3 28.315 Uttar Pradesh 49.6 49.3 52.5 52.5 50.9 35.7 28.6 28.1 30.2 27.4 17.2 23.0 33.6 24.9 27.4
New States16 Chattisgarh 46.7 - - - - 23.7 - - - - 30.0 - - - -17 Jharkhand - - - - - 9.7 - - - - 34.0 - - - -18 Uttaranchal 46.5 - - - - 24.5 - - - - 57.5 - - - -
Special Category States19 Arunachal Pradesh 86.3 85.1 89.4 84.0 6.8 5.8 7.0 5.3 74.6 70.4 69.2 72.9 20 Assam 58.5 69.2 66.2 70.3 57.9 17.6 15.0 23.6 34.0 46.3 47.9 50 48.2 39.0 27.921 Himachal Pradesh 51.0 64.7 51.6 67.3 58.5 15.9 21.5 17.7 15.8 12.5 62.4 51.1 54.4 57.3 74.822 Jammu and Kashmir 71.0 85.9 71.9 74.1 61.2 10.6 10.3 16.1 37.9 44.7 71.9 66.5 58 41.0 44.123 Manipur 78.5 81.4 73.3 84.5 78.9 20.0 8.2 9.4 5.8 22.6 59.3 61.5 60.5 63.8 70.224 Meghalaya 68.9 77.1 75.6 85.4 71.5 5.0 8.2 6.6 7.3 7.4 70.2 58.9 64.4 64.0 82.325 Mizoram 77.5 84.3 79.6 81.4 5.6 4.5 5.1 4.5 73.6 66.5 63.3 67.226 Nagaland 79.6 74.1 78.5 82.5 69.5 11.2 7.2 20.0 7.5 7.0 70.4 60.1 52.6 66.7 89.427 Sikkim 44.2 32.4 71.0 79.2 79.6 12.4 8.8 7.6 7.1 8.7 71.1 70.1 71.9 75.9 90.028 Tripura 71.5 82.2 85.5 80.7 71.0 7.0 6.0 8.9 8.0 6.6 70.5 60.2 57.5 61.2 79.9
29 NCT Delhi 28.1 29.6 - 77.4 80.8 - - - 22.6 19.3 - - -
All States 41.1 40.8 43.1 44.9 41.4 37.9 29.2 29.2 33.2 33.0 27.3 29.7 33.2 31.0 27.3Source: Appendix Tables 2, 22, 24 and 25
Table 44: Trends and Composition of Resource Transfers to States
Gross Resource Transfer/ Total Expenditure Ratio Loans/Gross Resource Transfer Ratio Grants/Gross Resource Transfer Ratio
115
26.2 per cent), two states in middle -income category (Andhra Pradesh 26.8
per cent and Karnataka 24.7 per cent) and three states in the low-income
category (Orissa 27.1 per cent, Rajasthan 25.9 per cent and Madhya Pradesh
25.5 per cent), which fall within the norm. The grant component has
generally been declining in respect of low-income states and not so for high-
income and middle -income states.
The decline in the grant component has been the steepest in Bihar (from
about 21 to 23 per cent in the 1980s and 26.6 per cent in the early 1990s to
13.7 per cent in 2002-03 and Uttar Pradesh (from 27 per cent and 33.3 per
cent to 17.2 per cent) – the two low income states. With new administrative
responsibilities and also covering underdeveloped regions of individual states,
the new states of Uttaranchal, Chattisgarh and Jharkhand enjoy substantially
higher proportions of transfers in the form of grants than the erstwhile
composite states
116
XI
Growth in States’ Liabilities and All that
The end product of fiscal laxity is seen in growing outstanding liabilities
of state governments. In fact, this began in the second half of the 1990s when
revenue growth suffered a setback. The debt stock of all the state
governments together as percentage of GDP, which had remained stable at
around 19 per cent in the second half of the 1980s, had in fact declined in the
first half of the 1990s to less than 18 per cent (Appendix Table 27).
Thereafter, it began rising; it has touched 25.7 per cent at the end of March
2002 and 27.9 per cent at the end of March 2003.
Market borrowing programmes of state governments have been
considerably expanded in recent years (Appendix Table 26). In particular,
some of the states like Andhra Pradesh, Rajasthan, Punjab and Uttar Pradesh,
which have agreed to enhance the ‘fiscal reform programme and fiscal reform
facility’, were allowed additional market borrowing in 1999-2000 (For details,
see Section XIII below).
On the face of it, inter-state differences in debt growth cannot be wide
because there are some restraints on the incurring of debt; they are generally
related to a state’s capacity. There are limits set on market borrowings and
loans from the central government are pre-determined as part of plan
assistance. Provident funds and other unfunded debt cannot grow beyond a
state’s capacity. Even so, the debt to GSDP ratios have risen in respect of
some low–income states due to the slower growth of incomes over years.
Thus, these ratios vary from 21 per cent to 26 per cent in respect of fast
growing states like Karnataka, Andhra Pradesh and Haryana and from 34 to
36 per cent in respect of Uttar Pradesh and West Bengal. Maharashtra had a
low ratio of 14 to 15 per cent until March 1999 but it has suddenly jumped to
20 per cent thereafter. Punjab is a special case as it has received vast amounts
of loans and advances from the central government which has pushed up its
overall size of liabilities. Its debt to GSDP ratio has shot up from about 26.8
per cent in 1986 to 37.3 per cent in 1991 and finally to 40.7 per cent in 2000-01.
117
The Question of Sustainability
A question mark on the sustainability of states’ debt position, however,
has arisen from the fact that (a) the recent debt has occurred at relatively high
interest rates, (b) it has been accompanied by a significant slowdown in
revenue growth, and (c) an increasing proportion of it is being used for non-
developmental purposes as indicated earlier. States’ interest payments as
proportion of revenue receipts has galloped from 7.5 per cent in 1980-81 to 13
per cent in 1990-91 and further to 21.8 per cent in 1999-2000 and 23.6 per
cent in 2002-03 (Appendix Table 28). Important states, which face this ratio
at higher than the national average, are Andhra Pradesh, Bihar, Gujarat,
Himachal Pradesh, Orissa, Rajasthan, Uttar Pradesh and West Bengal. Interest
payments as percentages of non-development expenditures too have risen
from 41 per cent to 44 per cent in the 1990s.
The question of appropriate size and sustainability of debt for a state is,
however, a complex one. A few broad guiding principles may be kept in view
in assessing the question. First, state debt per se need not always have
deleterious effects on the state economy; it is the nature of expenditure and the
purpose for which the state expenditures are incurred which matter (Rakshit
2000). Borrowings for augmenting the productive capacity of the state fall
into a different category as compared with borrowings for current
consumption. Second, the juxtaposition of the growth rate of the economy
and the average borrowing rate does not appear to provide an appropriate
borrowing condition; what is more appropriate is to replace the economic
growth rate by some concept of social rate of return, particularly when a
substantial part of ‘revenue’ expenditure is of a developmental nature in social
and economic spheres. Finally, in a healthy fiscal adjustment scenario, it is
the chosen path of reducing “revenue deficit” that should be the focus rather
than reducing “gross fiscal deficit” per se.
Contingent Liabilities
As cited earlier, states have adopted an innovative method of financing
capital expenditures with the help of off-budget projects for which the states’
para-statal bodies have borrowed from banks and other financial institutions,
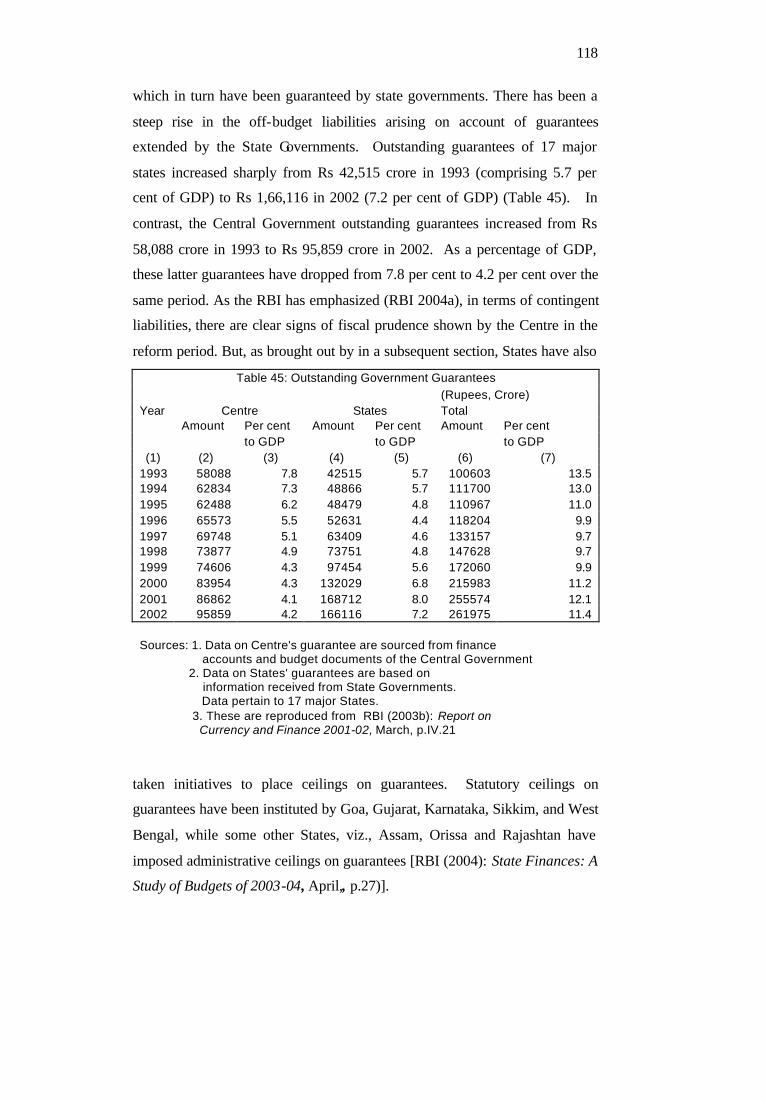
118
which in turn have been guaranteed by state governments. There has been a
steep rise in the off-budget liabilities arising on account of guarantees
extended by the State Governments. Outstanding guarantees of 17 major
states increased sharply from Rs 42,515 crore in 1993 (comprising 5.7 per
cent of GDP) to Rs 1,66,116 in 2002 (7.2 per cent of GDP) (Table 45). In
contrast, the Central Government outstanding guarantees increased from Rs
58,088 crore in 1993 to Rs 95,859 crore in 2002. As a percentage of GDP,
these latter guarantees have dropped from 7.8 per cent to 4.2 per cent over the
same period. As the RBI has emphasized (RBI 2004a), in terms of contingent
liabilities, there are clear signs of fiscal prudence shown by the Centre in the
reform period. But, as brought out by in a subsequent section, States have also
Table 45: Outstanding Government Guarantees
(Rupees, Crore) Year Centre States Total Amount Per cent Amount Per cent Amount Per cent to GDP to GDP to GDP (1) (2) (3) (4) (5) (6) (7)
1993 58088 7.8 42515 5.7 100603 13.5 1994 62834 7.3 48866 5.7 111700 13.0 1995 62488 6.2 48479 4.8 110967 11.0 1996 65573 5.5 52631 4.4 118204 9.9 1997 69748 5.1 63409 4.6 133157 9.7 1998 73877 4.9 73751 4.8 147628 9.7 1999 74606 4.3 97454 5.6 172060 9.9 2000 83954 4.3 132029 6.8 215983 11.2 2001 86862 4.1 168712 8.0 255574 12.1 2002 95859 4.2 166116 7.2 261975 11.4 Sources: 1. Data on Centre's guarantee are sourced from finance accounts and budget documents of the Central Government 2. Data on States' guarantees are based on information received from State Governments. Data pertain to 17 major States.
3. These are reproduced from RBI (2003b): Report on Currency and Finance 2001-02, March, p.IV.21
taken initiatives to place ceilings on guarantees. Statutory ceilings on
guarantees have been instituted by Goa, Gujarat, Karnataka, Sikkim, and West
Bengal, while some other States, viz., Assam, Orissa and Rajashtan have
imposed administrative ceilings on guarantees [RBI (2004): State Finances: A
Study of Budgets of 2003-04, April,, p.27)].
119
XII
Relative Fiscal Performance of States Juxtaposed Against
Their Economic Performance When we attempt an inter-state comparison of the fiscal performance, a
logical question that crops up concerns the relationship between the fiscal
performance of states and their performance in social and economic
development. No doubt, the processes of social and economic development
are a complex issue. Apart from the fact that impulses for growth come from
a variety of contributory factors – and fiscal policy and operations are one
amongst many albeit an important one, indicators of real sector development
are also many and varied – income growth, poverty reduction, and education
and health outcomes. The economic literature of recent years, particularly in
the context of economic reforms, has singled out two key factors favouring
the growth process, namely, fiscal outcomes and financial sector development.
No doubt, the causal relationship is not unidirectional; there is in fact
considerable mutual interdependence between the real sector development, on
the one hand, and fiscal and financial sector developments, on the other. Any
detailed enquiry into these causal relationships is beyond the scope of this
study. It has rather a limited objective which is to bring out the relative fiscal
performances of states belonging to different stages of real sector
development.
As for the indicators of social and economic development, we concentrate
on one major indicator, namely, the growth in state domestic product. We are
emboldened to adopt this method on the ground that a classification of major
states as ‘forward’ and ‘backward’ strictly in terms of per capita income has
been able to encompass the socio-demographic differences amongst states
generally (Kurian 2002). The socio-demographic profiles of the states in the
two groups have been captured in a disaggregated way by ranking the districts
of respective states on the basis of a composite index consisting of 12 social,
demographic and infrastructure development indicators. When the two groups
of ‘forward’ and ‘backward’ states classified strictly on the basis of per capita
120
incomes are juxtaposed against the district rankings, it is found that the bulk
of the districts of the ‘forward’ states carry high ranks socio-demographically;
likewise, the bulk of the districts of the ‘backward’ states carry low ranks
socio-demographically. These results are highlighted to make a limited point,
that income growth can be a reasonably representative indicator of overall
social and economic development of a state; this theme is also buttressed by
sectoral data presented in a sub-section below.
Growth Profiles of States
In matters relating to growth profiles of states based on the estimated
gross state domestic product (GSDP) and per capita GSDP, there has been a
spate of studies in recent years. The latest in this respect has been the one by
the EPW Research Foundation (2003a) producing a comprehensive data base
entitled Domestic Product of States of India for 40 years 1960-61 to 2000-01.
This study has also presented a literature review of earlier contributions on
inter-state comparisons of growth in SDP and attempted a fresh study of its
own on such comparisons of growth in GSDP, NSDP and per capita GSDP
and NSDP. Its key results being the latest, with the coverage of most recent
data, the same are reproduced in Exhibit I accompanying this section.
The objective of referring to these results is to juxtapose state-wise real
income growth – aggregate and per capita – against fiscal performance of
states. One method of undertaking such a juxtaposition is to rank states
separately according to growth and accounting to fiscal performances based
on some chosen indicators. With a view to making the comparison a little
more wholesome, two other areas of analysis are also taken into account – one
on state-wise human development index to supplement SDP as a development
indicator and another on financial sector performance (bank deposits and
credit growth as well as financial assistance of long-term financial
institutions) as a contributory factor for growth along with fiscal performance.
Before such a juxtaposition of all the four sets of indicators is attempted, a
brief description of the individual sector performances would be in order.
121
SDP and Per Capita SDP
The study by the EPW Research Foundation (2003a), referred to above,
has presented three key components of its results: annual compound growth
rate during the 1980s and 1990s in state-wise SDP and per capita SDP;
ranking of states according to their real per capita SDP and changing of ranks
over the two decades; and the evolving nature of inequality in the levels of
real per capita income over this period based such shifting of ranks and the
trends in Gini coefficients worked out for the annual series of state-wise real
per capita GSDP (Exhibit I).
The broad results of this study are as follows.
First, all states’ growth together has roughly improved to about 5.50-
5.70 per cent per annum in the 1990s from about 5.20-5.30 per cent per
annum in the 1980s in aggregate NSDP or GSDP and to about 3.60-3.80 per
cent per annum from 3.00-3.10 per cent per annum in per capita terms.
Second, in terms of both SDP and per capita SDP growth (Table 46),
all states with a few exceptions (Uttar Pradesh, Assam and Punjab) have
shown accelerated growth during the 1990s and many major states like
Gujarat, West Bengal, Himachal Pradesh and Kerala have moved up the
ladder above or near the all-states average SDP growth. In this respect,
amongst the major states that have shown outstanding performance in the
1990s are Karnataka, West Bengal, Rajasthan, Tamil Nadu and Gujarat which
belong to different regions in the country, but at the same time, deceleration in
the growth of high-income states of Punjab, Haryana and Maharashtra stands
out. It should be noted in parenthesis here that Punjab has remained as the
state with the highest per capita NSDP throughout the past two decades but
has persistently experienced reduced growth rates.
Third, at the other end, the low-income and poorly-performing major
states of Uttar Pradesh, Madhya Pradesh, Bihar, Orissa, and Assam, have not
only persisted with their low growth syndrome but have also experienced
further deceleration in growth rates in the 1990s. It is for this reason that,
despite an improvement in the growth rates of many middle -income states, the
degree of dispersion in growth rates as measured by the coefficient of
variation (CV) has got widened in the 1990s; CV (in percentages) of GSDP
122
growth rates has increased from 29.6 per cent in the 1980s to 41.1 per cent in
the 1990s.
Fourth, with the general phenomenon of relatively higher population
growth in low-income and low-growth states, the growth of per capita
incomes in such states is found to be relatively lower than the growth of total
state incomes. Contrariwise, the per capita incomes growth of high-income
and middle-income states is comparatively higher than the growth in their
total incomes.
Fifth, we have split the decade of the 1990s into two halves and
presented different measures of average growth rates for the periods 1990-91
to 1995-96 and 1995-96 to 2000-01 (Table 47). These results reveal certain
interesting features. Overall, the difference in growth as between the two
quinquennia has been negligible; while all-states total GSDP shows a
fractional deceleration in growth from about 5.60 per cent in the first half of
the decade to about 5.50 per cent in the second half, all-states per capita
GSDP sustains a growth of about 3.60 per cent per annum throughout the two
decades. But, growth differences at individual states levels are significant.
While a number of major states like Karnataka, West Bengal, Punjab,
Haryana, Andhra Pradesh, and Rajasthan have shown acceleration in growth
in the second half, some crucial ones, on the other hand, namely, Maharashtra,
Gujarat, Madhya Pradesh, Orissa and Assam, have experienced deceleration.
The loss in the growth momentum of Maharashtra and Gujarat as between the
two five-year periods is indeed steep – from 9.2 per cent to 4.2 per cent in the
case of Gujarat and from 8.2 per cent to 5.3 per cent for Maharashtra, in
GSDP. Though Kerala’s growth in total GSDP shows a decline in the second
half of the decade, its performance nevertheless remains above the national
average in terms of per capita income growth in both the quinquennia.
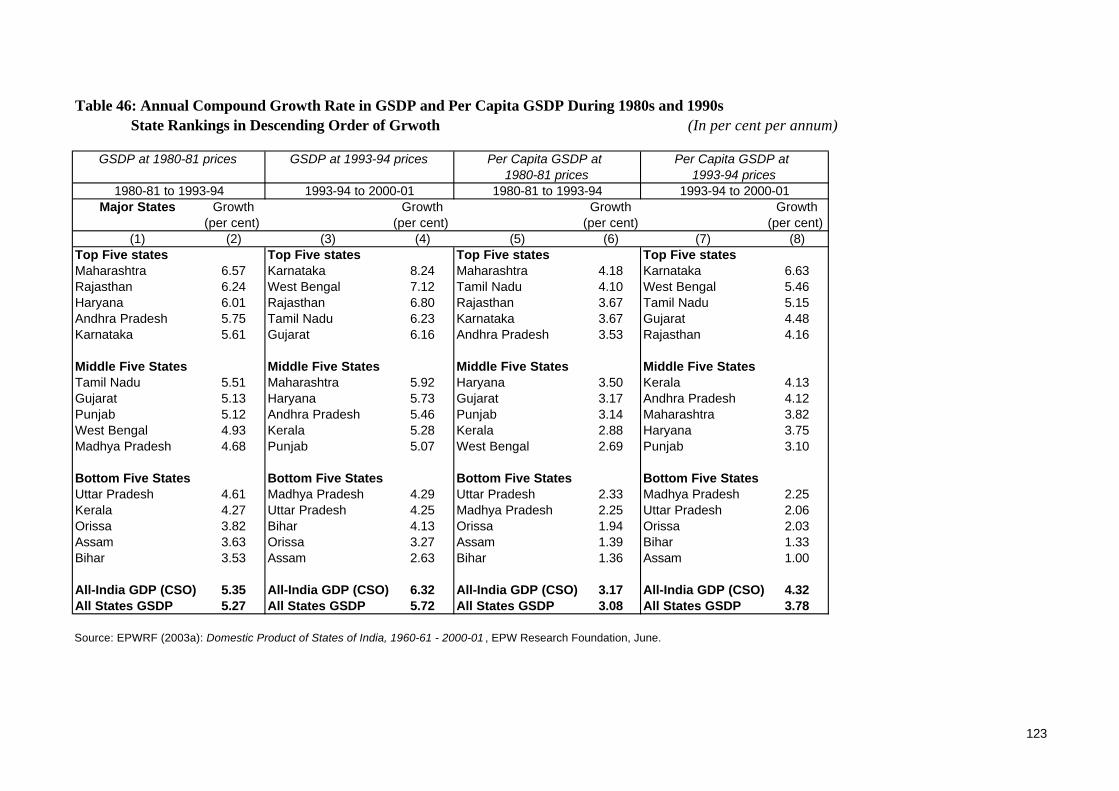
Table 46: Annual Compound Growth Rate in GSDP and Per Capita GSDP During 1980s and 1990s State Rankings in Descending Order of Grwoth (In per cent per annum)
Major States Growth Growth Growth Growth(per cent) (per cent) (per cent) (per cent)
(1) (2) (3) (4) (5) (6) (7) (8)Top Five states Top Five states Top Five states Top Five statesMaharashtra 6.57 Karnataka 8.24 Maharashtra 4.18 Karnataka 6.63Rajasthan 6.24 West Bengal 7.12 Tamil Nadu 4.10 West Bengal 5.46Haryana 6.01 Rajasthan 6.80 Rajasthan 3.67 Tamil Nadu 5.15Andhra Pradesh 5.75 Tamil Nadu 6.23 Karnataka 3.67 Gujarat 4.48Karnataka 5.61 Gujarat 6.16 Andhra Pradesh 3.53 Rajasthan 4.16
Middle Five States Middle Five States Middle Five States Middle Five StatesTamil Nadu 5.51 Maharashtra 5.92 Haryana 3.50 Kerala 4.13Gujarat 5.13 Haryana 5.73 Gujarat 3.17 Andhra Pradesh 4.12Punjab 5.12 Andhra Pradesh 5.46 Punjab 3.14 Maharashtra 3.82West Bengal 4.93 Kerala 5.28 Kerala 2.88 Haryana 3.75Madhya Pradesh 4.68 Punjab 5.07 West Bengal 2.69 Punjab 3.10
Bottom Five States Bottom Five States Bottom Five States Bottom Five StatesUttar Pradesh 4.61 Madhya Pradesh 4.29 Uttar Pradesh 2.33 Madhya Pradesh 2.25Kerala 4.27 Uttar Pradesh 4.25 Madhya Pradesh 2.25 Uttar Pradesh 2.06Orissa 3.82 Bihar 4.13 Orissa 1.94 Orissa 2.03Assam 3.63 Orissa 3.27 Assam 1.39 Bihar 1.33Bihar 3.53 Assam 2.63 Bihar 1.36 Assam 1.00
All-India GDP (CSO) 5.35 All-India GDP (CSO) 6.32 All-India GDP (CSO) 3.17 All-India GDP (CSO) 4.32All States GSDP 5.27 All States GSDP 5.72 All States GSDP 3.08 All States GSDP 3.78
Source: EPWRF (2003a): Domestic Product of States of India, 1960-61 - 2000-01 , EPW Research Foundation, June.
1980-81 prices 1993-94 prices1980-81 to 1993-94 1993-94 to 2000-01 1980-81 to 1993-94 1993-94 to 2000-01
GSDP at 1980-81 prices GSDP at 1993-94 prices Per Capita GSDP at Per Capita GSDP at
123
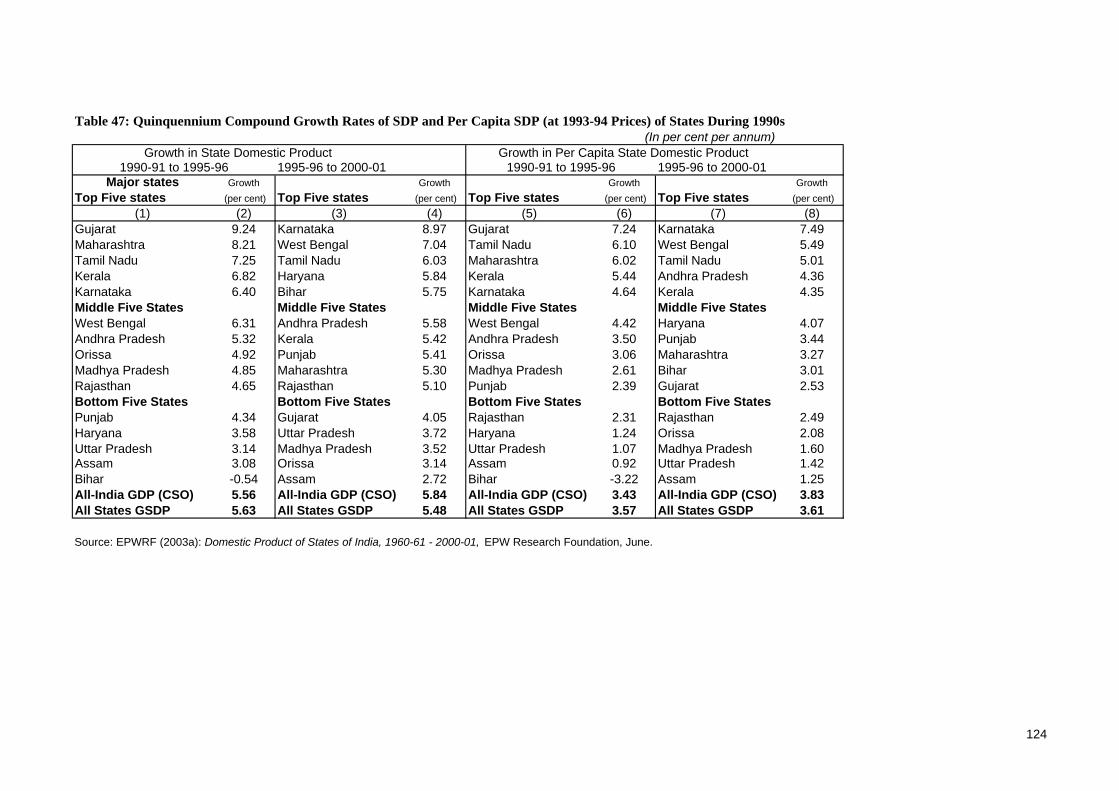
Table 47: Quinquennium Compound Growth Rates of SDP and Per Capita SDP (at 1993-94 Prices) of States During 1990s(In per cent per annum)
Major states Growth Growth Growth Growth
Top Five states (per cent) Top Five states (per cent) Top Five states (per cent) Top Five states (per cent)
(1) (2) (3) (4) (5) (6) (7) (8)Gujarat 9.24 Karnataka 8.97 Gujarat 7.24 Karnataka 7.49Maharashtra 8.21 West Bengal 7.04 Tamil Nadu 6.10 West Bengal 5.49Tamil Nadu 7.25 Tamil Nadu 6.03 Maharashtra 6.02 Tamil Nadu 5.01Kerala 6.82 Haryana 5.84 Kerala 5.44 Andhra Pradesh 4.36Karnataka 6.40 Bihar 5.75 Karnataka 4.64 Kerala 4.35Middle Five States Middle Five States Middle Five States Middle Five StatesWest Bengal 6.31 Andhra Pradesh 5.58 West Bengal 4.42 Haryana 4.07Andhra Pradesh 5.32 Kerala 5.42 Andhra Pradesh 3.50 Punjab 3.44Orissa 4.92 Punjab 5.41 Orissa 3.06 Maharashtra 3.27Madhya Pradesh 4.85 Maharashtra 5.30 Madhya Pradesh 2.61 Bihar 3.01Rajasthan 4.65 Rajasthan 5.10 Punjab 2.39 Gujarat 2.53Bottom Five States Bottom Five States Bottom Five States Bottom Five StatesPunjab 4.34 Gujarat 4.05 Rajasthan 2.31 Rajasthan 2.49Haryana 3.58 Uttar Pradesh 3.72 Haryana 1.24 Orissa 2.08Uttar Pradesh 3.14 Madhya Pradesh 3.52 Uttar Pradesh 1.07 Madhya Pradesh 1.60Assam 3.08 Orissa 3.14 Assam 0.92 Uttar Pradesh 1.42Bihar -0.54 Assam 2.72 Bihar -3.22 Assam 1.25All-India GDP (CSO) 5.56 All-India GDP (CSO) 5.84 All-India GDP (CSO) 3.43 All-India GDP (CSO) 3.83All States GSDP 5.63 All States GSDP 5.48 All States GSDP 3.57 All States GSDP 3.61
Source: EPWRF (2003a): Domestic Product of States of India, 1960-61 - 2000-01, EPW Research Foundation, June.
Growth in State Domestic Product Growth in Per Capita State Domestic Product1990-91 to 1995-96 1995-96 to 2000-01 1990-91 to 1995-96 1995-96 to 2000-01
124
125
Sixth, as for the rankings, an amazing impression imparted by these data
is that there has been little change in the relative position of states in their
rankings during the past two decades (Table 48). In particular, the
composition of the top five states and that of the bottom six states have
generally remained unchanged over the two decades. Significantly, even the
relative ranks of the top five – Punjab, Maharashtra, Haryana, Gujarat and
Tamil Nadu in that order – have stayed put as between the early 1990s and the
end of that decade (except for a notch interchange of top positions between
Punjab and Maharashtra in per capita GSDP). In the early 1980s too, the first
four out of the top five were the same states and in the same order; it is just
that West Bengal which held the fifth rank in that early period steadily and
steeply slipped downward thereafter and was replaced by Tamil Nadu in all
the subsequent three periods. Likewise, it is equally revealing that at the
bottom end, the same six states, namely, Rajasthan, Madhya Pradesh, Assam,
Uttar Pradesh, Orissa and Bihar, have remained stuck at the bottom position
during the four period intervals except for some minor shuffling (like Assam
and Uttar Pradesh exchanging their 14th and 15th positions in the last two
periods as per capita GSDP). Interestingly, even the spread between the top
five and the bottom six states has got widened.
Finally, the relative changes in the ranks of different states apart, there
is no gainsaying that overall inequality in the levels of real per capita income
has risen over the past two decades. This is evident from the year-to-year
steadily rising Gini coefficient worked out for the distribution of average per
capita GSDP amongst states separately for the individual years from 1980-81
to 1996-97 based on 1980-81 price series and for those from 1993-94 to 2000-
01 at 1993-94 prices (EPWRF 2003a, pp.28-30 and Table 6 in Shetty 2003,
p.5197).
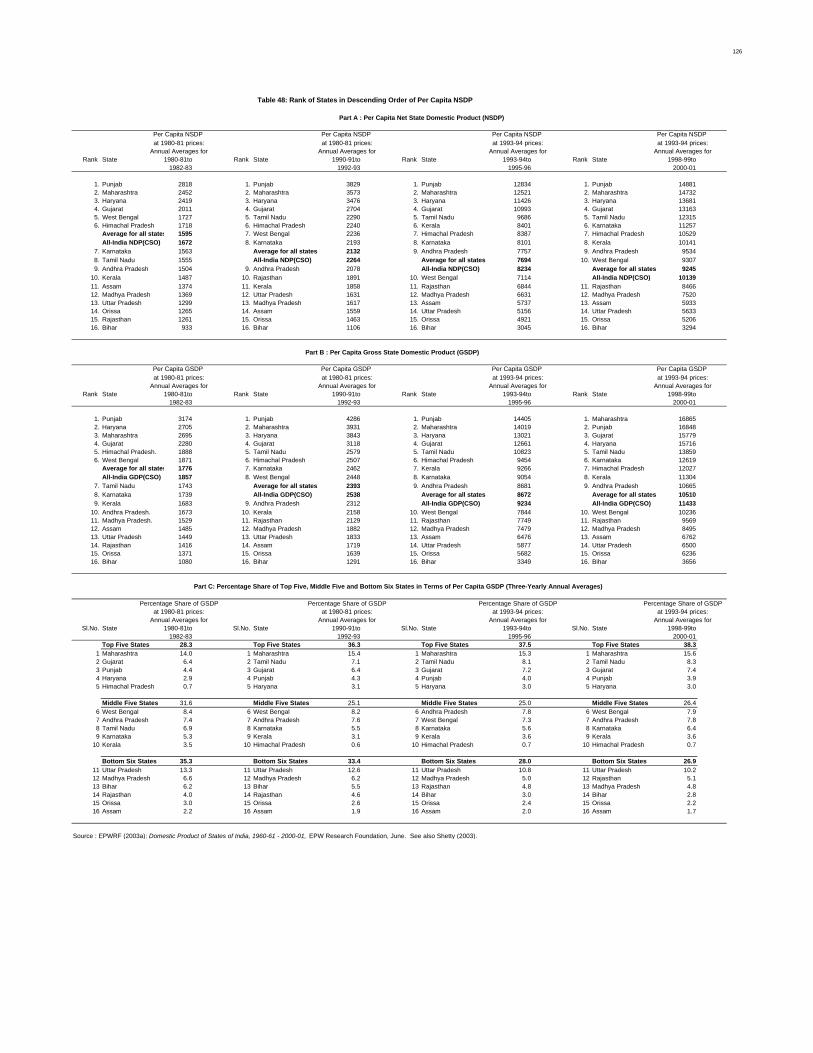
126
Per Capita NSDP Per Capita NSDP Per Capita NSDP Per Capita NSDP at 1980-81 prices: at 1980-81 prices: at 1993-94 prices: at 1993-94 prices:
Annual Averages for Annual Averages for Annual Averages for Annual Averages forRank State 1980-81to Rank State 1990-91to Rank State 1993-94to Rank State 1998-99to
1982-83 1992-93 1995-96 2000-01
1. Punjab 2818 1. Punjab 3829 1. Punjab 12834 1. Punjab 14881 2. Maharashtra 2452 2. Maharashtra 3573 2. Maharashtra 12521 2. Maharashtra 14732 3. Haryana 2419 3. Haryana 3476 3. Haryana 11426 3. Haryana 13681 4. Gujarat 2011 4. Gujarat 2704 4. Gujarat 10993 4. Gujarat 13163 5. West Bengal 1727 5. Tamil Nadu 2290 5. Tamil Nadu 9686 5. Tamil Nadu 12315 6. Himachal Pradesh 1718 6. Himachal Pradesh 2240 6. Kerala 8401 6. Karnataka 11257
Average for all states 1595 7. West Bengal 2236 7. Himachal Pradesh 8387 7. Himachal Pradesh 10529All-India NDP(CSO) 1672 8. Karnataka 2193 8. Karnataka 8101 8. Kerala 10141
7. Karnataka 1563 Average for all states 2132 9. Andhra Pradesh 7757 9. Andhra Pradesh 9534 8. Tamil Nadu 1555 All-India NDP(CSO) 2264 Average for all states 7694 10. West Bengal 9307 9. Andhra Pradesh 1504 9. Andhra Pradesh 2078 All-India NDP(CSO) 8234 Average for all states 924510. Kerala 1487 10. Rajasthan 1891 10. West Bengal 7114 All-India NDP(CSO) 1013911. Assam 1374 11. Kerala 1858 11. Rajasthan 6844 11. Rajasthan 846612. Madhya Pradesh 1369 12. Uttar Pradesh 1631 12. Madhya Pradesh 6631 12. Madhya Pradesh 752013. Uttar Pradesh 1299 13. Madhya Pradesh 1617 13. Assam 5737 13. Assam 593314. Orissa 1265 14. Assam 1559 14. Uttar Pradesh 5156 14. Uttar Pradesh 563315. Rajasthan 1261 15. Orissa 1463 15. Orissa 4921 15. Orissa 520616. Bihar 933 16. Bihar 1106 16. Bihar 3045 16. Bihar 3294
Per Capita GSDP Per Capita GSDP Per Capita GSDP Per Capita GSDP at 1980-81 prices: at 1980-81 prices: at 1993-94 prices: at 1993-94 prices:
Annual Averages for Annual Averages for Annual Averages for Annual Averages forRank State 1980-81to Rank State 1990-91to Rank State 1993-94to Rank State 1998-99to
1982-83 1992-93 1995-96 2000-01
1. Punjab 3174 1. Punjab 4286 1. Punjab 14405 1. Maharashtra 16865 2. Haryana 2705 2. Maharashtra 3931 2. Maharashtra 14019 2. Punjab 16848 3. Maharashtra 2695 3. Haryana 3843 3. Haryana 13021 3. Gujarat 15779 4. Gujarat 2280 4. Gujarat 3118 4. Gujarat 12661 4. Haryana 15716 5. Himachal Pradesh. 1888 5. Tamil Nadu 2579 5. Tamil Nadu 10823 5. Tamil Nadu 13859 6. West Bengal 1871 6. Himachal Pradesh 2507 6. Himachal Pradesh 9454 6. Karnataka 12619
Average for all states 1776 7. Karnataka 2462 7. Kerala 9266 7. Himachal Pradesh 12027All-India GDP(CSO) 1857 8. West Bengal 2448 8. Karnataka 9054 8. Kerala 11304
7. Tamil Nadu 1743 Average for all states 2393 9. Andhra Pradesh 8681 9. Andhra Pradesh 10665 8. Karnataka 1739 All-India GDP(CSO) 2538 Average for all states 8672 Average for all states 10510 9. Kerala 1683 9. Andhra Pradesh 2312 All-India GDP(CSO) 9234 All-India GDP(CSO) 1143310. Andhra Pradesh. 1673 10. Kerala 2158 10. West Bengal 7844 10. West Bengal 1023611. Madhya Pradesh. 1529 11. Rajasthan 2129 11. Rajasthan 7749 11. Rajasthan 956912. Assam 1485 12. Madhya Pradesh 1882 12. Madhya Pradesh 7479 12. Madhya Pradesh 849513. Uttar Pradesh 1449 13. Uttar Pradesh 1833 13. Assam 6476 13. Assam 676214. Rajasthan 1416 14. Assam 1719 14. Uttar Pradesh 5877 14. Uttar Pradesh 650015. Orissa 1371 15. Orissa 1639 15. Orissa 5682 15. Orissa 623616. Bihar 1080 16. Bihar 1291 16. Bihar 3349 16. Bihar 3656
Percentage Share of GSDP Percentage Share of GSDP Percentage Share of GSDP Percentage Share of GSDPat 1980-81 prices: at 1980-81 prices: at 1993-94 prices: at 1993-94 prices:
Annual Averages for Annual Averages for Annual Averages for Annual Averages forSl.No. State 1980-81to Sl.No. State 1990-91to Sl.No. State 1993-94to Sl.No. State 1998-99to
1982-83 1992-93 1995-96 2000-01Top Five States 28.3 Top Five States 36.3 Top Five States 37.5 Top Five States 38.3
1 Maharashtra 14.0 1 Maharashtra 15.4 1 Maharashtra 15.3 1 Maharashtra 15.62 Gujarat 6.4 2 Tamil Nadu 7.1 2 Tamil Nadu 8.1 2 Tamil Nadu 8.33 Punjab 4.4 3 Gujarat 6.4 3 Gujarat 7.2 3 Gujarat 7.44 Haryana 2.9 4 Punjab 4.3 4 Punjab 4.0 4 Punjab 3.95 Himachal Pradesh 0.7 5 Haryana 3.1 5 Haryana 3.0 5 Haryana 3.0
Middle Five States 31.6 Middle Five States 25.1 Middle Five States 25.0 Middle Five States 26.46 West Bengal 8.4 6 West Bengal 8.2 6 Andhra Pradesh 7.8 6 West Bengal 7.97 Andhra Pradesh 7.4 7 Andhra Pradesh 7.6 7 West Bengal 7.3 7 Andhra Pradesh 7.88 Tamil Nadu 6.9 8 Karnataka 5.5 8 Karnataka 5.6 8 Karnataka 6.49 Karnataka 5.3 9 Kerala 3.1 9 Kerala 3.6 9 Kerala 3.6
10 Kerala 3.5 10 Himachal Pradesh 0.6 10 Himachal Pradesh 0.7 10 Himachal Pradesh 0.7
Bottom Six States 35.3 Bottom Six States 33.4 Bottom Six States 28.0 Bottom Six States 26.911 Uttar Pradesh 13.3 11 Uttar Pradesh 12.6 11 Uttar Pradesh 10.8 11 Uttar Pradesh 10.212 Madhya Pradesh 6.6 12 Madhya Pradesh 6.2 12 Madhya Pradesh 5.0 12 Rajasthan 5.113 Bihar 6.2 13 Bihar 5.5 13 Rajasthan 4.8 13 Madhya Pradesh 4.814 Rajasthan 4.0 14 Rajasthan 4.6 14 Bihar 3.0 14 Bihar 2.815 Orissa 3.0 15 Orissa 2.6 15 Orissa 2.4 15 Orissa 2.216 Assam 2.2 16 Assam 1.9 16 Assam 2.0 16 Assam 1.7
Source : EPWRF (2003a): Domestic Product of States of India, 1960-61 - 2000-01, EPW Research Foundation, June. See also Shetty (2003).
Table 48: Rank of States in Descending Order of Per Capita NSDP
Part A : Per Capita Net State Domestic Product (NSDP)
Part B : Per Capita Gross State Domestic Product (GSDP)
Part C: Percentage Share of Top Five, Middle Five and Bottom Six States in Terms of Per Capita GSDP (Three-Yearly Annual Averages)
127
Rankings According to Human Development Index (HDI)
To supplement the SDP and per capita SDP rankings, we have a set of state-
wise Human Development Index (HDI) constructed by the Planning Commission
(2002a, pp. 140-141 and p.25) for decadal intervals, 1981, 1991 and 2001. This
HDI is a composite measure of variables “capturing attainments in three
dimensions of human development, viz., economic, educational and health. These
have been captured by per capita monthly expenditure adjusted for inequality; a
combination of literacy rate and intensity of formal education; and a combination
of life expectancy at age 1 and infant mortality rate” (pp.140-142).
Based on this HDI, major 15 states have been ranked in descending order of
their score (Table 49). While on the face of it, rankings of states as per HDI differ
from those based on per capita GSDP, it is significant that the differences are
marginal and that there are very many similarities in the two attainments state-wise.
One widely-known extreme case is that of Kerala which has by far the highest HDI
ranking on account of its high-level of social sector development, but its ranking
based on per capita SDP is far lower at the 10th rank. But, abstracting from the
Kerala’s case, the broad rankings are not very dissimilar. For instance, four out of
five top states for 2001 are the same as per capita GSDP as well as HDI rankings
(Maharashtra, Tamil Nadu, Punjab and Haryana). Likewise, the bottom five states
are identical in both the sets of rankings (Uttar Pradesh, Madhya Pradesh, Bihar,
Orissa and Assam) though there is some inter se difference in their ranking
sequence. As a consequence, four states out of five in the middle group turn out to
be also common in both SDP and HDI rankings.
The above is the latest position as obtaining in 2000-01. The question is:
has there been any movement in rankings over the past two decades? It is
intriguing but true that alterations in state rankings over the period have been
minimal. In HDI, the top eight states have retained their 1 to 8 rankings absolutely
intact in this order: Kerala, Punjab, Tamil Nadu, Maharashtra, Haryana, Gujarat,
Karnataka and West Bengal. Bihar has remained at the rock bottom throughout the
period. There is some minor shuffling in the ranks of a few states in HDI rankings
as between different periods. In per capita GSDP ranking, the situation has been
relatively more “static”, for the top five states and bottom five states have
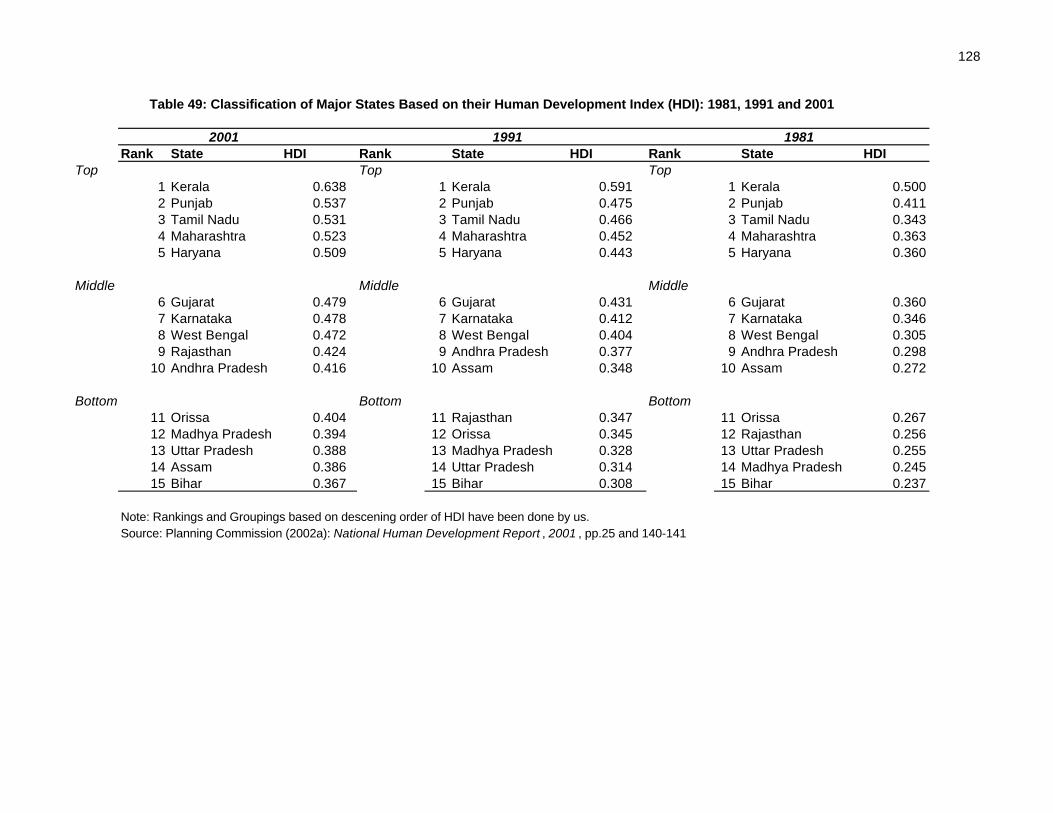
128
Table 49: Classification of Major States Based on their Human Development Index (HDI): 1981, 1991 and 2001
2001 1991 1981Rank State HDI Rank State HDI Rank State HDI
Top Top Top1 Kerala 0.638 1 Kerala 0.591 1 Kerala 0.5002 Punjab 0.537 2 Punjab 0.475 2 Punjab 0.4113 Tamil Nadu 0.531 3 Tamil Nadu 0.466 3 Tamil Nadu 0.3434 Maharashtra 0.523 4 Maharashtra 0.452 4 Maharashtra 0.3635 Haryana 0.509 5 Haryana 0.443 5 Haryana 0.360
Middle Middle Middle6 Gujarat 0.479 6 Gujarat 0.431 6 Gujarat 0.3607 Karnataka 0.478 7 Karnataka 0.412 7 Karnataka 0.3468 West Bengal 0.472 8 West Bengal 0.404 8 West Bengal 0.3059 Rajasthan 0.424 9 Andhra Pradesh 0.377 9 Andhra Pradesh 0.298
10 Andhra Pradesh 0.416 10 Assam 0.348 10 Assam 0.272
Bottom Bottom Bottom11 Orissa 0.404 11 Rajasthan 0.347 11 Orissa 0.26712 Madhya Pradesh 0.394 12 Orissa 0.345 12 Rajasthan 0.25613 Uttar Pradesh 0.388 13 Madhya Pradesh 0.328 13 Uttar Pradesh 0.25514 Assam 0.386 14 Uttar Pradesh 0.314 14 Madhya Pradesh 0.24515 Bihar 0.367 15 Bihar 0.308 15 Bihar 0.237
Note: Rankings and Groupings based on descening order of HDI have been done by us.Source: Planning Commission (2002a): National Human Development Report , 2001 , pp.25 and 140-141
129
retained their respective rankings unchanged since the early 1990s, while again
there have been some marginal alterations in rankings of a few states in the middle.
Financial Sector Development
For gauging the state-wise performance of the financial sector, we have chosen
two key indicators: scheduled commercial banks data on deposits, credit and credit-
deposit ratios at the states level; and state-wise disbursements of financial
assistance by all financial institutions (AFIs)). The former are obtained from the
Reserve Bank of India’s Basic Statistical Returns (BSR) on Banking Statistics,
which present a novel classification on bank credit by the method of utilization as
distinguished from sanction. That is, bank credit sanctioned in one state is utilized
in another state based on the location of factories and other business units. It is the
utilization of bank credit that is captured in this data set presented here. Data on
financial assistance by AFIs are obtained from the Industrial Development Bank of
India (IDBI)’ s Report on Development Banking in India. These cover assistance
rendered by both all-India institutions and institutions at the states level.
The basic data on scheduled commercial banks are presented in Exhibit II and
those on AFIs in Exhibit III at the end of this section.
Bank Credit Distribution
Banking development, which was highly urban-oriented and also concentrated
in a few regions until the beginning of the 1970s, became better spread out both
regionally and functionally within two decades of the 1970s and the 1980s, but
after the financial sector reforms began, in the early 1990s, the social goal of
banking to focus on regional spread was somewhat halted. Partly because of that
and partly because of the serious structural deficiencies of underdeveloped regions,
some serious inter-regional/inter-state disparities in banking development have not
only persisted but even widened. Broadly, three regions, namely, southern,
western, and northern regions were the ones to possess a relatively better banking
base to begin with, and after bank nationalisation, there was banking progress in
these regions but there was more rapid progress in the three underdeveloped
130
regions of central, eastern and north-eastern India. It must be admitted that such a
relative shift in progress was more in terms of branch banking, whereas the initial
impetus to expanding banking business defined in terms of relative deposit
resources generated and bank credit rendered, could not be sustained even in the
1980s in the three less developed regions (see Exhibit II). Such banking business
continued to forge ahead in the relatively advanced regions of the south, north and
western India.
It is interesting that an analysis of banking infrastructure and progress made in
it over years state-wise reveal interesting results which lend themselves to a broad
comparison with the respective states’ fiscal performance. The banking indicators
measured in this regard are: per capita bank deposits, per capita bank credit and
credit-deposit ratio. Such an analysis shows that, whatever banking indicator we
take, credit-deposit ratio, per capita deposits or per capita credit, the top performing
and the bottom ones generally remain the same; they are Maharashtra, Gujarat,
Tamil Nadu, Karnataka and Punjab in the top category, and Madhya Pradesh, Uttar
Pradesh, Assam, Orissa and Bihar in the bottom categories (Tables 50 and 51).
There are no doubt some well-known exceptions, Kerala and Punjab being the
outstanding ones. Both Kerala and Punjab are substantial deposit generating states
but have apparently absorbed limited credit, thus resultantly enjoying low credit-
deposit ratios. Kerala’s history of high banking development and non-resident
inward remittances and Punjab’s agricultural surpluses without commensurate
industrial transformation broadly explain the relatively high accumulation of bank
deposits in those states. Therefore, under the yardstick of credit-deposit ratio,
Punjab and Kerala appear under the bottom category, while in terms of per capita
deposit, both the states are in the top category. Even in terms of per capita bank
credit, Punjab and Kerala enjoy high rankings in the list.
In the state-wise distribution of development finance by all financial
institutions (AFIs), an apparent striking feature is the concentration of assistance in
a few states. Maharashtra and Gujarat absorb about 27 per cent and the three major
southern states about 22 per cent, thus these five states accounting for about near
one-half of assistance. On the other hand, four big-size states of UP, MP, Rajasthan,
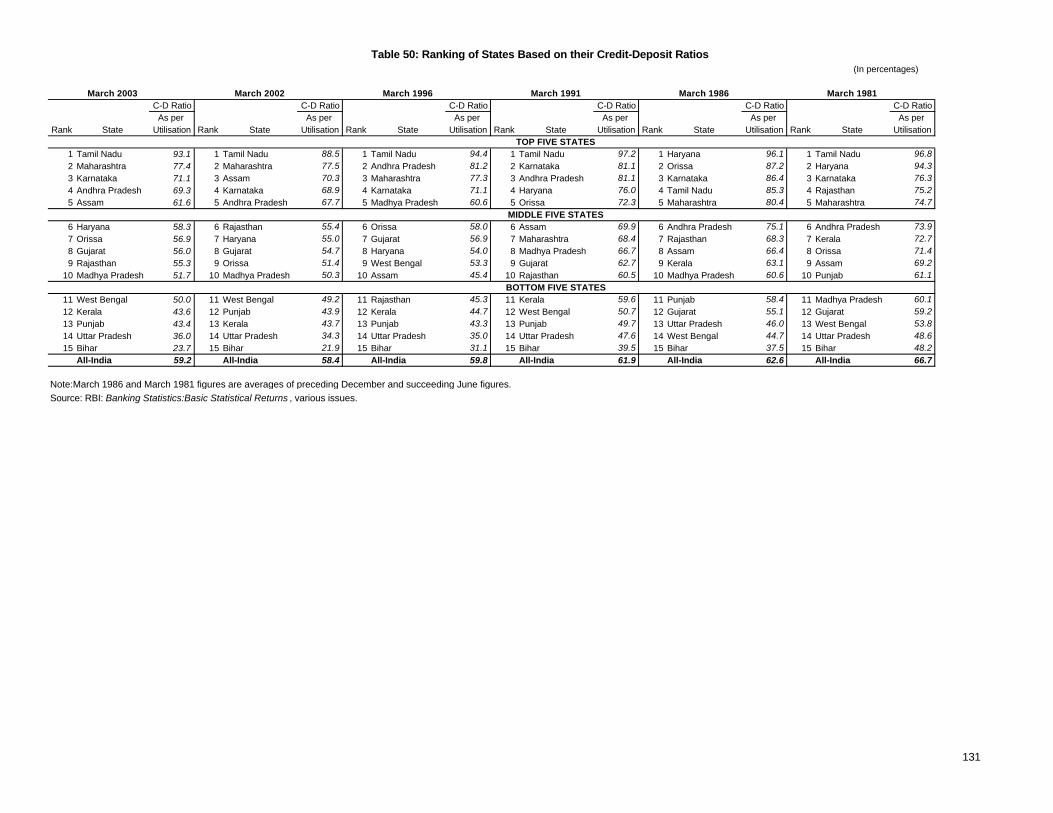
Table 50: Ranking of States Based on their Credit-Deposit Ratios (In percentages)
March 2003 March 2002 March 1996 March 1991 March 1986 March 1981C-D Ratio C-D Ratio C-D Ratio C-D Ratio C-D Ratio C-D Ratio
As per As per As per As per As per As per Rank State Utilisation Rank State Utilisation Rank State Utilisation Rank State Utilisation Rank State Utilisation Rank State Utilisation
TOP FIVE STATES1 Tamil Nadu 93.1 1 Tamil Nadu 88.5 1 Tamil Nadu 94.4 1 Tamil Nadu 97.2 1 Haryana 96.1 1 Tamil Nadu 96.82 Maharashtra 77.4 2 Maharashtra 77.5 2 Andhra Pradesh 81.2 2 Karnataka 81.1 2 Orissa 87.2 2 Haryana 94.33 Karnataka 71.1 3 Assam 70.3 3 Maharashtra 77.3 3 Andhra Pradesh 81.1 3 Karnataka 86.4 3 Karnataka 76.34 Andhra Pradesh 69.3 4 Karnataka 68.9 4 Karnataka 71.1 4 Haryana 76.0 4 Tamil Nadu 85.3 4 Rajasthan 75.25 Assam 61.6 5 Andhra Pradesh 67.7 5 Madhya Pradesh 60.6 5 Orissa 72.3 5 Maharashtra 80.4 5 Maharashtra 74.7
MIDDLE FIVE STATES6 Haryana 58.3 6 Rajasthan 55.4 6 Orissa 58.0 6 Assam 69.9 6 Andhra Pradesh 75.1 6 Andhra Pradesh 73.97 Orissa 56.9 7 Haryana 55.0 7 Gujarat 56.9 7 Maharashtra 68.4 7 Rajasthan 68.3 7 Kerala 72.78 Gujarat 56.0 8 Gujarat 54.7 8 Haryana 54.0 8 Madhya Pradesh 66.7 8 Assam 66.4 8 Orissa 71.49 Rajasthan 55.3 9 Orissa 51.4 9 West Bengal 53.3 9 Gujarat 62.7 9 Kerala 63.1 9 Assam 69.2
10 Madhya Pradesh 51.7 10 Madhya Pradesh 50.3 10 Assam 45.4 10 Rajasthan 60.5 10 Madhya Pradesh 60.6 10 Punjab 61.1BOTTOM FIVE STATES
11 West Bengal 50.0 11 West Bengal 49.2 11 Rajasthan 45.3 11 Kerala 59.6 11 Punjab 58.4 11 Madhya Pradesh 60.112 Kerala 43.6 12 Punjab 43.9 12 Kerala 44.7 12 West Bengal 50.7 12 Gujarat 55.1 12 Gujarat 59.213 Punjab 43.4 13 Kerala 43.7 13 Punjab 43.3 13 Punjab 49.7 13 Uttar Pradesh 46.0 13 West Bengal 53.814 Uttar Pradesh 36.0 14 Uttar Pradesh 34.3 14 Uttar Pradesh 35.0 14 Uttar Pradesh 47.6 14 West Bengal 44.7 14 Uttar Pradesh 48.615 Bihar 23.7 15 Bihar 21.9 15 Bihar 31.1 15 Bihar 39.5 15 Bihar 37.5 15 Bihar 48.2
All-India 59.2 All-India 58.4 All-India 59.8 All-India 61.9 All-India 62.6 All-India 66.7
Note:March 1986 and March 1981 figures are averages of preceding December and succeeding June figures.
Source: RBI: Banking Statistics:Basic Statistical Returns , various issues.
131
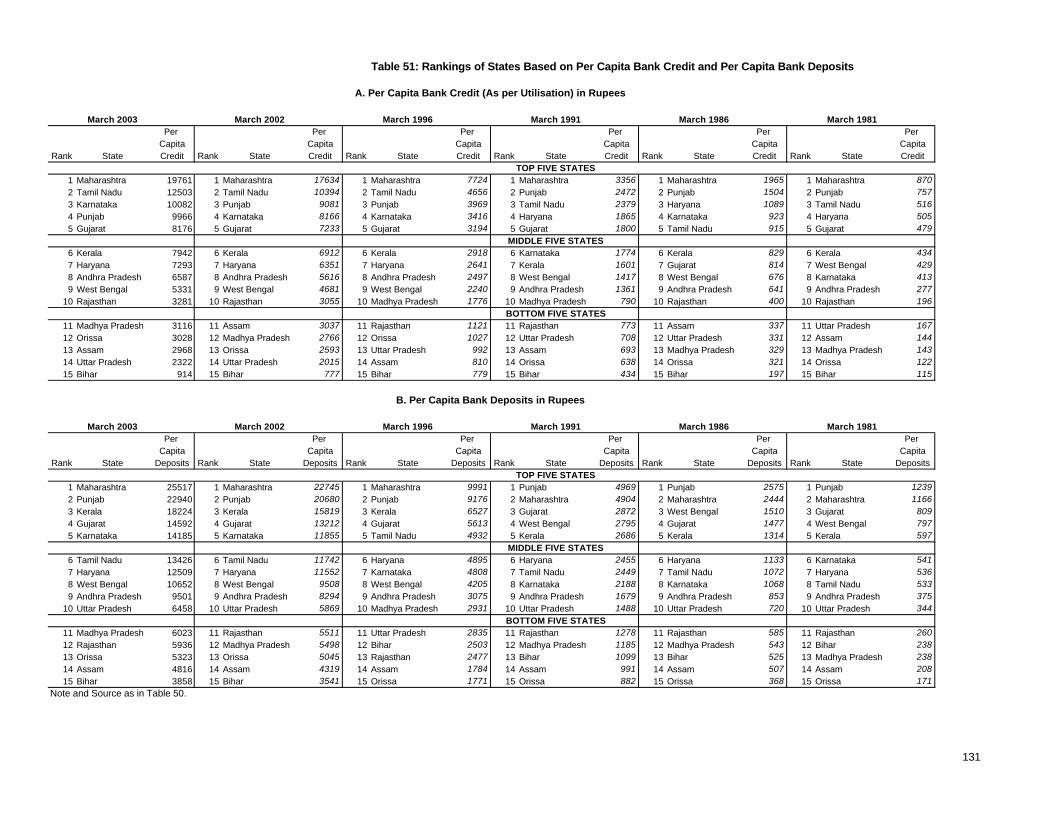
Table 51: Rankings of States Based on Per Capita Bank Credit and Per Capita Bank Deposits
March 2003 March 2002 March 1996 March 1991 March 1986 March 1981Per Per Per Per Per Per
Capita Capita Capita Capita Capita CapitaRank State Credit Rank State Credit Rank State Credit Rank State Credit Rank State Credit Rank State Credit
TOP FIVE STATES1 Maharashtra 19761 1 Maharashtra 17634 1 Maharashtra 7724 1 Maharashtra 3356 1 Maharashtra 1965 1 Maharashtra 8702 Tamil Nadu 12503 2 Tamil Nadu 10394 2 Tamil Nadu 4656 2 Punjab 2472 2 Punjab 1504 2 Punjab 7573 Karnataka 10082 3 Punjab 9081 3 Punjab 3969 3 Tamil Nadu 2379 3 Haryana 1089 3 Tamil Nadu 5164 Punjab 9966 4 Karnataka 8166 4 Karnataka 3416 4 Haryana 1865 4 Karnataka 923 4 Haryana 5055 Gujarat 8176 5 Gujarat 7233 5 Gujarat 3194 5 Gujarat 1800 5 Tamil Nadu 915 5 Gujarat 479
MIDDLE FIVE STATES6 Kerala 7942 6 Kerala 6912 6 Kerala 2918 6 Karnataka 1774 6 Kerala 829 6 Kerala 4347 Haryana 7293 7 Haryana 6351 7 Haryana 2641 7 Kerala 1601 7 Gujarat 814 7 West Bengal 4298 Andhra Pradesh 6587 8 Andhra Pradesh 5616 8 Andhra Pradesh 2497 8 West Bengal 1417 8 West Bengal 676 8 Karnataka 4139 West Bengal 5331 9 West Bengal 4681 9 West Bengal 2240 9 Andhra Pradesh 1361 9 Andhra Pradesh 641 9 Andhra Pradesh 277
10 Rajasthan 3281 10 Rajasthan 3055 10 Madhya Pradesh 1776 10 Madhya Pradesh 790 10 Rajasthan 400 10 Rajasthan 196BOTTOM FIVE STATES
11 Madhya Pradesh 3116 11 Assam 3037 11 Rajasthan 1121 11 Rajasthan 773 11 Assam 337 11 Uttar Pradesh 16712 Orissa 3028 12 Madhya Pradesh 2766 12 Orissa 1027 12 Uttar Pradesh 708 12 Uttar Pradesh 331 12 Assam 14413 Assam 2968 13 Orissa 2593 13 Uttar Pradesh 992 13 Assam 693 13 Madhya Pradesh 329 13 Madhya Pradesh 14314 Uttar Pradesh 2322 14 Uttar Pradesh 2015 14 Assam 810 14 Orissa 638 14 Orissa 321 14 Orissa 12215 Bihar 914 15 Bihar 777 15 Bihar 779 15 Bihar 434 15 Bihar 197 15 Bihar 115
March 2003 March 2002 March 1996 March 1991 March 1986 March 1981Per Per Per Per Per Per
Capita Capita Capita Capita Capita CapitaRank State Deposits Rank State Deposits Rank State Deposits Rank State Deposits Rank State Deposits Rank State Deposits
TOP FIVE STATES1 Maharashtra 25517 1 Maharashtra 22745 1 Maharashtra 9991 1 Punjab 4969 1 Punjab 2575 1 Punjab 12392 Punjab 22940 2 Punjab 20680 2 Punjab 9176 2 Maharashtra 4904 2 Maharashtra 2444 2 Maharashtra 11663 Kerala 18224 3 Kerala 15819 3 Kerala 6527 3 Gujarat 2872 3 West Bengal 1510 3 Gujarat 8094 Gujarat 14592 4 Gujarat 13212 4 Gujarat 5613 4 West Bengal 2795 4 Gujarat 1477 4 West Bengal 7975 Karnataka 14185 5 Karnataka 11855 5 Tamil Nadu 4932 5 Kerala 2686 5 Kerala 1314 5 Kerala 597
MIDDLE FIVE STATES6 Tamil Nadu 13426 6 Tamil Nadu 11742 6 Haryana 4895 6 Haryana 2455 6 Haryana 1133 6 Karnataka 5417 Haryana 12509 7 Haryana 11552 7 Karnataka 4808 7 Tamil Nadu 2449 7 Tamil Nadu 1072 7 Haryana 5368 West Bengal 10652 8 West Bengal 9508 8 West Bengal 4205 8 Karnataka 2188 8 Karnataka 1068 8 Tamil Nadu 5339 Andhra Pradesh 9501 9 Andhra Pradesh 8294 9 Andhra Pradesh 3075 9 Andhra Pradesh 1679 9 Andhra Pradesh 853 9 Andhra Pradesh 375
10 Uttar Pradesh 6458 10 Uttar Pradesh 5869 10 Madhya Pradesh 2931 10 Uttar Pradesh 1488 10 Uttar Pradesh 720 10 Uttar Pradesh 344BOTTOM FIVE STATES
11 Madhya Pradesh 6023 11 Rajasthan 5511 11 Uttar Pradesh 2835 11 Rajasthan 1278 11 Rajasthan 585 11 Rajasthan 26012 Rajasthan 5936 12 Madhya Pradesh 5498 12 Bihar 2503 12 Madhya Pradesh 1185 12 Madhya Pradesh 543 12 Bihar 23813 Orissa 5323 13 Orissa 5045 13 Rajasthan 2477 13 Bihar 1099 13 Bihar 525 13 Madhya Pradesh 23814 Assam 4816 14 Assam 4319 14 Assam 1784 14 Assam 991 14 Assam 507 14 Assam 20815 Bihar 3858 15 Bihar 3541 15 Orissa 1771 15 Orissa 882 15 Orissa 368 15 Orissa 171
Note and Source as in Table 50.
A. Per Capita Bank Credit (As per Utilisation) in Rupees
B. Per Capita Bank Deposits in Rupees
131
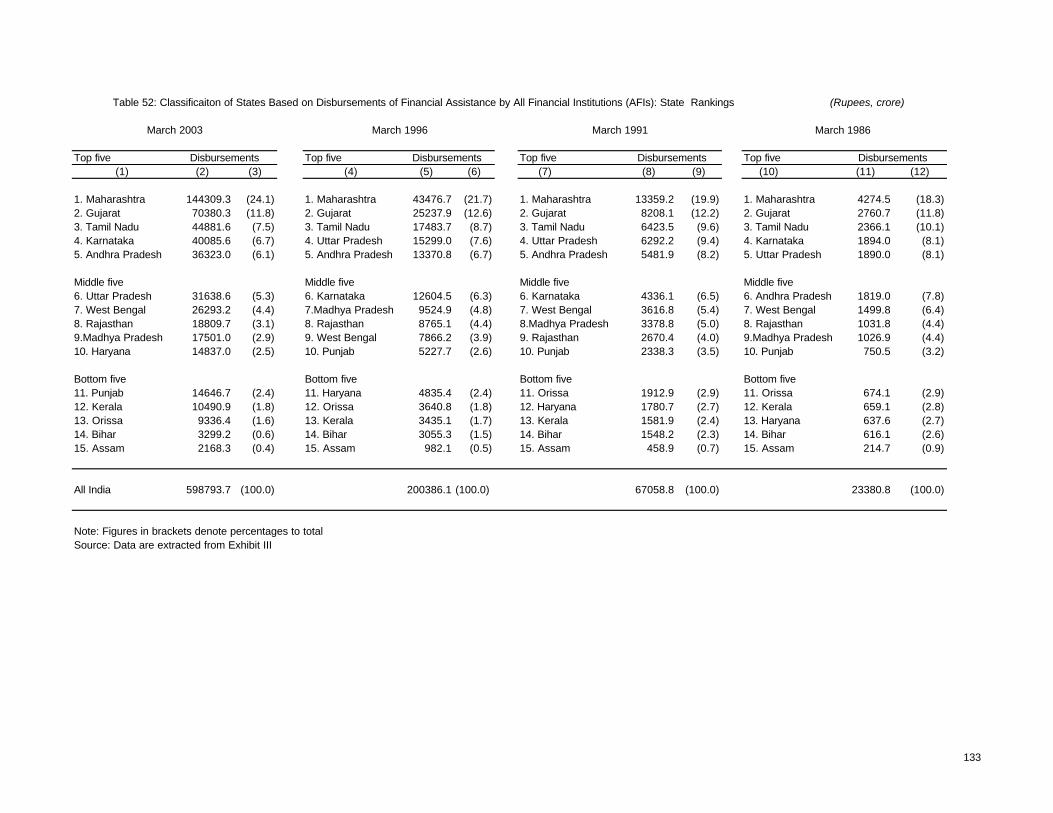
Top five Top five Top five Top five(1) (2) (3) (4) (5) (6) (7) (8) (9) (10) (11) (12)
1. Maharashtra 144309.3 (24.1) 1. Maharashtra 43476.7 (21.7) 1. Maharashtra 13359.2 (19.9) 1. Maharashtra 4274.5 (18.3)2. Gujarat 70380.3 (11.8) 2. Gujarat 25237.9 (12.6) 2. Gujarat 8208.1 (12.2) 2. Gujarat 2760.7 (11.8)3. Tamil Nadu 44881.6 (7.5) 3. Tamil Nadu 17483.7 (8.7) 3. Tamil Nadu 6423.5 (9.6) 3. Tamil Nadu 2366.1 (10.1)4. Karnataka 40085.6 (6.7) 4. Uttar Pradesh 15299.0 (7.6) 4. Uttar Pradesh 6292.2 (9.4) 4. Karnataka 1894.0 (8.1)5. Andhra Pradesh 36323.0 (6.1) 5. Andhra Pradesh 13370.8 (6.7) 5. Andhra Pradesh 5481.9 (8.2) 5. Uttar Pradesh 1890.0 (8.1)
Middle five Middle five Middle five Middle five6. Uttar Pradesh 31638.6 (5.3) 6. Karnataka 12604.5 (6.3) 6. Karnataka 4336.1 (6.5) 6. Andhra Pradesh 1819.0 (7.8)7. West Bengal 26293.2 (4.4) 7.Madhya Pradesh 9524.9 (4.8) 7. West Bengal 3616.8 (5.4) 7. West Bengal 1499.8 (6.4)8. Rajasthan 18809.7 (3.1) 8. Rajasthan 8765.1 (4.4) 8.Madhya Pradesh 3378.8 (5.0) 8. Rajasthan 1031.8 (4.4)9.Madhya Pradesh 17501.0 (2.9) 9. West Bengal 7866.2 (3.9) 9. Rajasthan 2670.4 (4.0) 9.Madhya Pradesh 1026.9 (4.4)10. Haryana 14837.0 (2.5) 10. Punjab 5227.7 (2.6) 10. Punjab 2338.3 (3.5) 10. Punjab 750.5 (3.2)
Bottom five Bottom five Bottom five Bottom five11. Punjab 14646.7 (2.4) 11. Haryana 4835.4 (2.4) 11. Orissa 1912.9 (2.9) 11. Orissa 674.1 (2.9)12. Kerala 10490.9 (1.8) 12. Orissa 3640.8 (1.8) 12. Haryana 1780.7 (2.7) 12. Kerala 659.1 (2.8)13. Orissa 9336.4 (1.6) 13. Kerala 3435.1 (1.7) 13. Kerala 1581.9 (2.4) 13. Haryana 637.6 (2.7)14. Bihar 3299.2 (0.6) 14. Bihar 3055.3 (1.5) 14. Bihar 1548.2 (2.3) 14. Bihar 616.1 (2.6)15. Assam 2168.3 (0.4) 15. Assam 982.1 (0.5) 15. Assam 458.9 (0.7) 15. Assam 214.7 (0.9)
All India 598793.7 (100.0) 200386.1 (100.0) 67058.8 (100.0) 23380.8 (100.0)
Note: Figures in brackets denote percentages to totalSource: Data are extracted from Exhibit III
Table 52: Classificaiton of States Based on Disbursements of Financial Assistance by All Financial Institutions (AFIs): State Rankings (Rupees, crore)
March 1996March 2003
Disbursements Disbursements
March 1991 March 1986
Disbursements Disbursements
133
134
and Bihar together account for just about 14 per cent of total assistance disbursed
by AFIs (Table 52). These four states account for 20 per cent of total GSDP or 36
per cent of the country’s total population. Maharashtra’s share in industrial output
in the 1990s has declined and Gujarat’s has remained static, and yet both the states
have enjoyed a rise in development finance. West Bengal’s is an example of both
the indicators registering declines in the state’s share. A priori it is thus difficult to
establish any close link between the inter-state distributions of development
finance and economic growth or industrial growth. Obviously, project finance is a
necessary but not sufficient condition for growth. But, there is yet another way of
looking at the state-wise distribution of institutional credit which is to work out the
picture in per capita terms – a way of judging fairness in distribution, however,
crudely (Table 53). This is what is attempted in a subsequent paragraph while
comparing it with fiscal performances of individual states.
Concentration of Investment Intentions
To a significant extent, the state-wise/regional concentration of the indicators
of bank credit and financial assistance by AFIs is not surprising, for there has been
an acute and growing concentration of industrial activities in the country. As
shown in Table 54, about 63 per cent of industrial output is concentrated in six
states of Maharashtra, Gujarat, Andhra Pradesh, Karnataka, Tamil Nadu and West
Bengal. Over years, their share in industrial output has been rising except for some
slowdown in the case of Maharashtra and the sharp deterioration in industrial
activities in West Bengal.
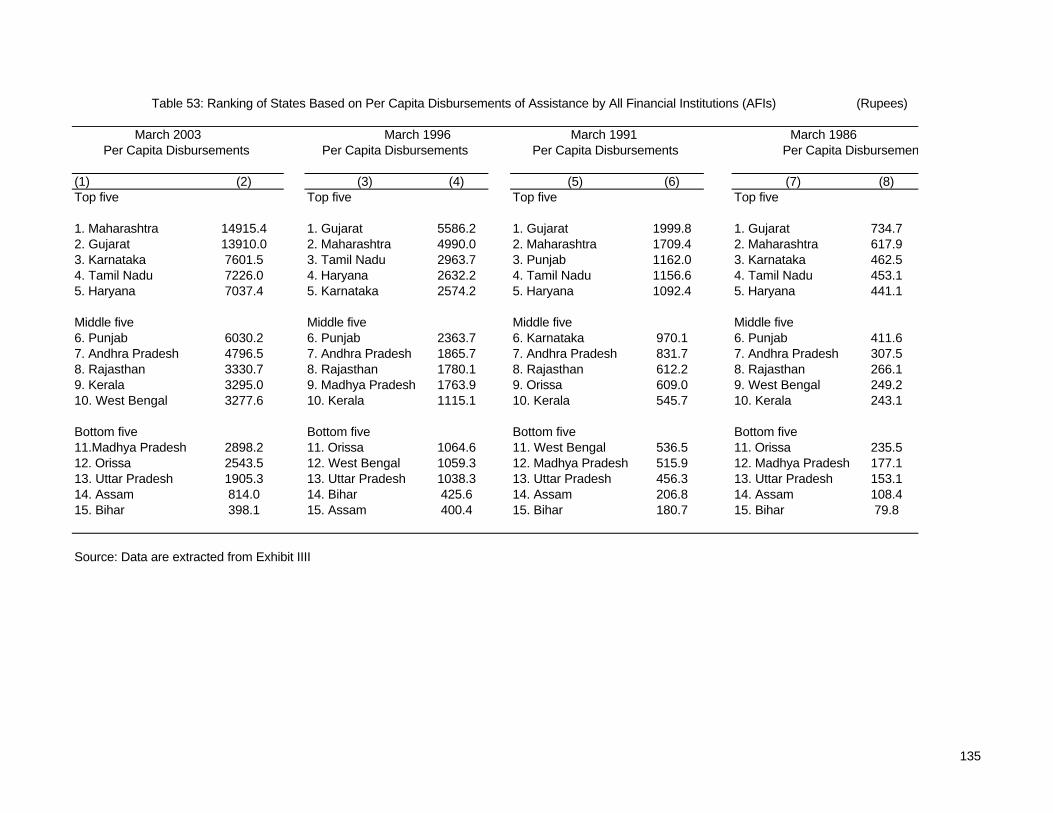
Table 53: Ranking of States Based on Per Capita Disbursements of Assistance by All Financial Institutions (AFIs) (Rupees)
March 2003 March 1996 March 1991
(1) (2) (3) (4) (5) (6) (7) (8)Top five Top five Top five Top five
1. Maharashtra 14915.4 1. Gujarat 5586.2 1. Gujarat 1999.8 1. Gujarat 734.72. Gujarat 13910.0 2. Maharashtra 4990.0 2. Maharashtra 1709.4 2. Maharashtra 617.93. Karnataka 7601.5 3. Tamil Nadu 2963.7 3. Punjab 1162.0 3. Karnataka 462.54. Tamil Nadu 7226.0 4. Haryana 2632.2 4. Tamil Nadu 1156.6 4. Tamil Nadu 453.15. Haryana 7037.4 5. Karnataka 2574.2 5. Haryana 1092.4 5. Haryana 441.1
Middle five Middle five Middle five Middle five6. Punjab 6030.2 6. Punjab 2363.7 6. Karnataka 970.1 6. Punjab 411.67. Andhra Pradesh 4796.5 7. Andhra Pradesh 1865.7 7. Andhra Pradesh 831.7 7. Andhra Pradesh 307.58. Rajasthan 3330.7 8. Rajasthan 1780.1 8. Rajasthan 612.2 8. Rajasthan 266.19. Kerala 3295.0 9. Madhya Pradesh 1763.9 9. Orissa 609.0 9. West Bengal 249.210. West Bengal 3277.6 10. Kerala 1115.1 10. Kerala 545.7 10. Kerala 243.1
Bottom five Bottom five Bottom five Bottom five11.Madhya Pradesh 2898.2 11. Orissa 1064.6 11. West Bengal 536.5 11. Orissa 235.512. Orissa 2543.5 12. West Bengal 1059.3 12. Madhya Pradesh 515.9 12. Madhya Pradesh 177.113. Uttar Pradesh 1905.3 13. Uttar Pradesh 1038.3 13. Uttar Pradesh 456.3 13. Uttar Pradesh 153.114. Assam 814.0 14. Bihar 425.6 14. Assam 206.8 14. Assam 108.415. Bihar 398.1 15. Assam 400.4 15. Bihar 180.7 15. Bihar 79.8
Source: Data are extracted from Exhibit IIII
March 1986 Per Capita Disbursements Per Capita Disbursements Per Capita Disbursements Per Capita Disbursements
135

Per Capita Disbursements
135
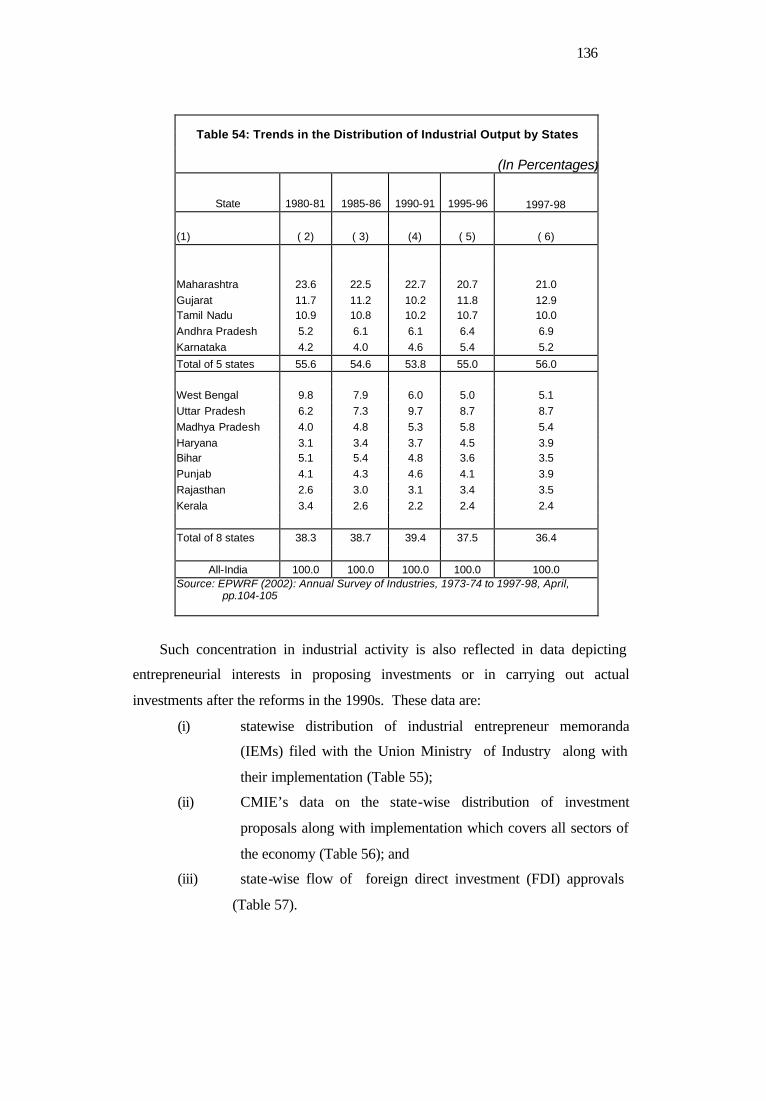
136
Table 54: Trends in the Distribution of Industrial Output by States
(In Percentages)
State 1980-81 1985-86 1990-91 1995-96
1997-98
(1) ( 2) ( 3) (4) ( 5) ( 6)
Maharashtra 23.6 22.5 22.7 20.7 21.0
Gujarat 11.7 11.2 10.2 11.8 12.9 Tamil Nadu 10.9 10.8 10.2 10.7 10.0
Andhra Pradesh 5.2 6.1 6.1 6.4 6.9
Karnataka 4.2 4.0 4.6 5.4 5.2
Total of 5 states 55.6 54.6 53.8 55.0 56.0
West Bengal 9.8 7.9 6.0 5.0 5.1
Uttar Pradesh 6.2 7.3 9.7 8.7 8.7
Madhya Pradesh 4.0 4.8 5.3 5.8 5.4
Haryana 3.1 3.4 3.7 4.5 3.9 Bihar 5.1 5.4 4.8 3.6 3.5
Punjab 4.1 4.3 4.6 4.1 3.9
Rajasthan 2.6 3.0 3.1 3.4 3.5
Kerala 3.4 2.6 2.2 2.4 2.4
Total of 8 states 38.3 38.7 39.4 37.5 36.4
All-India 100.0 100.0 100.0 100.0 100.0 Source: EPWRF (2002): Annual Survey of Industries, 1973-74 to 1997-98, April,
pp.104-105
Such concentration in industrial activity is also reflected in data depicting
entrepreneurial interests in proposing investments or in carrying out actual
investments after the reforms in the 1990s. These data are:
(i) statewise distribution of industrial entrepreneur memoranda
(IEMs) filed with the Union Ministry of Industry along with
their implementation (Table 55);
(ii) CMIE’s data on the state-wise distribution of investment
proposals along with implementation which covers all sectors of
the economy (Table 56); and
(iii) state-wise flow of foreign direct investment (FDI) approvals
(Table 57).
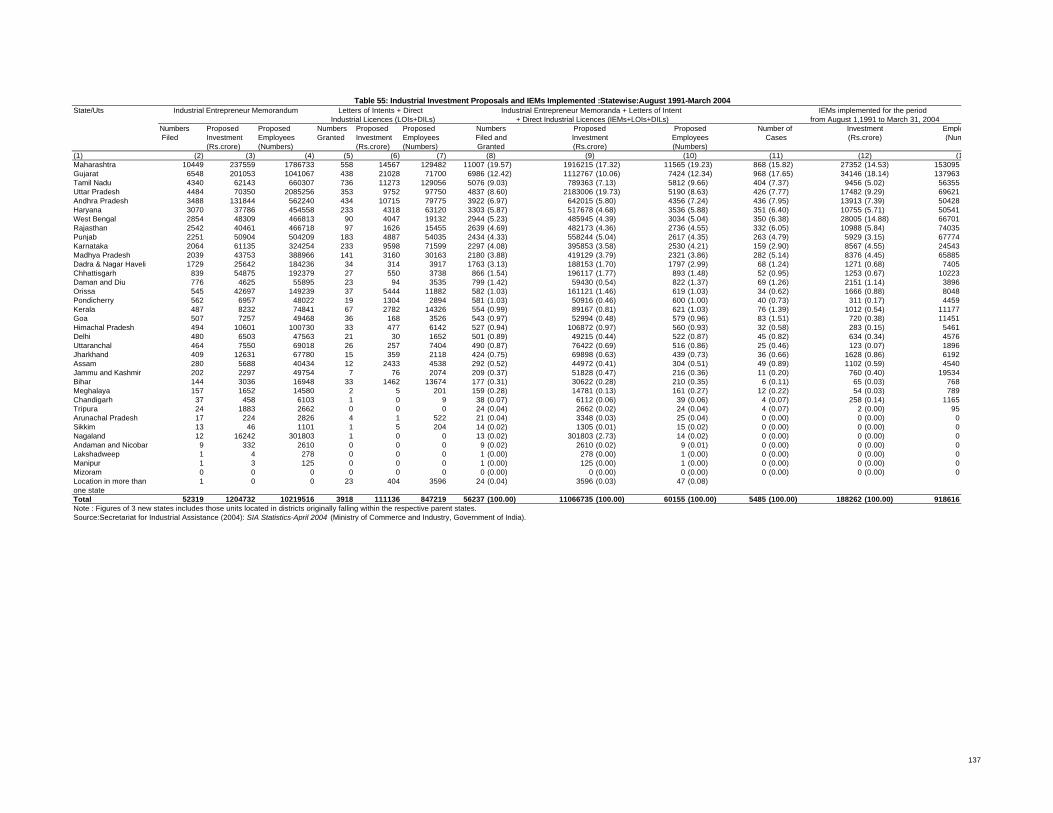
State/Uts
Numbers Proposed Proposed Numbers Proposed Proposed Filed Investment Employees Granted Investment Employees
(Rs.crore) (Numbers) (Rs.crore) (Numbers)(1) (2) (3) (4) (5) (6) (7)Maharashtra 10449 237559 1786733 558 14567 129482 11007 (19.57) 1916215 (17.32) 11565 (19.23) 868 (15.82) 27352 (14.53) 153095Gujarat 6548 201053 1041067 438 21028 71700 6986 (12.42) 1112767 (10.06) 7424 (12.34) 968 (17.65) 34146 (18.14) 137963Tamil Nadu 4340 62143 660307 736 11273 129056 5076 (9.03) 789363 (7.13) 5812 (9.66) 404 (7.37) 9456 (5.02) 56355Uttar Pradesh 4484 70350 2085256 353 9752 97750 4837 (8.60) 2183006 (19.73) 5190 (8.63) 426 (7.77) 17482 (9.29) 69621Andhra Pradesh 3488 131844 562240 434 10715 79775 3922 (6.97) 642015 (5.80) 4356 (7.24) 436 (7.95) 13913 (7.39) 50428Haryana 3070 37786 454558 233 4318 63120 3303 (5.87) 517678 (4.68) 3536 (5.88) 351 (6.40) 10755 (5.71) 50541West Bengal 2854 48309 466813 90 4047 19132 2944 (5.23) 485945 (4.39) 3034 (5.04) 350 (6.38) 28005 (14.88) 66701Rajasthan 2542 40461 466718 97 1626 15455 2639 (4.69) 482173 (4.36) 2736 (4.55) 332 (6.05) 10988 (5.84) 74035Punjab 2251 50904 504209 183 4887 54035 2434 (4.33) 558244 (5.04) 2617 (4.35) 263 (4.79) 5929 (3.15) 67774Karnataka 2064 61135 324254 233 9598 71599 2297 (4.08) 395853 (3.58) 2530 (4.21) 159 (2.90) 8567 (4.55) 24543Madhya Pradesh 2039 43753 388966 141 3160 30163 2180 (3.88) 419129 (3.79) 2321 (3.86) 282 (5.14) 8376 (4.45) 65885Dadra & Nagar Haveli 1729 25642 184236 34 314 3917 1763 (3.13) 188153 (1.70) 1797 (2.99) 68 (1.24) 1271 (0.68) 7405Chhattisgarh 839 54875 192379 27 550 3738 866 (1.54) 196117 (1.77) 893 (1.48) 52 (0.95) 1253 (0.67) 10223Daman and Diu 776 4625 55895 23 94 3535 799 (1.42) 59430 (0.54) 822 (1.37) 69 (1.26) 2151 (1.14) 3896Orissa 545 42697 149239 37 5444 11882 582 (1.03) 161121 (1.46) 619 (1.03) 34 (0.62) 1666 (0.88) 8048Pondicherry 562 6957 48022 19 1304 2894 581 (1.03) 50916 (0.46) 600 (1.00) 40 (0.73) 311 (0.17) 4459Kerala 487 8232 74841 67 2782 14326 554 (0.99) 89167 (0.81) 621 (1.03) 76 (1.39) 1012 (0.54) 11177Goa 507 7257 49468 36 168 3526 543 (0.97) 52994 (0.48) 579 (0.96) 83 (1.51) 720 (0.38) 11451Himachal Pradesh 494 10601 100730 33 477 6142 527 (0.94) 106872 (0.97) 560 (0.93) 32 (0.58) 283 (0.15) 5461Delhi 480 6503 47563 21 30 1652 501 (0.89) 49215 (0.44) 522 (0.87) 45 (0.82) 634 (0.34) 4576Uttaranchal 464 7550 69018 26 257 7404 490 (0.87) 76422 (0.69) 516 (0.86) 25 (0.46) 123 (0.07) 1896Jharkhand 409 12631 67780 15 359 2118 424 (0.75) 69898 (0.63) 439 (0.73) 36 (0.66) 1628 (0.86) 6192Assam 280 5688 40434 12 2433 4538 292 (0.52) 44972 (0.41) 304 (0.51) 49 (0.89) 1102 (0.59) 4540Jammu and Kashmir 202 2297 49754 7 76 2074 209 (0.37) 51828 (0.47) 216 (0.36) 11 (0.20) 760 (0.40) 19534Bihar 144 3036 16948 33 1462 13674 177 (0.31) 30622 (0.28) 210 (0.35) 6 (0.11) 65 (0.03) 768Meghalaya 157 1652 14580 2 5 201 159 (0.28) 14781 (0.13) 161 (0.27) 12 (0.22) 54 (0.03) 789Chandigarh 37 458 6103 1 0 9 38 (0.07) 6112 (0.06) 39 (0.06) 4 (0.07) 258 (0.14) 1165Tripura 24 1883 2662 0 0 0 24 (0.04) 2662 (0.02) 24 (0.04) 4 (0.07) 2 (0.00) 95Arunachal Pradesh 17 224 2826 4 1 522 21 (0.04) 3348 (0.03) 25 (0.04) 0 (0.00) 0 (0.00) 0Sikkim 13 46 1101 1 5 204 14 (0.02) 1305 (0.01) 15 (0.02) 0 (0.00) 0 (0.00) 0Nagaland 12 16242 301803 1 0 0 13 (0.02) 301803 (2.73) 14 (0.02) 0 (0.00) 0 (0.00) 0Andaman and Nicobar 9 332 2610 0 0 0 9 (0.02) 2610 (0.02) 9 (0.01) 0 (0.00) 0 (0.00) 0Lakshadweep 1 4 278 0 0 0 1 (0.00) 278 (0.00) 1 (0.00) 0 (0.00) 0 (0.00) 0Manipur 1 3 125 0 0 0 1 (0.00) 125 (0.00) 1 (0.00) 0 (0.00) 0 (0.00) 0Mizoram 0 0 0 0 0 0 0 (0.00) 0 (0.00) 0 (0.00) 0 (0.00) 0 (0.00) 0Location in more than 1 0 0 23 404 3596 24 (0.04) 3596 (0.03) 47 (0.08)one stateTotal 52319 1204732 10219516 3918 111136 847219 56237 (100.00) 11066735 (100.00) 60155 (100.00) 5485 (100.00) 188262 (100.00) 918616Note : Figures of 3 new states includes those units located in districts originally falling within the respective parent states.Source:Secretariat for Industrial Assistance (2004): SIA Statistics-April 2004 (Ministry of Commerce and Industry, Government of India).
(8)
NumbersFiled andGranted
(13)(9)
ProposedInvestment(Rs.crore) (Numbers)
(10) (11) (12)
Employment(Numbers)
ProposedEmployees
Number of Cases
Investment(Rs.crore)
Table 55: Industrial Investment Proposals and IEMs Implemented :Statewise:August 1991-March 2004Industrial Entrepreneur Memorandum Letters of Intents + Direct
Industrial Licences (LOIs+DILs)Industrial Entrepreneur Memoranda + Letters of Intent
+ Direct Industrial Licences (IEMs+LOIs+DILs)IEMs implemented for the period
from August 1,1991 to March 31, 2004
137
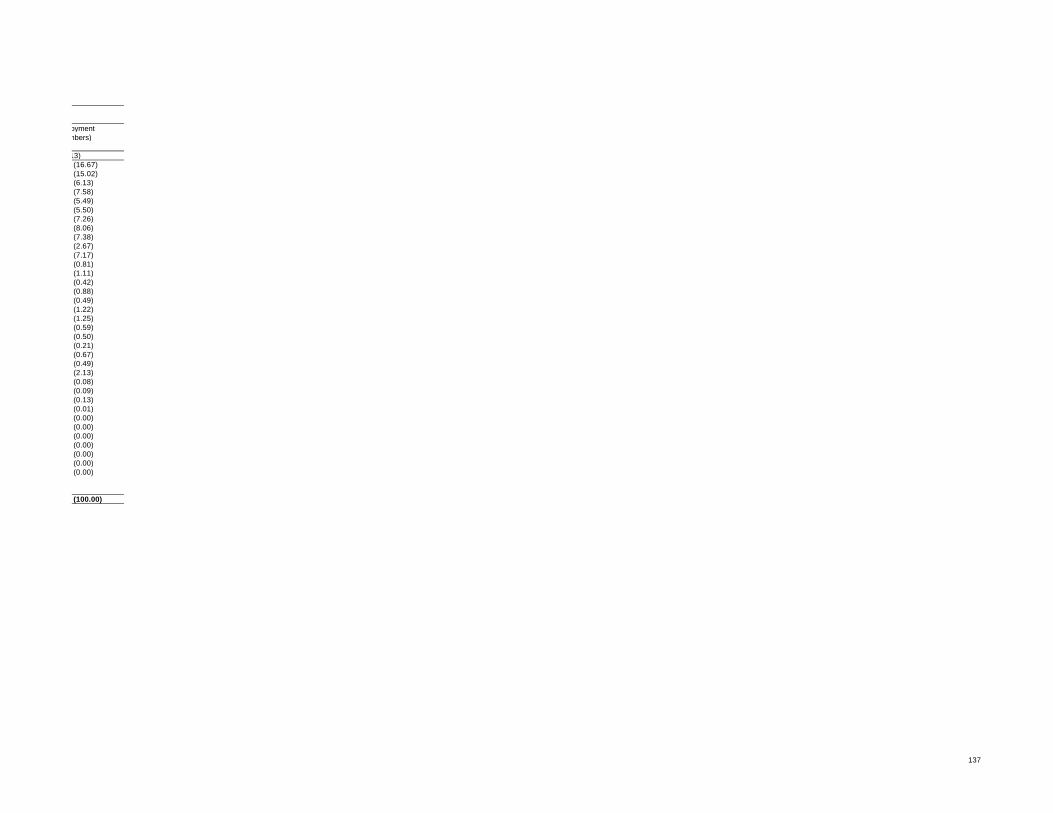
(16.67)(15.02)(6.13)(7.58)(5.49)(5.50)(7.26)(8.06)(7.38)(2.67)(7.17)(0.81)(1.11)(0.42)(0.88)(0.49)(1.22)(1.25)(0.59)(0.50)(0.21)(0.67)(0.49)(2.13)(0.08)(0.09)(0.13)(0.01)(0.00)(0.00)(0.00)(0.00)(0.00)(0.00)(0.00)
(100.00)
(13)
Employment(Numbers)
137
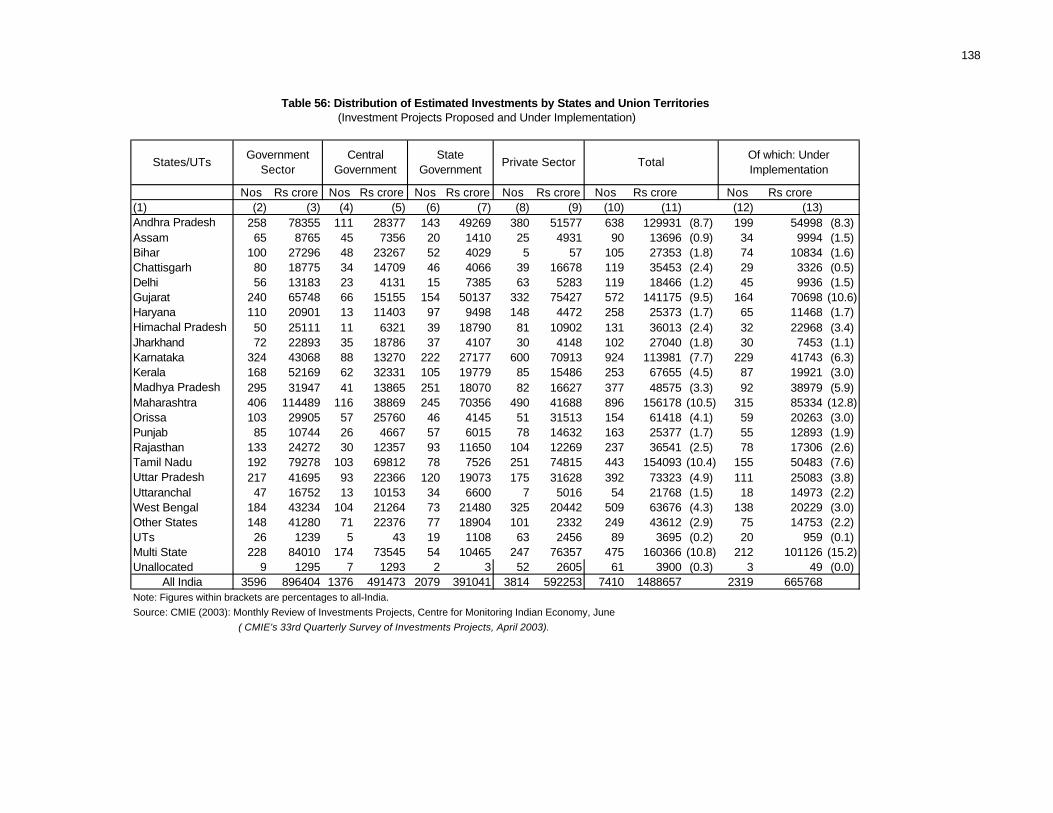
138
Nos Rs crore Nos Rs crore Nos Rs crore Nos Rs crore Nos Rs crore Nos Rs crore(1) (2) (3) (4) (5) (6) (7) (8) (9) (10) (11) (12) (13)
258 78355 111 28377 143 49269 380 51577 638 129931 (8.7) 199 54998 (8.3)Assam 65 8765 45 7356 20 1410 25 4931 90 13696 (0.9) 34 9994 (1.5)Bihar 100 27296 48 23267 52 4029 5 57 105 27353 (1.8) 74 10834 (1.6)Chattisgarh 80 18775 34 14709 46 4066 39 16678 119 35453 (2.4) 29 3326 (0.5)Delhi 56 13183 23 4131 15 7385 63 5283 119 18466 (1.2) 45 9936 (1.5)Gujarat 240 65748 66 15155 154 50137 332 75427 572 141175 (9.5) 164 70698 (10.6)Haryana 110 20901 13 11403 97 9498 148 4472 258 25373 (1.7) 65 11468 (1.7)
50 25111 11 6321 39 18790 81 10902 131 36013 (2.4) 32 22968 (3.4)Jharkhand 72 22893 35 18786 37 4107 30 4148 102 27040 (1.8) 30 7453 (1.1)Karnataka 324 43068 88 13270 222 27177 600 70913 924 113981 (7.7) 229 41743 (6.3)Kerala 168 52169 62 32331 105 19779 85 15486 253 67655 (4.5) 87 19921 (3.0)
295 31947 41 13865 251 18070 82 16627 377 48575 (3.3) 92 38979 (5.9)Maharashtra 406 114489 116 38869 245 70356 490 41688 896 156178 (10.5) 315 85334 (12.8)Orissa 103 29905 57 25760 46 4145 51 31513 154 61418 (4.1) 59 20263 (3.0)Punjab 85 10744 26 4667 57 6015 78 14632 163 25377 (1.7) 55 12893 (1.9)Rajasthan 133 24272 30 12357 93 11650 104 12269 237 36541 (2.5) 78 17306 (2.6)Tamil Nadu 192 79278 103 69812 78 7526 251 74815 443 154093 (10.4) 155 50483 (7.6)
217 41695 93 22366 120 19073 175 31628 392 73323 (4.9) 111 25083 (3.8)Uttaranchal 47 16752 13 10153 34 6600 7 5016 54 21768 (1.5) 18 14973 (2.2)West Bengal 184 43234 104 21264 73 21480 325 20442 509 63676 (4.3) 138 20229 (3.0)Other States 148 41280 71 22376 77 18904 101 2332 249 43612 (2.9) 75 14753 (2.2)UTs 26 1239 5 43 19 1108 63 2456 89 3695 (0.2) 20 959 (0.1)Multi State 228 84010 174 73545 54 10465 247 76357 475 160366 (10.8) 212 101126 (15.2)Unallocated 9 1295 7 1293 2 3 52 2605 61 3900 (0.3) 3 49 (0.0)
All India 3596 896404 1376 491473 2079 391041 3814 592253 7410 1488657 2319 665768Note: Figures within brackets are percentages to all-India.
Source: CMIE (2003): Monthly Review of Investments Projects, Centre for Monitoring Indian Economy, June
( CMIE's 33rd Quarterly Survey of Investments Projects, April 2003).
Andhra Pradesh
Himachal Pradesh
Madhya Pradesh
Uttar Pradesh
Private Sector Total
Table 56: Distribution of Estimated Investments by States and Union Territories
Of which: Under Implementation
States/UTsGovernment
SectorCentral
GovernmentState
Government
(Investment Projects Proposed and Under Implementation)
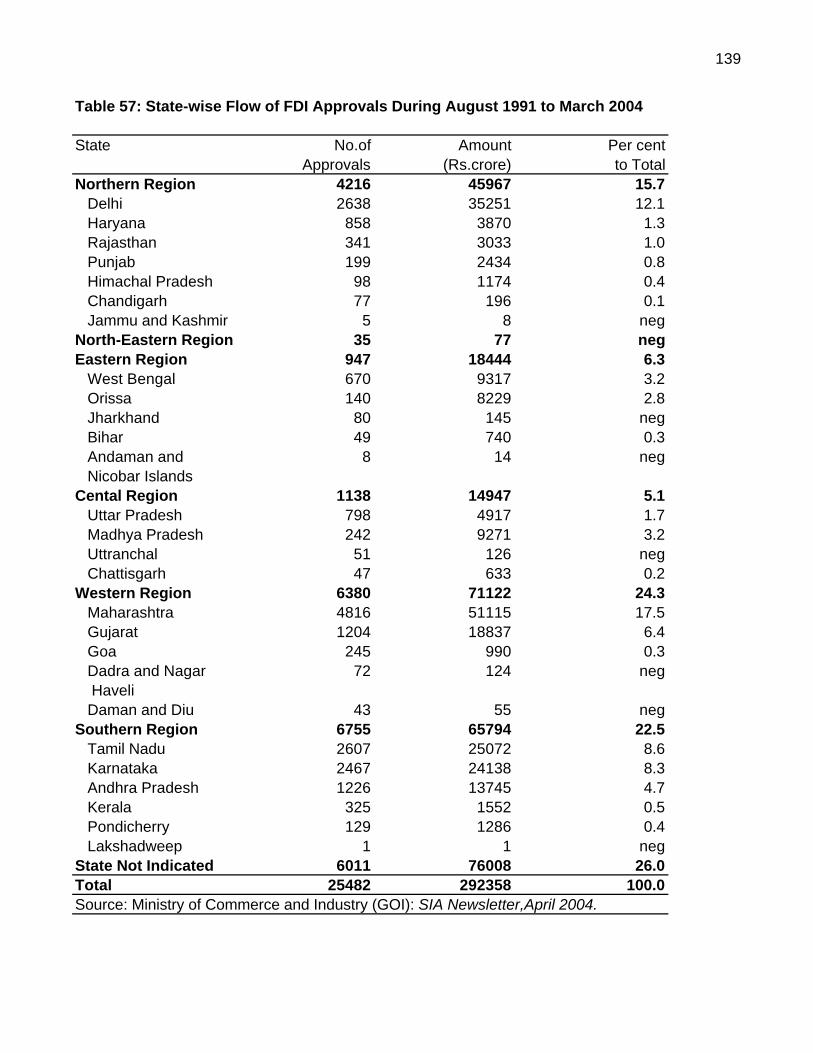
139
Table 57: State-wise Flow of FDI Approvals During August 1991 to March 2004
State No.of Amount Per centApprovals (Rs.crore) to Total
Northern Region 4216 45967 15.7 Delhi 2638 35251 12.1 Haryana 858 3870 1.3 Rajasthan 341 3033 1.0 Punjab 199 2434 0.8 Himachal Pradesh 98 1174 0.4 Chandigarh 77 196 0.1 Jammu and Kashmir 5 8 negNorth-Eastern Region 35 77 negEastern Region 947 18444 6.3 West Bengal 670 9317 3.2 Orissa 140 8229 2.8 Jharkhand 80 145 neg Bihar 49 740 0.3 Andaman and 8 14 neg Nicobar IslandsCental Region 1138 14947 5.1 Uttar Pradesh 798 4917 1.7 Madhya Pradesh 242 9271 3.2 Uttranchal 51 126 neg Chattisgarh 47 633 0.2Western Region 6380 71122 24.3 Maharashtra 4816 51115 17.5 Gujarat 1204 18837 6.4 Goa 245 990 0.3 Dadra and Nagar 72 124 neg Haveli Daman and Diu 43 55 negSouthern Region 6755 65794 22.5 Tamil Nadu 2607 25072 8.6 Karnataka 2467 24138 8.3 Andhra Pradesh 1226 13745 4.7 Kerala 325 1552 0.5 Pondicherry 129 1286 0.4 Lakshadweep 1 1 negState Not Indicated 6011 76008 26.0Total 25482 292358 100.0Source: Ministry of Commerce and Industry (GOI): SIA Newsletter,April 2004.
140
All of these data point to an acute concentration amongst a few states. First, as
per the data on IEMs and LoIs, near 55 per cent of proposed investment is
concentrated in four states of Maharashtra, Gujarat, Tamil Nadu and Andhra
Pradesh (Table 55). In the actual execution of these investment projects, however,
there is a slightly better spread, for five more states, namely, Haryana, West
Bengal, Rajasthan, Punjab and Madhya Pradesh, which have bagged 36 per cent of
the projects implemented (also in Table 55), though they had only 26 per cent share
at the proposal stage, indicating that these states are moving faster in project
implementation than the traditionally advanced states which, with 55 per cent share
in proposals, accounted for only 43 per cent in actual investment.
The above IEMs/LoIs data relate essentially to state-wise industrial
investment. There is another set of data collated by the Centre for Monitoring
Indian Economy (CMIE) based on its quarterly surveys of investment projects,
which cover all sectors of the economy, including irrigation and agriculture
projects. Interestingly, these data also suggest concentration but not to the same
extent as in the above industrial sector data. The top five states in aggregate
investment proposals as well as in their actual implementation as per the CMIE
data are Maharashtra, Gujarat, Tamil Nadu. Andhra Pradesh and Karnataka, which
together have a share of about 46 per cent of the total (Table 56). The top three
states in this set of data and the fourth state (Andhra Pradesh) which is in the fifth
rank here are the same as in the government’s IEMs implementation data, as
presented in the previous paragraph.
Finally, in the state-wise FDI approvals, the concentration has been still
more acute with about 63 per cent of the total approvals for the past 12 years from
August 1991 to March 2003 have been in the above mentioned five states. In all
of these data, the spread of investment activity to the three southern states of
Andhra Pradesh, Tamil Nadu and Karnataka stands out; Gujarat is another state
that has a consistently high share (Table 57). A caution should of course be
exercised in using FDI approvals data, for we have no information on the actual
eventual location of the approved foreign direct investment projects. It is very
likely that a substantial proportion of FDI approvals in metropolitan centres like
Delhi and Mumbai.
141
A sliver-lining in the otherwise acutely narrow investment
concentration has been the spread of activities into a few more states. This
has been particularly so in the three out of four southern states of Andhra
Pradesh, Tamil Nadu and Karnataka, which is found to be true interestingly,
as we will explain shortly, in all economic, social, financial and fiscal
indicators of progress. Apart from these southern states, some states in the
north which figure in the comparatively better performing league are Haryana,
Rajasthan, Punjab and Madhya Pradesh. The state of Uttar Pradesh possesses
a somewhat high share in many indicators partly because it is also the largest
state in the country and second, there are some of its pockets like the Western
UP which seem to attract industrial investments.
Fiscal Performance Vis -a-Vis the Economic Performance of States
In the above few paragraphs of this section, we have marshalled
substantial amount of empirical evidences on the rankings of states as per their
performances in income growth, improvement in human development, and
banking and financial sector development, as also in investment proposals and
execution. What do all these multiple sets of data add up to? Are the
performances of the sta tes in these respects akin to their fiscal performances?
An attempt is made in the following paragraphs to distil some answers so
these questions.
For facilitating such answers, however, we need to select a few crucial
indicators of fiscal performance of states, for otherwise there are very many
indicators and some of them indicate divergent performances on the part of
the states, as brought out earlier. The indicators so chosen are four: (i)
revenue deficit and gross fiscal deficit as presented in Table 34 earlier; (ii) a
specially-designed measure of fiscal imbalance in states which is defined as
total expenditure minus states’ own total revenue; (iii) states’ own tax revenue
as percentage of GSDP; and (iv) development expenditure as percentage of
respective GSDP (Table 58).
142
Key Results
Abstracting from aberrations and occasional divergences, there is an
amazing consistency in the varied rankings of states presented above.
Distilling the results from multiple performance indicators, a comparative
picture has been prepared and presented in Table 59 for major indicators.
From this it is clear that an overwhelming number of states appear common in
all the three top, middle, and bottom rankings pertaining to five different
measures of economic, financial and fiscal performances. Thus, a majority of
the top five states showing relatively better fiscal balance in recent years,
namely, Haryana, Maharashtra, Tamil Nadu Karnataka and Punjab, generally
appear in top rankings under those economic and financia l measures.
Likewise, at the other end of the scale, each of the five bottom ranking states
in fiscal performance, namely, Uttar Pradesh, West Bengal. Orissa, Assam
and Bihar seem to appear generally amongst such poor performance league in
almost all of the four economic and financial measures. As a result, the
middle group of states in fiscal performance, namely, Kerala, Andhra Pradesh,
Gujarat, Madhya Pradesh and Rajasthan also appear generally in the middle
groups in one measure or the other.
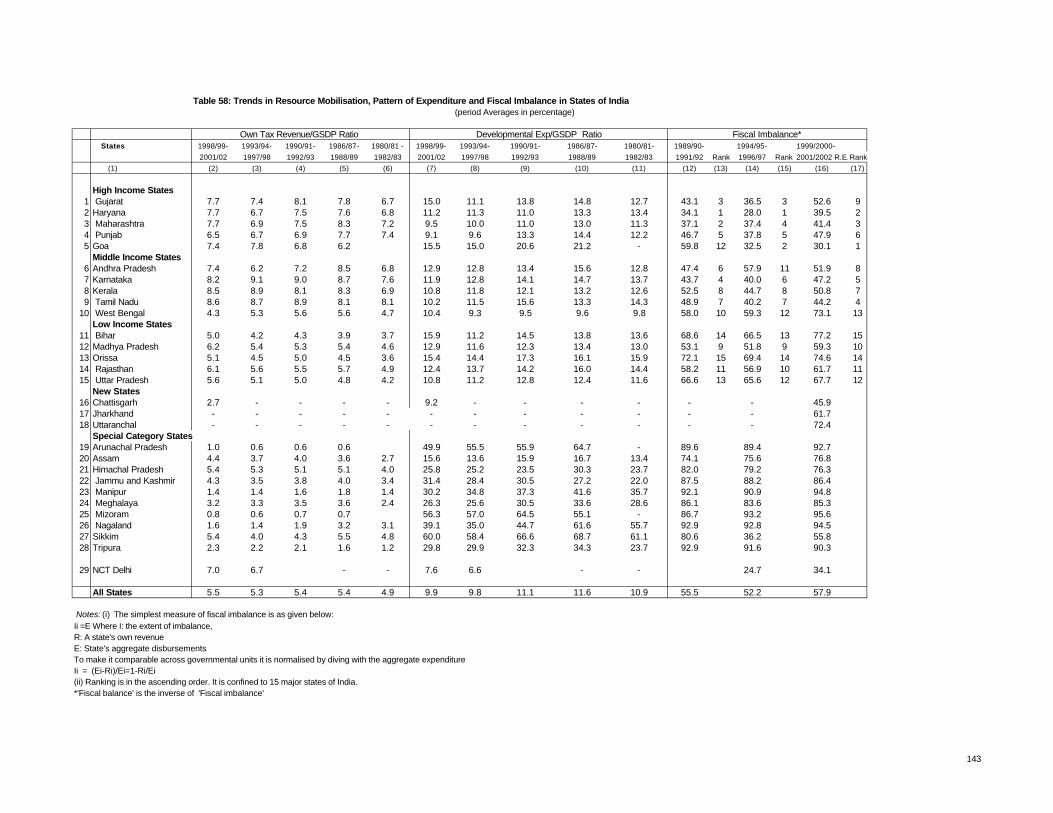
Table 58: Trends in Resource Mobilisation, Pattern of Expenditure and Fiscal Imbalance in States of India(period Averages in percentage)
States 1998/99- 1993/94- 1990/91- 1986/87- 1980/81 - 1998/99- 1993/94- 1990/91- 1986/87- 1980/81- 1989/90- 1994/95- 1999/2000-
2001/02 1997/98 1992/93 1988/89 1982/83 2001/02 1997/98 1992/93 1988/89 1982/83 1991/92 Rank 1996/97 Rank 2001/2002 R.E.Rank
(1) (2) (3) (4) (5) (6) (7) (8) (9) (10) (11) (12) (13) (14) (15) (16) (17)
High Income States1 Gujarat 7.7 7.4 8.1 7.8 6.7 15.0 11.1 13.8 14.8 12.7 43.1 3 36.5 3 52.6 92 Haryana 7.7 6.7 7.5 7.6 6.8 11.2 11.3 11.0 13.3 13.4 34.1 1 28.0 1 39.5 23 Maharashtra 7.7 6.9 7.5 8.3 7.2 9.5 10.0 11.0 13.0 11.3 37.1 2 37.4 4 41.4 34 Punjab 6.5 6.7 6.9 7.7 7.4 9.1 9.6 13.3 14.4 12.2 46.7 5 37.8 5 47.9 65 Goa 7.4 7.8 6.8 6.2 15.5 15.0 20.6 21.2 - 59.8 12 32.5 2 30.1 1
Middle Income States6 Andhra Pradesh 7.4 6.2 7.2 8.5 6.8 12.9 12.8 13.4 15.6 12.8 47.4 6 57.9 11 51.9 87 Karnataka 8.2 9.1 9.0 8.7 7.6 11.9 12.8 14.1 14.7 13.7 43.7 4 40.0 6 47.2 58 Kerala 8.5 8.9 8.1 8.3 6.9 10.8 11.8 12.1 13.2 12.6 52.5 8 44.7 8 50.8 79 Tamil Nadu 8.6 8.7 8.9 8.1 8.1 10.2 11.5 15.6 13.3 14.3 48.9 7 40.2 7 44.2 4
10 West Bengal 4.3 5.3 5.6 5.6 4.7 10.4 9.3 9.5 9.6 9.8 58.0 10 59.3 12 73.1 13Low Income States
11 Bihar 5.0 4.2 4.3 3.9 3.7 15.9 11.2 14.5 13.8 13.6 68.6 14 66.5 13 77.2 1512 Madhya Pradesh 6.2 5.4 5.3 5.4 4.6 12.9 11.6 12.3 13.4 13.0 53.1 9 51.8 9 59.3 1013 Orissa 5.1 4.5 5.0 4.5 3.6 15.4 14.4 17.3 16.1 15.9 72.1 15 69.4 14 74.6 1414 Rajasthan 6.1 5.6 5.5 5.7 4.9 12.4 13.7 14.2 16.0 14.4 58.2 11 56.9 10 61.7 1115 Uttar Pradesh 5.6 5.1 5.0 4.8 4.2 10.8 11.2 12.8 12.4 11.6 66.6 13 65.6 12 67.7 12
New States16 Chattisgarh 2.7 - - - - 9.2 - - - - - - 45.917 Jharkhand - - - - - - - - - - - - 61.718 Uttaranchal - - - - - - - - - - - - 72.4
Special Category States19 Arunachal Pradesh 1.0 0.6 0.6 0.6 49.9 55.5 55.9 64.7 - 89.6 89.4 92.720 Assam 4.4 3.7 4.0 3.6 2.7 15.6 13.6 15.9 16.7 13.4 74.1 75.6 76.821 Himachal Pradesh 5.4 5.3 5.1 5.1 4.0 25.8 25.2 23.5 30.3 23.7 82.0 79.2 76.322 Jammu and Kashmir 4.3 3.5 3.8 4.0 3.4 31.4 28.4 30.5 27.2 22.0 87.5 88.2 86.423 Manipur 1.4 1.4 1.6 1.8 1.4 30.2 34.8 37.3 41.6 35.7 92.1 90.9 94.824 Meghalaya 3.2 3.3 3.5 3.6 2.4 26.3 25.6 30.5 33.6 28.6 86.1 83.6 85.325 Mizoram 0.8 0.6 0.7 0.7 56.3 57.0 64.5 55.1 - 86.7 93.2 95.626 Nagaland 1.6 1.4 1.9 3.2 3.1 39.1 35.0 44.7 61.6 55.7 92.9 92.8 94.527 Sikkim 5.4 4.0 4.3 5.5 4.8 60.0 58.4 66.6 68.7 61.1 80.6 36.2 55.828 Tripura 2.3 2.2 2.1 1.6 1.2 29.8 29.9 32.3 34.3 23.7 92.9 91.6 90.3
29 NCT Delhi 7.0 6.7 - - 7.6 6.6 - - 24.7 34.1
All States 5.5 5.3 5.4 5.4 4.9 9.9 9.8 11.1 11.6 10.9 55.5 52.2 57.9
Notes: (i) The simplest measure of fiscal imbalance is as given below:Ii =Ei- RiWhere I: the extent of imbalance,R: A state's own revenueE: State's aggregate disbursementsTo make it comparable across governmental units it is normalised by diving with the aggregate expenditure Ii = (Ei-Ri)/Ei=1-Ri/Ei(ii) Ranking is in the ascending order. It is confined to 15 major states of India. *'Fiscal balance' is the inverse of 'Fiscal imbalance'
Developmental Exp/GSDP RatioOwn Tax Revenue/GSDP Ratio Fiscal Imbalance*
143
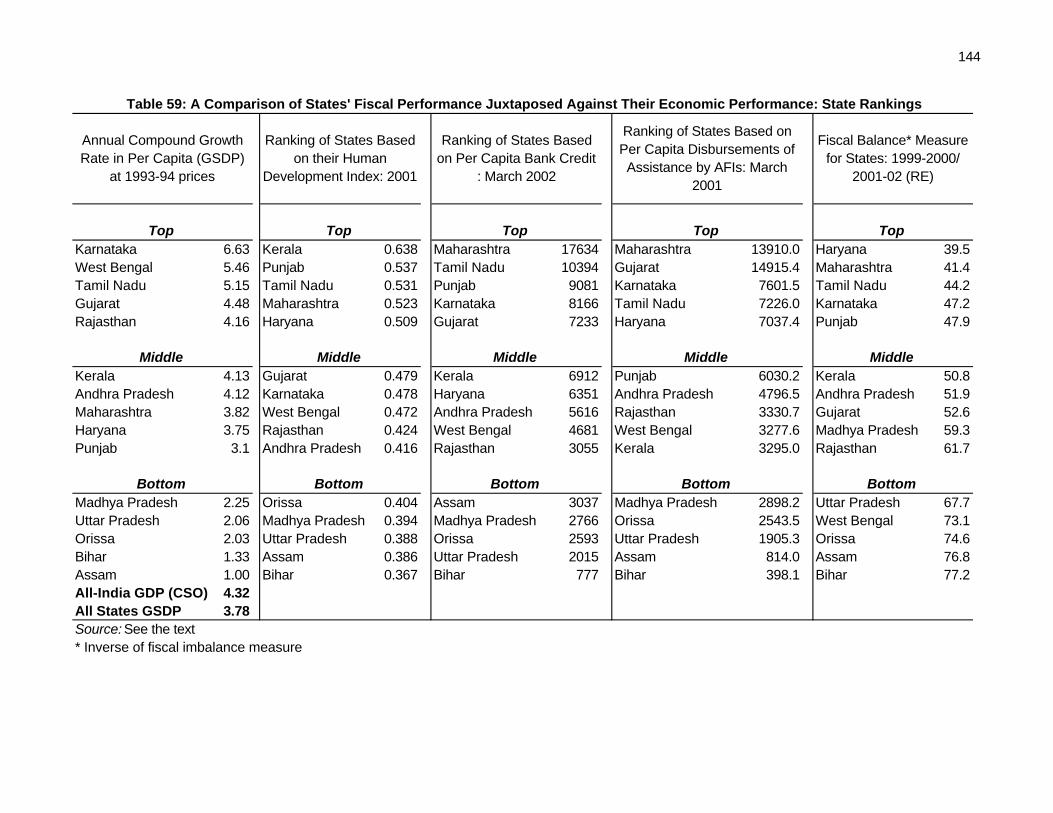
144
Karnataka 6.63 Kerala 0.638 Maharashtra 17634 Maharashtra 13910.0 Haryana 39.5West Bengal 5.46 Punjab 0.537 Tamil Nadu 10394 Gujarat 14915.4 Maharashtra 41.4Tamil Nadu 5.15 Tamil Nadu 0.531 Punjab 9081 Karnataka 7601.5 Tamil Nadu 44.2Gujarat 4.48 Maharashtra 0.523 Karnataka 8166 Tamil Nadu 7226.0 Karnataka 47.2Rajasthan 4.16 Haryana 0.509 Gujarat 7233 Haryana 7037.4 Punjab 47.9
Kerala 4.13 Gujarat 0.479 Kerala 6912 Punjab 6030.2 Kerala 50.8Andhra Pradesh 4.12 Karnataka 0.478 Haryana 6351 Andhra Pradesh 4796.5 Andhra Pradesh 51.9Maharashtra 3.82 West Bengal 0.472 Andhra Pradesh 5616 Rajasthan 3330.7 Gujarat 52.6Haryana 3.75 Rajasthan 0.424 West Bengal 4681 West Bengal 3277.6 Madhya Pradesh 59.3Punjab 3.1 Andhra Pradesh 0.416 Rajasthan 3055 Kerala 3295.0 Rajasthan 61.7
Madhya Pradesh 2.25 Orissa 0.404 Assam 3037 Madhya Pradesh 2898.2 Uttar Pradesh 67.7Uttar Pradesh 2.06 Madhya Pradesh 0.394 Madhya Pradesh 2766 Orissa 2543.5 West Bengal 73.1Orissa 2.03 Uttar Pradesh 0.388 Orissa 2593 Uttar Pradesh 1905.3 Orissa 74.6Bihar 1.33 Assam 0.386 Uttar Pradesh 2015 Assam 814.0 Assam 76.8Assam 1.00 Bihar 0.367 Bihar 777 Bihar 398.1 Bihar 77.2All-India GDP (CSO) 4.32All States GSDP 3.78Source: See the text* Inverse of fiscal imbalance measure
Top
Annual Compound Growth Rate in Per Capita (GSDP)
at 1993-94 prices
Ranking of States Based on their Human
Development Index: 2001
Ranking of States Based on Per Capita Bank Credit
: March 2002
Ranking of States Based on Per Capita Disbursements of Assistance by AFIs: March
2001
Fiscal Balance* Measure for States: 1999-2000/
2001-02 (RE)
Top
Middle
Top Top Top
Bottom
Table 59: A Comparison of States' Fiscal Performance Juxtaposed Against Their Economic Performance: State Rankings
Bottom Bottom Bottom Bottom
MiddleMiddle Middle Middle
145
There are no doubt conspicuous exceptions which have specific explanations.
Punjab, for instance, is a high-income state (Table 47), but a detailed study has
shown that its per capita SDP growth during the 1990s has lagged behind rather
significantly (Exhibit I and Tables 45 and 46). Even so, Punjab’s fiscal
performance falls in the top category; so does its ranking in HDI and the enjoyment
of per capita bank credit; even in per capita disbursement of assistance by AFIs,
Punjab is close to the top category of rankings. A caveat may be added though in
regard to the Punjab’s social attainments; its HDI has turned out to be high because
it includes household consumption expenditure per capita which is relatively high
in the state. Otherwise, Punjab’s achievements in some of the social indicators like
primary level school enrolment rate (79.05 per cent against the national average of
95.66 per cent) have been lower than the national average. Haryana’s case is
similar to that of Punjab. The other case of an outlier is Kerala which enjoys a top
social sector development, but otherwise it is uniformly in the top league within the
middle rankings in per capita GSDP growth, per capita bank credit (though it faces
poor credit-deposit ratio as stated earlier) as well as in fiscal performance.
Maharashtra’s is yet another unique case which gets a relatively good measure of
fiscal balance and which enjoys a commendable financial sector development; even
its overall HDI is relatively high, but in the 1990s its per capita income growth has
suffered somewhat so much so that its position in ranking has slipped from the top
rank in the 1980s (4.18 per cent per annum from 1980-81 to 1993-94) to the 8th
rank in the 1990s (3.82 per cent during 1993-94 to 2000-01); in fact, the
deceleration in Maharashtra’s per capita SDP growth rate has been much sharper
as between the first quinquinnium of the 1990s and its second quinquinnium, that
is, from 6.02 per cent to 3.27 per cent (see earlier Table 46).
Performances Based on Regional Groupings
Interestingly, the caricatures of growth and fiscal performances highlighted
could also be viewed as having regional dimensions. Broadly, it could be said that
the three regions of south, central and north have experienced better performances
in fiscal indicators and also simultaneously in economic growth, in social sector
development, in banking and finance, and in new investment projects and their
implementation. For instance, no single state belonging to the southern, western
146
and northern India is found amongst the bottom five states ranked as such in any of
the fiscal, economic, social and financial indicators presented as a comparative set
in Table 59; it has a singular exception of Kerala which finds a place amongst the
top rankings for per capita bank deposits (earlier Table 50) but falls into the bottom
rankings in regard to bank credit to deposit ratio and ranks relatively low in per
capita assistance by AFIs; this exception arises from the fact that Kerala has no
industrial progress to speak of. It must be admitted that the southern states’ fiscal
performance has not been exemplary but certainly in the middle category; they are
all emerging as powerful centres of growth and development and also reasonably
good performers in tax revenue mobilisation and minimising of fiscal imbalances.
Likewise, at the other end, it could be said that no single state belonging to
central, eastern or north-eastern India figures amongst the top rankings either in
fiscal performance or in indicators of economic, social and financial development.
In fact, almost all states of these regions belong to the bottom category except for
an interesting exception of West Bengal which has experienced a high per capita
GSDP growth in the 1990s particularly in the second half of the decade and which
has generally figured in the middle rankings for all fiscal and financial indicators.
This is not surprising, for West Bengal was in the forefront of industrialisation until
the 1960s but has faced a setback thereafter. Even so, its experience of acceleration
in agricultural growth in the recent period has placed it amongst the top ranking
states in GSDP growth but lower down in the middle category in the enjoyment of
social and financial sector development, but in fiscal performance it stands in the
bottom category; the loss of ground in the industrialization process by West Bengal
appears truly striking.
Comparison With Other Indicators of Fiscal Performance
So far our discussion has generally been based the comparison of one fiscal
indicator, namely, a measure of fiscal imbalance as presented in Table 59, with
those of economic, social and financial sector developments. But, in fiscal
performance, there are many other indicators with significant inter-state
differences; one concerning revenue and fiscal deficit indicators has already been
presented in Table 21 earlier. Two more, namely, own-tax revenue as percentage
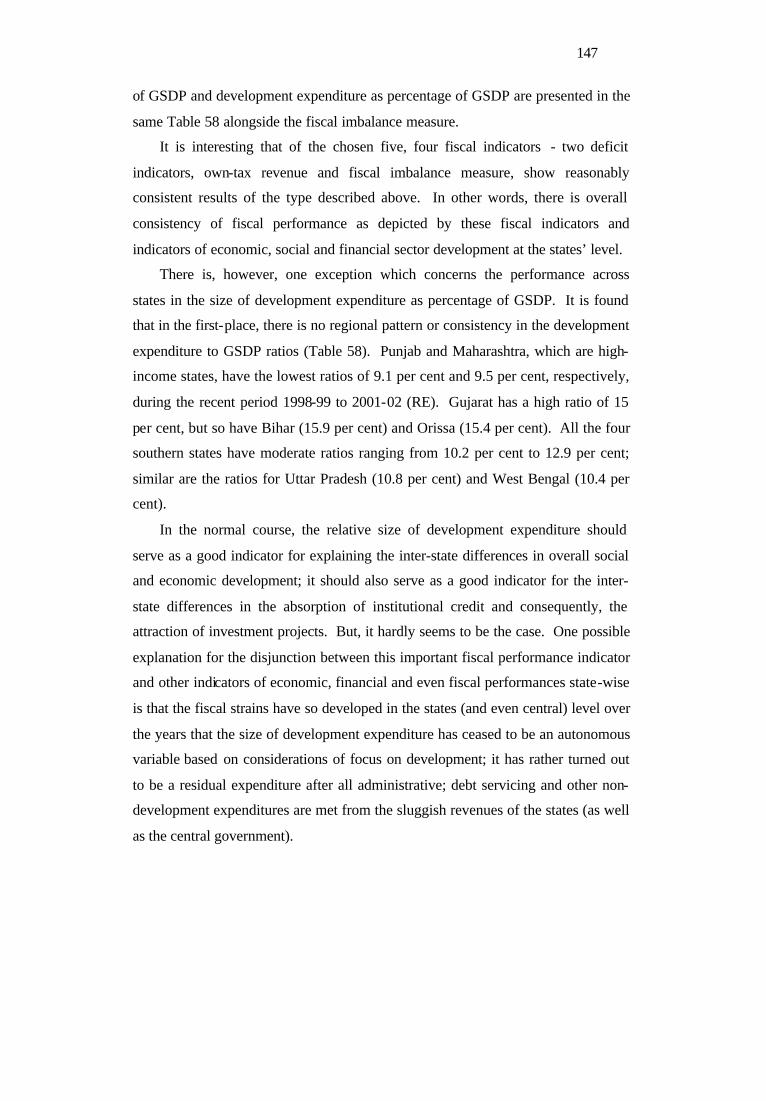
147
of GSDP and development expenditure as percentage of GSDP are presented in the
same Table 58 alongside the fiscal imbalance measure.
It is interesting that of the chosen five, four fiscal indicators - two deficit
indicators, own-tax revenue and fiscal imbalance measure, show reasonably
consistent results of the type described above. In other words, there is overall
consistency of fiscal performance as depicted by these fiscal indicators and
indicators of economic, social and financial sector development at the states’ level.
There is, however, one exception which concerns the performance across
states in the size of development expenditure as percentage of GSDP. It is found
that in the first-place, there is no regional pattern or consistency in the development
expenditure to GSDP ratios (Table 58). Punjab and Maharashtra, which are high-
income states, have the lowest ratios of 9.1 per cent and 9.5 per cent, respectively,
during the recent period 1998-99 to 2001-02 (RE). Gujarat has a high ratio of 15
per cent, but so have Bihar (15.9 per cent) and Orissa (15.4 per cent). All the four
southern states have moderate ratios ranging from 10.2 per cent to 12.9 per cent;
similar are the ratios for Uttar Pradesh (10.8 per cent) and West Bengal (10.4 per
cent).
In the normal course, the relative size of development expenditure should
serve as a good indicator for explaining the inter-state differences in overall social
and economic development; it should also serve as a good indicator for the inter-
state differences in the absorption of institutional credit and consequently, the
attraction of investment projects. But, it hardly seems to be the case. One possible
explanation for the disjunction between this important fiscal performance indicator
and other indicators of economic, financial and even fiscal performances state-wise
is that the fiscal strains have so developed in the states (and even central) level over
the years that the size of development expenditure has ceased to be an autonomous
variable based on considerations of focus on development; it has rather turned out
to be a residual expenditure after all administrative; debt servicing and other non-
development expenditures are met from the sluggish revenues of the states (as well
as the central government).
148
To sum up
There is link between fiscal performance and economic, social and financial
sector performances of states, but the causation seems to be surprisingly generally
unidirectional and it seems to run from the overall economic performance to fiscal
performance and also to the partaking of benefits of financial sector development
and not the other way about. States enjoying high income levels and relatively
high rates of income growth have generally succeeded in producing better own-tax
mobilisation and in minimising fiscal imbalances. Likewise, such are the very
states which have generated better deposit resources for banks and also succeeded
in producing a conducive environment for absorbing relatively higher levels of
bank credit as well as other institutional form of credit.
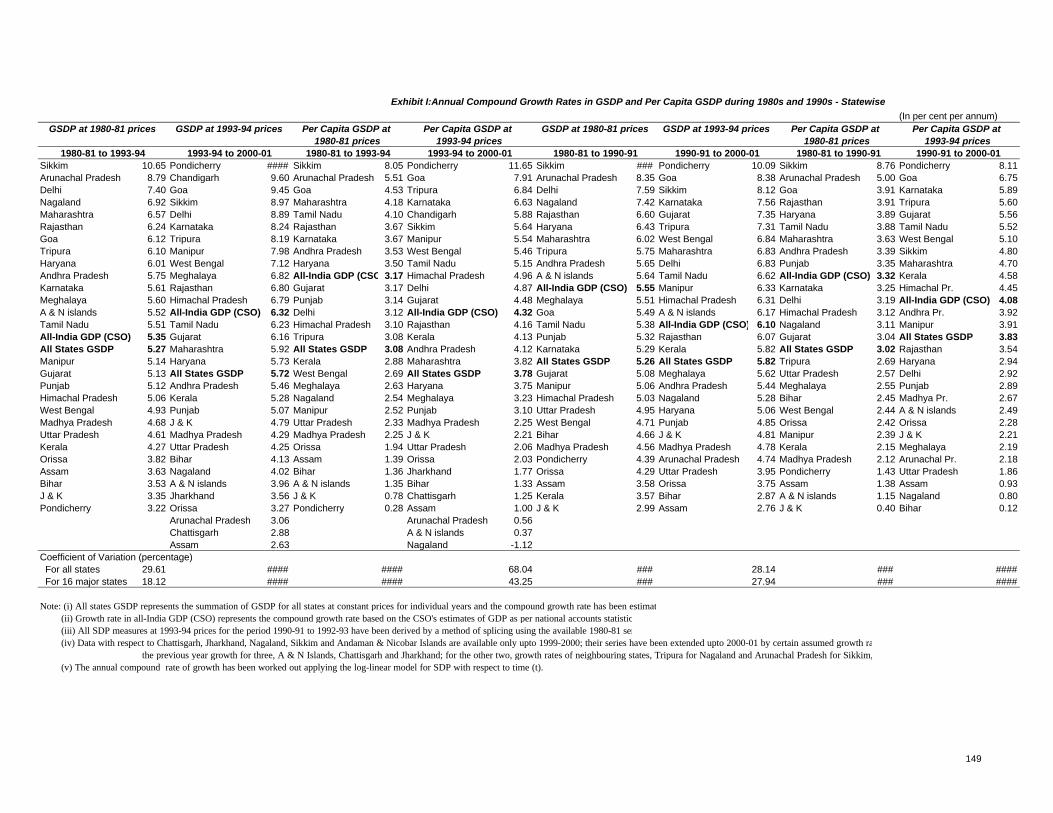
Exhibit I:Annual Compound Growth Rates in GSDP and Per Capita GSDP during 1980s and 1990s - Statewise
Sikkim 10.65 Pondicherry #### Sikkim 8.05 Pondicherry 11.65 Sikkim ### Pondicherry 10.09 Sikkim 8.76 Pondicherry 8.11Arunachal Pradesh 8.79 Chandigarh 9.60 Arunachal Pradesh 5.51 Goa 7.91 Arunachal Pradesh 8.35 Goa 8.38 Arunachal Pradesh 5.00 Goa 6.75Delhi 7.40 Goa 9.45 Goa 4.53 Tripura 6.84 Delhi 7.59 Sikkim 8.12 Goa 3.91 Karnataka 5.89Nagaland 6.92 Sikkim 8.97 Maharashtra 4.18 Karnataka 6.63 Nagaland 7.42 Karnataka 7.56 Rajasthan 3.91 Tripura 5.60Maharashtra 6.57 Delhi 8.89 Tamil Nadu 4.10 Chandigarh 5.88 Rajasthan 6.60 Gujarat 7.35 Haryana 3.89 Gujarat 5.56Rajasthan 6.24 Karnataka 8.24 Rajasthan 3.67 Sikkim 5.64 Haryana 6.43 Tripura 7.31 Tamil Nadu 3.88 Tamil Nadu 5.52Goa 6.12 Tripura 8.19 Karnataka 3.67 Manipur 5.54 Maharashtra 6.02 West Bengal 6.84 Maharashtra 3.63 West Bengal 5.10Tripura 6.10 Manipur 7.98 Andhra Pradesh 3.53 West Bengal 5.46 Tripura 5.75 Maharashtra 6.83 Andhra Pradesh 3.39 Sikkim 4.80Haryana 6.01 West Bengal 7.12 Haryana 3.50 Tamil Nadu 5.15 Andhra Pradesh 5.65 Delhi 6.83 Punjab 3.35 Maharashtra 4.70Andhra Pradesh 5.75 Meghalaya 6.82 All-India GDP (CSO)3.17 Himachal Pradesh 4.96 A & N islands 5.64 Tamil Nadu 6.62 All-India GDP (CSO) 3.32 Kerala 4.58Karnataka 5.61 Rajasthan 6.80 Gujarat 3.17 Delhi 4.87 All-India GDP (CSO) 5.55 Manipur 6.33 Karnataka 3.25 Himachal Pr. 4.45Meghalaya 5.60 Himachal Pradesh 6.79 Punjab 3.14 Gujarat 4.48 Meghalaya 5.51 Himachal Pradesh 6.31 Delhi 3.19 All-India GDP (CSO) 4.08A & N islands 5.52 All-India GDP (CSO) 6.32 Delhi 3.12 All-India GDP (CSO) 4.32 Goa 5.49 A & N islands 6.17 Himachal Pradesh 3.12 Andhra Pr. 3.92Tamil Nadu 5.51 Tamil Nadu 6.23 Himachal Pradesh 3.10 Rajasthan 4.16 Tamil Nadu 5.38 All-India GDP (CSO) 6.10 Nagaland 3.11 Manipur 3.91All-India GDP (CSO) 5.35 Gujarat 6.16 Tripura 3.08 Kerala 4.13 Punjab 5.32 Rajasthan 6.07 Gujarat 3.04 All States GSDP 3.83All States GSDP 5.27 Maharashtra 5.92 All States GSDP 3.08 Andhra Pradesh 4.12 Karnataka 5.29 Kerala 5.82 All States GSDP 3.02 Rajasthan 3.54Manipur 5.14 Haryana 5.73 Kerala 2.88 Maharashtra 3.82 All States GSDP 5.26 All States GSDP 5.82 Tripura 2.69 Haryana 2.94Gujarat 5.13 All States GSDP 5.72 West Bengal 2.69 All States GSDP 3.78 Gujarat 5.08 Meghalaya 5.62 Uttar Pradesh 2.57 Delhi 2.92Punjab 5.12 Andhra Pradesh 5.46 Meghalaya 2.63 Haryana 3.75 Manipur 5.06 Andhra Pradesh 5.44 Meghalaya 2.55 Punjab 2.89Himachal Pradesh 5.06 Kerala 5.28 Nagaland 2.54 Meghalaya 3.23 Himachal Pradesh 5.03 Nagaland 5.28 Bihar 2.45 Madhya Pr. 2.67West Bengal 4.93 Punjab 5.07 Manipur 2.52 Punjab 3.10 Uttar Pradesh 4.95 Haryana 5.06 West Bengal 2.44 A & N islands 2.49Madhya Pradesh 4.68 J & K 4.79 Uttar Pradesh 2.33 Madhya Pradesh 2.25 West Bengal 4.71 Punjab 4.85 Orissa 2.42 Orissa 2.28Uttar Pradesh 4.61 Madhya Pradesh 4.29 Madhya Pradesh 2.25 J & K 2.21 Bihar 4.66 J & K 4.81 Manipur 2.39 J & K 2.21Kerala 4.27 Uttar Pradesh 4.25 Orissa 1.94 Uttar Pradesh 2.06 Madhya Pradesh 4.56 Madhya Pradesh 4.78 Kerala 2.15 Meghalaya 2.19Orissa 3.82 Bihar 4.13 Assam 1.39 Orissa 2.03 Pondicherry 4.39 Arunachal Pradesh 4.74 Madhya Pradesh 2.12 Arunachal Pr. 2.18Assam 3.63 Nagaland 4.02 Bihar 1.36 Jharkhand 1.77 Orissa 4.29 Uttar Pradesh 3.95 Pondicherry 1.43 Uttar Pradesh 1.86Bihar 3.53 A & N islands 3.96 A & N islands 1.35 Bihar 1.33 Assam 3.58 Orissa 3.75 Assam 1.38 Assam 0.93J & K 3.35 Jharkhand 3.56 J & K 0.78 Chattisgarh 1.25 Kerala 3.57 Bihar 2.87 A & N islands 1.15 Nagaland 0.80Pondicherry 3.22 Orissa 3.27 Pondicherry 0.28 Assam 1.00 J & K 2.99 Assam 2.76 J & K 0.40 Bihar 0.12
Arunachal Pradesh 3.06 Arunachal Pradesh 0.56Chattisgarh 2.88 A & N islands 0.37Assam 2.63 Nagaland -1.12
For all states 29.61 #### #### 68.04 ### 28.14 ### #### For 16 major states 18.12 #### #### 43.25 ### 27.94 ### ####
(v) The annual compound rate of growth has been worked out applying the log-linear model for SDP with respect to time (t).
(In per cent per annum)GSDP at 1980-81 prices GSDP at 1993-94 prices Per Capita GSDP at Per Capita GSDP at GSDP at 1980-81 prices GSDP at 1993-94 prices Per Capita GSDP at Per Capita GSDP at
1980-81 prices 1993-94 prices 1980-81 prices 1993-94 prices1980-81 to 1993-94 1993-94 to 2000-01 1980-81 to 1993-94 1993-94 to 2000-01 1980-81 to 1990-91 1990-91 to 2000-01 1980-81 to 1990-91 1990-91 to 2000-01
(iv) Data with respect to Chattisgarh, Jharkhand, Nagaland, Sikkim and Andaman & Nicobar Islands are available only upto 1999-2000; their series have been extended upto 2000-01 by certain assumed growth rates: the previous year growth for three, A & N Islands, Chattisgarh and Jharkhand; for the other two, growth rates of neighbouring states, Tripura for Nagaland and Arunachal Pradesh for Sikkim, have been applied.
Coefficient of Variation (percentage)
Note: (i) All states GSDP represents the summation of GSDP for all states at constant prices for individual years and the compound growth rate has been estimated from them. (ii) Growth rate in all-India GDP (CSO) represents the compound growth rate based on the CSO's estimates of GDP as per national accounts statistics. (iii) All SDP measures at 1993-94 prices for the period 1990-91 to 1992-93 have been derived by a method of splicing using the available 1980-81 series.
149
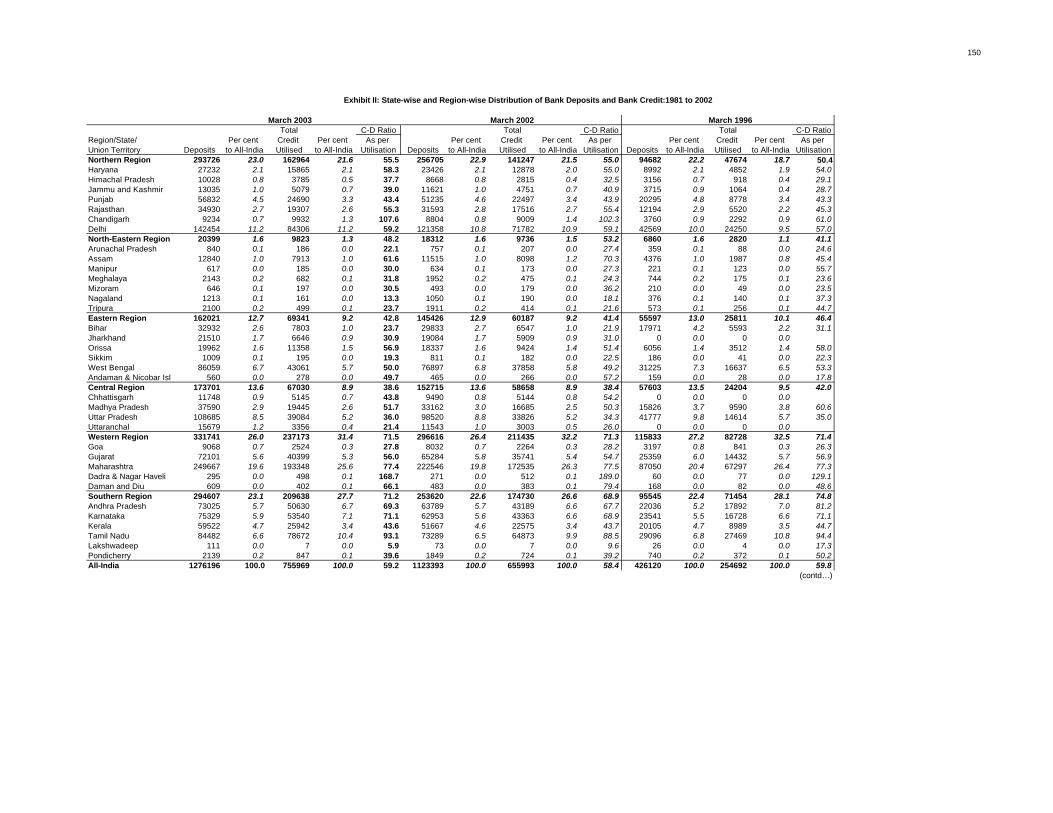
150
March 2003 March 2002 March 1996Total C-D Ratio Total C-D Ratio Total C-D Ratio
Region/State/ Per cent Credit Per cent As per Per cent Credit Per cent As per Per cent Credit Per cent As per Union Territory Deposits to All-India Utilised to All-India Utilisation Deposits to All-India Utilised to All-India Utilisation Deposits to All-India Utilised to All-India UtilisationNorthern Region 293726 23.0 162964 21.6 55.5 256705 22.9 141247 21.5 55.0 94682 22.2 47674 18.7 50.4Haryana 27232 2.1 15865 2.1 58.3 23426 2.1 12878 2.0 55.0 8992 2.1 4852 1.9 54.0Himachal Pradesh 10028 0.8 3785 0.5 37.7 8668 0.8 2815 0.4 32.5 3156 0.7 918 0.4 29.1Jammu and Kashmir 13035 1.0 5079 0.7 39.0 11621 1.0 4751 0.7 40.9 3715 0.9 1064 0.4 28.7Punjab 56832 4.5 24690 3.3 43.4 51235 4.6 22497 3.4 43.9 20295 4.8 8778 3.4 43.3Rajasthan 34930 2.7 19307 2.6 55.3 31593 2.8 17516 2.7 55.4 12194 2.9 5520 2.2 45.3Chandigarh 9234 0.7 9932 1.3 107.6 8804 0.8 9009 1.4 102.3 3760 0.9 2292 0.9 61.0Delhi 142454 11.2 84306 11.2 59.2 121358 10.8 71782 10.9 59.1 42569 10.0 24250 9.5 57.0North-Eastern Region 20399 1.6 9823 1.3 48.2 18312 1.6 9736 1.5 53.2 6860 1.6 2820 1.1 41.1Arunachal Pradesh 840 0.1 186 0.0 22.1 757 0.1 207 0.0 27.4 359 0.1 88 0.0 24.6Assam 12840 1.0 7913 1.0 61.6 11515 1.0 8098 1.2 70.3 4376 1.0 1987 0.8 45.4Manipur 617 0.0 185 0.0 30.0 634 0.1 173 0.0 27.3 221 0.1 123 0.0 55.7Meghalaya 2143 0.2 682 0.1 31.8 1952 0.2 475 0.1 24.3 744 0.2 175 0.1 23.6Mizoram 646 0.1 197 0.0 30.5 493 0.0 179 0.0 36.2 210 0.0 49 0.0 23.5Nagaland 1213 0.1 161 0.0 13.3 1050 0.1 190 0.0 18.1 376 0.1 140 0.1 37.3Tripura 2100 0.2 499 0.1 23.7 1911 0.2 414 0.1 21.6 573 0.1 256 0.1 44.7Eastern Region 162021 12.7 69341 9.2 42.8 145426 12.9 60187 9.2 41.4 55597 13.0 25811 10.1 46.4Bihar 32932 2.6 7803 1.0 23.7 29833 2.7 6547 1.0 21.9 17971 4.2 5593 2.2 31.1Jharkhand 21510 1.7 6646 0.9 30.9 19084 1.7 5909 0.9 31.0 0 0.0 0 0.0Orissa 19962 1.6 11358 1.5 56.9 18337 1.6 9424 1.4 51.4 6056 1.4 3512 1.4 58.0Sikkim 1009 0.1 195 0.0 19.3 811 0.1 182 0.0 22.5 186 0.0 41 0.0 22.3West Bengal 86059 6.7 43061 5.7 50.0 76897 6.8 37858 5.8 49.2 31225 7.3 16637 6.5 53.3Andaman & Nicobar Isl 560 0.0 278 0.0 49.7 465 0.0 266 0.0 57.2 159 0.0 28 0.0 17.8Central Region 173701 13.6 67030 8.9 38.6 152715 13.6 58658 8.9 38.4 57603 13.5 24204 9.5 42.0Chhattisgarh 11748 0.9 5145 0.7 43.8 9490 0.8 5144 0.8 54.2 0 0.0 0 0.0Madhya Pradesh 37590 2.9 19445 2.6 51.7 33162 3.0 16685 2.5 50.3 15826 3.7 9590 3.8 60.6Uttar Pradesh 108685 8.5 39084 5.2 36.0 98520 8.8 33826 5.2 34.3 41777 9.8 14614 5.7 35.0Uttaranchal 15679 1.2 3356 0.4 21.4 11543 1.0 3003 0.5 26.0 0 0.0 0 0.0Western Region 331741 26.0 237173 31.4 71.5 296616 26.4 211435 32.2 71.3 115833 27.2 82728 32.5 71.4Goa 9068 0.7 2524 0.3 27.8 8032 0.7 2264 0.3 28.2 3197 0.8 841 0.3 26.3Gujarat 72101 5.6 40399 5.3 56.0 65284 5.8 35741 5.4 54.7 25359 6.0 14432 5.7 56.9Maharashtra 249667 19.6 193348 25.6 77.4 222546 19.8 172535 26.3 77.5 87050 20.4 67297 26.4 77.3Dadra & Nagar Haveli 295 0.0 498 0.1 168.7 271 0.0 512 0.1 189.0 60 0.0 77 0.0 129.1Daman and Diu 609 0.0 402 0.1 66.1 483 0.0 383 0.1 79.4 168 0.0 82 0.0 48.6Southern Region 294607 23.1 209638 27.7 71.2 253620 22.6 174730 26.6 68.9 95545 22.4 71454 28.1 74.8Andhra Pradesh 73025 5.7 50630 6.7 69.3 63789 5.7 43189 6.6 67.7 22036 5.2 17892 7.0 81.2Karnataka 75329 5.9 53540 7.1 71.1 62953 5.6 43363 6.6 68.9 23541 5.5 16728 6.6 71.1Kerala 59522 4.7 25942 3.4 43.6 51667 4.6 22575 3.4 43.7 20105 4.7 8989 3.5 44.7Tamil Nadu 84482 6.6 78672 10.4 93.1 73289 6.5 64873 9.9 88.5 29096 6.8 27469 10.8 94.4Lakshwadeep 111 0.0 7 0.0 5.9 73 0.0 7 0.0 9.6 26 0.0 4 0.0 17.3Pondicherry 2139 0.2 847 0.1 39.6 1849 0.2 724 0.1 39.2 740 0.2 372 0.1 50.2All-India 1276196 100.0 755969 100.0 59.2 1123393 100.0 655993 100.0 58.4 426120 100.0 254692 100.0 59.8
(contd…)
Exhibit II: State-wise and Region-wise Distribution of Bank Deposits and Bank Credit:1981 to 2002
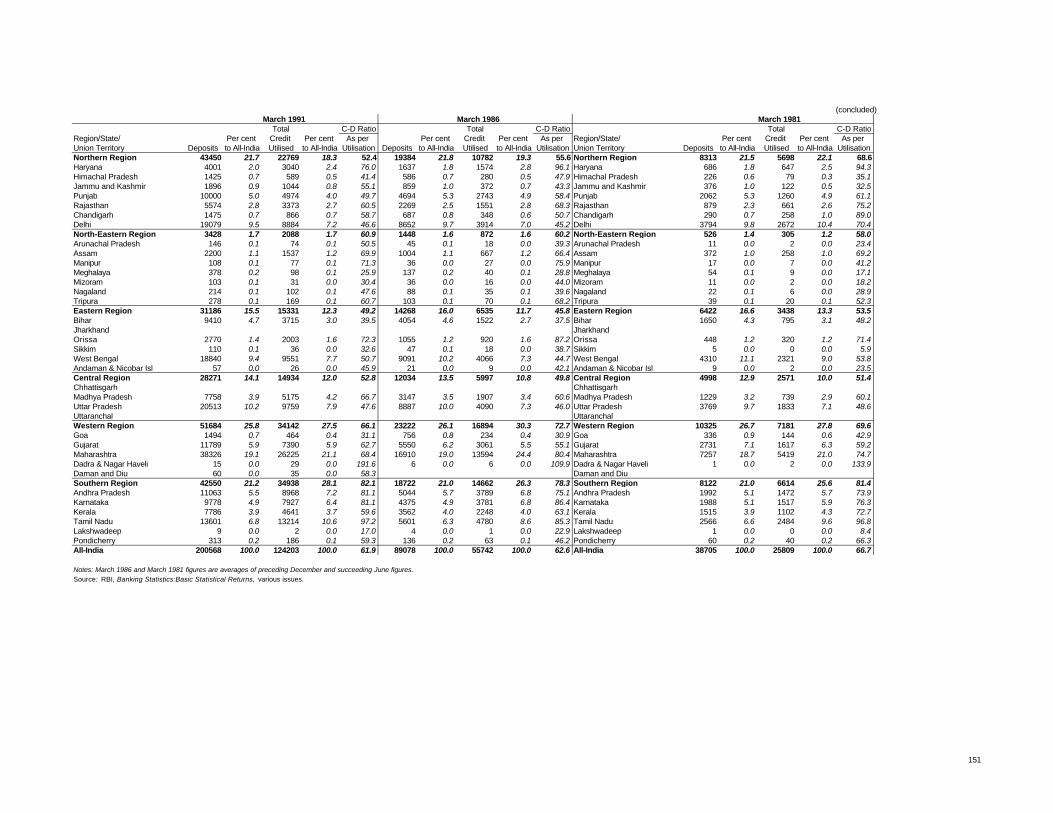
(concluded)March 1991 March 1986 March 1981
Total C-D Ratio Total C-D Ratio Total C-D RatioRegion/State/ Per cent Credit Per cent As per Per cent Credit Per cent As per Region/State/ Per cent Credit Per cent As per Union Territory Deposits to All-India Utilised to All-India Utilisation Deposits to All-India Utilised to All-India Utilisation Union Territory Deposits to All-India Utilised to All-India UtilisationNorthern Region 43450 21.7 22769 18.3 52.4 19384 21.8 10782 19.3 55.6 Northern Region 8313 21.5 5698 22.1 68.6Haryana 4001 2.0 3040 2.4 76.0 1637 1.8 1574 2.8 96.1 Haryana 686 1.8 647 2.5 94.3Himachal Pradesh 1425 0.7 589 0.5 41.4 586 0.7 280 0.5 47.9 Himachal Pradesh 226 0.6 79 0.3 35.1Jammu and Kashmir 1896 0.9 1044 0.8 55.1 859 1.0 372 0.7 43.3 Jammu and Kashmir 376 1.0 122 0.5 32.5Punjab 10000 5.0 4974 4.0 49.7 4694 5.3 2743 4.9 58.4 Punjab 2062 5.3 1260 4.9 61.1Rajasthan 5574 2.8 3373 2.7 60.5 2269 2.5 1551 2.8 68.3 Rajasthan 879 2.3 661 2.6 75.2Chandigarh 1475 0.7 866 0.7 58.7 687 0.8 348 0.6 50.7 Chandigarh 290 0.7 258 1.0 89.0Delhi 19079 9.5 8884 7.2 46.6 8652 9.7 3914 7.0 45.2 Delhi 3794 9.8 2672 10.4 70.4North-Eastern Region 3428 1.7 2088 1.7 60.9 1448 1.6 872 1.6 60.2 North-Eastern Region 526 1.4 305 1.2 58.0Arunachal Pradesh 146 0.1 74 0.1 50.5 45 0.1 18 0.0 39.3 Arunachal Pradesh 11 0.0 2 0.0 23.4Assam 2200 1.1 1537 1.2 69.9 1004 1.1 667 1.2 66.4 Assam 372 1.0 258 1.0 69.2Manipur 108 0.1 77 0.1 71.3 36 0.0 27 0.0 75.9 Manipur 17 0.0 7 0.0 41.2Meghalaya 378 0.2 98 0.1 25.9 137 0.2 40 0.1 28.8 Meghalaya 54 0.1 9 0.0 17.1Mizoram 103 0.1 31 0.0 30.4 36 0.0 16 0.0 44.0 Mizoram 11 0.0 2 0.0 18.2Nagaland 214 0.1 102 0.1 47.6 88 0.1 35 0.1 39.6 Nagaland 22 0.1 6 0.0 28.9Tripura 278 0.1 169 0.1 60.7 103 0.1 70 0.1 68.2 Tripura 39 0.1 20 0.1 52.3Eastern Region 31186 15.5 15331 12.3 49.2 14268 16.0 6535 11.7 45.8 Eastern Region 6422 16.6 3438 13.3 53.5Bihar 9410 4.7 3715 3.0 39.5 4054 4.6 1522 2.7 37.5 Bihar 1650 4.3 795 3.1 48.2Jharkhand JharkhandOrissa 2770 1.4 2003 1.6 72.3 1055 1.2 920 1.6 87.2 Orissa 448 1.2 320 1.2 71.4Sikkim 110 0.1 36 0.0 32.6 47 0.1 18 0.0 38.7 Sikkim 5 0.0 0 0.0 5.9West Bengal 18840 9.4 9551 7.7 50.7 9091 10.2 4066 7.3 44.7 West Bengal 4310 11.1 2321 9.0 53.8Andaman & Nicobar Isl 57 0.0 26 0.0 45.9 21 0.0 9 0.0 42.1 Andaman & Nicobar Isl 9 0.0 2 0.0 23.5Central Region 28271 14.1 14934 12.0 52.8 12034 13.5 5997 10.8 49.8 Central Region 4998 12.9 2571 10.0 51.4Chhattisgarh ChhattisgarhMadhya Pradesh 7758 3.9 5175 4.2 66.7 3147 3.5 1907 3.4 60.6 Madhya Pradesh 1229 3.2 739 2.9 60.1Uttar Pradesh 20513 10.2 9759 7.9 47.6 8887 10.0 4090 7.3 46.0 Uttar Pradesh 3769 9.7 1833 7.1 48.6Uttaranchal UttaranchalWestern Region 51684 25.8 34142 27.5 66.1 23222 26.1 16894 30.3 72.7 Western Region 10325 26.7 7181 27.8 69.6Goa 1494 0.7 464 0.4 31.1 756 0.8 234 0.4 30.9 Goa 336 0.9 144 0.6 42.9Gujarat 11789 5.9 7390 5.9 62.7 5550 6.2 3061 5.5 55.1 Gujarat 2731 7.1 1617 6.3 59.2Maharashtra 38326 19.1 26225 21.1 68.4 16910 19.0 13594 24.4 80.4 Maharashtra 7257 18.7 5419 21.0 74.7Dadra & Nagar Haveli 15 0.0 29 0.0 191.6 6 0.0 6 0.0 109.9 Dadra & Nagar Haveli 1 0.0 2 0.0 133.9Daman and Diu 60 0.0 35 0.0 58.3 Daman and DiuSouthern Region 42550 21.2 34938 28.1 82.1 18722 21.0 14662 26.3 78.3 Southern Region 8122 21.0 6614 25.6 81.4Andhra Pradesh 11063 5.5 8968 7.2 81.1 5044 5.7 3789 6.8 75.1 Andhra Pradesh 1992 5.1 1472 5.7 73.9Karnataka 9778 4.9 7927 6.4 81.1 4375 4.9 3781 6.8 86.4 Karnataka 1988 5.1 1517 5.9 76.3Kerala 7786 3.9 4641 3.7 59.6 3562 4.0 2248 4.0 63.1 Kerala 1515 3.9 1102 4.3 72.7Tamil Nadu 13601 6.8 13214 10.6 97.2 5601 6.3 4780 8.6 85.3 Tamil Nadu 2566 6.6 2484 9.6 96.8Lakshwadeep 9 0.0 2 0.0 17.0 4 0.0 1 0.0 22.9 Lakshwadeep 1 0.0 0 0.0 8.4Pondicherry 313 0.2 186 0.1 59.3 136 0.2 63 0.1 46.2 Pondicherry 60 0.2 40 0.2 66.3All-India 200568 100.0 124203 100.0 61.9 89078 100.0 55742 100.0 62.6 All-India 38705 100.0 25809 100.0 66.7
Notes: March 1986 and March 1981 figures are averages of preceding December and succeeding June figures.Source: RBI, Banking Statistics:Basic Statistical Returns, various issues.
151
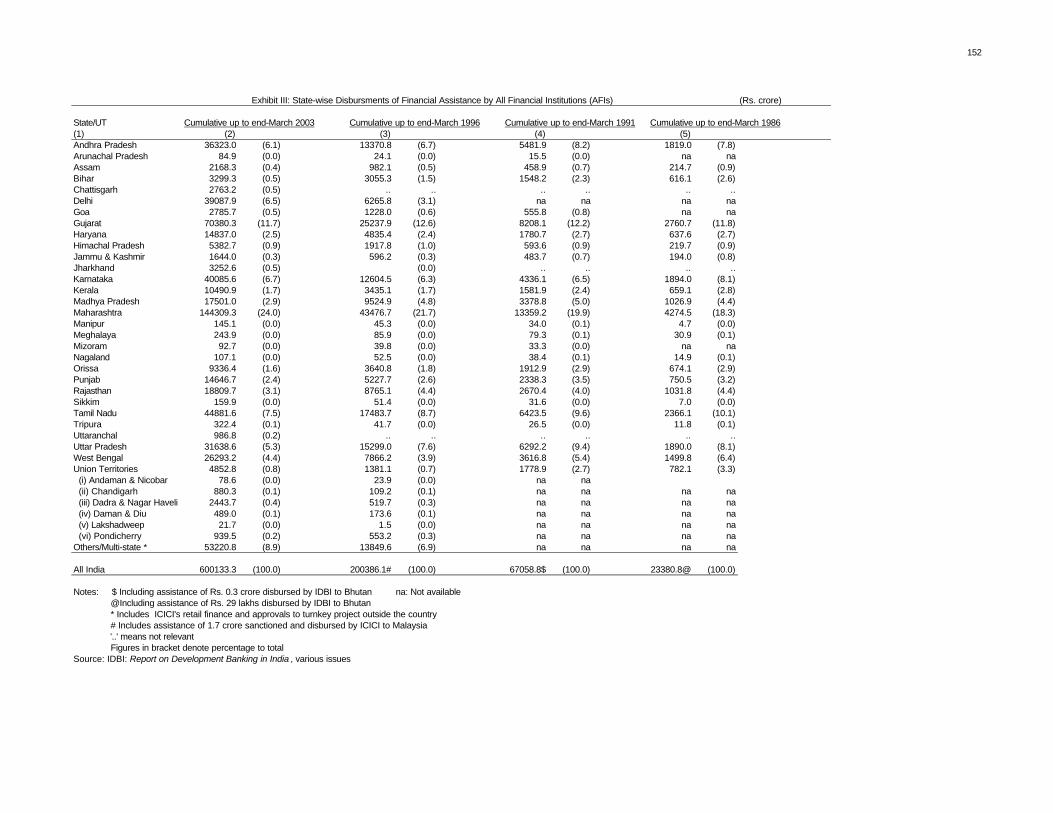
152
Exhibit III: State-wise Disbursments of Financial Assistance by All Financial Institutions (AFIs) (Rs. crore)
State/UT Cumulative up to end-March 1996 Cumulative up to end-March 1991 Cumulative up to end-March 1986(1) (2) (3) (4) (5)Andhra Pradesh 36323.0 (6.1) 13370.8 (6.7) 5481.9 (8.2) 1819.0 (7.8)Arunachal Pradesh 84.9 (0.0) 24.1 (0.0) 15.5 (0.0) na naAssam 2168.3 (0.4) 982.1 (0.5) 458.9 (0.7) 214.7 (0.9)Bihar 3299.3 (0.5) 3055.3 (1.5) 1548.2 (2.3) 616.1 (2.6)Chattisgarh 2763.2 (0.5) .. .. .. .. .. ..Delhi 39087.9 (6.5) 6265.8 (3.1) na na na naGoa 2785.7 (0.5) 1228.0 (0.6) 555.8 (0.8) na naGujarat 70380.3 (11.7) 25237.9 (12.6) 8208.1 (12.2) 2760.7 (11.8)Haryana 14837.0 (2.5) 4835.4 (2.4) 1780.7 (2.7) 637.6 (2.7)Himachal Pradesh 5382.7 (0.9) 1917.8 (1.0) 593.6 (0.9) 219.7 (0.9)Jammu & Kashmir 1644.0 (0.3) 596.2 (0.3) 483.7 (0.7) 194.0 (0.8)Jharkhand 3252.6 (0.5) (0.0) .. .. .. ..Karnataka 40085.6 (6.7) 12604.5 (6.3) 4336.1 (6.5) 1894.0 (8.1)Kerala 10490.9 (1.7) 3435.1 (1.7) 1581.9 (2.4) 659.1 (2.8)Madhya Pradesh 17501.0 (2.9) 9524.9 (4.8) 3378.8 (5.0) 1026.9 (4.4)Maharashtra 144309.3 (24.0) 43476.7 (21.7) 13359.2 (19.9) 4274.5 (18.3)Manipur 145.1 (0.0) 45.3 (0.0) 34.0 (0.1) 4.7 (0.0)Meghalaya 243.9 (0.0) 85.9 (0.0) 79.3 (0.1) 30.9 (0.1)Mizoram 92.7 (0.0) 39.8 (0.0) 33.3 (0.0) na naNagaland 107.1 (0.0) 52.5 (0.0) 38.4 (0.1) 14.9 (0.1)Orissa 9336.4 (1.6) 3640.8 (1.8) 1912.9 (2.9) 674.1 (2.9)Punjab 14646.7 (2.4) 5227.7 (2.6) 2338.3 (3.5) 750.5 (3.2)Rajasthan 18809.7 (3.1) 8765.1 (4.4) 2670.4 (4.0) 1031.8 (4.4)Sikkim 159.9 (0.0) 51.4 (0.0) 31.6 (0.0) 7.0 (0.0)Tamil Nadu 44881.6 (7.5) 17483.7 (8.7) 6423.5 (9.6) 2366.1 (10.1)Tripura 322.4 (0.1) 41.7 (0.0) 26.5 (0.0) 11.8 (0.1)Uttaranchal 986.8 (0.2) .. .. .. .. .. ..Uttar Pradesh 31638.6 (5.3) 15299.0 (7.6) 6292.2 (9.4) 1890.0 (8.1)West Bengal 26293.2 (4.4) 7866.2 (3.9) 3616.8 (5.4) 1499.8 (6.4)Union Territories 4852.8 (0.8) 1381.1 (0.7) 1778.9 (2.7) 782.1 (3.3) (i) Andaman & Nicobar 78.6 (0.0) 23.9 (0.0) na na (ii) Chandigarh 880.3 (0.1) 109.2 (0.1) na na na na (iii) Dadra & Nagar Haveli 2443.7 (0.4) 519.7 (0.3) na na na na (iv) Daman & Diu 489.0 (0.1) 173.6 (0.1) na na na na (v) Lakshadweep 21.7 (0.0) 1.5 (0.0) na na na na (vi) Pondicherry 939.5 (0.2) 553.2 (0.3) na na na naOthers/Multi-state * 53220.8 (8.9) 13849.6 (6.9) na na na na
All India 600133.3 (100.0) 200386.1# (100.0) 67058.8$ (100.0) 23380.8@ (100.0)
Notes: $ Including assistance of Rs. 0.3 crore disbursed by IDBI to Bhutan na: Not available @Including assistance of Rs. 29 lakhs disbursed by IDBI to Bhutan * Includes ICICI's retail finance and approvals to turnkey project outside the country # Includes assistance of 1.7 crore sanctioned and disbursed by ICICI to Malaysia '..' means not relevant Figures in bracket denote percentage to totalSource: IDBI: Report on Development Banking in India , various issues
Cumulative up to end-March 2003
152
XIII
Programmes of Fiscal Reforms at the States Level
Genesis
By the middle of the 1990s, it was realised amongst policy makers and
commentators alike that in matters of India’s fiscal reform, reforms at the states
level had to be given greater attention as the centre’s fiscal stresses and strains
were getting reflected in state finances and states themselves were increasingly
lagging behind in mobilising resources, particularly in collecting user charges and
returns on their investments, even as their expenditures were expanding and
developmental responsibilities were increasing. In 1996-97 to be specific, state
finances began to face renewed stresses and strains which were reflected in a
quantum jump in their total revenue deficit from Rs 8,201 crore (0.67 per cent of
GDP) in 1995-96 to Rs 16,114 crore (1.14 per cent) in 1996-97 following sharp
increases in interest payments, administrative expenditures and pension liabilities
(RBI 1997). The growth of developmental expenditure, and in particular capital
expenditure, suffered a setback. The year 1996-97 was the terminal year of the
eighth five-year plan which was characterised by recurrent shortfall in actual outlay
and unusually large shortfall in balances from current revenues. This brought into
focus the need for reforms in state finances.
A number of states initiated steps to address some of the long-run problems
in mobilisation of tax and non-tax revenues and reforming public enterprises.
Some states (Maharashtra, West Bengal and Andhra Pradesh) began accepting the
need for replacing the then inelastic and multiple rates of sales tax system with a
value added tax (VAT) having less number of rates. Certain states, namely, Tamil
Nadu, Kerala, Haryana, Karnataka, Himachal Pradesh, Goa and Orissa, began
encouraging private sector participation in transport and power generation sectors,
and even a gradual movement towards privatisation of some of the infrastructure
sectors such as power, road transport and irrigation � areas of traditional public
sector monopolies. The Government of India issued the Electricity Regulatory
Commission Ordinance 1998, following which a few states (Uttar Pradesh,
Haryana, Gujarat and Karnataka) also sought to improve the efficiency of State
153
Electricity Boards (SEBs) by granting autonomy to the power sector through the
setting up of independent State Electricity Regulatory Commissions (SERCs).
Gujarat initiated a dialogue with the Asian Development Bank (ADB) to revamp
the state finances. ADB sanctioned a loan of Rs 25 crore for the Gujarat Public
Sector Resource Management Programme in 1996 for the implementation of a
reform package. The areas which have been identified for the reform package
included rationalisation of taxes, privatising or restructuring state-owned
enterprises and strengthening the institutional and regulatory framework of the
infrastructure sector in Gujarat (RBI 1998). Orissa put in place a comprehensive
privatisation programme in the power sector, with the state’s 1996-97 budget
visualising disinvestment of equity holding worth Rs 300 crore in the Orissa Power
Generation Corporation. Meghalaya proposed to strengthen power transmission
and rural electrification.
That was also the time when sourcing revenue through non-tax measures
became an important policy plank for ensuring fiscal consolidation. In that light,
the Union Ministry of Finance brought out a Discussion Paper on “Government
Subsidies in India” (Ministry of Finance 1997). This study, prepared by the
NIPFP, placed the aggregate implicit subsidies of the centre and states at Rs
1,37,338 crore in 1994-95 amounting to 14.4 per cent of GDP (The combined tax
to GDP ratio of central and state governments was just 14.6 per cent in that year).
Of these, the subsidy on non-merit goods formed 10.7 per cent of GDP, with 3.8
per cent in the case of the centre and 6.9 per cent for states. The all-India recovery
rates on non-merit services were estimated to be as low as 5.3 per cent for social
services and 12.3 per cent for economic services. Recovery rates for states (fifteen
selected states) in respect of these two services were placed at 4.0 per cent and 12.9
per cent, respectively. Increases in the relevant user charges would result in more
than proportionate increase in cost recovery on two counts, viz., (i) increased user
price, and (ii) reduced quantity demanded (RBI 1998).
The period also coincided with the appointment of the Eleventh Finance
Commission in 1998. Realising the importance of restructuring India’s fiscal
position both at the central and state levels, the following crucial clause was added
to the Commission’s terms of reference which were set out in July 1998: “review
the state of the finances of the Union and the States and suggest ways and means
154
by which the Governments collectively and severally may bring about a
restructuring of the public finances so as to restore budgetary balance and maintain
macro-economic stability” (Government of India, 1998).
Two Major Steps at Fiscal Reforms at the States Level
The urgency of introducing fiscal correctives at the states level became further
intensified after the expenditures on states’ administrative services and
miscellaneous general services surged by 80 per cent and 72.1 per cent,
respectively, in 1998-99, following the revision of pay scales of state government
employees by applying the fifth pay commission recommendations for central
government employees. There also arose a massive, far beyond the permitted
limits, ways and means advances as well as overdrafts of states with the RBI (RBI
1999); 17 states resorted to overdrafts in that year and five of them could not clear
them within the stipulated time and hence the RBI had to stop their payments (RBI
1999, pp.92-93). These prompted the central government to take initiative to force
the pace of reforms in state finances. There were two major steps in this direction:
first, on the advice of the National Development Commission (NDC), the centre
instituted a one-time ‘fiscal reform facility’ for the year 1990-2000 associated with
the clearance of states’ ways and means advances from the RBI conditional upon
structural reforms in their finances being undertaken by them; and second, the start
of a monitorable fiscal reform programme for five years from 2001-02 to 2004-05
based on the supplementary recommendation obtained from the Eleventh Finance
Commission.
1. One-Time Fiscal Reform Facility for 1990-2000
The first of the above reform programmes has been referred to
earlier, but it has a history which is worth noting. The National
Development Council (NDC), in its 48th meeting held on February 19,
1999, discussed the financial difficulties faced by several state governments
arising, among others, from pay hikes granted by them for their employees.
In the meeting it was decided that the Union Finance Minister would
discuss with a group of representative states their financial difficulties and a
medium-term fiscal strategy to be undertaken by them. Accordingly, the
Union Finance Minister held a meeting on March 20, 1999 with the Chief
155
Ministers/Finance Ministers of seven representative states. In the meeting it
was decided that there was a need for joint effort on the part of the centre
and states to evolve a strategy to address fiscal issues and problems
confronting states. This strategy took the form of a package of advance
financial assistance which was provided by the centre along with an
appropriate time-bound programme of a medium-term fiscal reform to be
undertaken by the concerned states. The state - specific ‘fiscal reform
programme’ combined with a package of immediate financial assistance
was to be monitored and reviewed by an official committee under the
Chairmanship of Secretary, Planning Commission.
The financial assistance provided by the centre to the states under the
programme comprised advance tax devolution during 1999-2000, ways and
means (WAM) accommodation and advance release of plan assistance. The
immediate objective of the financial package was to assist states which had
gone in overdrafts with the Reserve Bank of India subject to the states
taking some concrete steps to address the underlying causes of their
endemic financial problems and unsatisfactory growth. As the WAMs
system is always basically meant to tide over temporary mismatches
between receipts and expenditures rather than structural deficits in the
finances of the states, an extended WAM facility of Rs 3,000 crore was
created to address structural deficits in state finances and this was provided
for in a supplementary budget presented to the Parliament in December
1999. Though it was a one-time measure, the main objective of this fiscal
reforms programme for states was aimed at improving the states’ ‘balance
from current revenues’ and wiping out their revenue deficits completely in
the medium-term. These programmes comprised specific time-bound
measures aimed at promoting the following:
• Reduction in non-plan revenue expenditure, through appropriate
taxation and expenditure measures and down-sizing of government
where possible;
• Pricing/subsidy reforms, to reduce fiscal burden of the concerned
state and improve allocative efficiency;
156
• Institutional reforms, to improve regulation and efficiency in
delivery of public services; and
• Reduction in the role of government from non-essential areas,
through decentralisation, disinvestment and privatisation.
Thirteen states evolved and undertook their own ‘fiscal reform programme’
and entered into an agreement with the centre during 1999-2000. These were
Punjab, Rajasthan, Himachal Pradesh, Manipur, Nagaland, Mizoram, Orissa,
Sikkim, Uttar Pradesh, Madhya Pradesh, Assam, Andhra Pradesh and Jammu &
Kashmir. Under this facility, extended WMAs of Rs 2,570 crore were provided to
these states. Besides, additional market borrowin gs of Rs 1,920 crore were also
allowed to seven states. An interesting fact was that even states, which were not
faced with acute financial distress, recognised the need for prudent fiscal
management and came forward to discuss their fiscal reforms programme with the
centre.
Monitorable Medium-Term Fiscal Reforms Programme
A reference was made to the Supplementary Report of the Eleventh Finance
Commission Report (2000) which recommended the monitorable fiscal reforms
programme for all the states based on an incentive fund specially created for the
purpose. For this development too, there is an interesting history. The Eleventh
Finance Commission for covering the period 2000-01 to 2004-05 was set up in July
1988; it had submitted its report covering all aspects of its original mandate in July
2000. Earlier, it had also submitted an interim report in January 2000 for covering
the first year 2000-01 with provisional arrangements. In the meantime, as the
Finance Ministry’s one-time fiscal reforms programme for the states, described
above, came to an end, the Eleventh Finance Commission (EFC) was specially
asked to “draw a monitorable fiscal reforms programme aimed at reduction of
revenue deficit of the States and recommend the manner in which the grants to the
States to cover the assessed deficit in their non-plan revenue account may be linked
to progress in implementing the programme”. Accordingly, the EFC submitted a
supplementary report on August 30, 2000. In the Main Report submitted on July 7,
2000, the EFC had recommended revenue deficit grants of Rs 35,359 crore for 15
States during 2000-2005. The remaining 10 states enjoyed revenue surpluses in the
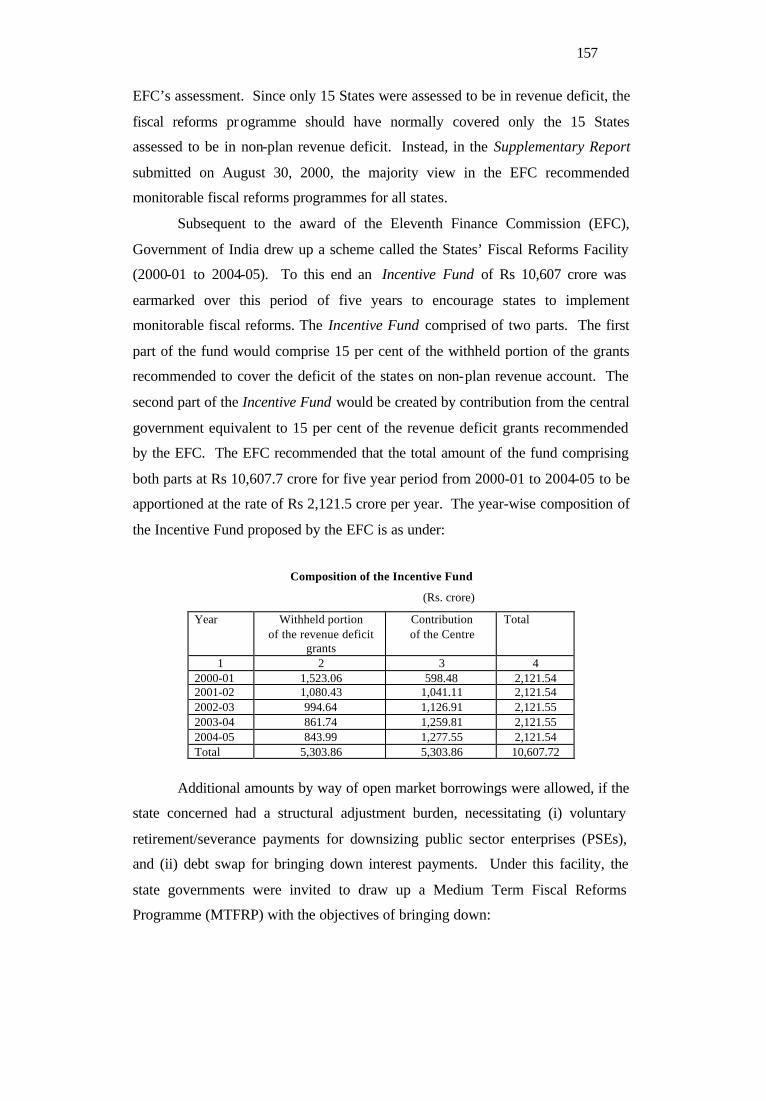
157
EFC’s assessment. Since only 15 States were assessed to be in revenue deficit, the
fiscal reforms programme should have normally covered only the 15 States
assessed to be in non-plan revenue deficit. Instead, in the Supplementary Report
submitted on August 30, 2000, the majority view in the EFC recommended
monitorable fiscal reforms programmes for all states.
Subsequent to the award of the Eleventh Finance Commission (EFC),
Government of India drew up a scheme called the States’ Fiscal Reforms Facility
(2000-01 to 2004-05). To this end an Incentive Fund of Rs 10,607 crore was
earmarked over this period of five years to encourage states to implement
monitorable fiscal reforms. The Incentive Fund comprised of two parts. The first
part of the fund would comprise 15 per cent of the withheld portion of the grants
recommended to cover the deficit of the states on non-plan revenue account. The
second part of the Incentive Fund would be created by contribution from the central
government equivalent to 15 per cent of the revenue deficit grants recommended
by the EFC. The EFC recommended that the total amount of the fund comprising
both parts at Rs 10,607.7 crore for five year period from 2000-01 to 2004-05 to be
apportioned at the rate of Rs 2,121.5 crore per year. The year-wise composition of
the Incentive Fund proposed by the EFC is as under:
Composition of the Incentive Fund
(Rs. crore)
Year Withheld portion of the revenue deficit
grants
Contribution of the Centre
Total
1 2 3 4 2000-01 1,523.06 598.48 2,121.54 2001-02 1,080.43 1,041.11 2,121.54 2002-03 994.64 1,126.91 2,121.55 2003-04 861.74 1,259.81 2,121.55 2004-05 843.99 1,277.55 2,121.54 Total 5,303.86 5,303.86 10,607.72
Additional amounts by way of open market borrowings were allowed, if the
state concerned had a structural adjustment burden, necessitating (i) voluntary
retirement/severance payments for downsizing public sector enterprises (PSEs),
and (ii) debt swap for bringing down interest payments. Under this facility, the
state governments were invited to draw up a Medium Term Fiscal Reforms
Programme (MTFRP) with the objectives of bringing down:
158
• the consolidated fiscal deficit to sustainable levels by 2005;
• the consolidated revenue deficit, so that in the aggregate, the revenue deficit is eliminated altogether by 2005; and
• the debt/GDP ratio including contingent liabilities to sustainable
levels, both in terms of stability and solvency.
The MTFRP of states attempted to combine policies in the following areas:
Fiscal Consolidation: These measures were intended to improving tax
and non-tax receipts, reprioritisation of expenditures, targeting non-merit subsidies and phasing them out, etc.
Public Sector Enterprise Reforms: These aimed at winding up loss-making PSEs,
privatisation of PSEs, restructuring of such PSEs as are felt to be absolutely necessary to continue in the public domain.
Power Sector Reforms: These aimed at corporatisation and unbundling
of the SEBs, 100 per cent metering up to 11 KV levels, implementing the awards of the Electricity Regulatory Commissions, provision of lump-sum subsidies from the state budgets in such cases where the utilities’ losses were phased out. The main monitorable milestone here, was the gap between average cost of power/kwh (on an accrual basis) and the average revenue realized/kwh (on a cash basis). The utilities have been sensitized to eliminate this gap over the next 5 years.
Fiscal Transparency: These measures inter alia sought at full disclosure
in state budgets especially with regard to subsidies, guarantees and the level of civil service employment.
Considerable flexibility was provided to the states in designing the MTFRP.
The state MTFRPs were considered by a committee comprising officials from the
state government concerned, the Union Ministry of Finance, Government of India,
Planning Commission and outside experts. Rele ases from the Incentive Fund were
based on a single monitorable fiscal parameter for the state which provided for a 5
percentage point reduction in the revenue deficit as a proportion to the states total
159
revenue receipts in each year till 2004-05. However, for the States which had
revenue surplus, a 3 percentage point improvement in ‘balance from current
revenues’ (BCR) was required to trigger off the release from the Incentive Fund.
The base year was the financial year 1999-2000. Releases were rule -based and not
discretionary. The improvement in the revenue balance and associated policy
measures suggested in the course of the MTFRP formed the basis of a
memorandum of understanding (MoU). Typically, the MoU had the following two
components in each sector of reform (i.e., fiscal consolidation, PSE reforms, etc.):
(i) Outcome Indicators: which covered approved/projected numbers
pertaining to the deficits, debt stock, subsidy reduction, tax and non-
tax receipts, etc.; and
(ii) Process Indicators: which are the monitorable administrative
milestones necessary to meet the projected
outcomes sector-wise; these included
notifications, enabling legislation, acting upon
recommendations of Regulatory Commissions,
etc. [GoI (2002a):Economic Survey 2001-2002,
p.64].
The Planning Commission is also extending support to the MTFRP by
ensuring that the Annual Plan framework is consistent with the reform agenda.
The Incentive Fund, which is intended for distribution amongst all the 25 (now 28)
states, has been created by allocating 15 per cent of the revenue deficit grant meant
for 15 major states during the five years coterminus with the Eleventh Finance
Commission period 2000-01 to 2004-05, and a matching contribution by the central
government.
So far up to the end of March 2003, 18 states, viz., Andhra Pradesh, Arunachal
Pradesh, Orissa, Maharashtra, Kerala, Karnataka, Manipur, Sikkim, Tamil Nadu,
Himachal Pradesh, West Bengal, Rajasthan, Mizoram, Meghalaya, Tripura and
Jammu and Kashmir, have drawn up the MTFRP in consultation with the central
government.
160
The Debt-Swap Scheme
In order to address the growing debt burden of states and to supplement the
efforts of states in the direction of evolving their medium-term fiscal reform
programme, a Debt-Swap Scheme has been formulated by the Government of
India. This scheme is focused on liquidating high-cost loans given by the
Government of India to the states, that is, all loans bearing interest rates in excess
of 13 per cent.
Out of the total stock of debt of Rs 2,44,000 crore owed by the states to the
Government of India as at the end of March 31, 2003, a little over Rs 1,00,000
crore were at coupon rates in excess of 13 per cent per annum, a rate that is far in
excess of the current market rates (6 per cent or thereabout). In consequence, the
interest burden of the states constituted a major item of expenditure for them;
leaving little for even routine, let alone developmental, purposes. Under the
mutually-agreed scheme between the central and state governments, all state loans
from the centre were to be swapped with market borrowings and small savings
proceedings at prevailing rates of interest over a period of three years ending 2004-
05. The debt-swap scheme is thus to be completed over a period of three years
ending 2004-05.
Over the above three-year period, all state loans to the Government of India
bearing coupons in excess of 13 per cent will have been swapped. In consequence,
the states will save, at the very minimum, an estimated Rs 81,000 crore in interest,
and deferred loan repayments, over the residual maturity period of the loans.
Furthermore, and equally importantly, this scheme will restrain the debt build-up in
states through the small savings scheme (Budget 2003-2004, GoI, February 28,
2003a).
Twenty-six of the twenty-eight states had consented to participate in the
scheme from the first year 2002-03 itself, while the remaining two joined in 2003-
04. As per the revised debt-swap scheme, 20 per cent of net small savings
releasable from September 2002 onwards are envisaged to be utilized for enabling
states to pre-pay high-cost government of India loans and advances outstanding as
on March 31, 2002. Further, retirements are through additional market borrowings.
Thus, in 2002-03, 25 states (excluding Maharashtra, Sikkim and West Bengal)
161
prepaid high-cost debt from the centre partly out of small savings collections and
partly through fresh market borrowings of Rs 10,000 crore conducted in two
tranches in the months of February and March 2003.
During 2003-04 (up to October 31, 2003), states have raised Rs 23,000
crore through additional market borrowings permitted under the debt-swap scheme
at coupon rates ranging from 6.20 per cent to 6.35 per cent.
Besides the Twelfth Finance Commission will also be making an
assessment of the debt position of the states and suggesting further such corrective
measures as are necessary.
Centre’s Reform-Linked Assistance for Sector-Specific Programmes
Besides, as enumerated in the Union Budget for 2002-03, the centre has been
extending the scheme of reform-linked assistance to states for sector-specific
programmes; in that year provision was made for assistance for states worth Rs
12,300 crore for accelerated power development and reform programme (APDRP)
(up from Rs 1,500 crore in 2001-02 to Rs 3,500 crore in 2002-03), accelerated
irrigation benefit programme (AIBP) (Rs 2,000 crore to Rs 2,800 crore), urban
reforms incentive fund (URIF) (Rs 500 crore), and rural infrastructure
development fund (RIDF) (Rs 5,000 crore to Rs 5,500 crore). In addition, the
centre’s budget for 2002-03 had also made a lump-sum provision of Rs 2,500 crore
for policy reforms in sectors which were constraining growth and development.
In all of these areas, assistance is linked to reforms. RIDF assistance is
linked to reforms in agriculture and rural sectors. The URIF is designed to
incentivise reforms in rent control, stamp duty regimes, streamlining the approvals
process for construction of buildings, revision of municipal laws, simplif ication of
laws and procedures for conversion of agricultural land for non-agricultural
purposes, levy of user charges and resource mobilisation by urban local bodies, and
initiation of public -private partnership in the provision of civic services. AIBP will
help states to accelerate the completion of unfinished medium and minor irrigation
projects, along with the undertaking of reforms by revising user charges and setting
up of water users associations. Finally, as detailed in a separate section below, the
power-sector reform is multi-faceted. Amongst other things, access to the APDRP
fund by the states has been on the basis of agreed reform programmes, “the centre
162
piece of which would be the narrowing and ultimate elimination of the gap between
unit cost of supply and revenue realisation within a specified time frame” (Union
Budget Speech 2002-03, Part-A, p.7). The focus of the power sector reform had
thus shifted from generation to transmission and distribution. However, in the
budget for 2003-04, the attention on capacity creation in the power sector was
reinforced. In 1999, the government had notified 18 power projects as mega
projects, with conferment on them various duty and licensing benefits. The
government has lately liberalised the mega power project policy further by
extending all those benefits to any power project that fulfilled the conditions
prescribed for mega power projects.
Multi-layer Efforts at Reforms of State Finances
Considering the enormity and wide-ranging nature of the problem, multi-layer
efforts have been thus made to reform the states’ fiscal positions and policies.
First, as explained above, three substantive programmes have been in operation at
the initiative of the central government – one-time fiscal reform facility
implemented in 1999-2000 with medium-term implications; a monitorable
medium-term fiscal reform programme (MTFRP) for five years 2000-01 to 2004-
05; and the debt-swap scheme. The MTFRP also involved power sector enterprise
reforms, in particular and public sector enterprises reforms, in general.
Second, in recent years, states have initiated and begun to implement on their
own several reform measures aimed at fiscal consolidation; these broadly cover
restructuring of their revenues and revenue augmentation, restraints on expenditure
increases and institutional reforms. A few states have even set up
committees/commissions relating to fiscal reforms. Assam has constituted a
Committee on Fiscal Reforms (COFR) and has engaged the NIPFP to undertake a
study on the prevailing fiscal scenario. Tamil Nadu instituted a staff and
expenditure review committee and Karnataka a tax reforms commission. Tamil
Nadu and Punjab also appointed disinvestment commissions for their states.
Almost all have indicated desires to introduce institutional reforms aimed at fiscal
stability and sustainability. Some states have initiated measures to provide
statutory backing to fiscal reforms through enabling legislation. The objective is to
eliminate revenue deficit and contain fiscal deficit in the medium term. Five states
163
viz., Karnataka, Kerala, Punjab, Tamil Nadu and Uttar Pradesh have already
enacted Fiscal Responsibility legislations. A Fiscal Responsibility Bill has also
been introduced in the legislature of Maharastra (RBI 2004). (For details see Chart
II). At second remove, the states’ efforts include measures to reform their revenue
structures including the preparatory work for introduction of Value Added Tax
(VAT) and rationalisation of user charges mainly relating to power, water and
transport. On the revenue side and various measures of expenditure containment
through economy measures such as restrictions on fresh recruitment and creation of
new posts and curbs on the increase in administrative expenditure; some states
have proposed the introduction of new contributory pension schemes for the newly
recruited staff on the lines of the central government scheme. Third, showing an
acute concern about the increasing interest burden of states because of the high
coupon rates applied to state government loans in the middle of the 1990s, a debt-
swap scheme has been introduced on mutual agreement between the central and
state governments. Finally, at the initiative of the central government and at the
states’ own initiative, concerted efforts have been made to reform the power sector
which has been a growing and sizeable drain on state finances.
A detailed state-wise picture of various fiscal reform schemes and programmes
under implementation and/or contemplated is presented in Chart I. This covers the
programmes as they obtained around the state budgets of the past three years 2000-
01, 2001-02 and 2002-03. Chart II gives brief summaries of fiscal responsibility
legislations effected in the five states mentioned above, as also those of the
proposed bill in Maharashtra.
Chart I presents the details under three categories of reforms for each state:
fiscal measures, institutional measures and sectoral measures. Fiscal measures
cover preparations for the introduction of VAT, reforms in sales taxation, measures
for broadening the existing tax base, attempts at zero-based budgeting, and
reduction and rationalisation of staff. Important institutional measures relate to
setting up of consolidated sinking fund, computerisation of budgeting, setting up of
standing audit committees, setting up of assets renewal fund, departmental
restructurings, and constitution of various committees and commissions for fiscal
and PSU reforms. Many of the sectoral measures like the institution of state
electricity regulatory authorities are also mentioned under institutional reforms. In
164
addition, under sectoral reforms, launching of sectoral technology missions,
starting of industrial parks for export promotion, promotion of information
technology, emphasis on agricultural sector reforms including the development of
horticulture and food processing industries, and conservation and management of
forests, are some of the common measures appearing in Chart I.
The provisions of fiscal responsibility legislations (Chart II) envisage
elimination of revenue deficit by 2006 (Karnataka) and by 2007 (Kerala) or
somewhat longer (may be about 7 years) by reducing revenue deficit to revenue
receipts ratio by five percentage points per year. Maharashtra is silent on the
targeted size of the gross fiscal deficit, though some restrictions on borrowings and
financial discipline impinging on the deficit has been proposed; Karnataka (3 per
cent of SDP), Punjab (2 per cent), Kerala (2 per cent) and Tamil Nadu (2.5 per
cent) have proposed GFD targets. Karnataka, Tamil Nadu, Punjab, Uttar Pradesh
and Maharshtra have provided for limiting state guarantees. Karnataka and Uttar
Pradesh have also set long-term goals of total liabilities not exceeding 25 per cent
of the estimated GSDP by the end of March 2015 and 2018, respectively.
Initiatives for State-Level Power Sector Reforms
As emphasized earlier, the power sector has become a major drain on state-
finances and also a hindrance to the development of state economies. Ailments of
the state power sector have been many. First, there are serious deficiencies in the
functioning of the State Electricity Boards (SEBs) at the physical level – poor
plant load factor particularly in the eastern states, unsatisfactory maintenance of
power equipments and delays in modernisation and renovation of generating units,
unsatisfactory delivery and huge losses in transmission and distribution due to
inadequate investments in the distribution system, improper billing and
indiscriminate grid extension despite low load densities.
These physical inefficiencies have adversely affected the financial
performances of SEBs, but there are more problems in the form of huge hidden
gross subsidies extended to agriculture and domestic consumers of power, the
inability of the state budgets to extend subvention for their losses, and sizeable
commercial losses outside of subsidies; these in turn are due to the growing gap
between user charges (average tariffs) and the cost of supply, as also the power
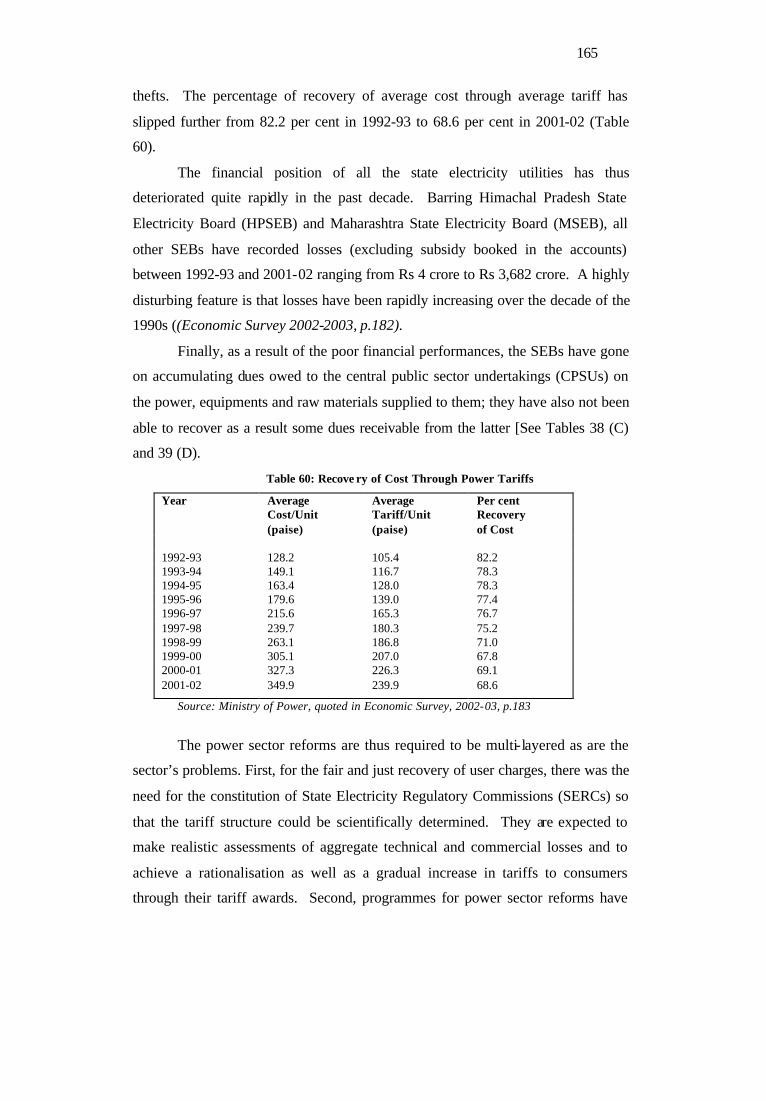
165
thefts. The percentage of recovery of average cost through average tariff has
slipped further from 82.2 per cent in 1992-93 to 68.6 per cent in 2001-02 (Table
60).
The financial position of all the state electricity utilities has thus
deteriorated quite rapidly in the past decade. Barring Himachal Pradesh State
Electricity Board (HPSEB) and Maharashtra State Electricity Board (MSEB), all
other SEBs have recorded losses (excluding subsidy booked in the accounts)
between 1992-93 and 2001-02 ranging from Rs 4 crore to Rs 3,682 crore. A highly
disturbing feature is that losses have been rapidly increasing over the decade of the
1990s ((Economic Survey 2002-2003, p.182).
Finally, as a result of the poor financial performances, the SEBs have gone
on accumulating dues owed to the central public sector undertakings (CPSUs) on
the power, equipments and raw materials supplied to them; they have also not been
able to recover as a result some dues receivable from the latter [See Tables 38 (C)
and 39 (D).
Table 60: Recove ry of Cost Through Power Tariffs
Year Average Cost/Unit (paise)
Average Tariff/Unit (paise)
Per cent Recovery of Cost
1992-93 128.2 105.4 82.2 1993-94 149.1 116.7 78.3 1994-95 163.4 128.0 78.3 1995-96 179.6 139.0 77.4 1996-97 215.6 165.3 76.7 1997-98 239.7 180.3 75.2 1998-99 263.1 186.8 71.0 1999-00 305.1 207.0 67.8 2000-01 327.3 226.3 69.1 2001-02 349.9 239.9 68.6
Source: Ministry of Power, quoted in Economic Survey, 2002-03, p.183
The power sector reforms are thus required to be multi-layered as are the
sector’s problems. First, for the fair and just recovery of user charges, there was the
need for the constitution of State Electricity Regulatory Commissions (SERCs) so
that the tariff structure could be scientifically determined. They are expected to
make realistic assessments of aggregate technical and commercial losses and to
achieve a rationalisation as well as a gradual increase in tariffs to consumers
through their tariff awards. Second, programmes for power sector reforms have
166
included unbundling of electricity boards into separate entities for power
generation, transmission and distribution. Third, based on the expert group
recommendations under the chairmanship of Dr. Montek Singh Ahluwalia, the then
Member (Energy), Planning Commission, the one-time settlement of dues payable
by SEBs to the CPSUs and dues from the CPSUs to the state power utilities (Rs
41,852 crore and Rs 9,610 crore, respectively, as on September 30, 2001), has been
effected. Finally, various measures have had to be initiated to reduce technical as
well as commercial losses in the power system, to improve the distribution system
and to prevent power thefts and improve the collection efficiency.
A few brief details of the above developments are given below.
Chart III presents the details of the power sector reforms undertaken and
under implementation in each of the states. State Electricity Regulatory
Commissions (SERCs) have been constituted or notified in 22 states (Andhra
Pradesh, Arunachal Pradesh, Assam, Bihar, Chattisgarh, Delhi, Goa, Gujarat,
Haryana, Himachal Pradesh, Karnataka, Kerala, Madhya Pradesh, Maharashtra,
Orissa, Punjab, Rajasthan, Tamil Nadu, Uttraranchal, Uttar Pradesh and West
Bengal). Of these, SERCs of 15 states have issued tariff orders (Andhra Pradesh,
Delhi, Gujarat, Himachal Pradesh, Karnataka, Madhya Pradesh, Maharashtra,
Orissa, Rajasthan, Uttar Pradesh, and West Bengal). The states of Andhra Pradesh,
Delhi, Gujarat, Haryana, Himachal Pradesh, Karnataka, Madhya Pradesh,
Maharashtra, Orissa, Punjab, Rajasthan and Uttar Pradesh have enacted their State
Electricity Reforms Acts which provide, inter-alia for unbundling corporatisation
of SEBs, setting up of SERCs, etc. The SEBs of Andhra Pradesh, Delhi , Haryana,
Karnataka, Orissa, Rajasthan and Uttar Pradesh have been unbundled/corporatised.
Twenty-one States have signed memorandum of understanding (MoUs)
with the Ministry of Power, Government of India, to undertake reforms in a time-
bound manner. Monitoring is being done to ensure that the agreed milestones are
achieved (State Finances: A Study of Budgets of 2002-03, RBI February 2003,
p.12). The Accelerated Power Development and Reforms Programme (APDRP),
which has an outlay of Rs 3,500 crore and which has been referred to earlier, has
been designed to assist reforms in the distribution sector. It seeks to target 63
distribution centres, and develop them as “centres of excellence”. It seeks to obtain
100 per cent metering, energy audit, better HT/LT ratio, replacement of distribution
167
transformers, and IT solutions relating to power flow at critical points to ensure
accountability at all levels. During 2002-03, 332 projects covering concentrated
load centres with capital cost of Rs 13,703 crore have been cleared till December
2002 (Economic Survey 2002-2003, p.186).
As for the one-time settlement of outstanding dues, the Expert Group on
SEBs’ Outstanding Dues (Chairman: Montek Singh Ahluwalia) submitted its report
in May 2001, which was endorsed by the Empowered Group of Chief Ministers in
March 2002. As per the recommendations of the Empowered Group, the
outstanding dues of SEBs to the CPSUs amounting to about Rs 44,000 crore as on
September 30,2001 were to be taken on state governments’ account and securitised
by the concerned states through a one-time settlement by issuing tax-free bonds
with coupon rate of 8.5 per cent to CPSUs, along with the clear understanding that
SEBs will henceforth pay their current dues to CPSUs. This was to enable SEBs to
clean up their books and raise resources to fund their development schemes. In
addition, this would also meet equity requirements of CPSUs and leverage them for
their expansion schemes. The scheme is making headway as a substantial number
of state governments have consented to it in the context of meeting payment
obligations of SEBs to National Thermal Power Corporation (NTPC), the CPSU
which has the largest accumulated receivables from SEBs and successive utilities.
Under the above scheme, the state governments have issued bonds worth Rs
28,984 core to the CPSUs against their outstanding dues at a tax-free interest rate
of 8.5 per cent per annum repayable over 10 years after a moratorium period of five
years. Subject to the approval of the RBI, 10 per cent of the bonds can be off-
loaded in the market each year for trading. The tripartite agreements (TPAs) in this
respect have been signed amongst the central government, the RBI and 28 state
governments. As the RBI has pointed out, this scheme will, however, further
impact the state finances as the state governments will be required to make
provision for meeting debt service obligations for the bonds issued to CPSUs, on
the one hand and ensuring payment of SEBs’ current dues to CPSUs, on the other,
in their budgets in the coming years” (Report on Currency and Finance 2001-02,
RBI 2003, p.IV-14).
168
Finally, the Electricity Bill, 2001 was introduced in the Lok Sabha in
August, 2001 and subsequently referred to the Standing Committee on Energy for
examination. The Committee submitted its report to the Lok Sabha on December
19, 2002. Action has already been initiated on this report. The Bill seeks to
provide a legal framework for enabling reforms and restructuring of the power
sector; it would result in simplification of administrative procedures by integrating
the Indian Electricity Act, 1910, the Electricity (Supply) Act, 1948 and the
Electricity Regulatory Commissions Act, 1998, into a single Act (Economic
Survey 2002-2003, p.186).
Revisions in Power Tariffs
As a consequence of the power sector reforms, some of the state
governments have effected upward revisions in power tariffs even for
agriculture. In this regard, the annual Reports of the Commission for
Agricultural Costs and Prices have been providing some brief details in
regard to power tariff revisions for irrigation and such other agricultural
purposes. The following extracts from these recent reports bring out the
nature of revisions being undertaken by different state governments.
(i) Reports for 2002-03 Season:
In the case of electricity for irrigation purposes, the electricity
tariffs have been increased during the past one year in the states of
Maharashtra, Gujarat, Karnataka, Uttar Pradesh, Madhya Pradesh,
Haryana and Assam. In Karnataka, the electricity rates have increased
from 50 paise per unit to 135 paise per unit with effect from December
20, 2000. In Gujarat, the metered tariff was 50 paise per unit. In
Haryana and Madhya Pradesh modest increase in the tariffs have been
effected. In Punjab and Tamil Nadu, electricity continues to be free of
cost for agricultural purposes.
(i) Reports for 2001-02 Season:
The electricity tariffs for irrigation purposes have remained at the
same levels as before in most of the kharif growing states except
Haryana, Maharashtra, Gujarat, Rajasthan and Uttar Pradesh. For
Haryana, the electricity rate for metered supplies have been increased
169
with effect from January 1, 2001 and are currently being charged at 60
paise/unit for supplies upto 100 units, at 50 paise/unit for 101-150
units, 43 paise/unit for 151-200 units and 35 paise/unit for over 200
units. On these lines, the electricity charges on un-metered supplies
also have been revised ranging from Rs 45/BHP/month to Rs
100/BHP/month for various categories of pump-sets. In addition, fuel
surcharge is also payable @ 3 paise/unit. In Maharashtra, with effect
from May 1, 2000, the metered tariff for electricity for agricultural
purposes has been increased from 74 paise per unit to 110 paise per
unit and flat rates applicable to various categories of pump-sets have
been increased by over 80 per cent. The flat rates for motors up to 5
HP are presently being fixed at Rs 75/HP/month, for motors of above
5 HP up to 7.5 HP at Rs 92/HP/month and for motors of more than 7.5
HP at Rs 117/HP/month. Uttar Pradesh has reported an increase of
electricity tariff from Rs 40/HP/month to Rs 55/HP/month with effect
from August 1, 2000. The electricity tariff for irrigation purposes in
the remaining states are being charged at different rates and the supply
at present is provided free of cost in a few states like Punjab, Tamil
Nadu and partially in Karnataka. In Gujarat, with effect from July 1,
2001, the electricity tariff for irrigation has been revised from Rs 350-
500/HP/annum to Rs 140/HP/month. In case of Rajasthan, the
metered tariff has been increased from 70 paise to 90 paise per unit
with effect from April 1, 2001 and the flat rates have been raised from
Rs 60/HP/month to Rs 85/HP/month from the same date.
(iii) Reports for 2000-01 Season:
The electricity tariffs for irrigation purposes during the last one-year
have not been revised in any of the states growing except Rajasthan
and Maharashtra. In Rajasthan the electricity tariff for metered supply
has been raised from 50 paise per unit to 70 paise per unit with effect
from November 1999; the flat rates for pump-sets of various H.P.
capacities have also been increased in the range of about 40 to 80 per
cent. With this increase, the flat rate has now been fixed at Rs 60 per
170
H.P. per month which replaces the earlier system of differential rates
applied for pump-set of varying capacities in Rajasthan. The electricity
is otherwise being supplied free of cost in Punjab and Tamil Nadu and
partially in Karnataka.
RBI initiatives on State Finances
The Reserve Bank of India (RBI) was deeply involved in resolving the
WMAs- related one-time fiscal reform facility of 1999-2000 for states. While the
central bank was always involved in its role as advisor to the state governments on
fiscal matters, the year 1998-99 witnessed “a very high gross fiscal deficit (GFD-
GDP ratio) for states” (RBI, 2000,p.1). First, with effect from March 1, 1999, the
normal WMAs were revised upwards by 65 per cent from Rs 2,234.40 crore to Rs
3,685 crore. Second, the central bank had also appointed a Committee of State
Finance Secretaries to examine the implications of contingent liabilities and
guarantees issued by the state governments in the interest of prudent financial
management and credibility of guarantees issued – an issue that had then begun to
crop up due to delays in honouring guarantees by some states. Third, at the
initiative of the RBI, a Committee of Finance Secretaries of State governments was
set up to work on the issue of transparency and voluntary disclosure norms for state
budgets. Fourth, the states were encouraged to access the market through the
auction mechanism for a part of their market borrowings. Fifth, the RBI has been
advising the state governments in such areas as cash management, funds
management and reforms in budgetary practices. Finally, following the mounting
debt of state governments, the RBI has, in consultation with state Finance
Secretaries, developed a scheme for a Consolidated Sinking Fund, though optional
for individual governments. The foundation for all of these initiatives by the
RBI was laid in 1999-2000, and as shown in Chart IV, further progress has been
made in each one of them in subsequent years.
Proposal to Fix a Ceiling on State Government Guarantees
As explained earlier, with restrictions on state government borrowings, the
fiscal reform has hurt the capital budgets rather drastically and hence, some of the
states have implemented capital projects outside their budgets. Therefore, the need
171
to obtain off-budget resources by state PSUs has got intensified. At the same time,
the state PSUs are unable to get fundings for their projects without the clutches of
state guarantees. The contingent liabilities of state governments also reflect the
practice of setting up of special purpose vehicles (SPUs) to borrow from the market
– a method which ensures a stream of revenues for the retirement of liabilities.
Overall, the deterioration in the quantum of state guarantees particularly began
in 1998-99; until then the size of state guarantees was lower than that of the centre.
Thereafter, they begun to gallop and reached 94 per cent higher than that of the
centre in 2000-01; there was a marginal decline in 2001-02 (see earlier Table 45).
“Many States have initiated measures to contain the growth of guarantees
such as setting up of guarantee redemption funds and statutory and
administrative limits on guarantees following the recommendation of the
Technical Committee on State Government Guarantees (1999). Besides,
some States have planned to charge guarantee commissions on outstanding
guaranteed amounts. The recent Report of the ‘Group to Assess the Fiscal
Risk of State Government Guarantees’ (2002) has made a number of
recommendations to limit guarantees by the State Governments so as to
contain the fiscal risk ”.
“The Technical Committee on State Government Guarantees (RBI
1999c) recommended that States fix a ceiling on guarantees; that there
should be some selectivity in issuance of guarantees; and that information
on guarantees should be comprehensive and disclosed in budget documents.
“The Group to Assess the Fiscal Risk of State Government
Guarantees was constituted to suggest, inter alia, a method for evaluation of
the fiscal risk of State Government guarantees. The major
recommendations of the Group (2002) are:
• Guarantees to be met out of budgetary resources should be
identified and treated as equivalent to debt;
• For other guarantees, projects/activities need to be classified and
assigned appropriate risk weights;
• Mapping of guarantees and future devolvement;
• Central financial institutions should amend their Acts/policies
and do away with the practice of insisting on guarantees;
172
• Regular publication of data regarding guarantees in budget
documents;
• State Level Tracking Unit for guarantees;
• At least one per cent of outstanding guarantees to be transferred
to the Guarantee Redemption Fund (GRF) each year specifically
to meet the additional fiscal risk” (Annual Report, 2002-03, RBI
(2003a), pp.67-68).
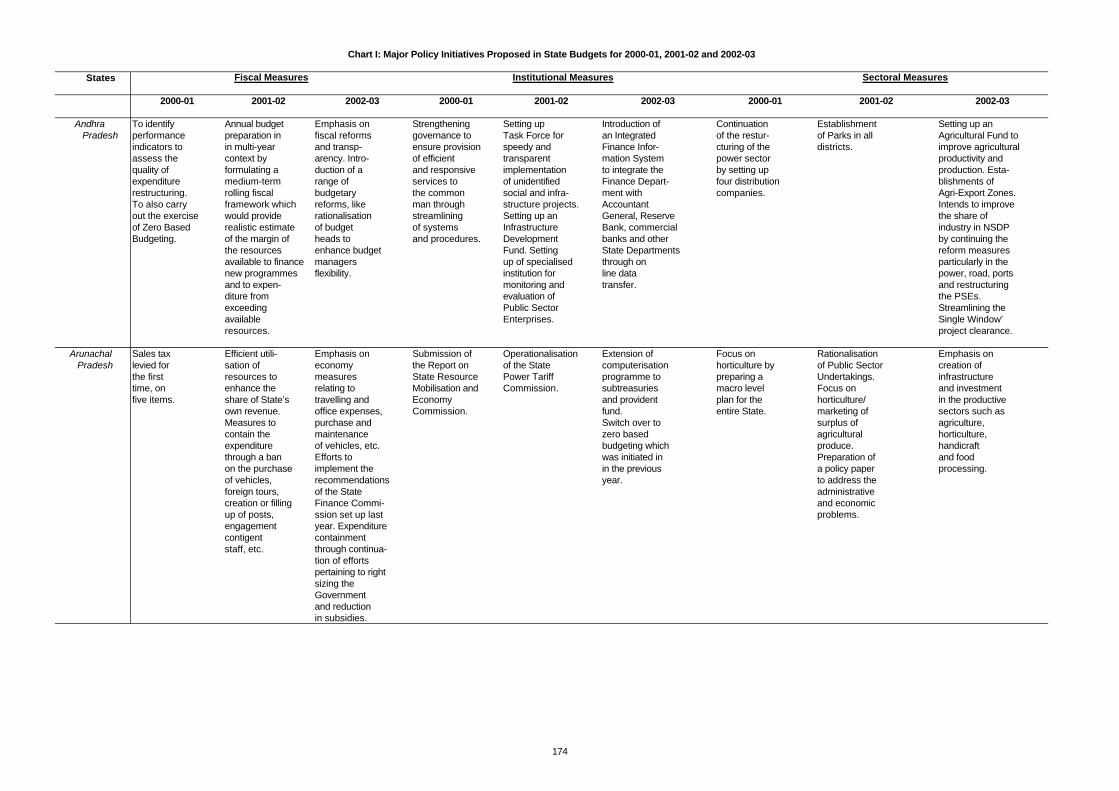
States
2000-01 2001-02 2002-03 2000-01 2001-02 2002-03 2000-01 2001-02 2002-03
Andhra To identify Annual budget Emphasis on Strengthening Setting up Introduction of Continuation Establishment Setting up an Pradesh performance preparation in fiscal reforms governance to Task Force for an Integrated of the restur- of Parks in all Agricultural Fund to
indicators to in multi-year and transp- ensure provision speedy and Finance Infor- cturing of the districts. improve agriculturalassess the context by arency. Intro- of efficient transparent mation System power sector productivity andquality of formulating a duction of a and responsive implementation to integrate the by setting up production. Esta-expenditure medium-term range of services to of unidentified Finance Depart- four distribution blishments of restructuring. rolling fiscal budgetary the common social and infra- ment with companies. Agri-Export Zones.To also carry framework which reforms, like man through structure projects. Accountant Intends to improve out the exercise would provide rationalisation streamlining Setting up an General, Reserve the share of of Zero Based realistic estimate of budget of systems Infrastructure Bank, commercial industry in NSDPBudgeting. of the margin of heads to and procedures. Development banks and other by continuing the
the resources enhance budget Fund. Setting State Departments reform measuresavailable to finance managers up of specialised through on particularly in thenew programmes flexibility. institution for line data power, road, portsand to expen- monitoring and transfer. and restructuringditure from evaluation of the PSEs.exceeding Public Sector Streamlining theavailable Enterprises. Single Window’resources. project clearance.
Arunachal Sales tax Efficient utili- Emphasis on Submission of Operationalisation Extension of Focus on Rationalisation Emphasis on Pradesh levied for sation of economy the Report on of the State computerisation horticulture by of Public Sector creation of
the first resources to measures State Resource Power Tariff programme to preparing a Undertakings. infrastructuretime, on enhance the relating to Mobilisation and Commission. subtreasuries macro level Focus on and investmentfive items. share of State’s travelling and Economy and provident plan for the horticulture/ in the productive
own revenue. office expenses, Commission. fund. entire State. marketing of sectors such asMeasures to purchase and Switch over to surplus of agriculture,contain the maintenance zero based agricultural horticulture,expenditure of vehicles, etc. budgeting which produce. handicraftthrough a ban Efforts to was initiated in Preparation of and food on the purchase implement the in the previous a policy paper processing.of vehicles, recommendations year. to address theforeign tours, of the State administrativecreation or filling Finance Commi- and economicup of posts, ssion set up last problems.engagement year. Expenditurecontigent containment staff, etc. through continua-
tion of efforts pertaining to rightsizing the Government and reductionin subsidies.
Fiscal Measures Institutional Measures Sectoral Measures
Chart I: Major Policy Initiatives Proposed in State Budgets for 2000-01, 2001-02 and 2002-03
174
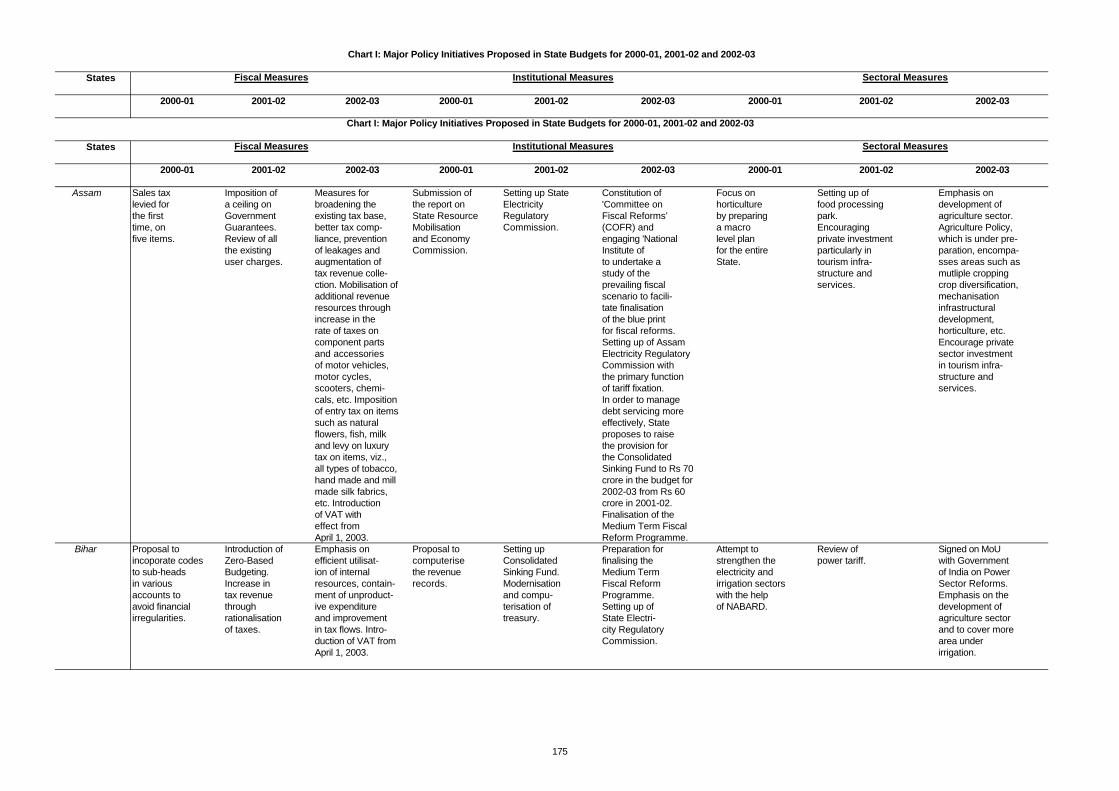
States
2000-01 2001-02 2002-03 2000-01 2001-02 2002-03 2000-01 2001-02 2002-03
Fiscal Measures Institutional Measures Sectoral Measures
Chart I: Major Policy Initiatives Proposed in State Budgets for 2000-01, 2001-02 and 2002-03
States
2000-01 2001-02 2002-03 2000-01 2001-02 2002-03 2000-01 2001-02 2002-03
Assam Sales tax Imposition of Measures for Submission of Setting up State Constitution of Focus on Setting up of Emphasis on levied for a ceiling on broadening the the report on Electricity 'Committee on horticulture food processing development ofthe first Government existing tax base, State Resource Regulatory Fiscal Reforms’ by preparing park. agriculture sector.time, on Guarantees. better tax comp- Mobilisation Commission. (COFR) and a macro Encouraging Agriculture Policy,five items. Review of all liance, prevention and Economy engaging 'National level plan private investment which is under pre-
the existing of leakages and Commission. Institute of for the entire particularly in paration, encompa-user charges. augmentation of to undertake a State. tourism infra- sses areas such as
tax revenue colle- study of the structure and mutliple croppingction. Mobilisation of prevailing fiscal services. crop diversification,additional revenue scenario to facili- mechanisationresources through tate finalisation infrastructuralincrease in the of the blue print development,rate of taxes on for fiscal reforms. horticulture, etc.component parts Setting up of Assam Encourage private and accessories Electricity Regulatory sector investmentof motor vehicles, Commission with in tourism infra-motor cycles, the primary function structure andscooters, chemi- of tariff fixation. services.cals, etc. Imposition In order to manage of entry tax on items debt servicing moresuch as natural effectively, Stateflowers, fish, milk proposes to raise and levy on luxury the provision for tax on items, viz., the Consolidated all types of tobacco, Sinking Fund to Rs 70 hand made and mill crore in the budget for made silk fabrics, 2002-03 from Rs 60 etc. Introduction crore in 2001-02. of VAT with Finalisation of the effect from Medium Term FiscalApril 1, 2003. Reform Programme.
Bihar Proposal to Introduction of Emphasis on Proposal to Setting up Preparation for Attempt to Review of Signed on MoU incoporate codes Zero-Based efficient utilisat- computerise Consolidated finalising the strengthen the power tariff. with Governmentto sub-heads Budgeting. ion of internal the revenue Sinking Fund. Medium Term electricity and of India on Powerin various Increase in resources, contain- records. Modernisation Fiscal Reform irrigation sectors Sector Reforms.accounts to tax revenue ment of unproduct- and compu- Programme. with the help Emphasis on theavoid financial through ive expenditure terisation of Setting up of of NABARD. development ofirregularities. rationalisation and improvement treasury. State Electri- agriculture sector
of taxes. in tax flows. Intro- city Regulatory and to cover moreduction of VAT from Commission. area underApril 1, 2003. irrigation.
Chart I: Major Policy Initiatives Proposed in State Budgets for 2000-01, 2001-02 and 2002-03
Fiscal Measures Institutional Measures Sectoral Measures
175
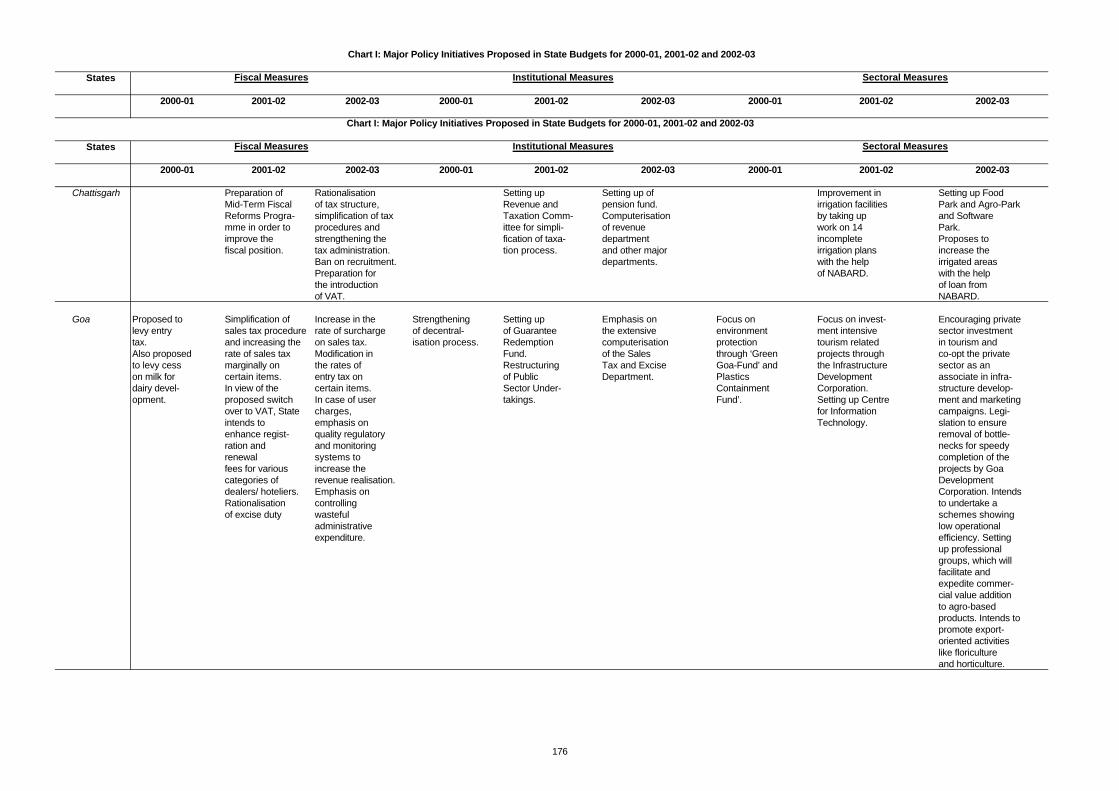
States
2000-01 2001-02 2002-03 2000-01 2001-02 2002-03 2000-01 2001-02 2002-03
Fiscal Measures Institutional Measures Sectoral Measures
Chart I: Major Policy Initiatives Proposed in State Budgets for 2000-01, 2001-02 and 2002-03
States
2000-01 2001-02 2002-03 2000-01 2001-02 2002-03 2000-01 2001-02 2002-03
Chattisgarh Preparation of Rationalisation Setting up Setting up of Improvement in Setting up Food Mid-Term Fiscal of tax structure, Revenue and pension fund. irrigation facilities Park and Agro-ParkReforms Progra- simplification of tax Taxation Comm- Computerisation by taking up and Softwaremme in order to procedures and ittee for simpli- of revenue work on 14 Park.improve the strengthening the fication of taxa- department incomplete Proposes tofiscal position. tax administration. tion process. and other major irrigation plans increase the
Ban on recruitment. departments. with the help irrigated areasPreparation for of NABARD. with the helpthe introduction of loan fromof VAT. NABARD.
Goa Proposed to Simplification of Increase in the Strengthening Setting up Emphasis on Focus on Focus on invest- Encouraging privatelevy entry sales tax procedure rate of surcharge of decentral- of Guarantee the extensive environment ment intensive sector investmenttax. and increasing the on sales tax. isation process. Redemption computerisation protection tourism related in tourism andAlso proposed rate of sales tax Modification in Fund. of the Sales through ‘Green projects through co-opt the privateto levy cess marginally on the rates of Restructuring Tax and Excise Goa-Fund’ and the Infrastructure sector as anon milk for certain items. entry tax on of Public Department. Plastics Development associate in infra-dairy devel- In view of the certain items. Sector Under- Containment Corporation. structure develop-opment. proposed switch In case of user takings. Fund’. Setting up Centre ment and marketing
over to VAT, State charges, for Information campaigns. Legi-intends to emphasis on Technology. slation to ensureenhance regist- quality regulatory removal of bottle-ration and and monitoring necks for speedy renewal systems to completion of thefees for various increase the projects by Goa categories of revenue realisation. Development dealers/ hoteliers. Emphasis on Corporation. IntendsRationalisation controlling to undertake aof excise duty wasteful schemes showing
administrative low operationalexpenditure. efficiency. Setting
up professional groups, which willfacilitate andexpedite commer-cial value additionto agro-based products. Intends topromote export-oriented activitieslike floricultureand horticulture.
Chart I: Major Policy Initiatives Proposed in State Budgets for 2000-01, 2001-02 and 2002-03
Fiscal Measures Institutional Measures Sectoral Measures
176
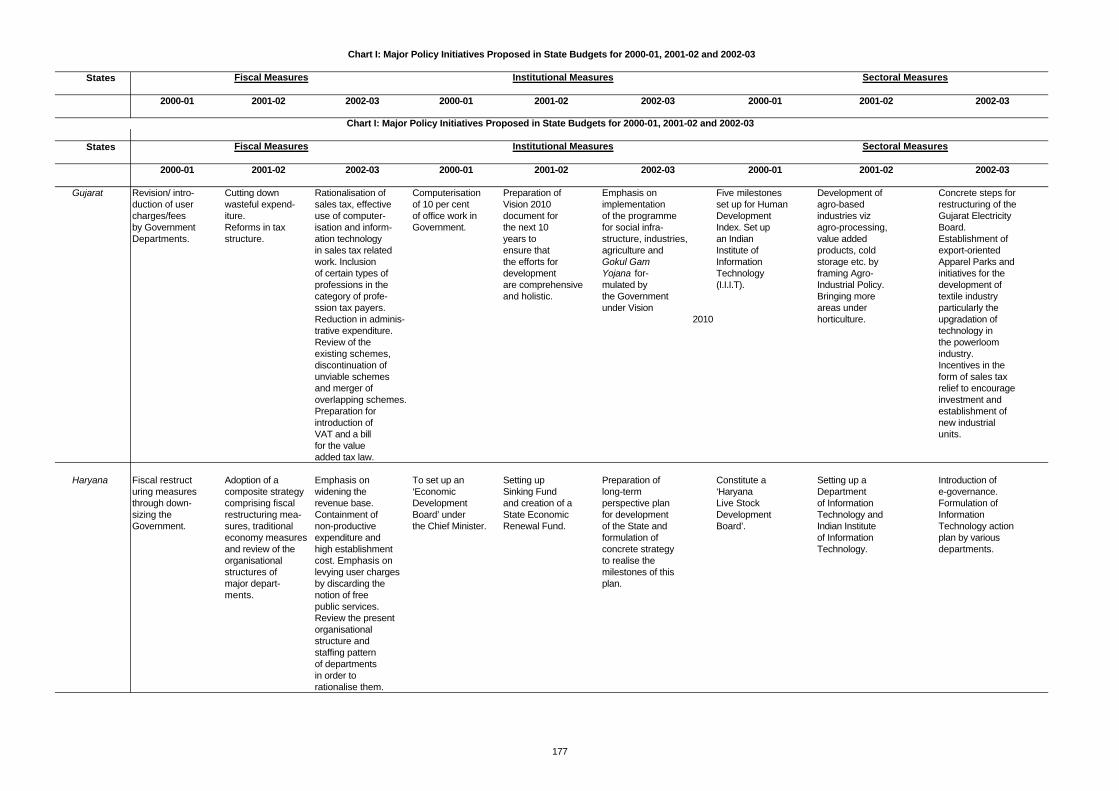
States
2000-01 2001-02 2002-03 2000-01 2001-02 2002-03 2000-01 2001-02 2002-03
Fiscal Measures Institutional Measures Sectoral Measures
Chart I: Major Policy Initiatives Proposed in State Budgets for 2000-01, 2001-02 and 2002-03
States
2000-01 2001-02 2002-03 2000-01 2001-02 2002-03 2000-01 2001-02 2002-03
Gujarat Revision/ intro- Cutting down Rationalisation of Computerisation Preparation of Emphasis on Five milestones Development of Concrete steps forduction of user wasteful expend- sales tax, effective of 10 per cent Vision 2010 implementation set up for Human agro-based restructuring of thecharges/fees iture. use of computer- of office work in document for of the programme Development industries viz Gujarat Electricityby Government Reforms in tax isation and inform- Government. the next 10 for social infra- Index. Set up agro-processing, Board.Departments. structure. ation technology years to structure, industries, an Indian value added Establishment of
in sales tax related ensure that agriculture and Institute of products, cold export-orientedwork. Inclusion the efforts for Gokul Gam Information storage etc. by Apparel Parks andof certain types of development Yojana for- Technology framing Agro- initiatives for theprofessions in the are comprehensive mulated by (I.I.I.T). Industrial Policy. development ofcategory of profe- and holistic. the Government Bringing more textile industryssion tax payers. under Vision areas under particularly theReduction in adminis- 2010 horticulture. upgradation oftrative expenditure. technology inReview of the the powerloomexisting schemes, industry.discontinuation of Incentives in theunviable schemes form of sales taxand merger of relief to encourageoverlapping schemes. investment andPreparation for establishment ofintroduction of new industrialVAT and a bill units.for the value added tax law.
Haryana Fiscal restruct Adoption of a Emphasis on To set up an Setting up Preparation of Constitute a Setting up a Introduction of uring measures composite strategy widening the ‘Economic Sinking Fund long-term ‘Haryana Department e-governance.through down- comprising fiscal revenue base. Development and creation of a perspective plan Live Stock of Information Formulation of sizing the restructuring mea- Containment of Board’ under State Economic for development Development Technology and InformationGovernment. sures, traditional non-productive the Chief Minister. Renewal Fund. of the State and Board’. Indian Institute Technology action
economy measures expenditure and formulation of of Information plan by variousand review of the high establishment concrete strategy Technology. departments.organisational cost. Emphasis on to realise thestructures of levying user charges milestones of thismajor depart- by discarding the plan.ments. notion of free
public services. Review the presentorganisationalstructure andstaffing patternof departmentsin order torationalise them.
Chart I: Major Policy Initiatives Proposed in State Budgets for 2000-01, 2001-02 and 2002-03
Fiscal Measures Institutional Measures Sectoral Measures
177
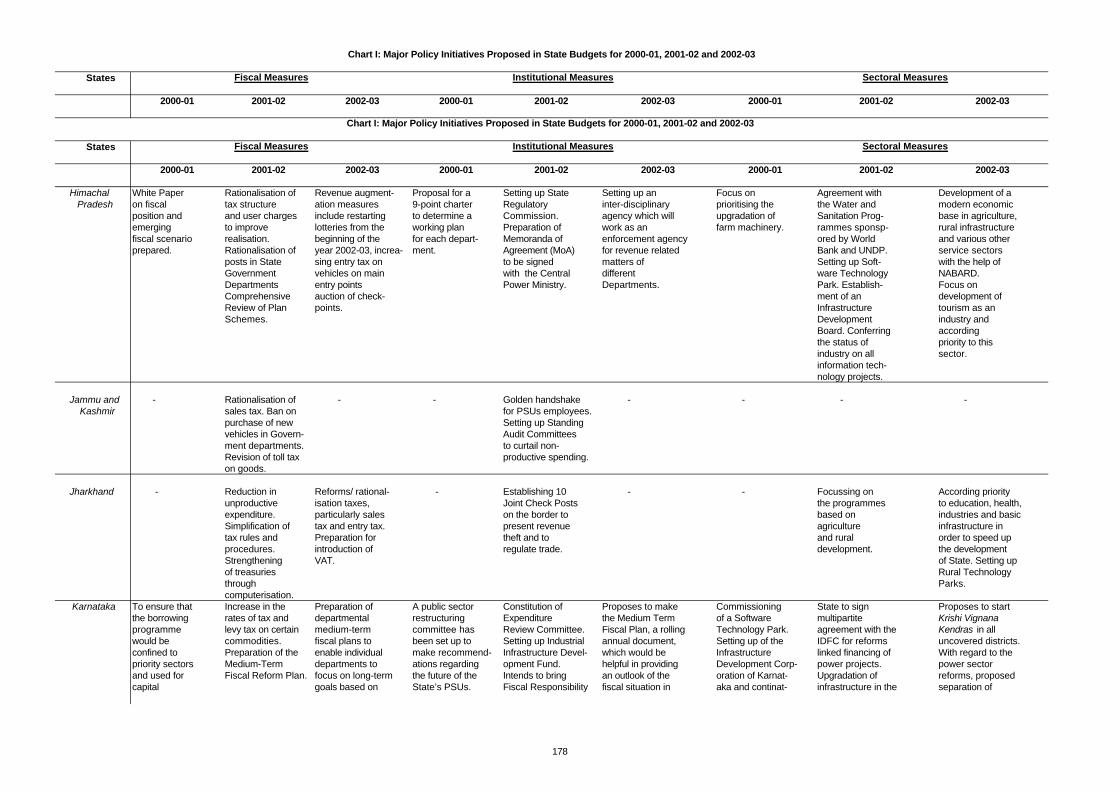
States
2000-01 2001-02 2002-03 2000-01 2001-02 2002-03 2000-01 2001-02 2002-03
Fiscal Measures Institutional Measures Sectoral Measures
Chart I: Major Policy Initiatives Proposed in State Budgets for 2000-01, 2001-02 and 2002-03
States
2000-01 2001-02 2002-03 2000-01 2001-02 2002-03 2000-01 2001-02 2002-03
Himachal White Paper Rationalisation of Revenue augment- Proposal for a Setting up State Setting up an Focus on Agreement with Development of a Pradesh on fiscal tax structure ation measures 9-point charter Regulatory inter-disciplinary prioritising the the Water and modern economic
position and and user charges include restarting to determine a Commission. agency which will upgradation of Sanitation Prog- base in agriculture,emerging to improve lotteries from the working plan Preparation of work as an farm machinery. rammes sponsp- rural infrastructurefiscal scenario realisation. beginning of the for each depart- Memoranda of enforcement agency ored by World and various otherprepared. Rationalisation of year 2002-03, increa- ment. Agreement (MoA) for revenue related Bank and UNDP. service sectors
posts in State sing entry tax on to be signed matters of Setting up Soft- with the help ofGovernment vehicles on main with the Central different ware Technology NABARD.Departments entry points Power Ministry. Departments. Park. Establish- Focus on Comprehensive auction of check- ment of an development of Review of Plan points. Infrastructure tourism as anSchemes. Development industry and
Board. Conferring accordingthe status of priority to thisindustry on all sector.information tech-nology projects.
Jammu and - Rationalisation of - - Golden handshake - - - - Kashmir sales tax. Ban on for PSUs employees.
purchase of new Setting up Standingvehicles in Govern- Audit Committeesment departments. to curtail non-Revision of toll tax productive spending.on goods.
Jharkhand - Reduction in Reforms/ rational- - Establishing 10 - - Focussing on According priority unproductive isation taxes, Joint Check Posts the programmes to education, health,expenditure. particularly sales on the border to based on industries and basicSimplification of tax and entry tax. present revenue agriculture infrastructure in tax rules and Preparation for theft and to and rural order to speed upprocedures. introduction of regulate trade. development. the development Strengthening VAT. of State. Setting up of treasuries Rural Technology through Parks.computerisation.
Karnataka To ensure that Increase in the Preparation of A public sector Constitution of Proposes to make Commissioning State to sign Proposes to startthe borrowing rates of tax and departmental restructuring Expenditure the Medium Term of a Software multipartite Krishi Vignanaprogramme levy tax on certain medium-term committee has Review Committee. Fiscal Plan, a rolling Technology Park. agreement with the Kendras in all would be commodities. fiscal plans to been set up to Setting up Industrial annual document, Setting up of the IDFC for reforms uncovered districts.confined to Preparation of the enable individual make recommend- Infrastructure Devel- which would be Infrastructure linked financing of With regard to the priority sectors Medium-Term departments to ations regarding opment Fund. helpful in providing Development Corp- power projects. power sectorand used for Fiscal Reform Plan. focus on long-term the future of the Intends to bring an outlook of the oration of Karnat- Upgradation of reforms, proposed capital goals based on State’s PSUs. Fiscal Responsibility fiscal situation in aka and continat- infrastructure in the separation of
Chart I: Major Policy Initiatives Proposed in State Budgets for 2000-01, 2001-02 and 2002-03
Fiscal Measures Institutional Measures Sectoral Measures
178
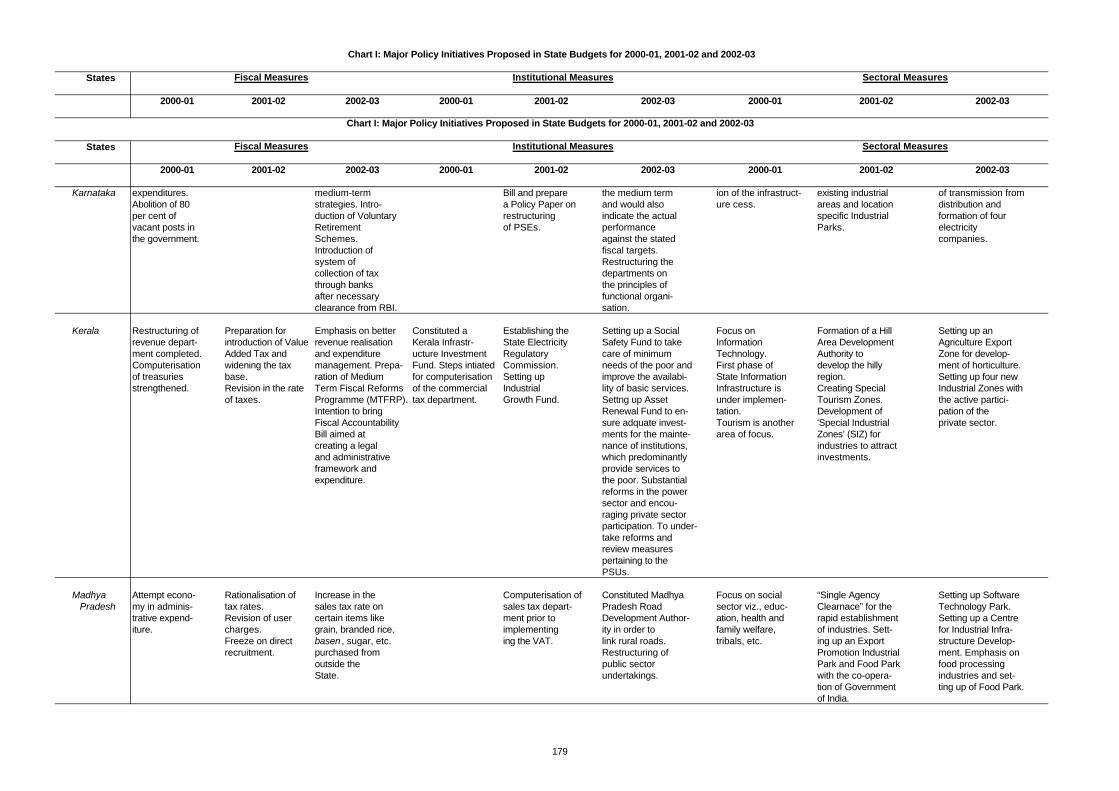
States
2000-01 2001-02 2002-03 2000-01 2001-02 2002-03 2000-01 2001-02 2002-03
Fiscal Measures Institutional Measures Sectoral Measures
Chart I: Major Policy Initiatives Proposed in State Budgets for 2000-01, 2001-02 and 2002-03
States
2000-01 2001-02 2002-03 2000-01 2001-02 2002-03 2000-01 2001-02 2002-03
Karnataka expenditures. medium-term Bill and prepare the medium term ion of the infrastruct- existing industrial of transmission from Abolition of 80 strategies. Intro- a Policy Paper on and would also ure cess. areas and location distribution andper cent of duction of Voluntary restructuring indicate the actual specific Industrial formation of fourvacant posts in Retirement of PSEs. performance Parks. electricity the government. Schemes. against the stated companies.
Introduction of fiscal targets.system of Restructuring the collection of tax departments onthrough banks the principles ofafter necessary functional organi-clearance from RBI. sation.
Kerala Restructuring of Preparation for Emphasis on better Constituted a Establishing the Setting up a Social Focus on Formation of a Hill Setting up an revenue depart- introduction of Value revenue realisation Kerala Infrastr- State Electricity Safety Fund to take Information Area Development Agriculture Exportment completed. Added Tax and and expenditure ucture Investment Regulatory care of minimum Technology. Authority to Zone for develop-Computerisation widening the tax management. Prepa- Fund. Steps intiated Commission. needs of the poor and First phase of develop the hilly ment of horticulture.of treasuries base. ration of Medium for computerisation Setting up improve the availabi- State Information region. Setting up four newstrengthened. Revision in the rate Term Fiscal Reforms of the commercial Industrial lity of basic services. Infrastructure is Creating Special Industrial Zones with
of taxes. Programme (MTFRP). tax department. Growth Fund. Settng up Asset under implemen- Tourism Zones. the active partici-Intention to bring Renewal Fund to en- tation. Development of pation of the Fiscal Accountability sure adquate invest- Tourism is another 'Special Industrial private sector.Bill aimed at ments for the mainte- area of focus. Zones’ (SIZ) for creating a legal nance of institutions, industries to attractand administrative which predominantly investments.framework and provide services to expenditure. the poor. Substantial
reforms in the power sector and encou-raging private sector participation. To under-take reforms andreview measurespertaining to thePSUs.
Madhya Attempt econo- Rationalisation of Increase in the Computerisation of Constituted Madhya Focus on social “Single Agency Setting up Software Pradesh my in adminis- tax rates. sales tax rate on sales tax depart- Pradesh Road sector viz., educ- Clearnace” for the Technology Park.
trative expend- Revision of user certain items like ment prior to Development Author- ation, health and rapid establishment Setting up a Centre iture. charges. grain, branded rice, implementing ity in order to family welfare, of industries. Sett- for Industrial Infra-
Freeze on direct basen , sugar, etc. ing the VAT. link rural roads. tribals, etc. ing up an Export structure Develop-recruitment. purchased from Restructuring of Promotion Industrial ment. Emphasis on
outside the public sector Park and Food Park food processingState. undertakings. with the co-opera- industries and set-
tion of Government ting up of Food Park.of India.
Chart I: Major Policy Initiatives Proposed in State Budgets for 2000-01, 2001-02 and 2002-03
Fiscal Measures Institutional Measures Sectoral Measures
179
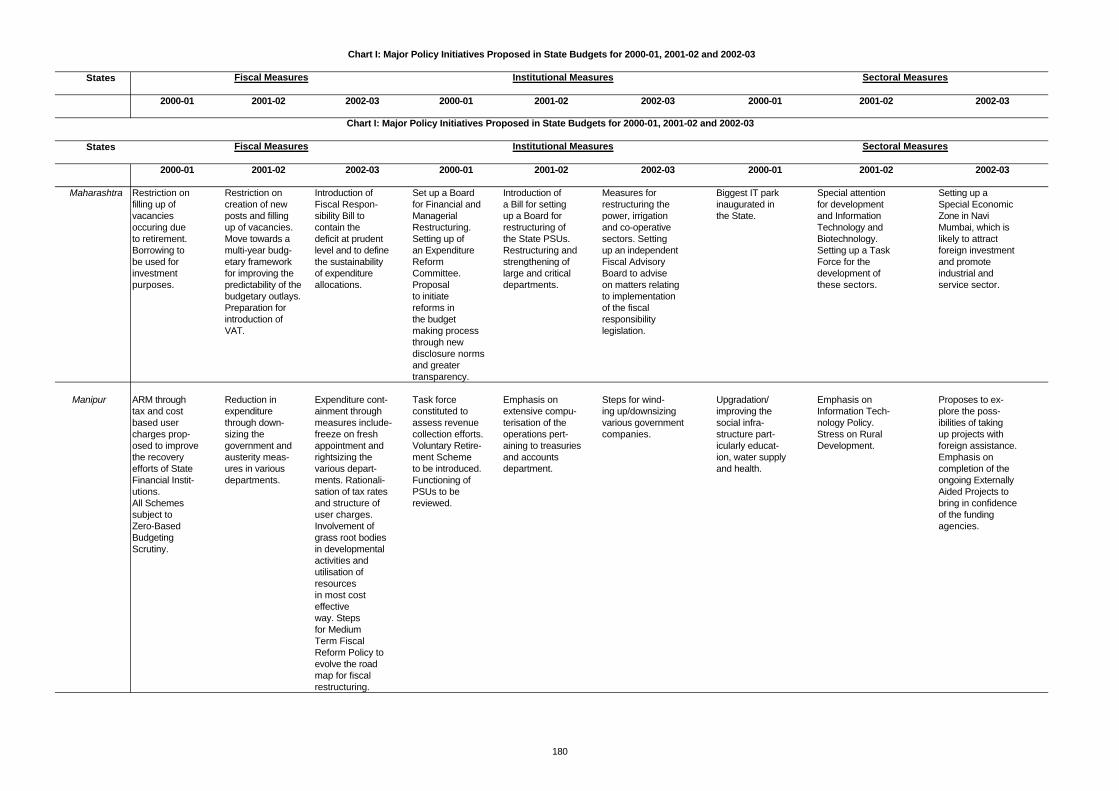
States
2000-01 2001-02 2002-03 2000-01 2001-02 2002-03 2000-01 2001-02 2002-03
Fiscal Measures Institutional Measures Sectoral Measures
Chart I: Major Policy Initiatives Proposed in State Budgets for 2000-01, 2001-02 and 2002-03
States
2000-01 2001-02 2002-03 2000-01 2001-02 2002-03 2000-01 2001-02 2002-03
Maharashtra Restriction on Restriction on Introduction of Set up a Board Introduction of Measures for Biggest IT park Special attention Setting up a filling up of creation of new Fiscal Respon- for Financial and a Bill for setting restructuring the inaugurated in for development Special Economicvacancies posts and filling sibility Bill to Managerial up a Board for power, irrigation the State. and Information Zone in Navioccuring due up of vacancies. contain the Restructuring. restructuring of and co-operative Technology and Mumbai, which isto retirement. Move towards a deficit at prudent Setting up of the State PSUs. sectors. Setting Biotechnology. likely to attractBorrowing to multi-year budg- level and to define an Expenditure Restructuring and up an independent Setting up a Task foreign investmentbe used for etary framework the sustainability Reform strengthening of Fiscal Advisory Force for the and promote investment for improving the of expenditure Committee. large and critical Board to advise development of industrial and purposes. predictability of the allocations. Proposal departments. on matters relating these sectors. service sector.
budgetary outlays. to initiate to implementationPreparation for reforms in of the fiscalintroduction of the budget responsibilityVAT. making process legislation.
through new disclosure normsand greatertransparency.
Manipur ARM through Reduction in Expenditure cont- Task force Emphasis on Steps for wind- Upgradation/ Emphasis on Proposes to ex-tax and cost expenditure ainment through constituted to extensive compu- ing up/downsizing improving the Information Tech- plore the poss-based user through down- measures include- assess revenue terisation of the various government social infra- nology Policy. ibilities of takingcharges prop- sizing the freeze on fresh collection efforts. operations pert- companies. structure part- Stress on Rural up projects withosed to improve government and appointment and Voluntary Retire- aining to treasuries icularly educat- Development. foreign assistance.the recovery austerity meas- rightsizing the ment Scheme and accounts ion, water supply Emphasis on efforts of State ures in various various depart- to be introduced. department. and health. completion of theFinancial Instit- departments. ments. Rationali- Functioning of ongoing Externallyutions. sation of tax rates PSUs to be Aided Projects toAll Schemes and structure of reviewed. bring in confidencesubject to user charges. of the fundingZero-Based Involvement of agencies.Budgeting grass root bodiesScrutiny. in developmental
activities and utilisation ofresourcesin most cost effectiveway. Stepsfor Medium Term Fiscal Reform Policy to evolve the road map for fiscalrestructuring.
Chart I: Major Policy Initiatives Proposed in State Budgets for 2000-01, 2001-02 and 2002-03
Fiscal Measures Institutional Measures Sectoral Measures
180
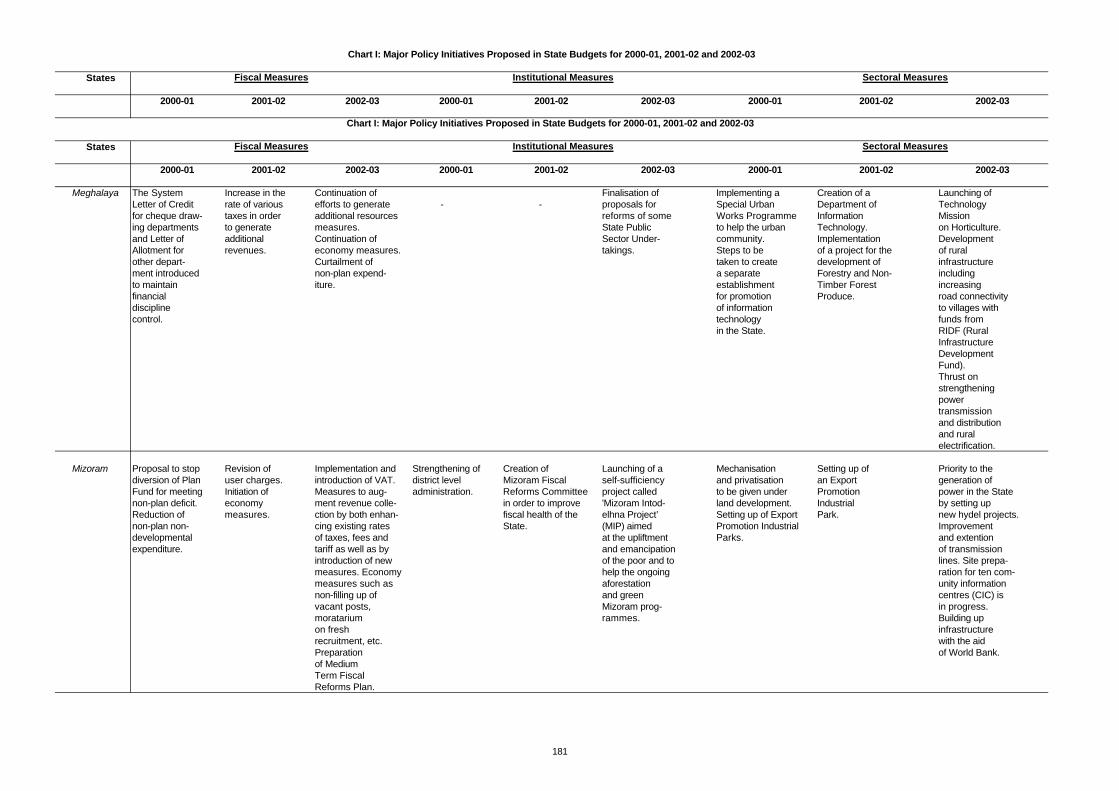
States
2000-01 2001-02 2002-03 2000-01 2001-02 2002-03 2000-01 2001-02 2002-03
Fiscal Measures Institutional Measures Sectoral Measures
Chart I: Major Policy Initiatives Proposed in State Budgets for 2000-01, 2001-02 and 2002-03
States
2000-01 2001-02 2002-03 2000-01 2001-02 2002-03 2000-01 2001-02 2002-03
Meghalaya The System Increase in the Continuation of Finalisation of Implementing a Creation of a Launching of Letter of Credit rate of various efforts to generate - - proposals for Special Urban Department of Technology for cheque draw- taxes in order additional resources reforms of some Works Programme Information Missioning departments to generate measures. State Public to help the urban Technology. on Horticulture.and Letter of additional Continuation of Sector Under- community. Implementation Development Allotment for revenues. economy measures. takings. Steps to be of a project for the of rural other depart- Curtailment of taken to create development of infrastructurement introduced non-plan expend- a separate Forestry and Non- includingto maintain iture. establishment Timber Forest increasingfinancial for promotion Produce. road connectivitydiscipline of information to villages withcontrol. technology funds from
in the State. RIDF (Rural InfrastructureDevelopment Fund).Thrust on strengthening powertransmission and distributionand ruralelectrification.
Mizoram Proposal to stop Revision of Implementation and Strengthening of Creation of Launching of a Mechanisation Setting up of Priority to thediversion of Plan user charges. introduction of VAT. district level Mizoram Fiscal self-sufficiency and privatisation an Export generation ofFund for meeting Initiation of Measures to aug- administration. Reforms Committee project called to be given under Promotion power in the Statenon-plan deficit. economy ment revenue colle- in order to improve 'Mizoram Intod- land development. Industrial by setting upReduction of measures. ction by both enhan- fiscal health of the elhna Project’ Setting up of Export Park. new hydel projects.non-plan non- cing existing rates State. (MIP) aimed Promotion Industrial Improvement developmental of taxes, fees and at the upliftment Parks. and extentionexpenditure. tariff as well as by and emancipation of transmission
introduction of new of the poor and to lines. Site prepa-measures. Economy help the ongoing ration for ten com-measures such as aforestation unity informationnon-filling up of and green centres (CIC) isvacant posts, Mizoram prog- in progress.moratarium rammes. Building upon fresh infrastructurerecruitment, etc. with the aidPreparation of World Bank.of Medium Term FiscalReforms Plan.
Chart I: Major Policy Initiatives Proposed in State Budgets for 2000-01, 2001-02 and 2002-03
Fiscal Measures Institutional Measures Sectoral Measures
181
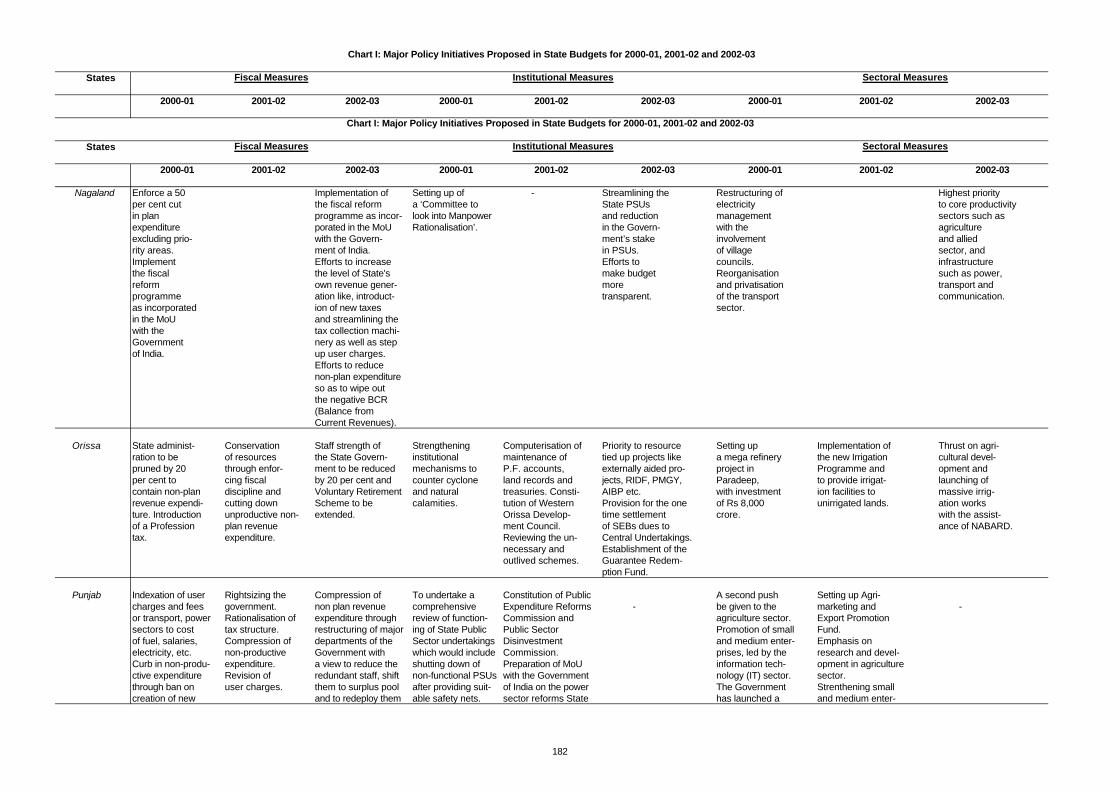
States
2000-01 2001-02 2002-03 2000-01 2001-02 2002-03 2000-01 2001-02 2002-03
Fiscal Measures Institutional Measures Sectoral Measures
Chart I: Major Policy Initiatives Proposed in State Budgets for 2000-01, 2001-02 and 2002-03
States
2000-01 2001-02 2002-03 2000-01 2001-02 2002-03 2000-01 2001-02 2002-03
Nagaland Enforce a 50 Implementation of Setting up of - Streamlining the Restructuring of Highest priority per cent cut the fiscal reform a ‘Committee to State PSUs electricity to core productivityin plan programme as incor- look into Manpower and reduction management sectors such asexpenditure porated in the MoU Rationalisation’. in the Govern- with the agricultureexcluding prio- with the Govern- ment’s stake involvement and alliedrity areas. ment of India. in PSUs. of village sector, andImplement Efforts to increase Efforts to councils. infrastructurethe fiscal the level of State's make budget Reorganisation such as power,reform own revenue gener- more and privatisation transport andprogramme ation like, introduct- transparent. of the transport communication.as incorporated ion of new taxes sector.in the MoU and streamlining thewith the tax collection machi-Government nery as well as stepof India. up user charges.
Efforts to reduce non-plan expenditureso as to wipe out the negative BCR (Balance from Current Revenues).
Orissa State administ- Conservation Staff strength of Strengthening Computerisation of Priority to resource Setting up Implementation of Thrust on agri-ration to be of resources the State Govern- institutional maintenance of tied up projects like a mega refinery the new Irrigation cultural devel-pruned by 20 through enfor- ment to be reduced mechanisms to P.F. accounts, externally aided pro- project in Programme and opment and per cent to cing fiscal by 20 per cent and counter cyclone land records and jects, RIDF, PMGY, Paradeep, to provide irrigat- launching ofcontain non-plan discipline and Voluntary Retirement and natural treasuries. Consti- AIBP etc. with investment ion facilities to massive irrig-revenue expendi- cutting down Scheme to be calamities. tution of Western Provision for the one of Rs 8,000 unirrigated lands. ation works ture. Introduction unproductive non- extended. Orissa Develop- time settlement crore. with the assist-of a Profession plan revenue ment Council. of SEBs dues to ance of NABARD.tax. expenditure. Reviewing the un- Central Undertakings.
necessary and Establishment of theoutlived schemes. Guarantee Redem-
ption Fund.
Punjab Indexation of user Rightsizing the Compression of To undertake a Constitution of Public A second push Setting up Agri-charges and fees government. non plan revenue comprehensive Expenditure Reforms - be given to the marketing and -or transport, power Rationalisation of expenditure through review of function- Commission and agriculture sector. Export Promotionsectors to cost tax structure. restructuring of major ing of State Public Public Sector Promotion of small Fund.of fuel, salaries, Compression of departments of the Sector undertakings Disinvestment and medium enter- Emphasis onelectricity, etc. non-productive Government with which would include Commission. prises, led by the research and devel-Curb in non-produ- expenditure. a view to reduce the shutting down of Preparation of MoU information tech- opment in agriculturective expenditure Revision of redundant staff, shift non-functional PSUs with the Government nology (IT) sector. sector.through ban on user charges. them to surplus pool after providing suit- of India on the power The Government Strenthening smallcreation of new and to redeploy them able safety nets. sector reforms State has launched a and medium enter-
Chart I: Major Policy Initiatives Proposed in State Budgets for 2000-01, 2001-02 and 2002-03
Fiscal Measures Institutional Measures Sectoral Measures
182
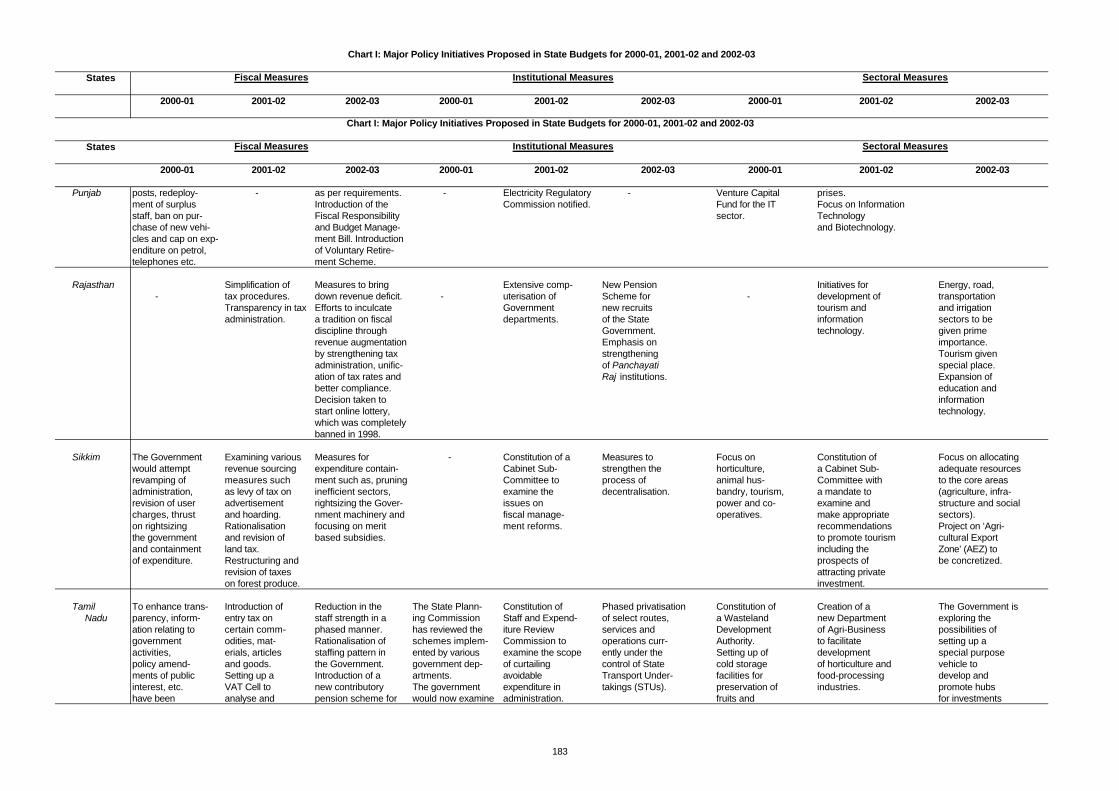
States
2000-01 2001-02 2002-03 2000-01 2001-02 2002-03 2000-01 2001-02 2002-03
Fiscal Measures Institutional Measures Sectoral Measures
Chart I: Major Policy Initiatives Proposed in State Budgets for 2000-01, 2001-02 and 2002-03
States
2000-01 2001-02 2002-03 2000-01 2001-02 2002-03 2000-01 2001-02 2002-03
Punjab posts, redeploy- - as per requirements. - Electricity Regulatory - Venture Capital prises. ment of surplus Introduction of the Commission notified. Fund for the IT Focus on Informationstaff, ban on pur- Fiscal Responsibility sector. Technologychase of new vehi- and Budget Manage- and Biotechnology.cles and cap on exp- ment Bill. Introductionenditure on petrol, of Voluntary Retire-telephones etc. ment Scheme.
Rajasthan Simplification of Measures to bring Extensive comp- New Pension Initiatives for Energy, road, - tax procedures. down revenue deficit. - uterisation of Scheme for - development of transportation
Transparency in tax Efforts to inculcate Government new recruits tourism and and irrigationadministration. a tradition on fiscal departments. of the State information sectors to be
discipline through Government. technology. given primerevenue augmentation Emphasis on importance.by strengthening tax strengthening Tourism givenadministration, unific- of Panchayati special place.ation of tax rates and Raj institutions. Expansion ofbetter compliance. education andDecision taken to informationstart online lottery, technology.which was completelybanned in 1998.
Sikkim The Government Examining various Measures for - Constitution of a Measures to Focus on Constitution of Focus on allocatingwould attempt revenue sourcing expenditure contain- Cabinet Sub- strengthen the horticulture, a Cabinet Sub- adequate resourcesrevamping of measures such ment such as, pruning Committee to process of animal hus- Committee with to the core areasadministration, as levy of tax on inefficient sectors, examine the decentralisation. bandry, tourism, a mandate to (agriculture, infra-revision of user advertisement rightsizing the Gover- issues on power and co- examine and structure and socialcharges, thrust and hoarding. nment machinery and fiscal manage- operatives. make appropriate sectors).on rightsizing Rationalisation focusing on merit ment reforms. recommendations Project on ‘Agri-the government and revision of based subsidies. to promote tourism cultural Exportand containment land tax. including the Zone’ (AEZ) toof expenditure. Restructuring and prospects of be concretized.
revision of taxes attracting privateon forest produce. investment.
Tamil To enhance trans- Introduction of Reduction in the The State Plann- Constitution of Phased privatisation Constitution of Creation of a The Government is Nadu parency, inform- entry tax on staff strength in a ing Commission Staff and Expend- of select routes, a Wasteland new Department exploring the
ation relating to certain comm- phased manner. has reviewed the iture Review services and Development of Agri-Business possibilities of government odities, mat- Rationalisation of schemes implem- Commission to operations curr- Authority. to facilitate setting up a activities, erials, articles staffing pattern in ented by various examine the scope ently under the Setting up of development special purposepolicy amend- and goods. the Government. government dep- of curtailing control of State cold storage of horticulture and vehicle toments of public Setting up a Introduction of a artments. avoidable Transport Under- facilities for food-processing develop andinterest, etc. VAT Cell to new contributory The government expenditure in takings (STUs). preservation of industries. promote hubshave been analyse and pension scheme for would now examine administration. fruits and for investments
Chart I: Major Policy Initiatives Proposed in State Budgets for 2000-01, 2001-02 and 2002-03
Fiscal Measures Institutional Measures Sectoral Measures
183

States
2000-01 2001-02 2002-03 2000-01 2001-02 2002-03 2000-01 2001-02 2002-03
Fiscal Measures Institutional Measures Sectoral Measures
Chart I: Major Policy Initiatives Proposed in State Budgets for 2000-01, 2001-02 and 2002-03
States
2000-01 2001-02 2002-03 2000-01 2001-02 2002-03 2000-01 2001-02 2002-03
Tamil Nadu posted on process various all employees recrui- the recommen- vegetables. in IT-enabledthe website. aspects of VAT. ted from Dec 1, dations of the Setting up of services.
2001, similar to the State industrial, Focus on infra-one being formulated Planning garment, bio- structure develop-by the Union Commission. technology ment and levyGovernment. and floriculture on infrastructureUnder the VAT sys- parks. surcharge of 5tem, the number of Separate depart- per cent ontax rates would be ment has been sales tax paidonly three, apart from set up for under the TNGSTa list of exempted youth welfare Act, on all itemsgoods and also com- and sports devel- except rice, wheat, modities which would opment. kerosene, LPGbe outside the pur- and declaredview of VAT and the goods.set-off principle.Zero-based budget-ing in all administra-tive departments soas to transfer and re-locate resources fromuproductive schemesto productive ones.
Tripura Enhancement in Preparation for Efforts towards Tripura Industrial Setting up State Signing of a MoU To set up an Formulation of a power tariff, introduction of expenditure Development Electricity Regul- with the Ministry Infrastructure 10-year perspective -leading to 30 VAT. containment and Authority is being atory Commission. of Power is in its Development plan for the develop-per cent increase Widening the revenue aug- made functional Commission to final stage and acc- Fund with a ment of horticulture.in revenues of tax base. mentation. to promote examine the scope ordingly formation corpus of the department. Strict monitoring industrialisation. of curtailing avoid- of the State Electri- Rs 10 crore.
of the non-plan able expenditure city Regulatory revenue in administration. Commission is underexpenditure. consideration.
Uttaranchal Rationalisation of Setting up High- Formulation of an - taxes and - - level Toursim - - industrial policy. -
user charges. Development Preparation of draftCouncil. for information Setting up State technology Finance policy.Commission. Conservation and
management offorests throughpanchayats.
Chart I: Major Policy Initiatives Proposed in State Budgets for 2000-01, 2001-02 and 2002-03
Fiscal Measures Institutional Measures Sectoral Measures
184
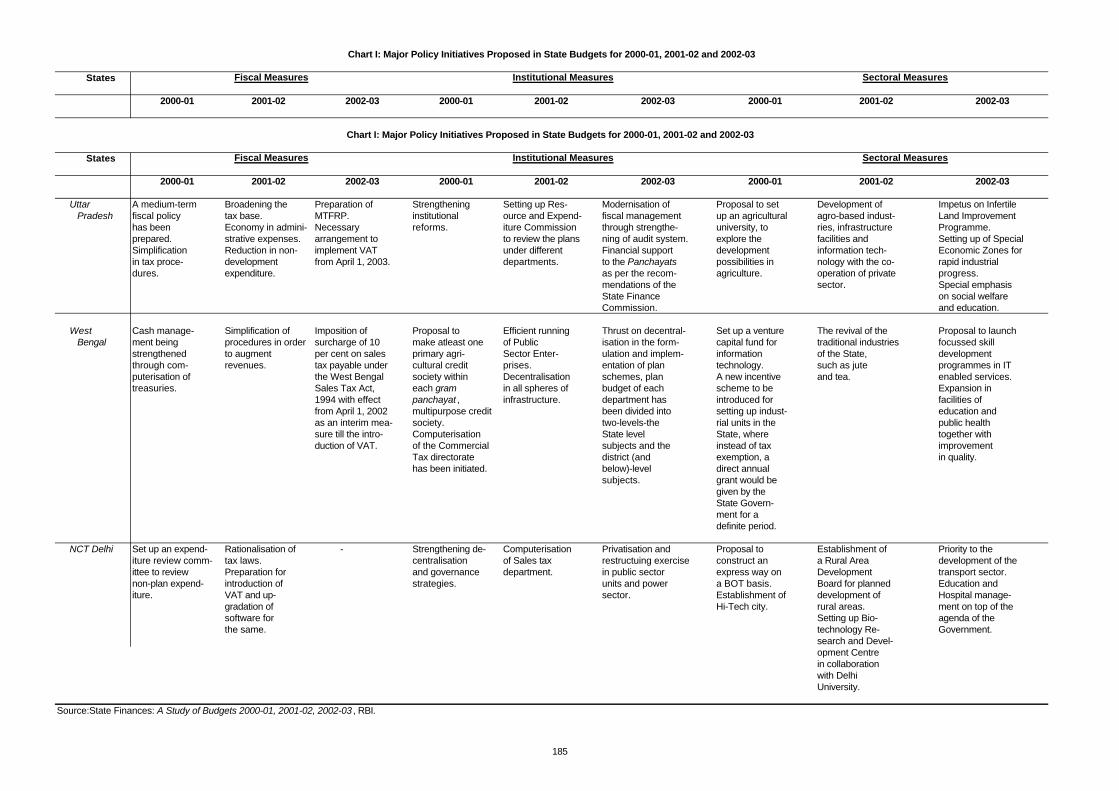
States
2000-01 2001-02 2002-03 2000-01 2001-02 2002-03 2000-01 2001-02 2002-03
Fiscal Measures Institutional Measures Sectoral Measures
Chart I: Major Policy Initiatives Proposed in State Budgets for 2000-01, 2001-02 and 2002-03
States
2000-01 2001-02 2002-03 2000-01 2001-02 2002-03 2000-01 2001-02 2002-03
Uttar A medium-term Broadening the Preparation of Strengthening Setting up Res- Modernisation of Proposal to set Development of Impetus on Infertile Pradesh fiscal policy tax base. MTFRP. institutional ource and Expend- fiscal management up an agricultural agro-based indust- Land Improvement
has been Economy in admini- Necessary reforms. iture Commission through strengthe- university, to ries, infrastructure Programme.prepared. strative expenses. arrangement to to review the plans ning of audit system. explore the facilities and Setting up of SpecialSimplification Reduction in non- implement VAT under different Financial support development information tech- Economic Zones forin tax proce- development from April 1, 2003. departments. to the Panchayats possibilities in nology with the co- rapid industrial dures. expenditure. as per the recom- agriculture. operation of private progress.
mendations of the sector. Special emphasisState Finance on social welfareCommission. and education.
West Cash manage- Simplification of Imposition of Proposal to Efficient running Thrust on decentral- Set up a venture The revival of the Proposal to launch Bengal ment being procedures in order surcharge of 10 make atleast one of Public isation in the form- capital fund for traditional industries focussed skill
strengthened to augment per cent on sales primary agri- Sector Enter- ulation and implem- information of the State, developmentthrough com- revenues. tax payable under cultural credit prises. entation of plan technology. such as jute programmes in ITputerisation of the West Bengal society within Decentralisation schemes, plan A new incentive and tea. enabled services.treasuries. Sales Tax Act, each gram in all spheres of budget of each scheme to be Expansion in
1994 with effect panchayat , infrastructure. department has introduced for facilities offrom April 1, 2002 multipurpose credit been divided into setting up indust- education andas an interim mea- society. two-levels-the rial units in the public healthsure till the intro- Computerisation State level State, where together withduction of VAT. of the Commercial subjects and the instead of tax improvement
Tax directorate district (and exemption, a in quality.has been initiated. below)-level direct annual
subjects. grant would begiven by the State Govern-ment for adefinite period.
NCT Delhi Set up an expend- Rationalisation of - Strengthening de- Computerisation Privatisation and Proposal to Establishment of Priority to the iture review comm- tax laws. centralisation of Sales tax restructuing exercise construct an a Rural Area development of the ittee to review Preparation for and governance department. in public sector express way on Development transport sector.non-plan expend- introduction of strategies. units and power a BOT basis. Board for planned Education and iture. VAT and up- sector. Establishment of development of Hospital manage-
gradation of Hi-Tech city. rural areas. ment on top of the software for Setting up Bio- agenda of the the same. technology Re- Government.
search and Devel-opment Centrein collaborationwith DelhiUniversity.
Source:State Finances: A Study of Budgets 2000-01, 2001-02, 2002-03 , RBI.
Chart I: Major Policy Initiatives Proposed in State Budgets for 2000-01, 2001-02 and 2002-03
Fiscal Measures Institutional Measures Sectoral Measures
185
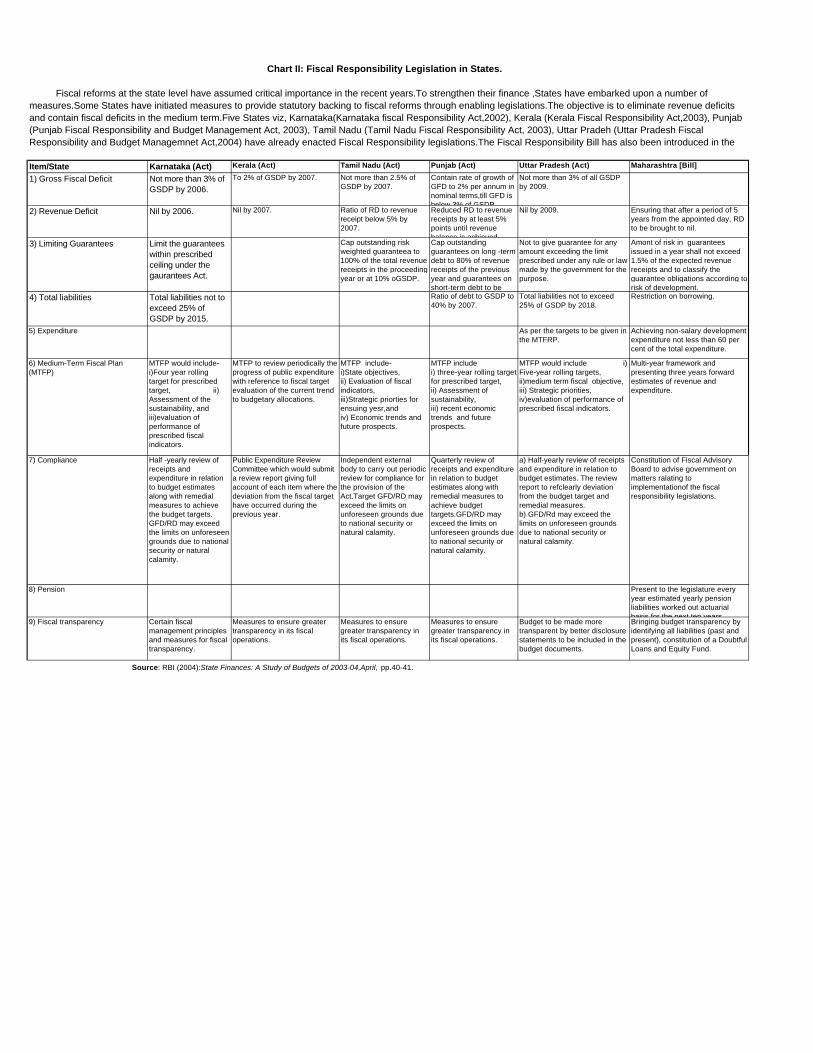
Chart II: Fiscal Responsibility Legislation in States.
Item/State Karnataka (Act) Kerala (Act) Tamil Nadu (Act) Punjab (Act) Uttar Pradesh (Act) Maharashtra [Bill]
1) Gross Fiscal Deficit Not more than 3% of GSDP by 2006.
To 2% of GSDP by 2007. Not more than 2.5% of GSDP by 2007.
Contain rate of growth of GFD to 2% per annum in nominal terms,till GFD is below 3% of GSDP.
Not more than 3% of all GSDP by 2009.
2) Revenue Deficit Nil by 2006. Nil by 2007. Ratio of RD to revenue receipt below 5% by 2007.
Reduced RD to revenue receipts by at least 5% points until revenue balance is achieved.
Nil by 2009. Ensuring that after a period of 5 years from the appointed day, RD to be brought to nil.
3) Limiting Guarantees Limit the guarantees within prescribed ceiling under the gaurantees Act.
Cap outstanding risk weighted guaranteea to 100% of the total revenue receipts in the proceeding year or at 10% oGSDP.
Cap outstanding guarantees on long -term debt to 80% of revenue receipts of the previous year and guarantees on short-term debt to be
Not to give guarantee for any amount exceeding the limit prescribed under any rule or law made by the government for the purpose.
Amont of risk in guarantees issued in a year shall not exceed 1.5% of the expected revenue receipts and to classify the guarantee obligations according to risk of development.
4) Total liabilities Total liabilities not to exceed 25% of GSDP by 2015.
Ratio of debt to GSDP to 40% by 2007.
Total liabilities not to exceed 25% of GSDP by 2018.
Restriction on borrowing.
5) Expenditure As per the targets to be given in the MTFRP.
Achieving non-salary development expenditure not less than 60 per cent of the total expenditure.
6) Medium-Term Fiscal Plan (MTFP)
MTFP would include- i)Four year rolling target for prescribed target, ii) Assessment of the sustainability, and iii)evaluation of performance of prescribed fiscal indicators.
MTFP to review periodically the progress of public expenditure with reference to fiscal target evaluation of the current trend to budgetary allocations.
MTFP include- i)State objectives, ii) Evaluation of fiscal indicators, iii)Strategic priorties for ensuing yesr,and iv) Economic trends and future prospects.
MTFP include i) three-year rolling target for prescribed target, ii) Assessment of sustainability, iii) recent economic trends and future prospects.
MTFP would include i) Five-year rolling targets, ii)medium term fiscal objective, iii) Strategic priorities, iv)evaluation of performance of prescribed fiscal indicators.
Multi-year framework and presenting three years forward estimates of revenue and expenditure.
7) Compliance Half -yearly review of receipts and expenditure in relation to budget estimates along with remedial measures to achieve the budget targets. GFD/RD may exceed the limits on unforeseen grounds due to national security or natural calamity.
Public Expenditure Review Committee which would submit a review report giving full account of each item where the deviation from the fiscal target have occurred during the previous year.
Independent external body to carry out periodic review for compliance for the provision of the Act.Target GFD/RD may exceed the limits on unforeseen grounds due to national security or natural calamity.
Quarterly review of receipts and expenditure in relation to budget estimates along with remedial measures to achieve budget targets.GFD/RD may exceed the limits on unforeseen grounds due to national security or natural calamity.
a) Half-yearly review of receipts and expenditure in relation to budget estimates. The review report to refclearly deviation from the budget target and remedial measures. b) GFD/Rd may exceed the limits on unforeseen grounds due to national security or natural calamity.
Constitution of Fiscal Advisory Board to advise government on matters ralating to implementationof the fiscal responsibility legislations.
8) Pension Present to the legislature every year estimated yearly pension liabilities worked out actuarial basis for the next ten years.
9) Fiscal transparency Certain fiscal management principles and measures for fiscal transparency.
Measures to ensure greater transparency in its fiscal operations.
Measures to ensure greater transparency in its fiscal operations.
Measures to ensure greater transparency in its fiscal operations.
Budget to be made more transparent by better disclosure statements to be included in the budget documents.
Bringing budget transparency by identifying all liabilities (past and present), constitution of a Doubtful Loans and Equity Fund.
Fiscal reforms at the state level have assumed critical importance in the recent years.To strengthen their finance ,States have embarked upon a number of measures.Some States have initiated measures to provide statutory backing to fiscal reforms through enabling legislations.The objective is to eliminate revenue deficits and contain fiscal deficits in the medium term.Five States viz, Karnataka(Karnataka fiscal Responsibility Act,2002), Kerala (Kerala Fiscal Responsibility Act,2003), Punjab (Punjab Fiscal Responsibility and Budget Management Act, 2003), Tamil Nadu (Tamil Nadu Fiscal Responsibility Act, 2003), Uttar Pradeh (Uttar Pradesh Fiscal Responsibility and Budget Managemnet Act,2004) have already enacted Fiscal Responsibility legislations.The Fiscal Responsibility Bill has also been introduced in the
Source: RBI (2004):State Finances: A Study of Budgets of 2003-04,April, pp.40-41.
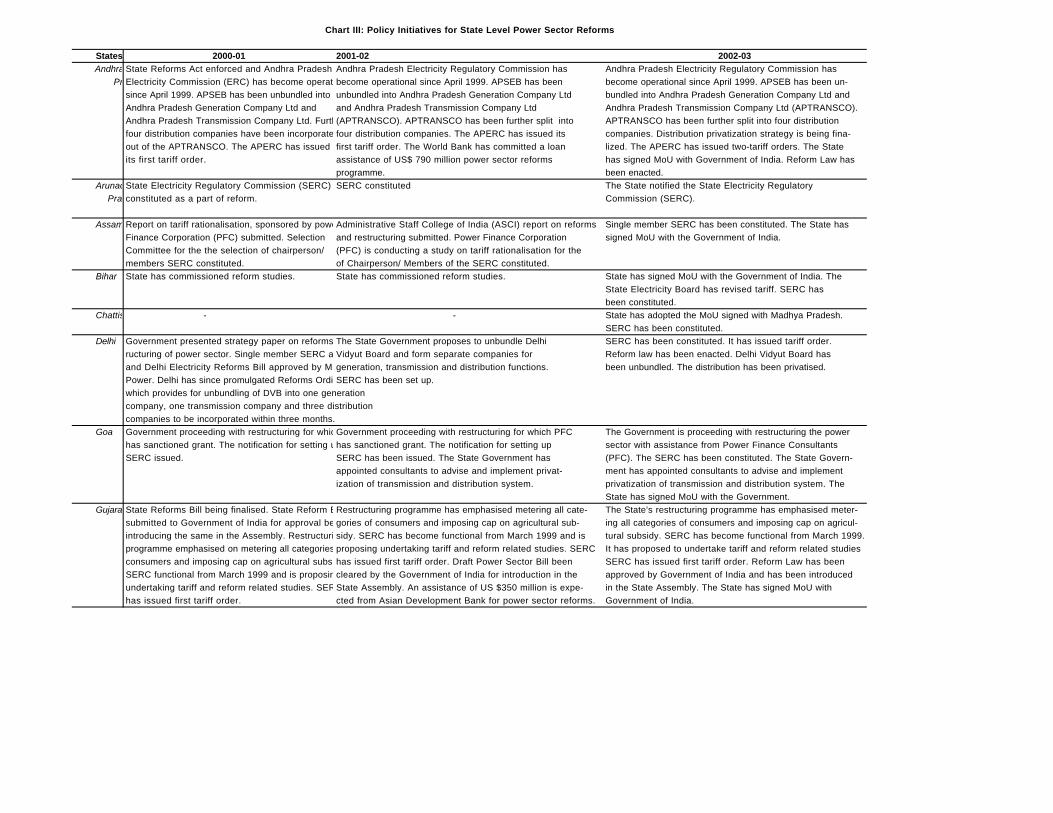
States 2000-01 2001-02 2002-03 Andhra State Reforms Act enforced and Andhra Pradesh Andhra Pradesh Electricity Regulatory Commission has Andhra Pradesh Electricity Regulatory Commission has
PradeshElectricity Commission (ERC) has become operationalbecome operational since April 1999. APSEB has been become operational since April 1999. APSEB has been un-
since April 1999. APSEB has been unbundled into unbundled into Andhra Pradesh Generation Company Ltd bundled into Andhra Pradesh Generation Company Ltd and
Andhra Pradesh Generation Company Ltd and and Andhra Pradesh Transmission Company Ltd Andhra Pradesh Transmission Company Ltd (APTRANSCO).
Andhra Pradesh Transmission Company Ltd. Further(APTRANSCO). APTRANSCO has been further split into APTRANSCO has been further split into four distribution
four distribution companies have been incorporatedfour distribution companies. The APERC has issued its companies. Distribution privatization strategy is being fina-
out of the APTRANSCO. The APERC has issued first tariff order. The World Bank has committed a loan lized. The APERC has issued two-tariff orders. The State
its first tariff order. assistance of US$ 790 million power sector reforms has signed MoU with Government of India. Reform Law has
programme. been enacted.
Arunachal State Electricity Regulatory Commission (SERC) SERC constituted The State notified the State Electricity Regulatory
Pradeshconstituted as a part of reform. Commission (SERC).
Assam Report on tariff rationalisation, sponsored by powerAdministrative Staff College of India (ASCI) report on reforms Single member SERC has been constituted. The State has
Finance Corporation (PFC) submitted. Selection and restructuring submitted. Power Finance Corporation signed MoU with the Government of India.
Committee for the the selection of chairperson/ (PFC) is conducting a study on tariff rationalisation for the
members SERC constituted. of Chairperson/ Members of the SERC constituted.
Bihar State has commissioned reform studies. State has commissioned reform studies. State has signed MoU with the Government of India. The
State Electricity Board has revised tariff. SERC has
been constituted.
Chattisgarh - - State has adopted the MoU signed with Madhya Pradesh.
SERC has been constituted.
Delhi Government presented strategy paper on reforms and rest-The State Government proposes to unbundle Delhi SERC has been constituted. It has issued tariff order.
ructuring of power sector. Single member SERC appointedVidyut Board and form separate companies for Reform law has been enacted. Delhi Vidyut Board has
and Delhi Electricity Reforms Bill approved by Ministry of generation, transmission and distribution functions. been unbundled. The distribution has been privatised.
Power. Delhi has since promulgated Reforms Ordinance SERC has been set up.
which provides for unbundling of DVB into one generation
company, one transmission company and three distribution
companies to be incorporated within three months.
Goa Government proceeding with restructuring for which PFC Government proceeding with restructuring for which PFC The Government is proceeding with restructuring the power
has sanctioned grant. The notification for setting uphas sanctioned grant. The notification for setting up sector with assistance from Power Finance Consultants
SERC issued. SERC has been issued. The State Government has (PFC). The SERC has been constituted. The State Govern-
appointed consultants to advise and implement privat- ment has appointed consultants to advise and implement
ization of transmission and distribution system. privatization of transmission and distribution system. The
State has signed MoU with the Government.
GujaratState Reforms Bill being finalised. State Reform Bill Restructuring programme has emphasised metering all cate- The State’s restructuring programme has emphasised meter-
submitted to Government of India for approval beforegories of consumers and imposing cap on agricultural sub- ing all categories of consumers and imposing cap on agricul-
introducing the same in the Assembly. Restructuring sidy. SERC has become functional from March 1999 and is tural subsidy. SERC has become functional from March 1999.
programme emphasised on metering all categories ofproposing undertaking tariff and reform related studies. SERC It has proposed to undertake tariff and reform related studies
consumers and imposing cap on agricultural subsidy. has issued first tariff order. Draft Power Sector Bill been SERC has issued first tariff order. Reform Law has been
SERC functional from March 1999 and is proposingcleared by the Government of India for introduction in the approved by Government of India and has been introduced
undertaking tariff and reform related studies. SERCState Assembly. An assistance of US $350 million is expe- in the State Assembly. The State has signed MoU with
has issued first tariff order. cted from Asian Development Bank for power sector reforms. Government of India.
Chart III: Policy Initiatives for State Level Power Sector Reforms
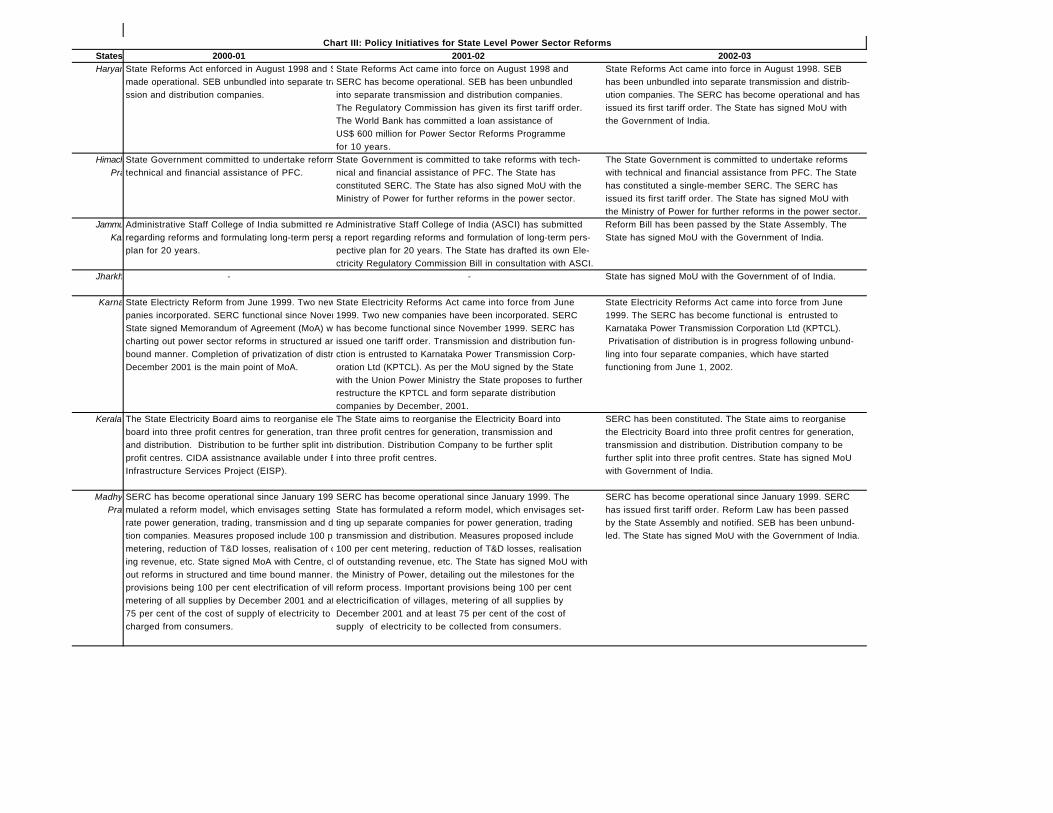
States 2000-01 2001-02 2002-03 HaryanaState Reforms Act enforced in August 1998 and SERCState Reforms Act came into force on August 1998 and State Reforms Act came into force in August 1998. SEB
made operational. SEB unbundled into separate transmi-SERC has become operational. SEB has been unbundled has been unbundled into separate transmission and distrib-
ssion and distribution companies. into separate transmission and distribution companies. ution companies. The SERC has become operational and has
The Regulatory Commission has given its first tariff order. issued its first tariff order. The State has signed MoU with
The World Bank has committed a loan assistance of the Government of India.
US$ 600 million for Power Sector Reforms Programme
for 10 years.
Himachal State Government committed to undertake reforms withState Government is committed to take reforms with tech- The State Government is committed to undertake reforms
Pradeshtechnical and financial assistance of PFC. nical and financial assistance of PFC. The State has with technical and financial assistance from PFC. The State
constituted SERC. The State has also signed MoU with the has constituted a single-member SERC. The SERC has
Ministry of Power for further reforms in the power sector. issued its first tariff order. The State has signed MoU with
the Ministry of Power for further reforms in the power sector.
Jammu andAdministrative Staff College of India submitted reportAdministrative Staff College of India (ASCI) has submitted Reform Bill has been passed by the State Assembly. The
Kasmirregarding reforms and formulating long-term perspective a report regarding reforms and formulation of long-term pers- State has signed MoU with the Government of India.
plan for 20 years. pective plan for 20 years. The State has drafted its own Ele-
ctricity Regulatory Commission Bill in consultation with ASCI.
Jharkhand - - State has signed MoU with the Government of of India.
KarnatakaState Electricty Reform from June 1999. Two new com-State Electricity Reforms Act came into force from June State Electricity Reforms Act came into force from June
panies incorporated. SERC functional since November 1999.1999. Two new companies have been incorporated. SERC 1999. The SERC has become functional is entrusted to
State signed Memorandum of Agreement (MoA) with Centre, has become functional since November 1999. SERC has Karnataka Power Transmission Corporation Ltd (KPTCL).
charting out power sector reforms in structured and timeissued one tariff order. Transmission and distribution fun- Privatisation of distribution is in progress following unbund-
bound manner. Completion of privatization of distribution byction is entrusted to Karnataka Power Transmission Corp- ling into four separate companies, which have started
December 2001 is the main point of MoA. oration Ltd (KPTCL). As per the MoU signed by the State functioning from June 1, 2002.
with the Union Power Ministry the State proposes to further
restructure the KPTCL and form separate distribution
companies by December, 2001.
Kerala The State Electricity Board aims to reorganise electricityThe State aims to reorganise the Electricity Board into SERC has been constituted. The State aims to reorganise
board into three profit centres for generation, transmissionthree profit centres for generation, transmission and the Electricity Board into three profit centres for generation,
and distribution. Distribution to be further split into threedistribution. Distribution Company to be further split transmission and distribution. Distribution company to be
profit centres. CIDA assistnance available under Energyinto three profit centres. further split into three profit centres. State has signed MoU
Infrastructure Services Project (EISP). with Government of India.
Madhya SERC has become operational since January 1999. For-SERC has become operational since January 1999. The SERC has become operational since January 1999. SERC
Pradeshmulated a reform model, which envisages setting up sepa-State has formulated a reform model, which envisages set- has issued first tariff order. Reform Law has been passed
rate power generation, trading, transmission and distribu-ting up separate companies for power generation, trading by the State Assembly and notified. SEB has been unbund-
tion companies. Measures proposed include 100 per centtransmission and distribution. Measures proposed include led. The State has signed MoU with the Government of India.
metering, reduction of T&D losses, realisation of outstand-100 per cent metering, reduction of T&D losses, realisation
ing revenue, etc. State signed MoA with Centre, charting of outstanding revenue, etc. The State has signed MoU with
out reforms in structured and time bound manner. Importantthe Ministry of Power, detailing out the milestones for the
provisions being 100 per cent electrification of villages, reform process. Important provisions being 100 per cent
metering of all supplies by December 2001 and at leastelectricification of villages, metering of all supplies by
75 per cent of the cost of supply of electricity to beDecember 2001 and at least 75 per cent of the cost of
charged from consumers. supply of electricity to be collected from consumers.
Chart III: Policy Initiatives for State Level Power Sector Reforms
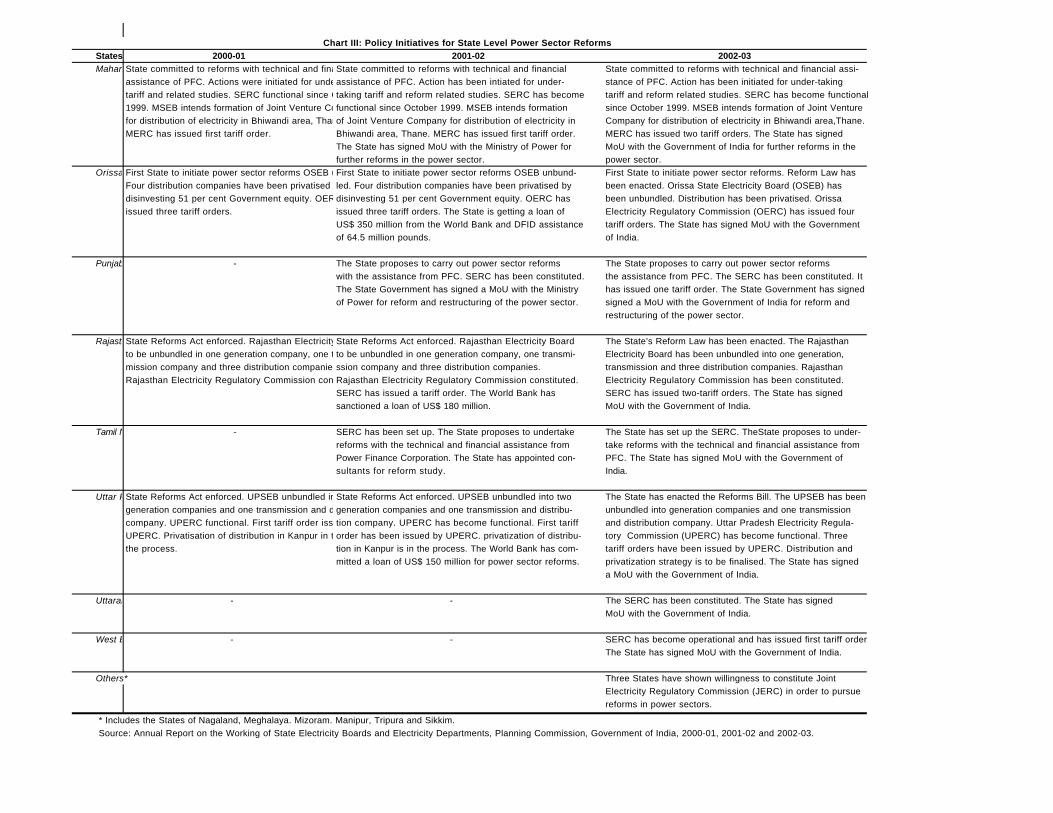
States 2000-01 2001-02 2002-03 MaharashtraState committed to reforms with technical and financialState committed to reforms with technical and financial State committed to reforms with technical and financial assi-
assistance of PFC. Actions were initiated for undertakingassistance of PFC. Action has been intiated for under- stance of PFC. Action has been initiated for under-taking
tariff and related studies. SERC functional since Octobertaking tariff and reform related studies. SERC has become tariff and reform related studies. SERC has become functional
1999. MSEB intends formation of Joint Venture Companyfunctional since October 1999. MSEB intends formation since October 1999. MSEB intends formation of Joint Venture
for distribution of electricity in Bhiwandi area, Thane. of Joint Venture Company for distribution of electricity in Company for distribution of electricity in Bhiwandi area,Thane.
MERC has issued first tariff order. Bhiwandi area, Thane. MERC has issued first tariff order. MERC has issued two tariff orders. The State has signed
The State has signed MoU with the Ministry of Power for MoU with the Government of India for further reforms in the
further reforms in the power sector. power sector.
Orissa First State to initiate power sector reforms OSEB unbundledFirst State to initiate power sector reforms OSEB unbund- First State to initiate power sector reforms. Reform Law has
Four distribution companies have been privatised byled. Four distribution companies have been privatised by been enacted. Orissa State Electricity Board (OSEB) has
disinvesting 51 per cent Government equity. OERC has disinvesting 51 per cent Government equity. OERC has been unbundled. Distribution has been privatised. Orissa
issued three tariff orders. issued three tariff orders. The State is getting a loan of Electricity Regulatory Commission (OERC) has issued four
US$ 350 million from the World Bank and DFID assistance tariff orders. The State has signed MoU with the Government
of 64.5 million pounds. of India.
Punjab - The State proposes to carry out power sector reforms The State proposes to carry out power sector reforms
with the assistance from PFC. SERC has been constituted. the assistance from PFC. The SERC has been constituted. It
The State Government has signed a MoU with the Ministry has issued one tariff order. The State Government has signed
of Power for reform and restructuring of the power sector. signed a MoU with the Government of India for reform and
restructuring of the power sector.
RajasthanState Reforms Act enforced. Rajasthan Electricity BoardState Reforms Act enforced. Rajasthan Electricity Board The State’s Reform Law has been enacted. The Rajasthan
to be unbundled in one generation company, one trans-to be unbundled in one generation company, one transmi- Electricity Board has been unbundled into one generation,
mission company and three distribution companies. ssion company and three distribution companies. transmission and three distribution companies. Rajasthan
Rajasthan Electricity Regulatory Commission constituted.Rajasthan Electricity Regulatory Commission constituted. Electricity Regulatory Commission has been constituted.
SERC has issued a tariff order. The World Bank has SERC has issued two-tariff orders. The State has signed
sanctioned a loan of US$ 180 million. MoU with the Government of India.
Tamil Nadu - SERC has been set up. The State proposes to undertake The State has set up the SERC. TheState proposes to under-
reforms with the technical and financial assistance from take reforms with the technical and financial assistance from
Power Finance Corporation. The State has appointed con- PFC. The State has signed MoU with the Government of
sultants for reform study. India.
Uttar PradeshState Reforms Act enforced. UPSEB unbundled into twoState Reforms Act enforced. UPSEB unbundled into two The State has enacted the Reforms Bill. The UPSEB has been
generation companies and one transmission and distributiongeneration companies and one transmission and distribu- unbundled into generation companies and one transmission
company. UPERC functional. First tariff order issued bytion company. UPERC has become functional. First tariff and distribution company. Uttar Pradesh Electricity Regula-
UPERC. Privatisation of distribution in Kanpur in theorder has been issued by UPERC. privatization of distribu- tory Commission (UPERC) has become functional. Three
the process. tion in Kanpur is in the process. The World Bank has com- tariff orders have been issued by UPERC. Distribution and
mitted a loan of US$ 150 million for power sector reforms. privatization strategy is to be finalised. The State has signed
a MoU with the Government of India.
Uttaranchal - - The SERC has been constituted. The State has signed
MoU with the Government of India.
West Bengal - - SERC has become operational and has issued first tariff order.
The State has signed MoU with the Government of India.
Others* Three States have shown willingness to constitute Joint
Electricity Regulatory Commission (JERC) in order to pursue
reforms in power sectors.
* Includes the States of Nagaland, Meghalaya. Mizoram. Manipur, Tripura and Sikkim.
Source: Annual Report on the Working of State Electricity Boards and Electricity Departments, Planning Commission, Government of India, 2000-01, 2001-02 and 2002-03.
Chart III: Policy Initiatives for State Level Power Sector Reforms
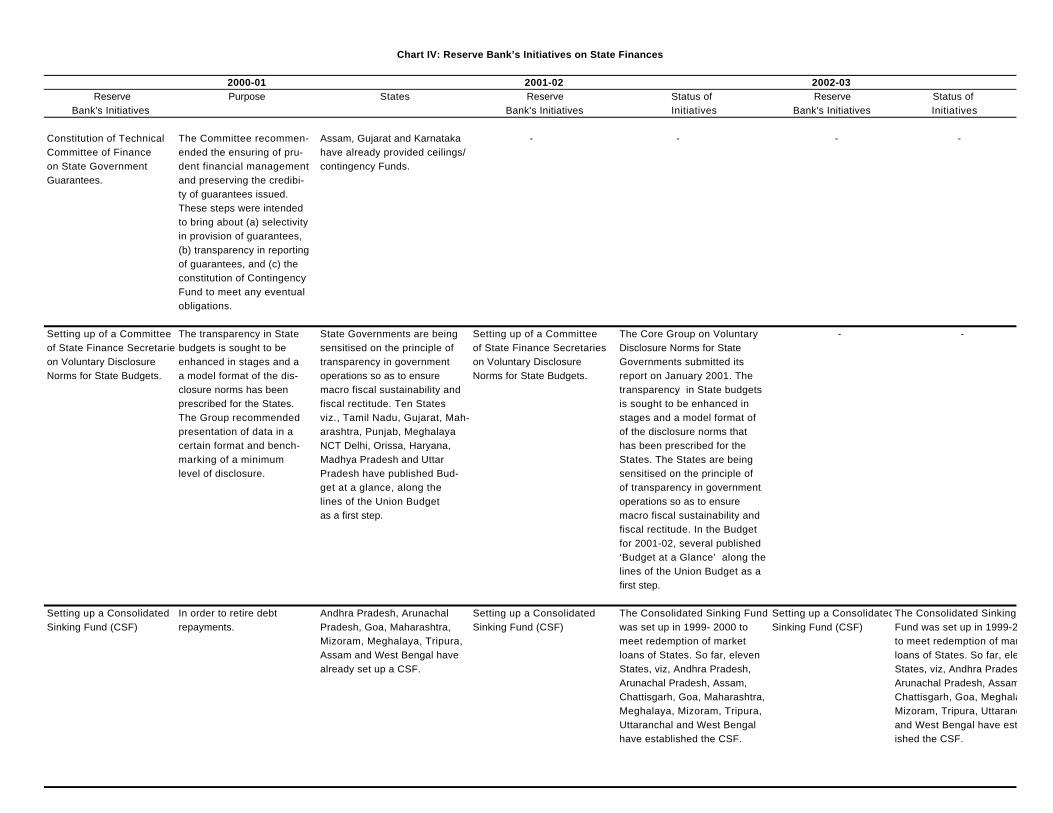
2000-01 2001-02 2002-03 Reserve Purpose States Reserve Status of Reserve Status of
Bank's Initiatives Bank's Initiatives Initiatives Bank's Initiatives Initiatives
Constitution of Technical The Committee recommen- Assam, Gujarat and Karnataka - - - -Committee of Finance ended the ensuring of pru- have already provided ceilings/on State Government dent financial management contingency Funds.Guarantees. and preserving the credibi-
ty of guarantees issued.These steps were intended to bring about (a) selectivityin provision of guarantees, (b) transparency in reporting of guarantees, and (c) the constitution of ContingencyFund to meet any eventualobligations.
Setting up of a Committee The transparency in State State Governments are being Setting up of a Committee The Core Group on Voluntary - -of State Finance Secretariesbudgets is sought to be sensitised on the principle of of State Finance Secretaries Disclosure Norms for State on Voluntary Disclosure enhanced in stages and a transparency in government on Voluntary Disclosure Governments submitted itsNorms for State Budgets. a model format of the dis- operations so as to ensure Norms for State Budgets. report on January 2001. The
closure norms has been macro fiscal sustainability and transparency in State budgetsprescribed for the States. fiscal rectitude. Ten States is sought to be enhanced inThe Group recommended viz., Tamil Nadu, Gujarat, Mah- stages and a model format of presentation of data in a arashtra, Punjab, Meghalaya of the disclosure norms that certain format and bench- NCT Delhi, Orissa, Haryana, has been prescribed for themarking of a minimum Madhya Pradesh and Uttar States. The States are being level of disclosure. Pradesh have published Bud- sensitised on the principle of
get at a glance, along the of transparency in governmentlines of the Union Budget operations so as to ensure as a first step. macro fiscal sustainability and
fiscal rectitude. In the Budgetfor 2001-02, several published‘Budget at a Glance’ along the lines of the Union Budget as afirst step.
Setting up a Consolidated In order to retire debt Andhra Pradesh, Arunachal Setting up a Consolidated The Consolidated Sinking Fund Setting up a ConsolidatedThe Consolidated SinkingSinking Fund (CSF) repayments. Pradesh, Goa, Maharashtra, Sinking Fund (CSF) was set up in 1999- 2000 to Sinking Fund (CSF) Fund was set up in 1999-2000
Mizoram, Meghalaya, Tripura, meet redemption of market to meet redemption of marketAssam and West Bengal have loans of States. So far, eleven loans of States. So far, elevenalready set up a CSF. States, viz, Andhra Pradesh, States, viz, Andhra Pradesh,
Arunachal Pradesh, Assam, Arunachal Pradesh, Assam, Chattisgarh, Goa, Maharashtra, Chattisgarh, Goa, Meghalaya, Meghalaya, Mizoram, Tripura, Mizoram, Tripura, UttaranchalUttaranchal and West Bengal and West Bengal have establ-have established the CSF. ished the CSF.
Chart IV: Reserve Bank’s Initiatives on State Finances
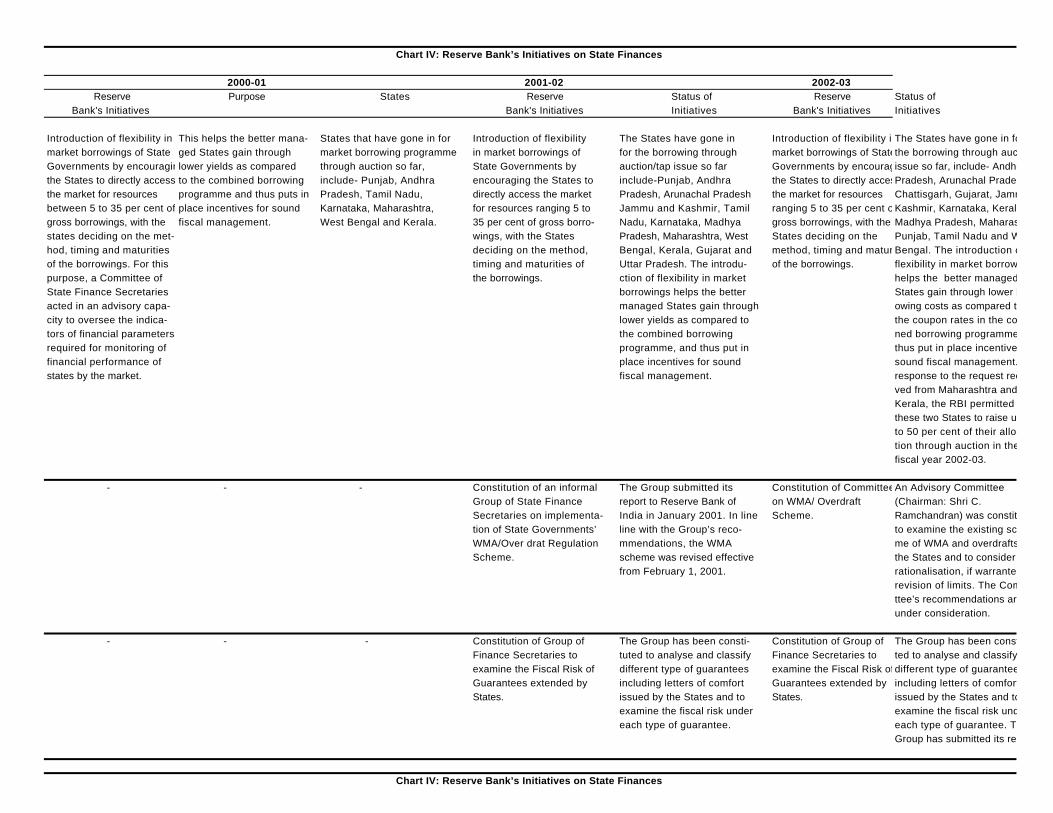
2000-01 2001-02 2002-03 Reserve Purpose States Reserve Status of Reserve Status of
Bank's Initiatives Bank's Initiatives Initiatives Bank's Initiatives Initiatives
Introduction of flexibility in This helps the better mana- States that have gone in for Introduction of flexibility The States have gone in Introduction of flexibility inThe States have gone in for market borrowings of State ged States gain through market borrowing programme in market borrowings of for the borrowing through market borrowings of Statethe borrowing through auctionGovernments by encouraginglower yields as compared through auction so far, State Governments by auction/tap issue so far Governments by encouragingissue so far, include- Andhrathe States to directly access to the combined borrowing include- Punjab, Andhra encouraging the States to include-Punjab, Andhra the States to directly accessPradesh, Arunachal Pradesh,the market for resources programme and thus puts in Pradesh, Tamil Nadu, directly access the market Pradesh, Arunachal Pradesh the market for resources Chattisgarh, Gujarat, Jammu &between 5 to 35 per cent of place incentives for sound Karnataka, Maharashtra, for resources ranging 5 to Jammu and Kashmir, Tamil ranging 5 to 35 per cent ofKashmir, Karnataka, Kerala, gross borrowings, with the fiscal management. West Bengal and Kerala. 35 per cent of gross borro- Nadu, Karnataka, Madhya gross borrowings, with the Madhya Pradesh, Maharashtra,states deciding on the met- wings, with the States Pradesh, Maharashtra, West States deciding on the Punjab, Tamil Nadu and Westhod, timing and maturities deciding on the method, Bengal, Kerala, Gujarat and method, timing and maturities Bengal. The introduction ofof the borrowings. For this timing and maturities of Uttar Pradesh. The introdu- of the borrowings. flexibility in market borrowingspurpose, a Committee of the borrowings. ction of flexibility in market helps the better managed State Finance Secretaries borrowings helps the better States gain through lower borr-acted in an advisory capa- managed States gain through owing costs as compared to city to oversee the indica- lower yields as compared to the coupon rates in the combi-tors of financial parameters the combined borrowing ned borrowing programme, andrequired for monitoring of programme, and thus put in thus put in place incentives forfinancial performance of place incentives for sound sound fiscal management. Instates by the market. fiscal management. response to the request recei-
ved from Maharashtra andKerala, the RBI permitted these two States to raise upto 50 per cent of their alloca-tion through auction in the fiscal year 2002-03.
- - - Constitution of an informal The Group submitted its Constitution of CommitteeAn Advisory CommitteeGroup of State Finance report to Reserve Bank of on WMA/ Overdraft (Chairman: Shri C. Secretaries on implementa- India in January 2001. In line Scheme. Ramchandran) was constitutedtion of State Governments’ line with the Group’s reco- to examine the existing sche-WMA/Over drat Regulation mmendations, the WMA me of WMA and overdrafts toScheme. scheme was revised effective the States and to consider
from February 1, 2001. rationalisation, if warranted, revision of limits. The Commi-ttee’s recommendations areunder consideration.
- - - Constitution of Group of The Group has been consti- Constitution of Group of The Group has been constitu-Finance Secretaries to tuted to analyse and classify Finance Secretaries to ted to analyse and classifyexamine the Fiscal Risk of different type of guarantees examine the Fiscal Risk of different type of guaranteesGuarantees extended by including letters of comfort Guarantees extended by including letters of comfort States. issued by the States and to States. issued by the States and to
examine the fiscal risk under examine the fiscal risk undereach type of guarantee. each type of guarantee. The
Group has submitted its report.
Chart IV: Reserve Bank’s Initiatives on State Finances
Chart IV: Reserve Bank’s Initiatives on State Finances
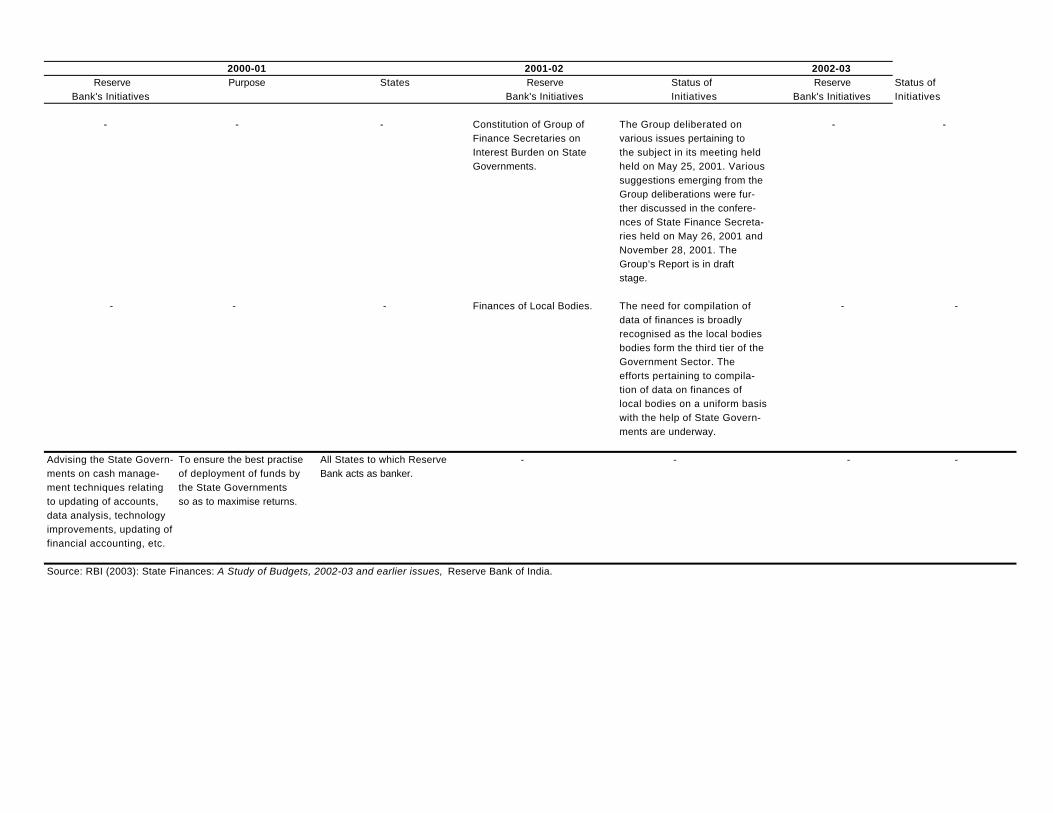
2000-01 2001-02 2002-03 Reserve Purpose States Reserve Status of Reserve Status of
Bank's Initiatives Bank's Initiatives Initiatives Bank's Initiatives Initiatives
- - - Constitution of Group of The Group deliberated on - -Finance Secretaries on various issues pertaining toInterest Burden on State the subject in its meeting heldGovernments. held on May 25, 2001. Various
suggestions emerging from theGroup deliberations were fur-ther discussed in the confere-nces of State Finance Secreta-ries held on May 26, 2001 and November 28, 2001. The Group’s Report is in draft stage.
- - - Finances of Local Bodies. The need for compilation of - -data of finances is broadly recognised as the local bodiesbodies form the third tier of theGovernment Sector. The efforts pertaining to compila-tion of data on finances of local bodies on a uniform basiswith the help of State Govern-ments are underway.
Advising the State Govern- To ensure the best practise All States to which Reserve - - - -ments on cash manage- of deployment of funds by Bank acts as banker.ment techniques relating the State Governmentsto updating of accounts, so as to maximise returns.data analysis, technologyimprovements, updating of financial accounting, etc.
Source: RBI (2003): State Finances: A Study of Budgets, 2002-03 and earlier issues, Reserve Bank of India.
193
XIV
Summary and Conclusions and Policy Implications 1. The objectives of this study are: (i) to build a fairly comprehensive data base
for a long period; (ii) to interpret the trends in various components of state finances in
terms of their determinants; (iii) to identify the major policy decisions taken at the
central as well as the states level that have contributed to the given trends in state
finances; (iv) to make an inter-state comparison of fiscal performance against the
backdrop of their growth outcomes in social and economic spheres; and (v) to put
together a narrative of efforts being made by individual state governments to
introduce reforms in their finances.
2. An aspect noticed in the study is the growing importance of states’ fiscal
operations relative to the size of central finances, with the aggregate expenditure of
states together overtaking the centre’s total expenditure in 1999-2000 and
considerable widening of the difference in developmental expenditures over years.
Genesis of Fiscal Imbalances
3. (i) Tracing the genesis of growing fiscal imbalances, the paper argues that
though the deficit on revenue account began in the year 1987-88, it
was following the impact of the fifth pay commission
recommendations, that the states’ revenue deficit experienced a
quantum leap. The same rise in revenue deficit has been responsible
for the quantum jump in states’ gross fiscal deficit (GFD) from 2.9 per
cent of GDP in 1997-98 to 4.2 per cent in 1998-99. The sharp
deterioration in the size of revenue deficit as well as GFD has occurred
primarily towards the closing years of the 1990s. Within two years
from 1997-98 to 1999-2000, revenue deficit and GFD registered steep
increases in relation to states’ aggregate disbursements, from 7 per
cent to 17 per cent and from 19 per cent to 29 per cent (peak levels),
respectively. In 1999-2000, the states’ GFD jumped to 4.8 per cent of
194
GDP partly because there was a classificatory change in that the states’
share in small saving collection began to be treated entirely as their
borrowings.
(ii) Apart from the impact of the fifth pay commission recommendations
and the classificatory change in respect of small savings, the drastic
upward revision in interest rates effected by the Reserve Bank of India
in the first half of the 1990s on the consideration of moving to market-
related rates of interest, that contributed to the fiscal malaise after the
end of that decade.
(iii) On the revenue side, the states’ own tax receipts, which had stood the
ground throughout the 1990s, became somewhat sluggish in the latter
half of the 1990s, but the sharpest fall has occurred in non-tax
revenues. Negative returns on state government investments and poor
recovery of the cost of public services, which have been the bane of
state finances, have deteriorated further in the latter half of the 1990s.
Amongst state PSUs, the most damaging drain has been from the
discouraging performances of SEBs and other utilities that account for
about 85 per cent of states’ PSU investments.
(iv) As a fallout of the fiscal adjustment and reduced revenue growth at the
central government level, following also the recessionary conditions in
Indian industry, the growth in states’ share in central taxes has slowed
down rather drastically. As against it, non-plan statutory grants have
shown some rise, but overall there has occurred a relative shift in
favour of loans as against grants. Also, with a rise in debt servicing on
central loans, net transfers from the centre have been getting narrowed.
4. In recent years, revenue deficit constitutes a major part (60 per cent) of fiscal
deficit though it was in the range of 20-30 per cent during the early 1990s.
Borrowing to meet current consumption may not assure adequate return to meet the
repayment of loans and interest liability. A substantial rise in current consumption
primarily to meet non-developmental expenditure has reduced the share of capital
expenditure and this may have been a factor in retarding the growth of state
195
economies over years. Thus, a decline in growth of state economies along with
higher repayment of loans and interest payments can further aggravate the fiscal
problems that have emerged in recent years.
5. (i) It is the vicious circle of higher revenue deficit leading to increased
borrowings and to higher fiscal deficit, that holds out a question on
debt sustainability.
(ii) The total outstanding liabilities of the states together, as percentage of
GDP, which had remained stable at around 19 per cent in the second
half of the 1980s, in fact declined in the first half of the 1990s to less
than 18 per cent until 1997-98. It was in that year and only thereafter,
when the impact of pay increases (and interest burden) began to be
felt, that the states’ liabilities began to move up and their ratio to GDP
reached 27.9 per cent at the end of March 2003.
(iii) A question mark on the sustainability of states’ debt position, however,
has arisen from the fact that (a) the recent debt has occurred at
relatively high interest rates, (b) it has been accompanied by a
significant slowdown in revenue growth, and (c) an increasing
proportion of it is being used for non-developmental purposes as
indicated earlier. Therefore, the capacity of public expenditure to
augment the growth potentials of the state economies and thus help
augment tax revenues, appears limited.
(iii) In recent years, the range of coupon rates and their weighted averages
have steadily declined; they were at a peak of 14 per cent and now
they have fallen to a range of 6.67 to 8 per cent or to a weighted
average of 7.50 per cent in 2002-03. But, their benefits will not accrue
to state budgets in the immediate period due to two to three reasons.
First, for some years to come, the outstandings of loans contracted
earlier at higher rates of interest will remain to be serviced. Secondly,
a rising proportion of borrowing requirements will be met, from the
high cost small savings and state provident funds – a disquieting
196
feature reflected in the financing pattern of gross fiscal deficits. Third,
as a result of the rising interest burden, interest outgo in the state
budgets has shot up to over 80 per cent of total debt servicing.
The Influence of Competitive Politics
6. What stands out in the overall fiscal performance of states has been the
sudden deterioration that began after 1997-98, following the influence of ‘competitive
politics’ playing an upper hand in the general governance of the country and in fiscal
operations in particular. First, with a view to attracting investment, there was
competition amongst states to reduce sales tax and other tax rates without putting in
place arrangements for checking tax evasions and avoidances. Second, states have
conferred further concessions in tariffs on power supplies to farmers and undertook
various other forms of liberal measures leading to a drastic reduction in the growth of
states’ own non-tax revenues – from 14.5 per cent to 9.5 per cent per annum as
between the above two periods. Finally, the same set of political compulsions have
induced the state governments to adopt for their employees the pay and pension
revisions recommended by the fifth pay commission for the central government
employees.
Structural Weaknesses
7. Yet another dimension to the fiscal problems of states has been that some of
the structural weaknesses, highlighted by the RBI (1999a) and further amplified by
the Eleventh Finance Commission (2000), have got accentuated in the recent period,
thus contributing to the severity of state- level fiscal imbalances. First, there is the
limited tax base of the states, with about 88 per cent of the total tax revenue obtained
from indirect taxes whereas in the case of the central government such indirect taxes
constitute about 62 per cent of its gross tax revenue. The growing services sector is
outside the ambit of the states which also explains the vast differences in tax base that
exist between the two layers of the federal system. Second, there has occurred
tremendous pressure on states to expand their expenditure commitments on
agriculture, irrigation and other rural infrastructures, as also on social infrastructures,
197
as part of their constitutional responsibilities. Third, there has always been a cap on
the size of the market borrowings of the states. Lastly, deficiencies in the
mechanism of federal trans fers to the states have been responded to in an ad hoc
manner from time to time.
Sluggish Revenue Trends
8. It is significant that the year of turning point in the fiscal performance of
states, namely, 1998-99, saw the relative dip in receipts under all revenue heads.
This was so even under the states’ own tax receipts. The anxiety among the states to
attract investment and reduce sales tax while ignoring tax evasion and avoidance has
reduced the contribution of tax revenue in the resources kitty. As referred to earlier, a
crucial structural problem faced by the states in tax revenues, has been the extremely
narrow tax base.
9. Sales tax, which is the major revenue earner for the states with over 60 per
cent of revenue accruing from it, faces a complex set of issues. States’ revenue
mobilisation through this tax has not been as discouraging as it is made out. Sales tax
revenue as percentage of GDP has shown a gentle rise, unlike other heads of revenue;
it has increased from 3.1 per cent in 1990-91 to 3.2 per cent in 1997-98 and to 3.8 per
cent in 2002-03 (BE).
10. The share of states in central taxes has experienced a slow but steady fall
(from 2.7 per cent of GDP in 1997-98 to 2.4 per cent in 2001-02). There have been
some compensating revenue grants from the centre, but some of the grants have a
political colour associated with them resulting in charges of their unequal distribution.
11. (i) Simultaneously, there has occurred slowdown in the rate of growth of
other non-tax receipts, particularly revenues earned from economic
and social services; the latter has receded from 0.9 per cent of GDP in
1994-95 to 0.6 per cent by 1998-99; it has remained stuck at that ratio
since then. It is as a result of this that the overall trends in non-tax
revenues suffered a setback after the latter half of the 1990s.
(ii) Non-tax revenues obtained from ‘social services’ are stuck at 2.0 per
cent of state expenditures throughout the period 1994-95 to 2001-02
198
(RE), while those collected from ‘economic services’ have declined
from 14.5 per cent to about 12 per cent during the period.
12 (i) Even the above meagre receipts under non-tax revenues hide the
potential losses under (a) potential returns on state government
investments, and (b) recovery of cost of public services. Power sector
has been a major drag on state finances. Far from generating the 3 per
cent rate of return on SEBs’ net fixed assets in service at the beginning
of a year as stipulated under Section 59 of the Electricity (Supply) Act,
1948 (a provision which had become operative from the accounting
year 1985-86, with the return being after providing for interest and
depreciation charges), the rate of return in reality from the SEBs has
not only remained negative but has steadily deteriorated over the
1990s.
(ii) State road transport corporations/undertakings (SRTUs) constitute the
second largest enterprises of the states and they also serve as a drag on
the state budgets. As a group, these SRTUs suffer negative returns on
their fixed capital partly because they are required to render social
obligations of serving transport needs of non-viable routes; very often
they make do with moderate fares and do not raise fares pari passu
with the rise in costs.
Declining Shares of Capital, Developmental and Plan Expenditures
13. (i) States’ total expenditure trends over the past two decades since the
early 1980s have seen their steady growth at about 14 to 14.5 per cent
per annum. When both revenue and capital expenditures are
combined, it is the average annual growth of non-development
expenditure that has not only been higher but also accelerating as
compared with that in developmental expenditure in successive
periods specified above.
(ii) A disconcerting aspect of the Indian fiscal performance has thus been
the erosion in development momentum as reflected in a declining
199
share of developmental expenditure in total expenditure both at the
centre and state levels in the 1990s, but the erosion at the states’ level
has been more moderate. As a proportion of aggregate expenditure
consisting of both revenue and capital accounts, development
expenditure has experienced a steady fall from about 70 per cent in the
early 1990s to less than 64 per cent in 1997-98, but thereafter,
following the implementation of the pay commission
recommendations, there has occurred a precipitate fall and reached
57.1 per cent in 2002-03 (BE).
(iii) The declining trend in developmental expenditure is found in both
revenue and capital expenditures. Until 1997-98/1998-99 when the
impact of central pay commission recommendations began to be felt,
the states’ total revenue expenditure as a ratio of GDP was gradually
falling, from 13.2 per cent in 1991-92 to 12.2/12.3 per cent during the
three-year period 1995-96 to 1997-98, but it began to rise thereafter
rather rapidly.
(iv) The loss of developmental momentum is better seen in the declining
ratio of developmental expenditure under revenue account as
percentage of GDP; it has receded from a peak of 9 per cent in 1991-
92 to 7.5 per cent in 1997-98; thereafter it has edged up but has
remained below what was attained in 1991-92; in 2001-02 (RE), it has
been placed at 8.1 per cent and in 2002-03 (BE), at 7.8 per cent
(v) As a result, incrementally, one-half of the increase in total expend iture
of the states after 1997-98 has been due to non-developmental
expenditures, whereas in the preceding seven-year period, the
corresponding ratio was only about 40 per cent.
(vi) If overall development expenditure as a proportion of states’ total
expenditure has steadily receded since the beginning of the 1990s, it is
the ‘economic services’ expenditure which has faced this slide. Such
‘economic services’ expenditure as percentage of total development
expenditure has steadily fallen from 47.8 per cent in 1991-92 to 41 per
200
cent during the latest two years; in contrast to it, the expenditure on
‘social services’ has experienced a corresponding rise from 43.9 per
cent to 52.8 per cent during the same period.
14. (i) In the latest phase between 1997-98 and 2002-03, plan and non-plan
disposition of states’ expenditures has followed a somewhat different
pattern, with plan expenditure rising by 81.7 per cent while non-plan
expenditure rising by 91.7 per cent in contrast to increases of 69.4 per
cent in developmental expenditures and 123.5 per cent in non-
development expenditures.
(ii) About 43 per cent of the incremental aggregate expenditures of states
has been absorbed by non-plan non-development expenditure, in
which three major heads of expenditure, namely, interest payments,
administrative services and pension and miscellaneous general
services, accounted for the bulk during the latest period – about 90 per
cent of non-plan non-development expenditure or nearly 40 per cent of
the increase in aggregate expenditure.
Inter-State Differences in Fiscal Performance
15. The picture of state finances described so far based on aggregate picture of
all-states data obviously hides the vast inter-state differences in fiscal performance.
The ten special category states have exhibited unusual fiscal indicators such as overall
revenue surpluses and low levels of fiscal deficits because of relatively high levels of
plan and non-plan grants that they have enjoyed from the central government.
16. (i) As for 15 major states, a majority – 8 out of 15 – had annual averages
of revenue deficits during 1998-99 to 2002-03 (BE), ranging from 4
per cent to 5.7 per cent of SDP which are higher than the all-states
average, while the other 7 states had this ratio ranging from 1.9 per
cent to 3.0 per cent. Three southern states of Karnataka, Andhra
Pradesh and Tamil Nadu, belonging to the middle- income groups,
have managed with relatively lower revenue deficit, while Haryana
and Goa amongst the high- income states have done so with moderate
201
revenue deficits. This is also broadly true of gross fiscal deficit (GFD)
to GSDP ratio, in which the same aforesaid eight states have
experienced relatively high ratios. Interestingly, the high-deficit
states are spread over all the three income categories – low, middle
and the higher.
(ii) The second important revelation at the individual states level has been
the sharp deterioration in revenue deficit as between the two phases of
1993-94 to 1997-98 and 1998-99 to 2002-03 (BE), with Gujarat
amongst high- income states facing the sharpest 10-fold rise, while
Madhya Pradesh and Haryana experiencing the lowest rise, between
the phases.
(iii) Finally, a more complex set of inter-state scenario is discernible when
we compare absolute sizes of gross fiscal deficits (GFD) of states and
their decomposition into sources and financing patterns, with their
capital outlay figures, which are an important purpose for which
borrowings are made, appearing unrelated to their GFD numbers.
17. Thus, there is no doubt that there are differences in the levels of fiscal
imbalances amongst the 15 major states and there are different causes for those
imbalances. But, at the same time, very many common causes dominate the fiscal
performances of major states which explain the rapid deterioration in revenue and
fiscal deficits of all states in recent years. These common causes of fiscal imbalances
amongst 15 major states are: (i) a sudden jump in non-development expenditure
including the incidence of interest on debt; (ii) sharp reductions in the growth of own
non-tax revenues; and (ii) similar deceleration in the rate of growth of resource
transfers from the central government. All of them face the structural issues
enumerated above.
18. (i) The major states’ overall performance in regard to mobilisation of own
taxes has not been as weak as it is generally believed. Ten out of 15
states have in fact achieved an improvement in their own-tax revenue to
GSDP ratios, or at least sustained them during the recent period, as
202
compared with the situation obtaining in the decade of the 1980s.
Amongst them, Tamil Nadu shows the best performance with the
highest level of own-tax to GSDP ratio during the entire decade of the
1990s. At the other end, West Bengal is the only state to experience a
noticeable fall in the recent period.
(ii) The mobilisation of non-tax revenue has been meagre amongst all states
without exception.
(iii) The severest drain on state finances has emanated from the discouraging
performances of state electricity boards (SEBs) with large commercial
losses. A Planning Commission study for 1955-96 had shown that the
highest negative rate of return was found in Punjab, Bihar, West Bengal,
and Uttar Pradesh, while Maharashtra, Karnataka, and Orissa produced
positive returns at least until 1995-96. On the other hand the latest N. J.
Kurian Study Group [Planning Commission (2002)] reveals that in the
case of the most important utility enterprises, it is observed that Andhra
Pradesh, Gujarat, Himachal Pradesh, Karnataka, Kerala, Maharashtra,
Pondicherry, Punjab, Rajasthan, Tamil Nadu and Uttar Pradesh are the
states where utility enterprises have consistently showed a positive return
although the returns have generally been below the benchmark rate.
Delhi, Mizoram and Tripura experienced a consistently negative rate of
return in case of the utility enterprises. Other states exhibited a mixed
trend.
19. (i) The sudden jump in non-development expenditure during the recent
period following the upward revision of pay and pensions of state
government as well as local bodies’ employees, has been striking.
Amongst the states which effected the highest revisions in 1998-99
were Goa (113.0 per cent), followed by Haryana (106.0 per cent), Uttar
Pradesh (68.6 per cent), Punjab (65.6 per cent), Gujarat (62.3 per cent)
and Madhya Pradesh (51.9 per cent).
203
(ii) Yet another important factor in the growth of non-development
expenditures of states has been the acceleration in the growth of interest
payments. Gross interest payments as percentage of revenue receipts of
states have steadily increased with the average for all states rising from
17.7 per cent in 1997-98 to 23.6 per cent in 2002-03 (BE). The states
facing these ratios more than the all-states average (23.6 per cent) in the
latest year are: West Bengal (41.8 per cent), Uttar Pradesh (31 per cent),
Punjab (24.8 per cent), Gujarat (26.7 per cent), Bihar (23.8 per cent) and
Andhra Pradesh (24.8 per cent).
20. If the proportions of 58 per cent to 60 per cent of aggregate expenditures,
which are all-states averages, are considered as the benchmark for developmental
expenditure purposes for recent years, all the southern states of Karnataka, Andhra
Pradesh, Kerala and Tamil Nadu (ranging from 63 per cent to 58 per cent) as well as
Haryana (63 per cent), Gujarat (68 per cent), Madhya Pradesh (62 per cent) and
Rajasthan (58 per cent), show better record in their attempt to devote higher
proportions of expenditures for developmental purposes.
21. Amongst the southern states, Andhra Pradesh, Karnataka and Kerala enjoy
better plan expenditure to GSDP ratios of 5 to 6 per cent too, but Tamil Nadu has a
lower ratio of a little above 3 per cent.
22. It is also significant that plan expenditures of states as percentages of total
developmental expenditures generally vary with their income levels, the high- income
states having lower proportions of plan expenditures and the low-income ones higher
proportions.
Fiscal Performance and Performances in Social and Economic Spheres 23 (i) A logical question that crops up concerns the relationship between the
fiscal performance of states and their performance in social and
economic development. Abstracting from aberrations and occasional
divergences, there is an amazing consistency in the varied rankings of
states based on major indicators. From this it is clear that an
overwhelming number of states appear common in all the three top,
204
middle, and bottom rankings pertaining to five different measures of
economic, financial and fiscal performances.
(ii) While there is thus link between fiscal performance and performances of
states, in economic, social and financial sector spheres, the causation
seems to be surprisingly generally unidirectional and seems to run from
the overall economic performance to fiscal performance and also to the
partaking of benefits of financial sector development and not the other
way about. States enjoying high income levels and relatively high rates
of income growth have generally succeeded in producing better own-tax
mobilisation and in minimising fiscal imbalances. Likewise, such are
the very states which have generated better deposit resources for banks
and also succeeded in producing a conducive environment for absorbing
relatively higher levels of bank credit as well as other institutional form
of credit.
Measures of Fiscal Reforms
24. (i) A number of states have initiated steps to address some of the long-run
problems in mobilisation of tax and non-tax revenues and reforming
public enterprises. This has also been the time when sourcing higher
revenues through non-tax measures has become an important policy
plank for ensuring fiscal consolidation.
(ii) Considering the enormity and wide-ranging nature of the problem,
multi- layer efforts have been thus made to reform the states’ fiscal
positions and policies. Three substantive programmes have been in
operation at the initiative of the central government. First, on the
advice of the National Development Council (NDC), the centre
instituted a one-time ‘fiscal reform facility’ for the year 1999-2000
associated with the clearance of states’ ways and means advances from
the RBI conditional upon structural reforms in their finances being
undertaken by them. Second, the start of a monitorable medium-term
fiscal reform programme (MTFRP) for five years from 2000-01 to
205
2004-05 based on the supplementary recommendation obtained from
the Eleventh Finance Commission. Third, in order to address the
growing debt burden of states and to supplement the efforts of states in
the direction of evolving their medium-term fiscal reform programme,
a Debt-Swap Scheme has been formulated by the Government of
India.
(iii) Besides, in recent years, states have initiated and begun to implement
on their own several reform measures aimed at fiscal consolidation;
these broadly cover restructuring of their revenues and revenue
augmentation, restraints on expenditure increases and institutional
reforms. Specifically, five states, namely, Karnataka, Kerala, Tamil
Nadu, Punjab and Uttar Pradesh, have already enacted fiscal
responsibility legislations to provide for statutory backing to the fiscal
reform process and Maharashtra has introduced such a bill in its
legislature.
(iv) Finally, at the initiative of the central government and at the states’
own initiative, concerted efforts have been made to reform the power
sector which has been a sizeable and growing drain on states’ finances.
25. In the same vein of fiscal reforms, the RBI has taken a number of initiatives to
reform the state level fiscal processes. Amongst them, the most visible has been the
measures to contain the growth of state guarantees. With resource constraints faced
by state governments, capital budgets have been hurt rather drastically and hence
some of the state governments have taken initiative to implement capital projects
outside their budgets through off-budget borrowings which required state guarantees.
Policy Implications
26. (i) The package of measures that have been set out under various reform
programmes suggests itself as a fairly comprehensive set of policies
that the states have to pursue to put their fiscal house in order. The
results of the present study throw up precisely the same set of measures
that are necessary to achieve the targeted goals. In this respect, two
206
issues that stand out are: first, the number of states that have proposed to
undertake substantive fiscal responsibility measures is very few; and
second, the series of measures that have been promised so far
themselves are not being implemented in their entirety.
(ii) On the whole, it is not proper to blame the states alone for their fiscal
malaise. Many of the budgetary decisions taken at the central level have
impacted the state level finances. In fairness, it must be said that the
states cannot resis t, for example, the demands for pay and pension
revisions in response to pay commission recommendations for central
government employees. On both the last two occasions, the response had
to be ad hoc as the implications for the state finances were not
considered in advance. Also, states have done reasonably well in
pursuing the mobilisation of their own taxes. In the recent period, states
have also joined together to organise their tax systems by co-ordinating
and introducing floor rates of taxes and easing out existing concessions
and tax holidays. It is the transfer of central taxes wherein there has
occurred deceleration in growth. Even so, there is still scope for
rationalising their tax rates, modernising the taxation system and
widening their tax base. On the VAT, in view of the apprehensions
entertained by the states, the central government has agreed to
compensate 100 per cent of the loss in the first-year, 75 per cent of the
loss in the second year, and 50 per cent in the third year. The central
government has also proposed a constitutional amendment to enable the
levy of tax on services with sufficient powers for both the central and
state governments to collect the proceeds. These should go a long way
in helping the states to minimise some of the structural problems in their
finances and widen their tax base.
(iii) A crying need at the states level today is administrative reform.
Repetitive reports of the Comptroller and Auditor General of India and
other documents suggest that there is excessive staff and consequential
inefficiency and corrupt practices which result in inoptimal
207
performances at various levels of state government administration.
Above all, these are reflected in inordinate delays in clearance of
investment proposals of domestic ent repreneurs and those of foreign
direct investment. Despite many government initiatives to bring about
better industrial dispersals regionally, the existing manufacturing base
and more importantly, the new IEMs and FDI are acutely concentrated
in a few states. Likewise, banks and financial institutions are reluctant
to expand their lending activities in vast areas of central India and
eastern and north- eastern regions. The administrative reforms will thus
have not only healthy effects on finances of state governments but also
on the general performances of state economies.
(iv) Apart from administrative reforms, an important reform which the states
have to undertake relates to their pension arrangements. Some states
have proposed introduction of contributory pension schemes for their
newly recruited staff. This is a necessary programme for all states to
emulate.
(v) On the revenue front, apart from the implementation of Value Added
Taxes (VAT), tightening of the tax administration, modernisation,
normal of loopholes and expanding the tax base by facilitating the
inclusion of services in the states’ tax net, are some of the obvious
measures that stand out as crucial for improving state finances.
208
Notes
1 Parthasarathi Shome wrote a paper which also did not address the question of state finances. Shome,
Parthasarathi (1996): “Fiscal Policy in the 1990s – Needed Reforms and Ramifications for the Financial Sector”, Sir Purshotamdas Memorial Lecture, 1996 (The Indian Institute of Bankers, Mumbai)
2 These have been summed up in Amaresh Bagchi (2003). 3Three new states of Chattisgarh (effective November 1, 2000), Uttaranchal (November 9, 2000), and
Jarkhand (November 15, 2000) have been created in 2001-02. Data for these three new states have been covered for a brief period of 2001-02 and 2002-03.
4 Subsequent to the completion of this study, the Reserve Bank of India has just realised its next 2004 study
on State Finances for 2003-04 (RBI April 2004). 5 For a description of these schemes, see Eleventh Finance Commission Report (2000), p.32. 6 Government of India’s budget documents regularly give these descriptions. For example, see the latest
budget papers, GoI February 2003a, but GoI February 2001 presents a more detailed description. 7 To this extent, a recent description of by Godbole in an otherwise excellent article on Maharashtra’s
finances of plan expenditure as new capital expenditure requires modification (Godbole 2001). Plan expenditures cover a substantial amount of ‘social service’ expenditures under revenue account
8 The dichotomy between plan and non-plan expenditures has been discussed at great length in the Report of the Eleventh Finance Commission (pp.33 and 119). Quoting a Union Finance Minister’s observations, the Report argues that with excessive focus on plan expenditure, there has occurred a corresponding neglect of maintenance of past projects which is classified as non-plan. Thus, in the 1998-99 budget speech, a task force was proposed to examine the question of eliminating “the plan and non-plan distinction in the budget and to make recommendations for a functionally viable and more focused presentation of government expenditure in the budget” (ibid, p.33). The Eleventh Finance Commission (2000) has commended this proposal.
9 The Budget Estimates of 2002-03 are found to be less reliable for trend analysis because there has occurred considerable shortfall in projected revenue receipts. This has happened in every component of the states’ revenue receipts, as shown below:
2002-03 (RE) 2002-03 (BE) Total Revenue Receipts 293,873 (11.9) 306, 844 (12.0) (a) Tax Revenue 202,518 (8.2) 215,049 (8.4) States’ Taxes 149,358 (6.0) 152,590 (6.0) Sharable Taxes 53,160 (2.0) 62,459 (2.4) (b) States’ Own Non-Taxes 35, 954 (1.5) 37,787 (1.5) (Figures in brackets are per cent of GDP) Source: RBI 2003c, p.770 10 The broad thrust of his contentions could be discerned from Prof. Gadgil’s writings.
209
References
Acharya, Shankar (2001): India’s Macroeconomic Management in the Nineties, Indian Council of Research in the Nineties, Indian Council of Research in International Economic Relations, New Delhi.
Bagchi, Amaresh, J L Bajaj and William A Byrd (1992): State Finances in India, Vikas
Publishing House Pvt. Ltd. Delhi. Bagchi, Amaresh (2003): ‘Fifty Years of Fiscal Federalism in India: An Appraisal’, National Institute
of Public Finance and Policy, Working Paper 2, New Delhi. Bagchi, Amaresh (2001): ‘Perspectives on Correcting Fiscal Imbalance in the Indian Economy, Some
Comments”, Money and Finance, Vol.2, No. 4-5, January-June. Bhagwati, Jagdish and T N Srinivasan (1993): India’s Economic Reforms, Ministry of Finance, July Chakraborty, Lekha S (2002): ‘Fiscal Deficit and Rate of Interest, An Econometric Analysis of the
Deregulated Financial Regime’, Economic and Political Weekly, May 11, pp.1831-1838. Chaudhury, Saumitra (2000): ‘State Government Finances’, Money and Finance, ICRA Bulletin,
Vol.2, No.1, May-June. Chaudhury, Saumitra (2000a): ‘Fiscal Management: An Alternative View of the Circumstances’,
Money and Finance, ICRA Bulletin, Vol.2, No.2, July-September. Chauhan, Devraj (2002): ‘Centrally Sponsored Schemes for Rural Development’, Foundation for
Research in Community Health, Pune, June. Chelliah, Raja J (2001): ‘The Nature of the Fiscal Crisis in the Indian Federation and Calibrating Fiscal
Policy’, Money and Finance, ICRA Bulletin, Vol. 2. Nos. 4-5, January-June. Centre For Monitoring Indian Economy (2003): Monthly Review of Investment Projects, Centre for
Monitoring Indian Economy Private Limited, June. Eleventh Finance Commission (2000): Report of the Eleventh Finance Commission, For
2000- 2005, Ministry of Finance, Department of Economic Affairs, July. EPWRF (2004): ‘Finances of State Governments: Deteriorating Fiscal Management’, Economic and
Political Weekly, Special Statistics – 37, May 1. EPWRF (2003a): Domestic Product of States of India:1960/61 to 2000/01’, EPW Research
Foundation, June. EPWRF (2003): ‘Finances of Government of India: Special Statistics’, Economic and
Political Weekly, Vol. XXXVIII, No.19, May10. EPWRF (2001a): ‘Finances of State Governments, A Time Series Presentation’, Economic
and Political Weekly, Vol. XXXVI, No.20, May 19.
EPWRF (2001): ‘Finances of Government of India: Special Statistics’, Economic and Political Weekly, Vol XXXVI, Nos 14 and 15, April 14-20.
210
EPWRF (2002): National Accounts Statistics 1950-51 to 2000-01: New Linked Series with 1993-94 as the Base Year, Fourth Edition, July
Gadgil, D R (1965): Planning and Economic Policy in India , Gokhale Institute Studies, No.39, Gokhale
Institute of Politics and Economics, March 22. Godbole, Madhav (2001): ‘Maharashtra Budget 2001-02: A Directionless and Empty Ritual’, Economic and
Political Weekly’, April 14 Government of India (2004a): Interim Budget 2004-2005, Ministry of Finance, Budget Division. February Government of India (2004): Economic Survey, 2003-04, Ministry of Finance, Economic Division Government of India (2003): Economic Survey, 2002-03, Ministry of Finance, Economic Division Government of India (2003a): Expenditure Budget 2003-2004 , Vol.2. February. Government of India (2002a): Economic Survey 2001-02, Ministry of Finance, Economic Division Government of India (2002): Union Budget Speech 2002-03, Ministry of Finance, Budget Division. Government of India (2001): Key to the Budget Documents and Expenditure Budget 2001-02, Volume 1
(Part II), Ministry of Finance, Budget Division, February Government of India (2001a):Economic Survey, 2000-01, Ministry of Finance, Economic Division. Government of India (1995): Economic Survey, 1994-95, Ministry of Finance, Economic Division. Government of India (1998): Economic Survey, 1997-98, Ministry of Finance, Economic Division. Government of India (1993): Economic Reforms, Two Years After and the Task Ahead, Ministry of
Finance, Government of India.
Krishnaswamy, K S (1953): ‘Finances of Part A and B States’, Reserve Bank of India Bulletin , May.
Kurian, N J (2002): ‘A Note on Socio-Demographic Disparities Among Major Indian States’,
Mimeograph, Planning Commission, Government of India. Kurian, N J (2000):‘Widening Regional Disparities in India, Some Indicators’, Economic and Political
Weekly, Vol.35, No.7.
Kurian, N J (1999): ‘State Government Finances: A Survey of Recent Trends’, Economic and Political Weekly, Vol. XXXIV, No.19, pp.1115-1125
Lahiri, Ashok (2000): ‘Practising Sub-National Public Finance in India’, Working Paper No.1,
National Institute of Public Finance and Policy, March. Ministry of Agriculture (2003): Reports of the Commission for Agricultural Costs and Prices, for
Crops Sown during 2002-03 season , Department of Agriculture and Co-operation, Government of India.
Ministry of Agriculture (2002): Reports of the Commission for Agricultural Costs and Prices, for
Crops Sown during 2001-02 season , Department of Agriculture and Co-operation, Government of India.
211
Ministry of Agriculture (2001): Reports of the Commission for Agricultural Costs and Prices, for Crops Sown during 2000-01 season, Department of Agriculture and Co-operation, Government of India.
Ministry of Commerce and Industry (2004): SIA Statistics-April 2004 , Secretariat for Industrial Assistance,
Government of India. Ministry of Finance (1997): Government Subsidies in India, Discussion Paper, Government of India. Ministry of Finance (1993): Discussion Paper on Economic Reforms: Two Years After and the Task
Ahead, Government of India. Mundle, Sudipto and M Govinda Rao (1991): ‘Volume and Composition of Government
Subsidies in India, 1987-88’, Economic and Political Weekly, May 4. Mundle, Sudipto and M Govinda Rao (1990): ‘The Unrecovered Cost of Public Services
in India: 1987-88’, Working Paper, National Institute of Public Finance and Policy, New Delhi.
Planning Commission (2002): Study Group on Reforms in State Public Sector Undertakings – Final Report, Volume I, Government of India, New Delhi, August
Planning Commission (2002c): Annual Report on The Working of State Electricity Boards &
Electricity Departments for 2001-02, (Power & Energy Division), Government of India, New Delhi, May.
Planning Commission (2002b): Tenth Five Year Plan 2002-2007 , Volume – I: Dimensions and
Strategies, Volume - II: Sectoral Policies and Programmes and Volume - III: State Plans Trends, Concerns, and Strategies, Government of India, New Delhi, December.
Planning Commission (2002a): National Human Development Report, 2001, Government of India. Planning Commission (2001a): Indian Planning Experience, A Statistical Profile, Government of India . Planning Commission (2001): Approach Paper to the Tenth Five Year Plan 2002-2007, Government of
India, New Delhi Planning Commission (2000) Mid Term Appraisal of Ninth Five Year Plan (1997-2002), Government
of India, New Delhi. Planning Commission (1995) Annual Report on the Working of State Electricity Boards and Electricity
Departments, Power and Energy Division, Government of India, October. Planning Commission (1995): A Study on the Performance of State Road Transport Undertakings,
Government of India, September. Rajaraman, Indira and M J Bhende (1998): ‘A Land-based Agricultural Presumptive Tax Designed for
Levy by Panchayat’, Economic and Political Weekly, April 4, pp.765-78 Rakshit, Mihir (2001): ‘Contentious Issues in Fiscal Policy: A Suggested Resolution, Money and
Finance, ICRA Bulletin, Vol.2, No.7, October-December. Rakshit, Mihir (2000): ‘On Correcting Fiscal Imbalances in the Indian Economy: Some Perspectives,
Money and Finance, ICRA Bulletin, Vol.2, No.2, July -September.
212
Rao, Govinda M (2003): ‘Intergovernmental Finance in South Africa: Some Observations’, Working Paper 1, National Institute of Public Finance and Policy, New Delhi.
Rao, Govinda M (2002): ‘State Finances in India: Issues and Challenges’, Economic and Political
Weekly, Vol.XXXVII, No.31, pp3261-3285. Rao, M Govinda (2001): ‘Taxing Services: Issues and Strategy’, Economic and Political
Weekly, Vol. XXXVI, No.42, pp.3999-4006. Rao, M Govinda and Nirvikar Singh (2001): ‘Federalism in India: Political Economy and
Reform’, Paper prepared for conference on ‘India: The years of Economic Reform’, Lecture delivered at William Davidson Institute, University of Michigan.
Rao, M. Govinda (1997): ‘Invisible Transfers in Indian Federalism’, Public Finance, Vol. 52 (3-4),
pp.429-448.
Rao, M. Govinda (1992): ‘A Proposal for State-level Budgetary Reforms, National Institute of Public Finance and Policy’, Working Paper No.19, New Delhi.
Rao, Hemlata, Abha Prasad and Arnab Gupta (2001): A Study of State Public Accounts in
India, Department of Economic Analysis and Policy, Reserve Bank of India, Mumbai.
RBI (2004): State Finances: A Study of Budgets of 2003-04, Reserve Bank of India, April RBI (2004a): Report on Currency and Finance 2002-03, Reserve Bank of India, January RBI (2003): State Finances, A Study of Budgets of 2002-03, Reserve Bank of India, February. RBI (2003a): Annual Report 2002-03, Reserve Bank of India, August. RBI (2003b): Report on Currency and Finance 2001-02, Reserve Bank of India, March. RBI (2003c): ‘Finances of State Governments – 2003-04: A Summary of Major Features’, Reserve Bank of India Bulletin , November RBI (2002): State Finances, A Study of Budgets of 2001-2002, Reserve Bank of India, January. RBI (2002a): Report on Currency and Finance 2001-02, Reserve Bank of India, January. RBI (2000): State Finances, A Study of Budgets of 1999-2000, Reserve Bank of India, January. RBI (1999): State Finances, A Study of Budgets of 1998-1999, Reserve Bank of India, February. RBI (1999a): Annual Report 1998-1999 , Reserve Bank of India, August. RBI (1999b): Report on Currency and Finances 1998-99, Reserve Bank of India, December. RBI (1999c): Report of the Technical Committee on State Government Guarantees, Reserve Bank of India, February RBI (1998): State Finances, A Study of Budgets of 1997-98, Reserve Bank of India, February. RBI (1997): State Finances, A Study of Budgets of 1996-97, Reserve Bank of India, February. RBI (1995): Annual Report, 1994-95, Reserve Bank of India, August.
213
Shetty (2003): ‘Growth of SDP and Structural Changes in State Economies: Interstate Comparisons’, EPW, No.49, December 6
Shome, Parthasarathi (2002): ‘Fiscal Policy in the 1990s-Needed Reforms ad Ramifications for the
Financial Sector’, Lectures in Memory of Sri Purushotam Das Thakurdas (Reprinted in The Indian Institute of Bankers (Ed.), Perspectives on Finance, Reforms and Innovation, Macmillan India Ltd. New Delhi).
Shome, Parthasarathi (2000): ‘Primary Aspects of a Medium Term Fiscal Strategy’, Indian Council for
Research on International Economic Relations, New Delhi. Sen, Tapas K (1997): ‘Relative Tax Effort by Indian States’, National Institute of Public Finance and
Policy, Working Paper No.5, New Delhi. Srivastava, D. K and C. Bhujanga Rao (2002): ‘Government Subsidies in India’, Working Paper No.6,
National Institute of Public Finance and Policy, New Delhi. Vithal, B P R and M L Sastry (2001): Fiscal Federalism in India, Oxford University Press, New Delhi. Vithal, B P R and M L Sastry (2002): The Gadgil Formula, For Allocation of Central
Assistance for State Plans, Manohar Publishers, New Delhi.
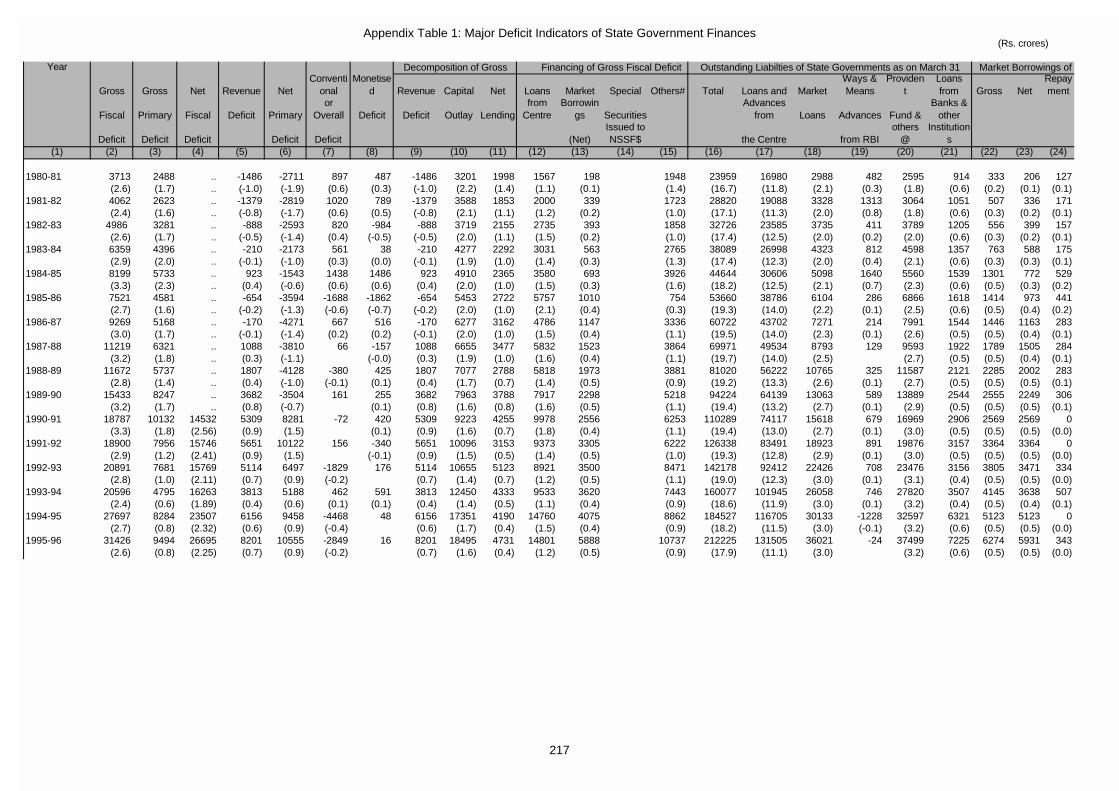
Appendix Table 1: Major Deficit Indicators of State Government Finances(Rs. crores)
Year
Gross Gross Net Revenue NetConventi
onalMonetise
d Revenue Capital Net Loans Market Special Others# Total Loans and MarketWays & Means
Provident
Loans from Gross Net
Repayment
Fiscal Primary Fiscal Deficit Primaryor
Overall Deficit Deficit Outlay Lendingfrom
CentreBorrowin
gs Securities Advances
from Loans Advances Fund &Banks &
other
Deficit Deficit Deficit Deficit Deficit (Net)Issued to NSSF$ the Centre from RBI
others @
Institutions
(1) (2) (3) (4) (5) (6) (7) (8) (9) (10) (11) (12) (13) (14) (15) (16) (17) (18) (19) (20) (21) (22) (23) (24)
1980-81 3713 2488 .. -1486 -2711 897 487 -1486 3201 1998 1567 198 1948 23959 16980 2988 482 2595 914 333 206 127(2.6) (1.7) .. (-1.0) (-1.9) (0.6) (0.3) (-1.0) (2.2) (1.4) (1.1) (0.1) (1.4) (16.7) (11.8) (2.1) (0.3) (1.8) (0.6) (0.2) (0.1) (0.1)
1981-82 4062 2623 .. -1379 -2819 1020 789 -1379 3588 1853 2000 339 1723 28820 19088 3328 1313 3064 1051 507 336 171(2.4) (1.6) .. (-0.8) (-1.7) (0.6) (0.5) (-0.8) (2.1) (1.1) (1.2) (0.2) (1.0) (17.1) (11.3) (2.0) (0.8) (1.8) (0.6) (0.3) (0.2) (0.1)
1982-83 4986 3281 .. -888 -2593 820 -984 -888 3719 2155 2735 393 1858 32726 23585 3735 411 3789 1205 556 399 157(2.6) (1.7) .. (-0.5) (-1.4) (0.4) (-0.5) (-0.5) (2.0) (1.1) (1.5) (0.2) (1.0) (17.4) (12.5) (2.0) (0.2) (2.0) (0.6) (0.3) (0.2) (0.1)
1983-84 6359 4396 .. -210 -2173 561 38 -210 4277 2292 3031 563 2765 38089 26998 4323 812 4598 1357 763 588 175(2.9) (2.0) .. (-0.1) (-1.0) (0.3) (0.0) (-0.1) (1.9) (1.0) (1.4) (0.3) (1.3) (17.4) (12.3) (2.0) (0.4) (2.1) (0.6) (0.3) (0.3) (0.1)
1984-85 8199 5733 .. 923 -1543 1438 1486 923 4910 2365 3580 693 3926 44644 30606 5098 1640 5560 1539 1301 772 529(3.3) (2.3) .. (0.4) (-0.6) (0.6) (0.6) (0.4) (2.0) (1.0) (1.5) (0.3) (1.6) (18.2) (12.5) (2.1) (0.7) (2.3) (0.6) (0.5) (0.3) (0.2)
1985-86 7521 4581 .. -654 -3594 -1688 -1862 -654 5453 2722 5757 1010 754 53660 38786 6104 286 6866 1618 1414 973 441(2.7) (1.6) .. (-0.2) (-1.3) (-0.6) (-0.7) (-0.2) (2.0) (1.0) (2.1) (0.4) (0.3) (19.3) (14.0) (2.2) (0.1) (2.5) (0.6) (0.5) (0.4) (0.2)
1986-87 9269 5168 .. -170 -4271 667 516 -170 6277 3162 4786 1147 3336 60722 43702 7271 214 7991 1544 1446 1163 283(3.0) (1.7) .. (-0.1) (-1.4) (0.2) (0.2) (-0.1) (2.0) (1.0) (1.5) (0.4) (1.1) (19.5) (14.0) (2.3) (0.1) (2.6) (0.5) (0.5) (0.4) (0.1)
1987-88 11219 6321 .. 1088 -3810 66 -157 1088 6655 3477 5832 1523 3864 69971 49534 8793 129 9593 1922 1789 1505 284(3.2) (1.8) .. (0.3) (-1.1) (-0.0) (0.3) (1.9) (1.0) (1.6) (0.4) (1.1) (19.7) (14.0) (2.5) (2.7) (0.5) (0.5) (0.4) (0.1)
1988-89 11672 5737 .. 1807 -4128 -380 425 1807 7077 2788 5818 1973 3881 81020 56222 10765 325 11587 2121 2285 2002 283(2.8) (1.4) .. (0.4) (-1.0) (-0.1) (0.1) (0.4) (1.7) (0.7) (1.4) (0.5) (0.9) (19.2) (13.3) (2.6) (0.1) (2.7) (0.5) (0.5) (0.5) (0.1)
1989-90 15433 8247 .. 3682 -3504 161 255 3682 7963 3788 7917 2298 5218 94224 64139 13063 589 13889 2544 2555 2249 306(3.2) (1.7) .. (0.8) (-0.7) (0.1) (0.8) (1.6) (0.8) (1.6) (0.5) (1.1) (19.4) (13.2) (2.7) (0.1) (2.9) (0.5) (0.5) (0.5) (0.1)
1990-91 18787 10132 14532 5309 8281 -72 420 5309 9223 4255 9978 2556 6253 110289 74117 15618 679 16969 2906 2569 2569 0(3.3) (1.8) (2.56) (0.9) (1.5) (0.1) (0.9) (1.6) (0.7) (1.8) (0.4) (1.1) (19.4) (13.0) (2.7) (0.1) (3.0) (0.5) (0.5) (0.5) (0.0)
1991-92 18900 7956 15746 5651 10122 156 -340 5651 10096 3153 9373 3305 6222 126338 83491 18923 891 19876 3157 3364 3364 0(2.9) (1.2) (2.41) (0.9) (1.5) (-0.1) (0.9) (1.5) (0.5) (1.4) (0.5) (1.0) (19.3) (12.8) (2.9) (0.1) (3.0) (0.5) (0.5) (0.5) (0.0)
1992-93 20891 7681 15769 5114 6497 -1829 176 5114 10655 5123 8921 3500 8471 142178 92412 22426 708 23476 3156 3805 3471 334(2.8) (1.0) (2.11) (0.7) (0.9) (-0.2) (0.7) (1.4) (0.7) (1.2) (0.5) (1.1) (19.0) (12.3) (3.0) (0.1) (3.1) (0.4) (0.5) (0.5) (0.0)
1993-94 20596 4795 16263 3813 5188 462 591 3813 12450 4333 9533 3620 7443 160077 101945 26058 746 27820 3507 4145 3638 507(2.4) (0.6) (1.89) (0.4) (0.6) (0.1) (0.1) (0.4) (1.4) (0.5) (1.1) (0.4) (0.9) (18.6) (11.9) (3.0) (0.1) (3.2) (0.4) (0.5) (0.4) (0.1)
1994-95 27697 8284 23507 6156 9458 -4468 48 6156 17351 4190 14760 4075 8862 184527 116705 30133 -1228 32597 6321 5123 5123 0(2.7) (0.8) (2.32) (0.6) (0.9) (-0.4) (0.6) (1.7) (0.4) (1.5) (0.4) (0.9) (18.2) (11.5) (3.0) (-0.1) (3.2) (0.6) (0.5) (0.5) (0.0)
1995-96 31426 9494 26695 8201 10555 -2849 16 8201 18495 4731 14801 5888 10737 212225 131505 36021 -24 37499 7225 6274 5931 343(2.6) (0.8) (2.25) (0.7) (0.9) (-0.2) (0.7) (1.6) (0.4) (1.2) (0.5) (0.9) (17.9) (11.1) (3.0) (3.2) (0.6) (0.5) (0.5) (0.0)
Financing of Gross Fiscal Deficit Market Borrowings of Decomposition of Gross Outstanding Liabilties of State Governments as on March 31
217
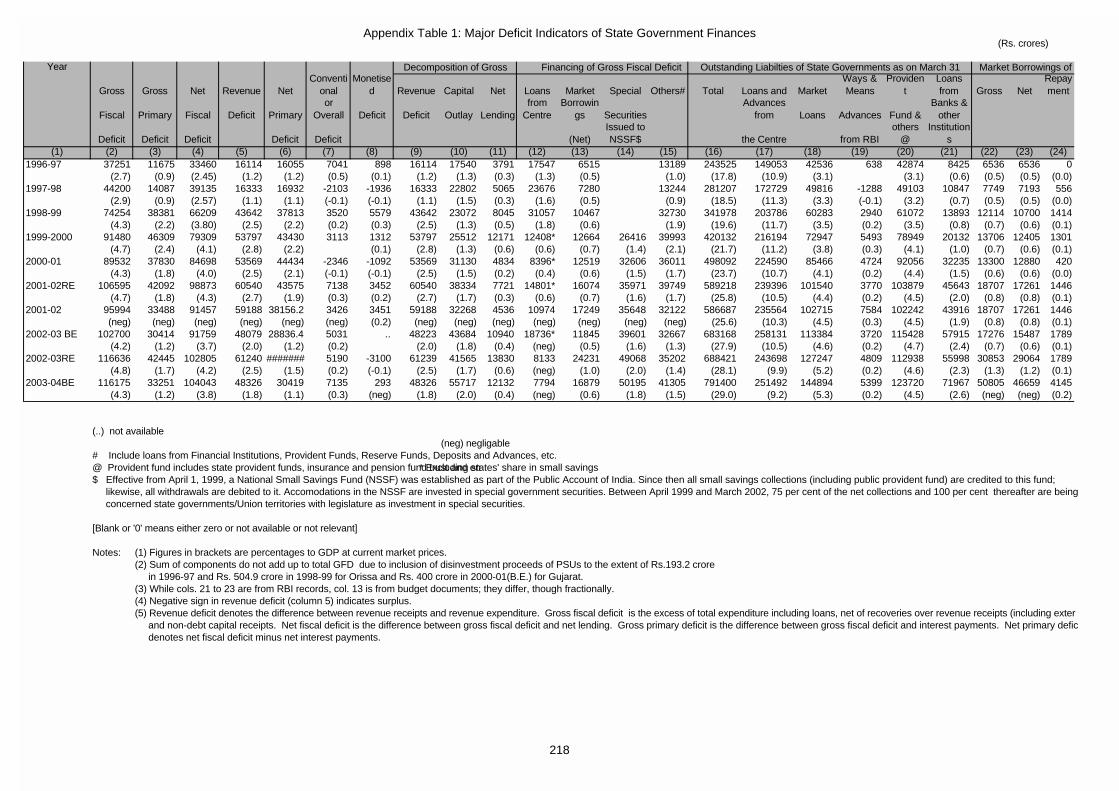
Appendix Table 1: Major Deficit Indicators of State Government Finances(Rs. crores)
Year
Gross Gross Net Revenue NetConventi
onalMonetise
d Revenue Capital Net Loans Market Special Others# Total Loans and MarketWays & Means
Provident
Loans from Gross Net
Repayment
Fiscal Primary Fiscal Deficit Primaryor
Overall Deficit Deficit Outlay Lendingfrom
CentreBorrowin
gs Securities Advances
from Loans Advances Fund &Banks &
other
Deficit Deficit Deficit Deficit Deficit (Net)Issued to NSSF$ the Centre from RBI
others @
Institutions
(1) (2) (3) (4) (5) (6) (7) (8) (9) (10) (11) (12) (13) (14) (15) (16) (17) (18) (19) (20) (21) (22) (23) (24)
Financing of Gross Fiscal Deficit Market Borrowings of Decomposition of Gross Outstanding Liabilties of State Governments as on March 31
1996-97 37251 11675 33460 16114 16055 7041 898 16114 17540 3791 17547 6515 13189 243525 149053 42536 638 42874 8425 6536 6536 0(2.7) (0.9) (2.45) (1.2) (1.2) (0.5) (0.1) (1.2) (1.3) (0.3) (1.3) (0.5) (1.0) (17.8) (10.9) (3.1) (3.1) (0.6) (0.5) (0.5) (0.0)
1997-98 44200 14087 39135 16333 16932 -2103 -1936 16333 22802 5065 23676 7280 13244 281207 172729 49816 -1288 49103 10847 7749 7193 556(2.9) (0.9) (2.57) (1.1) (1.1) (-0.1) (-0.1) (1.1) (1.5) (0.3) (1.6) (0.5) (0.9) (18.5) (11.3) (3.3) (-0.1) (3.2) (0.7) (0.5) (0.5) (0.0)
1998-99 74254 38381 66209 43642 37813 3520 5579 43642 23072 8045 31057 10467 32730 341978 203786 60283 2940 61072 13893 12114 10700 1414(4.3) (2.2) (3.80) (2.5) (2.2) (0.2) (0.3) (2.5) (1.3) (0.5) (1.8) (0.6) (1.9) (19.6) (11.7) (3.5) (0.2) (3.5) (0.8) (0.7) (0.6) (0.1)
1999-2000 91480 46309 79309 53797 43430 3113 1312 53797 25512 12171 12408* 12664 26416 39993 420132 216194 72947 5493 78949 20132 13706 12405 1301 (4.7) (2.4) (4.1) (2.8) (2.2) (0.1) (2.8) (1.3) (0.6) (0.6) (0.7) (1.4) (2.1) (21.7) (11.2) (3.8) (0.3) (4.1) (1.0) (0.7) (0.6) (0.1)
2000-01 89532 37830 84698 53569 44434 -2346 -1092 53569 31130 4834 8396* 12519 32606 36011 498092 224590 85466 4724 92056 32235 13300 12880 420(4.3) (1.8) (4.0) (2.5) (2.1) (-0.1) (-0.1) (2.5) (1.5) (0.2) (0.4) (0.6) (1.5) (1.7) (23.7) (10.7) (4.1) (0.2) (4.4) (1.5) (0.6) (0.6) (0.0)
2001-02RE 106595 42092 98873 60540 43575 7138 3452 60540 38334 7721 14801* 16074 35971 39749 589218 239396 101540 3770 103879 45643 18707 17261 1446(4.7) (1.8) (4.3) (2.7) (1.9) (0.3) (0.2) (2.7) (1.7) (0.3) (0.6) (0.7) (1.6) (1.7) (25.8) (10.5) (4.4) (0.2) (4.5) (2.0) (0.8) (0.8) (0.1)
2001-02 95994 33488 91457 59188 38156.2 3426 3451 59188 32268 4536 10974 17249 35648 32122 586687 235564 102715 7584 102242 43916 18707 17261 1446(neg) (neg) (neg) (neg) (neg) (neg) (0.2) (neg) (neg) (neg) (neg) (neg) (neg) (neg) (25.6) (10.3) (4.5) (0.3) (4.5) (1.9) (0.8) (0.8) (0.1)
2002-03 BE 102700 30414 91759 48079 28836.4 5031 .. 48223 43684 10940 18736* 11845 39601 32667 683168 258131 113384 3720 115428 57915 17276 15487 1789(4.2) (1.2) (3.7) (2.0) (1.2) (0.2) (2.0) (1.8) (0.4) (neg) (0.5) (1.6) (1.3) (27.9) (10.5) (4.6) (0.2) (4.7) (2.4) (0.7) (0.6) (0.1)
2002-03RE 116636 42445 102805 61240 ####### 5190 -3100 61239 41565 13830 8133 24231 49068 35202 688421 243698 127247 4809 112938 55998 30853 29064 1789(4.8) (1.7) (4.2) (2.5) (1.5) (0.2) (-0.1) (2.5) (1.7) (0.6) (neg) (1.0) (2.0) (1.4) (28.1) (9.9) (5.2) (0.2) (4.6) (2.3) (1.3) (1.2) (0.1)
2003-04BE 116175 33251 104043 48326 30419 7135 293 48326 55717 12132 7794 16879 50195 41305 791400 251492 144894 5399 123720 71967 50805 46659 4145(4.3) (1.2) (3.8) (1.8) (1.1) (0.3) (neg) (1.8) (2.0) (0.4) (neg) (0.6) (1.8) (1.5) (29.0) (9.2) (5.3) (0.2) (4.5) (2.6) (neg) (neg) (0.2)
(..) not available(neg) negligable
# Include loans from Financial Institutions, Provident Funds, Reserve Funds, Deposits and Advances, etc.@ Provident fund includes state provident funds, insurance and pension fund trust and en * Excluding states' share in small savings$ Effective from April 1, 1999, a National Small Savings Fund (NSSF) was established as part of the Public Account of India. Since then all small savings collections (including public provident fund) are credited to this fund; likewise, all withdrawals are debited to it. Accomodations in the NSSF are invested in special government securities. Between April 1999 and March 2002, 75 per cent of the net collections and 100 per cent thereafter are being concerned state governments/Union territories with legislature as investment in special securities.
[Blank or '0' means either zero or not available or not relevant]
Notes: (1) Figures in brackets are percentages to GDP at current market prices.(2) Sum of components do not add up to total GFD due to inclusion of disinvestment proceeds of PSUs to the extent of Rs.193.2 crore in 1996-97 and Rs. 504.9 crore in 1998-99 for Orissa and Rs. 400 crore in 2000-01(B.E.) for Gujarat.(3) While cols. 21 to 23 are from RBI records, col. 13 is from budget documents; they differ, though fractionally.(4) Negative sign in revenue deficit (column 5) indicates surplus.(5) Revenue deficit denotes the difference between revenue receipts and revenue expenditure. Gross fiscal deficit is the excess of total expenditure including loans, net of recoveries over revenue receipts (including exter and non-debt capital receipts. Net fiscal deficit is the difference between gross fiscal deficit and net lending. Gross primary deficit is the difference between gross fiscal deficit and interest payments. Net primary defic denotes net fiscal deficit minus net interest payments.
218
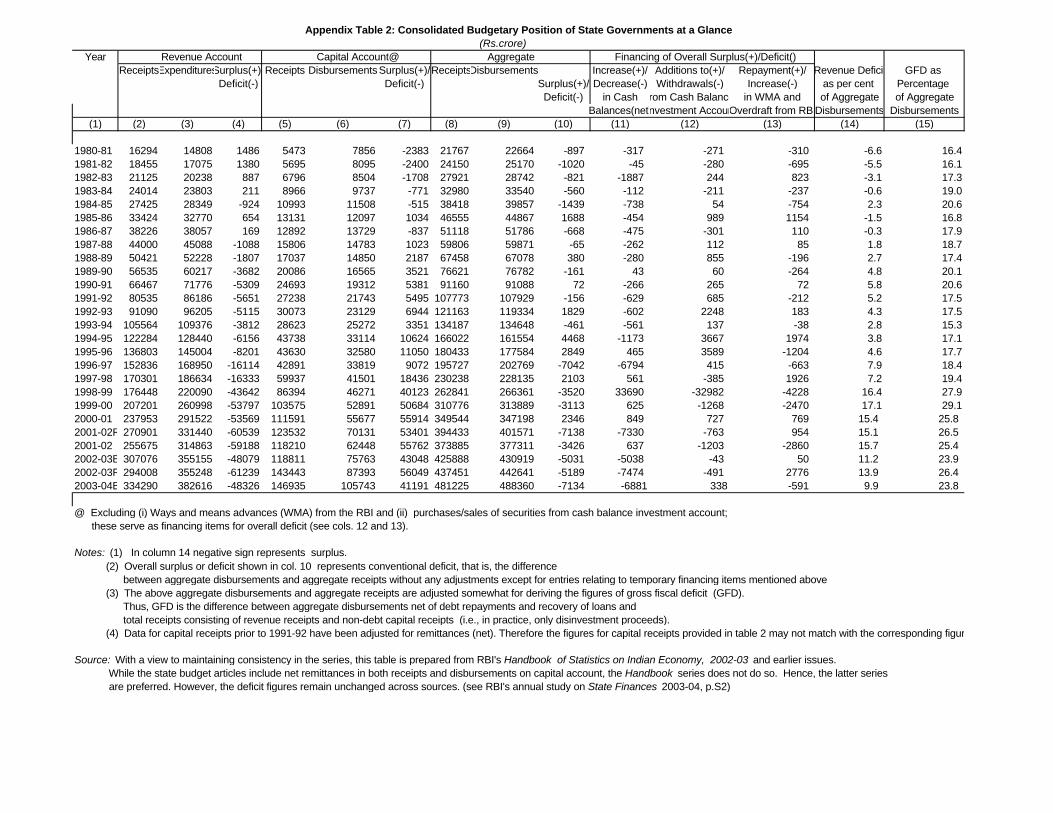
(Rs.crore)Year
ReceiptsExpendituresSurplus(+)/Receipts Disbursements Surplus(+)/ReceiptsDisbursements Increase(+)/ Additions to(+)/ Repayment(+)/ Revenue Deficit GFD as Deficit(-) Deficit(-) Surplus(+)/ Decrease(-) Withdrawals(-) Increase(-) as per cent Percentage
Deficit(-) in Cash from Cash Balance in WMA and of Aggregate of Aggregate Balances(net) Investment AccountOverdraft from RBIDisbursements Disbursements
(1) (2) (3) (4) (5) (6) (7) (8) (9) (10) (11) (12) (13) (14) (15)
1980-81 16294 14808 1486 5473 7856 -2383 21767 22664 -897 -317 -271 -310 -6.6 16.41981-82 18455 17075 1380 5695 8095 -2400 24150 25170 -1020 -45 -280 -695 -5.5 16.11982-83 21125 20238 887 6796 8504 -1708 27921 28742 -821 -1887 244 823 -3.1 17.31983-84 24014 23803 211 8966 9737 -771 32980 33540 -560 -112 -211 -237 -0.6 19.01984-85 27425 28349 -924 10993 11508 -515 38418 39857 -1439 -738 54 -754 2.3 20.61985-86 33424 32770 654 13131 12097 1034 46555 44867 1688 -454 989 1154 -1.5 16.81986-87 38226 38057 169 12892 13729 -837 51118 51786 -668 -475 -301 110 -0.3 17.91987-88 44000 45088 -1088 15806 14783 1023 59806 59871 -65 -262 112 85 1.8 18.71988-89 50421 52228 -1807 17037 14850 2187 67458 67078 380 -280 855 -196 2.7 17.41989-90 56535 60217 -3682 20086 16565 3521 76621 76782 -161 43 60 -264 4.8 20.11990-91 66467 71776 -5309 24693 19312 5381 91160 91088 72 -266 265 72 5.8 20.61991-92 80535 86186 -5651 27238 21743 5495 107773 107929 -156 -629 685 -212 5.2 17.51992-93 91090 96205 -5115 30073 23129 6944 121163 119334 1829 -602 2248 183 4.3 17.51993-94 105564 109376 -3812 28623 25272 3351 134187 134648 -461 -561 137 -38 2.8 15.31994-95 122284 128440 -6156 43738 33114 10624 166022 161554 4468 -1173 3667 1974 3.8 17.11995-96 136803 145004 -8201 43630 32580 11050 180433 177584 2849 465 3589 -1204 4.6 17.71996-97 152836 168950 -16114 42891 33819 9072 195727 202769 -7042 -6794 415 -663 7.9 18.41997-98 170301 186634 -16333 59937 41501 18436 230238 228135 2103 561 -385 1926 7.2 19.41998-99 176448 220090 -43642 86394 46271 40123 262841 266361 -3520 33690 -32982 -4228 16.4 27.91999-00 207201 260998 -53797 103575 52891 50684 310776 313889 -3113 625 -1268 -2470 17.1 29.12000-01 237953 291522 -53569 111591 55677 55914 349544 347198 2346 849 727 769 15.4 25.82001-02RE270901 331440 -60539 123532 70131 53401 394433 401571 -7138 -7330 -763 954 15.1 26.52001-02 255675 314863 -59188 118210 62448 55762 373885 377311 -3426 637 -1203 -2860 15.7 25.42002-03BE307076 355155 -48079 118811 75763 43048 425888 430919 -5031 -5038 -43 50 11.2 23.92002-03RE294008 355248 -61239 143443 87393 56049 437451 442641 -5189 -7474 -491 2776 13.9 26.42003-04BE334290 382616 -48326 146935 105743 41191 481225 488360 -7134 -6881 338 -591 9.9 23.8
@ Excluding (i) Ways and means advances (WMA) from the RBI and (ii) purchases/sales of securities from cash balance investment account; these serve as financing items for overall deficit (see cols. 12 and 13).
Notes: (1) In column 14 negative sign represents surplus. (2) Overall surplus or deficit shown in col. 10 represents conventional deficit, that is, the difference between aggregate disbursements and aggregate receipts without any adjustments except for entries relating to temporary financing items mentioned above (3) The above aggregate disbursements and aggregate receipts are adjusted somewhat for deriving the figures of gross fiscal deficit (GFD). Thus, GFD is the difference between aggregate disbursements net of debt repayments and recovery of loans and total receipts consisting of revenue receipts and non-debt capital receipts (i.e., in practice, only disinvestment proceeds). (4) Data for capital receipts prior to 1991-92 have been adjusted for remittances (net). Therefore the figures for capital receipts provided in table 2 may not match with the corresponding figures in table 5.
Source: With a view to maintaining consistency in the series, this table is prepared from RBI's Handbook of Statistics on Indian Economy, 2002-03 and earlier issues. While the state budget articles include net remittances in both receipts and disbursements on capital account, the Handbook series does not do so. Hence, the latter series are preferred. However, the deficit figures remain unchanged across sources. (see RBI's annual study on State Finances 2003-04, p.S2)
Appendix Table 2: Consolidated Budgetary Position of State Governments at a Glance
Capital Account@ Revenue Account Aggregate Financing of Overall Surplus(+)/Deficit()
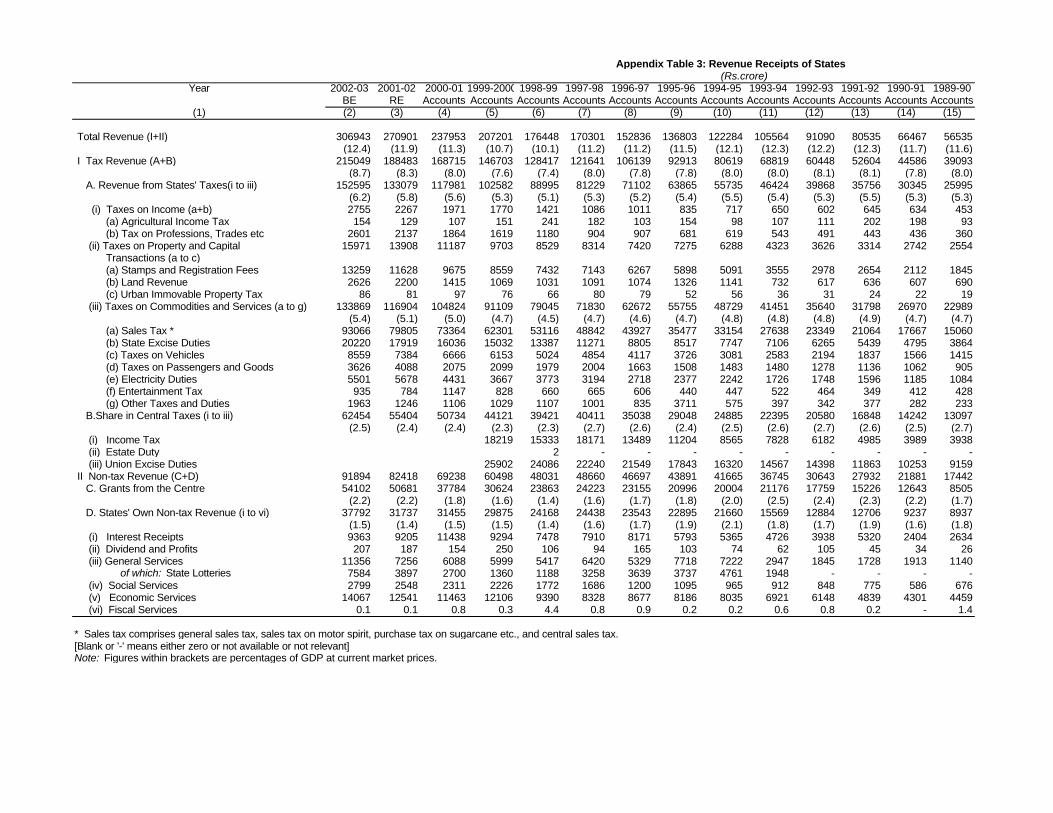
Year 2002-03 2001-02 2000-01 1999-2000 1998-99 1997-98 1996-97 1995-96 1994-95 1993-94 1992-93 1991-92 1990-91 1989-90BE RE Accounts Accounts Accounts Accounts Accounts Accounts Accounts Accounts Accounts Accounts Accounts Accounts
(1) (2) (3) (4) (5) (6) (7) (8) (9) (10) (11) (12) (13) (14) (15)
Total Revenue (I+II) 306943 270901 237953 207201 176448 170301 152836 136803 122284 105564 91090 80535 66467 56535(12.4) (11.9) (11.3) (10.7) (10.1) (11.2) (11.2) (11.5) (12.1) (12.3) (12.2) (12.3) (11.7) (11.6)
I Tax Revenue (A+B) 215049 188483 168715 146703 128417 121641 106139 92913 80619 68819 60448 52604 44586 39093(8.7) (8.3) (8.0) (7.6) (7.4) (8.0) (7.8) (7.8) (8.0) (8.0) (8.1) (8.1) (7.8) (8.0)
A. Revenue from States' Taxes(i to iii) 152595 133079 117981 102582 88995 81229 71102 63865 55735 46424 39868 35756 30345 25995(6.2) (5.8) (5.6) (5.3) (5.1) (5.3) (5.2) (5.4) (5.5) (5.4) (5.3) (5.5) (5.3) (5.3)
(i) Taxes on Income (a+b) 2755 2267 1971 1770 1421 1086 1011 835 717 650 602 645 634 453 (a) Agricultural Income Tax 154 129 107 151 241 182 103 154 98 107 111 202 198 93 (b) Tax on Professions, Trades etc 2601 2137 1864 1619 1180 904 907 681 619 543 491 443 436 360 (ii) Taxes on Property and Capital 15971 13908 11187 9703 8529 8314 7420 7275 6288 4323 3626 3314 2742 2554 Transactions (a to c) (a) Stamps and Registration Fees 13259 11628 9675 8559 7432 7143 6267 5898 5091 3555 2978 2654 2112 1845 (b) Land Revenue 2626 2200 1415 1069 1031 1091 1074 1326 1141 732 617 636 607 690 (c) Urban Immovable Property Tax 86 81 97 76 66 80 79 52 56 36 31 24 22 19 (iii) Taxes on Commodities and Services (a to g) 133869 116904 104824 91109 79045 71830 62672 55755 48729 41451 35640 31798 26970 22989
(5.4) (5.1) (5.0) (4.7) (4.5) (4.7) (4.6) (4.7) (4.8) (4.8) (4.8) (4.9) (4.7) (4.7) (a) Sales Tax * 93066 79805 73364 62301 53116 48842 43927 35477 33154 27638 23349 21064 17667 15060 (b) State Excise Duties 20220 17919 16036 15032 13387 11271 8805 8517 7747 7106 6265 5439 4795 3864 (c) Taxes on Vehicles 8559 7384 6666 6153 5024 4854 4117 3726 3081 2583 2194 1837 1566 1415 (d) Taxes on Passengers and Goods 3626 4088 2075 2099 1979 2004 1663 1508 1483 1480 1278 1136 1062 905 (e) Electricity Duties 5501 5678 4431 3667 3773 3194 2718 2377 2242 1726 1748 1596 1185 1084 (f) Entertainment Tax 935 784 1147 828 660 665 606 440 447 522 464 349 412 428 (g) Other Taxes and Duties 1963 1246 1106 1029 1107 1001 835 3711 575 397 342 377 282 233 B.Share in Central Taxes (i to iii) 62454 55404 50734 44121 39421 40411 35038 29048 24885 22395 20580 16848 14242 13097
(2.5) (2.4) (2.4) (2.3) (2.3) (2.7) (2.6) (2.4) (2.5) (2.6) (2.7) (2.6) (2.5) (2.7) (i) Income Tax 18219 15333 18171 13489 11204 8565 7828 6182 4985 3989 3938 (ii) Estate Duty 2 - - - - - - - - - (iii) Union Excise Duties 25902 24086 22240 21549 17843 16320 14567 14398 11863 10253 9159 II Non-tax Revenue (C+D) 91894 82418 69238 60498 48031 48660 46697 43891 41665 36745 30643 27932 21881 17442 C. Grants from the Centre 54102 50681 37784 30624 23863 24223 23155 20996 20004 21176 17759 15226 12643 8505
(2.2) (2.2) (1.8) (1.6) (1.4) (1.6) (1.7) (1.8) (2.0) (2.5) (2.4) (2.3) (2.2) (1.7) D. States' Own Non-tax Revenue (i to vi) 37792 31737 31455 29875 24168 24438 23543 22895 21660 15569 12884 12706 9237 8937
(1.5) (1.4) (1.5) (1.5) (1.4) (1.6) (1.7) (1.9) (2.1) (1.8) (1.7) (1.9) (1.6) (1.8) (i) Interest Receipts 9363 9205 11438 9294 7478 7910 8171 5793 5365 4726 3938 5320 2404 2634 (ii) Dividend and Profits 207 187 154 250 106 94 165 103 74 62 105 45 34 26 (iii) General Services 11356 7256 6088 5999 5417 6420 5329 7718 7222 2947 1845 1728 1913 1140 of which: State Lotteries 7584 3897 2700 1360 1188 3258 3639 3737 4761 1948 - - - - (iv) Social Services 2799 2548 2311 2226 1772 1686 1200 1095 965 912 848 775 586 676 (v) Economic Services 14067 12541 11463 12106 9390 8328 8677 8186 8035 6921 6148 4839 4301 4459 (vi) Fiscal Services 0.1 0.1 0.8 0.3 4.4 0.8 0.9 0.2 0.2 0.6 0.8 0.2 - 1.4 * Sales tax comprises general sales tax, sales tax on motor spirit, purchase tax on sugarcane etc., and central sales tax.[Blank or '-' means either zero or not available or not relevant]Note: Figures within brackets are percentages of GDP at current market prices.
Appendix Table 3: Revenue Receipts of States(Rs.crore)
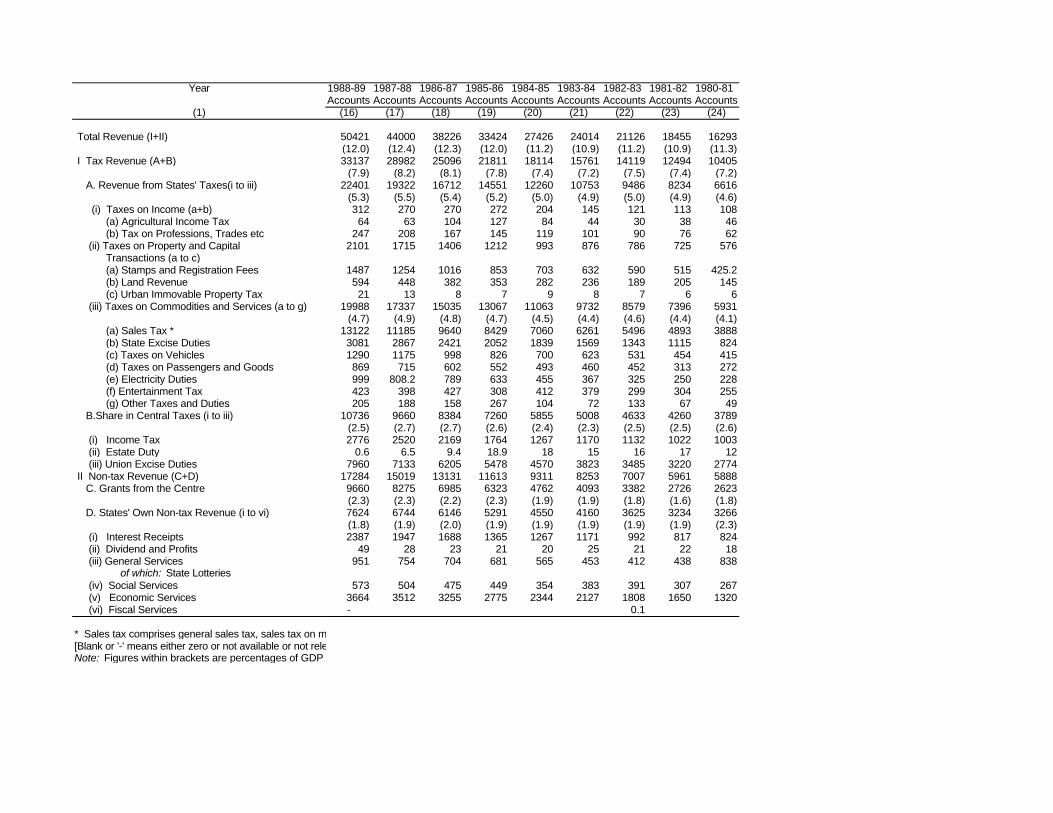
Year
(1)
Total Revenue (I+II)
I Tax Revenue (A+B)
A. Revenue from States' Taxes(i to iii)
(i) Taxes on Income (a+b) (a) Agricultural Income Tax (b) Tax on Professions, Trades etc (ii) Taxes on Property and Capital Transactions (a to c) (a) Stamps and Registration Fees (b) Land Revenue (c) Urban Immovable Property Tax (iii) Taxes on Commodities and Services (a to g)
(a) Sales Tax * (b) State Excise Duties (c) Taxes on Vehicles (d) Taxes on Passengers and Goods (e) Electricity Duties (f) Entertainment Tax (g) Other Taxes and Duties B.Share in Central Taxes (i to iii)
(i) Income Tax (ii) Estate Duty (iii) Union Excise Duties II Non-tax Revenue (C+D) C. Grants from the Centre
D. States' Own Non-tax Revenue (i to vi)
(i) Interest Receipts (ii) Dividend and Profits (iii) General Services of which: State Lotteries (iv) Social Services (v) Economic Services (vi) Fiscal Services * Sales tax comprises general sales tax, sales tax on motor spirit, purchase tax on sugarcane etc., and central sales tax.[Blank or '-' means either zero or not available or not relevant]Note: Figures within brackets are percentages of GDP at current market prices.
1988-89 1987-88 1986-87 1985-86 1984-85 1983-84 1982-83 1981-82 1980-81Accounts Accounts Accounts Accounts Accounts Accounts Accounts Accounts Accounts
(16) (17) (18) (19) (20) (21) (22) (23) (24)
50421 44000 38226 33424 27426 24014 21126 18455 16293(12.0) (12.4) (12.3) (12.0) (11.2) (10.9) (11.2) (10.9) (11.3)33137 28982 25096 21811 18114 15761 14119 12494 10405
(7.9) (8.2) (8.1) (7.8) (7.4) (7.2) (7.5) (7.4) (7.2)22401 19322 16712 14551 12260 10753 9486 8234 6616
(5.3) (5.5) (5.4) (5.2) (5.0) (4.9) (5.0) (4.9) (4.6)312 270 270 272 204 145 121 113 10864 63 104 127 84 44 30 38 46
247 208 167 145 119 101 90 76 622101 1715 1406 1212 993 876 786 725 576
1487 1254 1016 853 703 632 590 515 425.2594 448 382 353 282 236 189 205 14521 13 8 7 9 8 7 6 6
19988 17337 15035 13067 11063 9732 8579 7396 5931(4.7) (4.9) (4.8) (4.7) (4.5) (4.4) (4.6) (4.4) (4.1)
13122 11185 9640 8429 7060 6261 5496 4893 38883081 2867 2421 2052 1839 1569 1343 1115 8241290 1175 998 826 700 623 531 454 415869 715 602 552 493 460 452 313 272999 808.2 789 633 455 367 325 250 228423 398 427 308 412 379 299 304 255205 188 158 267 104 72 133 67 49
10736 9660 8384 7260 5855 5008 4633 4260 3789(2.5) (2.7) (2.7) (2.6) (2.4) (2.3) (2.5) (2.5) (2.6)2776 2520 2169 1764 1267 1170 1132 1022 1003
0.6 6.5 9.4 18.9 18 15 16 17 127960 7133 6205 5478 4570 3823 3485 3220 2774
17284 15019 13131 11613 9311 8253 7007 5961 58889660 8275 6985 6323 4762 4093 3382 2726 2623(2.3) (2.3) (2.2) (2.3) (1.9) (1.9) (1.8) (1.6) (1.8)7624 6744 6146 5291 4550 4160 3625 3234 3266(1.8) (1.9) (2.0) (1.9) (1.9) (1.9) (1.9) (1.9) (2.3)2387 1947 1688 1365 1267 1171 992 817 824
49 28 23 21 20 25 21 22 18951 754 704 681 565 453 412 438 838
573 504 475 449 354 383 391 307 2673664 3512 3255 2775 2344 2127 1808 1650 1320- 0.1
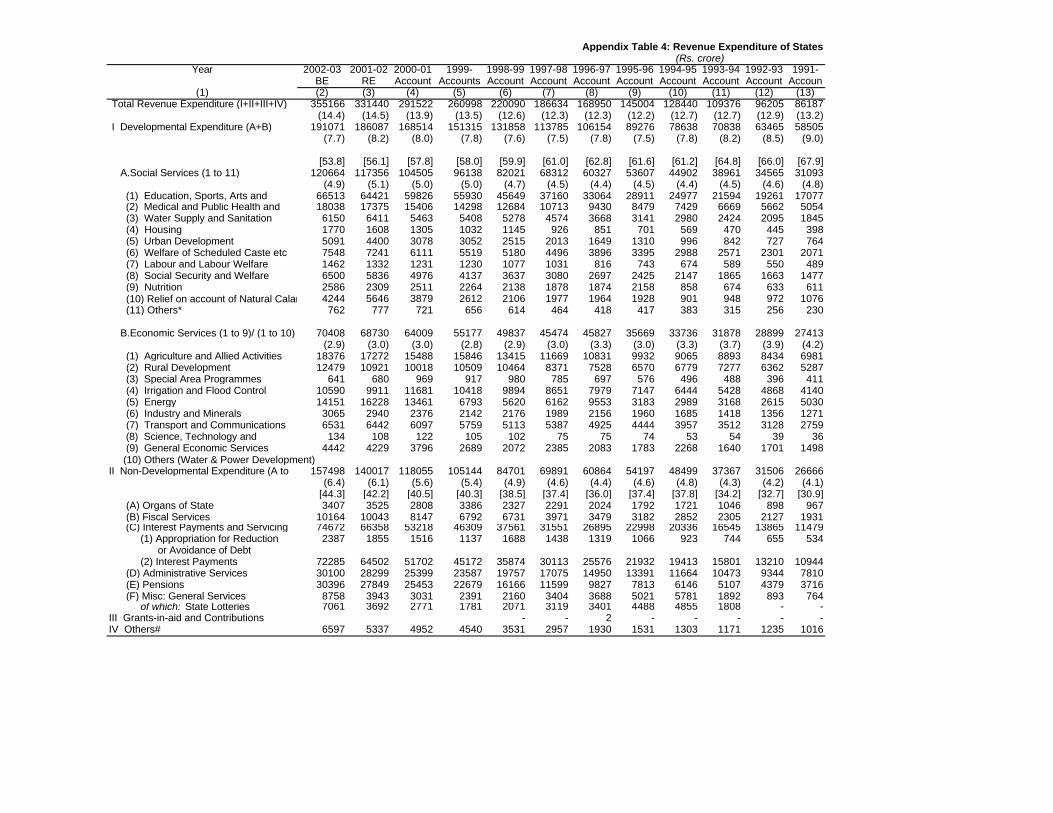
Year 2002-03 2001-02 2000-01 1999- 1998-99 1997-98 1996-97 1995-96 1994-95 1993-94 1992-93 1991-BE RE Account Accounts Account Account Account Account Account Account Account Accoun
(1) (2) (3) (4) (5) (6) (7) (8) (9) (10) (11) (12) (13) Total Revenue Expenditure (I+II+III+IV) 355166 331440 291522 260998 220090 186634 168950 145004 128440 109376 96205 86187
(14.4) (14.5) (13.9) (13.5) (12.6) (12.3) (12.3) (12.2) (12.7) (12.7) (12.9) (13.2) I Developmental Expenditure (A+B) 191071 186087 168514 151315 131858 113785 106154 89276 78638 70838 63465 58505
(7.7) (8.2) (8.0) (7.8) (7.6) (7.5) (7.8) (7.5) (7.8) (8.2) (8.5) (9.0)
[53.8] [56.1] [57.8] [58.0] [59.9] [61.0] [62.8] [61.6] [61.2] [64.8] [66.0] [67.9] A.Social Services (1 to 11) 120664 117356 104505 96138 82021 68312 60327 53607 44902 38961 34565 31093
(4.9) (5.1) (5.0) (5.0) (4.7) (4.5) (4.4) (4.5) (4.4) (4.5) (4.6) (4.8) (1) Education, Sports, Arts and 66513 64421 59826 55930 45649 37160 33064 28911 24977 21594 19261 17077 (2) Medical and Public Health and 18038 17375 15406 14298 12684 10713 9430 8479 7429 6669 5662 5054 (3) Water Supply and Sanitation 6150 6411 5463 5408 5278 4574 3668 3141 2980 2424 2095 1845 (4) Housing 1770 1608 1305 1032 1145 926 851 701 569 470 445 398 (5) Urban Development 5091 4400 3078 3052 2515 2013 1649 1310 996 842 727 764 (6) Welfare of Scheduled Caste etc 7548 7241 6111 5519 5180 4496 3896 3395 2988 2571 2301 2071 (7) Labour and Labour Welfare 1462 1332 1231 1230 1077 1031 816 743 674 589 550 489 (8) Social Security and Welfare 6500 5836 4976 4137 3637 3080 2697 2425 2147 1865 1663 1477 (9) Nutrition 2586 2309 2511 2264 2138 1878 1874 2158 858 674 633 611 (10) Relief on account of Natural Calamities4244 5646 3879 2612 2106 1977 1964 1928 901 948 972 1076 (11) Others* 762 777 721 656 614 464 418 417 383 315 256 230
B.Economic Services (1 to 9)/ (1 to 10) 70408 68730 64009 55177 49837 45474 45827 35669 33736 31878 28899 27413(2.9) (3.0) (3.0) (2.8) (2.9) (3.0) (3.3) (3.0) (3.3) (3.7) (3.9) (4.2)
(1) Agriculture and Allied Activities 18376 17272 15488 15846 13415 11669 10831 9932 9065 8893 8434 6981 (2) Rural Development 12479 10921 10018 10509 10464 8371 7528 6570 6779 7277 6362 5287 (3) Special Area Programmes 641 680 969 917 980 785 697 576 496 488 396 411 (4) Irrigation and Flood Control 10590 9911 11681 10418 9894 8651 7979 7147 6444 5428 4868 4140 (5) Energy 14151 16228 13461 6793 5620 6162 9553 3183 2989 3168 2615 5030 (6) Industry and Minerals 3065 2940 2376 2142 2176 1989 2156 1960 1685 1418 1356 1271 (7) Transport and Communications 6531 6442 6097 5759 5113 5387 4925 4444 3957 3512 3128 2759 (8) Science, Technology and 134 108 122 105 102 75 75 74 53 54 39 36 (9) General Economic Services 4442 4229 3796 2689 2072 2385 2083 1783 2268 1640 1701 1498 (10) Others (Water & Power Development)II Non-Developmental Expenditure (A to 157498 140017 118055 105144 84701 69891 60864 54197 48499 37367 31506 26666
(6.4) (6.1) (5.6) (5.4) (4.9) (4.6) (4.4) (4.6) (4.8) (4.3) (4.2) (4.1)[44.3] [42.2] [40.5] [40.3] [38.5] [37.4] [36.0] [37.4] [37.8] [34.2] [32.7] [30.9]
(A) Organs of State 3407 3525 2808 3386 2327 2291 2024 1792 1721 1046 898 967 (B) Fiscal Services 10164 10043 8147 6792 6731 3971 3479 3182 2852 2305 2127 1931 (C) Interest Payments and Servicing 74672 66358 53218 46309 37561 31551 26895 22998 20336 16545 13865 11479 (1) Appropriation for Reduction 2387 1855 1516 1137 1688 1438 1319 1066 923 744 655 534 or Avoidance of Debt (2) Interest Payments 72285 64502 51702 45172 35874 30113 25576 21932 19413 15801 13210 10944 (D) Administrative Services 30100 28299 25399 23587 19757 17075 14950 13391 11664 10473 9344 7810 (E) Pensions 30396 27849 25453 22679 16166 11599 9827 7813 6146 5107 4379 3716 (F) Misc: General Services 8758 3943 3031 2391 2160 3404 3688 5021 5781 1892 893 764 of which: State Lotteries 7061 3692 2771 1781 2071 3119 3401 4488 4855 1808 - -III Grants-in-aid and Contributions - - 2 - - - - -IV Others# 6597 5337 4952 4540 3531 2957 1930 1531 1303 1171 1235 1016
Appendix Table 4: Revenue Expenditure of States (Rs. crore)
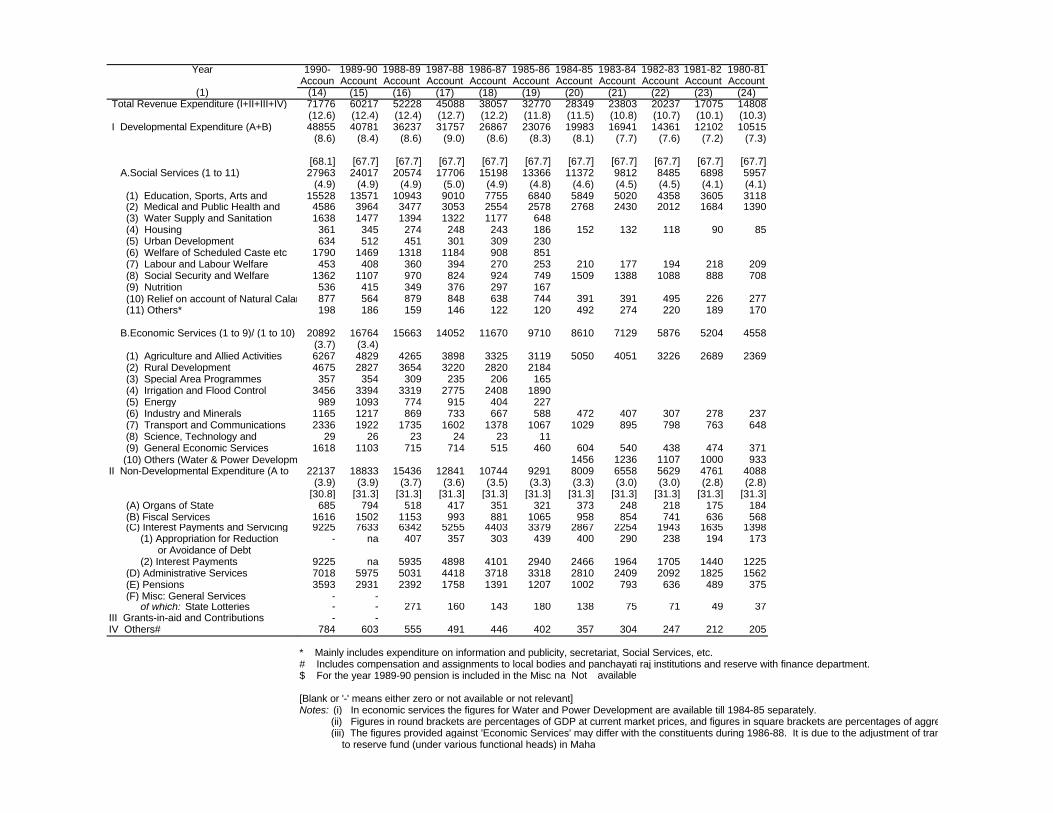
Year
(1) Total Revenue Expenditure (I+II+III+IV)
I Developmental Expenditure (A+B)
A.Social Services (1 to 11)
(1) Education, Sports, Arts and (2) Medical and Public Health and (3) Water Supply and Sanitation (4) Housing (5) Urban Development (6) Welfare of Scheduled Caste etc (7) Labour and Labour Welfare (8) Social Security and Welfare (9) Nutrition (10) Relief on account of Natural Calamities (11) Others*
B.Economic Services (1 to 9)/ (1 to 10)
(1) Agriculture and Allied Activities (2) Rural Development (3) Special Area Programmes (4) Irrigation and Flood Control (5) Energy (6) Industry and Minerals (7) Transport and Communications (8) Science, Technology and (9) General Economic Services (10) Others (Water & Power Development)II Non-Developmental Expenditure (A to
(A) Organs of State (B) Fiscal Services (C) Interest Payments and Servicing (1) Appropriation for Reduction or Avoidance of Debt (2) Interest Payments (D) Administrative Services (E) Pensions (F) Misc: General Services of which: State LotteriesIII Grants-in-aid and ContributionsIV Others#
1990- 1989-90 1988-89 1987-88 1986-87 1985-86 1984-85 1983-84 1982-83 1981-82 1980-81Accoun Account Account Account Account Account Account Account Account Account Account
(14) (15) (16) (17) (18) (19) (20) (21) (22) (23) (24)71776 60217 52228 45088 38057 32770 28349 23803 20237 17075 14808(12.6) (12.4) (12.4) (12.7) (12.2) (11.8) (11.5) (10.8) (10.7) (10.1) (10.3)48855 40781 36237 31757 26867 23076 19983 16941 14361 12102 10515
(8.6) (8.4) (8.6) (9.0) (8.6) (8.3) (8.1) (7.7) (7.6) (7.2) (7.3)
[68.1] [67.7] [67.7] [67.7] [67.7] [67.7] [67.7] [67.7] [67.7] [67.7] [67.7]27963 24017 20574 17706 15198 13366 11372 9812 8485 6898 5957
(4.9) (4.9) (4.9) (5.0) (4.9) (4.8) (4.6) (4.5) (4.5) (4.1) (4.1)15528 13571 10943 9010 7755 6840 5849 5020 4358 3605 3118
4586 3964 3477 3053 2554 2578 2768 2430 2012 1684 13901638 1477 1394 1322 1177 648
361 345 274 248 243 186 152 132 118 90 85634 512 451 301 309 230
1790 1469 1318 1184 908 851453 408 360 394 270 253 210 177 194 218 209
1362 1107 970 824 924 749 1509 1388 1088 888 708536 415 349 376 297 167877 564 879 848 638 744 391 391 495 226 277198 186 159 146 122 120 492 274 220 189 170
20892 16764 15663 14052 11670 9710 8610 7129 5876 5204 4558(3.7) (3.4)6267 4829 4265 3898 3325 3119 5050 4051 3226 2689 23694675 2827 3654 3220 2820 2184
357 354 309 235 206 1653456 3394 3319 2775 2408 1890
989 1093 774 915 404 2271165 1217 869 733 667 588 472 407 307 278 2372336 1922 1735 1602 1378 1067 1029 895 798 763 648
29 26 23 24 23 111618 1103 715 714 515 460 604 540 438 474 371
1456 1236 1107 1000 93322137 18833 15436 12841 10744 9291 8009 6558 5629 4761 4088
(3.9) (3.9) (3.7) (3.6) (3.5) (3.3) (3.3) (3.0) (3.0) (2.8) (2.8)[30.8] [31.3] [31.3] [31.3] [31.3] [31.3] [31.3] [31.3] [31.3] [31.3] [31.3]
685 794 518 417 351 321 373 248 218 175 1841616 1502 1153 993 881 1065 958 854 741 636 5689225 7633 6342 5255 4403 3379 2867 2254 1943 1635 1398
- na 407 357 303 439 400 290 238 194 173
9225 na 5935 4898 4101 2940 2466 1964 1705 1440 12257018 5975 5031 4418 3718 3318 2810 2409 2092 1825 15623593 2931 2392 1758 1391 1207 1002 793 636 489 375
- -- - 271 160 143 180 138 75 71 49 37- -
784 603 555 491 446 402 357 304 247 212 205
* Mainly includes expenditure on information and publicity, secretariat, Social Services, etc.# Includes compensation and assignments to local bodies and panchayati raj institutions and reserve with finance department.$ For the year 1989-90 pension is included in the Misc. general servicesna Not available
[Blank or '-' means either zero or not available or not relevant]Notes: (i) In economic services the figures for Water and Power Development are available till 1984-85 separately. (ii) Figures in round brackets are percentages of GDP at current market prices, and figures in square brackets are percentages of aggregate revenue expenditure. (iii) The figures provided against 'Economic Services' may differ with the constituents during 1986-88. It is due to the adjustment of transfers
to reserve fund (under various functional heads) in Maharashtra.
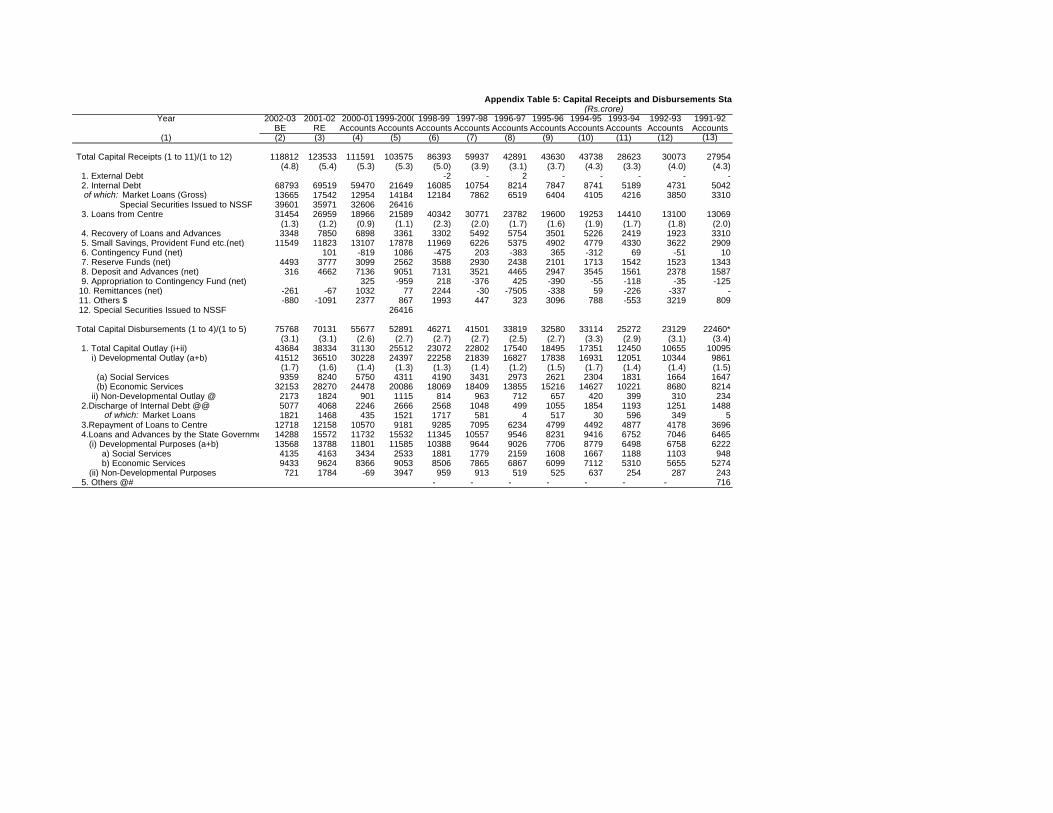
Year 2002-03 2001-02 2000-01 1999-2000 1998-99 1997-98 1996-97 1995-96 1994-95 1993-94 1992-93 1991-92BE RE Accounts Accounts Accounts Accounts Accounts Accounts Accounts Accounts Accounts Accounts
(1) (2) (3) (4) (5) (6) (7) (8) (9) (10) (11) (12) (13)
Total Capital Receipts (1 to 11)/(1 to 12) 118812 123533 111591 103575 86393 59937 42891 43630 43738 28623 30073 27954(4.8) (5.4) (5.3) (5.3) (5.0) (3.9) (3.1) (3.7) (4.3) (3.3) (4.0) (4.3)
1. External Debt -2 - 2 - - - - - 2. Internal Debt 68793 69519 59470 21649 16085 10754 8214 7847 8741 5189 4731 5042 of which: Market Loans (Gross) 13665 17542 12954 14184 12184 7862 6519 6404 4105 4216 3850 3310 Special Securities Issued to NSSF 39601 35971 32606 26416 3. Loans from Centre 31454 26959 18966 21589 40342 30771 23782 19600 19253 14410 13100 13069
(1.3) (1.2) (0.9) (1.1) (2.3) (2.0) (1.7) (1.6) (1.9) (1.7) (1.8) (2.0) 4. Recovery of Loans and Advances 3348 7850 6898 3361 3302 5492 5754 3501 5226 2419 1923 3310 5. Small Savings, Provident Fund etc.(net) 11549 11823 13107 17878 11969 6226 5375 4902 4779 4330 3622 2909 6. Contingency Fund (net) 101 -819 1086 -475 203 -383 365 -312 69 -51 10 7. Reserve Funds (net) 4493 3777 3099 2562 3588 2930 2438 2101 1713 1542 1523 1343 8. Deposit and Advances (net) 316 4662 7136 9051 7131 3521 4465 2947 3545 1561 2378 1587 9. Appropriation to Contingency Fund (net) 325 -959 218 -376 425 -390 -55 -118 -35 -125 10. Remittances (net) -261 -67 1032 77 2244 -30 -7505 -338 59 -226 -337 - 11. Others $ -880 -1091 2377 867 1993 447 323 3096 788 -553 3219 809 12. Special Securities Issued to NSSF 26416
Total Capital Disbursements (1 to 4)/(1 to 5) 75768 70131 55677 52891 46271 41501 33819 32580 33114 25272 23129 22460*(3.1) (3.1) (2.6) (2.7) (2.7) (2.7) (2.5) (2.7) (3.3) (2.9) (3.1) (3.4)
1. Total Capital Outlay (i+ii) 43684 38334 31130 25512 23072 22802 17540 18495 17351 12450 10655 10095 i) Developmental Outlay (a+b) 41512 36510 30228 24397 22258 21839 16827 17838 16931 12051 10344 9861
(1.7) (1.6) (1.4) (1.3) (1.3) (1.4) (1.2) (1.5) (1.7) (1.4) (1.4) (1.5) (a) Social Services 9359 8240 5750 4311 4190 3431 2973 2621 2304 1831 1664 1647 (b) Economic Services 32153 28270 24478 20086 18069 18409 13855 15216 14627 10221 8680 8214 ii) Non-Developmental Outlay @ 2173 1824 901 1115 814 963 712 657 420 399 310 234 2.Discharge of Internal Debt @@ 5077 4068 2246 2666 2568 1048 499 1055 1854 1193 1251 1488 of which: Market Loans 1821 1468 435 1521 1717 581 4 517 30 596 349 5 3.Repayment of Loans to Centre 12718 12158 10570 9181 9285 7095 6234 4799 4492 4877 4178 3696 4.Loans and Advances by the State Governments (i+ii)14288 15572 11732 15532 11345 10557 9546 8231 9416 6752 7046 6465 (i) Developmental Purposes (a+b) 13568 13788 11801 11585 10388 9644 9026 7706 8779 6498 6758 6222 a) Social Services 4135 4163 3434 2533 1881 1779 2159 1608 1667 1188 1103 948 b) Economic Services 9433 9624 8366 9053 8506 7865 6867 6099 7112 5310 5655 5274 (ii) Non-Developmental Purposes 721 1784 -69 3947 959 913 519 525 637 254 287 243 5. Others @# - - - - - - - 716
Appendix Table 5: Capital Receipts and Disbursements States(Rs.crore)
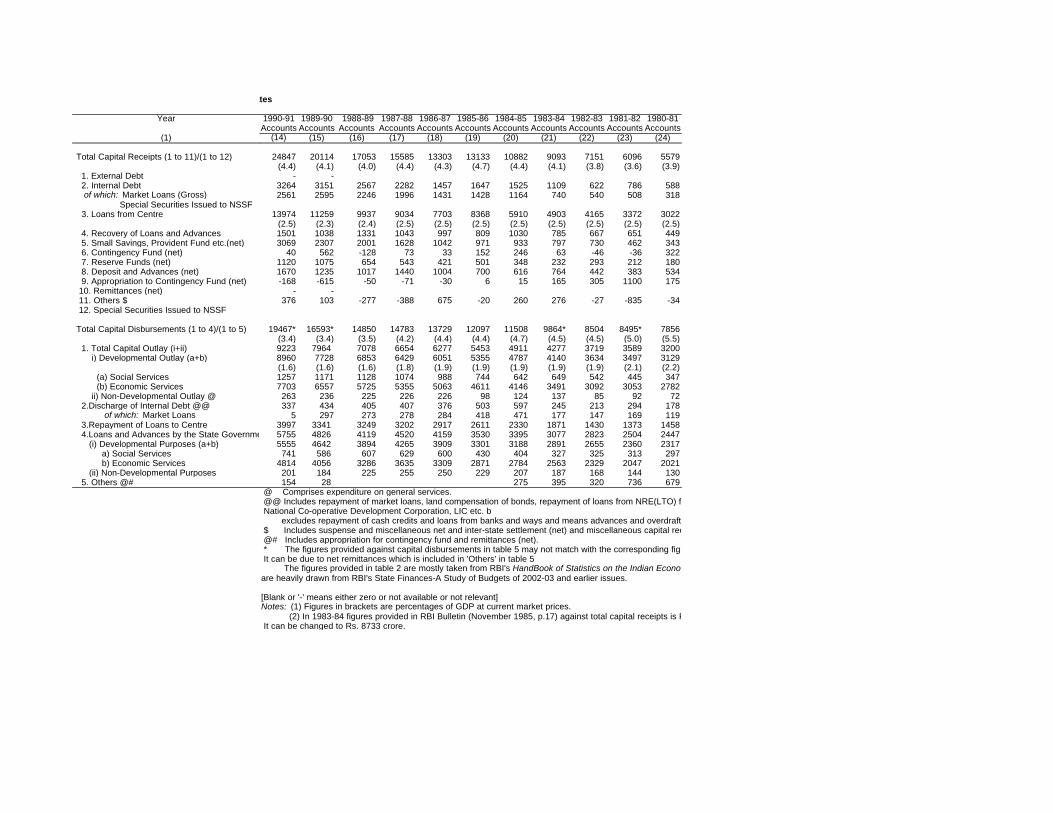
Year
(1)
Total Capital Receipts (1 to 11)/(1 to 12)
1. External Debt 2. Internal Debt of which: Market Loans (Gross) Special Securities Issued to NSSF 3. Loans from Centre
4. Recovery of Loans and Advances 5. Small Savings, Provident Fund etc.(net) 6. Contingency Fund (net) 7. Reserve Funds (net) 8. Deposit and Advances (net) 9. Appropriation to Contingency Fund (net) 10. Remittances (net) 11. Others $ 12. Special Securities Issued to NSSF
Total Capital Disbursements (1 to 4)/(1 to 5)
1. Total Capital Outlay (i+ii) i) Developmental Outlay (a+b)
(a) Social Services (b) Economic Services ii) Non-Developmental Outlay @ 2.Discharge of Internal Debt @@ of which: Market Loans 3.Repayment of Loans to Centre 4.Loans and Advances by the State Governments (i+ii) (i) Developmental Purposes (a+b) a) Social Services b) Economic Services (ii) Non-Developmental Purposes 5. Others @#
1990-91 1989-90 1988-89 1987-88 1986-87 1985-86 1984-85 1983-84 1982-83 1981-82 1980-81Accounts Accounts Accounts Accounts Accounts Accounts Accounts Accounts Accounts Accounts Accounts
(14) (15) (16) (17) (18) (19) (20) (21) (22) (23) (24)
24847 20114 17053 15585 13303 13133 10882 9093 7151 6096 5579(4.4) (4.1) (4.0) (4.4) (4.3) (4.7) (4.4) (4.1) (3.8) (3.6) (3.9)
- -3264 3151 2567 2282 1457 1647 1525 1109 622 786 5882561 2595 2246 1996 1431 1428 1164 740 540 508 318
13974 11259 9937 9034 7703 8368 5910 4903 4165 3372 3022(2.5) (2.3) (2.4) (2.5) (2.5) (2.5) (2.5) (2.5) (2.5) (2.5) (2.5)1501 1038 1331 1043 997 809 1030 785 667 651 4493069 2307 2001 1628 1042 971 933 797 730 462 343
40 562 -128 73 33 152 246 63 -46 -36 3221120 1075 654 543 421 501 348 232 293 212 1801670 1235 1017 1440 1004 700 616 764 442 383 534-168 -615 -50 -71 -30 6 15 165 305 1100 175
- -376 103 -277 -388 675 -20 260 276 -27 -835 -34
19467* 16593* 14850 14783 13729 12097 11508 9864* 8504 8495* 7856
(3.4) (3.4) (3.5) (4.2) (4.4) (4.4) (4.7) (4.5) (4.5) (5.0) (5.5)9223 7964 7078 6654 6277 5453 4911 4277 3719 3589 32008960 7728 6853 6429 6051 5355 4787 4140 3634 3497 3129(1.6) (1.6) (1.6) (1.8) (1.9) (1.9) (1.9) (1.9) (1.9) (2.1) (2.2)1257 1171 1128 1074 988 744 642 649 542 445 3477703 6557 5725 5355 5063 4611 4146 3491 3092 3053 2782263 236 225 226 226 98 124 137 85 92 72337 434 405 407 376 503 597 245 213 294 178
5 297 273 278 284 418 471 177 147 169 1193997 3341 3249 3202 2917 2611 2330 1871 1430 1373 14585755 4826 4119 4520 4159 3530 3395 3077 2823 2504 24475555 4642 3894 4265 3909 3301 3188 2891 2655 2360 2317741 586 607 629 600 430 404 327 325 313 297
4814 4056 3286 3635 3309 2871 2784 2563 2329 2047 2021201 184 225 255 250 229 207 187 168 144 130154 28 275 395 320 736 679
@ Comprises expenditure on general services. @@ Includes repayment of market loans, land compensation of bonds, repayment of loans from NRE(LTO) fund of NABARD,
excludes repayment of cash credits and loans from banks and ways and means advances and overdrafts from RBI. $ Includes suspense and miscellaneous net and inter-state settlement (net) and miscellaneous capital receipts. @# Includes appropriation for contingency fund and remittances (net). * The figures provided against capital disbursements in table 5 may not match with the corresponding figures in table 2. It can be due to net remittances which is included in 'Others' in table 5 The figures provided in table 2 are mostly taken from RBI's HandBook of Statistics on the Indian Economy are heavily drawn from RBI's State Finances-A Study of Budgets of 2002-03 and earlier issues.
[Blank or '-' means either zero or not available or not relevant]Notes: (1) Figures in brackets are percentages of GDP at current market prices. (2) In 1983-84 figures provided in RBI Bulletin (November 1985, p.17) against total capital receipts is Rs. 9093 crore. It can be changed to Rs. 8733 crore.
Appendix Table 5: Capital Receipts and Disbursements States
National Co-operative Development Corporation, LIC etc. but
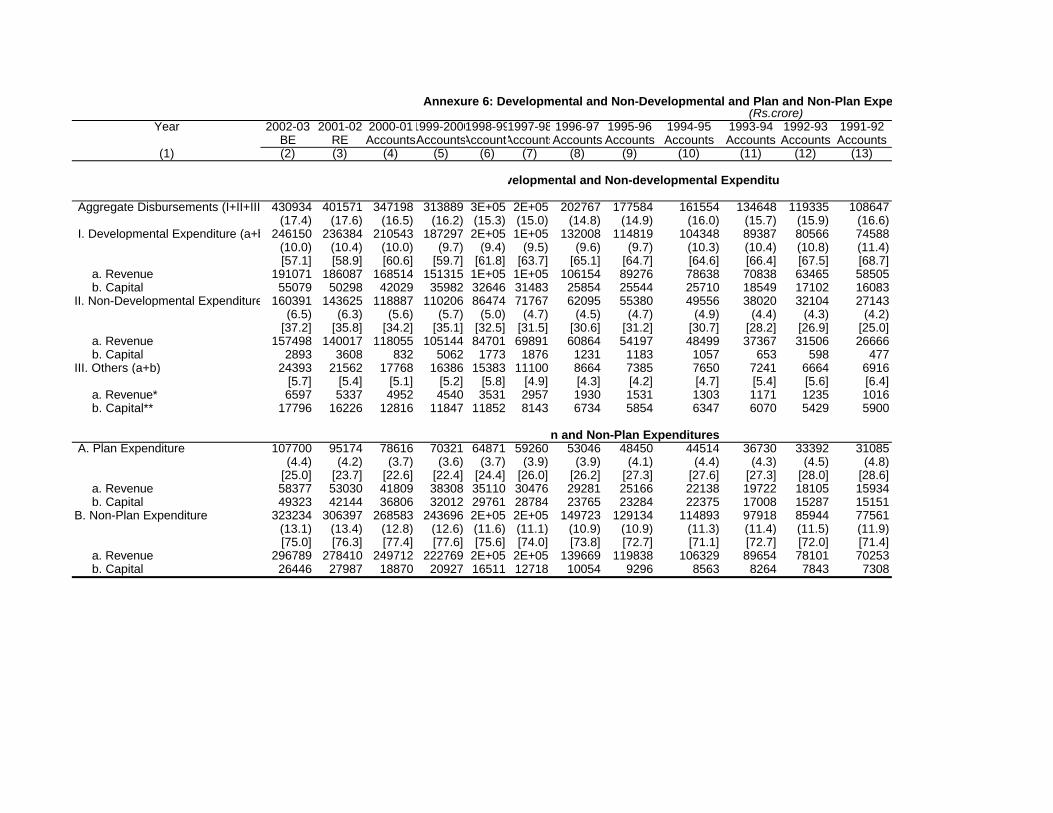
Year 2002-03 2001-02 2000-011999-20001998-991997-98 1996-97 1995-96 1994-95 1993-94 1992-93 1991-92BE RE AccountsAccountsAccountsAccountsAccounts Accounts Accounts Accounts Accounts Accounts
(1) (2) (3) (4) (5) (6) (7) (8) (9) (10) (11) (12) (13)
Aggregate Disbursements (I+II+III) 430934 401571 347198 313889 3E+05 2E+05 202767 177584 161554 134648 119335 108647(17.4) (17.6) (16.5) (16.2) (15.3) (15.0) (14.8) (14.9) (16.0) (15.7) (15.9) (16.6)
I. Developmental Expenditure (a+b) 246150 236384 210543 187297 2E+05 1E+05 132008 114819 104348 89387 80566 74588(10.0) (10.4) (10.0) (9.7) (9.4) (9.5) (9.6) (9.7) (10.3) (10.4) (10.8) (11.4)[57.1] [58.9] [60.6] [59.7] [61.8] [63.7] [65.1] [64.7] [64.6] [66.4] [67.5] [68.7]
a. Revenue 191071 186087 168514 151315 1E+05 1E+05 106154 89276 78638 70838 63465 58505 b. Capital 55079 50298 42029 35982 32646 31483 25854 25544 25710 18549 17102 16083II. Non-Developmental Expenditure (a+b) 160391 143625 118887 110206 86474 71767 62095 55380 49556 38020 32104 27143
(6.5) (6.3) (5.6) (5.7) (5.0) (4.7) (4.5) (4.7) (4.9) (4.4) (4.3) (4.2)[37.2] [35.8] [34.2] [35.1] [32.5] [31.5] [30.6] [31.2] [30.7] [28.2] [26.9] [25.0]
a. Revenue 157498 140017 118055 105144 84701 69891 60864 54197 48499 37367 31506 26666 b. Capital 2893 3608 832 5062 1773 1876 1231 1183 1057 653 598 477III. Others (a+b) 24393 21562 17768 16386 15383 11100 8664 7385 7650 7241 6664 6916
[5.7] [5.4] [5.1] [5.2] [5.8] [4.9] [4.3] [4.2] [4.7] [5.4] [5.6] [6.4] a. Revenue* 6597 5337 4952 4540 3531 2957 1930 1531 1303 1171 1235 1016 b. Capital** 17796 16226 12816 11847 11852 8143 6734 5854 6347 6070 5429 5900
A. Plan Expenditure 107700 95174 78616 70321 64871 59260 53046 48450 44514 36730 33392 31085(4.4) (4.2) (3.7) (3.6) (3.7) (3.9) (3.9) (4.1) (4.4) (4.3) (4.5) (4.8)
[25.0] [23.7] [22.6] [22.4] [24.4] [26.0] [26.2] [27.3] [27.6] [27.3] [28.0] [28.6] a. Revenue 58377 53030 41809 38308 35110 30476 29281 25166 22138 19722 18105 15934 b. Capital 49323 42144 36806 32012 29761 28784 23765 23284 22375 17008 15287 15151B. Non-Plan Expenditure 323234 306397 268583 243696 2E+05 2E+05 149723 129134 114893 97918 85944 77561
(13.1) (13.4) (12.8) (12.6) (11.6) (11.1) (10.9) (10.9) (11.3) (11.4) (11.5) (11.9)[75.0] [76.3] [77.4] [77.6] [75.6] [74.0] [73.8] [72.7] [71.1] [72.7] [72.0] [71.4]
a. Revenue 296789 278410 249712 222769 2E+05 2E+05 139669 119838 106329 89654 78101 70253 b. Capital 26446 27987 18870 20927 16511 12718 10054 9296 8563 8264 7843 7308
Annexure 6: Developmental and Non-Developmental and Plan and Non-Plan Expenditures Under Revenue and Capital Accounts.(Rs.crore)
Developmental and Non-developmental Expenditures
Plan and Non-Plan Expenditures
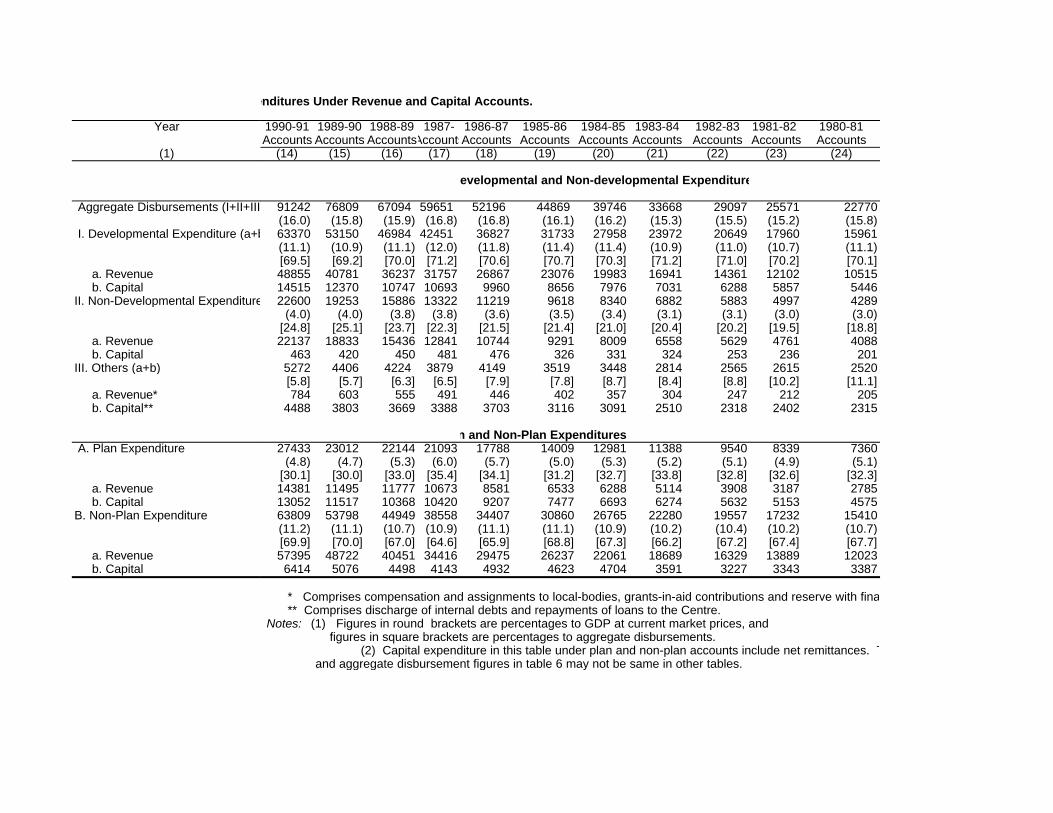
Year
(1)
Aggregate Disbursements (I+II+III)
I. Developmental Expenditure (a+b)
a. Revenue b. CapitalII. Non-Developmental Expenditure (a+b)
a. Revenue b. CapitalIII. Others (a+b)
a. Revenue* b. Capital**
A. Plan Expenditure
a. Revenue b. CapitalB. Non-Plan Expenditure
a. Revenue b. Capital
1990-91 1989-90 1988-89 1987- 1986-87 1985-86 1984-85 1983-84 1982-83 1981-82 1980-81Accounts Accounts AccountsAccountsAccounts Accounts Accounts Accounts Accounts Accounts Accounts
(14) (15) (16) (17) (18) (19) (20) (21) (22) (23) (24)
91242 76809 67094 59651 52196 44869 39746 33668 29097 25571 22770(16.0) (15.8) (15.9) (16.8) (16.8) (16.1) (16.2) (15.3) (15.5) (15.2) (15.8)63370 53150 46984 42451 36827 31733 27958 23972 20649 17960 15961(11.1) (10.9) (11.1) (12.0) (11.8) (11.4) (11.4) (10.9) (11.0) (10.7) (11.1)[69.5] [69.2] [70.0] [71.2] [70.6] [70.7] [70.3] [71.2] [71.0] [70.2] [70.1]48855 40781 36237 31757 26867 23076 19983 16941 14361 12102 1051514515 12370 10747 10693 9960 8656 7976 7031 6288 5857 544622600 19253 15886 13322 11219 9618 8340 6882 5883 4997 4289
(4.0) (4.0) (3.8) (3.8) (3.6) (3.5) (3.4) (3.1) (3.1) (3.0) (3.0)[24.8] [25.1] [23.7] [22.3] [21.5] [21.4] [21.0] [20.4] [20.2] [19.5] [18.8]22137 18833 15436 12841 10744 9291 8009 6558 5629 4761 4088
463 420 450 481 476 326 331 324 253 236 2015272 4406 4224 3879 4149 3519 3448 2814 2565 2615 2520[5.8] [5.7] [6.3] [6.5] [7.9] [7.8] [8.7] [8.4] [8.8] [10.2] [11.1]784 603 555 491 446 402 357 304 247 212 205
4488 3803 3669 3388 3703 3116 3091 2510 2318 2402 2315
27433 23012 22144 21093 17788 14009 12981 11388 9540 8339 7360(4.8) (4.7) (5.3) (6.0) (5.7) (5.0) (5.3) (5.2) (5.1) (4.9) (5.1)
[30.1] [30.0] [33.0] [35.4] [34.1] [31.2] [32.7] [33.8] [32.8] [32.6] [32.3]14381 11495 11777 10673 8581 6533 6288 5114 3908 3187 278513052 11517 10368 10420 9207 7477 6693 6274 5632 5153 457563809 53798 44949 38558 34407 30860 26765 22280 19557 17232 15410(11.2) (11.1) (10.7) (10.9) (11.1) (11.1) (10.9) (10.2) (10.4) (10.2) (10.7)[69.9] [70.0] [67.0] [64.6] [65.9] [68.8] [67.3] [66.2] [67.2] [67.4] [67.7]57395 48722 40451 34416 29475 26237 22061 18689 16329 13889 120236414 5076 4498 4143 4932 4623 4704 3591 3227 3343 3387
* Comprises compensation and assignments to local-bodies, grants-in-aid contributions and reserve with finance departments ** Comprises discharge of internal debts and repayments of loans to the Centre. Notes: (1) Figures in round brackets are percentages to GDP at current market prices, and figures in square brackets are percentages to aggregate disbursements.
(2) Capital expenditure in this table under plan and non-plan accounts include net remittances. Therefore capital expenditure and aggregate disbursement figures in table 6 may not be same in other tables.
Annexure 6: Developmental and Non-Developmental and Plan and Non-Plan Expenditures Under Revenue and Capital Accounts.
Plan and Non-Plan Expenditures
Developmental and Non-developmental Expenditures
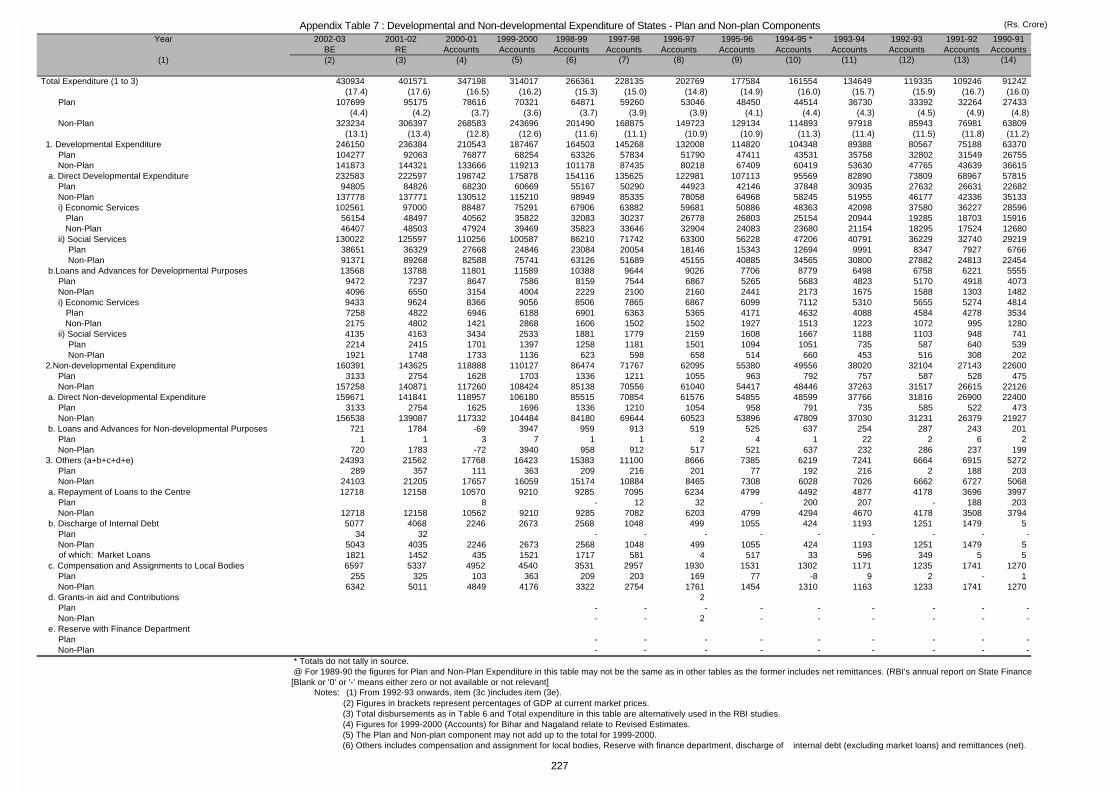
Appendix Table 7 : Developmental and Non-developmental Expenditure of States - Plan and Non-plan Components (Rs. Crore)
Year 2002-03 2001-02 2000-01 1999-2000 1998-99 1997-98 1996-97 1995-96 1994-95 * 1993-94 1992-93 1991-92 1990-91BE RE Accounts Accounts Accounts Accounts Accounts Accounts Accounts Accounts Accounts Accounts Accounts
(1) (2) (3) (4) (5) (6) (7) (8) (9) (10) (11) (12) (13) (14)
Total Expenditure (1 to 3) 430934 401571 347198 314017 266361 228135 202769 177584 161554 134649 119335 109246 91242(17.4) (17.6) (16.5) (16.2) (15.3) (15.0) (14.8) (14.9) (16.0) (15.7) (15.9) (16.7) (16.0)
Plan 107699 95175 78616 70321 64871 59260 53046 48450 44514 36730 33392 32264 27433(4.4) (4.2) (3.7) (3.6) (3.7) (3.9) (3.9) (4.1) (4.4) (4.3) (4.5) (4.9) (4.8)
Non-Plan 323234 306397 268583 243696 201490 168875 149723 129134 114893 97918 85943 76981 63809(13.1) (13.4) (12.8) (12.6) (11.6) (11.1) (10.9) (10.9) (11.3) (11.4) (11.5) (11.8) (11.2)
1. Developmental Expenditure 246150 236384 210543 187467 164503 145268 132008 114820 104348 89388 80567 75188 63370 Plan 104277 92063 76877 68254 63326 57834 51790 47411 43531 35758 32802 31549 26755 Non-Plan 141873 144321 133666 119213 101178 87435 80218 67409 60419 53630 47765 43639 36615 a. Direct Developmental Expenditure 232583 222597 198742 175878 154116 135625 122981 107113 95569 82890 73809 68967 57815 Plan 94805 84826 68230 60669 55167 50290 44923 42146 37848 30935 27632 26631 22682 Non-Plan 137778 137771 130512 115210 98949 85335 78058 64968 58245 51955 46177 42336 35133 i) Economic Services 102561 97000 88487 75291 67906 63882 59681 50886 48363 42098 37580 36227 28596 Plan 56154 48497 40562 35822 32083 30237 26778 26803 25154 20944 19285 18703 15916 Non-Plan 46407 48503 47924 39469 35823 33646 32904 24083 23680 21154 18295 17524 12680 ii) Social Services 130022 125597 110256 100587 86210 71742 63300 56228 47206 40791 36229 32740 29219 Plan 38651 36329 27668 24846 23084 20054 18146 15343 12694 9991 8347 7927 6766 Non-Plan 91371 89268 82588 75741 63126 51689 45155 40885 34565 30800 27882 24813 22454 b.Loans and Advances for Developmental Purposes 13568 13788 11801 11589 10388 9644 9026 7706 8779 6498 6758 6221 5555 Plan 9472 7237 8647 7586 8159 7544 6867 5265 5683 4823 5170 4918 4073 Non-Plan 4096 6550 3154 4004 2229 2100 2160 2441 2173 1675 1588 1303 1482 i) Economic Services 9433 9624 8366 9056 8506 7865 6867 6099 7112 5310 5655 5274 4814 Plan 7258 4822 6946 6188 6901 6363 5365 4171 4632 4088 4584 4278 3534 Non-Plan 2175 4802 1421 2868 1606 1502 1502 1927 1513 1223 1072 995 1280 ii) Social Services 4135 4163 3434 2533 1881 1779 2159 1608 1667 1188 1103 948 741 Plan 2214 2415 1701 1397 1258 1181 1501 1094 1051 735 587 640 539 Non-Plan 1921 1748 1733 1136 623 598 658 514 660 453 516 308 202 2.Non-developmental Expenditure 160391 143625 118888 110127 86474 71767 62095 55380 49556 38020 32104 27143 22600 Plan 3133 2754 1628 1703 1336 1211 1055 963 792 757 587 528 475 Non-Plan 157258 140871 117260 108424 85138 70556 61040 54417 48446 37263 31517 26615 22126 a. Direct Non-developmental Expenditure 159671 141841 118957 106180 85515 70854 61576 54855 48599 37766 31816 26900 22400 Plan 3133 2754 1625 1696 1336 1210 1054 958 791 735 585 522 473 Non-Plan 156538 139087 117332 104484 84180 69644 60523 53896 47809 37030 31231 26379 21927 b. Loans and Advances for Non-developmental Purposes 721 1784 -69 3947 959 913 519 525 637 254 287 243 201 Plan 1 1 3 7 1 1 2 4 1 22 2 6 2 Non-Plan 720 1783 -72 3940 958 912 517 521 637 232 286 237 199 3. Others (a+b+c+d+e) 24393 21562 17768 16423 15383 11100 8666 7385 6219 7241 6664 6915 5272 Plan 289 357 111 363 209 216 201 77 192 216 2 188 203 Non-Plan 24103 21205 17657 16059 15174 10884 8465 7308 6028 7026 6662 6727 5068 a. Repayment of Loans to the Centre 12718 12158 10570 9210 9285 7095 6234 4799 4492 4877 4178 3696 3997 Plan 8 - 12 32 - 200 207 - 188 203 Non-Plan 12718 12158 10562 9210 9285 7082 6203 4799 4294 4670 4178 3508 3794 b. Discharge of Internal Debt 5077 4068 2246 2673 2568 1048 499 1055 424 1193 1251 1479 5 Plan 34 32 - - - - - - - - - Non-Plan 5043 4035 2246 2673 2568 1048 499 1055 424 1193 1251 1479 5 of which: Market Loans 1821 1452 435 1521 1717 581 4 517 33 596 349 5 5 c. Compensation and Assignments to Local Bodies 6597 5337 4952 4540 3531 2957 1930 1531 1302 1171 1235 1741 1270 Plan 255 325 103 363 209 203 169 77 -8 9 2 - 1 Non-Plan 6342 5011 4849 4176 3322 2754 1761 1454 1310 1163 1233 1741 1270 d. Grants-in aid and Contributions 2 Plan - - - - - - - - - Non-Plan - - 2 - - - - - - e. Reserve with Finance Department Plan - - - - - - - - - Non-Plan - - - - - - - - -
* Totals do not tally in source. @ For 1989-90 the figures for Plan and Non-Plan Expenditure in this table may not be the same as in other tables as the former includes net remittances. (RBI's annual report on State Finance[Blank or '0' or '-' means either zero or not available or not relevant] Notes: (1) From 1992-93 onwards, item (3c )includes item (3e). (2) Figures in brackets represent percentages of GDP at current market prices. (3) Total disbursements as in Table 6 and Total expenditure in this table are alternatively used in the RBI studies. (4) Figures for 1999-2000 (Accounts) for Bihar and Nagaland relate to Revised Estimates. (5) The Plan and Non-plan component may not add up to the total for 1999-2000. (6) Others includes compensation and assignment for local bodies, Reserve with finance department, discharge of internal debt (excluding market loans) and remittances (net).
227
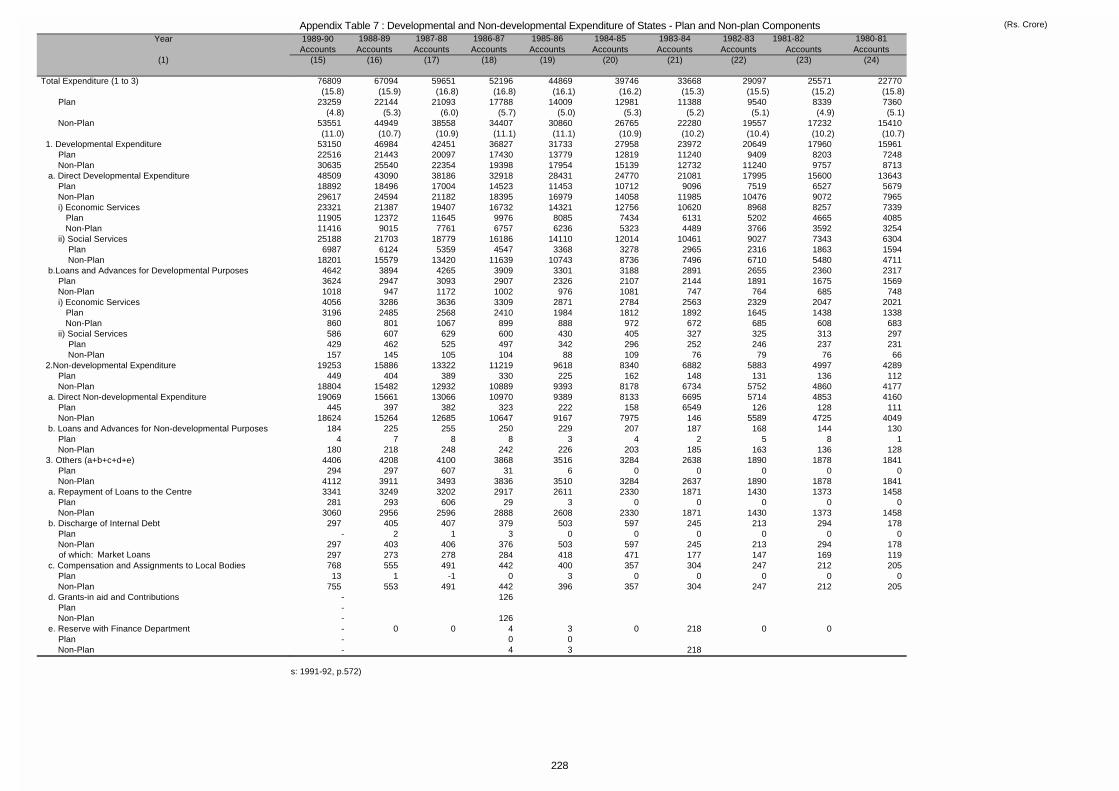
Appendix Table 7 : Developmental and Non-developmental Expenditure of States - Plan and Non-plan Components (Rs. Crore)
Year
(1)
Total Expenditure (1 to 3)
Plan
Non-Plan
1. Developmental Expenditure Plan Non-Plan a. Direct Developmental Expenditure Plan Non-Plan i) Economic Services Plan Non-Plan ii) Social Services Plan Non-Plan b.Loans and Advances for Developmental Purposes Plan Non-Plan i) Economic Services Plan Non-Plan ii) Social Services Plan Non-Plan 2.Non-developmental Expenditure Plan Non-Plan a. Direct Non-developmental Expenditure Plan Non-Plan b. Loans and Advances for Non-developmental Purposes Plan Non-Plan 3. Others (a+b+c+d+e) Plan Non-Plan a. Repayment of Loans to the Centre Plan Non-Plan b. Discharge of Internal Debt Plan Non-Plan of which: Market Loans c. Compensation and Assignments to Local Bodies Plan Non-Plan d. Grants-in aid and Contributions Plan Non-Plan e. Reserve with Finance Department Plan Non-Plan
1989-90 1988-89 1987-88 1986-87 1985-86 1984-85 1983-84 1982-83 1981-82 1980-81Accounts Accounts Accounts Accounts Accounts Accounts Accounts Accounts Accounts Accounts
(15) (16) (17) (18) (19) (20) (21) (22) (23) (24)
76809 67094 59651 52196 44869 39746 33668 29097 25571 22770(15.8) (15.9) (16.8) (16.8) (16.1) (16.2) (15.3) (15.5) (15.2) (15.8)
23259 22144 21093 17788 14009 12981 11388 9540 8339 7360(4.8) (5.3) (6.0) (5.7) (5.0) (5.3) (5.2) (5.1) (4.9) (5.1)
53551 44949 38558 34407 30860 26765 22280 19557 17232 15410(11.0) (10.7) (10.9) (11.1) (11.1) (10.9) (10.2) (10.4) (10.2) (10.7)
53150 46984 42451 36827 31733 27958 23972 20649 17960 1596122516 21443 20097 17430 13779 12819 11240 9409 8203 724830635 25540 22354 19398 17954 15139 12732 11240 9757 871348509 43090 38186 32918 28431 24770 21081 17995 15600 1364318892 18496 17004 14523 11453 10712 9096 7519 6527 567929617 24594 21182 18395 16979 14058 11985 10476 9072 796523321 21387 19407 16732 14321 12756 10620 8968 8257 733911905 12372 11645 9976 8085 7434 6131 5202 4665 408511416 9015 7761 6757 6236 5323 4489 3766 3592 325425188 21703 18779 16186 14110 12014 10461 9027 7343 63046987 6124 5359 4547 3368 3278 2965 2316 1863 1594
18201 15579 13420 11639 10743 8736 7496 6710 5480 47114642 3894 4265 3909 3301 3188 2891 2655 2360 23173624 2947 3093 2907 2326 2107 2144 1891 1675 15691018 947 1172 1002 976 1081 747 764 685 7484056 3286 3636 3309 2871 2784 2563 2329 2047 20213196 2485 2568 2410 1984 1812 1892 1645 1438 1338860 801 1067 899 888 972 672 685 608 683586 607 629 600 430 405 327 325 313 297429 462 525 497 342 296 252 246 237 231157 145 105 104 88 109 76 79 76 66
19253 15886 13322 11219 9618 8340 6882 5883 4997 4289449 404 389 330 225 162 148 131 136 112
18804 15482 12932 10889 9393 8178 6734 5752 4860 417719069 15661 13066 10970 9389 8133 6695 5714 4853 4160
445 397 382 323 222 158 6549 126 128 11118624 15264 12685 10647 9167 7975 146 5589 4725 4049
184 225 255 250 229 207 187 168 144 1304 7 8 8 3 4 2 5 8 1
180 218 248 242 226 203 185 163 136 1284406 4208 4100 3868 3516 3284 2638 1890 1878 1841294 297 607 31 6 0 0 0 0 0
4112 3911 3493 3836 3510 3284 2637 1890 1878 18413341 3249 3202 2917 2611 2330 1871 1430 1373 1458281 293 606 29 3 0 0 0 0 0
3060 2956 2596 2888 2608 2330 1871 1430 1373 1458297 405 407 379 503 597 245 213 294 178
- 2 1 3 0 0 0 0 0 0297 403 406 376 503 597 245 213 294 178297 273 278 284 418 471 177 147 169 119768 555 491 442 400 357 304 247 212 20513 1 -1 0 3 0 0 0 0 0
755 553 491 442 396 357 304 247 212 205- 126-- 126- 0 0 4 3 0 218 0 0- 0 0 - 4 3 218
s: 1991-92, p.572)
228
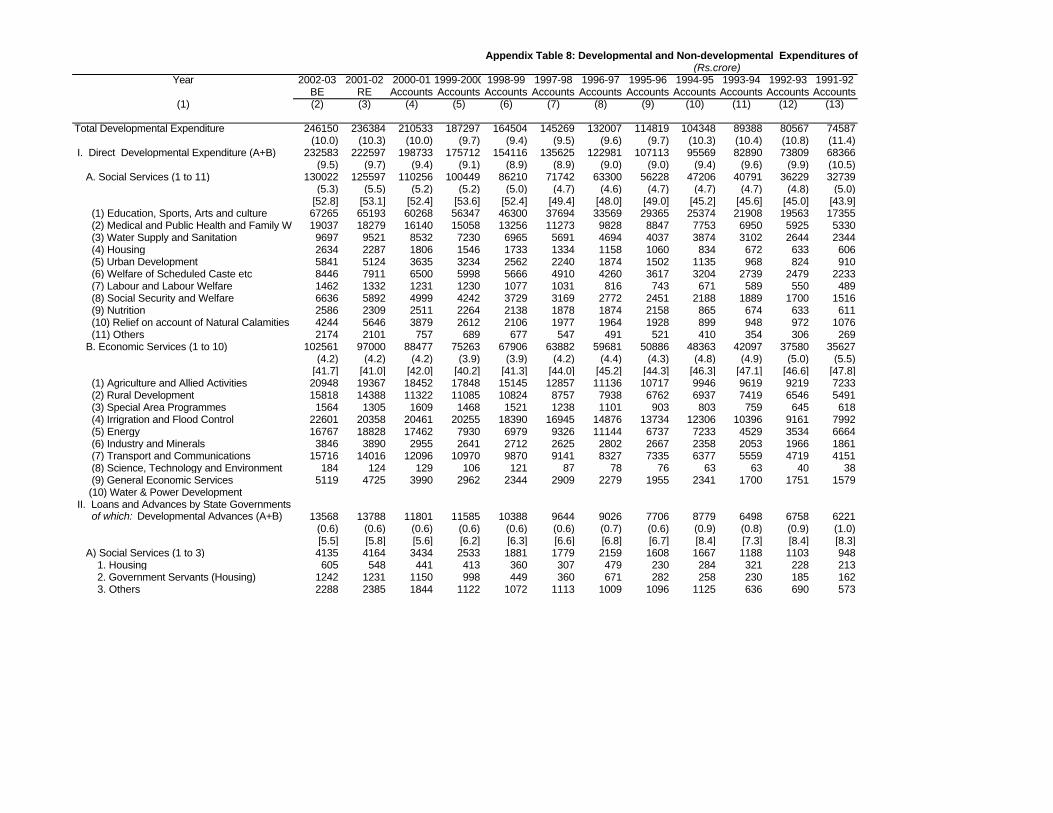
Year 2002-03 2001-02 2000-01 1999-2000 1998-99 1997-98 1996-97 1995-96 1994-95 1993-94 1992-93 1991-92BE RE Accounts Accounts Accounts Accounts Accounts Accounts Accounts Accounts Accounts Accounts
(1) (2) (3) (4) (5) (6) (7) (8) (9) (10) (11) (12) (13)
Total Developmental Expenditure 246150 236384 210533 187297 164504 145269 132007 114819 104348 89388 80567 74587(10.0) (10.3) (10.0) (9.7) (9.4) (9.5) (9.6) (9.7) (10.3) (10.4) (10.8) (11.4)
I. Direct Developmental Expenditure (A+B) 232583 222597 198733 175712 154116 135625 122981 107113 95569 82890 73809 68366(9.5) (9.7) (9.4) (9.1) (8.9) (8.9) (9.0) (9.0) (9.4) (9.6) (9.9) (10.5)
A. Social Services (1 to 11) 130022 125597 110256 100449 86210 71742 63300 56228 47206 40791 36229 32739(5.3) (5.5) (5.2) (5.2) (5.0) (4.7) (4.6) (4.7) (4.7) (4.7) (4.8) (5.0)
[52.8] [53.1] [52.4] [53.6] [52.4] [49.4] [48.0] [49.0] [45.2] [45.6] [45.0] [43.9] (1) Education, Sports, Arts and culture 67265 65193 60268 56347 46300 37694 33569 29365 25374 21908 19563 17355 (2) Medical and Public Health and Family Welfare19037 18279 16140 15058 13256 11273 9828 8847 7753 6950 5925 5330 (3) Water Supply and Sanitation 9697 9521 8532 7230 6965 5691 4694 4037 3874 3102 2644 2344 (4) Housing 2634 2287 1806 1546 1733 1334 1158 1060 834 672 633 606 (5) Urban Development 5841 5124 3635 3234 2562 2240 1874 1502 1135 968 824 910 (6) Welfare of Scheduled Caste etc 8446 7911 6500 5998 5666 4910 4260 3617 3204 2739 2479 2233 (7) Labour and Labour Welfare 1462 1332 1231 1230 1077 1031 816 743 671 589 550 489 (8) Social Security and Welfare 6636 5892 4999 4242 3729 3169 2772 2451 2188 1889 1700 1516 (9) Nutrition 2586 2309 2511 2264 2138 1878 1874 2158 865 674 633 611 (10) Relief on account of Natural Calamities 4244 5646 3879 2612 2106 1977 1964 1928 899 948 972 1076 (11) Others 2174 2101 757 689 677 547 491 521 410 354 306 269 B. Economic Services (1 to 10) 102561 97000 88477 75263 67906 63882 59681 50886 48363 42097 37580 35627
(4.2) (4.2) (4.2) (3.9) (3.9) (4.2) (4.4) (4.3) (4.8) (4.9) (5.0) (5.5)[41.7] [41.0] [42.0] [40.2] [41.3] [44.0] [45.2] [44.3] [46.3] [47.1] [46.6] [47.8]
(1) Agriculture and Allied Activities 20948 19367 18452 17848 15145 12857 11136 10717 9946 9619 9219 7233 (2) Rural Development 15818 14388 11322 11085 10824 8757 7938 6762 6937 7419 6546 5491 (3) Special Area Programmes 1564 1305 1609 1468 1521 1238 1101 903 803 759 645 618 (4) Irrigration and Flood Control 22601 20358 20461 20255 18390 16945 14876 13734 12306 10396 9161 7992 (5) Energy 16767 18828 17462 7930 6979 9326 11144 6737 7233 4529 3534 6664 (6) Industry and Minerals 3846 3890 2955 2641 2712 2625 2802 2667 2358 2053 1966 1861 (7) Transport and Communications 15716 14016 12096 10970 9870 9141 8327 7335 6377 5559 4719 4151 (8) Science, Technology and Environment 184 124 129 106 121 87 78 76 63 63 40 38 (9) General Economic Services 5119 4725 3990 2962 2344 2909 2279 1955 2341 1700 1751 1579 (10) Water & Power Development II. Loans and Advances by State Governments of which: Developmental Advances (A+B) 13568 13788 11801 11585 10388 9644 9026 7706 8779 6498 6758 6221
(0.6) (0.6) (0.6) (0.6) (0.6) (0.6) (0.7) (0.6) (0.9) (0.8) (0.9) (1.0)[5.5] [5.8] [5.6] [6.2] [6.3] [6.6] [6.8] [6.7] [8.4] [7.3] [8.4] [8.3]
A) Social Services (1 to 3) 4135 4164 3434 2533 1881 1779 2159 1608 1667 1188 1103 948 1. Housing 605 548 441 413 360 307 479 230 284 321 228 213 2. Government Servants (Housing) 1242 1231 1150 998 449 360 671 282 258 230 185 162 3. Others 2288 2385 1844 1122 1072 1113 1009 1096 1125 636 690 573
Appendix Table 8: Developmental and Non-developmental Expenditures of States: Major Heads(Rs.crore)
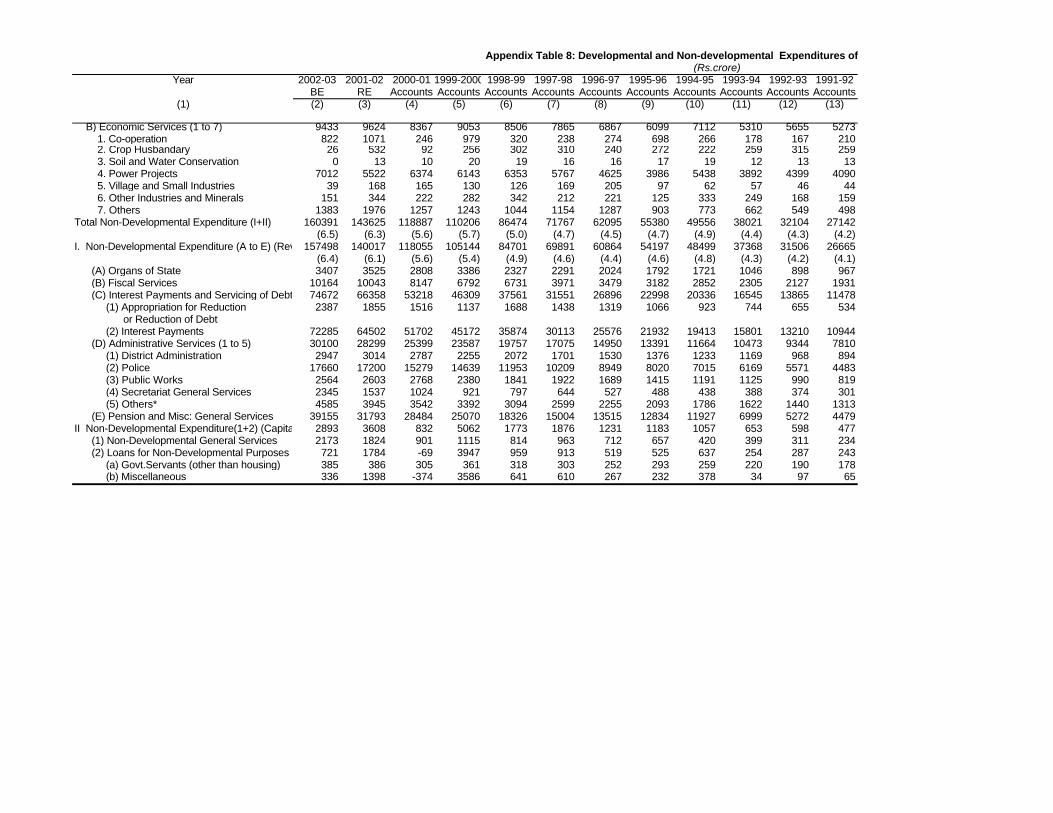
Year 2002-03 2001-02 2000-01 1999-2000 1998-99 1997-98 1996-97 1995-96 1994-95 1993-94 1992-93 1991-92BE RE Accounts Accounts Accounts Accounts Accounts Accounts Accounts Accounts Accounts Accounts
(1) (2) (3) (4) (5) (6) (7) (8) (9) (10) (11) (12) (13)
Appendix Table 8: Developmental and Non-developmental Expenditures of States: Major Heads(Rs.crore)
B) Economic Services (1 to 7) 9433 9624 8367 9053 8506 7865 6867 6099 7112 5310 5655 5273 1. Co-operation 822 1071 246 979 320 238 274 698 266 178 167 210 2. Crop Husbandary 26 532 92 256 302 310 240 272 222 259 315 259 3. Soil and Water Conservation 0 13 10 20 19 16 16 17 19 12 13 13 4. Power Projects 7012 5522 6374 6143 6353 5767 4625 3986 5438 3892 4399 4090 5. Village and Small Industries 39 168 165 130 126 169 205 97 62 57 46 44 6. Other Industries and Minerals 151 344 222 282 342 212 221 125 333 249 168 159 7. Others 1383 1976 1257 1243 1044 1154 1287 903 773 662 549 498Total Non-Developmental Expenditure (I+II) 160391 143625 118887 110206 86474 71767 62095 55380 49556 38021 32104 27142
(6.5) (6.3) (5.6) (5.7) (5.0) (4.7) (4.5) (4.7) (4.9) (4.4) (4.3) (4.2)I. Non-Developmental Expenditure (A to E) (Revenue Account)157498 140017 118055 105144 84701 69891 60864 54197 48499 37368 31506 26665
(6.4) (6.1) (5.6) (5.4) (4.9) (4.6) (4.4) (4.6) (4.8) (4.3) (4.2) (4.1) (A) Organs of State 3407 3525 2808 3386 2327 2291 2024 1792 1721 1046 898 967 (B) Fiscal Services 10164 10043 8147 6792 6731 3971 3479 3182 2852 2305 2127 1931 (C) Interest Payments and Servicing of Debt (1+2)74672 66358 53218 46309 37561 31551 26896 22998 20336 16545 13865 11478 (1) Appropriation for Reduction 2387 1855 1516 1137 1688 1438 1319 1066 923 744 655 534 or Reduction of Debt (2) Interest Payments 72285 64502 51702 45172 35874 30113 25576 21932 19413 15801 13210 10944 (D) Administrative Services (1 to 5) 30100 28299 25399 23587 19757 17075 14950 13391 11664 10473 9344 7810 (1) District Administration 2947 3014 2787 2255 2072 1701 1530 1376 1233 1169 968 894 (2) Police 17660 17200 15279 14639 11953 10209 8949 8020 7015 6169 5571 4483 (3) Public Works 2564 2603 2768 2380 1841 1922 1689 1415 1191 1125 990 819 (4) Secretariat General Services 2345 1537 1024 921 797 644 527 488 438 388 374 301 (5) Others* 4585 3945 3542 3392 3094 2599 2255 2093 1786 1622 1440 1313 (E) Pension and Misc: General Services 39155 31793 28484 25070 18326 15004 13515 12834 11927 6999 5272 4479II Non-Developmental Expenditure(1+2) (Capital Account)2893 3608 832 5062 1773 1876 1231 1183 1057 653 598 477 (1) Non-Developmental General Services 2173 1824 901 1115 814 963 712 657 420 399 311 234 (2) Loans for Non-Developmental Purposes (a+b) 721 1784 -69 3947 959 913 519 525 637 254 287 243 (a) Govt.Servants (other than housing) 385 386 305 361 318 303 252 293 259 220 190 178 (b) Miscellaneous 336 1398 -374 3586 641 610 267 232 378 34 97 65
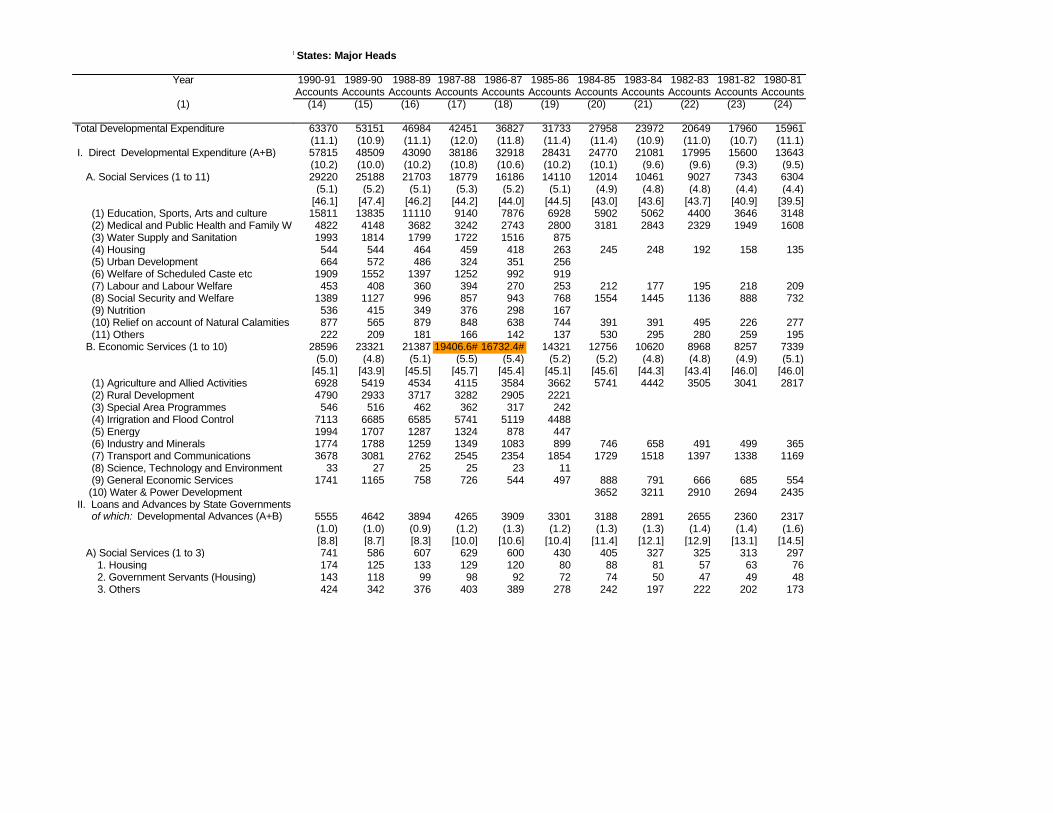
Year
(1)
Total Developmental Expenditure
I. Direct Developmental Expenditure (A+B)
A. Social Services (1 to 11)
(1) Education, Sports, Arts and culture (2) Medical and Public Health and Family Welfare (3) Water Supply and Sanitation (4) Housing (5) Urban Development (6) Welfare of Scheduled Caste etc (7) Labour and Labour Welfare (8) Social Security and Welfare (9) Nutrition (10) Relief on account of Natural Calamities (11) Others B. Economic Services (1 to 10)
(1) Agriculture and Allied Activities (2) Rural Development (3) Special Area Programmes (4) Irrigration and Flood Control (5) Energy (6) Industry and Minerals (7) Transport and Communications (8) Science, Technology and Environment (9) General Economic Services (10) Water & Power Development II. Loans and Advances by State Governments of which: Developmental Advances (A+B)
A) Social Services (1 to 3) 1. Housing 2. Government Servants (Housing) 3. Others
1990-91 1989-90 1988-89 1987-88 1986-87 1985-86 1984-85 1983-84 1982-83 1981-82 1980-81Accounts Accounts Accounts Accounts Accounts Accounts Accounts Accounts Accounts Accounts Accounts
(14) (15) (16) (17) (18) (19) (20) (21) (22) (23) (24)
63370 53151 46984 42451 36827 31733 27958 23972 20649 17960 15961(11.1) (10.9) (11.1) (12.0) (11.8) (11.4) (11.4) (10.9) (11.0) (10.7) (11.1)57815 48509 43090 38186 32918 28431 24770 21081 17995 15600 13643(10.2) (10.0) (10.2) (10.8) (10.6) (10.2) (10.1) (9.6) (9.6) (9.3) (9.5)29220 25188 21703 18779 16186 14110 12014 10461 9027 7343 6304
(5.1) (5.2) (5.1) (5.3) (5.2) (5.1) (4.9) (4.8) (4.8) (4.4) (4.4)[46.1] [47.4] [46.2] [44.2] [44.0] [44.5] [43.0] [43.6] [43.7] [40.9] [39.5]15811 13835 11110 9140 7876 6928 5902 5062 4400 3646 31484822 4148 3682 3242 2743 2800 3181 2843 2329 1949 16081993 1814 1799 1722 1516 875544 544 464 459 418 263 245 248 192 158 135664 572 486 324 351 256
1909 1552 1397 1252 992 919453 408 360 394 270 253 212 177 195 218 209
1389 1127 996 857 943 768 1554 1445 1136 888 732536 415 349 376 298 167877 565 879 848 638 744 391 391 495 226 277222 209 181 166 142 137 530 295 280 259 195
28596 23321 21387 19406.6# 16732.4# 14321 12756 10620 8968 8257 7339(5.0) (4.8) (5.1) (5.5) (5.4) (5.2) (5.2) (4.8) (4.8) (4.9) (5.1)
[45.1] [43.9] [45.5] [45.7] [45.4] [45.1] [45.6] [44.3] [43.4] [46.0] [46.0]6928 5419 4534 4115 3584 3662 5741 4442 3505 3041 28174790 2933 3717 3282 2905 2221546 516 462 362 317 242
7113 6685 6585 5741 5119 44881994 1707 1287 1324 878 4471774 1788 1259 1349 1083 899 746 658 491 499 3653678 3081 2762 2545 2354 1854 1729 1518 1397 1338 1169
33 27 25 25 23 111741 1165 758 726 544 497 888 791 666 685 554
3652 3211 2910 2694 2435
5555 4642 3894 4265 3909 3301 3188 2891 2655 2360 2317(1.0) (1.0) (0.9) (1.2) (1.3) (1.2) (1.3) (1.3) (1.4) (1.4) (1.6)[8.8] [8.7] [8.3] [10.0] [10.6] [10.4] [11.4] [12.1] [12.9] [13.1] [14.5]741 586 607 629 600 430 405 327 325 313 297174 125 133 129 120 80 88 81 57 63 76143 118 99 98 92 72 74 50 47 49 48424 342 376 403 389 278 242 197 222 202 173
Appendix Table 8: Developmental and Non-developmental Expenditures of States: Major Heads
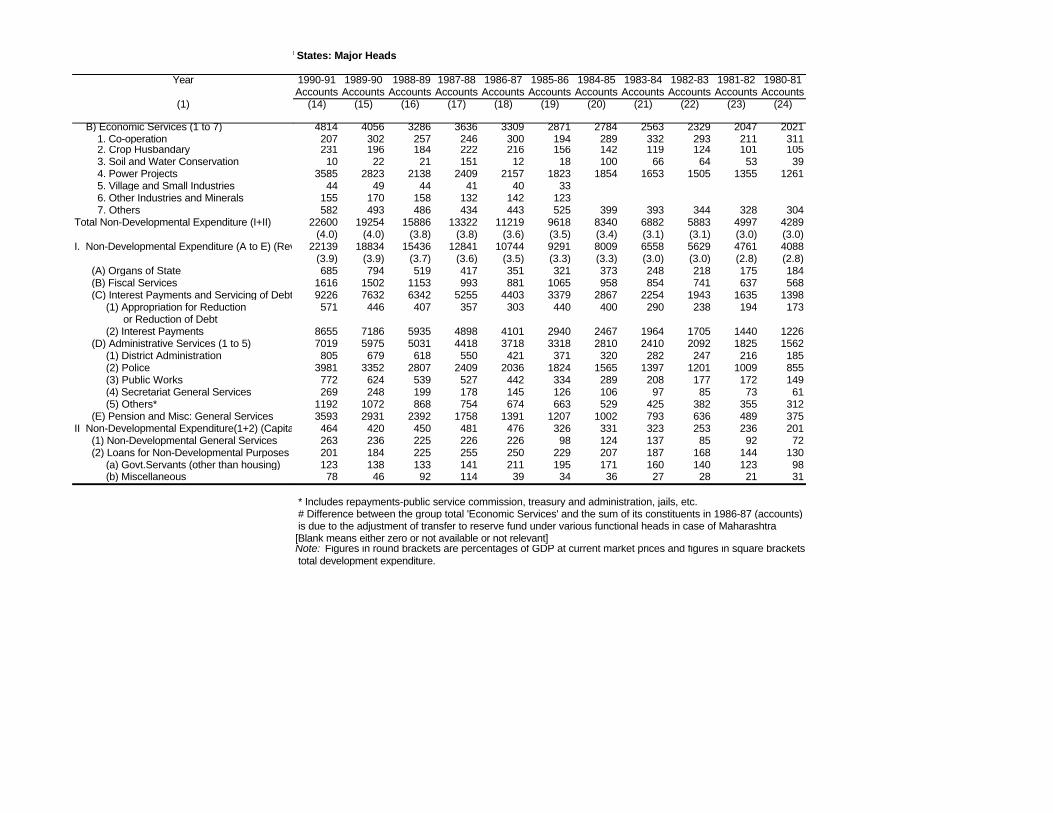
Year
(1)
B) Economic Services (1 to 7) 1. Co-operation 2. Crop Husbandary 3. Soil and Water Conservation 4. Power Projects 5. Village and Small Industries 6. Other Industries and Minerals 7. OthersTotal Non-Developmental Expenditure (I+II)
I. Non-Developmental Expenditure (A to E) (Revenue Account)
(A) Organs of State (B) Fiscal Services (C) Interest Payments and Servicing of Debt (1+2) (1) Appropriation for Reduction or Reduction of Debt (2) Interest Payments (D) Administrative Services (1 to 5) (1) District Administration (2) Police (3) Public Works (4) Secretariat General Services (5) Others* (E) Pension and Misc: General ServicesII Non-Developmental Expenditure(1+2) (Capital Account) (1) Non-Developmental General Services (2) Loans for Non-Developmental Purposes (a+b) (a) Govt.Servants (other than housing) (b) Miscellaneous
1990-91 1989-90 1988-89 1987-88 1986-87 1985-86 1984-85 1983-84 1982-83 1981-82 1980-81Accounts Accounts Accounts Accounts Accounts Accounts Accounts Accounts Accounts Accounts Accounts
(14) (15) (16) (17) (18) (19) (20) (21) (22) (23) (24)
Appendix Table 8: Developmental and Non-developmental Expenditures of States: Major Heads
4814 4056 3286 3636 3309 2871 2784 2563 2329 2047 2021207 302 257 246 300 194 289 332 293 211 311231 196 184 222 216 156 142 119 124 101 10510 22 21 151 12 18 100 66 64 53 39
3585 2823 2138 2409 2157 1823 1854 1653 1505 1355 126144 49 44 41 40 33
155 170 158 132 142 123582 493 486 434 443 525 399 393 344 328 304
22600 19254 15886 13322 11219 9618 8340 6882 5883 4997 4289(4.0) (4.0) (3.8) (3.8) (3.6) (3.5) (3.4) (3.1) (3.1) (3.0) (3.0)
22139 18834 15436 12841 10744 9291 8009 6558 5629 4761 4088(3.9) (3.9) (3.7) (3.6) (3.5) (3.3) (3.3) (3.0) (3.0) (2.8) (2.8)685 794 519 417 351 321 373 248 218 175 184
1616 1502 1153 993 881 1065 958 854 741 637 5689226 7632 6342 5255 4403 3379 2867 2254 1943 1635 1398571 446 407 357 303 440 400 290 238 194 173
8655 7186 5935 4898 4101 2940 2467 1964 1705 1440 12267019 5975 5031 4418 3718 3318 2810 2410 2092 1825 1562805 679 618 550 421 371 320 282 247 216 185
3981 3352 2807 2409 2036 1824 1565 1397 1201 1009 855772 624 539 527 442 334 289 208 177 172 149269 248 199 178 145 126 106 97 85 73 61
1192 1072 868 754 674 663 529 425 382 355 3123593 2931 2392 1758 1391 1207 1002 793 636 489 375464 420 450 481 476 326 331 323 253 236 201263 236 225 226 226 98 124 137 85 92 72201 184 225 255 250 229 207 187 168 144 130123 138 133 141 211 195 171 160 140 123 9878 46 92 114 39 34 36 27 28 21 31
* Includes repayments-public service commission, treasury and administration, jails, etc. # Difference between the group total 'Economic Services' and the sum of its constituents in 1986-87 (accounts) and 1987-88 (accounts) is due to the adjustment of transfer to reserve fund under various functional heads in case of Maharashtra[Blank means either zero or not available or not relevant]Note: Figures in round brackets are percentages of GDP at current market prices and figures in square brackets are percentages of total development expenditure.
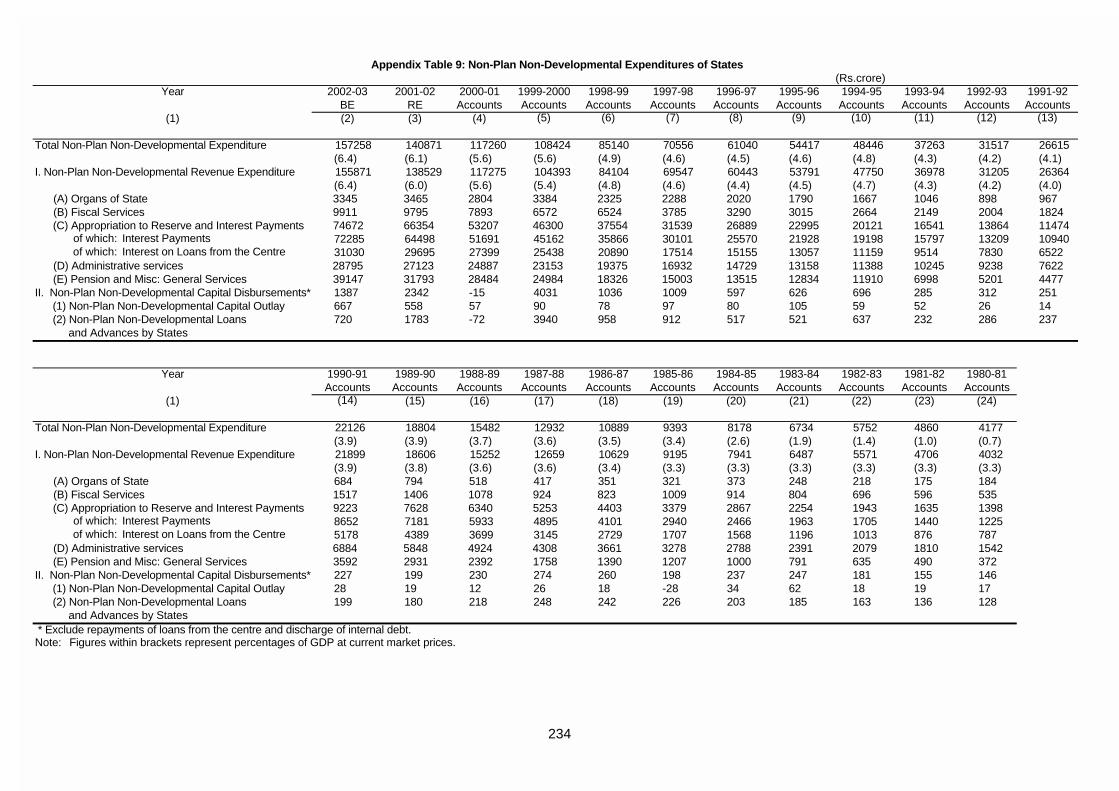
(Rs.crore)Year 2002-03 2001-02 2000-01 1999-2000 1998-99 1997-98 1996-97 1995-96 1994-95 1993-94 1992-93 1991-92
BE RE Accounts Accounts Accounts Accounts Accounts Accounts Accounts Accounts Accounts Accounts(1) (2) (3) (4) (5) (6) (7) (8) (9) (10) (11) (12) (13)
Total Non-Plan Non-Developmental Expenditure 157258 140871 117260 108424 85140 70556 61040 54417 48446 37263 31517 26615(6.4) (6.1) (5.6) (5.6) (4.9) (4.6) (4.5) (4.6) (4.8) (4.3) (4.2) (4.1)
I. Non-Plan Non-Developmental Revenue Expenditure 155871 138529 117275 104393 84104 69547 60443 53791 47750 36978 31205 26364(6.4) (6.0) (5.6) (5.4) (4.8) (4.6) (4.4) (4.5) (4.7) (4.3) (4.2) (4.0)
(A) Organs of State 3345 3465 2804 3384 2325 2288 2020 1790 1667 1046 898 967 (B) Fiscal Services 9911 9795 7893 6572 6524 3785 3290 3015 2664 2149 2004 1824 (C) Appropriation to Reserve and Interest Payments 74672 66354 53207 46300 37554 31539 26889 22995 20121 16541 13864 11474 of which: Interest Payments 72285 64498 51691 45162 35866 30101 25570 21928 19198 15797 13209 10940 of which: Interest on Loans from the Centre 31030 29695 27399 25438 20890 17514 15155 13057 11159 9514 7830 6522 (D) Administrative services 28795 27123 24887 23153 19375 16932 14729 13158 11388 10245 9238 7622 (E) Pension and Misc: General Services 39147 31793 28484 24984 18326 15003 13515 12834 11910 6998 5201 4477II. Non-Plan Non-Developmental Capital Disbursements* 1387 2342 -15 4031 1036 1009 597 626 696 285 312 251 (1) Non-Plan Non-Developmental Capital Outlay 667 558 57 90 78 97 80 105 59 52 26 14 (2) Non-Plan Non-Developmental Loans 720 1783 -72 3940 958 912 517 521 637 232 286 237 and Advances by States
Year 1990-91 1989-90 1988-89 1987-88 1986-87 1985-86 1984-85 1983-84 1982-83 1981-82 1980-81Accounts Accounts Accounts Accounts Accounts Accounts Accounts Accounts Accounts Accounts Accounts
(1) (14) (15) (16) (17) (18) (19) (20) (21) (22) (23) (24)
Total Non-Plan Non-Developmental Expenditure 22126 18804 15482 12932 10889 9393 8178 6734 5752 4860 4177(3.9) (3.9) (3.7) (3.6) (3.5) (3.4) (2.6) (1.9) (1.4) (1.0) (0.7)
I. Non-Plan Non-Developmental Revenue Expenditure 21899 18606 15252 12659 10629 9195 7941 6487 5571 4706 4032(3.9) (3.8) (3.6) (3.6) (3.4) (3.3) (3.3) (3.3) (3.3) (3.3) (3.3)
(A) Organs of State 684 794 518 417 351 321 373 248 218 175 184 (B) Fiscal Services 1517 1406 1078 924 823 1009 914 804 696 596 535 (C) Appropriation to Reserve and Interest Payments 9223 7628 6340 5253 4403 3379 2867 2254 1943 1635 1398 of which: Interest Payments 8652 7181 5933 4895 4101 2940 2466 1963 1705 1440 1225 of which: Interest on Loans from the Centre 5178 4389 3699 3145 2729 1707 1568 1196 1013 876 787 (D) Administrative services 6884 5848 4924 4308 3661 3278 2788 2391 2079 1810 1542 (E) Pension and Misc: General Services 3592 2931 2392 1758 1390 1207 1000 791 635 490 372II. Non-Plan Non-Developmental Capital Disbursements* 227 199 230 274 260 198 237 247 181 155 146 (1) Non-Plan Non-Developmental Capital Outlay 28 19 12 26 18 -28 34 62 18 19 17 (2) Non-Plan Non-Developmental Loans 199 180 218 248 242 226 203 185 163 136 128 and Advances by States * Exclude repayments of loans from the centre and discharge of internal debt.Note: Figures within brackets represent percentages of GDP at current market prices.
Appendix Table 9: Non-Plan Non-Developmental Expenditures of States
234
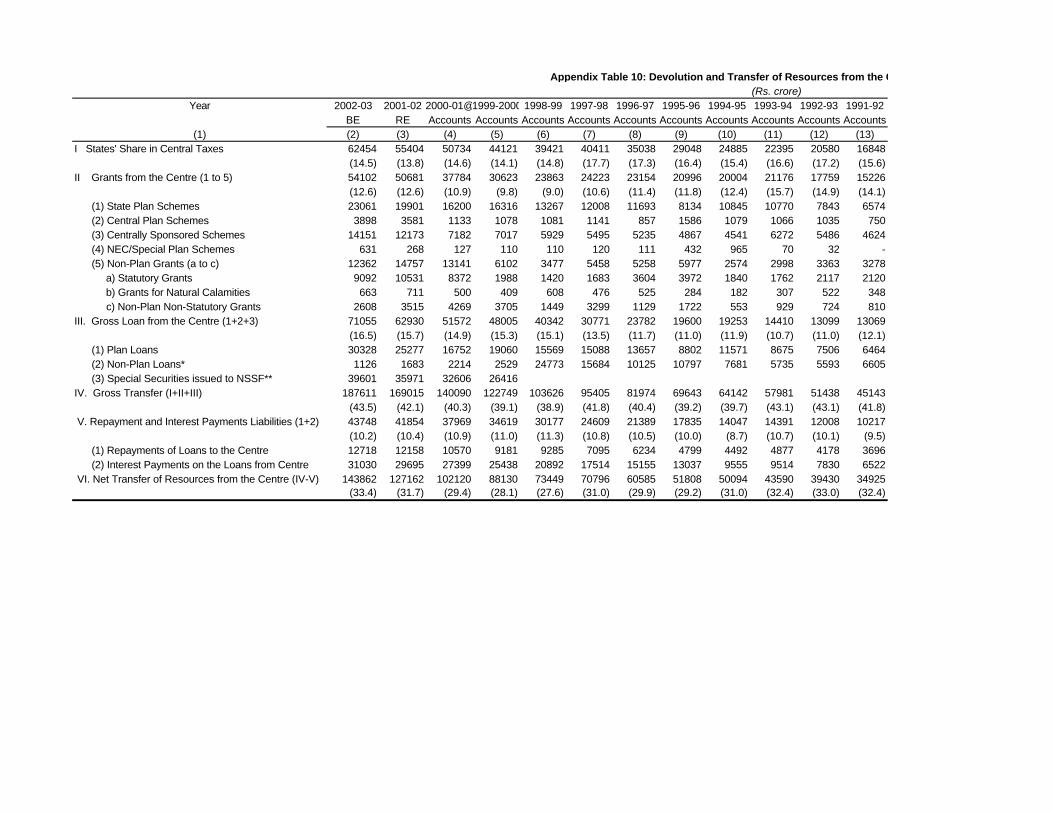
(Rs. crore)Year 2002-03 2001-02 2000-01@1999-2000 1998-99 1997-98 1996-97 1995-96 1994-95 1993-94 1992-93 1991-92
BE RE Accounts Accounts Accounts Accounts Accounts Accounts Accounts Accounts Accounts Accounts(1) (2) (3) (4) (5) (6) (7) (8) (9) (10) (11) (12) (13)
I States' Share in Central Taxes 62454 55404 50734 44121 39421 40411 35038 29048 24885 22395 20580 16848(14.5) (13.8) (14.6) (14.1) (14.8) (17.7) (17.3) (16.4) (15.4) (16.6) (17.2) (15.6)
II Grants from the Centre (1 to 5) 54102 50681 37784 30623 23863 24223 23154 20996 20004 21176 17759 15226(12.6) (12.6) (10.9) (9.8) (9.0) (10.6) (11.4) (11.8) (12.4) (15.7) (14.9) (14.1)
(1) State Plan Schemes 23061 19901 16200 16316 13267 12008 11693 8134 10845 10770 7843 6574 (2) Central Plan Schemes 3898 3581 1133 1078 1081 1141 857 1586 1079 1066 1035 750 (3) Centrally Sponsored Schemes 14151 12173 7182 7017 5929 5495 5235 4867 4541 6272 5486 4624 (4) NEC/Special Plan Schemes 631 268 127 110 110 120 111 432 965 70 32 - (5) Non-Plan Grants (a to c) 12362 14757 13141 6102 3477 5458 5258 5977 2574 2998 3363 3278 a) Statutory Grants 9092 10531 8372 1988 1420 1683 3604 3972 1840 1762 2117 2120 b) Grants for Natural Calamities 663 711 500 409 608 476 525 284 182 307 522 348 c) Non-Plan Non-Statutory Grants 2608 3515 4269 3705 1449 3299 1129 1722 553 929 724 810III. Gross Loan from the Centre (1+2+3) 71055 62930 51572 48005 40342 30771 23782 19600 19253 14410 13099 13069
(16.5) (15.7) (14.9) (15.3) (15.1) (13.5) (11.7) (11.0) (11.9) (10.7) (11.0) (12.1) (1) Plan Loans 30328 25277 16752 19060 15569 15088 13657 8802 11571 8675 7506 6464 (2) Non-Plan Loans* 1126 1683 2214 2529 24773 15684 10125 10797 7681 5735 5593 6605 (3) Special Securities issued to NSSF** 39601 35971 32606 26416IV. Gross Transfer (I+II+III) 187611 169015 140090 122749 103626 95405 81974 69643 64142 57981 51438 45143
(43.5) (42.1) (40.3) (39.1) (38.9) (41.8) (40.4) (39.2) (39.7) (43.1) (43.1) (41.8) V. Repayment and Interest Payments Liabilities (1+2) 43748 41854 37969 34619 30177 24609 21389 17835 14047 14391 12008 10217
(10.2) (10.4) (10.9) (11.0) (11.3) (10.8) (10.5) (10.0) (8.7) (10.7) (10.1) (9.5) (1) Repayments of Loans to the Centre 12718 12158 10570 9181 9285 7095 6234 4799 4492 4877 4178 3696 (2) Interest Payments on the Loans from Centre 31030 29695 27399 25438 20892 17514 15155 13037 9555 9514 7830 6522 VI. Net Transfer of Resources from the Centre (IV-V) 143862 127162 102120 88130 73449 70796 60585 51808 50094 43590 39430 34925
(33.4) (31.7) (29.4) (28.1) (27.6) (31.0) (29.9) (29.2) (31.0) (32.4) (33.0) (32.4)
Appendix Table 10: Devolution and Transfer of Resources from the Centre
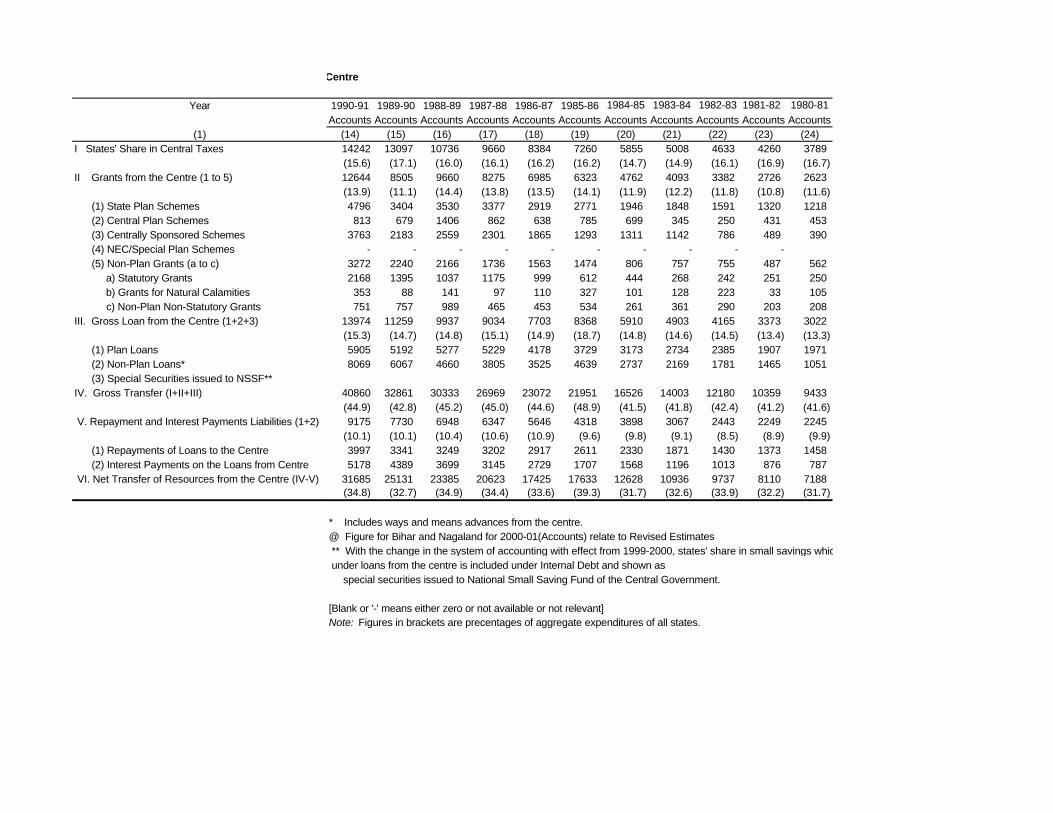
Year
(1)I States' Share in Central Taxes
II Grants from the Centre (1 to 5)
(1) State Plan Schemes (2) Central Plan Schemes (3) Centrally Sponsored Schemes (4) NEC/Special Plan Schemes (5) Non-Plan Grants (a to c) a) Statutory Grants b) Grants for Natural Calamities c) Non-Plan Non-Statutory Grants III. Gross Loan from the Centre (1+2+3)
(1) Plan Loans (2) Non-Plan Loans* (3) Special Securities issued to NSSF**IV. Gross Transfer (I+II+III)
V. Repayment and Interest Payments Liabilities (1+2)
(1) Repayments of Loans to the Centre (2) Interest Payments on the Loans from Centre VI. Net Transfer of Resources from the Centre (IV-V)
1990-91 1989-90 1988-89 1987-88 1986-87 1985-86 1984-85 1983-84 1982-83 1981-82 1980-81
Accounts Accounts Accounts Accounts Accounts Accounts Accounts Accounts Accounts Accounts Accounts(14) (15) (16) (17) (18) (19) (20) (21) (22) (23) (24)14242 13097 10736 9660 8384 7260 5855 5008 4633 4260 3789(15.6) (17.1) (16.0) (16.1) (16.2) (16.2) (14.7) (14.9) (16.1) (16.9) (16.7)12644 8505 9660 8275 6985 6323 4762 4093 3382 2726 2623(13.9) (11.1) (14.4) (13.8) (13.5) (14.1) (11.9) (12.2) (11.8) (10.8) (11.6)4796 3404 3530 3377 2919 2771 1946 1848 1591 1320 1218813 679 1406 862 638 785 699 345 250 431 453
3763 2183 2559 2301 1865 1293 1311 1142 786 489 390- - - - - - - - - -
3272 2240 2166 1736 1563 1474 806 757 755 487 5622168 1395 1037 1175 999 612 444 268 242 251 250353 88 141 97 110 327 101 128 223 33 105751 757 989 465 453 534 261 361 290 203 208
13974 11259 9937 9034 7703 8368 5910 4903 4165 3373 3022(15.3) (14.7) (14.8) (15.1) (14.9) (18.7) (14.8) (14.6) (14.5) (13.4) (13.3)5905 5192 5277 5229 4178 3729 3173 2734 2385 1907 19718069 6067 4660 3805 3525 4639 2737 2169 1781 1465 1051
40860 32861 30333 26969 23072 21951 16526 14003 12180 10359 9433(44.9) (42.8) (45.2) (45.0) (44.6) (48.9) (41.5) (41.8) (42.4) (41.2) (41.6)9175 7730 6948 6347 5646 4318 3898 3067 2443 2249 2245
(10.1) (10.1) (10.4) (10.6) (10.9) (9.6) (9.8) (9.1) (8.5) (8.9) (9.9)3997 3341 3249 3202 2917 2611 2330 1871 1430 1373 14585178 4389 3699 3145 2729 1707 1568 1196 1013 876 787
31685 25131 23385 20623 17425 17633 12628 10936 9737 8110 7188(34.8) (32.7) (34.9) (34.4) (33.6) (39.3) (31.7) (32.6) (33.9) (32.2) (31.7)
* Includes ways and means advances from the centre.@ Figure for Bihar and Nagaland for 2000-01(Accounts) relate to Revised Estimates ** With the change in the system of accounting with effect from 1999-2000, states' share in small savings which was included earlier under loans from the centre is included under Internal Debt and shown as special securities issued to National Small Saving Fund of the Central Government.
[Blank or '-' means either zero or not available or not relevant]Note: Figures in brackets are precentages of aggregate expenditures of all states.
Appendix Table 10: Devolution and Transfer of Resources from the Centre
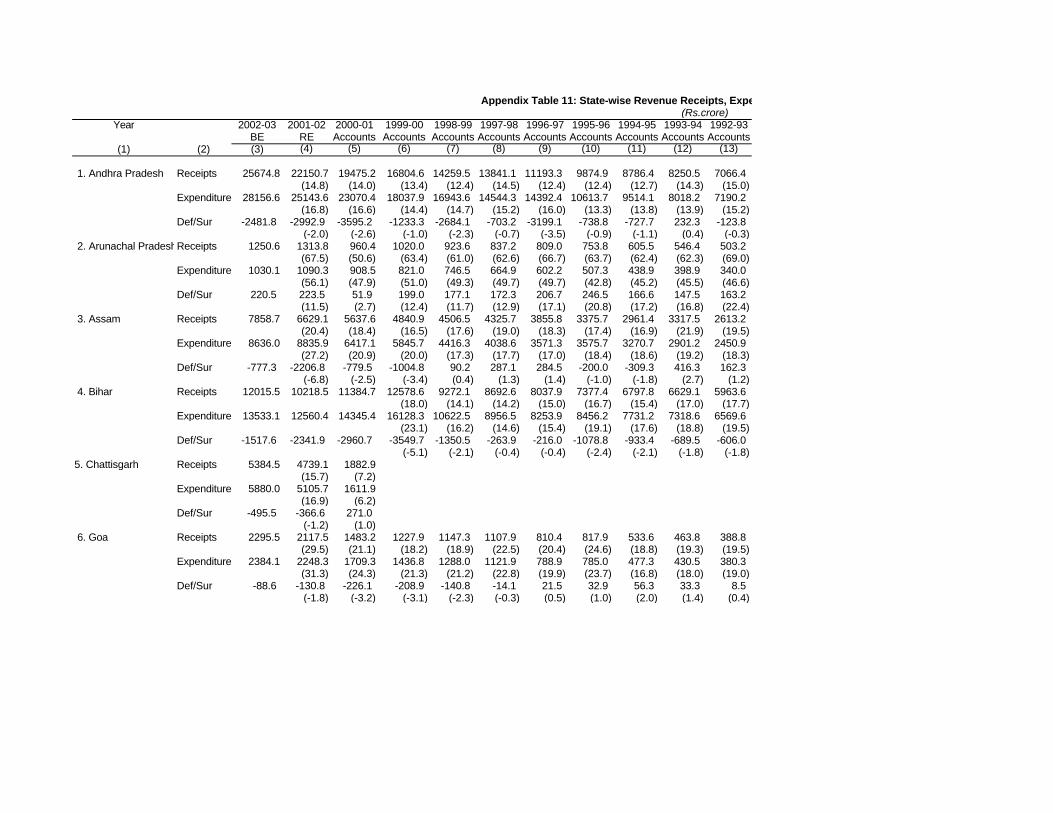
Year 2002-03 2001-02 2000-01 1999-00 1998-99 1997-98 1996-97 1995-96 1994-95 1993-94 1992-93BE RE Accounts Accounts Accounts Accounts Accounts Accounts Accounts Accounts Accounts
(1) (2) (3) (4) (5) (6) (7) (8) (9) (10) (11) (12) (13)
1. Andhra Pradesh Receipts 25674.8 22150.7 19475.2 16804.6 14259.5 13841.1 11193.3 9874.9 8786.4 8250.5 7066.4(14.8) (14.0) (13.4) (12.4) (14.5) (12.4) (12.4) (12.7) (14.3) (15.0)
Expenditure 28156.6 25143.6 23070.4 18037.9 16943.6 14544.3 14392.4 10613.7 9514.1 8018.2 7190.2(16.8) (16.6) (14.4) (14.7) (15.2) (16.0) (13.3) (13.8) (13.9) (15.2)
Def/Sur -2481.8 -2992.9 -3595.2 -1233.3 -2684.1 -703.2 -3199.1 -738.8 -727.7 232.3 -123.8(-2.0) (-2.6) (-1.0) (-2.3) (-0.7) (-3.5) (-0.9) (-1.1) (0.4) (-0.3)
2. Arunachal PradeshReceipts 1250.6 1313.8 960.4 1020.0 923.6 837.2 809.0 753.8 605.5 546.4 503.2(67.5) (50.6) (63.4) (61.0) (62.6) (66.7) (63.7) (62.4) (62.3) (69.0)
Expenditure 1030.1 1090.3 908.5 821.0 746.5 664.9 602.2 507.3 438.9 398.9 340.0(56.1) (47.9) (51.0) (49.3) (49.7) (49.7) (42.8) (45.2) (45.5) (46.6)
Def/Sur 220.5 223.5 51.9 199.0 177.1 172.3 206.7 246.5 166.6 147.5 163.2(11.5) (2.7) (12.4) (11.7) (12.9) (17.1) (20.8) (17.2) (16.8) (22.4)
3. Assam Receipts 7858.7 6629.1 5637.6 4840.9 4506.5 4325.7 3855.8 3375.7 2961.4 3317.5 2613.2(20.4) (18.4) (16.5) (17.6) (19.0) (18.3) (17.4) (16.9) (21.9) (19.5)
Expenditure 8636.0 8835.9 6417.1 5845.7 4416.3 4038.6 3571.3 3575.7 3270.7 2901.2 2450.9(27.2) (20.9) (20.0) (17.3) (17.7) (17.0) (18.4) (18.6) (19.2) (18.3)
Def/Sur -777.3 -2206.8 -779.5 -1004.8 90.2 287.1 284.5 -200.0 -309.3 416.3 162.3(-6.8) (-2.5) (-3.4) (0.4) (1.3) (1.4) (-1.0) (-1.8) (2.7) (1.2)
4. Bihar Receipts 12015.5 10218.5 11384.7 12578.6 9272.1 8692.6 8037.9 7377.4 6797.8 6629.1 5963.6(18.0) (14.1) (14.2) (15.0) (16.7) (15.4) (17.0) (17.7)
Expenditure 13533.1 12560.4 14345.4 16128.3 10622.5 8956.5 8253.9 8456.2 7731.2 7318.6 6569.6(23.1) (16.2) (14.6) (15.4) (19.1) (17.6) (18.8) (19.5)
Def/Sur -1517.6 -2341.9 -2960.7 -3549.7 -1350.5 -263.9 -216.0 -1078.8 -933.4 -689.5 -606.0(-5.1) (-2.1) (-0.4) (-0.4) (-2.4) (-2.1) (-1.8) (-1.8)
5. Chattisgarh Receipts 5384.5 4739.1 1882.9(15.7) (7.2)
Expenditure 5880.0 5105.7 1611.9(16.9) (6.2)
Def/Sur -495.5 -366.6 271.0(-1.2) (1.0)
6. Goa Receipts 2295.5 2117.5 1483.2 1227.9 1147.3 1107.9 810.4 817.9 533.6 463.8 388.8(29.5) (21.1) (18.2) (18.9) (22.5) (20.4) (24.6) (18.8) (19.3) (19.5)
Expenditure 2384.1 2248.3 1709.3 1436.8 1288.0 1121.9 788.9 785.0 477.3 430.5 380.3(31.3) (24.3) (21.3) (21.2) (22.8) (19.9) (23.7) (16.8) (18.0) (19.0)
Def/Sur -88.6 -130.8 -226.1 -208.9 -140.8 -14.1 21.5 32.9 56.3 33.3 8.5(-1.8) (-3.2) (-3.1) (-2.3) (-0.3) (0.5) (1.0) (2.0) (1.4) (0.4)
Appendix Table 11: State-wise Revenue Receipts, Expenditure and Revenue Deficit.(Rs.crore)
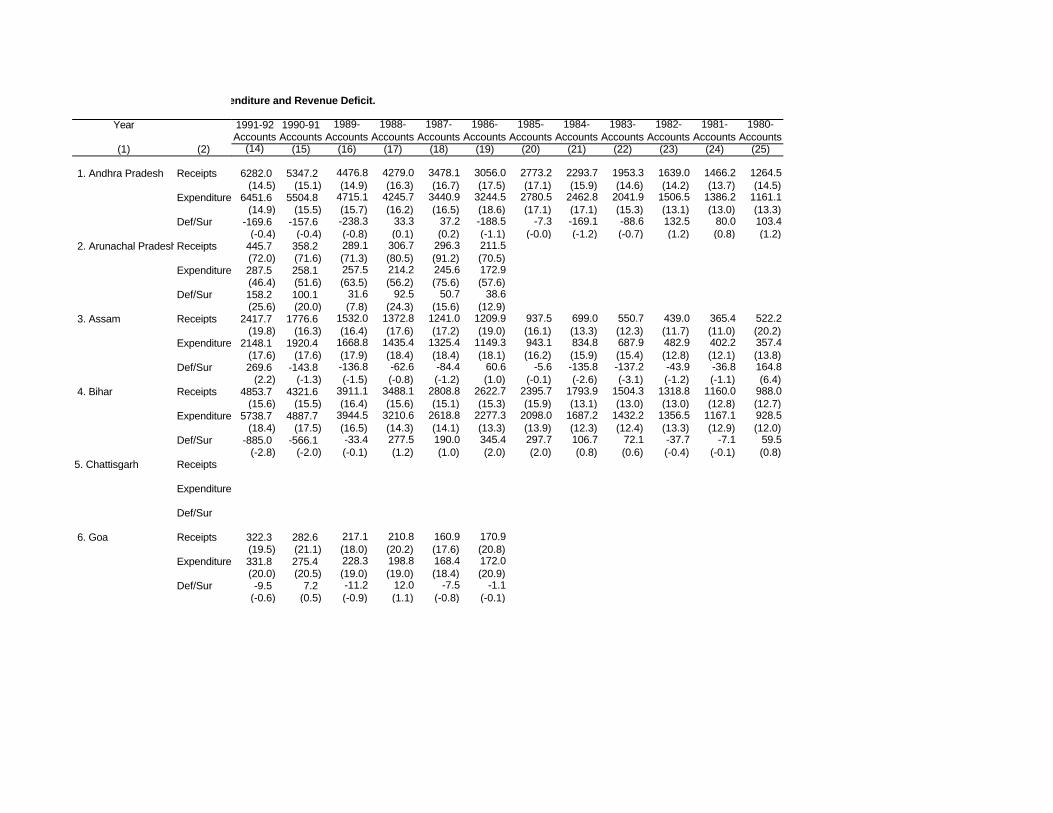
Year
(1) (2)
1. Andhra Pradesh Receipts
Expenditure
Def/Sur
2. Arunachal PradeshReceipts
Expenditure
Def/Sur
3. Assam Receipts
Expenditure
Def/Sur
4. Bihar Receipts
Expenditure
Def/Sur
5. Chattisgarh Receipts
Expenditure
Def/Sur
6. Goa Receipts
Expenditure
Def/Sur
1991-92 1990-91 1989- 1988- 1987- 1986- 1985- 1984- 1983- 1982- 1981- 1980-Accounts Accounts Accounts Accounts Accounts Accounts Accounts Accounts Accounts Accounts Accounts Accounts
(14) (15) (16) (17) (18) (19) (20) (21) (22) (23) (24) (25)
6282.0 5347.2 4476.8 4279.0 3478.1 3056.0 2773.2 2293.7 1953.3 1639.0 1466.2 1264.5 (14.5) (15.1) (14.9) (16.3) (16.7) (17.5) (17.1) (15.9) (14.6) (14.2) (13.7) (14.5)
6451.6 5504.8 4715.1 4245.7 3440.9 3244.5 2780.5 2462.8 2041.9 1506.5 1386.2 1161.1 (14.9) (15.5) (15.7) (16.2) (16.5) (18.6) (17.1) (17.1) (15.3) (13.1) (13.0) (13.3)
-169.6 -157.6 -238.3 33.3 37.2 -188.5 -7.3 -169.1 -88.6 132.5 80.0 103.4 (-0.4) (-0.4) (-0.8) (0.1) (0.2) (-1.1) (-0.0) (-1.2) (-0.7) (1.2) (0.8) (1.2)
445.7 358.2 289.1 306.7 296.3 211.5 (72.0) (71.6) (71.3) (80.5) (91.2) (70.5) 287.5 258.1 257.5 214.2 245.6 172.9 (46.4) (51.6) (63.5) (56.2) (75.6) (57.6)158.2 100.1 31.6 92.5 50.7 38.6 (25.6) (20.0) (7.8) (24.3) (15.6) (12.9)
2417.7 1776.6 1532.0 1372.8 1241.0 1209.9 937.5 699.0 550.7 439.0 365.4 522.2 (19.8) (16.3) (16.4) (17.6) (17.2) (19.0) (16.1) (13.3) (12.3) (11.7) (11.0) (20.2)
2148.1 1920.4 1668.8 1435.4 1325.4 1149.3 943.1 834.8 687.9 482.9 402.2 357.4 (17.6) (17.6) (17.9) (18.4) (18.4) (18.1) (16.2) (15.9) (15.4) (12.8) (12.1) (13.8)269.6 -143.8 -136.8 -62.6 -84.4 60.6 -5.6 -135.8 -137.2 -43.9 -36.8 164.8
(2.2) (-1.3) (-1.5) (-0.8) (-1.2) (1.0) (-0.1) (-2.6) (-3.1) (-1.2) (-1.1) (6.4)4853.7 4321.6 3911.1 3488.1 2808.8 2622.7 2395.7 1793.9 1504.3 1318.8 1160.0 988.0
(15.6) (15.5) (16.4) (15.6) (15.1) (15.3) (15.9) (13.1) (13.0) (13.0) (12.8) (12.7)5738.7 4887.7 3944.5 3210.6 2618.8 2277.3 2098.0 1687.2 1432.2 1356.5 1167.1 928.5
(18.4) (17.5) (16.5) (14.3) (14.1) (13.3) (13.9) (12.3) (12.4) (13.3) (12.9) (12.0)-885.0 -566.1 -33.4 277.5 190.0 345.4 297.7 106.7 72.1 -37.7 -7.1 59.5
(-2.8) (-2.0) (-0.1) (1.2) (1.0) (2.0) (2.0) (0.8) (0.6) (-0.4) (-0.1) (0.8)
322.3 282.6 217.1 210.8 160.9 170.9 (19.5) (21.1) (18.0) (20.2) (17.6) (20.8)331.8 275.4 228.3 198.8 168.4 172.0 (20.0) (20.5) (19.0) (19.0) (18.4) (20.9)-9.5 7.2 -11.2 12.0 -7.5 -1.1
(-0.6) (0.5) (-0.9) (1.1) (-0.8) (-0.1)
Appendix Table 11: State-wise Revenue Receipts, Expenditure and Revenue Deficit.
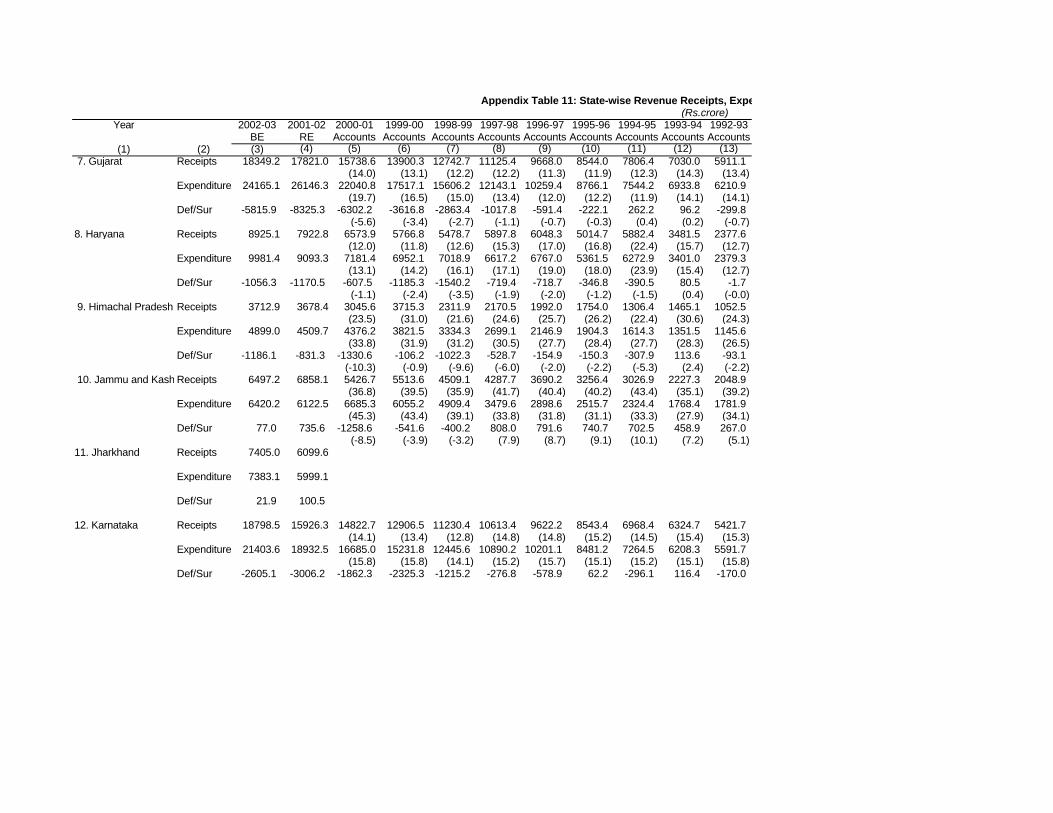
Year 2002-03 2001-02 2000-01 1999-00 1998-99 1997-98 1996-97 1995-96 1994-95 1993-94 1992-93BE RE Accounts Accounts Accounts Accounts Accounts Accounts Accounts Accounts Accounts
(1) (2) (3) (4) (5) (6) (7) (8) (9) (10) (11) (12) (13)
Appendix Table 11: State-wise Revenue Receipts, Expenditure and Revenue Deficit.(Rs.crore)
7. Gujarat Receipts 18349.2 17821.0 15738.6 13900.3 12742.7 11125.4 9668.0 8544.0 7806.4 7030.0 5911.1(14.0) (13.1) (12.2) (12.2) (11.3) (11.9) (12.3) (14.3) (13.4)
Expenditure 24165.1 26146.3 22040.8 17517.1 15606.2 12143.1 10259.4 8766.1 7544.2 6933.8 6210.9(19.7) (16.5) (15.0) (13.4) (12.0) (12.2) (11.9) (14.1) (14.1)
Def/Sur -5815.9 -8325.3 -6302.2 -3616.8 -2863.4 -1017.8 -591.4 -222.1 262.2 96.2 -299.8(-5.6) (-3.4) (-2.7) (-1.1) (-0.7) (-0.3) (0.4) (0.2) (-0.7)
8. Haryana Receipts 8925.1 7922.8 6573.9 5766.8 5478.7 5897.8 6048.3 5014.7 5882.4 3481.5 2377.6(12.0) (11.8) (12.6) (15.3) (17.0) (16.8) (22.4) (15.7) (12.7)
Expenditure 9981.4 9093.3 7181.4 6952.1 7018.9 6617.2 6767.0 5361.5 6272.9 3401.0 2379.3(13.1) (14.2) (16.1) (17.1) (19.0) (18.0) (23.9) (15.4) (12.7)
Def/Sur -1056.3 -1170.5 -607.5 -1185.3 -1540.2 -719.4 -718.7 -346.8 -390.5 80.5 -1.7(-1.1) (-2.4) (-3.5) (-1.9) (-2.0) (-1.2) (-1.5) (0.4) (-0.0)
9. Himachal Pradesh Receipts 3712.9 3678.4 3045.6 3715.3 2311.9 2170.5 1992.0 1754.0 1306.4 1465.1 1052.5(23.5) (31.0) (21.6) (24.6) (25.7) (26.2) (22.4) (30.6) (24.3)
Expenditure 4899.0 4509.7 4376.2 3821.5 3334.3 2699.1 2146.9 1904.3 1614.3 1351.5 1145.6(33.8) (31.9) (31.2) (30.5) (27.7) (28.4) (27.7) (28.3) (26.5)
Def/Sur -1186.1 -831.3 -1330.6 -106.2 -1022.3 -528.7 -154.9 -150.3 -307.9 113.6 -93.1(-10.3) (-0.9) (-9.6) (-6.0) (-2.0) (-2.2) (-5.3) (2.4) (-2.2)
10. Jammu and KashmirReceipts 6497.2 6858.1 5426.7 5513.6 4509.1 4287.7 3690.2 3256.4 3026.9 2227.3 2048.9(36.8) (39.5) (35.9) (41.7) (40.4) (40.2) (43.4) (35.1) (39.2)
Expenditure 6420.2 6122.5 6685.3 6055.2 4909.4 3479.6 2898.6 2515.7 2324.4 1768.4 1781.9(45.3) (43.4) (39.1) (33.8) (31.8) (31.1) (33.3) (27.9) (34.1)
Def/Sur 77.0 735.6 -1258.6 -541.6 -400.2 808.0 791.6 740.7 702.5 458.9 267.0(-8.5) (-3.9) (-3.2) (7.9) (8.7) (9.1) (10.1) (7.2) (5.1)
11. Jharkhand Receipts 7405.0 6099.6
Expenditure 7383.1 5999.1
Def/Sur 21.9 100.5
12. Karnataka Receipts 18798.5 15926.3 14822.7 12906.5 11230.4 10613.4 9622.2 8543.4 6968.4 6324.7 5421.7(14.1) (13.4) (12.8) (14.8) (14.8) (15.2) (14.5) (15.4) (15.3)
Expenditure 21403.6 18932.5 16685.0 15231.8 12445.6 10890.2 10201.1 8481.2 7264.5 6208.3 5591.7(15.8) (15.8) (14.1) (15.2) (15.7) (15.1) (15.2) (15.1) (15.8)
Def/Sur -2605.1 -3006.2 -1862.3 -2325.3 -1215.2 -276.8 -578.9 62.2 -296.1 116.4 -170.0

Year
(1) (2) 7. Gujarat Receipts
Expenditure
Def/Sur
8. Haryana Receipts
Expenditure
Def/Sur
9. Himachal Pradesh Receipts
Expenditure
Def/Sur
10. Jammu and KashmirReceipts
Expenditure
Def/Sur
11. Jharkhand Receipts
Expenditure
Def/Sur
12. Karnataka Receipts
Expenditure
Def/Sur
1991-92 1990-91 1989- 1988- 1987- 1986- 1985- 1984- 1983- 1982- 1981- 1980-Accounts Accounts Accounts Accounts Accounts Accounts Accounts Accounts Accounts Accounts Accounts Accounts
(14) (15) (16) (17) (18) (19) (20) (21) (22) (23) (24) (25)
Appendix Table 11: State-wise Revenue Receipts, Expenditure and Revenue Deficit.
4662.6 3379.2 3601.2 3235.7 2806.5 2159.7 1902.4 1769.4 1565.1 1349.2 1159.4 1025.0 (14.0) (11.1) (13.3) (13.3) (15.8) (12.2) (12.5) (12.2) (11.3) (12.5) (11.5) (12.7)
5238.2 4081.9 3727.3 3362.4 3093.0 2469.2 1972.4 1701.2 1426.1 1283.0 1039.1 903.2 (15.7) (13.4) (13.8) (13.8) (17.4) (14.0) (12.9) (11.7) (10.3) (11.9) (10.3) (11.2)
-575.6 -702.7 -126.1 -126.7 -286.5 -309.5 -70.0 68.2 139.0 66.2 120.3 121.8 (-1.7) (-2.3) (-0.5) (-0.5) (-1.6) (-1.8) (-0.5) (0.5) (1.0) (0.6) (1.2) (1.5)
2241.8 1913.4 1607.2 1441.0 1303.8 1130.1 960.3 790.4 698.6 611.6 536.0 459.9 (12.7) (13.0) (13.4) (13.3) (15.6) (15.2) (13.6) (13.6) (13.2) (12.6) (12.7) (12.6)
2274.0 1933.1 1701.7 1442.9 1287.5 967.3 854.2 760.8 622.7 566.8 485.5 400.7 (12.9) (13.1) (14.2) (13.4) (15.4) (13.0) (12.1) (13.1) (11.8) (11.7) (11.5) (11.0)-32.2 -19.7 -94.5 -1.9 16.3 162.8 106.1 29.6 75.9 44.8 50.5 59.2 (-0.2) (-0.1) (-0.8) (-0.0) (0.2) (2.2) (1.5) (0.5) (1.4) (0.9) (1.2) (1.6)
992.4 806.7 721.2 698.3 649.8 533.8 519.2 381.7 316.9 272.2 234.2 292.3 (26.4) (25.3) (26.2) (28.6) (33.3) (31.1) (33.4) (29.6) (24.8) (24.4) (22.4) (32.5)982.6 901.5 782.5 768.2 608.8 464.0 411.3 344.1 284.2 263.2 212.4 187.7 (26.2) (28.3) (28.4) (31.5) (31.2) (27.0) (26.5) (26.7) (22.3) (23.6) (20.3) (20.9)
9.8 -94.8 -61.3 -69.9 41.0 69.8 107.9 37.6 32.7 9.0 21.8 104.6 (0.3) (-3.0) (-2.2) (-2.9) (2.1) (4.1) (6.9) (2.9) (2.6) (0.8) (2.1) (11.6)
1625.4 1157.8 958.0 901.7 754.0 694.7 601.9 438.3 375.8 325.0 298.5 258.0 (34.5) (27.9) (25.3) (25.6) (26.0) (23.1) (23.2) (18.9) (18.4) (18.1) (19.1) (19.0)
1521.4 1249.0 1081.2 965.7 860.7 653.3 595.4 509.3 422.3 326.0 296.2 273.2 (32.3) (30.1) (28.6) (27.5) (29.7) (21.7) (23.0) (22.0) (20.6) (18.2) (19.0) (20.1)104.0 -91.2 -123.2 -64.0 -106.7 41.4 6.5 -71.0 -46.5 -1.0 2.3 -15.2
(2.2) (-2.2) (-3.3) (-1.8) (-3.7) (1.4) (0.3) (-3.1) (-2.3) (-0.1) (0.1) (-1.1)
4775.4 3892.2 3336.5 2963.5 2556.9 2284.1 2013.1 1739.9 1489.4 1280.6 1166.6 953.4 (14.8) (15.6) (15.4) (15.6) (15.7) (16.0) (16.2) (15.0) (14.4) (14.9) (15.1) (14.3)
4954.1 3971.1 3482.9 3002.3 2666.7 2204.7 2097.8 1883.5 1416.5 1238.7 1002.3 894.9 (15.3) 3971.1 3971.1 3971.1 3971.1 3971.1 3971.1 3971.1 3971.1 3971.1 3971.1 3971.1
-178.7 -78.9 -146.4 -38.8 -109.8 79.4 -84.7 -143.6 72.9 41.9 164.3 58.5
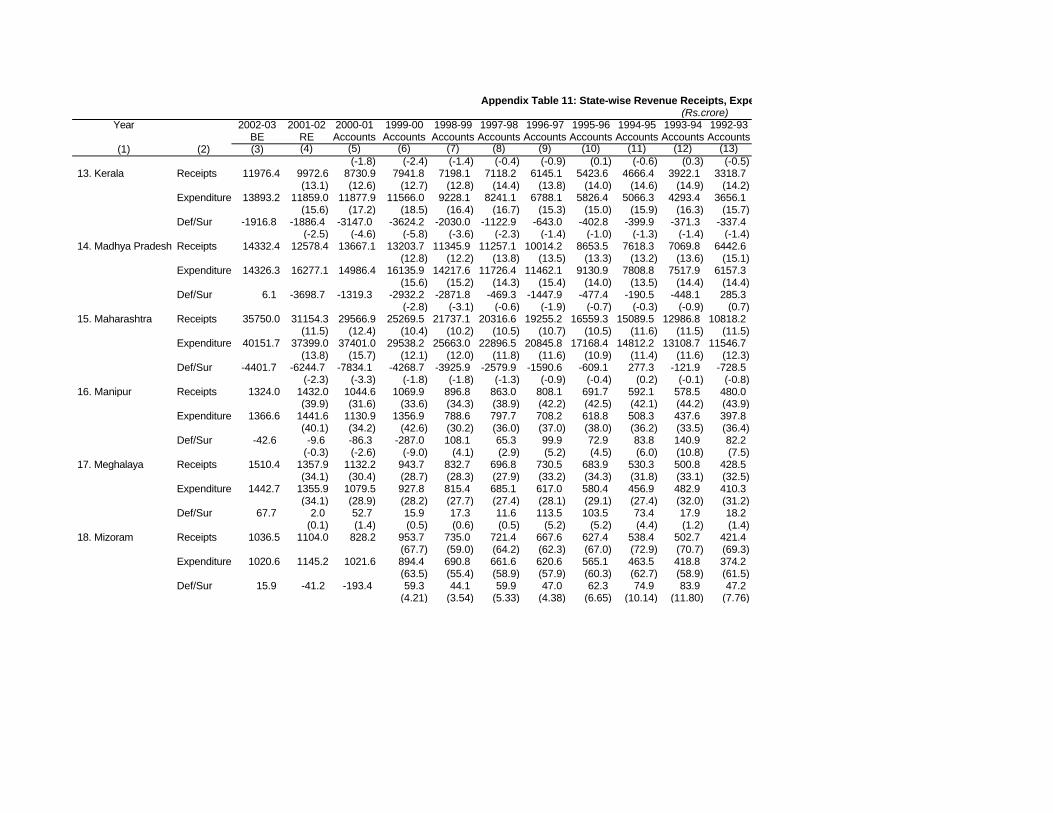
Year 2002-03 2001-02 2000-01 1999-00 1998-99 1997-98 1996-97 1995-96 1994-95 1993-94 1992-93BE RE Accounts Accounts Accounts Accounts Accounts Accounts Accounts Accounts Accounts
(1) (2) (3) (4) (5) (6) (7) (8) (9) (10) (11) (12) (13)
Appendix Table 11: State-wise Revenue Receipts, Expenditure and Revenue Deficit.(Rs.crore)
(-1.8) (-2.4) (-1.4) (-0.4) (-0.9) (0.1) (-0.6) (0.3) (-0.5) 13. Kerala Receipts 11976.4 9972.6 8730.9 7941.8 7198.1 7118.2 6145.1 5423.6 4666.4 3922.1 3318.7
(13.1) (12.6) (12.7) (12.8) (14.4) (13.8) (14.0) (14.6) (14.9) (14.2)Expenditure 13893.2 11859.0 11877.9 11566.0 9228.1 8241.1 6788.1 5826.4 5066.3 4293.4 3656.1
(15.6) (17.2) (18.5) (16.4) (16.7) (15.3) (15.0) (15.9) (16.3) (15.7)Def/Sur -1916.8 -1886.4 -3147.0 -3624.2 -2030.0 -1122.9 -643.0 -402.8 -399.9 -371.3 -337.4
(-2.5) (-4.6) (-5.8) (-3.6) (-2.3) (-1.4) (-1.0) (-1.3) (-1.4) (-1.4) 14. Madhya Pradesh Receipts 14332.4 12578.4 13667.1 13203.7 11345.9 11257.1 10014.2 8653.5 7618.3 7069.8 6442.6
(12.8) (12.2) (13.8) (13.5) (13.3) (13.2) (13.6) (15.1)Expenditure 14326.3 16277.1 14986.4 16135.9 14217.6 11726.4 11462.1 9130.9 7808.8 7517.9 6157.3
(15.6) (15.2) (14.3) (15.4) (14.0) (13.5) (14.4) (14.4)Def/Sur 6.1 -3698.7 -1319.3 -2932.2 -2871.8 -469.3 -1447.9 -477.4 -190.5 -448.1 285.3
(-2.8) (-3.1) (-0.6) (-1.9) (-0.7) (-0.3) (-0.9) (0.7) 15. Maharashtra Receipts 35750.0 31154.3 29566.9 25269.5 21737.1 20316.6 19255.2 16559.3 15089.5 12986.8 10818.2
(11.5) (12.4) (10.4) (10.2) (10.5) (10.7) (10.5) (11.6) (11.5) (11.5)Expenditure 40151.7 37399.0 37401.0 29538.2 25663.0 22896.5 20845.8 17168.4 14812.2 13108.7 11546.7
(13.8) (15.7) (12.1) (12.0) (11.8) (11.6) (10.9) (11.4) (11.6) (12.3)Def/Sur -4401.7 -6244.7 -7834.1 -4268.7 -3925.9 -2579.9 -1590.6 -609.1 277.3 -121.9 -728.5
(-2.3) (-3.3) (-1.8) (-1.8) (-1.3) (-0.9) (-0.4) (0.2) (-0.1) (-0.8) 16. Manipur Receipts 1324.0 1432.0 1044.6 1069.9 896.8 863.0 808.1 691.7 592.1 578.5 480.0
(39.9) (31.6) (33.6) (34.3) (38.9) (42.2) (42.5) (42.1) (44.2) (43.9)Expenditure 1366.6 1441.6 1130.9 1356.9 788.6 797.7 708.2 618.8 508.3 437.6 397.8
(40.1) (34.2) (42.6) (30.2) (36.0) (37.0) (38.0) (36.2) (33.5) (36.4)Def/Sur -42.6 -9.6 -86.3 -287.0 108.1 65.3 99.9 72.9 83.8 140.9 82.2
(-0.3) (-2.6) (-9.0) (4.1) (2.9) (5.2) (4.5) (6.0) (10.8) (7.5) 17. Meghalaya Receipts 1510.4 1357.9 1132.2 943.7 832.7 696.8 730.5 683.9 530.3 500.8 428.5
(34.1) (30.4) (28.7) (28.3) (27.9) (33.2) (34.3) (31.8) (33.1) (32.5)Expenditure 1442.7 1355.9 1079.5 927.8 815.4 685.1 617.0 580.4 456.9 482.9 410.3
(34.1) (28.9) (28.2) (27.7) (27.4) (28.1) (29.1) (27.4) (32.0) (31.2)Def/Sur 67.7 2.0 52.7 15.9 17.3 11.6 113.5 103.5 73.4 17.9 18.2
(0.1) (1.4) (0.5) (0.6) (0.5) (5.2) (5.2) (4.4) (1.2) (1.4) 18. Mizoram Receipts 1036.5 1104.0 828.2 953.7 735.0 721.4 667.6 627.4 538.4 502.7 421.4
(67.7) (59.0) (64.2) (62.3) (67.0) (72.9) (70.7) (69.3)Expenditure 1020.6 1145.2 1021.6 894.4 690.8 661.6 620.6 565.1 463.5 418.8 374.2
(63.5) (55.4) (58.9) (57.9) (60.3) (62.7) (58.9) (61.5)Def/Sur 15.9 -41.2 -193.4 59.3 44.1 59.9 47.0 62.3 74.9 83.9 47.2
(4.21) (3.54) (5.33) (4.38) (6.65) (10.14) (11.80) (7.76)
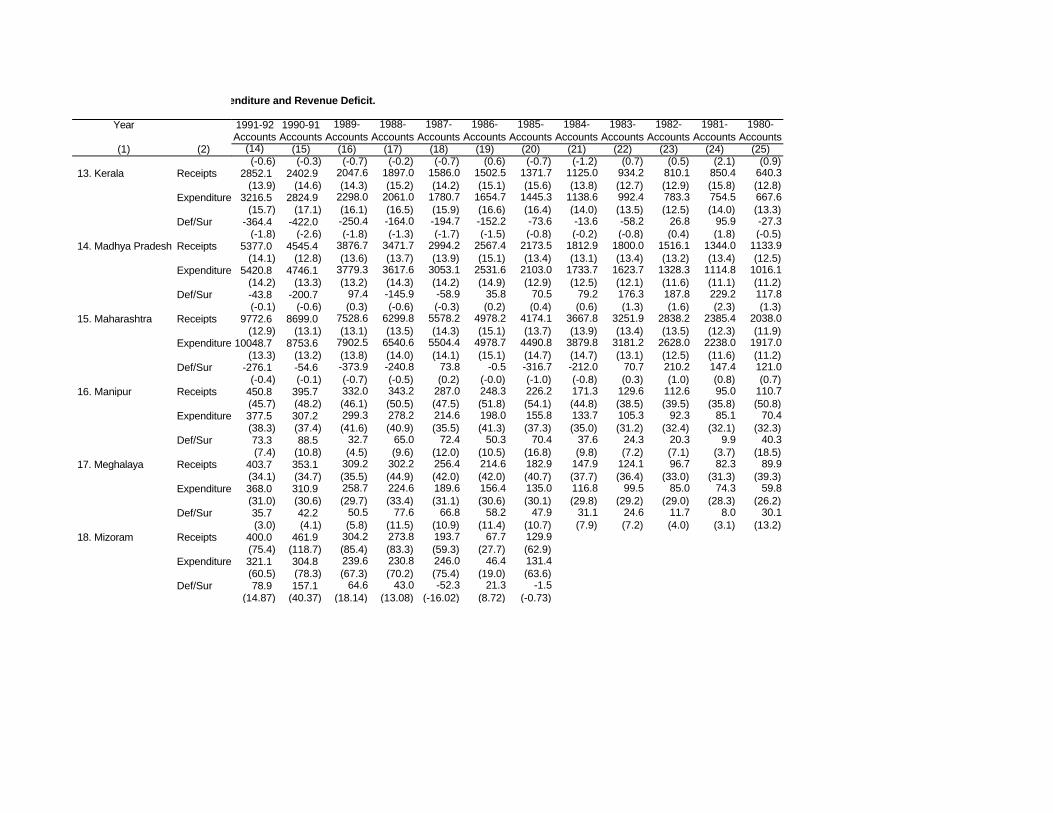
Year
(1) (2)
13. Kerala Receipts
Expenditure
Def/Sur
14. Madhya Pradesh Receipts
Expenditure
Def/Sur
15. Maharashtra Receipts
Expenditure
Def/Sur
16. Manipur Receipts
Expenditure
Def/Sur
17. Meghalaya Receipts
Expenditure
Def/Sur
18. Mizoram Receipts
Expenditure
Def/Sur
1991-92 1990-91 1989- 1988- 1987- 1986- 1985- 1984- 1983- 1982- 1981- 1980-Accounts Accounts Accounts Accounts Accounts Accounts Accounts Accounts Accounts Accounts Accounts Accounts
(14) (15) (16) (17) (18) (19) (20) (21) (22) (23) (24) (25)
Appendix Table 11: State-wise Revenue Receipts, Expenditure and Revenue Deficit.
(-0.6) (-0.3) (-0.7) (-0.2) (-0.7) (0.6) (-0.7) (-1.2) (0.7) (0.5) (2.1) (0.9)2852.1 2402.9 2047.6 1897.0 1586.0 1502.5 1371.7 1125.0 934.2 810.1 850.4 640.3
(13.9) (14.6) (14.3) (15.2) (14.2) (15.1) (15.6) (13.8) (12.7) (12.9) (15.8) (12.8)3216.5 2824.9 2298.0 2061.0 1780.7 1654.7 1445.3 1138.6 992.4 783.3 754.5 667.6
(15.7) (17.1) (16.1) (16.5) (15.9) (16.6) (16.4) (14.0) (13.5) (12.5) (14.0) (13.3)-364.4 -422.0 -250.4 -164.0 -194.7 -152.2 -73.6 -13.6 -58.2 26.8 95.9 -27.3
(-1.8) (-2.6) (-1.8) (-1.3) (-1.7) (-1.5) (-0.8) (-0.2) (-0.8) (0.4) (1.8) (-0.5)5377.0 4545.4 3876.7 3471.7 2994.2 2567.4 2173.5 1812.9 1800.0 1516.1 1344.0 1133.9
(14.1) (12.8) (13.6) (13.7) (13.9) (15.1) (13.4) (13.1) (13.4) (13.2) (13.4) (12.5)5420.8 4746.1 3779.3 3617.6 3053.1 2531.6 2103.0 1733.7 1623.7 1328.3 1114.8 1016.1
(14.2) (13.3) (13.2) (14.3) (14.2) (14.9) (12.9) (12.5) (12.1) (11.6) (11.1) (11.2)-43.8 -200.7 97.4 -145.9 -58.9 35.8 70.5 79.2 176.3 187.8 229.2 117.8 (-0.1) (-0.6) (0.3) (-0.6) (-0.3) (0.2) (0.4) (0.6) (1.3) (1.6) (2.3) (1.3)
9772.6 8699.0 7528.6 6299.8 5578.2 4978.2 4174.1 3667.8 3251.9 2838.2 2385.4 2038.0 (12.9) (13.1) (13.1) (13.5) (14.3) (15.1) (13.7) (13.9) (13.4) (13.5) (12.3) (11.9)
10048.7 8753.6 7902.5 6540.6 5504.4 4978.7 4490.8 3879.8 3181.2 2628.0 2238.0 1917.0 (13.3) (13.2) (13.8) (14.0) (14.1) (15.1) (14.7) (14.7) (13.1) (12.5) (11.6) (11.2)
-276.1 -54.6 -373.9 -240.8 73.8 -0.5 -316.7 -212.0 70.7 210.2 147.4 121.0 (-0.4) (-0.1) (-0.7) (-0.5) (0.2) (-0.0) (-1.0) (-0.8) (0.3) (1.0) (0.8) (0.7)
450.8 395.7 332.0 343.2 287.0 248.3 226.2 171.3 129.6 112.6 95.0 110.7 (45.7) (48.2) (46.1) (50.5) (47.5) (51.8) (54.1) (44.8) (38.5) (39.5) (35.8) (50.8)377.5 307.2 299.3 278.2 214.6 198.0 155.8 133.7 105.3 92.3 85.1 70.4 (38.3) (37.4) (41.6) (40.9) (35.5) (41.3) (37.3) (35.0) (31.2) (32.4) (32.1) (32.3)73.3 88.5 32.7 65.0 72.4 50.3 70.4 37.6 24.3 20.3 9.9 40.3 (7.4) (10.8) (4.5) (9.6) (12.0) (10.5) (16.8) (9.8) (7.2) (7.1) (3.7) (18.5)
403.7 353.1 309.2 302.2 256.4 214.6 182.9 147.9 124.1 96.7 82.3 89.9 (34.1) (34.7) (35.5) (44.9) (42.0) (42.0) (40.7) (37.7) (36.4) (33.0) (31.3) (39.3)368.0 310.9 258.7 224.6 189.6 156.4 135.0 116.8 99.5 85.0 74.3 59.8 (31.0) (30.6) (29.7) (33.4) (31.1) (30.6) (30.1) (29.8) (29.2) (29.0) (28.3) (26.2)35.7 42.2 50.5 77.6 66.8 58.2 47.9 31.1 24.6 11.7 8.0 30.1 (3.0) (4.1) (5.8) (11.5) (10.9) (11.4) (10.7) (7.9) (7.2) (4.0) (3.1) (13.2)
400.0 461.9 304.2 273.8 193.7 67.7 129.9 (75.4) (118.7) (85.4) (83.3) (59.3) (27.7) (62.9) 321.1 304.8 239.6 230.8 246.0 46.4 131.4 (60.5) (78.3) (67.3) (70.2) (75.4) (19.0) (63.6) 78.9 157.1 64.6 43.0 -52.3 21.3 -1.5
(14.87) (40.37) (18.14) (13.08) (-16.02) (8.72) (-0.73)
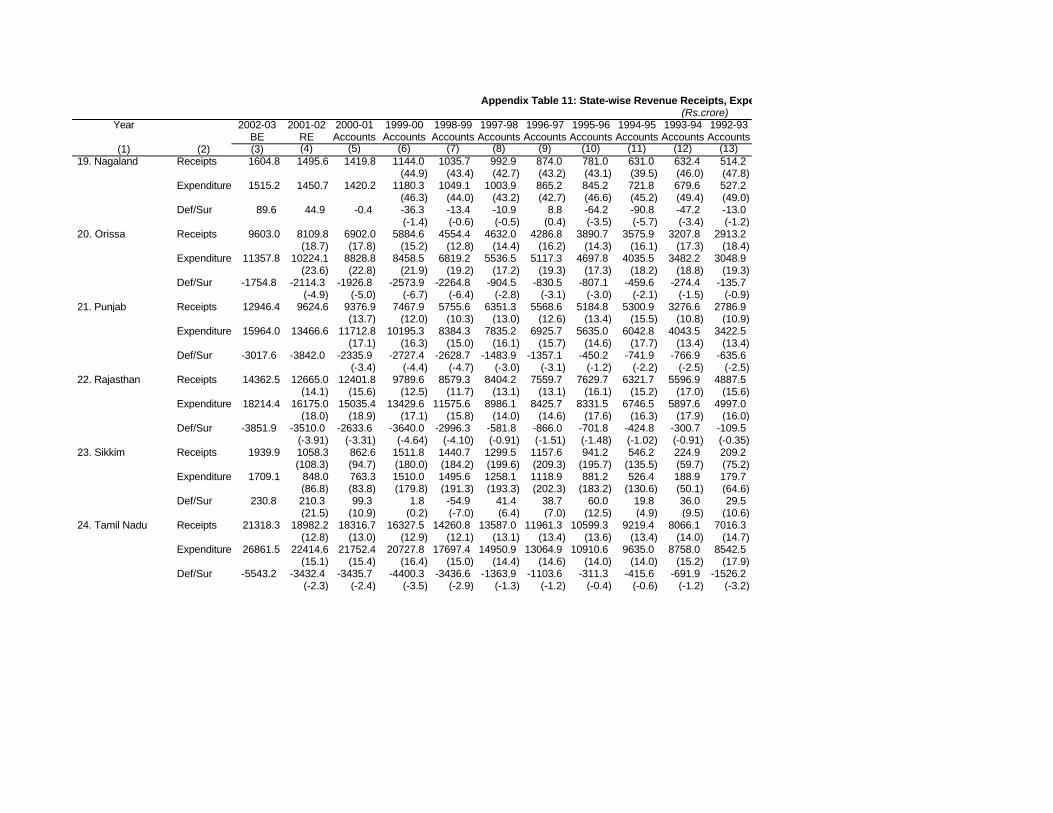
Year 2002-03 2001-02 2000-01 1999-00 1998-99 1997-98 1996-97 1995-96 1994-95 1993-94 1992-93BE RE Accounts Accounts Accounts Accounts Accounts Accounts Accounts Accounts Accounts
(1) (2) (3) (4) (5) (6) (7) (8) (9) (10) (11) (12) (13)
Appendix Table 11: State-wise Revenue Receipts, Expenditure and Revenue Deficit.(Rs.crore)
19. Nagaland Receipts 1604.8 1495.6 1419.8 1144.0 1035.7 992.9 874.0 781.0 631.0 632.4 514.2(44.9) (43.4) (42.7) (43.2) (43.1) (39.5) (46.0) (47.8)
Expenditure 1515.2 1450.7 1420.2 1180.3 1049.1 1003.9 865.2 845.2 721.8 679.6 527.2(46.3) (44.0) (43.2) (42.7) (46.6) (45.2) (49.4) (49.0)
Def/Sur 89.6 44.9 -0.4 -36.3 -13.4 -10.9 8.8 -64.2 -90.8 -47.2 -13.0(-1.4) (-0.6) (-0.5) (0.4) (-3.5) (-5.7) (-3.4) (-1.2)
20. Orissa Receipts 9603.0 8109.8 6902.0 5884.6 4554.4 4632.0 4286.8 3890.7 3575.9 3207.8 2913.2(18.7) (17.8) (15.2) (12.8) (14.4) (16.2) (14.3) (16.1) (17.3) (18.4)
Expenditure 11357.8 10224.1 8828.8 8458.5 6819.2 5536.5 5117.3 4697.8 4035.5 3482.2 3048.9(23.6) (22.8) (21.9) (19.2) (17.2) (19.3) (17.3) (18.2) (18.8) (19.3)
Def/Sur -1754.8 -2114.3 -1926.8 -2573.9 -2264.8 -904.5 -830.5 -807.1 -459.6 -274.4 -135.7(-4.9) (-5.0) (-6.7) (-6.4) (-2.8) (-3.1) (-3.0) (-2.1) (-1.5) (-0.9)
21. Punjab Receipts 12946.4 9624.6 9376.9 7467.9 5755.6 6351.3 5568.6 5184.8 5300.9 3276.6 2786.9(13.7) (12.0) (10.3) (13.0) (12.6) (13.4) (15.5) (10.8) (10.9)
Expenditure 15964.0 13466.6 11712.8 10195.3 8384.3 7835.2 6925.7 5635.0 6042.8 4043.5 3422.5(17.1) (16.3) (15.0) (16.1) (15.7) (14.6) (17.7) (13.4) (13.4)
Def/Sur -3017.6 -3842.0 -2335.9 -2727.4 -2628.7 -1483.9 -1357.1 -450.2 -741.9 -766.9 -635.6(-3.4) (-4.4) (-4.7) (-3.0) (-3.1) (-1.2) (-2.2) (-2.5) (-2.5)
22. Rajasthan Receipts 14362.5 12665.0 12401.8 9789.6 8579.3 8404.2 7559.7 7629.7 6321.7 5596.9 4887.5(14.1) (15.6) (12.5) (11.7) (13.1) (13.1) (16.1) (15.2) (17.0) (15.6)
Expenditure 18214.4 16175.0 15035.4 13429.6 11575.6 8986.1 8425.7 8331.5 6746.5 5897.6 4997.0(18.0) (18.9) (17.1) (15.8) (14.0) (14.6) (17.6) (16.3) (17.9) (16.0)
Def/Sur -3851.9 -3510.0 -2633.6 -3640.0 -2996.3 -581.8 -866.0 -701.8 -424.8 -300.7 -109.5(-3.91) (-3.31) (-4.64) (-4.10) (-0.91) (-1.51) (-1.48) (-1.02) (-0.91) (-0.35)
23. Sikkim Receipts 1939.9 1058.3 862.6 1511.8 1440.7 1299.5 1157.6 941.2 546.2 224.9 209.2(108.3) (94.7) (180.0) (184.2) (199.6) (209.3) (195.7) (135.5) (59.7) (75.2)
Expenditure 1709.1 848.0 763.3 1510.0 1495.6 1258.1 1118.9 881.2 526.4 188.9 179.7(86.8) (83.8) (179.8) (191.3) (193.3) (202.3) (183.2) (130.6) (50.1) (64.6)
Def/Sur 230.8 210.3 99.3 1.8 -54.9 41.4 38.7 60.0 19.8 36.0 29.5(21.5) (10.9) (0.2) (-7.0) (6.4) (7.0) (12.5) (4.9) (9.5) (10.6)
24. Tamil Nadu Receipts 21318.3 18982.2 18316.7 16327.5 14260.8 13587.0 11961.3 10599.3 9219.4 8066.1 7016.3(12.8) (13.0) (12.9) (12.1) (13.1) (13.4) (13.6) (13.4) (14.0) (14.7)
Expenditure 26861.5 22414.6 21752.4 20727.8 17697.4 14950.9 13064.9 10910.6 9635.0 8758.0 8542.5(15.1) (15.4) (16.4) (15.0) (14.4) (14.6) (14.0) (14.0) (15.2) (17.9)
Def/Sur -5543.2 -3432.4 -3435.7 -4400.3 -3436.6 -1363.9 -1103.6 -311.3 -415.6 -691.9 -1526.2(-2.3) (-2.4) (-3.5) (-2.9) (-1.3) (-1.2) (-0.4) (-0.6) (-1.2) (-3.2)
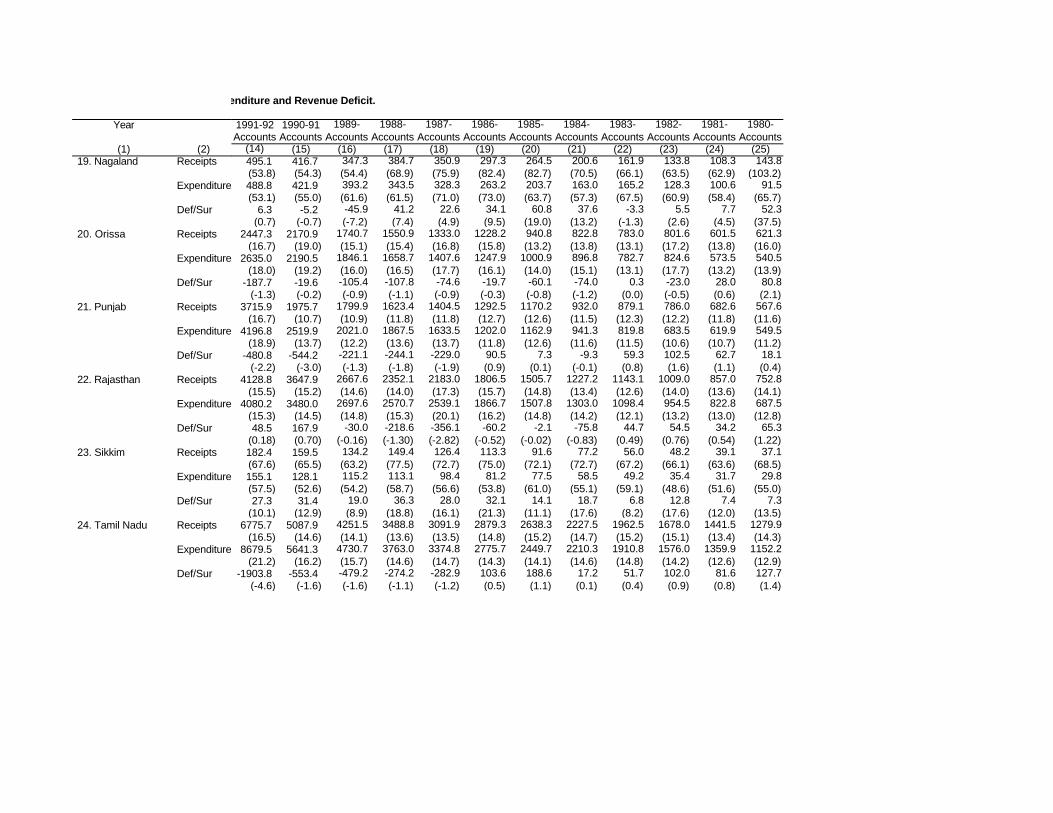
Year
(1) (2) 19. Nagaland Receipts
Expenditure
Def/Sur
20. Orissa Receipts
Expenditure
Def/Sur
21. Punjab Receipts
Expenditure
Def/Sur
22. Rajasthan Receipts
Expenditure
Def/Sur
23. Sikkim Receipts
Expenditure
Def/Sur
24. Tamil Nadu Receipts
Expenditure
Def/Sur
1991-92 1990-91 1989- 1988- 1987- 1986- 1985- 1984- 1983- 1982- 1981- 1980-Accounts Accounts Accounts Accounts Accounts Accounts Accounts Accounts Accounts Accounts Accounts Accounts
(14) (15) (16) (17) (18) (19) (20) (21) (22) (23) (24) (25)
Appendix Table 11: State-wise Revenue Receipts, Expenditure and Revenue Deficit.
495.1 416.7 347.3 384.7 350.9 297.3 264.5 200.6 161.9 133.8 108.3 143.8 (53.8) (54.3) (54.4) (68.9) (75.9) (82.4) (82.7) (70.5) (66.1) (63.5) (62.9) (103.2)488.8 421.9 393.2 343.5 328.3 263.2 203.7 163.0 165.2 128.3 100.6 91.5 (53.1) (55.0) (61.6) (61.5) (71.0) (73.0) (63.7) (57.3) (67.5) (60.9) (58.4) (65.7)
6.3 -5.2 -45.9 41.2 22.6 34.1 60.8 37.6 -3.3 5.5 7.7 52.3 (0.7) (-0.7) (-7.2) (7.4) (4.9) (9.5) (19.0) (13.2) (-1.3) (2.6) (4.5) (37.5)
2447.3 2170.9 1740.7 1550.9 1333.0 1228.2 940.8 822.8 783.0 801.6 601.5 621.3 (16.7) (19.0) (15.1) (15.4) (16.8) (15.8) (13.2) (13.8) (13.1) (17.2) (13.8) (16.0)
2635.0 2190.5 1846.1 1658.7 1407.6 1247.9 1000.9 896.8 782.7 824.6 573.5 540.5 (18.0) (19.2) (16.0) (16.5) (17.7) (16.1) (14.0) (15.1) (13.1) (17.7) (13.2) (13.9)
-187.7 -19.6 -105.4 -107.8 -74.6 -19.7 -60.1 -74.0 0.3 -23.0 28.0 80.8 (-1.3) (-0.2) (-0.9) (-1.1) (-0.9) (-0.3) (-0.8) (-1.2) (0.0) (-0.5) (0.6) (2.1)
3715.9 1975.7 1799.9 1623.4 1404.5 1292.5 1170.2 932.0 879.1 786.0 682.6 567.6 (16.7) (10.7) (10.9) (11.8) (11.8) (12.7) (12.6) (11.5) (12.3) (12.2) (11.8) (11.6)
4196.8 2519.9 2021.0 1867.5 1633.5 1202.0 1162.9 941.3 819.8 683.5 619.9 549.5 (18.9) (13.7) (12.2) (13.6) (13.7) (11.8) (12.6) (11.6) (11.5) (10.6) (10.7) (11.2)
-480.8 -544.2 -221.1 -244.1 -229.0 90.5 7.3 -9.3 59.3 102.5 62.7 18.1 (-2.2) (-3.0) (-1.3) (-1.8) (-1.9) (0.9) (0.1) (-0.1) (0.8) (1.6) (1.1) (0.4)
4128.8 3647.9 2667.6 2352.1 2183.0 1806.5 1505.7 1227.2 1143.1 1009.0 857.0 752.8 (15.5) (15.2) (14.6) (14.0) (17.3) (15.7) (14.8) (13.4) (12.6) (14.0) (13.6) (14.1)
4080.2 3480.0 2697.6 2570.7 2539.1 1866.7 1507.8 1303.0 1098.4 954.5 822.8 687.5 (15.3) (14.5) (14.8) (15.3) (20.1) (16.2) (14.8) (14.2) (12.1) (13.2) (13.0) (12.8)48.5 167.9 -30.0 -218.6 -356.1 -60.2 -2.1 -75.8 44.7 54.5 34.2 65.3
(0.18) (0.70) (-0.16) (-1.30) (-2.82) (-0.52) (-0.02) (-0.83) (0.49) (0.76) (0.54) (1.22)182.4 159.5 134.2 149.4 126.4 113.3 91.6 77.2 56.0 48.2 39.1 37.1 (67.6) (65.5) (63.2) (77.5) (72.7) (75.0) (72.1) (72.7) (67.2) (66.1) (63.6) (68.5)155.1 128.1 115.2 113.1 98.4 81.2 77.5 58.5 49.2 35.4 31.7 29.8 (57.5) (52.6) (54.2) (58.7) (56.6) (53.8) (61.0) (55.1) (59.1) (48.6) (51.6) (55.0)27.3 31.4 19.0 36.3 28.0 32.1 14.1 18.7 6.8 12.8 7.4 7.3
(10.1) (12.9) (8.9) (18.8) (16.1) (21.3) (11.1) (17.6) (8.2) (17.6) (12.0) (13.5)6775.7 5087.9 4251.5 3488.8 3091.9 2879.3 2638.3 2227.5 1962.5 1678.0 1441.5 1279.9
(16.5) (14.6) (14.1) (13.6) (13.5) (14.8) (15.2) (14.7) (15.2) (15.1) (13.4) (14.3)8679.5 5641.3 4730.7 3763.0 3374.8 2775.7 2449.7 2210.3 1910.8 1576.0 1359.9 1152.2
(21.2) (16.2) (15.7) (14.6) (14.7) (14.3) (14.1) (14.6) (14.8) (14.2) (12.6) (12.9)-1903.8 -553.4 -479.2 -274.2 -282.9 103.6 188.6 17.2 51.7 102.0 81.6 127.7
(-4.6) (-1.6) (-1.6) (-1.1) (-1.2) (0.5) (1.1) (0.1) (0.4) (0.9) (0.8) (1.4)
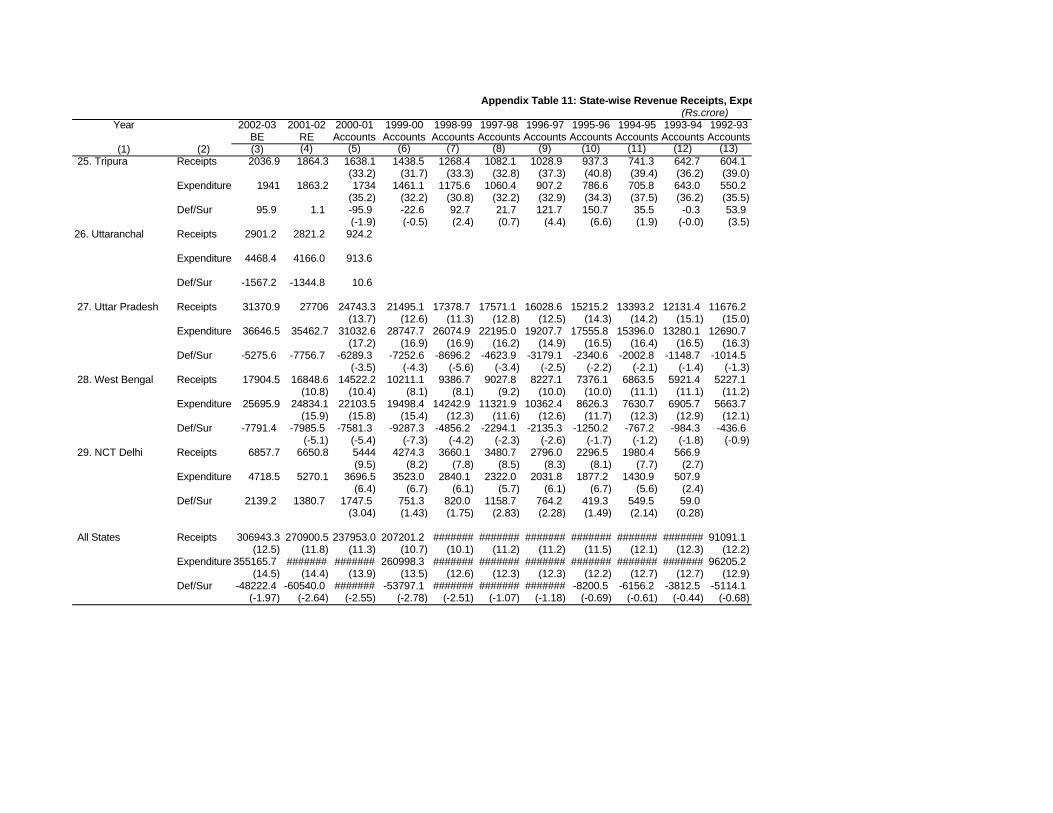
Year 2002-03 2001-02 2000-01 1999-00 1998-99 1997-98 1996-97 1995-96 1994-95 1993-94 1992-93BE RE Accounts Accounts Accounts Accounts Accounts Accounts Accounts Accounts Accounts
(1) (2) (3) (4) (5) (6) (7) (8) (9) (10) (11) (12) (13)
Appendix Table 11: State-wise Revenue Receipts, Expenditure and Revenue Deficit.(Rs.crore)
25. Tripura Receipts 2036.9 1864.3 1638.1 1438.5 1268.4 1082.1 1028.9 937.3 741.3 642.7 604.1(33.2) (31.7) (33.3) (32.8) (37.3) (40.8) (39.4) (36.2) (39.0)
Expenditure 1941 1863.2 1734 1461.1 1175.6 1060.4 907.2 786.6 705.8 643.0 550.2(35.2) (32.2) (30.8) (32.2) (32.9) (34.3) (37.5) (36.2) (35.5)
Def/Sur 95.9 1.1 -95.9 -22.6 92.7 21.7 121.7 150.7 35.5 -0.3 53.9(-1.9) (-0.5) (2.4) (0.7) (4.4) (6.6) (1.9) (-0.0) (3.5)
26. Uttaranchal Receipts 2901.2 2821.2 924.2
Expenditure 4468.4 4166.0 913.6
Def/Sur -1567.2 -1344.8 10.6
27. Uttar Pradesh Receipts 31370.9 27706 24743.3 21495.1 17378.7 17571.1 16028.6 15215.2 13393.2 12131.4 11676.2(13.7) (12.6) (11.3) (12.8) (12.5) (14.3) (14.2) (15.1) (15.0)
Expenditure 36646.5 35462.7 31032.6 28747.7 26074.9 22195.0 19207.7 17555.8 15396.0 13280.1 12690.7(17.2) (16.9) (16.9) (16.2) (14.9) (16.5) (16.4) (16.5) (16.3)
Def/Sur -5275.6 -7756.7 -6289.3 -7252.6 -8696.2 -4623.9 -3179.1 -2340.6 -2002.8 -1148.7 -1014.5(-3.5) (-4.3) (-5.6) (-3.4) (-2.5) (-2.2) (-2.1) (-1.4) (-1.3)
28. West Bengal Receipts 17904.5 16848.6 14522.2 10211.1 9386.7 9027.8 8227.1 7376.1 6863.5 5921.4 5227.1(10.8) (10.4) (8.1) (8.1) (9.2) (10.0) (10.0) (11.1) (11.1) (11.2)
Expenditure 25695.9 24834.1 22103.5 19498.4 14242.9 11321.9 10362.4 8626.3 7630.7 6905.7 5663.7(15.9) (15.8) (15.4) (12.3) (11.6) (12.6) (11.7) (12.3) (12.9) (12.1)
Def/Sur -7791.4 -7985.5 -7581.3 -9287.3 -4856.2 -2294.1 -2135.3 -1250.2 -767.2 -984.3 -436.6(-5.1) (-5.4) (-7.3) (-4.2) (-2.3) (-2.6) (-1.7) (-1.2) (-1.8) (-0.9)
29. NCT Delhi Receipts 6857.7 6650.8 5444 4274.3 3660.1 3480.7 2796.0 2296.5 1980.4 566.9(9.5) (8.2) (7.8) (8.5) (8.3) (8.1) (7.7) (2.7)
Expenditure 4718.5 5270.1 3696.5 3523.0 2840.1 2322.0 2031.8 1877.2 1430.9 507.9 (6.4) (6.7) (6.1) (5.7) (6.1) (6.7) (5.6) (2.4)
Def/Sur 2139.2 1380.7 1747.5 751.3 820.0 1158.7 764.2 419.3 549.5 59.0 (3.04) (1.43) (1.75) (2.83) (2.28) (1.49) (2.14) (0.28)
All States Receipts 306943.3 270900.5 237953.0 207201.2 ####### ####### ####### ####### ####### ####### 91091.1
(12.5) (11.8) (11.3) (10.7) (10.1) (11.2) (11.2) (11.5) (12.1) (12.3) (12.2)Expenditure 355165.7 ####### ####### 260998.3 ####### ####### ####### ####### ####### ####### 96205.2
(14.5) (14.4) (13.9) (13.5) (12.6) (12.3) (12.3) (12.2) (12.7) (12.7) (12.9)Def/Sur -48222.4 -60540.0 ####### -53797.1 ####### ####### ####### -8200.5 -6156.2 -3812.5 -5114.1
(-1.97) (-2.64) (-2.55) (-2.78) (-2.51) (-1.07) (-1.18) (-0.69) (-0.61) (-0.44) (-0.68)
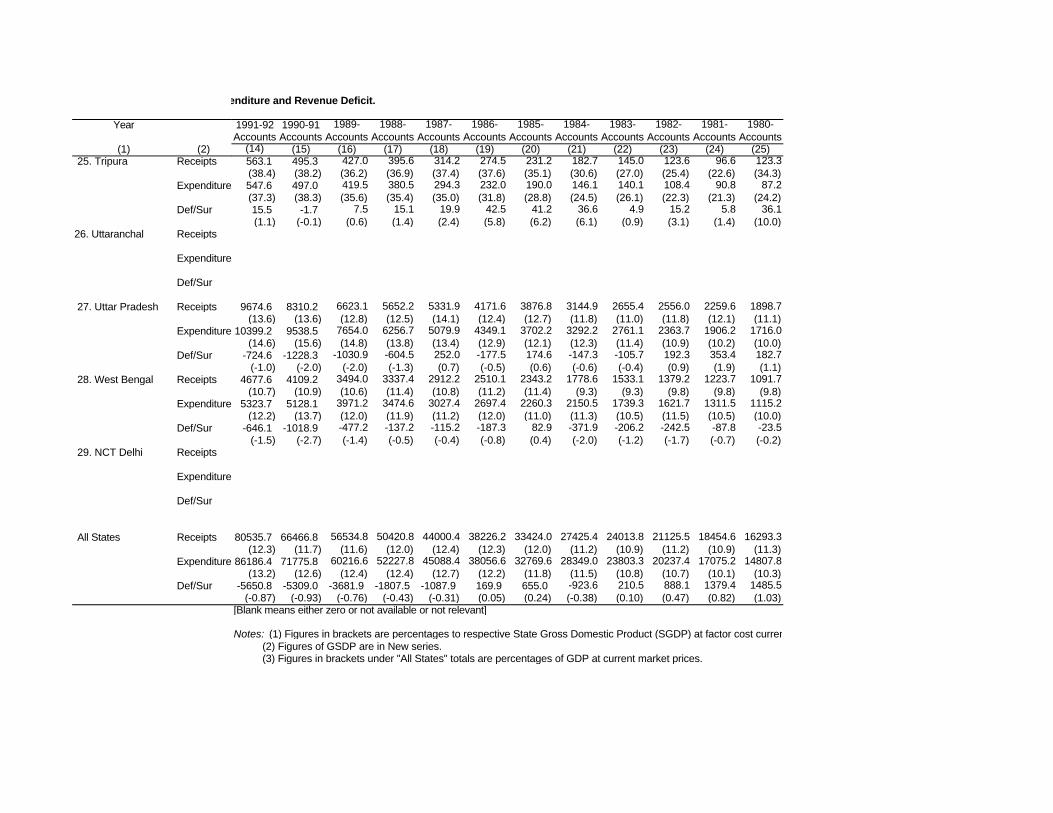
Year
(1) (2) 25. Tripura Receipts
Expenditure
Def/Sur
26. Uttaranchal Receipts
Expenditure
Def/Sur
27. Uttar Pradesh Receipts
Expenditure
Def/Sur
28. West Bengal Receipts
Expenditure
Def/Sur
29. NCT Delhi Receipts
Expenditure
Def/Sur
All States Receipts
Expenditure
Def/Sur
1991-92 1990-91 1989- 1988- 1987- 1986- 1985- 1984- 1983- 1982- 1981- 1980-Accounts Accounts Accounts Accounts Accounts Accounts Accounts Accounts Accounts Accounts Accounts Accounts
(14) (15) (16) (17) (18) (19) (20) (21) (22) (23) (24) (25)
Appendix Table 11: State-wise Revenue Receipts, Expenditure and Revenue Deficit.
563.1 495.3 427.0 395.6 314.2 274.5 231.2 182.7 145.0 123.6 96.6 123.3 (38.4) (38.2) (36.2) (36.9) (37.4) (37.6) (35.1) (30.6) (27.0) (25.4) (22.6) (34.3)547.6 497.0 419.5 380.5 294.3 232.0 190.0 146.1 140.1 108.4 90.8 87.2 (37.3) (38.3) (35.6) (35.4) (35.0) (31.8) (28.8) (24.5) (26.1) (22.3) (21.3) (24.2)15.5 -1.7 7.5 15.1 19.9 42.5 41.2 36.6 4.9 15.2 5.8 36.1 (1.1) (-0.1) (0.6) (1.4) (2.4) (5.8) (6.2) (6.1) (0.9) (3.1) (1.4) (10.0)
9674.6 8310.2 6623.1 5652.2 5331.9 4171.6 3876.8 3144.9 2655.4 2556.0 2259.6 1898.7 (13.6) (13.6) (12.8) (12.5) (14.1) (12.4) (12.7) (11.8) (11.0) (11.8) (12.1) (11.1)
10399.2 9538.5 7654.0 6256.7 5079.9 4349.1 3702.2 3292.2 2761.1 2363.7 1906.2 1716.0 (14.6) (15.6) (14.8) (13.8) (13.4) (12.9) (12.1) (12.3) (11.4) (10.9) (10.2) (10.0)
-724.6 -1228.3 -1030.9 -604.5 252.0 -177.5 174.6 -147.3 -105.7 192.3 353.4 182.7 (-1.0) (-2.0) (-2.0) (-1.3) (0.7) (-0.5) (0.6) (-0.6) (-0.4) (0.9) (1.9) (1.1)
4677.6 4109.2 3494.0 3337.4 2912.2 2510.1 2343.2 1778.6 1533.1 1379.2 1223.7 1091.7 (10.7) (10.9) (10.6) (11.4) (10.8) (11.2) (11.4) (9.3) (9.3) (9.8) (9.8) (9.8)
5323.7 5128.1 3971.2 3474.6 3027.4 2697.4 2260.3 2150.5 1739.3 1621.7 1311.5 1115.2 (12.2) (13.7) (12.0) (11.9) (11.2) (12.0) (11.0) (11.3) (10.5) (11.5) (10.5) (10.0)
-646.1 -1018.9 -477.2 -137.2 -115.2 -187.3 82.9 -371.9 -206.2 -242.5 -87.8 -23.5 (-1.5) (-2.7) (-1.4) (-0.5) (-0.4) (-0.8) (0.4) (-2.0) (-1.2) (-1.7) (-0.7) (-0.2)
80535.7 66466.8 56534.8 50420.8 44000.4 38226.2 33424.0 27425.4 24013.8 21125.5 18454.6 16293.3
(12.3) (11.7) (11.6) (12.0) (12.4) (12.3) (12.0) (11.2) (10.9) (11.2) (10.9) (11.3)86186.4 71775.8 60216.6 52227.8 45088.4 38056.6 32769.6 28349.0 23803.3 20237.4 17075.2 14807.8
(13.2) (12.6) (12.4) (12.4) (12.7) (12.2) (11.8) (11.5) (10.8) (10.7) (10.1) (10.3)-5650.8 -5309.0 -3681.9 -1807.5 -1087.9 169.9 655.0 -923.6 210.5 888.1 1379.4 1485.5
(-0.87) (-0.93) (-0.76) (-0.43) (-0.31) (0.05) (0.24) (-0.38) (0.10) (0.47) (0.82) (1.03)[Blank means either zero or not available or not relevant]
Notes: (1) Figures in brackets are percentages to respective State Gross Domestic Product (SGDP) at factor cost current prices. (2) Figures of GSDP are in New series. (3) Figures in brackets under "All States" totals are percentages of GDP at current market prices.
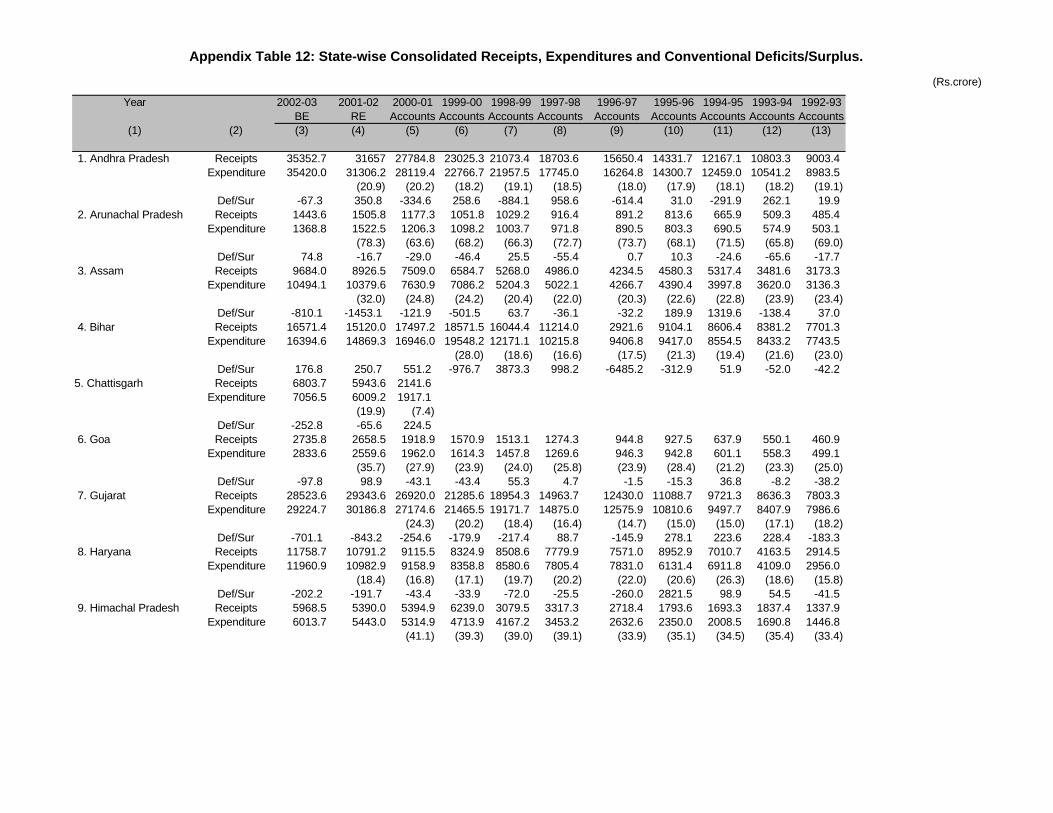
Appendix Table 12: State-wise Consolidated Receipts, Expenditures and Conventional Deficits/Surplus.
(Rs.crore)
Year 2002-03 2001-02 2000-01 1999-00 1998-99 1997-98 1996-97 1995-96 1994-95 1993-94 1992-93BE RE Accounts Accounts Accounts Accounts Accounts Accounts Accounts Accounts Accounts
(1) (2) (3) (4) (5) (6) (7) (8) (9) (10) (11) (12) (13) 1. Andhra Pradesh Receipts 35352.7 31657 27784.8 23025.3 21073.4 18703.6 15650.4 14331.7 12167.1 10803.3 9003.4
Expenditure 35420.0 31306.2 28119.4 22766.7 21957.5 17745.0 16264.8 14300.7 12459.0 10541.2 8983.5(20.9) (20.2) (18.2) (19.1) (18.5) (18.0) (17.9) (18.1) (18.2) (19.1)
Def/Sur -67.3 350.8 -334.6 258.6 -884.1 958.6 -614.4 31.0 -291.9 262.1 19.9 2. Arunachal Pradesh Receipts 1443.6 1505.8 1177.3 1051.8 1029.2 916.4 891.2 813.6 665.9 509.3 485.4
Expenditure 1368.8 1522.5 1206.3 1098.2 1003.7 971.8 890.5 803.3 690.5 574.9 503.1(78.3) (63.6) (68.2) (66.3) (72.7) (73.7) (68.1) (71.5) (65.8) (69.0)
Def/Sur 74.8 -16.7 -29.0 -46.4 25.5 -55.4 0.7 10.3 -24.6 -65.6 -17.7 3. Assam Receipts 9684.0 8926.5 7509.0 6584.7 5268.0 4986.0 4234.5 4580.3 5317.4 3481.6 3173.3
Expenditure 10494.1 10379.6 7630.9 7086.2 5204.3 5022.1 4266.7 4390.4 3997.8 3620.0 3136.3(32.0) (24.8) (24.2) (20.4) (22.0) (20.3) (22.6) (22.8) (23.9) (23.4)
Def/Sur -810.1 -1453.1 -121.9 -501.5 63.7 -36.1 -32.2 189.9 1319.6 -138.4 37.0 4. Bihar Receipts 16571.4 15120.0 17497.2 18571.5 16044.4 11214.0 2921.6 9104.1 8606.4 8381.2 7701.3
Expenditure 16394.6 14869.3 16946.0 19548.2 12171.1 10215.8 9406.8 9417.0 8554.5 8433.2 7743.5(28.0) (18.6) (16.6) (17.5) (21.3) (19.4) (21.6) (23.0)
Def/Sur 176.8 250.7 551.2 -976.7 3873.3 998.2 -6485.2 -312.9 51.9 -52.0 -42.25. Chattisgarh Receipts 6803.7 5943.6 2141.6
Expenditure 7056.5 6009.2 1917.1(19.9) (7.4)
Def/Sur -252.8 -65.6 224.5 6. Goa Receipts 2735.8 2658.5 1918.9 1570.9 1513.1 1274.3 944.8 927.5 637.9 550.1 460.9
Expenditure 2833.6 2559.6 1962.0 1614.3 1457.8 1269.6 946.3 942.8 601.1 558.3 499.1(35.7) (27.9) (23.9) (24.0) (25.8) (23.9) (28.4) (21.2) (23.3) (25.0)
Def/Sur -97.8 98.9 -43.1 -43.4 55.3 4.7 -1.5 -15.3 36.8 -8.2 -38.2 7. Gujarat Receipts 28523.6 29343.6 26920.0 21285.6 18954.3 14963.7 12430.0 11088.7 9721.3 8636.3 7803.3
Expenditure 29224.7 30186.8 27174.6 21465.5 19171.7 14875.0 12575.9 10810.6 9497.7 8407.9 7986.6(24.3) (20.2) (18.4) (16.4) (14.7) (15.0) (15.0) (17.1) (18.2)
Def/Sur -701.1 -843.2 -254.6 -179.9 -217.4 88.7 -145.9 278.1 223.6 228.4 -183.3 8. Haryana Receipts 11758.7 10791.2 9115.5 8324.9 8508.6 7779.9 7571.0 8952.9 7010.7 4163.5 2914.5
Expenditure 11960.9 10982.9 9158.9 8358.8 8580.6 7805.4 7831.0 6131.4 6911.8 4109.0 2956.0(18.4) (16.8) (17.1) (19.7) (20.2) (22.0) (20.6) (26.3) (18.6) (15.8)
Def/Sur -202.2 -191.7 -43.4 -33.9 -72.0 -25.5 -260.0 2821.5 98.9 54.5 -41.5 9. Himachal Pradesh Receipts 5968.5 5390.0 5394.9 6239.0 3079.5 3317.3 2718.4 1793.6 1693.3 1837.4 1337.9
Expenditure 6013.7 5443.0 5314.9 4713.9 4167.2 3453.2 2632.6 2350.0 2008.5 1690.8 1446.8(41.1) (39.3) (39.0) (39.1) (33.9) (35.1) (34.5) (35.4) (33.4)
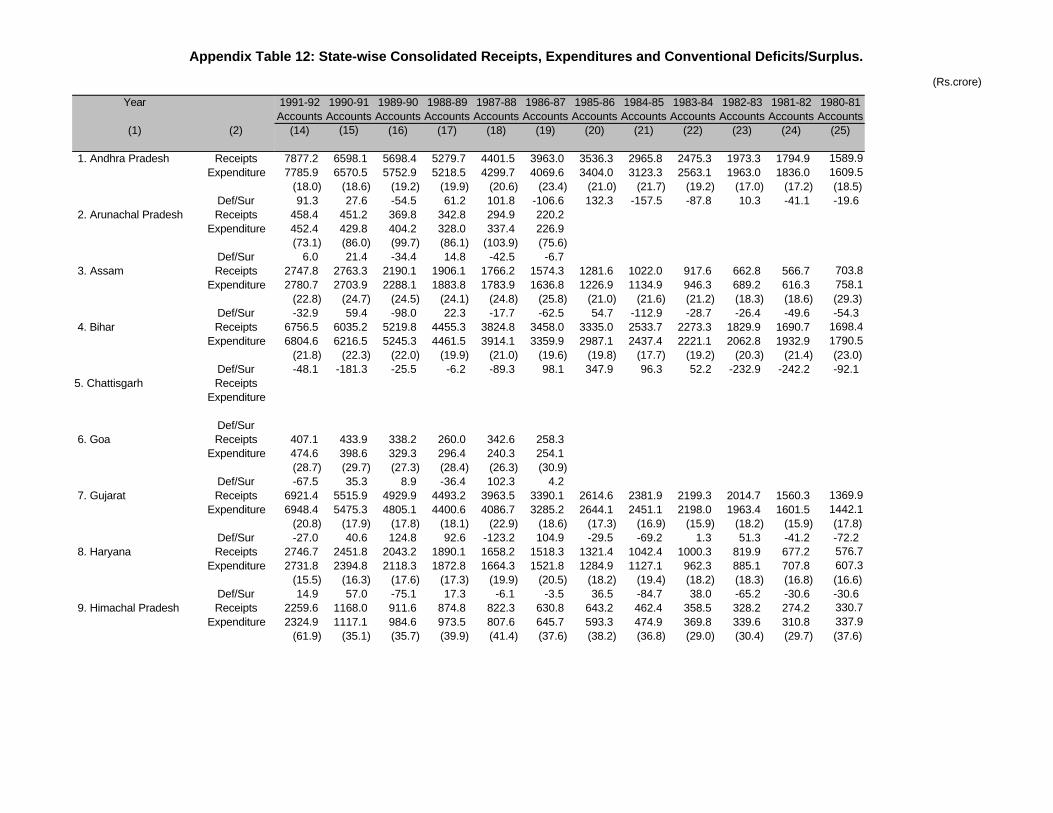
Appendix Table 12: State-wise Consolidated Receipts, Expenditures and Conventional Deficits/Surplus.
(Rs.crore)
Year
(1) (2) 1. Andhra Pradesh Receipts
Expenditure
Def/Sur 2. Arunachal Pradesh Receipts
Expenditure
Def/Sur 3. Assam Receipts
Expenditure
Def/Sur 4. Bihar Receipts
Expenditure
Def/Sur5. Chattisgarh Receipts
Expenditure
Def/Sur 6. Goa Receipts
Expenditure
Def/Sur 7. Gujarat Receipts
Expenditure
Def/Sur 8. Haryana Receipts
Expenditure
Def/Sur 9. Himachal Pradesh Receipts
Expenditure
1991-92 1990-91 1989-90 1988-89 1987-88 1986-87 1985-86 1984-85 1983-84 1982-83 1981-82 1980-81Accounts Accounts Accounts Accounts Accounts Accounts Accounts Accounts Accounts Accounts Accounts Accounts
(14) (15) (16) (17) (18) (19) (20) (21) (22) (23) (24) (25)
7877.2 6598.1 5698.4 5279.7 4401.5 3963.0 3536.3 2965.8 2475.3 1973.3 1794.9 1589.97785.9 6570.5 5752.9 5218.5 4299.7 4069.6 3404.0 3123.3 2563.1 1963.0 1836.0 1609.5
(18.0) (18.6) (19.2) (19.9) (20.6) (23.4) (21.0) (21.7) (19.2) (17.0) (17.2) (18.5)91.3 27.6 -54.5 61.2 101.8 -106.6 132.3 -157.5 -87.8 10.3 -41.1 -19.6
458.4 451.2 369.8 342.8 294.9 220.2452.4 429.8 404.2 328.0 337.4 226.9(73.1) (86.0) (99.7) (86.1) (103.9) (75.6)
6.0 21.4 -34.4 14.8 -42.5 -6.72747.8 2763.3 2190.1 1906.1 1766.2 1574.3 1281.6 1022.0 917.6 662.8 566.7 703.82780.7 2703.9 2288.1 1883.8 1783.9 1636.8 1226.9 1134.9 946.3 689.2 616.3 758.1
(22.8) (24.7) (24.5) (24.1) (24.8) (25.8) (21.0) (21.6) (21.2) (18.3) (18.6) (29.3)-32.9 59.4 -98.0 22.3 -17.7 -62.5 54.7 -112.9 -28.7 -26.4 -49.6 -54.3
6756.5 6035.2 5219.8 4455.3 3824.8 3458.0 3335.0 2533.7 2273.3 1829.9 1690.7 1698.46804.6 6216.5 5245.3 4461.5 3914.1 3359.9 2987.1 2437.4 2221.1 2062.8 1932.9 1790.5
(21.8) (22.3) (22.0) (19.9) (21.0) (19.6) (19.8) (17.7) (19.2) (20.3) (21.4) (23.0)-48.1 -181.3 -25.5 -6.2 -89.3 98.1 347.9 96.3 52.2 -232.9 -242.2 -92.1
407.1 433.9 338.2 260.0 342.6 258.3474.6 398.6 329.3 296.4 240.3 254.1(28.7) (29.7) (27.3) (28.4) (26.3) (30.9)-67.5 35.3 8.9 -36.4 102.3 4.2
6921.4 5515.9 4929.9 4493.2 3963.5 3390.1 2614.6 2381.9 2199.3 2014.7 1560.3 1369.96948.4 5475.3 4805.1 4400.6 4086.7 3285.2 2644.1 2451.1 2198.0 1963.4 1601.5 1442.1
(20.8) (17.9) (17.8) (18.1) (22.9) (18.6) (17.3) (16.9) (15.9) (18.2) (15.9) (17.8)-27.0 40.6 124.8 92.6 -123.2 104.9 -29.5 -69.2 1.3 51.3 -41.2 -72.2
2746.7 2451.8 2043.2 1890.1 1658.2 1518.3 1321.4 1042.4 1000.3 819.9 677.2 576.72731.8 2394.8 2118.3 1872.8 1664.3 1521.8 1284.9 1127.1 962.3 885.1 707.8 607.3
(15.5) (16.3) (17.6) (17.3) (19.9) (20.5) (18.2) (19.4) (18.2) (18.3) (16.8) (16.6)14.9 57.0 -75.1 17.3 -6.1 -3.5 36.5 -84.7 38.0 -65.2 -30.6 -30.6
2259.6 1168.0 911.6 874.8 822.3 630.8 643.2 462.4 358.5 328.2 274.2 330.72324.9 1117.1 984.6 973.5 807.6 645.7 593.3 474.9 369.8 339.6 310.8 337.9
(61.9) (35.1) (35.7) (39.9) (41.4) (37.6) (38.2) (36.8) (29.0) (30.4) (29.7) (37.6)
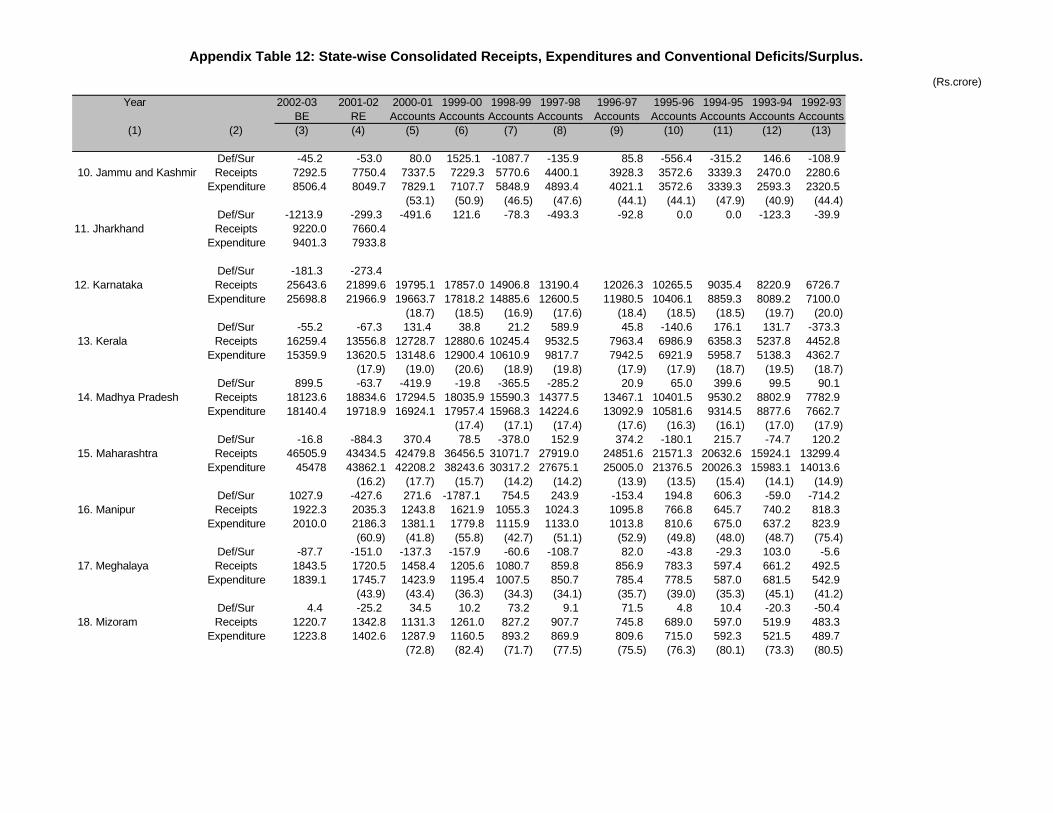
Appendix Table 12: State-wise Consolidated Receipts, Expenditures and Conventional Deficits/Surplus.
(Rs.crore)
Year 2002-03 2001-02 2000-01 1999-00 1998-99 1997-98 1996-97 1995-96 1994-95 1993-94 1992-93BE RE Accounts Accounts Accounts Accounts Accounts Accounts Accounts Accounts Accounts
(1) (2) (3) (4) (5) (6) (7) (8) (9) (10) (11) (12) (13)
Def/Sur -45.2 -53.0 80.0 1525.1 -1087.7 -135.9 85.8 -556.4 -315.2 146.6 -108.9 10. Jammu and Kashmir Receipts 7292.5 7750.4 7337.5 7229.3 5770.6 4400.1 3928.3 3572.6 3339.3 2470.0 2280.6
Expenditure 8506.4 8049.7 7829.1 7107.7 5848.9 4893.4 4021.1 3572.6 3339.3 2593.3 2320.5(53.1) (50.9) (46.5) (47.6) (44.1) (44.1) (47.9) (40.9) (44.4)
Def/Sur -1213.9 -299.3 -491.6 121.6 -78.3 -493.3 -92.8 0.0 0.0 -123.3 -39.911. Jharkhand Receipts 9220.0 7660.4
Expenditure 9401.3 7933.8
Def/Sur -181.3 -273.412. Karnataka Receipts 25643.6 21899.6 19795.1 17857.0 14906.8 13190.4 12026.3 10265.5 9035.4 8220.9 6726.7
Expenditure 25698.8 21966.9 19663.7 17818.2 14885.6 12600.5 11980.5 10406.1 8859.3 8089.2 7100.0(18.7) (18.5) (16.9) (17.6) (18.4) (18.5) (18.5) (19.7) (20.0)
Def/Sur -55.2 -67.3 131.4 38.8 21.2 589.9 45.8 -140.6 176.1 131.7 -373.3 13. Kerala Receipts 16259.4 13556.8 12728.7 12880.6 10245.4 9532.5 7963.4 6986.9 6358.3 5237.8 4452.8
Expenditure 15359.9 13620.5 13148.6 12900.4 10610.9 9817.7 7942.5 6921.9 5958.7 5138.3 4362.7(17.9) (19.0) (20.6) (18.9) (19.8) (17.9) (17.9) (18.7) (19.5) (18.7)
Def/Sur 899.5 -63.7 -419.9 -19.8 -365.5 -285.2 20.9 65.0 399.6 99.5 90.1 14. Madhya Pradesh Receipts 18123.6 18834.6 17294.5 18035.9 15590.3 14377.5 13467.1 10401.5 9530.2 8802.9 7782.9
Expenditure 18140.4 19718.9 16924.1 17957.4 15968.3 14224.6 13092.9 10581.6 9314.5 8877.6 7662.7(17.4) (17.1) (17.4) (17.6) (16.3) (16.1) (17.0) (17.9)
Def/Sur -16.8 -884.3 370.4 78.5 -378.0 152.9 374.2 -180.1 215.7 -74.7 120.2 15. Maharashtra Receipts 46505.9 43434.5 42479.8 36456.5 31071.7 27919.0 24851.6 21571.3 20632.6 15924.1 13299.4
Expenditure 45478 43862.1 42208.2 38243.6 30317.2 27675.1 25005.0 21376.5 20026.3 15983.1 14013.6(16.2) (17.7) (15.7) (14.2) (14.2) (13.9) (13.5) (15.4) (14.1) (14.9)
Def/Sur 1027.9 -427.6 271.6 -1787.1 754.5 243.9 -153.4 194.8 606.3 -59.0 -714.2 16. Manipur Receipts 1922.3 2035.3 1243.8 1621.9 1055.3 1024.3 1095.8 766.8 645.7 740.2 818.3
Expenditure 2010.0 2186.3 1381.1 1779.8 1115.9 1133.0 1013.8 810.6 675.0 637.2 823.9(60.9) (41.8) (55.8) (42.7) (51.1) (52.9) (49.8) (48.0) (48.7) (75.4)
Def/Sur -87.7 -151.0 -137.3 -157.9 -60.6 -108.7 82.0 -43.8 -29.3 103.0 -5.6 17. Meghalaya Receipts 1843.5 1720.5 1458.4 1205.6 1080.7 859.8 856.9 783.3 597.4 661.2 492.5
Expenditure 1839.1 1745.7 1423.9 1195.4 1007.5 850.7 785.4 778.5 587.0 681.5 542.9(43.9) (43.4) (36.3) (34.3) (34.1) (35.7) (39.0) (35.3) (45.1) (41.2)
Def/Sur 4.4 -25.2 34.5 10.2 73.2 9.1 71.5 4.8 10.4 -20.3 -50.4 18. Mizoram Receipts 1220.7 1342.8 1131.3 1261.0 827.2 907.7 745.8 689.0 597.0 519.9 483.3
Expenditure 1223.8 1402.6 1287.9 1160.5 893.2 869.9 809.6 715.0 592.3 521.5 489.7(72.8) (82.4) (71.7) (77.5) (75.5) (76.3) (80.1) (73.3) (80.5)
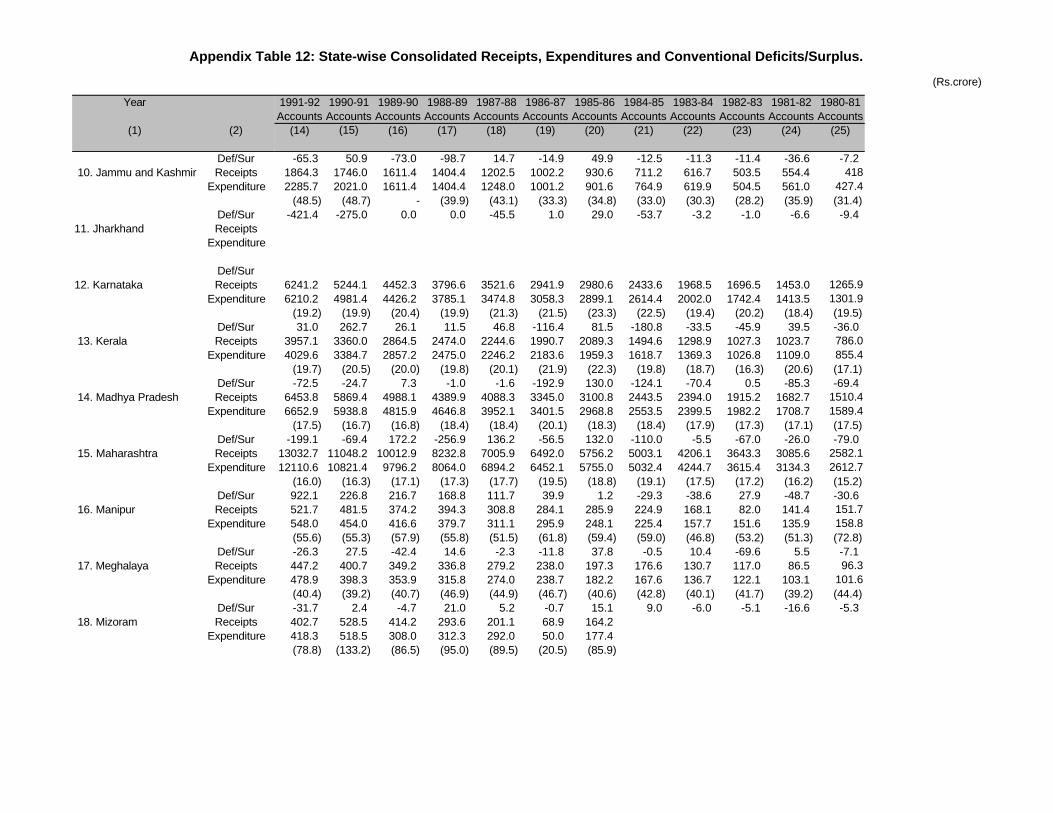
Appendix Table 12: State-wise Consolidated Receipts, Expenditures and Conventional Deficits/Surplus.
(Rs.crore)
Year
(1) (2)
Def/Sur 10. Jammu and Kashmir Receipts
Expenditure
Def/Sur11. Jharkhand Receipts
Expenditure
Def/Sur12. Karnataka Receipts
Expenditure
Def/Sur 13. Kerala Receipts
Expenditure
Def/Sur 14. Madhya Pradesh Receipts
Expenditure
Def/Sur 15. Maharashtra Receipts
Expenditure
Def/Sur 16. Manipur Receipts
Expenditure
Def/Sur 17. Meghalaya Receipts
Expenditure
Def/Sur 18. Mizoram Receipts
Expenditure
1991-92 1990-91 1989-90 1988-89 1987-88 1986-87 1985-86 1984-85 1983-84 1982-83 1981-82 1980-81Accounts Accounts Accounts Accounts Accounts Accounts Accounts Accounts Accounts Accounts Accounts Accounts
(14) (15) (16) (17) (18) (19) (20) (21) (22) (23) (24) (25)
-65.3 50.9 -73.0 -98.7 14.7 -14.9 49.9 -12.5 -11.3 -11.4 -36.6 -7.21864.3 1746.0 1611.4 1404.4 1202.5 1002.2 930.6 711.2 616.7 503.5 554.4 4182285.7 2021.0 1611.4 1404.4 1248.0 1001.2 901.6 764.9 619.9 504.5 561.0 427.4
(48.5) (48.7) - (39.9) (43.1) (33.3) (34.8) (33.0) (30.3) (28.2) (35.9) (31.4)-421.4 -275.0 0.0 0.0 -45.5 1.0 29.0 -53.7 -3.2 -1.0 -6.6 -9.4
6241.2 5244.1 4452.3 3796.6 3521.6 2941.9 2980.6 2433.6 1968.5 1696.5 1453.0 1265.96210.2 4981.4 4426.2 3785.1 3474.8 3058.3 2899.1 2614.4 2002.0 1742.4 1413.5 1301.9
(19.2) (19.9) (20.4) (19.9) (21.3) (21.5) (23.3) (22.5) (19.4) (20.2) (18.4) (19.5)31.0 262.7 26.1 11.5 46.8 -116.4 81.5 -180.8 -33.5 -45.9 39.5 -36.0
3957.1 3360.0 2864.5 2474.0 2244.6 1990.7 2089.3 1494.6 1298.9 1027.3 1023.7 786.04029.6 3384.7 2857.2 2475.0 2246.2 2183.6 1959.3 1618.7 1369.3 1026.8 1109.0 855.4
(19.7) (20.5) (20.0) (19.8) (20.1) (21.9) (22.3) (19.8) (18.7) (16.3) (20.6) (17.1)-72.5 -24.7 7.3 -1.0 -1.6 -192.9 130.0 -124.1 -70.4 0.5 -85.3 -69.4
6453.8 5869.4 4988.1 4389.9 4088.3 3345.0 3100.8 2443.5 2394.0 1915.2 1682.7 1510.46652.9 5938.8 4815.9 4646.8 3952.1 3401.5 2968.8 2553.5 2399.5 1982.2 1708.7 1589.4
(17.5) (16.7) (16.8) (18.4) (18.4) (20.1) (18.3) (18.4) (17.9) (17.3) (17.1) (17.5)-199.1 -69.4 172.2 -256.9 136.2 -56.5 132.0 -110.0 -5.5 -67.0 -26.0 -79.0
13032.7 11048.2 10012.9 8232.8 7005.9 6492.0 5756.2 5003.1 4206.1 3643.3 3085.6 2582.112110.6 10821.4 9796.2 8064.0 6894.2 6452.1 5755.0 5032.4 4244.7 3615.4 3134.3 2612.7
(16.0) (16.3) (17.1) (17.3) (17.7) (19.5) (18.8) (19.1) (17.5) (17.2) (16.2) (15.2)922.1 226.8 216.7 168.8 111.7 39.9 1.2 -29.3 -38.6 27.9 -48.7 -30.6521.7 481.5 374.2 394.3 308.8 284.1 285.9 224.9 168.1 82.0 141.4 151.7548.0 454.0 416.6 379.7 311.1 295.9 248.1 225.4 157.7 151.6 135.9 158.8(55.6) (55.3) (57.9) (55.8) (51.5) (61.8) (59.4) (59.0) (46.8) (53.2) (51.3) (72.8)-26.3 27.5 -42.4 14.6 -2.3 -11.8 37.8 -0.5 10.4 -69.6 5.5 -7.1447.2 400.7 349.2 336.8 279.2 238.0 197.3 176.6 130.7 117.0 86.5 96.3478.9 398.3 353.9 315.8 274.0 238.7 182.2 167.6 136.7 122.1 103.1 101.6(40.4) (39.2) (40.7) (46.9) (44.9) (46.7) (40.6) (42.8) (40.1) (41.7) (39.2) (44.4)-31.7 2.4 -4.7 21.0 5.2 -0.7 15.1 9.0 -6.0 -5.1 -16.6 -5.3402.7 528.5 414.2 293.6 201.1 68.9 164.2418.3 518.5 308.0 312.3 292.0 50.0 177.4(78.8) (133.2) (86.5) (95.0) (89.5) (20.5) (85.9)
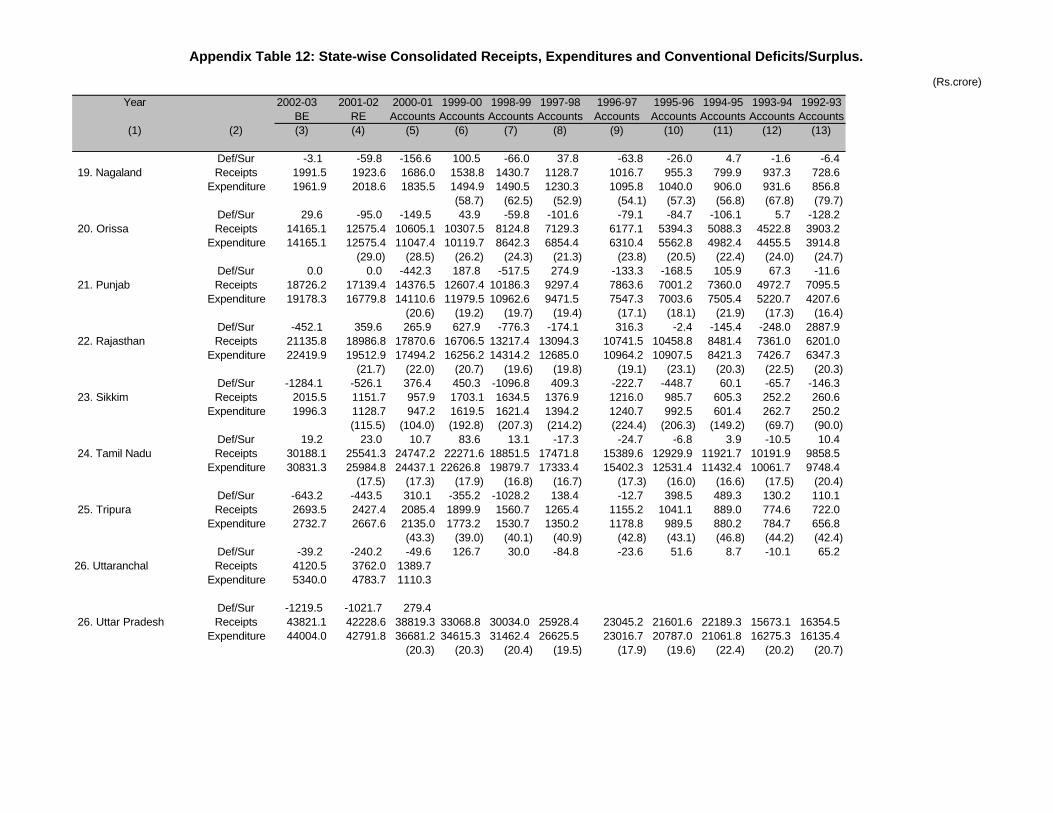
Appendix Table 12: State-wise Consolidated Receipts, Expenditures and Conventional Deficits/Surplus.
(Rs.crore)
Year 2002-03 2001-02 2000-01 1999-00 1998-99 1997-98 1996-97 1995-96 1994-95 1993-94 1992-93BE RE Accounts Accounts Accounts Accounts Accounts Accounts Accounts Accounts Accounts
(1) (2) (3) (4) (5) (6) (7) (8) (9) (10) (11) (12) (13)
Def/Sur -3.1 -59.8 -156.6 100.5 -66.0 37.8 -63.8 -26.0 4.7 -1.6 -6.4 19. Nagaland Receipts 1991.5 1923.6 1686.0 1538.8 1430.7 1128.7 1016.7 955.3 799.9 937.3 728.6
Expenditure 1961.9 2018.6 1835.5 1494.9 1490.5 1230.3 1095.8 1040.0 906.0 931.6 856.8(58.7) (62.5) (52.9) (54.1) (57.3) (56.8) (67.8) (79.7)
Def/Sur 29.6 -95.0 -149.5 43.9 -59.8 -101.6 -79.1 -84.7 -106.1 5.7 -128.2 20. Orissa Receipts 14165.1 12575.4 10605.1 10307.5 8124.8 7129.3 6177.1 5394.3 5088.3 4522.8 3903.2
Expenditure 14165.1 12575.4 11047.4 10119.7 8642.3 6854.4 6310.4 5562.8 4982.4 4455.5 3914.8(29.0) (28.5) (26.2) (24.3) (21.3) (23.8) (20.5) (22.4) (24.0) (24.7)
Def/Sur 0.0 0.0 -442.3 187.8 -517.5 274.9 -133.3 -168.5 105.9 67.3 -11.6 21. Punjab Receipts 18726.2 17139.4 14376.5 12607.4 10186.3 9297.4 7863.6 7001.2 7360.0 4972.7 7095.5
Expenditure 19178.3 16779.8 14110.6 11979.5 10962.6 9471.5 7547.3 7003.6 7505.4 5220.7 4207.6(20.6) (19.2) (19.7) (19.4) (17.1) (18.1) (21.9) (17.3) (16.4)
Def/Sur -452.1 359.6 265.9 627.9 -776.3 -174.1 316.3 -2.4 -145.4 -248.0 2887.9 22. Rajasthan Receipts 21135.8 18986.8 17870.6 16706.5 13217.4 13094.3 10741.5 10458.8 8481.4 7361.0 6201.0
Expenditure 22419.9 19512.9 17494.2 16256.2 14314.2 12685.0 10964.2 10907.5 8421.3 7426.7 6347.3(21.7) (22.0) (20.7) (19.6) (19.8) (19.1) (23.1) (20.3) (22.5) (20.3)
Def/Sur -1284.1 -526.1 376.4 450.3 -1096.8 409.3 -222.7 -448.7 60.1 -65.7 -146.3 23. Sikkim Receipts 2015.5 1151.7 957.9 1703.1 1634.5 1376.9 1216.0 985.7 605.3 252.2 260.6
Expenditure 1996.3 1128.7 947.2 1619.5 1621.4 1394.2 1240.7 992.5 601.4 262.7 250.2(115.5) (104.0) (192.8) (207.3) (214.2) (224.4) (206.3) (149.2) (69.7) (90.0)
Def/Sur 19.2 23.0 10.7 83.6 13.1 -17.3 -24.7 -6.8 3.9 -10.5 10.4 24. Tamil Nadu Receipts 30188.1 25541.3 24747.2 22271.6 18851.5 17471.8 15389.6 12929.9 11921.7 10191.9 9858.5
Expenditure 30831.3 25984.8 24437.1 22626.8 19879.7 17333.4 15402.3 12531.4 11432.4 10061.7 9748.4(17.5) (17.3) (17.9) (16.8) (16.7) (17.3) (16.0) (16.6) (17.5) (20.4)
Def/Sur -643.2 -443.5 310.1 -355.2 -1028.2 138.4 -12.7 398.5 489.3 130.2 110.1 25. Tripura Receipts 2693.5 2427.4 2085.4 1899.9 1560.7 1265.4 1155.2 1041.1 889.0 774.6 722.0
Expenditure 2732.7 2667.6 2135.0 1773.2 1530.7 1350.2 1178.8 989.5 880.2 784.7 656.8(43.3) (39.0) (40.1) (40.9) (42.8) (43.1) (46.8) (44.2) (42.4)
Def/Sur -39.2 -240.2 -49.6 126.7 30.0 -84.8 -23.6 51.6 8.7 -10.1 65.226. Uttaranchal Receipts 4120.5 3762.0 1389.7
Expenditure 5340.0 4783.7 1110.3
Def/Sur -1219.5 -1021.7 279.4 26. Uttar Pradesh Receipts 43821.1 42228.6 38819.3 33068.8 30034.0 25928.4 23045.2 21601.6 22189.3 15673.1 16354.5
Expenditure 44004.0 42791.8 36681.2 34615.3 31462.4 26625.5 23016.7 20787.0 21061.8 16275.3 16135.4(20.3) (20.3) (20.4) (19.5) (17.9) (19.6) (22.4) (20.2) (20.7)
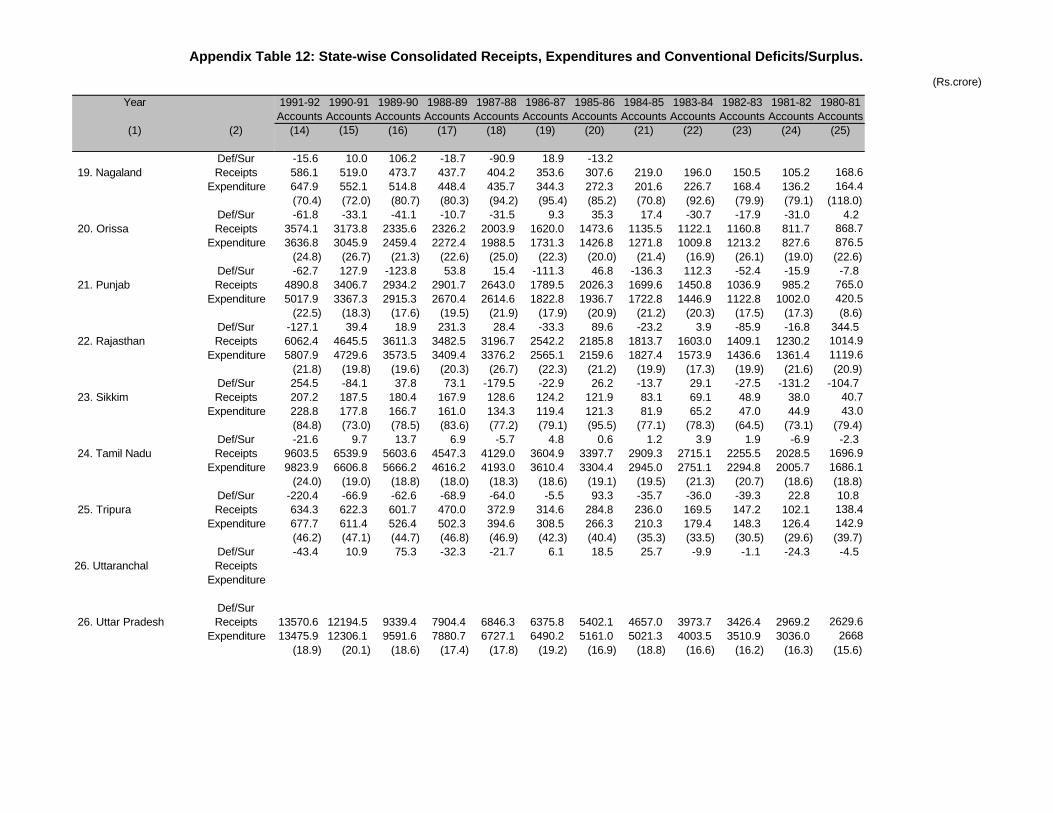
Appendix Table 12: State-wise Consolidated Receipts, Expenditures and Conventional Deficits/Surplus.
(Rs.crore)
Year
(1) (2)
Def/Sur 19. Nagaland Receipts
Expenditure
Def/Sur 20. Orissa Receipts
Expenditure
Def/Sur 21. Punjab Receipts
Expenditure
Def/Sur 22. Rajasthan Receipts
Expenditure
Def/Sur 23. Sikkim Receipts
Expenditure
Def/Sur 24. Tamil Nadu Receipts
Expenditure
Def/Sur 25. Tripura Receipts
Expenditure
Def/Sur26. Uttaranchal Receipts
Expenditure
Def/Sur 26. Uttar Pradesh Receipts
Expenditure
1991-92 1990-91 1989-90 1988-89 1987-88 1986-87 1985-86 1984-85 1983-84 1982-83 1981-82 1980-81Accounts Accounts Accounts Accounts Accounts Accounts Accounts Accounts Accounts Accounts Accounts Accounts
(14) (15) (16) (17) (18) (19) (20) (21) (22) (23) (24) (25)
-15.6 10.0 106.2 -18.7 -90.9 18.9 -13.2586.1 519.0 473.7 437.7 404.2 353.6 307.6 219.0 196.0 150.5 105.2 168.6647.9 552.1 514.8 448.4 435.7 344.3 272.3 201.6 226.7 168.4 136.2 164.4(70.4) (72.0) (80.7) (80.3) (94.2) (95.4) (85.2) (70.8) (92.6) (79.9) (79.1) (118.0)-61.8 -33.1 -41.1 -10.7 -31.5 9.3 35.3 17.4 -30.7 -17.9 -31.0 4.2
3574.1 3173.8 2335.6 2326.2 2003.9 1620.0 1473.6 1135.5 1122.1 1160.8 811.7 868.73636.8 3045.9 2459.4 2272.4 1988.5 1731.3 1426.8 1271.8 1009.8 1213.2 827.6 876.5
(24.8) (26.7) (21.3) (22.6) (25.0) (22.3) (20.0) (21.4) (16.9) (26.1) (19.0) (22.6)-62.7 127.9 -123.8 53.8 15.4 -111.3 46.8 -136.3 112.3 -52.4 -15.9 -7.8
4890.8 3406.7 2934.2 2901.7 2643.0 1789.5 2026.3 1699.6 1450.8 1036.9 985.2 765.05017.9 3367.3 2915.3 2670.4 2614.6 1822.8 1936.7 1722.8 1446.9 1122.8 1002.0 420.5
(22.5) (18.3) (17.6) (19.5) (21.9) (17.9) (20.9) (21.2) (20.3) (17.5) (17.3) (8.6)-127.1 39.4 18.9 231.3 28.4 -33.3 89.6 -23.2 3.9 -85.9 -16.8 344.56062.4 4645.5 3611.3 3482.5 3196.7 2542.2 2185.8 1813.7 1603.0 1409.1 1230.2 1014.95807.9 4729.6 3573.5 3409.4 3376.2 2565.1 2159.6 1827.4 1573.9 1436.6 1361.4 1119.6
(21.8) (19.8) (19.6) (20.3) (26.7) (22.3) (21.2) (19.9) (17.3) (19.9) (21.6) (20.9)254.5 -84.1 37.8 73.1 -179.5 -22.9 26.2 -13.7 29.1 -27.5 -131.2 -104.7207.2 187.5 180.4 167.9 128.6 124.2 121.9 83.1 69.1 48.9 38.0 40.7228.8 177.8 166.7 161.0 134.3 119.4 121.3 81.9 65.2 47.0 44.9 43.0(84.8) (73.0) (78.5) (83.6) (77.2) (79.1) (95.5) (77.1) (78.3) (64.5) (73.1) (79.4)-21.6 9.7 13.7 6.9 -5.7 4.8 0.6 1.2 3.9 1.9 -6.9 -2.3
9603.5 6539.9 5603.6 4547.3 4129.0 3604.9 3397.7 2909.3 2715.1 2255.5 2028.5 1696.99823.9 6606.8 5666.2 4616.2 4193.0 3610.4 3304.4 2945.0 2751.1 2294.8 2005.7 1686.1
(24.0) (19.0) (18.8) (18.0) (18.3) (18.6) (19.1) (19.5) (21.3) (20.7) (18.6) (18.8)-220.4 -66.9 -62.6 -68.9 -64.0 -5.5 93.3 -35.7 -36.0 -39.3 22.8 10.8634.3 622.3 601.7 470.0 372.9 314.6 284.8 236.0 169.5 147.2 102.1 138.4677.7 611.4 526.4 502.3 394.6 308.5 266.3 210.3 179.4 148.3 126.4 142.9(46.2) (47.1) (44.7) (46.8) (46.9) (42.3) (40.4) (35.3) (33.5) (30.5) (29.6) (39.7)-43.4 10.9 75.3 -32.3 -21.7 6.1 18.5 25.7 -9.9 -1.1 -24.3 -4.5
13570.6 12194.5 9339.4 7904.4 6846.3 6375.8 5402.1 4657.0 3973.7 3426.4 2969.2 2629.613475.9 12306.1 9591.6 7880.7 6727.1 6490.2 5161.0 5021.3 4003.5 3510.9 3036.0 2668
(18.9) (20.1) (18.6) (17.4) (17.8) (19.2) (16.9) (18.8) (16.6) (16.2) (16.3) (15.6)
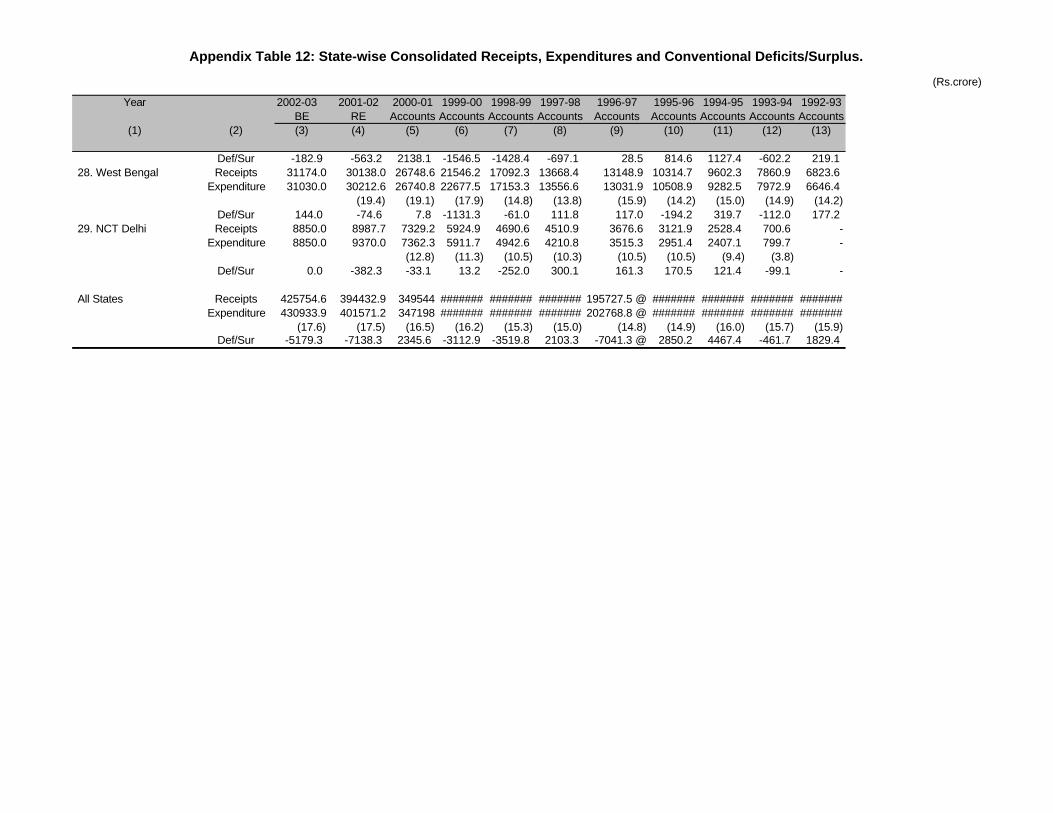
Appendix Table 12: State-wise Consolidated Receipts, Expenditures and Conventional Deficits/Surplus.
(Rs.crore)
Year 2002-03 2001-02 2000-01 1999-00 1998-99 1997-98 1996-97 1995-96 1994-95 1993-94 1992-93BE RE Accounts Accounts Accounts Accounts Accounts Accounts Accounts Accounts Accounts
(1) (2) (3) (4) (5) (6) (7) (8) (9) (10) (11) (12) (13)
Def/Sur -182.9 -563.2 2138.1 -1546.5 -1428.4 -697.1 28.5 814.6 1127.4 -602.2 219.1 28. West Bengal Receipts 31174.0 30138.0 26748.6 21546.2 17092.3 13668.4 13148.9 10314.7 9602.3 7860.9 6823.6
Expenditure 31030.0 30212.6 26740.8 22677.5 17153.3 13556.6 13031.9 10508.9 9282.5 7972.9 6646.4(19.4) (19.1) (17.9) (14.8) (13.8) (15.9) (14.2) (15.0) (14.9) (14.2)
Def/Sur 144.0 -74.6 7.8 -1131.3 -61.0 111.8 117.0 -194.2 319.7 -112.0 177.2 29. NCT Delhi Receipts 8850.0 8987.7 7329.2 5924.9 4690.6 4510.9 3676.6 3121.9 2528.4 700.6 -
Expenditure 8850.0 9370.0 7362.3 5911.7 4942.6 4210.8 3515.3 2951.4 2407.1 799.7 -(12.8) (11.3) (10.5) (10.3) (10.5) (10.5) (9.4) (3.8)
Def/Sur 0.0 -382.3 -33.1 13.2 -252.0 300.1 161.3 170.5 121.4 -99.1 -
All States Receipts 425754.6 394432.9 349544 ####### ####### ####### 195727.5 @ ####### ####### ####### #######Expenditure 430933.9 401571.2 347198 ####### ####### ####### 202768.8 @ ####### ####### ####### #######
(17.6) (17.5) (16.5) (16.2) (15.3) (15.0) (14.8) (14.9) (16.0) (15.7) (15.9)Def/Sur -5179.3 -7138.3 2345.6 -3112.9 -3519.8 2103.3 -7041.3 @ 2850.2 4467.4 -461.7 1829.4
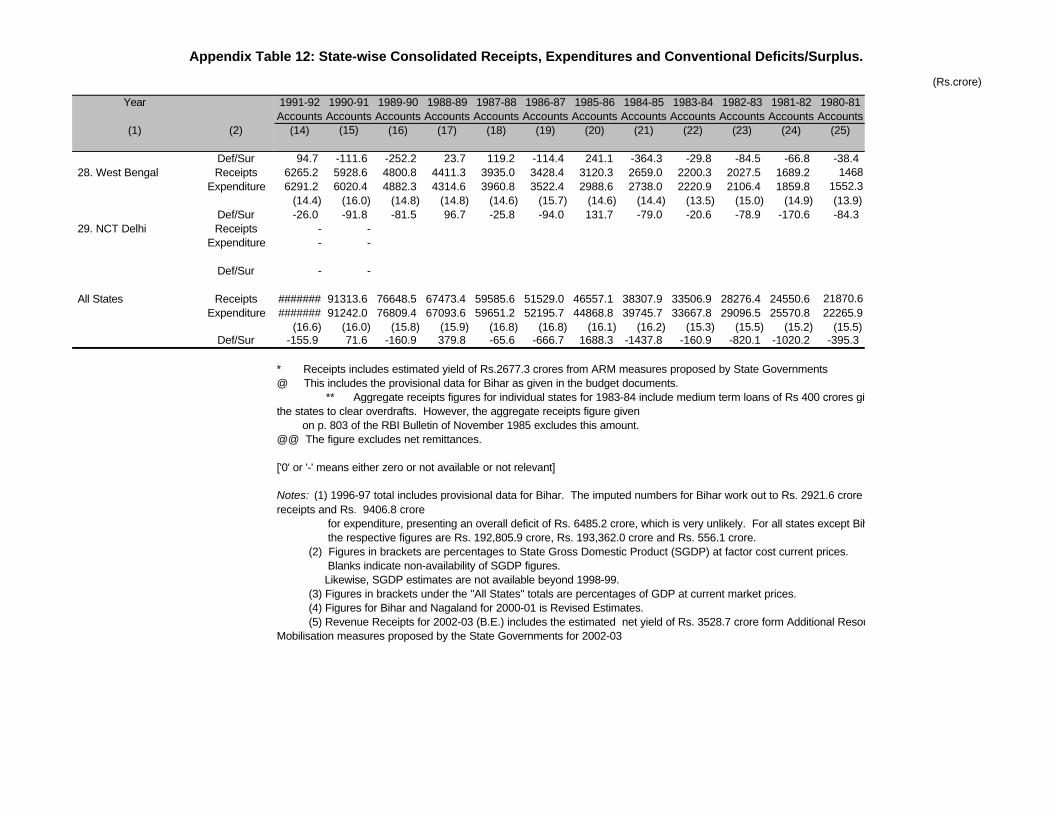
Appendix Table 12: State-wise Consolidated Receipts, Expenditures and Conventional Deficits/Surplus.
(Rs.crore)
Year
(1) (2)
Def/Sur 28. West Bengal Receipts
Expenditure
Def/Sur 29. NCT Delhi Receipts
Expenditure
Def/Sur
All States ReceiptsExpenditure
Def/Sur
1991-92 1990-91 1989-90 1988-89 1987-88 1986-87 1985-86 1984-85 1983-84 1982-83 1981-82 1980-81Accounts Accounts Accounts Accounts Accounts Accounts Accounts Accounts Accounts Accounts Accounts Accounts
(14) (15) (16) (17) (18) (19) (20) (21) (22) (23) (24) (25)
94.7 -111.6 -252.2 23.7 119.2 -114.4 241.1 -364.3 -29.8 -84.5 -66.8 -38.46265.2 5928.6 4800.8 4411.3 3935.0 3428.4 3120.3 2659.0 2200.3 2027.5 1689.2 14686291.2 6020.4 4882.3 4314.6 3960.8 3522.4 2988.6 2738.0 2220.9 2106.4 1859.8 1552.3
(14.4) (16.0) (14.8) (14.8) (14.6) (15.7) (14.6) (14.4) (13.5) (15.0) (14.9) (13.9)-26.0 -91.8 -81.5 96.7 -25.8 -94.0 131.7 -79.0 -20.6 -78.9 -170.6 -84.3
- -- -
- -
####### 91313.6 76648.5 67473.4 59585.6 51529.0 46557.1 38307.9 33506.9 28276.4 24550.6 21870.6####### 91242.0 76809.4 67093.6 59651.2 52195.7 44868.8 39745.7 33667.8 29096.5 25570.8 22265.9
(16.6) (16.0) (15.8) (15.9) (16.8) (16.8) (16.1) (16.2) (15.3) (15.5) (15.2) (15.5)-155.9 71.6 -160.9 379.8 -65.6 -666.7 1688.3 -1437.8 -160.9 -820.1 -1020.2 -395.3
* Receipts includes estimated yield of Rs.2677.3 crores from ARM measures proposed by State Governments@ This includes the provisional data for Bihar as given in the budget documents.
** Aggregate receipts figures for individual states for 1983-84 include medium term loans of Rs 400 crores given by the centre to the states to clear overdrafts. However, the aggregate receipts figure given on p. 803 of the RBI Bulletin of November 1985 excludes this amount.@@ The figure excludes net remittances.
['0' or '-' means either zero or not available or not relevant]
Notes: (1) 1996-97 total includes provisional data for Bihar. The imputed numbers for Bihar work out to Rs. 2921.6 crore for receipts and Rs. 9406.8 crore for expenditure, presenting an overall deficit of Rs. 6485.2 crore, which is very unlikely. For all states except Bihar, the respective figures are Rs. 192,805.9 crore, Rs. 193,362.0 crore and Rs. 556.1 crore. (2) Figures in brackets are percentages to State Gross Domestic Product (SGDP) at factor cost current prices. Blanks indicate non-availability of SGDP figures. Likewise, SGDP estimates are not available beyond 1998-99. (3) Figures in brackets under the "All States" totals are percentages of GDP at current market prices. (4) Figures for Bihar and Nagaland for 2000-01 is Revised Estimates. (5) Revenue Receipts for 2002-03 (B.E.) includes the estimated net yield of Rs. 3528.7 crore form Additional Resource Mobilisation measures proposed by the State Governments for 2002-03Mobilisation measures proposed by the State Governments for 2002-03
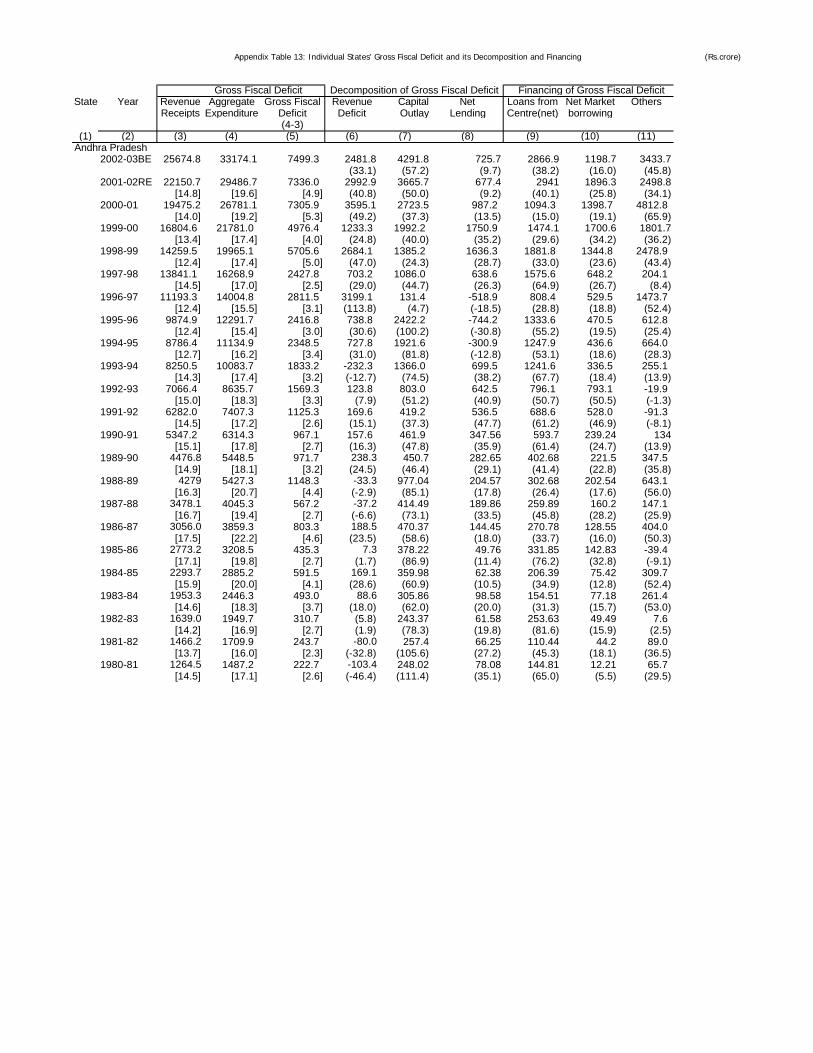
Appendix Table 13: Individual States' Gross Fiscal Deficit and its Decomposition and Financing (Rs.crore)
State Year Revenue Aggregate Gross Fiscal Revenue Capital Net Loans from Net Market OthersReceipts Expenditure Deficit Deficit Outlay Lending Centre(net) borrowing
(4-3)(1) (2) (3) (4) (5) (6) (7) (8) (9) (10) (11)
Andhra Pradesh2002-03BE 25674.8 33174.1 7499.3 2481.8 4291.8 725.7 2866.9 1198.7 3433.7
(33.1) (57.2) (9.7) (38.2) (16.0) (45.8)2001-02RE 22150.7 29486.7 7336.0 2992.9 3665.7 677.4 2941 1896.3 2498.8
[14.8] [19.6] [4.9] (40.8) (50.0) (9.2) (40.1) (25.8) (34.1)2000-01 19475.2 26781.1 7305.9 3595.1 2723.5 987.2 1094.3 1398.7 4812.8
[14.0] [19.2] [5.3] (49.2) (37.3) (13.5) (15.0) (19.1) (65.9)1999-00 16804.6 21781.0 4976.4 1233.3 1992.2 1750.9 1474.1 1700.6 1801.7
[13.4] [17.4] [4.0] (24.8) (40.0) (35.2) (29.6) (34.2) (36.2)1998-99 14259.5 19965.1 5705.6 2684.1 1385.2 1636.3 1881.8 1344.8 2478.9
[12.4] [17.4] [5.0] (47.0) (24.3) (28.7) (33.0) (23.6) (43.4)1997-98 13841.1 16268.9 2427.8 703.2 1086.0 638.6 1575.6 648.2 204.1
[14.5] [17.0] [2.5] (29.0) (44.7) (26.3) (64.9) (26.7) (8.4)1996-97 11193.3 14004.8 2811.5 3199.1 131.4 -518.9 808.4 529.5 1473.7
[12.4] [15.5] [3.1] (113.8) (4.7) (-18.5) (28.8) (18.8) (52.4)1995-96 9874.9 12291.7 2416.8 738.8 2422.2 -744.2 1333.6 470.5 612.8
[12.4] [15.4] [3.0] (30.6) (100.2) (-30.8) (55.2) (19.5) (25.4)1994-95 8786.4 11134.9 2348.5 727.8 1921.6 -300.9 1247.9 436.6 664.0
[12.7] [16.2] [3.4] (31.0) (81.8) (-12.8) (53.1) (18.6) (28.3)1993-94 8250.5 10083.7 1833.2 -232.3 1366.0 699.5 1241.6 336.5 255.1
[14.3] [17.4] [3.2] (-12.7) (74.5) (38.2) (67.7) (18.4) (13.9)1992-93 7066.4 8635.7 1569.3 123.8 803.0 642.5 796.1 793.1 -19.9
[15.0] [18.3] [3.3] (7.9) (51.2) (40.9) (50.7) (50.5) (-1.3)1991-92 6282.0 7407.3 1125.3 169.6 419.2 536.5 688.6 528.0 -91.3
[14.5] [17.2] [2.6] (15.1) (37.3) (47.7) (61.2) (46.9) (-8.1)1990-91 5347.2 6314.3 967.1 157.6 461.9 347.56 593.7 239.24 134
[15.1] [17.8] [2.7] (16.3) (47.8) (35.9) (61.4) (24.7) (13.9)1989-90 4476.8 5448.5 971.7 238.3 450.7 282.65 402.68 221.5 347.5
[14.9] [18.1] [3.2] (24.5) (46.4) (29.1) (41.4) (22.8) (35.8)1988-89 4279 5427.3 1148.3 -33.3 977.04 204.57 302.68 202.54 643.1
[16.3] [20.7] [4.4] (-2.9) (85.1) (17.8) (26.4) (17.6) (56.0)1987-88 3478.1 4045.3 567.2 -37.2 414.49 189.86 259.89 160.2 147.1
[16.7] [19.4] [2.7] (-6.6) (73.1) (33.5) (45.8) (28.2) (25.9)1986-87 3056.0 3859.3 803.3 188.5 470.37 144.45 270.78 128.55 404.0
[17.5] [22.2] [4.6] (23.5) (58.6) (18.0) (33.7) (16.0) (50.3)1985-86 2773.2 3208.5 435.3 7.3 378.22 49.76 331.85 142.83 -39.4
[17.1] [19.8] [2.7] (1.7) (86.9) (11.4) (76.2) (32.8) (-9.1)1984-85 2293.7 2885.2 591.5 169.1 359.98 62.38 206.39 75.42 309.7
[15.9] [20.0] [4.1] (28.6) (60.9) (10.5) (34.9) (12.8) (52.4)1983-84 1953.3 2446.3 493.0 88.6 305.86 98.58 154.51 77.18 261.4
[14.6] [18.3] [3.7] (18.0) (62.0) (20.0) (31.3) (15.7) (53.0)1982-83 1639.0 1949.7 310.7 (5.8) 243.37 61.58 253.63 49.49 7.6
[14.2] [16.9] [2.7] (1.9) (78.3) (19.8) (81.6) (15.9) (2.5)1981-82 1466.2 1709.9 243.7 -80.0 257.4 66.25 110.44 44.2 89.0
[13.7] [16.0] [2.3] (-32.8) (105.6) (27.2) (45.3) (18.1) (36.5)1980-81 1264.5 1487.2 222.7 -103.4 248.02 78.08 144.81 12.21 65.7
[14.5] [17.1] [2.6] (-46.4) (111.4) (35.1) (65.0) (5.5) (29.5)
Gross Fiscal Deficit Decomposition of Gross Fiscal Deficit Financing of Gross Fiscal Deficit
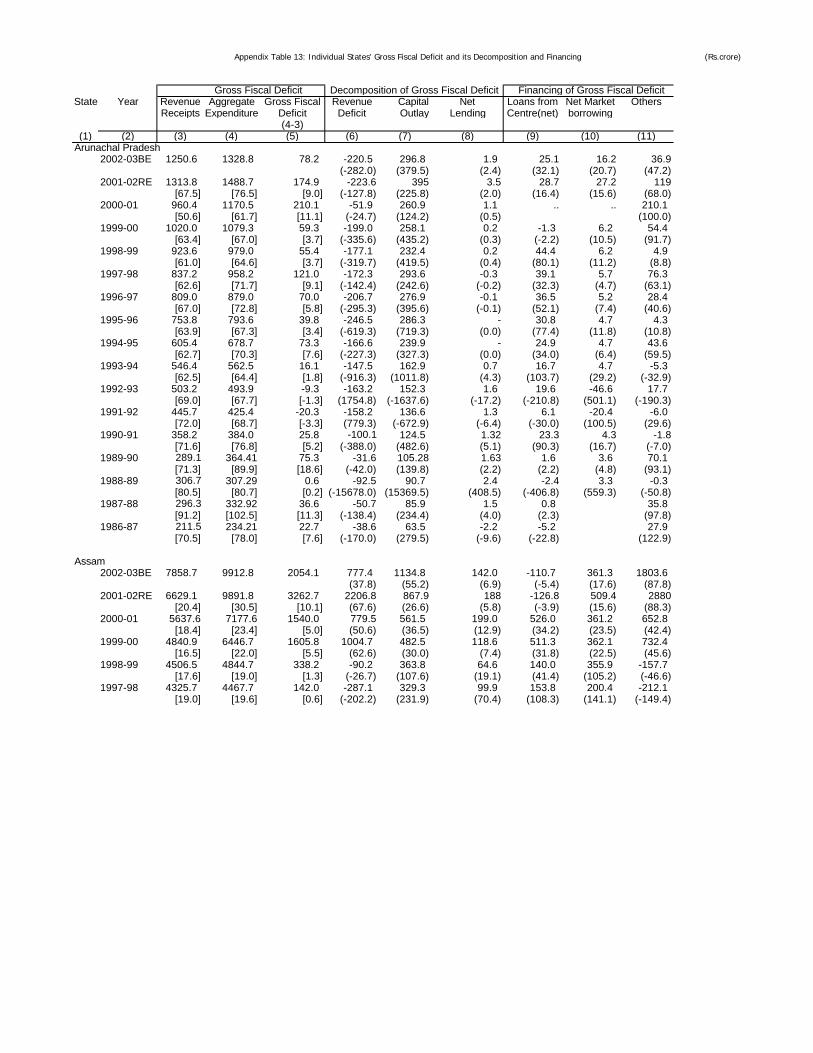
Appendix Table 13: Individual States' Gross Fiscal Deficit and its Decomposition and Financing (Rs.crore)
State Year Revenue Aggregate Gross Fiscal Revenue Capital Net Loans from Net Market OthersReceipts Expenditure Deficit Deficit Outlay Lending Centre(net) borrowing
(4-3)(1) (2) (3) (4) (5) (6) (7) (8) (9) (10) (11)
Gross Fiscal Deficit Decomposition of Gross Fiscal Deficit Financing of Gross Fiscal Deficit
Arunachal Pradesh2002-03BE 1250.6 1328.8 78.2 -220.5 296.8 1.9 25.1 16.2 36.9
(-282.0) (379.5) (2.4) (32.1) (20.7) (47.2)2001-02RE 1313.8 1488.7 174.9 -223.6 395 3.5 28.7 27.2 119
[67.5] [76.5] [9.0] (-127.8) (225.8) (2.0) (16.4) (15.6) (68.0)2000-01 960.4 1170.5 210.1 -51.9 260.9 1.1 .. .. 210.1
[50.6] [61.7] [11.1] (-24.7) (124.2) (0.5) (100.0)1999-00 1020.0 1079.3 59.3 -199.0 258.1 0.2 -1.3 6.2 54.4
[63.4] [67.0] [3.7] (-335.6) (435.2) (0.3) (-2.2) (10.5) (91.7)1998-99 923.6 979.0 55.4 -177.1 232.4 0.2 44.4 6.2 4.9
[61.0] [64.6] [3.7] (-319.7) (419.5) (0.4) (80.1) (11.2) (8.8)1997-98 837.2 958.2 121.0 -172.3 293.6 -0.3 39.1 5.7 76.3
[62.6] [71.7] [9.1] (-142.4) (242.6) (-0.2) (32.3) (4.7) (63.1)1996-97 809.0 879.0 70.0 -206.7 276.9 -0.1 36.5 5.2 28.4
[67.0] [72.8] [5.8] (-295.3) (395.6) (-0.1) (52.1) (7.4) (40.6)1995-96 753.8 793.6 39.8 -246.5 286.3 - 30.8 4.7 4.3
[63.9] [67.3] [3.4] (-619.3) (719.3) (0.0) (77.4) (11.8) (10.8)1994-95 605.4 678.7 73.3 -166.6 239.9 - 24.9 4.7 43.6
[62.7] [70.3] [7.6] (-227.3) (327.3) (0.0) (34.0) (6.4) (59.5)1993-94 546.4 562.5 16.1 -147.5 162.9 0.7 16.7 4.7 -5.3
[62.5] [64.4] [1.8] (-916.3) (1011.8) (4.3) (103.7) (29.2) (-32.9)1992-93 503.2 493.9 -9.3 -163.2 152.3 1.6 19.6 -46.6 17.7
[69.0] [67.7] [-1.3] (1754.8) (-1637.6) (-17.2) (-210.8) (501.1) (-190.3)1991-92 445.7 425.4 -20.3 -158.2 136.6 1.3 6.1 -20.4 -6.0
[72.0] [68.7] [-3.3] (779.3) (-672.9) (-6.4) (-30.0) (100.5) (29.6)1990-91 358.2 384.0 25.8 -100.1 124.5 1.32 23.3 4.3 -1.8
[71.6] [76.8] [5.2] (-388.0) (482.6) (5.1) (90.3) (16.7) (-7.0)1989-90 289.1 364.41 75.3 -31.6 105.28 1.63 1.6 3.6 70.1
[71.3] [89.9] [18.6] (-42.0) (139.8) (2.2) (2.2) (4.8) (93.1)1988-89 306.7 307.29 0.6 -92.5 90.7 2.4 -2.4 3.3 -0.3
[80.5] [80.7] [0.2] (-15678.0) (15369.5) (408.5) (-406.8) (559.3) (-50.8)1987-88 296.3 332.92 36.6 -50.7 85.9 1.5 0.8 35.8
[91.2] [102.5] [11.3] (-138.4) (234.4) (4.0) (2.3) (97.8)1986-87 211.5 234.21 22.7 -38.6 63.5 -2.2 -5.2 27.9
[70.5] [78.0] [7.6] (-170.0) (279.5) (-9.6) (-22.8) (122.9)
Assam2002-03BE 7858.7 9912.8 2054.1 777.4 1134.8 142.0 -110.7 361.3 1803.6
(37.8) (55.2) (6.9) (-5.4) (17.6) (87.8)2001-02RE 6629.1 9891.8 3262.7 2206.8 867.9 188 -126.8 509.4 2880
[20.4] [30.5] [10.1] (67.6) (26.6) (5.8) (-3.9) (15.6) (88.3)2000-01 5637.6 7177.6 1540.0 779.5 561.5 199.0 526.0 361.2 652.8
[18.4] [23.4] [5.0] (50.6) (36.5) (12.9) (34.2) (23.5) (42.4)1999-00 4840.9 6446.7 1605.8 1004.7 482.5 118.6 511.3 362.1 732.4
[16.5] [22.0] [5.5] (62.6) (30.0) (7.4) (31.8) (22.5) (45.6)1998-99 4506.5 4844.7 338.2 -90.2 363.8 64.6 140.0 355.9 -157.7
[17.6] [19.0] [1.3] (-26.7) (107.6) (19.1) (41.4) (105.2) (-46.6)1997-98 4325.7 4467.7 142.0 -287.1 329.3 99.9 153.8 200.4 -212.1
[19.0] [19.6] [0.6] (-202.2) (231.9) (70.4) (108.3) (141.1) (-149.4)
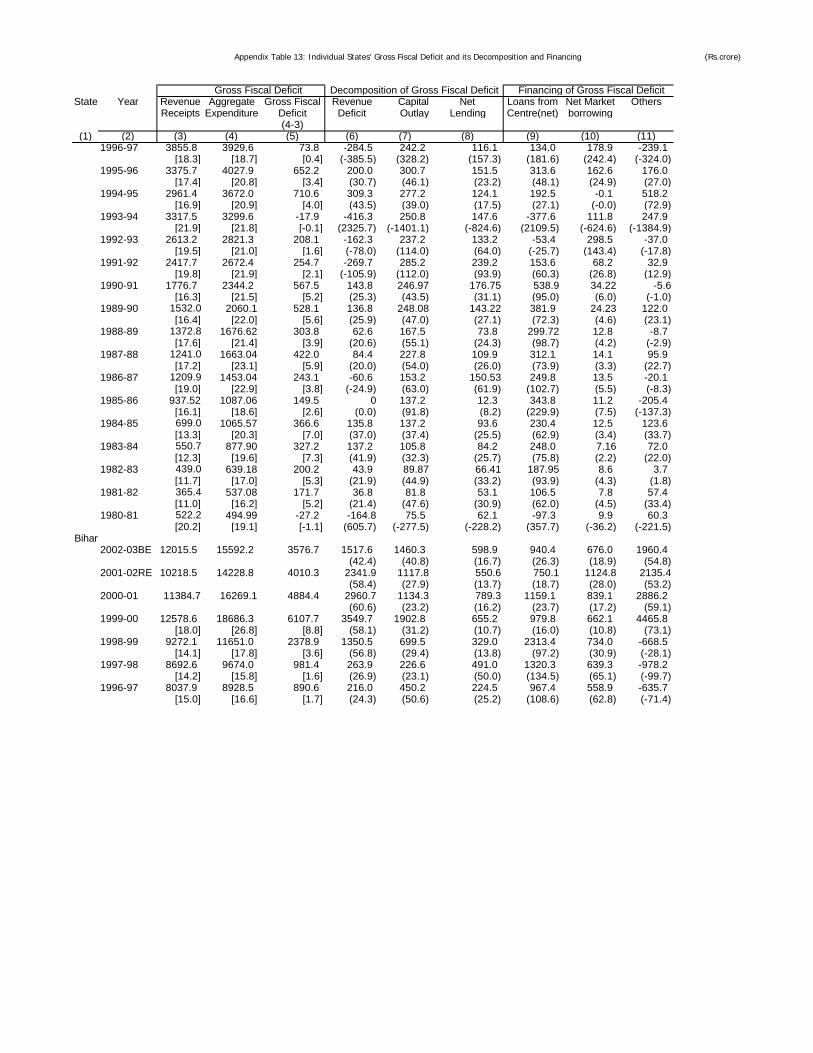
Appendix Table 13: Individual States' Gross Fiscal Deficit and its Decomposition and Financing (Rs.crore)
State Year Revenue Aggregate Gross Fiscal Revenue Capital Net Loans from Net Market OthersReceipts Expenditure Deficit Deficit Outlay Lending Centre(net) borrowing
(4-3)(1) (2) (3) (4) (5) (6) (7) (8) (9) (10) (11)
Gross Fiscal Deficit Decomposition of Gross Fiscal Deficit Financing of Gross Fiscal Deficit
1996-97 3855.8 3929.6 73.8 -284.5 242.2 116.1 134.0 178.9 -239.1[18.3] [18.7] [0.4] (-385.5) (328.2) (157.3) (181.6) (242.4) (-324.0)
1995-96 3375.7 4027.9 652.2 200.0 300.7 151.5 313.6 162.6 176.0[17.4] [20.8] [3.4] (30.7) (46.1) (23.2) (48.1) (24.9) (27.0)
1994-95 2961.4 3672.0 710.6 309.3 277.2 124.1 192.5 -0.1 518.2[16.9] [20.9] [4.0] (43.5) (39.0) (17.5) (27.1) (-0.0) (72.9)
1993-94 3317.5 3299.6 -17.9 -416.3 250.8 147.6 -377.6 111.8 247.9[21.9] [21.8] [-0.1] (2325.7) (-1401.1) (-824.6) (2109.5) (-624.6) (-1384.9)
1992-93 2613.2 2821.3 208.1 -162.3 237.2 133.2 -53.4 298.5 -37.0[19.5] [21.0] [1.6] (-78.0) (114.0) (64.0) (-25.7) (143.4) (-17.8)
1991-92 2417.7 2672.4 254.7 -269.7 285.2 239.2 153.6 68.2 32.9[19.8] [21.9] [2.1] (-105.9) (112.0) (93.9) (60.3) (26.8) (12.9)
1990-91 1776.7 2344.2 567.5 143.8 246.97 176.75 538.9 34.22 -5.6[16.3] [21.5] [5.2] (25.3) (43.5) (31.1) (95.0) (6.0) (-1.0)
1989-90 1532.0 2060.1 528.1 136.8 248.08 143.22 381.9 24.23 122.0[16.4] [22.0] [5.6] (25.9) (47.0) (27.1) (72.3) (4.6) (23.1)
1988-89 1372.8 1676.62 303.8 62.6 167.5 73.8 299.72 12.8 -8.7[17.6] [21.4] [3.9] (20.6) (55.1) (24.3) (98.7) (4.2) (-2.9)
1987-88 1241.0 1663.04 422.0 84.4 227.8 109.9 312.1 14.1 95.9[17.2] [23.1] [5.9] (20.0) (54.0) (26.0) (73.9) (3.3) (22.7)
1986-87 1209.9 1453.04 243.1 -60.6 153.2 150.53 249.8 13.5 -20.1[19.0] [22.9] [3.8] (-24.9) (63.0) (61.9) (102.7) (5.5) (-8.3)
1985-86 937.52 1087.06 149.5 0 137.2 12.3 343.8 11.2 -205.4[16.1] [18.6] [2.6] (0.0) (91.8) (8.2) (229.9) (7.5) (-137.3)
1984-85 699.0 1065.57 366.6 135.8 137.2 93.6 230.4 12.5 123.6[13.3] [20.3] [7.0] (37.0) (37.4) (25.5) (62.9) (3.4) (33.7)
1983-84 550.7 877.90 327.2 137.2 105.8 84.2 248.0 7.16 72.0[12.3] [19.6] [7.3] (41.9) (32.3) (25.7) (75.8) (2.2) (22.0)
1982-83 439.0 639.18 200.2 43.9 89.87 66.41 187.95 8.6 3.7[11.7] [17.0] [5.3] (21.9) (44.9) (33.2) (93.9) (4.3) (1.8)
1981-82 365.4 537.08 171.7 36.8 81.8 53.1 106.5 7.8 57.4[11.0] [16.2] [5.2] (21.4) (47.6) (30.9) (62.0) (4.5) (33.4)
1980-81 522.2 494.99 -27.2 -164.8 75.5 62.1 -97.3 9.9 60.3[20.2] [19.1] [-1.1] (605.7) (-277.5) (-228.2) (357.7) (-36.2) (-221.5)
Bihar2002-03BE 12015.5 15592.2 3576.7 1517.6 1460.3 598.9 940.4 676.0 1960.4
(42.4) (40.8) (16.7) (26.3) (18.9) (54.8)2001-02RE 10218.5 14228.8 4010.3 2341.9 1117.8 550.6 750.1 1124.8 2135.4
(58.4) (27.9) (13.7) (18.7) (28.0) (53.2)2000-01 11384.7 16269.1 4884.4 2960.7 1134.3 789.3 1159.1 839.1 2886.2
(60.6) (23.2) (16.2) (23.7) (17.2) (59.1)1999-00 12578.6 18686.3 6107.7 3549.7 1902.8 655.2 979.8 662.1 4465.8
[18.0] [26.8] [8.8] (58.1) (31.2) (10.7) (16.0) (10.8) (73.1)1998-99 9272.1 11651.0 2378.9 1350.5 699.5 329.0 2313.4 734.0 -668.5
[14.1] [17.8] [3.6] (56.8) (29.4) (13.8) (97.2) (30.9) (-28.1)1997-98 8692.6 9674.0 981.4 263.9 226.6 491.0 1320.3 639.3 -978.2
[14.2] [15.8] [1.6] (26.9) (23.1) (50.0) (134.5) (65.1) (-99.7)1996-97 8037.9 8928.5 890.6 216.0 450.2 224.5 967.4 558.9 -635.7
[15.0] [16.6] [1.7] (24.3) (50.6) (25.2) (108.6) (62.8) (-71.4)
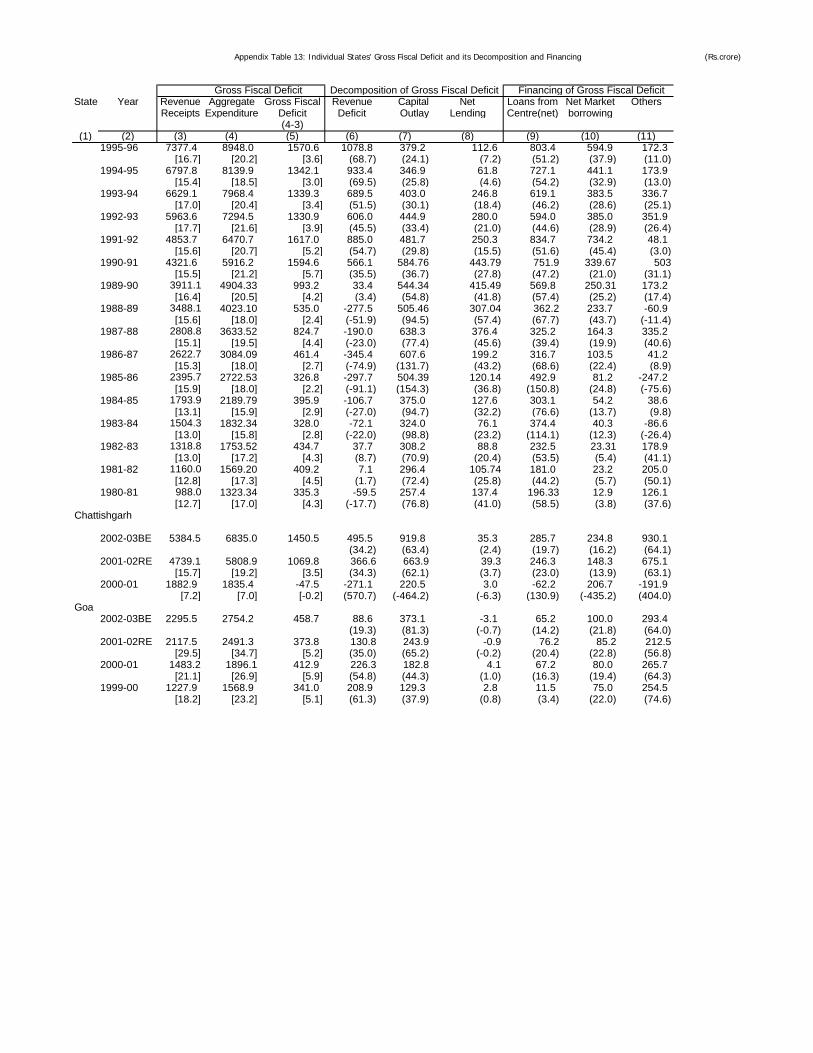
Appendix Table 13: Individual States' Gross Fiscal Deficit and its Decomposition and Financing (Rs.crore)
State Year Revenue Aggregate Gross Fiscal Revenue Capital Net Loans from Net Market OthersReceipts Expenditure Deficit Deficit Outlay Lending Centre(net) borrowing
(4-3)(1) (2) (3) (4) (5) (6) (7) (8) (9) (10) (11)
Gross Fiscal Deficit Decomposition of Gross Fiscal Deficit Financing of Gross Fiscal Deficit
1995-96 7377.4 8948.0 1570.6 1078.8 379.2 112.6 803.4 594.9 172.3[16.7] [20.2] [3.6] (68.7) (24.1) (7.2) (51.2) (37.9) (11.0)
1994-95 6797.8 8139.9 1342.1 933.4 346.9 61.8 727.1 441.1 173.9[15.4] [18.5] [3.0] (69.5) (25.8) (4.6) (54.2) (32.9) (13.0)
1993-94 6629.1 7968.4 1339.3 689.5 403.0 246.8 619.1 383.5 336.7[17.0] [20.4] [3.4] (51.5) (30.1) (18.4) (46.2) (28.6) (25.1)
1992-93 5963.6 7294.5 1330.9 606.0 444.9 280.0 594.0 385.0 351.9[17.7] [21.6] [3.9] (45.5) (33.4) (21.0) (44.6) (28.9) (26.4)
1991-92 4853.7 6470.7 1617.0 885.0 481.7 250.3 834.7 734.2 48.1[15.6] [20.7] [5.2] (54.7) (29.8) (15.5) (51.6) (45.4) (3.0)
1990-91 4321.6 5916.2 1594.6 566.1 584.76 443.79 751.9 339.67 503[15.5] [21.2] [5.7] (35.5) (36.7) (27.8) (47.2) (21.0) (31.1)
1989-90 3911.1 4904.33 993.2 33.4 544.34 415.49 569.8 250.31 173.2[16.4] [20.5] [4.2] (3.4) (54.8) (41.8) (57.4) (25.2) (17.4)
1988-89 3488.1 4023.10 535.0 -277.5 505.46 307.04 362.2 233.7 -60.9[15.6] [18.0] [2.4] (-51.9) (94.5) (57.4) (67.7) (43.7) (-11.4)
1987-88 2808.8 3633.52 824.7 -190.0 638.3 376.4 325.2 164.3 335.2[15.1] [19.5] [4.4] (-23.0) (77.4) (45.6) (39.4) (19.9) (40.6)
1986-87 2622.7 3084.09 461.4 -345.4 607.6 199.2 316.7 103.5 41.2[15.3] [18.0] [2.7] (-74.9) (131.7) (43.2) (68.6) (22.4) (8.9)
1985-86 2395.7 2722.53 326.8 -297.7 504.39 120.14 492.9 81.2 -247.2[15.9] [18.0] [2.2] (-91.1) (154.3) (36.8) (150.8) (24.8) (-75.6)
1984-85 1793.9 2189.79 395.9 -106.7 375.0 127.6 303.1 54.2 38.6[13.1] [15.9] [2.9] (-27.0) (94.7) (32.2) (76.6) (13.7) (9.8)
1983-84 1504.3 1832.34 328.0 -72.1 324.0 76.1 374.4 40.3 -86.6[13.0] [15.8] [2.8] (-22.0) (98.8) (23.2) (114.1) (12.3) (-26.4)
1982-83 1318.8 1753.52 434.7 37.7 308.2 88.8 232.5 23.31 178.9[13.0] [17.2] [4.3] (8.7) (70.9) (20.4) (53.5) (5.4) (41.1)
1981-82 1160.0 1569.20 409.2 7.1 296.4 105.74 181.0 23.2 205.0[12.8] [17.3] [4.5] (1.7) (72.4) (25.8) (44.2) (5.7) (50.1)
1980-81 988.0 1323.34 335.3 -59.5 257.4 137.4 196.33 12.9 126.1[12.7] [17.0] [4.3] (-17.7) (76.8) (41.0) (58.5) (3.8) (37.6)
Chattishgarh
2002-03BE 5384.5 6835.0 1450.5 495.5 919.8 35.3 285.7 234.8 930.1(34.2) (63.4) (2.4) (19.7) (16.2) (64.1)
2001-02RE 4739.1 5808.9 1069.8 366.6 663.9 39.3 246.3 148.3 675.1[15.7] [19.2] [3.5] (34.3) (62.1) (3.7) (23.0) (13.9) (63.1)
2000-01 1882.9 1835.4 -47.5 -271.1 220.5 3.0 -62.2 206.7 -191.9[7.2] [7.0] [-0.2] (570.7) (-464.2) (-6.3) (130.9) (-435.2) (404.0)
Goa2002-03BE 2295.5 2754.2 458.7 88.6 373.1 -3.1 65.2 100.0 293.4
(19.3) (81.3) (-0.7) (14.2) (21.8) (64.0)2001-02RE 2117.5 2491.3 373.8 130.8 243.9 -0.9 76.2 85.2 212.5
[29.5] [34.7] [5.2] (35.0) (65.2) (-0.2) (20.4) (22.8) (56.8)2000-01 1483.2 1896.1 412.9 226.3 182.8 4.1 67.2 80.0 265.7
[21.1] [26.9] [5.9] (54.8) (44.3) (1.0) (16.3) (19.4) (64.3)1999-00 1227.9 1568.9 341.0 208.9 129.3 2.8 11.5 75.0 254.5
[18.2] [23.2] [5.1] (61.3) (37.9) (0.8) (3.4) (22.0) (74.6)
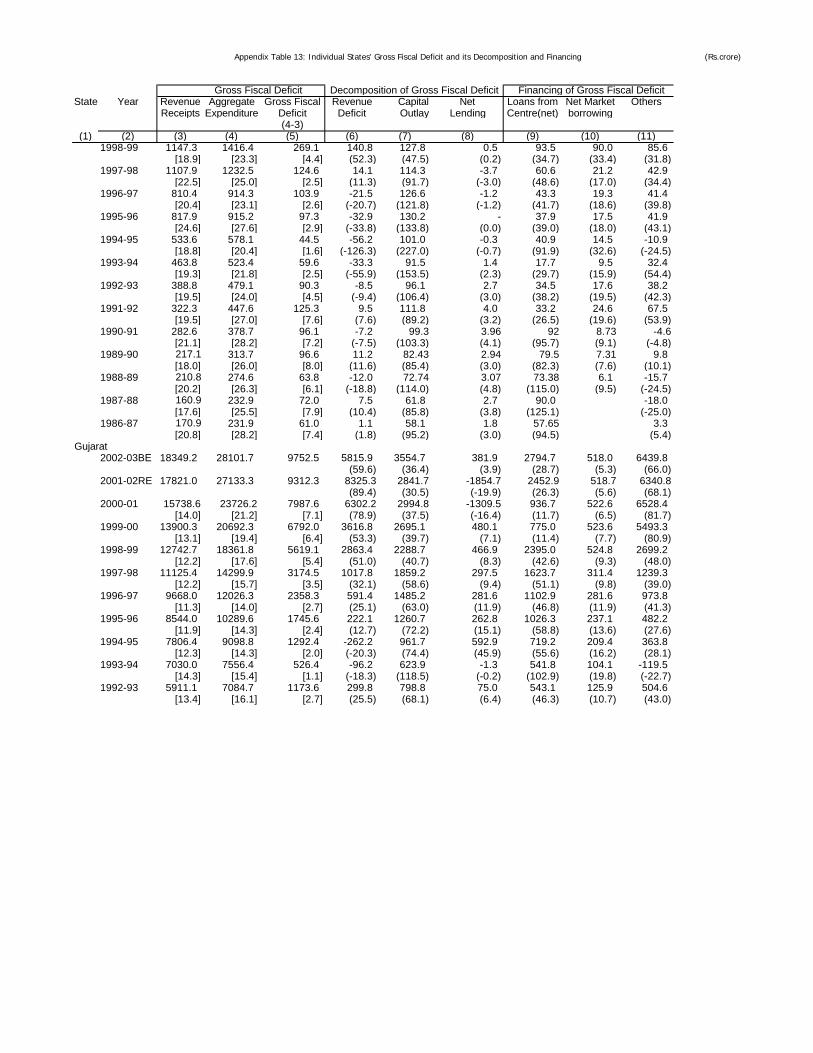
Appendix Table 13: Individual States' Gross Fiscal Deficit and its Decomposition and Financing (Rs.crore)
State Year Revenue Aggregate Gross Fiscal Revenue Capital Net Loans from Net Market OthersReceipts Expenditure Deficit Deficit Outlay Lending Centre(net) borrowing
(4-3)(1) (2) (3) (4) (5) (6) (7) (8) (9) (10) (11)
Gross Fiscal Deficit Decomposition of Gross Fiscal Deficit Financing of Gross Fiscal Deficit
1998-99 1147.3 1416.4 269.1 140.8 127.8 0.5 93.5 90.0 85.6[18.9] [23.3] [4.4] (52.3) (47.5) (0.2) (34.7) (33.4) (31.8)
1997-98 1107.9 1232.5 124.6 14.1 114.3 -3.7 60.6 21.2 42.9[22.5] [25.0] [2.5] (11.3) (91.7) (-3.0) (48.6) (17.0) (34.4)
1996-97 810.4 914.3 103.9 -21.5 126.6 -1.2 43.3 19.3 41.4[20.4] [23.1] [2.6] (-20.7) (121.8) (-1.2) (41.7) (18.6) (39.8)
1995-96 817.9 915.2 97.3 -32.9 130.2 - 37.9 17.5 41.9[24.6] [27.6] [2.9] (-33.8) (133.8) (0.0) (39.0) (18.0) (43.1)
1994-95 533.6 578.1 44.5 -56.2 101.0 -0.3 40.9 14.5 -10.9[18.8] [20.4] [1.6] (-126.3) (227.0) (-0.7) (91.9) (32.6) (-24.5)
1993-94 463.8 523.4 59.6 -33.3 91.5 1.4 17.7 9.5 32.4[19.3] [21.8] [2.5] (-55.9) (153.5) (2.3) (29.7) (15.9) (54.4)
1992-93 388.8 479.1 90.3 -8.5 96.1 2.7 34.5 17.6 38.2[19.5] [24.0] [4.5] (-9.4) (106.4) (3.0) (38.2) (19.5) (42.3)
1991-92 322.3 447.6 125.3 9.5 111.8 4.0 33.2 24.6 67.5[19.5] [27.0] [7.6] (7.6) (89.2) (3.2) (26.5) (19.6) (53.9)
1990-91 282.6 378.7 96.1 -7.2 99.3 3.96 92 8.73 -4.6[21.1] [28.2] [7.2] (-7.5) (103.3) (4.1) (95.7) (9.1) (-4.8)
1989-90 217.1 313.7 96.6 11.2 82.43 2.94 79.5 7.31 9.8[18.0] [26.0] [8.0] (11.6) (85.4) (3.0) (82.3) (7.6) (10.1)
1988-89 210.8 274.6 63.8 -12.0 72.74 3.07 73.38 6.1 -15.7[20.2] [26.3] [6.1] (-18.8) (114.0) (4.8) (115.0) (9.5) (-24.5)
1987-88 160.9 232.9 72.0 7.5 61.8 2.7 90.0 -18.0[17.6] [25.5] [7.9] (10.4) (85.8) (3.8) (125.1) (-25.0)
1986-87 170.9 231.9 61.0 1.1 58.1 1.8 57.65 3.3[20.8] [28.2] [7.4] (1.8) (95.2) (3.0) (94.5) (5.4)
Gujarat2002-03BE 18349.2 28101.7 9752.5 5815.9 3554.7 381.9 2794.7 518.0 6439.8
(59.6) (36.4) (3.9) (28.7) (5.3) (66.0)2001-02RE 17821.0 27133.3 9312.3 8325.3 2841.7 -1854.7 2452.9 518.7 6340.8
(89.4) (30.5) (-19.9) (26.3) (5.6) (68.1)2000-01 15738.6 23726.2 7987.6 6302.2 2994.8 -1309.5 936.7 522.6 6528.4
[14.0] [21.2] [7.1] (78.9) (37.5) (-16.4) (11.7) (6.5) (81.7)1999-00 13900.3 20692.3 6792.0 3616.8 2695.1 480.1 775.0 523.6 5493.3
[13.1] [19.4] [6.4] (53.3) (39.7) (7.1) (11.4) (7.7) (80.9)1998-99 12742.7 18361.8 5619.1 2863.4 2288.7 466.9 2395.0 524.8 2699.2
[12.2] [17.6] [5.4] (51.0) (40.7) (8.3) (42.6) (9.3) (48.0)1997-98 11125.4 14299.9 3174.5 1017.8 1859.2 297.5 1623.7 311.4 1239.3
[12.2] [15.7] [3.5] (32.1) (58.6) (9.4) (51.1) (9.8) (39.0)1996-97 9668.0 12026.3 2358.3 591.4 1485.2 281.6 1102.9 281.6 973.8
[11.3] [14.0] [2.7] (25.1) (63.0) (11.9) (46.8) (11.9) (41.3)1995-96 8544.0 10289.6 1745.6 222.1 1260.7 262.8 1026.3 237.1 482.2
[11.9] [14.3] [2.4] (12.7) (72.2) (15.1) (58.8) (13.6) (27.6)1994-95 7806.4 9098.8 1292.4 -262.2 961.7 592.9 719.2 209.4 363.8
[12.3] [14.3] [2.0] (-20.3) (74.4) (45.9) (55.6) (16.2) (28.1)1993-94 7030.0 7556.4 526.4 -96.2 623.9 -1.3 541.8 104.1 -119.5
[14.3] [15.4] [1.1] (-18.3) (118.5) (-0.2) (102.9) (19.8) (-22.7)1992-93 5911.1 7084.7 1173.6 299.8 798.8 75.0 543.1 125.9 504.6
[13.4] [16.1] [2.7] (25.5) (68.1) (6.4) (46.3) (10.7) (43.0)
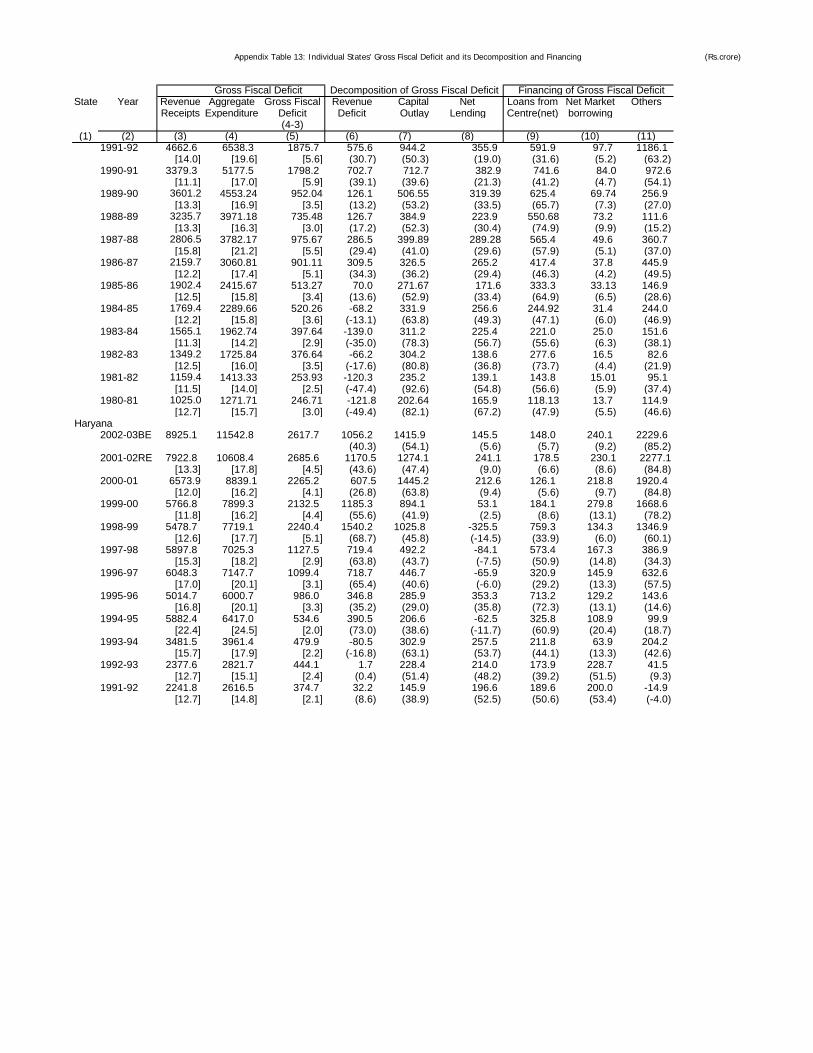
Appendix Table 13: Individual States' Gross Fiscal Deficit and its Decomposition and Financing (Rs.crore)
State Year Revenue Aggregate Gross Fiscal Revenue Capital Net Loans from Net Market OthersReceipts Expenditure Deficit Deficit Outlay Lending Centre(net) borrowing
(4-3)(1) (2) (3) (4) (5) (6) (7) (8) (9) (10) (11)
Gross Fiscal Deficit Decomposition of Gross Fiscal Deficit Financing of Gross Fiscal Deficit
1991-92 4662.6 6538.3 1875.7 575.6 944.2 355.9 591.9 97.7 1186.1[14.0] [19.6] [5.6] (30.7) (50.3) (19.0) (31.6) (5.2) (63.2)
1990-91 3379.3 5177.5 1798.2 702.7 712.7 382.9 741.6 84.0 972.6[11.1] [17.0] [5.9] (39.1) (39.6) (21.3) (41.2) (4.7) (54.1)
1989-90 3601.2 4553.24 952.04 126.1 506.55 319.39 625.4 69.74 256.9[13.3] [16.9] [3.5] (13.2) (53.2) (33.5) (65.7) (7.3) (27.0)
1988-89 3235.7 3971.18 735.48 126.7 384.9 223.9 550.68 73.2 111.6[13.3] [16.3] [3.0] (17.2) (52.3) (30.4) (74.9) (9.9) (15.2)
1987-88 2806.5 3782.17 975.67 286.5 399.89 289.28 565.4 49.6 360.7[15.8] [21.2] [5.5] (29.4) (41.0) (29.6) (57.9) (5.1) (37.0)
1986-87 2159.7 3060.81 901.11 309.5 326.5 265.2 417.4 37.8 445.9[12.2] [17.4] [5.1] (34.3) (36.2) (29.4) (46.3) (4.2) (49.5)
1985-86 1902.4 2415.67 513.27 70.0 271.67 171.6 333.3 33.13 146.9[12.5] [15.8] [3.4] (13.6) (52.9) (33.4) (64.9) (6.5) (28.6)
1984-85 1769.4 2289.66 520.26 -68.2 331.9 256.6 244.92 31.4 244.0[12.2] [15.8] [3.6] (-13.1) (63.8) (49.3) (47.1) (6.0) (46.9)
1983-84 1565.1 1962.74 397.64 -139.0 311.2 225.4 221.0 25.0 151.6[11.3] [14.2] [2.9] (-35.0) (78.3) (56.7) (55.6) (6.3) (38.1)
1982-83 1349.2 1725.84 376.64 -66.2 304.2 138.6 277.6 16.5 82.6[12.5] [16.0] [3.5] (-17.6) (80.8) (36.8) (73.7) (4.4) (21.9)
1981-82 1159.4 1413.33 253.93 -120.3 235.2 139.1 143.8 15.01 95.1[11.5] [14.0] [2.5] (-47.4) (92.6) (54.8) (56.6) (5.9) (37.4)
1980-81 1025.0 1271.71 246.71 -121.8 202.64 165.9 118.13 13.7 114.9[12.7] [15.7] [3.0] (-49.4) (82.1) (67.2) (47.9) (5.5) (46.6)
Haryana2002-03BE 8925.1 11542.8 2617.7 1056.2 1415.9 145.5 148.0 240.1 2229.6
(40.3) (54.1) (5.6) (5.7) (9.2) (85.2)2001-02RE 7922.8 10608.4 2685.6 1170.5 1274.1 241.1 178.5 230.1 2277.1
[13.3] [17.8] [4.5] (43.6) (47.4) (9.0) (6.6) (8.6) (84.8)2000-01 6573.9 8839.1 2265.2 607.5 1445.2 212.6 126.1 218.8 1920.4
[12.0] [16.2] [4.1] (26.8) (63.8) (9.4) (5.6) (9.7) (84.8)1999-00 5766.8 7899.3 2132.5 1185.3 894.1 53.1 184.1 279.8 1668.6
[11.8] [16.2] [4.4] (55.6) (41.9) (2.5) (8.6) (13.1) (78.2)1998-99 5478.7 7719.1 2240.4 1540.2 1025.8 -325.5 759.3 134.3 1346.9
[12.6] [17.7] [5.1] (68.7) (45.8) (-14.5) (33.9) (6.0) (60.1)1997-98 5897.8 7025.3 1127.5 719.4 492.2 -84.1 573.4 167.3 386.9
[15.3] [18.2] [2.9] (63.8) (43.7) (-7.5) (50.9) (14.8) (34.3)1996-97 6048.3 7147.7 1099.4 718.7 446.7 -65.9 320.9 145.9 632.6
[17.0] [20.1] [3.1] (65.4) (40.6) (-6.0) (29.2) (13.3) (57.5)1995-96 5014.7 6000.7 986.0 346.8 285.9 353.3 713.2 129.2 143.6
[16.8] [20.1] [3.3] (35.2) (29.0) (35.8) (72.3) (13.1) (14.6)1994-95 5882.4 6417.0 534.6 390.5 206.6 -62.5 325.8 108.9 99.9
[22.4] [24.5] [2.0] (73.0) (38.6) (-11.7) (60.9) (20.4) (18.7)1993-94 3481.5 3961.4 479.9 -80.5 302.9 257.5 211.8 63.9 204.2
[15.7] [17.9] [2.2] (-16.8) (63.1) (53.7) (44.1) (13.3) (42.6)1992-93 2377.6 2821.7 444.1 1.7 228.4 214.0 173.9 228.7 41.5
[12.7] [15.1] [2.4] (0.4) (51.4) (48.2) (39.2) (51.5) (9.3)1991-92 2241.8 2616.5 374.7 32.2 145.9 196.6 189.6 200.0 -14.9
[12.7] [14.8] [2.1] (8.6) (38.9) (52.5) (50.6) (53.4) (-4.0)
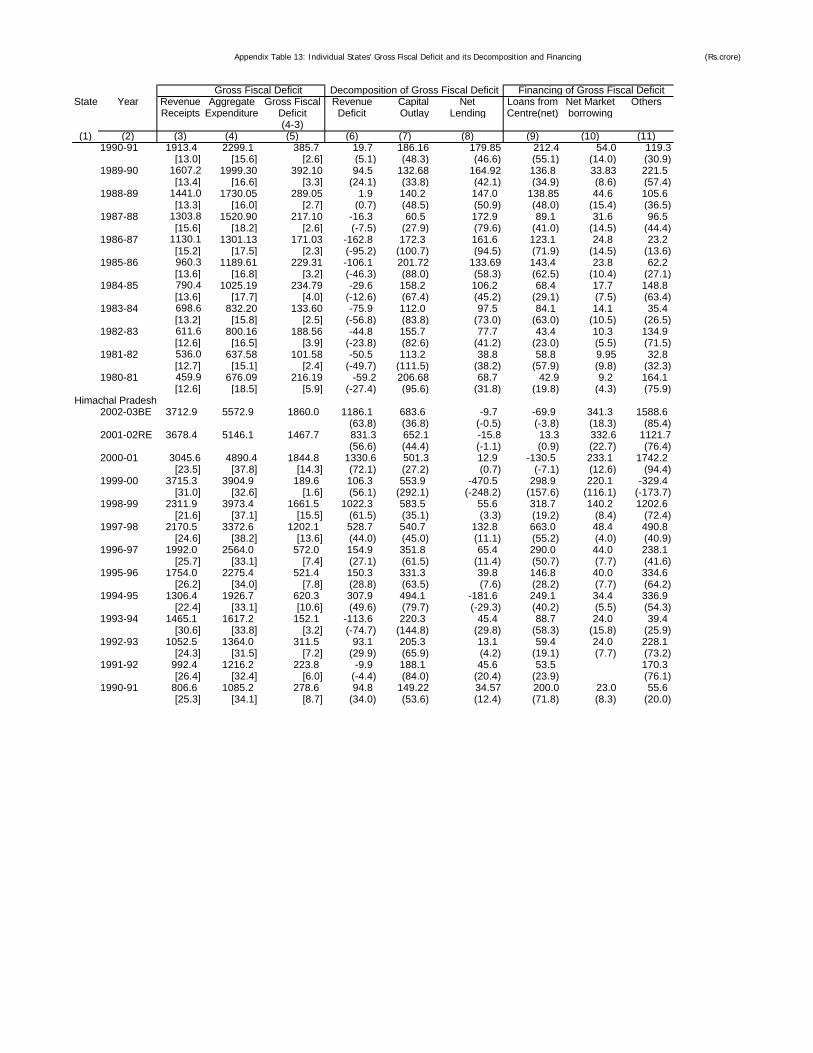
Appendix Table 13: Individual States' Gross Fiscal Deficit and its Decomposition and Financing (Rs.crore)
State Year Revenue Aggregate Gross Fiscal Revenue Capital Net Loans from Net Market OthersReceipts Expenditure Deficit Deficit Outlay Lending Centre(net) borrowing
(4-3)(1) (2) (3) (4) (5) (6) (7) (8) (9) (10) (11)
Gross Fiscal Deficit Decomposition of Gross Fiscal Deficit Financing of Gross Fiscal Deficit
1990-91 1913.4 2299.1 385.7 19.7 186.16 179.85 212.4 54.0 119.3[13.0] [15.6] [2.6] (5.1) (48.3) (46.6) (55.1) (14.0) (30.9)
1989-90 1607.2 1999.30 392.10 94.5 132.68 164.92 136.8 33.83 221.5[13.4] [16.6] [3.3] (24.1) (33.8) (42.1) (34.9) (8.6) (57.4)
1988-89 1441.0 1730.05 289.05 1.9 140.2 147.0 138.85 44.6 105.6[13.3] [16.0] [2.7] (0.7) (48.5) (50.9) (48.0) (15.4) (36.5)
1987-88 1303.8 1520.90 217.10 -16.3 60.5 172.9 89.1 31.6 96.5[15.6] [18.2] [2.6] (-7.5) (27.9) (79.6) (41.0) (14.5) (44.4)
1986-87 1130.1 1301.13 171.03 -162.8 172.3 161.6 123.1 24.8 23.2[15.2] [17.5] [2.3] (-95.2) (100.7) (94.5) (71.9) (14.5) (13.6)
1985-86 960.3 1189.61 229.31 -106.1 201.72 133.69 143.4 23.8 62.2[13.6] [16.8] [3.2] (-46.3) (88.0) (58.3) (62.5) (10.4) (27.1)
1984-85 790.4 1025.19 234.79 -29.6 158.2 106.2 68.4 17.7 148.8[13.6] [17.7] [4.0] (-12.6) (67.4) (45.2) (29.1) (7.5) (63.4)
1983-84 698.6 832.20 133.60 -75.9 112.0 97.5 84.1 14.1 35.4[13.2] [15.8] [2.5] (-56.8) (83.8) (73.0) (63.0) (10.5) (26.5)
1982-83 611.6 800.16 188.56 -44.8 155.7 77.7 43.4 10.3 134.9[12.6] [16.5] [3.9] (-23.8) (82.6) (41.2) (23.0) (5.5) (71.5)
1981-82 536.0 637.58 101.58 -50.5 113.2 38.8 58.8 9.95 32.8[12.7] [15.1] [2.4] (-49.7) (111.5) (38.2) (57.9) (9.8) (32.3)
1980-81 459.9 676.09 216.19 -59.2 206.68 68.7 42.9 9.2 164.1[12.6] [18.5] [5.9] (-27.4) (95.6) (31.8) (19.8) (4.3) (75.9)
Himachal Pradesh2002-03BE 3712.9 5572.9 1860.0 1186.1 683.6 -9.7 -69.9 341.3 1588.6
(63.8) (36.8) (-0.5) (-3.8) (18.3) (85.4)2001-02RE 3678.4 5146.1 1467.7 831.3 652.1 -15.8 13.3 332.6 1121.7
(56.6) (44.4) (-1.1) (0.9) (22.7) (76.4)2000-01 3045.6 4890.4 1844.8 1330.6 501.3 12.9 -130.5 233.1 1742.2
[23.5] [37.8] [14.3] (72.1) (27.2) (0.7) (-7.1) (12.6) (94.4)1999-00 3715.3 3904.9 189.6 106.3 553.9 -470.5 298.9 220.1 -329.4
[31.0] [32.6] [1.6] (56.1) (292.1) (-248.2) (157.6) (116.1) (-173.7)1998-99 2311.9 3973.4 1661.5 1022.3 583.5 55.6 318.7 140.2 1202.6
[21.6] [37.1] [15.5] (61.5) (35.1) (3.3) (19.2) (8.4) (72.4)1997-98 2170.5 3372.6 1202.1 528.7 540.7 132.8 663.0 48.4 490.8
[24.6] [38.2] [13.6] (44.0) (45.0) (11.1) (55.2) (4.0) (40.9)1996-97 1992.0 2564.0 572.0 154.9 351.8 65.4 290.0 44.0 238.1
[25.7] [33.1] [7.4] (27.1) (61.5) (11.4) (50.7) (7.7) (41.6)1995-96 1754.0 2275.4 521.4 150.3 331.3 39.8 146.8 40.0 334.6
[26.2] [34.0] [7.8] (28.8) (63.5) (7.6) (28.2) (7.7) (64.2)1994-95 1306.4 1926.7 620.3 307.9 494.1 -181.6 249.1 34.4 336.9
[22.4] [33.1] [10.6] (49.6) (79.7) (-29.3) (40.2) (5.5) (54.3)1993-94 1465.1 1617.2 152.1 -113.6 220.3 45.4 88.7 24.0 39.4
[30.6] [33.8] [3.2] (-74.7) (144.8) (29.8) (58.3) (15.8) (25.9)1992-93 1052.5 1364.0 311.5 93.1 205.3 13.1 59.4 24.0 228.1
[24.3] [31.5] [7.2] (29.9) (65.9) (4.2) (19.1) (7.7) (73.2)1991-92 992.4 1216.2 223.8 -9.9 188.1 45.6 53.5 170.3
[26.4] [32.4] [6.0] (-4.4) (84.0) (20.4) (23.9) (76.1)1990-91 806.6 1085.2 278.6 94.8 149.22 34.57 200.0 23.0 55.6
[25.3] [34.1] [8.7] (34.0) (53.6) (12.4) (71.8) (8.3) (20.0)
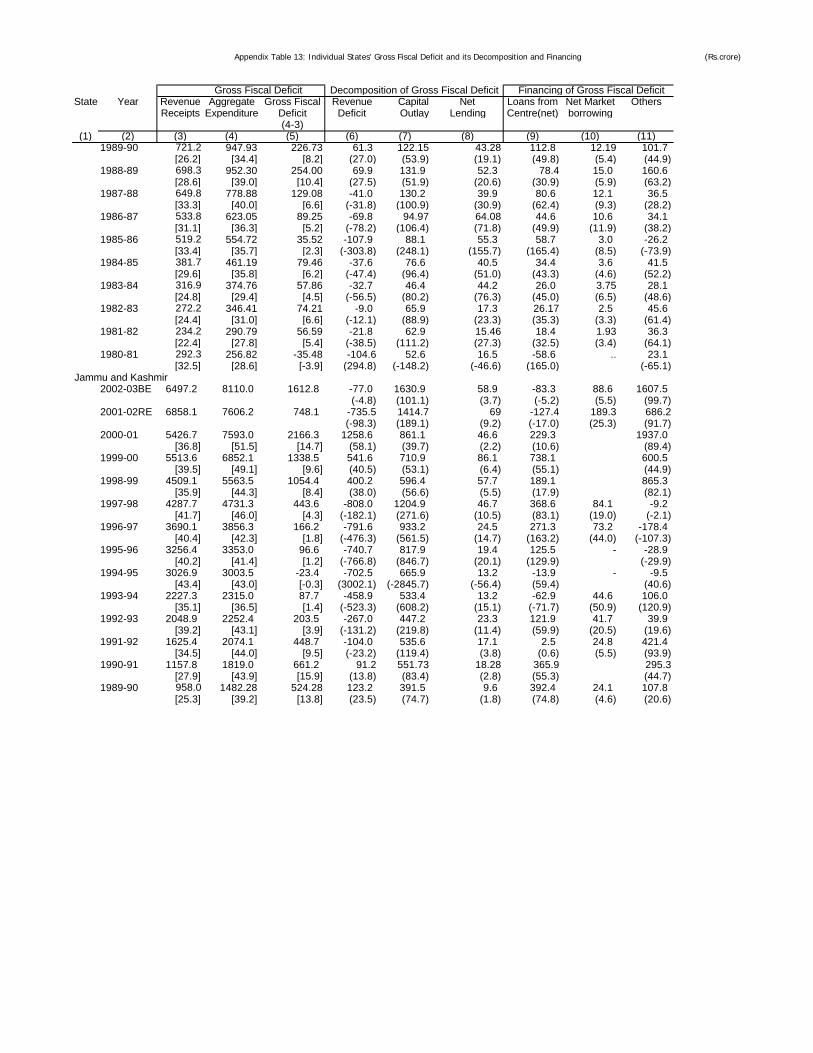
Appendix Table 13: Individual States' Gross Fiscal Deficit and its Decomposition and Financing (Rs.crore)
State Year Revenue Aggregate Gross Fiscal Revenue Capital Net Loans from Net Market OthersReceipts Expenditure Deficit Deficit Outlay Lending Centre(net) borrowing
(4-3)(1) (2) (3) (4) (5) (6) (7) (8) (9) (10) (11)
Gross Fiscal Deficit Decomposition of Gross Fiscal Deficit Financing of Gross Fiscal Deficit
1989-90 721.2 947.93 226.73 61.3 122.15 43.28 112.8 12.19 101.7[26.2] [34.4] [8.2] (27.0) (53.9) (19.1) (49.8) (5.4) (44.9)
1988-89 698.3 952.30 254.00 69.9 131.9 52.3 78.4 15.0 160.6[28.6] [39.0] [10.4] (27.5) (51.9) (20.6) (30.9) (5.9) (63.2)
1987-88 649.8 778.88 129.08 -41.0 130.2 39.9 80.6 12.1 36.5[33.3] [40.0] [6.6] (-31.8) (100.9) (30.9) (62.4) (9.3) (28.2)
1986-87 533.8 623.05 89.25 -69.8 94.97 64.08 44.6 10.6 34.1[31.1] [36.3] [5.2] (-78.2) (106.4) (71.8) (49.9) (11.9) (38.2)
1985-86 519.2 554.72 35.52 -107.9 88.1 55.3 58.7 3.0 -26.2[33.4] [35.7] [2.3] (-303.8) (248.1) (155.7) (165.4) (8.5) (-73.9)
1984-85 381.7 461.19 79.46 -37.6 76.6 40.5 34.4 3.6 41.5[29.6] [35.8] [6.2] (-47.4) (96.4) (51.0) (43.3) (4.6) (52.2)
1983-84 316.9 374.76 57.86 -32.7 46.4 44.2 26.0 3.75 28.1[24.8] [29.4] [4.5] (-56.5) (80.2) (76.3) (45.0) (6.5) (48.6)
1982-83 272.2 346.41 74.21 -9.0 65.9 17.3 26.17 2.5 45.6[24.4] [31.0] [6.6] (-12.1) (88.9) (23.3) (35.3) (3.3) (61.4)
1981-82 234.2 290.79 56.59 -21.8 62.9 15.46 18.4 1.93 36.3[22.4] [27.8] [5.4] (-38.5) (111.2) (27.3) (32.5) (3.4) (64.1)
1980-81 292.3 256.82 -35.48 -104.6 52.6 16.5 -58.6 .. 23.1[32.5] [28.6] [-3.9] (294.8) (-148.2) (-46.6) (165.0) (-65.1)
Jammu and Kashmir2002-03BE 6497.2 8110.0 1612.8 -77.0 1630.9 58.9 -83.3 88.6 1607.5
(-4.8) (101.1) (3.7) (-5.2) (5.5) (99.7)2001-02RE 6858.1 7606.2 748.1 -735.5 1414.7 69 -127.4 189.3 686.2
(-98.3) (189.1) (9.2) (-17.0) (25.3) (91.7)2000-01 5426.7 7593.0 2166.3 1258.6 861.1 46.6 229.3 1937.0
[36.8] [51.5] [14.7] (58.1) (39.7) (2.2) (10.6) (89.4)1999-00 5513.6 6852.1 1338.5 541.6 710.9 86.1 738.1 600.5
[39.5] [49.1] [9.6] (40.5) (53.1) (6.4) (55.1) (44.9)1998-99 4509.1 5563.5 1054.4 400.2 596.4 57.7 189.1 865.3
[35.9] [44.3] [8.4] (38.0) (56.6) (5.5) (17.9) (82.1)1997-98 4287.7 4731.3 443.6 -808.0 1204.9 46.7 368.6 84.1 -9.2
[41.7] [46.0] [4.3] (-182.1) (271.6) (10.5) (83.1) (19.0) (-2.1)1996-97 3690.1 3856.3 166.2 -791.6 933.2 24.5 271.3 73.2 -178.4
[40.4] [42.3] [1.8] (-476.3) (561.5) (14.7) (163.2) (44.0) (-107.3)1995-96 3256.4 3353.0 96.6 -740.7 817.9 19.4 125.5 - -28.9
[40.2] [41.4] [1.2] (-766.8) (846.7) (20.1) (129.9) (-29.9)1994-95 3026.9 3003.5 -23.4 -702.5 665.9 13.2 -13.9 - -9.5
[43.4] [43.0] [-0.3] (3002.1) (-2845.7) (-56.4) (59.4) (40.6)1993-94 2227.3 2315.0 87.7 -458.9 533.4 13.2 -62.9 44.6 106.0
[35.1] [36.5] [1.4] (-523.3) (608.2) (15.1) (-71.7) (50.9) (120.9)1992-93 2048.9 2252.4 203.5 -267.0 447.2 23.3 121.9 41.7 39.9
[39.2] [43.1] [3.9] (-131.2) (219.8) (11.4) (59.9) (20.5) (19.6)1991-92 1625.4 2074.1 448.7 -104.0 535.6 17.1 2.5 24.8 421.4
[34.5] [44.0] [9.5] (-23.2) (119.4) (3.8) (0.6) (5.5) (93.9)1990-91 1157.8 1819.0 661.2 91.2 551.73 18.28 365.9 295.3
[27.9] [43.9] [15.9] (13.8) (83.4) (2.8) (55.3) (44.7)1989-90 958.0 1482.28 524.28 123.2 391.5 9.6 392.4 24.1 107.8
[25.3] [39.2] [13.8] (23.5) (74.7) (1.8) (74.8) (4.6) (20.6)
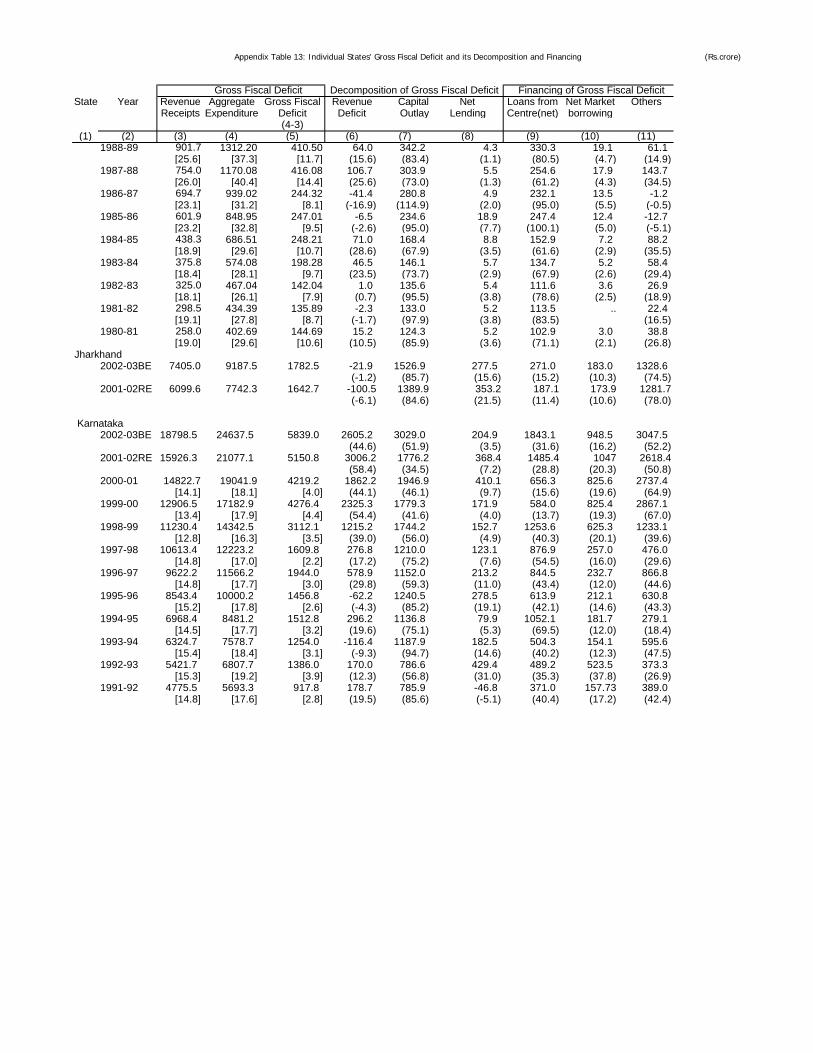
Appendix Table 13: Individual States' Gross Fiscal Deficit and its Decomposition and Financing (Rs.crore)
State Year Revenue Aggregate Gross Fiscal Revenue Capital Net Loans from Net Market OthersReceipts Expenditure Deficit Deficit Outlay Lending Centre(net) borrowing
(4-3)(1) (2) (3) (4) (5) (6) (7) (8) (9) (10) (11)
Gross Fiscal Deficit Decomposition of Gross Fiscal Deficit Financing of Gross Fiscal Deficit
1988-89 901.7 1312.20 410.50 64.0 342.2 4.3 330.3 19.1 61.1[25.6] [37.3] [11.7] (15.6) (83.4) (1.1) (80.5) (4.7) (14.9)
1987-88 754.0 1170.08 416.08 106.7 303.9 5.5 254.6 17.9 143.7[26.0] [40.4] [14.4] (25.6) (73.0) (1.3) (61.2) (4.3) (34.5)
1986-87 694.7 939.02 244.32 -41.4 280.8 4.9 232.1 13.5 -1.2[23.1] [31.2] [8.1] (-16.9) (114.9) (2.0) (95.0) (5.5) (-0.5)
1985-86 601.9 848.95 247.01 -6.5 234.6 18.9 247.4 12.4 -12.7[23.2] [32.8] [9.5] (-2.6) (95.0) (7.7) (100.1) (5.0) (-5.1)
1984-85 438.3 686.51 248.21 71.0 168.4 8.8 152.9 7.2 88.2[18.9] [29.6] [10.7] (28.6) (67.9) (3.5) (61.6) (2.9) (35.5)
1983-84 375.8 574.08 198.28 46.5 146.1 5.7 134.7 5.2 58.4[18.4] [28.1] [9.7] (23.5) (73.7) (2.9) (67.9) (2.6) (29.4)
1982-83 325.0 467.04 142.04 1.0 135.6 5.4 111.6 3.6 26.9[18.1] [26.1] [7.9] (0.7) (95.5) (3.8) (78.6) (2.5) (18.9)
1981-82 298.5 434.39 135.89 -2.3 133.0 5.2 113.5 .. 22.4[19.1] [27.8] [8.7] (-1.7) (97.9) (3.8) (83.5) (16.5)
1980-81 258.0 402.69 144.69 15.2 124.3 5.2 102.9 3.0 38.8[19.0] [29.6] [10.6] (10.5) (85.9) (3.6) (71.1) (2.1) (26.8)
Jharkhand2002-03BE 7405.0 9187.5 1782.5 -21.9 1526.9 277.5 271.0 183.0 1328.6
(-1.2) (85.7) (15.6) (15.2) (10.3) (74.5)2001-02RE 6099.6 7742.3 1642.7 -100.5 1389.9 353.2 187.1 173.9 1281.7
(-6.1) (84.6) (21.5) (11.4) (10.6) (78.0)
Karnataka2002-03BE 18798.5 24637.5 5839.0 2605.2 3029.0 204.9 1843.1 948.5 3047.5
(44.6) (51.9) (3.5) (31.6) (16.2) (52.2)2001-02RE 15926.3 21077.1 5150.8 3006.2 1776.2 368.4 1485.4 1047 2618.4
(58.4) (34.5) (7.2) (28.8) (20.3) (50.8)2000-01 14822.7 19041.9 4219.2 1862.2 1946.9 410.1 656.3 825.6 2737.4
[14.1] [18.1] [4.0] (44.1) (46.1) (9.7) (15.6) (19.6) (64.9)1999-00 12906.5 17182.9 4276.4 2325.3 1779.3 171.9 584.0 825.4 2867.1
[13.4] [17.9] [4.4] (54.4) (41.6) (4.0) (13.7) (19.3) (67.0)1998-99 11230.4 14342.5 3112.1 1215.2 1744.2 152.7 1253.6 625.3 1233.1
[12.8] [16.3] [3.5] (39.0) (56.0) (4.9) (40.3) (20.1) (39.6)1997-98 10613.4 12223.2 1609.8 276.8 1210.0 123.1 876.9 257.0 476.0
[14.8] [17.0] [2.2] (17.2) (75.2) (7.6) (54.5) (16.0) (29.6)1996-97 9622.2 11566.2 1944.0 578.9 1152.0 213.2 844.5 232.7 866.8
[14.8] [17.7] [3.0] (29.8) (59.3) (11.0) (43.4) (12.0) (44.6)1995-96 8543.4 10000.2 1456.8 -62.2 1240.5 278.5 613.9 212.1 630.8
[15.2] [17.8] [2.6] (-4.3) (85.2) (19.1) (42.1) (14.6) (43.3)1994-95 6968.4 8481.2 1512.8 296.2 1136.8 79.9 1052.1 181.7 279.1
[14.5] [17.7] [3.2] (19.6) (75.1) (5.3) (69.5) (12.0) (18.4)1993-94 6324.7 7578.7 1254.0 -116.4 1187.9 182.5 504.3 154.1 595.6
[15.4] [18.4] [3.1] (-9.3) (94.7) (14.6) (40.2) (12.3) (47.5)1992-93 5421.7 6807.7 1386.0 170.0 786.6 429.4 489.2 523.5 373.3
[15.3] [19.2] [3.9] (12.3) (56.8) (31.0) (35.3) (37.8) (26.9)1991-92 4775.5 5693.3 917.8 178.7 785.9 -46.8 371.0 157.73 389.0
[14.8] [17.6] [2.8] (19.5) (85.6) (-5.1) (40.4) (17.2) (42.4)
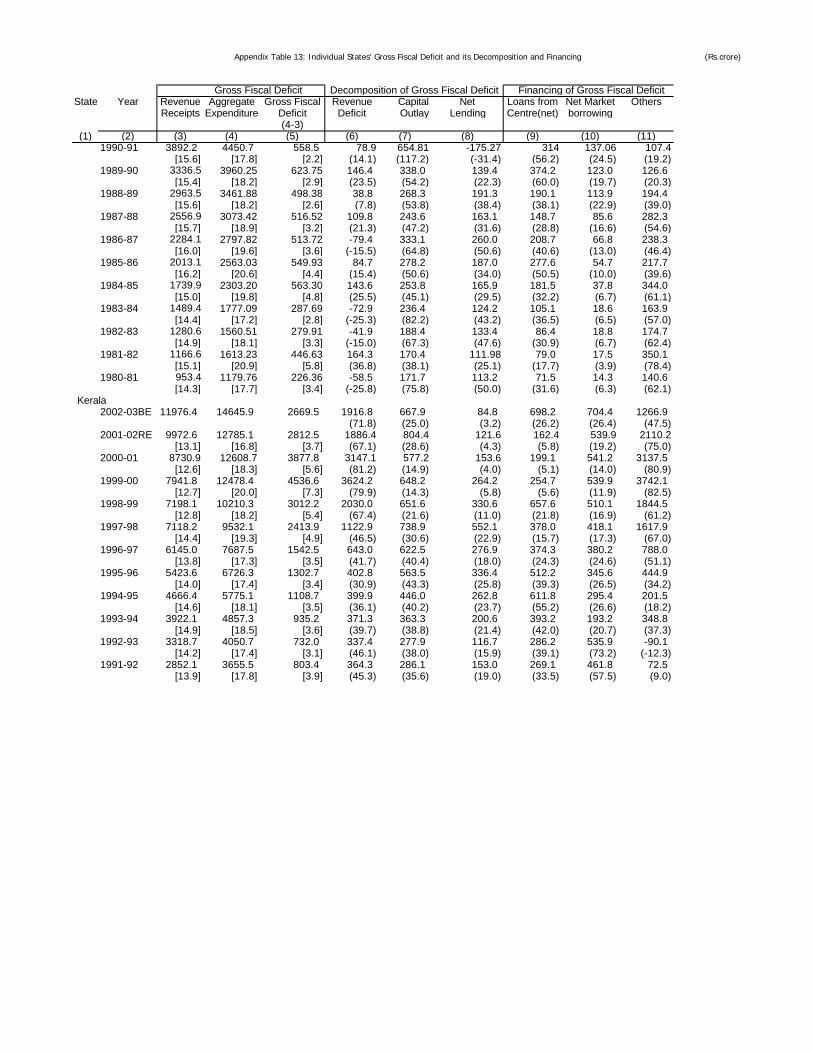
Appendix Table 13: Individual States' Gross Fiscal Deficit and its Decomposition and Financing (Rs.crore)
State Year Revenue Aggregate Gross Fiscal Revenue Capital Net Loans from Net Market OthersReceipts Expenditure Deficit Deficit Outlay Lending Centre(net) borrowing
(4-3)(1) (2) (3) (4) (5) (6) (7) (8) (9) (10) (11)
Gross Fiscal Deficit Decomposition of Gross Fiscal Deficit Financing of Gross Fiscal Deficit
1990-91 3892.2 4450.7 558.5 78.9 654.81 -175.27 314 137.06 107.4[15.6] [17.8] [2.2] (14.1) (117.2) (-31.4) (56.2) (24.5) (19.2)
1989-90 3336.5 3960.25 623.75 146.4 338.0 139.4 374.2 123.0 126.6[15.4] [18.2] [2.9] (23.5) (54.2) (22.3) (60.0) (19.7) (20.3)
1988-89 2963.5 3461.88 498.38 38.8 268.3 191.3 190.1 113.9 194.4[15.6] [18.2] [2.6] (7.8) (53.8) (38.4) (38.1) (22.9) (39.0)
1987-88 2556.9 3073.42 516.52 109.8 243.6 163.1 148.7 85.6 282.3[15.7] [18.9] [3.2] (21.3) (47.2) (31.6) (28.8) (16.6) (54.6)
1986-87 2284.1 2797.82 513.72 -79.4 333.1 260.0 208.7 66.8 238.3[16.0] [19.6] [3.6] (-15.5) (64.8) (50.6) (40.6) (13.0) (46.4)
1985-86 2013.1 2563.03 549.93 84.7 278.2 187.0 277.6 54.7 217.7[16.2] [20.6] [4.4] (15.4) (50.6) (34.0) (50.5) (10.0) (39.6)
1984-85 1739.9 2303.20 563.30 143.6 253.8 165.9 181.5 37.8 344.0[15.0] [19.8] [4.8] (25.5) (45.1) (29.5) (32.2) (6.7) (61.1)
1983-84 1489.4 1777.09 287.69 -72.9 236.4 124.2 105.1 18.6 163.9[14.4] [17.2] [2.8] (-25.3) (82.2) (43.2) (36.5) (6.5) (57.0)
1982-83 1280.6 1560.51 279.91 -41.9 188.4 133.4 86.4 18.8 174.7[14.9] [18.1] [3.3] (-15.0) (67.3) (47.6) (30.9) (6.7) (62.4)
1981-82 1166.6 1613.23 446.63 164.3 170.4 111.98 79.0 17.5 350.1[15.1] [20.9] [5.8] (36.8) (38.1) (25.1) (17.7) (3.9) (78.4)
1980-81 953.4 1179.76 226.36 -58.5 171.7 113.2 71.5 14.3 140.6[14.3] [17.7] [3.4] (-25.8) (75.8) (50.0) (31.6) (6.3) (62.1)
Kerala2002-03BE 11976.4 14645.9 2669.5 1916.8 667.9 84.8 698.2 704.4 1266.9
(71.8) (25.0) (3.2) (26.2) (26.4) (47.5)2001-02RE 9972.6 12785.1 2812.5 1886.4 804.4 121.6 162.4 539.9 2110.2
[13.1] [16.8] [3.7] (67.1) (28.6) (4.3) (5.8) (19.2) (75.0)2000-01 8730.9 12608.7 3877.8 3147.1 577.2 153.6 199.1 541.2 3137.5
[12.6] [18.3] [5.6] (81.2) (14.9) (4.0) (5.1) (14.0) (80.9)1999-00 7941.8 12478.4 4536.6 3624.2 648.2 264.2 254.7 539.9 3742.1
[12.7] [20.0] [7.3] (79.9) (14.3) (5.8) (5.6) (11.9) (82.5)1998-99 7198.1 10210.3 3012.2 2030.0 651.6 330.6 657.6 510.1 1844.5
[12.8] [18.2] [5.4] (67.4) (21.6) (11.0) (21.8) (16.9) (61.2)1997-98 7118.2 9532.1 2413.9 1122.9 738.9 552.1 378.0 418.1 1617.9
[14.4] [19.3] [4.9] (46.5) (30.6) (22.9) (15.7) (17.3) (67.0)1996-97 6145.0 7687.5 1542.5 643.0 622.5 276.9 374.3 380.2 788.0
[13.8] [17.3] [3.5] (41.7) (40.4) (18.0) (24.3) (24.6) (51.1)1995-96 5423.6 6726.3 1302.7 402.8 563.5 336.4 512.2 345.6 444.9
[14.0] [17.4] [3.4] (30.9) (43.3) (25.8) (39.3) (26.5) (34.2)1994-95 4666.4 5775.1 1108.7 399.9 446.0 262.8 611.8 295.4 201.5
[14.6] [18.1] [3.5] (36.1) (40.2) (23.7) (55.2) (26.6) (18.2)1993-94 3922.1 4857.3 935.2 371.3 363.3 200.6 393.2 193.2 348.8
[14.9] [18.5] [3.6] (39.7) (38.8) (21.4) (42.0) (20.7) (37.3)1992-93 3318.7 4050.7 732.0 337.4 277.9 116.7 286.2 535.9 -90.1
[14.2] [17.4] [3.1] (46.1) (38.0) (15.9) (39.1) (73.2) (-12.3)1991-92 2852.1 3655.5 803.4 364.3 286.1 153.0 269.1 461.8 72.5
[13.9] [17.8] [3.9] (45.3) (35.6) (19.0) (33.5) (57.5) (9.0)
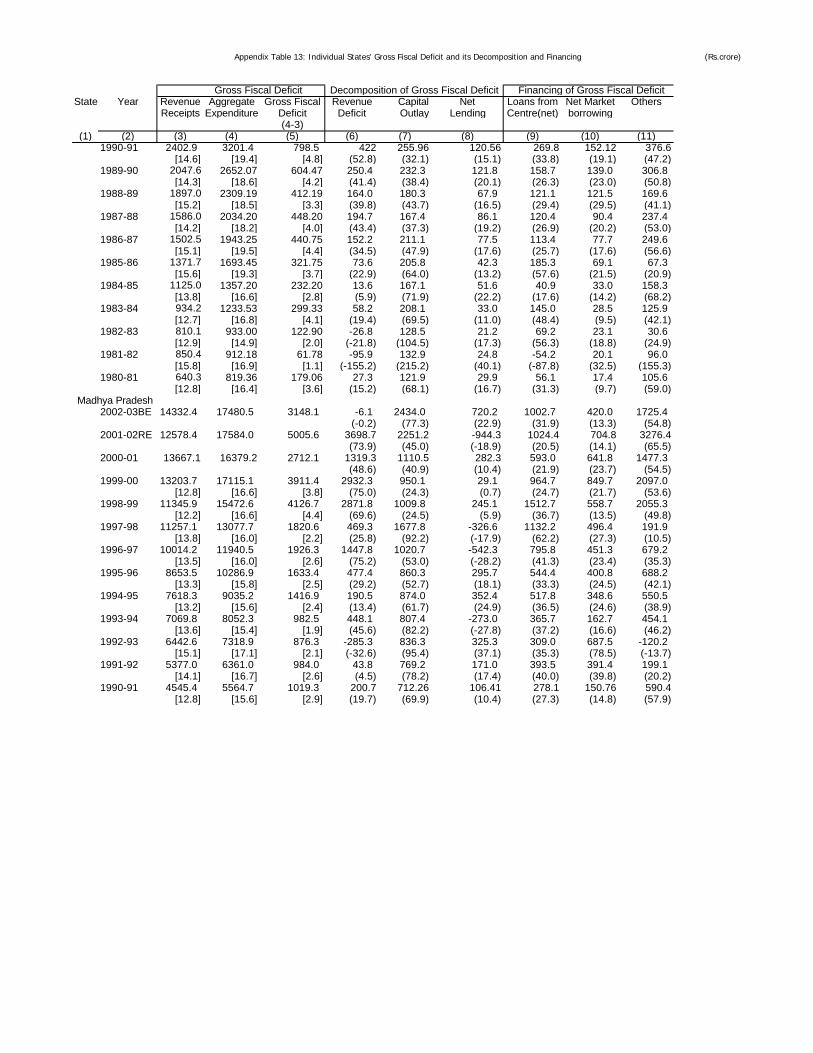
Appendix Table 13: Individual States' Gross Fiscal Deficit and its Decomposition and Financing (Rs.crore)
State Year Revenue Aggregate Gross Fiscal Revenue Capital Net Loans from Net Market OthersReceipts Expenditure Deficit Deficit Outlay Lending Centre(net) borrowing
(4-3)(1) (2) (3) (4) (5) (6) (7) (8) (9) (10) (11)
Gross Fiscal Deficit Decomposition of Gross Fiscal Deficit Financing of Gross Fiscal Deficit
1990-91 2402.9 3201.4 798.5 422 255.96 120.56 269.8 152.12 376.6[14.6] [19.4] [4.8] (52.8) (32.1) (15.1) (33.8) (19.1) (47.2)
1989-90 2047.6 2652.07 604.47 250.4 232.3 121.8 158.7 139.0 306.8[14.3] [18.6] [4.2] (41.4) (38.4) (20.1) (26.3) (23.0) (50.8)
1988-89 1897.0 2309.19 412.19 164.0 180.3 67.9 121.1 121.5 169.6[15.2] [18.5] [3.3] (39.8) (43.7) (16.5) (29.4) (29.5) (41.1)
1987-88 1586.0 2034.20 448.20 194.7 167.4 86.1 120.4 90.4 237.4[14.2] [18.2] [4.0] (43.4) (37.3) (19.2) (26.9) (20.2) (53.0)
1986-87 1502.5 1943.25 440.75 152.2 211.1 77.5 113.4 77.7 249.6[15.1] [19.5] [4.4] (34.5) (47.9) (17.6) (25.7) (17.6) (56.6)
1985-86 1371.7 1693.45 321.75 73.6 205.8 42.3 185.3 69.1 67.3[15.6] [19.3] [3.7] (22.9) (64.0) (13.2) (57.6) (21.5) (20.9)
1984-85 1125.0 1357.20 232.20 13.6 167.1 51.6 40.9 33.0 158.3[13.8] [16.6] [2.8] (5.9) (71.9) (22.2) (17.6) (14.2) (68.2)
1983-84 934.2 1233.53 299.33 58.2 208.1 33.0 145.0 28.5 125.9[12.7] [16.8] [4.1] (19.4) (69.5) (11.0) (48.4) (9.5) (42.1)
1982-83 810.1 933.00 122.90 -26.8 128.5 21.2 69.2 23.1 30.6[12.9] [14.9] [2.0] (-21.8) (104.5) (17.3) (56.3) (18.8) (24.9)
1981-82 850.4 912.18 61.78 -95.9 132.9 24.8 -54.2 20.1 96.0[15.8] [16.9] [1.1] (-155.2) (215.2) (40.1) (-87.8) (32.5) (155.3)
1980-81 640.3 819.36 179.06 27.3 121.9 29.9 56.1 17.4 105.6[12.8] [16.4] [3.6] (15.2) (68.1) (16.7) (31.3) (9.7) (59.0)
Madhya Pradesh2002-03BE 14332.4 17480.5 3148.1 -6.1 2434.0 720.2 1002.7 420.0 1725.4
(-0.2) (77.3) (22.9) (31.9) (13.3) (54.8)2001-02RE 12578.4 17584.0 5005.6 3698.7 2251.2 -944.3 1024.4 704.8 3276.4
(73.9) (45.0) (-18.9) (20.5) (14.1) (65.5)2000-01 13667.1 16379.2 2712.1 1319.3 1110.5 282.3 593.0 641.8 1477.3
(48.6) (40.9) (10.4) (21.9) (23.7) (54.5)1999-00 13203.7 17115.1 3911.4 2932.3 950.1 29.1 964.7 849.7 2097.0
[12.8] [16.6] [3.8] (75.0) (24.3) (0.7) (24.7) (21.7) (53.6)1998-99 11345.9 15472.6 4126.7 2871.8 1009.8 245.1 1512.7 558.7 2055.3
[12.2] [16.6] [4.4] (69.6) (24.5) (5.9) (36.7) (13.5) (49.8)1997-98 11257.1 13077.7 1820.6 469.3 1677.8 -326.6 1132.2 496.4 191.9
[13.8] [16.0] [2.2] (25.8) (92.2) (-17.9) (62.2) (27.3) (10.5)1996-97 10014.2 11940.5 1926.3 1447.8 1020.7 -542.3 795.8 451.3 679.2
[13.5] [16.0] [2.6] (75.2) (53.0) (-28.2) (41.3) (23.4) (35.3)1995-96 8653.5 10286.9 1633.4 477.4 860.3 295.7 544.4 400.8 688.2
[13.3] [15.8] [2.5] (29.2) (52.7) (18.1) (33.3) (24.5) (42.1)1994-95 7618.3 9035.2 1416.9 190.5 874.0 352.4 517.8 348.6 550.5
[13.2] [15.6] [2.4] (13.4) (61.7) (24.9) (36.5) (24.6) (38.9)1993-94 7069.8 8052.3 982.5 448.1 807.4 -273.0 365.7 162.7 454.1
[13.6] [15.4] [1.9] (45.6) (82.2) (-27.8) (37.2) (16.6) (46.2)1992-93 6442.6 7318.9 876.3 -285.3 836.3 325.3 309.0 687.5 -120.2
[15.1] [17.1] [2.1] (-32.6) (95.4) (37.1) (35.3) (78.5) (-13.7)1991-92 5377.0 6361.0 984.0 43.8 769.2 171.0 393.5 391.4 199.1
[14.1] [16.7] [2.6] (4.5) (78.2) (17.4) (40.0) (39.8) (20.2)1990-91 4545.4 5564.7 1019.3 200.7 712.26 106.41 278.1 150.76 590.4
[12.8] [15.6] [2.9] (19.7) (69.9) (10.4) (27.3) (14.8) (57.9)
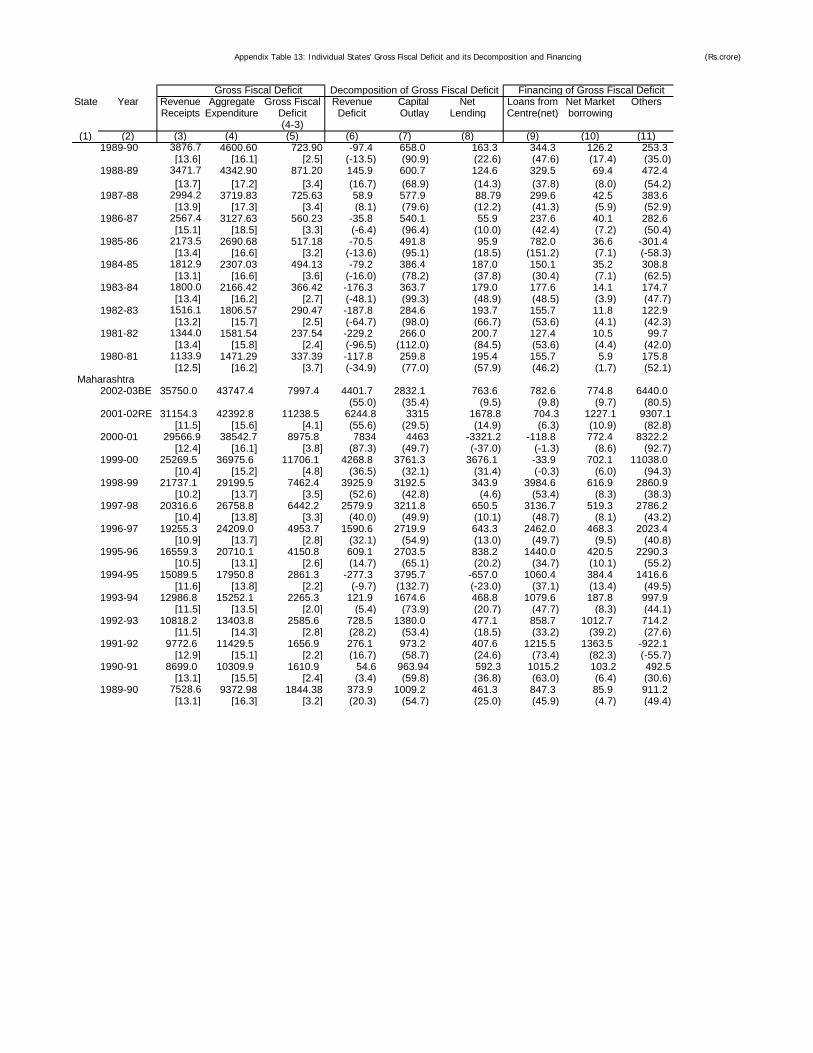
Appendix Table 13: Individual States' Gross Fiscal Deficit and its Decomposition and Financing (Rs.crore)
State Year Revenue Aggregate Gross Fiscal Revenue Capital Net Loans from Net Market OthersReceipts Expenditure Deficit Deficit Outlay Lending Centre(net) borrowing
(4-3)(1) (2) (3) (4) (5) (6) (7) (8) (9) (10) (11)
Gross Fiscal Deficit Decomposition of Gross Fiscal Deficit Financing of Gross Fiscal Deficit
1989-90 3876.7 4600.60 723.90 -97.4 658.0 163.3 344.3 126.2 253.3[13.6] [16.1] [2.5] (-13.5) (90.9) (22.6) (47.6) (17.4) (35.0)
1988-89 3471.7 4342.90 871.20 145.9 600.7 124.6 329.5 69.4 472.4[13.7] [17.2] [3.4] (16.7) (68.9) (14.3) (37.8) (8.0) (54.2)
1987-88 2994.2 3719.83 725.63 58.9 577.9 88.79 299.6 42.5 383.6[13.9] [17.3] [3.4] (8.1) (79.6) (12.2) (41.3) (5.9) (52.9)
1986-87 2567.4 3127.63 560.23 -35.8 540.1 55.9 237.6 40.1 282.6[15.1] [18.5] [3.3] (-6.4) (96.4) (10.0) (42.4) (7.2) (50.4)
1985-86 2173.5 2690.68 517.18 -70.5 491.8 95.9 782.0 36.6 -301.4[13.4] [16.6] [3.2] (-13.6) (95.1) (18.5) (151.2) (7.1) (-58.3)
1984-85 1812.9 2307.03 494.13 -79.2 386.4 187.0 150.1 35.2 308.8[13.1] [16.6] [3.6] (-16.0) (78.2) (37.8) (30.4) (7.1) (62.5)
1983-84 1800.0 2166.42 366.42 -176.3 363.7 179.0 177.6 14.1 174.7[13.4] [16.2] [2.7] (-48.1) (99.3) (48.9) (48.5) (3.9) (47.7)
1982-83 1516.1 1806.57 290.47 -187.8 284.6 193.7 155.7 11.8 122.9[13.2] [15.7] [2.5] (-64.7) (98.0) (66.7) (53.6) (4.1) (42.3)
1981-82 1344.0 1581.54 237.54 -229.2 266.0 200.7 127.4 10.5 99.7[13.4] [15.8] [2.4] (-96.5) (112.0) (84.5) (53.6) (4.4) (42.0)
1980-81 1133.9 1471.29 337.39 -117.8 259.8 195.4 155.7 5.9 175.8[12.5] [16.2] [3.7] (-34.9) (77.0) (57.9) (46.2) (1.7) (52.1)
Maharashtra2002-03BE 35750.0 43747.4 7997.4 4401.7 2832.1 763.6 782.6 774.8 6440.0
(55.0) (35.4) (9.5) (9.8) (9.7) (80.5)2001-02RE 31154.3 42392.8 11238.5 6244.8 3315 1678.8 704.3 1227.1 9307.1
[11.5] [15.6] [4.1] (55.6) (29.5) (14.9) (6.3) (10.9) (82.8)2000-01 29566.9 38542.7 8975.8 7834 4463 -3321.2 -118.8 772.4 8322.2
[12.4] [16.1] [3.8] (87.3) (49.7) (-37.0) (-1.3) (8.6) (92.7)1999-00 25269.5 36975.6 11706.1 4268.8 3761.3 3676.1 -33.9 702.1 11038.0
[10.4] [15.2] [4.8] (36.5) (32.1) (31.4) (-0.3) (6.0) (94.3)1998-99 21737.1 29199.5 7462.4 3925.9 3192.5 343.9 3984.6 616.9 2860.9
[10.2] [13.7] [3.5] (52.6) (42.8) (4.6) (53.4) (8.3) (38.3)1997-98 20316.6 26758.8 6442.2 2579.9 3211.8 650.5 3136.7 519.3 2786.2
[10.4] [13.8] [3.3] (40.0) (49.9) (10.1) (48.7) (8.1) (43.2)1996-97 19255.3 24209.0 4953.7 1590.6 2719.9 643.3 2462.0 468.3 2023.4
[10.9] [13.7] [2.8] (32.1) (54.9) (13.0) (49.7) (9.5) (40.8)1995-96 16559.3 20710.1 4150.8 609.1 2703.5 838.2 1440.0 420.5 2290.3
[10.5] [13.1] [2.6] (14.7) (65.1) (20.2) (34.7) (10.1) (55.2)1994-95 15089.5 17950.8 2861.3 -277.3 3795.7 -657.0 1060.4 384.4 1416.6
[11.6] [13.8] [2.2] (-9.7) (132.7) (-23.0) (37.1) (13.4) (49.5)1993-94 12986.8 15252.1 2265.3 121.9 1674.6 468.8 1079.6 187.8 997.9
[11.5] [13.5] [2.0] (5.4) (73.9) (20.7) (47.7) (8.3) (44.1)1992-93 10818.2 13403.8 2585.6 728.5 1380.0 477.1 858.7 1012.7 714.2
[11.5] [14.3] [2.8] (28.2) (53.4) (18.5) (33.2) (39.2) (27.6)1991-92 9772.6 11429.5 1656.9 276.1 973.2 407.6 1215.5 1363.5 -922.1
[12.9] [15.1] [2.2] (16.7) (58.7) (24.6) (73.4) (82.3) (-55.7)1990-91 8699.0 10309.9 1610.9 54.6 963.94 592.3 1015.2 103.2 492.5
[13.1] [15.5] [2.4] (3.4) (59.8) (36.8) (63.0) (6.4) (30.6)1989-90 7528.6 9372.98 1844.38 373.9 1009.2 461.3 847.3 85.9 911.2
[13.1] [16.3] [3.2] (20.3) (54.7) (25.0) (45.9) (4.7) (49.4)
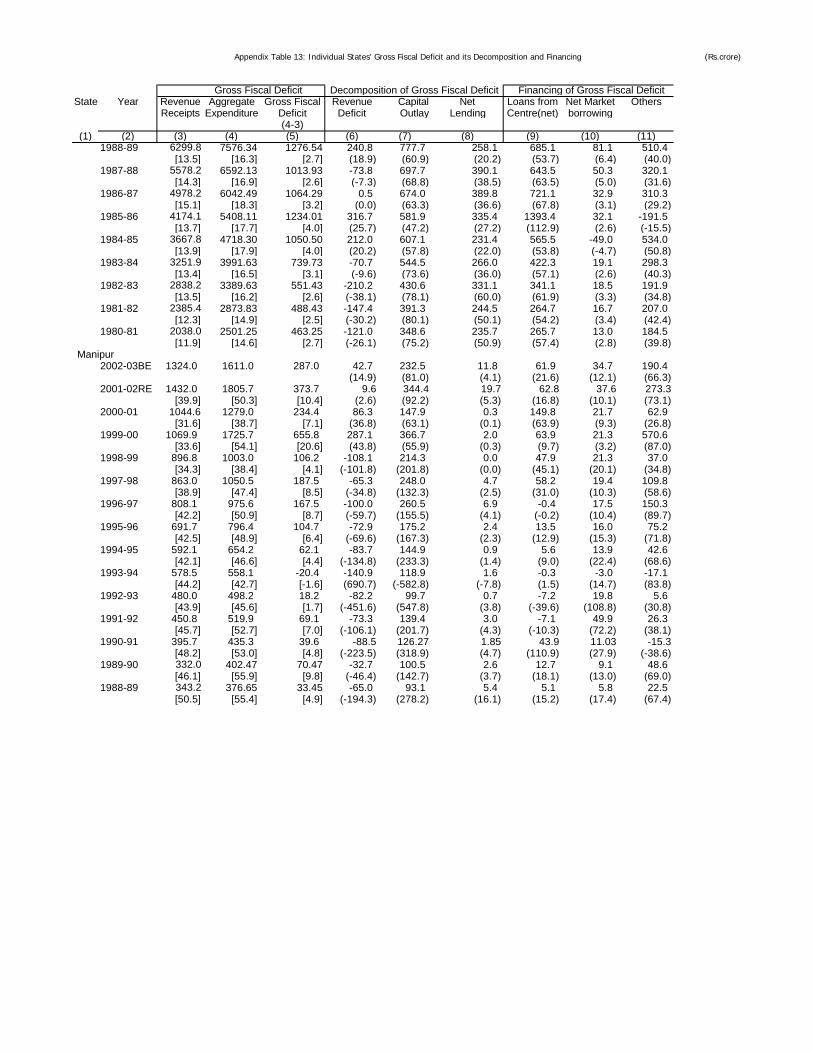
Appendix Table 13: Individual States' Gross Fiscal Deficit and its Decomposition and Financing (Rs.crore)
State Year Revenue Aggregate Gross Fiscal Revenue Capital Net Loans from Net Market OthersReceipts Expenditure Deficit Deficit Outlay Lending Centre(net) borrowing
(4-3)(1) (2) (3) (4) (5) (6) (7) (8) (9) (10) (11)
Gross Fiscal Deficit Decomposition of Gross Fiscal Deficit Financing of Gross Fiscal Deficit
1988-89 6299.8 7576.34 1276.54 240.8 777.7 258.1 685.1 81.1 510.4[13.5] [16.3] [2.7] (18.9) (60.9) (20.2) (53.7) (6.4) (40.0)
1987-88 5578.2 6592.13 1013.93 -73.8 697.7 390.1 643.5 50.3 320.1[14.3] [16.9] [2.6] (-7.3) (68.8) (38.5) (63.5) (5.0) (31.6)
1986-87 4978.2 6042.49 1064.29 0.5 674.0 389.8 721.1 32.9 310.3[15.1] [18.3] [3.2] (0.0) (63.3) (36.6) (67.8) (3.1) (29.2)
1985-86 4174.1 5408.11 1234.01 316.7 581.9 335.4 1393.4 32.1 -191.5[13.7] [17.7] [4.0] (25.7) (47.2) (27.2) (112.9) (2.6) (-15.5)
1984-85 3667.8 4718.30 1050.50 212.0 607.1 231.4 565.5 -49.0 534.0[13.9] [17.9] [4.0] (20.2) (57.8) (22.0) (53.8) (-4.7) (50.8)
1983-84 3251.9 3991.63 739.73 -70.7 544.5 266.0 422.3 19.1 298.3[13.4] [16.5] [3.1] (-9.6) (73.6) (36.0) (57.1) (2.6) (40.3)
1982-83 2838.2 3389.63 551.43 -210.2 430.6 331.1 341.1 18.5 191.9[13.5] [16.2] [2.6] (-38.1) (78.1) (60.0) (61.9) (3.3) (34.8)
1981-82 2385.4 2873.83 488.43 -147.4 391.3 244.5 264.7 16.7 207.0[12.3] [14.9] [2.5] (-30.2) (80.1) (50.1) (54.2) (3.4) (42.4)
1980-81 2038.0 2501.25 463.25 -121.0 348.6 235.7 265.7 13.0 184.5[11.9] [14.6] [2.7] (-26.1) (75.2) (50.9) (57.4) (2.8) (39.8)
Manipur2002-03BE 1324.0 1611.0 287.0 42.7 232.5 11.8 61.9 34.7 190.4
(14.9) (81.0) (4.1) (21.6) (12.1) (66.3)2001-02RE 1432.0 1805.7 373.7 9.6 344.4 19.7 62.8 37.6 273.3
[39.9] [50.3] [10.4] (2.6) (92.2) (5.3) (16.8) (10.1) (73.1)2000-01 1044.6 1279.0 234.4 86.3 147.9 0.3 149.8 21.7 62.9
[31.6] [38.7] [7.1] (36.8) (63.1) (0.1) (63.9) (9.3) (26.8)1999-00 1069.9 1725.7 655.8 287.1 366.7 2.0 63.9 21.3 570.6
[33.6] [54.1] [20.6] (43.8) (55.9) (0.3) (9.7) (3.2) (87.0)1998-99 896.8 1003.0 106.2 -108.1 214.3 0.0 47.9 21.3 37.0
[34.3] [38.4] [4.1] (-101.8) (201.8) (0.0) (45.1) (20.1) (34.8)1997-98 863.0 1050.5 187.5 -65.3 248.0 4.7 58.2 19.4 109.8
[38.9] [47.4] [8.5] (-34.8) (132.3) (2.5) (31.0) (10.3) (58.6)1996-97 808.1 975.6 167.5 -100.0 260.5 6.9 -0.4 17.5 150.3
[42.2] [50.9] [8.7] (-59.7) (155.5) (4.1) (-0.2) (10.4) (89.7)1995-96 691.7 796.4 104.7 -72.9 175.2 2.4 13.5 16.0 75.2
[42.5] [48.9] [6.4] (-69.6) (167.3) (2.3) (12.9) (15.3) (71.8)1994-95 592.1 654.2 62.1 -83.7 144.9 0.9 5.6 13.9 42.6
[42.1] [46.6] [4.4] (-134.8) (233.3) (1.4) (9.0) (22.4) (68.6)1993-94 578.5 558.1 -20.4 -140.9 118.9 1.6 -0.3 -3.0 -17.1
[44.2] [42.7] [-1.6] (690.7) (-582.8) (-7.8) (1.5) (14.7) (83.8)1992-93 480.0 498.2 18.2 -82.2 99.7 0.7 -7.2 19.8 5.6
[43.9] [45.6] [1.7] (-451.6) (547.8) (3.8) (-39.6) (108.8) (30.8)1991-92 450.8 519.9 69.1 -73.3 139.4 3.0 -7.1 49.9 26.3
[45.7] [52.7] [7.0] (-106.1) (201.7) (4.3) (-10.3) (72.2) (38.1)1990-91 395.7 435.3 39.6 -88.5 126.27 1.85 43.9 11.03 -15.3
[48.2] [53.0] [4.8] (-223.5) (318.9) (4.7) (110.9) (27.9) (-38.6)1989-90 332.0 402.47 70.47 -32.7 100.5 2.6 12.7 9.1 48.6
[46.1] [55.9] [9.8] (-46.4) (142.7) (3.7) (18.1) (13.0) (69.0)1988-89 343.2 376.65 33.45 -65.0 93.1 5.4 5.1 5.8 22.5
[50.5] [55.4] [4.9] (-194.3) (278.2) (16.1) (15.2) (17.4) (67.4)
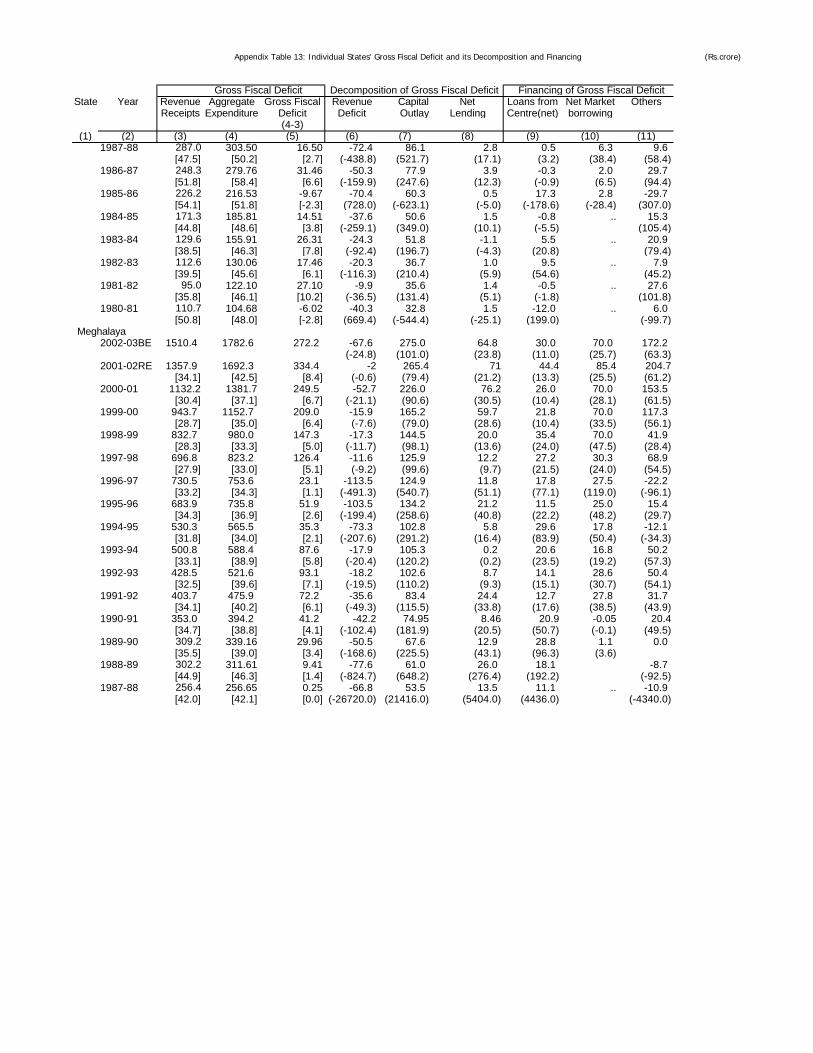
Appendix Table 13: Individual States' Gross Fiscal Deficit and its Decomposition and Financing (Rs.crore)
State Year Revenue Aggregate Gross Fiscal Revenue Capital Net Loans from Net Market OthersReceipts Expenditure Deficit Deficit Outlay Lending Centre(net) borrowing
(4-3)(1) (2) (3) (4) (5) (6) (7) (8) (9) (10) (11)
Gross Fiscal Deficit Decomposition of Gross Fiscal Deficit Financing of Gross Fiscal Deficit
1987-88 287.0 303.50 16.50 -72.4 86.1 2.8 0.5 6.3 9.6[47.5] [50.2] [2.7] (-438.8) (521.7) (17.1) (3.2) (38.4) (58.4)
1986-87 248.3 279.76 31.46 -50.3 77.9 3.9 -0.3 2.0 29.7[51.8] [58.4] [6.6] (-159.9) (247.6) (12.3) (-0.9) (6.5) (94.4)
1985-86 226.2 216.53 -9.67 -70.4 60.3 0.5 17.3 2.8 -29.7[54.1] [51.8] [-2.3] (728.0) (-623.1) (-5.0) (-178.6) (-28.4) (307.0)
1984-85 171.3 185.81 14.51 -37.6 50.6 1.5 -0.8 .. 15.3[44.8] [48.6] [3.8] (-259.1) (349.0) (10.1) (-5.5) (105.4)
1983-84 129.6 155.91 26.31 -24.3 51.8 -1.1 5.5 .. 20.9[38.5] [46.3] [7.8] (-92.4) (196.7) (-4.3) (20.8) (79.4)
1982-83 112.6 130.06 17.46 -20.3 36.7 1.0 9.5 .. 7.9[39.5] [45.6] [6.1] (-116.3) (210.4) (5.9) (54.6) (45.2)
1981-82 95.0 122.10 27.10 -9.9 35.6 1.4 -0.5 .. 27.6[35.8] [46.1] [10.2] (-36.5) (131.4) (5.1) (-1.8) (101.8)
1980-81 110.7 104.68 -6.02 -40.3 32.8 1.5 -12.0 .. 6.0[50.8] [48.0] [-2.8] (669.4) (-544.4) (-25.1) (199.0) (-99.7)
Meghalaya2002-03BE 1510.4 1782.6 272.2 -67.6 275.0 64.8 30.0 70.0 172.2
(-24.8) (101.0) (23.8) (11.0) (25.7) (63.3)2001-02RE 1357.9 1692.3 334.4 -2 265.4 71 44.4 85.4 204.7
[34.1] [42.5] [8.4] (-0.6) (79.4) (21.2) (13.3) (25.5) (61.2)2000-01 1132.2 1381.7 249.5 -52.7 226.0 76.2 26.0 70.0 153.5
[30.4] [37.1] [6.7] (-21.1) (90.6) (30.5) (10.4) (28.1) (61.5)1999-00 943.7 1152.7 209.0 -15.9 165.2 59.7 21.8 70.0 117.3
[28.7] [35.0] [6.4] (-7.6) (79.0) (28.6) (10.4) (33.5) (56.1)1998-99 832.7 980.0 147.3 -17.3 144.5 20.0 35.4 70.0 41.9
[28.3] [33.3] [5.0] (-11.7) (98.1) (13.6) (24.0) (47.5) (28.4)1997-98 696.8 823.2 126.4 -11.6 125.9 12.2 27.2 30.3 68.9
[27.9] [33.0] [5.1] (-9.2) (99.6) (9.7) (21.5) (24.0) (54.5)1996-97 730.5 753.6 23.1 -113.5 124.9 11.8 17.8 27.5 -22.2
[33.2] [34.3] [1.1] (-491.3) (540.7) (51.1) (77.1) (119.0) (-96.1)1995-96 683.9 735.8 51.9 -103.5 134.2 21.2 11.5 25.0 15.4
[34.3] [36.9] [2.6] (-199.4) (258.6) (40.8) (22.2) (48.2) (29.7)1994-95 530.3 565.5 35.3 -73.3 102.8 5.8 29.6 17.8 -12.1
[31.8] [34.0] [2.1] (-207.6) (291.2) (16.4) (83.9) (50.4) (-34.3)1993-94 500.8 588.4 87.6 -17.9 105.3 0.2 20.6 16.8 50.2
[33.1] [38.9] [5.8] (-20.4) (120.2) (0.2) (23.5) (19.2) (57.3)1992-93 428.5 521.6 93.1 -18.2 102.6 8.7 14.1 28.6 50.4
[32.5] [39.6] [7.1] (-19.5) (110.2) (9.3) (15.1) (30.7) (54.1)1991-92 403.7 475.9 72.2 -35.6 83.4 24.4 12.7 27.8 31.7
[34.1] [40.2] [6.1] (-49.3) (115.5) (33.8) (17.6) (38.5) (43.9)1990-91 353.0 394.2 41.2 -42.2 74.95 8.46 20.9 -0.05 20.4
[34.7] [38.8] [4.1] (-102.4) (181.9) (20.5) (50.7) (-0.1) (49.5)1989-90 309.2 339.16 29.96 -50.5 67.6 12.9 28.8 1.1 0.0
[35.5] [39.0] [3.4] (-168.6) (225.5) (43.1) (96.3) (3.6)1988-89 302.2 311.61 9.41 -77.6 61.0 26.0 18.1 -8.7
[44.9] [46.3] [1.4] (-824.7) (648.2) (276.4) (192.2) (-92.5)1987-88 256.4 256.65 0.25 -66.8 53.5 13.5 11.1 .. -10.9
[42.0] [42.1] [0.0] (-26720.0) (21416.0) (5404.0) (4436.0) (-4340.0)
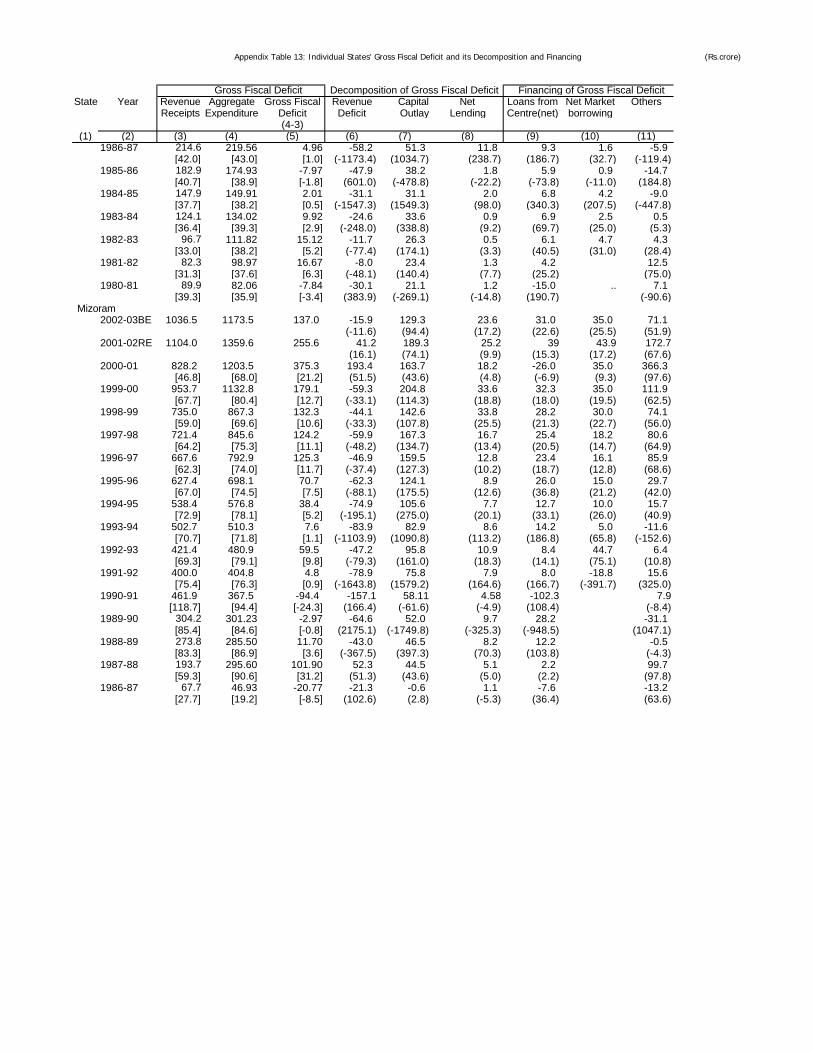
Appendix Table 13: Individual States' Gross Fiscal Deficit and its Decomposition and Financing (Rs.crore)
State Year Revenue Aggregate Gross Fiscal Revenue Capital Net Loans from Net Market OthersReceipts Expenditure Deficit Deficit Outlay Lending Centre(net) borrowing
(4-3)(1) (2) (3) (4) (5) (6) (7) (8) (9) (10) (11)
Gross Fiscal Deficit Decomposition of Gross Fiscal Deficit Financing of Gross Fiscal Deficit
1986-87 214.6 219.56 4.96 -58.2 51.3 11.8 9.3 1.6 -5.9[42.0] [43.0] [1.0] (-1173.4) (1034.7) (238.7) (186.7) (32.7) (-119.4)
1985-86 182.9 174.93 -7.97 -47.9 38.2 1.8 5.9 0.9 -14.7[40.7] [38.9] [-1.8] (601.0) (-478.8) (-22.2) (-73.8) (-11.0) (184.8)
1984-85 147.9 149.91 2.01 -31.1 31.1 2.0 6.8 4.2 -9.0[37.7] [38.2] [0.5] (-1547.3) (1549.3) (98.0) (340.3) (207.5) (-447.8)
1983-84 124.1 134.02 9.92 -24.6 33.6 0.9 6.9 2.5 0.5[36.4] [39.3] [2.9] (-248.0) (338.8) (9.2) (69.7) (25.0) (5.3)
1982-83 96.7 111.82 15.12 -11.7 26.3 0.5 6.1 4.7 4.3[33.0] [38.2] [5.2] (-77.4) (174.1) (3.3) (40.5) (31.0) (28.4)
1981-82 82.3 98.97 16.67 -8.0 23.4 1.3 4.2 12.5[31.3] [37.6] [6.3] (-48.1) (140.4) (7.7) (25.2) (75.0)
1980-81 89.9 82.06 -7.84 -30.1 21.1 1.2 -15.0 .. 7.1[39.3] [35.9] [-3.4] (383.9) (-269.1) (-14.8) (190.7) (-90.6)
Mizoram2002-03BE 1036.5 1173.5 137.0 -15.9 129.3 23.6 31.0 35.0 71.1
(-11.6) (94.4) (17.2) (22.6) (25.5) (51.9)2001-02RE 1104.0 1359.6 255.6 41.2 189.3 25.2 39 43.9 172.7
(16.1) (74.1) (9.9) (15.3) (17.2) (67.6)2000-01 828.2 1203.5 375.3 193.4 163.7 18.2 -26.0 35.0 366.3
[46.8] [68.0] [21.2] (51.5) (43.6) (4.8) (-6.9) (9.3) (97.6)1999-00 953.7 1132.8 179.1 -59.3 204.8 33.6 32.3 35.0 111.9
[67.7] [80.4] [12.7] (-33.1) (114.3) (18.8) (18.0) (19.5) (62.5)1998-99 735.0 867.3 132.3 -44.1 142.6 33.8 28.2 30.0 74.1
[59.0] [69.6] [10.6] (-33.3) (107.8) (25.5) (21.3) (22.7) (56.0)1997-98 721.4 845.6 124.2 -59.9 167.3 16.7 25.4 18.2 80.6
[64.2] [75.3] [11.1] (-48.2) (134.7) (13.4) (20.5) (14.7) (64.9)1996-97 667.6 792.9 125.3 -46.9 159.5 12.8 23.4 16.1 85.9
[62.3] [74.0] [11.7] (-37.4) (127.3) (10.2) (18.7) (12.8) (68.6)1995-96 627.4 698.1 70.7 -62.3 124.1 8.9 26.0 15.0 29.7
[67.0] [74.5] [7.5] (-88.1) (175.5) (12.6) (36.8) (21.2) (42.0)1994-95 538.4 576.8 38.4 -74.9 105.6 7.7 12.7 10.0 15.7
[72.9] [78.1] [5.2] (-195.1) (275.0) (20.1) (33.1) (26.0) (40.9)1993-94 502.7 510.3 7.6 -83.9 82.9 8.6 14.2 5.0 -11.6
[70.7] [71.8] [1.1] (-1103.9) (1090.8) (113.2) (186.8) (65.8) (-152.6)1992-93 421.4 480.9 59.5 -47.2 95.8 10.9 8.4 44.7 6.4
[69.3] [79.1] [9.8] (-79.3) (161.0) (18.3) (14.1) (75.1) (10.8)1991-92 400.0 404.8 4.8 -78.9 75.8 7.9 8.0 -18.8 15.6
[75.4] [76.3] [0.9] (-1643.8) (1579.2) (164.6) (166.7) (-391.7) (325.0)1990-91 461.9 367.5 -94.4 -157.1 58.11 4.58 -102.3 7.9
[118.7] [94.4] [-24.3] (166.4) (-61.6) (-4.9) (108.4) (-8.4)1989-90 304.2 301.23 -2.97 -64.6 52.0 9.7 28.2 -31.1
[85.4] [84.6] [-0.8] (2175.1) (-1749.8) (-325.3) (-948.5) (1047.1)1988-89 273.8 285.50 11.70 -43.0 46.5 8.2 12.2 -0.5
[83.3] [86.9] [3.6] (-367.5) (397.3) (70.3) (103.8) (-4.3)1987-88 193.7 295.60 101.90 52.3 44.5 5.1 2.2 99.7
[59.3] [90.6] [31.2] (51.3) (43.6) (5.0) (2.2) (97.8)1986-87 67.7 46.93 -20.77 -21.3 -0.6 1.1 -7.6 -13.2
[27.7] [19.2] [-8.5] (102.6) (2.8) (-5.3) (36.4) (63.6)
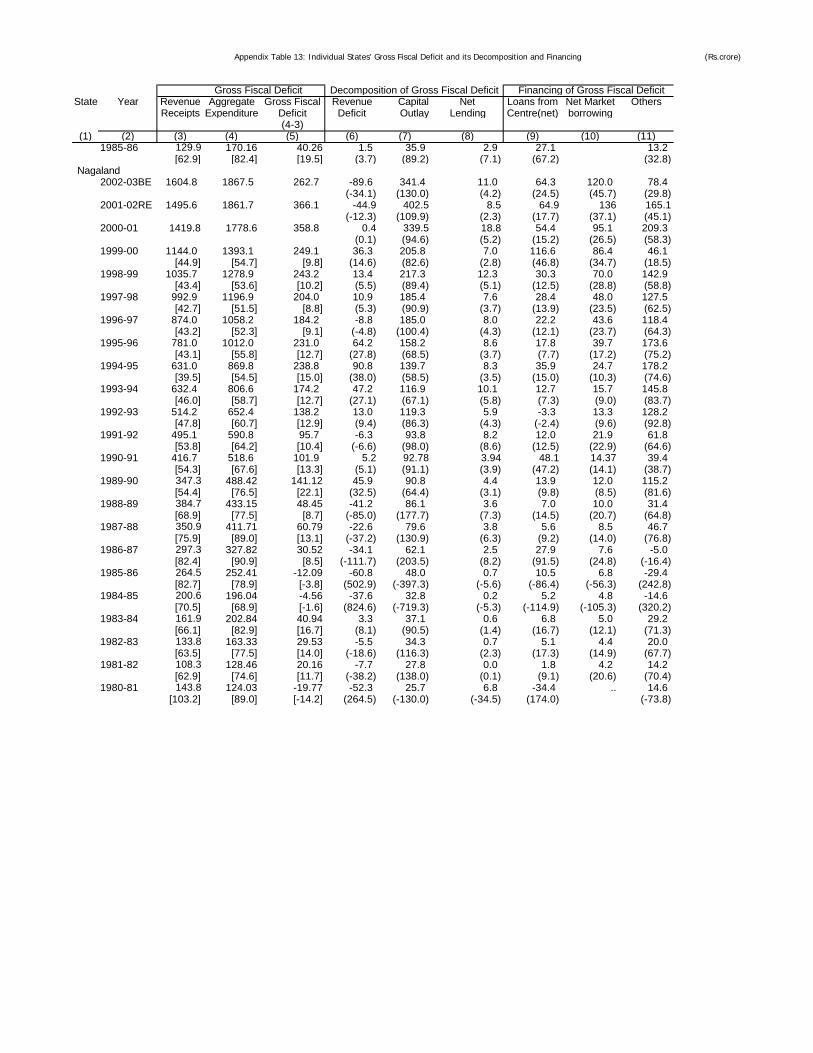
Appendix Table 13: Individual States' Gross Fiscal Deficit and its Decomposition and Financing (Rs.crore)
State Year Revenue Aggregate Gross Fiscal Revenue Capital Net Loans from Net Market OthersReceipts Expenditure Deficit Deficit Outlay Lending Centre(net) borrowing
(4-3)(1) (2) (3) (4) (5) (6) (7) (8) (9) (10) (11)
Gross Fiscal Deficit Decomposition of Gross Fiscal Deficit Financing of Gross Fiscal Deficit
1985-86 129.9 170.16 40.26 1.5 35.9 2.9 27.1 13.2[62.9] [82.4] [19.5] (3.7) (89.2) (7.1) (67.2) (32.8)
Nagaland2002-03BE 1604.8 1867.5 262.7 -89.6 341.4 11.0 64.3 120.0 78.4
(-34.1) (130.0) (4.2) (24.5) (45.7) (29.8)2001-02RE 1495.6 1861.7 366.1 -44.9 402.5 8.5 64.9 136 165.1
(-12.3) (109.9) (2.3) (17.7) (37.1) (45.1)2000-01 1419.8 1778.6 358.8 0.4 339.5 18.8 54.4 95.1 209.3
(0.1) (94.6) (5.2) (15.2) (26.5) (58.3)1999-00 1144.0 1393.1 249.1 36.3 205.8 7.0 116.6 86.4 46.1
[44.9] [54.7] [9.8] (14.6) (82.6) (2.8) (46.8) (34.7) (18.5)1998-99 1035.7 1278.9 243.2 13.4 217.3 12.3 30.3 70.0 142.9
[43.4] [53.6] [10.2] (5.5) (89.4) (5.1) (12.5) (28.8) (58.8)1997-98 992.9 1196.9 204.0 10.9 185.4 7.6 28.4 48.0 127.5
[42.7] [51.5] [8.8] (5.3) (90.9) (3.7) (13.9) (23.5) (62.5)1996-97 874.0 1058.2 184.2 -8.8 185.0 8.0 22.2 43.6 118.4
[43.2] [52.3] [9.1] (-4.8) (100.4) (4.3) (12.1) (23.7) (64.3)1995-96 781.0 1012.0 231.0 64.2 158.2 8.6 17.8 39.7 173.6
[43.1] [55.8] [12.7] (27.8) (68.5) (3.7) (7.7) (17.2) (75.2)1994-95 631.0 869.8 238.8 90.8 139.7 8.3 35.9 24.7 178.2
[39.5] [54.5] [15.0] (38.0) (58.5) (3.5) (15.0) (10.3) (74.6)1993-94 632.4 806.6 174.2 47.2 116.9 10.1 12.7 15.7 145.8
[46.0] [58.7] [12.7] (27.1) (67.1) (5.8) (7.3) (9.0) (83.7)1992-93 514.2 652.4 138.2 13.0 119.3 5.9 -3.3 13.3 128.2
[47.8] [60.7] [12.9] (9.4) (86.3) (4.3) (-2.4) (9.6) (92.8)1991-92 495.1 590.8 95.7 -6.3 93.8 8.2 12.0 21.9 61.8
[53.8] [64.2] [10.4] (-6.6) (98.0) (8.6) (12.5) (22.9) (64.6)1990-91 416.7 518.6 101.9 5.2 92.78 3.94 48.1 14.37 39.4
[54.3] [67.6] [13.3] (5.1) (91.1) (3.9) (47.2) (14.1) (38.7)1989-90 347.3 488.42 141.12 45.9 90.8 4.4 13.9 12.0 115.2
[54.4] [76.5] [22.1] (32.5) (64.4) (3.1) (9.8) (8.5) (81.6)1988-89 384.7 433.15 48.45 -41.2 86.1 3.6 7.0 10.0 31.4
[68.9] [77.5] [8.7] (-85.0) (177.7) (7.3) (14.5) (20.7) (64.8)1987-88 350.9 411.71 60.79 -22.6 79.6 3.8 5.6 8.5 46.7
[75.9] [89.0] [13.1] (-37.2) (130.9) (6.3) (9.2) (14.0) (76.8)1986-87 297.3 327.82 30.52 -34.1 62.1 2.5 27.9 7.6 -5.0
[82.4] [90.9] [8.5] (-111.7) (203.5) (8.2) (91.5) (24.8) (-16.4)1985-86 264.5 252.41 -12.09 -60.8 48.0 0.7 10.5 6.8 -29.4
[82.7] [78.9] [-3.8] (502.9) (-397.3) (-5.6) (-86.4) (-56.3) (242.8)1984-85 200.6 196.04 -4.56 -37.6 32.8 0.2 5.2 4.8 -14.6
[70.5] [68.9] [-1.6] (824.6) (-719.3) (-5.3) (-114.9) (-105.3) (320.2)1983-84 161.9 202.84 40.94 3.3 37.1 0.6 6.8 5.0 29.2
[66.1] [82.9] [16.7] (8.1) (90.5) (1.4) (16.7) (12.1) (71.3)1982-83 133.8 163.33 29.53 -5.5 34.3 0.7 5.1 4.4 20.0
[63.5] [77.5] [14.0] (-18.6) (116.3) (2.3) (17.3) (14.9) (67.7)1981-82 108.3 128.46 20.16 -7.7 27.8 0.0 1.8 4.2 14.2
[62.9] [74.6] [11.7] (-38.2) (138.0) (0.1) (9.1) (20.6) (70.4)1980-81 143.8 124.03 -19.77 -52.3 25.7 6.8 -34.4 .. 14.6
[103.2] [89.0] [-14.2] (264.5) (-130.0) (-34.5) (174.0) (-73.8)
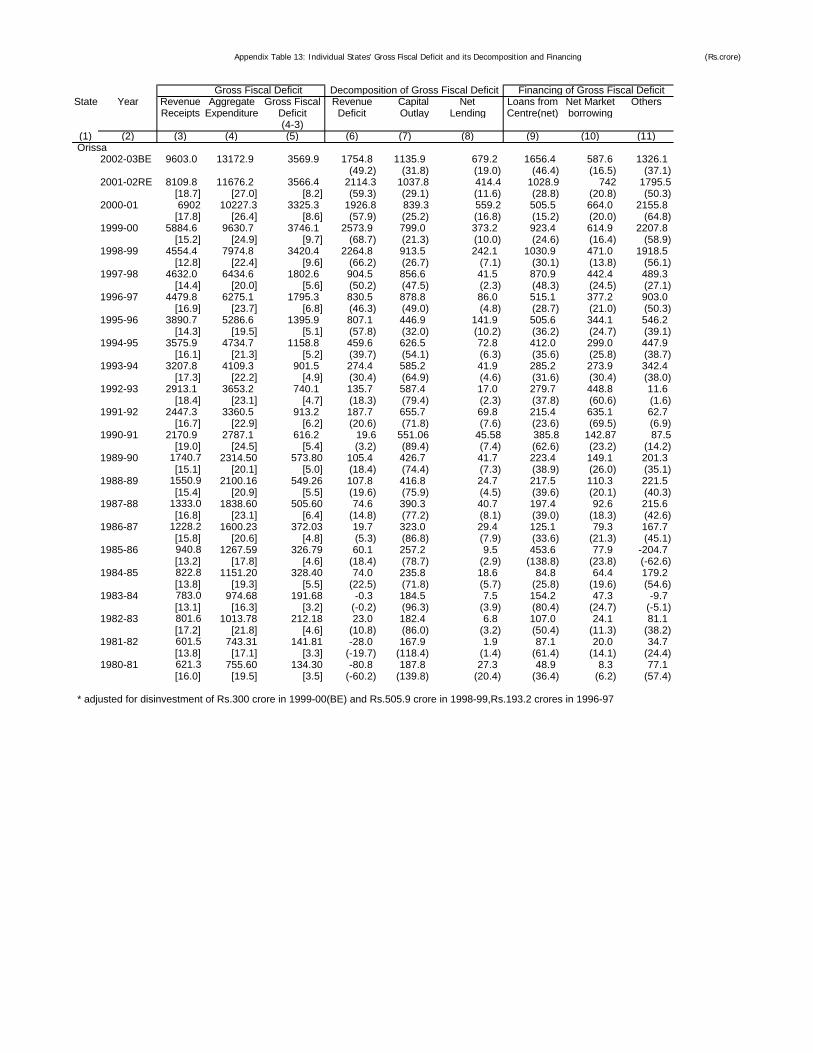
Appendix Table 13: Individual States' Gross Fiscal Deficit and its Decomposition and Financing (Rs.crore)
State Year Revenue Aggregate Gross Fiscal Revenue Capital Net Loans from Net Market OthersReceipts Expenditure Deficit Deficit Outlay Lending Centre(net) borrowing
(4-3)(1) (2) (3) (4) (5) (6) (7) (8) (9) (10) (11)
Gross Fiscal Deficit Decomposition of Gross Fiscal Deficit Financing of Gross Fiscal Deficit
Orissa2002-03BE 9603.0 13172.9 3569.9 1754.8 1135.9 679.2 1656.4 587.6 1326.1
(49.2) (31.8) (19.0) (46.4) (16.5) (37.1)2001-02RE 8109.8 11676.2 3566.4 2114.3 1037.8 414.4 1028.9 742 1795.5
[18.7] [27.0] [8.2] (59.3) (29.1) (11.6) (28.8) (20.8) (50.3)2000-01 6902 10227.3 3325.3 1926.8 839.3 559.2 505.5 664.0 2155.8
[17.8] [26.4] [8.6] (57.9) (25.2) (16.8) (15.2) (20.0) (64.8)1999-00 5884.6 9630.7 3746.1 2573.9 799.0 373.2 923.4 614.9 2207.8
[15.2] [24.9] [9.7] (68.7) (21.3) (10.0) (24.6) (16.4) (58.9)1998-99 4554.4 7974.8 3420.4 2264.8 913.5 242.1 1030.9 471.0 1918.5
[12.8] [22.4] [9.6] (66.2) (26.7) (7.1) (30.1) (13.8) (56.1)1997-98 4632.0 6434.6 1802.6 904.5 856.6 41.5 870.9 442.4 489.3
[14.4] [20.0] [5.6] (50.2) (47.5) (2.3) (48.3) (24.5) (27.1)1996-97 4479.8 6275.1 1795.3 830.5 878.8 86.0 515.1 377.2 903.0
[16.9] [23.7] [6.8] (46.3) (49.0) (4.8) (28.7) (21.0) (50.3)1995-96 3890.7 5286.6 1395.9 807.1 446.9 141.9 505.6 344.1 546.2
[14.3] [19.5] [5.1] (57.8) (32.0) (10.2) (36.2) (24.7) (39.1)1994-95 3575.9 4734.7 1158.8 459.6 626.5 72.8 412.0 299.0 447.9
[16.1] [21.3] [5.2] (39.7) (54.1) (6.3) (35.6) (25.8) (38.7)1993-94 3207.8 4109.3 901.5 274.4 585.2 41.9 285.2 273.9 342.4
[17.3] [22.2] [4.9] (30.4) (64.9) (4.6) (31.6) (30.4) (38.0)1992-93 2913.1 3653.2 740.1 135.7 587.4 17.0 279.7 448.8 11.6
[18.4] [23.1] [4.7] (18.3) (79.4) (2.3) (37.8) (60.6) (1.6)1991-92 2447.3 3360.5 913.2 187.7 655.7 69.8 215.4 635.1 62.7
[16.7] [22.9] [6.2] (20.6) (71.8) (7.6) (23.6) (69.5) (6.9)1990-91 2170.9 2787.1 616.2 19.6 551.06 45.58 385.8 142.87 87.5
[19.0] [24.5] [5.4] (3.2) (89.4) (7.4) (62.6) (23.2) (14.2)1989-90 1740.7 2314.50 573.80 105.4 426.7 41.7 223.4 149.1 201.3
[15.1] [20.1] [5.0] (18.4) (74.4) (7.3) (38.9) (26.0) (35.1)1988-89 1550.9 2100.16 549.26 107.8 416.8 24.7 217.5 110.3 221.5
[15.4] [20.9] [5.5] (19.6) (75.9) (4.5) (39.6) (20.1) (40.3)1987-88 1333.0 1838.60 505.60 74.6 390.3 40.7 197.4 92.6 215.6
[16.8] [23.1] [6.4] (14.8) (77.2) (8.1) (39.0) (18.3) (42.6)1986-87 1228.2 1600.23 372.03 19.7 323.0 29.4 125.1 79.3 167.7
[15.8] [20.6] [4.8] (5.3) (86.8) (7.9) (33.6) (21.3) (45.1)1985-86 940.8 1267.59 326.79 60.1 257.2 9.5 453.6 77.9 -204.7
[13.2] [17.8] [4.6] (18.4) (78.7) (2.9) (138.8) (23.8) (-62.6)1984-85 822.8 1151.20 328.40 74.0 235.8 18.6 84.8 64.4 179.2
[13.8] [19.3] [5.5] (22.5) (71.8) (5.7) (25.8) (19.6) (54.6)1983-84 783.0 974.68 191.68 -0.3 184.5 7.5 154.2 47.3 -9.7
[13.1] [16.3] [3.2] (-0.2) (96.3) (3.9) (80.4) (24.7) (-5.1)1982-83 801.6 1013.78 212.18 23.0 182.4 6.8 107.0 24.1 81.1
[17.2] [21.8] [4.6] (10.8) (86.0) (3.2) (50.4) (11.3) (38.2)1981-82 601.5 743.31 141.81 -28.0 167.9 1.9 87.1 20.0 34.7
[13.8] [17.1] [3.3] (-19.7) (118.4) (1.4) (61.4) (14.1) (24.4)1980-81 621.3 755.60 134.30 -80.8 187.8 27.3 48.9 8.3 77.1
[16.0] [19.5] [3.5] (-60.2) (139.8) (20.4) (36.4) (6.2) (57.4)
* adjusted for disinvestment of Rs.300 crore in 1999-00(BE) and Rs.505.9 crore in 1998-99,Rs.193.2 crores in 1996-97
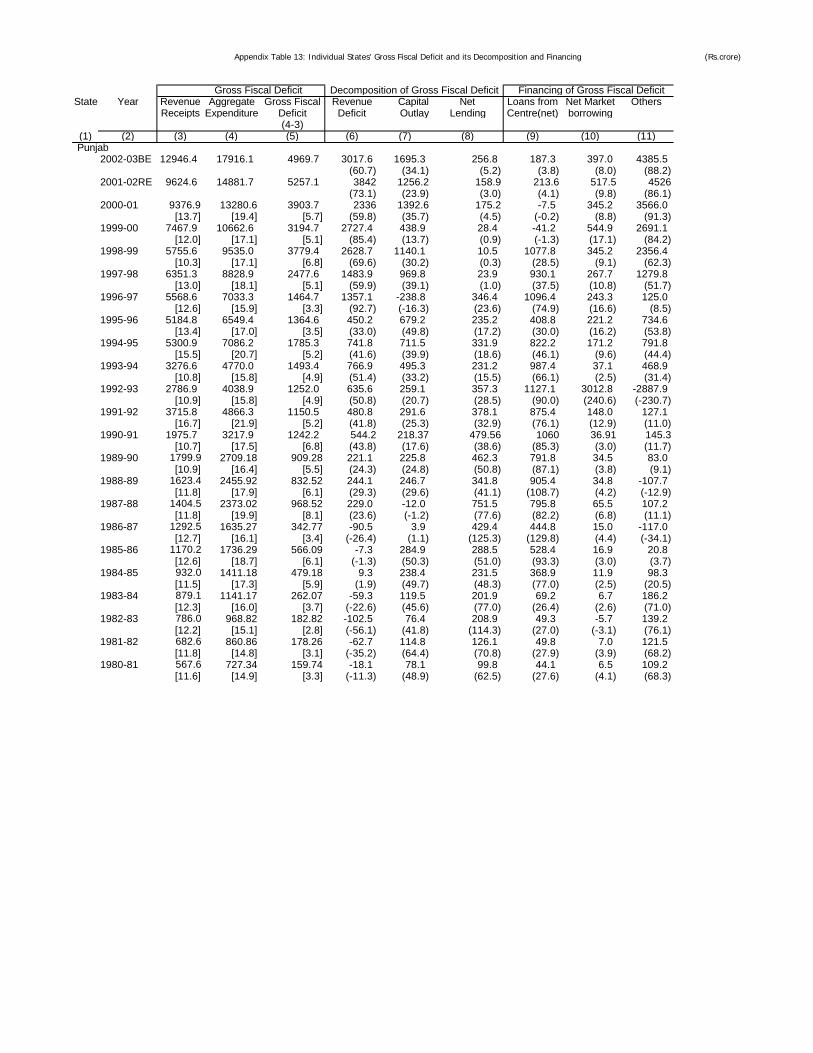
Appendix Table 13: Individual States' Gross Fiscal Deficit and its Decomposition and Financing (Rs.crore)
State Year Revenue Aggregate Gross Fiscal Revenue Capital Net Loans from Net Market OthersReceipts Expenditure Deficit Deficit Outlay Lending Centre(net) borrowing
(4-3)(1) (2) (3) (4) (5) (6) (7) (8) (9) (10) (11)
Gross Fiscal Deficit Decomposition of Gross Fiscal Deficit Financing of Gross Fiscal Deficit
Punjab2002-03BE 12946.4 17916.1 4969.7 3017.6 1695.3 256.8 187.3 397.0 4385.5
(60.7) (34.1) (5.2) (3.8) (8.0) (88.2)2001-02RE 9624.6 14881.7 5257.1 3842 1256.2 158.9 213.6 517.5 4526
(73.1) (23.9) (3.0) (4.1) (9.8) (86.1)2000-01 9376.9 13280.6 3903.7 2336 1392.6 175.2 -7.5 345.2 3566.0
[13.7] [19.4] [5.7] (59.8) (35.7) (4.5) (-0.2) (8.8) (91.3)1999-00 7467.9 10662.6 3194.7 2727.4 438.9 28.4 -41.2 544.9 2691.1
[12.0] [17.1] [5.1] (85.4) (13.7) (0.9) (-1.3) (17.1) (84.2)1998-99 5755.6 9535.0 3779.4 2628.7 1140.1 10.5 1077.8 345.2 2356.4
[10.3] [17.1] [6.8] (69.6) (30.2) (0.3) (28.5) (9.1) (62.3)1997-98 6351.3 8828.9 2477.6 1483.9 969.8 23.9 930.1 267.7 1279.8
[13.0] [18.1] [5.1] (59.9) (39.1) (1.0) (37.5) (10.8) (51.7)1996-97 5568.6 7033.3 1464.7 1357.1 -238.8 346.4 1096.4 243.3 125.0
[12.6] [15.9] [3.3] (92.7) (-16.3) (23.6) (74.9) (16.6) (8.5)1995-96 5184.8 6549.4 1364.6 450.2 679.2 235.2 408.8 221.2 734.6
[13.4] [17.0] [3.5] (33.0) (49.8) (17.2) (30.0) (16.2) (53.8)1994-95 5300.9 7086.2 1785.3 741.8 711.5 331.9 822.2 171.2 791.8
[15.5] [20.7] [5.2] (41.6) (39.9) (18.6) (46.1) (9.6) (44.4)1993-94 3276.6 4770.0 1493.4 766.9 495.3 231.2 987.4 37.1 468.9
[10.8] [15.8] [4.9] (51.4) (33.2) (15.5) (66.1) (2.5) (31.4)1992-93 2786.9 4038.9 1252.0 635.6 259.1 357.3 1127.1 3012.8 -2887.9
[10.9] [15.8] [4.9] (50.8) (20.7) (28.5) (90.0) (240.6) (-230.7)1991-92 3715.8 4866.3 1150.5 480.8 291.6 378.1 875.4 148.0 127.1
[16.7] [21.9] [5.2] (41.8) (25.3) (32.9) (76.1) (12.9) (11.0)1990-91 1975.7 3217.9 1242.2 544.2 218.37 479.56 1060 36.91 145.3
[10.7] [17.5] [6.8] (43.8) (17.6) (38.6) (85.3) (3.0) (11.7)1989-90 1799.9 2709.18 909.28 221.1 225.8 462.3 791.8 34.5 83.0
[10.9] [16.4] [5.5] (24.3) (24.8) (50.8) (87.1) (3.8) (9.1)1988-89 1623.4 2455.92 832.52 244.1 246.7 341.8 905.4 34.8 -107.7
[11.8] [17.9] [6.1] (29.3) (29.6) (41.1) (108.7) (4.2) (-12.9)1987-88 1404.5 2373.02 968.52 229.0 -12.0 751.5 795.8 65.5 107.2
[11.8] [19.9] [8.1] (23.6) (-1.2) (77.6) (82.2) (6.8) (11.1)1986-87 1292.5 1635.27 342.77 -90.5 3.9 429.4 444.8 15.0 -117.0
[12.7] [16.1] [3.4] (-26.4) (1.1) (125.3) (129.8) (4.4) (-34.1)1985-86 1170.2 1736.29 566.09 -7.3 284.9 288.5 528.4 16.9 20.8
[12.6] [18.7] [6.1] (-1.3) (50.3) (51.0) (93.3) (3.0) (3.7)1984-85 932.0 1411.18 479.18 9.3 238.4 231.5 368.9 11.9 98.3
[11.5] [17.3] [5.9] (1.9) (49.7) (48.3) (77.0) (2.5) (20.5)1983-84 879.1 1141.17 262.07 -59.3 119.5 201.9 69.2 6.7 186.2
[12.3] [16.0] [3.7] (-22.6) (45.6) (77.0) (26.4) (2.6) (71.0)1982-83 786.0 968.82 182.82 -102.5 76.4 208.9 49.3 -5.7 139.2
[12.2] [15.1] [2.8] (-56.1) (41.8) (114.3) (27.0) (-3.1) (76.1)1981-82 682.6 860.86 178.26 -62.7 114.8 126.1 49.8 7.0 121.5
[11.8] [14.8] [3.1] (-35.2) (64.4) (70.8) (27.9) (3.9) (68.2)1980-81 567.6 727.34 159.74 -18.1 78.1 99.8 44.1 6.5 109.2
[11.6] [14.9] [3.3] (-11.3) (48.9) (62.5) (27.6) (4.1) (68.3)
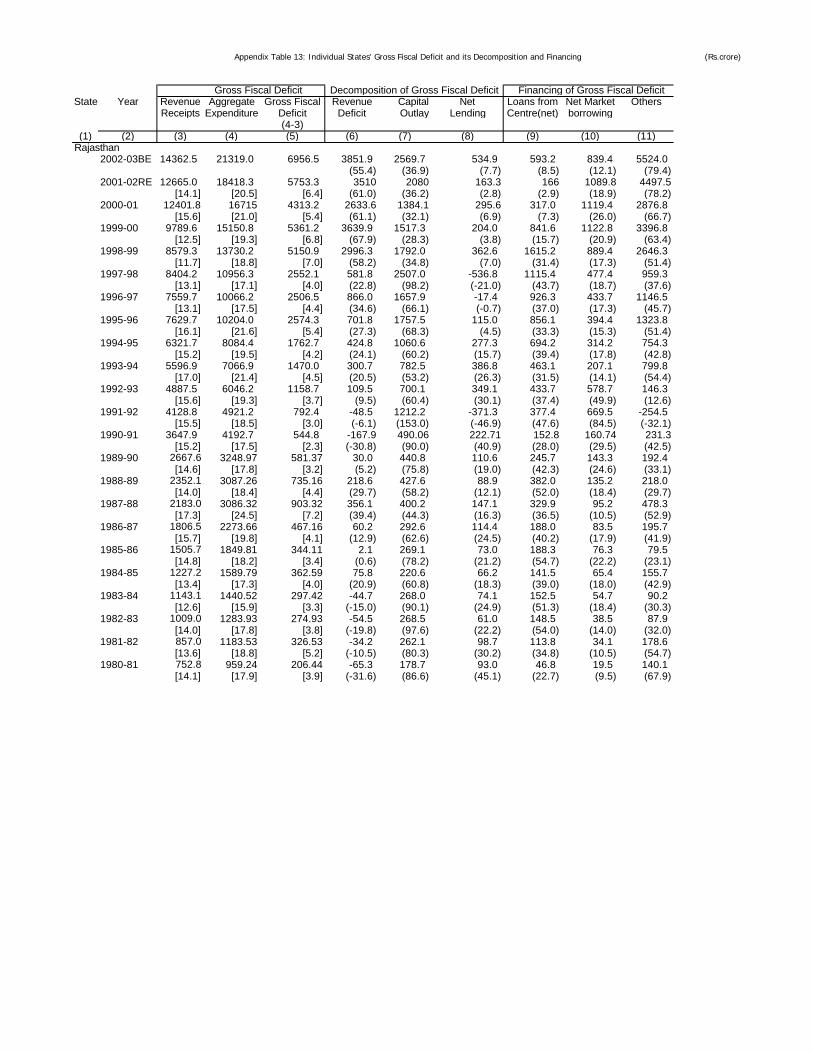
Appendix Table 13: Individual States' Gross Fiscal Deficit and its Decomposition and Financing (Rs.crore)
State Year Revenue Aggregate Gross Fiscal Revenue Capital Net Loans from Net Market OthersReceipts Expenditure Deficit Deficit Outlay Lending Centre(net) borrowing
(4-3)(1) (2) (3) (4) (5) (6) (7) (8) (9) (10) (11)
Gross Fiscal Deficit Decomposition of Gross Fiscal Deficit Financing of Gross Fiscal Deficit
Rajasthan2002-03BE 14362.5 21319.0 6956.5 3851.9 2569.7 534.9 593.2 839.4 5524.0
(55.4) (36.9) (7.7) (8.5) (12.1) (79.4)2001-02RE 12665.0 18418.3 5753.3 3510 2080 163.3 166 1089.8 4497.5
[14.1] [20.5] [6.4] (61.0) (36.2) (2.8) (2.9) (18.9) (78.2)2000-01 12401.8 16715 4313.2 2633.6 1384.1 295.6 317.0 1119.4 2876.8
[15.6] [21.0] [5.4] (61.1) (32.1) (6.9) (7.3) (26.0) (66.7)1999-00 9789.6 15150.8 5361.2 3639.9 1517.3 204.0 841.6 1122.8 3396.8
[12.5] [19.3] [6.8] (67.9) (28.3) (3.8) (15.7) (20.9) (63.4)1998-99 8579.3 13730.2 5150.9 2996.3 1792.0 362.6 1615.2 889.4 2646.3
[11.7] [18.8] [7.0] (58.2) (34.8) (7.0) (31.4) (17.3) (51.4)1997-98 8404.2 10956.3 2552.1 581.8 2507.0 -536.8 1115.4 477.4 959.3
[13.1] [17.1] [4.0] (22.8) (98.2) (-21.0) (43.7) (18.7) (37.6)1996-97 7559.7 10066.2 2506.5 866.0 1657.9 -17.4 926.3 433.7 1146.5
[13.1] [17.5] [4.4] (34.6) (66.1) (-0.7) (37.0) (17.3) (45.7)1995-96 7629.7 10204.0 2574.3 701.8 1757.5 115.0 856.1 394.4 1323.8
[16.1] [21.6] [5.4] (27.3) (68.3) (4.5) (33.3) (15.3) (51.4)1994-95 6321.7 8084.4 1762.7 424.8 1060.6 277.3 694.2 314.2 754.3
[15.2] [19.5] [4.2] (24.1) (60.2) (15.7) (39.4) (17.8) (42.8)1993-94 5596.9 7066.9 1470.0 300.7 782.5 386.8 463.1 207.1 799.8
[17.0] [21.4] [4.5] (20.5) (53.2) (26.3) (31.5) (14.1) (54.4)1992-93 4887.5 6046.2 1158.7 109.5 700.1 349.1 433.7 578.7 146.3
[15.6] [19.3] [3.7] (9.5) (60.4) (30.1) (37.4) (49.9) (12.6)1991-92 4128.8 4921.2 792.4 -48.5 1212.2 -371.3 377.4 669.5 -254.5
[15.5] [18.5] [3.0] (-6.1) (153.0) (-46.9) (47.6) (84.5) (-32.1)1990-91 3647.9 4192.7 544.8 -167.9 490.06 222.71 152.8 160.74 231.3
[15.2] [17.5] [2.3] (-30.8) (90.0) (40.9) (28.0) (29.5) (42.5)1989-90 2667.6 3248.97 581.37 30.0 440.8 110.6 245.7 143.3 192.4
[14.6] [17.8] [3.2] (5.2) (75.8) (19.0) (42.3) (24.6) (33.1)1988-89 2352.1 3087.26 735.16 218.6 427.6 88.9 382.0 135.2 218.0
[14.0] [18.4] [4.4] (29.7) (58.2) (12.1) (52.0) (18.4) (29.7)1987-88 2183.0 3086.32 903.32 356.1 400.2 147.1 329.9 95.2 478.3
[17.3] [24.5] [7.2] (39.4) (44.3) (16.3) (36.5) (10.5) (52.9)1986-87 1806.5 2273.66 467.16 60.2 292.6 114.4 188.0 83.5 195.7
[15.7] [19.8] [4.1] (12.9) (62.6) (24.5) (40.2) (17.9) (41.9)1985-86 1505.7 1849.81 344.11 2.1 269.1 73.0 188.3 76.3 79.5
[14.8] [18.2] [3.4] (0.6) (78.2) (21.2) (54.7) (22.2) (23.1)1984-85 1227.2 1589.79 362.59 75.8 220.6 66.2 141.5 65.4 155.7
[13.4] [17.3] [4.0] (20.9) (60.8) (18.3) (39.0) (18.0) (42.9)1983-84 1143.1 1440.52 297.42 -44.7 268.0 74.1 152.5 54.7 90.2
[12.6] [15.9] [3.3] (-15.0) (90.1) (24.9) (51.3) (18.4) (30.3)1982-83 1009.0 1283.93 274.93 -54.5 268.5 61.0 148.5 38.5 87.9
[14.0] [17.8] [3.8] (-19.8) (97.6) (22.2) (54.0) (14.0) (32.0)1981-82 857.0 1183.53 326.53 -34.2 262.1 98.7 113.8 34.1 178.6
[13.6] [18.8] [5.2] (-10.5) (80.3) (30.2) (34.8) (10.5) (54.7)1980-81 752.8 959.24 206.44 -65.3 178.7 93.0 46.8 19.5 140.1
[14.1] [17.9] [3.9] (-31.6) (86.6) (45.1) (22.7) (9.5) (67.9)
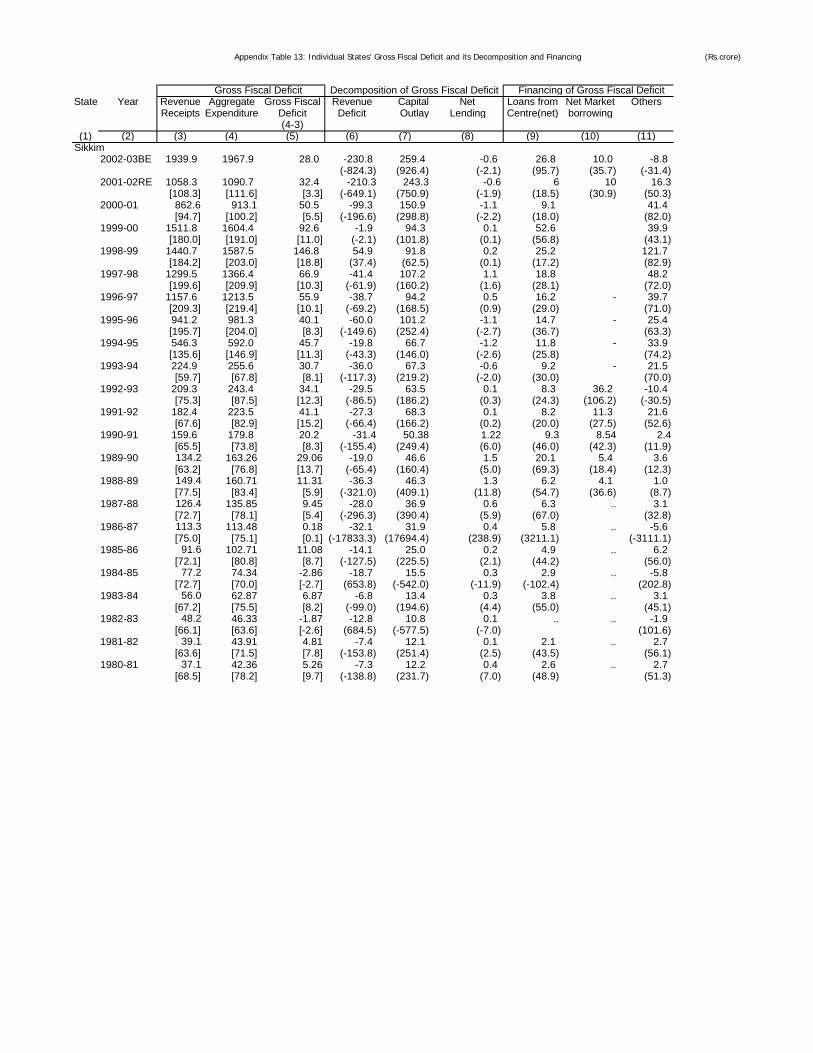
Appendix Table 13: Individual States' Gross Fiscal Deficit and its Decomposition and Financing (Rs.crore)
State Year Revenue Aggregate Gross Fiscal Revenue Capital Net Loans from Net Market OthersReceipts Expenditure Deficit Deficit Outlay Lending Centre(net) borrowing
(4-3)(1) (2) (3) (4) (5) (6) (7) (8) (9) (10) (11)
Gross Fiscal Deficit Decomposition of Gross Fiscal Deficit Financing of Gross Fiscal Deficit
Sikkim2002-03BE 1939.9 1967.9 28.0 -230.8 259.4 -0.6 26.8 10.0 -8.8
(-824.3) (926.4) (-2.1) (95.7) (35.7) (-31.4)2001-02RE 1058.3 1090.7 32.4 -210.3 243.3 -0.6 6 10 16.3
[108.3] [111.6] [3.3] (-649.1) (750.9) (-1.9) (18.5) (30.9) (50.3)2000-01 862.6 913.1 50.5 -99.3 150.9 -1.1 9.1 41.4
[94.7] [100.2] [5.5] (-196.6) (298.8) (-2.2) (18.0) (82.0)1999-00 1511.8 1604.4 92.6 -1.9 94.3 0.1 52.6 39.9
[180.0] [191.0] [11.0] (-2.1) (101.8) (0.1) (56.8) (43.1)1998-99 1440.7 1587.5 146.8 54.9 91.8 0.2 25.2 121.7
[184.2] [203.0] [18.8] (37.4) (62.5) (0.1) (17.2) (82.9)1997-98 1299.5 1366.4 66.9 -41.4 107.2 1.1 18.8 48.2
[199.6] [209.9] [10.3] (-61.9) (160.2) (1.6) (28.1) (72.0)1996-97 1157.6 1213.5 55.9 -38.7 94.2 0.5 16.2 - 39.7
[209.3] [219.4] [10.1] (-69.2) (168.5) (0.9) (29.0) (71.0)1995-96 941.2 981.3 40.1 -60.0 101.2 -1.1 14.7 - 25.4
[195.7] [204.0] [8.3] (-149.6) (252.4) (-2.7) (36.7) (63.3)1994-95 546.3 592.0 45.7 -19.8 66.7 -1.2 11.8 - 33.9
[135.6] [146.9] [11.3] (-43.3) (146.0) (-2.6) (25.8) (74.2)1993-94 224.9 255.6 30.7 -36.0 67.3 -0.6 9.2 - 21.5
[59.7] [67.8] [8.1] (-117.3) (219.2) (-2.0) (30.0) (70.0)1992-93 209.3 243.4 34.1 -29.5 63.5 0.1 8.3 36.2 -10.4
[75.3] [87.5] [12.3] (-86.5) (186.2) (0.3) (24.3) (106.2) (-30.5)1991-92 182.4 223.5 41.1 -27.3 68.3 0.1 8.2 11.3 21.6
[67.6] [82.9] [15.2] (-66.4) (166.2) (0.2) (20.0) (27.5) (52.6)1990-91 159.6 179.8 20.2 -31.4 50.38 1.22 9.3 8.54 2.4
[65.5] [73.8] [8.3] (-155.4) (249.4) (6.0) (46.0) (42.3) (11.9)1989-90 134.2 163.26 29.06 -19.0 46.6 1.5 20.1 5.4 3.6
[63.2] [76.8] [13.7] (-65.4) (160.4) (5.0) (69.3) (18.4) (12.3)1988-89 149.4 160.71 11.31 -36.3 46.3 1.3 6.2 4.1 1.0
[77.5] [83.4] [5.9] (-321.0) (409.1) (11.8) (54.7) (36.6) (8.7)1987-88 126.4 135.85 9.45 -28.0 36.9 0.6 6.3 .. 3.1
[72.7] [78.1] [5.4] (-296.3) (390.4) (5.9) (67.0) (32.8)1986-87 113.3 113.48 0.18 -32.1 31.9 0.4 5.8 .. -5.6
[75.0] [75.1] [0.1] (-17833.3) (17694.4) (238.9) (3211.1) (-3111.1)1985-86 91.6 102.71 11.08 -14.1 25.0 0.2 4.9 .. 6.2
[72.1] [80.8] [8.7] (-127.5) (225.5) (2.1) (44.2) (56.0)1984-85 77.2 74.34 -2.86 -18.7 15.5 0.3 2.9 .. -5.8
[72.7] [70.0] [-2.7] (653.8) (-542.0) (-11.9) (-102.4) (202.8)1983-84 56.0 62.87 6.87 -6.8 13.4 0.3 3.8 .. 3.1
[67.2] [75.5] [8.2] (-99.0) (194.6) (4.4) (55.0) (45.1)1982-83 48.2 46.33 -1.87 -12.8 10.8 0.1 .. .. -1.9
[66.1] [63.6] [-2.6] (684.5) (-577.5) (-7.0) (101.6)1981-82 39.1 43.91 4.81 -7.4 12.1 0.1 2.1 .. 2.7
[63.6] [71.5] [7.8] (-153.8) (251.4) (2.5) (43.5) (56.1)1980-81 37.1 42.36 5.26 -7.3 12.2 0.4 2.6 .. 2.7
[68.5] [78.2] [9.7] (-138.8) (231.7) (7.0) (48.9) (51.3)
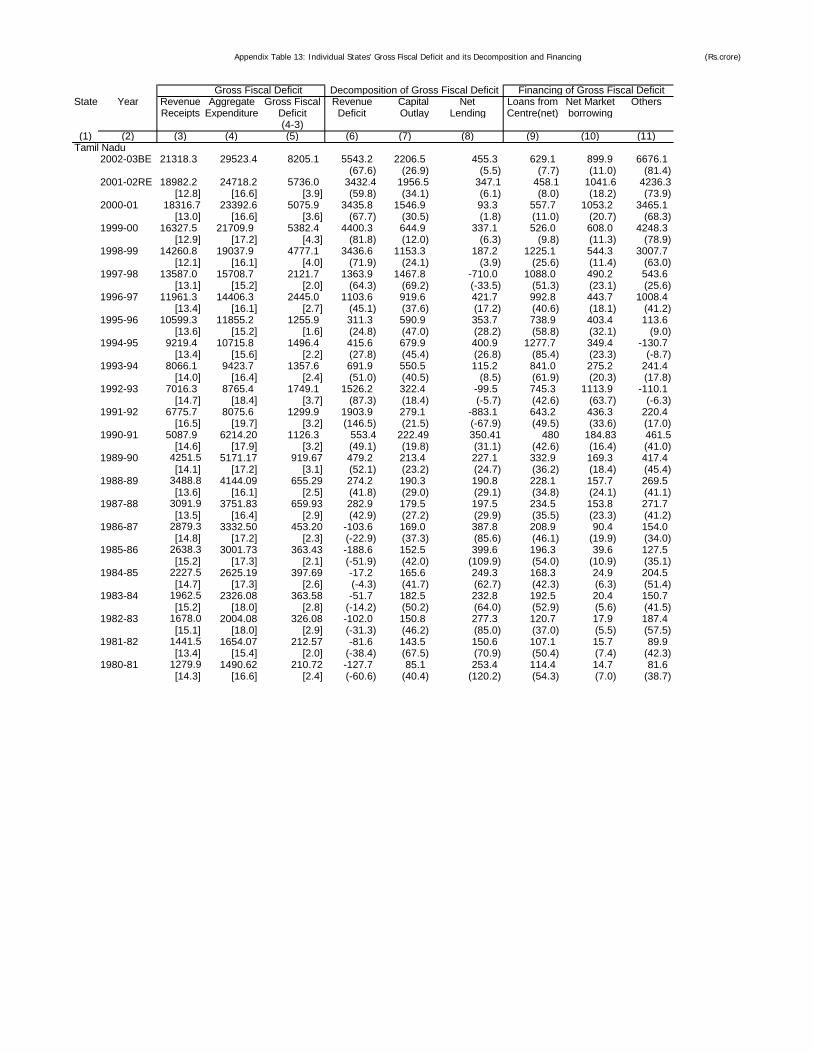
Appendix Table 13: Individual States' Gross Fiscal Deficit and its Decomposition and Financing (Rs.crore)
State Year Revenue Aggregate Gross Fiscal Revenue Capital Net Loans from Net Market OthersReceipts Expenditure Deficit Deficit Outlay Lending Centre(net) borrowing
(4-3)(1) (2) (3) (4) (5) (6) (7) (8) (9) (10) (11)
Gross Fiscal Deficit Decomposition of Gross Fiscal Deficit Financing of Gross Fiscal Deficit
Tamil Nadu2002-03BE 21318.3 29523.4 8205.1 5543.2 2206.5 455.3 629.1 899.9 6676.1
(67.6) (26.9) (5.5) (7.7) (11.0) (81.4)2001-02RE 18982.2 24718.2 5736.0 3432.4 1956.5 347.1 458.1 1041.6 4236.3
[12.8] [16.6] [3.9] (59.8) (34.1) (6.1) (8.0) (18.2) (73.9)2000-01 18316.7 23392.6 5075.9 3435.8 1546.9 93.3 557.7 1053.2 3465.1
[13.0] [16.6] [3.6] (67.7) (30.5) (1.8) (11.0) (20.7) (68.3)1999-00 16327.5 21709.9 5382.4 4400.3 644.9 337.1 526.0 608.0 4248.3
[12.9] [17.2] [4.3] (81.8) (12.0) (6.3) (9.8) (11.3) (78.9)1998-99 14260.8 19037.9 4777.1 3436.6 1153.3 187.2 1225.1 544.3 3007.7
[12.1] [16.1] [4.0] (71.9) (24.1) (3.9) (25.6) (11.4) (63.0)1997-98 13587.0 15708.7 2121.7 1363.9 1467.8 -710.0 1088.0 490.2 543.6
[13.1] [15.2] [2.0] (64.3) (69.2) (-33.5) (51.3) (23.1) (25.6)1996-97 11961.3 14406.3 2445.0 1103.6 919.6 421.7 992.8 443.7 1008.4
[13.4] [16.1] [2.7] (45.1) (37.6) (17.2) (40.6) (18.1) (41.2)1995-96 10599.3 11855.2 1255.9 311.3 590.9 353.7 738.9 403.4 113.6
[13.6] [15.2] [1.6] (24.8) (47.0) (28.2) (58.8) (32.1) (9.0)1994-95 9219.4 10715.8 1496.4 415.6 679.9 400.9 1277.7 349.4 -130.7
[13.4] [15.6] [2.2] (27.8) (45.4) (26.8) (85.4) (23.3) (-8.7)1993-94 8066.1 9423.7 1357.6 691.9 550.5 115.2 841.0 275.2 241.4
[14.0] [16.4] [2.4] (51.0) (40.5) (8.5) (61.9) (20.3) (17.8)1992-93 7016.3 8765.4 1749.1 1526.2 322.4 -99.5 745.3 1113.9 -110.1
[14.7] [18.4] [3.7] (87.3) (18.4) (-5.7) (42.6) (63.7) (-6.3)1991-92 6775.7 8075.6 1299.9 1903.9 279.1 -883.1 643.2 436.3 220.4
[16.5] [19.7] [3.2] (146.5) (21.5) (-67.9) (49.5) (33.6) (17.0)1990-91 5087.9 6214.20 1126.3 553.4 222.49 350.41 480 184.83 461.5
[14.6] [17.9] [3.2] (49.1) (19.8) (31.1) (42.6) (16.4) (41.0)1989-90 4251.5 5171.17 919.67 479.2 213.4 227.1 332.9 169.3 417.4
[14.1] [17.2] [3.1] (52.1) (23.2) (24.7) (36.2) (18.4) (45.4)1988-89 3488.8 4144.09 655.29 274.2 190.3 190.8 228.1 157.7 269.5
[13.6] [16.1] [2.5] (41.8) (29.0) (29.1) (34.8) (24.1) (41.1)1987-88 3091.9 3751.83 659.93 282.9 179.5 197.5 234.5 153.8 271.7
[13.5] [16.4] [2.9] (42.9) (27.2) (29.9) (35.5) (23.3) (41.2)1986-87 2879.3 3332.50 453.20 -103.6 169.0 387.8 208.9 90.4 154.0
[14.8] [17.2] [2.3] (-22.9) (37.3) (85.6) (46.1) (19.9) (34.0)1985-86 2638.3 3001.73 363.43 -188.6 152.5 399.6 196.3 39.6 127.5
[15.2] [17.3] [2.1] (-51.9) (42.0) (109.9) (54.0) (10.9) (35.1)1984-85 2227.5 2625.19 397.69 -17.2 165.6 249.3 168.3 24.9 204.5
[14.7] [17.3] [2.6] (-4.3) (41.7) (62.7) (42.3) (6.3) (51.4)1983-84 1962.5 2326.08 363.58 -51.7 182.5 232.8 192.5 20.4 150.7
[15.2] [18.0] [2.8] (-14.2) (50.2) (64.0) (52.9) (5.6) (41.5)1982-83 1678.0 2004.08 326.08 -102.0 150.8 277.3 120.7 17.9 187.4
[15.1] [18.0] [2.9] (-31.3) (46.2) (85.0) (37.0) (5.5) (57.5)1981-82 1441.5 1654.07 212.57 -81.6 143.5 150.6 107.1 15.7 89.9
[13.4] [15.4] [2.0] (-38.4) (67.5) (70.9) (50.4) (7.4) (42.3)1980-81 1279.9 1490.62 210.72 -127.7 85.1 253.4 114.4 14.7 81.6
[14.3] [16.6] [2.4] (-60.6) (40.4) (120.2) (54.3) (7.0) (38.7)
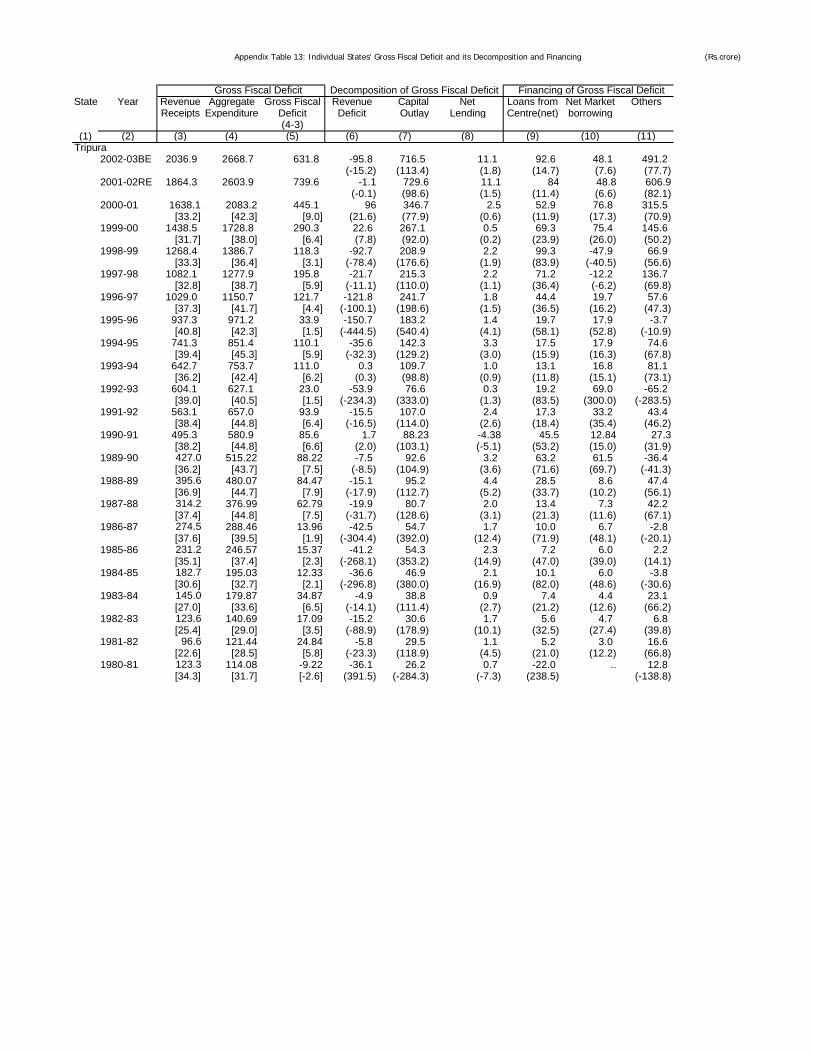
Appendix Table 13: Individual States' Gross Fiscal Deficit and its Decomposition and Financing (Rs.crore)
State Year Revenue Aggregate Gross Fiscal Revenue Capital Net Loans from Net Market OthersReceipts Expenditure Deficit Deficit Outlay Lending Centre(net) borrowing
(4-3)(1) (2) (3) (4) (5) (6) (7) (8) (9) (10) (11)
Gross Fiscal Deficit Decomposition of Gross Fiscal Deficit Financing of Gross Fiscal Deficit
Tripura2002-03BE 2036.9 2668.7 631.8 -95.8 716.5 11.1 92.6 48.1 491.2
(-15.2) (113.4) (1.8) (14.7) (7.6) (77.7)2001-02RE 1864.3 2603.9 739.6 -1.1 729.6 11.1 84 48.8 606.9
(-0.1) (98.6) (1.5) (11.4) (6.6) (82.1)2000-01 1638.1 2083.2 445.1 96 346.7 2.5 52.9 76.8 315.5
[33.2] [42.3] [9.0] (21.6) (77.9) (0.6) (11.9) (17.3) (70.9)1999-00 1438.5 1728.8 290.3 22.6 267.1 0.5 69.3 75.4 145.6
[31.7] [38.0] [6.4] (7.8) (92.0) (0.2) (23.9) (26.0) (50.2)1998-99 1268.4 1386.7 118.3 -92.7 208.9 2.2 99.3 -47.9 66.9
[33.3] [36.4] [3.1] (-78.4) (176.6) (1.9) (83.9) (-40.5) (56.6)1997-98 1082.1 1277.9 195.8 -21.7 215.3 2.2 71.2 -12.2 136.7
[32.8] [38.7] [5.9] (-11.1) (110.0) (1.1) (36.4) (-6.2) (69.8)1996-97 1029.0 1150.7 121.7 -121.8 241.7 1.8 44.4 19.7 57.6
[37.3] [41.7] [4.4] (-100.1) (198.6) (1.5) (36.5) (16.2) (47.3)1995-96 937.3 971.2 33.9 -150.7 183.2 1.4 19.7 17.9 -3.7
[40.8] [42.3] [1.5] (-444.5) (540.4) (4.1) (58.1) (52.8) (-10.9)1994-95 741.3 851.4 110.1 -35.6 142.3 3.3 17.5 17.9 74.6
[39.4] [45.3] [5.9] (-32.3) (129.2) (3.0) (15.9) (16.3) (67.8)1993-94 642.7 753.7 111.0 0.3 109.7 1.0 13.1 16.8 81.1
[36.2] [42.4] [6.2] (0.3) (98.8) (0.9) (11.8) (15.1) (73.1)1992-93 604.1 627.1 23.0 -53.9 76.6 0.3 19.2 69.0 -65.2
[39.0] [40.5] [1.5] (-234.3) (333.0) (1.3) (83.5) (300.0) (-283.5)1991-92 563.1 657.0 93.9 -15.5 107.0 2.4 17.3 33.2 43.4
[38.4] [44.8] [6.4] (-16.5) (114.0) (2.6) (18.4) (35.4) (46.2)1990-91 495.3 580.9 85.6 1.7 88.23 -4.38 45.5 12.84 27.3
[38.2] [44.8] [6.6] (2.0) (103.1) (-5.1) (53.2) (15.0) (31.9)1989-90 427.0 515.22 88.22 -7.5 92.6 3.2 63.2 61.5 -36.4
[36.2] [43.7] [7.5] (-8.5) (104.9) (3.6) (71.6) (69.7) (-41.3)1988-89 395.6 480.07 84.47 -15.1 95.2 4.4 28.5 8.6 47.4
[36.9] [44.7] [7.9] (-17.9) (112.7) (5.2) (33.7) (10.2) (56.1)1987-88 314.2 376.99 62.79 -19.9 80.7 2.0 13.4 7.3 42.2
[37.4] [44.8] [7.5] (-31.7) (128.6) (3.1) (21.3) (11.6) (67.1)1986-87 274.5 288.46 13.96 -42.5 54.7 1.7 10.0 6.7 -2.8
[37.6] [39.5] [1.9] (-304.4) (392.0) (12.4) (71.9) (48.1) (-20.1)1985-86 231.2 246.57 15.37 -41.2 54.3 2.3 7.2 6.0 2.2
[35.1] [37.4] [2.3] (-268.1) (353.2) (14.9) (47.0) (39.0) (14.1)1984-85 182.7 195.03 12.33 -36.6 46.9 2.1 10.1 6.0 -3.8
[30.6] [32.7] [2.1] (-296.8) (380.0) (16.9) (82.0) (48.6) (-30.6)1983-84 145.0 179.87 34.87 -4.9 38.8 0.9 7.4 4.4 23.1
[27.0] [33.6] [6.5] (-14.1) (111.4) (2.7) (21.2) (12.6) (66.2)1982-83 123.6 140.69 17.09 -15.2 30.6 1.7 5.6 4.7 6.8
[25.4] [29.0] [3.5] (-88.9) (178.9) (10.1) (32.5) (27.4) (39.8)1981-82 96.6 121.44 24.84 -5.8 29.5 1.1 5.2 3.0 16.6
[22.6] [28.5] [5.8] (-23.3) (118.9) (4.5) (21.0) (12.2) (66.8)1980-81 123.3 114.08 -9.22 -36.1 26.2 0.7 -22.0 .. 12.8
[34.3] [31.7] [-2.6] (391.5) (-284.3) (-7.3) (238.5) (-138.8)
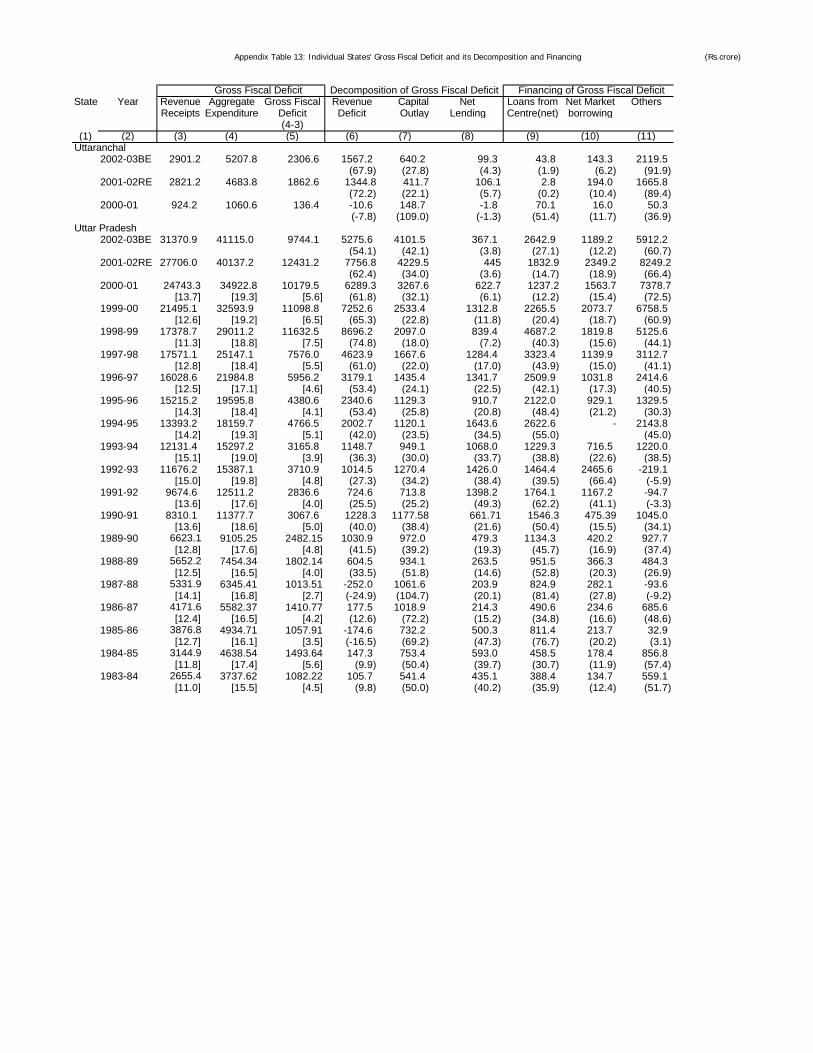
Appendix Table 13: Individual States' Gross Fiscal Deficit and its Decomposition and Financing (Rs.crore)
State Year Revenue Aggregate Gross Fiscal Revenue Capital Net Loans from Net Market OthersReceipts Expenditure Deficit Deficit Outlay Lending Centre(net) borrowing
(4-3)(1) (2) (3) (4) (5) (6) (7) (8) (9) (10) (11)
Gross Fiscal Deficit Decomposition of Gross Fiscal Deficit Financing of Gross Fiscal Deficit
Uttaranchal2002-03BE 2901.2 5207.8 2306.6 1567.2 640.2 99.3 43.8 143.3 2119.5
(67.9) (27.8) (4.3) (1.9) (6.2) (91.9)2001-02RE 2821.2 4683.8 1862.6 1344.8 411.7 106.1 2.8 194.0 1665.8
(72.2) (22.1) (5.7) (0.2) (10.4) (89.4)2000-01 924.2 1060.6 136.4 -10.6 148.7 -1.8 70.1 16.0 50.3
(-7.8) (109.0) (-1.3) (51.4) (11.7) (36.9)Uttar Pradesh
2002-03BE 31370.9 41115.0 9744.1 5275.6 4101.5 367.1 2642.9 1189.2 5912.2(54.1) (42.1) (3.8) (27.1) (12.2) (60.7)
2001-02RE 27706.0 40137.2 12431.2 7756.8 4229.5 445 1832.9 2349.2 8249.2(62.4) (34.0) (3.6) (14.7) (18.9) (66.4)
2000-01 24743.3 34922.8 10179.5 6289.3 3267.6 622.7 1237.2 1563.7 7378.7[13.7] [19.3] [5.6] (61.8) (32.1) (6.1) (12.2) (15.4) (72.5)
1999-00 21495.1 32593.9 11098.8 7252.6 2533.4 1312.8 2265.5 2073.7 6758.5[12.6] [19.2] [6.5] (65.3) (22.8) (11.8) (20.4) (18.7) (60.9)
1998-99 17378.7 29011.2 11632.5 8696.2 2097.0 839.4 4687.2 1819.8 5125.6[11.3] [18.8] [7.5] (74.8) (18.0) (7.2) (40.3) (15.6) (44.1)
1997-98 17571.1 25147.1 7576.0 4623.9 1667.6 1284.4 3323.4 1139.9 3112.7[12.8] [18.4] [5.5] (61.0) (22.0) (17.0) (43.9) (15.0) (41.1)
1996-97 16028.6 21984.8 5956.2 3179.1 1435.4 1341.7 2509.9 1031.8 2414.6[12.5] [17.1] [4.6] (53.4) (24.1) (22.5) (42.1) (17.3) (40.5)
1995-96 15215.2 19595.8 4380.6 2340.6 1129.3 910.7 2122.0 929.1 1329.5[14.3] [18.4] [4.1] (53.4) (25.8) (20.8) (48.4) (21.2) (30.3)
1994-95 13393.2 18159.7 4766.5 2002.7 1120.1 1643.6 2622.6 - 2143.8[14.2] [19.3] [5.1] (42.0) (23.5) (34.5) (55.0) (45.0)
1993-94 12131.4 15297.2 3165.8 1148.7 949.1 1068.0 1229.3 716.5 1220.0[15.1] [19.0] [3.9] (36.3) (30.0) (33.7) (38.8) (22.6) (38.5)
1992-93 11676.2 15387.1 3710.9 1014.5 1270.4 1426.0 1464.4 2465.6 -219.1[15.0] [19.8] [4.8] (27.3) (34.2) (38.4) (39.5) (66.4) (-5.9)
1991-92 9674.6 12511.2 2836.6 724.6 713.8 1398.2 1764.1 1167.2 -94.7[13.6] [17.6] [4.0] (25.5) (25.2) (49.3) (62.2) (41.1) (-3.3)
1990-91 8310.1 11377.7 3067.6 1228.3 1177.58 661.71 1546.3 475.39 1045.0[13.6] [18.6] [5.0] (40.0) (38.4) (21.6) (50.4) (15.5) (34.1)
1989-90 6623.1 9105.25 2482.15 1030.9 972.0 479.3 1134.3 420.2 927.7[12.8] [17.6] [4.8] (41.5) (39.2) (19.3) (45.7) (16.9) (37.4)
1988-89 5652.2 7454.34 1802.14 604.5 934.1 263.5 951.5 366.3 484.3[12.5] [16.5] [4.0] (33.5) (51.8) (14.6) (52.8) (20.3) (26.9)
1987-88 5331.9 6345.41 1013.51 -252.0 1061.6 203.9 824.9 282.1 -93.6[14.1] [16.8] [2.7] (-24.9) (104.7) (20.1) (81.4) (27.8) (-9.2)
1986-87 4171.6 5582.37 1410.77 177.5 1018.9 214.3 490.6 234.6 685.6[12.4] [16.5] [4.2] (12.6) (72.2) (15.2) (34.8) (16.6) (48.6)
1985-86 3876.8 4934.71 1057.91 -174.6 732.2 500.3 811.4 213.7 32.9[12.7] [16.1] [3.5] (-16.5) (69.2) (47.3) (76.7) (20.2) (3.1)
1984-85 3144.9 4638.54 1493.64 147.3 753.4 593.0 458.5 178.4 856.8[11.8] [17.4] [5.6] (9.9) (50.4) (39.7) (30.7) (11.9) (57.4)
1983-84 2655.4 3737.62 1082.22 105.7 541.4 435.1 388.4 134.7 559.1[11.0] [15.5] [4.5] (9.8) (50.0) (40.2) (35.9) (12.4) (51.7)
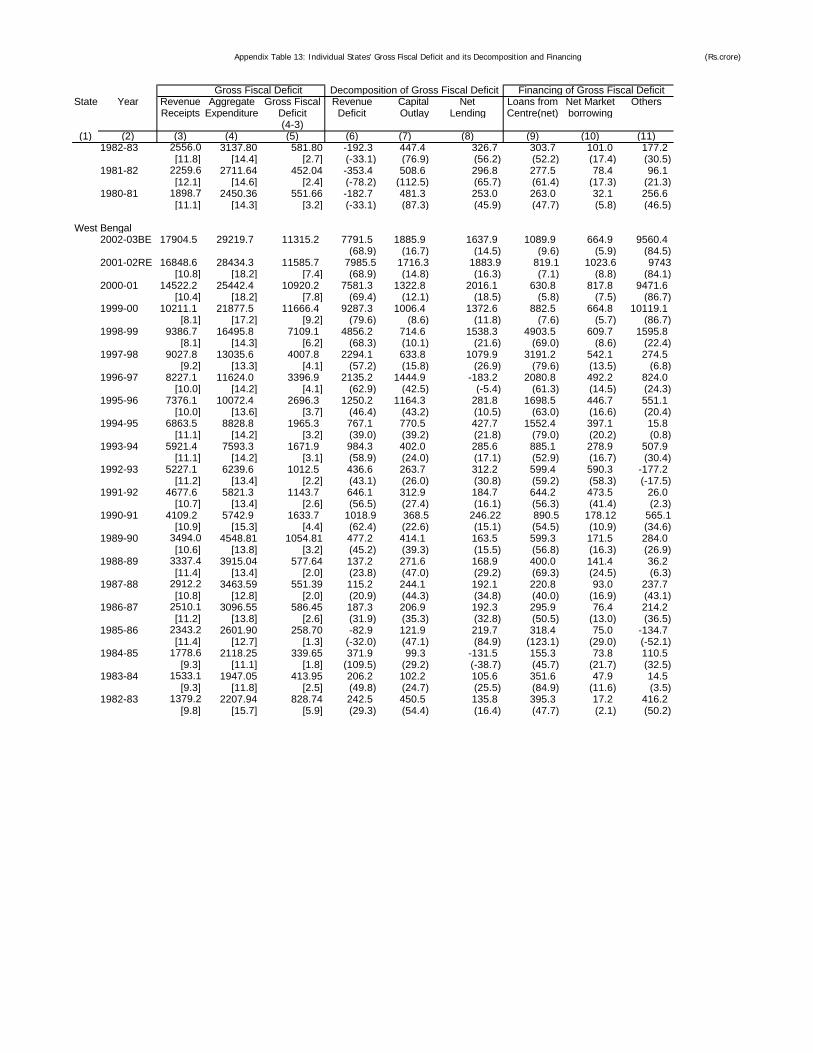
Appendix Table 13: Individual States' Gross Fiscal Deficit and its Decomposition and Financing (Rs.crore)
State Year Revenue Aggregate Gross Fiscal Revenue Capital Net Loans from Net Market OthersReceipts Expenditure Deficit Deficit Outlay Lending Centre(net) borrowing
(4-3)(1) (2) (3) (4) (5) (6) (7) (8) (9) (10) (11)
Gross Fiscal Deficit Decomposition of Gross Fiscal Deficit Financing of Gross Fiscal Deficit
1982-83 2556.0 3137.80 581.80 -192.3 447.4 326.7 303.7 101.0 177.2[11.8] [14.4] [2.7] (-33.1) (76.9) (56.2) (52.2) (17.4) (30.5)
1981-82 2259.6 2711.64 452.04 -353.4 508.6 296.8 277.5 78.4 96.1[12.1] [14.6] [2.4] (-78.2) (112.5) (65.7) (61.4) (17.3) (21.3)
1980-81 1898.7 2450.36 551.66 -182.7 481.3 253.0 263.0 32.1 256.6[11.1] [14.3] [3.2] (-33.1) (87.3) (45.9) (47.7) (5.8) (46.5)
West Bengal2002-03BE 17904.5 29219.7 11315.2 7791.5 1885.9 1637.9 1089.9 664.9 9560.4
(68.9) (16.7) (14.5) (9.6) (5.9) (84.5)2001-02RE 16848.6 28434.3 11585.7 7985.5 1716.3 1883.9 819.1 1023.6 9743
[10.8] [18.2] [7.4] (68.9) (14.8) (16.3) (7.1) (8.8) (84.1)2000-01 14522.2 25442.4 10920.2 7581.3 1322.8 2016.1 630.8 817.8 9471.6
[10.4] [18.2] [7.8] (69.4) (12.1) (18.5) (5.8) (7.5) (86.7)1999-00 10211.1 21877.5 11666.4 9287.3 1006.4 1372.6 882.5 664.8 10119.1
[8.1] [17.2] [9.2] (79.6) (8.6) (11.8) (7.6) (5.7) (86.7)1998-99 9386.7 16495.8 7109.1 4856.2 714.6 1538.3 4903.5 609.7 1595.8
[8.1] [14.3] [6.2] (68.3) (10.1) (21.6) (69.0) (8.6) (22.4)1997-98 9027.8 13035.6 4007.8 2294.1 633.8 1079.9 3191.2 542.1 274.5
[9.2] [13.3] [4.1] (57.2) (15.8) (26.9) (79.6) (13.5) (6.8)1996-97 8227.1 11624.0 3396.9 2135.2 1444.9 -183.2 2080.8 492.2 824.0
[10.0] [14.2] [4.1] (62.9) (42.5) (-5.4) (61.3) (14.5) (24.3)1995-96 7376.1 10072.4 2696.3 1250.2 1164.3 281.8 1698.5 446.7 551.1
[10.0] [13.6] [3.7] (46.4) (43.2) (10.5) (63.0) (16.6) (20.4)1994-95 6863.5 8828.8 1965.3 767.1 770.5 427.7 1552.4 397.1 15.8
[11.1] [14.2] [3.2] (39.0) (39.2) (21.8) (79.0) (20.2) (0.8)1993-94 5921.4 7593.3 1671.9 984.3 402.0 285.6 885.1 278.9 507.9
[11.1] [14.2] [3.1] (58.9) (24.0) (17.1) (52.9) (16.7) (30.4)1992-93 5227.1 6239.6 1012.5 436.6 263.7 312.2 599.4 590.3 -177.2
[11.2] [13.4] [2.2] (43.1) (26.0) (30.8) (59.2) (58.3) (-17.5)1991-92 4677.6 5821.3 1143.7 646.1 312.9 184.7 644.2 473.5 26.0
[10.7] [13.4] [2.6] (56.5) (27.4) (16.1) (56.3) (41.4) (2.3)1990-91 4109.2 5742.9 1633.7 1018.9 368.5 246.22 890.5 178.12 565.1
[10.9] [15.3] [4.4] (62.4) (22.6) (15.1) (54.5) (10.9) (34.6)1989-90 3494.0 4548.81 1054.81 477.2 414.1 163.5 599.3 171.5 284.0
[10.6] [13.8] [3.2] (45.2) (39.3) (15.5) (56.8) (16.3) (26.9)1988-89 3337.4 3915.04 577.64 137.2 271.6 168.9 400.0 141.4 36.2
[11.4] [13.4] [2.0] (23.8) (47.0) (29.2) (69.3) (24.5) (6.3)1987-88 2912.2 3463.59 551.39 115.2 244.1 192.1 220.8 93.0 237.7
[10.8] [12.8] [2.0] (20.9) (44.3) (34.8) (40.0) (16.9) (43.1)1986-87 2510.1 3096.55 586.45 187.3 206.9 192.3 295.9 76.4 214.2
[11.2] [13.8] [2.6] (31.9) (35.3) (32.8) (50.5) (13.0) (36.5)1985-86 2343.2 2601.90 258.70 -82.9 121.9 219.7 318.4 75.0 -134.7
[11.4] [12.7] [1.3] (-32.0) (47.1) (84.9) (123.1) (29.0) (-52.1)1984-85 1778.6 2118.25 339.65 371.9 99.3 -131.5 155.3 73.8 110.5
[9.3] [11.1] [1.8] (109.5) (29.2) (-38.7) (45.7) (21.7) (32.5)1983-84 1533.1 1947.05 413.95 206.2 102.2 105.6 351.6 47.9 14.5
[9.3] [11.8] [2.5] (49.8) (24.7) (25.5) (84.9) (11.6) (3.5)1982-83 1379.2 2207.94 828.74 242.5 450.5 135.8 395.3 17.2 416.2
[9.8] [15.7] [5.9] (29.3) (54.4) (16.4) (47.7) (2.1) (50.2)
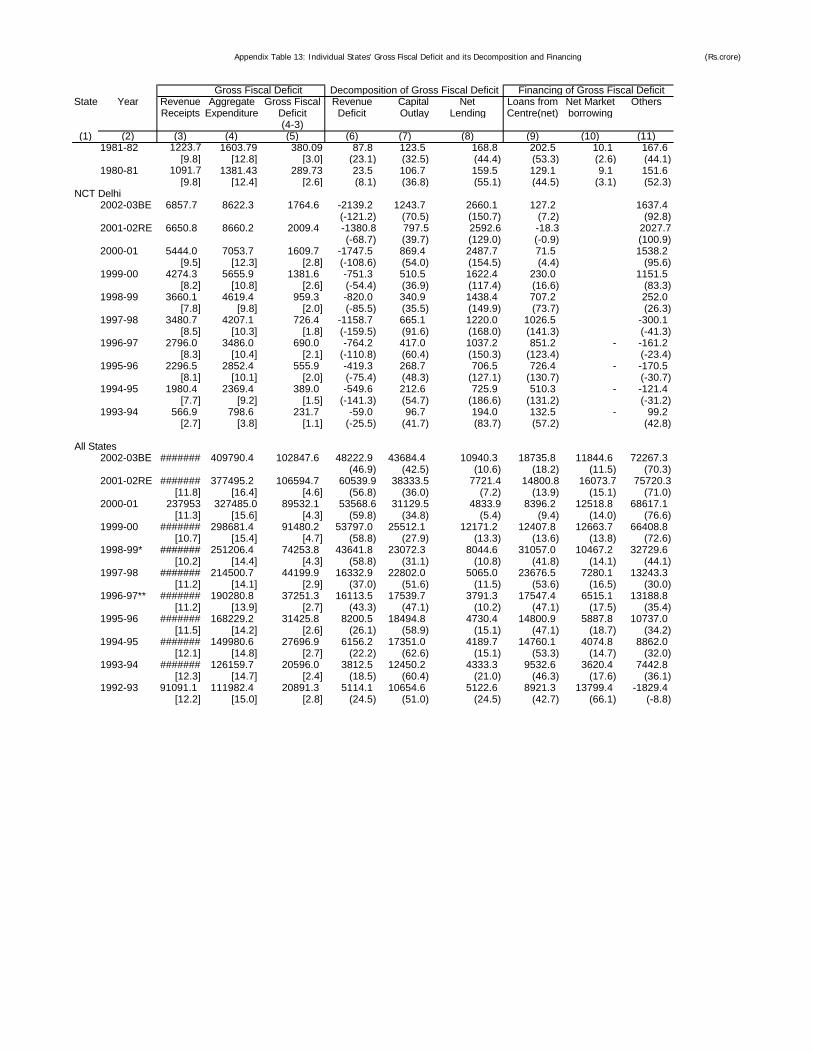
Appendix Table 13: Individual States' Gross Fiscal Deficit and its Decomposition and Financing (Rs.crore)
State Year Revenue Aggregate Gross Fiscal Revenue Capital Net Loans from Net Market OthersReceipts Expenditure Deficit Deficit Outlay Lending Centre(net) borrowing
(4-3)(1) (2) (3) (4) (5) (6) (7) (8) (9) (10) (11)
Gross Fiscal Deficit Decomposition of Gross Fiscal Deficit Financing of Gross Fiscal Deficit
1981-82 1223.7 1603.79 380.09 87.8 123.5 168.8 202.5 10.1 167.6[9.8] [12.8] [3.0] (23.1) (32.5) (44.4) (53.3) (2.6) (44.1)
1980-81 1091.7 1381.43 289.73 23.5 106.7 159.5 129.1 9.1 151.6[9.8] [12.4] [2.6] (8.1) (36.8) (55.1) (44.5) (3.1) (52.3)
NCT Delhi2002-03BE 6857.7 8622.3 1764.6 -2139.2 1243.7 2660.1 127.2 1637.4
(-121.2) (70.5) (150.7) (7.2) (92.8)2001-02RE 6650.8 8660.2 2009.4 -1380.8 797.5 2592.6 -18.3 2027.7
(-68.7) (39.7) (129.0) (-0.9) (100.9)2000-01 5444.0 7053.7 1609.7 -1747.5 869.4 2487.7 71.5 1538.2
[9.5] [12.3] [2.8] (-108.6) (54.0) (154.5) (4.4) (95.6)1999-00 4274.3 5655.9 1381.6 -751.3 510.5 1622.4 230.0 1151.5
[8.2] [10.8] [2.6] (-54.4) (36.9) (117.4) (16.6) (83.3)1998-99 3660.1 4619.4 959.3 -820.0 340.9 1438.4 707.2 252.0
[7.8] [9.8] [2.0] (-85.5) (35.5) (149.9) (73.7) (26.3)1997-98 3480.7 4207.1 726.4 -1158.7 665.1 1220.0 1026.5 -300.1
[8.5] [10.3] [1.8] (-159.5) (91.6) (168.0) (141.3) (-41.3)1996-97 2796.0 3486.0 690.0 -764.2 417.0 1037.2 851.2 - -161.2
[8.3] [10.4] [2.1] (-110.8) (60.4) (150.3) (123.4) (-23.4)1995-96 2296.5 2852.4 555.9 -419.3 268.7 706.5 726.4 - -170.5
[8.1] [10.1] [2.0] (-75.4) (48.3) (127.1) (130.7) (-30.7)1994-95 1980.4 2369.4 389.0 -549.6 212.6 725.9 510.3 - -121.4
[7.7] [9.2] [1.5] (-141.3) (54.7) (186.6) (131.2) (-31.2)1993-94 566.9 798.6 231.7 -59.0 96.7 194.0 132.5 - 99.2
[2.7] [3.8] [1.1] (-25.5) (41.7) (83.7) (57.2) (42.8)
All States2002-03BE ####### 409790.4 102847.6 48222.9 43684.4 10940.3 18735.8 11844.6 72267.3
(46.9) (42.5) (10.6) (18.2) (11.5) (70.3)2001-02RE ####### 377495.2 106594.7 60539.9 38333.5 7721.4 14800.8 16073.7 75720.3
[11.8] [16.4] [4.6] (56.8) (36.0) (7.2) (13.9) (15.1) (71.0)2000-01 237953 327485.0 89532.1 53568.6 31129.5 4833.9 8396.2 12518.8 68617.1
[11.3] [15.6] [4.3] (59.8) (34.8) (5.4) (9.4) (14.0) (76.6)1999-00 ####### 298681.4 91480.2 53797.0 25512.1 12171.2 12407.8 12663.7 66408.8
[10.7] [15.4] [4.7] (58.8) (27.9) (13.3) (13.6) (13.8) (72.6)1998-99* ####### 251206.4 74253.8 43641.8 23072.3 8044.6 31057.0 10467.2 32729.6
[10.2] [14.4] [4.3] (58.8) (31.1) (10.8) (41.8) (14.1) (44.1)1997-98 ####### 214500.7 44199.9 16332.9 22802.0 5065.0 23676.5 7280.1 13243.3
[11.2] [14.1] [2.9] (37.0) (51.6) (11.5) (53.6) (16.5) (30.0)1996-97** ####### 190280.8 37251.3 16113.5 17539.7 3791.3 17547.4 6515.1 13188.8
[11.2] [13.9] [2.7] (43.3) (47.1) (10.2) (47.1) (17.5) (35.4)1995-96 ####### 168229.2 31425.8 8200.5 18494.8 4730.4 14800.9 5887.8 10737.0
[11.5] [14.2] [2.6] (26.1) (58.9) (15.1) (47.1) (18.7) (34.2)1994-95 ####### 149980.6 27696.9 6156.2 17351.0 4189.7 14760.1 4074.8 8862.0
[12.1] [14.8] [2.7] (22.2) (62.6) (15.1) (53.3) (14.7) (32.0)1993-94 ####### 126159.7 20596.0 3812.5 12450.2 4333.3 9532.6 3620.4 7442.8
[12.3] [14.7] [2.4] (18.5) (60.4) (21.0) (46.3) (17.6) (36.1)1992-93 91091.1 111982.4 20891.3 5114.1 10654.6 5122.6 8921.3 13799.4 -1829.4
[12.2] [15.0] [2.8] (24.5) (51.0) (24.5) (42.7) (66.1) (-8.8)
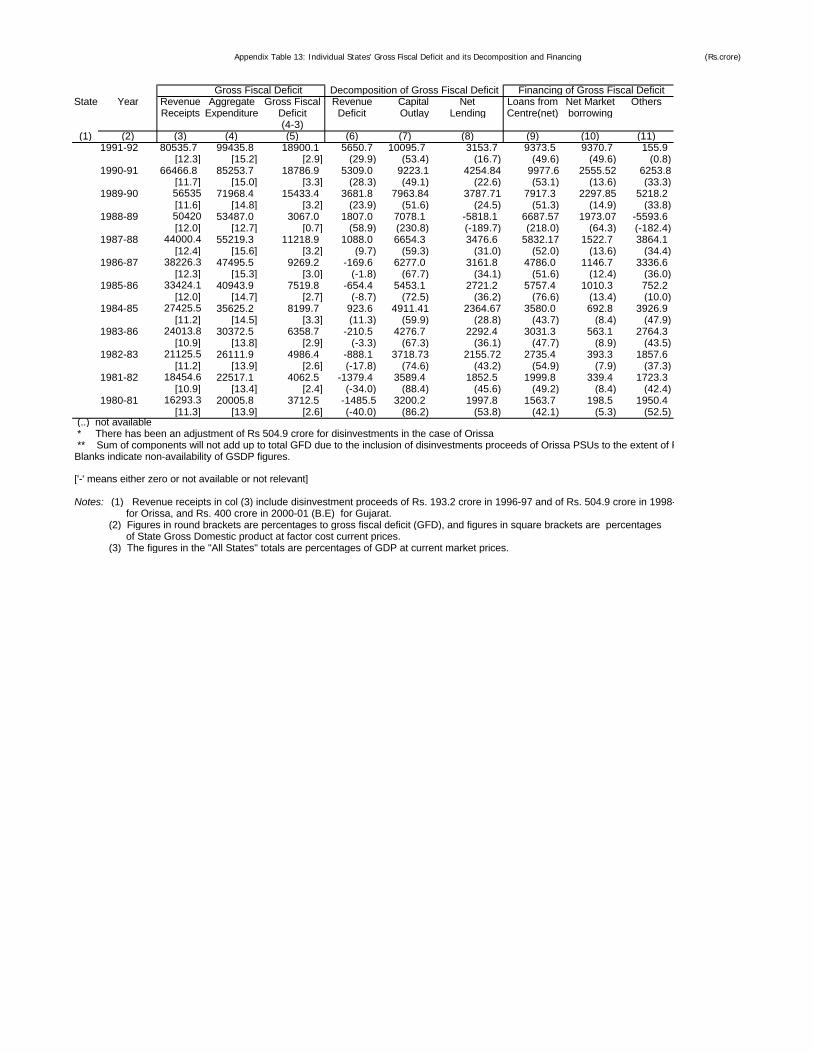
Appendix Table 13: Individual States' Gross Fiscal Deficit and its Decomposition and Financing (Rs.crore)
State Year Revenue Aggregate Gross Fiscal Revenue Capital Net Loans from Net Market OthersReceipts Expenditure Deficit Deficit Outlay Lending Centre(net) borrowing
(4-3)(1) (2) (3) (4) (5) (6) (7) (8) (9) (10) (11)
Gross Fiscal Deficit Decomposition of Gross Fiscal Deficit Financing of Gross Fiscal Deficit
1991-92 80535.7 99435.8 18900.1 5650.7 10095.7 3153.7 9373.5 9370.7 155.9[12.3] [15.2] [2.9] (29.9) (53.4) (16.7) (49.6) (49.6) (0.8)
1990-91 66466.8 85253.7 18786.9 5309.0 9223.1 4254.84 9977.6 2555.52 6253.8[11.7] [15.0] [3.3] (28.3) (49.1) (22.6) (53.1) (13.6) (33.3)
1989-90 56535 71968.4 15433.4 3681.8 7963.84 3787.71 7917.3 2297.85 5218.2[11.6] [14.8] [3.2] (23.9) (51.6) (24.5) (51.3) (14.9) (33.8)
1988-89 50420 53487.0 3067.0 1807.0 7078.1 -5818.1 6687.57 1973.07 -5593.6[12.0] [12.7] [0.7] (58.9) (230.8) (-189.7) (218.0) (64.3) (-182.4)
1987-88 44000.4 55219.3 11218.9 1088.0 6654.3 3476.6 5832.17 1522.7 3864.1[12.4] [15.6] [3.2] (9.7) (59.3) (31.0) (52.0) (13.6) (34.4)
1986-87 38226.3 47495.5 9269.2 -169.6 6277.0 3161.8 4786.0 1146.7 3336.6[12.3] [15.3] [3.0] (-1.8) (67.7) (34.1) (51.6) (12.4) (36.0)
1985-86 33424.1 40943.9 7519.8 -654.4 5453.1 2721.2 5757.4 1010.3 752.2[12.0] [14.7] [2.7] (-8.7) (72.5) (36.2) (76.6) (13.4) (10.0)
1984-85 27425.5 35625.2 8199.7 923.6 4911.41 2364.67 3580.0 692.8 3926.9[11.2] [14.5] [3.3] (11.3) (59.9) (28.8) (43.7) (8.4) (47.9)
1983-86 24013.8 30372.5 6358.7 -210.5 4276.7 2292.4 3031.3 563.1 2764.3[10.9] [13.8] [2.9] (-3.3) (67.3) (36.1) (47.7) (8.9) (43.5)
1982-83 21125.5 26111.9 4986.4 -888.1 3718.73 2155.72 2735.4 393.3 1857.6[11.2] [13.9] [2.6] (-17.8) (74.6) (43.2) (54.9) (7.9) (37.3)
1981-82 18454.6 22517.1 4062.5 -1379.4 3589.4 1852.5 1999.8 339.4 1723.3[10.9] [13.4] [2.4] (-34.0) (88.4) (45.6) (49.2) (8.4) (42.4)
1980-81 16293.3 20005.8 3712.5 -1485.5 3200.2 1997.8 1563.7 198.5 1950.4[11.3] [13.9] [2.6] (-40.0) (86.2) (53.8) (42.1) (5.3) (52.5)
(..) not available * There has been an adjustment of Rs 504.9 crore for disinvestments in the case of Orissa ** Sum of components will not add up to total GFD due to the inclusion of disinvestments proceeds of Orissa PSUs to the extent of Rs 193.2 croreBlanks indicate non-availability of GSDP figures.
['-' means either zero or not available or not relevant]
Notes: (1) Revenue receipts in col (3) include disinvestment proceeds of Rs. 193.2 crore in 1996-97 and of Rs. 504.9 crore in 1998-99 for Orissa, and Rs. 400 crore in 2000-01 (B.E) for Gujarat. (2) Figures in round brackets are percentages to gross fiscal deficit (GFD), and figures in square brackets are percentages of State Gross Domestic product at factor cost current prices. (3) The figures in the "All States" totals are percentages of GDP at current market prices.
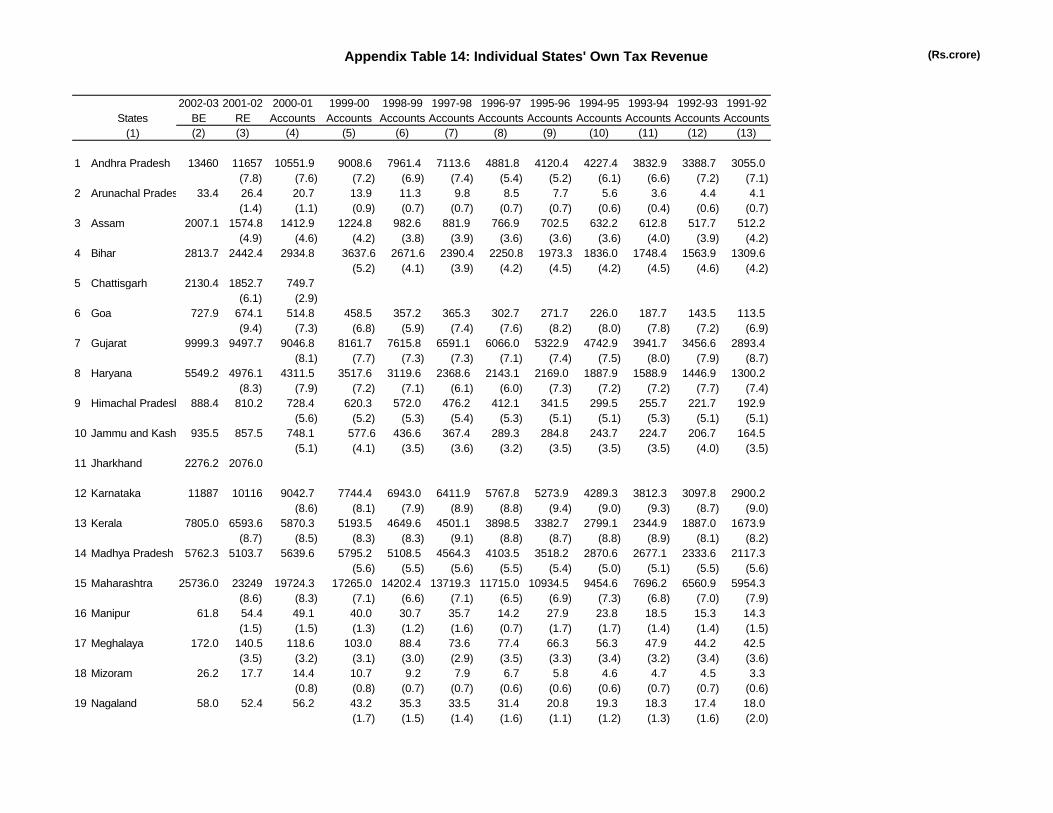
Appendix Table 14: Individual States' Own Tax Revenue (Rs.crore)
2002-03 2001-02 2000-01 1999-00 1998-99 1997-98 1996-97 1995-96 1994-95 1993-94 1992-93 1991-92States BE RE Accounts Accounts Accounts Accounts Accounts Accounts Accounts Accounts Accounts Accounts
(1) (2) (3) (4) (5) (6) (7) (8) (9) (10) (11) (12) (13)
1 Andhra Pradesh 13460 11657 10551.9 9008.6 7961.4 7113.6 4881.8 4120.4 4227.4 3832.9 3388.7 3055.0(7.8) (7.6) (7.2) (6.9) (7.4) (5.4) (5.2) (6.1) (6.6) (7.2) (7.1)
2 Arunachal Pradesh 33.4 26.4 20.7 13.9 11.3 9.8 8.5 7.7 5.6 3.6 4.4 4.1(1.4) (1.1) (0.9) (0.7) (0.7) (0.7) (0.7) (0.6) (0.4) (0.6) (0.7)
3 Assam 2007.1 1574.8 1412.9 1224.8 982.6 881.9 766.9 702.5 632.2 612.8 517.7 512.2(4.9) (4.6) (4.2) (3.8) (3.9) (3.6) (3.6) (3.6) (4.0) (3.9) (4.2)
4 Bihar 2813.7 2442.4 2934.8 3637.6 2671.6 2390.4 2250.8 1973.3 1836.0 1748.4 1563.9 1309.6(5.2) (4.1) (3.9) (4.2) (4.5) (4.2) (4.5) (4.6) (4.2)
5 Chattisgarh 2130.4 1852.7 749.7(6.1) (2.9)
6 Goa 727.9 674.1 514.8 458.5 357.2 365.3 302.7 271.7 226.0 187.7 143.5 113.5(9.4) (7.3) (6.8) (5.9) (7.4) (7.6) (8.2) (8.0) (7.8) (7.2) (6.9)
7 Gujarat 9999.3 9497.7 9046.8 8161.7 7615.8 6591.1 6066.0 5322.9 4742.9 3941.7 3456.6 2893.4(8.1) (7.7) (7.3) (7.3) (7.1) (7.4) (7.5) (8.0) (7.9) (8.7)
8 Haryana 5549.2 4976.1 4311.5 3517.6 3119.6 2368.6 2143.1 2169.0 1887.9 1588.9 1446.9 1300.2(8.3) (7.9) (7.2) (7.1) (6.1) (6.0) (7.3) (7.2) (7.2) (7.7) (7.4)
9 Himachal Pradesh 888.4 810.2 728.4 620.3 572.0 476.2 412.1 341.5 299.5 255.7 221.7 192.9(5.6) (5.2) (5.3) (5.4) (5.3) (5.1) (5.1) (5.3) (5.1) (5.1)
10 Jammu and Kashmir935.5 857.5 748.1 577.6 436.6 367.4 289.3 284.8 243.7 224.7 206.7 164.5(5.1) (4.1) (3.5) (3.6) (3.2) (3.5) (3.5) (3.5) (4.0) (3.5)
11 Jharkhand 2276.2 2076.0
12 Karnataka 11887 10116 9042.7 7744.4 6943.0 6411.9 5767.8 5273.9 4289.3 3812.3 3097.8 2900.2(8.6) (8.1) (7.9) (8.9) (8.8) (9.4) (9.0) (9.3) (8.7) (9.0)
13 Kerala 7805.0 6593.6 5870.3 5193.5 4649.6 4501.1 3898.5 3382.7 2799.1 2344.9 1887.0 1673.9(8.7) (8.5) (8.3) (8.3) (9.1) (8.8) (8.7) (8.8) (8.9) (8.1) (8.2)
14 Madhya Pradesh 5762.3 5103.7 5639.6 5795.2 5108.5 4564.3 4103.5 3518.2 2870.6 2677.1 2333.6 2117.3(5.6) (5.5) (5.6) (5.5) (5.4) (5.0) (5.1) (5.5) (5.6)
15 Maharashtra 25736.0 23249 19724.3 17265.0 14202.4 13719.3 11715.0 10934.5 9454.6 7696.2 6560.9 5954.3(8.6) (8.3) (7.1) (6.6) (7.1) (6.5) (6.9) (7.3) (6.8) (7.0) (7.9)
16 Manipur 61.8 54.4 49.1 40.0 30.7 35.7 14.2 27.9 23.8 18.5 15.3 14.3(1.5) (1.5) (1.3) (1.2) (1.6) (0.7) (1.7) (1.7) (1.4) (1.4) (1.5)
17 Meghalaya 172.0 140.5 118.6 103.0 88.4 73.6 77.4 66.3 56.3 47.9 44.2 42.5(3.5) (3.2) (3.1) (3.0) (2.9) (3.5) (3.3) (3.4) (3.2) (3.4) (3.6)
18 Mizoram 26.2 17.7 14.4 10.7 9.2 7.9 6.7 5.8 4.6 4.7 4.5 3.3(0.8) (0.8) (0.7) (0.7) (0.6) (0.6) (0.6) (0.7) (0.7) (0.6)
19 Nagaland 58.0 52.4 56.2 43.2 35.3 33.5 31.4 20.8 19.3 18.3 17.4 18.0(1.7) (1.5) (1.4) (1.6) (1.1) (1.2) (1.3) (1.6) (2.0)
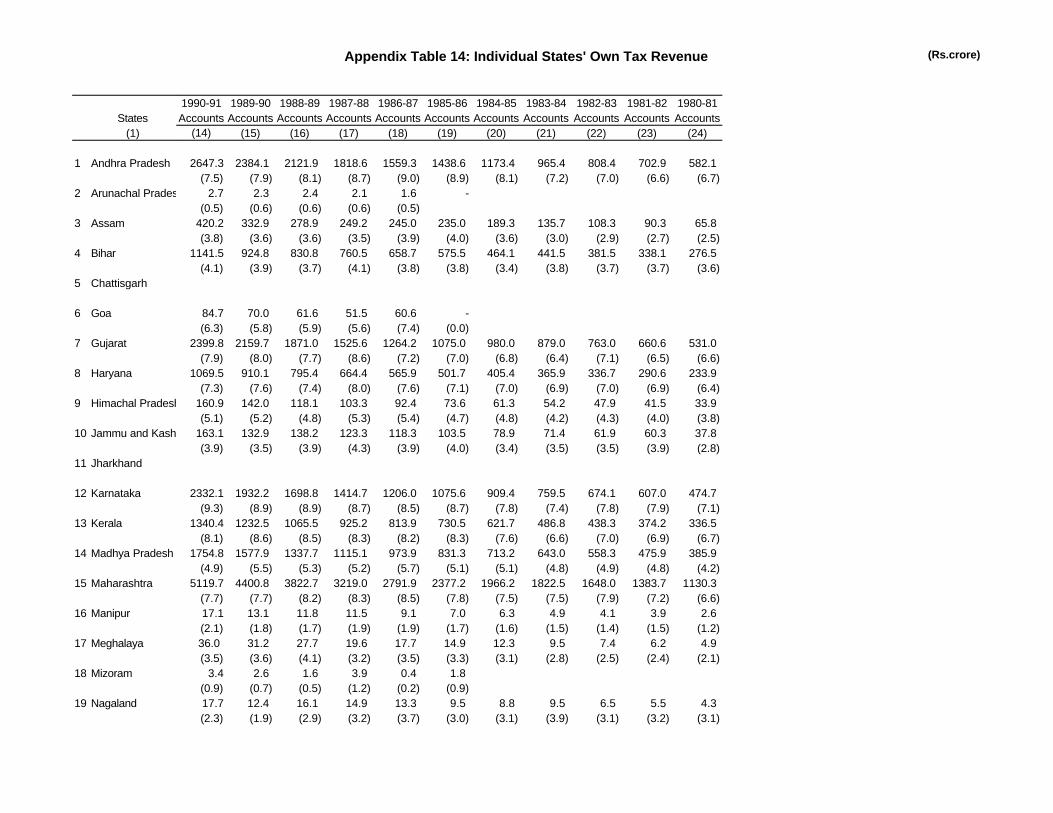
Appendix Table 14: Individual States' Own Tax Revenue (Rs.crore)
States(1)
1 Andhra Pradesh
2 Arunachal Pradesh
3 Assam
4 Bihar
5 Chattisgarh
6 Goa
7 Gujarat
8 Haryana
9 Himachal Pradesh
10 Jammu and Kashmir
11 Jharkhand
12 Karnataka
13 Kerala
14 Madhya Pradesh
15 Maharashtra
16 Manipur
17 Meghalaya
18 Mizoram
19 Nagaland
1990-91 1989-90 1988-89 1987-88 1986-87 1985-86 1984-85 1983-84 1982-83 1981-82 1980-81Accounts Accounts Accounts Accounts Accounts Accounts Accounts Accounts Accounts Accounts Accounts
(14) (15) (16) (17) (18) (19) (20) (21) (22) (23) (24)
2647.3 2384.1 2121.9 1818.6 1559.3 1438.6 1173.4 965.4 808.4 702.9 582.1(7.5) (7.9) (8.1) (8.7) (9.0) (8.9) (8.1) (7.2) (7.0) (6.6) (6.7)
2.7 2.3 2.4 2.1 1.6 -(0.5) (0.6) (0.6) (0.6) (0.5)
420.2 332.9 278.9 249.2 245.0 235.0 189.3 135.7 108.3 90.3 65.8(3.8) (3.6) (3.6) (3.5) (3.9) (4.0) (3.6) (3.0) (2.9) (2.7) (2.5)
1141.5 924.8 830.8 760.5 658.7 575.5 464.1 441.5 381.5 338.1 276.5(4.1) (3.9) (3.7) (4.1) (3.8) (3.8) (3.4) (3.8) (3.7) (3.7) (3.6)
84.7 70.0 61.6 51.5 60.6 -(6.3) (5.8) (5.9) (5.6) (7.4) (0.0)
2399.8 2159.7 1871.0 1525.6 1264.2 1075.0 980.0 879.0 763.0 660.6 531.0(7.9) (8.0) (7.7) (8.6) (7.2) (7.0) (6.8) (6.4) (7.1) (6.5) (6.6)
1069.5 910.1 795.4 664.4 565.9 501.7 405.4 365.9 336.7 290.6 233.9(7.3) (7.6) (7.4) (8.0) (7.6) (7.1) (7.0) (6.9) (7.0) (6.9) (6.4)
160.9 142.0 118.1 103.3 92.4 73.6 61.3 54.2 47.9 41.5 33.9(5.1) (5.2) (4.8) (5.3) (5.4) (4.7) (4.8) (4.2) (4.3) (4.0) (3.8)
163.1 132.9 138.2 123.3 118.3 103.5 78.9 71.4 61.9 60.3 37.8(3.9) (3.5) (3.9) (4.3) (3.9) (4.0) (3.4) (3.5) (3.5) (3.9) (2.8)
2332.1 1932.2 1698.8 1414.7 1206.0 1075.6 909.4 759.5 674.1 607.0 474.7(9.3) (8.9) (8.9) (8.7) (8.5) (8.7) (7.8) (7.4) (7.8) (7.9) (7.1)
1340.4 1232.5 1065.5 925.2 813.9 730.5 621.7 486.8 438.3 374.2 336.5(8.1) (8.6) (8.5) (8.3) (8.2) (8.3) (7.6) (6.6) (7.0) (6.9) (6.7)
1754.8 1577.9 1337.7 1115.1 973.9 831.3 713.2 643.0 558.3 475.9 385.9(4.9) (5.5) (5.3) (5.2) (5.7) (5.1) (5.1) (4.8) (4.9) (4.8) (4.2)
5119.7 4400.8 3822.7 3219.0 2791.9 2377.2 1966.2 1822.5 1648.0 1383.7 1130.3(7.7) (7.7) (8.2) (8.3) (8.5) (7.8) (7.5) (7.5) (7.9) (7.2) (6.6)17.1 13.1 11.8 11.5 9.1 7.0 6.3 4.9 4.1 3.9 2.6(2.1) (1.8) (1.7) (1.9) (1.9) (1.7) (1.6) (1.5) (1.4) (1.5) (1.2)36.0 31.2 27.7 19.6 17.7 14.9 12.3 9.5 7.4 6.2 4.9(3.5) (3.6) (4.1) (3.2) (3.5) (3.3) (3.1) (2.8) (2.5) (2.4) (2.1)
3.4 2.6 1.6 3.9 0.4 1.8(0.9) (0.7) (0.5) (1.2) (0.2) (0.9)17.7 12.4 16.1 14.9 13.3 9.5 8.8 9.5 6.5 5.5 4.3(2.3) (1.9) (2.9) (3.2) (3.7) (3.0) (3.1) (3.9) (3.1) (3.2) (3.1)
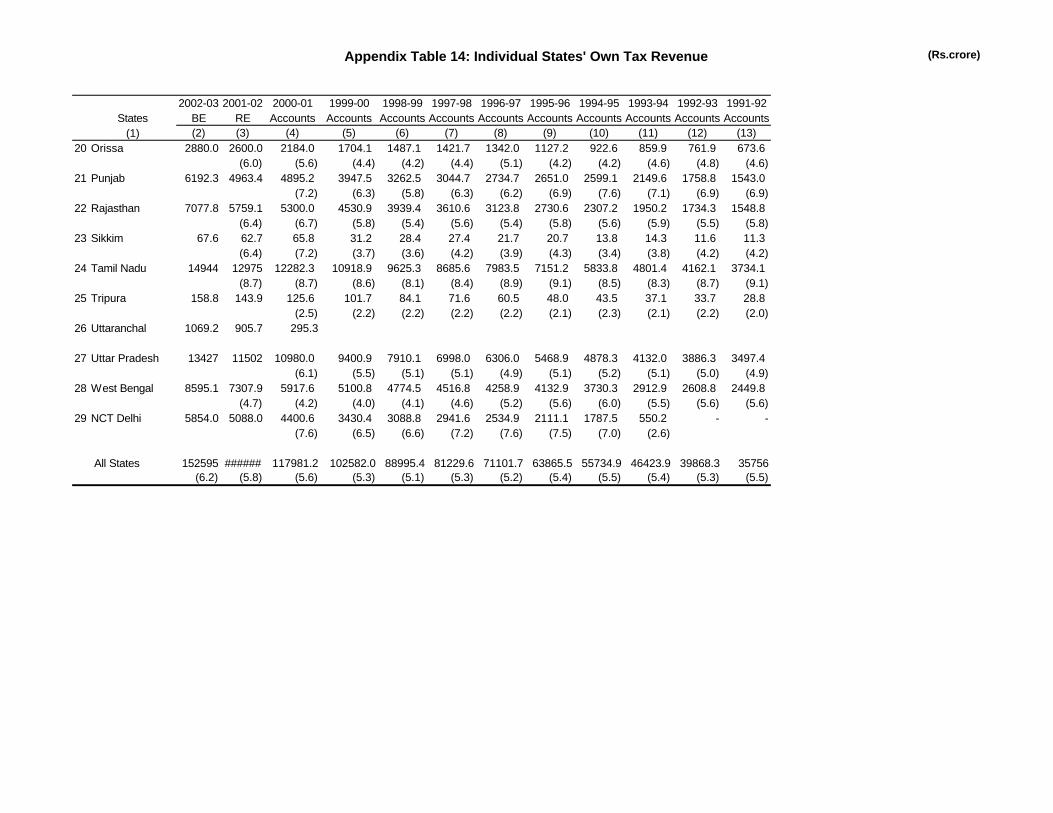
Appendix Table 14: Individual States' Own Tax Revenue (Rs.crore)
2002-03 2001-02 2000-01 1999-00 1998-99 1997-98 1996-97 1995-96 1994-95 1993-94 1992-93 1991-92States BE RE Accounts Accounts Accounts Accounts Accounts Accounts Accounts Accounts Accounts Accounts
(1) (2) (3) (4) (5) (6) (7) (8) (9) (10) (11) (12) (13)20 Orissa 2880.0 2600.0 2184.0 1704.1 1487.1 1421.7 1342.0 1127.2 922.6 859.9 761.9 673.6
(6.0) (5.6) (4.4) (4.2) (4.4) (5.1) (4.2) (4.2) (4.6) (4.8) (4.6)21 Punjab 6192.3 4963.4 4895.2 3947.5 3262.5 3044.7 2734.7 2651.0 2599.1 2149.6 1758.8 1543.0
(7.2) (6.3) (5.8) (6.3) (6.2) (6.9) (7.6) (7.1) (6.9) (6.9)22 Rajasthan 7077.8 5759.1 5300.0 4530.9 3939.4 3610.6 3123.8 2730.6 2307.2 1950.2 1734.3 1548.8
(6.4) (6.7) (5.8) (5.4) (5.6) (5.4) (5.8) (5.6) (5.9) (5.5) (5.8)23 Sikkim 67.6 62.7 65.8 31.2 28.4 27.4 21.7 20.7 13.8 14.3 11.6 11.3
(6.4) (7.2) (3.7) (3.6) (4.2) (3.9) (4.3) (3.4) (3.8) (4.2) (4.2)24 Tamil Nadu 14944 12975 12282.3 10918.9 9625.3 8685.6 7983.5 7151.2 5833.8 4801.4 4162.1 3734.1
(8.7) (8.7) (8.6) (8.1) (8.4) (8.9) (9.1) (8.5) (8.3) (8.7) (9.1)25 Tripura 158.8 143.9 125.6 101.7 84.1 71.6 60.5 48.0 43.5 37.1 33.7 28.8
(2.5) (2.2) (2.2) (2.2) (2.2) (2.1) (2.3) (2.1) (2.2) (2.0)26 Uttaranchal 1069.2 905.7 295.3
27 Uttar Pradesh 13427 11502 10980.0 9400.9 7910.1 6998.0 6306.0 5468.9 4878.3 4132.0 3886.3 3497.4(6.1) (5.5) (5.1) (5.1) (4.9) (5.1) (5.2) (5.1) (5.0) (4.9)
28 West Bengal 8595.1 7307.9 5917.6 5100.8 4774.5 4516.8 4258.9 4132.9 3730.3 2912.9 2608.8 2449.8(4.7) (4.2) (4.0) (4.1) (4.6) (5.2) (5.6) (6.0) (5.5) (5.6) (5.6)
29 NCT Delhi 5854.0 5088.0 4400.6 3430.4 3088.8 2941.6 2534.9 2111.1 1787.5 550.2 - -(7.6) (6.5) (6.6) (7.2) (7.6) (7.5) (7.0) (2.6)
All States 152595 ###### 117981.2 102582.0 88995.4 81229.6 71101.7 63865.5 55734.9 46423.9 39868.3 35756(6.2) (5.8) (5.6) (5.3) (5.1) (5.3) (5.2) (5.4) (5.5) (5.4) (5.3) (5.5)
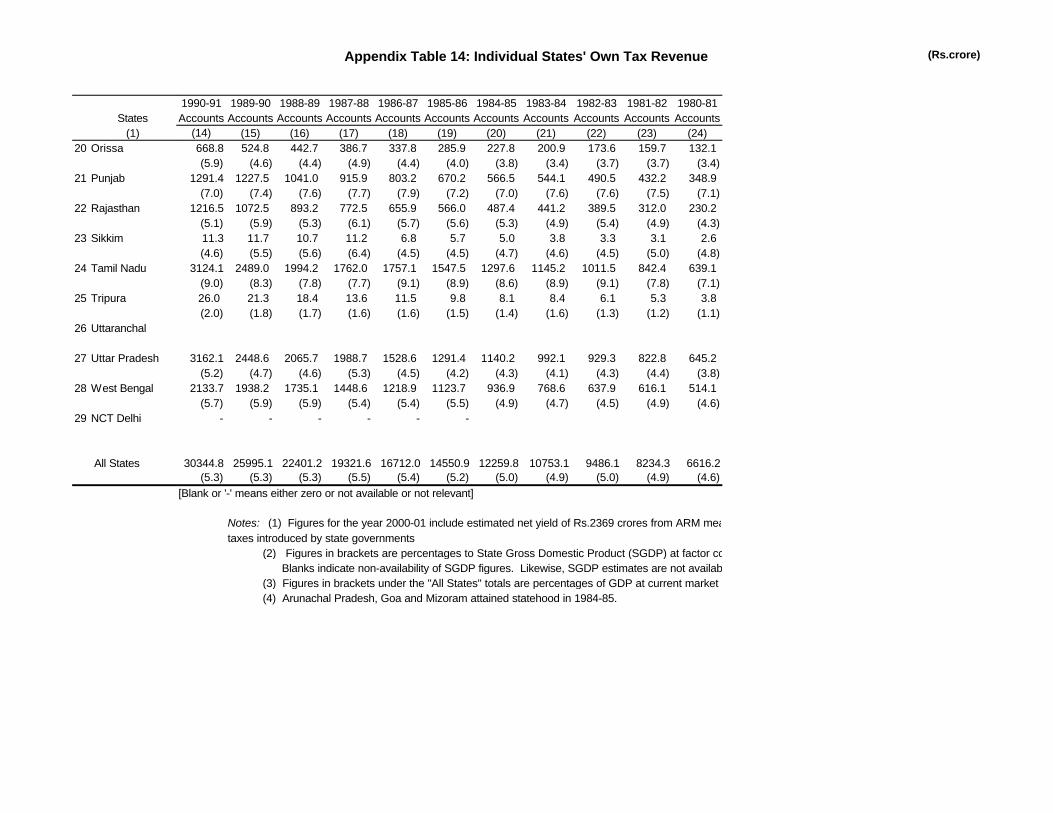
Appendix Table 14: Individual States' Own Tax Revenue (Rs.crore)
States(1)
20 Orissa
21 Punjab
22 Rajasthan
23 Sikkim
24 Tamil Nadu
25 Tripura
26 Uttaranchal
27 Uttar Pradesh
28 West Bengal
29 NCT Delhi
All States
1990-91 1989-90 1988-89 1987-88 1986-87 1985-86 1984-85 1983-84 1982-83 1981-82 1980-81Accounts Accounts Accounts Accounts Accounts Accounts Accounts Accounts Accounts Accounts Accounts
(14) (15) (16) (17) (18) (19) (20) (21) (22) (23) (24)668.8 524.8 442.7 386.7 337.8 285.9 227.8 200.9 173.6 159.7 132.1(5.9) (4.6) (4.4) (4.9) (4.4) (4.0) (3.8) (3.4) (3.7) (3.7) (3.4)
1291.4 1227.5 1041.0 915.9 803.2 670.2 566.5 544.1 490.5 432.2 348.9(7.0) (7.4) (7.6) (7.7) (7.9) (7.2) (7.0) (7.6) (7.6) (7.5) (7.1)
1216.5 1072.5 893.2 772.5 655.9 566.0 487.4 441.2 389.5 312.0 230.2(5.1) (5.9) (5.3) (6.1) (5.7) (5.6) (5.3) (4.9) (5.4) (4.9) (4.3)11.3 11.7 10.7 11.2 6.8 5.7 5.0 3.8 3.3 3.1 2.6(4.6) (5.5) (5.6) (6.4) (4.5) (4.5) (4.7) (4.6) (4.5) (5.0) (4.8)
3124.1 2489.0 1994.2 1762.0 1757.1 1547.5 1297.6 1145.2 1011.5 842.4 639.1(9.0) (8.3) (7.8) (7.7) (9.1) (8.9) (8.6) (8.9) (9.1) (7.8) (7.1)26.0 21.3 18.4 13.6 11.5 9.8 8.1 8.4 6.1 5.3 3.8(2.0) (1.8) (1.7) (1.6) (1.6) (1.5) (1.4) (1.6) (1.3) (1.2) (1.1)
3162.1 2448.6 2065.7 1988.7 1528.6 1291.4 1140.2 992.1 929.3 822.8 645.2(5.2) (4.7) (4.6) (5.3) (4.5) (4.2) (4.3) (4.1) (4.3) (4.4) (3.8)
2133.7 1938.2 1735.1 1448.6 1218.9 1123.7 936.9 768.6 637.9 616.1 514.1(5.7) (5.9) (5.9) (5.4) (5.4) (5.5) (4.9) (4.7) (4.5) (4.9) (4.6)
- - - - - -
30344.8 25995.1 22401.2 19321.6 16712.0 14550.9 12259.8 10753.1 9486.1 8234.3 6616.2(5.3) (5.3) (5.3) (5.5) (5.4) (5.2) (5.0) (4.9) (5.0) (4.9) (4.6)
[Blank or '-' means either zero or not available or not relevant]
Notes: (1) Figures for the year 2000-01 include estimated net yield of Rs.2369 crores from ARM measures through .taxes introduced by state governments (2) Figures in brackets are percentages to State Gross Domestic Product (SGDP) at factor cost current prices. Blanks indicate non-availability of SGDP figures. Likewise, SGDP estimates are not available beyond 1998- 99. (3) Figures in brackets under the "All States" totals are percentages of GDP at current market prices. (4) Arunachal Pradesh, Goa and Mizoram attained statehood in 1984-85.
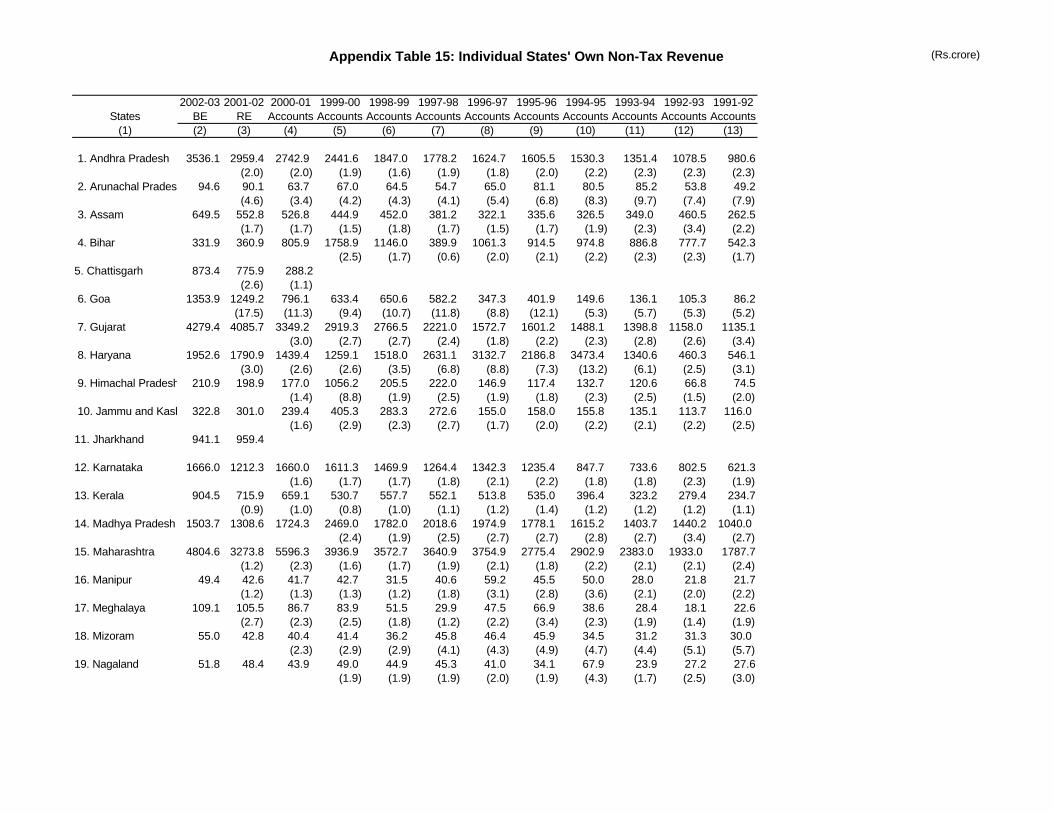
Appendix Table 15: Individual States' Own Non-Tax Revenue (Rs.crore)
2002-03 2001-02 2000-01 1999-00 1998-99 1997-98 1996-97 1995-96 1994-95 1993-94 1992-93 1991-92States BE RE Accounts Accounts Accounts Accounts Accounts Accounts Accounts Accounts Accounts Accounts
(1) (2) (3) (4) (5) (6) (7) (8) (9) (10) (11) (12) (13)
1. Andhra Pradesh 3536.1 2959.4 2742.9 2441.6 1847.0 1778.2 1624.7 1605.5 1530.3 1351.4 1078.5 980.6(2.0) (2.0) (1.9) (1.6) (1.9) (1.8) (2.0) (2.2) (2.3) (2.3) (2.3)
2. Arunachal Pradesh 94.6 90.1 63.7 67.0 64.5 54.7 65.0 81.1 80.5 85.2 53.8 49.2(4.6) (3.4) (4.2) (4.3) (4.1) (5.4) (6.8) (8.3) (9.7) (7.4) (7.9)
3. Assam 649.5 552.8 526.8 444.9 452.0 381.2 322.1 335.6 326.5 349.0 460.5 262.5(1.7) (1.7) (1.5) (1.8) (1.7) (1.5) (1.7) (1.9) (2.3) (3.4) (2.2)
4. Bihar 331.9 360.9 805.9 1758.9 1146.0 389.9 1061.3 914.5 974.8 886.8 777.7 542.3(2.5) (1.7) (0.6) (2.0) (2.1) (2.2) (2.3) (2.3) (1.7)
5. Chattisgarh 873.4 775.9 288.2(2.6) (1.1)
6. Goa 1353.9 1249.2 796.1 633.4 650.6 582.2 347.3 401.9 149.6 136.1 105.3 86.2(17.5) (11.3) (9.4) (10.7) (11.8) (8.8) (12.1) (5.3) (5.7) (5.3) (5.2)
7. Gujarat 4279.4 4085.7 3349.2 2919.3 2766.5 2221.0 1572.7 1601.2 1488.1 1398.8 1158.0 1135.1(3.0) (2.7) (2.7) (2.4) (1.8) (2.2) (2.3) (2.8) (2.6) (3.4)
8. Haryana 1952.6 1790.9 1439.4 1259.1 1518.0 2631.1 3132.7 2186.8 3473.4 1340.6 460.3 546.1(3.0) (2.6) (2.6) (3.5) (6.8) (8.8) (7.3) (13.2) (6.1) (2.5) (3.1)
9. Himachal Pradesh 210.9 198.9 177.0 1056.2 205.5 222.0 146.9 117.4 132.7 120.6 66.8 74.5(1.4) (8.8) (1.9) (2.5) (1.9) (1.8) (2.3) (2.5) (1.5) (2.0)
10. Jammu and Kashmir322.8 301.0 239.4 405.3 283.3 272.6 155.0 158.0 155.8 135.1 113.7 116.0(1.6) (2.9) (2.3) (2.7) (1.7) (2.0) (2.2) (2.1) (2.2) (2.5)
11. Jharkhand 941.1 959.4
12. Karnataka 1666.0 1212.3 1660.0 1611.3 1469.9 1264.4 1342.3 1235.4 847.7 733.6 802.5 621.3(1.6) (1.7) (1.7) (1.8) (2.1) (2.2) (1.8) (1.8) (2.3) (1.9)
13. Kerala 904.5 715.9 659.1 530.7 557.7 552.1 513.8 535.0 396.4 323.2 279.4 234.7(0.9) (1.0) (0.8) (1.0) (1.1) (1.2) (1.4) (1.2) (1.2) (1.2) (1.1)
14. Madhya Pradesh 1503.7 1308.6 1724.3 2469.0 1782.0 2018.6 1974.9 1778.1 1615.2 1403.7 1440.2 1040.0(2.4) (1.9) (2.5) (2.7) (2.7) (2.8) (2.7) (3.4) (2.7)
15. Maharashtra 4804.6 3273.8 5596.3 3936.9 3572.7 3640.9 3754.9 2775.4 2902.9 2383.0 1933.0 1787.7(1.2) (2.3) (1.6) (1.7) (1.9) (2.1) (1.8) (2.2) (2.1) (2.1) (2.4)
16. Manipur 49.4 42.6 41.7 42.7 31.5 40.6 59.2 45.5 50.0 28.0 21.8 21.7(1.2) (1.3) (1.3) (1.2) (1.8) (3.1) (2.8) (3.6) (2.1) (2.0) (2.2)
17. Meghalaya 109.1 105.5 86.7 83.9 51.5 29.9 47.5 66.9 38.6 28.4 18.1 22.6(2.7) (2.3) (2.5) (1.8) (1.2) (2.2) (3.4) (2.3) (1.9) (1.4) (1.9)
18. Mizoram 55.0 42.8 40.4 41.4 36.2 45.8 46.4 45.9 34.5 31.2 31.3 30.0(2.3) (2.9) (2.9) (4.1) (4.3) (4.9) (4.7) (4.4) (5.1) (5.7)
19. Nagaland 51.8 48.4 43.9 49.0 44.9 45.3 41.0 34.1 67.9 23.9 27.2 27.6(1.9) (1.9) (1.9) (2.0) (1.9) (4.3) (1.7) (2.5) (3.0)
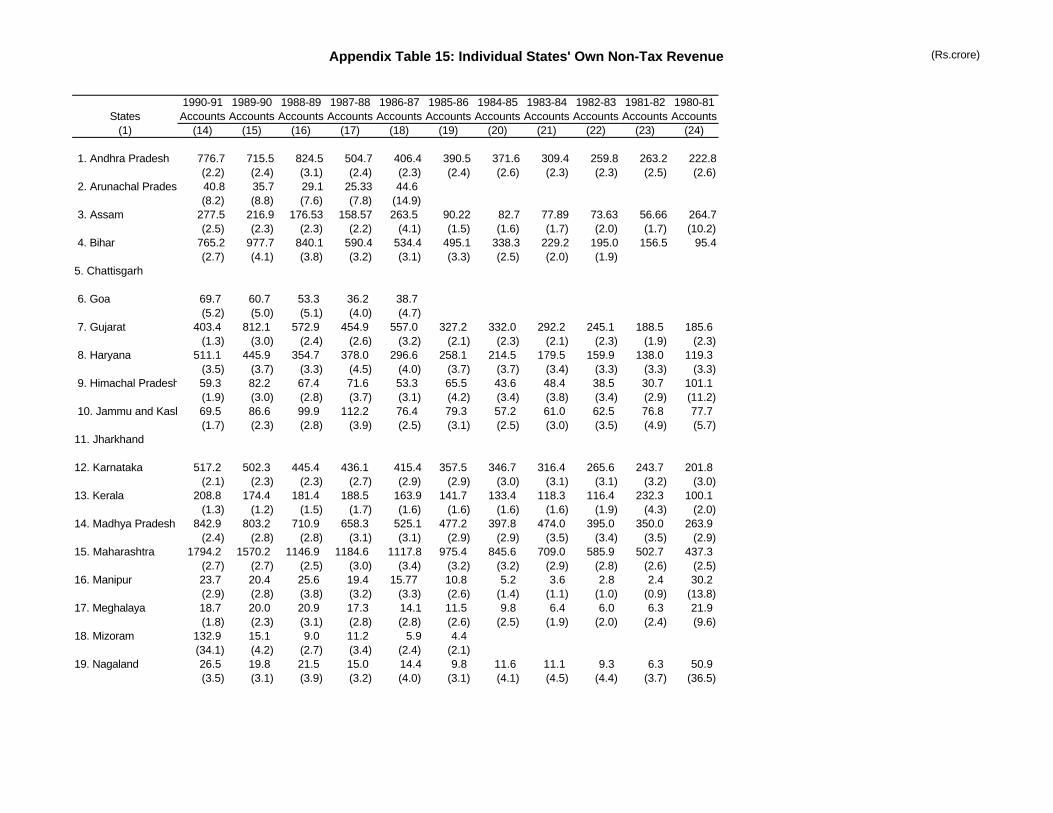
Appendix Table 15: Individual States' Own Non-Tax Revenue (Rs.crore)
States(1)
1. Andhra Pradesh
2. Arunachal Pradesh
3. Assam
4. Bihar
5. Chattisgarh
6. Goa
7. Gujarat
8. Haryana
9. Himachal Pradesh
10. Jammu and Kashmir
11. Jharkhand
12. Karnataka
13. Kerala
14. Madhya Pradesh
15. Maharashtra
16. Manipur
17. Meghalaya
18. Mizoram
19. Nagaland
1990-91 1989-90 1988-89 1987-88 1986-87 1985-86 1984-85 1983-84 1982-83 1981-82 1980-81Accounts Accounts Accounts Accounts Accounts Accounts Accounts Accounts Accounts Accounts Accounts
(14) (15) (16) (17) (18) (19) (20) (21) (22) (23) (24)
776.7 715.5 824.5 504.7 406.4 390.5 371.6 309.4 259.8 263.2 222.8(2.2) (2.4) (3.1) (2.4) (2.3) (2.4) (2.6) (2.3) (2.3) (2.5) (2.6)40.8 35.7 29.1 25.33 44.6(8.2) (8.8) (7.6) (7.8) (14.9)
277.5 216.9 176.53 158.57 263.5 90.22 82.7 77.89 73.63 56.66 264.7(2.5) (2.3) (2.3) (2.2) (4.1) (1.5) (1.6) (1.7) (2.0) (1.7) (10.2)
765.2 977.7 840.1 590.4 534.4 495.1 338.3 229.2 195.0 156.5 95.4(2.7) (4.1) (3.8) (3.2) (3.1) (3.3) (2.5) (2.0) (1.9)
69.7 60.7 53.3 36.2 38.7(5.2) (5.0) (5.1) (4.0) (4.7)
403.4 812.1 572.9 454.9 557.0 327.2 332.0 292.2 245.1 188.5 185.6(1.3) (3.0) (2.4) (2.6) (3.2) (2.1) (2.3) (2.1) (2.3) (1.9) (2.3)
511.1 445.9 354.7 378.0 296.6 258.1 214.5 179.5 159.9 138.0 119.3(3.5) (3.7) (3.3) (4.5) (4.0) (3.7) (3.7) (3.4) (3.3) (3.3) (3.3)59.3 82.2 67.4 71.6 53.3 65.5 43.6 48.4 38.5 30.7 101.1(1.9) (3.0) (2.8) (3.7) (3.1) (4.2) (3.4) (3.8) (3.4) (2.9) (11.2)69.5 86.6 99.9 112.2 76.4 79.3 57.2 61.0 62.5 76.8 77.7(1.7) (2.3) (2.8) (3.9) (2.5) (3.1) (2.5) (3.0) (3.5) (4.9) (5.7)
517.2 502.3 445.4 436.1 415.4 357.5 346.7 316.4 265.6 243.7 201.8(2.1) (2.3) (2.3) (2.7) (2.9) (2.9) (3.0) (3.1) (3.1) (3.2) (3.0)
208.8 174.4 181.4 188.5 163.9 141.7 133.4 118.3 116.4 232.3 100.1(1.3) (1.2) (1.5) (1.7) (1.6) (1.6) (1.6) (1.6) (1.9) (4.3) (2.0)
842.9 803.2 710.9 658.3 525.1 477.2 397.8 474.0 395.0 350.0 263.9(2.4) (2.8) (2.8) (3.1) (3.1) (2.9) (2.9) (3.5) (3.4) (3.5) (2.9)
1794.2 1570.2 1146.9 1184.6 1117.8 975.4 845.6 709.0 585.9 502.7 437.3(2.7) (2.7) (2.5) (3.0) (3.4) (3.2) (3.2) (2.9) (2.8) (2.6) (2.5)23.7 20.4 25.6 19.4 15.77 10.8 5.2 3.6 2.8 2.4 30.2(2.9) (2.8) (3.8) (3.2) (3.3) (2.6) (1.4) (1.1) (1.0) (0.9) (13.8)18.7 20.0 20.9 17.3 14.1 11.5 9.8 6.4 6.0 6.3 21.9(1.8) (2.3) (3.1) (2.8) (2.8) (2.6) (2.5) (1.9) (2.0) (2.4) (9.6)
132.9 15.1 9.0 11.2 5.9 4.4(34.1) (4.2) (2.7) (3.4) (2.4) (2.1)26.5 19.8 21.5 15.0 14.4 9.8 11.6 11.1 9.3 6.3 50.9(3.5) (3.1) (3.9) (3.2) (4.0) (3.1) (4.1) (4.5) (4.4) (3.7) (36.5)
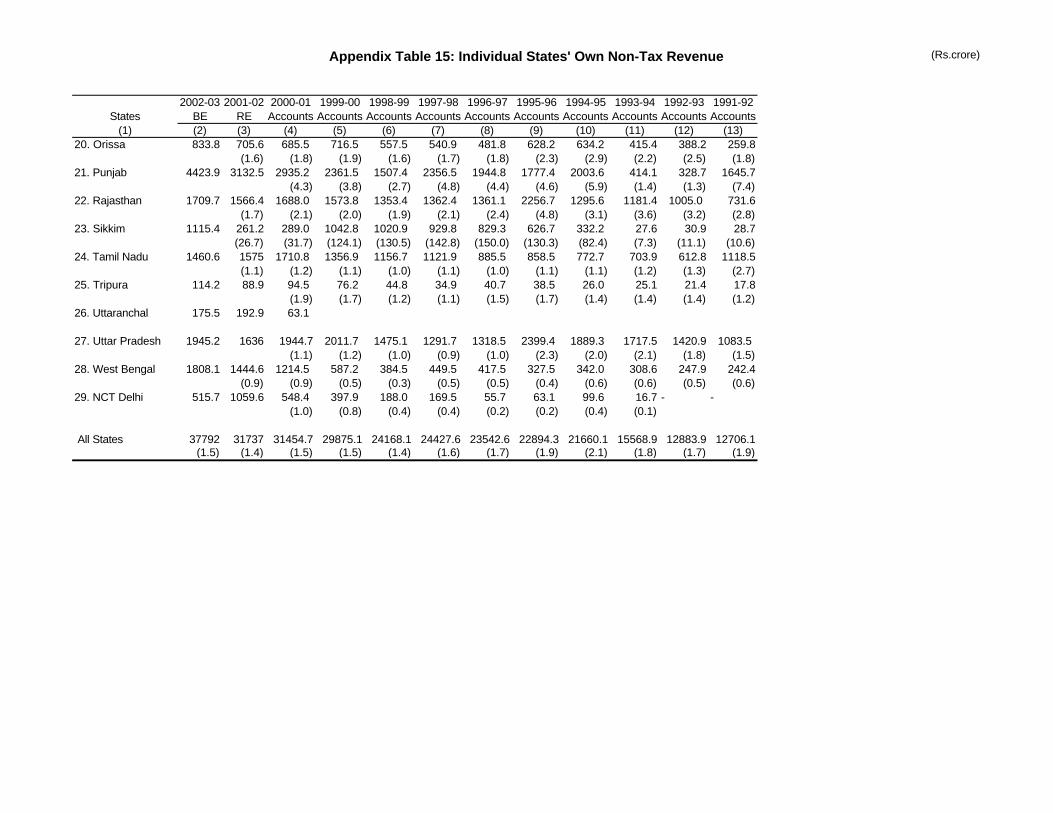
Appendix Table 15: Individual States' Own Non-Tax Revenue (Rs.crore)
2002-03 2001-02 2000-01 1999-00 1998-99 1997-98 1996-97 1995-96 1994-95 1993-94 1992-93 1991-92States BE RE Accounts Accounts Accounts Accounts Accounts Accounts Accounts Accounts Accounts Accounts
(1) (2) (3) (4) (5) (6) (7) (8) (9) (10) (11) (12) (13)20. Orissa 833.8 705.6 685.5 716.5 557.5 540.9 481.8 628.2 634.2 415.4 388.2 259.8
(1.6) (1.8) (1.9) (1.6) (1.7) (1.8) (2.3) (2.9) (2.2) (2.5) (1.8)21. Punjab 4423.9 3132.5 2935.2 2361.5 1507.4 2356.5 1944.8 1777.4 2003.6 414.1 328.7 1645.7
(4.3) (3.8) (2.7) (4.8) (4.4) (4.6) (5.9) (1.4) (1.3) (7.4)22. Rajasthan 1709.7 1566.4 1688.0 1573.8 1353.4 1362.4 1361.1 2256.7 1295.6 1181.4 1005.0 731.6
(1.7) (2.1) (2.0) (1.9) (2.1) (2.4) (4.8) (3.1) (3.6) (3.2) (2.8)23. Sikkim 1115.4 261.2 289.0 1042.8 1020.9 929.8 829.3 626.7 332.2 27.6 30.9 28.7
(26.7) (31.7) (124.1) (130.5) (142.8) (150.0) (130.3) (82.4) (7.3) (11.1) (10.6)24. Tamil Nadu 1460.6 1575 1710.8 1356.9 1156.7 1121.9 885.5 858.5 772.7 703.9 612.8 1118.5
(1.1) (1.2) (1.1) (1.0) (1.1) (1.0) (1.1) (1.1) (1.2) (1.3) (2.7)25. Tripura 114.2 88.9 94.5 76.2 44.8 34.9 40.7 38.5 26.0 25.1 21.4 17.8
(1.9) (1.7) (1.2) (1.1) (1.5) (1.7) (1.4) (1.4) (1.4) (1.2)26. Uttaranchal 175.5 192.9 63.1
27. Uttar Pradesh 1945.2 1636 1944.7 2011.7 1475.1 1291.7 1318.5 2399.4 1889.3 1717.5 1420.9 1083.5(1.1) (1.2) (1.0) (0.9) (1.0) (2.3) (2.0) (2.1) (1.8) (1.5)
28. West Bengal 1808.1 1444.6 1214.5 587.2 384.5 449.5 417.5 327.5 342.0 308.6 247.9 242.4(0.9) (0.9) (0.5) (0.3) (0.5) (0.5) (0.4) (0.6) (0.6) (0.5) (0.6)
29. NCT Delhi 515.7 1059.6 548.4 397.9 188.0 169.5 55.7 63.1 99.6 16.7 - -(1.0) (0.8) (0.4) (0.4) (0.2) (0.2) (0.4) (0.1)
All States 37792 31737 31454.7 29875.1 24168.1 24427.6 23542.6 22894.3 21660.1 15568.9 12883.9 12706.1(1.5) (1.4) (1.5) (1.5) (1.4) (1.6) (1.7) (1.9) (2.1) (1.8) (1.7) (1.9)
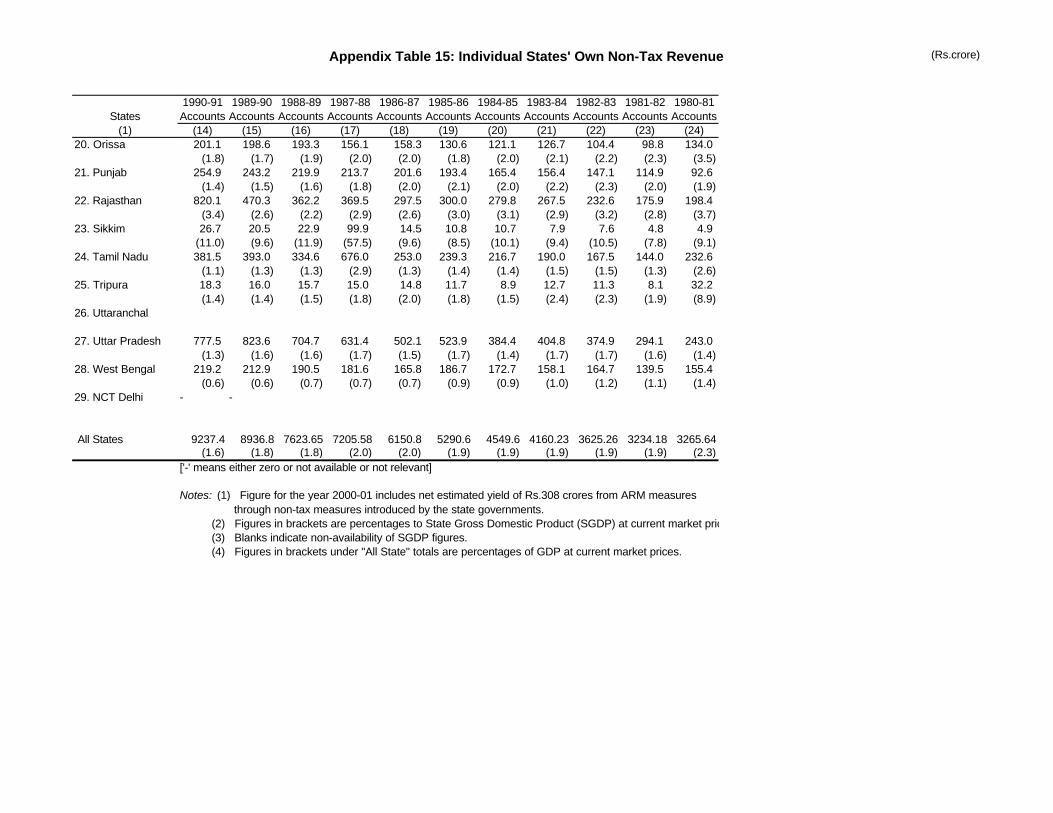
Appendix Table 15: Individual States' Own Non-Tax Revenue (Rs.crore)
States(1)
20. Orissa
21. Punjab
22. Rajasthan
23. Sikkim
24. Tamil Nadu
25. Tripura
26. Uttaranchal
27. Uttar Pradesh
28. West Bengal
29. NCT Delhi
All States
1990-91 1989-90 1988-89 1987-88 1986-87 1985-86 1984-85 1983-84 1982-83 1981-82 1980-81Accounts Accounts Accounts Accounts Accounts Accounts Accounts Accounts Accounts Accounts Accounts
(14) (15) (16) (17) (18) (19) (20) (21) (22) (23) (24)201.1 198.6 193.3 156.1 158.3 130.6 121.1 126.7 104.4 98.8 134.0
(1.8) (1.7) (1.9) (2.0) (2.0) (1.8) (2.0) (2.1) (2.2) (2.3) (3.5)254.9 243.2 219.9 213.7 201.6 193.4 165.4 156.4 147.1 114.9 92.6
(1.4) (1.5) (1.6) (1.8) (2.0) (2.1) (2.0) (2.2) (2.3) (2.0) (1.9)820.1 470.3 362.2 369.5 297.5 300.0 279.8 267.5 232.6 175.9 198.4
(3.4) (2.6) (2.2) (2.9) (2.6) (3.0) (3.1) (2.9) (3.2) (2.8) (3.7)26.7 20.5 22.9 99.9 14.5 10.8 10.7 7.9 7.6 4.8 4.9
(11.0) (9.6) (11.9) (57.5) (9.6) (8.5) (10.1) (9.4) (10.5) (7.8) (9.1)381.5 393.0 334.6 676.0 253.0 239.3 216.7 190.0 167.5 144.0 232.6
(1.1) (1.3) (1.3) (2.9) (1.3) (1.4) (1.4) (1.5) (1.5) (1.3) (2.6)18.3 16.0 15.7 15.0 14.8 11.7 8.9 12.7 11.3 8.1 32.2(1.4) (1.4) (1.5) (1.8) (2.0) (1.8) (1.5) (2.4) (2.3) (1.9) (8.9)
777.5 823.6 704.7 631.4 502.1 523.9 384.4 404.8 374.9 294.1 243.0(1.3) (1.6) (1.6) (1.7) (1.5) (1.7) (1.4) (1.7) (1.7) (1.6) (1.4)
219.2 212.9 190.5 181.6 165.8 186.7 172.7 158.1 164.7 139.5 155.4(0.6) (0.6) (0.7) (0.7) (0.7) (0.9) (0.9) (1.0) (1.2) (1.1) (1.4)
- -
9237.4 8936.8 7623.65 7205.58 6150.8 5290.6 4549.6 4160.23 3625.26 3234.18 3265.64(1.6) (1.8) (1.8) (2.0) (2.0) (1.9) (1.9) (1.9) (1.9) (1.9) (2.3)
['-' means either zero or not available or not relevant]
Notes: (1) Figure for the year 2000-01 includes net estimated yield of Rs.308 crores from ARM measures through non-tax measures introduced by the state governments. (2) Figures in brackets are percentages to State Gross Domestic Product (SGDP) at current market prices. (3) Blanks indicate non-availability of SGDP figures. (4) Figures in brackets under "All State" totals are percentages of GDP at current market prices.
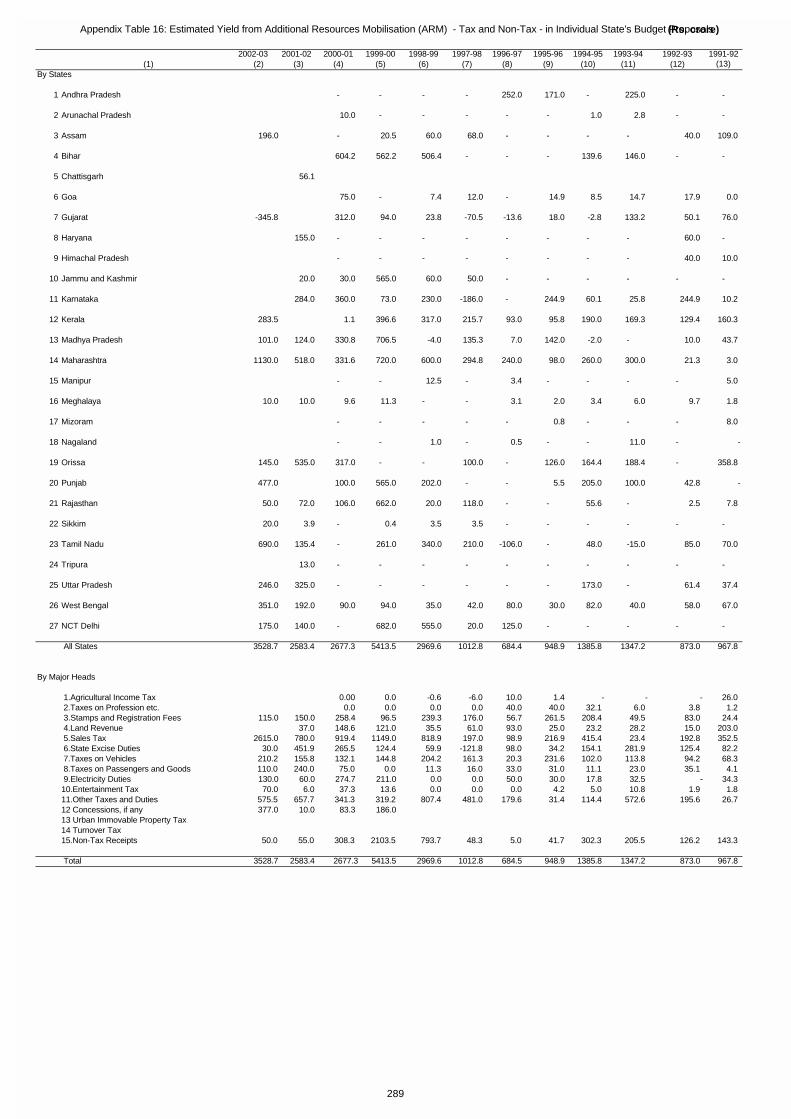
Appendix Table 16: Estimated Yield from Additional Resources Mobilisation (ARM) - Tax and Non-Tax - in Individual State's Budget Proposals(Rs. crore)
2002-03 2001-02 2000-01 1999-00 1998-99 1997-98 1996-97 1995-96 1994-95 1993-94 1992-93 1991-92(1) (2) (3) (4) (5) (6) (7) (8) (9) (10) (11) (12) (13)
By States
1 Andhra Pradesh - - - - 252.0 171.0 - 225.0 - -
2 Arunachal Pradesh 10.0 - - - - - 1.0 2.8 - -
3 Assam 196.0 - 20.5 60.0 68.0 - - - - 40.0 109.0
4 Bihar 604.2 562.2 506.4 - - - 139.6 146.0 - -
5 Chattisgarh 56.1
6 Goa 75.0 - 7.4 12.0 - 14.9 8.5 14.7 17.9 0.0
7 Gujarat -345.8 312.0 94.0 23.8 -70.5 -13.6 18.0 -2.8 133.2 50.1 76.0
8 Haryana 155.0 - - - - - - - - 60.0 -
9 Himachal Pradesh - - - - - - - - 40.0 10.0
10 Jammu and Kashmir 20.0 30.0 565.0 60.0 50.0 - - - - - -
11 Karnataka 284.0 360.0 73.0 230.0 -186.0 - 244.9 60.1 25.8 244.9 10.2
12 Kerala 283.5 1.1 396.6 317.0 215.7 93.0 95.8 190.0 169.3 129.4 160.3
13 Madhya Pradesh 101.0 124.0 330.8 706.5 -4.0 135.3 7.0 142.0 -2.0 - 10.0 43.7
14 Maharashtra 1130.0 518.0 331.6 720.0 600.0 294.8 240.0 98.0 260.0 300.0 21.3 3.0
15 Manipur - - 12.5 - 3.4 - - - - 5.0
16 Meghalaya 10.0 10.0 9.6 11.3 - - 3.1 2.0 3.4 6.0 9.7 1.8
17 Mizoram - - - - - 0.8 - - - 8.0
18 Nagaland - - 1.0 - 0.5 - - 11.0 - -
19 Orissa 145.0 535.0 317.0 - - 100.0 - 126.0 164.4 188.4 - 358.8
20 Punjab 477.0 100.0 565.0 202.0 - - 5.5 205.0 100.0 42.8 -
21 Rajasthan 50.0 72.0 106.0 662.0 20.0 118.0 - - 55.6 - 2.5 7.8
22 Sikkim 20.0 3.9 - 0.4 3.5 3.5 - - - - - -
23 Tamil Nadu 690.0 135.4 - 261.0 340.0 210.0 -106.0 - 48.0 -15.0 85.0 70.0
24 Tripura 13.0 - - - - - - - - - -
25 Uttar Pradesh 246.0 325.0 - - - - - - 173.0 - 61.4 37.4
26 West Bengal 351.0 192.0 90.0 94.0 35.0 42.0 80.0 30.0 82.0 40.0 58.0 67.0
27 NCT Delhi 175.0 140.0 - 682.0 555.0 20.0 125.0 - - - - -
All States 3528.7 2583.4 2677.3 5413.5 2969.6 1012.8 684.4 948.9 1385.8 1347.2 873.0 967.8
By Major Heads
1.Agricultural Income Tax 0.00 0.0 -0.6 -6.0 10.0 1.4 - - - 26.0 2.Taxes on Profession etc. 0.0 0.0 0.0 0.0 40.0 40.0 32.1 6.0 3.8 1.2 3.Stamps and Registration Fees 115.0 150.0 258.4 96.5 239.3 176.0 56.7 261.5 208.4 49.5 83.0 24.4 4.Land Revenue 37.0 148.6 121.0 35.5 61.0 93.0 25.0 23.2 28.2 15.0 203.0 5.Sales Tax 2615.0 780.0 919.4 1149.0 818.9 197.0 98.9 216.9 415.4 23.4 192.8 352.5 6.State Excise Duties 30.0 451.9 265.5 124.4 59.9 -121.8 98.0 34.2 154.1 281.9 125.4 82.2 7.Taxes on Vehicles 210.2 155.8 132.1 144.8 204.2 161.3 20.3 231.6 102.0 113.8 94.2 68.3 8.Taxes on Passengers and Goods 110.0 240.0 75.0 0.0 11.3 16.0 33.0 31.0 11.1 23.0 35.1 4.1 9.Electricity Duties 130.0 60.0 274.7 211.0 0.0 0.0 50.0 30.0 17.8 32.5 - 34.310.Entertainment Tax 70.0 6.0 37.3 13.6 0.0 0.0 0.0 4.2 5.0 10.8 1.9 1.811.Other Taxes and Duties 575.5 657.7 341.3 319.2 807.4 481.0 179.6 31.4 114.4 572.6 195.6 26.712 Concessions, if any 377.0 10.0 83.3 186.013 Urban Immovable Property Tax14 Turnover Tax15.Non-Tax Receipts 50.0 55.0 308.3 2103.5 793.7 48.3 5.0 41.7 302.3 205.5 126.2 143.3
Total 3528.7 2583.4 2677.3 5413.5 2969.6 1012.8 684.5 948.9 1385.8 1347.2 873.0 967.8
289
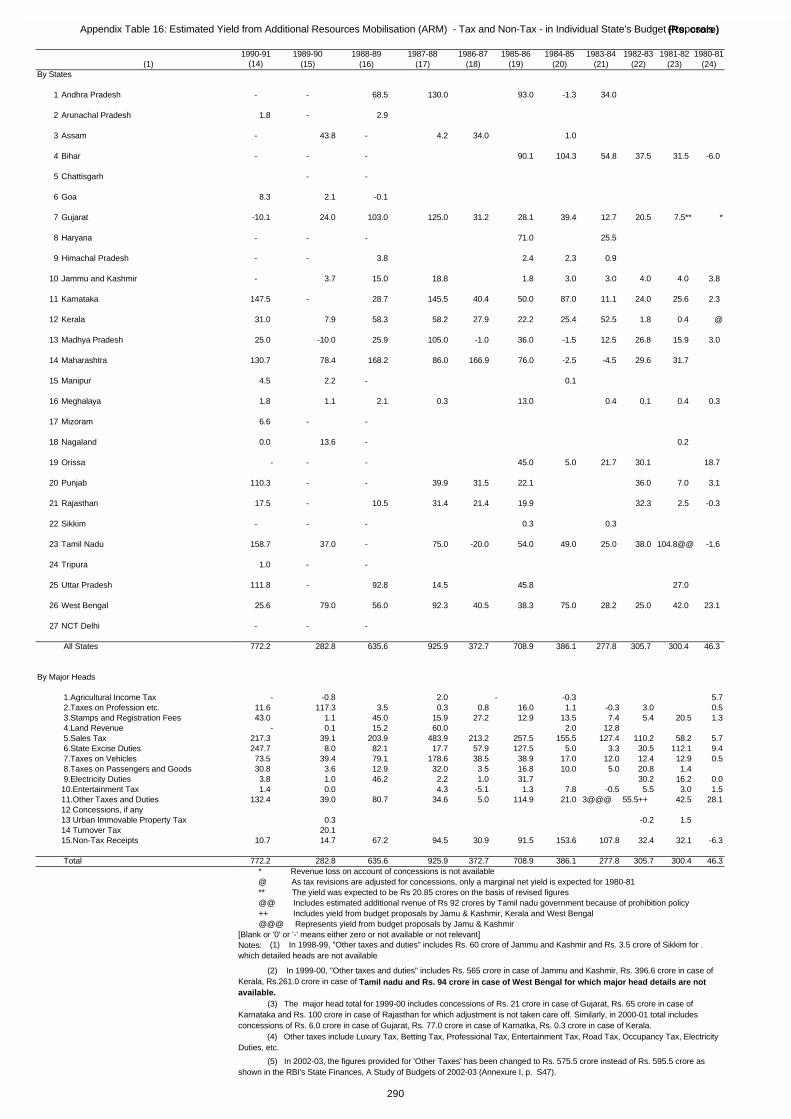
Appendix Table 16: Estimated Yield from Additional Resources Mobilisation (ARM) - Tax and Non-Tax - in Individual State's Budget Proposals(Rs. crore)
(1)By States
1 Andhra Pradesh
2 Arunachal Pradesh
3 Assam
4 Bihar
5 Chattisgarh
6 Goa
7 Gujarat
8 Haryana
9 Himachal Pradesh
10 Jammu and Kashmir
11 Karnataka
12 Kerala
13 Madhya Pradesh
14 Maharashtra
15 Manipur
16 Meghalaya
17 Mizoram
18 Nagaland
19 Orissa
20 Punjab
21 Rajasthan
22 Sikkim
23 Tamil Nadu
24 Tripura
25 Uttar Pradesh
26 West Bengal
27 NCT Delhi
All States
By Major Heads
1.Agricultural Income Tax 2.Taxes on Profession etc. 3.Stamps and Registration Fees 4.Land Revenue 5.Sales Tax 6.State Excise Duties 7.Taxes on Vehicles 8.Taxes on Passengers and Goods 9.Electricity Duties10.Entertainment Tax11.Other Taxes and Duties12 Concessions, if any13 Urban Immovable Property Tax14 Turnover Tax15.Non-Tax Receipts
Total
1990-91 1989-90 1988-89 1987-88 1986-87 1985-86 1984-85 1983-84 1982-83 1981-82 1980-81(14) (15) (16) (17) (18) (19) (20) (21) (22) (23) (24)
- - 68.5 130.0 93.0 -1.3 34.0
1.8 - 2.9
- 43.8 - 4.2 34.0 1.0
- - - 90.1 104.3 54.8 37.5 31.5 -6.0
- -
8.3 2.1 -0.1
-10.1 24.0 103.0 125.0 31.2 28.1 39.4 12.7 20.5 7.5** *
- - - 71.0 25.5
- - 3.8 2.4 2.3 0.9
- 3.7 15.0 18.8 1.8 3.0 3.0 4.0 4.0 3.8
147.5 - 28.7 145.5 40.4 50.0 87.0 11.1 24.0 25.6 2.3
31.0 7.9 58.3 58.2 27.9 22.2 25.4 52.5 1.8 0.4 @
25.0 -10.0 25.9 105.0 -1.0 36.0 -1.5 12.5 26.8 15.9 3.0
130.7 78.4 168.2 86.0 166.9 76.0 -2.5 -4.5 29.6 31.7
4.5 2.2 - 0.1
1.8 1.1 2.1 0.3 13.0 0.4 0.1 0.4 0.3
6.6 - -
0.0 13.6 - 0.2
- - - 45.0 5.0 21.7 30.1 18.7
110.3 - - 39.9 31.5 22.1 36.0 7.0 3.1
17.5 - 10.5 31.4 21.4 19.9 32.3 2.5 -0.3
- - - 0.3 0.3
158.7 37.0 - 75.0 -20.0 54.0 49.0 25.0 38.0 104.8@@ -1.6
1.0 - -
111.8 - 92.8 14.5 45.8 27.0
25.6 79.0 56.0 92.3 40.5 38.3 75.0 28.2 25.0 42.0 23.1
- - -
772.2 282.8 635.6 925.9 372.7 708.9 386.1 277.8 305.7 300.4 46.3
- -0.8 2.0 - -0.3 5.711.6 117.3 3.5 0.3 0.8 16.0 1.1 -0.3 3.0 0.543.0 1.1 45.0 15.9 27.2 12.9 13.5 7.4 5.4 20.5 1.3
- 0.1 15.2 60.0 2.0 12.8217.3 39.1 203.9 483.9 213.2 257.5 155.5 127.4 110.2 58.2 5.7247.7 8.0 82.1 17.7 57.9 127.5 5.0 3.3 30.5 112.1 9.473.5 39.4 79.1 178.6 38.5 38.9 17.0 12.0 12.4 12.9 0.530.8 3.6 12.9 32.0 3.5 16.8 10.0 5.0 20.8 1.43.8 1.0 46.2 2.2 1.0 31.7 30.2 16.2 0.01.4 0.0 4.3 -5.1 1.3 7.8 -0.5 5.5 3.0 1.5
132.4 39.0 80.7 34.6 5.0 114.9 21.0 3@@@ 55.5++ 42.5 28.1
0.3 -0.2 1.520.1
10.7 14.7 67.2 94.5 30.9 91.5 153.6 107.8 32.4 32.1 -6.3
772.2 282.8 635.6 925.9 372.7 708.9 386.1 277.8 305.7 300.4 46.3 * Revenue loss on account of concessions is not available @ As tax revisions are adjusted for concessions, only a marginal net yield is expected for 1980-81 ** The yield was expected to be Rs 20.85 crores on the basis of revised figures @@ Includes estimated additional rvenue of Rs 92 crores by Tamil nadu government because of prohibition policy ++ Includes yield from budget proposals by Jamu & Kashmir, Kerala and West Bengal @@@ Represents yield from budget proposals by Jamu & Kashmir[Blank or '0' or '-' means either zero or not available or not relevant]Notes: (1) In 1998-99, "Other taxes and duties" includes Rs. 60 crore of Jammu and Kashmir and Rs. 3.5 crore of Sikkim for .which detailed heads are not available
(5) In 2002-03, the figures provided for 'Other Taxes' has been changed to Rs. 575.5 crore instead of Rs. 595.5 crore as shown in the RBI's State Finances, A Study of Budgets of 2002-03 (Annexure I, p. S47).
(2) In 1999-00, "Other taxes and duties" includes Rs. 565 crore in case of Jammu and Kashmir, Rs. 396.6 crore in case of Kerala, Rs.261.0 crore in case of Tamil nadu and Rs. 94 crore in case of West Bengal for which major head details are not available. (3) The major head total for 1999-00 includes concessions of Rs. 21 crore in case of Gujarat, Rs. 65 crore in case of Karnataka and Rs. 100 crore in case of Rajasthan for which adjustment is not taken care off. Similarly, in 2000-01 total includes concessions of Rs. 6.0 crore in case of Gujarat, Rs. 77.0 crore in case of Karnatka, Rs. 0.3 crore in case of Kerala. (4) Other taxes include Luxury Tax, Betting Tax, Professional Tax, Entertainment Tax, Road Tax, Occupancy Tax, Electricity Duties, etc.
290
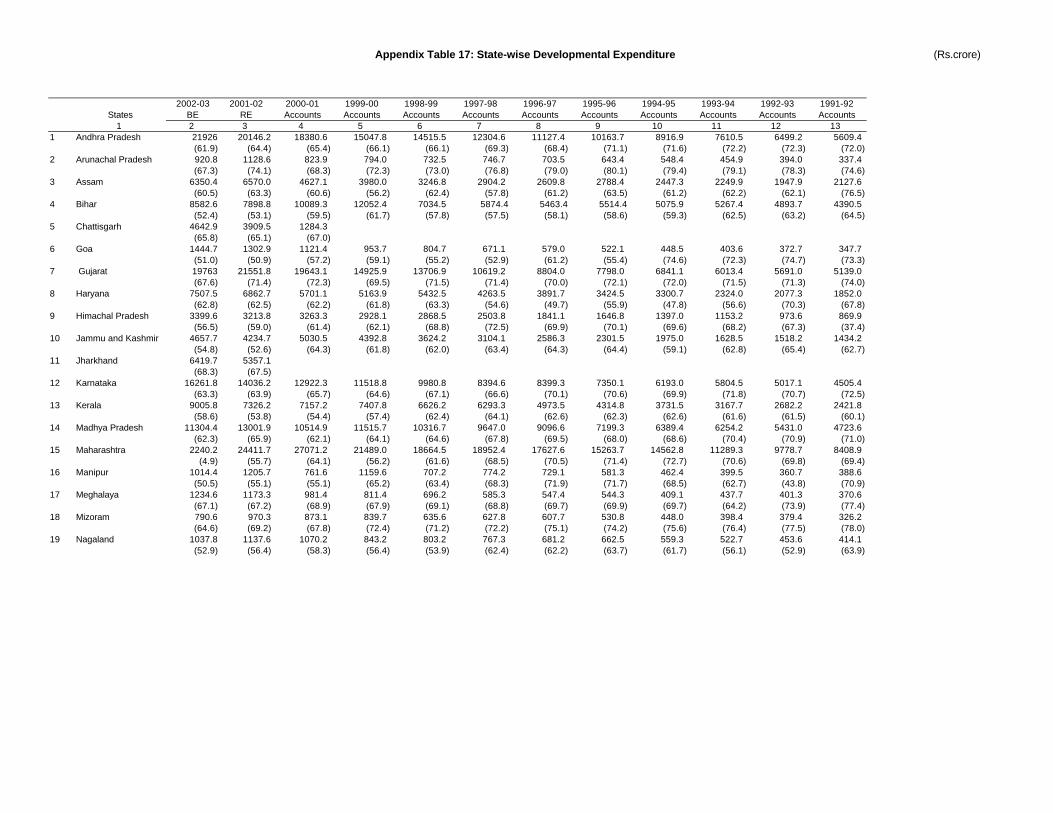
Appendix Table 17: State-wise Developmental Expenditure (Rs.crore)
2002-03 2001-02 2000-01 1999-00 1998-99 1997-98 1996-97 1995-96 1994-95 1993-94 1992-93 1991-92States BE RE Accounts Accounts Accounts Accounts Accounts Accounts Accounts Accounts Accounts Accounts
1 2 3 4 5 6 7 8 9 10 11 12 131 Andhra Pradesh 21926 20146.2 18380.6 15047.8 14515.5 12304.6 11127.4 10163.7 8916.9 7610.5 6499.2 5609.4
(61.9) (64.4) (65.4) (66.1) (66.1) (69.3) (68.4) (71.1) (71.6) (72.2) (72.3) (72.0)2 Arunachal Pradesh 920.8 1128.6 823.9 794.0 732.5 746.7 703.5 643.4 548.4 454.9 394.0 337.4
(67.3) (74.1) (68.3) (72.3) (73.0) (76.8) (79.0) (80.1) (79.4) (79.1) (78.3) (74.6)3 Assam 6350.4 6570.0 4627.1 3980.0 3246.8 2904.2 2609.8 2788.4 2447.3 2249.9 1947.9 2127.6
(60.5) (63.3) (60.6) (56.2) (62.4) (57.8) (61.2) (63.5) (61.2) (62.2) (62.1) (76.5)4 Bihar 8582.6 7898.8 10089.3 12052.4 7034.5 5874.4 5463.4 5514.4 5075.9 5267.4 4893.7 4390.5
(52.4) (53.1) (59.5) (61.7) (57.8) (57.5) (58.1) (58.6) (59.3) (62.5) (63.2) (64.5)5 Chattisgarh 4642.9 3909.5 1284.3
(65.8) (65.1) (67.0)6 Goa 1444.7 1302.9 1121.4 953.7 804.7 671.1 579.0 522.1 448.5 403.6 372.7 347.7
(51.0) (50.9) (57.2) (59.1) (55.2) (52.9) (61.2) (55.4) (74.6) (72.3) (74.7) (73.3)7 Gujarat 19763 21551.8 19643.1 14925.9 13706.9 10619.2 8804.0 7798.0 6841.1 6013.4 5691.0 5139.0
(67.6) (71.4) (72.3) (69.5) (71.5) (71.4) (70.0) (72.1) (72.0) (71.5) (71.3) (74.0)8 Haryana 7507.5 6862.7 5701.1 5163.9 5432.5 4263.5 3891.7 3424.5 3300.7 2324.0 2077.3 1852.0
(62.8) (62.5) (62.2) (61.8) (63.3) (54.6) (49.7) (55.9) (47.8) (56.6) (70.3) (67.8)9 Himachal Pradesh 3399.6 3213.8 3263.3 2928.1 2868.5 2503.8 1841.1 1646.8 1397.0 1153.2 973.6 869.9
(56.5) (59.0) (61.4) (62.1) (68.8) (72.5) (69.9) (70.1) (69.6) (68.2) (67.3) (37.4)10 Jammu and Kashmir 4657.7 4234.7 5030.5 4392.8 3624.2 3104.1 2586.3 2301.5 1975.0 1628.5 1518.2 1434.2
(54.8) (52.6) (64.3) (61.8) (62.0) (63.4) (64.3) (64.4) (59.1) (62.8) (65.4) (62.7)11 Jharkhand 6419.7 5357.1
(68.3) (67.5)12 Karnataka 16261.8 14036.2 12922.3 11518.8 9980.8 8394.6 8399.3 7350.1 6193.0 5804.5 5017.1 4505.4
(63.3) (63.9) (65.7) (64.6) (67.1) (66.6) (70.1) (70.6) (69.9) (71.8) (70.7) (72.5)13 Kerala 9005.8 7326.2 7157.2 7407.8 6626.2 6293.3 4973.5 4314.8 3731.5 3167.7 2682.2 2421.8
(58.6) (53.8) (54.4) (57.4) (62.4) (64.1) (62.6) (62.3) (62.6) (61.6) (61.5) (60.1)14 Madhya Pradesh 11304.4 13001.9 10514.9 11515.7 10316.7 9647.0 9096.6 7199.3 6389.4 6254.2 5431.0 4723.6
(62.3) (65.9) (62.1) (64.1) (64.6) (67.8) (69.5) (68.0) (68.6) (70.4) (70.9) (71.0)15 Maharashtra 2240.2 24411.7 27071.2 21489.0 18664.5 18952.4 17627.6 15263.7 14562.8 11289.3 9778.7 8408.9
(4.9) (55.7) (64.1) (56.2) (61.6) (68.5) (70.5) (71.4) (72.7) (70.6) (69.8) (69.4)16 Manipur 1014.4 1205.7 761.6 1159.6 707.2 774.2 729.1 581.3 462.4 399.5 360.7 388.6
(50.5) (55.1) (55.1) (65.2) (63.4) (68.3) (71.9) (71.7) (68.5) (62.7) (43.8) (70.9)17 Meghalaya 1234.6 1173.3 981.4 811.4 696.2 585.3 547.4 544.3 409.1 437.7 401.3 370.6
(67.1) (67.2) (68.9) (67.9) (69.1) (68.8) (69.7) (69.9) (69.7) (64.2) (73.9) (77.4)18 Mizoram 790.6 970.3 873.1 839.7 635.6 627.8 607.7 530.8 448.0 398.4 379.4 326.2
(64.6) (69.2) (67.8) (72.4) (71.2) (72.2) (75.1) (74.2) (75.6) (76.4) (77.5) (78.0)19 Nagaland 1037.8 1137.6 1070.2 843.2 803.2 767.3 681.2 662.5 559.3 522.7 453.6 414.1
(52.9) (56.4) (58.3) (56.4) (53.9) (62.4) (62.2) (63.7) (61.7) (56.1) (52.9) (63.9)
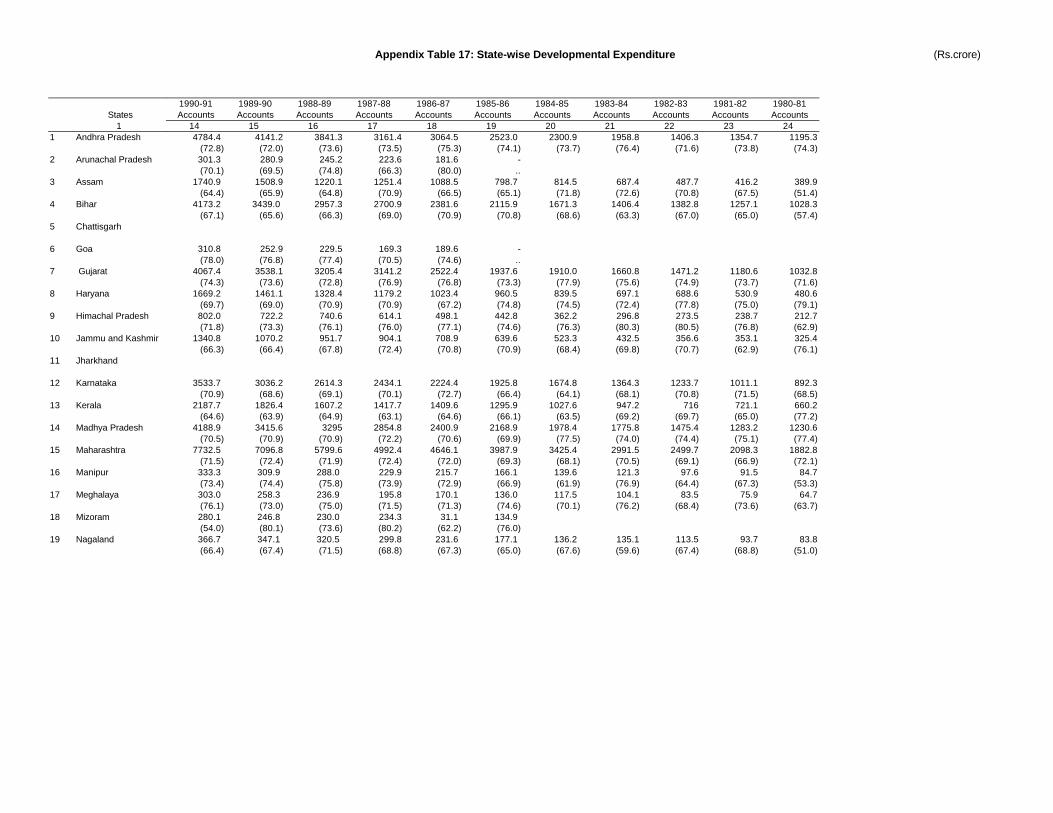
Appendix Table 17: State-wise Developmental Expenditure (Rs.crore)
States1
1 Andhra Pradesh
2 Arunachal Pradesh
3 Assam
4 Bihar
5 Chattisgarh
6 Goa
7 Gujarat
8 Haryana
9 Himachal Pradesh
10 Jammu and Kashmir
11 Jharkhand
12 Karnataka
13 Kerala
14 Madhya Pradesh
15 Maharashtra
16 Manipur
17 Meghalaya
18 Mizoram
19 Nagaland
1990-91 1989-90 1988-89 1987-88 1986-87 1985-86 1984-85 1983-84 1982-83 1981-82 1980-81Accounts Accounts Accounts Accounts Accounts Accounts Accounts Accounts Accounts Accounts Accounts
14 15 16 17 18 19 20 21 22 23 244784.4 4141.2 3841.3 3161.4 3064.5 2523.0 2300.9 1958.8 1406.3 1354.7 1195.3
(72.8) (72.0) (73.6) (73.5) (75.3) (74.1) (73.7) (76.4) (71.6) (73.8) (74.3)301.3 280.9 245.2 223.6 181.6 -(70.1) (69.5) (74.8) (66.3) (80.0) ..
1740.9 1508.9 1220.1 1251.4 1088.5 798.7 814.5 687.4 487.7 416.2 389.9(64.4) (65.9) (64.8) (70.9) (66.5) (65.1) (71.8) (72.6) (70.8) (67.5) (51.4)
4173.2 3439.0 2957.3 2700.9 2381.6 2115.9 1671.3 1406.4 1382.8 1257.1 1028.3(67.1) (65.6) (66.3) (69.0) (70.9) (70.8) (68.6) (63.3) (67.0) (65.0) (57.4)
310.8 252.9 229.5 169.3 189.6 -(78.0) (76.8) (77.4) (70.5) (74.6) ..
4067.4 3538.1 3205.4 3141.2 2522.4 1937.6 1910.0 1660.8 1471.2 1180.6 1032.8(74.3) (73.6) (72.8) (76.9) (76.8) (73.3) (77.9) (75.6) (74.9) (73.7) (71.6)
1669.2 1461.1 1328.4 1179.2 1023.4 960.5 839.5 697.1 688.6 530.9 480.6(69.7) (69.0) (70.9) (70.9) (67.2) (74.8) (74.5) (72.4) (77.8) (75.0) (79.1)802.0 722.2 740.6 614.1 498.1 442.8 362.2 296.8 273.5 238.7 212.7(71.8) (73.3) (76.1) (76.0) (77.1) (74.6) (76.3) (80.3) (80.5) (76.8) (62.9)
1340.8 1070.2 951.7 904.1 708.9 639.6 523.3 432.5 356.6 353.1 325.4(66.3) (66.4) (67.8) (72.4) (70.8) (70.9) (68.4) (69.8) (70.7) (62.9) (76.1)
3533.7 3036.2 2614.3 2434.1 2224.4 1925.8 1674.8 1364.3 1233.7 1011.1 892.3(70.9) (68.6) (69.1) (70.1) (72.7) (66.4) (64.1) (68.1) (70.8) (71.5) (68.5)
2187.7 1826.4 1607.2 1417.7 1409.6 1295.9 1027.6 947.2 716 721.1 660.2(64.6) (63.9) (64.9) (63.1) (64.6) (66.1) (63.5) (69.2) (69.7) (65.0) (77.2)
4188.9 3415.6 3295 2854.8 2400.9 2168.9 1978.4 1775.8 1475.4 1283.2 1230.6(70.5) (70.9) (70.9) (72.2) (70.6) (69.9) (77.5) (74.0) (74.4) (75.1) (77.4)
7732.5 7096.8 5799.6 4992.4 4646.1 3987.9 3425.4 2991.5 2499.7 2098.3 1882.8(71.5) (72.4) (71.9) (72.4) (72.0) (69.3) (68.1) (70.5) (69.1) (66.9) (72.1)333.3 309.9 288.0 229.9 215.7 166.1 139.6 121.3 97.6 91.5 84.7(73.4) (74.4) (75.8) (73.9) (72.9) (66.9) (61.9) (76.9) (64.4) (67.3) (53.3)303.0 258.3 236.9 195.8 170.1 136.0 117.5 104.1 83.5 75.9 64.7(76.1) (73.0) (75.0) (71.5) (71.3) (74.6) (70.1) (76.2) (68.4) (73.6) (63.7)280.1 246.8 230.0 234.3 31.1 134.9(54.0) (80.1) (73.6) (80.2) (62.2) (76.0)366.7 347.1 320.5 299.8 231.6 177.1 136.2 135.1 113.5 93.7 83.8(66.4) (67.4) (71.5) (68.8) (67.3) (65.0) (67.6) (59.6) (67.4) (68.8) (51.0)
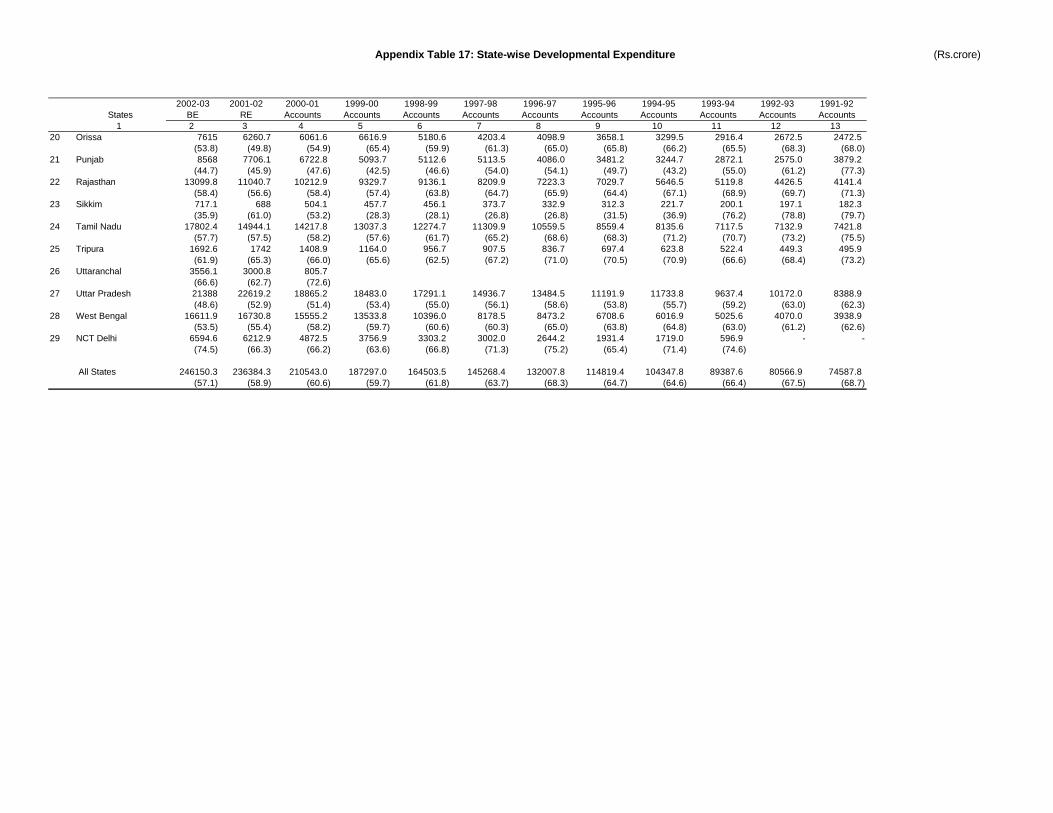
Appendix Table 17: State-wise Developmental Expenditure (Rs.crore)
2002-03 2001-02 2000-01 1999-00 1998-99 1997-98 1996-97 1995-96 1994-95 1993-94 1992-93 1991-92States BE RE Accounts Accounts Accounts Accounts Accounts Accounts Accounts Accounts Accounts Accounts
1 2 3 4 5 6 7 8 9 10 11 12 1320 Orissa 7615 6260.7 6061.6 6616.9 5180.6 4203.4 4098.9 3658.1 3299.5 2916.4 2672.5 2472.5
(53.8) (49.8) (54.9) (65.4) (59.9) (61.3) (65.0) (65.8) (66.2) (65.5) (68.3) (68.0)21 Punjab 8568 7706.1 6722.8 5093.7 5112.6 5113.5 4086.0 3481.2 3244.7 2872.1 2575.0 3879.2
(44.7) (45.9) (47.6) (42.5) (46.6) (54.0) (54.1) (49.7) (43.2) (55.0) (61.2) (77.3)22 Rajasthan 13099.8 11040.7 10212.9 9329.7 9136.1 8209.9 7223.3 7029.7 5646.5 5119.8 4426.5 4141.4
(58.4) (56.6) (58.4) (57.4) (63.8) (64.7) (65.9) (64.4) (67.1) (68.9) (69.7) (71.3)23 Sikkim 717.1 688 504.1 457.7 456.1 373.7 332.9 312.3 221.7 200.1 197.1 182.3
(35.9) (61.0) (53.2) (28.3) (28.1) (26.8) (26.8) (31.5) (36.9) (76.2) (78.8) (79.7)24 Tamil Nadu 17802.4 14944.1 14217.8 13037.3 12274.7 11309.9 10559.5 8559.4 8135.6 7117.5 7132.9 7421.8
(57.7) (57.5) (58.2) (57.6) (61.7) (65.2) (68.6) (68.3) (71.2) (70.7) (73.2) (75.5)25 Tripura 1692.6 1742 1408.9 1164.0 956.7 907.5 836.7 697.4 623.8 522.4 449.3 495.9
(61.9) (65.3) (66.0) (65.6) (62.5) (67.2) (71.0) (70.5) (70.9) (66.6) (68.4) (73.2)26 Uttaranchal 3556.1 3000.8 805.7
(66.6) (62.7) (72.6)27 Uttar Pradesh 21388 22619.2 18865.2 18483.0 17291.1 14936.7 13484.5 11191.9 11733.8 9637.4 10172.0 8388.9
(48.6) (52.9) (51.4) (53.4) (55.0) (56.1) (58.6) (53.8) (55.7) (59.2) (63.0) (62.3)28 West Bengal 16611.9 16730.8 15555.2 13533.8 10396.0 8178.5 8473.2 6708.6 6016.9 5025.6 4070.0 3938.9
(53.5) (55.4) (58.2) (59.7) (60.6) (60.3) (65.0) (63.8) (64.8) (63.0) (61.2) (62.6)29 NCT Delhi 6594.6 6212.9 4872.5 3756.9 3303.2 3002.0 2644.2 1931.4 1719.0 596.9 - -
(74.5) (66.3) (66.2) (63.6) (66.8) (71.3) (75.2) (65.4) (71.4) (74.6)
All States 246150.3 236384.3 210543.0 187297.0 164503.5 145268.4 132007.8 114819.4 104347.8 89387.6 80566.9 74587.8(57.1) (58.9) (60.6) (59.7) (61.8) (63.7) (68.3) (64.7) (64.6) (66.4) (67.5) (68.7)
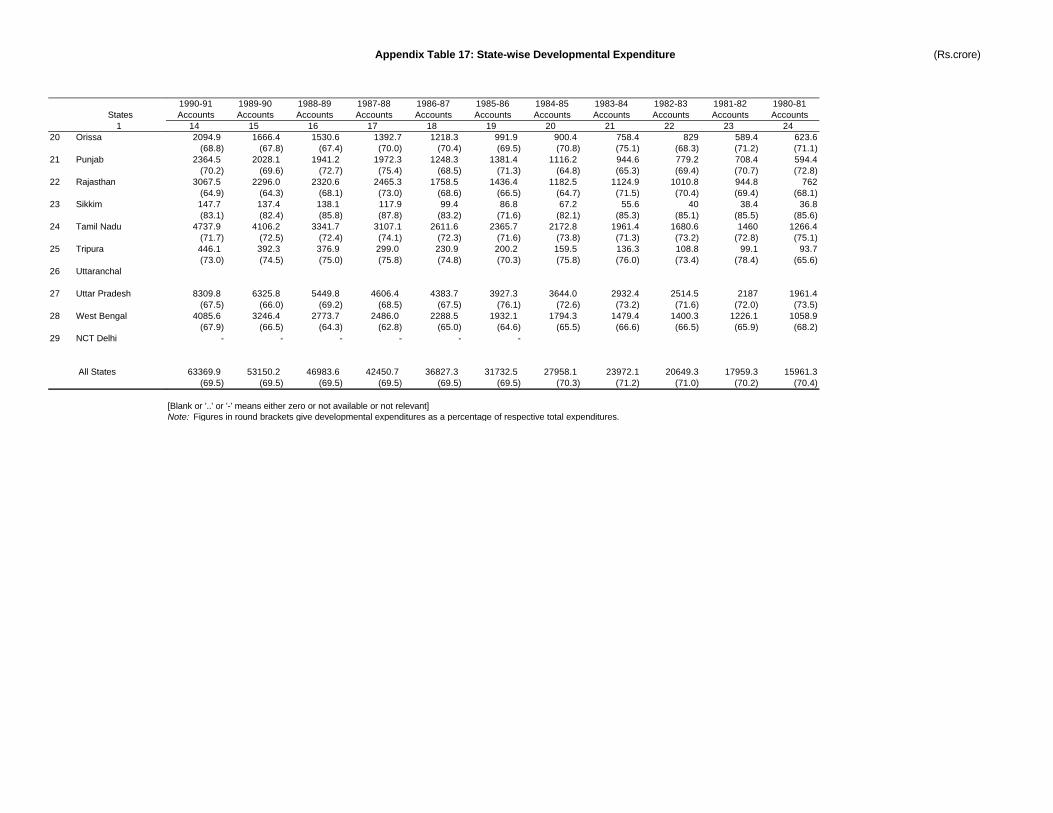
Appendix Table 17: State-wise Developmental Expenditure (Rs.crore)
States1
20 Orissa
21 Punjab
22 Rajasthan
23 Sikkim
24 Tamil Nadu
25 Tripura
26 Uttaranchal
27 Uttar Pradesh
28 West Bengal
29 NCT Delhi
All States
1990-91 1989-90 1988-89 1987-88 1986-87 1985-86 1984-85 1983-84 1982-83 1981-82 1980-81Accounts Accounts Accounts Accounts Accounts Accounts Accounts Accounts Accounts Accounts Accounts
14 15 16 17 18 19 20 21 22 23 242094.9 1666.4 1530.6 1392.7 1218.3 991.9 900.4 758.4 829 589.4 623.6
(68.8) (67.8) (67.4) (70.0) (70.4) (69.5) (70.8) (75.1) (68.3) (71.2) (71.1)2364.5 2028.1 1941.2 1972.3 1248.3 1381.4 1116.2 944.6 779.2 708.4 594.4
(70.2) (69.6) (72.7) (75.4) (68.5) (71.3) (64.8) (65.3) (69.4) (70.7) (72.8)3067.5 2296.0 2320.6 2465.3 1758.5 1436.4 1182.5 1124.9 1010.8 944.8 762
(64.9) (64.3) (68.1) (73.0) (68.6) (66.5) (64.7) (71.5) (70.4) (69.4) (68.1)147.7 137.4 138.1 117.9 99.4 86.8 67.2 55.6 40 38.4 36.8(83.1) (82.4) (85.8) (87.8) (83.2) (71.6) (82.1) (85.3) (85.1) (85.5) (85.6)
4737.9 4106.2 3341.7 3107.1 2611.6 2365.7 2172.8 1961.4 1680.6 1460 1266.4(71.7) (72.5) (72.4) (74.1) (72.3) (71.6) (73.8) (71.3) (73.2) (72.8) (75.1)446.1 392.3 376.9 299.0 230.9 200.2 159.5 136.3 108.8 99.1 93.7(73.0) (74.5) (75.0) (75.8) (74.8) (70.3) (75.8) (76.0) (73.4) (78.4) (65.6)
8309.8 6325.8 5449.8 4606.4 4383.7 3927.3 3644.0 2932.4 2514.5 2187 1961.4(67.5) (66.0) (69.2) (68.5) (67.5) (76.1) (72.6) (73.2) (71.6) (72.0) (73.5)
4085.6 3246.4 2773.7 2486.0 2288.5 1932.1 1794.3 1479.4 1400.3 1226.1 1058.9(67.9) (66.5) (64.3) (62.8) (65.0) (64.6) (65.5) (66.6) (66.5) (65.9) (68.2)
- - - - - -
63369.9 53150.2 46983.6 42450.7 36827.3 31732.5 27958.1 23972.1 20649.3 17959.3 15961.3(69.5) (69.5) (69.5) (69.5) (69.5) (69.5) (70.3) (71.2) (71.0) (70.2) (70.4)
[Blank or '..' or '-' means either zero or not available or not relevant]Note: Figures in round brackets give developmental expenditures as a percentage of respective total expenditures.
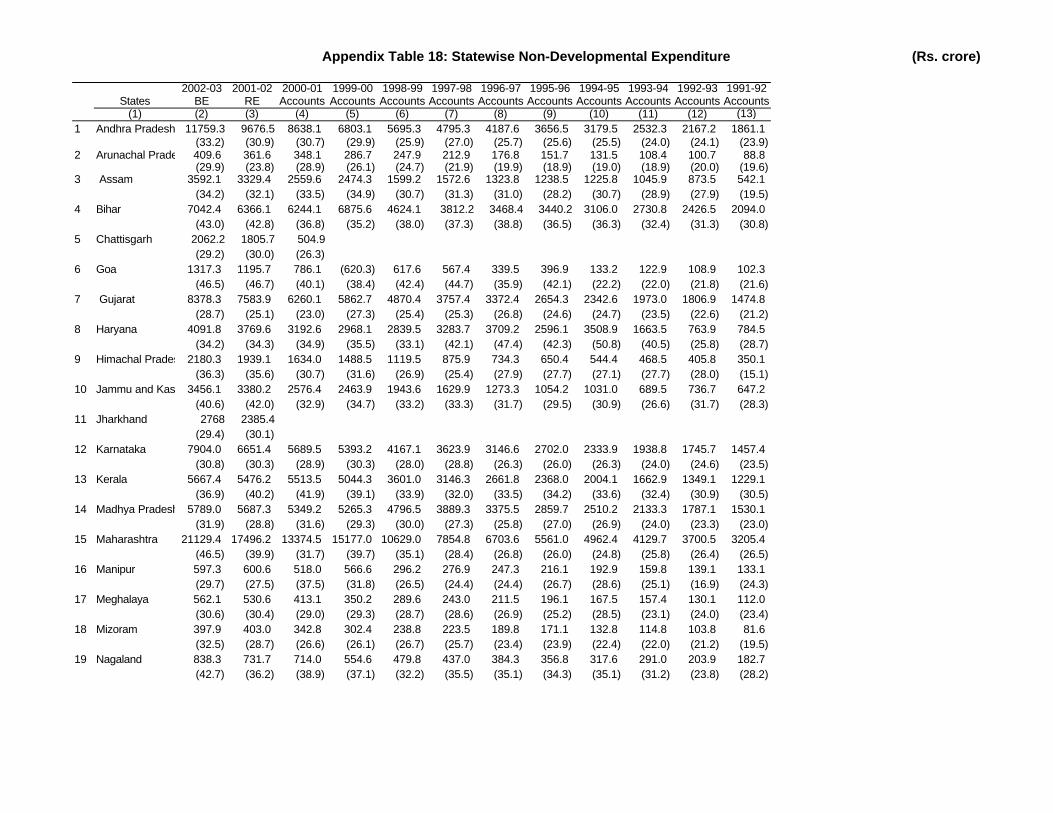
Appendix Table 18: Statewise Non-Developmental Expenditure (Rs. crore)
2002-03 2001-02 2000-01 1999-00 1998-99 1997-98 1996-97 1995-96 1994-95 1993-94 1992-93 1991-92States BE RE Accounts Accounts Accounts Accounts Accounts Accounts Accounts Accounts Accounts Accounts
(1) (2) (3) (4) (5) (6) (7) (8) (9) (10) (11) (12) (13)1 Andhra Pradesh 11759.3 9676.5 8638.1 6803.1 5695.3 4795.3 4187.6 3656.5 3179.5 2532.3 2167.2 1861.1
(33.2) (30.9) (30.7) (29.9) (25.9) (27.0) (25.7) (25.6) (25.5) (24.0) (24.1) (23.9)2 Arunachal Pradesh 409.6 361.6 348.1 286.7 247.9 212.9 176.8 151.7 131.5 108.4 100.7 88.8
(29.9) (23.8) (28.9) (26.1) (24.7) (21.9) (19.9) (18.9) (19.0) (18.9) (20.0) (19.6)3 Assam 3592.1 3329.4 2559.6 2474.3 1599.2 1572.6 1323.8 1238.5 1225.8 1045.9 873.5 542.1
(34.2) (32.1) (33.5) (34.9) (30.7) (31.3) (31.0) (28.2) (30.7) (28.9) (27.9) (19.5)4 Bihar 7042.4 6366.1 6244.1 6875.6 4624.1 3812.2 3468.4 3440.2 3106.0 2730.8 2426.5 2094.0
(43.0) (42.8) (36.8) (35.2) (38.0) (37.3) (38.8) (36.5) (36.3) (32.4) (31.3) (30.8)5 Chattisgarh 2062.2 1805.7 504.9
(29.2) (30.0) (26.3)6 Goa 1317.3 1195.7 786.1 (620.3) 617.6 567.4 339.5 396.9 133.2 122.9 108.9 102.3
(46.5) (46.7) (40.1) (38.4) (42.4) (44.7) (35.9) (42.1) (22.2) (22.0) (21.8) (21.6)7 Gujarat 8378.3 7583.9 6260.1 5862.7 4870.4 3757.4 3372.4 2654.3 2342.6 1973.0 1806.9 1474.8
(28.7) (25.1) (23.0) (27.3) (25.4) (25.3) (26.8) (24.6) (24.7) (23.5) (22.6) (21.2)8 Haryana 4091.8 3769.6 3192.6 2968.1 2839.5 3283.7 3709.2 2596.1 3508.9 1663.5 763.9 784.5
(34.2) (34.3) (34.9) (35.5) (33.1) (42.1) (47.4) (42.3) (50.8) (40.5) (25.8) (28.7)9 Himachal Pradesh 2180.3 1939.1 1634.0 1488.5 1119.5 875.9 734.3 650.4 544.4 468.5 405.8 350.1
(36.3) (35.6) (30.7) (31.6) (26.9) (25.4) (27.9) (27.7) (27.1) (27.7) (28.0) (15.1)10 Jammu and Kashmir3456.1 3380.2 2576.4 2463.9 1943.6 1629.9 1273.3 1054.2 1031.0 689.5 736.7 647.2
(40.6) (42.0) (32.9) (34.7) (33.2) (33.3) (31.7) (29.5) (30.9) (26.6) (31.7) (28.3)11 Jharkhand 2768 2385.4
(29.4) (30.1)12 Karnataka 7904.0 6651.4 5689.5 5393.2 4167.1 3623.9 3146.6 2702.0 2333.9 1938.8 1745.7 1457.4
(30.8) (30.3) (28.9) (30.3) (28.0) (28.8) (26.3) (26.0) (26.3) (24.0) (24.6) (23.5)13 Kerala 5667.4 5476.2 5513.5 5044.3 3601.0 3146.3 2661.8 2368.0 2004.1 1662.9 1349.1 1229.1
(36.9) (40.2) (41.9) (39.1) (33.9) (32.0) (33.5) (34.2) (33.6) (32.4) (30.9) (30.5)14 Madhya Pradesh 5789.0 5687.3 5349.2 5265.3 4796.5 3889.3 3375.5 2859.7 2510.2 2133.3 1787.1 1530.1
(31.9) (28.8) (31.6) (29.3) (30.0) (27.3) (25.8) (27.0) (26.9) (24.0) (23.3) (23.0)15 Maharashtra 21129.4 17496.2 13374.5 15177.0 10629.0 7854.8 6703.6 5561.0 4962.4 4129.7 3700.5 3205.4
(46.5) (39.9) (31.7) (39.7) (35.1) (28.4) (26.8) (26.0) (24.8) (25.8) (26.4) (26.5)16 Manipur 597.3 600.6 518.0 566.6 296.2 276.9 247.3 216.1 192.9 159.8 139.1 133.1
(29.7) (27.5) (37.5) (31.8) (26.5) (24.4) (24.4) (26.7) (28.6) (25.1) (16.9) (24.3)17 Meghalaya 562.1 530.6 413.1 350.2 289.6 243.0 211.5 196.1 167.5 157.4 130.1 112.0
(30.6) (30.4) (29.0) (29.3) (28.7) (28.6) (26.9) (25.2) (28.5) (23.1) (24.0) (23.4)18 Mizoram 397.9 403.0 342.8 302.4 238.8 223.5 189.8 171.1 132.8 114.8 103.8 81.6
(32.5) (28.7) (26.6) (26.1) (26.7) (25.7) (23.4) (23.9) (22.4) (22.0) (21.2) (19.5)19 Nagaland 838.3 731.7 714.0 554.6 479.8 437.0 384.3 356.8 317.6 291.0 203.9 182.7
(42.7) (36.2) (38.9) (37.1) (32.2) (35.5) (35.1) (34.3) (35.1) (31.2) (23.8) (28.2)
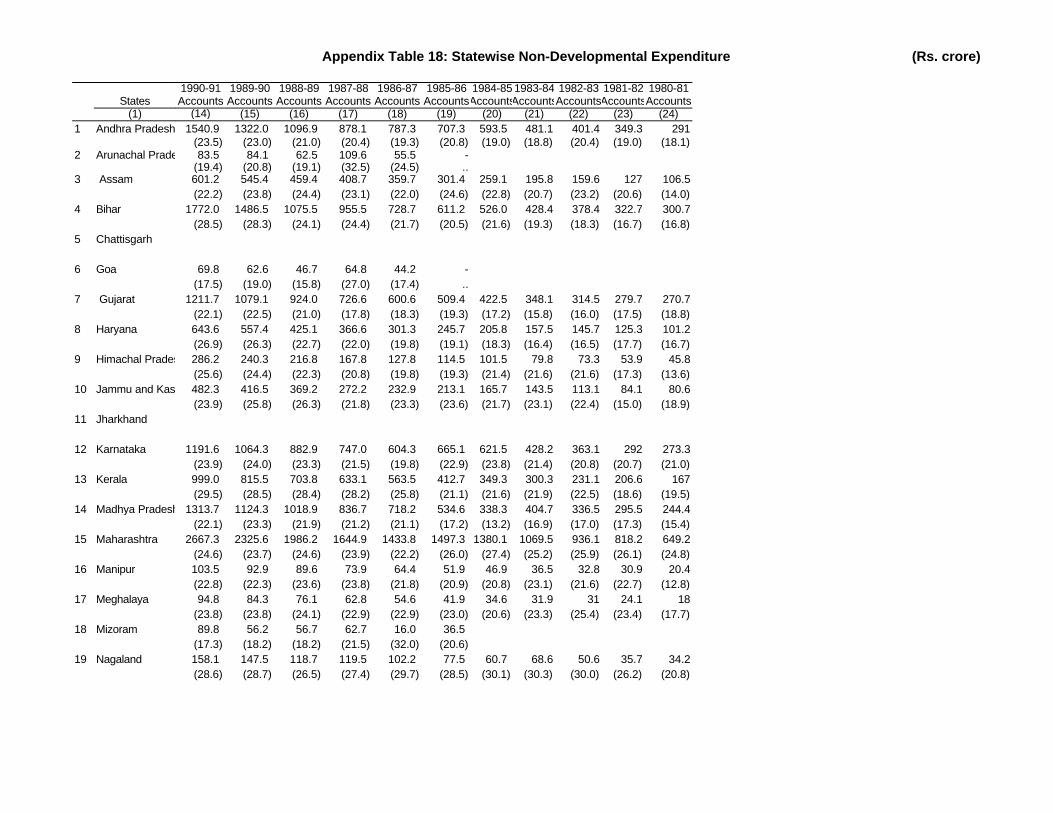
Appendix Table 18: Statewise Non-Developmental Expenditure (Rs. crore)
States(1)
1 Andhra Pradesh
2 Arunachal Pradesh
3 Assam
4 Bihar
5 Chattisgarh
6 Goa
7 Gujarat
8 Haryana
9 Himachal Pradesh
10 Jammu and Kashmir
11 Jharkhand
12 Karnataka
13 Kerala
14 Madhya Pradesh
15 Maharashtra
16 Manipur
17 Meghalaya
18 Mizoram
19 Nagaland
1990-91 1989-90 1988-89 1987-88 1986-87 1985-86 1984-85 1983-84 1982-83 1981-82 1980-81Accounts Accounts Accounts Accounts Accounts AccountsAccountsAccountsAccountsAccountsAccounts
(14) (15) (16) (17) (18) (19) (20) (21) (22) (23) (24)1540.9 1322.0 1096.9 878.1 787.3 707.3 593.5 481.1 401.4 349.3 291
(23.5) (23.0) (21.0) (20.4) (19.3) (20.8) (19.0) (18.8) (20.4) (19.0) (18.1)83.5 84.1 62.5 109.6 55.5 -
(19.4) (20.8) (19.1) (32.5) (24.5) ..601.2 545.4 459.4 408.7 359.7 301.4 259.1 195.8 159.6 127 106.5(22.2) (23.8) (24.4) (23.1) (22.0) (24.6) (22.8) (20.7) (23.2) (20.6) (14.0)
1772.0 1486.5 1075.5 955.5 728.7 611.2 526.0 428.4 378.4 322.7 300.7(28.5) (28.3) (24.1) (24.4) (21.7) (20.5) (21.6) (19.3) (18.3) (16.7) (16.8)
69.8 62.6 46.7 64.8 44.2 -(17.5) (19.0) (15.8) (27.0) (17.4) ..
1211.7 1079.1 924.0 726.6 600.6 509.4 422.5 348.1 314.5 279.7 270.7(22.1) (22.5) (21.0) (17.8) (18.3) (19.3) (17.2) (15.8) (16.0) (17.5) (18.8)643.6 557.4 425.1 366.6 301.3 245.7 205.8 157.5 145.7 125.3 101.2(26.9) (26.3) (22.7) (22.0) (19.8) (19.1) (18.3) (16.4) (16.5) (17.7) (16.7)286.2 240.3 216.8 167.8 127.8 114.5 101.5 79.8 73.3 53.9 45.8(25.6) (24.4) (22.3) (20.8) (19.8) (19.3) (21.4) (21.6) (21.6) (17.3) (13.6)482.3 416.5 369.2 272.2 232.9 213.1 165.7 143.5 113.1 84.1 80.6(23.9) (25.8) (26.3) (21.8) (23.3) (23.6) (21.7) (23.1) (22.4) (15.0) (18.9)
1191.6 1064.3 882.9 747.0 604.3 665.1 621.5 428.2 363.1 292 273.3(23.9) (24.0) (23.3) (21.5) (19.8) (22.9) (23.8) (21.4) (20.8) (20.7) (21.0)999.0 815.5 703.8 633.1 563.5 412.7 349.3 300.3 231.1 206.6 167(29.5) (28.5) (28.4) (28.2) (25.8) (21.1) (21.6) (21.9) (22.5) (18.6) (19.5)
1313.7 1124.3 1018.9 836.7 718.2 534.6 338.3 404.7 336.5 295.5 244.4(22.1) (23.3) (21.9) (21.2) (21.1) (17.2) (13.2) (16.9) (17.0) (17.3) (15.4)
2667.3 2325.6 1986.2 1644.9 1433.8 1497.3 1380.1 1069.5 936.1 818.2 649.2(24.6) (23.7) (24.6) (23.9) (22.2) (26.0) (27.4) (25.2) (25.9) (26.1) (24.8)103.5 92.9 89.6 73.9 64.4 51.9 46.9 36.5 32.8 30.9 20.4(22.8) (22.3) (23.6) (23.8) (21.8) (20.9) (20.8) (23.1) (21.6) (22.7) (12.8)94.8 84.3 76.1 62.8 54.6 41.9 34.6 31.9 31 24.1 18
(23.8) (23.8) (24.1) (22.9) (22.9) (23.0) (20.6) (23.3) (25.4) (23.4) (17.7)89.8 56.2 56.7 62.7 16.0 36.5
(17.3) (18.2) (18.2) (21.5) (32.0) (20.6)158.1 147.5 118.7 119.5 102.2 77.5 60.7 68.6 50.6 35.7 34.2(28.6) (28.7) (26.5) (27.4) (29.7) (28.5) (30.1) (30.3) (30.0) (26.2) (20.8)
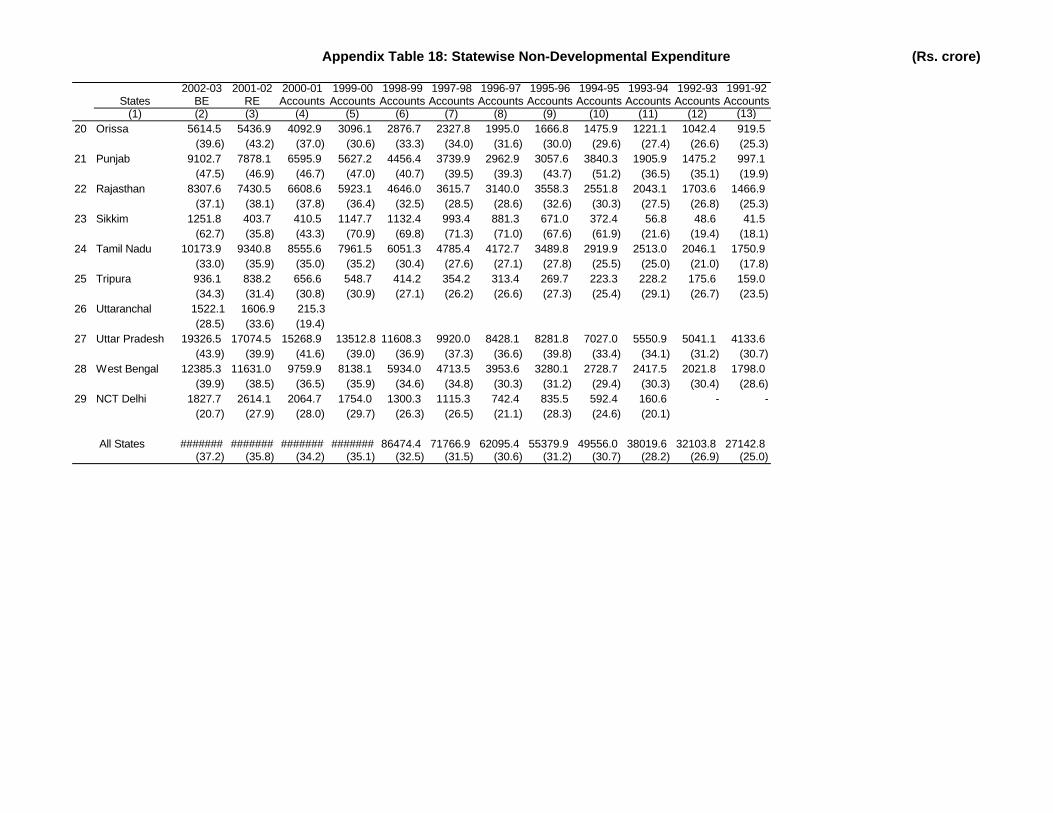
Appendix Table 18: Statewise Non-Developmental Expenditure (Rs. crore)
2002-03 2001-02 2000-01 1999-00 1998-99 1997-98 1996-97 1995-96 1994-95 1993-94 1992-93 1991-92States BE RE Accounts Accounts Accounts Accounts Accounts Accounts Accounts Accounts Accounts Accounts
(1) (2) (3) (4) (5) (6) (7) (8) (9) (10) (11) (12) (13)20 Orissa 5614.5 5436.9 4092.9 3096.1 2876.7 2327.8 1995.0 1666.8 1475.9 1221.1 1042.4 919.5
(39.6) (43.2) (37.0) (30.6) (33.3) (34.0) (31.6) (30.0) (29.6) (27.4) (26.6) (25.3)21 Punjab 9102.7 7878.1 6595.9 5627.2 4456.4 3739.9 2962.9 3057.6 3840.3 1905.9 1475.2 997.1
(47.5) (46.9) (46.7) (47.0) (40.7) (39.5) (39.3) (43.7) (51.2) (36.5) (35.1) (19.9)22 Rajasthan 8307.6 7430.5 6608.6 5923.1 4646.0 3615.7 3140.0 3558.3 2551.8 2043.1 1703.6 1466.9
(37.1) (38.1) (37.8) (36.4) (32.5) (28.5) (28.6) (32.6) (30.3) (27.5) (26.8) (25.3)23 Sikkim 1251.8 403.7 410.5 1147.7 1132.4 993.4 881.3 671.0 372.4 56.8 48.6 41.5
(62.7) (35.8) (43.3) (70.9) (69.8) (71.3) (71.0) (67.6) (61.9) (21.6) (19.4) (18.1)24 Tamil Nadu 10173.9 9340.8 8555.6 7961.5 6051.3 4785.4 4172.7 3489.8 2919.9 2513.0 2046.1 1750.9
(33.0) (35.9) (35.0) (35.2) (30.4) (27.6) (27.1) (27.8) (25.5) (25.0) (21.0) (17.8)25 Tripura 936.1 838.2 656.6 548.7 414.2 354.2 313.4 269.7 223.3 228.2 175.6 159.0
(34.3) (31.4) (30.8) (30.9) (27.1) (26.2) (26.6) (27.3) (25.4) (29.1) (26.7) (23.5)26 Uttaranchal 1522.1 1606.9 215.3
(28.5) (33.6) (19.4)27 Uttar Pradesh 19326.5 17074.5 15268.9 13512.8 11608.3 9920.0 8428.1 8281.8 7027.0 5550.9 5041.1 4133.6
(43.9) (39.9) (41.6) (39.0) (36.9) (37.3) (36.6) (39.8) (33.4) (34.1) (31.2) (30.7)28 West Bengal 12385.3 11631.0 9759.9 8138.1 5934.0 4713.5 3953.6 3280.1 2728.7 2417.5 2021.8 1798.0
(39.9) (38.5) (36.5) (35.9) (34.6) (34.8) (30.3) (31.2) (29.4) (30.3) (30.4) (28.6)29 NCT Delhi 1827.7 2614.1 2064.7 1754.0 1300.3 1115.3 742.4 835.5 592.4 160.6 - -
(20.7) (27.9) (28.0) (29.7) (26.3) (26.5) (21.1) (28.3) (24.6) (20.1)
All States ####### ####### ####### ####### 86474.4 71766.9 62095.4 55379.9 49556.0 38019.6 32103.8 27142.8(37.2) (35.8) (34.2) (35.1) (32.5) (31.5) (30.6) (31.2) (30.7) (28.2) (26.9) (25.0)
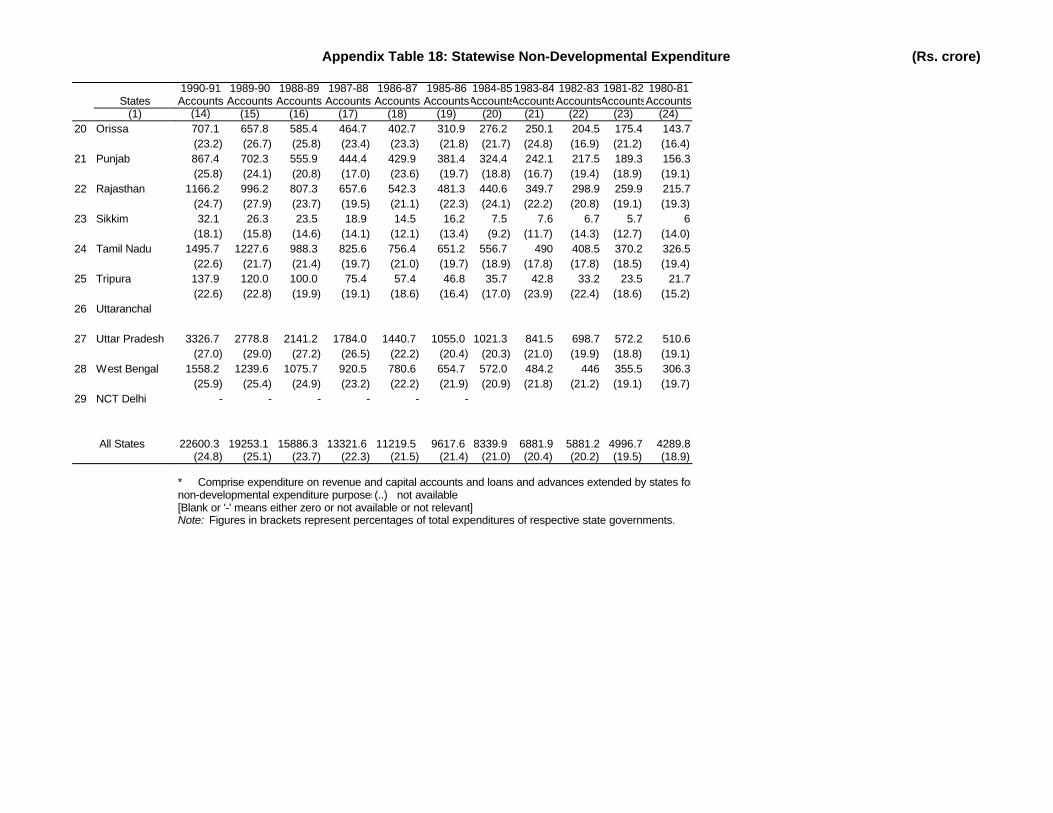
Appendix Table 18: Statewise Non-Developmental Expenditure (Rs. crore)
States(1)
20 Orissa
21 Punjab
22 Rajasthan
23 Sikkim
24 Tamil Nadu
25 Tripura
26 Uttaranchal
27 Uttar Pradesh
28 West Bengal
29 NCT Delhi
All States
1990-91 1989-90 1988-89 1987-88 1986-87 1985-86 1984-85 1983-84 1982-83 1981-82 1980-81Accounts Accounts Accounts Accounts Accounts AccountsAccountsAccountsAccountsAccountsAccounts
(14) (15) (16) (17) (18) (19) (20) (21) (22) (23) (24)707.1 657.8 585.4 464.7 402.7 310.9 276.2 250.1 204.5 175.4 143.7(23.2) (26.7) (25.8) (23.4) (23.3) (21.8) (21.7) (24.8) (16.9) (21.2) (16.4)867.4 702.3 555.9 444.4 429.9 381.4 324.4 242.1 217.5 189.3 156.3(25.8) (24.1) (20.8) (17.0) (23.6) (19.7) (18.8) (16.7) (19.4) (18.9) (19.1)
1166.2 996.2 807.3 657.6 542.3 481.3 440.6 349.7 298.9 259.9 215.7(24.7) (27.9) (23.7) (19.5) (21.1) (22.3) (24.1) (22.2) (20.8) (19.1) (19.3)32.1 26.3 23.5 18.9 14.5 16.2 7.5 7.6 6.7 5.7 6
(18.1) (15.8) (14.6) (14.1) (12.1) (13.4) (9.2) (11.7) (14.3) (12.7) (14.0)1495.7 1227.6 988.3 825.6 756.4 651.2 556.7 490 408.5 370.2 326.5
(22.6) (21.7) (21.4) (19.7) (21.0) (19.7) (18.9) (17.8) (17.8) (18.5) (19.4)137.9 120.0 100.0 75.4 57.4 46.8 35.7 42.8 33.2 23.5 21.7(22.6) (22.8) (19.9) (19.1) (18.6) (16.4) (17.0) (23.9) (22.4) (18.6) (15.2)
3326.7 2778.8 2141.2 1784.0 1440.7 1055.0 1021.3 841.5 698.7 572.2 510.6(27.0) (29.0) (27.2) (26.5) (22.2) (20.4) (20.3) (21.0) (19.9) (18.8) (19.1)
1558.2 1239.6 1075.7 920.5 780.6 654.7 572.0 484.2 446 355.5 306.3(25.9) (25.4) (24.9) (23.2) (22.2) (21.9) (20.9) (21.8) (21.2) (19.1) (19.7)
- - - - - -
22600.3 19253.1 15886.3 13321.6 11219.5 9617.6 8339.9 6881.9 5881.2 4996.7 4289.8(24.8) (25.1) (23.7) (22.3) (21.5) (21.4) (21.0) (20.4) (20.2) (19.5) (18.9)
* Comprise expenditure on revenue and capital accounts and loans and advances extended by states for non-developmental expenditure purposes.(..) not available[Blank or '-' means either zero or not available or not relevant]Note: Figures in brackets represent percentages of total expenditures of respective state governments.
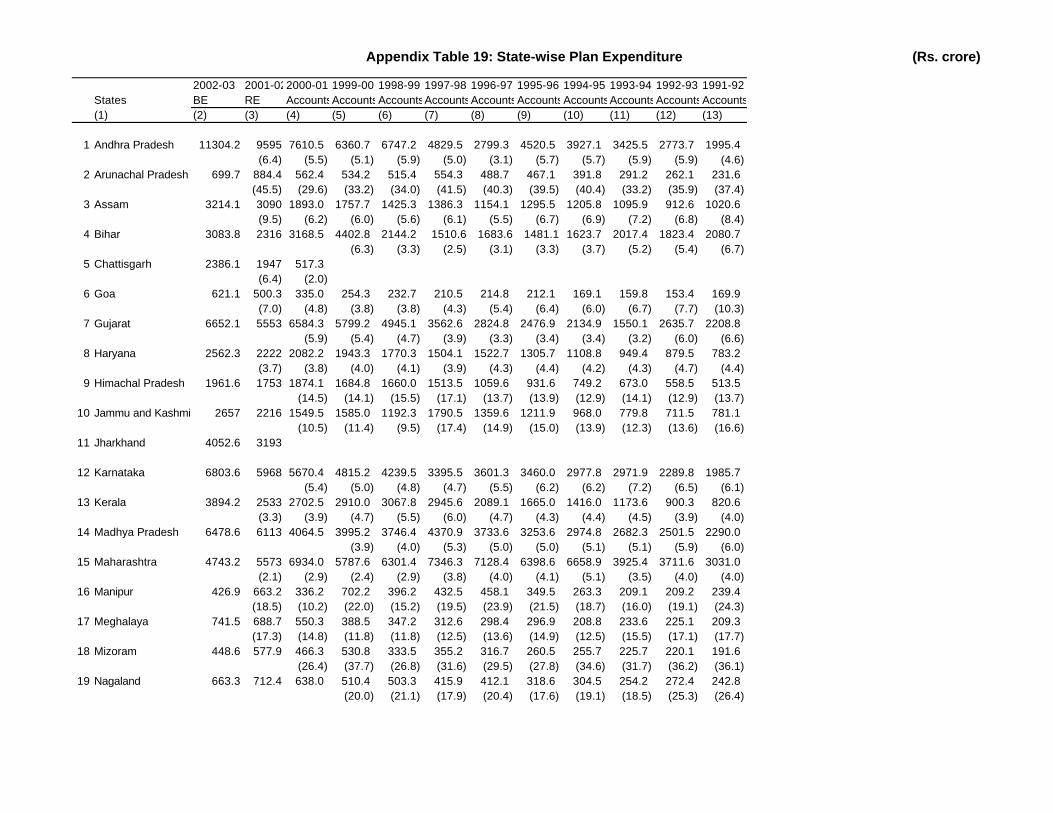
Appendix Table 19: State-wise Plan Expenditure (Rs. crore)
2002-03 2001-022000-01 1999-00 1998-99 1997-98 1996-97 1995-96 1994-95 1993-94 1992-93 1991-92States BE RE AccountsAccountsAccountsAccountsAccountsAccountsAccountsAccountsAccountsAccounts(1) (2) (3) (4) (5) (6) (7) (8) (9) (10) (11) (12) (13)
1 Andhra Pradesh 11304.2 9595 7610.5 6360.7 6747.2 4829.5 2799.3 4520.5 3927.1 3425.5 2773.7 1995.4(6.4) (5.5) (5.1) (5.9) (5.0) (3.1) (5.7) (5.7) (5.9) (5.9) (4.6)
2 Arunachal Pradesh 699.7 884.4 562.4 534.2 515.4 554.3 488.7 467.1 391.8 291.2 262.1 231.6(45.5) (29.6) (33.2) (34.0) (41.5) (40.3) (39.5) (40.4) (33.2) (35.9) (37.4)
3 Assam 3214.1 3090 1893.0 1757.7 1425.3 1386.3 1154.1 1295.5 1205.8 1095.9 912.6 1020.6(9.5) (6.2) (6.0) (5.6) (6.1) (5.5) (6.7) (6.9) (7.2) (6.8) (8.4)
4 Bihar 3083.8 2316 3168.5 4402.8 2144.2 1510.6 1683.6 1481.1 1623.7 2017.4 1823.4 2080.7(6.3) (3.3) (2.5) (3.1) (3.3) (3.7) (5.2) (5.4) (6.7)
5 Chattisgarh 2386.1 1947 517.3(6.4) (2.0)
6 Goa 621.1 500.3 335.0 254.3 232.7 210.5 214.8 212.1 169.1 159.8 153.4 169.9(7.0) (4.8) (3.8) (3.8) (4.3) (5.4) (6.4) (6.0) (6.7) (7.7) (10.3)
7 Gujarat 6652.1 5553 6584.3 5799.2 4945.1 3562.6 2824.8 2476.9 2134.9 1550.1 2635.7 2208.8(5.9) (5.4) (4.7) (3.9) (3.3) (3.4) (3.4) (3.2) (6.0) (6.6)
8 Haryana 2562.3 2222 2082.2 1943.3 1770.3 1504.1 1522.7 1305.7 1108.8 949.4 879.5 783.2(3.7) (3.8) (4.0) (4.1) (3.9) (4.3) (4.4) (4.2) (4.3) (4.7) (4.4)
9 Himachal Pradesh 1961.6 1753 1874.1 1684.8 1660.0 1513.5 1059.6 931.6 749.2 673.0 558.5 513.5(14.5) (14.1) (15.5) (17.1) (13.7) (13.9) (12.9) (14.1) (12.9) (13.7)
10 Jammu and Kashmir 2657 2216 1549.5 1585.0 1192.3 1790.5 1359.6 1211.9 968.0 779.8 711.5 781.1(10.5) (11.4) (9.5) (17.4) (14.9) (15.0) (13.9) (12.3) (13.6) (16.6)
11 Jharkhand 4052.6 3193
12 Karnataka 6803.6 5968 5670.4 4815.2 4239.5 3395.5 3601.3 3460.0 2977.8 2971.9 2289.8 1985.7(5.4) (5.0) (4.8) (4.7) (5.5) (6.2) (6.2) (7.2) (6.5) (6.1)
13 Kerala 3894.2 2533 2702.5 2910.0 3067.8 2945.6 2089.1 1665.0 1416.0 1173.6 900.3 820.6(3.3) (3.9) (4.7) (5.5) (6.0) (4.7) (4.3) (4.4) (4.5) (3.9) (4.0)
14 Madhya Pradesh 6478.6 6113 4064.5 3995.2 3746.4 4370.9 3733.6 3253.6 2974.8 2682.3 2501.5 2290.0(3.9) (4.0) (5.3) (5.0) (5.0) (5.1) (5.1) (5.9) (6.0)
15 Maharashtra 4743.2 5573 6934.0 5787.6 6301.4 7346.3 7128.4 6398.6 6658.9 3925.4 3711.6 3031.0(2.1) (2.9) (2.4) (2.9) (3.8) (4.0) (4.1) (5.1) (3.5) (4.0) (4.0)
16 Manipur 426.9 663.2 336.2 702.2 396.2 432.5 458.1 349.5 263.3 209.1 209.2 239.4(18.5) (10.2) (22.0) (15.2) (19.5) (23.9) (21.5) (18.7) (16.0) (19.1) (24.3)
17 Meghalaya 741.5 688.7 550.3 388.5 347.2 312.6 298.4 296.9 208.8 233.6 225.1 209.3(17.3) (14.8) (11.8) (11.8) (12.5) (13.6) (14.9) (12.5) (15.5) (17.1) (17.7)
18 Mizoram 448.6 577.9 466.3 530.8 333.5 355.2 316.7 260.5 255.7 225.7 220.1 191.6(26.4) (37.7) (26.8) (31.6) (29.5) (27.8) (34.6) (31.7) (36.2) (36.1)
19 Nagaland 663.3 712.4 638.0 510.4 503.3 415.9 412.1 318.6 304.5 254.2 272.4 242.8(20.0) (21.1) (17.9) (20.4) (17.6) (19.1) (18.5) (25.3) (26.4)
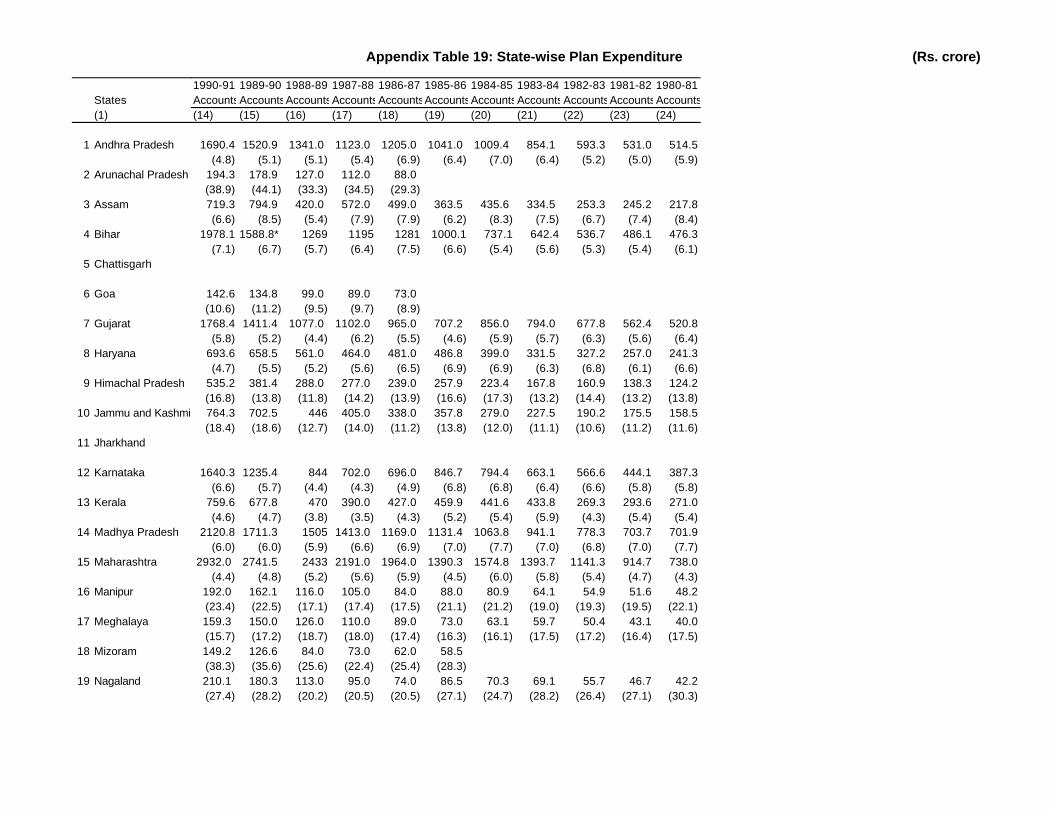
Appendix Table 19: State-wise Plan Expenditure (Rs. crore)
States(1)
1 Andhra Pradesh
2 Arunachal Pradesh
3 Assam
4 Bihar
5 Chattisgarh
6 Goa
7 Gujarat
8 Haryana
9 Himachal Pradesh
10 Jammu and Kashmir
11 Jharkhand
12 Karnataka
13 Kerala
14 Madhya Pradesh
15 Maharashtra
16 Manipur
17 Meghalaya
18 Mizoram
19 Nagaland
1990-91 1989-90 1988-89 1987-88 1986-87 1985-86 1984-85 1983-84 1982-83 1981-82 1980-81AccountsAccountsAccountsAccountsAccountsAccountsAccountsAccountsAccountsAccountsAccounts(14) (15) (16) (17) (18) (19) (20) (21) (22) (23) (24)
1690.4 1520.9 1341.0 1123.0 1205.0 1041.0 1009.4 854.1 593.3 531.0 514.5(4.8) (5.1) (5.1) (5.4) (6.9) (6.4) (7.0) (6.4) (5.2) (5.0) (5.9)
194.3 178.9 127.0 112.0 88.0(38.9) (44.1) (33.3) (34.5) (29.3)719.3 794.9 420.0 572.0 499.0 363.5 435.6 334.5 253.3 245.2 217.8(6.6) (8.5) (5.4) (7.9) (7.9) (6.2) (8.3) (7.5) (6.7) (7.4) (8.4)
1978.1 1588.8* 1269 1195 1281 1000.1 737.1 642.4 536.7 486.1 476.3(7.1) (6.7) (5.7) (6.4) (7.5) (6.6) (5.4) (5.6) (5.3) (5.4) (6.1)
142.6 134.8 99.0 89.0 73.0(10.6) (11.2) (9.5) (9.7) (8.9)
1768.4 1411.4 1077.0 1102.0 965.0 707.2 856.0 794.0 677.8 562.4 520.8(5.8) (5.2) (4.4) (6.2) (5.5) (4.6) (5.9) (5.7) (6.3) (5.6) (6.4)
693.6 658.5 561.0 464.0 481.0 486.8 399.0 331.5 327.2 257.0 241.3(4.7) (5.5) (5.2) (5.6) (6.5) (6.9) (6.9) (6.3) (6.8) (6.1) (6.6)
535.2 381.4 288.0 277.0 239.0 257.9 223.4 167.8 160.9 138.3 124.2(16.8) (13.8) (11.8) (14.2) (13.9) (16.6) (17.3) (13.2) (14.4) (13.2) (13.8)764.3 702.5 446 405.0 338.0 357.8 279.0 227.5 190.2 175.5 158.5(18.4) (18.6) (12.7) (14.0) (11.2) (13.8) (12.0) (11.1) (10.6) (11.2) (11.6)
1640.3 1235.4 844 702.0 696.0 846.7 794.4 663.1 566.6 444.1 387.3(6.6) (5.7) (4.4) (4.3) (4.9) (6.8) (6.8) (6.4) (6.6) (5.8) (5.8)
759.6 677.8 470 390.0 427.0 459.9 441.6 433.8 269.3 293.6 271.0(4.6) (4.7) (3.8) (3.5) (4.3) (5.2) (5.4) (5.9) (4.3) (5.4) (5.4)
2120.8 1711.3 1505 1413.0 1169.0 1131.4 1063.8 941.1 778.3 703.7 701.9(6.0) (6.0) (5.9) (6.6) (6.9) (7.0) (7.7) (7.0) (6.8) (7.0) (7.7)
2932.0 2741.5 2433 2191.0 1964.0 1390.3 1574.8 1393.7 1141.3 914.7 738.0(4.4) (4.8) (5.2) (5.6) (5.9) (4.5) (6.0) (5.8) (5.4) (4.7) (4.3)
192.0 162.1 116.0 105.0 84.0 88.0 80.9 64.1 54.9 51.6 48.2(23.4) (22.5) (17.1) (17.4) (17.5) (21.1) (21.2) (19.0) (19.3) (19.5) (22.1)159.3 150.0 126.0 110.0 89.0 73.0 63.1 59.7 50.4 43.1 40.0(15.7) (17.2) (18.7) (18.0) (17.4) (16.3) (16.1) (17.5) (17.2) (16.4) (17.5)149.2 126.6 84.0 73.0 62.0 58.5(38.3) (35.6) (25.6) (22.4) (25.4) (28.3)210.1 180.3 113.0 95.0 74.0 86.5 70.3 69.1 55.7 46.7 42.2(27.4) (28.2) (20.2) (20.5) (20.5) (27.1) (24.7) (28.2) (26.4) (27.1) (30.3)
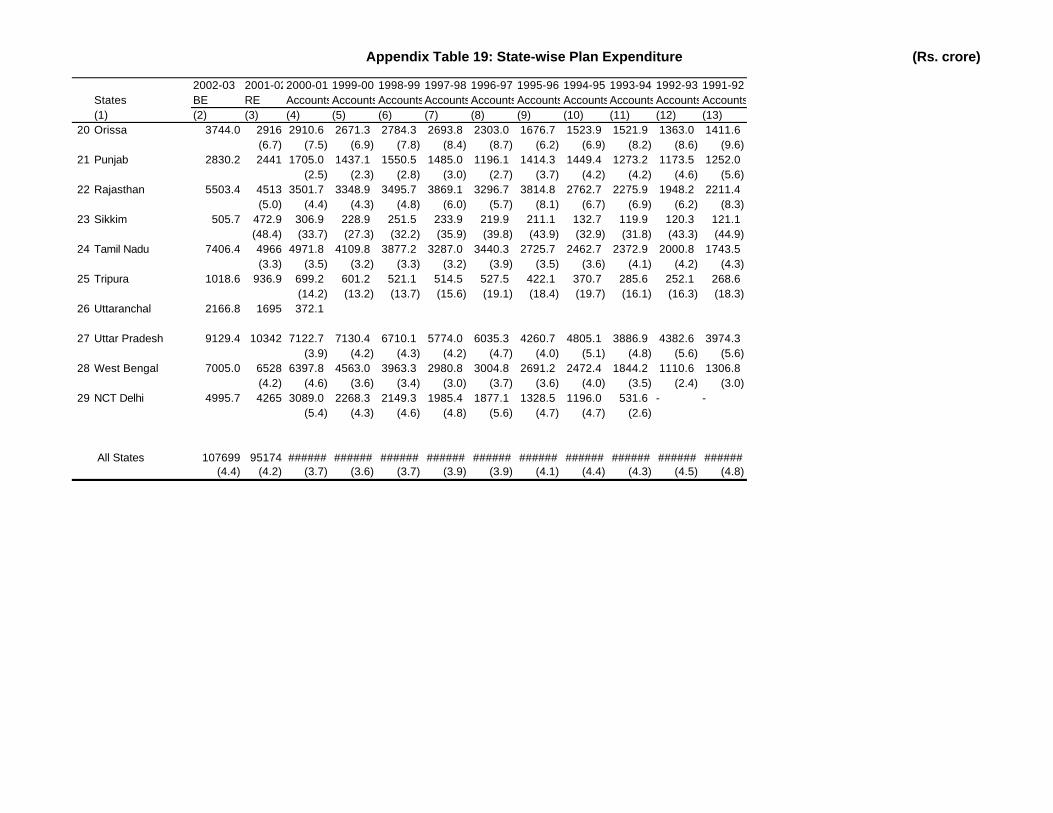
Appendix Table 19: State-wise Plan Expenditure (Rs. crore)
2002-03 2001-022000-01 1999-00 1998-99 1997-98 1996-97 1995-96 1994-95 1993-94 1992-93 1991-92States BE RE AccountsAccountsAccountsAccountsAccountsAccountsAccountsAccountsAccountsAccounts(1) (2) (3) (4) (5) (6) (7) (8) (9) (10) (11) (12) (13)
20 Orissa 3744.0 2916 2910.6 2671.3 2784.3 2693.8 2303.0 1676.7 1523.9 1521.9 1363.0 1411.6(6.7) (7.5) (6.9) (7.8) (8.4) (8.7) (6.2) (6.9) (8.2) (8.6) (9.6)
21 Punjab 2830.2 2441 1705.0 1437.1 1550.5 1485.0 1196.1 1414.3 1449.4 1273.2 1173.5 1252.0(2.5) (2.3) (2.8) (3.0) (2.7) (3.7) (4.2) (4.2) (4.6) (5.6)
22 Rajasthan 5503.4 4513 3501.7 3348.9 3495.7 3869.1 3296.7 3814.8 2762.7 2275.9 1948.2 2211.4(5.0) (4.4) (4.3) (4.8) (6.0) (5.7) (8.1) (6.7) (6.9) (6.2) (8.3)
23 Sikkim 505.7 472.9 306.9 228.9 251.5 233.9 219.9 211.1 132.7 119.9 120.3 121.1(48.4) (33.7) (27.3) (32.2) (35.9) (39.8) (43.9) (32.9) (31.8) (43.3) (44.9)
24 Tamil Nadu 7406.4 4966 4971.8 4109.8 3877.2 3287.0 3440.3 2725.7 2462.7 2372.9 2000.8 1743.5(3.3) (3.5) (3.2) (3.3) (3.2) (3.9) (3.5) (3.6) (4.1) (4.2) (4.3)
25 Tripura 1018.6 936.9 699.2 601.2 521.1 514.5 527.5 422.1 370.7 285.6 252.1 268.6(14.2) (13.2) (13.7) (15.6) (19.1) (18.4) (19.7) (16.1) (16.3) (18.3)
26 Uttaranchal 2166.8 1695 372.1
27 Uttar Pradesh 9129.4 10342 7122.7 7130.4 6710.1 5774.0 6035.3 4260.7 4805.1 3886.9 4382.6 3974.3(3.9) (4.2) (4.3) (4.2) (4.7) (4.0) (5.1) (4.8) (5.6) (5.6)
28 West Bengal 7005.0 6528 6397.8 4563.0 3963.3 2980.8 3004.8 2691.2 2472.4 1844.2 1110.6 1306.8(4.2) (4.6) (3.6) (3.4) (3.0) (3.7) (3.6) (4.0) (3.5) (2.4) (3.0)
29 NCT Delhi 4995.7 4265 3089.0 2268.3 2149.3 1985.4 1877.1 1328.5 1196.0 531.6 - -(5.4) (4.3) (4.6) (4.8) (5.6) (4.7) (4.7) (2.6)
All States 107699 95174 ###### ###### ###### ###### ###### ###### ###### ###### ###### ######(4.4) (4.2) (3.7) (3.6) (3.7) (3.9) (3.9) (4.1) (4.4) (4.3) (4.5) (4.8)
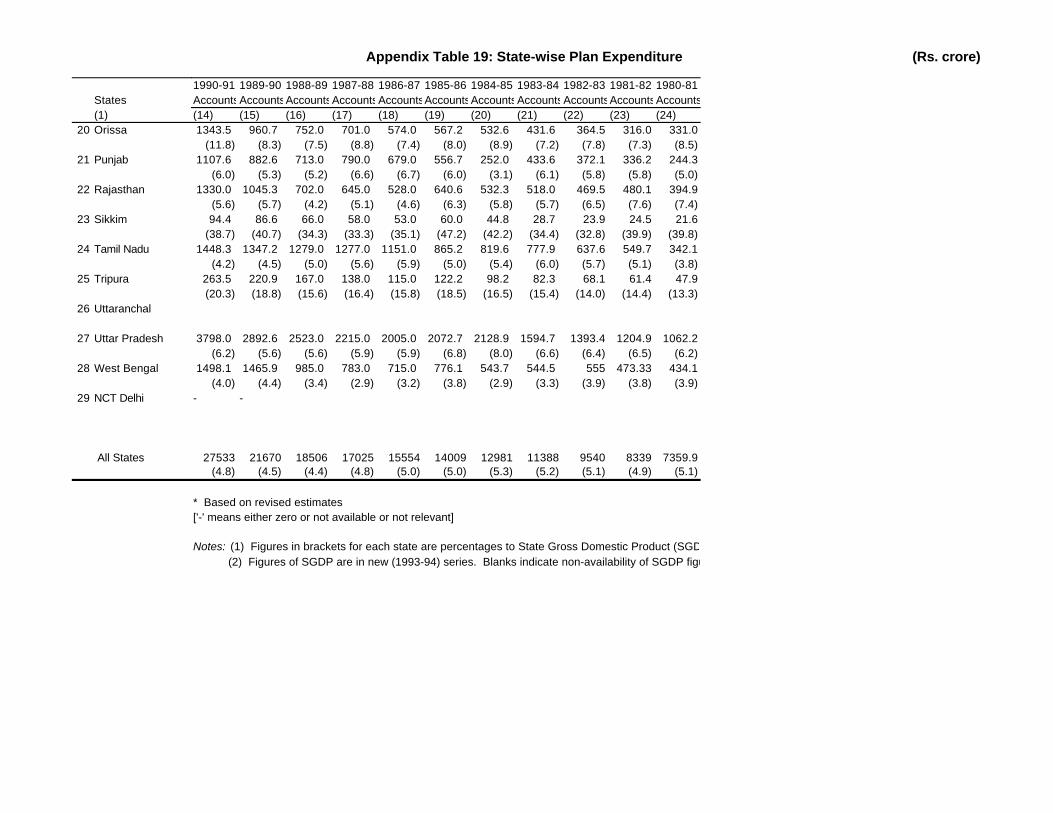
Appendix Table 19: State-wise Plan Expenditure (Rs. crore)
States(1)
20 Orissa
21 Punjab
22 Rajasthan
23 Sikkim
24 Tamil Nadu
25 Tripura
26 Uttaranchal
27 Uttar Pradesh
28 West Bengal
29 NCT Delhi
All States
1990-91 1989-90 1988-89 1987-88 1986-87 1985-86 1984-85 1983-84 1982-83 1981-82 1980-81AccountsAccountsAccountsAccountsAccountsAccountsAccountsAccountsAccountsAccountsAccounts(14) (15) (16) (17) (18) (19) (20) (21) (22) (23) (24)1343.5 960.7 752.0 701.0 574.0 567.2 532.6 431.6 364.5 316.0 331.0
(11.8) (8.3) (7.5) (8.8) (7.4) (8.0) (8.9) (7.2) (7.8) (7.3) (8.5)1107.6 882.6 713.0 790.0 679.0 556.7 252.0 433.6 372.1 336.2 244.3
(6.0) (5.3) (5.2) (6.6) (6.7) (6.0) (3.1) (6.1) (5.8) (5.8) (5.0)1330.0 1045.3 702.0 645.0 528.0 640.6 532.3 518.0 469.5 480.1 394.9
(5.6) (5.7) (4.2) (5.1) (4.6) (6.3) (5.8) (5.7) (6.5) (7.6) (7.4)94.4 86.6 66.0 58.0 53.0 60.0 44.8 28.7 23.9 24.5 21.6
(38.7) (40.7) (34.3) (33.3) (35.1) (47.2) (42.2) (34.4) (32.8) (39.9) (39.8)1448.3 1347.2 1279.0 1277.0 1151.0 865.2 819.6 777.9 637.6 549.7 342.1
(4.2) (4.5) (5.0) (5.6) (5.9) (5.0) (5.4) (6.0) (5.7) (5.1) (3.8)263.5 220.9 167.0 138.0 115.0 122.2 98.2 82.3 68.1 61.4 47.9(20.3) (18.8) (15.6) (16.4) (15.8) (18.5) (16.5) (15.4) (14.0) (14.4) (13.3)
3798.0 2892.6 2523.0 2215.0 2005.0 2072.7 2128.9 1594.7 1393.4 1204.9 1062.2(6.2) (5.6) (5.6) (5.9) (5.9) (6.8) (8.0) (6.6) (6.4) (6.5) (6.2)
1498.1 1465.9 985.0 783.0 715.0 776.1 543.7 544.5 555 473.33 434.1(4.0) (4.4) (3.4) (2.9) (3.2) (3.8) (2.9) (3.3) (3.9) (3.8) (3.9)
- -
27533 21670 18506 17025 15554 14009 12981 11388 9540 8339 7359.9(4.8) (4.5) (4.4) (4.8) (5.0) (5.0) (5.3) (5.2) (5.1) (4.9) (5.1)
* Based on revised estimates['-' means either zero or not available or not relevant]
Notes: (1) Figures in brackets for each state are percentages to State Gross Domestic Product (SGDP) at factor cost current prices. (2) Figures of SGDP are in new (1993-94) series. Blanks indicate non-availability of SGDP figures.
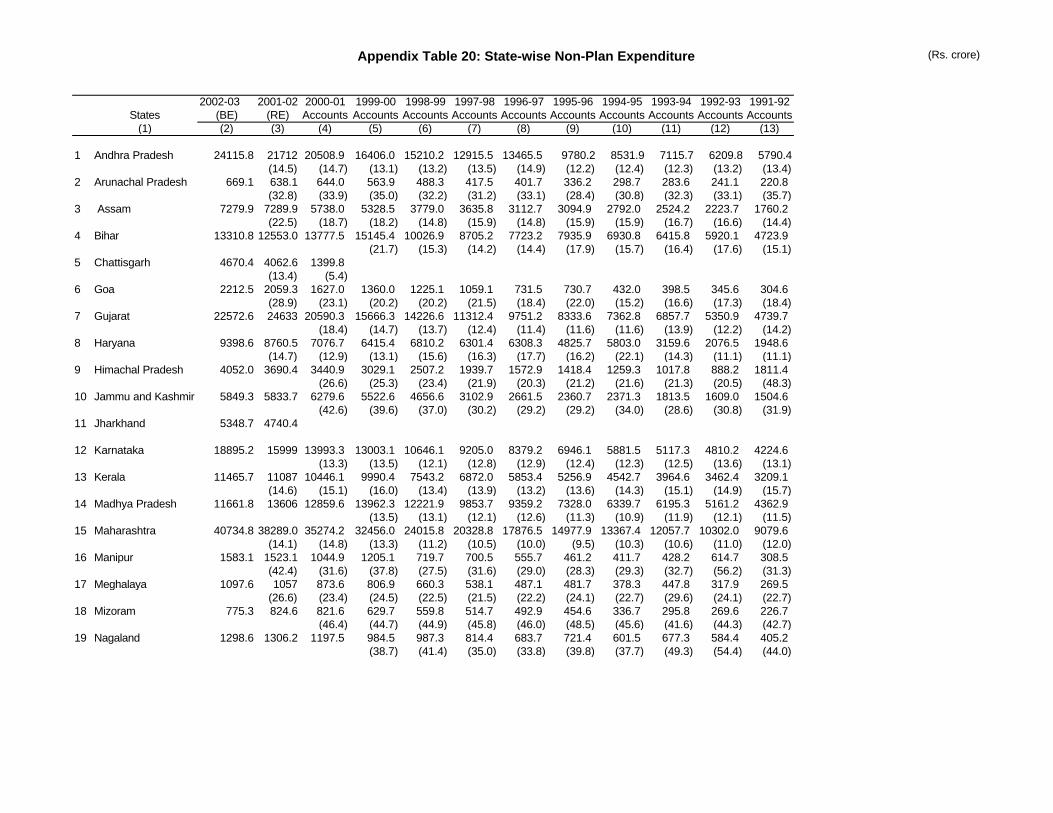
Appendix Table 20: State-wise Non-Plan Expenditure (Rs. crore)
2002-03 2001-02 2000-01 1999-00 1998-99 1997-98 1996-97 1995-96 1994-95 1993-94 1992-93 1991-92States (BE) (RE) Accounts Accounts Accounts Accounts Accounts Accounts Accounts Accounts Accounts Accounts
(1) (2) (3) (4) (5) (6) (7) (8) (9) (10) (11) (12) (13)
1 Andhra Pradesh 24115.8 21712 20508.9 16406.0 15210.2 12915.5 13465.5 9780.2 8531.9 7115.7 6209.8 5790.4(14.5) (14.7) (13.1) (13.2) (13.5) (14.9) (12.2) (12.4) (12.3) (13.2) (13.4)
2 Arunachal Pradesh 669.1 638.1 644.0 563.9 488.3 417.5 401.7 336.2 298.7 283.6 241.1 220.8(32.8) (33.9) (35.0) (32.2) (31.2) (33.1) (28.4) (30.8) (32.3) (33.1) (35.7)
3 Assam 7279.9 7289.9 5738.0 5328.5 3779.0 3635.8 3112.7 3094.9 2792.0 2524.2 2223.7 1760.2(22.5) (18.7) (18.2) (14.8) (15.9) (14.8) (15.9) (15.9) (16.7) (16.6) (14.4)
4 Bihar 13310.8 12553.0 13777.5 15145.4 10026.9 8705.2 7723.2 7935.9 6930.8 6415.8 5920.1 4723.9(21.7) (15.3) (14.2) (14.4) (17.9) (15.7) (16.4) (17.6) (15.1)
5 Chattisgarh 4670.4 4062.6 1399.8(13.4) (5.4)
6 Goa 2212.5 2059.3 1627.0 1360.0 1225.1 1059.1 731.5 730.7 432.0 398.5 345.6 304.6(28.9) (23.1) (20.2) (20.2) (21.5) (18.4) (22.0) (15.2) (16.6) (17.3) (18.4)
7 Gujarat 22572.6 24633 20590.3 15666.3 14226.6 11312.4 9751.2 8333.6 7362.8 6857.7 5350.9 4739.7(18.4) (14.7) (13.7) (12.4) (11.4) (11.6) (11.6) (13.9) (12.2) (14.2)
8 Haryana 9398.6 8760.5 7076.7 6415.4 6810.2 6301.4 6308.3 4825.7 5803.0 3159.6 2076.5 1948.6(14.7) (12.9) (13.1) (15.6) (16.3) (17.7) (16.2) (22.1) (14.3) (11.1) (11.1)
9 Himachal Pradesh 4052.0 3690.4 3440.9 3029.1 2507.2 1939.7 1572.9 1418.4 1259.3 1017.8 888.2 1811.4(26.6) (25.3) (23.4) (21.9) (20.3) (21.2) (21.6) (21.3) (20.5) (48.3)
10 Jammu and Kashmir 5849.3 5833.7 6279.6 5522.6 4656.6 3102.9 2661.5 2360.7 2371.3 1813.5 1609.0 1504.6(42.6) (39.6) (37.0) (30.2) (29.2) (29.2) (34.0) (28.6) (30.8) (31.9)
11 Jharkhand 5348.7 4740.4
12 Karnataka 18895.2 15999 13993.3 13003.1 10646.1 9205.0 8379.2 6946.1 5881.5 5117.3 4810.2 4224.6(13.3) (13.5) (12.1) (12.8) (12.9) (12.4) (12.3) (12.5) (13.6) (13.1)
13 Kerala 11465.7 11087 10446.1 9990.4 7543.2 6872.0 5853.4 5256.9 4542.7 3964.6 3462.4 3209.1(14.6) (15.1) (16.0) (13.4) (13.9) (13.2) (13.6) (14.3) (15.1) (14.9) (15.7)
14 Madhya Pradesh 11661.8 13606 12859.6 13962.3 12221.9 9853.7 9359.2 7328.0 6339.7 6195.3 5161.2 4362.9(13.5) (13.1) (12.1) (12.6) (11.3) (10.9) (11.9) (12.1) (11.5)
15 Maharashtra 40734.8 38289.0 35274.2 32456.0 24015.8 20328.8 17876.5 14977.9 13367.4 12057.7 10302.0 9079.6(14.1) (14.8) (13.3) (11.2) (10.5) (10.0) (9.5) (10.3) (10.6) (11.0) (12.0)
16 Manipur 1583.1 1523.1 1044.9 1205.1 719.7 700.5 555.7 461.2 411.7 428.2 614.7 308.5(42.4) (31.6) (37.8) (27.5) (31.6) (29.0) (28.3) (29.3) (32.7) (56.2) (31.3)
17 Meghalaya 1097.6 1057 873.6 806.9 660.3 538.1 487.1 481.7 378.3 447.8 317.9 269.5(26.6) (23.4) (24.5) (22.5) (21.5) (22.2) (24.1) (22.7) (29.6) (24.1) (22.7)
18 Mizoram 775.3 824.6 821.6 629.7 559.8 514.7 492.9 454.6 336.7 295.8 269.6 226.7(46.4) (44.7) (44.9) (45.8) (46.0) (48.5) (45.6) (41.6) (44.3) (42.7)
19 Nagaland 1298.6 1306.2 1197.5 984.5 987.3 814.4 683.7 721.4 601.5 677.3 584.4 405.2(38.7) (41.4) (35.0) (33.8) (39.8) (37.7) (49.3) (54.4) (44.0)
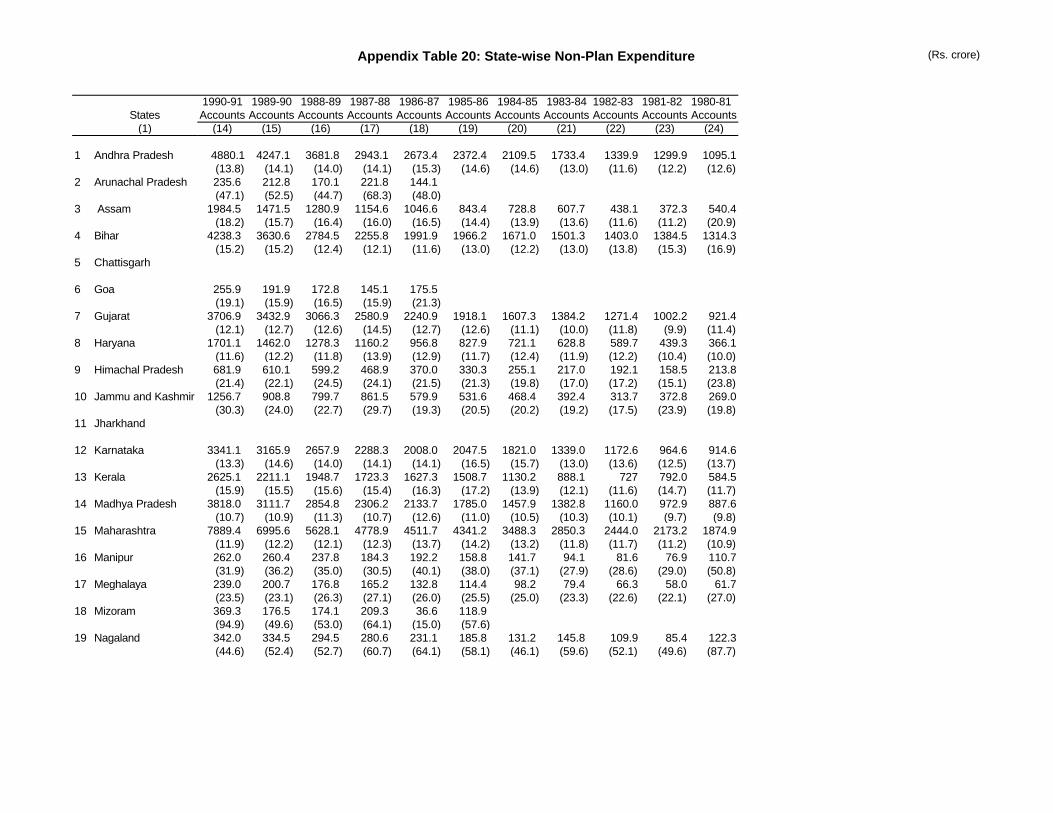
Appendix Table 20: State-wise Non-Plan Expenditure (Rs. crore)
States(1)
1 Andhra Pradesh
2 Arunachal Pradesh
3 Assam
4 Bihar
5 Chattisgarh
6 Goa
7 Gujarat
8 Haryana
9 Himachal Pradesh
10 Jammu and Kashmir
11 Jharkhand
12 Karnataka
13 Kerala
14 Madhya Pradesh
15 Maharashtra
16 Manipur
17 Meghalaya
18 Mizoram
19 Nagaland
1990-91 1989-90 1988-89 1987-88 1986-87 1985-86 1984-85 1983-84 1982-83 1981-82 1980-81Accounts Accounts Accounts Accounts Accounts Accounts Accounts Accounts Accounts Accounts Accounts
(14) (15) (16) (17) (18) (19) (20) (21) (22) (23) (24)
4880.1 4247.1 3681.8 2943.1 2673.4 2372.4 2109.5 1733.4 1339.9 1299.9 1095.1(13.8) (14.1) (14.0) (14.1) (15.3) (14.6) (14.6) (13.0) (11.6) (12.2) (12.6)235.6 212.8 170.1 221.8 144.1(47.1) (52.5) (44.7) (68.3) (48.0)
1984.5 1471.5 1280.9 1154.6 1046.6 843.4 728.8 607.7 438.1 372.3 540.4(18.2) (15.7) (16.4) (16.0) (16.5) (14.4) (13.9) (13.6) (11.6) (11.2) (20.9)
4238.3 3630.6 2784.5 2255.8 1991.9 1966.2 1671.0 1501.3 1403.0 1384.5 1314.3(15.2) (15.2) (12.4) (12.1) (11.6) (13.0) (12.2) (13.0) (13.8) (15.3) (16.9)
255.9 191.9 172.8 145.1 175.5(19.1) (15.9) (16.5) (15.9) (21.3)
3706.9 3432.9 3066.3 2580.9 2240.9 1918.1 1607.3 1384.2 1271.4 1002.2 921.4(12.1) (12.7) (12.6) (14.5) (12.7) (12.6) (11.1) (10.0) (11.8) (9.9) (11.4)
1701.1 1462.0 1278.3 1160.2 956.8 827.9 721.1 628.8 589.7 439.3 366.1(11.6) (12.2) (11.8) (13.9) (12.9) (11.7) (12.4) (11.9) (12.2) (10.4) (10.0)681.9 610.1 599.2 468.9 370.0 330.3 255.1 217.0 192.1 158.5 213.8(21.4) (22.1) (24.5) (24.1) (21.5) (21.3) (19.8) (17.0) (17.2) (15.1) (23.8)
1256.7 908.8 799.7 861.5 579.9 531.6 468.4 392.4 313.7 372.8 269.0(30.3) (24.0) (22.7) (29.7) (19.3) (20.5) (20.2) (19.2) (17.5) (23.9) (19.8)
3341.1 3165.9 2657.9 2288.3 2008.0 2047.5 1821.0 1339.0 1172.6 964.6 914.6(13.3) (14.6) (14.0) (14.1) (14.1) (16.5) (15.7) (13.0) (13.6) (12.5) (13.7)
2625.1 2211.1 1948.7 1723.3 1627.3 1508.7 1130.2 888.1 727 792.0 584.5(15.9) (15.5) (15.6) (15.4) (16.3) (17.2) (13.9) (12.1) (11.6) (14.7) (11.7)
3818.0 3111.7 2854.8 2306.2 2133.7 1785.0 1457.9 1382.8 1160.0 972.9 887.6(10.7) (10.9) (11.3) (10.7) (12.6) (11.0) (10.5) (10.3) (10.1) (9.7) (9.8)
7889.4 6995.6 5628.1 4778.9 4511.7 4341.2 3488.3 2850.3 2444.0 2173.2 1874.9(11.9) (12.2) (12.1) (12.3) (13.7) (14.2) (13.2) (11.8) (11.7) (11.2) (10.9)262.0 260.4 237.8 184.3 192.2 158.8 141.7 94.1 81.6 76.9 110.7(31.9) (36.2) (35.0) (30.5) (40.1) (38.0) (37.1) (27.9) (28.6) (29.0) (50.8)239.0 200.7 176.8 165.2 132.8 114.4 98.2 79.4 66.3 58.0 61.7(23.5) (23.1) (26.3) (27.1) (26.0) (25.5) (25.0) (23.3) (22.6) (22.1) (27.0)369.3 176.5 174.1 209.3 36.6 118.9(94.9) (49.6) (53.0) (64.1) (15.0) (57.6)342.0 334.5 294.5 280.6 231.1 185.8 131.2 145.8 109.9 85.4 122.3(44.6) (52.4) (52.7) (60.7) (64.1) (58.1) (46.1) (59.6) (52.1) (49.6) (87.7)
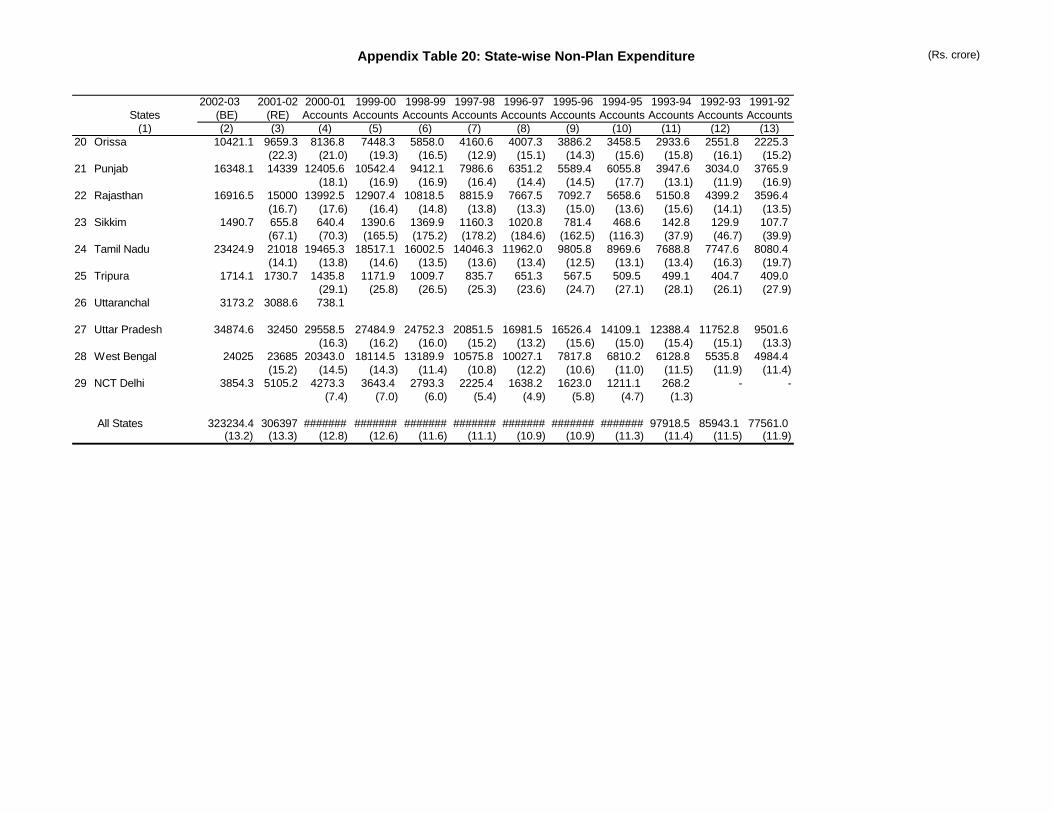
Appendix Table 20: State-wise Non-Plan Expenditure (Rs. crore)
2002-03 2001-02 2000-01 1999-00 1998-99 1997-98 1996-97 1995-96 1994-95 1993-94 1992-93 1991-92States (BE) (RE) Accounts Accounts Accounts Accounts Accounts Accounts Accounts Accounts Accounts Accounts
(1) (2) (3) (4) (5) (6) (7) (8) (9) (10) (11) (12) (13)20 Orissa 10421.1 9659.3 8136.8 7448.3 5858.0 4160.6 4007.3 3886.2 3458.5 2933.6 2551.8 2225.3
(22.3) (21.0) (19.3) (16.5) (12.9) (15.1) (14.3) (15.6) (15.8) (16.1) (15.2)21 Punjab 16348.1 14339 12405.6 10542.4 9412.1 7986.6 6351.2 5589.4 6055.8 3947.6 3034.0 3765.9
(18.1) (16.9) (16.9) (16.4) (14.4) (14.5) (17.7) (13.1) (11.9) (16.9)22 Rajasthan 16916.5 15000 13992.5 12907.4 10818.5 8815.9 7667.5 7092.7 5658.6 5150.8 4399.2 3596.4
(16.7) (17.6) (16.4) (14.8) (13.8) (13.3) (15.0) (13.6) (15.6) (14.1) (13.5)23 Sikkim 1490.7 655.8 640.4 1390.6 1369.9 1160.3 1020.8 781.4 468.6 142.8 129.9 107.7
(67.1) (70.3) (165.5) (175.2) (178.2) (184.6) (162.5) (116.3) (37.9) (46.7) (39.9)24 Tamil Nadu 23424.9 21018 19465.3 18517.1 16002.5 14046.3 11962.0 9805.8 8969.6 7688.8 7747.6 8080.4
(14.1) (13.8) (14.6) (13.5) (13.6) (13.4) (12.5) (13.1) (13.4) (16.3) (19.7)25 Tripura 1714.1 1730.7 1435.8 1171.9 1009.7 835.7 651.3 567.5 509.5 499.1 404.7 409.0
(29.1) (25.8) (26.5) (25.3) (23.6) (24.7) (27.1) (28.1) (26.1) (27.9)26 Uttaranchal 3173.2 3088.6 738.1
27 Uttar Pradesh 34874.6 32450 29558.5 27484.9 24752.3 20851.5 16981.5 16526.4 14109.1 12388.4 11752.8 9501.6(16.3) (16.2) (16.0) (15.2) (13.2) (15.6) (15.0) (15.4) (15.1) (13.3)
28 West Bengal 24025 23685 20343.0 18114.5 13189.9 10575.8 10027.1 7817.8 6810.2 6128.8 5535.8 4984.4(15.2) (14.5) (14.3) (11.4) (10.8) (12.2) (10.6) (11.0) (11.5) (11.9) (11.4)
29 NCT Delhi 3854.3 5105.2 4273.3 3643.4 2793.3 2225.4 1638.2 1623.0 1211.1 268.2 - -(7.4) (7.0) (6.0) (5.4) (4.9) (5.8) (4.7) (1.3)
All States 323234.4 306397 ####### ####### ####### ####### ####### ####### ####### 97918.5 85943.1 77561.0(13.2) (13.3) (12.8) (12.6) (11.6) (11.1) (10.9) (10.9) (11.3) (11.4) (11.5) (11.9)
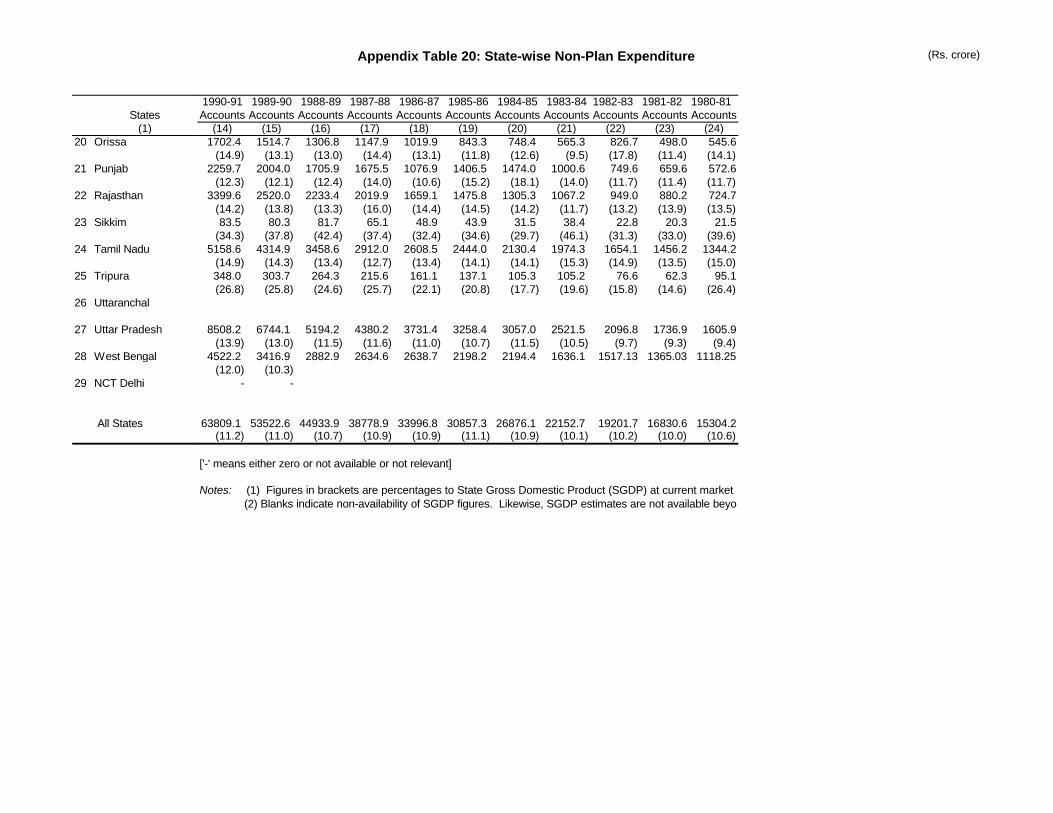
Appendix Table 20: State-wise Non-Plan Expenditure (Rs. crore)
States(1)
20 Orissa
21 Punjab
22 Rajasthan
23 Sikkim
24 Tamil Nadu
25 Tripura
26 Uttaranchal
27 Uttar Pradesh
28 West Bengal
29 NCT Delhi
All States
1990-91 1989-90 1988-89 1987-88 1986-87 1985-86 1984-85 1983-84 1982-83 1981-82 1980-81Accounts Accounts Accounts Accounts Accounts Accounts Accounts Accounts Accounts Accounts Accounts
(14) (15) (16) (17) (18) (19) (20) (21) (22) (23) (24)1702.4 1514.7 1306.8 1147.9 1019.9 843.3 748.4 565.3 826.7 498.0 545.6
(14.9) (13.1) (13.0) (14.4) (13.1) (11.8) (12.6) (9.5) (17.8) (11.4) (14.1)2259.7 2004.0 1705.9 1675.5 1076.9 1406.5 1474.0 1000.6 749.6 659.6 572.6
(12.3) (12.1) (12.4) (14.0) (10.6) (15.2) (18.1) (14.0) (11.7) (11.4) (11.7)3399.6 2520.0 2233.4 2019.9 1659.1 1475.8 1305.3 1067.2 949.0 880.2 724.7
(14.2) (13.8) (13.3) (16.0) (14.4) (14.5) (14.2) (11.7) (13.2) (13.9) (13.5)83.5 80.3 81.7 65.1 48.9 43.9 31.5 38.4 22.8 20.3 21.5
(34.3) (37.8) (42.4) (37.4) (32.4) (34.6) (29.7) (46.1) (31.3) (33.0) (39.6)5158.6 4314.9 3458.6 2912.0 2608.5 2444.0 2130.4 1974.3 1654.1 1456.2 1344.2
(14.9) (14.3) (13.4) (12.7) (13.4) (14.1) (14.1) (15.3) (14.9) (13.5) (15.0)348.0 303.7 264.3 215.6 161.1 137.1 105.3 105.2 76.6 62.3 95.1(26.8) (25.8) (24.6) (25.7) (22.1) (20.8) (17.7) (19.6) (15.8) (14.6) (26.4)
8508.2 6744.1 5194.2 4380.2 3731.4 3258.4 3057.0 2521.5 2096.8 1736.9 1605.9(13.9) (13.0) (11.5) (11.6) (11.0) (10.7) (11.5) (10.5) (9.7) (9.3) (9.4)
4522.2 3416.9 2882.9 2634.6 2638.7 2198.2 2194.4 1636.1 1517.13 1365.03 1118.25(12.0) (10.3)
- -
63809.1 53522.6 44933.9 38778.9 33996.8 30857.3 26876.1 22152.7 19201.7 16830.6 15304.2(11.2) (11.0) (10.7) (10.9) (10.9) (11.1) (10.9) (10.1) (10.2) (10.0) (10.6)
['-' means either zero or not available or not relevant]
Notes: (1) Figures in brackets are percentages to State Gross Domestic Product (SGDP) at current market prices (New series). (2) Blanks indicate non-availability of SGDP figures. Likewise, SGDP estimates are not available beyond 1998-99.
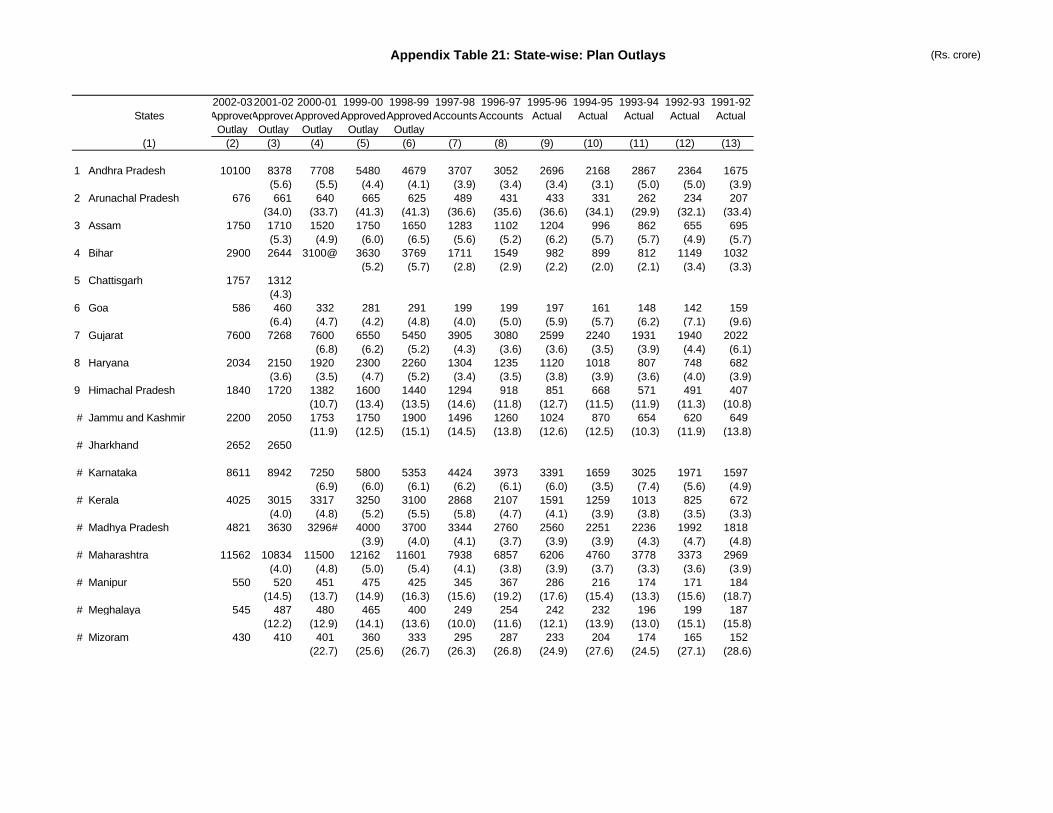
Appendix Table 21: State-wise: Plan Outlays (Rs. crore)
2002-032001-02 2000-01 1999-00 1998-99 1997-98 1996-97 1995-96 1994-95 1993-94 1992-93 1991-92States ApprovedApprovedApprovedApprovedApprovedAccounts Accounts Actual Actual Actual Actual Actual
Outlay Outlay Outlay Outlay Outlay(1) (2) (3) (4) (5) (6) (7) (8) (9) (10) (11) (12) (13)
1 Andhra Pradesh 10100 8378 7708 5480 4679 3707 3052 2696 2168 2867 2364 1675(5.6) (5.5) (4.4) (4.1) (3.9) (3.4) (3.4) (3.1) (5.0) (5.0) (3.9)
2 Arunachal Pradesh 676 661 640 665 625 489 431 433 331 262 234 207(34.0) (33.7) (41.3) (41.3) (36.6) (35.6) (36.6) (34.1) (29.9) (32.1) (33.4)
3 Assam 1750 1710 1520 1750 1650 1283 1102 1204 996 862 655 695(5.3) (4.9) (6.0) (6.5) (5.6) (5.2) (6.2) (5.7) (5.7) (4.9) (5.7)
4 Bihar 2900 2644 3100@ 3630 3769 1711 1549 982 899 812 1149 1032(5.2) (5.7) (2.8) (2.9) (2.2) (2.0) (2.1) (3.4) (3.3)
5 Chattisgarh 1757 1312(4.3)
6 Goa 586 460 332 281 291 199 199 197 161 148 142 159(6.4) (4.7) (4.2) (4.8) (4.0) (5.0) (5.9) (5.7) (6.2) (7.1) (9.6)
7 Gujarat 7600 7268 7600 6550 5450 3905 3080 2599 2240 1931 1940 2022(6.8) (6.2) (5.2) (4.3) (3.6) (3.6) (3.5) (3.9) (4.4) (6.1)
8 Haryana 2034 2150 1920 2300 2260 1304 1235 1120 1018 807 748 682(3.6) (3.5) (4.7) (5.2) (3.4) (3.5) (3.8) (3.9) (3.6) (4.0) (3.9)
9 Himachal Pradesh 1840 1720 1382 1600 1440 1294 918 851 668 571 491 407(10.7) (13.4) (13.5) (14.6) (11.8) (12.7) (11.5) (11.9) (11.3) (10.8)
# Jammu and Kashmir 2200 2050 1753 1750 1900 1496 1260 1024 870 654 620 649(11.9) (12.5) (15.1) (14.5) (13.8) (12.6) (12.5) (10.3) (11.9) (13.8)
# Jharkhand 2652 2650
# Karnataka 8611 8942 7250 5800 5353 4424 3973 3391 1659 3025 1971 1597(6.9) (6.0) (6.1) (6.2) (6.1) (6.0) (3.5) (7.4) (5.6) (4.9)
# Kerala 4025 3015 3317 3250 3100 2868 2107 1591 1259 1013 825 672(4.0) (4.8) (5.2) (5.5) (5.8) (4.7) (4.1) (3.9) (3.8) (3.5) (3.3)
# Madhya Pradesh 4821 3630 3296# 4000 3700 3344 2760 2560 2251 2236 1992 1818(3.9) (4.0) (4.1) (3.7) (3.9) (3.9) (4.3) (4.7) (4.8)
# Maharashtra 11562 10834 11500 12162 11601 7938 6857 6206 4760 3778 3373 2969(4.0) (4.8) (5.0) (5.4) (4.1) (3.8) (3.9) (3.7) (3.3) (3.6) (3.9)
# Manipur 550 520 451 475 425 345 367 286 216 174 171 184(14.5) (13.7) (14.9) (16.3) (15.6) (19.2) (17.6) (15.4) (13.3) (15.6) (18.7)
# Meghalaya 545 487 480 465 400 249 254 242 232 196 199 187(12.2) (12.9) (14.1) (13.6) (10.0) (11.6) (12.1) (13.9) (13.0) (15.1) (15.8)
# Mizoram 430 410 401 360 333 295 287 233 204 174 165 152(22.7) (25.6) (26.7) (26.3) (26.8) (24.9) (27.6) (24.5) (27.1) (28.6)
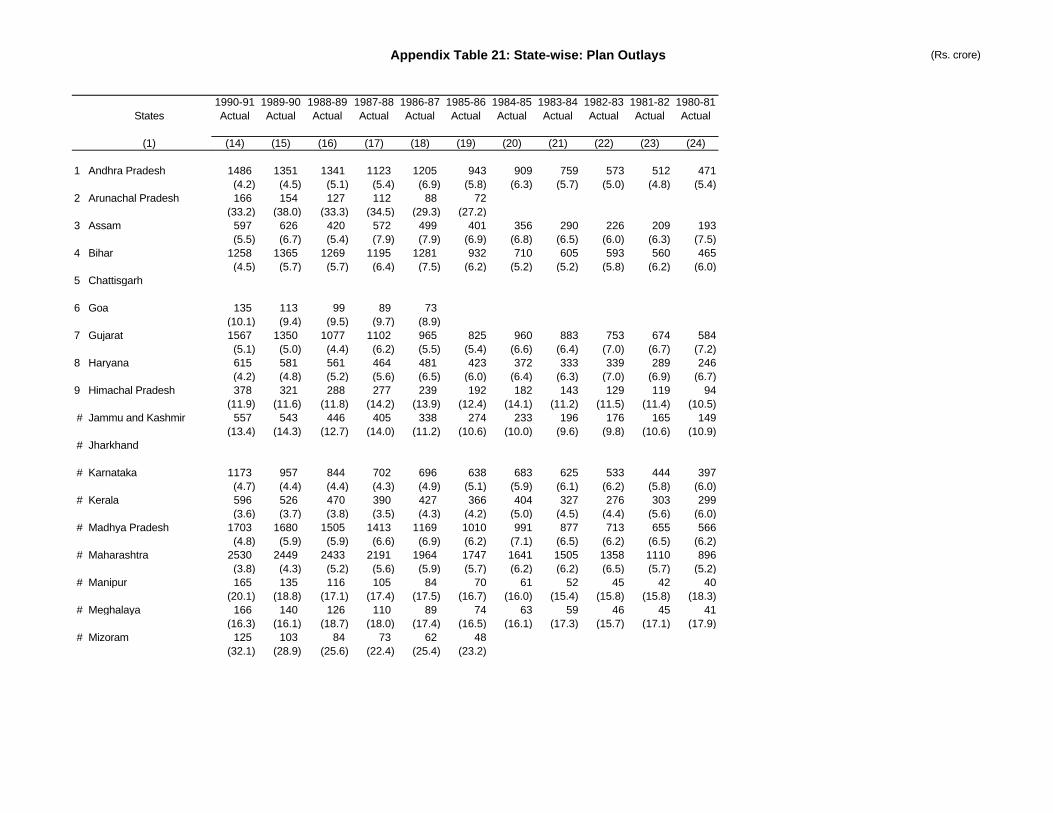
Appendix Table 21: State-wise: Plan Outlays (Rs. crore)
2002-03States
(1)
1 Andhra Pradesh
2 Arunachal Pradesh
3 Assam
4 Bihar
5 Chattisgarh
6 Goa
7 Gujarat
8 Haryana
9 Himachal Pradesh
# Jammu and Kashmir
# Jharkhand
# Karnataka
# Kerala
# Madhya Pradesh
# Maharashtra
# Manipur
# Meghalaya
# Mizoram
1990-91 1989-90 1988-89 1987-88 1986-87 1985-86 1984-85 1983-84 1982-83 1981-82 1980-81Actual Actual Actual Actual Actual Actual Actual Actual Actual Actual Actual
(14) (15) (16) (17) (18) (19) (20) (21) (22) (23) (24)
1486 1351 1341 1123 1205 943 909 759 573 512 471(4.2) (4.5) (5.1) (5.4) (6.9) (5.8) (6.3) (5.7) (5.0) (4.8) (5.4)166 154 127 112 88 72
(33.2) (38.0) (33.3) (34.5) (29.3) (27.2)597 626 420 572 499 401 356 290 226 209 193(5.5) (6.7) (5.4) (7.9) (7.9) (6.9) (6.8) (6.5) (6.0) (6.3) (7.5)
1258 1365 1269 1195 1281 932 710 605 593 560 465(4.5) (5.7) (5.7) (6.4) (7.5) (6.2) (5.2) (5.2) (5.8) (6.2) (6.0)
135 113 99 89 73(10.1) (9.4) (9.5) (9.7) (8.9)1567 1350 1077 1102 965 825 960 883 753 674 584(5.1) (5.0) (4.4) (6.2) (5.5) (5.4) (6.6) (6.4) (7.0) (6.7) (7.2)615 581 561 464 481 423 372 333 339 289 246(4.2) (4.8) (5.2) (5.6) (6.5) (6.0) (6.4) (6.3) (7.0) (6.9) (6.7)378 321 288 277 239 192 182 143 129 119 94
(11.9) (11.6) (11.8) (14.2) (13.9) (12.4) (14.1) (11.2) (11.5) (11.4) (10.5)557 543 446 405 338 274 233 196 176 165 149
(13.4) (14.3) (12.7) (14.0) (11.2) (10.6) (10.0) (9.6) (9.8) (10.6) (10.9)
1173 957 844 702 696 638 683 625 533 444 397(4.7) (4.4) (4.4) (4.3) (4.9) (5.1) (5.9) (6.1) (6.2) (5.8) (6.0)596 526 470 390 427 366 404 327 276 303 299(3.6) (3.7) (3.8) (3.5) (4.3) (4.2) (5.0) (4.5) (4.4) (5.6) (6.0)
1703 1680 1505 1413 1169 1010 991 877 713 655 566(4.8) (5.9) (5.9) (6.6) (6.9) (6.2) (7.1) (6.5) (6.2) (6.5) (6.2)
2530 2449 2433 2191 1964 1747 1641 1505 1358 1110 896(3.8) (4.3) (5.2) (5.6) (5.9) (5.7) (6.2) (6.2) (6.5) (5.7) (5.2)165 135 116 105 84 70 61 52 45 42 40
(20.1) (18.8) (17.1) (17.4) (17.5) (16.7) (16.0) (15.4) (15.8) (15.8) (18.3)166 140 126 110 89 74 63 59 46 45 41
(16.3) (16.1) (18.7) (18.0) (17.4) (16.5) (16.1) (17.3) (15.7) (17.1) (17.9)125 103 84 73 62 48
(32.1) (28.9) (25.6) (22.4) (25.4) (23.2)
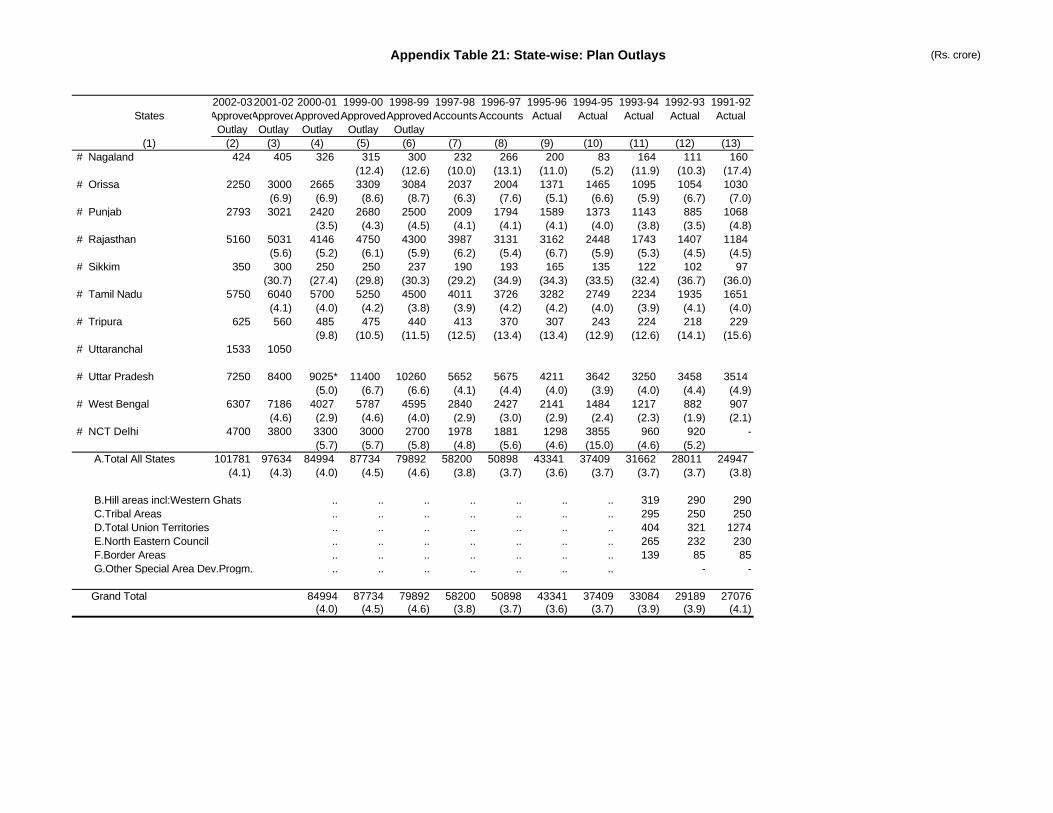
Appendix Table 21: State-wise: Plan Outlays (Rs. crore)
2002-032001-02 2000-01 1999-00 1998-99 1997-98 1996-97 1995-96 1994-95 1993-94 1992-93 1991-92States ApprovedApprovedApprovedApprovedApprovedAccounts Accounts Actual Actual Actual Actual Actual
Outlay Outlay Outlay Outlay Outlay(1) (2) (3) (4) (5) (6) (7) (8) (9) (10) (11) (12) (13)
# Nagaland 424 405 326 315 300 232 266 200 83 164 111 160(12.4) (12.6) (10.0) (13.1) (11.0) (5.2) (11.9) (10.3) (17.4)
# Orissa 2250 3000 2665 3309 3084 2037 2004 1371 1465 1095 1054 1030(6.9) (6.9) (8.6) (8.7) (6.3) (7.6) (5.1) (6.6) (5.9) (6.7) (7.0)
# Punjab 2793 3021 2420 2680 2500 2009 1794 1589 1373 1143 885 1068(3.5) (4.3) (4.5) (4.1) (4.1) (4.1) (4.0) (3.8) (3.5) (4.8)
# Rajasthan 5160 5031 4146 4750 4300 3987 3131 3162 2448 1743 1407 1184(5.6) (5.2) (6.1) (5.9) (6.2) (5.4) (6.7) (5.9) (5.3) (4.5) (4.5)
# Sikkim 350 300 250 250 237 190 193 165 135 122 102 97(30.7) (27.4) (29.8) (30.3) (29.2) (34.9) (34.3) (33.5) (32.4) (36.7) (36.0)
# Tamil Nadu 5750 6040 5700 5250 4500 4011 3726 3282 2749 2234 1935 1651(4.1) (4.0) (4.2) (3.8) (3.9) (4.2) (4.2) (4.0) (3.9) (4.1) (4.0)
# Tripura 625 560 485 475 440 413 370 307 243 224 218 229(9.8) (10.5) (11.5) (12.5) (13.4) (13.4) (12.9) (12.6) (14.1) (15.6)
# Uttaranchal 1533 1050
# Uttar Pradesh 7250 8400 9025* 11400 10260 5652 5675 4211 3642 3250 3458 3514(5.0) (6.7) (6.6) (4.1) (4.4) (4.0) (3.9) (4.0) (4.4) (4.9)
# West Bengal 6307 7186 4027 5787 4595 2840 2427 2141 1484 1217 882 907(4.6) (2.9) (4.6) (4.0) (2.9) (3.0) (2.9) (2.4) (2.3) (1.9) (2.1)
# NCT Delhi 4700 3800 3300 3000 2700 1978 1881 1298 3855 960 920 -(5.7) (5.7) (5.8) (4.8) (5.6) (4.6) (15.0) (4.6) (5.2)
A.Total All States 101781 97634 84994 87734 79892 58200 50898 43341 37409 31662 28011 24947(4.1) (4.3) (4.0) (4.5) (4.6) (3.8) (3.7) (3.6) (3.7) (3.7) (3.7) (3.8)
B.Hill areas incl:Western Ghats .. .. .. .. .. .. .. 319 290 290 C.Tribal Areas .. .. .. .. .. .. .. 295 250 250 D.Total Union Territories .. .. .. .. .. .. .. 404 321 1274 E.North Eastern Council .. .. .. .. .. .. .. 265 232 230 F.Border Areas .. .. .. .. .. .. .. 139 85 85 G.Other Special Area Dev.Progm. .. .. .. .. .. .. .. - -
Grand Total 84994 87734 79892 58200 50898 43341 37409 33084 29189 27076(4.0) (4.5) (4.6) (3.8) (3.7) (3.6) (3.7) (3.9) (3.9) (4.1)
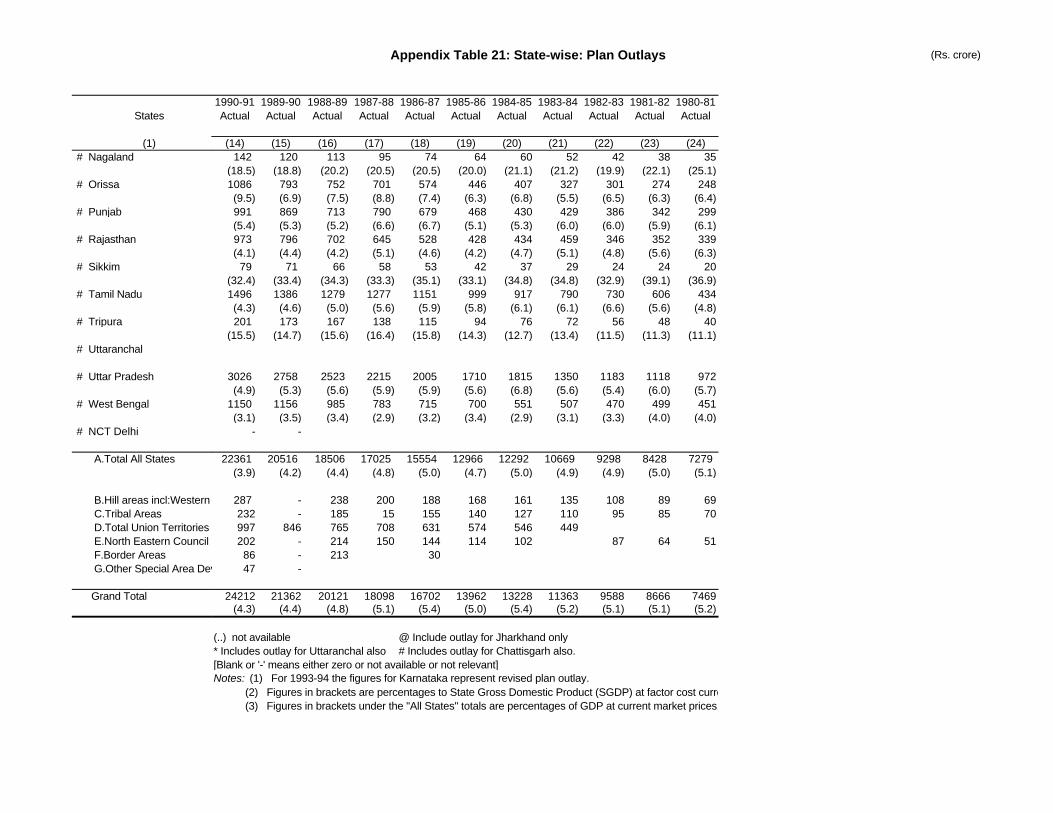
Appendix Table 21: State-wise: Plan Outlays (Rs. crore)
2002-03States
(1)# Nagaland
# Orissa
# Punjab
# Rajasthan
# Sikkim
# Tamil Nadu
# Tripura
# Uttaranchal
# Uttar Pradesh
# West Bengal
# NCT Delhi
A.Total All States
B.Hill areas incl:Western Ghats C.Tribal Areas D.Total Union Territories E.North Eastern Council F.Border Areas G.Other Special Area Dev.Progm.
Grand Total
1990-91 1989-90 1988-89 1987-88 1986-87 1985-86 1984-85 1983-84 1982-83 1981-82 1980-81Actual Actual Actual Actual Actual Actual Actual Actual Actual Actual Actual
(14) (15) (16) (17) (18) (19) (20) (21) (22) (23) (24)142 120 113 95 74 64 60 52 42 38 35
(18.5) (18.8) (20.2) (20.5) (20.5) (20.0) (21.1) (21.2) (19.9) (22.1) (25.1)1086 793 752 701 574 446 407 327 301 274 248(9.5) (6.9) (7.5) (8.8) (7.4) (6.3) (6.8) (5.5) (6.5) (6.3) (6.4)991 869 713 790 679 468 430 429 386 342 299(5.4) (5.3) (5.2) (6.6) (6.7) (5.1) (5.3) (6.0) (6.0) (5.9) (6.1)973 796 702 645 528 428 434 459 346 352 339(4.1) (4.4) (4.2) (5.1) (4.6) (4.2) (4.7) (5.1) (4.8) (5.6) (6.3)
79 71 66 58 53 42 37 29 24 24 20(32.4) (33.4) (34.3) (33.3) (35.1) (33.1) (34.8) (34.8) (32.9) (39.1) (36.9)1496 1386 1279 1277 1151 999 917 790 730 606 434(4.3) (4.6) (5.0) (5.6) (5.9) (5.8) (6.1) (6.1) (6.6) (5.6) (4.8)201 173 167 138 115 94 76 72 56 48 40
(15.5) (14.7) (15.6) (16.4) (15.8) (14.3) (12.7) (13.4) (11.5) (11.3) (11.1)
3026 2758 2523 2215 2005 1710 1815 1350 1183 1118 972(4.9) (5.3) (5.6) (5.9) (5.9) (5.6) (6.8) (5.6) (5.4) (6.0) (5.7)
1150 1156 985 783 715 700 551 507 470 499 451(3.1) (3.5) (3.4) (2.9) (3.2) (3.4) (2.9) (3.1) (3.3) (4.0) (4.0)
- -
22361 20516 18506 17025 15554 12966 12292 10669 9298 8428 7279(3.9) (4.2) (4.4) (4.8) (5.0) (4.7) (5.0) (4.9) (4.9) (5.0) (5.1)
287 - 238 200 188 168 161 135 108 89 69232 - 185 15 155 140 127 110 95 85 70997 846 765 708 631 574 546 449 202 - 214 150 144 114 102 87 64 51
86 - 213 3047 -
24212 21362 20121 18098 16702 13962 13228 11363 9588 8666 7469(4.3) (4.4) (4.8) (5.1) (5.4) (5.0) (5.4) (5.2) (5.1) (5.1) (5.2)
(..) not available @ Include outlay for Jharkhand only* Includes outlay for Uttaranchal also # Includes outlay for Chattisgarh also.[Blank or '-' means either zero or not available or not relevant]Notes: (1) For 1993-94 the figures for Karnataka represent revised plan outlay. (2) Figures in brackets are percentages to State Gross Domestic Product (SGDP) at factor cost current prices. (3) Figures in brackets under the "All States" totals are percentages of GDP at current market prices.
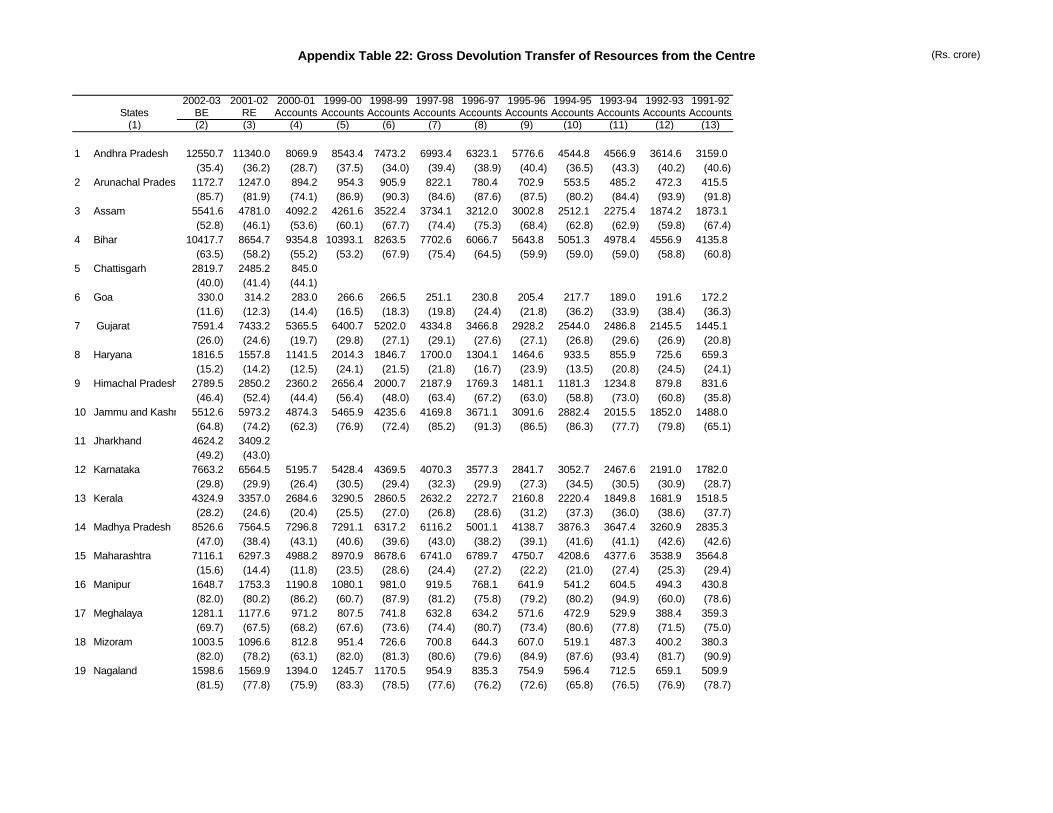
Appendix Table 22: Gross Devolution Transfer of Resources from the Centre (Rs. crore)
2002-03 2001-02 2000-01 1999-00 1998-99 1997-98 1996-97 1995-96 1994-95 1993-94 1992-93 1991-92States BE RE Accounts Accounts Accounts Accounts Accounts Accounts Accounts Accounts Accounts Accounts
(1) (2) (3) (4) (5) (6) (7) (8) (9) (10) (11) (12) (13)
1 Andhra Pradesh 12550.7 11340.0 8069.9 8543.4 7473.2 6993.4 6323.1 5776.6 4544.8 4566.9 3614.6 3159.0(35.4) (36.2) (28.7) (37.5) (34.0) (39.4) (38.9) (40.4) (36.5) (43.3) (40.2) (40.6)
2 Arunachal Pradesh 1172.7 1247.0 894.2 954.3 905.9 822.1 780.4 702.9 553.5 485.2 472.3 415.5(85.7) (81.9) (74.1) (86.9) (90.3) (84.6) (87.6) (87.5) (80.2) (84.4) (93.9) (91.8)
3 Assam 5541.6 4781.0 4092.2 4261.6 3522.4 3734.1 3212.0 3002.8 2512.1 2275.4 1874.2 1873.1(52.8) (46.1) (53.6) (60.1) (67.7) (74.4) (75.3) (68.4) (62.8) (62.9) (59.8) (67.4)
4 Bihar 10417.7 8654.7 9354.8 10393.1 8263.5 7702.6 6066.7 5643.8 5051.3 4978.4 4556.9 4135.8(63.5) (58.2) (55.2) (53.2) (67.9) (75.4) (64.5) (59.9) (59.0) (59.0) (58.8) (60.8)
5 Chattisgarh 2819.7 2485.2 845.0(40.0) (41.4) (44.1)
6 Goa 330.0 314.2 283.0 266.6 266.5 251.1 230.8 205.4 217.7 189.0 191.6 172.2(11.6) (12.3) (14.4) (16.5) (18.3) (19.8) (24.4) (21.8) (36.2) (33.9) (38.4) (36.3)
7 Gujarat 7591.4 7433.2 5365.5 6400.7 5202.0 4334.8 3466.8 2928.2 2544.0 2486.8 2145.5 1445.1(26.0) (24.6) (19.7) (29.8) (27.1) (29.1) (27.6) (27.1) (26.8) (29.6) (26.9) (20.8)
8 Haryana 1816.5 1557.8 1141.5 2014.3 1846.7 1700.0 1304.1 1464.6 933.5 855.9 725.6 659.3(15.2) (14.2) (12.5) (24.1) (21.5) (21.8) (16.7) (23.9) (13.5) (20.8) (24.5) (24.1)
9 Himachal Pradesh 2789.5 2850.2 2360.2 2656.4 2000.7 2187.9 1769.3 1481.1 1181.3 1234.8 879.8 831.6(46.4) (52.4) (44.4) (56.4) (48.0) (63.4) (67.2) (63.0) (58.8) (73.0) (60.8) (35.8)
10 Jammu and Kashmir 5512.6 5973.2 4874.3 5465.9 4235.6 4169.8 3671.1 3091.6 2882.4 2015.5 1852.0 1488.0(64.8) (74.2) (62.3) (76.9) (72.4) (85.2) (91.3) (86.5) (86.3) (77.7) (79.8) (65.1)
11 Jharkhand 4624.2 3409.2 (49.2) (43.0)
12 Karnataka 7663.2 6564.5 5195.7 5428.4 4369.5 4070.3 3577.3 2841.7 3052.7 2467.6 2191.0 1782.0(29.8) (29.9) (26.4) (30.5) (29.4) (32.3) (29.9) (27.3) (34.5) (30.5) (30.9) (28.7)
13 Kerala 4324.9 3357.0 2684.6 3290.5 2860.5 2632.2 2272.7 2160.8 2220.4 1849.8 1681.9 1518.5(28.2) (24.6) (20.4) (25.5) (27.0) (26.8) (28.6) (31.2) (37.3) (36.0) (38.6) (37.7)
14 Madhya Pradesh 8526.6 7564.5 7296.8 7291.1 6317.2 6116.2 5001.1 4138.7 3876.3 3647.4 3260.9 2835.3(47.0) (38.4) (43.1) (40.6) (39.6) (43.0) (38.2) (39.1) (41.6) (41.1) (42.6) (42.6)
15 Maharashtra 7116.1 6297.3 4988.2 8970.9 8678.6 6741.0 6789.7 4750.7 4208.6 4377.6 3538.9 3564.8(15.6) (14.4) (11.8) (23.5) (28.6) (24.4) (27.2) (22.2) (21.0) (27.4) (25.3) (29.4)
16 Manipur 1648.7 1753.3 1190.8 1080.1 981.0 919.5 768.1 641.9 541.2 604.5 494.3 430.8(82.0) (80.2) (86.2) (60.7) (87.9) (81.2) (75.8) (79.2) (80.2) (94.9) (60.0) (78.6)
17 Meghalaya 1281.1 1177.6 971.2 807.5 741.8 632.8 634.2 571.6 472.9 529.9 388.4 359.3(69.7) (67.5) (68.2) (67.6) (73.6) (74.4) (80.7) (73.4) (80.6) (77.8) (71.5) (75.0)
18 Mizoram 1003.5 1096.6 812.8 951.4 726.6 700.8 644.3 607.0 519.1 487.3 400.2 380.3(82.0) (78.2) (63.1) (82.0) (81.3) (80.6) (79.6) (84.9) (87.6) (93.4) (81.7) (90.9)
19 Nagaland 1598.6 1569.9 1394.0 1245.7 1170.5 954.9 835.3 754.9 596.4 712.5 659.1 509.9(81.5) (77.8) (75.9) (83.3) (78.5) (77.6) (76.2) (72.6) (65.8) (76.5) (76.9) (78.7)
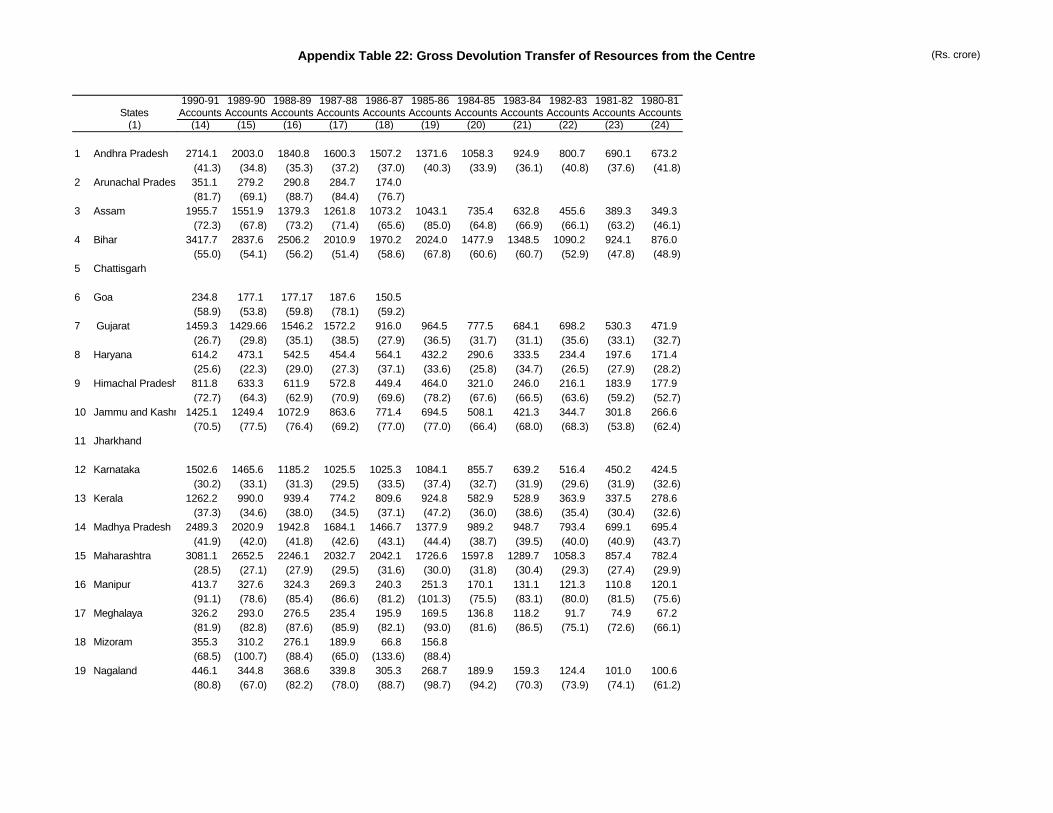
Appendix Table 22: Gross Devolution Transfer of Resources from the Centre (Rs. crore)
States(1)
1 Andhra Pradesh
2 Arunachal Pradesh
3 Assam
4 Bihar
5 Chattisgarh
6 Goa
7 Gujarat
8 Haryana
9 Himachal Pradesh
10 Jammu and Kashmir
11 Jharkhand
12 Karnataka
13 Kerala
14 Madhya Pradesh
15 Maharashtra
16 Manipur
17 Meghalaya
18 Mizoram
19 Nagaland
1990-91 1989-90 1988-89 1987-88 1986-87 1985-86 1984-85 1983-84 1982-83 1981-82 1980-81Accounts Accounts Accounts Accounts Accounts Accounts Accounts Accounts Accounts Accounts Accounts
(14) (15) (16) (17) (18) (19) (20) (21) (22) (23) (24)
2714.1 2003.0 1840.8 1600.3 1507.2 1371.6 1058.3 924.9 800.7 690.1 673.2(41.3) (34.8) (35.3) (37.2) (37.0) (40.3) (33.9) (36.1) (40.8) (37.6) (41.8)351.1 279.2 290.8 284.7 174.0(81.7) (69.1) (88.7) (84.4) (76.7)
1955.7 1551.9 1379.3 1261.8 1073.2 1043.1 735.4 632.8 455.6 389.3 349.3(72.3) (67.8) (73.2) (71.4) (65.6) (85.0) (64.8) (66.9) (66.1) (63.2) (46.1)
3417.7 2837.6 2506.2 2010.9 1970.2 2024.0 1477.9 1348.5 1090.2 924.1 876.0(55.0) (54.1) (56.2) (51.4) (58.6) (67.8) (60.6) (60.7) (52.9) (47.8) (48.9)
234.8 177.1 177.17 187.6 150.5(58.9) (53.8) (59.8) (78.1) (59.2)
1459.3 1429.66 1546.2 1572.2 916.0 964.5 777.5 684.1 698.2 530.3 471.9(26.7) (29.8) (35.1) (38.5) (27.9) (36.5) (31.7) (31.1) (35.6) (33.1) (32.7)614.2 473.1 542.5 454.4 564.1 432.2 290.6 333.5 234.4 197.6 171.4(25.6) (22.3) (29.0) (27.3) (37.1) (33.6) (25.8) (34.7) (26.5) (27.9) (28.2)811.8 633.3 611.9 572.8 449.4 464.0 321.0 246.0 216.1 183.9 177.9(72.7) (64.3) (62.9) (70.9) (69.6) (78.2) (67.6) (66.5) (63.6) (59.2) (52.7)
1425.1 1249.4 1072.9 863.6 771.4 694.5 508.1 421.3 344.7 301.8 266.6(70.5) (77.5) (76.4) (69.2) (77.0) (77.0) (66.4) (68.0) (68.3) (53.8) (62.4)
1502.6 1465.6 1185.2 1025.5 1025.3 1084.1 855.7 639.2 516.4 450.2 424.5(30.2) (33.1) (31.3) (29.5) (33.5) (37.4) (32.7) (31.9) (29.6) (31.9) (32.6)
1262.2 990.0 939.4 774.2 809.6 924.8 582.9 528.9 363.9 337.5 278.6(37.3) (34.6) (38.0) (34.5) (37.1) (47.2) (36.0) (38.6) (35.4) (30.4) (32.6)
2489.3 2020.9 1942.8 1684.1 1466.7 1377.9 989.2 948.7 793.4 699.1 695.4(41.9) (42.0) (41.8) (42.6) (43.1) (44.4) (38.7) (39.5) (40.0) (40.9) (43.7)
3081.1 2652.5 2246.1 2032.7 2042.1 1726.6 1597.8 1289.7 1058.3 857.4 782.4(28.5) (27.1) (27.9) (29.5) (31.6) (30.0) (31.8) (30.4) (29.3) (27.4) (29.9)413.7 327.6 324.3 269.3 240.3 251.3 170.1 131.1 121.3 110.8 120.1(91.1) (78.6) (85.4) (86.6) (81.2) (101.3) (75.5) (83.1) (80.0) (81.5) (75.6)326.2 293.0 276.5 235.4 195.9 169.5 136.8 118.2 91.7 74.9 67.2(81.9) (82.8) (87.6) (85.9) (82.1) (93.0) (81.6) (86.5) (75.1) (72.6) (66.1)355.3 310.2 276.1 189.9 66.8 156.8 (68.5) (100.7) (88.4) (65.0) (133.6) (88.4) 446.1 344.8 368.6 339.8 305.3 268.7 189.9 159.3 124.4 101.0 100.6(80.8) (67.0) (82.2) (78.0) (88.7) (98.7) (94.2) (70.3) (73.9) (74.1) (61.2)
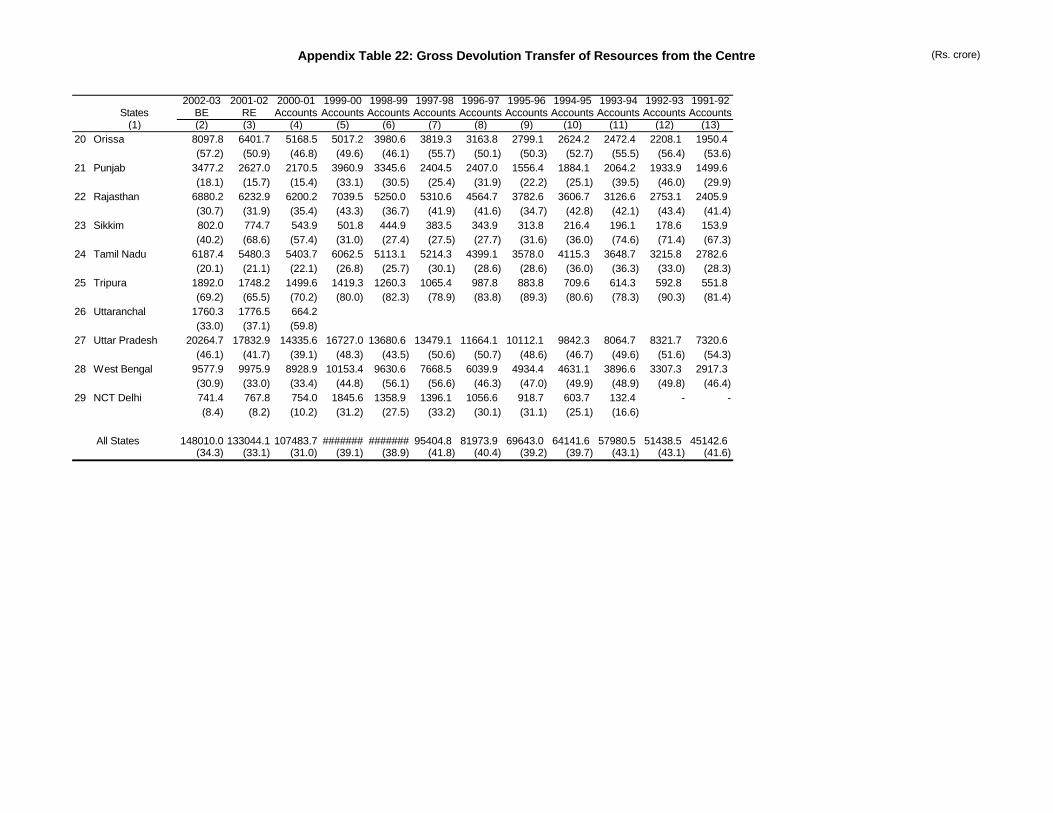
Appendix Table 22: Gross Devolution Transfer of Resources from the Centre (Rs. crore)
2002-03 2001-02 2000-01 1999-00 1998-99 1997-98 1996-97 1995-96 1994-95 1993-94 1992-93 1991-92States BE RE Accounts Accounts Accounts Accounts Accounts Accounts Accounts Accounts Accounts Accounts
(1) (2) (3) (4) (5) (6) (7) (8) (9) (10) (11) (12) (13)20 Orissa 8097.8 6401.7 5168.5 5017.2 3980.6 3819.3 3163.8 2799.1 2624.2 2472.4 2208.1 1950.4
(57.2) (50.9) (46.8) (49.6) (46.1) (55.7) (50.1) (50.3) (52.7) (55.5) (56.4) (53.6)21 Punjab 3477.2 2627.0 2170.5 3960.9 3345.6 2404.5 2407.0 1556.4 1884.1 2064.2 1933.9 1499.6
(18.1) (15.7) (15.4) (33.1) (30.5) (25.4) (31.9) (22.2) (25.1) (39.5) (46.0) (29.9)22 Rajasthan 6880.2 6232.9 6200.2 7039.5 5250.0 5310.6 4564.7 3782.6 3606.7 3126.6 2753.1 2405.9
(30.7) (31.9) (35.4) (43.3) (36.7) (41.9) (41.6) (34.7) (42.8) (42.1) (43.4) (41.4)23 Sikkim 802.0 774.7 543.9 501.8 444.9 383.5 343.9 313.8 216.4 196.1 178.6 153.9
(40.2) (68.6) (57.4) (31.0) (27.4) (27.5) (27.7) (31.6) (36.0) (74.6) (71.4) (67.3)24 Tamil Nadu 6187.4 5480.3 5403.7 6062.5 5113.1 5214.3 4399.1 3578.0 4115.3 3648.7 3215.8 2782.6
(20.1) (21.1) (22.1) (26.8) (25.7) (30.1) (28.6) (28.6) (36.0) (36.3) (33.0) (28.3)25 Tripura 1892.0 1748.2 1499.6 1419.3 1260.3 1065.4 987.8 883.8 709.6 614.3 592.8 551.8
(69.2) (65.5) (70.2) (80.0) (82.3) (78.9) (83.8) (89.3) (80.6) (78.3) (90.3) (81.4)26 Uttaranchal 1760.3 1776.5 664.2
(33.0) (37.1) (59.8)27 Uttar Pradesh 20264.7 17832.9 14335.6 16727.0 13680.6 13479.1 11664.1 10112.1 9842.3 8064.7 8321.7 7320.6
(46.1) (41.7) (39.1) (48.3) (43.5) (50.6) (50.7) (48.6) (46.7) (49.6) (51.6) (54.3)28 West Bengal 9577.9 9975.9 8928.9 10153.4 9630.6 7668.5 6039.9 4934.4 4631.1 3896.6 3307.3 2917.3
(30.9) (33.0) (33.4) (44.8) (56.1) (56.6) (46.3) (47.0) (49.9) (48.9) (49.8) (46.4)29 NCT Delhi 741.4 767.8 754.0 1845.6 1358.9 1396.1 1056.6 918.7 603.7 132.4 - -
(8.4) (8.2) (10.2) (31.2) (27.5) (33.2) (30.1) (31.1) (25.1) (16.6)
All States 148010.0 133044.1 107483.7 ####### ####### 95404.8 81973.9 69643.0 64141.6 57980.5 51438.5 45142.6(34.3) (33.1) (31.0) (39.1) (38.9) (41.8) (40.4) (39.2) (39.7) (43.1) (43.1) (41.6)
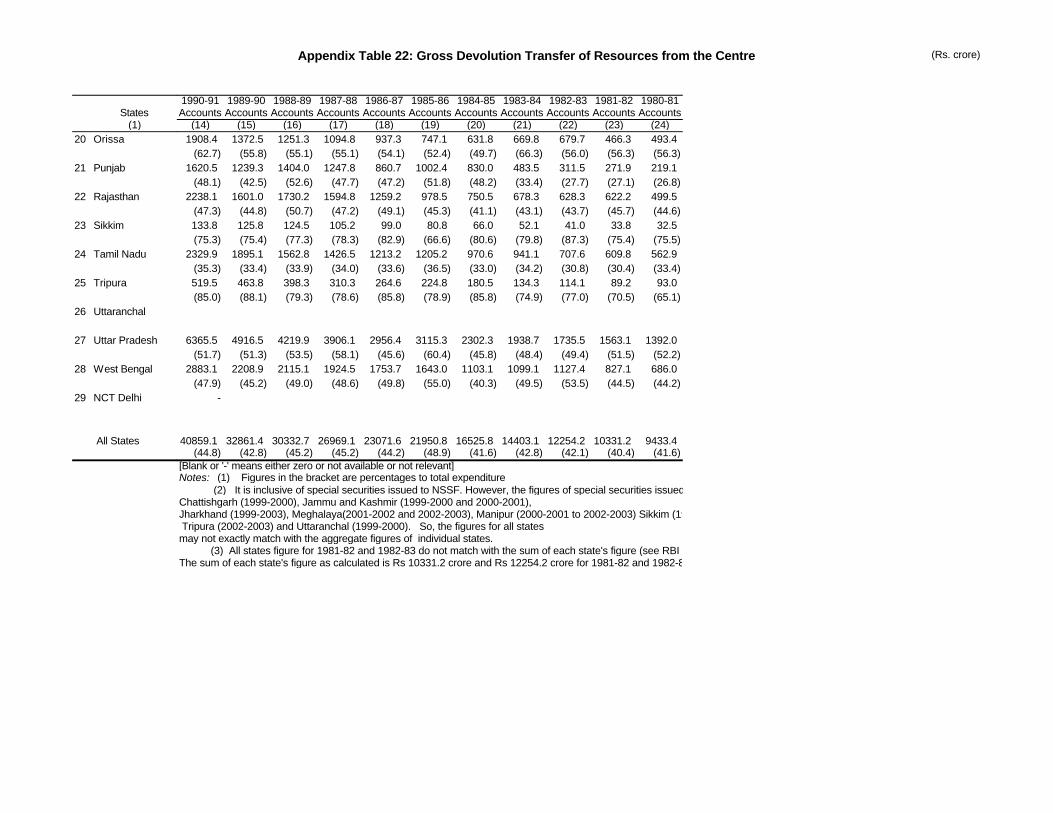
Appendix Table 22: Gross Devolution Transfer of Resources from the Centre (Rs. crore)
States(1)
20 Orissa
21 Punjab
22 Rajasthan
23 Sikkim
24 Tamil Nadu
25 Tripura
26 Uttaranchal
27 Uttar Pradesh
28 West Bengal
29 NCT Delhi
All States
1990-91 1989-90 1988-89 1987-88 1986-87 1985-86 1984-85 1983-84 1982-83 1981-82 1980-81Accounts Accounts Accounts Accounts Accounts Accounts Accounts Accounts Accounts Accounts Accounts
(14) (15) (16) (17) (18) (19) (20) (21) (22) (23) (24)1908.4 1372.5 1251.3 1094.8 937.3 747.1 631.8 669.8 679.7 466.3 493.4
(62.7) (55.8) (55.1) (55.1) (54.1) (52.4) (49.7) (66.3) (56.0) (56.3) (56.3)1620.5 1239.3 1404.0 1247.8 860.7 1002.4 830.0 483.5 311.5 271.9 219.1
(48.1) (42.5) (52.6) (47.7) (47.2) (51.8) (48.2) (33.4) (27.7) (27.1) (26.8)2238.1 1601.0 1730.2 1594.8 1259.2 978.5 750.5 678.3 628.3 622.2 499.5
(47.3) (44.8) (50.7) (47.2) (49.1) (45.3) (41.1) (43.1) (43.7) (45.7) (44.6)133.8 125.8 124.5 105.2 99.0 80.8 66.0 52.1 41.0 33.8 32.5(75.3) (75.4) (77.3) (78.3) (82.9) (66.6) (80.6) (79.8) (87.3) (75.4) (75.5)
2329.9 1895.1 1562.8 1426.5 1213.2 1205.2 970.6 941.1 707.6 609.8 562.9(35.3) (33.4) (33.9) (34.0) (33.6) (36.5) (33.0) (34.2) (30.8) (30.4) (33.4)519.5 463.8 398.3 310.3 264.6 224.8 180.5 134.3 114.1 89.2 93.0(85.0) (88.1) (79.3) (78.6) (85.8) (78.9) (85.8) (74.9) (77.0) (70.5) (65.1)
6365.5 4916.5 4219.9 3906.1 2956.4 3115.3 2302.3 1938.7 1735.5 1563.1 1392.0(51.7) (51.3) (53.5) (58.1) (45.6) (60.4) (45.8) (48.4) (49.4) (51.5) (52.2)
2883.1 2208.9 2115.1 1924.5 1753.7 1643.0 1103.1 1099.1 1127.4 827.1 686.0(47.9) (45.2) (49.0) (48.6) (49.8) (55.0) (40.3) (49.5) (53.5) (44.5) (44.2)
-
40859.1 32861.4 30332.7 26969.1 23071.6 21950.8 16525.8 14403.1 12254.2 10331.2 9433.4(44.8) (42.8) (45.2) (45.2) (44.2) (48.9) (41.6) (42.8) (42.1) (40.4) (41.6)
[Blank or '-' means either zero or not available or not relevant]Notes: (1) Figures in the bracket are percentages to total expenditure (2) It is inclusive of special securities issued to NSSF. However, the figures of special securities issued to NSSF are not available for Chattishgarh (1999-2000), Jammu and Kashmir (1999-2000 and 2000-2001), Jharkhand (1999-2003), Meghalaya(2001-2002 and 2002-2003), Manipur (2000-2001 to 2002-2003) Sikkim (1999-2000 & 2000-01), Tripura (2002-2003) and Uttaranchal (1999-2000). So, the figures for all statesmay not exactly match with the aggregate figures of individual states. (3) All states figure for 1981-82 and 1982-83 do not match with the sum of each state's figure (see RBI Bulletin, October 1984). The sum of each state's figure as calculated is Rs 10331.2 crore and Rs 12254.2 crore for 1981-82 and 1982-83 respectively.
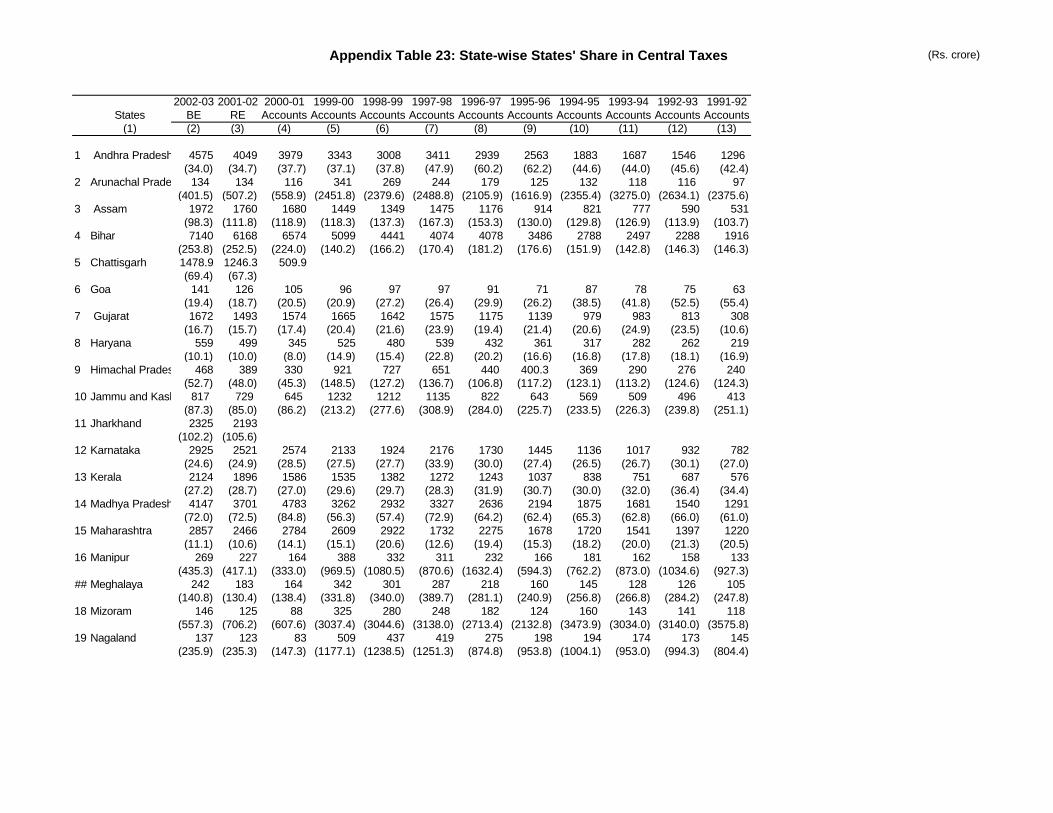
Appendix Table 23: State-wise States' Share in Central Taxes (Rs. crore)
2002-03 2001-02 2000-01 1999-00 1998-99 1997-98 1996-97 1995-96 1994-95 1993-94 1992-93 1991-92States BE RE Accounts Accounts Accounts Accounts Accounts Accounts Accounts Accounts Accounts Accounts
(1) (2) (3) (4) (5) (6) (7) (8) (9) (10) (11) (12) (13)
1 Andhra Pradesh 4575 4049 3979 3343 3008 3411 2939 2563 1883 1687 1546 1296(34.0) (34.7) (37.7) (37.1) (37.8) (47.9) (60.2) (62.2) (44.6) (44.0) (45.6) (42.4)
2 Arunachal Pradesh 134 134 116 341 269 244 179 125 132 118 116 97(401.5) (507.2) (558.9) (2451.8) (2379.6) (2488.8) (2105.9) (1616.9) (2355.4) (3275.0) (2634.1) (2375.6)
3 Assam 1972 1760 1680 1449 1349 1475 1176 914 821 777 590 531(98.3) (111.8) (118.9) (118.3) (137.3) (167.3) (153.3) (130.0) (129.8) (126.9) (113.9) (103.7)
4 Bihar 7140 6168 6574 5099 4441 4074 4078 3486 2788 2497 2288 1916(253.8) (252.5) (224.0) (140.2) (166.2) (170.4) (181.2) (176.6) (151.9) (142.8) (146.3) (146.3)
5 Chattisgarh 1478.9 1246.3 509.9(69.4) (67.3)
6 Goa 141 126 105 96 97 97 91 71 87 78 75 63(19.4) (18.7) (20.5) (20.9) (27.2) (26.4) (29.9) (26.2) (38.5) (41.8) (52.5) (55.4)
7 Gujarat 1672 1493 1574 1665 1642 1575 1175 1139 979 983 813 308(16.7) (15.7) (17.4) (20.4) (21.6) (23.9) (19.4) (21.4) (20.6) (24.9) (23.5) (10.6)
8 Haryana 559 499 345 525 480 539 432 361 317 282 262 219(10.1) (10.0) (8.0) (14.9) (15.4) (22.8) (20.2) (16.6) (16.8) (17.8) (18.1) (16.9)
9 Himachal Pradesh 468 389 330 921 727 651 440 400.3 369 290 276 240(52.7) (48.0) (45.3) (148.5) (127.2) (136.7) (106.8) (117.2) (123.1) (113.2) (124.6) (124.3)
10 Jammu and Kashmir817 729 645 1232 1212 1135 822 643 569 509 496 413(87.3) (85.0) (86.2) (213.2) (277.6) (308.9) (284.0) (225.7) (233.5) (226.3) (239.8) (251.1)
11 Jharkhand 2325 2193(102.2) (105.6)
12 Karnataka 2925 2521 2574 2133 1924 2176 1730 1445 1136 1017 932 782(24.6) (24.9) (28.5) (27.5) (27.7) (33.9) (30.0) (27.4) (26.5) (26.7) (30.1) (27.0)
13 Kerala 2124 1896 1586 1535 1382 1272 1243 1037 838 751 687 576(27.2) (28.7) (27.0) (29.6) (29.7) (28.3) (31.9) (30.7) (30.0) (32.0) (36.4) (34.4)
14 Madhya Pradesh 4147 3701 4783 3262 2932 3327 2636 2194 1875 1681 1540 1291(72.0) (72.5) (84.8) (56.3) (57.4) (72.9) (64.2) (62.4) (65.3) (62.8) (66.0) (61.0)
15 Maharashtra 2857 2466 2784 2609 2922 1732 2275 1678 1720 1541 1397 1220(11.1) (10.6) (14.1) (15.1) (20.6) (12.6) (19.4) (15.3) (18.2) (20.0) (21.3) (20.5)
16 Manipur 269 227 164 388 332 311 232 166 181 162 158 133(435.3) (417.1) (333.0) (969.5) (1080.5) (870.6) (1632.4) (594.3) (762.2) (873.0) (1034.6) (927.3)
## Meghalaya 242 183 164 342 301 287 218 160 145 128 126 105(140.8) (130.4) (138.4) (331.8) (340.0) (389.7) (281.1) (240.9) (256.8) (266.8) (284.2) (247.8)
18 Mizoram 146 125 88 325 280 248 182 124 160 143 141 118(557.3) (706.2) (607.6) (3037.4) (3044.6) (3138.0) (2713.4) (2132.8) (3473.9) (3034.0) (3140.0) (3575.8)
19 Nagaland 137 123 83 509 437 419 275 198 194 174 173 145(235.9) (235.3) (147.3) (1177.1) (1238.5) (1251.3) (874.8) (953.8) (1004.1) (953.0) (994.3) (804.4)
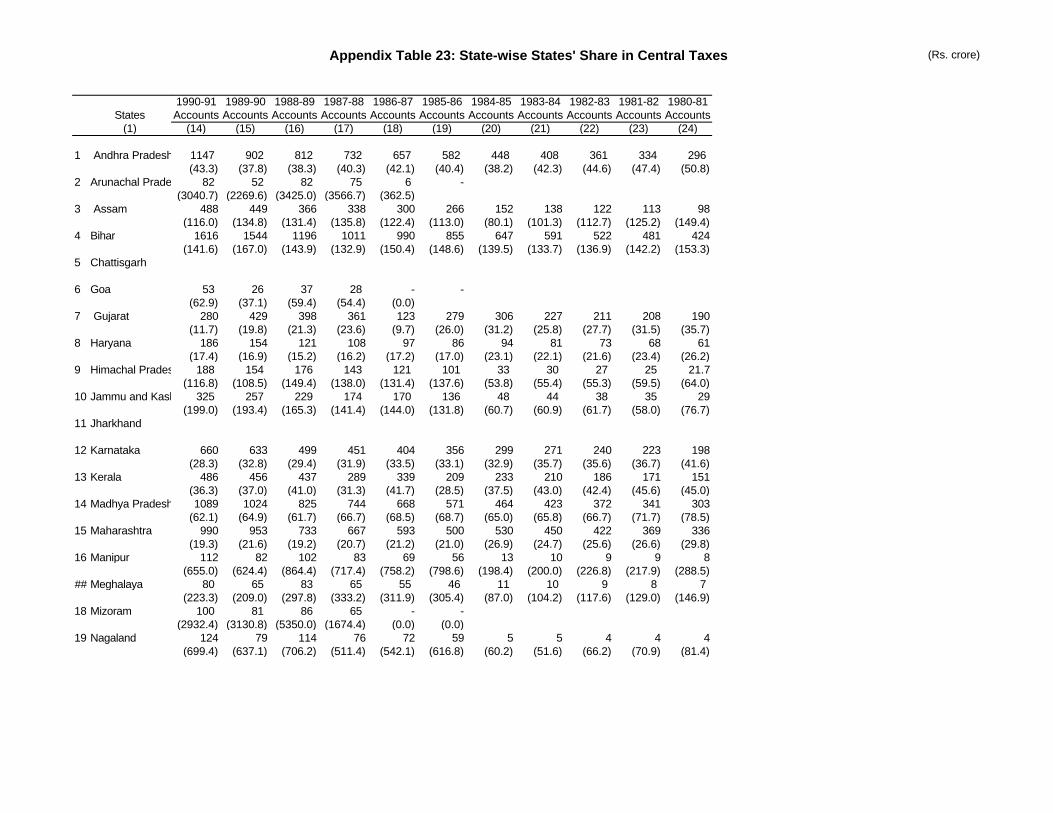
Appendix Table 23: State-wise States' Share in Central Taxes (Rs. crore)
States(1)
1 Andhra Pradesh
2 Arunachal Pradesh
3 Assam
4 Bihar
5 Chattisgarh
6 Goa
7 Gujarat
8 Haryana
9 Himachal Pradesh
10 Jammu and Kashmir
11 Jharkhand
12 Karnataka
13 Kerala
14 Madhya Pradesh
15 Maharashtra
16 Manipur
## Meghalaya
18 Mizoram
19 Nagaland
1990-91 1989-90 1988-89 1987-88 1986-87 1985-86 1984-85 1983-84 1982-83 1981-82 1980-81Accounts Accounts Accounts Accounts Accounts Accounts Accounts Accounts Accounts Accounts Accounts
(14) (15) (16) (17) (18) (19) (20) (21) (22) (23) (24)
1147 902 812 732 657 582 448 408 361 334 296(43.3) (37.8) (38.3) (40.3) (42.1) (40.4) (38.2) (42.3) (44.6) (47.4) (50.8)
82 52 82 75 6 -(3040.7) (2269.6) (3425.0) (3566.7) (362.5)
488 449 366 338 300 266 152 138 122 113 98(116.0) (134.8) (131.4) (135.8) (122.4) (113.0) (80.1) (101.3) (112.7) (125.2) (149.4)
1616 1544 1196 1011 990 855 647 591 522 481 424(141.6) (167.0) (143.9) (132.9) (150.4) (148.6) (139.5) (133.7) (136.9) (142.2) (153.3)
53 26 37 28 - -(62.9) (37.1) (59.4) (54.4) (0.0)
280 429 398 361 123 279 306 227 211 208 190(11.7) (19.8) (21.3) (23.6) (9.7) (26.0) (31.2) (25.8) (27.7) (31.5) (35.7)
186 154 121 108 97 86 94 81 73 68 61(17.4) (16.9) (15.2) (16.2) (17.2) (17.0) (23.1) (22.1) (21.6) (23.4) (26.2)
188 154 176 143 121 101 33 30 27 25 21.7(116.8) (108.5) (149.4) (138.0) (131.4) (137.6) (53.8) (55.4) (55.3) (59.5) (64.0)
325 257 229 174 170 136 48 44 38 35 29(199.0) (193.4) (165.3) (141.4) (144.0) (131.8) (60.7) (60.9) (61.7) (58.0) (76.7)
660 633 499 451 404 356 299 271 240 223 198(28.3) (32.8) (29.4) (31.9) (33.5) (33.1) (32.9) (35.7) (35.6) (36.7) (41.6)
486 456 437 289 339 209 233 210 186 171 151(36.3) (37.0) (41.0) (31.3) (41.7) (28.5) (37.5) (43.0) (42.4) (45.6) (45.0)1089 1024 825 744 668 571 464 423 372 341 303
(62.1) (64.9) (61.7) (66.7) (68.5) (68.7) (65.0) (65.8) (66.7) (71.7) (78.5)990 953 733 667 593 500 530 450 422 369 336
(19.3) (21.6) (19.2) (20.7) (21.2) (21.0) (26.9) (24.7) (25.6) (26.6) (29.8)112 82 102 83 69 56 13 10 9 9 8
(655.0) (624.4) (864.4) (717.4) (758.2) (798.6) (198.4) (200.0) (226.8) (217.9) (288.5)80 65 83 65 55 46 11 10 9 8 7
(223.3) (209.0) (297.8) (333.2) (311.9) (305.4) (87.0) (104.2) (117.6) (129.0) (146.9)100 81 86 65 - -
(2932.4) (3130.8) (5350.0) (1674.4) (0.0) (0.0)124 79 114 76 72 59 5 5 4 4 4
(699.4) (637.1) (706.2) (511.4) (542.1) (616.8) (60.2) (51.6) (66.2) (70.9) (81.4)
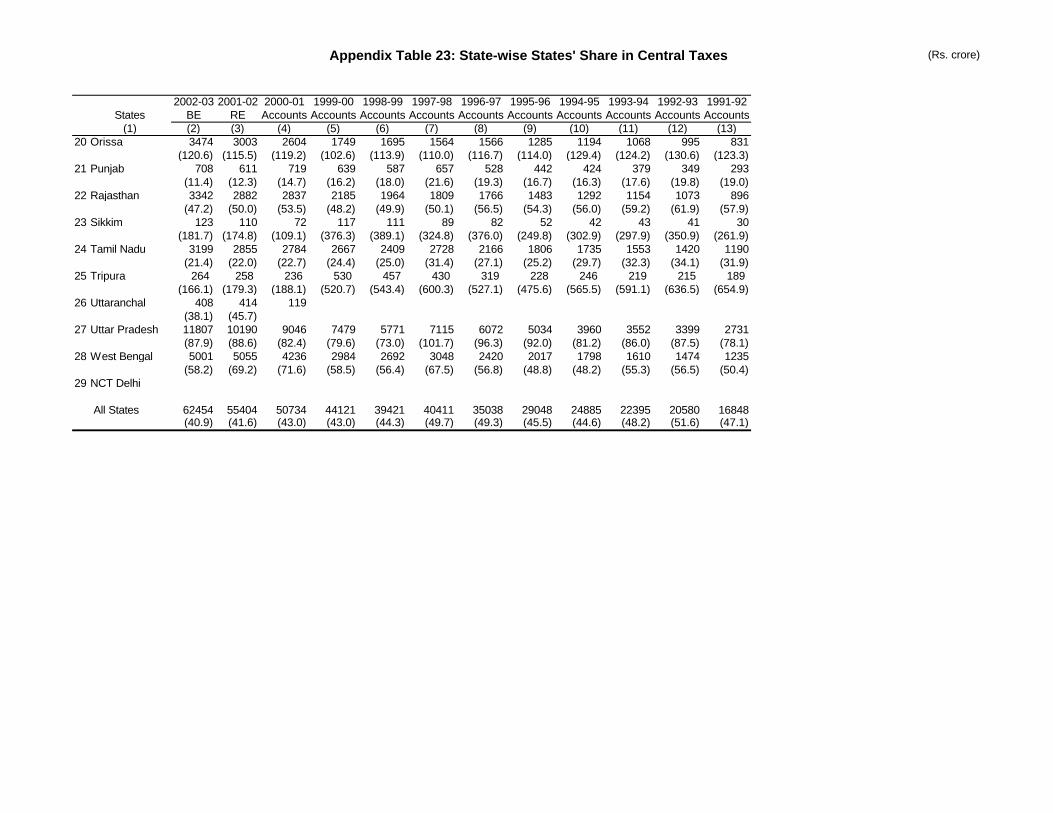
Appendix Table 23: State-wise States' Share in Central Taxes (Rs. crore)
2002-03 2001-02 2000-01 1999-00 1998-99 1997-98 1996-97 1995-96 1994-95 1993-94 1992-93 1991-92States BE RE Accounts Accounts Accounts Accounts Accounts Accounts Accounts Accounts Accounts Accounts
(1) (2) (3) (4) (5) (6) (7) (8) (9) (10) (11) (12) (13)20 Orissa 3474 3003 2604 1749 1695 1564 1566 1285 1194 1068 995 831
(120.6) (115.5) (119.2) (102.6) (113.9) (110.0) (116.7) (114.0) (129.4) (124.2) (130.6) (123.3)21 Punjab 708 611 719 639 587 657 528 442 424 379 349 293
(11.4) (12.3) (14.7) (16.2) (18.0) (21.6) (19.3) (16.7) (16.3) (17.6) (19.8) (19.0)22 Rajasthan 3342 2882 2837 2185 1964 1809 1766 1483 1292 1154 1073 896
(47.2) (50.0) (53.5) (48.2) (49.9) (50.1) (56.5) (54.3) (56.0) (59.2) (61.9) (57.9)23 Sikkim 123 110 72 117 111 89 82 52 42 43 41 30
(181.7) (174.8) (109.1) (376.3) (389.1) (324.8) (376.0) (249.8) (302.9) (297.9) (350.9) (261.9)24 Tamil Nadu 3199 2855 2784 2667 2409 2728 2166 1806 1735 1553 1420 1190
(21.4) (22.0) (22.7) (24.4) (25.0) (31.4) (27.1) (25.2) (29.7) (32.3) (34.1) (31.9)25 Tripura 264 258 236 530 457 430 319 228 246 219 215 189
(166.1) (179.3) (188.1) (520.7) (543.4) (600.3) (527.1) (475.6) (565.5) (591.1) (636.5) (654.9)26 Uttaranchal 408 414 119
(38.1) (45.7)27 Uttar Pradesh 11807 10190 9046 7479 5771 7115 6072 5034 3960 3552 3399 2731
(87.9) (88.6) (82.4) (79.6) (73.0) (101.7) (96.3) (92.0) (81.2) (86.0) (87.5) (78.1)28 West Bengal 5001 5055 4236 2984 2692 3048 2420 2017 1798 1610 1474 1235
(58.2) (69.2) (71.6) (58.5) (56.4) (67.5) (56.8) (48.8) (48.2) (55.3) (56.5) (50.4)29 NCT Delhi
All States 62454 55404 50734 44121 39421 40411 35038 29048 24885 22395 20580 16848(40.9) (41.6) (43.0) (43.0) (44.3) (49.7) (49.3) (45.5) (44.6) (48.2) (51.6) (47.1)
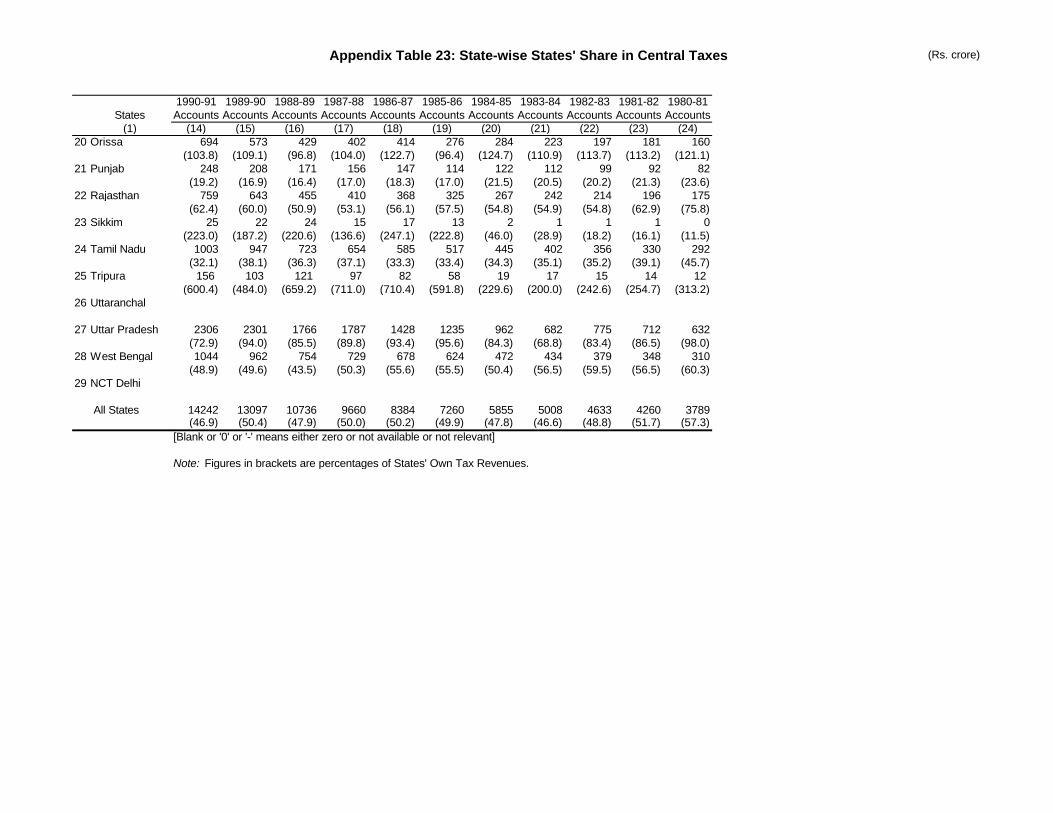
Appendix Table 23: State-wise States' Share in Central Taxes (Rs. crore)
States(1)
20 Orissa
21 Punjab
22 Rajasthan
23 Sikkim
24 Tamil Nadu
25 Tripura
26 Uttaranchal
27 Uttar Pradesh
28 West Bengal
29 NCT Delhi
All States
1990-91 1989-90 1988-89 1987-88 1986-87 1985-86 1984-85 1983-84 1982-83 1981-82 1980-81Accounts Accounts Accounts Accounts Accounts Accounts Accounts Accounts Accounts Accounts Accounts
(14) (15) (16) (17) (18) (19) (20) (21) (22) (23) (24)694 573 429 402 414 276 284 223 197 181 160
(103.8) (109.1) (96.8) (104.0) (122.7) (96.4) (124.7) (110.9) (113.7) (113.2) (121.1)248 208 171 156 147 114 122 112 99 92 82
(19.2) (16.9) (16.4) (17.0) (18.3) (17.0) (21.5) (20.5) (20.2) (21.3) (23.6)759 643 455 410 368 325 267 242 214 196 175
(62.4) (60.0) (50.9) (53.1) (56.1) (57.5) (54.8) (54.9) (54.8) (62.9) (75.8)25 22 24 15 17 13 2 1 1 1 0
(223.0) (187.2) (220.6) (136.6) (247.1) (222.8) (46.0) (28.9) (18.2) (16.1) (11.5)1003 947 723 654 585 517 445 402 356 330 292
(32.1) (38.1) (36.3) (37.1) (33.3) (33.4) (34.3) (35.1) (35.2) (39.1) (45.7)156 103 121 97 82 58 19 17 15 14 12
(600.4) (484.0) (659.2) (711.0) (710.4) (591.8) (229.6) (200.0) (242.6) (254.7) (313.2)
2306 2301 1766 1787 1428 1235 962 682 775 712 632(72.9) (94.0) (85.5) (89.8) (93.4) (95.6) (84.3) (68.8) (83.4) (86.5) (98.0)1044 962 754 729 678 624 472 434 379 348 310
(48.9) (49.6) (43.5) (50.3) (55.6) (55.5) (50.4) (56.5) (59.5) (56.5) (60.3)
14242 13097 10736 9660 8384 7260 5855 5008 4633 4260 3789(46.9) (50.4) (47.9) (50.0) (50.2) (49.9) (47.8) (46.6) (48.8) (51.7) (57.3)
[Blank or '0' or '-' means either zero or not available or not relevant]
Note: Figures in brackets are percentages of States' Own Tax Revenues.
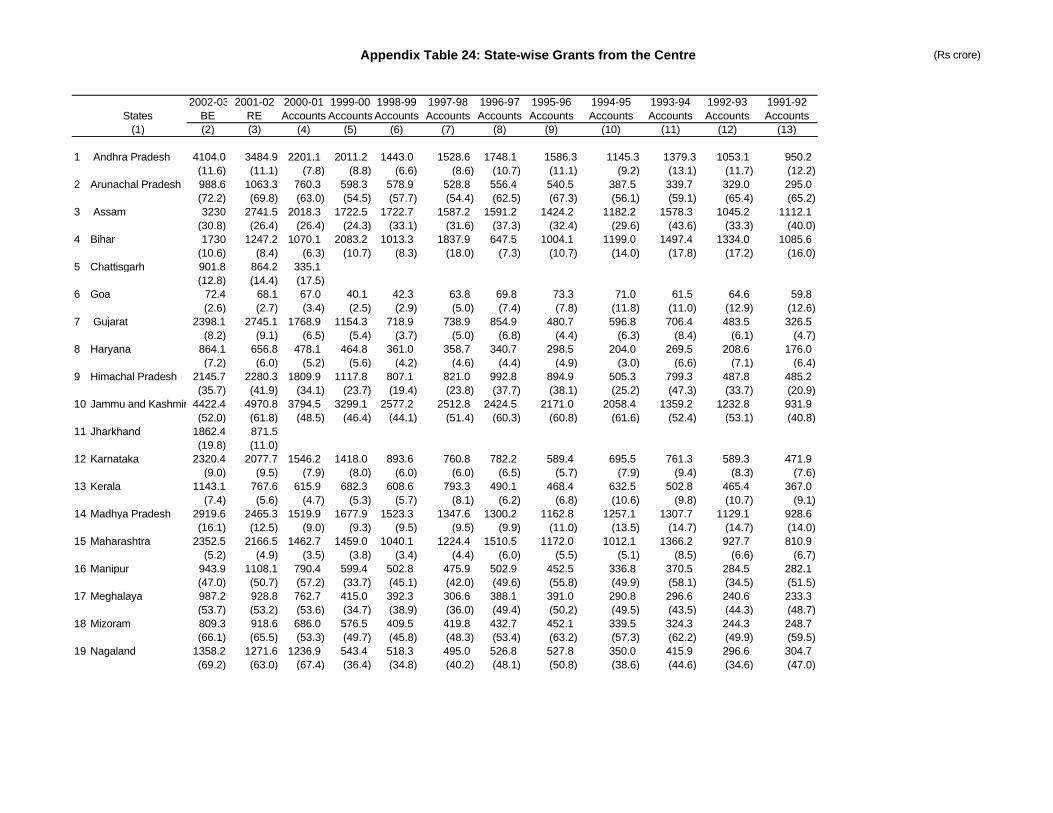
Appendix Table 24: State-wise Grants from the Centre (Rs crore)
2002-03 2001-02 2000-01 1999-00 1998-99 1997-98 1996-97 1995-96 1994-95 1993-94 1992-93 1991-92States BE RE Accounts Accounts Accounts Accounts Accounts Accounts Accounts Accounts Accounts Accounts
(1) (2) (3) (4) (5) (6) (7) (8) (9) (10) (11) (12) (13)
1 Andhra Pradesh 4104.0 3484.9 2201.1 2011.2 1443.0 1528.6 1748.1 1586.3 1145.3 1379.3 1053.1 950.2(11.6) (11.1) (7.8) (8.8) (6.6) (8.6) (10.7) (11.1) (9.2) (13.1) (11.7) (12.2)
2 Arunachal Pradesh 988.6 1063.3 760.3 598.3 578.9 528.8 556.4 540.5 387.5 339.7 329.0 295.0(72.2) (69.8) (63.0) (54.5) (57.7) (54.4) (62.5) (67.3) (56.1) (59.1) (65.4) (65.2)
3 Assam 3230 2741.5 2018.3 1722.5 1722.7 1587.2 1591.2 1424.2 1182.2 1578.3 1045.2 1112.1(30.8) (26.4) (26.4) (24.3) (33.1) (31.6) (37.3) (32.4) (29.6) (43.6) (33.3) (40.0)
4 Bihar 1730 1247.2 1070.1 2083.2 1013.3 1837.9 647.5 1004.1 1199.0 1497.4 1334.0 1085.6(10.6) (8.4) (6.3) (10.7) (8.3) (18.0) (7.3) (10.7) (14.0) (17.8) (17.2) (16.0)
5 Chattisgarh 901.8 864.2 335.1(12.8) (14.4) (17.5)
6 Goa 72.4 68.1 67.0 40.1 42.3 63.8 69.8 73.3 71.0 61.5 64.6 59.8(2.6) (2.7) (3.4) (2.5) (2.9) (5.0) (7.4) (7.8) (11.8) (11.0) (12.9) (12.6)
7 Gujarat 2398.1 2745.1 1768.9 1154.3 718.9 738.9 854.9 480.7 596.8 706.4 483.5 326.5(8.2) (9.1) (6.5) (5.4) (3.7) (5.0) (6.8) (4.4) (6.3) (8.4) (6.1) (4.7)
8 Haryana 864.1 656.8 478.1 464.8 361.0 358.7 340.7 298.5 204.0 269.5 208.6 176.0(7.2) (6.0) (5.2) (5.6) (4.2) (4.6) (4.4) (4.9) (3.0) (6.6) (7.1) (6.4)
9 Himachal Pradesh 2145.7 2280.3 1809.9 1117.8 807.1 821.0 992.8 894.9 505.3 799.3 487.8 485.2(35.7) (41.9) (34.1) (23.7) (19.4) (23.8) (37.7) (38.1) (25.2) (47.3) (33.7) (20.9)
10 Jammu and Kashmir 4422.4 4970.8 3794.5 3299.1 2577.2 2512.8 2424.5 2171.0 2058.4 1359.2 1232.8 931.9(52.0) (61.8) (48.5) (46.4) (44.1) (51.4) (60.3) (60.8) (61.6) (52.4) (53.1) (40.8)
11 Jharkhand 1862.4 871.5(19.8) (11.0)
12 Karnataka 2320.4 2077.7 1546.2 1418.0 893.6 760.8 782.2 589.4 695.5 761.3 589.3 471.9(9.0) (9.5) (7.9) (8.0) (6.0) (6.0) (6.5) (5.7) (7.9) (9.4) (8.3) (7.6)
13 Kerala 1143.1 767.6 615.9 682.3 608.6 793.3 490.1 468.4 632.5 502.8 465.4 367.0(7.4) (5.6) (4.7) (5.3) (5.7) (8.1) (6.2) (6.8) (10.6) (9.8) (10.7) (9.1)
14 Madhya Pradesh 2919.6 2465.3 1519.9 1677.9 1523.3 1347.6 1300.2 1162.8 1257.1 1307.7 1129.1 928.6(16.1) (12.5) (9.0) (9.3) (9.5) (9.5) (9.9) (11.0) (13.5) (14.7) (14.7) (14.0)
15 Maharashtra 2352.5 2166.5 1462.7 1459.0 1040.1 1224.4 1510.5 1172.0 1012.1 1366.2 927.7 810.9(5.2) (4.9) (3.5) (3.8) (3.4) (4.4) (6.0) (5.5) (5.1) (8.5) (6.6) (6.7)
16 Manipur 943.9 1108.1 790.4 599.4 502.8 475.9 502.9 452.5 336.8 370.5 284.5 282.1(47.0) (50.7) (57.2) (33.7) (45.1) (42.0) (49.6) (55.8) (49.9) (58.1) (34.5) (51.5)
17 Meghalaya 987.2 928.8 762.7 415.0 392.3 306.6 388.1 391.0 290.8 296.6 240.6 233.3(53.7) (53.2) (53.6) (34.7) (38.9) (36.0) (49.4) (50.2) (49.5) (43.5) (44.3) (48.7)
18 Mizoram 809.3 918.6 686.0 576.5 409.5 419.8 432.7 452.1 339.5 324.3 244.3 248.7(66.1) (65.5) (53.3) (49.7) (45.8) (48.3) (53.4) (63.2) (57.3) (62.2) (49.9) (59.5)
19 Nagaland 1358.2 1271.6 1236.9 543.4 518.3 495.0 526.8 527.8 350.0 415.9 296.6 304.7(69.2) (63.0) (67.4) (36.4) (34.8) (40.2) (48.1) (50.8) (38.6) (44.6) (34.6) (47.0)
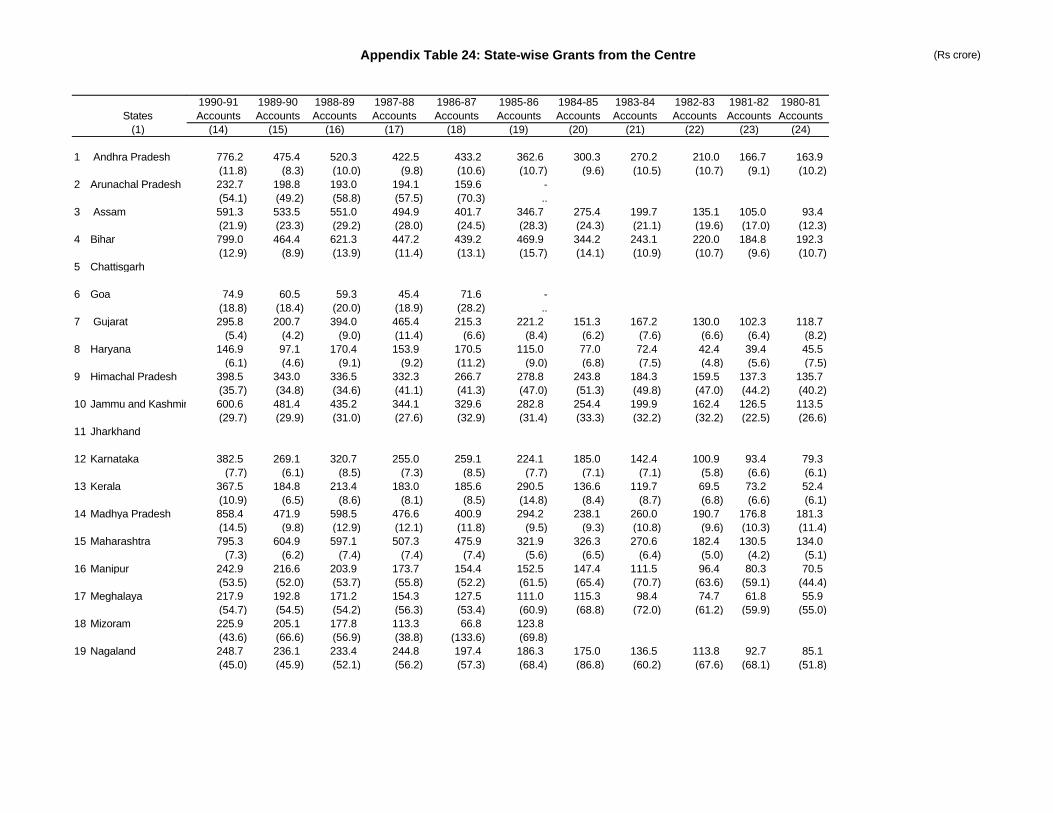
Appendix Table 24: State-wise Grants from the Centre (Rs crore)
States(1)
1 Andhra Pradesh
2 Arunachal Pradesh
3 Assam
4 Bihar
5 Chattisgarh
6 Goa
7 Gujarat
8 Haryana
9 Himachal Pradesh
10 Jammu and Kashmir
11 Jharkhand
12 Karnataka
13 Kerala
14 Madhya Pradesh
15 Maharashtra
16 Manipur
17 Meghalaya
18 Mizoram
19 Nagaland
1990-91 1989-90 1988-89 1987-88 1986-87 1985-86 1984-85 1983-84 1982-83 1981-82 1980-81Accounts Accounts Accounts Accounts Accounts Accounts Accounts Accounts Accounts Accounts Accounts
(14) (15) (16) (17) (18) (19) (20) (21) (22) (23) (24)
776.2 475.4 520.3 422.5 433.2 362.6 300.3 270.2 210.0 166.7 163.9(11.8) (8.3) (10.0) (9.8) (10.6) (10.7) (9.6) (10.5) (10.7) (9.1) (10.2)232.7 198.8 193.0 194.1 159.6 -(54.1) (49.2) (58.8) (57.5) (70.3) ..591.3 533.5 551.0 494.9 401.7 346.7 275.4 199.7 135.1 105.0 93.4(21.9) (23.3) (29.2) (28.0) (24.5) (28.3) (24.3) (21.1) (19.6) (17.0) (12.3)799.0 464.4 621.3 447.2 439.2 469.9 344.2 243.1 220.0 184.8 192.3(12.9) (8.9) (13.9) (11.4) (13.1) (15.7) (14.1) (10.9) (10.7) (9.6) (10.7)
74.9 60.5 59.3 45.4 71.6 -(18.8) (18.4) (20.0) (18.9) (28.2) ..295.8 200.7 394.0 465.4 215.3 221.2 151.3 167.2 130.0 102.3 118.7
(5.4) (4.2) (9.0) (11.4) (6.6) (8.4) (6.2) (7.6) (6.6) (6.4) (8.2)146.9 97.1 170.4 153.9 170.5 115.0 77.0 72.4 42.4 39.4 45.5
(6.1) (4.6) (9.1) (9.2) (11.2) (9.0) (6.8) (7.5) (4.8) (5.6) (7.5)398.5 343.0 336.5 332.3 266.7 278.8 243.8 184.3 159.5 137.3 135.7(35.7) (34.8) (34.6) (41.1) (41.3) (47.0) (51.3) (49.8) (47.0) (44.2) (40.2)600.6 481.4 435.2 344.1 329.6 282.8 254.4 199.9 162.4 126.5 113.5(29.7) (29.9) (31.0) (27.6) (32.9) (31.4) (33.3) (32.2) (32.2) (22.5) (26.6)
382.5 269.1 320.7 255.0 259.1 224.1 185.0 142.4 100.9 93.4 79.3(7.7) (6.1) (8.5) (7.3) (8.5) (7.7) (7.1) (7.1) (5.8) (6.6) (6.1)
367.5 184.8 213.4 183.0 185.6 290.5 136.6 119.7 69.5 73.2 52.4(10.9) (6.5) (8.6) (8.1) (8.5) (14.8) (8.4) (8.7) (6.8) (6.6) (6.1)858.4 471.9 598.5 476.6 400.9 294.2 238.1 260.0 190.7 176.8 181.3(14.5) (9.8) (12.9) (12.1) (11.8) (9.5) (9.3) (10.8) (9.6) (10.3) (11.4)795.3 604.9 597.1 507.3 475.9 321.9 326.3 270.6 182.4 130.5 134.0
(7.3) (6.2) (7.4) (7.4) (7.4) (5.6) (6.5) (6.4) (5.0) (4.2) (5.1)242.9 216.6 203.9 173.7 154.4 152.5 147.4 111.5 96.4 80.3 70.5(53.5) (52.0) (53.7) (55.8) (52.2) (61.5) (65.4) (70.7) (63.6) (59.1) (44.4)217.9 192.8 171.2 154.3 127.5 111.0 115.3 98.4 74.7 61.8 55.9(54.7) (54.5) (54.2) (56.3) (53.4) (60.9) (68.8) (72.0) (61.2) (59.9) (55.0)225.9 205.1 177.8 113.3 66.8 123.8(43.6) (66.6) (56.9) (38.8) (133.6) (69.8)248.7 236.1 233.4 244.8 197.4 186.3 175.0 136.5 113.8 92.7 85.1(45.0) (45.9) (52.1) (56.2) (57.3) (68.4) (86.8) (60.2) (67.6) (68.1) (51.8)
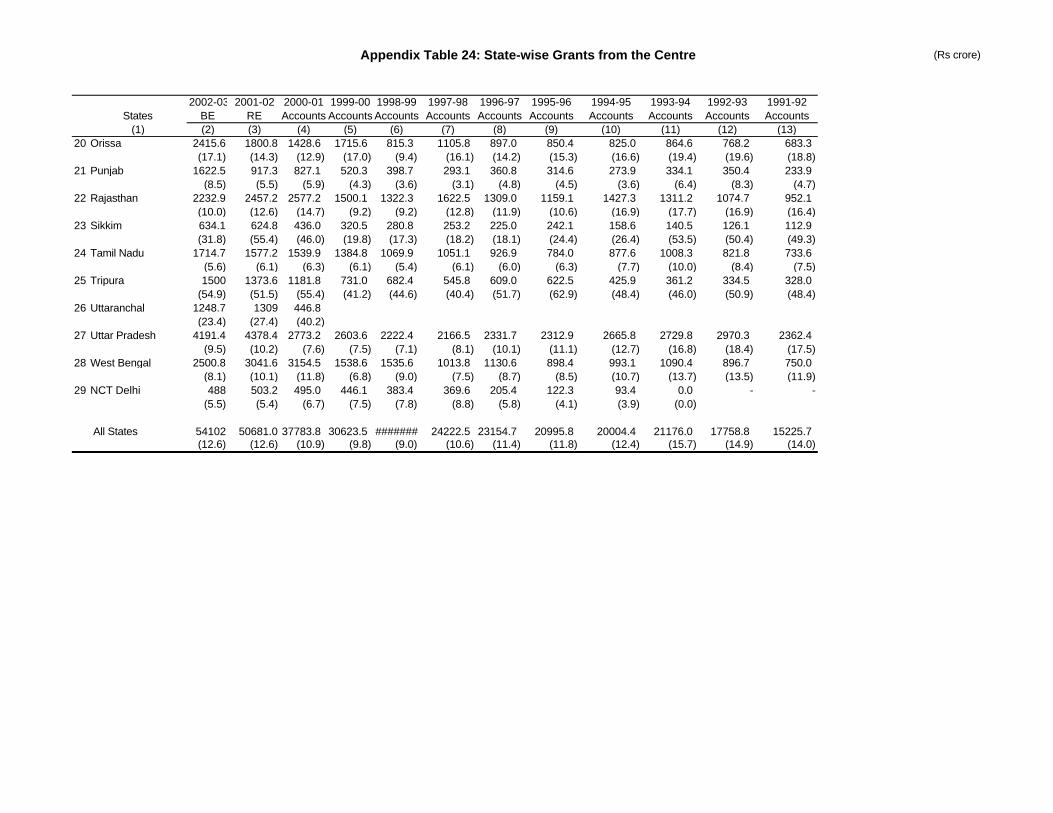
Appendix Table 24: State-wise Grants from the Centre (Rs crore)
2002-03 2001-02 2000-01 1999-00 1998-99 1997-98 1996-97 1995-96 1994-95 1993-94 1992-93 1991-92States BE RE Accounts Accounts Accounts Accounts Accounts Accounts Accounts Accounts Accounts Accounts
(1) (2) (3) (4) (5) (6) (7) (8) (9) (10) (11) (12) (13)20 Orissa 2415.6 1800.8 1428.6 1715.6 815.3 1105.8 897.0 850.4 825.0 864.6 768.2 683.3
(17.1) (14.3) (12.9) (17.0) (9.4) (16.1) (14.2) (15.3) (16.6) (19.4) (19.6) (18.8)21 Punjab 1622.5 917.3 827.1 520.3 398.7 293.1 360.8 314.6 273.9 334.1 350.4 233.9
(8.5) (5.5) (5.9) (4.3) (3.6) (3.1) (4.8) (4.5) (3.6) (6.4) (8.3) (4.7)22 Rajasthan 2232.9 2457.2 2577.2 1500.1 1322.3 1622.5 1309.0 1159.1 1427.3 1311.2 1074.7 952.1
(10.0) (12.6) (14.7) (9.2) (9.2) (12.8) (11.9) (10.6) (16.9) (17.7) (16.9) (16.4)23 Sikkim 634.1 624.8 436.0 320.5 280.8 253.2 225.0 242.1 158.6 140.5 126.1 112.9
(31.8) (55.4) (46.0) (19.8) (17.3) (18.2) (18.1) (24.4) (26.4) (53.5) (50.4) (49.3)24 Tamil Nadu 1714.7 1577.2 1539.9 1384.8 1069.9 1051.1 926.9 784.0 877.6 1008.3 821.8 733.6
(5.6) (6.1) (6.3) (6.1) (5.4) (6.1) (6.0) (6.3) (7.7) (10.0) (8.4) (7.5)25 Tripura 1500 1373.6 1181.8 731.0 682.4 545.8 609.0 622.5 425.9 361.2 334.5 328.0
(54.9) (51.5) (55.4) (41.2) (44.6) (40.4) (51.7) (62.9) (48.4) (46.0) (50.9) (48.4)26 Uttaranchal 1248.7 1309 446.8
(23.4) (27.4) (40.2)27 Uttar Pradesh 4191.4 4378.4 2773.2 2603.6 2222.4 2166.5 2331.7 2312.9 2665.8 2729.8 2970.3 2362.4
(9.5) (10.2) (7.6) (7.5) (7.1) (8.1) (10.1) (11.1) (12.7) (16.8) (18.4) (17.5)28 West Bengal 2500.8 3041.6 3154.5 1538.6 1535.6 1013.8 1130.6 898.4 993.1 1090.4 896.7 750.0
(8.1) (10.1) (11.8) (6.8) (9.0) (7.5) (8.7) (8.5) (10.7) (13.7) (13.5) (11.9)29 NCT Delhi 488 503.2 495.0 446.1 383.4 369.6 205.4 122.3 93.4 0.0 - -
(5.5) (5.4) (6.7) (7.5) (7.8) (8.8) (5.8) (4.1) (3.9) (0.0) All States 54102 50681.0 37783.8 30623.5 ####### 24222.5 23154.7 20995.8 20004.4 21176.0 17758.8 15225.7
(12.6) (12.6) (10.9) (9.8) (9.0) (10.6) (11.4) (11.8) (12.4) (15.7) (14.9) (14.0)
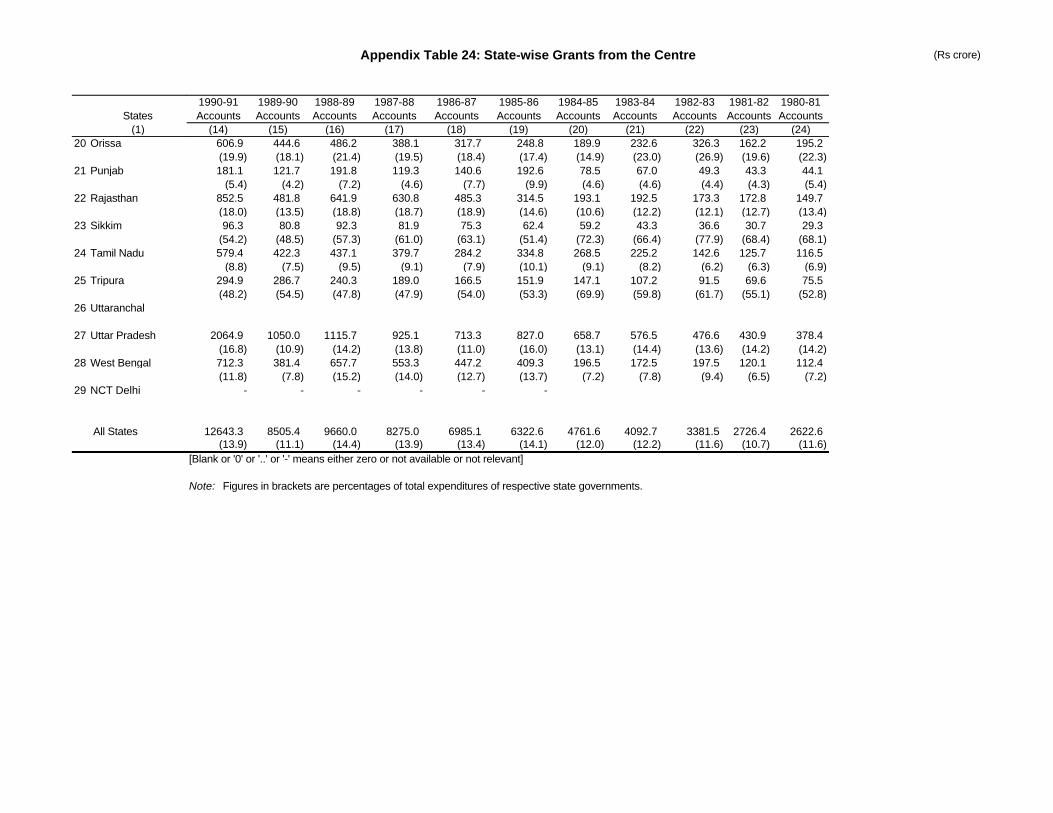
Appendix Table 24: State-wise Grants from the Centre (Rs crore)
States(1)
20 Orissa
21 Punjab
22 Rajasthan
23 Sikkim
24 Tamil Nadu
25 Tripura
26 Uttaranchal
27 Uttar Pradesh
28 West Bengal
29 NCT Delhi
All States
1990-91 1989-90 1988-89 1987-88 1986-87 1985-86 1984-85 1983-84 1982-83 1981-82 1980-81Accounts Accounts Accounts Accounts Accounts Accounts Accounts Accounts Accounts Accounts Accounts
(14) (15) (16) (17) (18) (19) (20) (21) (22) (23) (24)606.9 444.6 486.2 388.1 317.7 248.8 189.9 232.6 326.3 162.2 195.2(19.9) (18.1) (21.4) (19.5) (18.4) (17.4) (14.9) (23.0) (26.9) (19.6) (22.3)181.1 121.7 191.8 119.3 140.6 192.6 78.5 67.0 49.3 43.3 44.1
(5.4) (4.2) (7.2) (4.6) (7.7) (9.9) (4.6) (4.6) (4.4) (4.3) (5.4)852.5 481.8 641.9 630.8 485.3 314.5 193.1 192.5 173.3 172.8 149.7(18.0) (13.5) (18.8) (18.7) (18.9) (14.6) (10.6) (12.2) (12.1) (12.7) (13.4)96.3 80.8 92.3 81.9 75.3 62.4 59.2 43.3 36.6 30.7 29.3
(54.2) (48.5) (57.3) (61.0) (63.1) (51.4) (72.3) (66.4) (77.9) (68.4) (68.1)579.4 422.3 437.1 379.7 284.2 334.8 268.5 225.2 142.6 125.7 116.5
(8.8) (7.5) (9.5) (9.1) (7.9) (10.1) (9.1) (8.2) (6.2) (6.3) (6.9)294.9 286.7 240.3 189.0 166.5 151.9 147.1 107.2 91.5 69.6 75.5(48.2) (54.5) (47.8) (47.9) (54.0) (53.3) (69.9) (59.8) (61.7) (55.1) (52.8)
2064.9 1050.0 1115.7 925.1 713.3 827.0 658.7 576.5 476.6 430.9 378.4(16.8) (10.9) (14.2) (13.8) (11.0) (16.0) (13.1) (14.4) (13.6) (14.2) (14.2)712.3 381.4 657.7 553.3 447.2 409.3 196.5 172.5 197.5 120.1 112.4(11.8) (7.8) (15.2) (14.0) (12.7) (13.7) (7.2) (7.8) (9.4) (6.5) (7.2)
- - - - - -
12643.3 8505.4 9660.0 8275.0 6985.1 6322.6 4761.6 4092.7 3381.5 2726.4 2622.6(13.9) (11.1) (14.4) (13.9) (13.4) (14.1) (12.0) (12.2) (11.6) (10.7) (11.6)
[Blank or '0' or '..' or '-' means either zero or not available or not relevant]
Note: Figures in brackets are percentages of total expenditures of respective state governments.
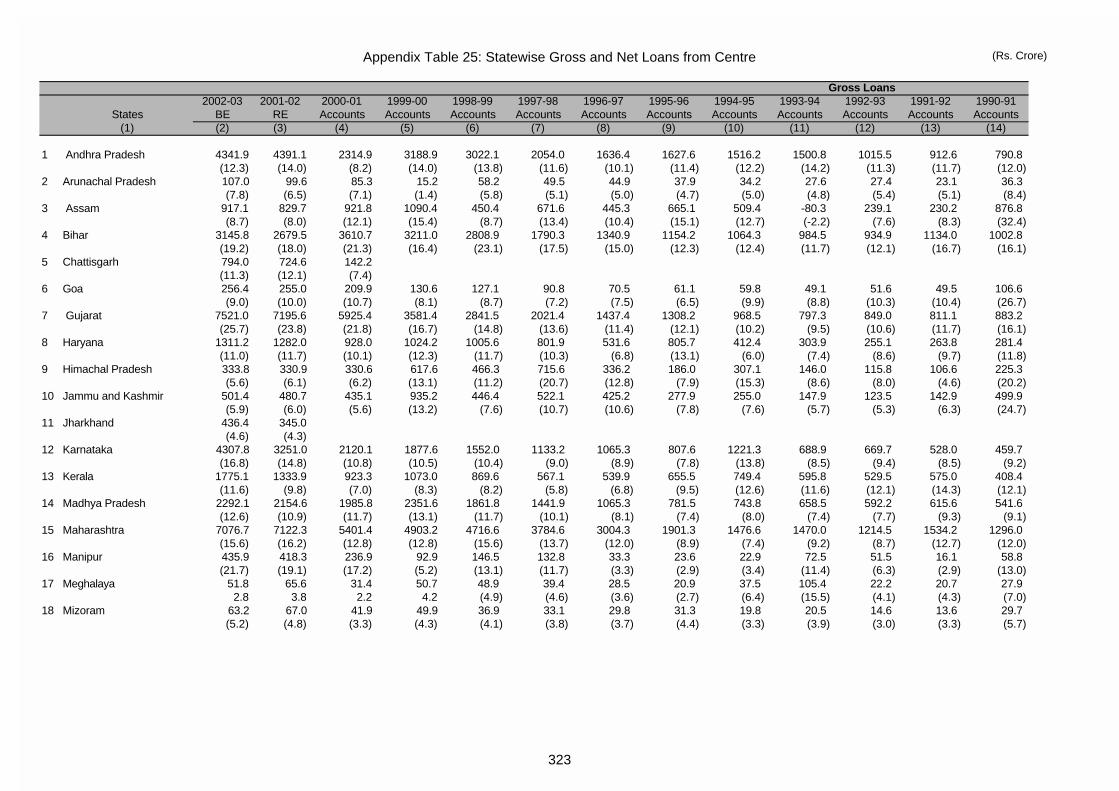
Appendix Table 25: Statewise Gross and Net Loans from Centre (Rs. Crore)
2002-03 2001-02 2000-01 1999-00 1998-99 1997-98 1996-97 1995-96 1994-95 1993-94 1992-93 1991-92 1990-91States BE RE Accounts Accounts Accounts Accounts Accounts Accounts Accounts Accounts Accounts Accounts Accounts
(1) (2) (3) (4) (5) (6) (7) (8) (9) (10) (11) (12) (13) (14)
1 Andhra Pradesh 4341.9 4391.1 2314.9 3188.9 3022.1 2054.0 1636.4 1627.6 1516.2 1500.8 1015.5 912.6 790.8(12.3) (14.0) (8.2) (14.0) (13.8) (11.6) (10.1) (11.4) (12.2) (14.2) (11.3) (11.7) (12.0)
2 Arunachal Pradesh 107.0 99.6 85.3 15.2 58.2 49.5 44.9 37.9 34.2 27.6 27.4 23.1 36.3(7.8) (6.5) (7.1) (1.4) (5.8) (5.1) (5.0) (4.7) (5.0) (4.8) (5.4) (5.1) (8.4)
3 Assam 917.1 829.7 921.8 1090.4 450.4 671.6 445.3 665.1 509.4 -80.3 239.1 230.2 876.8(8.7) (8.0) (12.1) (15.4) (8.7) (13.4) (10.4) (15.1) (12.7) (-2.2) (7.6) (8.3) (32.4)
4 Bihar 3145.8 2679.5 3610.7 3211.0 2808.9 1790.3 1340.9 1154.2 1064.3 984.5 934.9 1134.0 1002.8(19.2) (18.0) (21.3) (16.4) (23.1) (17.5) (15.0) (12.3) (12.4) (11.7) (12.1) (16.7) (16.1)
5 Chattisgarh 794.0 724.6 142.2(11.3) (12.1) (7.4)
6 Goa 256.4 255.0 209.9 130.6 127.1 90.8 70.5 61.1 59.8 49.1 51.6 49.5 106.6(9.0) (10.0) (10.7) (8.1) (8.7) (7.2) (7.5) (6.5) (9.9) (8.8) (10.3) (10.4) (26.7)
7 Gujarat 7521.0 7195.6 5925.4 3581.4 2841.5 2021.4 1437.4 1308.2 968.5 797.3 849.0 811.1 883.2(25.7) (23.8) (21.8) (16.7) (14.8) (13.6) (11.4) (12.1) (10.2) (9.5) (10.6) (11.7) (16.1)
8 Haryana 1311.2 1282.0 928.0 1024.2 1005.6 801.9 531.6 805.7 412.4 303.9 255.1 263.8 281.4(11.0) (11.7) (10.1) (12.3) (11.7) (10.3) (6.8) (13.1) (6.0) (7.4) (8.6) (9.7) (11.8)
9 Himachal Pradesh 333.8 330.9 330.6 617.6 466.3 715.6 336.2 186.0 307.1 146.0 115.8 106.6 225.3(5.6) (6.1) (6.2) (13.1) (11.2) (20.7) (12.8) (7.9) (15.3) (8.6) (8.0) (4.6) (20.2)
10 Jammu and Kashmir 501.4 480.7 435.1 935.2 446.4 522.1 425.2 277.9 255.0 147.9 123.5 142.9 499.9(5.9) (6.0) (5.6) (13.2) (7.6) (10.7) (10.6) (7.8) (7.6) (5.7) (5.3) (6.3) (24.7)
11 Jharkhand 436.4 345.0(4.6) (4.3)
12 Karnataka 4307.8 3251.0 2120.1 1877.6 1552.0 1133.2 1065.3 807.6 1221.3 688.9 669.7 528.0 459.7(16.8) (14.8) (10.8) (10.5) (10.4) (9.0) (8.9) (7.8) (13.8) (8.5) (9.4) (8.5) (9.2)
13 Kerala 1775.1 1333.9 923.3 1073.0 869.6 567.1 539.9 655.5 749.4 595.8 529.5 575.0 408.4(11.6) (9.8) (7.0) (8.3) (8.2) (5.8) (6.8) (9.5) (12.6) (11.6) (12.1) (14.3) (12.1)
14 Madhya Pradesh 2292.1 2154.6 1985.8 2351.6 1861.8 1441.9 1065.3 781.5 743.8 658.5 592.2 615.6 541.6(12.6) (10.9) (11.7) (13.1) (11.7) (10.1) (8.1) (7.4) (8.0) (7.4) (7.7) (9.3) (9.1)
15 Maharashtra 7076.7 7122.3 5401.4 4903.2 4716.6 3784.6 3004.3 1901.3 1476.6 1470.0 1214.5 1534.2 1296.0(15.6) (16.2) (12.8) (12.8) (15.6) (13.7) (12.0) (8.9) (7.4) (9.2) (8.7) (12.7) (12.0)
16 Manipur 435.9 418.3 236.9 92.9 146.5 132.8 33.3 23.6 22.9 72.5 51.5 16.1 58.8(21.7) (19.1) (17.2) (5.2) (13.1) (11.7) (3.3) (2.9) (3.4) (11.4) (6.3) (2.9) (13.0)
17 Meghalaya 51.8 65.6 31.4 50.7 48.9 39.4 28.5 20.9 37.5 105.4 22.2 20.7 27.92.8 3.8 2.2 4.2 (4.9) (4.6) (3.6) (2.7) (6.4) (15.5) (4.1) (4.3) (7.0)
18 Mizoram 63.2 67.0 41.9 49.9 36.9 33.1 29.8 31.3 19.8 20.5 14.6 13.6 29.7(5.2) (4.8) (3.3) (4.3) (4.1) (3.8) (3.7) (4.4) (3.3) (3.9) (3.0) (3.3) (5.7)
Gross Loans
323
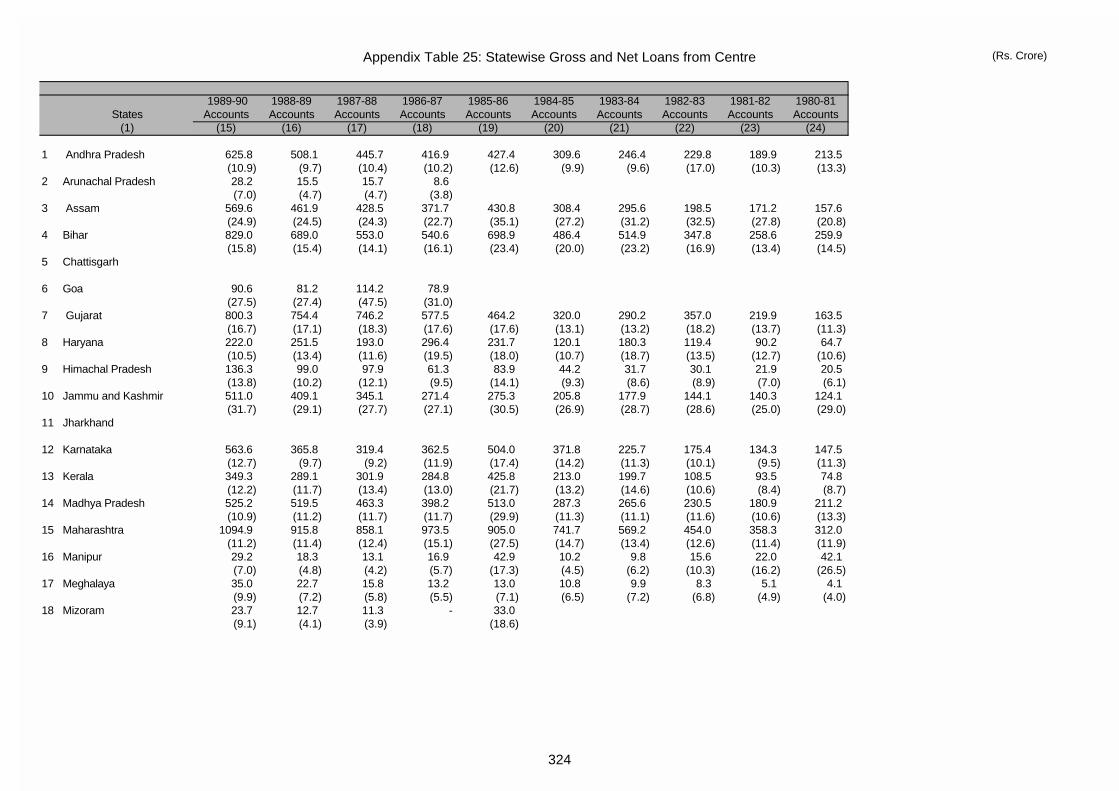
Appendix Table 25: Statewise Gross and Net Loans from Centre (Rs. Crore)
States(1)
1 Andhra Pradesh
2 Arunachal Pradesh
3 Assam
4 Bihar
5 Chattisgarh
6 Goa
7 Gujarat
8 Haryana
9 Himachal Pradesh
10 Jammu and Kashmir
11 Jharkhand
12 Karnataka
13 Kerala
14 Madhya Pradesh
15 Maharashtra
16 Manipur
17 Meghalaya
18 Mizoram
1989-90 1988-89 1987-88 1986-87 1985-86 1984-85 1983-84 1982-83 1981-82 1980-81Accounts Accounts Accounts Accounts Accounts Accounts Accounts Accounts Accounts Accounts
(15) (16) (17) (18) (19) (20) (21) (22) (23) (24)
625.8 508.1 445.7 416.9 427.4 309.6 246.4 229.8 189.9 213.5(10.9) (9.7) (10.4) (10.2) (12.6) (9.9) (9.6) (17.0) (10.3) (13.3)28.2 15.5 15.7 8.6 (7.0) (4.7) (4.7) (3.8)
569.6 461.9 428.5 371.7 430.8 308.4 295.6 198.5 171.2 157.6(24.9) (24.5) (24.3) (22.7) (35.1) (27.2) (31.2) (32.5) (27.8) (20.8)829.0 689.0 553.0 540.6 698.9 486.4 514.9 347.8 258.6 259.9(15.8) (15.4) (14.1) (16.1) (23.4) (20.0) (23.2) (16.9) (13.4) (14.5)
90.6 81.2 114.2 78.9(27.5) (27.4) (47.5) (31.0)800.3 754.4 746.2 577.5 464.2 320.0 290.2 357.0 219.9 163.5(16.7) (17.1) (18.3) (17.6) (17.6) (13.1) (13.2) (18.2) (13.7) (11.3)222.0 251.5 193.0 296.4 231.7 120.1 180.3 119.4 90.2 64.7(10.5) (13.4) (11.6) (19.5) (18.0) (10.7) (18.7) (13.5) (12.7) (10.6)136.3 99.0 97.9 61.3 83.9 44.2 31.7 30.1 21.9 20.5(13.8) (10.2) (12.1) (9.5) (14.1) (9.3) (8.6) (8.9) (7.0) (6.1)511.0 409.1 345.1 271.4 275.3 205.8 177.9 144.1 140.3 124.1(31.7) (29.1) (27.7) (27.1) (30.5) (26.9) (28.7) (28.6) (25.0) (29.0)
563.6 365.8 319.4 362.5 504.0 371.8 225.7 175.4 134.3 147.5(12.7) (9.7) (9.2) (11.9) (17.4) (14.2) (11.3) (10.1) (9.5) (11.3)349.3 289.1 301.9 284.8 425.8 213.0 199.7 108.5 93.5 74.8(12.2) (11.7) (13.4) (13.0) (21.7) (13.2) (14.6) (10.6) (8.4) (8.7)525.2 519.5 463.3 398.2 513.0 287.3 265.6 230.5 180.9 211.2(10.9) (11.2) (11.7) (11.7) (29.9) (11.3) (11.1) (11.6) (10.6) (13.3)
1094.9 915.8 858.1 973.5 905.0 741.7 569.2 454.0 358.3 312.0(11.2) (11.4) (12.4) (15.1) (27.5) (14.7) (13.4) (12.6) (11.4) (11.9)29.2 18.3 13.1 16.9 42.9 10.2 9.8 15.6 22.0 42.1(7.0) (4.8) (4.2) (5.7) (17.3) (4.5) (6.2) (10.3) (16.2) (26.5)35.0 22.7 15.8 13.2 13.0 10.8 9.9 8.3 5.1 4.1(9.9) (7.2) (5.8) (5.5) (7.1) (6.5) (7.2) (6.8) (4.9) (4.0)23.7 12.7 11.3 - 33.0 (9.1) (4.1) (3.9) (18.6)
324
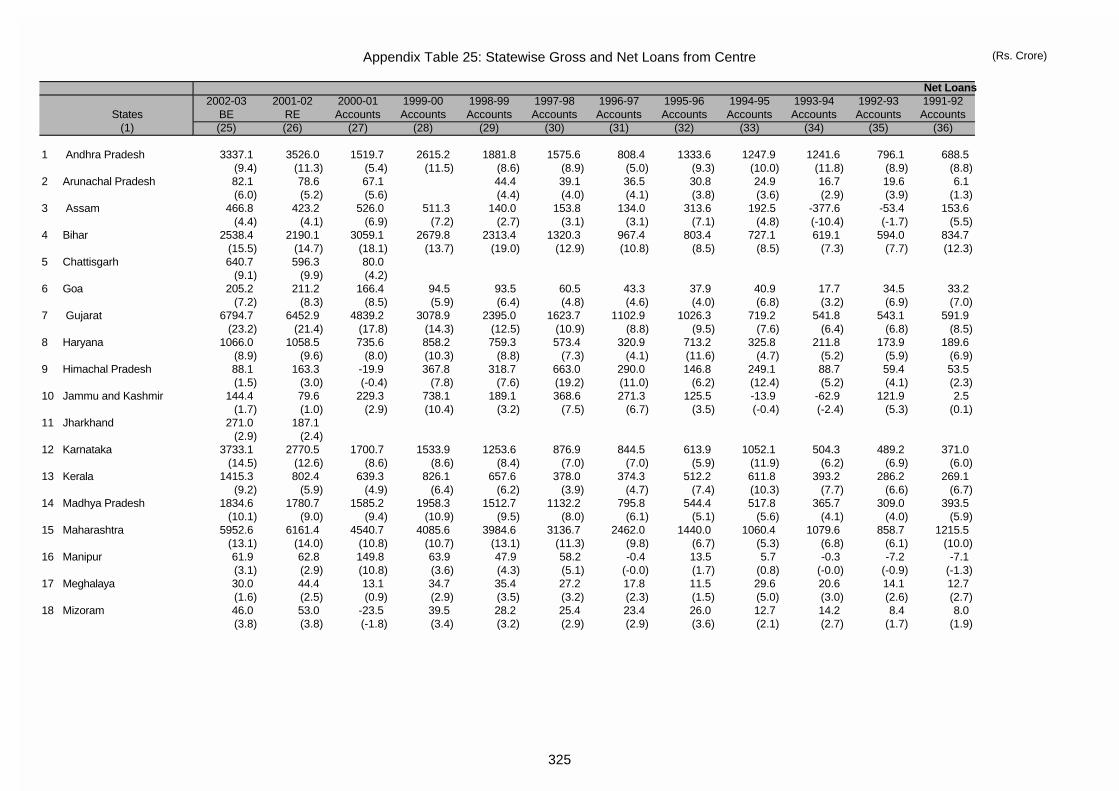
Appendix Table 25: Statewise Gross and Net Loans from Centre (Rs. Crore)
States(1)
1 Andhra Pradesh
2 Arunachal Pradesh
3 Assam
4 Bihar
5 Chattisgarh
6 Goa
7 Gujarat
8 Haryana
9 Himachal Pradesh
10 Jammu and Kashmir
11 Jharkhand
12 Karnataka
13 Kerala
14 Madhya Pradesh
15 Maharashtra
16 Manipur
17 Meghalaya
18 Mizoram
2002-03 2001-02 2000-01 1999-00 1998-99 1997-98 1996-97 1995-96 1994-95 1993-94 1992-93 1991-92BE RE Accounts Accounts Accounts Accounts Accounts Accounts Accounts Accounts Accounts Accounts(25) (26) (27) (28) (29) (30) (31) (32) (33) (34) (35) (36)
3337.1 3526.0 1519.7 2615.2 1881.8 1575.6 808.4 1333.6 1247.9 1241.6 796.1 688.5(9.4) (11.3) (5.4) (11.5) (8.6) (8.9) (5.0) (9.3) (10.0) (11.8) (8.9) (8.8)82.1 78.6 67.1 44.4 39.1 36.5 30.8 24.9 16.7 19.6 6.1(6.0) (5.2) (5.6) (4.4) (4.0) (4.1) (3.8) (3.6) (2.9) (3.9) (1.3)
466.8 423.2 526.0 511.3 140.0 153.8 134.0 313.6 192.5 -377.6 -53.4 153.6(4.4) (4.1) (6.9) (7.2) (2.7) (3.1) (3.1) (7.1) (4.8) (-10.4) (-1.7) (5.5)
2538.4 2190.1 3059.1 2679.8 2313.4 1320.3 967.4 803.4 727.1 619.1 594.0 834.7(15.5) (14.7) (18.1) (13.7) (19.0) (12.9) (10.8) (8.5) (8.5) (7.3) (7.7) (12.3)640.7 596.3 80.0
(9.1) (9.9) (4.2)205.2 211.2 166.4 94.5 93.5 60.5 43.3 37.9 40.9 17.7 34.5 33.2
(7.2) (8.3) (8.5) (5.9) (6.4) (4.8) (4.6) (4.0) (6.8) (3.2) (6.9) (7.0)6794.7 6452.9 4839.2 3078.9 2395.0 1623.7 1102.9 1026.3 719.2 541.8 543.1 591.9
(23.2) (21.4) (17.8) (14.3) (12.5) (10.9) (8.8) (9.5) (7.6) (6.4) (6.8) (8.5)1066.0 1058.5 735.6 858.2 759.3 573.4 320.9 713.2 325.8 211.8 173.9 189.6
(8.9) (9.6) (8.0) (10.3) (8.8) (7.3) (4.1) (11.6) (4.7) (5.2) (5.9) (6.9)88.1 163.3 -19.9 367.8 318.7 663.0 290.0 146.8 249.1 88.7 59.4 53.5(1.5) (3.0) (-0.4) (7.8) (7.6) (19.2) (11.0) (6.2) (12.4) (5.2) (4.1) (2.3)
144.4 79.6 229.3 738.1 189.1 368.6 271.3 125.5 -13.9 -62.9 121.9 2.5(1.7) (1.0) (2.9) (10.4) (3.2) (7.5) (6.7) (3.5) (-0.4) (-2.4) (5.3) (0.1)
271.0 187.1(2.9) (2.4)
3733.1 2770.5 1700.7 1533.9 1253.6 876.9 844.5 613.9 1052.1 504.3 489.2 371.0(14.5) (12.6) (8.6) (8.6) (8.4) (7.0) (7.0) (5.9) (11.9) (6.2) (6.9) (6.0)
1415.3 802.4 639.3 826.1 657.6 378.0 374.3 512.2 611.8 393.2 286.2 269.1(9.2) (5.9) (4.9) (6.4) (6.2) (3.9) (4.7) (7.4) (10.3) (7.7) (6.6) (6.7)
1834.6 1780.7 1585.2 1958.3 1512.7 1132.2 795.8 544.4 517.8 365.7 309.0 393.5(10.1) (9.0) (9.4) (10.9) (9.5) (8.0) (6.1) (5.1) (5.6) (4.1) (4.0) (5.9)
5952.6 6161.4 4540.7 4085.6 3984.6 3136.7 2462.0 1440.0 1060.4 1079.6 858.7 1215.5(13.1) (14.0) (10.8) (10.7) (13.1) (11.3) (9.8) (6.7) (5.3) (6.8) (6.1) (10.0)61.9 62.8 149.8 63.9 47.9 58.2 -0.4 13.5 5.7 -0.3 -7.2 -7.1(3.1) (2.9) (10.8) (3.6) (4.3) (5.1) (-0.0) (1.7) (0.8) (-0.0) (-0.9) (-1.3)30.0 44.4 13.1 34.7 35.4 27.2 17.8 11.5 29.6 20.6 14.1 12.7(1.6) (2.5) (0.9) (2.9) (3.5) (3.2) (2.3) (1.5) (5.0) (3.0) (2.6) (2.7)46.0 53.0 -23.5 39.5 28.2 25.4 23.4 26.0 12.7 14.2 8.4 8.0(3.8) (3.8) (-1.8) (3.4) (3.2) (2.9) (2.9) (3.6) (2.1) (2.7) (1.7) (1.9)
Net Loans
325
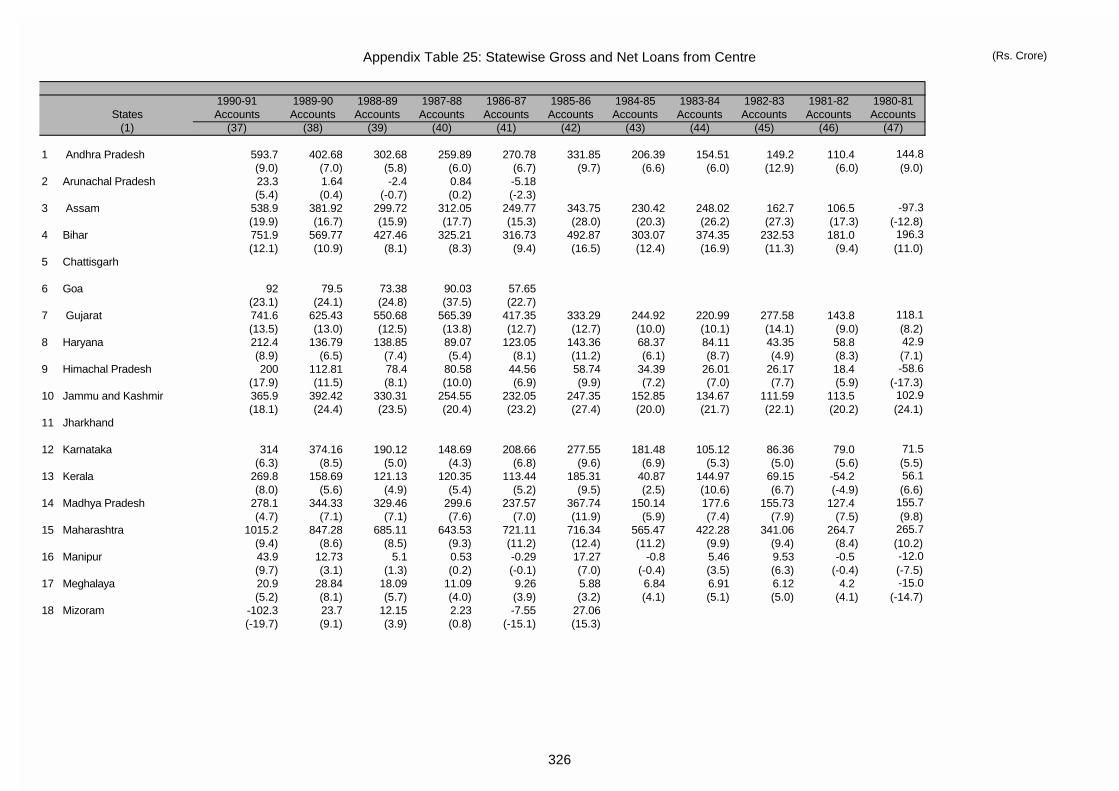
Appendix Table 25: Statewise Gross and Net Loans from Centre (Rs. Crore)
States(1)
1 Andhra Pradesh
2 Arunachal Pradesh
3 Assam
4 Bihar
5 Chattisgarh
6 Goa
7 Gujarat
8 Haryana
9 Himachal Pradesh
10 Jammu and Kashmir
11 Jharkhand
12 Karnataka
13 Kerala
14 Madhya Pradesh
15 Maharashtra
16 Manipur
17 Meghalaya
18 Mizoram
1990-91 1989-90 1988-89 1987-88 1986-87 1985-86 1984-85 1983-84 1982-83 1981-82 1980-81Accounts Accounts Accounts Accounts Accounts Accounts Accounts Accounts Accounts Accounts Accounts
(37) (38) (39) (40) (41) (42) (43) (44) (45) (46) (47)
593.7 402.68 302.68 259.89 270.78 331.85 206.39 154.51 149.2 110.4 144.8 (9.0) (7.0) (5.8) (6.0) (6.7) (9.7) (6.6) (6.0) (12.9) (6.0) (9.0)23.3 1.64 -2.4 0.84 -5.18 (5.4) (0.4) (-0.7) (0.2) (-2.3)
538.9 381.92 299.72 312.05 249.77 343.75 230.42 248.02 162.7 106.5 -97.3 (19.9) (16.7) (15.9) (17.7) (15.3) (28.0) (20.3) (26.2) (27.3) (17.3) (-12.8)751.9 569.77 427.46 325.21 316.73 492.87 303.07 374.35 232.53 181.0 196.3 (12.1) (10.9) (8.1) (8.3) (9.4) (16.5) (12.4) (16.9) (11.3) (9.4) (11.0)
92 79.5 73.38 90.03 57.65 (23.1) (24.1) (24.8) (37.5) (22.7)741.6 625.43 550.68 565.39 417.35 333.29 244.92 220.99 277.58 143.8 118.1 (13.5) (13.0) (12.5) (13.8) (12.7) (12.7) (10.0) (10.1) (14.1) (9.0) (8.2)212.4 136.79 138.85 89.07 123.05 143.36 68.37 84.11 43.35 58.8 42.9 (8.9) (6.5) (7.4) (5.4) (8.1) (11.2) (6.1) (8.7) (4.9) (8.3) (7.1)200 112.81 78.4 80.58 44.56 58.74 34.39 26.01 26.17 18.4 -58.6
(17.9) (11.5) (8.1) (10.0) (6.9) (9.9) (7.2) (7.0) (7.7) (5.9) (-17.3)365.9 392.42 330.31 254.55 232.05 247.35 152.85 134.67 111.59 113.5 102.9 (18.1) (24.4) (23.5) (20.4) (23.2) (27.4) (20.0) (21.7) (22.1) (20.2) (24.1)
314 374.16 190.12 148.69 208.66 277.55 181.48 105.12 86.36 79.0 71.5 (6.3) (8.5) (5.0) (4.3) (6.8) (9.6) (6.9) (5.3) (5.0) (5.6) (5.5)
269.8 158.69 121.13 120.35 113.44 185.31 40.87 144.97 69.15 -54.2 56.1 (8.0) (5.6) (4.9) (5.4) (5.2) (9.5) (2.5) (10.6) (6.7) (-4.9) (6.6)
278.1 344.33 329.46 299.6 237.57 367.74 150.14 177.6 155.73 127.4 155.7 (4.7) (7.1) (7.1) (7.6) (7.0) (11.9) (5.9) (7.4) (7.9) (7.5) (9.8)
1015.2 847.28 685.11 643.53 721.11 716.34 565.47 422.28 341.06 264.7 265.7 (9.4) (8.6) (8.5) (9.3) (11.2) (12.4) (11.2) (9.9) (9.4) (8.4) (10.2)43.9 12.73 5.1 0.53 -0.29 17.27 -0.8 5.46 9.53 -0.5 -12.0 (9.7) (3.1) (1.3) (0.2) (-0.1) (7.0) (-0.4) (3.5) (6.3) (-0.4) (-7.5)20.9 28.84 18.09 11.09 9.26 5.88 6.84 6.91 6.12 4.2 -15.0 (5.2) (8.1) (5.7) (4.0) (3.9) (3.2) (4.1) (5.1) (5.0) (4.1) (-14.7)
-102.3 23.7 12.15 2.23 -7.55 27.06(-19.7) (9.1) (3.9) (0.8) (-15.1) (15.3)
326
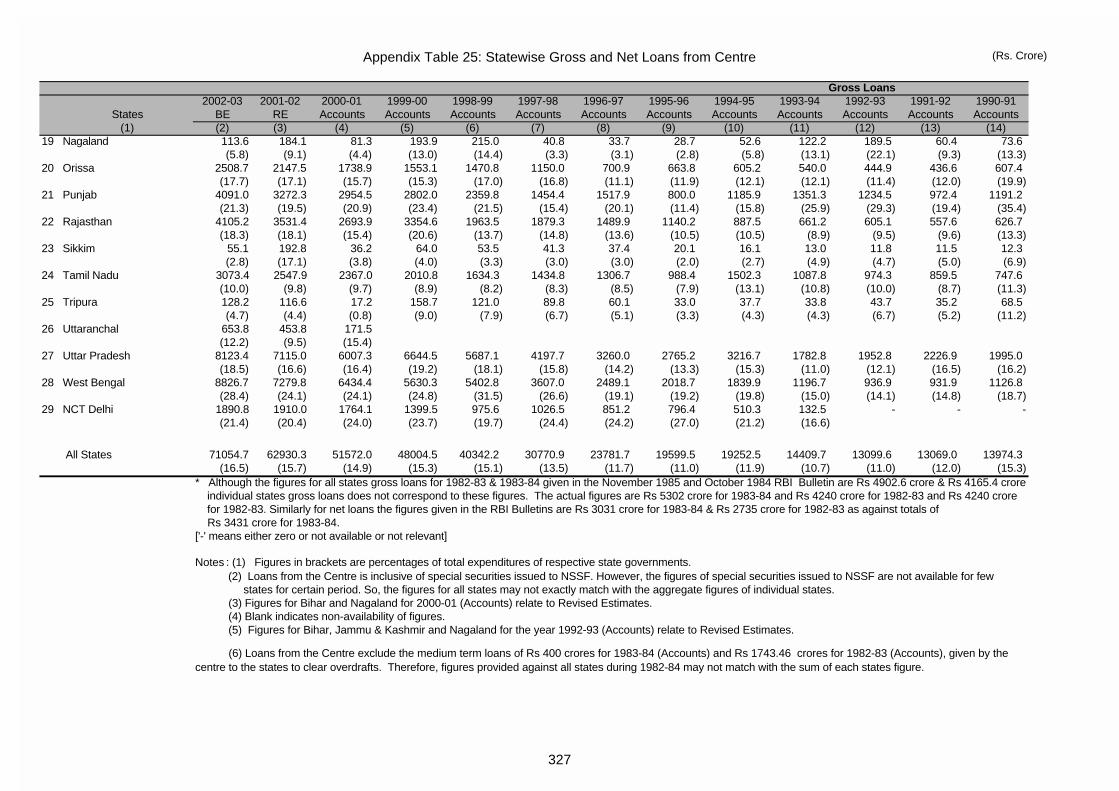
Appendix Table 25: Statewise Gross and Net Loans from Centre (Rs. Crore)
2002-03 2001-02 2000-01 1999-00 1998-99 1997-98 1996-97 1995-96 1994-95 1993-94 1992-93 1991-92 1990-91States BE RE Accounts Accounts Accounts Accounts Accounts Accounts Accounts Accounts Accounts Accounts Accounts
(1) (2) (3) (4) (5) (6) (7) (8) (9) (10) (11) (12) (13) (14)
Gross Loans
19 Nagaland 113.6 184.1 81.3 193.9 215.0 40.8 33.7 28.7 52.6 122.2 189.5 60.4 73.6(5.8) (9.1) (4.4) (13.0) (14.4) (3.3) (3.1) (2.8) (5.8) (13.1) (22.1) (9.3) (13.3)
20 Orissa 2508.7 2147.5 1738.9 1553.1 1470.8 1150.0 700.9 663.8 605.2 540.0 444.9 436.6 607.4(17.7) (17.1) (15.7) (15.3) (17.0) (16.8) (11.1) (11.9) (12.1) (12.1) (11.4) (12.0) (19.9)
21 Punjab 4091.0 3272.3 2954.5 2802.0 2359.8 1454.4 1517.9 800.0 1185.9 1351.3 1234.5 972.4 1191.2(21.3) (19.5) (20.9) (23.4) (21.5) (15.4) (20.1) (11.4) (15.8) (25.9) (29.3) (19.4) (35.4)
22 Rajasthan 4105.2 3531.4 2693.9 3354.6 1963.5 1879.3 1489.9 1140.2 887.5 661.2 605.1 557.6 626.7(18.3) (18.1) (15.4) (20.6) (13.7) (14.8) (13.6) (10.5) (10.5) (8.9) (9.5) (9.6) (13.3)
23 Sikkim 55.1 192.8 36.2 64.0 53.5 41.3 37.4 20.1 16.1 13.0 11.8 11.5 12.3(2.8) (17.1) (3.8) (4.0) (3.3) (3.0) (3.0) (2.0) (2.7) (4.9) (4.7) (5.0) (6.9)
24 Tamil Nadu 3073.4 2547.9 2367.0 2010.8 1634.3 1434.8 1306.7 988.4 1502.3 1087.8 974.3 859.5 747.6(10.0) (9.8) (9.7) (8.9) (8.2) (8.3) (8.5) (7.9) (13.1) (10.8) (10.0) (8.7) (11.3)
25 Tripura 128.2 116.6 17.2 158.7 121.0 89.8 60.1 33.0 37.7 33.8 43.7 35.2 68.5(4.7) (4.4) (0.8) (9.0) (7.9) (6.7) (5.1) (3.3) (4.3) (4.3) (6.7) (5.2) (11.2)
26 Uttaranchal 653.8 453.8 171.5(12.2) (9.5) (15.4)
27 Uttar Pradesh 8123.4 7115.0 6007.3 6644.5 5687.1 4197.7 3260.0 2765.2 3216.7 1782.8 1952.8 2226.9 1995.0(18.5) (16.6) (16.4) (19.2) (18.1) (15.8) (14.2) (13.3) (15.3) (11.0) (12.1) (16.5) (16.2)
28 West Bengal 8826.7 7279.8 6434.4 5630.3 5402.8 3607.0 2489.1 2018.7 1839.9 1196.7 936.9 931.9 1126.8(28.4) (24.1) (24.1) (24.8) (31.5) (26.6) (19.1) (19.2) (19.8) (15.0) (14.1) (14.8) (18.7)
29 NCT Delhi 1890.8 1910.0 1764.1 1399.5 975.6 1026.5 851.2 796.4 510.3 132.5 - - -(21.4) (20.4) (24.0) (23.7) (19.7) (24.4) (24.2) (27.0) (21.2) (16.6)
All States 71054.7 62930.3 51572.0 48004.5 40342.2 30770.9 23781.7 19599.5 19252.5 14409.7 13099.6 13069.0 13974.3(16.5) (15.7) (14.9) (15.3) (15.1) (13.5) (11.7) (11.0) (11.9) (10.7) (11.0) (12.0) (15.3)
* Although the figures for all states gross loans for 1982-83 & 1983-84 given in the November 1985 and October 1984 RBI Bulletin are Rs 4902.6 crore & Rs 4165.4 crore individual states gross loans does not correspond to these figures. The actual figures are Rs 5302 crore for 1983-84 and Rs 4240 crore for 1982-83 and Rs 4240 crore for 1982-83. Similarly for net loans the figures given in the RBI Bulletins are Rs 3031 crore for 1983-84 & Rs 2735 crore for 1982-83 as against totals of Rs 3431 crore for 1983-84.['-' means either zero or not available or not relevant]
Notes : (1) Figures in brackets are percentages of total expenditures of respective state governments. (2) Loans from the Centre is inclusive of special securities issued to NSSF. However, the figures of special securities issued to NSSF are not available for few states for certain period. So, the figures for all states may not exactly match with the aggregate figures of individual states. (3) Figures for Bihar and Nagaland for 2000-01 (Accounts) relate to Revised Estimates. (4) Blank indicates non-availability of figures. (5) Figures for Bihar, Jammu & Kashmir and Nagaland for the year 1992-93 (Accounts) relate to Revised Estimates.
(6) Loans from the Centre exclude the medium term loans of Rs 400 crores for 1983-84 (Accounts) and Rs 1743.46 crores for 1982-83 (Accounts), given by the centre to the states to clear overdrafts. Therefore, figures provided against all states during 1982-84 may not match with the sum of each states figure.
327
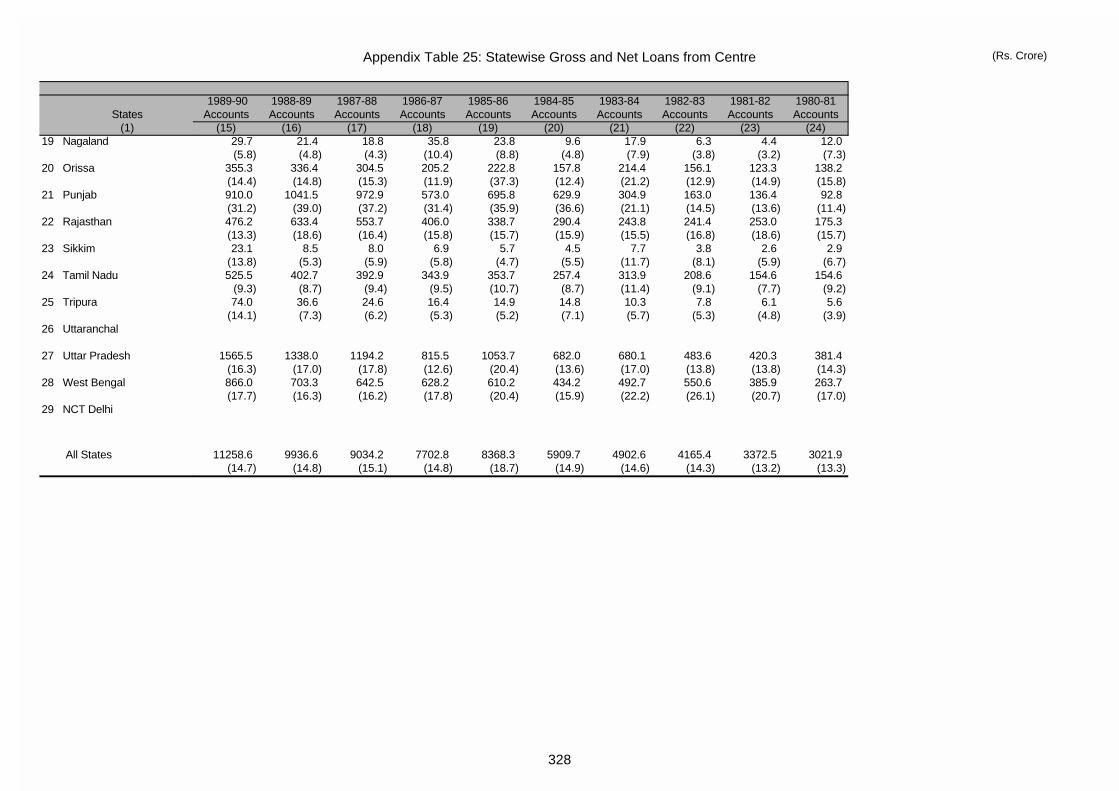
Appendix Table 25: Statewise Gross and Net Loans from Centre (Rs. Crore)
States(1)
19 Nagaland
20 Orissa
21 Punjab
22 Rajasthan
23 Sikkim
24 Tamil Nadu
25 Tripura
26 Uttaranchal
27 Uttar Pradesh
28 West Bengal
29 NCT Delhi
All States
1989-90 1988-89 1987-88 1986-87 1985-86 1984-85 1983-84 1982-83 1981-82 1980-81Accounts Accounts Accounts Accounts Accounts Accounts Accounts Accounts Accounts Accounts
(15) (16) (17) (18) (19) (20) (21) (22) (23) (24)29.7 21.4 18.8 35.8 23.8 9.6 17.9 6.3 4.4 12.0(5.8) (4.8) (4.3) (10.4) (8.8) (4.8) (7.9) (3.8) (3.2) (7.3)
355.3 336.4 304.5 205.2 222.8 157.8 214.4 156.1 123.3 138.2(14.4) (14.8) (15.3) (11.9) (37.3) (12.4) (21.2) (12.9) (14.9) (15.8)910.0 1041.5 972.9 573.0 695.8 629.9 304.9 163.0 136.4 92.8(31.2) (39.0) (37.2) (31.4) (35.9) (36.6) (21.1) (14.5) (13.6) (11.4)476.2 633.4 553.7 406.0 338.7 290.4 243.8 241.4 253.0 175.3(13.3) (18.6) (16.4) (15.8) (15.7) (15.9) (15.5) (16.8) (18.6) (15.7)23.1 8.5 8.0 6.9 5.7 4.5 7.7 3.8 2.6 2.9
(13.8) (5.3) (5.9) (5.8) (4.7) (5.5) (11.7) (8.1) (5.9) (6.7)525.5 402.7 392.9 343.9 353.7 257.4 313.9 208.6 154.6 154.6
(9.3) (8.7) (9.4) (9.5) (10.7) (8.7) (11.4) (9.1) (7.7) (9.2)74.0 36.6 24.6 16.4 14.9 14.8 10.3 7.8 6.1 5.6
(14.1) (7.3) (6.2) (5.3) (5.2) (7.1) (5.7) (5.3) (4.8) (3.9)
1565.5 1338.0 1194.2 815.5 1053.7 682.0 680.1 483.6 420.3 381.4(16.3) (17.0) (17.8) (12.6) (20.4) (13.6) (17.0) (13.8) (13.8) (14.3)866.0 703.3 642.5 628.2 610.2 434.2 492.7 550.6 385.9 263.7(17.7) (16.3) (16.2) (17.8) (20.4) (15.9) (22.2) (26.1) (20.7) (17.0)
11258.6 9936.6 9034.2 7702.8 8368.3 5909.7 4902.6 4165.4 3372.5 3021.9(14.7) (14.8) (15.1) (14.8) (18.7) (14.9) (14.6) (14.3) (13.2) (13.3)
328
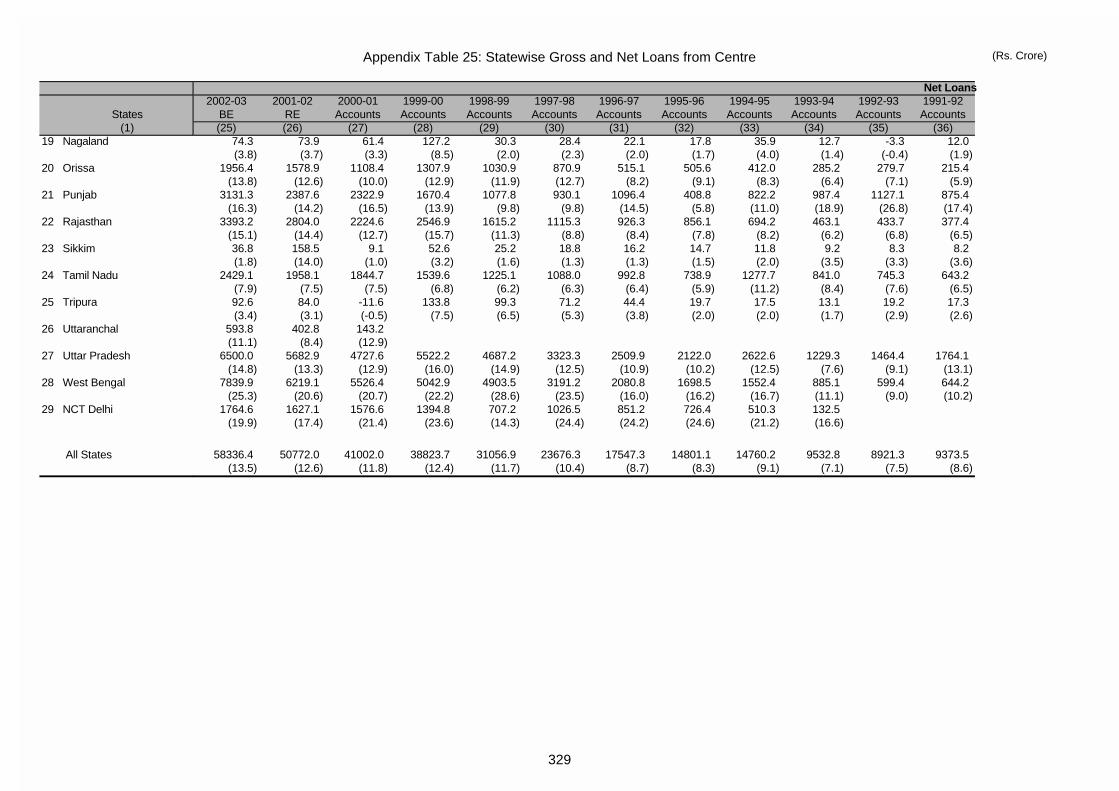
Appendix Table 25: Statewise Gross and Net Loans from Centre (Rs. Crore)
States(1)
19 Nagaland
20 Orissa
21 Punjab
22 Rajasthan
23 Sikkim
24 Tamil Nadu
25 Tripura
26 Uttaranchal
27 Uttar Pradesh
28 West Bengal
29 NCT Delhi
All States
2002-03 2001-02 2000-01 1999-00 1998-99 1997-98 1996-97 1995-96 1994-95 1993-94 1992-93 1991-92BE RE Accounts Accounts Accounts Accounts Accounts Accounts Accounts Accounts Accounts Accounts(25) (26) (27) (28) (29) (30) (31) (32) (33) (34) (35) (36)
Net Loans
74.3 73.9 61.4 127.2 30.3 28.4 22.1 17.8 35.9 12.7 -3.3 12.0(3.8) (3.7) (3.3) (8.5) (2.0) (2.3) (2.0) (1.7) (4.0) (1.4) (-0.4) (1.9)
1956.4 1578.9 1108.4 1307.9 1030.9 870.9 515.1 505.6 412.0 285.2 279.7 215.4(13.8) (12.6) (10.0) (12.9) (11.9) (12.7) (8.2) (9.1) (8.3) (6.4) (7.1) (5.9)
3131.3 2387.6 2322.9 1670.4 1077.8 930.1 1096.4 408.8 822.2 987.4 1127.1 875.4(16.3) (14.2) (16.5) (13.9) (9.8) (9.8) (14.5) (5.8) (11.0) (18.9) (26.8) (17.4)
3393.2 2804.0 2224.6 2546.9 1615.2 1115.3 926.3 856.1 694.2 463.1 433.7 377.4(15.1) (14.4) (12.7) (15.7) (11.3) (8.8) (8.4) (7.8) (8.2) (6.2) (6.8) (6.5)36.8 158.5 9.1 52.6 25.2 18.8 16.2 14.7 11.8 9.2 8.3 8.2(1.8) (14.0) (1.0) (3.2) (1.6) (1.3) (1.3) (1.5) (2.0) (3.5) (3.3) (3.6)
2429.1 1958.1 1844.7 1539.6 1225.1 1088.0 992.8 738.9 1277.7 841.0 745.3 643.2(7.9) (7.5) (7.5) (6.8) (6.2) (6.3) (6.4) (5.9) (11.2) (8.4) (7.6) (6.5)92.6 84.0 -11.6 133.8 99.3 71.2 44.4 19.7 17.5 13.1 19.2 17.3(3.4) (3.1) (-0.5) (7.5) (6.5) (5.3) (3.8) (2.0) (2.0) (1.7) (2.9) (2.6)
593.8 402.8 143.2(11.1) (8.4) (12.9)
6500.0 5682.9 4727.6 5522.2 4687.2 3323.3 2509.9 2122.0 2622.6 1229.3 1464.4 1764.1(14.8) (13.3) (12.9) (16.0) (14.9) (12.5) (10.9) (10.2) (12.5) (7.6) (9.1) (13.1)
7839.9 6219.1 5526.4 5042.9 4903.5 3191.2 2080.8 1698.5 1552.4 885.1 599.4 644.2(25.3) (20.6) (20.7) (22.2) (28.6) (23.5) (16.0) (16.2) (16.7) (11.1) (9.0) (10.2)
1764.6 1627.1 1576.6 1394.8 707.2 1026.5 851.2 726.4 510.3 132.5(19.9) (17.4) (21.4) (23.6) (14.3) (24.4) (24.2) (24.6) (21.2) (16.6)
58336.4 50772.0 41002.0 38823.7 31056.9 23676.3 17547.3 14801.1 14760.2 9532.8 8921.3 9373.5(13.5) (12.6) (11.8) (12.4) (11.7) (10.4) (8.7) (8.3) (9.1) (7.1) (7.5) (8.6)
329
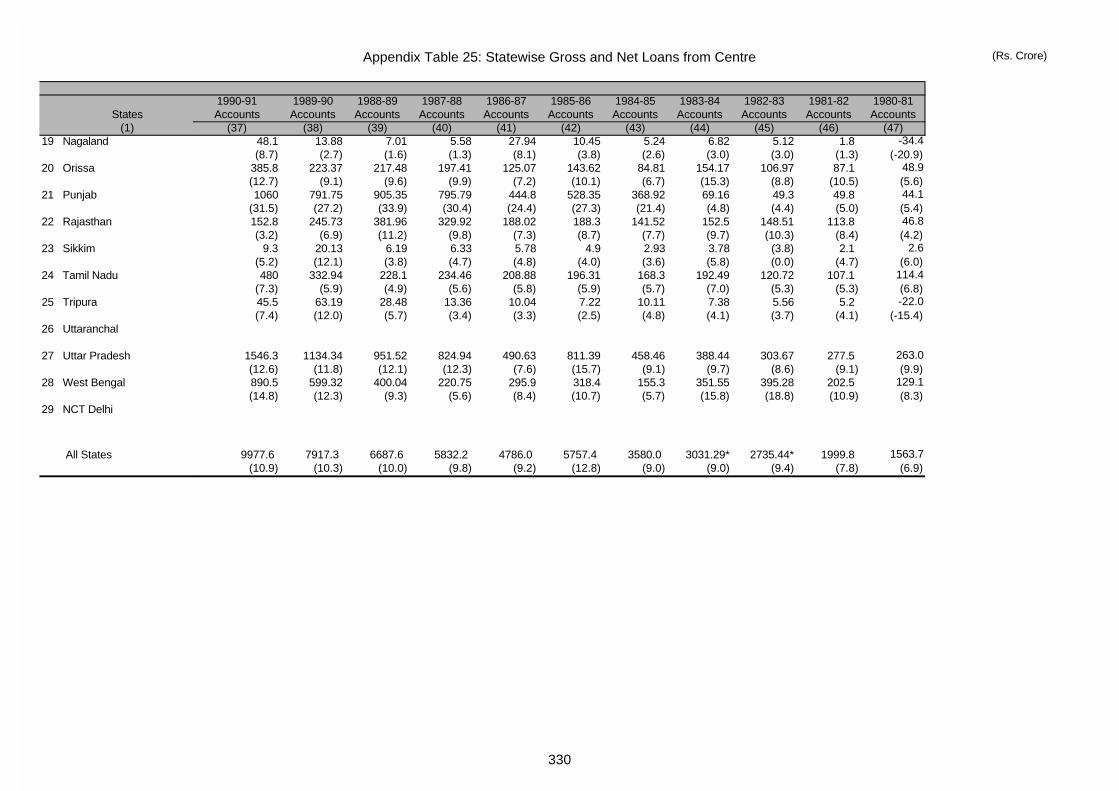
Appendix Table 25: Statewise Gross and Net Loans from Centre (Rs. Crore)
States(1)
19 Nagaland
20 Orissa
21 Punjab
22 Rajasthan
23 Sikkim
24 Tamil Nadu
25 Tripura
26 Uttaranchal
27 Uttar Pradesh
28 West Bengal
29 NCT Delhi
All States
1990-91 1989-90 1988-89 1987-88 1986-87 1985-86 1984-85 1983-84 1982-83 1981-82 1980-81Accounts Accounts Accounts Accounts Accounts Accounts Accounts Accounts Accounts Accounts Accounts
(37) (38) (39) (40) (41) (42) (43) (44) (45) (46) (47)48.1 13.88 7.01 5.58 27.94 10.45 5.24 6.82 5.12 1.8 -34.4 (8.7) (2.7) (1.6) (1.3) (8.1) (3.8) (2.6) (3.0) (3.0) (1.3) (-20.9)
385.8 223.37 217.48 197.41 125.07 143.62 84.81 154.17 106.97 87.1 48.9 (12.7) (9.1) (9.6) (9.9) (7.2) (10.1) (6.7) (15.3) (8.8) (10.5) (5.6)1060 791.75 905.35 795.79 444.8 528.35 368.92 69.16 49.3 49.8 44.1
(31.5) (27.2) (33.9) (30.4) (24.4) (27.3) (21.4) (4.8) (4.4) (5.0) (5.4)152.8 245.73 381.96 329.92 188.02 188.3 141.52 152.5 148.51 113.8 46.8 (3.2) (6.9) (11.2) (9.8) (7.3) (8.7) (7.7) (9.7) (10.3) (8.4) (4.2)
9.3 20.13 6.19 6.33 5.78 4.9 2.93 3.78 (3.8) 2.1 2.6 (5.2) (12.1) (3.8) (4.7) (4.8) (4.0) (3.6) (5.8) (0.0) (4.7) (6.0)480 332.94 228.1 234.46 208.88 196.31 168.3 192.49 120.72 107.1 114.4
(7.3) (5.9) (4.9) (5.6) (5.8) (5.9) (5.7) (7.0) (5.3) (5.3) (6.8)45.5 63.19 28.48 13.36 10.04 7.22 10.11 7.38 5.56 5.2 -22.0 (7.4) (12.0) (5.7) (3.4) (3.3) (2.5) (4.8) (4.1) (3.7) (4.1) (-15.4)
1546.3 1134.34 951.52 824.94 490.63 811.39 458.46 388.44 303.67 277.5 263.0 (12.6) (11.8) (12.1) (12.3) (7.6) (15.7) (9.1) (9.7) (8.6) (9.1) (9.9)890.5 599.32 400.04 220.75 295.9 318.4 155.3 351.55 395.28 202.5 129.1 (14.8) (12.3) (9.3) (5.6) (8.4) (10.7) (5.7) (15.8) (18.8) (10.9) (8.3)
9977.6 7917.3 6687.6 5832.2 4786.0 5757.4 3580.0 3031.29* 2735.44* 1999.8 1563.7 (10.9) (10.3) (10.0) (9.8) (9.2) (12.8) (9.0) (9.0) (9.4) (7.8) (6.9)
330
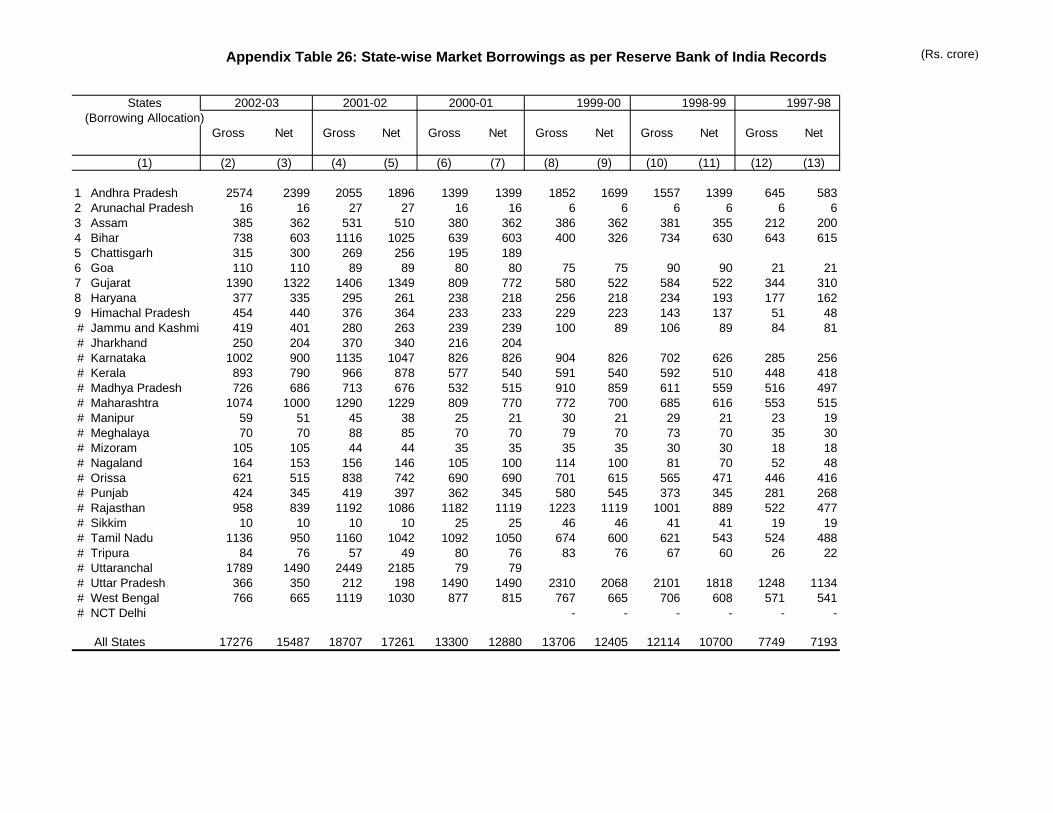
Appendix Table 26: State-wise Market Borrowings as per Reserve Bank of India Records (Rs. crore)
States(Borrowing Allocation)
Gross Net Gross Net Gross Net Gross Net Gross Net Gross Net
(1) (2) (3) (4) (5) (6) (7) (8) (9) (10) (11) (12) (13)
1 Andhra Pradesh 2574 2399 2055 1896 1399 1399 1852 1699 1557 1399 645 5832 Arunachal Pradesh 16 16 27 27 16 16 6 6 6 6 6 63 Assam 385 362 531 510 380 362 386 362 381 355 212 2004 Bihar 738 603 1116 1025 639 603 400 326 734 630 643 6155 Chattisgarh 315 300 269 256 195 189 6 Goa 110 110 89 89 80 80 75 75 90 90 21 217 Gujarat 1390 1322 1406 1349 809 772 580 522 584 522 344 3108 Haryana 377 335 295 261 238 218 256 218 234 193 177 1629 Himachal Pradesh 454 440 376 364 233 233 229 223 143 137 51 48# Jammu and Kashmir 419 401 280 263 239 239 100 89 106 89 84 81# Jharkhand 250 204 370 340 216 204# Karnataka 1002 900 1135 1047 826 826 904 826 702 626 285 256# Kerala 893 790 966 878 577 540 591 540 592 510 448 418# Madhya Pradesh 726 686 713 676 532 515 910 859 611 559 516 497# Maharashtra 1074 1000 1290 1229 809 770 772 700 685 616 553 515# Manipur 59 51 45 38 25 21 30 21 29 21 23 19# Meghalaya 70 70 88 85 70 70 79 70 73 70 35 30# Mizoram 105 105 44 44 35 35 35 35 30 30 18 18# Nagaland 164 153 156 146 105 100 114 100 81 70 52 48# Orissa 621 515 838 742 690 690 701 615 565 471 446 416# Punjab 424 345 419 397 362 345 580 545 373 345 281 268# Rajasthan 958 839 1192 1086 1182 1119 1223 1119 1001 889 522 477# Sikkim 10 10 10 10 25 25 46 46 41 41 19 19# Tamil Nadu 1136 950 1160 1042 1092 1050 674 600 621 543 524 488# Tripura 84 76 57 49 80 76 83 76 67 60 26 22# Uttaranchal 1789 1490 2449 2185 79 79# Uttar Pradesh 366 350 212 198 1490 1490 2310 2068 2101 1818 1248 1134# West Bengal 766 665 1119 1030 877 815 767 665 706 608 571 541# NCT Delhi - - - - - -
All States 17276 15487 18707 17261 13300 12880 13706 12405 12114 10700 7749 7193
2002-03 2001-02 2000-01 1999-00 1998-99 1997-98
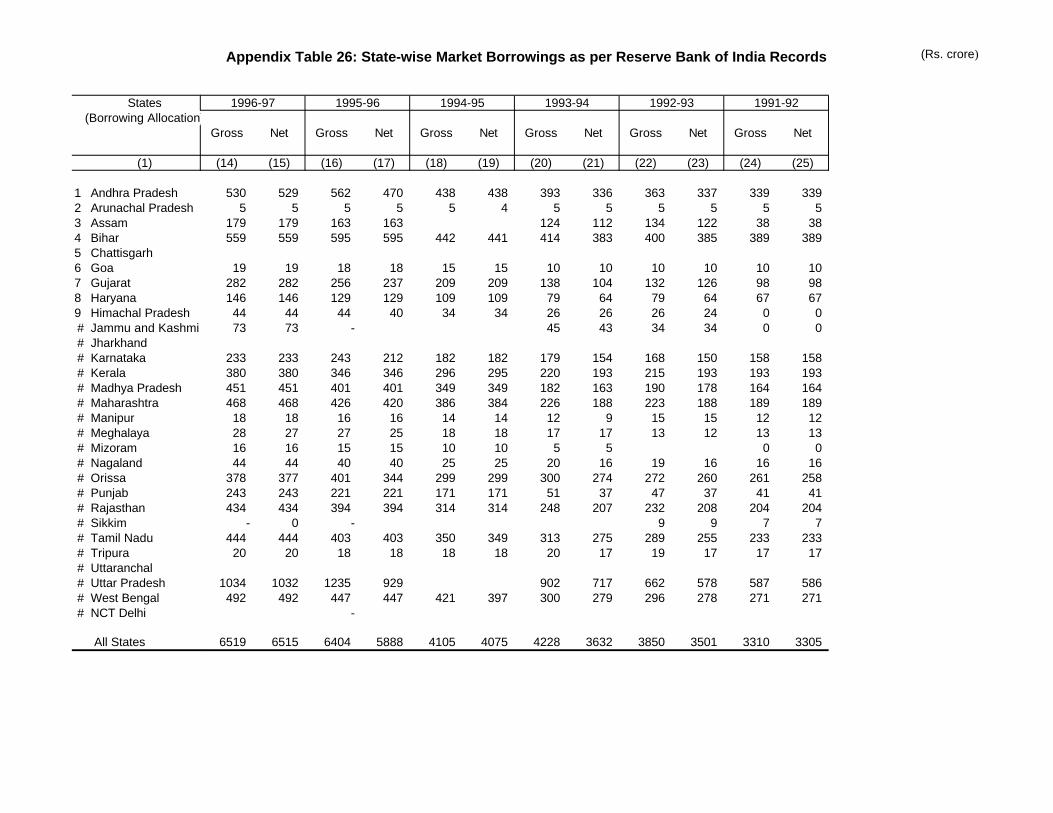
Appendix Table 26: State-wise Market Borrowings as per Reserve Bank of India Records (Rs. crore)
States(Borrowing Allocation)
(1)
1 Andhra Pradesh2 Arunachal Pradesh3 Assam4 Bihar5 Chattisgarh6 Goa7 Gujarat8 Haryana9 Himachal Pradesh# Jammu and Kashmir# Jharkhand# Karnataka# Kerala# Madhya Pradesh# Maharashtra# Manipur# Meghalaya# Mizoram# Nagaland# Orissa# Punjab# Rajasthan# Sikkim# Tamil Nadu# Tripura# Uttaranchal# Uttar Pradesh# West Bengal# NCT Delhi
All States
Gross Net Gross Net Gross Net Gross Net Gross Net Gross Net
(14) (15) (16) (17) (18) (19) (20) (21) (22) (23) (24) (25)
530 529 562 470 438 438 393 336 363 337 339 3395 5 5 5 5 4 5 5 5 5 5 5
179 179 163 163 124 112 134 122 38 38559 559 595 595 442 441 414 383 400 385 389 389
19 19 18 18 15 15 10 10 10 10 10 10
282 282 256 237 209 209 138 104 132 126 98 98146 146 129 129 109 109 79 64 79 64 67 6744 44 44 40 34 34 26 26 26 24 0 073 73 - 45 43 34 34 0 0
233 233 243 212 182 182 179 154 168 150 158 158380 380 346 346 296 295 220 193 215 193 193 193451 451 401 401 349 349 182 163 190 178 164 164468 468 426 420 386 384 226 188 223 188 189 18918 18 16 16 14 14 12 9 15 15 12 1228 27 27 25 18 18 17 17 13 12 13 1316 16 15 15 10 10 5 5 0 044 44 40 40 25 25 20 16 19 16 16 16
378 377 401 344 299 299 300 274 272 260 261 258243 243 221 221 171 171 51 37 47 37 41 41434 434 394 394 314 314 248 207 232 208 204 204
- 0 - 9 9 7 7444 444 403 403 350 349 313 275 289 255 233 23320 20 18 18 18 18 20 17 19 17 17 17
1034 1032 1235 929 902 717 662 578 587 586492 492 447 447 421 397 300 279 296 278 271 271
-
6519 6515 6404 5888 4105 4075 4228 3632 3850 3501 3310 3305
1994-95 1993-94 1992-93 1991-921996-97 1995-96
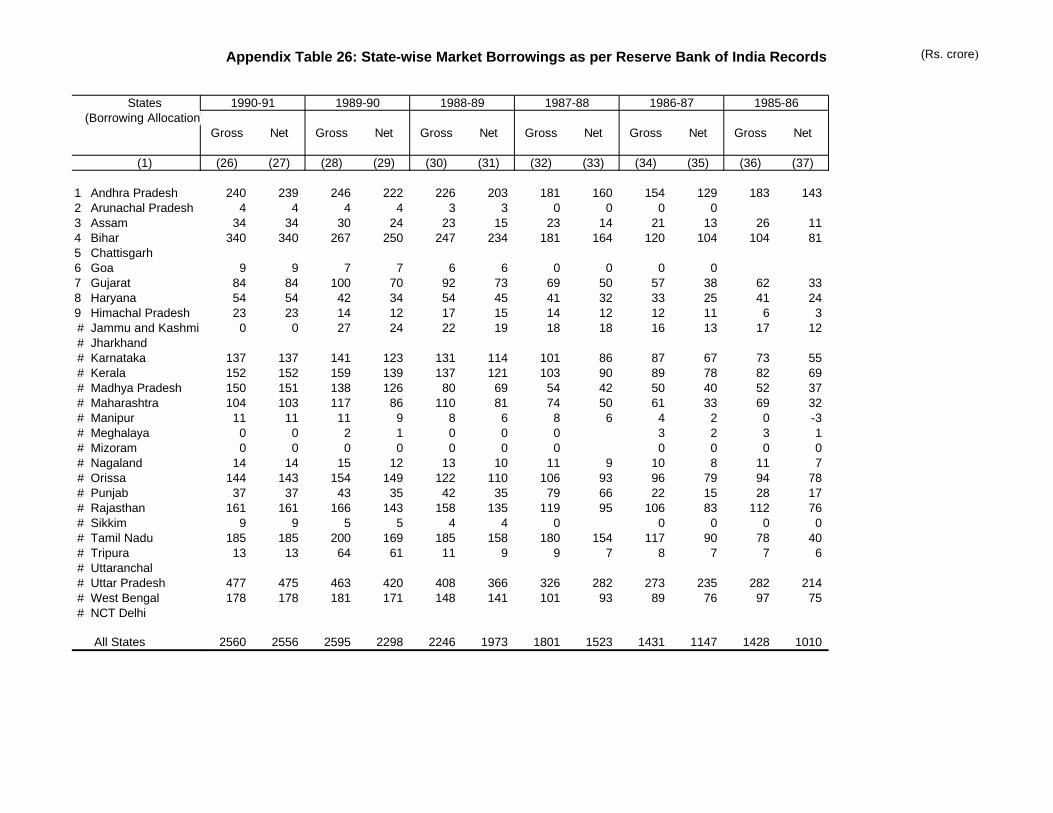
Appendix Table 26: State-wise Market Borrowings as per Reserve Bank of India Records (Rs. crore)
States(Borrowing Allocation)
(1)
1 Andhra Pradesh2 Arunachal Pradesh3 Assam4 Bihar5 Chattisgarh6 Goa7 Gujarat8 Haryana9 Himachal Pradesh# Jammu and Kashmir# Jharkhand# Karnataka# Kerala# Madhya Pradesh# Maharashtra# Manipur# Meghalaya# Mizoram# Nagaland# Orissa# Punjab# Rajasthan# Sikkim# Tamil Nadu# Tripura# Uttaranchal# Uttar Pradesh# West Bengal# NCT Delhi
All States
Gross Net Gross Net Gross Net Gross Net Gross Net Gross Net
(26) (27) (28) (29) (30) (31) (32) (33) (34) (35) (36) (37)
240 239 246 222 226 203 181 160 154 129 183 1434 4 4 4 3 3 0 0 0 0
34 34 30 24 23 15 23 14 21 13 26 11340 340 267 250 247 234 181 164 120 104 104 81
9 9 7 7 6 6 0 0 0 084 84 100 70 92 73 69 50 57 38 62 3354 54 42 34 54 45 41 32 33 25 41 2423 23 14 12 17 15 14 12 12 11 6 30 0 27 24 22 19 18 18 16 13 17 12
137 137 141 123 131 114 101 86 87 67 73 55152 152 159 139 137 121 103 90 89 78 82 69150 151 138 126 80 69 54 42 50 40 52 37104 103 117 86 110 81 74 50 61 33 69 3211 11 11 9 8 6 8 6 4 2 0 -30 0 2 1 0 0 0 3 2 3 10 0 0 0 0 0 0 0 0 0 0
14 14 15 12 13 10 11 9 10 8 11 7144 143 154 149 122 110 106 93 96 79 94 7837 37 43 35 42 35 79 66 22 15 28 17
161 161 166 143 158 135 119 95 106 83 112 769 9 5 5 4 4 0 0 0 0 0
185 185 200 169 185 158 180 154 117 90 78 4013 13 64 61 11 9 9 7 8 7 7 6
477 475 463 420 408 366 326 282 273 235 282 214178 178 181 171 148 141 101 93 89 76 97 75
2560 2556 2595 2298 2246 1973 1801 1523 1431 1147 1428 1010
1986-87 1985-861990-91 1989-90 1988-89 1987-88
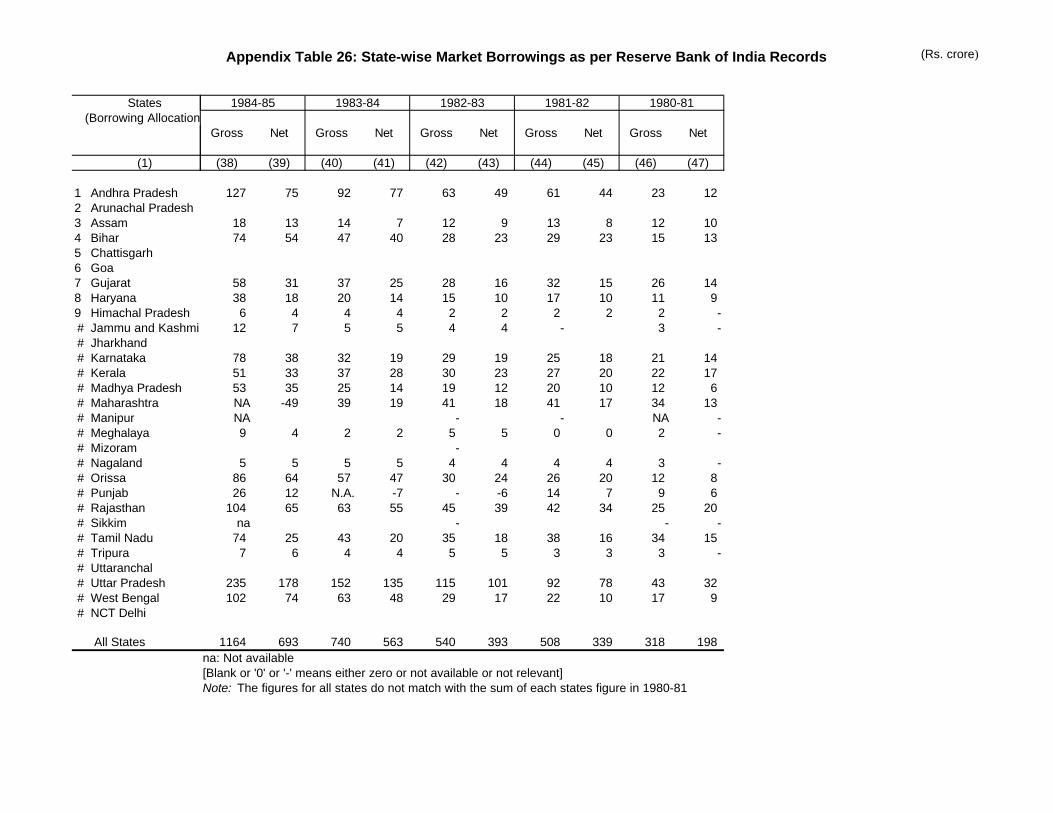
Appendix Table 26: State-wise Market Borrowings as per Reserve Bank of India Records (Rs. crore)
States(Borrowing Allocation)
(1)
1 Andhra Pradesh2 Arunachal Pradesh3 Assam4 Bihar5 Chattisgarh6 Goa7 Gujarat8 Haryana9 Himachal Pradesh# Jammu and Kashmir# Jharkhand# Karnataka# Kerala# Madhya Pradesh# Maharashtra# Manipur# Meghalaya# Mizoram# Nagaland# Orissa# Punjab# Rajasthan# Sikkim# Tamil Nadu# Tripura# Uttaranchal# Uttar Pradesh# West Bengal# NCT Delhi
All States
Gross Net Gross Net Gross Net Gross Net Gross Net
(38) (39) (40) (41) (42) (43) (44) (45) (46) (47)
127 75 92 77 63 49 61 44 23 12
18 13 14 7 12 9 13 8 12 1074 54 47 40 28 23 29 23 15 13
58 31 37 25 28 16 32 15 26 1438 18 20 14 15 10 17 10 11 96 4 4 4 2 2 2 2 2 -
12 7 5 5 4 4 - 3 -
78 38 32 19 29 19 25 18 21 1451 33 37 28 30 23 27 20 22 1753 35 25 14 19 12 20 10 12 6NA -49 39 19 41 18 41 17 34 13NA - - NA -9 4 2 2 5 5 0 0 2 -
- 5 5 5 5 4 4 4 4 3 -
86 64 57 47 30 24 26 20 12 826 12 N.A. -7 - -6 14 7 9 6
104 65 63 55 45 39 42 34 25 20na - - -
74 25 43 20 35 18 38 16 34 157 6 4 4 5 5 3 3 3 -
235 178 152 135 115 101 92 78 43 32102 74 63 48 29 17 22 10 17 9
1164 693 740 563 540 393 508 339 318 198na: Not available[Blank or '0' or '-' means either zero or not available or not relevant]Note: The figures for all states do not match with the sum of each states figure in 1980-81
1982-83 1981-82 1980-811984-85 1983-84
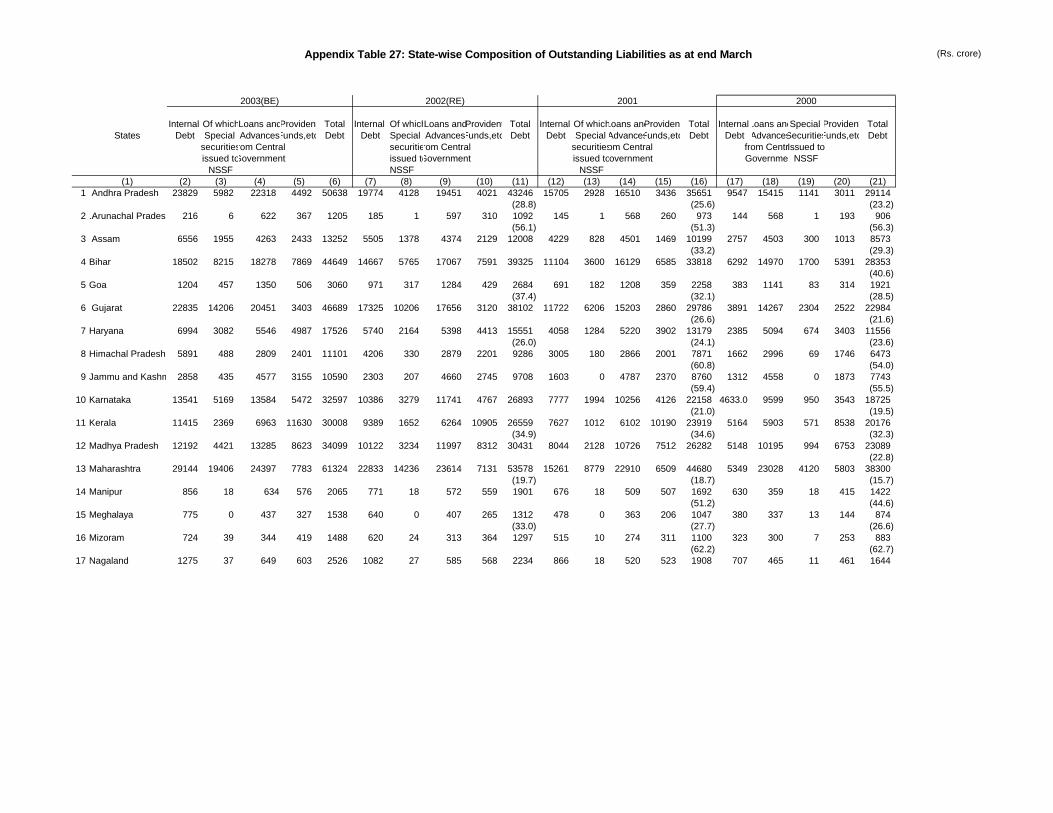
Appendix Table 27: State-wise Composition of Outstanding Liabilities as at end March (Rs. crore)
Internal Of whichLoans andProvident Total Internal Of whichLoans andProvident Total Internal Of whichLoans andProvident Total Internal Loans andSpecial Provident TotalStates Debt Special AdvancesFunds,etc. Debt Debt Special AdvancesFunds,etc. Debt Debt Special AdvancesFunds,etc. Debt Debt AdvancesSecuritiesFunds,etc. Debt
securitiesfrom Central securitiesfrom Central securitiesfrom Central from CentralIssued toissued toGovernment issued toGovernment issued toGovernment GovernmentNSSF
NSSF NSSF NSSF(1) (2) (3) (4) (5) (6) (7) (8) (9) (10) (11) (12) (13) (14) (15) (16) (17) (18) (19) (20) (21)
1 Andhra Pradesh 23829 5982 22318 4492 50638 19774 4128 19451 4021 43246 15705 2928 16510 3436 35651 9547 15415 1141 3011 29114(28.8) (25.6) (23.2)
2 .Arunachal Pradesh 216 6 622 367 1205 185 1 597 310 1092 145 1 568 260 973 144 568 1 193 906(56.1) (51.3) (56.3)
3 Assam 6556 1955 4263 2433 13252 5505 1378 4374 2129 12008 4229 828 4501 1469 10199 2757 4503 300 1013 8573(33.2) (29.3)
4 Bihar 18502 8215 18278 7869 44649 14667 5765 17067 7591 39325 11104 3600 16129 6585 33818 6292 14970 1700 5391 28353(40.6)
5 Goa 1204 457 1350 506 3060 971 317 1284 429 2684 691 182 1208 359 2258 383 1141 83 314 1921(37.4) (32.1) (28.5)
6 Gujarat 22835 14206 20451 3403 46689 17325 10206 17656 3120 38102 11722 6206 15203 2860 29786 3891 14267 2304 2522 22984(26.6) (21.6)
7 Haryana 6994 3082 5546 4987 17526 5740 2164 5398 4413 15551 4058 1284 5220 3902 13179 2385 5094 674 3403 11556(26.0) (24.1) (23.6)
8 Himachal Pradesh 5891 488 2809 2401 11101 4206 330 2879 2201 9286 3005 180 2866 2001 7871 1662 2996 69 1746 6473(60.8) (54.0)
9 Jammu and Kashmir 2858 435 4577 3155 10590 2303 207 4660 2745 9708 1603 0 4787 2370 8760 1312 4558 0 1873 7743(59.4) (55.5)
10 Karnataka 13541 5169 13584 5472 32597 10386 3279 11741 4767 26893 7777 1994 10256 4126 22158 4633.0 9599 950 3543 18725(21.0) (19.5)
11 Kerala 11415 2369 6963 11630 30008 9389 1652 6264 10905 26559 7627 1012 6102 10190 23919 5164 5903 571 8538 20176(34.9) (34.6) (32.3)
12 Madhya Pradesh 12192 4421 13285 8623 34099 10122 3234 11997 8312 30431 8044 2128 10726 7512 26282 5148 10195 994 6753 23089(22.8)
13 Maharashtra 29144 19406 24397 7783 61324 22833 14236 23614 7131 53578 15261 8779 22910 6509 44680 5349 23028 4120 5803 38300(19.7) (18.7) (15.7)
14 Manipur 856 18 634 576 2065 771 18 572 559 1901 676 18 509 507 1692 630 359 18 415 1422(51.2) (44.6)
15 Meghalaya 775 0 437 327 1538 640 0 407 265 1312 478 0 363 206 1047 380 337 13 144 874(33.0) (27.7) (26.6)
16 Mizoram 724 39 344 419 1488 620 24 313 364 1297 515 10 274 311 1100 323 300 7 253 883(62.2) (62.7)
17 Nagaland 1275 37 649 603 2526 1082 27 585 568 2234 866 18 520 523 1908 707 465 11 461 1644
2003(BE) 2002(RE) 2001 2000
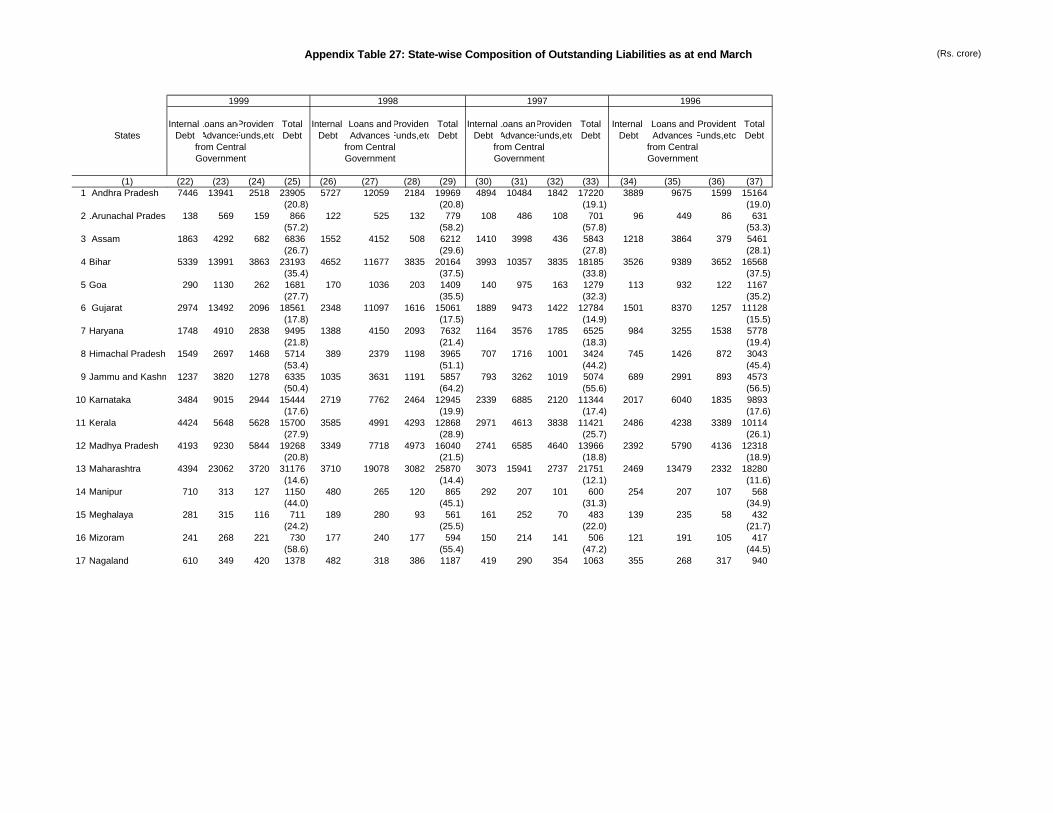
Appendix Table 27: State-wise Composition of Outstanding Liabilities as at end March (Rs. crore)
States
(1)1 Andhra Pradesh
2 .Arunachal Pradesh
3 Assam
4 Bihar
5 Goa
6 Gujarat
7 Haryana
8 Himachal Pradesh
9 Jammu and Kashmir
10 Karnataka
11 Kerala
12 Madhya Pradesh
13 Maharashtra
14 Manipur
15 Meghalaya
16 Mizoram
17 Nagaland
Internal Loans andProvident Total Internal Loans andProvident Total Internal Loans andProvident Total Internal Loans and Provident TotalDebt AdvancesFunds,etc. Debt Debt AdvancesFunds,etc. Debt Debt AdvancesFunds,etc. Debt Debt Advances Funds,etc. Debt
from Central from Central from Central from CentralGovernment Government Government Government
(22) (23) (24) (25) (26) (27) (28) (29) (30) (31) (32) (33) (34) (35) (36) (37)7446 13941 2518 23905 5727 12059 2184 19969 4894 10484 1842 17220 3889 9675 1599 15164
(20.8) (20.8) (19.1) (19.0)138 569 159 866 122 525 132 779 108 486 108 701 96 449 86 631
(57.2) (58.2) (57.8) (53.3)1863 4292 682 6836 1552 4152 508 6212 1410 3998 436 5843 1218 3864 379 5461
(26.7) (29.6) (27.8) (28.1)5339 13991 3863 23193 4652 11677 3835 20164 3993 10357 3835 18185 3526 9389 3652 16568
(35.4) (37.5) (33.8) (37.5)290 1130 262 1681 170 1036 203 1409 140 975 163 1279 113 932 122 1167
(27.7) (35.5) (32.3) (35.2)2974 13492 2096 18561 2348 11097 1616 15061 1889 9473 1422 12784 1501 8370 1257 11128
(17.8) (17.5) (14.9) (15.5)1748 4910 2838 9495 1388 4150 2093 7632 1164 3576 1785 6525 984 3255 1538 5778
(21.8) (21.4) (18.3) (19.4)1549 2697 1468 5714 389 2379 1198 3965 707 1716 1001 3424 745 1426 872 3043
(53.4) (51.1) (44.2) (45.4)1237 3820 1278 6335 1035 3631 1191 5857 793 3262 1019 5074 689 2991 893 4573
(50.4) (64.2) (55.6) (56.5)3484 9015 2944 15444 2719 7762 2464 12945 2339 6885 2120 11344 2017 6040 1835 9893
(17.6) (19.9) (17.4) (17.6)4424 5648 5628 15700 3585 4991 4293 12868 2971 4613 3838 11421 2486 4238 3389 10114
(27.9) (28.9) (25.7) (26.1)4193 9230 5844 19268 3349 7718 4973 16040 2741 6585 4640 13966 2392 5790 4136 12318
(20.8) (21.5) (18.8) (18.9)4394 23062 3720 31176 3710 19078 3082 25870 3073 15941 2737 21751 2469 13479 2332 18280
(14.6) (14.4) (12.1) (11.6)710 313 127 1150 480 265 120 865 292 207 101 600 254 207 107 568
(44.0) (45.1) (31.3) (34.9)281 315 116 711 189 280 93 561 161 252 70 483 139 235 58 432
(24.2) (25.5) (22.0) (21.7)241 268 221 730 177 240 177 594 150 214 141 506 121 191 105 417
(58.6) (55.4) (47.2) (44.5)610 349 420 1378 482 318 386 1187 419 290 354 1063 355 268 317 940
1999 1998 1997 1996
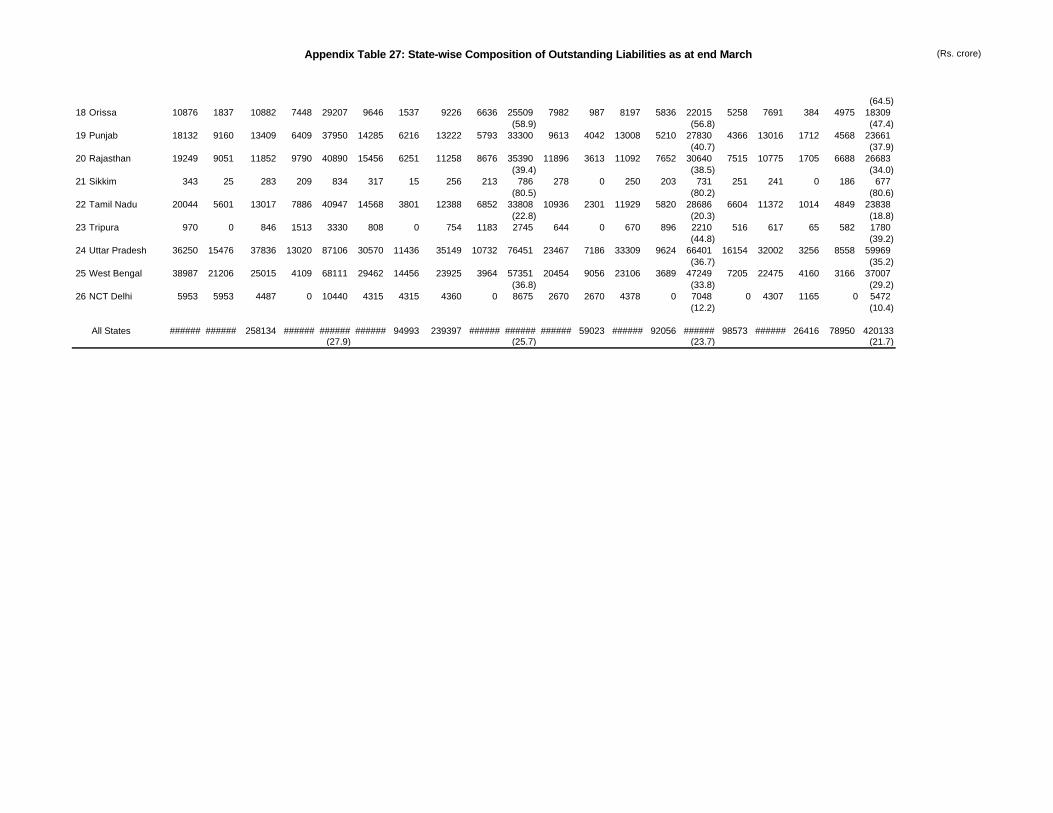
Appendix Table 27: State-wise Composition of Outstanding Liabilities as at end March (Rs. crore)
(64.5)18 Orissa 10876 1837 10882 7448 29207 9646 1537 9226 6636 25509 7982 987 8197 5836 22015 5258 7691 384 4975 18309
(58.9) (56.8) (47.4)19 Punjab 18132 9160 13409 6409 37950 14285 6216 13222 5793 33300 9613 4042 13008 5210 27830 4366 13016 1712 4568 23661
(40.7) (37.9)20 Rajasthan 19249 9051 11852 9790 40890 15456 6251 11258 8676 35390 11896 3613 11092 7652 30640 7515 10775 1705 6688 26683
(39.4) (38.5) (34.0)21 Sikkim 343 25 283 209 834 317 15 256 213 786 278 0 250 203 731 251 241 0 186 677
(80.5) (80.2) (80.6)22 Tamil Nadu 20044 5601 13017 7886 40947 14568 3801 12388 6852 33808 10936 2301 11929 5820 28686 6604 11372 1014 4849 23838
(22.8) (20.3) (18.8)23 Tripura 970 0 846 1513 3330 808 0 754 1183 2745 644 0 670 896 2210 516 617 65 582 1780
(44.8) (39.2)24 Uttar Pradesh 36250 15476 37836 13020 87106 30570 11436 35149 10732 76451 23467 7186 33309 9624 66401 16154 32002 3256 8558 59969
(36.7) (35.2)25 West Bengal 38987 21206 25015 4109 68111 29462 14456 23925 3964 57351 20454 9056 23106 3689 47249 7205 22475 4160 3166 37007
(36.8) (33.8) (29.2)26 NCT Delhi 5953 5953 4487 0 10440 4315 4315 4360 0 8675 2670 2670 4378 0 7048 0 4307 1165 0 5472
(12.2) (10.4)
All States ###### ###### 258134 ###### ###### ###### 94993 239397 ###### ###### ###### 59023 ###### 92056 ###### 98573 ###### 26416 78950 420133(27.9) (25.7) (23.7) (21.7)
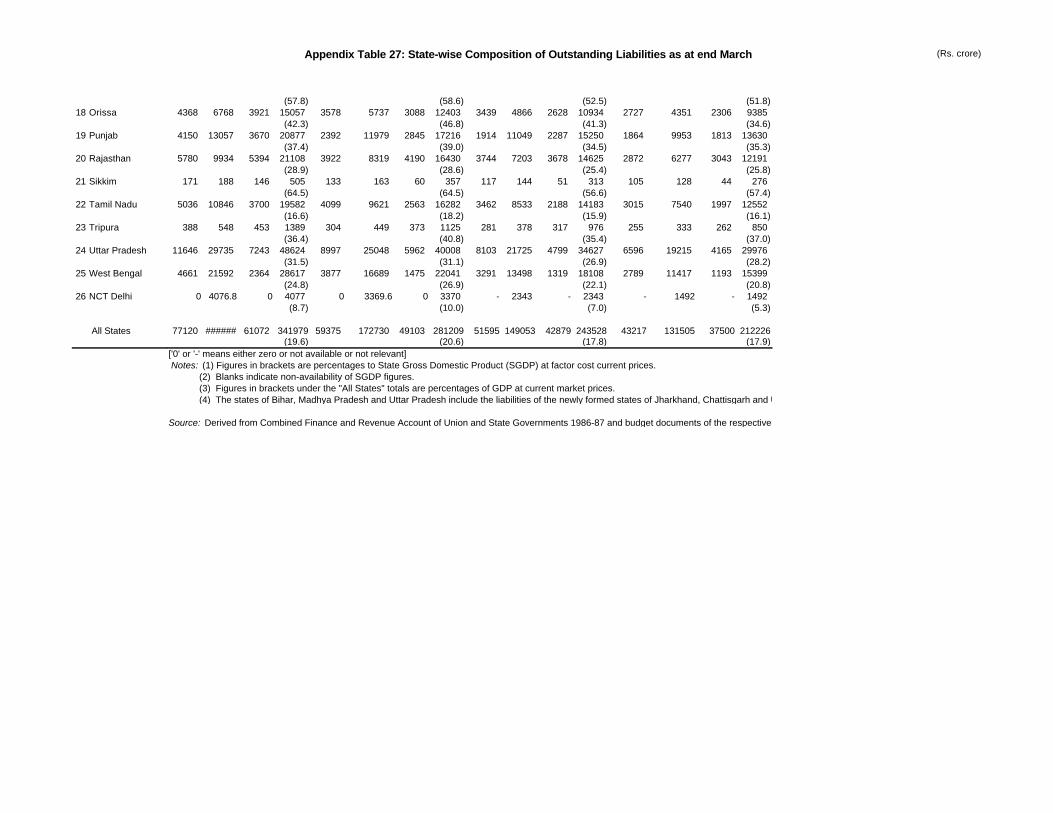
Appendix Table 27: State-wise Composition of Outstanding Liabilities as at end March (Rs. crore)
18 Orissa
19 Punjab
20 Rajasthan
21 Sikkim
22 Tamil Nadu
23 Tripura
24 Uttar Pradesh
25 West Bengal
26 NCT Delhi
All States
(57.8) (58.6) (52.5) (51.8)4368 6768 3921 15057 3578 5737 3088 12403 3439 4866 2628 10934 2727 4351 2306 9385
(42.3) (46.8) (41.3) (34.6)4150 13057 3670 20877 2392 11979 2845 17216 1914 11049 2287 15250 1864 9953 1813 13630
(37.4) (39.0) (34.5) (35.3)5780 9934 5394 21108 3922 8319 4190 16430 3744 7203 3678 14625 2872 6277 3043 12191
(28.9) (28.6) (25.4) (25.8)171 188 146 505 133 163 60 357 117 144 51 313 105 128 44 276
(64.5) (64.5) (56.6) (57.4)5036 10846 3700 19582 4099 9621 2563 16282 3462 8533 2188 14183 3015 7540 1997 12552
(16.6) (18.2) (15.9) (16.1)388 548 453 1389 304 449 373 1125 281 378 317 976 255 333 262 850
(36.4) (40.8) (35.4) (37.0)11646 29735 7243 48624 8997 25048 5962 40008 8103 21725 4799 34627 6596 19215 4165 29976
(31.5) (31.1) (26.9) (28.2)4661 21592 2364 28617 3877 16689 1475 22041 3291 13498 1319 18108 2789 11417 1193 15399
(24.8) (26.9) (22.1) (20.8)0 4076.8 0 4077 0 3369.6 0 3370 - 2343 - 2343 - 1492 - 1492
(8.7) (10.0) (7.0) (5.3)
77120 ###### 61072 341979 59375 172730 49103 281209 51595 149053 42879 243528 43217 131505 37500 212226(19.6) (20.6) (17.8) (17.9)
['0' or '-' means either zero or not available or not relevant] Notes: (1) Figures in brackets are percentages to State Gross Domestic Product (SGDP) at factor cost current prices. (2) Blanks indicate non-availability of SGDP figures. (3) Figures in brackets under the "All States" totals are percentages of GDP at current market prices. (4) The states of Bihar, Madhya Pradesh and Uttar Pradesh include the liabilities of the newly formed states of Jharkhand, Chattisgarh and Uttaranchal respectively.
Source: Derived from Combined Finance and Revenue Account of Union and State Governments 1986-87 and budget documents of the respective State Governments (as per RBI).
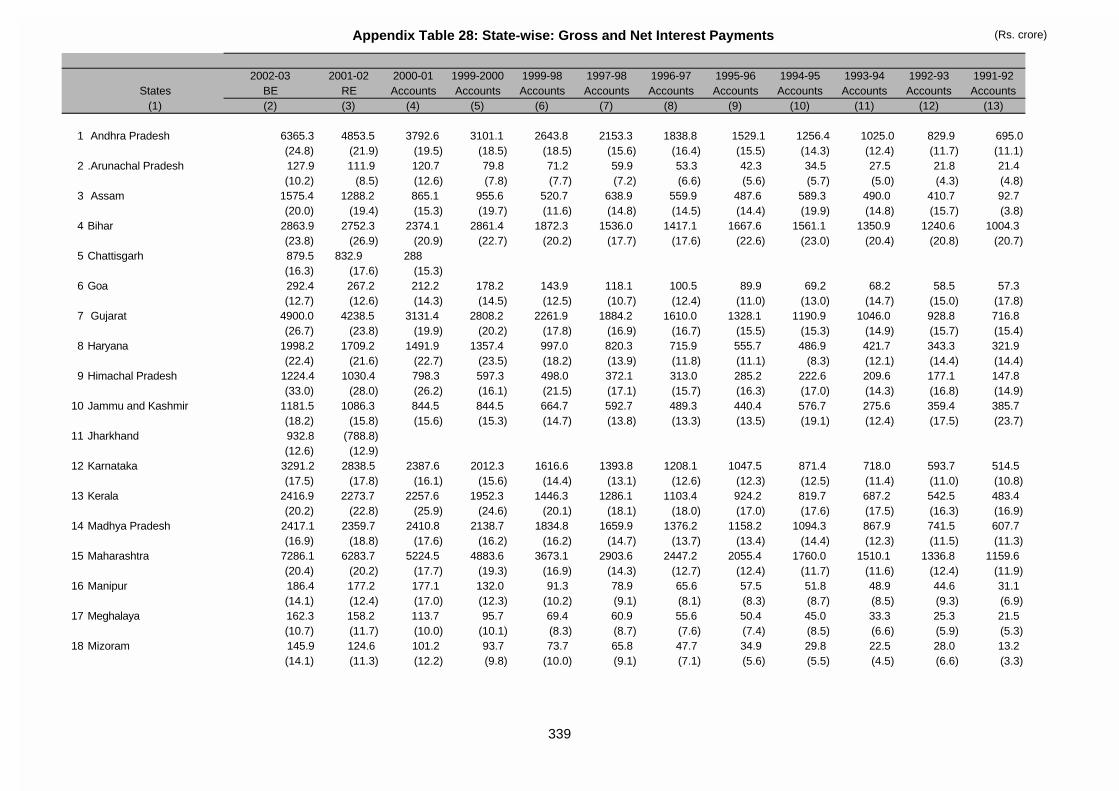
Appendix Table 28: State-wise: Gross and Net Interest Payments (Rs. crore)
2002-03 2001-02 2000-01 1999-2000 1999-98 1997-98 1996-97 1995-96 1994-95 1993-94 1992-93 1991-92States BE RE Accounts Accounts Accounts Accounts Accounts Accounts Accounts Accounts Accounts Accounts
(1) (2) (3) (4) (5) (6) (7) (8) (9) (10) (11) (12) (13)
1 Andhra Pradesh 6365.3 4853.5 3792.6 3101.1 2643.8 2153.3 1838.8 1529.1 1256.4 1025.0 829.9 695.0(24.8) (21.9) (19.5) (18.5) (18.5) (15.6) (16.4) (15.5) (14.3) (12.4) (11.7) (11.1)
2 .Arunachal Pradesh 127.9 111.9 120.7 79.8 71.2 59.9 53.3 42.3 34.5 27.5 21.8 21.4(10.2) (8.5) (12.6) (7.8) (7.7) (7.2) (6.6) (5.6) (5.7) (5.0) (4.3) (4.8)
3 Assam 1575.4 1288.2 865.1 955.6 520.7 638.9 559.9 487.6 589.3 490.0 410.7 92.7(20.0) (19.4) (15.3) (19.7) (11.6) (14.8) (14.5) (14.4) (19.9) (14.8) (15.7) (3.8)
4 Bihar 2863.9 2752.3 2374.1 2861.4 1872.3 1536.0 1417.1 1667.6 1561.1 1350.9 1240.6 1004.3(23.8) (26.9) (20.9) (22.7) (20.2) (17.7) (17.6) (22.6) (23.0) (20.4) (20.8) (20.7)
5 Chattisgarh 879.5 832.9 288(16.3) (17.6) (15.3)
6 Goa 292.4 267.2 212.2 178.2 143.9 118.1 100.5 89.9 69.2 68.2 58.5 57.3(12.7) (12.6) (14.3) (14.5) (12.5) (10.7) (12.4) (11.0) (13.0) (14.7) (15.0) (17.8)
7 Gujarat 4900.0 4238.5 3131.4 2808.2 2261.9 1884.2 1610.0 1328.1 1190.9 1046.0 928.8 716.8(26.7) (23.8) (19.9) (20.2) (17.8) (16.9) (16.7) (15.5) (15.3) (14.9) (15.7) (15.4)
8 Haryana 1998.2 1709.2 1491.9 1357.4 997.0 820.3 715.9 555.7 486.9 421.7 343.3 321.9(22.4) (21.6) (22.7) (23.5) (18.2) (13.9) (11.8) (11.1) (8.3) (12.1) (14.4) (14.4)
9 Himachal Pradesh 1224.4 1030.4 798.3 597.3 498.0 372.1 313.0 285.2 222.6 209.6 177.1 147.8(33.0) (28.0) (26.2) (16.1) (21.5) (17.1) (15.7) (16.3) (17.0) (14.3) (16.8) (14.9)
10 Jammu and Kashmir 1181.5 1086.3 844.5 844.5 664.7 592.7 489.3 440.4 576.7 275.6 359.4 385.7(18.2) (15.8) (15.6) (15.3) (14.7) (13.8) (13.3) (13.5) (19.1) (12.4) (17.5) (23.7)
11 Jharkhand 932.8 (788.8)(12.6) (12.9)
12 Karnataka 3291.2 2838.5 2387.6 2012.3 1616.6 1393.8 1208.1 1047.5 871.4 718.0 593.7 514.5(17.5) (17.8) (16.1) (15.6) (14.4) (13.1) (12.6) (12.3) (12.5) (11.4) (11.0) (10.8)
13 Kerala 2416.9 2273.7 2257.6 1952.3 1446.3 1286.1 1103.4 924.2 819.7 687.2 542.5 483.4(20.2) (22.8) (25.9) (24.6) (20.1) (18.1) (18.0) (17.0) (17.6) (17.5) (16.3) (16.9)
14 Madhya Pradesh 2417.1 2359.7 2410.8 2138.7 1834.8 1659.9 1376.2 1158.2 1094.3 867.9 741.5 607.7(16.9) (18.8) (17.6) (16.2) (16.2) (14.7) (13.7) (13.4) (14.4) (12.3) (11.5) (11.3)
15 Maharashtra 7286.1 6283.7 5224.5 4883.6 3673.1 2903.6 2447.2 2055.4 1760.0 1510.1 1336.8 1159.6(20.4) (20.2) (17.7) (19.3) (16.9) (14.3) (12.7) (12.4) (11.7) (11.6) (12.4) (11.9)
16 Manipur 186.4 177.2 177.1 132.0 91.3 78.9 65.6 57.5 51.8 48.9 44.6 31.1(14.1) (12.4) (17.0) (12.3) (10.2) (9.1) (8.1) (8.3) (8.7) (8.5) (9.3) (6.9)
17 Meghalaya 162.3 158.2 113.7 95.7 69.4 60.9 55.6 50.4 45.0 33.3 25.3 21.5(10.7) (11.7) (10.0) (10.1) (8.3) (8.7) (7.6) (7.4) (8.5) (6.6) (5.9) (5.3)
18 Mizoram 145.9 124.6 101.2 93.7 73.7 65.8 47.7 34.9 29.8 22.5 28.0 13.2(14.1) (11.3) (12.2) (9.8) (10.0) (9.1) (7.1) (5.6) (5.5) (4.5) (6.6) (3.3)
339
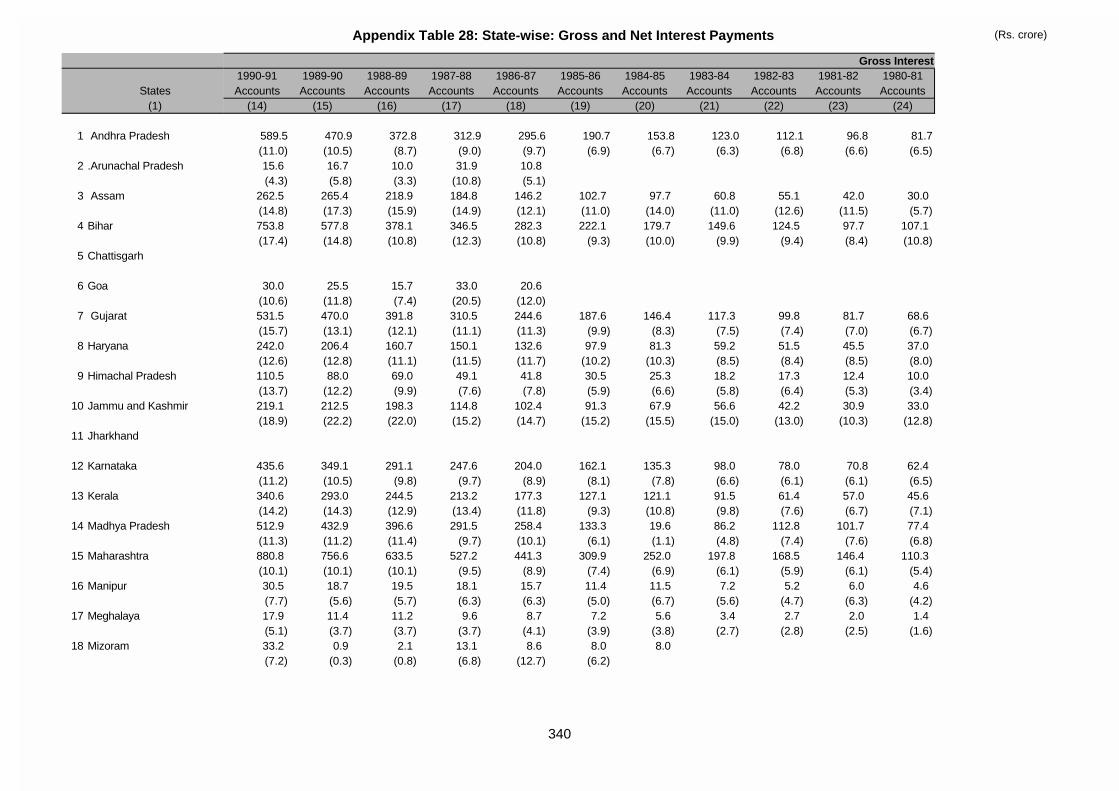
Appendix Table 28: State-wise: Gross and Net Interest Payments (Rs. crore)
States(1)
1 Andhra Pradesh
2 .Arunachal Pradesh
3 Assam
4 Bihar
5 Chattisgarh
6 Goa
7 Gujarat
8 Haryana
9 Himachal Pradesh
10 Jammu and Kashmir
11 Jharkhand
12 Karnataka
13 Kerala
14 Madhya Pradesh
15 Maharashtra
16 Manipur
17 Meghalaya
18 Mizoram
1990-91 1989-90 1988-89 1987-88 1986-87 1985-86 1984-85 1983-84 1982-83 1981-82 1980-81Accounts Accounts Accounts Accounts Accounts Accounts Accounts Accounts Accounts Accounts Accounts
(14) (15) (16) (17) (18) (19) (20) (21) (22) (23) (24)
589.5 470.9 372.8 312.9 295.6 190.7 153.8 123.0 112.1 96.8 81.7(11.0) (10.5) (8.7) (9.0) (9.7) (6.9) (6.7) (6.3) (6.8) (6.6) (6.5)15.6 16.7 10.0 31.9 10.8(4.3) (5.8) (3.3) (10.8) (5.1)
262.5 265.4 218.9 184.8 146.2 102.7 97.7 60.8 55.1 42.0 30.0(14.8) (17.3) (15.9) (14.9) (12.1) (11.0) (14.0) (11.0) (12.6) (11.5) (5.7)753.8 577.8 378.1 346.5 282.3 222.1 179.7 149.6 124.5 97.7 107.1(17.4) (14.8) (10.8) (12.3) (10.8) (9.3) (10.0) (9.9) (9.4) (8.4) (10.8)
30.0 25.5 15.7 33.0 20.6(10.6) (11.8) (7.4) (20.5) (12.0) 531.5 470.0 391.8 310.5 244.6 187.6 146.4 117.3 99.8 81.7 68.6(15.7) (13.1) (12.1) (11.1) (11.3) (9.9) (8.3) (7.5) (7.4) (7.0) (6.7)242.0 206.4 160.7 150.1 132.6 97.9 81.3 59.2 51.5 45.5 37.0(12.6) (12.8) (11.1) (11.5) (11.7) (10.2) (10.3) (8.5) (8.4) (8.5) (8.0)110.5 88.0 69.0 49.1 41.8 30.5 25.3 18.2 17.3 12.4 10.0(13.7) (12.2) (9.9) (7.6) (7.8) (5.9) (6.6) (5.8) (6.4) (5.3) (3.4)219.1 212.5 198.3 114.8 102.4 91.3 67.9 56.6 42.2 30.9 33.0(18.9) (22.2) (22.0) (15.2) (14.7) (15.2) (15.5) (15.0) (13.0) (10.3) (12.8)
435.6 349.1 291.1 247.6 204.0 162.1 135.3 98.0 78.0 70.8 62.4(11.2) (10.5) (9.8) (9.7) (8.9) (8.1) (7.8) (6.6) (6.1) (6.1) (6.5)340.6 293.0 244.5 213.2 177.3 127.1 121.1 91.5 61.4 57.0 45.6(14.2) (14.3) (12.9) (13.4) (11.8) (9.3) (10.8) (9.8) (7.6) (6.7) (7.1)512.9 432.9 396.6 291.5 258.4 133.3 19.6 86.2 112.8 101.7 77.4(11.3) (11.2) (11.4) (9.7) (10.1) (6.1) (1.1) (4.8) (7.4) (7.6) (6.8)880.8 756.6 633.5 527.2 441.3 309.9 252.0 197.8 168.5 146.4 110.3(10.1) (10.1) (10.1) (9.5) (8.9) (7.4) (6.9) (6.1) (5.9) (6.1) (5.4)30.5 18.7 19.5 18.1 15.7 11.4 11.5 7.2 5.2 6.0 4.6(7.7) (5.6) (5.7) (6.3) (6.3) (5.0) (6.7) (5.6) (4.7) (6.3) (4.2)17.9 11.4 11.2 9.6 8.7 7.2 5.6 3.4 2.7 2.0 1.4(5.1) (3.7) (3.7) (3.7) (4.1) (3.9) (3.8) (2.7) (2.8) (2.5) (1.6)33.2 0.9 2.1 13.1 8.6 8.0 8.0(7.2) (0.3) (0.8) (6.8) (12.7) (6.2)
Gross Interest
340
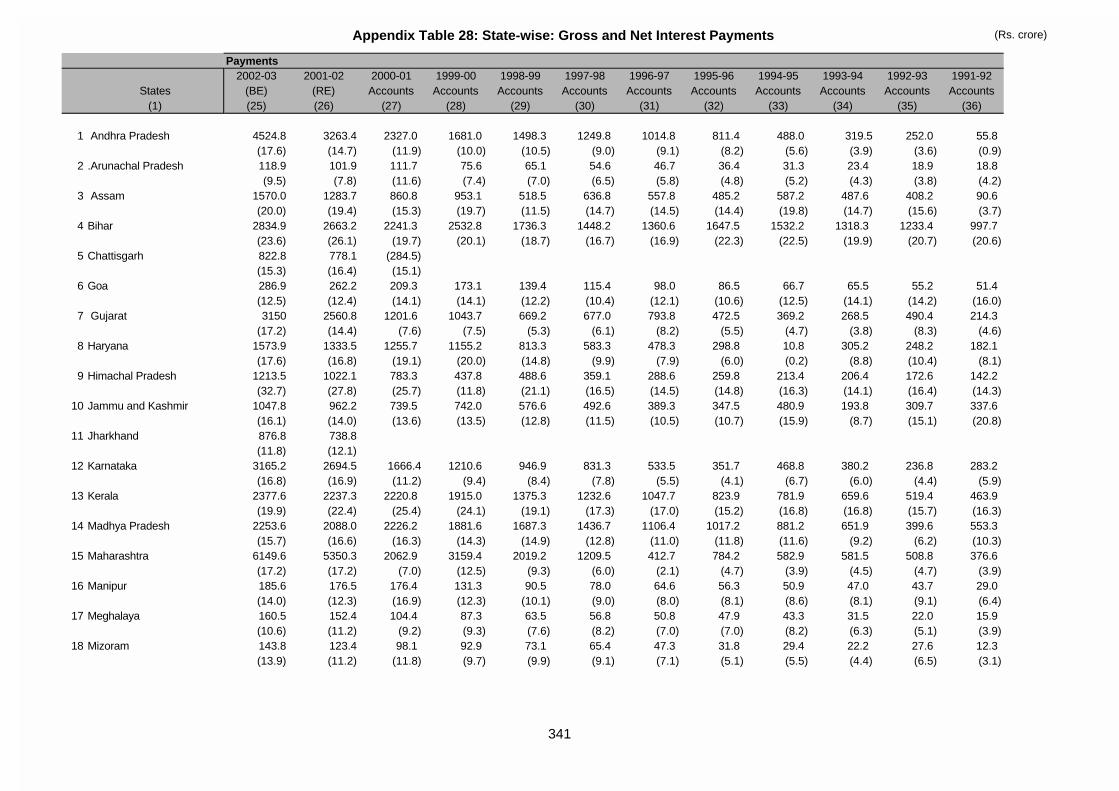
Appendix Table 28: State-wise: Gross and Net Interest Payments (Rs. crore)
States(1)
1 Andhra Pradesh
2 .Arunachal Pradesh
3 Assam
4 Bihar
5 Chattisgarh
6 Goa
7 Gujarat
8 Haryana
9 Himachal Pradesh
10 Jammu and Kashmir
11 Jharkhand
12 Karnataka
13 Kerala
14 Madhya Pradesh
15 Maharashtra
16 Manipur
17 Meghalaya
18 Mizoram
2002-03 2001-02 2000-01 1999-00 1998-99 1997-98 1996-97 1995-96 1994-95 1993-94 1992-93 1991-92(BE) (RE) Accounts Accounts Accounts Accounts Accounts Accounts Accounts Accounts Accounts Accounts(25) (26) (27) (28) (29) (30) (31) (32) (33) (34) (35) (36)
4524.8 3263.4 2327.0 1681.0 1498.3 1249.8 1014.8 811.4 488.0 319.5 252.0 55.8(17.6) (14.7) (11.9) (10.0) (10.5) (9.0) (9.1) (8.2) (5.6) (3.9) (3.6) (0.9)118.9 101.9 111.7 75.6 65.1 54.6 46.7 36.4 31.3 23.4 18.9 18.8(9.5) (7.8) (11.6) (7.4) (7.0) (6.5) (5.8) (4.8) (5.2) (4.3) (3.8) (4.2)
1570.0 1283.7 860.8 953.1 518.5 636.8 557.8 485.2 587.2 487.6 408.2 90.6(20.0) (19.4) (15.3) (19.7) (11.5) (14.7) (14.5) (14.4) (19.8) (14.7) (15.6) (3.7)
2834.9 2663.2 2241.3 2532.8 1736.3 1448.2 1360.6 1647.5 1532.2 1318.3 1233.4 997.7(23.6) (26.1) (19.7) (20.1) (18.7) (16.7) (16.9) (22.3) (22.5) (19.9) (20.7) (20.6)822.8 778.1 (284.5)(15.3) (16.4) (15.1)286.9 262.2 209.3 173.1 139.4 115.4 98.0 86.5 66.7 65.5 55.2 51.4(12.5) (12.4) (14.1) (14.1) (12.2) (10.4) (12.1) (10.6) (12.5) (14.1) (14.2) (16.0)3150 2560.8 1201.6 1043.7 669.2 677.0 793.8 472.5 369.2 268.5 490.4 214.3
(17.2) (14.4) (7.6) (7.5) (5.3) (6.1) (8.2) (5.5) (4.7) (3.8) (8.3) (4.6)1573.9 1333.5 1255.7 1155.2 813.3 583.3 478.3 298.8 10.8 305.2 248.2 182.1(17.6) (16.8) (19.1) (20.0) (14.8) (9.9) (7.9) (6.0) (0.2) (8.8) (10.4) (8.1)
1213.5 1022.1 783.3 437.8 488.6 359.1 288.6 259.8 213.4 206.4 172.6 142.2(32.7) (27.8) (25.7) (11.8) (21.1) (16.5) (14.5) (14.8) (16.3) (14.1) (16.4) (14.3)
1047.8 962.2 739.5 742.0 576.6 492.6 389.3 347.5 480.9 193.8 309.7 337.6(16.1) (14.0) (13.6) (13.5) (12.8) (11.5) (10.5) (10.7) (15.9) (8.7) (15.1) (20.8)876.8 738.8(11.8) (12.1)
3165.2 2694.5 1666.4 1210.6 946.9 831.3 533.5 351.7 468.8 380.2 236.8 283.2(16.8) (16.9) (11.2) (9.4) (8.4) (7.8) (5.5) (4.1) (6.7) (6.0) (4.4) (5.9)
2377.6 2237.3 2220.8 1915.0 1375.3 1232.6 1047.7 823.9 781.9 659.6 519.4 463.9(19.9) (22.4) (25.4) (24.1) (19.1) (17.3) (17.0) (15.2) (16.8) (16.8) (15.7) (16.3)
2253.6 2088.0 2226.2 1881.6 1687.3 1436.7 1106.4 1017.2 881.2 651.9 399.6 553.3(15.7) (16.6) (16.3) (14.3) (14.9) (12.8) (11.0) (11.8) (11.6) (9.2) (6.2) (10.3)
6149.6 5350.3 2062.9 3159.4 2019.2 1209.5 412.7 784.2 582.9 581.5 508.8 376.6(17.2) (17.2) (7.0) (12.5) (9.3) (6.0) (2.1) (4.7) (3.9) (4.5) (4.7) (3.9)185.6 176.5 176.4 131.3 90.5 78.0 64.6 56.3 50.9 47.0 43.7 29.0(14.0) (12.3) (16.9) (12.3) (10.1) (9.0) (8.0) (8.1) (8.6) (8.1) (9.1) (6.4)160.5 152.4 104.4 87.3 63.5 56.8 50.8 47.9 43.3 31.5 22.0 15.9(10.6) (11.2) (9.2) (9.3) (7.6) (8.2) (7.0) (7.0) (8.2) (6.3) (5.1) (3.9)143.8 123.4 98.1 92.9 73.1 65.4 47.3 31.8 29.4 22.2 27.6 12.3(13.9) (11.2) (11.8) (9.7) (9.9) (9.1) (7.1) (5.1) (5.5) (4.4) (6.5) (3.1)
Payments
341
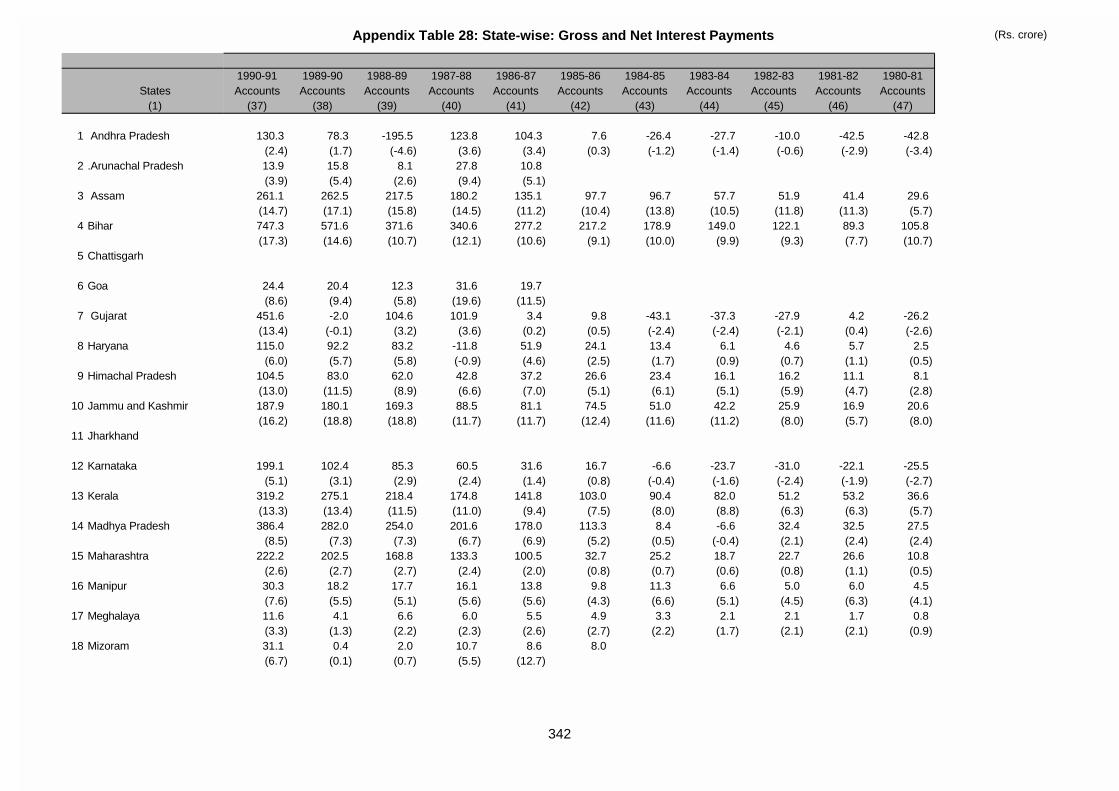
Appendix Table 28: State-wise: Gross and Net Interest Payments (Rs. crore)
States(1)
1 Andhra Pradesh
2 .Arunachal Pradesh
3 Assam
4 Bihar
5 Chattisgarh
6 Goa
7 Gujarat
8 Haryana
9 Himachal Pradesh
10 Jammu and Kashmir
11 Jharkhand
12 Karnataka
13 Kerala
14 Madhya Pradesh
15 Maharashtra
16 Manipur
17 Meghalaya
18 Mizoram
1990-91 1989-90 1988-89 1987-88 1986-87 1985-86 1984-85 1983-84 1982-83 1981-82 1980-81Accounts Accounts Accounts Accounts Accounts Accounts Accounts Accounts Accounts Accounts Accounts
(37) (38) (39) (40) (41) (42) (43) (44) (45) (46) (47)
130.3 78.3 -195.5 123.8 104.3 7.6 -26.4 -27.7 -10.0 -42.5 -42.8(2.4) (1.7) (-4.6) (3.6) (3.4) (0.3) (-1.2) (-1.4) (-0.6) (-2.9) (-3.4)13.9 15.8 8.1 27.8 10.8 (3.9) (5.4) (2.6) (9.4) (5.1)
261.1 262.5 217.5 180.2 135.1 97.7 96.7 57.7 51.9 41.4 29.6(14.7) (17.1) (15.8) (14.5) (11.2) (10.4) (13.8) (10.5) (11.8) (11.3) (5.7)747.3 571.6 371.6 340.6 277.2 217.2 178.9 149.0 122.1 89.3 105.8(17.3) (14.6) (10.7) (12.1) (10.6) (9.1) (10.0) (9.9) (9.3) (7.7) (10.7)
24.4 20.4 12.3 31.6 19.7 (8.6) (9.4) (5.8) (19.6) (11.5)
451.6 -2.0 104.6 101.9 3.4 9.8 -43.1 -37.3 -27.9 4.2 -26.2(13.4) (-0.1) (3.2) (3.6) (0.2) (0.5) (-2.4) (-2.4) (-2.1) (0.4) (-2.6)115.0 92.2 83.2 -11.8 51.9 24.1 13.4 6.1 4.6 5.7 2.5
(6.0) (5.7) (5.8) (-0.9) (4.6) (2.5) (1.7) (0.9) (0.7) (1.1) (0.5)104.5 83.0 62.0 42.8 37.2 26.6 23.4 16.1 16.2 11.1 8.1(13.0) (11.5) (8.9) (6.6) (7.0) (5.1) (6.1) (5.1) (5.9) (4.7) (2.8)187.9 180.1 169.3 88.5 81.1 74.5 51.0 42.2 25.9 16.9 20.6(16.2) (18.8) (18.8) (11.7) (11.7) (12.4) (11.6) (11.2) (8.0) (5.7) (8.0)
199.1 102.4 85.3 60.5 31.6 16.7 -6.6 -23.7 -31.0 -22.1 -25.5(5.1) (3.1) (2.9) (2.4) (1.4) (0.8) (-0.4) (-1.6) (-2.4) (-1.9) (-2.7)
319.2 275.1 218.4 174.8 141.8 103.0 90.4 82.0 51.2 53.2 36.6(13.3) (13.4) (11.5) (11.0) (9.4) (7.5) (8.0) (8.8) (6.3) (6.3) (5.7)386.4 282.0 254.0 201.6 178.0 113.3 8.4 -6.6 32.4 32.5 27.5
(8.5) (7.3) (7.3) (6.7) (6.9) (5.2) (0.5) (-0.4) (2.1) (2.4) (2.4)222.2 202.5 168.8 133.3 100.5 32.7 25.2 18.7 22.7 26.6 10.8
(2.6) (2.7) (2.7) (2.4) (2.0) (0.8) (0.7) (0.6) (0.8) (1.1) (0.5)30.3 18.2 17.7 16.1 13.8 9.8 11.3 6.6 5.0 6.0 4.5(7.6) (5.5) (5.1) (5.6) (5.6) (4.3) (6.6) (5.1) (4.5) (6.3) (4.1)11.6 4.1 6.6 6.0 5.5 4.9 3.3 2.1 2.1 1.7 0.8(3.3) (1.3) (2.2) (2.3) (2.6) (2.7) (2.2) (1.7) (2.1) (2.1) (0.9)31.1 0.4 2.0 10.7 8.6 8.0 (6.7) (0.1) (0.7) (5.5) (12.7)
342
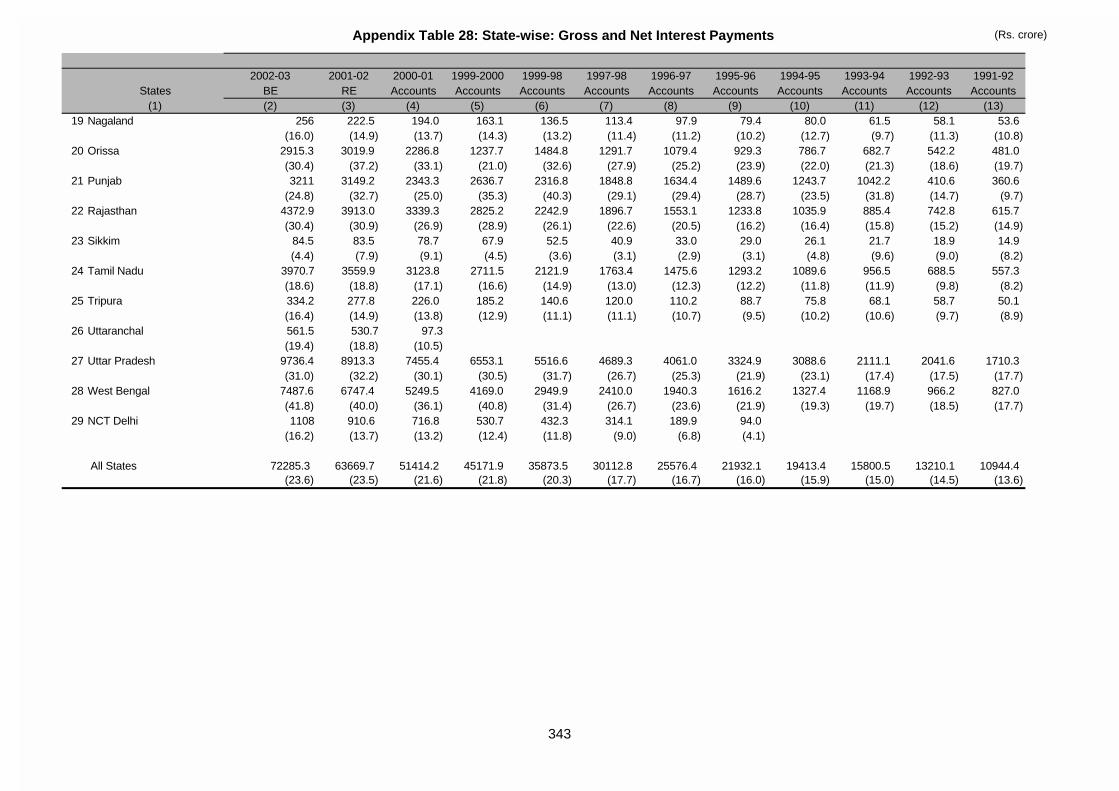
Appendix Table 28: State-wise: Gross and Net Interest Payments (Rs. crore)
2002-03 2001-02 2000-01 1999-2000 1999-98 1997-98 1996-97 1995-96 1994-95 1993-94 1992-93 1991-92States BE RE Accounts Accounts Accounts Accounts Accounts Accounts Accounts Accounts Accounts Accounts
(1) (2) (3) (4) (5) (6) (7) (8) (9) (10) (11) (12) (13)19 Nagaland 256 222.5 194.0 163.1 136.5 113.4 97.9 79.4 80.0 61.5 58.1 53.6
(16.0) (14.9) (13.7) (14.3) (13.2) (11.4) (11.2) (10.2) (12.7) (9.7) (11.3) (10.8)20 Orissa 2915.3 3019.9 2286.8 1237.7 1484.8 1291.7 1079.4 929.3 786.7 682.7 542.2 481.0
(30.4) (37.2) (33.1) (21.0) (32.6) (27.9) (25.2) (23.9) (22.0) (21.3) (18.6) (19.7)21 Punjab 3211 3149.2 2343.3 2636.7 2316.8 1848.8 1634.4 1489.6 1243.7 1042.2 410.6 360.6
(24.8) (32.7) (25.0) (35.3) (40.3) (29.1) (29.4) (28.7) (23.5) (31.8) (14.7) (9.7)22 Rajasthan 4372.9 3913.0 3339.3 2825.2 2242.9 1896.7 1553.1 1233.8 1035.9 885.4 742.8 615.7
(30.4) (30.9) (26.9) (28.9) (26.1) (22.6) (20.5) (16.2) (16.4) (15.8) (15.2) (14.9)23 Sikkim 84.5 83.5 78.7 67.9 52.5 40.9 33.0 29.0 26.1 21.7 18.9 14.9
(4.4) (7.9) (9.1) (4.5) (3.6) (3.1) (2.9) (3.1) (4.8) (9.6) (9.0) (8.2)24 Tamil Nadu 3970.7 3559.9 3123.8 2711.5 2121.9 1763.4 1475.6 1293.2 1089.6 956.5 688.5 557.3
(18.6) (18.8) (17.1) (16.6) (14.9) (13.0) (12.3) (12.2) (11.8) (11.9) (9.8) (8.2)25 Tripura 334.2 277.8 226.0 185.2 140.6 120.0 110.2 88.7 75.8 68.1 58.7 50.1
(16.4) (14.9) (13.8) (12.9) (11.1) (11.1) (10.7) (9.5) (10.2) (10.6) (9.7) (8.9)26 Uttaranchal 561.5 530.7 97.3
(19.4) (18.8) (10.5)27 Uttar Pradesh 9736.4 8913.3 7455.4 6553.1 5516.6 4689.3 4061.0 3324.9 3088.6 2111.1 2041.6 1710.3
(31.0) (32.2) (30.1) (30.5) (31.7) (26.7) (25.3) (21.9) (23.1) (17.4) (17.5) (17.7)28 West Bengal 7487.6 6747.4 5249.5 4169.0 2949.9 2410.0 1940.3 1616.2 1327.4 1168.9 966.2 827.0
(41.8) (40.0) (36.1) (40.8) (31.4) (26.7) (23.6) (21.9) (19.3) (19.7) (18.5) (17.7)29 NCT Delhi 1108 910.6 716.8 530.7 432.3 314.1 189.9 94.0
(16.2) (13.7) (13.2) (12.4) (11.8) (9.0) (6.8) (4.1)
All States 72285.3 63669.7 51414.2 45171.9 35873.5 30112.8 25576.4 21932.1 19413.4 15800.5 13210.1 10944.4(23.6) (23.5) (21.6) (21.8) (20.3) (17.7) (16.7) (16.0) (15.9) (15.0) (14.5) (13.6)
343
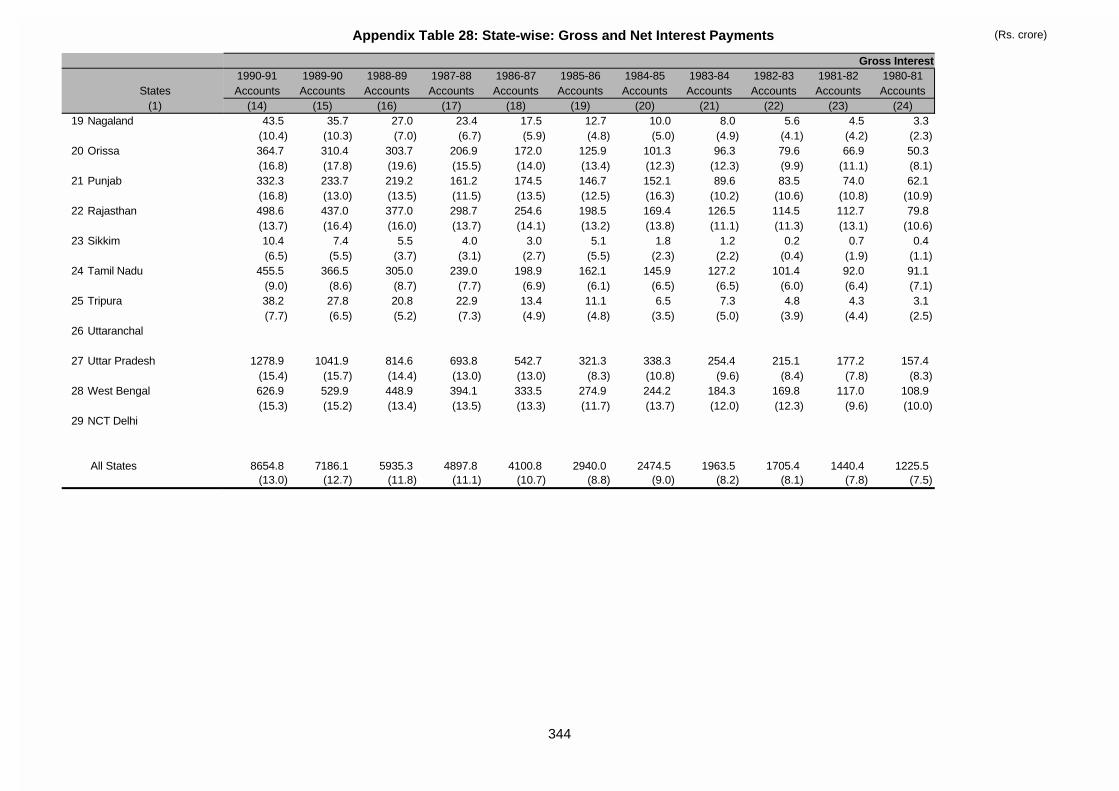
Appendix Table 28: State-wise: Gross and Net Interest Payments (Rs. crore)
States(1)
19 Nagaland
20 Orissa
21 Punjab
22 Rajasthan
23 Sikkim
24 Tamil Nadu
25 Tripura
26 Uttaranchal
27 Uttar Pradesh
28 West Bengal
29 NCT Delhi
All States
1990-91 1989-90 1988-89 1987-88 1986-87 1985-86 1984-85 1983-84 1982-83 1981-82 1980-81Accounts Accounts Accounts Accounts Accounts Accounts Accounts Accounts Accounts Accounts Accounts
(14) (15) (16) (17) (18) (19) (20) (21) (22) (23) (24)
Gross Interest
43.5 35.7 27.0 23.4 17.5 12.7 10.0 8.0 5.6 4.5 3.3(10.4) (10.3) (7.0) (6.7) (5.9) (4.8) (5.0) (4.9) (4.1) (4.2) (2.3)364.7 310.4 303.7 206.9 172.0 125.9 101.3 96.3 79.6 66.9 50.3(16.8) (17.8) (19.6) (15.5) (14.0) (13.4) (12.3) (12.3) (9.9) (11.1) (8.1)332.3 233.7 219.2 161.2 174.5 146.7 152.1 89.6 83.5 74.0 62.1(16.8) (13.0) (13.5) (11.5) (13.5) (12.5) (16.3) (10.2) (10.6) (10.8) (10.9)498.6 437.0 377.0 298.7 254.6 198.5 169.4 126.5 114.5 112.7 79.8(13.7) (16.4) (16.0) (13.7) (14.1) (13.2) (13.8) (11.1) (11.3) (13.1) (10.6)10.4 7.4 5.5 4.0 3.0 5.1 1.8 1.2 0.2 0.7 0.4(6.5) (5.5) (3.7) (3.1) (2.7) (5.5) (2.3) (2.2) (0.4) (1.9) (1.1)
455.5 366.5 305.0 239.0 198.9 162.1 145.9 127.2 101.4 92.0 91.1(9.0) (8.6) (8.7) (7.7) (6.9) (6.1) (6.5) (6.5) (6.0) (6.4) (7.1)38.2 27.8 20.8 22.9 13.4 11.1 6.5 7.3 4.8 4.3 3.1(7.7) (6.5) (5.2) (7.3) (4.9) (4.8) (3.5) (5.0) (3.9) (4.4) (2.5)
1278.9 1041.9 814.6 693.8 542.7 321.3 338.3 254.4 215.1 177.2 157.4(15.4) (15.7) (14.4) (13.0) (13.0) (8.3) (10.8) (9.6) (8.4) (7.8) (8.3)626.9 529.9 448.9 394.1 333.5 274.9 244.2 184.3 169.8 117.0 108.9(15.3) (15.2) (13.4) (13.5) (13.3) (11.7) (13.7) (12.0) (12.3) (9.6) (10.0)
8654.8 7186.1 5935.3 4897.8 4100.8 2940.0 2474.5 1963.5 1705.4 1440.4 1225.5(13.0) (12.7) (11.8) (11.1) (10.7) (8.8) (9.0) (8.2) (8.1) (7.8) (7.5)
344
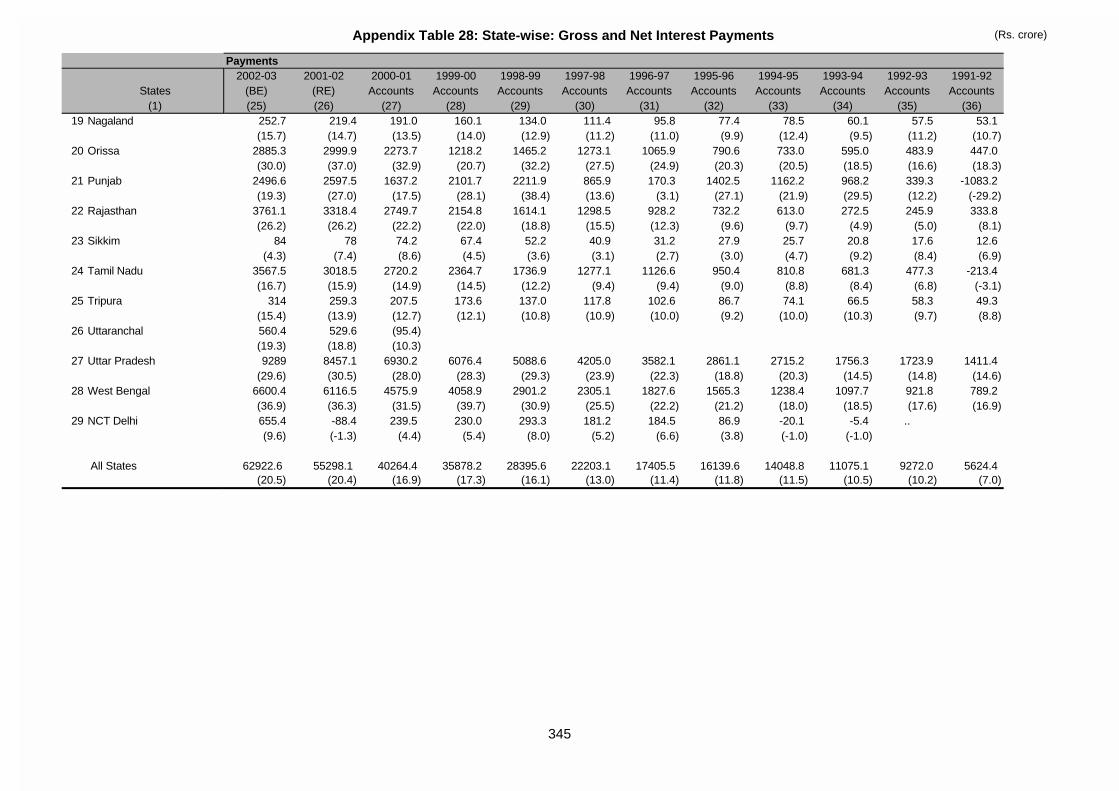
Appendix Table 28: State-wise: Gross and Net Interest Payments (Rs. crore)
States(1)
19 Nagaland
20 Orissa
21 Punjab
22 Rajasthan
23 Sikkim
24 Tamil Nadu
25 Tripura
26 Uttaranchal
27 Uttar Pradesh
28 West Bengal
29 NCT Delhi
All States
2002-03 2001-02 2000-01 1999-00 1998-99 1997-98 1996-97 1995-96 1994-95 1993-94 1992-93 1991-92(BE) (RE) Accounts Accounts Accounts Accounts Accounts Accounts Accounts Accounts Accounts Accounts(25) (26) (27) (28) (29) (30) (31) (32) (33) (34) (35) (36)
Payments
252.7 219.4 191.0 160.1 134.0 111.4 95.8 77.4 78.5 60.1 57.5 53.1(15.7) (14.7) (13.5) (14.0) (12.9) (11.2) (11.0) (9.9) (12.4) (9.5) (11.2) (10.7)
2885.3 2999.9 2273.7 1218.2 1465.2 1273.1 1065.9 790.6 733.0 595.0 483.9 447.0(30.0) (37.0) (32.9) (20.7) (32.2) (27.5) (24.9) (20.3) (20.5) (18.5) (16.6) (18.3)
2496.6 2597.5 1637.2 2101.7 2211.9 865.9 170.3 1402.5 1162.2 968.2 339.3 -1083.2(19.3) (27.0) (17.5) (28.1) (38.4) (13.6) (3.1) (27.1) (21.9) (29.5) (12.2) (-29.2)
3761.1 3318.4 2749.7 2154.8 1614.1 1298.5 928.2 732.2 613.0 272.5 245.9 333.8(26.2) (26.2) (22.2) (22.0) (18.8) (15.5) (12.3) (9.6) (9.7) (4.9) (5.0) (8.1)
84 78 74.2 67.4 52.2 40.9 31.2 27.9 25.7 20.8 17.6 12.6(4.3) (7.4) (8.6) (4.5) (3.6) (3.1) (2.7) (3.0) (4.7) (9.2) (8.4) (6.9)
3567.5 3018.5 2720.2 2364.7 1736.9 1277.1 1126.6 950.4 810.8 681.3 477.3 -213.4(16.7) (15.9) (14.9) (14.5) (12.2) (9.4) (9.4) (9.0) (8.8) (8.4) (6.8) (-3.1)
314 259.3 207.5 173.6 137.0 117.8 102.6 86.7 74.1 66.5 58.3 49.3(15.4) (13.9) (12.7) (12.1) (10.8) (10.9) (10.0) (9.2) (10.0) (10.3) (9.7) (8.8)560.4 529.6 (95.4)(19.3) (18.8) (10.3)9289 8457.1 6930.2 6076.4 5088.6 4205.0 3582.1 2861.1 2715.2 1756.3 1723.9 1411.4
(29.6) (30.5) (28.0) (28.3) (29.3) (23.9) (22.3) (18.8) (20.3) (14.5) (14.8) (14.6)6600.4 6116.5 4575.9 4058.9 2901.2 2305.1 1827.6 1565.3 1238.4 1097.7 921.8 789.2(36.9) (36.3) (31.5) (39.7) (30.9) (25.5) (22.2) (21.2) (18.0) (18.5) (17.6) (16.9)655.4 -88.4 239.5 230.0 293.3 181.2 184.5 86.9 -20.1 -5.4 ..(9.6) (-1.3) (4.4) (5.4) (8.0) (5.2) (6.6) (3.8) (-1.0) (-1.0)
62922.6 55298.1 40264.4 35878.2 28395.6 22203.1 17405.5 16139.6 14048.8 11075.1 9272.0 5624.4(20.5) (20.4) (16.9) (17.3) (16.1) (13.0) (11.4) (11.8) (11.5) (10.5) (10.2) (7.0)
345
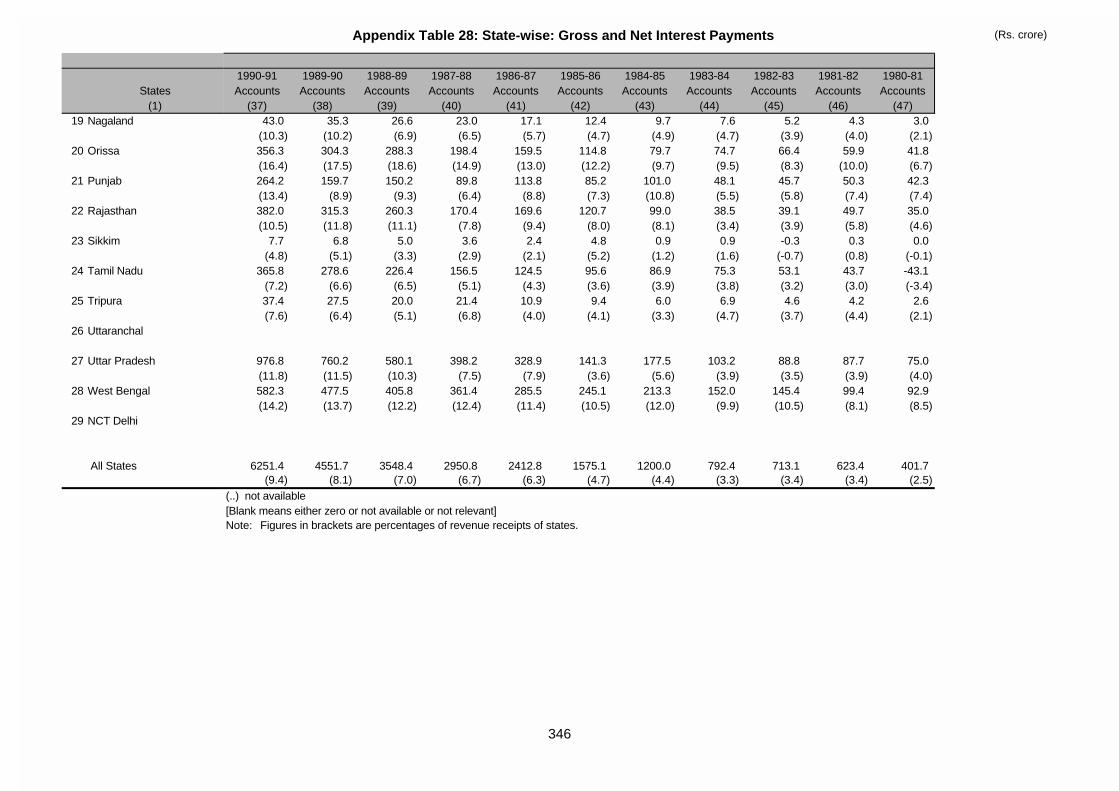
Appendix Table 28: State-wise: Gross and Net Interest Payments (Rs. crore)
States(1)
19 Nagaland
20 Orissa
21 Punjab
22 Rajasthan
23 Sikkim
24 Tamil Nadu
25 Tripura
26 Uttaranchal
27 Uttar Pradesh
28 West Bengal
29 NCT Delhi
All States
1990-91 1989-90 1988-89 1987-88 1986-87 1985-86 1984-85 1983-84 1982-83 1981-82 1980-81Accounts Accounts Accounts Accounts Accounts Accounts Accounts Accounts Accounts Accounts Accounts
(37) (38) (39) (40) (41) (42) (43) (44) (45) (46) (47)43.0 35.3 26.6 23.0 17.1 12.4 9.7 7.6 5.2 4.3 3.0
(10.3) (10.2) (6.9) (6.5) (5.7) (4.7) (4.9) (4.7) (3.9) (4.0) (2.1)356.3 304.3 288.3 198.4 159.5 114.8 79.7 74.7 66.4 59.9 41.8(16.4) (17.5) (18.6) (14.9) (13.0) (12.2) (9.7) (9.5) (8.3) (10.0) (6.7)264.2 159.7 150.2 89.8 113.8 85.2 101.0 48.1 45.7 50.3 42.3(13.4) (8.9) (9.3) (6.4) (8.8) (7.3) (10.8) (5.5) (5.8) (7.4) (7.4)382.0 315.3 260.3 170.4 169.6 120.7 99.0 38.5 39.1 49.7 35.0(10.5) (11.8) (11.1) (7.8) (9.4) (8.0) (8.1) (3.4) (3.9) (5.8) (4.6)
7.7 6.8 5.0 3.6 2.4 4.8 0.9 0.9 -0.3 0.3 0.0(4.8) (5.1) (3.3) (2.9) (2.1) (5.2) (1.2) (1.6) (-0.7) (0.8) (-0.1)
365.8 278.6 226.4 156.5 124.5 95.6 86.9 75.3 53.1 43.7 -43.1(7.2) (6.6) (6.5) (5.1) (4.3) (3.6) (3.9) (3.8) (3.2) (3.0) (-3.4)37.4 27.5 20.0 21.4 10.9 9.4 6.0 6.9 4.6 4.2 2.6(7.6) (6.4) (5.1) (6.8) (4.0) (4.1) (3.3) (4.7) (3.7) (4.4) (2.1)
976.8 760.2 580.1 398.2 328.9 141.3 177.5 103.2 88.8 87.7 75.0(11.8) (11.5) (10.3) (7.5) (7.9) (3.6) (5.6) (3.9) (3.5) (3.9) (4.0)582.3 477.5 405.8 361.4 285.5 245.1 213.3 152.0 145.4 99.4 92.9(14.2) (13.7) (12.2) (12.4) (11.4) (10.5) (12.0) (9.9) (10.5) (8.1) (8.5)
6251.4 4551.7 3548.4 2950.8 2412.8 1575.1 1200.0 792.4 713.1 623.4 401.7
(9.4) (8.1) (7.0) (6.7) (6.3) (4.7) (4.4) (3.3) (3.4) (3.4) (2.5)(..) not available[Blank means either zero or not available or not relevant]Note: Figures in brackets are percentages of revenue receipts of states.
346
Related Documents