Voltage Event Detection and Characterization Methods: A Comparative Study commonly used methods of detection and analysis of voltage events in power systems. The performance of the rms method, the fundamental component estimation using Discrete Fourier Transform and Kalman filtering and the use of wavelet analysis for detection and estimation of magnitude and duration of voltage events, are studied under simulation using voltage dips of different magnitude, duration and point-on-wave of beginning in a pure sinusoidal voltage supply and also for a voltage supply with different harmonic distortion levels. The methods employed are also tested using real voltage events measured in a low- voltage distribution system discussing the results obtained. Index Terms—Fourier Transform, Kalman filtering, Power Quality, RMS, Wavelets. I. INTRODUCTION Voltage events, defined as an abnormal and temporary variation of the magnitude of voltage supply, are one of the most important power quality disturbances in power systems because of their frequency of occurrence and the economical impact on commercial and industrial customers. The magnitude of voltage supply during a voltage event can be computed using the r.m.s. magnitude, the fundamental component magnitude or the peak voltage magnitude. The use of any of these three methods will produce the same results in the case of a pure sinusoidal voltage supply, but the presence of harmonics and other disturbances in voltage waveforms could produce different results depending on the signal processing method used. The paper presents a comparative study of the most common methods used for voltage event detection and characterization in power systems: the r.m.s. method, DFT method, Kalman filtering and the wavelet analysis method. II. REVIEW OF VOLTAGE EVENT DETECTION AND CLASSIFICATION METHODS This section reviews the performance of the main signal processing methods used in voltage event detection and analysis. A. RMS method The most common processing tool used for voltage measurement in power system is the calculation of the root mean square voltage. This work was supported by the Spanish Ministry of Science and Technology under grant DPI 2003-08869-C02. E. Pérez and J. Barros are with the Department of Electronics and Computers, University of Cantabria, Santander, Spain 39005. (e-mail: [email protected]). The main advantage of this method is its simplicity but the main drawback is the dependency on the window length and the time interval for updating the values. Depending on the selection of these two parameters, the magnitude and the duration of a voltage event can be very different [1]-[3]. IEC Standard 61000-4-30 has proposed the U rms(1/2) magnitude as the basic measurement of a voltage event [4]. This magnitude is defined as “the r.m.s. voltage measured over 1 cycle, commencing at a fundamental zero crossing, and refreshed each half-cycle”. According to this standard, the voltage dip begins when the U rms(1/2) magnitude goes below the dip threshold and ends when this magnitude is equal to or above the dip threshold plus the hysteresis voltage. The efficiency in the detection and in the estimation of the magnitude and duration of voltage events using the U rms(1/2) method has been studied in [5]. As any other r.m.s. method, it is simple and easy to implement, but shows a limited performance in the detection of voltage events and in the estimation of its magnitude and duration, especially for short duration and less severe voltage events. Another limitation of this method is that no phase-angle information nor the point- on-wave where the event starts is given. B. DFT method The traditional method to obtain the fundamental and harmonic components of a signal in a digital system is the application of the Discrete Fourier Transform (DFT) to the samples of the signal taken in a time window. As is well known, the results obtained using DFT are incorrect in the case of non-stationary signals, as is the case of the voltage waveform in an event. A way to overcome this problem is the use of the Short Time Fourier Transform (STFT). The STFT partitions the signal into time segments where the signal is considered stationary, applying the DFT within each segment. Once the size of the time window is selected, the time-frequency resolution obtained is fixed and it is the same for the whole frequency spectrum of the signal. To obtain different resolutions in different parts of the spectra it would be necessary to apply STFT using different window sizes. The results obtained give information of the time evolution of the harmonic components of the signal. Different authors have studied the application of STFT for the detection and characterization of voltage events in power systems [6]-[8]. The results obtained show, as in the case of the rms method, its dependency on the length of the time window selected. An advantage of the STFT method is that it gives information on the magnitude and phase-angle of the fundamental and harmonic components of voltage supply during the event. 1-4244-0288-3/06/$20.00 ©2006 IEEE 2006 IEEE PES Transmission and Distribution Conference and Exposition Latin America, Venezuela Enrique Pérez, Senior Member, IEEE, and Julio Barros, Senior Member, IEEE

Welcome message from author
This document is posted to help you gain knowledge. Please leave a comment to let me know what you think about it! Share it to your friends and learn new things together.
Transcript
Voltage Event Detection and Characterization
Methods: A Comparative Study
commonly used methods of detection and analysis of voltage
events in power systems. The performance of the rms method, the
fundamental component estimation using Discrete Fourier
Transform and Kalman filtering and the use of wavelet analysis
for detection and estimation of magnitude and duration of
voltage events, are studied under simulation using voltage dips of
different magnitude, duration and point-on-wave of beginning in
a pure sinusoidal voltage supply and also for a voltage supply
with different harmonic distortion levels. The methods employed
are also tested using real voltage events measured in a low-
voltage distribution system discussing the results obtained.
Index Terms—Fourier Transform, Kalman filtering, Power
Quality, RMS, Wavelets.
I. INTRODUCTION
Voltage events, defined as an abnormal and temporary
variation of the magnitude of voltage supply, are one of the
most important power quality disturbances in power systems
because of their frequency of occurrence and the economical
impact on commercial and industrial customers.
The magnitude of voltage supply during a voltage event
can be computed using the r.m.s. magnitude, the fundamental
component magnitude or the peak voltage magnitude. The use
of any of these three methods will produce the same results in
the case of a pure sinusoidal voltage supply, but the presence
of harmonics and other disturbances in voltage waveforms
could produce different results depending on the signal
processing method used. The paper presents a comparative
study of the most common methods used for voltage event
detection and characterization in power systems: the r.m.s.
method, DFT method, Kalman filtering and the wavelet
analysis method.
II. REVIEW OF VOLTAGE EVENT DETECTION AND
CLASSIFICATION METHODS
This section reviews the performance of the main signal
processing methods used in voltage event detection and
analysis.
A. RMS method
The most common processing tool used for voltage
measurement in power system is the calculation of the root
mean square voltage.
This work was supported by the Spanish Ministry of Science and
Technology under grant DPI 2003-08869-C02.
E. Pérez and J. Barros are with the Department of Electronics and
Computers, University of Cantabria, Santander, Spain 39005. (e-mail:
The main advantage of this method is its simplicity but the
main drawback is the dependency on the window length and
the time interval for updating the values. Depending on the
selection of these two parameters, the magnitude and the
duration of a voltage event can be very different [1]-[3].
IEC Standard 61000-4-30 has proposed the Urms(1/2)
magnitude as the basic measurement of a voltage event [4].
This magnitude is defined as “the r.m.s. voltage measured
over 1 cycle, commencing at a fundamental zero crossing, and
refreshed each half-cycle”. According to this standard, the
voltage dip begins when the Urms(1/2) magnitude goes below the
dip threshold and ends when this magnitude is equal to or
above the dip threshold plus the hysteresis voltage.
The efficiency in the detection and in the estimation of the
magnitude and duration of voltage events using the Urms(1/2)
method has been studied in [5]. As any other r.m.s. method, it
is simple and easy to implement, but shows a limited
performance in the detection of voltage events and in the
estimation of its magnitude and duration, especially for short
duration and less severe voltage events. Another limitation of
this method is that no phase-angle information nor the point-
on-wave where the event starts is given.
B. DFT method
The traditional method to obtain the fundamental and
harmonic components of a signal in a digital system is the
application of the Discrete Fourier Transform (DFT) to the
samples of the signal taken in a time window. As is well
known, the results obtained using DFT are incorrect in the
case of non-stationary signals, as is the case of the voltage
waveform in an event.
A way to overcome this problem is the use of the Short
Time Fourier Transform (STFT). The STFT partitions the
signal into time segments where the signal is considered
stationary, applying the DFT within each segment. Once the
size of the time window is selected, the time-frequency
resolution obtained is fixed and it is the same for the whole
frequency spectrum of the signal. To obtain different
resolutions in different parts of the spectra it would be
necessary to apply STFT using different window sizes. The
results obtained give information of the time evolution of the
harmonic components of the signal.
Different authors have studied the application of STFT for
the detection and characterization of voltage events in power
systems [6]-[8]. The results obtained show, as in the case of
the rms method, its dependency on the length of the time
window selected. An advantage of the STFT method is that it
gives information on the magnitude and phase-angle of the
fundamental and harmonic components of voltage supply
during the event.
1-4244-0288-3/06/$20.00 ©2006 IEEE
2006 IEEE PES Transmission and Distribution Conference and Exposition Latin America, Venezuela
Enrique Pérez, Senior Member, IEEE, and Julio Barros, Senior Member, IEEE
C. Kalman filtering method
Kalman filters have been used as an alternative method for
detection and analysis of voltage events in power systems. The
change in magnitude of the fundamental component of voltage
supply can be used as an efficient way to detect and analyze
voltage events. Unlike the r.m.s. method, the Kalman filtering
method gives information both on the magnitude and phase
angle of voltage supply during the event and the point-on-
wave where the voltage event begins. References [9], [10]
discusses the Kalman filtering modeling issues and compares
the speed of detection of voltage dips using linear Kalman
filters of different order.
References [11], [12] propose the use of a three twelve-
state Kalman filters (one per phase) for real-time detection and
analysis of voltage events in power system. The fundamental
component and odd harmonics from third to eleventh order are
used to have an accurate representation of voltage supply
during the event. A new value of fundamental magnitude and
phase angle of voltage supply is obtained in real-time with
each new sample of the voltage waveform. Reference [13]
shows the results obtained in several months monitoring of
voltage supply in a low-voltage distribution system.
The detection properties of Kalman filtering and the
accuracy in the estimation of the magnitude and duration of
voltage events depend both on the model of the system used
and on the magnitude, duration and point-on-wave where the
voltage event begins. In general, the detection of the end of a
voltage event could show worse performance than the
detection of the beginning, mainly for short duration or
multiple-step voltage events, because, in such a case, the
coefficients of the filter may not have converged to the new
stationary values when the transition associated with the end
of the voltage event arrives.
A possible solution to improve the performance of Kalman
filtering in the detection and analysis of voltage events is the
use of an Extended Kalman filter to better estimate the non-
linear process associate with a voltage event. Reference [14]
presents the performance of different Extended Kalman filters
in the estimation of simulated and real voltage events in power
systems.
D. Wavelet analysis
Wavelet analysis is a powerful signal processing tool
specially useful for the analysis of non-stationary signals.
Unlike the STFT, which provides the same time-frequency
resolution in the whole frequency spectrum of a signal, the
discrete wavelet transform provides a non-uniform division of
the time-frequency plane, giving short-time intervals for high-
frequency components and long-time intervals for low-
frequency components.
Wavelet analysis has been successfully applied to monitor
power quality disturbances in power systems [15]-[20]. One of
the key factors in the application of the discrete wavelet
transform is the selection of the most appropriate wavelet
function depending on the type of disturbance to be detected
and analyzed. As a general rule shorter wavelets are best
suited for detecting fast transients while slow transients are
better detected using longer wavelets [15].
References [19],[20] study the performance of different
wavelet functions for the analysis of voltage dips,
recommending the use of the Daubechies with 6 coefficients
as the mother wavelet and the detail coefficients of the first
level of decomposition of the wavelet decomposition tree to
detect the beginning and the end of a voltage dip. As can be
seen in these references, these coefficients are insensitive to a
steady-state signal but show a high variation in magnitude
associated with the high frequency components present at the
beginning and the end of a voltage dip.
Yoon and Devaney in [21] give the theoretical basis for
computing the rms magnitude of voltage or current waveforms
using the detail and approximation coefficients of the wavelet
analysis. An alternative way to compute the phasor of a signal
using the wavelet analysis can be seen in [22].
III. COMPARATIVE ANALYSIS
As an example of the different performance in the detection
and analysis of voltage events using the methods described in
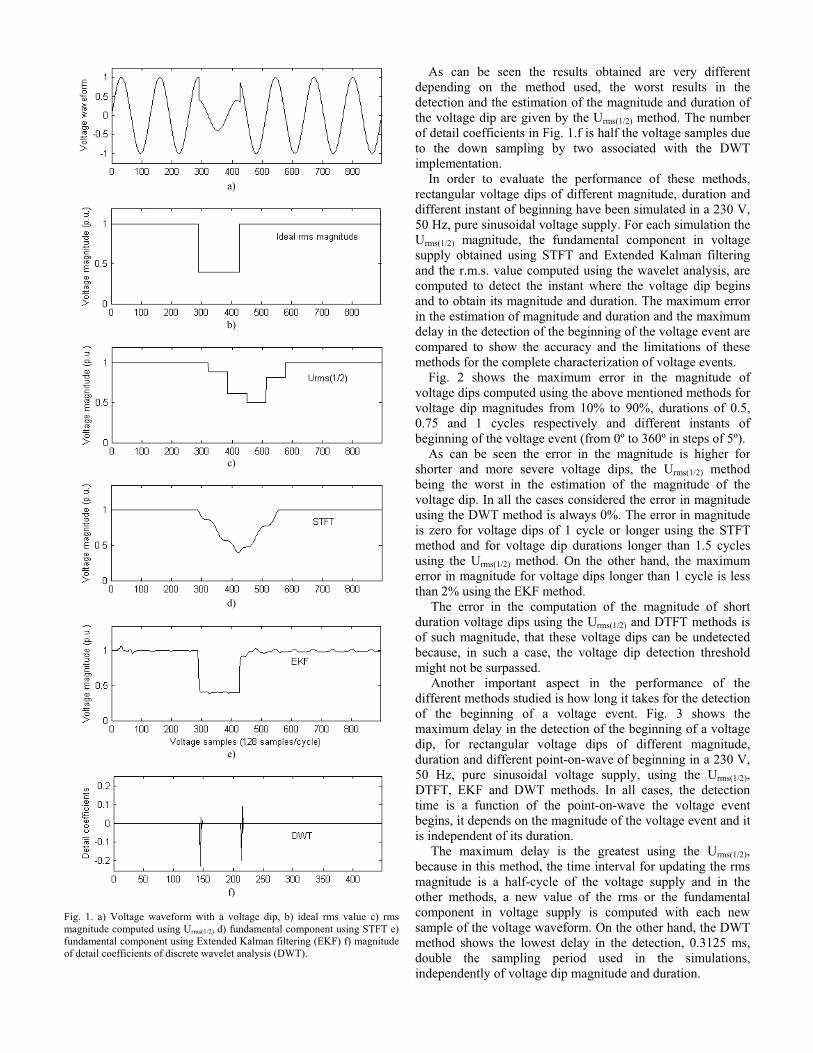
the last section, Table I and Fig. 1 show the simulation results
obtained when a 60% magnitude and 21.25 ms duration
voltage dip is applied to a 230 V, 50 Hz pure sinusoidal
voltage waveform. The voltage dip starts after two cycles and
5.15 ms of the voltage waveform and the sampling frequency
used in the simulations is 6.4 KHz (128 samples/cycle in a 50
Hz power system).
The characteristics of the different signal processing
methods applied for the detection and analysis of voltage dips
were the following:
• The Urms(1/2) magnitude is computed in the way proposed
in IEC61000-4-30.
• The STFT is applied using a sampling window of 1 cycle
and the results are updated with each new sample taken,
using the algorithm proposed in [23].
• A 13-state Extended Kalman filter, with the in-phase and in-
quadrature components of the fundamental and odd harmonic
components from third to eleventh order of voltage supply
and the power system frequency as the state variables, has
been used to detect and to estimate the fundamental
component of voltage supply during the voltage dip [14].
• The discrete wavelet transform is applied to the voltage
samples using Daubechies with six coefficients as the
mother wavelet function. The detail coefficients of the first
level of decomposition of the signal are used to determine
the beginning, the end and the duration of the voltage dip
and also to compute the rms magnitude of voltage supply
using the method proposed in [22].
TABLE I
RESULTS OBTAINED IN THE DETECTION AND EVALUATION
OF 60% MAGNITUDE, 21.25 MS DURATION VOLTAGE DIP
Urms(1/2) STFT EKF DWT
Magnitude (%) 49.6 60 59.9 60
Duration (ms) 40.0 37.5 22.03 21.31
Detection time (ms) 5.15 1.87 0 0.156
a)
b)
c)
d)
e)
f)
Fig. 1. a) Voltage waveform with a voltage dip, b) ideal rms value c) rms
magnitude computed using Urms(1/2) d) fundamental component using STFT e)
fundamental component using Extended Kalman filtering (EKF) f) magnitude
of detail coefficients of discrete wavelet analysis (DWT).
As can be seen the results obtained are very different
depending on the method used, the worst results in the
detection and the estimation of the magnitude and duration of
the voltage dip are given by the Urms(1/2) method. The number
of detail coefficients in Fig. 1.f is half the voltage samples due
to the down sampling by two associated with the DWT
implementation.
In order to evaluate the performance of these methods,
rectangular voltage dips of different magnitude, duration and
different instant of beginning have been simulated in a 230 V,
50 Hz, pure sinusoidal voltage supply. For each simulation the
Urms(1/2) magnitude, the fundamental component in voltage
supply obtained using STFT and Extended Kalman filtering
and the r.m.s. value computed using the wavelet analysis, are
computed to detect the instant where the voltage dip begins
and to obtain its magnitude and duration. The maximum error
in the estimation of magnitude and duration and the maximum
delay in the detection of the beginning of the voltage event are
compared to show the accuracy and the limitations of these
methods for the complete characterization of voltage events.
Fig. 2 shows the maximum error in the magnitude of
voltage dips computed using the above mentioned methods for
voltage dip magnitudes from 10% to 90%, durations of 0.5,
0.75 and 1 cycles respectively and different instants of
beginning of the voltage event (from 0º to 360º in steps of 5º).
As can be seen the error in the magnitude is higher for
shorter and more severe voltage dips, the Urms(1/2) method
being the worst in the estimation of the magnitude of the
voltage dip. In all the cases considered the error in magnitude
using the DWT method is always 0%. The error in magnitude
is zero for voltage dips of 1 cycle or longer using the STFT
method and for voltage dip durations longer than 1.5 cycles
using the Urms(1/2) method. On the other hand, the maximum
error in magnitude for voltage dips longer than 1 cycle is less
than 2% using the EKF method.
The error in the computation of the magnitude of short
duration voltage dips using the Urms(1/2) and DTFT methods is
of such magnitude, that these voltage dips can be undetected
because, in such a case, the voltage dip detection threshold
might not be surpassed.
Another important aspect in the performance of the
different methods studied is how long it takes for the detection
of the beginning of a voltage event. Fig. 3 shows the
maximum delay in the detection of the beginning of a voltage
dip, for rectangular voltage dips of different magnitude,
duration and different point-on-wave of beginning in a 230 V,
50 Hz, pure sinusoidal voltage supply, using the Urms(1/2),
DTFT, EKF and DWT methods. In all cases, the detection
time is a function of the point-on-wave the voltage event
begins, it depends on the magnitude of the voltage event and it
is independent of its duration.
The maximum delay is the greatest using the Urms(1/2),
because in this method, the time interval for updating the rms
magnitude is a half-cycle of the voltage supply and in the
other methods, a new value of the rms or the fundamental
component in voltage supply is computed with each new
sample of the voltage waveform. On the other hand, the DWT
method shows the lowest delay in the detection, 0.3125 ms,
double the sampling period used in the simulations,
independently of voltage dip magnitude and duration.
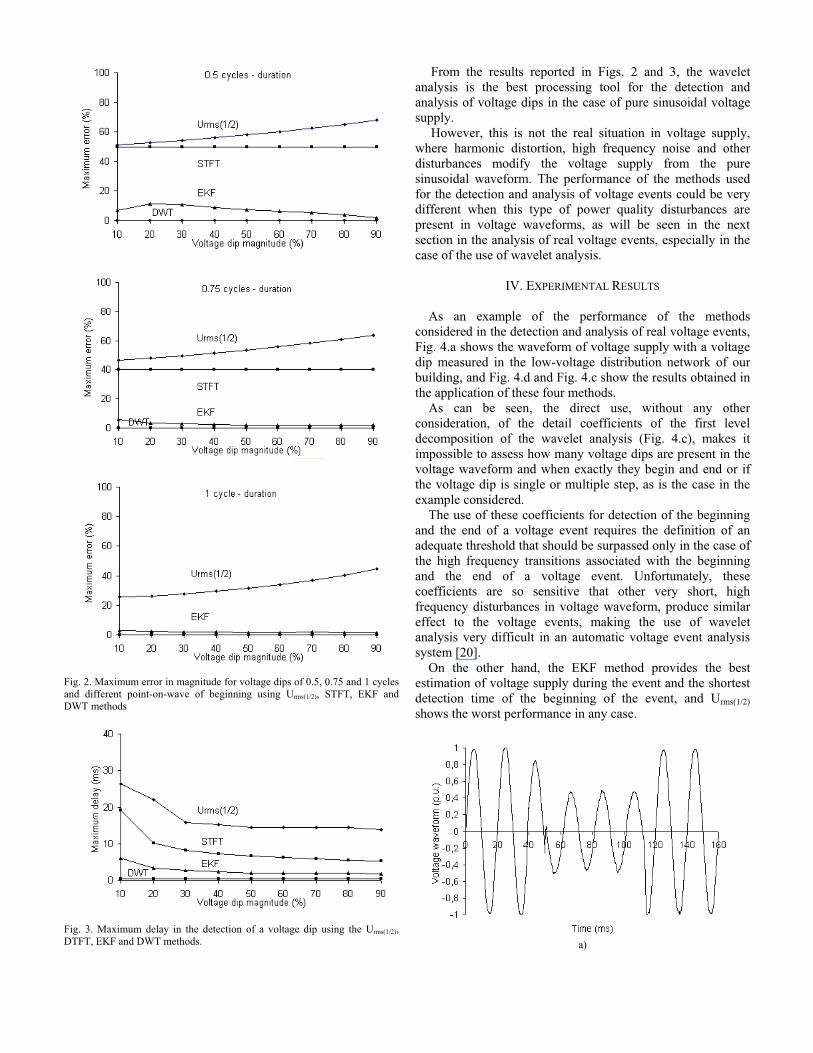
Fig. 2. Maximum error in magnitude for voltage dips of 0.5, 0.75 and 1 cycles
and different point-on-wave of beginning using Urms(1/2), STFT, EKF and
DWT methods
Fig. 3. Maximum delay in the detection of a voltage dip using the Urms(1/2),
DTFT, EKF and DWT methods.
From the results reported in Figs. 2 and 3, the wavelet
analysis is the best processing tool for the detection and
analysis of voltage dips in the case of pure sinusoidal voltage
supply.
However, this is not the real situation in voltage supply,
where harmonic distortion, high frequency noise and other
disturbances modify the voltage supply from the pure
sinusoidal waveform. The performance of the methods used
for the detection and analysis of voltage events could be very
different when this type of power quality disturbances are
present in voltage waveforms, as will be seen in the next
section in the analysis of real voltage events, especially in the
case of the use of wavelet analysis.
IV. EXPERIMENTAL RESULTS
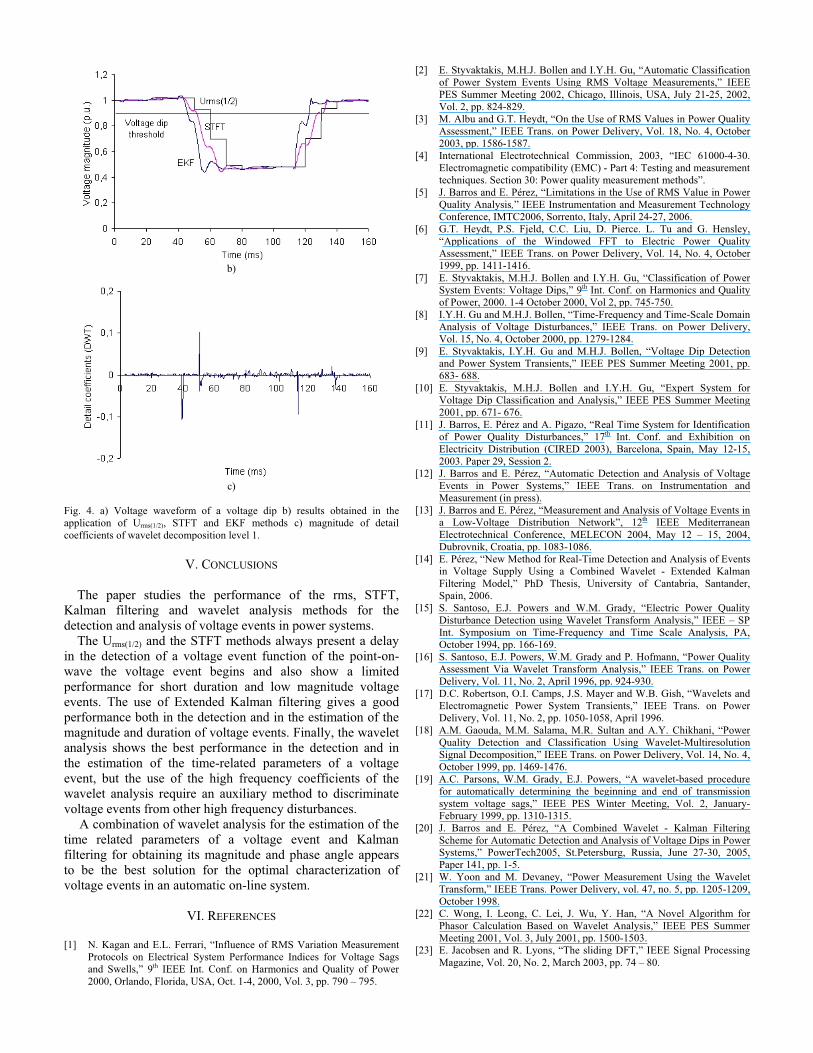
As an example of the performance of the methods
considered in the detection and analysis of real voltage events,
Fig. 4.a shows the waveform of voltage supply with a voltage
dip measured in the low-voltage distribution network of our
building, and Fig. 4.d and Fig. 4.c show the results obtained in
the application of these four methods.
As can be seen, the direct use, without any other
consideration, of the detail coefficients of the first level
decomposition of the wavelet analysis (Fig. 4.c), makes it
impossible to assess how many voltage dips are present in the
voltage waveform and when exactly they begin and end or if
the voltage dip is single or multiple step, as is the case in the
example considered.
The use of these coefficients for detection of the beginning
and the end of a voltage event requires the definition of an
adequate threshold that should be surpassed only in the case of
the high frequency transitions associated with the beginning
and the end of a voltage event. Unfortunately, these
coefficients are so sensitive that other very short, high
frequency disturbances in voltage waveform, produce similar
effect to the voltage events, making the use of wavelet
analysis very difficult in an automatic voltage event analysis
system [20].
On the other hand, the EKF method provides the best
estimation of voltage supply during the event and the shortest
detection time of the beginning of the event, and Urms(1/2)
shows the worst performance in any case.
a)
b)
c)
Fig. 4. a) Voltage waveform of a voltage dip b) results obtained in the
application of Urms(1/2), STFT and EKF methods c) magnitude of detail
coefficients of wavelet decomposition level 1.
V. CONCLUSIONS
The paper studies the performance of the rms, STFT,
Kalman filtering and wavelet analysis methods for the
detection and analysis of voltage events in power systems.
The Urms(1/2) and the STFT methods always present a delay
in the detection of a voltage event function of the point-on-
wave the voltage event begins and also show a limited
performance for short duration and low magnitude voltage
events. The use of Extended Kalman filtering gives a good
performance both in the detection and in the estimation of the
magnitude and duration of voltage events. Finally, the wavelet
analysis shows the best performance in the detection and in
the estimation of the time-related parameters of a voltage
event, but the use of the high frequency coefficients of the
wavelet analysis require an auxiliary method to discriminate
voltage events from other high frequency disturbances.
A combination of wavelet analysis for the estimation of the
time related parameters of a voltage event and Kalman
filtering for obtaining its magnitude and phase angle appears
to be the best solution for the optimal characterization of
voltage events in an automatic on-line system.
VI. REFERENCES
[1] N. Kagan and E.L. Ferrari, “Influence of RMS Variation Measurement
Protocols on Electrical System Performance Indices for Voltage Sags
and Swells,” 9th IEEE Int. Conf. on Harmonics and Quality of Power
2000, Orlando, Florida, USA, Oct. 1-4, 2000, Vol. 3, pp. 790 – 795.
[2] E. Styvaktakis, M.H.J. Bollen and I.Y.H. Gu, “Automatic Classification
of Power System Events Using RMS Voltage Measurements,” IEEE
PES Summer Meeting 2002, Chicago, Illinois, USA, July 21-25, 2002,
Vol. 2, pp. 824-829.
[3] M. Albu and G.T. Heydt, “On the Use of RMS Values in Power Quality
Assessment,” IEEE Trans. on Power Delivery, Vol. 18, No. 4, October
2003, pp. 1586-1587.
[4] International Electrotechnical Commission, 2003, “IEC 61000-4-30.
Electromagnetic compatibility (EMC) - Part 4: Testing and measurement
techniques. Section 30: Power quality measurement methods”.
[5] J. Barros and E. Pérez, “Limitations in the Use of RMS Value in Power
Quality Analysis,” IEEE Instrumentation and Measurement Technology
Conference, IMTC2006, Sorrento, Italy, April 24-27, 2006.
[6] G.T. Heydt, P.S. Fjeld, C.C. Liu, D. Pierce. L. Tu and G. Hensley,
“Applications of the Windowed FFT to Electric Power Quality
Assessment,” IEEE Trans. on Power Delivery, Vol. 14, No. 4, October
1999, pp. 1411-1416.
[7] E. Styvaktakis, M.H.J. Bollen and I.Y.H. Gu, “Classification of Power
System Events: Voltage Dips,” 9th Int. Conf. on Harmonics and Quality
of Power, 2000. 1-4 October 2000, Vol 2, pp. 745-750.
[8] I.Y.H. Gu and M.H.J. Bollen, “Time-Frequency and Time-Scale Domain
Analysis of Voltage Disturbances,” IEEE Trans. on Power Delivery,
Vol. 15, No. 4, October 2000, pp. 1279-1284.
[9] E. Styvaktakis, I.Y.H. Gu and M.H.J. Bollen, “Voltage Dip Detection
and Power System Transients,” IEEE PES Summer Meeting 2001, pp.
683- 688.
[10] E. Styvaktakis, M.H.J. Bollen and I.Y.H. Gu, “Expert System for
Voltage Dip Classification and Analysis,” IEEE PES Summer Meeting
2001, pp. 671- 676.
[11] J. Barros, E. Pérez and A. Pigazo, “Real Time System for Identification
of Power Quality Disturbances,” 17th Int. Conf. and Exhibition on
Electricity Distribution (CIRED 2003), Barcelona, Spain, May 12-15,
2003. Paper 29, Session 2.
[12] J. Barros and E. Pérez, “Automatic Detection and Analysis of Voltage
Events in Power Systems,” IEEE Trans. on Instrumentation and
Measurement (in press).
[13] J. Barros and E. Pérez, “Measurement and Analysis of Voltage Events in
a Low-Voltage Distribution Network”, 12th IEEE Mediterranean
Electrotechnical Conference, MELECON 2004, May 12 – 15, 2004,
Dubrovnik, Croatia, pp. 1083-1086.
[14] E. Pérez, “New Method for Real-Time Detection and Analysis of Events
in Voltage Supply Using a Combined Wavelet - Extended Kalman
Filtering Model,” PhD Thesis, University of Cantabria, Santander,
Spain, 2006.
[15] S. Santoso, E.J. Powers and W.M. Grady, “Electric Power Quality
Disturbance Detection using Wavelet Transform Analysis,” IEEE – SP
Int. Symposium on Time-Frequency and Time Scale Analysis, PA,
October 1994, pp. 166-169.
[16] S. Santoso, E.J. Powers, W.M. Grady and P. Hofmann, “Power Quality
Assessment Via Wavelet Transform Analysis,” IEEE Trans. on Power
Delivery, Vol. 11, No. 2, April 1996, pp. 924-930.
[17] D.C. Robertson, O.I. Camps, J.S. Mayer and W.B. Gish, “Wavelets and
Electromagnetic Power System Transients,” IEEE Trans. on Power
Delivery, Vol. 11, No. 2, pp. 1050-1058, April 1996.
[18] A.M. Gaouda, M.M. Salama, M.R. Sultan and A.Y. Chikhani, “Power
Quality Detection and Classification Using Wavelet-Multiresolution
Signal Decomposition,” IEEE Trans. on Power Delivery, Vol. 14, No. 4,
October 1999, pp. 1469-1476.
[19] A.C. Parsons, W.M. Grady, E.J. Powers, “A wavelet-based procedure
for automatically determining the beginning and end of transmission
system voltage sags,” IEEE PES Winter Meeting, Vol. 2, January-
February 1999, pp. 1310-1315.
[20] J. Barros and E. Pérez, “A Combined Wavelet - Kalman Filtering
Scheme for Automatic Detection and Analysis of Voltage Dips in Power
Systems,” PowerTech2005, St.Petersburg, Russia, June 27-30, 2005,
Paper 141, pp. 1-5.
[21] W. Yoon and M. Devaney, “Power Measurement Using the Wavelet
Transform,” IEEE Trans. Power Delivery, vol. 47, no. 5, pp. 1205-1209,
October 1998.
[22] C. Wong, I. Leong, C. Lei, J. Wu, Y. Han, “A Novel Algorithm for
Phasor Calculation Based on Wavelet Analysis,” IEEE PES Summer
Meeting 2001, Vol. 3, July 2001, pp. 1500-1503.
[23] E. Jacobsen and R. Lyons, “The sliding DFT,” IEEE Signal Processing
Magazine, Vol. 20, No. 2, March 2003, pp. 74 – 80.

VII. BIOGRAPHIES
Enrique Pérez, received the M.Sc. degree in Physics in 1985 from the
University of Cantabria, Spain. His research areas include real-time computer
application in power systems, power quality and harmonic compensation in
power systems. At present he is pursuing his Ph.D. degree in the area of
power system applications and control.
Julio Barros (M’1996, SM’2002) received the M.Sc. and Ph.D. degrees in
Physics in 1978 and 1989 respectively, both from the University of Cantabria,
Spain. In 1989 he joined the Department of Electronics and Computers of the
University of Cantabria, Spain, where he is currently a Professor. His research
areas are real-time computer applications in power systems, harmonics and
power quality.
Related Documents