VOLCANO H.AWAII ^ - :>'>. V :vi?;< £&$$jjm& PETROLOGY OF THE KILAUEA IKI LAVA LAKE GEOLOGICAL SURVEY RFESSIONAL PAPER 537-6

Welcome message from author
This document is posted to help you gain knowledge. Please leave a comment to let me know what you think about it! Share it to your friends and learn new things together.
Transcript

VOLCANO H.AWAII
^ - :>'>. V :vi?;< £&$$jjm&
PETROLOGY OF THE KILAUEA IKI
LAVA LAKE
GEOLOGICAL SURVEY RFESSIONAL PAPER 537-6

Petrology of the
Kilauea Iki Lava Lake
Hawaii By DONALD H. RICHTER .and. JAMES G. MOORE
THE 1959-60 ERUPTION OF KILAUEA VOLCANO, HAWAII
GEOLOGICAL SURVEY PROFESSIONAL PAPER 537-B
A petrologic and thermometric study of a
semienclosed body of slowly cooling basalt
UNITED STATES GOVERNMENT PRINTING OFFICE, WASHINGTON : 1966

UNITED STATES DEPARTMENT OF THE INTERIOR
STEWART L. UDALL, Secretary
GEOLOGICAL SURVEY
William T. Pecora, Director
For sale by the Superintendent of Documents, U.S. Government Printing Office Washington, D.C. 20402 - Price 30 cents {paper cover)

CONTENTS
Abstract __________________________________________ _
Introduction ______________________________________ _
Acknowledgments _________________________________ _ Geologic and petrol~gic setting ______________________ _
The 1959 eruption and formation of the Kilauea Iki lava lake ____________________________________________ _
Methods of study __________________________________ _ Drilling and sampling __________________________ _ Thermometry _________________________________ _
Physical properties and petrochemistry ___________ _ Growth of lava lake crust ___________________________ _
Page
B1 1 2 2
3 6 6 7 7 8
The crust _________________________________________ _
Vesicularity, density, and grain size ______________ _ Petrochemistry ________________________________ _
Olivine basalt _____________________________ _ Transient zone of crystallization _____________ _ Diabase segregations _______________________ _ Melt _____________________________________ _
Alteration ____ -----------------------------Differentiation ____________________________________ _
Fractional crystallization _______________________ _ Alkali transfer _______________________ ---_- ___ ---
References-------------------------~---------------
ILLUSTRATIONS
FIGURE 1. Map of the Island of Hawaii_ _______________________________________________________________________ _ 2. Map and section of Kilauea Iki crater _____________________________________________________ ------------3. Graph showing volume of lava erupted into Kilauea Iki_ _______________________________________________ _ 4. Core barrel and bit after 1~ hours of immersion in melt ________________________________________________ _ 5. Growth of crust on Kilauea Iki lava lake _____________________________________________________________ _ 6. Isotherms in crust of Kilauea Iki lava lake ____________________________________________________________ _ 7. Composite section through drill hole!_ ___________________________________________________ . ____________ _ 8. Composite section through drill hole 2 _________________________________________________________ -- _____ -
9. Section through drill hole 3 ________________________________________________ -- _-----------------------10. Silica-variation diagram _______________________________________________ -- __ --_-----------------------11. Photomicrographs of crustal rocks from depth of 29 to 31 feet at two different periods during growth of crust__-_--12. Graph showing relation between volume percentage, index of refraction, and temperature of interstitial glass in
the transient zone of crystallization __________________________________________ -----------------------13. Photomicrograph of diabase segregation ________________________________________________________ - __ -- __
14. Plot of KzO: Na20 as a function of Si02 for Kilauea Iki lava lake rocks-----------------.,-------------------15. Graph showing Fe20a : FeO + Fe20 3 as a function of depth _______________________________ - __ -------------16. Alkali-magnesia-iron oxide diagram of differentiation trend in Kilauea Iki lava lake ________________________ _ 17. Hypothetical sections through Kilauea Iki lava lake showing mechanism of alkali enrichment_ ______________ _
TABLES
Page B10
10 11 13 18 20 21 22 23 23 24 26
Page B2
4 5 7 8 9
11 12 13 16 19 _-
19 20 22 22 24 25
Page
TARLE 1. Kilauea Iki lava lake temperature profiles________________________________________________________________ B9 2. Chemical analyses, norms, and modes of rocks from hole!_________________________________________________ 14
3. Chemical analyses, norms, and modes of rocks from hole 2--------~---------------------------------------- 15 4. Modes of rocks from hole 3 _ _ _ _ _ _ _ _ _ _ _ _ _ _ _ _ _ _ _ _ _ _ _ _ _ _ _ _ _ _ _ _ _ _ _ _ _ _ _ _ _ _ _ _ _ _ _ _ _ _ _ _ _ _ _ _ _ _ _ _ _ _ _ _ _ _ _ _ _ _ _ _ _ _ _ _ 16 5. Chemical analyses, norms, and modes of tholeiitic differentiates _________________________________ ------------ 20 6. Composition of clinopyroxene from diabase segregation, hole 3 ____________________________________ ---------- 21
III

.THE 1959-60 ERUPTION· OF KILAUEA VOLCANO, HAWAII
PETROLOGY OF THE KILAUEA IKI LAVA LAKE, HAWAII
By DoNALD H. RrcHTER and JAl\:t:Es G. MoonE
ABSTRACT
The 1959 summit eruption of Kilauea Volcano filled the crater of Kilauea lki to a depth of 365 feet with 50 million cubic yards of tholeiitic basalt. In the 3-year period since the formation of this lava lake, the U.S. Geological Survey core drilled four holes through the crust for petrologic and thermometric studies of a semienclosed body of slowly cooling basalt.
Between the end of the eruption in December ~959 and December 1962, the crust over the lake of molten lava had attained a thickness of more than 43 feet. Growth of the crust is attributable to the radiation and conduction of heat which is controlled primarily by the amount of rain falling on the lake's surface. Rate of crustal growth has decreased from about 4 feet per month during .the first four months of the lake's history to an average rate of 0.34 foot per month between .June and December 1962.
The rocks in the crust of the lava lake are porphyritic olivine basalts that have a wide range in phenocrystic olivine content. The olivine phenocrysts are set in. a fine-grained, generally bolocrystalline, intergranular groundmass of clinopyroxene and plagioclase with minor opaque minerals, apatite, hypersthene and glass. The base of the crust is characterized by a 5- to 6-foot-thick transient zone of crystallization that contains as much as 30 percent interstitial liquid at the crust-melt contact. Olivine-poor diabase segregations have been found at depths below 32 feet and constitute less·than 1 percent of the total core examined.
The bulk density of the crust is almost entirely a function of the degree of vesiculation and increases from about 2.0 g per cc at the surface to 2.8 g per cc below a depth of 34 feet. Densities of nonvesicular glasses that contain a few olivine phenocrysts range from 2.6 to 2.9 g per cc. The grain size of the groundmass reaches a maximum within 15 feet of the surface, regardless of the thickness of the crust.
A total of 20 new chemical analyses together with 45 modal analyses of the rocks and melt in the upper part of the lake are presented. These data portray the chemical and mineralogical properties of the crust at five different times during the early history of the lake. The changes in composition in most of the rocks are due to two processes of fractional crystallization: gravity settling and filter pressing. ·Settling of olivine phenocrysts has influenced the composition of the entire crust, l'ffecting changes in silica content between 45.61 and 49.61 percent.
The olivine-poor diabase segregations and the bo.ttom-hol~ ooze found at depth in the crust are filter-pressed residual pore liquids and contain as much as 54.08 percent Si02. The low refractive index of the glass in the transient zone of crystallization indicates that differentiates with more than 60 percent Si02 are capable of being formed by filter pressing. The overall differentiation trend is toward pronounced enrichment in K20, Na20, and Ti02, and moderate enrichment in total iron oxides with increasing Si02.
Chemical analyses of the melt indicate that a zone of transient alkali enrichment exists immediately below the crust. Enrichment of ~0 in this zone is upwards of 100 percent over that in the crust rocks and original lavas that filled the lake. The alkalis apparently moved from deep within the lake and concentrated in the melt below the crust. Upon crystallization of this zone, the excess alkalis were driven off and deposited as crystalline alkali sulfate sublimates in the cooler parts of the crust. It is postulated that, if analogous conditions exist in the magma reservoirs of the Hawaiian volcanoes, this process of alkali enrichment. coupled with removal of clinopyroxene by settling, could well explain the formation of alkalic basalt from a tholeiite parent.
INTRODUCTION
The origin of the two prineipal basalt magma typestholeiitic and alkalic-has been one of the most difficult problems in igneous petrology. In 1950, C. E. Tilley adv·anced our concepts of basalt petrogenesis by calling attention to the presence of tholeiitic magma in an oceanic environment and by demonstrating that a consistent chronologieal change in magma type, from tholeiitic to alkalic, occurred during the evolution of Hawaiian volcanoes.
Since 1950, the interest in the Hawaiian Islands has been attested to by the increased number of petrologic papers referring to Hawaiian basalts. As would be expected, however, the various investigators are not unanimous in their theories regarding the origin and relationship of the two principal basalt magma types. Unfortunately, deep-seated igneous processes cannot be
B1

B2 THE 1959-60 ERUPTION OF KILAUEA VOLCANO, HAWAII
examined directly, but must be inferred from laboratory investigations of less complex systems and from field relationships. The inability to duplicate fully the physical-chemical conditions which control the natural systems leaves considerable room for speculation and argument.
The 1959 summit eruption of Kilauea Volcano has provided an unexcelled opportunity to study a slowly cooling body of tholeiitic basalt. At the end of the eruption in late December 1959, approximately 50 million cubic yards of molten lava filled the crater of Kilauea Iki to a depth of 365 feet. . This exposed magma chamber, where processes of crystallization and magmatic differentiation are perhaps analogous to those within the Kilauea magma reservoir, presents an unparalleled, opportunity for petrologic investigations.
This ideal natural laboratory has already prompted a number of inv~stigations. Shortly after the end of the 1959 summit eruption the staff of the U.S. Geological Survey's Hawaiian Volcano Observatory initiated a program of drilling and thermal measurement. Temperatures measured in the crust and melt of the lava lake during the early stages of this program have been the subject of two preliminary reports (Ault and others, 1961; Ault and others, 1962). The first hole to completely penetrate the crust of the lake was drilled in July 1960, by the Lawrence Radiation Laboratory (LRL) of the University of California, in an attempt to test drilling techniques in hot and molten rock masses (Rawson, 1960). Core and melt samples ~rom the LRL hole have been studied and analysed by Macdonald and Katsura ( 1961). Ground magTietic surveys on the lava lake have been conducted by Decker (1962), and. F. C. Frischknecht and L. A. Anderson (unpub. data) have measured the electrical conductivity of the melt by field electromagnetic techniques.
This paper (1) summarizes the physical, petrographic, and chemical data obtained from studies of core and melt, collected at known temperatures, from three successive U.S. Geological Survey holes drilled between April 1960 and June 1962, and (2) discusses the petrologic implications of these data. Although the crust of the lava lake was only a little more than 41 feet thick in June 1962, magmatic differentiation had already affected the composition of the rocks. In fact, the range in chemical composition in this relatively thin crustal layer is greater than any previously known :f.or the exposed volcano of Kilauea.
ACKNOWLEDGEMENTS
without whose interest this investigation would not have been possible. George Kojima, Robert Koyanagi, John C. Forbes, William Francis, Burton C. Loucks, and Reginald Okamura gave much of their time during the drilling operations and the thermal-profile measurements. Jerry P. Eaton, Wayne U. Ault, and Harold T. Krivoy not only aided. in the field but gave advice and encouragement throughout the course of the study. Special credit is also due Wayne U. Ault who fabricated most of the temperature probes and who was responsible for obtain ;ng much of the thermal data.
The excellent analytical work of Dorothy F. Powers, U.S. Geological Survey, Denver, Colo., whose chemical analyses are a valuable part of this paper is acknowledged with gratitude. Thanks are also due Howard A. Powers, David B. Stewart, and William N. Sharp of the Geological Survey for their discussions and aid.
Appreciation is here given to Superintendent Fred A. Johnston of Hawaii National Park and his staff for their continued interest in and support of the studies of Kilauea Iki lava lake.
GEOLOGIC AND PETROLOGIC SETTING
Kilauea is one of five volcanoes that compose the Island of Hawaii, largest and southeasternmost island in the 1,500-mile-long chain of volcanic islands that form the mid-PaCific Hawaiian Archipelago (fig. 1). Kilauea, 4,090 feet above sea level, and its lofty companion Mauna Loa, 13,680 feet above sea level, are the youngest and most active of the Hawaiian volcanoes.
N
r
CONTOUR INTERVAL 2000 FEET
The authors wish to express their appreciation to FIGURE 1.-Map of the island of Hawaii showing location of the entire staff of the Hawaiian Volcano Observatory. Kilauea Iki crater on Kilauea Volcano.
...
PETROLOGY OF THE KILAUEA IKI LAVA LAKE B3
Both are typical shield volcanoes built by the outpour- I ings of many thousands of relatively fluid flows of tholeiite basalt; neither volcano is known to l1ave yet produced lavas of the alkali basalt suite, which -are characteristically erupted intermittently and in minor volume during the dying stages of Hawaiian volcanoes.
The broad summit of Kilauea is indented by a large,. relatively flat-floored caldera, approximately 3 miles long and 2 miles wide. In the southwest part o:f the caldera is Halem:uunau, a precipitously walled 500-:foot-deep crater with a diameter o:f about 3,200 :feet. Two rift zones-a southwest and an east-extend down the flanks o:f the volcano, :from the summit area to :far below sea level. Summit eruptions, as the name implies, are restricted to the caldera region with most o:f them occurring in Halemaumau; fl-ank eruptions, which generally :follow a summit outbreak, occur along the rift zones.
IGlauea Iki, site o:f the 1959 summit eruption, is a deep and relatively large pit crater immediately ea.st o:f the summit caldera. This crater is approximately 1 mile long and one-half mile wide, and its rim ranges :from about 3,900 :feet a·bove sea level along the northwest and west sectors -to about 3,600 feet above sea level along the low, narrow ridge that separates Kilauea Iki :from the summit caldera (see fig. 2). The preeruption fl·oor o:f Kilauea Iki was a small fla;t plain, 37 acres in area, averaging 3,130 :feet above sea level. This plain was the surface o:f a shallow lava pond :formed during the brief eruption o:f 1868, the last eruptive activity in the crater prior to 1959.
The bulk o:f the tholeiitic lava flows o:f Kilauea is remarkably similar in composition, and any changes that do occur, both within the lavas o:f a single eruption and :from eruption to eruption, are, in general, ·aUributahle to the addition or removal o:f olivine (Powers, 1955). The average silica content o:f Kilauea basalt, determined by 24 chemical analyses o:f prehistoric ( pre-1790) and historic flows, is about ·50 percent, the norm containing a :few tenths of a percent olivine (Macdonald, 1949b, p. 7 4). The minor intrusive rocks and some o:f the massive flow rocks o:f Kilauea, on the other hand, show the effects o:f more advanced differentiation. Rocks :from the Uwekahuna laccolith in the IGlauea caldera wall range :from 45.7 to 52.04 percent in silica content, a range in composition as great as tha;t found :for all the analyzed IGlauea flows (Murata and Richter, 1961). Likewise, l{uno and others (1957) have :found that :segregation veins in a thick augite-olivine basalt flow exposed in the caldera wall contain 52.36 percent Si02
which, until the present study, represented the most siliceous tholeiitic differentiate found on Kilauea.
Recently, evidence has also been found suggesting that an increase in K 20 in the Kilauea magma has occurred during late prehistoric-ea.rly historic time (Moore and Richter, unpub. dU~ta). This change is in the direction of part of the shift from tholeiitic to alkalic basalt.
THE 1959 ERUPTION AND FORMATION OF THE KILAUEA IKI LAVA LAKE
The 1959 summit eruption of Kilauea Volcano began at 8:08p.m. on November 14, 1959, when several discontinuous fissures halfway up the 600-foot south wa.Il of IGlauea Iki began discharging liquid lava (Richter and Eaton, 1960). In 2 hours the line of eruptive fissures was approximately one-half mile long, with the indi~ vidual lava fountains rea.ching heights of 100 feet. Through the night, however, activity gradually ceased, first along the outermost vents. By ·the next day only one vent, in the west end of the crater (vent, fig. 2), remained active. As the eruption continued both the rate of lava extruded from the single vent and the size of the lava fountain increased, with the fountain reach-
. ing heights of 1;200 feet by November 20. On November 21, after almost 7 days of continuous eruption, the level of the lava in the crater reached the level ·of the vent and the founta.ining ceased.
In the next 4 weeks, 16 additional eruptive phases, ranging in duration from 321;2 hours (4th phase) to 1%, hours (14th phase), occurred in IGlauea Iki. · The 17th and last of the eruptive phases, stopped at approximately 8 :00 a.m., December 20, 1959, marking the end of the summit eruption. All these lruter and shorter phases of the eruption were apparently fed by the same conduit-vent system which fed the week-long first phase,.. and, moreover, all erupting stopped soon after lake lava reached the level of the vent.
This phenomenon of lake lava drowning the active lava fountain and stopping the extrusion of lava was exceptionally well displayed during the eruption. As lake lava encroa·ched upon the 'Orifice of the vent, just prior to the end of an eruptive phase, the fountain ac- · tivity became very erratic, suggesting that the relatively heavier, degassed lake lava was impeding the natural flow of new gas-charged lava from the vent. As the lake level conti_nued to rise, it was apparent that grea:t quantities of lake lava were actually pouring into the vent between bursts of fountaining, until finally, enough material filled the conduit to effectively prevent vesiculation and thereby pressurecapped the system. After the cessation of fountaining, the entire lake surface would immediately subside as more and more lake lava flowed back down the vent. This backflowiri.g lava evidently returned to the magma reservoir from which it

B4 THE 1959-60 ERUPTION OF KILAUEA VOLCANO, HAWAII
3000 FEET ·ABOVE SEA LEVEL
CINDER-PUMICE CONE
N
\
0 200 400 600 800 FEET
CONTOUR INTERVAL 100 FEET
Dashed contours represent pre-eruption crater topography
FIGURE 2.-Map and section of Kilauea Iki crater before and after the 1959 summit eruption showing location of U.S. Geological Surve~ drill holes. Small open circles show location of permanent reference stations on the surface of the lava lake.
had risen, there to mix with new magma and again rise . to the surface in ·a subsequent eruptive phase. Backflow often continued for as long as 2 days after the end of a phase, causing the lake level to subside as much as 50 feet. In the first hour of hackflow the volume rate frequently exceeded 2 million cubic yards per hour, or more than twice the average rate of eruption.
The volume of lava erupted into Kilauea Iki during the 17 eruptive phases, and the volume withdrawn following each phase is shown graphically, as a function of time, in figure 3. A quantitative measure of the rate of extrusion and withdrawal is expressed by the slope o~ the lines in the graph. During the week -long first phase, the rate of extrusion increased from 40,000 cubic yards per hour for the first 2 days of eruption to
a maximum of 500,000 cubic yards per hour on the sixth day and then decreased slightly to 300,000 cubic yards per hour on the last day. During the laker phases, rates of extrusion (and withdrawal) were generally much higher. The maximum rate 1neasured was 1,600,000 cubic yards per hour during the 31j2-hourlong 16th phase.
A total of 40 million cubic yards of lava filled the crater at the end of the first phase; backflow was relatively minor and resulted in a loss of only 1,500,000 cubic yards. The very obvious change in the average net capacity of the lava lake (fig. 3) from 40 million to 50 million cubic yards between the third and fourth phases was due to a change in the elevation of the vent. The fourth phase activity started on the steep, inner

PETROLOGY OF THE KILAUEA IKI LAVA LAKE B5
side of the new cinder-pumice cone approximately 40 feet higher but over the same area as the vent of the earlier phases. In all subsequent phases the vent remained at this higher but somewhat variable level allowing the lake to fill to a much greater depth before flowing hack into the vent. Following five of the eruptive phases (Nos. 2, 7, 9, 12, m:t-d 15), more lava was withdrawn than had been erupted during each phase. Apparently some form of breakdown around the orifice of the vent, probably caused by the backflowing lava, allowed some of the lake lava from the earlier phases to escape. The lake attained ·its greatest depth ( 414 ft) and volume (58 million cu yd) at the end of the eighth phase on December 11, 1959. After the end of the last backflow on December 23, 1959, the lava lake contained slightly less than. 50 million cubic yards and had a maximum depth of approximately 365 feet.
vVith the exeeption of the pyroclastic debris, ··most of which built the cinder-pumice cone lee,vard of the vent (fig. 2), all the lava extruded during the eruption
was eontained in IGlauea Ild. Because of the extreme fluidity of the lav:a and rapidity of filling, it is assumed that most of the lava was thoroughly mixed, and any possible correlation between specific layers of lake lava and lava from an individual eruptive phase is unlikely. Furthermore, since filling, convection currents have no doubt contributed to a certain amount of mixing within the still fluid part of the lake.
The filling of the crater was neither orderly nor systematic. In the first phase, most of the early lavas poured into the trough leading from the shallow west end to the deep east end of the crater and spread rapidly across the crater's flat floor (fig. 2). By the time lava in the bottom of the erater reached a depth of 25 feet, new lava flowing down the trough from the vent had begun to plunge under the crust of the lake, floating it upward and filling the young lake from below. Although this process continued throughout most of the first phase, the original crust on the lake did not persist more than a few days and, in fact, a
60r-----------------------~------------------------------------------------------------~
50
"' 40 8 X
en Cl a::: <( >-(.) 30 iD :::> (.)
·z u.i :2 :::> 20 ...J 0 >
14 16
~-_}}J'.,,,}',,,_}\)\hJ!J.,,,.]\_. __
, ___ . ______ )\ _)'-----.---------- .
ERUPTIVE PHASES
18 20 22 24 NOVEMBER 1959
1..
26 28
3
30 2
_4_ 1 6 7
4 6 8
8
10 12 14 16 DECEMBER 1959
18 20
l!_,IGURE 3.-Graph showing volume of lava erupted into Kilauea Iki during the 1959 summit eruption. Dashed line after the end of an eruptive phase represents backflow of lava down the vent. Each dot is a volume measurement. Note that the volume of totallava actually decreased during the fourth eruptive phase.
796'-503 0~66-2

B6 THE 1959-60 ERUPTION OF KILAUEA VOLCANO, HAWAII
new crust. formed over most of the lake -at least once or twice every 24 hours. As the crust floated upward, a zone of very thin and unstable crust was left between the thick, older crust · and the sloping crater walls. From this peripheral weak zone, liquid lava continually welled up from below and spread out over the old surf.ace, eventually cooling to form a new crust. In the later phases, most of the new lava contributed to the lake spread from the vent area as thick surface flows, covering and probably assimilating the old crust. In at least two phases, however, subcrust:al injection played an important role in filling the lake.
The process of backflow following an eruptive phase further compli_cated the lake's history. Crustal foundering, somewhat similar to that which occurred at the periphery of the lake during filling, continually reworked the lake surfa.ce during backflow. This reworking appeared to be a direct consequence of the liquid lake lava attempting to reach a common level in the concave bow 1 formed by the continual subsidence of the lake's crust. In this manner, an entirely new surface crust was generally formed every few hours on the lake. The end result on December 23, 1959, was an extremely level lake surface, with m·aximum relief of less than 5 feet over an area of approximately 135 acres (see section, fig. 2).
METHODS OF STUDY
In March 1960, less than 3 months after the end of the 1959 eruption, engineering surveys by the staff of the U.S. Geological Survey's Volcano Observatory were conducted in and around Kilauea Iki to set up controls for the various investigations planned on the lava lake. A 4,000-foot base line trending a pproximately N. 80° W. and a 2,000-foot crossline, both with permanent stations spaced every 100 feet, were laid out by transit and tape (fig. 2). Case-hardened 2-inch concrete nails driven into the crust through stamped aluminum tags were used to designate the permanent stations. Temperatures of more than 100° C within 2 inches of the surface were indicated by the f.act that, after the nails were emplaced, water dropped on the nailheads would immediately boil.
After the control lines were installed, a level line was carried into the crater and the elevations of all permanent stations were determined. Releveling, repeated every 3 to .8 months since the original survey, has shown that the lake surface subsided an average of 0.7 foot per year during the 2-year period ending March 1962.
Access to the surface of the lava lake is by means of a 1-mile-long foot trail which switchbacks down the 400-foot-high east wall of the crater (fig. 2).
DRILLING AND SAMPLING
A total of four holes (fig. 2) has been drilled by the U.S. Geological Survey into the crust of the lava lake between April 1960 and December 1962. As mentioned previously, however, only data from the first three hole-s are fully presented in this paper. All holes were core drilled their entire length, but core recovery seldom averaged more than 20 percent, principally because of the extreme temperatures and the consequent unorthodox drilling methods used. Melt was collected below the crust in holes 1 and 3, and during the first penetration of hole 2; no attempt was made to sample the melt in the second penetration of hole 2.
On April 9, 1960, hole 1 was drilled to a depth of 71h feet using an ordinary lh-inch electric hand drill powered by a 300-watt portable generator. The bit employed was a hollow, tungsten-carbide masonry drill, 1~$ inch in diameter and capable of holding 3 inches of core, welded to a section of %-inch solid steel rod. On April 25 the hole was deepened to 11.8 feet and on May 6 to 12.7 feet. Drilling was done dry .to 7 feet; below that, water was sparingly poured into the hole during drilling in an attempt to cool the bottom. Despite the cooling, however, temperatures at depths of more than 12 feet often reached 900° C, and at 12.7 feet both the drill and bits failed to function properly and drilling was temporarily halted. Although the equipment used in this first drilling on the lava lake was primitive, it demonstrated that core drilling in extremely hot rock is feasible.
Hole 1 finally penetrated the crust on August 24, 1960, using a 1~) 6-inch core drill powered by 2~~-hp gasoline engine with a maximum speed of 400 rpm. The drill bits, specially . :fabricated by Sprague and Henwood, Inc., consisted of tungsten-carbide cutters set in a high-temperature matrix with nickel shims. Core was collected in. a conventional thin-wall, 2-foot doubletube core barrel. During drilling, water was manually pumped into the drill rods through a water swivel designed and built by Chester K. Wentworth of the U.S. Geological Survey. ·
Using the same drilling equipment, hole 2 was dri1led through the crust (29.7 ft thick) on April13, 1961, and again on October 4, 1961 (35 ft thick).· Immediately after the second penetration in October, a stainless steel-ceramic probe containing a thermocouple was forced 4 feet into the melt below the crust ( Ault and others, 1962). .
Hole 3 was drilled through the crust ( 41.6 ft thick) between May 31, and June 11, 1962, again using the same equipment as that used for hole 2. An attempt to force a 10-foot probe into the melt proved unsuccessful, and the hole, still containing the probe and approxi-
. mately 15 feet of drill rod, was abandoned.

PETROLOGY OF THE KILAUEA IKI LAVA LAKE B7
With more elaborate and powerful drilling equipment (a conventional 9-hp portable drill and a 3%-hp water pump), hole 4 penetrated the melt at 43.6 feet on December 6, 1962. On January 10, 1963, after extreme cooling with water, hole 4 was deepened to 48 feet, or about 4 feet below the normal crust-melt boundary.
Drilling rates through the vesicular basalt of the crust could be maintained, under ideal conditions, as high as 1 foot per minute. In the denser rocks, below about 30 feet, drilling was generally slower; and within a few feet of the melt drilling was always very slow, with mtes rarely exceeding 0.1 foot per minute. Moreover, extreme care had to be exercised when approaching the melt owing to liquid oozing from the wall of the hole and freezing onto the drill bit. On more · than one occasion the bit stuck fast in the hol"e and the drill stalled. When this occurred, the rods and bi·t were left without benefit of coolant water until thermal equilibrium returned (generally 15 to 20 min) after which the string of rods could, with considerable difficulty, be withdrawn.
The drill bit, however, could not survive being submerged too long in the highly corrosive melt. ·when the melt was penetrated at 22.5 feet in hole 1, the bi.t became stuck and the rods snapped 15 feet below the collar of the hole. The rods 'vere finally extracted after 1Vz hours, during which time the entire bit plus 5 inches of the double-tube core barrel had been completely dissolved by the melt (fig. 4).
Drill rods were pulled after every 3 inches during the drilling ·of hole 1 when the masonry bit was used, and at least after every 2 feet when the convent.ional core barrel was used. Care was taken to reduce grinding up of the core to a minimum, but even with precaution many drilling runs produced no core whatsoever. Mel~ was collected with either the drill bit or a specially designed 5-inch-long, hollow steel spoon. Samples of c~re from the three hol~s are numbered consecutively, w1th respect to depth, as follows: Hole 1, IU-100 to KI-115; hole 2, KI-150 to KI-186; hole 3, KI-200 to KI -236. (See figs. 6, 7, and 8.)
EA • t. IL J ¥II J 1,1 IJII::OII.III.~Ii,JH .. ,If .• 4 .J I ,. PFOiit~l.liiJiihii'Cf ..
·~· .. "V'-
FIGURE 4.- Core barrel and bit after i% hours of immersion in melt at a depth of 22.5 feet. Compare with new core barrel and bit.
THERMOMETRY
It is not the intent of this paper to discuss fully the temperature investigations that have been undertaken on the lava lake. Hmvever, the temperature profiles measured in the holes as soon as possible after drilling and hence, indicative of the sample temperature a:t time of collection, are important in understanding the crystallization history of the lava lake. Not all the many temperature profiles measured through the crust of the lava lake since April1960 are used in this paper. These valuable source data are the basis for studies presently underway on the physical properties of the crustal rocks and for calculations of physical constants, such as thermal diffusivity and latent heat of crystallization.
Most of the temperatures obtained in the drill holes were measured with sheathed chromel-alumel thermocouples and a slide-wire potentiometer with a rea;din()'
" accuracy of 0.005 millivolt. The sheathed thermo-couples consisted of matched chromel-alumel pairs, swaged with powdered MgO filler, in a thin-wall 310-stainless-steel case. Unsheathed thermocouples were used successfully for the first measurements in hole 1, but after melt. penetration, a few seconds exposure to the extremely hot S02-rich bottom-hole vapors would disintegrate the alumel element. In hole 3 a compound 5-pair chromel-alumel thermocouple, with junctions spaced 3 feet apart, was used. Laboratory cali-brations, using the melting-point technique and latterly a comparison with aN ational Bureau of Standards calibrated platinum-platinum-90, rhodium-10 thermocouple, indicate an accuracy of about one-half of 1 percent at 500° C and about 1 percent at 1000° C for the thermocouple tern peratures.
Bottom-hole temperatures were also measured, whenever conditions permitted, with incandescent ,filamenttype optical pyrometers. In the shallower holes (hole 1 and first penetration of hole 2), optical-pyrometer temperatmes were within 5° C of those obtained by chromel-alumel thermocouples. In the deeper holes, however, a greater divergence was observed, with the optical-pyrometer values consistently higher by as much as 10° C. Surface and near-surface (less than 1 ft) drill-hole temperatures were measured with mercury thermometers.
PHYSICAL PROPERTIES AND PETROCHEMISTRY
Rock-density determinations were made on most uniform pieces of core greater than one-half inch long. The ends of the selected core sa.mples were ground flat to form a nea-r-perfect cylinder, and the dimensions (length and diameter) were measured with vernier

B8 THE 1959-60 ERUPTION OF KILAUEA VOLCANO, HAWAII
calipers. The weight of the individual cylinders was determined on a laboratory balance.
A total of 21 samples, including rock, melt, and one clinopyroxene separate, were chemically analyzed in the Denver Rock Analysis Labora·tory of the U.S. Geological Survey. The clinopyroxene from a diabase segregation in hole 3 was separated by means of heavy liquids and an isodynamic separator. Norms of the analyses were calculated by computer. Modes were determined for 45 samples, and with only a few exceptions, more than 500 points were counted per thin section. The composition of the olivines was deterrnined by the X-ray method of Yoder and Sahama (1957), and the composition of the feldspars, where practical, by the method of Tsuboi.
GROWTH OF LAVA LAKE CRUST
In the 3-period between the end of eruption in December 1959 and the last drilling in December 1962, the crust of the Kilauea Iki lava lake ruttained a thickness of 43.6 feet. Although the growth of the crust has been studied only in a very restricted area over the deepest part of the lake (fig. 2), the level surface indicates a comparable growth rate-hence uniform thicknessover a much larger area. A·t the periphery of the lake and in the relatively shallow west end, however, the crust is presumably thicker.
The criterion used to identify the base of the crust when drilling was the depth at which drill rods noticeably sank into the melt. Even though this depth is a complex relation of several physical and mechanical factors (see Ault and others, 1962, p. 2811), temperatures measured in all the drill holes at this depth were consistently between 1057° and 1065° C. The base of the crust was also identified. independently during the empla.cement of the melt probe in hole 2 as the 1065° C isotherm (Ault and others, 1962), corroborating the temperatures measured at the base of crust determined by drilling. As would be expected, there is no sharp demarcation between solid and 1iquid; instead, the contact is a zone only a few inches thick of rapid change in the proportion of crystals ·and in viscosity. Thin sections of crust and melt across this narrow zone reveal a glass (liquid) content of 24 to 26 percent in the lowermost crust and 30 to 73 percent in the upper part. of the melt. The relatively rapid change in degree of crystallinity over an exceedingly limited temperature interval (<5° C) is due to the onset of plagioclase crystallization at or slightly above the 1065 ° C isC\therm. It should also be noted that the thermal profiles (table 1 and figs. 6, 7, 8) show that the base of the. crust is marked by only a subtle change in the slope of the thermal gradient.
The growth of the crust is shown graphically in figure 5 as a function of time. The rate of growth de.creased from an average of 2.8 feet per month, during the first 8.1 months, to an average of 0.34 feet per month during the 5.6 months ending December 6, 1962. In the 22-month period between August 1960 and June 1962, however, the rate of growth decreased only slightly from 0.95 to 0.80 feet per month. Five selected temperature profiles, based on measurements made when equilibrium returned after drilling and therefore representative of the core-sample temperature at time of collection, are listed in table 1. These same data are plotted graphically in figures 6, 7, and 8. A contoured temperature diagram of depth versus time for the crust of the lava lake is shown in figure 6. The descent of all isotherms below 600° C has been virtually linear~ the rates ranging from 0.12 feet per month for 100° C to 0.6 feet per month for 600° C during the period between April 1960 and tT une 1962. Isotherms above 600° C were relatively steep during the early period of crust formation and since about January 1962 have shown a marked tendency to flatten.
The transfer and loss of hea;t from the upper part of the lava lake, which directly affects the growth of the crust, are controlled principally by (1) the interrelated effects of radiation and conduction and (2) the vaporization of water (rain). Although all these processes will be effective until thermal equilibrium between the lake and its environment is attained, each plays a dominant role at various periods in the lake's development. During eruption and in the first few hours of stable crust formation, loss of heat was almost entirely due to radiation. However, as the crust
0~~~~~~~~~~~~~~~~~~~~
4 \2
·4
April 9
3 _9 \ . HOLE 1 8
ft per\ I April. 2. 5 12 month \,~Mall .. ?
._16 ~16.0 ~ 20 1.8 \,, Aug 24
ft per month' ~24 22.5
0.95
HOLE 2
April 13
CRUST
HOLE 3 HOL 4
Dec 3
June 1
::i t28 LIJ 0 32
ft per month 9 .? ............ .
0.93 !october 4 Dec 6
36
40
44
MELT ft per month 5 0 Prob~l ·
lJI-80 ft per month
June 1 41.6 June _25 0_34
~_3.6
ft per month
JFMAMJJASONDJFMAMJJASONDJFM
1961 1962
FIGURE 5.-Growth of crust on Kilauea Iki lava lake as of December 1962, showing calculated average rate of crustal growth between drilling.

PETROLOGY OF THE KILAUEA IKI LAVA L,AKE B9
TABLE 1.-Kilauea Iki lava lake temperature profiles, holes 1 to 3
1 2 3 --
Depth (feet) Temperature ("C)
Depth (feet) Temperature ("C)
Depth (feet) Temperature ("C)
May 16,1960 Sept. 8, 1960 Oct. 2 and 5, 1961 June 21, 1962
Surface ----------- 152 Surface 148 3. 0 87 0. 5 1 105 ------------ 2. 0 147 6. 0 99 1.0 . 87 98 4.0 302 9. 0 200 2. 0 196 182 8. 0 511 11. 9 314 3. 0 342 278 12. 0 640 13. 0 346 4. 0 447 364 16.0 728 16. 0· 442 6.0 589 481 20.0 794 19. 0 530 8. 0 708 585 24.0 861 21. 9 615
10.0 806 679 27.6 929 25. 0 695 12.0 ----------- 760 32.2 1000 29. 5 818 12.8 915 ------------ 33.2 1024 32. 5 899 14. 0 838 34.2 1046 35. 5 966 16. 0 907 35.2 1063 38.4 1021 18.0 972 36.2 1081 41.5 1060 18.5 986 37.2 1092 22.4 2 1065 38.2 1101
39.2' 1106
t Mercury thermometer. 2. Drilled 0 to 30.4 ft on Apr. 13, 1961; drilled 27.4 to 35.2 ft on Oct. 4, 1961. 2 Optical pyrometer. All other temperatures by chromel-alumel thermocouple. 3. Drilled 0 to 42ft between May 31 and June 11, 1962.
1. Drilled 0 to 12.8 ft between Apr. 9 and May 6, 1960; drilled 12.8 to 22.7 ft on Aug. 24, 1960.
1960 1961
TIME---~
1962
FIGURE 6.-Isotherms in crust of Kilauea Iki la:va lake. plotted as a function of time. Diagram compiled from thermal data from drill holes 1, 3, and 4.
(a poor heat conduotor) became thicker, radiation became less and less efficient and heat loss became dependent. on the amount of heat transferred to the surface by conduction·. A third cooling process, vaporization of water, is a function of the amount of rain falling on the lake and being changed to vapor upon contact with hot rocks in the crust. Because an average of approximately 100 inches of rain per year falls on the Kilauea Iki area, the vaporization of water is now by far the most important. single process contributing to the cooling of the lava lake.
The amount of heat (heat of vaporization) required to change 1 gram of water at 100° C from a liquid to a vapor is 540 calories. Assuming that the basalt has a specific heat of 0.20 and a density of 2.7 g per cc, 1 cc of basalt will have a thermal capaci·ty (mass X specific heat) of 0.54 cal per deg C, or 0.54 cal will be released for every degree cooled. Hence, the amount of heat necessary to vaporize 1 cc ( 1 g) ·of water is equivalent. to the heat released in cooling 1 cc of basalt from 1100° to 100° C.
However, these calculations can only be used as a rough qualitative measure of crustal growth because they fail to consider processes that add heat to the crust. For example, if all the rain falling on the lake was utilized in cooling and no heat was added, approximately 8 feet per year of lake lava would be transformed into crust having a temperature of 100° C. This is a rate of 0.67 foot per month, virtually double the observed rate ( 0.36 ft per month) . between June

BlO THE 1959-60 ERUPTION OF KILAUEA VOLCANO, HAWAII
and December .1962, and yet this r.ate does not include the contribution due to heat loss by conduction and radiation. The physical-chemical processes that add heat to the crust in significant quantities are ( l) heat o£ crystallization; (2) solar radiation, and (3) convection. Heat of crystalliza;tion is by far the most important of these processes, especially in the lower 5 feet of crust where upwards of 70 percent ·Of the total volume is still liquid. The heat contributed by solar radiation to the surface of the lake and by convective overturn in the melt ·aTe of secondary importance but need to be considered in any attempt to understand the heat budget of the lake.
Furthermore, the questionable validity of the basic assumptions (density and specific heat of the basalt) could also affect the calculation o£ the rate of heat loss due to cooling by water. If either the density or specific heat are more than assumed, then by definition the thermal capacity of the basalt would be correspondingly larger and hence more water would be required to cool an equivalent amount of basalt. On the other hand, recycling of the water in the crust could substantia1ly add to the effectiveness of cooling by the vaporization of rainfall. In fact, it is entirely possibl~ that much of the 100 inches of rain per year is used over and over again, especially as the crust thickens leaving a relatively cool top ·to condense the vapors rising from the hotter zones at depth.
Though the above considerations are somewhat speculative, the rate of heat· flow through the crust of the lake may be compared with the rate of heat loss due to the vaporization of rainfall. On the basis of a miiform heat conductivity of 5.1 X 10⁻³ cal per em per deg C for the crustal basalt, the rate of heat flow in cal?ries per second can be expressed by the equation :
. T -T Rate of heat flow=k 1 2 XA,
t where k is the thermal conductivity of basalt, T 1 - T 2
the difference in temperature between the top and base of crust ( 1000° C), t the thickness in centimeters, and A the area (1 cm2
). As all parameters are fixed, with the exception of t, it is apparent that the rate of heat flow varies inversely with .thickness. Solving the equation for thicknesses of 10, 20, 30, and 40 feet (305, 610, 914, and 1,219 em), the corresponding heat flow rates are 16.4, 8.1, 5.5, and 4.1 X 10⁻³ cal per sec. Hence, for a crust thickness of about 40 feet, the heat loss due to vaporization of rainfall begins to exceed the heat loss by conduction.
THE CRUST
Megascopically, the bulk of the rocks in the 42-foot thick crust of. the ICilauea Iki lava lake is porphyritic olivine basalts that have a wide range of content of
phenocrystic olivine. The base of the crust is characterized by a 5- to 6-foot-thick zone of fluid-rich basalt, referred to as the transient zone of crystallization, which moves downward at a rate equal to the crustal growth rate. Olivine-poor diabase segregations found only at depths below 32 feet constitute less than 1 percent of the total crust thickness examined.
The basalts exposed on the surface of the lake and in cracks penetrating a few feet below the surface are highly vesicular, the voids constituting up to 40 percent by volume of the rock. The groundmass matrix is generally dense, breaks with a rough hackly fracture, and, depending on the degree of crystallinity, ranges 1n color froin gray to nearly black.
VESICULARITY, DENSITY, AND GRAIN SIZE
The size, shape, and relative abundance of the vesicles in the crust of the lava lake are shown diagrammatically in the drill-hole sections in figures 7, 8, and 9. The extreme top of the crust, too thin to portray in the sections, is characterized by a chilled glassy skin not more than 1 inch thick, containing abundant vesicles and covering, in many places, large flat gas blisters (macrovesicles) as much as 3 feet in diameter. Immediately below the glassy skin the vesicles are generally more uniform in habit and, as would be expected, decrease in size and abundance with depth. With the exception of a number of anomalous dense layers in the upper part of the crust, the spherical vesicles decrease from 8 to 10 mm in diameter near the surface to 1 mm or less in diameter below about 34 feet. In addition to the spherical vesicles, relatively large flattened voids and irregular tubes, probably formed under conditions of subtle shearing within the crust, are locally common at depths below 26 feet. Vesicles in the diabase segregations are even more irregular and form intricate branching tubes as much as three-fourths inch long.
The thin dense layers restricted to the upper 14 feet of crust are apparently partially remelted re.mnants of old crust that were engulfed hy liquid lava during the last period 'Of crustal foundering ·on the lake's surface. Although probably limited in areal extent and erratically distributed, these dense 7-ones have locally affected the composition of the overlying strata. In every case where a dense zone has been recognized it formed an impermeable barrier to sinking ·olivine crystals and 'was overla.in by layers ·of crystal mush with a.s much as 37 percent modal olivine.
The bulk density of the crust is almost entirely a function of t.he degree of vesicularity ; the effect of changes in the olivine content on the density is possibly only apparent, at depth, in hole 3 (figs. 8 and 9). Bulk densities range from a .low of 1.8 to 2.1 g per cc near the

'PETROLOGY OF THE KILAUEA IKI LAVA LAKE Bll
MODAl COMPOSITION, IN PERCENTAGE BY VOlUME
0 20 40 60 80 0 20 40
NO CORE
MELT (5-6-60)
NO CORE
Glass, mode
' / ' / d-
I I I 0 0.05 0.10 0.15 0.20
GRAIN SIZE, IN MilliMETERS
~,--r-,--r-,-~~~,_-r-,--r-,-~--r-~--,
I I
d I I
o· I I I I I I
2oo· 4oo· 6oo· soo· 1ooo· 12oo· TEMPERATURE, IN DEGREES C
I!.,IGURE 7.-Camposite section through drill hole 1 with pertinent mineralogical and physical data. Relative size, shape, and abundance of the vesicles in drill core are portrayed diagrammatically by pattern. Dashed lines denote obvious textural and chemical discontinuities.
sui-face to a maximum of 2.7 to 2.8 g per cc below a depth of 34 feet. The increase -frmn 1.8 to 2.5 g per cc occurs fa·irly rapidly and consistently in about the first 6 feet of crust; below that the increase from 2.5 to 2.8 g per cc is erra:tic and gradual. The anomalously lowdensity zone bebveen 26 and 32 feet in hole 3 may be due to· n. corresponding low olivine content in this same general interval (·fig. 9).
Bulk densities were determined for a number of nonvesicular glasses that were collected while still liquid. Melt samples, containing a few olivine phenocrysts, had densities of 2.66 g per cc (sample l(I-186, 35.0 to 35.2 ft, hole 2) and 2.78 g per cc (sample l(I-235, 42.05 to 42.3 fit, hole 3). The silica-rich liquid that oozed into the bottom of hole 1 (sample I\I-113, 22.3 to 22.5 ft) from the base of the crust had a. density of 2.65 g per cc. l\1oreover, the specific gravity :of vesicle-free fragments of tachylite from the surface of the lake ranges between 2.6 and 2.9. li. A. Powers (written co~mun.) luis ob-
served that vesicle-free glass shards from the Kilauea Iki lavas had specific gravities very close to 2.9 or perhaps even more.
The groundmass grain size (figs. 7, 8, and 9) does not s~Tow a consistent increase with depth as might be expected. There is an increase in size directly helow the surface and directly above the base of the crust, but the maximum grain size appears to be a:t:btined within 15 feet of the surface, regardless of the thickness of crust.
PETROCHEMISTRY
A total of 20 new chemical analyses together with 45 modal analyses of the rocks and melt in the crust of the lake are presented in tables 2, 3, 4, and 5. These data portray the chemical and mineralogical properties of the crust a.t five different times (Apr. 9 to May 6, 1960; Aug. 24, 1960; Apr. 13, 1961; Oct. 4, 1961; and May 31 to June 11, 1962) during the early history of the lake. Although melt penetration occurred on the four latter

B12 THE 1959-60 ERUPTION OF KILAUEA VOLCANO, HAWAII
SAMPLE DENSITY, IN GRAMS PER
CUBIC CENTIMETER MODEL COMPOSITION, IN PERCENTAGE BY VOLUME
2.0 2.5 3."0 0 I
20 40 60 80 0 20 40
1-UJ UJ LL.
2
8
Kl-1571
10 ~::l~~l Kl-160
Kl-161
Kl-162
NO CORE
NO CORE 0: , 00
• 0 0 ,.
• ~ •• 0
1""1 1111 1
T r~~
1 I I I
I I
\ I I
\
I I ~, ~.-r~~--~~--.-r-.'1-.-.-.~.-~
Temperature
I I
~----' I
'~ I
\ I I I I I I I I I I I I I
0 0.05 0.10 0.15 0.20 0° 200° 400° 600° 800° 1000° 1200° TEMPERATURE, IN DEGREES C GRAIN SIZE, IN
MILLIMETERS
FIGURE 8.-Composite section through drill hole 2 (see fig.7).
dates, only the samples collected on April13, 1961, and May 31 t.o June 11, 1962, represent isochronal surface to melt profiles. The dates of sampling and the locations of the sam pies are shown on the diagrammatic drillhole sections in figures 7, 8, and 9.
The chemical analyses were done by standard gravimetric methods in the Denver laboratories of the U.S. Geological Survey by the analysts credited in tables 2, 3, 4; and 5. All these analyses appear consistent; that is, they plot on smooth linea.r control lines in variation diagrams when compared with one another, with analyses of Kilauea lavas earlier than those of the 1959 eruption, and with Kilauea Iki analyses made hy other labon-.,tories (Tilley, 1960). Only the 10 Kilauea Iki
analyses of Katsura (in Macdonald and Katsura, 1961, table 1, p. 362) show a marked divergence from the analyses presented here; Katsura's analyses when plotted on a silica-variation diagram, similar to that used in this paper (fig. 10), are erratic and define, only within broad limits, the linear control lines tightly controlled by ·analyses from other laboratories. Also, l{atsura's analyses show a bias (again comparing with analyses from other laboratories) toward low silica by as much as 2 percent. The low silica values are partly compensated for by anomalously high alumina values, and it is the writers' opinion that the apparent discrepancies lie largely in the values reported for these two constituents.

PETROLOGY OF THE KILAUEA IKI LAVA LAKE B13
OLIVINE BASALT
In thin section the predominant •tholeiitic olivine basalt samples consist of large olivine phenocrysts s~t in a groundmass of fine-grained clinopyroxene, plagioclase, and ·opaque minerals with varying amounts of glass (see fig. 11). Minute needlelike crystals of apatite ( ~) are common in the glass of the more vi'tric rocks, and minor hypersthene was observed In a few
thin sections. The groundmass texture grades from completely glassy rut the surface, through interstitial in a zone a few feet below the surface, to intergranular below about 5 feet. Beginning in the transient zone of crystallization at the base of the crust and going upwards, this textural sequence is reversed with the glass representing a true interstitial liquid phase at the temperature and time of collection.
0
2
4
6
8
10
12
14
16
18 I-w w u.. 20 ~ :i I- 22 a. w 0
24
en w I- 26 <: 0
t!' z 28 ::i ..J
0:: 0
30 N 1.0 01 .... ...; 32
z ::::> 34 -,
I .... ('Y)
> 36 <: :E
l38 40
42
SAMPLE
DENSITY, IN GRAMS PER CUBIC CENTIMETER
2.0 2.5 3.0 1""1""1
0 I
KI-200I b• o 0 o
Kl-201! oOo 0 OPF"N SPArE
K1-2o2 o~ogoo Kl-203 OPFN St-'AI E Kl-2041 .o.ooo•o Kl-205 0 • oOo Oo
oO• o
Kl-206 <?·o~c?.00 Kl-207 °Q~0·· 0 ·
0 0 0
NO CORE
~1?-~~~p __ .,_,2_0_..!.9.
·o.o:o~o O•OoOo
NO CORE
NO CORE
I
MODEL COMPOSITION, IN PERCENTAGE BY VOLUME
20 40 60 80 0 20 40 '---~ L ____ L I lr--r-'T"I :..........---.~.---r-~~--r--r-~--,.---,-.--.,.----,
I I I I I I I
Glass, mode
Temperature June 21. 1%2
I I
SEGREGA~riON + I_ :~~~J
'----- t=' ,----- I
NO CORE . . .
NO CORE
.· · ... :
I
0.05 0.10 0.15 GRAIN SIZE, IN MILLIMETERS
I
oo · 200° 400° 600° 8oo· 1 ooo· 12ooo TEMPERATURE, IN DEGREES C
FIGURE 9.-Section through drill hole 3 (see fig. 7).

B14 THE 1959-60 ERUPTION OF KILAUEA VOLCANO, HAWAII
TABLE 2.-0hemical analyses, norms, and modes of rocks from hole 1, Kilauea Iki lava lake
[Results in percent. D. F. Powers, analyst]
Si 02 _____ - _________ -__________________________________ _
Ah03- ------------------------------------------------ _ Fe203. ___ -- ___________________________________________ _ FeO __ ------- ___ ------------ ____ --------- ________ ------MgO ___ -------------- ______ --~---------- ______ --------CaO __________________________________________________ _ Na20 ____ ------~----------- ------------------- ________ _ K20 ___ ------------------------------------------------H 20+ __ - -----------------------------------------------H20-_ -------------------------- ___ ------------- ______ _ Ti 02. _________________________________________________ _
P20s.- ------------------------------------------------MnO _ -------------------------------------------------C 02-------- _- ------ __________________________________ _ Cl ____________________________________________________ _
F- -----------------------------------------------------
KI-115
0-.1
48.29 11.48 1. 59
10.03 13.58 9.85 1. 90 .44 .05 .05
2.33 .23 .18 . 01 .02 .03
KI-100 KI-102 KI-104
0.1-.5 2-2.5 4--4.5
Chemical analyses
48.83 12.38 2.15 9. 41
11.08 10.64 2.02 .47
. 03 ---------- ----------2.47. ---------- ----------.24 ---------- ---------.17 ---------- ----------
. 02 ----~----- ----------
.03 ---------- ----------
Sample and depth (feet)
KI-105 KI-106
5-5.5 6-7
46.67 ----------9.65 ----------
1 13.01 ----------
19.05 ----------8.19 ----------1.58 ----------.38 ----------
. 03 ----------2.09 ----------.18 ---------.17 ----------
. 01 ----------
.02 ----------
KI-107
7.5-8
45.61 8.33 2.12
10.02 23.06
6. 98 1.33 .32
KI-108 KI-109
9-9.5 10.5-11
. 04 ---------- ----------1.70 ---------- ----------.16 ---------- ---------.17 ---------- ----------
. 02 ---------- ---------
.02 ---------- ·----------
KI-110
11-11.5
45.50 8.17 1. 60
10.44 23.87
6. 79 1. 28 . 31
.04 1. 54 .15 .17
.01
.02
SubtotaL __________________ -------- ___ ------------ 100. 06 99.94 ---------- ---------- (2) ---------- 99.88 ---------- ---------- 100.39 Less o __________ --------------------------------------- . 01 .01 ---------- ---------- ---------- ---------- . 01 ---------- ---------- . 01
TotaL ____________________________________________ _ 100.05 99.93 99.87 99.88
Norms
KI-112 (melt)
22.5
49.27 12.10 1. 77 9.89
10.46 9.65 2.25 . 65
.03 3.30 .30 .17
.02
.04
99.90 .02
99.88
Q ______________________________________________________ ---------- ---------- ---------- ---------- ---------- ---------- ---------- ---------- ---------- ---·------ ----------or______________________________________________________ 2. 60 2. 78 __________ __________ 2. 25 1. 89 ---------- ---------- !. 83 3. 84 ab_ ---------------------------------------------------- 15.80 16.94 ---------- __________ 13.29 11.10 ---------- ---------- 10.75 18.88 an_---------------------------------------------------- 21.64 23.41 ---------- __________ 18.16 15.89 ---------- ---------- 15.67 21.08 di: wo __________________________________________________ _
10.68 11.55 ---------- ---------- 8.85 7.34 ---------- ---------- 7.07 10.28 en ______ --- __________________________________________ _ 7.07 7. 54 ---------- ---------- 6. 21 5.34 ---------- ---------- 5.C9 6.64 fs ______ -- ___________________________________________ _ 2.84 3. 21 ---------- ---------- 1. 89 1. 32 ---------- ---------- 1. 34 2. 95 hy: en __________________________________________________ _
12.57 13.64 ---------- ---------- 10.61 10.69 ---------- ---------- 9. 30 15.75 fs ___________________________________________________ _ 5.05 5. 80 ---------- ---------- 3.22 2. 64 ---------- ---------- 2.44 6. 99
ol: fo ___________________________________________________ _ 9.93 4.49 ---------- ---------- 21.45 29.00 ---------- ---------- 31.56 2.56 fa ___________________________________________________ _
4.40 2.11 ---------- ---------- 7.18 7.88 ---------- ---------- 9.14 1. 25 mt ____________________________________________________ _ 2. 31 3.12 ---------- ---------- 2.32 3.07 ---------- ---------- 2.32 2. 57 iL ___ --- ______________________________________________ _ 4.43 4.69 ---------- ---------- 3.97 3.23 ---------- ---------- 2. 92 6. 27
ap------ -----------------------------------------------hL ____________________________________________________ _ .54 . 57 ---------- ---------- .43 .38 ---------- ---------- .36 . 71 .03 .03 ---------- ---------- .02 .03 ---------- ---------- .02 .03 fr _____________________________________________________ _ .04 . 04 ---------- ---------- .02 .03 ---------- ---------- .03 .05
Total ________ ------- ______ ----------- ___ ----------- ·99. 93 99.92 99.87 ---------- 99.83 ---------- ---------- 99.84 99.85
Modes
Phenocrysts: Olivine __________________________________ ---------- 4 Groundmass: .
Pyroxene __ --------------------------------------- ___ ---------- 54 Plagtoclase ________________ ---------- ___ -------------- ---------- 19 Opaques ____ ----------------------------------------- ---------- 3 Glass________________________________________________ _ _ _ _ _ _ _ _ __ . 20
I Total iron calculated as Fe203. For norm, 10.27 percent allocated to FeO. 2 Partial analysis, total omitted.
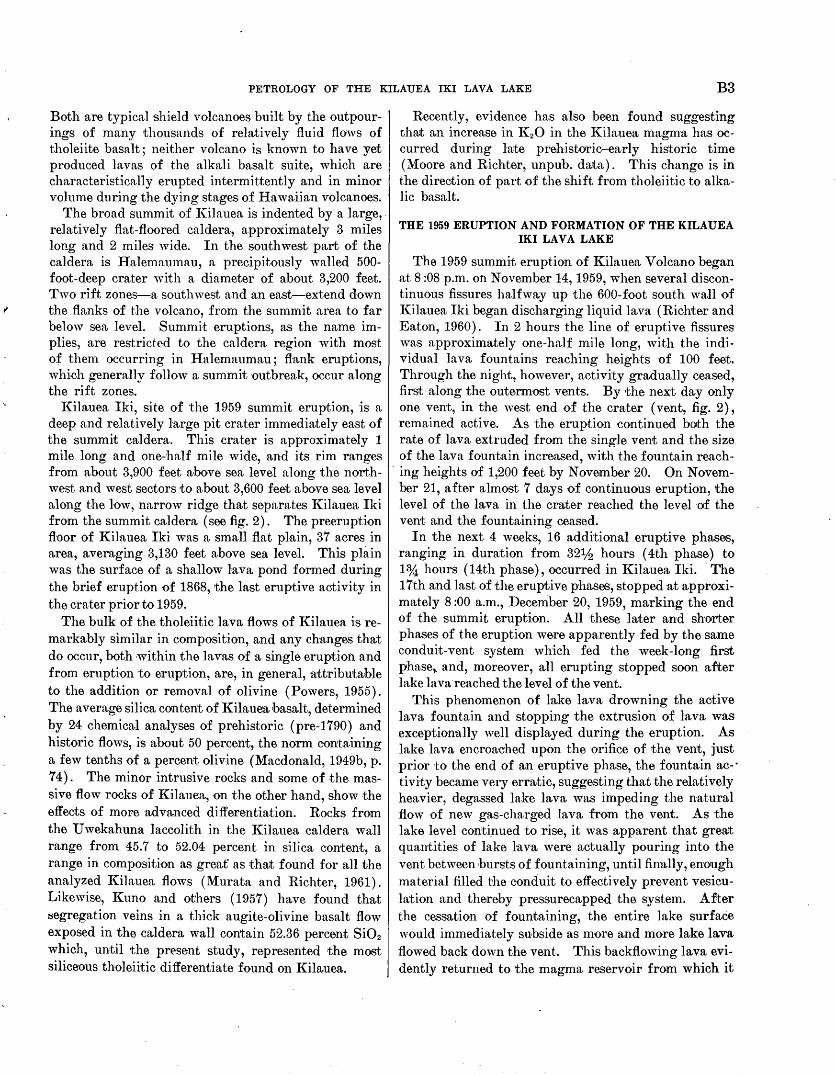
The extreme variation in chemical composition of the olivine basalts is controlled principally by the physical addition or removal of olivine phenocrysts. The content of modal olivine ranges from 2 percent (sample KI-184) to 37 percent (sample l{l-109), effecting changes of more than 4 percent in silica and more than 15 percent in magnesia. This pronounced olivine control (Powers, 1955) on the composition of the basalts is best demonstrated by the silica-variation diagram in figure 10. Each of the major constituent oxides, when plotted against Si02 , defines a_ unique straight line between about 50 percent Si02 and the plot for the com-
17
51 24 5 3
14 32 10 33 37 35 4
55 38 55 37 39 38 18 21 24 27 25 17 21 5 8 4 6 4 6 5 0 2 2 1 1 1 <1 3 74
3 Very dark glass, probably includes some opaques.
position of hypothetical olivine (Fat5 ) at 40 percent. Si02 • Rocks containing more than about 50 percent. Si02 and less than 7 to 8 percent MgO are, in general, olivine poor and hence are unaffected by olivine control.
Although the modes of the groundmass minerals in the olivine basalts vary widely depending on the concentration of phenocrystic olivine, the relative proportions of these minerals in the glass-poor basalts are fairly constant. The most striking constancy of volume ratios is between clinopyroxene ( 37 to 65 mode percent) and plagioclase (19 to 33 mode percent), which, with only a few exceptions, is remarkably close

TABLE 3.-0hemical analyses, norms and modes of rocks from hole 2, Kilauea Iki lava lake
[Results in percent. Analyses by D. F. Powers, except samples KI-184 and Kl-186 by C. T. Parker]
Sample and depth (feet)
KI-150 Kl-151 Kl-152 Kl-153 KI-154 Kl-155 Kl-156 Kl-157 KI-158 Kl-159 Kl-160 Kl-161 KI-163 KI-164 Kl-165 Kl-167 KI-168 KI-169 Kl-184 Kl-185 Kl-186
1---- -~---1 I I I I I ~--- -I - I I I I I I I I I o-1. 2512. 2H ~- 25 5. 2&-5. 76. 4-6. 75 e. 7>-7 7-7. 5 8.5-ll. 5 9. s-10. 1 10. 1-10. 510. o-u. •ln. 9-12. 8 26.52-27 ~ 21. &-27. • 27.!>-29. 1 29.>-29. 1 29. 7-29. • 20. 9-ilO. 4 31. 8-32. 8 32. 8-33. 5 34. 3-35
Chemical analyses
8102-------------------- -------- -------- -------- 46.53 -------- 48.12 47.93 46.96 49.16 48.41 47.90 --------- --------- 48.45 48.98 --------- 48 .. 74 .--------- 49.61 --------- 49.20 Al20s-- ---------------- -------- -------- -------- 9.49 -------- 11.43 11.18 9. 90 12.54 11.80 11. 17 --------- --------- 11.64 12.05 --------- 11.60 --------- 12.91 --------- 12.32 Fe20a- _ --------------- _ -------- -------- -------- 2.16 -------- 2.26 2.46 2.13 1.83 2.81 2. 41 --------- --------- 1.04 1.39 --------- 1. 38 --------- 1. 60 --------- 1. 26 FeO ______ --- _ -------- __ -------- -------- -------- 9. 79 -------- 9.46 9.36 9. 72 10.02 8.91 9.36 --------- --------- 10.37 10.17 --------- 10.18 --------- 9. 68 --------- 10.13 MgO ___________________
-------- -------- -------- 19.28 -------- 13.65 14.33 18.31 10.05 12.52 14.64 --------- ------- ...... 13.23 11.18 --------- 12.35 --------- 8.84 --------- 10.51 CaO ___ --------------- _ -------- -------- -------- 8.18 -------- 9.87 9.64 8.58 10.55 10.18 9.58 --------- --------- 10.13 10.83 --------- 10.45 --------- . 10.96 --------- 11.05 Na20- _ ---------------- -------- -------- -------- 1.54 -------- 1. 89 1.86 1. 58 2. 09 1. 93 1. 82 --------- --------- 1. 89 1. 73 --------- 1. 67 --------- 2.24 --------- 2. 02 K20 ______ -------------- -------- -------- -------- .38 -------- . 46 .45 .37 . 56 .48 . 41 --------- --------- .45 .80 --------- . 79 --------- .55 --------- .48 H20+ ---~- -------------- -------- -------- -------- . 08 -------- . 03 . 01 . 00 . 06 .08 . 00 --------- --------- . 09 . 02 --------- . 04 --------- . 02 --------- .04 H2o-___________________
-------- -------- -------- .04 -------- . 05 . 04 . 00 . 02 .02 . 02· --------- --------- . 00 . 00 --------- .01 --------- .01 --------- . 02 Ti02- _: ________________ -------- -------- -------- 1.99 -------- 2.34 2.32 2.01 2. 73 2.47 2.24 --------- --------- 2.35 2. 48 --------- 2.44 --------- 3. 03 --------- 2. 50 P206--- --.- --~ --------- -------- -------- -------- .18 -------- .22 .21 .19 . 26 .23 . 21 --------- --------- .23 .24 --------- .23 --------- .27 --------- .23 Mn 0 __________________
-------- -------- -------- .18 -------- .18 .18 .18 .18 .18 .18 --------- --------- .18 .18 --------- .18 --------- .17 --------- .18 002-------------------- -------- -------- -------- .11 -------- . 04 . 02 .00 . 00 . 00 . 01 --------- --------- . 00 .01 --------- .01 --------- . 01 --------- . 01 CL--- ----- ___ .. ________ -------- -------- -------- . 01 -------- .03 . 02 . 01 .02 .01 . 01 --------- --------- . 01 .01 --------- . 02 --------- . 01 --------- . 02 F--- ------------------- -------- -------- -------- . 03 -------- .04 . 03 . 03 . 04 . 03 . 03 --------- --------- . 03 . 03 --------- . 03 --------- .04 --------- .04 s _______________________ -------- -------- -------- . 00 -------- .00 . 02 . 01 . 01 . 01 . 00 --------- --------- . 01 .01 --------- . 00 --------- --------- --------- --------
SubtotaL----------J--------j--------j--------J 99.97j--------jl00.07jl00.06j 99.98,100.121 100.07 Less 0----------------- -------- -------- -------- . 01 -------- . 03 . 02 . 02 . 03 . 02
99.99 J---------J---------I 100.10 I 100.11 I---------I 100.12 I---------I 99.95 J---------l 100.01 . 01 --------- --------- . 02 . 02 --------- . 01 --------- . 02 --------- . 02
TotaL-------------'--------1--------'--------1 99.96 1--------1100.04 1100.04 I 99.96 1100.09 I 100.05 99.98 1---------'---------1 100. os I 100.09 1---------' 100.11 1---------' 99.93 1---------' 99.99
Norms
~-~~=== ==== = === = ==== ===1 ==== ==== 1 ====== = = 1 == ====== 1--~r~r 1 == ==== ==1·-~r ~r~--~r~r ~--~r ~r~-- ~ r~-~---~r rs -~---~r~rl ==== ===== 1===== ====!-- -~~:gr ~---~r~-1 ==== =====~---~r~rl ==== ===== ~---~r ~r 1 ===== ====~---~rrz an. _____________________________________________ 18.60 ________ 21.72 21.04 18.87 23.26 .. 22.16 21.20 ------------------ 21.99 22.86 --------- 21.97 --------- 23.65 --------- 23.28 m: .
wo ___________ -----. __ -------- -------- -------- 8.62 -------- 10.68 10.54 9. 31 11.34 11.14 10.35 --------- --------- 11.11 12.17 --------- 11.78 --------- 12.00 --------- 12.45 en _________________ . __
-------- -------- -------- 6.16 -------- 7.28 7.30 6.60 7. 07 7. 70 7.17 --------- --------- 7.18 7.65 --------- 7.58 --------- 7.37 --------- 7.68 fs ____________________ -------- -------- -------- 1. 70 -------- 2. 56 2.38 1. 89 3. 59 2. 54 2.33 --------- --------- 3.18 3. 78 --------- 3.42 --------- 3. 94 --------- 4. 04 by:
en ________ . _____ ----._ -------- -------- -------- 13.78 -------- 13.97 13.61 12.13 13.88 14.78 13.68 --------- --------- 11.24 12.70 --------- 12.98 --------- 13.86 --------- 12.26 fs _____________ . ____ . _ -------- -------- -------- 3.80 -------- 4. 92 4.43 3. 48 7. 04 4.87 4.44 --------- --------- 4.99 6.27 --------- 5.85 --------- 7. 41 --------- 6.45
ol: fo ____________________ -------- -------- -------- 19.67 --- ............. 8. 93 10.35 18.84 2.85 6.09 10.93 --------- --------- 10.18 5.24 --------- 7.14 --------- .54 --------- 4.36 fa ____ . _________ . ____ . -------- -------- -------- 5.98 -------- 3. 47 3. 71 5. 95 1. 60 2.21 3. 91 --------- --------- 4. 98 2.85 --------- 3.54 --------- .32 --------- 2.53
mt_ -------------------- -------- -------- -------- 3.13 -------- 3.28 3.57 3. 09 2.65 4.07 3.49 --------- --------- 1. 51 2. 02 --------- 2.00 --------- 2.32 --------- 1. 83 il_ __ --- ----------------- -------- -------- -------- 3. 78 -------- 4.44 4.41 3.82 5.18 4.69 4.25 --------- --------- 4.46 4. 71 --------- 4.63 --------- 5. 75 --------- 4. 75
~t:~~==== ==== ==== ~==== = -------- -------- -------- .43 -------- . 52 .50 . 45 . 62 .54 .50 --------- --------- .54 . 57 --------- .54 --------- .64 --------- .54
.02 -------- . 05 . 03 . 02 . 03 . 02 . 02 --------- --------- . 02 . 02 --------- .03 --------- . 02 --------- . 03 fr _____________________ . -------- -------- -------- . 05 -------- . 06 .04 .04 .06 .04 .04 --------- --------- .04 .04 --------- . 04 --------- . 06 --------- . 06 nc ______________________ -------- -------- -------- .26 -------- .10 . 05 -------- -------- --------- .02 --------- --------- --------- . 02 --------- .02 --------- . 02 --------- .02 pr ______________________ -------- -------- -------- -------- -------- -------- .04 . 02 . 02 . 02 --------- --------- --------- . 02 . 02 --------- --------- --------- --------- --------- --------
TotaL _____________ I _______ .I _______ J _______ _I 99.87 1--------1 99.99 1100.00 I 99.99 1100.03 99.96 99.95 1---------1---------' 100.01 I 100.09 1---------' 100.05 1---------' 99.90 1---------' 99.94
Modes
Phenocrysts: Olivine___ 15 5 29 19 25 7 23 32 5 8 --------- 14 7 11 7 6 8 20 2 6 Groundmass:
Pyroxene_____________ 47 53 41 49 44 59 46 40 65 56 --------- 55 55 50 50 45 42 27 50 43 43 Plagioclase___________ 21 26 24 20 22 25 24 20 20 24 --------- 23 24 24 21 21 17 11 28 24 21
&f:S~~~~~============ 1~ ~ ~ 8 7 9 5 6 11 12 --------- 8 7 5 5 4 3 1 7 5 3 4 2 0 2 . 1 1 Tr. 0 8 10 17 24 30 I 41 13 22 26
Apatite ______________ ------------------------ Tr. Tr. -------- ________ Tr. Tr. Tr. _.,. _______ --------- --------- --------- · Tr. Tr. Tr. --------- Tr. Tr. Tr.
1 Probably includes some opaques.
t-c:l 1::<.1 8 ~ 0 t-4 0 0 ~
0 ~
~ 1::<.1
p:j ~
t:-4
~ 1::<.1
>
8 t:-4
~ t:-4 > p:j 1::<.1
t:d 1-' ~
B16 THE 1959-60 ERUPTION OF KILAUEA VOLCANO, HAWAII
TABLE 4.-Modes of rocks from hole 3, Kilauea Iki lava lake [KI-228: Diabase segregation]
Sample and depth (feet)
KI-200 KI-203 KI-207 KI-209 KI-210 KI-213 KI-216 KI-217 KI-220 KI-223 KI-225 KI-228 KI-231 KI-233 KI-234 KI-236 (melt)
0.1-0.4 2-2.5 5-6 8-9 11-12 14-15 17-18 21-22 24-25 27-28 29-31 33-34 36.7-37.4 37.7-39 40.8-41.6 41.6-41.7 -----------·1------------------------------------------------.Phenocrysts: Olivine_________ 12 23 Groundmass:
Pyroxene_________________ 41 42 Plagioclase_______________ 22 21 Opaques__________________ 10 11 Glass_____________________ 15 3 Apatite ___________________ -------- --------
(j') UJ Cl x 0 a::: UJ :I: f-0 u.. 0 UJ ~ <{ f-z UJ (.) a::: UJ a...
24
23
22
21
20
19
18
17
16
15
14
13
12
11
10
9
8
7
6
5
4
3
2
0 44
12
11
G1,.0
45 46
w _j
0 J:
rtl u.i w N _j 0 0 0 J:
z 0 f= <( (.!)
(\j w 0:: (.!) w (/)0
w _j
0 J:
...: _j
w
<>
•
47 48 49 50 51 52 53 54 55
PERCENTAGE OF SiO 2
FIGURE 10.-Silica-variation diagram of all analyzed crust rocks and melt samples from Kilauea Iki lava lake. Calculated average composition of Kilauea Iki lava (K. J. Murata, unpub. data) is shown by + at 48.21 percent Si02. Lines drawn through the oxide plots below 49.61 percent Si02 represent olivine (Fa15) control lines. Note change in scale for total iron.

PETROLOGY OF THE KILAUEA IKI LAVA LAKE B17
to 2: 1. In the olivine basalts with more than about 20 to 30 mode percent interstitial glass, on the other hanrl, there is a marked increase in the volume ratio of clinopyroxene to plagioclase. Melts collected at the base of the crust contain, after quenching, bet-ween 30 and 74 mode· percent glass, and the volume ratio of clinopyroxene to plagioclase is consistently greater than 2.5: 1 and is as high as 4.5: 1 (sample KI-236). These relations suggest that clinopyroxene begins to crystallize at somewhat higher temperatures than plagioclase in the melt.
The olivine phenocrysts in the crust range in size from 0.08 to over 4 mm in diameter. In the upper 2 to 3 feet of crust, olivine is euhedral to slightly rounded; below 3 feet, however, and throughout the remainder of the crust, it is highly rounded and embayed due to resorption by the melt. Evidence of reaction between the olivine phenocrysts and melt is spotty and inconsistent. Abnormal concentrations of clinopyroxene around the margins of the olivine were observed below a depth of 27 feet in hole 2 and below a depth of 5 feet in hole 3. Yet in hole 1 no apparent coronas were evident. Small crystals of hypersthene(~) were present on resorbed olivine crystals at a depth of 2 to 2.5 feet in hole 3 (sample I\:I_:_203) but were not observed to bear this relation elsewhere in the crust. The composition of five olivine separates from depths of 2 to 2.5, 8 to 9, 17 to 18, 29 to 31, and 37.7 to 39 feet in hole 3 ranged from Fa14 to Fa17 • No consistent relation between composition and depth is apparent, and the olivine crystals show no evidence of zoning.
Clinopyroxene, the most abundant groundmass mineral in the olivine basalts, occurs as small, stubby hypidiomorphic prisms and irregular grains averaging 0.05 mm in diameter. Sparse microphenocrysts as much as 0.6 mm in diameter and with ragged crystal outlines were observed scattered through the groundmass in a few sections at a depth of more than 14 feet in holes 2 and 3. A tendency toward a subophitic intergrowth is discer_nible in some of the sections, but in general the clinopyroxene crystals are smaller than the plagioclase laths. This is a rather curious feature inasmuch as the clinopyroxene begins to crystallize at slightly higher temperatures and has a higher ratio to plagioclase in the glassy rocks than in the holocrystalline rocks. Glomerocrystic clots of clinopyroxene and plagioclase are common in the vitric basalts at the surface of the crust but are absent in the glass-rich basal zone. In this basal zone and the underlying melt· the clinopyroxene is present as minute perfect euhedra dispersed through the glass. Zoning is not apparent in
either the microphenocrysts or groundmass clinopyroxenes, but the latter do exhibit simple twinning. The groundmass clinopyroxenes are augitic with an approximate composition of W 04oEn5oFS1o (large 2V, y= 1.710) ; no optical properties indicative of pigeonite were observed. Clinopyroxene with Fs: En approximately 17: 83 is apparently in equilibrium with olivine Fa14 to Fa11.
The plagioclase occurs as hypidiomorphic laths, plates,. and needles as much as 1 mm in length. In the clinopyroxene-plagioclase glomerocrysts typical of the vitric basalts at the top of the crust, the plagioclase commonly occurs as radiating star-burst clusters of laths, each lath mantled by a concentration of small clinopyroxene crystals. Slight zoning was observed in some of the larger crystals. The composition of the plagioclase at a depth of 34.3 to 35 feet in hole 2 (sample KI-186) is Ans4·
Hypersthene is rare in the basalts and was neYer observed to exceed more than 1 percent by volume of the rock. Small crystals, probably of hypersthene, were observed on resorbed olivine phenocrysts near the surface in hole 3 (sample KI-203), but elsewhere hypersthene forms relatively large (as much as 0.1 mm) irregular to blocky prisms scattered through the groundmass. In the m-odal analyses (tables 2, 3, and 4) the minor amount of hypersthene· is included in modal pyroxene.
Opaque minerals occur in a variety of forms in the groundmass and constitute between 3 and 12 percent of the total volume of the rock. Within 10 feet of the surf·ace the opaque minerals generally form irregular masses with abnormally high concentrations around the periphery of the vesicles. · At depths greater than about 10 feet they tend to be more regular in outline, forming rods, equant crystals, a.nd chainlike groups of equant crystals· as much as 1 mm in length. Although no large crystals of opaque minerals were observed in the melt, the general opacity of the melt glass is probably due in part to included opaque microlites. AU of the opaques appear to be strongly ferromagnetic and hence rich in magnetite. The high titania content of the basalts, however, strongly indicates the presence of ulvospinel (FeTi04) molecule in the magnetite and probably primary ilmenite as well.
Minute needlelike crystals of apatite( n occur in trace amounts throughout much of the glass and are especially common in the glass-rich basalt in the transient zone of crystallization. The needles occur singly and in tufted groups.
Cristobalite was first identified in cores from hole 4 drilled December 3 to 6, 1962. It was not observed

'\,
Bl8 THE 1959-60 ERUPTION OF KILAUEA VOLCANO, HAWAII
In any core from the earlier drill holes. The cristohalite occurs as well-formed white pseudoisometric crystals as much as one-half mm in size lining vesicles. It occurs in much of the core in the interval11.9 to 15.9 feet and also near the bottom of the interval15.9 to 19.9 feet. Some of the rock probably contains up to 1 percent cristobalite, and all the rock containing the mineral is otherwise rather normal-appearing olivine basalt with 10 to 20 percent olivine. The temperature range of the cores containing the cristobalite was 400° to 615° C ~t the time of collection, and hence the cristohalite crystallized at a higher temperature range. Because it occurs only in vesicles in olivine-rich rocks, the cristobalite must have crystallized from hot gases streaming through the crust from the melt below. Such gas transfer indicates depletion of Si02 in the melt and enrichment of Si02 in the crust.
The glass content decreases from about 80 mode percent in the rapidly chilled upper inch of crust to 0 to 3 mode percent below a depth of 5 feet (figs. 7, 8, and 9). About 6 feet above the base of the crust, at the top of the transient zone of crystallization, the glass content again increases and reaches approximately 30 mode percent (sample l{l-168) at the crust-melt contact. Most of the glass in the upper part of the crust is dark brown to nearly opaque, typical basaltic glass ( n= 1.61 to 1.63) probably corresponding to compositions of 49.02 to 49.85 percent Si02 and 7.44 to 10.20 percent MgO (K. J. Murata, unpub. analyses of glass from 1959 eruption). The low-silica and high-magnesia content of some of these glasses indicates that they would have crystallized significant -amounts of magnesian olivine if they had not been quenched. The glass in the lower part of the crust and melt is discussed in more detail in the following sections.
TRANSIENT ZONE OF CRYSTALLIZATION
Although the rocks in the zone of crystallization are virtually all olivine basalts, similar mineralogically and chemically to the overlying holocrystalline basalts, the unique ·character of the zone and significance of the included magmatic fluids warrants a separate description.
The base of the transient zone of crysta-llization is the ernst-melt contact. Here, as previously described, the transition between crust ( <30 percent liquid) and melt (>30 percent liquid) is relwtively abrupt and occurs within a thin zone not more than a few inches thick at about the 1065° C isotherm. The less well defined top of the zone, where pore liquid ceases to exist, lies 5 to 6 feet above the base of the crust at a pproximwtely the 970° C isotherm. As the crust of the lake grows, the
zone of crystallization will not only advance downward but will also increase in thickness owing to a decrease in the lake's thermal gradient.
The transient nature of the zone of crystallization is well illustrated in the two photomicrographs in figure 11. Figure 11A depicts the state of crystallization within the crust-melt contact (sample KI-168) at a depth of 29.7 to 29.9 feet and a;t a temperature of 1065° C (fig. 8) in hole 2 on April 13, 1961. The abundant glass, which constitutes 30 percent of the rook (table 3), pervades the entire groundmass and surrounds the crystals and crystal groups of clinopyroxene, plagioclase, and opaques. Figure 11B shows a thin section of core (sample KI -225) from the same depth ( 29 to 31 ft) , but collected about 14 mon~hs later (June 1, 1962) in hole 3 at a temperature of approximately 825° C (fig. 9). Crystallization is virtually complete, and only a trace of glass (table 4) remains in the groundmass. Moreover, the amount of opaque minerals has wbout doubled (from 3 percent in sample KI-168 to 7 percent in sample Kl-225) during the course of crystallization.
Unlike the glass in the upper part of the crust, which was quenched, the glass in the transient zone of crystallization represents a sample of residual pore liquid in equilibrium with the groundmass minerals at the temperature of sampling. Hence, the composition of these glasses is strongly dependent on temperature and exhibits marked changes through the relatively narrow
. zone of crystallization. The relationship between volume, temperature, and index of refraction of the glass in the base of the crust on October 1961 and June 1962 is shown graphically in figure 12. Upward from the base of the crust the index of refraction of the glass decreases, concomitant with a decrease in amount and temperature, from 1.61 (melt, sample KI-236) to 1.508 (sample, KI-231), 41j2 feet above the base. The color of the glass also changes through this interval from dark brown at the base to very pale brown. A very crude estimation of the composition of these glasses can he made by reference to the work of Stewart (1962) on the indices of refraction of fused Hawaiian rocks. Analyses showed that the melt glass with n= 1.61 corresponds to a composition of about 49 percent Si02, ·in good agreement with the assumed compositions for glass of similar index at the surface of the crust. Using Stewart's least-squares curve showing the relation between index of refra-ction and Si02 content for all rocks studied (both alkalic and· tholeiitic), we found that the lowest index of refraction (1.508) observed corresponds on the same curve to 59 percent Si02. However, because of ·a pnssible pronounced divergence between the

PETROLOGY OF THE KILAUEA IKI LAVA LAKE B19
FIGURE H.-Photomicrographs of crustal rocks from depths of 29 to 31 feet at two different periods during growth of crust. A. (upper), Resorbed olivine phenocryst in glass-rich groundmass from depth of 29.7 to 29.9 feet (temp 1065° C) on April 13, 1961. Groundmass minerals are clinopyroxene, plagioclase, and opaques. B ( lower), Resorbed olivine phenocryst in holocrystalline groundmass from depth of 29 to 31 feet (temp 825° C) on June 1,1962.
alkalic and tholeiitic index of refraction curves with increasing silica content, the lo"~> index glass may contain somewha:t more than 59 percent Si02 •
Two pore fluids from the base of the crust have boon analyzed ( taoble 5) . One is the diabase segregation (sample KI-228) described in the following section, and the other is a glass (sample KI-113) collected from
AMOUNT, IN PERCENTAGE BY VOLUME 0 10 20 30 40 50 60 70 80 90 100
31-
32-
33-
34-
' ' , ' '
Hole 2 Drdled Oct. 3-4, 1961
Temperature profile Oct. 5, 1961_
c~\, 35------- ~-------==,.---'
Melt
36-
37-
32-tw ~SEGREGATION
i ::~_::SJ f Cl.. I u.J I 0 35-1
I I I
36-\
Hole 3 On/led June I-ll, /962
Temperature profile June 21, 1962
1.56 1.58 1.60 1.62 1.64 1.66
INDEX OF REFRACTION (n)
lPIGURE 12.-Gra ph showing relation between volume percentage index of refraction, and temperature O'f interstitial glass in the transient zone of crystallization at two different periods during growth of crust.
the bottom of hole 1 (22.3 to 22.5 ft). The glass (n=l.569, Ste·wart, 1962) represents a low-viscosity liquid that oozed from the base of the e1·ust into hole 1 after the August 24, 1960, drilling and chanced to adhere to the end of a thermocouple used during a temperature-profile measurement. The glass contains 54.08 percent Si02 and 5.02 percent total alkalis-the most silica- and alkali-rich tholeiitic material ever analyzed from Kilauea. Neither the diabase segregation nor the glass ooze, however, are appreciably enriched in iron . The relative silica content of ·the two differentiates indicates that the ooze \Yas derived from a higher level in the transient zone of crystallization and at lower temperatures than the segregation.

B20 THE 1959-60 ERUPTION OF KILAUEA VOLCANO, HAWAII
TABLE 5.-Chemical analyses, norms, and modes of tholeiitic differentiates Kilauea Ilci lava lalce
[Results in percent. D. F. Powers, analyst]
Sample and depth (feet)
KI-ll3 (ooze, hole 1)
22.3-22.5
Chemical analyses
Si02---------------------------- 54. 08 AhOa- ------------------------ -- 1 13. 62 F0.10a----------- -- -------------- 213. 03 FeO ____________________________ ------------MgO_ ___ _ _ _ ___ _ _ _ _ __ _ _ _ _ _ _ _ _ __ _ 4. 26 CaO____________________________ 7. 03 ~a20--------------------------- 3. 32 K20-------------- ---------- ---- 1. 70 H20+ ______________________________________ _ H2o-________________ ___________ . 04 Ti02---- -------- --------------- 3. 37 P205-------------- ------ -------- ------------Mn 0 ___ ____________ _________________ ___ ___ _ C02- ___ --- ________________________________ _ CL _______________________________________ _ F_____________________ ____ ___ __ .13
SubtotaL_ __ ____ __________ __ (3) Less 0 _____________________________________ _
TotaL ____ ________________ _____________ _
Norms
Q--------------- ---------------or _____________________________ _ ab ____________________________ _ an ____________________________ _
di: wo __________________________ _ en __________________________ _ fs __________________ ________ _ _
hy :
6.27 10. 04 28. 08 15. 88
6. 23 2. 87 3.31
KI-228 (diabase segregation, hole 3)
33--34
50. 32 13. 35
1. 79 10.39 5.69 9. 89 2. 72
. 84
. 04
. 00 4. 40
. 41
. 19
. 00
. 02
. 06
100. 11 . 03
100. 08
3. 36 5.00
23. 06 21. 13
10.44 5. 60 4.49
en___________________________ 7. 74 8. 60 fs _- __ - - _ _ _ _ _ _ _ _ _ _ _ _ _ _ _ _ _ _ _ _ _ _ 8. 94 6. 2 0
cl: . fo _____________________________ ______________________ _ fa ___________________________________________________ _
mt_____________________________ 2. 17 2. 55 iL_____________________________ 6. 40 8. 36 ap _____________________________ 1.18 1. 01 fr__---- ------ ------------------ . 22 . 07
TotaL _______________ ______ _ 99. 33
Modes
Olivine ____________________________________ _ Pyroxene ___ _____ ____________ __ ____________ _ Plagioclase _________________________________ _ 0 paques _ ________________________ - ___ ------ _ Glass _________________________ ___ __________ _ Apatite ____________________________________ _
99. 87
Tr. 34 41
8 16
1
1 AJ,O,+P,o,. On basis of spectrographic analysis (P. Barnett, written commun.), 0.50 percent allocated for P 20, for norm.
2 Total iron calculated as Fe,Oa. For norm, 10.38 percent allocated to FeO. • Partial analysis, total omitted.
DIABASE SEGREGATIONS
Segregations consisting principally of mediumgrained clinopyroxene and plagioclase have been found in hole 3, at depths below 32 feet (fig. 9) . Two have been observed. The uppermost and largest segregation occurs between 32.8 and 34.1 feet (sample KI-228) and the smaller one, which is less than 0.1 foot thick, occurs at 38 feet. In thin sections of the largest segregation the equigranular clinopyroxene and plagioclase crystals form a hypidiomorphic to subophitic intergrowth with minor opaque minerals, olivine, apatite(?), and as much as 16 percent interstitial glass (fig. 13). No hy-
FIGURE 13.-Photomicrograph of diabase segregation with plain light (.A, upper) and crossed nicols (B, lower) showing hypicliomorphic-granular to subophitic clinopyroxene-plagioclase intergrowth. Large dark areas in upper middle and right middle parts are vesicles. Interstitial gla s with needlelike apatite(?) crystals occurs around the long opaque crystal aggregate and in the left middle part.

PETROLOGY OF THE KILAUEA IKI LAVA LAKE B21
persthene was observed. The crystals commonly project into and also grow within the abundant irregular vesicles and form a local diktytaxiticlike texture.
Plagioclase, the most abundant mineral of the segregations ( 41 mode percent), occurs as subhedral laths and plates averaging 1 mm in length and 0.2 mm in width. The crystals are zoned ranging from An55 to An4s, noticeably more sodic than the plagioclase in the olivine basalts. Subhedral to subophitic clinopyroxene, in subordinate amount ( 34 mode percent), occurs as unzoned and optically homogeneous crystals (2V=45°, y=l.72) averaging 1 mm in diameter. The clinopyroxene has a composition of W o35.5 Eri4G.5 Fs1s.o (table 6), containing a somewhat greater proportion of ferrosilite tha.n the groundmass augites of the olivine basalts. Olivine was not observed in thin section but was present in trace amounts in the heavy-mineral separates from the segregation. The olivine has an average composition of Fa26 ; slight zoning is apparent in some of the crystals. Although the segregation olivine is considerably richer in iron than the olivine in the basalt, the average magnesia content of the segregation olivine is still greater than that of the coexisting clinopyroxene .. This relation supposedly indicates nonequilibrium (l\tfuir and Tilley, 1957), a condition which appears untenable in view of the observed physical and mineralogical features in the segregation and enclosing rock. The opaque minerals are all strongly ferromagnetic and occur as elongate and equant crystals and as chains of equant crystals.
TABLE 6.-Com1J08ition of clinopyroxene from diabase segregation, sample IU-228A, hole 3
[Results in percent. J?. F. Powers, analyst]
Chemical analyses Composition
Si02--- ---------------------------------- 51.04 Wo ___________ ------------ 35. 5 Al20a------------------------------------ '3. 52 En ________________________ 46.5 Fe20a------------ ------------------------ 1. 67 Fs ____ -------------------- 18.0 FoO __ ----------------------------------- 9. 45 MgO ____ -------------------------------- 15.66 Cao _____________ ------------------------ 16.66 Na20- __ --------------------------------- . 44 K20- _ ----------------------------------- . 04 I-I20--- __ --- __________ -------------- __ _ _ _ . 00 'l'i02------------------------------------- 1.44
99.92
The interstitial glass ( n= 1.503) in the segregations represents an extreme tholeiitic differentiate. Unlike t.he glass in the transient zone of crystallization, however, it was app.arently solid when collected (fig. 12) and hence not in equilibrium with the crystal phases of the segregation at the collection temperature. In thin section the glass is colorless to very pale brown and contains fairly abundant needlelike growths of apatite( n. The work of Stewart (1962) indicates that the glass probably contains more than 60 percent Si02.
A chemical and modal analysis of the diabase segregation is presented in table 5. The relatively low-bulksilica content ( 50.32 percent), despite the predominance of silica-rich constituents (plagioclase, 55 percent Si02; clinopyroxene, 51.04 percent Si02; glass, 60 to 68 percent Si02), is apparently due to the 8 percent of opaque minerals. An interesting, but inexplicable feature of the segregation not observed in other siliceous tholeiitic differentiates from Hawaii, is the extremely rich TiOz content of 4.40 percent, which results in a high ilmenite norm of 8.36 percent. Moreover, in the ooze from hole 1, which is even richer in silica, the titania content is relatively low and comparable to titania values in other rocks of similar silica content. No abnormal changes in the remaining oxides, other than those attributable to fractional crystallization, are apparent.
MELT
The melt is that part of the iava lake with temperatures above 1065° C and is a viscous liquid containing variable amounts of crystalline olivine, minor clinopyroxene, and a trace or no plagioclase. Although the mineralogy and bulk chemistry of the melt (where sampled), crust, and original lavas are grossly similar, there is a marked enrichment in alkali content of the melt which appears to have significant petrologic implications. The melt in hole 1 (sample KI-112) is also abnormally high in titania, probably indicating some contribution of titania-rich interstitial liquid from the transient zone of crystallization.
In figure 14 are plotted the K 20: N a20 ratios, as a function of weight percent Si02, for all the analyzed samples from the Kilauea Iki lava lake. Also plotted is ,the average composition of the 1959 lavas (K. J. Murata, unpub. data) that filled the lake. The outstanding features shown by this plot are : ( 1) the uniform 1(20 : N a20 ratios for most of the crust rocks, including those of the average 1959 lava, and (2) the anomalously high ratios for the two analyzed melt samples (KI-112, table 1; J(I-168, table 2). Alkali ratios for the holocrystalline olivine basalts, most of the vitric-rich basalt in the transient zone of crystallization, and the average 1959 lava, consistently fall between 0.22 and 0.25, regardless of bulk-silica content. The melt in hole 1 (sample KI-112, depth 22.5 ft) and hole 2 (I\:I-168, depth 29.8 ft), on the other hand, have alkali ratios of 0.29 and 0.47 respectively. One sample, from the transient zone of crystallization (KI-165, depth 27.9 to 29.1 ft) about 1 foot above the melt in hole 2, also shows a marked increase in the alkali ratio. I-Iowever1 other samples from this zone (KI-164, depth 27.5 to 27.9 ft; I\:I-184, depth 31.8 to 32.8 ft; and KI-186, depth 34.3 to 35 ft) have a normal alkali con-
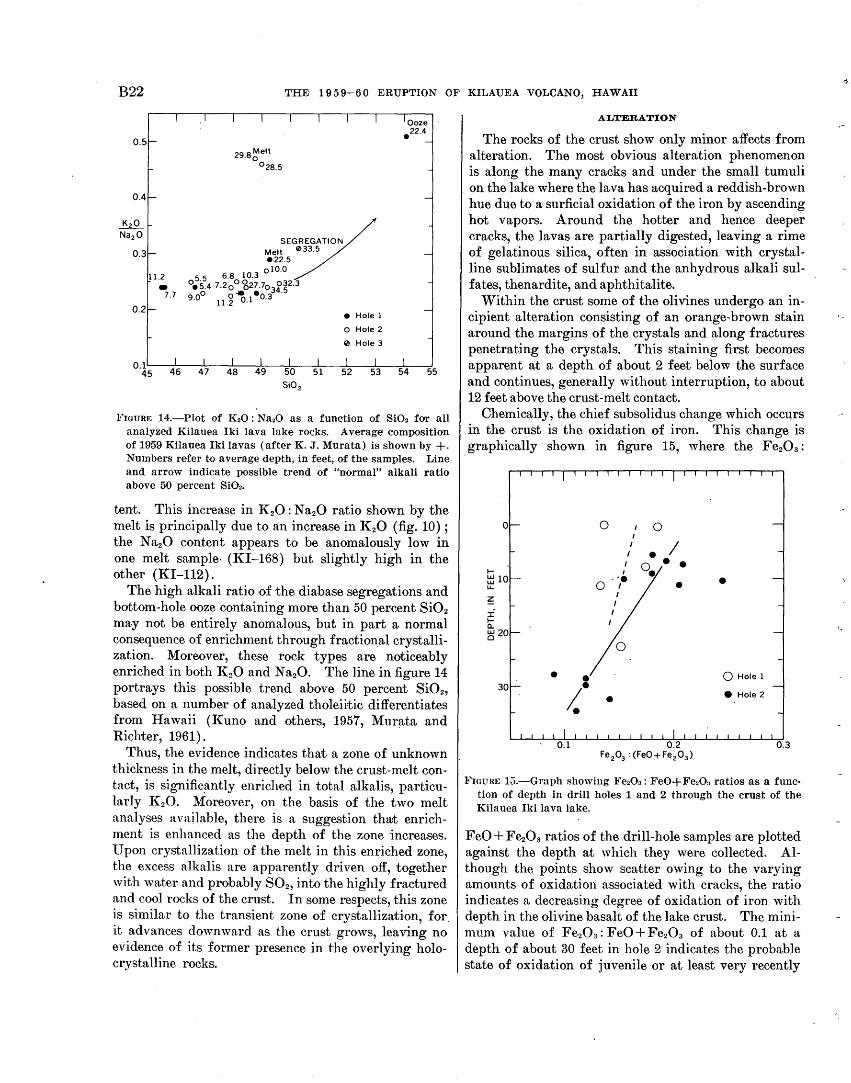
B22 THE 1959-60 ERUPTION OF KILAUEA VOLCANO, HAWAII
SEGREGATION Melt 033.5 e22.5
0 10.0 05.5 6.80 ~0.3 e5.4 7.2o o27.7o 032.3
0 .. • 34.5 9.0 11.~ 0.1 0.3
e Hole 1
o Hole 2
0 Hole 3
Ooze .22.4
55
FIGURE 14.-Plot of K20: Na20 as a function of Si02 for all analyzed Kilauea Iki lava lake rocks. Average composition of 1959 Kilauea lki lavas (after K. J. Murata) is shown by+· Numbers refer to average depth, in feet, of the samples. Line and arrow indicate possible trend of "normal" alkali ratio above 50 percent Si02.
tent. This increase in KzO : N a 20 ratio shown by the melt is principally due to an increase in K 20 (fig. 10); the N azO content appears to be anomalously low in one melt sample· (KI-168) but slightly high in the other (KI-112).
The high alkali ratio of the diabase segregations and bottom-hole ooze containing more than 50 per~ent SiOz may not be entirely anomalous, but in part a normal consequence of enrichment through fraction.al crystallization. Moreover, these rock types are noticeably enriched in both K 20 and N a20. The line in figure 14 portrays this possible trend above 50 percent SiOz, based on a number of analyzed tholeiitic differentiates from Hawaii (l(uno and others, 1957, Murata and Richter, 1961).
Thus, the evidence indicates that a zone of unknown thickness in the melt., directly below the crust-melt contact, is signific~ntly enriched in total alkalis, particularly K20. Moreover, on the basis of the two melt analyses available, there is a suggestion tha;t enrichment is enhanced as the depth of the zone increases. lTpon crystallization of the melt in this enriched zone, the excess alkalis are apparently driven off, together with water and probably 802 , into the highly fractured and cool rocks of the crust. In some respects, this zone is similar to the transient zone of crystallization, for. it advances downward as the crust grows, leaving no evidence of its former presence in the overlying holocrystalline rocks.
ALTERATION
The rocks of the crust show only minor affects from alteration. The most obvious alteration phenomenon is along the many cracks and under the small tumuli on the lake where the lava has acquired a reddish-brown hue due to a surficial oxidation of the iron by ascending hot vapors. Around the hotter and hence deeper cracks, the lavas are partially digested, leaving a rime of gelatinous silica, often in association with crystalline sublimates of sulfur and the anhydrous alkali sulfates, thenardite, and aphthitalite.
Within the crust some of the olivines undergo an incipient alteration consisting of an orange-brown stain around the margins of the crystais and along fractures penetrating the crystals. This staining first becomes apparent at a depth of about 2 feet below the surface and continues, generally without interruption, to about 12 feet above the crust-melt contact.
Chemically, the chief subsolidus change which occurs in the crust is the oxidation of iron. This change is
. graphically shown in figure 15, 'Nhere the FezOa:
0
I
I
0 . ..
I
~ I
I I
• ;_= • •
0 I
I I • • • •
0 Hole 1
e Hole 2
l!'IGUHE 1;:1.-Graph showing l!'e20a: FeO+Fe20a ratios as a function of depth in drill holes 1 and 2 through the crust of the Kilauea Iki lava lake.
FeO + FezOa ratios of the drill-hole samples are plotted against the depth at which they were collected. Although the points show scatter owing to the varying amounts of oxidation associated with cracks, the ratio indicates a decreasing degree of oxidation of iron with depth in the olivine basalt of the lake crust. The minimum value of FezOa : FeO + FezOa of about 0.1 at a depth of about 30 feet in hole 2 indicates the probable state of oxidation of juvenile or at least very recently
'·

PETROLOGY OF THE KILAUEA IKI LAVA LAKE B23
erupted I{ilauea lava. The increase of the ratio toward the top of the crust suggests that oxidation is proceeding from the top down and that· the oxidizing agents are of atmospheric origin.
In figure 15 the offset of the average curve of points of hole 1 as compared with that of hole 2 is a measure of the oxidation which has taken place in the crust during the approximate 1-year interval between drilling and sampling of the two holes.
The measured increase in the oxidation state of the iron is probably the result of several processes. The late crystallization of opaque minerals at the base of the crust has already been noted (fig. 11). These opaques, which probably are chiefly magnetite, presumably grow at the expense of FeO in the glass (or interstitial melt). Further oxidation of iron in olivine occurs at rather shallow depth and at low temperature and produces the. orange-brown staining referred to a)bove.
DIFFERENTIATION
Magmatic differentiation played and continues to play ·an important role in the crystalliz·ation of the tholeiitic rocks in the crust of the l{ilauea Ikilava lake. During ·the 3-year period between December 1959 and December 1962, the crust has grown from 0 to .more than 42 feet thick and fractional crystallization has resulted in ·compositional changes between 45.61 and at least 54.08 percent Si02. The petrographic and chemical data also strongly suggest that gas transfer may play an important role in desilication of the melt and that -a process of transient alkali enrichment occurs in the melt immediately below the crust-melt contact. These changes in the composition of the crust ·and underlying melt have, without much doubt, occurred after the beginning of the formatio~ of the crust and hence are not inherited, except indirectly, from original compositional differences in the lava of the 17 eruptive phases that filled the lake.
FRACTIONAL CRYSTALLIZATION
The changes in composition exhibited by most of the rocks are due to two processes of fra,ctional crystallization: gravity settling of heavy crystals and filter pressing. Gravity settling has influenced the composition of the entire crust, h11t is more apparent-at the present·time-only in the upper section. Filter pressing, however, is a more deep-seated process, dependent essentially on slow cooling, and is restricted to depths below about 20 feet.
In the upper 14 feet of crust the sinking of rela;tively heavy olivine crystals has produced a number of olivineric~ layers that contain as much as 37-mode-percent olivine and simultaneously leave a superstratum rela.-
tively poor in olivine (figs. 7, 8, and 9). The olivine accumulates rest upon thin layers of dense basalt, which probably represent partially digested portions of old crust emplaced during the period of crustal foundering at the end of the eruption. At depths of more than 14 feet there is a gradual but erratic decrease in olivine content (figs. 8 and 9). Olivine from this zone and the melt below is presum·ably building up a thick crystal accumulate at the base of the melt in the bottom of the lake.
The range in silica content from 45.61 to 49.61 percent in the crustal olivine basalts can be explained solely by the addition or removal of magnesian olivine by gravity settling (fig. 10). No evidence to support clinopyroxene removal by gravity settling, as advocated by Macdonald and Katsura ( 1961) has been found. On the basis of observations made during the 1959 summit eruption and 1960 flank eruption, augitic clinopyroxene begins to crystallize at about 1100° C (D. H. Richter, unpub. data). Hence, clinopyroxene can crystallize only in a zone extending upward from about 3 feet below t.l!e crust-melt contact (see temp profile, hole 2, table 1). However, inasmuch as the crystals formed are small (max size 0.08 mm) and the melt is viscous, it appears unlikely that the rate of crystal settling is greater than the ra~te o:f crustal growth. Possibly, in time, with a thicker crust and less steep thermal gradient, the sinking of early-formed clinopyroxene may play a- significant role in the differentiation of the lake lavas.
The efficacy of filter pressing as a differentiation mechanism in the lava lake is manifest by the presence of diabase segregations in hole 3 and the ooze from the bottom of hole 1. Both of these differentiates represent an interstitial liquid that was originally in equilibrium with crystallizing clinopyroxene and plagioclase in the transient zone of crystallization. Filter pressing becomes an effective separation process when a crystal mesh of sufficient cross-sectional density screens out crystals and allows only residual fluid to pass through. In the Hawaiian tholeiites, the Kilauea Iki lavas in particula.r, this condition is reached only after the crysta.Hization of most of the magnesian olivine and some of the clinopyroxene and plagioclase. The expelled liquid was apparently injected into local dilatant zones, such as the continuously forming shrinkage cracks, at somewhat higher levels in the crust than the source of the liquid. The ooze in the drill hole, however, was artificially released by the drilling and thus allowed the interstitial liquid to exude from the zone of crystallization and to collect in the bottom of the ho1e.
The course of differentiation exhibited by the segregations and ooze is towards enrichment in K 20, N a20,

B24 THE 1959-60 ERUPTION OF KILAUEA VOLCANO, HAWAII
and Ti02 with increasing· silica content (fig. 10). Alumina and total iron oxides remain virtually constant, and magnesia and lime show a marked decrease. Assuming that the liquid in the parent liquid -crystal melt (50 percent Si02) contained more than about 52 percent Si02, this trend would fall within a continuously changing clinopyroxene-plagioclase control field (Richter and others, 1964). The composition of the ·.differentiates may also be affected by enrichment in' potash and silica that is in addition to simple concentration through fractional crystallization.
A comparison of refractive indices (fig. 12) indicates that the ooze from hole 1 represents the residual liquid in an olivine basalt ( 5 to 10 percent modal olivine) after crystallization has been 76 to 78 percent complete. By inference from the index of refraction and the thermal-profile data in figure 12, this differentiate, which corresponds chemically to a quartz basalt, has a liquidus temperature of approximately 1040°C. The diabase segregations, because of their lower silica content, were evidently derived from less crystalline layers and at somewhat higher temperatures (1050° to 1060°C) deeper in the zone of crystallization. Although residual liquids persist to levels where temperatures are as low as 970°C, the small volumes of these interstitia1ly trapped liquids virtually precludes their egress in any substantial amount from the crust. However were it possible to continuously remove these lower temperature liquids, products approaching the composition of granite could readily be formed through fractional crystallization alone.
Analyses of the lava-lake rocks plotted on an AMF (alkali-magnesia-iron oxide) diagram (fig. 16) show
FIGURE 16.-AMF diagram of differentiation trend in Kilauea. Iki lava lake (solid circles), Uwekahtma laccolith, Kilauea (crosses), and Palolo diabase, Koolau, Oahu (open circles).
only a very moderate iron enrichment, markedly different from the high iron trend of the 'Skaergaard (Wager and Deer, 1939) or the so-called J{ilauea trend of J{uno and others (1957). The differentiation trend is practically identical with that shown by the U wekahuna laccolith in Kilauea caldera (Murata and Richter, 1961) and is very similar to that of the Koolau basalts and intrusives on the Island of Oahu (l{uno and others, 1957). Kuno and his colleagues proferred the term "IGlauea trend" because of an iron-rich segregation vein in an olivine basalt flow in the wall of Kilauea caldera; however, as shown in figure 16, iron enrichment in l{ilauea appears to be more the exception than the rule. Osborn ( 1959) has pointed out that changes in the partial presssure of oxygen in (p02) may be the controlling faetor in determining which trend-iron
. enrichment or alka1i enrichment-will be followed by a differentiating basaltic magma. _However, it seems difficult to believe that in the similar environment of the flows, intrusives, a-nd lava. la-ke on Kilauea, changes in p02 would be of sufficient magnitude to affect the course of crystallization.
ALKALI TRANSFER
Petrochemical studies of melt samples from the lava lake strongly suggest that a zone enriched in alkalis, especially 1{20, occurs in the melt directly beneath the crust-melt contact.. K 20 in this zone shows upward of 100 percent enrichment, resulting in a twofold increase in the K 20 : N a20 ratio. After crystallization proceeds through . this zone, the resulting. holocrystalline rock sho·ws a normal alkali content and alkali ratio. The thickness of the enriched layer is not known.
An attempt 'to explain this phenomenon is portrayed diagrammatically in ~the three sections in figure 17. At the erid. of the eruption in December 1959, the melt in the lake was probably nearly homogeneous, having an average K 20: Na20 ratio of 0.24 (fig. 17A). In fact, in 17 analyses of the lava that contributed to the filling of the lake. the alkali ratio ranged only from 0.23 to 0.26 (K. J. Murata, unpub. data). In August 1960, when the crust was 22 feet thick, the sampled melt had a K20: Na20 ratio of 0.29 (fig. 17B); and by April 1961 this ratio had increased to 0.47 (fig. 170). The olivine basa.lt samples from the crust r~tain an average alkali ratio about the same as that of the original lavas, regardless of their depth in the crust. In the remaining great bulk of melt beneath the alkali -enriched zone, there is evidently a complimen!tary decrease in the alkali ratio; however, the actual values shown in figures 17 B and 0 are highly· conjectural This process of alkali enrichment within the melt may be. similar to the mechanism advanced by Kennedy ( 1955). He has

PETROLOGY OF THE KILAUEA IKI LAVA LAKE B25
shown that under equilibrium conditions, water in a quiet magma;tic melt will have a uniform partial pressure throughout its entire volume. To achieve this condition, water by means of diffusion will migrate to, and concentrate in, areas of least confining pressures and lowest temperatures. Utilizing the data of Morey and Hesselgesser (1952) who found an extremely high solubility of alkali silicates in superheated water vapor, l{ennedy further reasoned that water and alkalis should tend to associa;te in a magma regardless of whether they are in solution or exist as a separate gas pi1ase. Hence it appears very reasonruble to expect that, in the lava lake, dissolved water in association with abundant alkalis will concentrate in the relatively low temperruturepressure zone beneath the crust-melt contact.
V pon crystallization of this enriched alkali-water zone and concomitant rapid decrease in pressure, ·the alkalis, in excess of that required to form plagioclase,
Melt
0.24
' End of eruption December 1959
Crust 22 ft thick August 1960
ilG~6·2DB~~· .. rzili~rtr~~~1j~t·t·t 0.47
------Melt------- ---------- ---- ----------------- -- ----------
) . 0.20? ~ om"';oc
c Crust 30 ft thick
April 1961
FIGURE 17.-Hypothetical sections through Kilauea Iki lava lake showing mechanism of alkali enrichment. Thickness of crust is exaggerated and solidified base is o·mitted.
are apparently released together with water vapor and other volatiles (fig. 17 B, 0). Migrating upwards, these volatile exhalations deposi·t crystalline sublimates of aphthitalite, thenardite, and sulfur in the ·cooler parts of the crust.
The petrologic implications of the ·alkali-enriched zone in the melt of the Kilauea Iki lava lake are great. Of particular importance is its bearing on the origin of the undersaturated alkali basalts. Macdonald ( 1949a, b) who has supported fractional crys•tallization to explain the genesis of the alkali basalts from a ·tholeiitic parent has alS'o stressed the possible role played by alkali transfer (1949a, p. 1584; 1949b, p. 91). However, it was not ·until the first drilling in the lava lake that demonstrable evidence was found to sustain these views
· (Macdonald and Katsura, 1961). Additional data gathered subsequently from the lava lake and presented in this paper corroborates the presence of an alkali-rich melt, at least in part, and demonstrates that Macdonald's one sample was not exceptional.
If processes similar to those presently active within the lava lake occur in the shallow (1 to 5 km deep) magma chambers of the Hawaiian volcanoes, there is convincing argument to support the deriva;tion of the alkali basalts from a primary tholeiitic magma. Throughout the early stages of Hawaiian volcanism, tholeii·tic lavas are erupted frequently -and voluminously without undergoing prolonged storage in the volcanic pile. With decadency, however, the tempo of eruptive activity declines. The processes of alkali enrichment and silica transfer in the Kilauea Iki lava lake may have upwards of hundreds of years to operate rather than only a few, and the lavas shift ·to the alkalic type. It is also significant that 'the total volume of alkalic lava erupted is very minor compared with the tremendous volume of tholeiitic basalt com posing the main bulk of the volcano. During the long periods of quiescence in the waning period of volcanism, extremely slow cool-· ing and relatively high lithostatic load should enhance the concentration of alkalis in the upper levels of the stagnant magma chambers and may also further the process of silica transfer. Although desilication of the ·magma through gas transfer still evades quantitative evalu~tion, it is an apparently important process and may well be the key in explaining the undersaturation of the alkalic basalts. Slow cooling will also significantly increase the efficacy of fractional crystallization in the magma. Not only will m·agnesian olivine he removed . from the upper part of ·the melt through gravity settling, but the early-crystallizing high-silica augitic clinopyroxenes should settle out as well. The formation of magnesian olivine and augitic accumulates in the shallow magma chambers is indicated by the great

B26 THE 1959-60 ERUPTION OF KILAUEA VOLCANO, HAWAII
abundance of periodoti'te and pyroxenite nodules in the alkalic flows (Richter and Murata, 1961), whereas such inclusions are almost unknown in Hawaiian tholeiites.
Eruptions of the postulated alkali-rich melt could be effected by an increase in vapor pressure that accompanies the concentration of H 20 in the residual melt in the uppermost parts of the magma chambers. The need for additional primary material from the mantle to act as an accessive force to cause eruption, as in the tholeiitic eruptions, doe,s not appear necessary. An explosive release of water vapor would follow any fracturing of the magma chamber. Indeed, the scattered occurrence of vents and apparent explosive character of Hawaiian alkalic eruptions implies a fairly shallow origin for the magma, such that fracturing from the magma chamber to the surface is geologically feasible.
Recently, evidence has been found to indicate the possible beginning of a shift to alkalic tendencies in J{ilauea Volcano (J. G. Moore and D. H. Richter, unpub. data). The K 20 : N a20 ratios of prehistoric and early historic tholeiitic basalts from Kilauea average about 0.19, while recent basalts average 0.24. This change is in the same direction as that of the change from tholeiitic to alkalic basalt and also of that in the changes observed in the lava lake.
Thus, it appears plausible that a combination of alkali and silica transfer and fractional crystallization of clinopyroxene within shallow.magma chambers may well explain the change from tholeiite to alkalic basalt observed in Hawaiian volcanoes. This is opposed to the views of Yoder and Tilley (1962) who, principally on the basis of laboratory studies, believe that neither a tholeiitic nor alkalic magma is the parent of the other but that each is derived as separate fluids· from the mantle. Although our arguments have been largely qualitative, further investigations on the slowly crystallizing Kilauea Iki lava lake should significantly add to the presently meager knowledge of magmatic chemical-physical processes.
REFERENCES
Kennedy, G. C., 1955, Some aspects of the role of water in rock melts, in Poldervaart, A., ed., Crust of the earth-a symposium : Geol. Soc. America Spec. Paper 62, p. 489-503.
Kuno, Hisashi, Yamasaki, Kazuo, Iida, Chuzo, and Nagashima, Kozo, 1957, Differentiation of Hawaiian magmas: Japanese Jour. Geology and Geography, v. 28, p.179-218.
Macdonald, G. A., 1949a, Hawaiian petrographic province: Geol. ~oc. America Bull., v. 60, no. 10, p. 1541-1596.
---1949b, Petrography of the island of Hawaii: U.S. Geol. Survey Prof. Paper 214-D, p. 51-96.
Macdonald, G. A., and Katsura, Takashi, 1961, Variations in _ the lava of the 1959 eruption in Kilauea Iki: Pacific Sci.,
v.15,no.3,p.358-369. Morey, G. W., and Hesselgesser, J. M., 1952, The system
H20-Na20-Si02 at 400° C:. Am. Jour .. Sci., Bowen Volume, pt. 2, p. 343-371.
Muir, I. D., and Tilley, C. E., 1957, The picrite-basalts of Kilauea, Pt. 1 of Contributions to the petrology of Hawaiian ·basalts: Am. Jour. Sci., v. 255, no. 4, p. 241-253. · .
Murata, K. J., and Richter, D. H., 1961, Magmatic differentiation in the Uwekahuna laccolith, Kilauea caldera, Hawaii: Jour. Petrology [Oxford, England], v. 2, no. 3, p. 424-437.
Osborn, E. F., 1959, Role of oxygen pressure in th_e crystallization and differentiation of basaltic magma: Am. Jour. Sci., v.257,no.9,p.609-647.
Powers, H. A., 1955, Composition and origin of basaltic magma of the Hawaiian Islands : Geochim. et Cosmochim. A eta, v.7,nos.1-2,p.77-107.
Rawson, D. E., 1960, Drilling into molten lava in the Kilauea Iki volcanic crater, Hawaii: Nature, v. 188, no. 4754, p. 930-931.
Richter, D. H., Ault, W. U., Eaton, J. P., and Moore, J. G., 1964, The 1961 eruption of Kilauea Volcano, Hawaii: U.S. Geol. Survey Prof. Paper 474-D, 34 p.
Richter, D. H., and Eaton, J. P., 1960, The 1959-60 eruption of Kilauea Volcano: The New Scientist, v. 7, p. 994-997; reprinted 1961 in Smithsonian Inst. Ann. Rept. 1960, p. 349-355.
Richter, D. H., and Murata, K. J., 1961, Xenolithic nodules in the 1800-1801 Kaupulehu flow of Hualalai Volcano, in Short papers in the geologic and hydrologic sciences: U.S. Geol. Survey Prof. Paper 424-B, p. B215-B217.
Stewart, D. B., 1962, Index of refraction measurements of fused Hawaiian rocks in Short papers in the geologic and hydrologic sciences: U.S. Geol. Survey Prof. Paper 450-B, p. B76-B78.
Tilley, C. E., 1950, Some aspects of magmatic evolution (presidential address] : Geol. Soc. London Quart. Jour., v. 106, pt. 1,no.421, p.37-61.
---1960, Kilauea magma 1959-60: Geol. Mag. [Great Britain], v. 97, no. 6, p. 494-497.
Ault, W. U., Eaton, J. P., and Richter, D. H., 1961, Lava tern- Wager, L. R., and Deer, W. A., 1939, The petrology of the peratures in the 1959 Kilauea eruption and cooling lake: Skaergaard intrusion, Kangerdlugssuaq, East Greenland, Geol. Soc. America Bull., v. 72, no. 5, p. 791-794. Pt. 3 of Geological investigations in East Greenland:
Ault, W. U., Richter, D. H., and Stewart, D. B., 1962, A tem- Meddel. Gr~nland, v. 105, no. 4, 352 p. perature measurement probe into the melt of the Kilauea · Yoder, H. S., and Sahama, T. G., 1957, Olivine X-ray determina-Iki lava lake in Hawaii: .Jour. Geophys. Research, v. 67,, tive curve: Am. Mineralogist, v. 42, nos. 7-8, p. 475-491. no. 7, p. 2809-2812. Yoder, H. S., and Tilley, C. E., 1962, Origin of basalt magmas-
Decker, R. W., 1962, Magnetic studies on Kilauea Iki lava an experimental study of natural and synthetic rock sys-lake, Hawaii [abs.] : Internat. Symposium Volcanology. tems; Jour. Petrology [Oxford, England], v. 3, no. 3, p. Abstracts, Tokyo, 1962, Sci. Council Japan, p. 6. 342-532.
U.S. GOVERNMENl PRINTING OFFICE: 1966 0-796-503
r
' r
Related Documents