ACPD 11, 7423–7467, 2011 Volatility and hygroscopicity of aging SOA in a smog chamber T. Tritscher et al. Title Page Abstract Introduction Conclusions References Tables Figures Back Close Full Screen / Esc Printer-friendly Version Interactive Discussion Discussion Paper | Discussion Paper | Discussion Paper | Discussion Paper | Atmos. Chem. Phys. Discuss., 11, 7423–7467, 2011 www.atmos-chem-phys-discuss.net/11/7423/2011/ doi:10.5194/acpd-11-7423-2011 © Author(s) 2011. CC Attribution 3.0 License. Atmospheric Chemistry and Physics Discussions This discussion paper is/has been under review for the journal Atmospheric Chemistry and Physics (ACP). Please refer to the corresponding final paper in ACP if available. Volatility and hygroscopicity of aging secondary organic aerosol in a smog chamber T. Tritscher 1 , J. Dommen 1 , P. F. DeCarlo 1,* , P. B. Barmet 1 , A. P. Praplan 1 , E. Weingartner 1 , M. Gysel 1 , A. S. H. Pr´ ev ˆ ot 1 , I. Riipinen 2,3 , N. M. Donahue 3 , and U. Baltensperger 1 1 Laboratory of Atmospheric Chemistry, Paul Scherrer Institut, Villigen, Switzerland 2 Department of Physics, University of Helsinki, Helsinki, Finland 3 Department of Chemical Engineering, Carnegie Mellon University, Pittsburgh, PA, USA * now at: AAAS Science and Technology Policy Fellow Hosted at the US EPA, Washington, DC, USA Received: 24 February 2011 – Accepted: 25 February 2011 – Published: 3 March 2011 Correspondence to: E. Weingartner ([email protected]) Published by Copernicus Publications on behalf of the European Geosciences Union. 7423

Welcome message from author
This document is posted to help you gain knowledge. Please leave a comment to let me know what you think about it! Share it to your friends and learn new things together.
Transcript
ACPD11, 7423–7467, 2011
Volatility andhygroscopicity of
aging SOA in a smogchamber
T. Tritscher et al.
Title Page
Abstract Introduction
Conclusions References
Tables Figures
J I
J I
Back Close
Full Screen / Esc
Printer-friendly Version
Interactive Discussion
Discussion
Paper
|D
iscussionP
aper|
Discussion
Paper
|D
iscussionP
aper|
Atmos. Chem. Phys. Discuss., 11, 7423–7467, 2011www.atmos-chem-phys-discuss.net/11/7423/2011/doi:10.5194/acpd-11-7423-2011© Author(s) 2011. CC Attribution 3.0 License.
AtmosphericChemistry
and PhysicsDiscussions
This discussion paper is/has been under review for the journal Atmospheric Chemistryand Physics (ACP). Please refer to the corresponding final paper in ACP if available.
Volatility and hygroscopicity of agingsecondary organic aerosol in a smogchamberT. Tritscher1, J. Dommen1, P. F. DeCarlo1,*, P. B. Barmet1, A. P. Praplan1,E. Weingartner1, M. Gysel1, A. S. H. Prevot1, I. Riipinen2,3, N. M. Donahue3, andU. Baltensperger1
1Laboratory of Atmospheric Chemistry, Paul Scherrer Institut, Villigen, Switzerland2Department of Physics, University of Helsinki, Helsinki, Finland3Department of Chemical Engineering, Carnegie Mellon University, Pittsburgh, PA, USA*now at: AAAS Science and Technology Policy Fellow Hosted at the US EPA, Washington,DC, USA
Received: 24 February 2011 – Accepted: 25 February 2011 – Published: 3 March 2011
Correspondence to: E. Weingartner ([email protected])
Published by Copernicus Publications on behalf of the European Geosciences Union.
7423

ACPD11, 7423–7467, 2011
Volatility andhygroscopicity of
aging SOA in a smogchamber
T. Tritscher et al.
Title Page
Abstract Introduction
Conclusions References
Tables Figures
J I
J I
Back Close
Full Screen / Esc
Printer-friendly Version
Interactive Discussion
Discussion
Paper
|D
iscussionP
aper|
Discussion
Paper
|D
iscussionP
aper|
Abstract
The evolution of secondary organic aerosols (SOA) during (photo-)chemical aging pro-cesses was investigated in a smog chamber. SOA from 10–40 ppb α-pinene wasformed during ozonolysis followed by aging with OH radicals. The particles’ volatilityand hygroscopicity (expressed as volume fraction remaining (VFR) and hygroscopic-5
ity parameter κ) were measured with a volatility and hygroscopicity tandem differentialmobility analyzer (V/H-TDMA). These measurements were used as sensitive physicalparameters to reveal the possible mechanisms responsible for the chemical changesin the SOA composition during aging: A change of VFR and/or κ during processing ofatmospheric aerosol may occur either by addition of SOA mass (by condensation) or10
by an exchange of molecules in the SOA by other molecules with different properties.The former process increases the SOA mass by definition, while the latter keeps theSOA mass roughly constant and may occur either by heterogeneous reactions on thesurface of the SOA particles, by homogeneous reactions like oligomerization or by anevaporation – gas-phase oxidation – recondensation cycle. Thus, when there is a sub-15
stantial change in the aerosol mass with time, the condensation mechanism may beassumed to be dominant, while, when the mass stays roughly constant the exchangemechanism is likely to be dominant, a process termed ripening here. Depending onthe phase of the experiment, an O3 mediated condensation, O3 mediated ripening, OHmediated condensation, and OH mediated ripening could be distinguished.20
During the O3 mediated condensation the particles volatility decreased (increasingVFR) while the hygroscopicity increased. Thereafter, in the course of O3 mediatedripening volatility continued to decrease, but hygroscopicity stayed roughly constant.After exposing the SOA to OH radicals an OH mediated condensation started with asignificant increase of SOA mass. Concurrently, hygroscopicity and volatility increased.25
This phase was then followed by an OH mediated ripening with a decrease of volatility.
7424

ACPD11, 7423–7467, 2011
Volatility andhygroscopicity of
aging SOA in a smogchamber
T. Tritscher et al.
Title Page
Abstract Introduction
Conclusions References
Tables Figures
J I
J I
Back Close
Full Screen / Esc
Printer-friendly Version
Interactive Discussion
Discussion
Paper
|D
iscussionP
aper|
Discussion
Paper
|D
iscussionP
aper|
1 Introduction
Secondary organic aerosols (SOA) are a major constituent of the atmospheric par-ticulate matter and originate from chemical transformation of primary volatile organiccompounds (VOC) to lower volatility products that partition into the condensed phase.Many studies have already been performed on SOA formation and properties (see5
e.g. references in Hallquist et al. 2009). One of the major challenges for SOA studiesis the multi-component composition of SOA with only few known substances amongthousands of unknown species. Field measurements show changing SOA propertieswith oxidative aging, but detailed studies of these processes under ambient conditionsin the lab are challenging and thus scarce (Rudich et al., 2007).10
It is challenging for the state-of-the-art chemical transport models to reproduce themeasured ambient organic aerosol concentrations (i.e. directly emitted primary organicaerosol (POA) and SOA formed from various precursors) with currently known chemicaland physical mechanisms (Volkamer et al., 2006; Hodzic et al., 2010). One importantchallenge in modeling SOA mass in the atmosphere or under laboratory conditions15
is the correct implementation of the gas-particle interactions such as the partition-ing effect Pankow (1994a,b). The semi-volatile nature of the SOA particles includingtheir gas-particle partitioning behavior was recently described by the volatility basis set(VBS) approach (Donahue et al., 2006; Robinson et al., 2007; Jimenez et al., 2009),which lumps the various organic compounds together according to their effective sat-20
uration mass concentration (C∗). This is the mass equivalent of the saturation vaporpressure, which controls volatility. Volatility is a key property of the organic compo-nents of the gas and particulate phase and it determines the SOA formation and thepartitioning between the phases.
Laboratory experiments e.g. in chambers span a wide range of semi-volatile oxy-25
genated organic aerosol (SV-OOA), but low-volatility oxygenated organic aerosol (LV-OOA), as found in ambient measurements of aged air masses, is still difficult to studyand reproduce under laboratory conditions (Jimenez et al., 2009). The atomic oxygen
7425

ACPD11, 7423–7467, 2011
Volatility andhygroscopicity of
aging SOA in a smogchamber
T. Tritscher et al.
Title Page
Abstract Introduction
Conclusions References
Tables Figures
J I
J I
Back Close
Full Screen / Esc
Printer-friendly Version
Interactive Discussion
Discussion
Paper
|D
iscussionP
aper|
Discussion
Paper
|D
iscussionP
aper|
to carbon ratio (O:C ratio) of SOA can be used to roughly split the mass to SV-OOAand LV-OOA components. It also allows the classification of organics within the VBSframework.
Formation of SOA involves at least three main types of chemical transformation:oligomerization, functionalization and fragmentation (Jimenez et al., 2009). During ox-5
idation processes functionalization and fragmentation occur, driving an increase in theO:C ratio. Volatility decreases during functionalization and (mostly) increases duringfragmentation as molecules become smaller. Oligomerization is a chemical processthat converts monomers to larger, less volatile compounds (Kalberer et al., 2004). Dur-ing oligomerization the volatility decreases while the O:C ratio may be increased or10
reduced, depending on the process (Reinhardt et al., 2007; Jimenez et al., 2009). Theexpected behavior of the volatility during the three main processes is summarized inTable 1.
Aerosols, including SOA but also inorganic and other organic substances, have aninfluence on global climate via the direct aerosol effect by scattering sunlight and via15
the indirect aerosol effect by changing cloud properties and characteristics (Lohmannand Feichter, 2005). Hygroscopicity, the degree of water uptake by particles, is animportant parameter for both effects and has been studied for different SOA typese.g. (Baltensperger et al., 2005; Varutbangkul et al., 2006; Prenni et al., 2007; Duplissyet al., 2008; Juranyi et al., 2009; Qi et al., 2010). A positive correlation between hygro-20
scopicity and O:C ratio has been shown recently (Jimenez et al., 2009; Chang et al.,2010; Massoli et al., 2010; Duplissy et al., 2011). The following equation for the hygro-scopicity parameter κ can be derived from Petters and Kreidenweis (2007) to representthe hygroscopicity of an aerosol:
κ=νw×ρs
Ms× is, (1)25
where νw is the partial molar volume of water, Ms, ρs and is the molar mass, densityand effective van’t Hoff factor of the solute. νw is in good approximation constant across
7426

ACPD11, 7423–7467, 2011
Volatility andhygroscopicity of
aging SOA in a smogchamber
T. Tritscher et al.
Title Page
Abstract Introduction
Conclusions References
Tables Figures
J I
J I
Back Close
Full Screen / Esc
Printer-friendly Version
Interactive Discussion
Discussion
Paper
|D
iscussionP
aper|
Discussion
Paper
|D
iscussionP
aper|
the water activity range of interest. This leaves is and ρs/Ms as the two key factors de-termining particle hygroscopicity (κ). The expected effect of the three main chemicalprocesses on is and ρs/Ms and thus κ is summarized in Table 1. Functionalization typi-cally increases is due to positive interactions between polar functional groups and water(Petters et al., 2009). Additional dissociation effects would also increase is, though the5
degree of dissociation of carboxyl and hydroxyl groups is likely very small. Only a smallincrease, if at all, is expected for Ms and ρs, and thus changes of ρs/Ms will be small.κ is thus expected to increase under the influence of functionalization. Oligomerizationstrongly increases Ms with little effect on ρs, resulting in a decrease of ρs/Ms. Onlysmall changes are expected for is. Overall a decrease of κ is expected under the influ-10
ence of oligomerization, though the effect becomes smaller with increasing Ms (Petterset al., 2006). Opposite effects are essentially expected for fragmentation comparedto oligomerization. Equation 1 describes the hygroscopicity of completely dissolvedsolutes. Particle hygroscopicity would be reduced if the SOA was only partially solu-ble. Functionalization increases the solubility, while oligomerization and fragmentation15
are expected to have little effect on the solubility. The qualitative overall effects of thethree main chemical reactions on aerosol hygroscopicity as described in Table 1 remainthus also valid if additional effects of limited solubility occur. In general the number ofspecies (molecules or ions) going into solution matters for the hygroscopicity, this canbe expressed as the van’t Hoff factor. Highly oxidized organic molecules like acids can20
dissociate in water and have thus a higher hygroscopicity than a hydrocarbon with littlefunctional groups.
The chemical and physical characterization of SOA is often discussed separately(Hallquist et al., 2009). So far it is not clear how oxidation (aging) changes the amountand properties of SOA. Here we investigate the aerosol physical properties of SOA25
volatility and hygroscopicity as a function of the oxidant exposure under controlledconditions. Comparing trends of volatility and hygroscopicity may shed light on thedominant processes (functionalization, condensation and oligomerization) under theinfluence of different aging processes. These measurements were conducted at the
7427

ACPD11, 7423–7467, 2011
Volatility andhygroscopicity of
aging SOA in a smogchamber
T. Tritscher et al.
Title Page
Abstract Introduction
Conclusions References
Tables Figures
J I
J I
Back Close
Full Screen / Esc
Printer-friendly Version
Interactive Discussion
Discussion
Paper
|D
iscussionP
aper|
Discussion
Paper
|D
iscussionP
aper|
Paul Scherrer Institut (PSI) smog chamber within the scope of the MUCHACHAS (Mul-tiple Chamber Aerosol Chemistry and Aging Studies) campaigns. MUCHACHAS tookplace in several chambers in Europe and the US with different points of emphasis fora similar set of experiments. The main emphasis for the MUCHACHAS experiments atthe PSI smog chamber was the aging of α-pinene (AP) SOA with OH under dark and5
light conditions.
2 The experimental setup
2.1 Smog chamber and associated instruments
The air in the 27-m3 Teflon bag in a temperature controlled chamber with four filteredxenon lamps providing quasi-solar illumination is monitored by several gas and aerosol10
phase instruments described in detail in Paulsen et al. (2005). Here we mention themain instruments relevant for this paper and the experimental procedure. The parti-cles volatility and hygroscopicity were characterized with a volatility and hygroscopicitytandem differential mobility analyzer (V/H-TDMA, see Sect. 2.2). The aerosol parti-cle number size distribution (diameter D=20−800 nm) and chemical composition were15
measured with an scanning mobility particle sizer (SMPS) and an Aerodyne high reso-lution time of flight aerosol mass spectrometer (AMS). The AMS detects inorganic andorganic aerosol species quantitatively and is described elsewhere in detail (DeCarlo etal., 2006). It allows the chemical quantification and characterization of several types offragments of the SOA with a time resolution of minutes (e.g. Alfarra et al. 2006). The20
organic aerosol mass measurement from the AMS was wall-loss corrected to accountfor the losses to the chamber walls. Assuming that the wall loss rate is first order andindependent of size we used an exponential fit asymptotically decreasing to 0 to cor-rect for the losses (Pathak et al., 2007). In the following the terms “organic aerosolmass” or ”SOA mass” always relate to wall-loss corrected organic particulate mass. A25
very useful parameter derived from AMS data is the oxygen to carbon ratio (O:C ratio)
7428

ACPD11, 7423–7467, 2011
Volatility andhygroscopicity of
aging SOA in a smogchamber
T. Tritscher et al.
Title Page
Abstract Introduction
Conclusions References
Tables Figures
J I
J I
Back Close
Full Screen / Esc
Printer-friendly Version
Interactive Discussion
Discussion
Paper
|D
iscussionP
aper|
Discussion
Paper
|D
iscussionP
aper|
(Aiken et al., 2007, 2008), which is linked to the hygroscopicity properties of the aerosol(Duplissy et al., 2011).
The gas-phase instruments include NOx monitors (Monitor Labs 9841A, ThermoEnvironmental Instruments 42C) and ozone monitors (Monitor Labs 8810, EnvironicsS300). A proton transfer reaction mass spectrometer (PTR-MS) from IONICON was5
deployed as well. The high sensitivity PTR-MS (Lindinger et al., 1998) is able to detectVOCs in real-time with a very low detection limit (ppt level). From the measurement ofthe precursor α-pinene we calculated ”AP reacted”. However, after injection of AP intothe ozone (O3) containing chamber the initial concentration was not directly measuredbecause AP needs to mix first and already starts to react with O3. It was therefore10
determined from fitting the AP concentration back to the injection time.
2.2 V/H-TDMA instrument
We built a new V/H-TDMA instrument which is described and characterized in moredetail here. The tandem differential mobility analyzer (TDMA) technique (Rader andMcMurry, 1986) is a common technique to characterize aerosol properties. The H-15
TDMA technique is well established and a suitable method to measure the hygroscop-icity of submicrometer aerosol (Swietlicki et al., 2008). Our combined volatility andhygroscopicity tandem differential mobility analyzer (V/H-TDMA) runs volatility and hy-groscopicity scans in parallel (Fig. 1). The aerosol is conditioned before entering thefirst differential mobility analyzer (DMA1) by passing through a diffusion dryer and a20
Kr-85 bipolar charger to bring the particles into charge equilibrium. All DMAs are situ-ated in a temperature controlled, well insulated housing at 20 ◦C. DMA1 size selects adry (RH<15%), quasi-monodisperse aerosol, which is split into a heater and a humidi-fier flow (0.3 L/min each). Two additional DMAs scan the heated or humidified particles(DMA2 and DMA3, respectively) which are then counted with the condensation particle25
counter for hygroscopicity (CPCH) and the CPCV (CPC for volatility), respectively.The H-TDMA part is based on the design of a previous instrument (Duplissy et al.,
2008, 2009). The individual sheath air flows are operated in closed loops and the7429

ACPD11, 7423–7467, 2011
Volatility andhygroscopicity of
aging SOA in a smogchamber
T. Tritscher et al.
Title Page
Abstract Introduction
Conclusions References
Tables Figures
J I
J I
Back Close
Full Screen / Esc
Printer-friendly Version
Interactive Discussion
Discussion
Paper
|D
iscussionP
aper|
Discussion
Paper
|D
iscussionP
aper|
flows are maintained with blowers (Fig. 1), which is controlled by laminar flow elementscombined with differential pressure sensors and proportional-integral-derivative (PID)controllers. A separate humidifier loop with bubbler (not shown in Fig. 1) supplies thehumidifier with humid air. The humidifier section is situated in a second, temperaturecontrolled housing at 24 ◦C. The aerosol can be humidified up to a controlled relative5
humidity (RH) of 97±1% with a residence time of ∼26 s (between DMA1 and DMA2).Measurement of the deliquescence RH of ammonium sulfate (AS) and other salts
e.g. sodium chloride (NaCl) are used for the calibration of the dew point mirror (seeFig. 1) to assure accurate RH measurement. The correct absolute sizing of the DMAsis periodically checked with polystyrene latex spheres (PSLs) having dry diameters10
D0 between 100 and 350 nm. The correct sizing of the DMAs with respect to eachother is frequently checked by conducting a series of measurements without heatingand humidifying. This relative calibration of DMA1 with DMA2 /DMA3 is important todetect small instrumental drifts which would affect the precision of the growth factormeasurements (the error in D/D0 is typically <1%).15
The heater in the V-TDMA part is custom-built and consists of an inner linear brasstube (70×2.2 cm) surrounded by capillary tubes containing a heating wire. The smallspace between these capillary tubes allows for a rapid cooling with pressurized air.The temperature sensor in the center of the inner tube (see Fig. 1) controls the heatertemperature (T ) in a range from 25–200 ◦C (±2 ◦C). Modeling of the temperatures20
and flow streamlines inside the heater suggests a laminar flow and a homogeneoustemperature distribution after at most 15 cm from the inlet. The calculated plug flowresidence time (RT) in the heater for 25–200 ◦C is 24.4–15.4 s at a constant aerosolflow of 0.6 L/min. The aerosol flow is diluted with filtered, pure air before (0.3 L/min)and after the heater (0.4 L/min) to maintain correct aerosol flows in all parts of the25
instrument. Measurements of the aerosol particles’ average “traveling time” from theoutlet of DMA1 to the inlet of DMA3 (including heater and tubing) was found to be23±2 s at 30 ◦C. The RT is longer compared to other heaters employed in TDMAs(Paulsen et al., 2005; Jonsson et al., 2007; Villani et al., 2007) and thermodenuder
7430

ACPD11, 7423–7467, 2011
Volatility andhygroscopicity of
aging SOA in a smogchamber
T. Tritscher et al.
Title Page
Abstract Introduction
Conclusions References
Tables Figures
J I
J I
Back Close
Full Screen / Esc
Printer-friendly Version
Interactive Discussion
Discussion
Paper
|D
iscussionP
aper|
Discussion
Paper
|D
iscussionP
aper|
(Burtscher et al., 2001; Wehner et al., 2002). This typically results in a lower remainingaerosol volume at a specific temperature (An et al., 2007). As particle concentrationsare rather small, a denuder is not needed in our system because the inner surface ofthe heater offers much larger surface for the vapors to condense than the aerosols.Nucleation, an indicator for re-condensation of vapors, was not observed in the V-5
TDMA.In general the parameters obtained from the TDMA are the growth factor GF(RH),
and shrinking factor SF(T ) defined as the ratio of humidified diameter D(RH), or heateddiameter D(T ) and initial dry and non-heated diameter (D0), respectively:
GF(RH)=D(RH)
D0(2)10
SF(T )=D(T )
D0(3)
The raw growth or shrinking factor distributions measured by the V- and H-part areanalyzed using the TDMAinv approach (Gysel et al., 2009) in order to obtain invertedand calibrated probability density functions (PDF). Details on this data analysis proce-dure and especially on the used TDMAinv approach are found in Gysel et al. (2009). In15
the following the hygroscopic growth factor (GF) always refers to the number weightedmean GF (1st moment) of the inverted GF-PDF, and the shrinking factor (SF) to thevolume weighted mean SF (3rd moment) of the inverted SF-PDF. Instead of SF the vol-ume fraction remaining (VFR), defined as VFR=SF3, is chosen to present the volatilitydata.20
In this study the H-TDMA was typically operated at a constant high RH of 95%. TheRH was very stable, and the GF data in the RH range 93–97% were corrected to 95.0%RH in order to exclude any uncertainties caused by this small variation (Gysel et al.,2009). The V-TDMA heater was running mainly at 70 ◦C (with a plug flow RT of 21 s)and only data in the range T =68–72 ◦C were considered in the analysis. We minimize25
chemical perturbations of the composition (pyrolysis) in the heater with this relatively7431

ACPD11, 7423–7467, 2011
Volatility andhygroscopicity of
aging SOA in a smogchamber
T. Tritscher et al.
Title Page
Abstract Introduction
Conclusions References
Tables Figures
J I
J I
Back Close
Full Screen / Esc
Printer-friendly Version
Interactive Discussion
Discussion
Paper
|D
iscussionP
aper|
Discussion
Paper
|D
iscussionP
aper|
low thermodenuder temperature. During few experiments the heater temperature wasvaried (from 25 to 200 ◦C) to measure the VFR as a function of temperature, resultingin a thermogram plot.
The measured D0 are in the total range from 50 to 250 nm, where low AP experi-ments range from 50 to 150 nm and high AP precursor concentrations range from 755
to 250 nm. D0 was chosen for several diameters with long overlapping time. D0 hadto be changed if the number size distribution in the smog chamber changed in a waythat the D0 of the V/H-TDMA was out of the range or had too few counts. Typicallyparticles are small in the beginning of an SOA experiment, but grow very rapidly duringthe ozonolysis and stabilize at a diameter of a few hundred nanometers. We present10
the hygroscopicity results mainly in the single hygroscopicity parameter κ (see alsoequation 1, Petters and Kreidenweis 2007) to account for the size dependence of theGF (Kelvin effect). κ was calculated assuming the surface tension of pure water. A κ of0 corresponds to GF=1. The use of κ allows for direct comparison with other studiesor measurements e.g. from a cloud condensation nucleus counter.15
The V-TDMA was characterized with laboratory generated particles of known chemi-cal composition to allow for a comparison of the results with other systems. The instru-ment residence time, diameter, and concentration of aerosols are important factors forheater characterization. Figure 2 shows the VFR for different compounds and particlediameters as function of the heater temperature.20
Panel A in Fig. 2 displays the VFR of NaCl, which is known to be non-volatile up totemperatures clearly above 200 ◦C (Scheibel and Porstendoerfer, 1983), and thus theVFR measured by the V-TDMA is expected to be unity across the whole temperaturerange. The very small observed decrease in VFR to ∼0.97 at 200 ◦C might be eithera restructuring/reorientation effect, which would result in a more compact structure25
and therefore smaller effective volume, or evaporation of impurities from the nebuliz-ing process of NaCl. A similarly stable volatility behavior is observed in other studies(e.g. Modini et al. 2010). The plot of NaCl shows also the high precision of the instru-ment with less than ±2% for VFR. Thermophoretical losses at 200 ◦C were determined
7432

ACPD11, 7423–7467, 2011
Volatility andhygroscopicity of
aging SOA in a smogchamber
T. Tritscher et al.
Title Page
Abstract Introduction
Conclusions References
Tables Figures
J I
J I
Back Close
Full Screen / Esc
Printer-friendly Version
Interactive Discussion
Discussion
Paper
|D
iscussionP
aper|
Discussion
Paper
|D
iscussionP
aper|
to be 10–15% in particle number for NaCl particles with D0 =35–200 nm. This is in therange of other thermodenuders (Huffman et al., 2008; Park et al., 2008). We considerthe losses as less relevant because the instrument is not quantitative in particle massor number but rather measures the physical properties volatility and hygroscopicity.
Citric acid (Fig. 2B) was chosen as a reference substance because it is of rather high5
volatility similar to SOA; VFR starts to decrease at T > 70 ◦C. At temperatures above110 ◦C particles with D0 ≤ 300 nm are completely evaporated in our instrument. A smallsize-dependence due to kinetic reasons is seen: smaller particles tend to evaporatefaster than larger particles (see e.g. Riipinen et al. 2010).
Ammonium sulfate particles (AS) (Fig. 2C) are often used for heater characteriza-10
tion; in our system AS particles start to volatilize at temperatures T > ∼100 ◦C. All ASparticles volatilize completely (i.e. VFR < 0.15) at temperatures above 150 ◦C. Com-pared to literature data the thermogram of the mass fraction remaining from AMS forpolydisperse AS in Wu et al. (2009) looks similar as ours, with a rapid decrease of themass fraction remaining between 120 ◦C and 160 ◦C. Villani et al. (2007) present an15
overview table with 160 - 180 ◦C at D0 =15–150 nm as lowest volatilization temperaturefor AS in their V-TDMA instrument while other studies report even higher temperatures.There are also studies where AS starts to volatilize around 110 ◦C, but does not evapo-rate completely even at temperatures above 230 ◦C (Huffman et al., 2008). In contrastto other studies and our V-TDMA there is a thermodenuder study where the diameter20
of AS decreases at lower temperatures around 75 ◦C, but 150 ◦C is needed to volatilizethe particles completely (D0 =100 and 200 nm) (An et al., 2007).
Overall our instrument seems to be in a good temperature and residence time rangefor volatilization measurements of AS. Nevertheless, organic substances (e.g. citricacid) with relatively high volatility might be better suited to characterize a thermode-25
nuder system than salts like AS because they often evaporate already at lower temper-atures, i.e., more gentle heating is needed.
7433

ACPD11, 7423–7467, 2011
Volatility andhygroscopicity of
aging SOA in a smogchamber
T. Tritscher et al.
Title Page
Abstract Introduction
Conclusions References
Tables Figures
J I
J I
Back Close
Full Screen / Esc
Printer-friendly Version
Interactive Discussion
Discussion
Paper
|D
iscussionP
aper|
Discussion
Paper
|D
iscussionP
aper|
2.3 Smog chamber operation
The typical design of the MUCHACHAS experiments is shown as schematic in Fig. 3.The precursor in all experiments described here was α-pinene (AP). The concept wasto first form SOA from ozonolysis, allow it to stabilize after nearly all the precursor wasconsumed, and then to expose the first-generation SOA and partially oxidized gas-5
phase species to OH radicals in order to observe changes caused by OH aging.A change of the VFR and/or the κ value during processing of atmospheric aerosol
may occur either by addition of SOA mass (by condensation) or by an exchange ofmolecules in the SOA by other molecules with different properties. The former processincreases the SOA mass by definition, while the latter keeps the SOA mass roughly10
constant and may occur either by heterogeneous reactions on the surface of the SOAparticles or by evaporation – gas-phase oxidation – recondensation cycle. Thus, whenthere is a substantial change in the aerosol mass with time, the condensation mecha-nism may be assumed to be dominant, while, when the mass stays roughly constantthe exchange mechanism is the likely dominant process. In our experiments both15
mechanisms may be mediated by either ozone or OH radicals. In the light of this, weassign the following four dominating mechanisms to four different phases of our exper-iments (see Fig. 3): O3 mediated condensation, O3 mediated ripening, OH mediatedcondensation, and OH mediated ripening. In the condensation phases, the physical(VFR, κ) and chemical (O:C ratio) properties are believed to mainly vary as a result of20
the additional condensing material, while ripening refers to chemical transformation ofthe SOA without significant change of the mass.
In all experiments, the clean smog chamber was humidified to ∼50% RH and ina first step O3 was added. After about 20 min when the O3 was distributed homo-geneously in the bag the precursor AP was injected. We conducted experiments at25
two atmospherically relevant precursor concentrations of 40 ppb (“high”) and 10 ppb(“low”) α-pinene concentration. The reaction started immediately forming particles(first-generation SOA) from the ozonolysis of the C=C double bond in AP. The OH
7434

ACPD11, 7423–7467, 2011
Volatility andhygroscopicity of
aging SOA in a smogchamber
T. Tritscher et al.
Title Page
Abstract Introduction
Conclusions References
Tables Figures
J I
J I
Back Close
Full Screen / Esc
Printer-friendly Version
Interactive Discussion
Discussion
Paper
|D
iscussionP
aper|
Discussion
Paper
|D
iscussionP
aper|
formed by the ozonolysis will mainly react with the AP, as long as this is still presentin excess. Ozonolysis lasted a few hours until at least 90% of the AP precursor hadreacted (Fig. 3).
In a next step, 20 ppb of 3-pentanol was added. Pentanol reacts with OH only,and thus its decay can be used as an OH tracer, in the same way as specific in-5
termediate products. SOA was exposed to OH aging by either photolysis of HONO(“HONO photolysis experiments”) or ozonolysis of tetramethylethylene (TME) (IUPACname: 2,3−dimethyl−2−butene) (“dark OH (TME) experiments”) (Epstein and Don-ahue, 2008). A list with details of all conducted experiments is given in Table 2.
A HONO level of 15-20 ppb (as measured by a Long Path Absorption Photometer10
(LOPAP)) in the chamber was reached by passing pure air (2 L/min) through a custombuilt vessel with sulfuric acid (0.01 M H2SO4) and sodium nitrite (3×10⁻³ M NaNO2).The vessel and the HONO system are described elsewhere (Taira and Kanda, 1990).The flow from the HONO generator was passed through a filter to ensure that only thegas phase HONO without particles entered into the chamber. The addition of HONO15
started about one hour before the lights were turned on. In some high-NOx photolysisexperiments (Table 2, exp. No. 6–8) 50–80 ppb NO was added in addition to the HONO.TME was continuously injected from a gas cylinder (Messer, TME 1000 mol ppm in N25.0) at a flow of 10 mL/min. The ozone level was usually higher in the TME experi-ments compared to HONO photolysis experiments because O3 was also needed for20
the ozonolysis of TME.Different time axes as shown in the concept figure (Fig. 3) are used in the following.
Two “physical time” clocks (in units of hour (h) are used; one is related first to the “timeafter AP injection” which is the time of the start of the ozonolysis reaction. The sec-ond time axis is ”time after OH started” indicating the start of the OH aging, which can25
be either the time when the lights were turned on or when the continuous injection ofTME started. Two ”chemical time” clocks are used to represent the experiments withrespect to their experienced reaction dependence on the concentration of the respec-tive reactants. The O3 exposure integrated over time (in h ppb) serves as chemical
7435

ACPD11, 7423–7467, 2011
Volatility andhygroscopicity of
aging SOA in a smogchamber
T. Tritscher et al.
Title Page
Abstract Introduction
Conclusions References
Tables Figures
J I
J I
Back Close
Full Screen / Esc
Printer-friendly Version
Interactive Discussion
Discussion
Paper
|D
iscussionP
aper|
Discussion
Paper
|D
iscussionP
aper|
time during the ozonolysis, and the integrated OH exposure time (in h cm−3) is usedduring the reaction period with OH. The OH concentration was calculated from thedecay rate of pinonaldehyde as measured by PTR-MS (see Barmet et al., in prepara-tion). Pinonaldehyde is a reaction product of AP ozonolysis. OH concentrations in theexperiments were between 2×10⁶ and 107 molecules per cm3. Due to the fast reaction5
of pinonaldehyde with OH the OH exposure time was limited to about 15×106 h cm−3.
3 Results and discussion
First we present thermograms (temperature ramping in the V-TDMA heater) of someSOA experiments for comparison with reference substances (Sect. 2.2) and with otherstudies (Sect. 3.1). However, the main focus in this paper is on the temporal evolu-10
tion of κ (GF) and VFR during the ozonolysis (Sect. 3.2) and the OH exposure phases(Sect. 3.3). Thus time series at constant heater temperature (T=70 ◦C) in the V-TDMAand relative humidity (RH=95%) in the H-TDMA allow for a closer look at the on-going processes during different reaction periods, mechanisms and conditions (seeSect. 2.3). Finally, the correlation of VFR and κ (Sect. 3.4) will be investigated as well15
as the effect of additional light and the size dependence (Sect. 3.5) of these measuredproperties.
3.1 Thermogram of SOA and comparison with other studies
Thermograms with well known substances characterize the V-TDMA (Fig. 2) as dis-cussed above. Such thermal information can also be used to gain information on the20
complex chemical nature of SOA. Figure 4 shows mean VFR values versus heatertemperature for all three types of AP SOA experiments (circles). Four thermogramsfrom other studies of AP SOA (squares) are compared to our measurements. Theerror bars represent the standard deviations of VFR (vertical) and the temperature(horizontal). Large vertical error bars are due to real volatility changes of the chamber25
7436

ACPD11, 7423–7467, 2011
Volatility andhygroscopicity of
aging SOA in a smogchamber
T. Tritscher et al.
Title Page
Abstract Introduction
Conclusions References
Tables Figures
J I
J I
Back Close
Full Screen / Esc
Printer-friendly Version
Interactive Discussion
Discussion
Paper
|D
iscussionP
aper|
Discussion
Paper
|D
iscussionP
aper|
aerosol during the course of the experiment and do not reflect the V-TDMA accuracy.All our thermograms are similar within these uncertainties and show no distinct D0 orexperiment type dependence.
A significant decrease of VFR starts at ∼50 ◦C and by 90 ◦C 50% of the particle vol-ume is volatilized. Temperatures around 150 ◦C are required to reduce the VFR to 10%.5
This is a much wider temperature range than for pure citric acid or ammonium sulfateand is explained with different compounds in the chamber SOA possessing volatilitiesranging from rather semi-volatile to low-volatile. The SOA produced purely by ozonol-ysis tends to be slightly more volatile than after aging with OH. The three experimenttypes (ozonolysis, HONO photolysis and dark OH (TME) experiments) cannot be com-10
pared in detail as they comprise different temperature setting and reaction times. Nev-ertheless, our thermograms were fitted with an error function (erf) (Fig. 4, black line,only valid above 50 ◦C); it is set to 1 as maximum and has the following equation withT as the heater temperature:
VFR=0.91−0.911×erf(T [◦C]−53.15
82.5
)(4)15
This fit is helpful to extrapolate the volatility data from other experiments during thisstudy when the temperature was set to 70 ◦C continuously to compare e.g. with otherstudies. Comparison of our measurements with other AP SOA studies (squares inFig. 4) shows the best agreement with the instrument and measurements from Jons-son et al. (2007) for low temperatures and Huffman et al. (2009) for higher tempera-20
tures. Our SOA thermograms lie between the two other studies from An et al. (2007)and Paulsen et al. (2005). Different residence times (RT) in the heated zone are an im-portant reason for the encountered differences in the thermograms. The plug flow RTfrom the other studies are <1 s (Baltensperger et al., 2005; Paulsen et al., 2005), 2.8 s(Jonsson et al., 2007), 21.2 s (Huffman et al., 2008, 2009) and 31.6 s (An et al., 2007),25
respectively. If the above papers stated the centerline RT at laminar flow we convertedit to plug flow RT (factor 2). Our instrument seems to have the second longest RT, ca.
7437

ACPD11, 7423–7467, 2011
Volatility andhygroscopicity of
aging SOA in a smogchamber
T. Tritscher et al.
Title Page
Abstract Introduction
Conclusions References
Tables Figures
J I
J I
Back Close
Full Screen / Esc
Printer-friendly Version
Interactive Discussion
Discussion
Paper
|D
iscussionP
aper|
Discussion
Paper
|D
iscussionP
aper|
23 s at ambient temperature (see Sect. 2.2); only the RT from An et al. (2007) is longer.This could explain the stronger volatilization of SOA at relatively low temperatures intheir study at least partly. On the other hand shorter RT leads to higher VFR (Bal-tensperger et al., 2005; Paulsen et al., 2005; Jonsson et al., 2007). Other factors likeinitial particle size, monodisperse or polydisperse measurement, or the use of a char-5
coal denuder after the heating section may also be responsible for some differencesbetween the various studies. With our long RT we are able to use low temperaturesin the heater and minimize kinetic limitations of evaporation and hope to be close toequilibrium, even though this might be not the case as suggested recently (Riipinen etal., 2010). Further reasons for small differences in the SOA thermograms may be the10
type AP SOA, its concentration, and experimental conditions.Overall, the comparison of thermograms gives an orientation on our V-TDMA char-
acteristics and shows the importance of the residence time. The decrease in VFRwith temperature is experienced over a relatively large temperature range and offersa sensitive range from ∼60 to 100 ◦C to study the SOA volatile properties. In the fol-15
lowing discussion a constant oven temperature of 70 ◦C was chosen to track temporalchanges in the SOA volatility during the chamber reactions.
3.2 Ozonolysis – O3 mediated condensation and ripening
The first step in each experiment was the ozonolysis of AP to form SOA mass (Fig. 3).The initial O3 concentration varied with the type of experiment. Figure 5 shows the20
time trends of the fraction of AP reacted, the organic aerosol mass, the volatility asVFR, and the hygroscopicity both as κ value and as GF at 95% RH. The markers arecolored according to the initial O3 concentration (blue= low O3 and orange=high O3concentration); filled symbols represent low AP and open symbols represent high APinput.25
High O3 concentrations led to a fast reaction of AP and a rapid formation of SOA(Fig. 5, panel A-B). It took roughly one hour to reach the “90% AP reacted” level (seevertical lines in Fig. 5). At lower O3 concentrations this took 2–3 times longer and the
7438

ACPD11, 7423–7467, 2011
Volatility andhygroscopicity of
aging SOA in a smogchamber
T. Tritscher et al.
Title Page
Abstract Introduction
Conclusions References
Tables Figures
J I
J I
Back Close
Full Screen / Esc
Printer-friendly Version
Interactive Discussion
Discussion
Paper
|D
iscussionP
aper|
Discussion
Paper
|D
iscussionP
aper|
final SOA mass was lower. This may have two reasons. Firstly, more semi-volatilecompounds are lost to the walls and do not condense on the particles. Secondly,organic radical-radical reactions are decreased, eventually leading to less semi-volatilecompounds contributing to SOA.
The physical parameters κ and VFR data (Fig. 5, panel C-D) split mainly into two5
groups comprising low and high concentration AP experiments. Experiments with highSOA mass have generally a higher volatility (lower VFR) and lower hygroscopicity. Incase of the low AP experiments VFR increases steadily from 0.55 to 0.7 after 4.5 hof reaction. Even after most of the AP had reacted (90%-level) VFR keeps increas-ing. The high AP experiments show a similar but less pronounced trend. During the10
condensation phase VFR slightly increases. The split into low and high AP experi-ments is less clear for the hygroscopicity in the very beginning; they separate morewith time (Fig. 5D, E). Other studies found a distinct mass concentration dependenceof GF (Duplissy et al., 2008). During the ozonolysis and the beginning of the OH me-diated condensation phase this is not the case for all experiments, but Duplissy et al.15
(2008) had higher AP concentrations (>120 ppb) in their study and investigated a dif-ferent system (photolysis instead of pure ozonolysis), which can explain the differencesin the findings.
The hygroscopicity is presented in Fig. 5 (panel D-E) in terms of κ and GF to allowa direct comparison. Both show the same features (small difference between high and20
low AP experiments) and differences between κ and GF are mainly seen during thefirst 1–2 h of ozonolysis where the selected diameters are small and differ due to fastparticle formation. In some experiments (open blue circle at about 5 h, two diametersare measured alternately) the GF seems to smooth size effects of different diameters.The presented κ values are a good proxy for the particles’ hygroscopicity because the25
diameter dependence of the Kelvin effect is taken into account (by assuming a surfacetension of pure water). Thus we will present the hygroscopicity data as κ values inthe following. The κ values start at about 0.04 in the beginning of all experiments andthen increase during the condensation phase. Thereafter, κ remains almost constant.
7439

ACPD11, 7423–7467, 2011
Volatility andhygroscopicity of
aging SOA in a smogchamber
T. Tritscher et al.
Title Page
Abstract Introduction
Conclusions References
Tables Figures
J I
J I
Back Close
Full Screen / Esc
Printer-friendly Version
Interactive Discussion
Discussion
Paper
|D
iscussionP
aper|
Discussion
Paper
|D
iscussionP
aper|
Similar as for VFR, the low AP concentration experiments group together and showa higher κ than the high AP concentration experiments. However, the values remainwithin a rather narrow range of 0.08–0.12.
Plotting κ and VFR versus the integrated O3 exposure time (in h ppb) (Fig. A) splitsthe data into low and high O3 concentration experiments. Figure A shows exactly5
the same experiments and parameters (panel A-D) as Fig. 5 with addition of the O3concentration (panel E) on a chemical time clock axis. Thus experiments are stretchedor compressed compared to the physical time clock (in Fig. 5). The increase of κ andVFR during the O3 mediated condensation and the rather constant values during theO3 mediated ripening are again visible. The dose of O3 is important; it determines the10
initial situation of the following OH reactions.
3.3 SOA aging – OH mediated condensation and ripening
During the first phase of the experiment the ozonolysis removed the precursor andformed a certain mass of SOA and first generation gaseous oxidation products. Wethen turned on an OH-radical source and monitored any changes in the amount and15
properties of SOA. Figure 6 shows the organic aerosol mass (panel A), the VFR at70 ◦C (panel B), as well as κ and O:C ratio (panel C) for a low (green) and a high(blue) AP concentration using HONO photolysis as OH radical source. The time axisis given as “time after lights on” (TALO), which means that negative values denotethe previous ozonolysis phase. Immediately after the onset of the OH radical source20
additional SOA mass is formed. Figure 6a shows that after correction for wall loss theSOA mass increases by 40–100%. This is a lower limit as the wall loss correctionpresented here is conservative – the effects of aging on SOA levels will be discussedin detail in a separate publication. We divide the OH mediated oxidation phase into anOH mediated condensation phase (TALO ∼0 to 2 h), and OH mediated ripening (TALO25
∼2 to 4.5 h).The hygroscopicity parameter κ (Fig. 6C) increases slightly during the OH mediated
condensation phase and then stays constant during the OH mediated ripening. Hy-7440

ACPD11, 7423–7467, 2011
Volatility andhygroscopicity of
aging SOA in a smogchamber
T. Tritscher et al.
Title Page
Abstract Introduction
Conclusions References
Tables Figures
J I
J I
Back Close
Full Screen / Esc
Printer-friendly Version
Interactive Discussion
Discussion
Paper
|D
iscussionP
aper|
Discussion
Paper
|D
iscussionP
aper|
groscopicity is not affected abruptly by the addition of new mass after OH exposurestarts. This suggests similar hygroscopic properties of the new condensing materialcompared to the existing particle phase material. The O:C ratio is constant or slightlydecreasing during the O3 mediated phase, while it correlates well with κ during the OHmediated phase. Contrary to this the VFR (Fig. 6B) abruptly decreases after OH ag-5
ing commences (turning lights on) and starts to stabilize after about one hour of agingwith OH radicals. During the OH mediated ripening the VFR tends to increase slightly.The newly added organic aerosol mass after the onset of OH oxidation seems to havea higher volatility (lower VFR) than the existing organic aerosol. For example, theZdanovskii-Stokes-Robinson equation (ZSR) (Stokes and Robinson, 1966) is used to10
predict from pure compound properties the hygroscopicity of mixed particles e.g. (Choiand Chan, 2002; Gysel et al., 2007; Moore and Raymond, 2008; Sjogren et al., 2008).The ZSR approximation assumes independent volatility behavior of the individual frac-tions in the mixed particle. Here we use this mixing rule as a two-component modelto calculate the volatility of the newly added organic aerosol mass with the following15
equation:
VFR=VFRold×εold+VFRnew× (1−εold) (5)
VFRnew=VFR−VFRold×εold
1−εold(6)
where VFRnew is the calculated volume fraction remaining of the newly added SOAmass and VFR is measured with the V-TDMA. The volume fractions ε are derived from20
the organic aerosol mass measurements by the AMS before (εold) and after (1-εold)new material was added, assuming the same density for old and new mass. VFRoldis the volume fraction remaining obtained by extrapolating a linear fit through the last3 hours of ozonolysis. The resulting linear regression lines for the low AP experiment(No. 4) and for the high AP experiment (No. 7) are given in the figure.25
Using the VFRold after one hour of exposure to OH, the newly condensed materialhas a calculated VFRnew of 0.24 and 0.04 for the low and high precursor experiment,
7441

ACPD11, 7423–7467, 2011
Volatility andhygroscopicity of
aging SOA in a smogchamber
T. Tritscher et al.
Title Page
Abstract Introduction
Conclusions References
Tables Figures
J I
J I
Back Close
Full Screen / Esc
Printer-friendly Version
Interactive Discussion
Discussion
Paper
|D
iscussionP
aper|
Discussion
Paper
|D
iscussionP
aper|
respectively. The results are very similar if we assume a constant VFR (0.72, 0.69)at 70 ◦C for the initial aerosol before ”lights on” (TALO=0) instead of the VFRold. Thiscalculation shows that the freshly added material is highly volatile. We hypothesize thatthe SOA formed after OH exposure consists of smaller molecules with slightly higherO:C atomic ratios than the original SOA, which condenses onto the particles during5
this phase of the experiment.In Fig. 7 all experiments are summarized. Panels A and B group the experiments
according to the type of OH radical source (HONO photolysis and dark OH (TME))while panels C and D show the dependence of κ and VFR on the wall-loss correctedSOA mass. OH exposure integrated over time is used as a chemical clock to bring all10
experiments on a comparable time scale. Some experiments are not shown in theirfull experimental length because this chemical OH clock is limited in time to when thepinonaldehyde concentration was high enough to be measured by the PTR-MS withhigh signal to noise ratio (see Sect. 2.3).
Overall, the time trends of κ and VFR (Fig. 7, panel A/B) are similar for all exper-15
iments and to those discussed above for the two experiments shown in Fig. 6. Theinitial values of κ and VFR are somewhat variable, depending on the preparation ofthe SOA by ozonolysis as discussed in Section 3.2. The κ values start at 0.07–0.12and increase to 0.10–0.15 during the OH mediated condensation. The addition of newaerosol mass increases hygroscopicity, which indicates that the new mass is more hy-20
groscopic than the original aerosol mass. During the second phase, the OH mediatedripening κ increases just slightly but stays almost constant. A linear regression overthe whole OH mediated phase results in a mean straight line of κ =0.00137 t + 0.105(R2 =0.46).
The VFR decreases during the OH mediated condensation and increases during the25
OH mediated ripening after about 8×10⁶ h cm−3 OH exposure. The high concentra-tion dark OH (TME) experiment No. 11 is the exception – VFR increases during bothphases as it is the experiment with the highest organic aerosol mass. The type ofOH source, dark OH (TME) and HONO photolysis does not show differences in the
7442

ACPD11, 7423–7467, 2011
Volatility andhygroscopicity of
aging SOA in a smogchamber
T. Tritscher et al.
Title Page
Abstract Introduction
Conclusions References
Tables Figures
J I
J I
Back Close
Full Screen / Esc
Printer-friendly Version
Interactive Discussion
Discussion
Paper
|D
iscussionP
aper|
Discussion
Paper
|D
iscussionP
aper|
particles’ hygroscopicity or volatility behavior. This also indicates that high or low NOxconditions during HONO photolysis experiments have no clear influence on κ and VFR(see Table 2).
In panel C and D (Fig. 7) the κ and VFR data of each experiment are colored by theSOA mass concentration measured by the AMS. The volatility of the high mass exper-5
iments is generally higher (lower VFR) than for the low AP experiments throughout theexperiment. The spread of VFR becomes narrower with time. At the end of the OHmediated ripening phase κ values are lower for high AP experiments compared to thelow concentration ones.
3.4 Correlation of κ and VFR10
Here we present κ and VFR in direct relationship to each other which might help toassess the ongoing chemical processes and see the ranges of them. The trend of thevolatility and the hygroscopicity evolution is similar during the O3 mediated condensa-tion and the OH mediated ripening, but shows the opposite trend after OH oxidationis initiated. Thus scatter plots of these two parameters are only useful for selected15
periods. Figure 8A shows for all available ozonolysis experiments (14 in total) the cor-relation of κ and VFR. The correlation is fair (R2 =0.80) and the observed scatter isattributed to different experimental conditions and periods. The correlation is governedby the chemistry during the O3 mediated condensation where the strongest changesin κ and VFR are observed (see Sect. 3.2).20
The correlation of κ and VFR in Fig. 8B allows a closer look at the temporal evolutionduring OH mediated condensation and ripening and the effect of “lights on” in four darkOH (TME) experiments (No. 11-14, see Table 2). Generally, the dark OH exposureexperiments show a positive correlation between κ and VFR for about the first 10 h.Afterwards only the VFR increases further. Only an enhanced oxidation rate by turn-25
ing on the lights producing more OH radicals increases VFR and κ even more (up toκ =0.2). It should be cautioned here that the opposing trends of VFR and κ during theOH mediated condensing phase are buried in the scatter plot.
7443

ACPD11, 7423–7467, 2011
Volatility andhygroscopicity of
aging SOA in a smogchamber
T. Tritscher et al.
Title Page
Abstract Introduction
Conclusions References
Tables Figures
J I
J I
Back Close
Full Screen / Esc
Printer-friendly Version
Interactive Discussion
Discussion
Paper
|D
iscussionP
aper|
Discussion
Paper
|D
iscussionP
aper|
3.4.1 Maximum hygroscopicity and minimum volatility with addition of UV light
In one experiment we removed the UV-filters from the xenon lamps in the chamber.The combination of OH production with TME and ozone photolysis with unfiltered UVlight results in a higher hygroscopicity (experiment No. 15, not shown in Fig. 8b). Thehighest hygroscopicity (κ =∼0.21) and lowest volatility (highest VFR = ∼0.82 at 70 ◦C)5
of all experiments were reached in this experiment after only 4 h of OH aging (seeTable 2). The experiment with second highest κ and VFR was the one with dark OHand (normal, see Sect. 2.1) lights on (No. 13). However, this was a long experimentwith high O3 concentration and we cannot decouple the effects. We conclude that boththe additional OH (e.g. TME + lights) and enough time are important for aging.10
3.5 Ripening and size dependence
In the following we present results from the second part of the experiments where OHmediated ripening was investigated. In addition we discuss the κ and VFR dependenceon the particle’s diameter. Figure 9 shows two different types of low concentration APexperiments: HONO photolysis (green traces) and dark OH (TME) experiment (yellow15
traces) with additional lights on (No. 5 and 14, see Table 2). The periods with lightson are indicated by arrows. In experiment No. 5 (green) the lights were the only OHsource, in experiment No. 14 the lights were turned on and off in addition to the darkOH (TME) source. Organic aerosol mass, atomic O:C ratio (panel A and D) from theAMS and VFR as well as κ (panel B and C) are plotted against physical time after OH20
injection started. Dry diameters (D0) are presented in different symbols.All TDMA data are size-specific and the size dependence of the measured hygro-
scopicity and volatility has not been discussed so far. In experiment No. 14 the smallerparticles tend to have a higher κ and lower VFR (higher volatility); this is not observed inexperiment No. 5. The variation in κ between different D0 is typically less than ± 0.0125
(within uncertainty), in extreme cases up to 0.03, when comparing D0 =50 nm andD0 =150 nm. Usually several D0, not too different from each other, are selected in the
7444

ACPD11, 7423–7467, 2011
Volatility andhygroscopicity of
aging SOA in a smogchamber
T. Tritscher et al.
Title Page
Abstract Introduction
Conclusions References
Tables Figures
J I
J I
Back Close
Full Screen / Esc
Printer-friendly Version
Interactive Discussion
Discussion
Paper
|D
iscussionP
aper|
Discussion
Paper
|D
iscussionP
aper|
TDMA to ensure a consistent measurement. Using the volatility data from the V-TDMAfor experiment No. 14 from 6–9 h after the OH exposure as input for an evaporationmodel (Riipinen et al., 2010) showed a positive size dependence in the diameter range100–150 nm – due to different evaporation kinetics of particles with different diameters.For this calculation, we approximated the SOA with a single component aerosol with5
saturation concentration of 1.2 µg/m3 and a mass accommodation coefficient of unity,chosen to produce consistent results with the measured VFR at 100 nm. The SOA wasassumed otherwise to have similar properties as the theoretical AP SOA modeled inRiipinen et al. (2010). Although this is a rough approximation, we believe it to be suffi-cient for this purpose of simply demonstrating the size-dependence of the evaporation10
kinetics. The size dependence predicted by the model is a bit stronger (VFR rangingfrom 0.71 to 0.83 with diameters ranging from 100 to 150 nm) than the one observed inour measurements (VFR from 0.71 to 0.75). The discrepancy in VFR between differentD0 sizes can thus probably be explained by simply kinetic effects rather than differentvolatilities of the particles with different sizes or measurement uncertainties or artifacts.15
The two experiments No. 5 and 14 in Fig. 9 also illustrate well the interplay betweenOH mediated ripening and OH mediated condensation on VFR. The start of OH agingat time 0 resulted in an abrupt decrease in VFR (Fig. 9b) while SOA mass increased(OH mediated condensation phase) as already discussed above. When lights wereturned off, the VFR increased by ripening (experiment No. 5) until lights were turned on20
again. The VFR then stayed constant while again SOA mass slightly increased. Thisis an indication that more of less volatile compounds are condensing compensatingthe ripening effect. In case of the TME experiment (No. 14) turning lights on enhancesthe OH exposure and more SOA mass is produced. Thus, VFR stays constant. Thismay indicate again that ripening is compensated by the condensation of low volatility25
compounds. When lights are turned off after 4.6 h VFR starts to increase. The ripeningeffect seems to be stronger than further condensation indicated by the slow SOA massincrease. Another lights on phase after 6.6 h does not change the ripening trend. Thisis also not expected as this time there was not much additional condensation observed.
7445

ACPD11, 7423–7467, 2011
Volatility andhygroscopicity of
aging SOA in a smogchamber
T. Tritscher et al.
Title Page
Abstract Introduction
Conclusions References
Tables Figures
J I
J I
Back Close
Full Screen / Esc
Printer-friendly Version
Interactive Discussion
Discussion
Paper
|D
iscussionP
aper|
Discussion
Paper
|D
iscussionP
aper|
The effects on κ are less pronounced. In general κ (panel C) increased with OHexposure while without OH, when lights were off (experiment No. 5, 2–4 h) κ slightlydecreased.
4 Summary and conclusions
After careful construction, validation and characterization of a new V/H-TDMA we mea-5
sured SOA during 15 different aging experiments with 10–40 ppb α-pinene within theMUCHACHAS campaign in the PSI smog chamber. The retrieved parameters VFRand κ for volatility and hygroscopicity are sensitive indicators of even small changes inthe SOA properties. We assume that the observed changes of physical properties arecaused by chemical changes as a result of functionalization, oligomerization or frag-10
mentation. Two periods (condensation and ripening) were discerned for each reactionperiod (ozonolysis and OH exposure), as seen in Figs. 3 and 6. We introduced forthese the terms O3 mediated condensation and O3 mediated ripening during ozonol-ysis and OH mediated condensation and OH mediated ripening during OH exposure.The first phase (O3 mediated condensation) forms most of the SOA mass.15
The original intent of these experiments was to observe changes in SOA physicalproperties (including total amounts) induced by exposure to OH radicals. Consistentwith our hypotheses, we did observe significant changes in both SOA levels and volatil-ity following exposure to OH. However, we also observed a sometimes slow, but steadyevolution in both hygroscopicity and volatility in most experiments, which appears to be20
independent of exposure to OH. We hypothesize that this ripening is caused by rel-atively slow transformations of the condensed phase (this can include evaporation,oxidation, condensation cycles) which do not influence the SOA mass concentrationsbut do influence intensive physical and chemical properties (such as VFR, κ, O:C).Both of these phenomena appear to be significant and will require further attention.25
Overall the particles’ volatility decreases throughout the experiment. The VFR at70 ◦C increases from about 0.5 up to 0.82 (after 4 h of aging) and 0.95 (after 20 h of
7446

ACPD11, 7423–7467, 2011
Volatility andhygroscopicity of
aging SOA in a smogchamber
T. Tritscher et al.
Title Page
Abstract Introduction
Conclusions References
Tables Figures
J I
J I
Back Close
Full Screen / Esc
Printer-friendly Version
Interactive Discussion
Discussion
Paper
|D
iscussionP
aper|
Discussion
Paper
|D
iscussionP
aper|
aging, Fig. 8). The hygroscopicity parameter κ ranges from 0.07 to 0.12 (GF from 1.28to 1.40 at 95% RH) after the ozonolysis and increases significantly after OH exposureto κ 0.10–0.21 (GF 1.39–1.61) strongly dependent on the experiment and its conditions(Table 2). Production of new SOA seems to be the main driving force for the changesrather than aging of old SOA upon OH exposure. The κ range agrees well with the5
findings from other hygroscopicity studies for AP SOA (Petters and Kreidenweis, 2007;Duplissy et al., 2008). In agreement with Duplissy et al. (2008) κ values are lowerfor high AP experiments compared to the low AP concentration ones. These low κvalues are explained with the partitioning of more volatile, less oxygenated compoundstowards the particle phase at higher AP concentrations. The measured properties of10
our chamber SOA evolve almost continuously during aging, which is in contrast to otherstudies (Qi et al., 2010). They observed clearly lower hygroscopic GFs (at comparableRH) and slightly lower VFR at 100 ◦C (compare thermogram Fig. 4), probably due todifferent experimental conditions like low RH or less radiation intensity in their chamber.
The SOA is formed from the ozonolysis of the C=C double bond in α-pinene. Since15
O3 does not react at other sites we expect that the first-generation oxidation productsdo not change during the ozonolysis reaction. The young aerosol seems to be fairlyvolatile with a VFR around 0.55-0.60, which then steadily increases. This indicates thatreactions in the particles lead to less volatile compounds (oligomerization) as there areno second generation oxidation reactions in the gas phase yet. Heterogeneous reac-20
tions of O3 on the surface of aerosols can be excluded as a higher O3 concentrationdoes not lead to a steeper increase in VFR (Figs. 5 and A). The low hygroscopicity inthe beginning of the ozonolysis is consistent with a volatile, not strongly oxidized com-position. The O:C ratio was measured to be 0.4–0.5 staying more or less constant oreven slightly decreasing throughout the ozonolysis. With increasing SOA mass smaller25
compounds can partition into the aerosol leading to an increase in κ while oligomer-ization during the ripening phase would tend to decrease κ. When these aerosolsare then exposed to OH the first generation volatile and semi-volatile products are fur-ther oxidized leading to further condensation onto the existing aerosol. This leads to
7447

ACPD11, 7423–7467, 2011
Volatility andhygroscopicity of
aging SOA in a smogchamber
T. Tritscher et al.
Title Page
Abstract Introduction
Conclusions References
Tables Figures
J I
J I
Back Close
Full Screen / Esc
Printer-friendly Version
Interactive Discussion
Discussion
Paper
|D
iscussionP
aper|
Discussion
Paper
|D
iscussionP
aper|
a sudden increase in volatility (decrease in VFR). Based on a simple two-compoundmodel we estimate that this new SOA forming compounds are highly volatile (VFR<0.25 at 70 ◦C). During this OH mediated condensation phase both the hygroscopicityand the O:C ratio increase. All this indicates that fairly volatile, small and highly oxi-dized compounds, which are produced by functionalization and fragmentation of first5
generation products, are condensing during this phase. After the strong drop VFR in-creases again, indicating another ripening phase. Because there is still some morematerial condensing both of these two processes influence VFR and κ. As shown inFig. 9 (see Sect. 3.5) condensation can be shut off by turning lights off (i.e., reducingthe OH concentration), while the ripening (experiment No. 5) continues, resulting in an10
increasing VFR, but slightly decreasing κ and O:C ratio. We assume that this is dueto oligomerization. In contrast, κ and the O:C ratio are more or less constant duringthe OH mediated ripening process for most experiments. We hypothesize that in thiscase the ongoing condensation is partly (VFR) or completely (κ and O:C) offsetting thiseffect.15
There were no significant differences between dark OH (induced by tetramethylethy-lene, TME) and light OH (induced by HONO) aging found, and also high and low NOxconditions had virtually no influence on the physical properties. Several parametersincluding AP, O3 and OH concentration, SOA mass, organic aerosol atomic O:C ratiowere analyzed with respect to their influence on the volatility and hygroscopicity. The20
combination of the physical properties volatility and hygroscopicity is a highly suitableapproach to access the complex chemical processes during formation and aging ofSOA. Future comprehensive studies should also include sophisticated chemical anal-ysis of specific compounds in the aerosol phase combined with more trace gas mea-surements to be able to describe the ongoing processes in more detail.25
7448

ACPD11, 7423–7467, 2011
Volatility andhygroscopicity of
aging SOA in a smogchamber
T. Tritscher et al.
Title Page
Abstract Introduction
Conclusions References
Tables Figures
J I
J I
Back Close
Full Screen / Esc
Printer-friendly Version
Interactive Discussion
Discussion
Paper
|D
iscussionP
aper|
Discussion
Paper
|D
iscussionP
aper|
Appendix A
The ozonolysis part in Sect. 3.2 analyzes the ongoing condensation and ripening pro-cesses. Figure A shows similar data as in Fig. 5 with the same symbols but on thechemical axis with O3 exposure (in h ppb). This leads to a stretching or compressingof the data. Fig. 5 shows mainly a mix of concentration and time effects. Here we see5
(Fig. A) the O3 dependence of VFR and κ which is mainly independent of the aerosolmass. The O3 dose determines the starting point for the following OH reactions. Thehigh O3 concentration cases show lower κ, and higher O3 concentration makes morevolatile mass (lower VFR). κ and VFR increase mainly during the O3 mediated con-densation and are rather constant later (especially κ).10
Acknowledgements. The authors thank Rene Richter and Gunther Wehrle for the great sup-port and work on the V/H-TDMA instrument and various smog chamber issues. This work wassupported by the IMBALANCE project of the Competence Center Environment and Sustain-ability of the ETH Domain (CCES), as well as the Swiss National Science Foundation. PFD isgrateful for postdoctoral research support from the US-NSF (IRFP #0701013).15
References
Aiken, A. C., DeCarlo, P. F., and Jimenez, J. L.: Elemental analysis of organic specieswith electron ionization high-resolution mass spectrometry, Anal. Chem., 79, 8350–8358,doi:10.1021/ac071150w, 2007. 7429
Aiken, A. C., Decarlo, P. F., Kroll, J. H., Worsnop, D. R., Huffman, J. A., Docherty, K. S., Ulbrich,20
I. M., Mohr, C., Kimmel, J. R., Sueper, D., Sun, Y., Zhang, Q., Trimborn, A., Northway, M.,Ziemann, P. J., Canagaratna, M. R., Onasch, T. B., Alfarra, M. R., Prevot, A. S. H., Dommen,J., Duplissy, J., Metzger, A., Baltensperger, U., and Jimenez, J. L.: O/C and OM/OC ratios ofprimary, secondary, and ambient organic aerosols with high-resolution time-of-flight aerosolmass spectrometry, Environ. Sci. Technol., 42, 4478–4485, doi:10.1021/es703009q, 2008.25
7429Alfarra, M. R., Paulsen, D., Gysel, M., Garforth, A. A., Dommen, J., Prevot, A. S. H., Worsnop,
D. R., Baltensperger, U., and Coe, H.: A mass spectrometric study of secondary organic7449

ACPD11, 7423–7467, 2011
Volatility andhygroscopicity of
aging SOA in a smogchamber
T. Tritscher et al.
Title Page
Abstract Introduction
Conclusions References
Tables Figures
J I
J I
Back Close
Full Screen / Esc
Printer-friendly Version
Interactive Discussion
Discussion
Paper
|D
iscussionP
aper|
Discussion
Paper
|D
iscussionP
aper|
aerosols formed from the photooxidation of anthropogenic and biogenic precursors in a re-action chamber, Atmos. Chem. Phys., 6, 5279–5293, doi:10.5194/acp-6-5279-2006, 2006.7428
An, W. J., Pathak, R. K., Lee, B. H., and Pandis, S. N.: Aerosol volatility measurement usingan improved thermodenuder: Application to secondary organic aerosol, J. Aerosol Sci., 38,5
305–314, 2007. 7431, 7433, 7437, 7438Baltensperger, U., Kalberer, M., Dommen, J., Paulsen, D., Alfarra, M. R., Coe, H., Fisseha,
R., Gascho, A., Gysel, M., Nyeki, S., Sax, M., Steinbacher, M., Prevot, A. S. H., Sjogren,S., Weingartner, E., and Zenobi, R.: Secondary organic aerosols from anthropogenic andbiogenic precursors, Faraday Discuss., 130, 265–278, 2005. 7426, 7437, 743810
Burtscher, H., Baltensperger, U., Bukowiecki, N., Cohn, P., Huglin, C., Mohr, M., Matter, U.,Nyeki, S., Schmatloch, V., Streit, N., and Weingartner, E.: Separation of volatile and non-volatile aerosol fractions by thermodesorption: instrumental development and applications,J. Aerosol Sci., 32, 427–442, 2001. 7431
Chang, R. Y. W., Slowik, J. G., Shantz, N. C., Vlasenko, A., Liggio, J., Sjostedt, S. J., Leaitch, W.15
R., and Abbatt, J. P. D.: The hygroscopicity parameter (kappa) of ambient organic aerosol at afield site subject to biogenic and anthropogenic influences: relationship to degree of aerosoloxidation, Atmos. Chem. Phys., 10, 5047–5064, doi:10.5194/acp-10-5047-2010, 2010. 7426
Choi, M. Y. and Chan, C. K.: The effects of organic species on the hygroscopic behaviors ofinorganic aerosols, Environ. Sci. Technol., 36, 2422–2428, doi:10.1021/es0113293, 2002.20
7441DeCarlo, P. F., Kimmel, J. R., Trimborn, A., Northway, M. J., Jayne, J. T., Aiken, A. C., Go-
nin, M., Fuhrer, K., Horvath, T., Docherty, K. S., Worsnop, D. R., and Jimenez, J. L.:Field-deployable, high-resolution, time-of-flight aerosol mass spectrometer, Anal. Chem., 78,8281–8289, doi:10.1021/ac061249n, 2006. 742825
Donahue, N. M., Robinson, A. L., Stanier, C. O., and Pandis, S. N.: Coupled partitioning,dilution, and chemical aging of semivolatile organics, Environ. Sci. Technol., 40, 2635-2643,doi:10.1021/esO52297c, 2006. 7425
Duplissy, J., Gysel, M., Alfarra, M. R., Dommen, J., Metzger, A., Prevot, A. S. H., Wein-gartner, E., Laaksonen, A., Raatikainen, T., Good, N., Turner, S. F., McFiggans, G., and30
Baltensperger, U.: Cloud forming potential of secondary organic aerosol under near atmo-spheric conditions, Geophys. Res. Lett., 35(5), L03818, doi:10.1029/2007GL031075, 2008.7426, 7429, 7439, 7447
7450

ACPD11, 7423–7467, 2011
Volatility andhygroscopicity of
aging SOA in a smogchamber
T. Tritscher et al.
Title Page
Abstract Introduction
Conclusions References
Tables Figures
J I
J I
Back Close
Full Screen / Esc
Printer-friendly Version
Interactive Discussion
Discussion
Paper
|D
iscussionP
aper|
Discussion
Paper
|D
iscussionP
aper|
Duplissy, J., Gysel, M., Sjogren, S., Meyer, N., Good, N., Kammermann, L., Michaud, V.,Weigel, R., Martins dos Santos, S., Gruening, C., Villani, P., Laj, P., Sellegri, K., Metzger,A., McFiggans, G. B., Wehrle, G., Richter, R., Dommen, J., Ristovski, Z., Baltensperger, U.,and Weingartner, E.: Intercomparison study of six HTDMAs: results and recommendations,Atmos. Meas. Tech., 2, 363–378, doi:10.5194/amt-2-363-2009, 2009. 74295
Duplissy, J., DeCarlo, P. F., Dommen, J., Alfarra, M. R., Metzger, A., Barmpadimos, I., Prevot,A. S. H., Weingartner, E., Tritscher, T., Gysel, M., Aiken, A. C., Jimenez, J. L., Canagaratna,M. R., Worsnop, D. R., Collins, D. R., Tomlinson, J., and Baltensperger, U.: Relating hy-groscopicity and composition of organic aerosol particulate matter, Atmos. Chem. Phys.,11,1155–1165, doi:10.5194/acp-11-1155-2011, 2011. 7426, 742910
Epstein, S. A., and Donahue, N. M.: The kinetics of tetramethylethene ozonolysis: Decompo-sition of the primary ozonide and subsequent product formation in the condensed phase, J.Phys. Chem. A, 112, 13535–13541, doi:10.1021/jp807682y, 2008. 7435
Gysel, M., Crosier, J., Topping, D. O., Whitehead, J. D., Bower, K. N., Cubison, M. J., Williams,P. I., Flynn, M. J., McFiggans, G. B., and Coe, H.: Closure study between chemical compo-15
sition and hygroscopic growth of aerosol particles during TORCH2, Atmos. Chem. Phys., 7,6131–6144, doi:10.5194/acp-7-6131-2007, 2007. 7441
Gysel, M., McFiggans, G. B., and Coe, H.: Inversion of tandem differential mobility analyser(TDMA) measurements, J. Aerosol Sci., 40, 134–151, doi:10.1016/j.jaerosci.2008.07.013,2009. 743120
Hallquist, M., Wenger, J. C., Baltensperger, U., Rudich, Y., Simpson, D., Claeys, M., Dommen,J., Donahue, N. M., George, C., Goldstein, A. H., Hamilton, J. F., Herrmann, H., Hoffmann,T., Iinuma, Y., Jang, M., Jenkin, M. E., Jimenez, J. L., Kiendler-Scharr, A., Maenhaut, W.,McFiggans, G., Mentel, T. F., Monod, A., Prevot, A. S. H., Seinfeld, J. H., Surratt, J. D.,Szmigielski, R., and Wildt, J.: The formation, properties and impact of secondary organic25
aerosol: current and emerging issues, Atmos. Chem. Phys., 9, 5155–5236, doi:10.5194/acp-9-5155-2009, 2009. 7425, 7427
Hodzic, A., Jimenez, J. L., Madronich, S., Canagaratna, M. R., DeCarlo, P. F., Kleinman, L.,and Fast, J.: Potential contribution of semi-volatile and intermediate volatility primary organiccompounds to secondary organic aerosol in the Mexico City region, Atmos. Chem. Phys.,30
10, 5491–5514, doi:10.5194/acp-10-5491-2010, 2010. 7425Huffman, J. A., Ziemann, P. J., Jayne, J. T., Worsnop, D. R., and Jimenez, J.
L.: Development and characterization of a fast-stepping/scanning thermodenuder for
7451

ACPD11, 7423–7467, 2011
Volatility andhygroscopicity of
aging SOA in a smogchamber
T. Tritscher et al.
Title Page
Abstract Introduction
Conclusions References
Tables Figures
J I
J I
Back Close
Full Screen / Esc
Printer-friendly Version
Interactive Discussion
Discussion
Paper
|D
iscussionP
aper|
Discussion
Paper
|D
iscussionP
aper|
chemically-resolved aerosol volatility measurements, Aerosol Sci. Technol., 42, 395–407,doi:10.1080/02786820802104981, 2008. 7433, 7437
Huffman, J. A., Docherty, K. S., Mohr, C., Cubison, M. J., Ulbrich, I. M., Ziemann, P. J., Onasch,T. B., and Jimenez, J. L.: Chemically-resolved volatility measurements of organic aerosolfrom different sources, Environ. Sci. Technol., 43, 5351–5357, doi:10.1021/es803539d,5
2009. 7437Jimenez, J. L., Canagaratna, M. R., Donahue, N. M., Prevot, A. S. H., Zhang, Q., Kroll, J. H.,
DeCarlo, P. F., Allan, J. D., Coe, H., Ng, N. L., Aiken, A. C., Docherty, K. S., Ulbrich, I. M.,Grieshop, A. P., Robinson, A. L., Duplissy, J., Smith, J. D., Wilson, K. R., Lanz, V. A., Hueglin,C., Sun, Y. L., Tian, J., Laaksonen, A., Raatikainen, T., Rautiainen, J., Vaattovaara, P., Ehn,10
M., Kulmala, M., Tomlinson, J. M., Collins, D. R., Cubison, M. J., Dunlea, E. J., Huffman, J.A., Onasch, T. B., Alfarra, M. R., Williams, P. I., Bower, K., Kondo, Y., Schneider, J., Drewnick,F., Borrmann, S., Weimer, S., Demerjian, K., Salcedo, D., Cottrell, L., Griffin, R., Takami, A.,Miyoshi, T., Hatakeyama, S., Shimono, A., Sun, J. Y., Zhang, Y. M., Dzepina, K., Kimmel, J.R., Sueper, D., Jayne, J. T., Herndon, S. C., Trimborn, A. M., Williams, L. R., Wood, E. C.,15
Middlebrook, A. M., Kolb, C. E., Baltensperger, U., and Worsnop, D. R.: Evolution of organicaerosols in the atmosphere, Science, 326, 1525–1529, doi:10.1126/science.1180353, 2009.7425, 7426
Jonsson, A. M., Hallquist, M., and Saathoff, H.: Volatility of secondary organic aerosols fromthe ozone initiated oxidation of alpha-pinene and limonene, J. Aerosol Sci., 38, 843–852,20
2007. 7430, 7437, 7438Juranyi, Z., Gysel, M., Duplissy, J., Weingartner, E., Tritscher, T., Dommen, J., Henning, S.,
Ziese, M., Kiselev, A., Stratmann, F., George, I., and Baltensperger, U.: Influence of gas-to-particle partitioning on the hygroscopic and droplet activation behaviour of alpha-pinene sec-ondary organic aerosol, Phys. Chem. Chem. Phys., 11, 8091–8097, doi:10.1039/b904162a,25
2009. 7426Kalberer, M., Paulsen, D., Sax, M., Steinbacher, M., Dommen, J., Prevot, A. S. H., Fisseha, R.,
Weingartner, E., Frankevich, V., Zenobi, R., and Baltensperger, U.: Identification of polymersas major components of atmospheric organic aerosols, Science, 303, 1659–1662, 2004.742630
Lindinger, W., Hansel, A., and Jordan, A.: On-line monitoring of volatile organic compoundsat pptv levels by means of proton-transfer-reaction mass spectrometry (PTR-MS) – Medicalapplications, food control and environmental research, Int. J. Mass Spectrom., 173, 191–241,
7452

ACPD11, 7423–7467, 2011
Volatility andhygroscopicity of
aging SOA in a smogchamber
T. Tritscher et al.
Title Page
Abstract Introduction
Conclusions References
Tables Figures
J I
J I
Back Close
Full Screen / Esc
Printer-friendly Version
Interactive Discussion
Discussion
Paper
|D
iscussionP
aper|
Discussion
Paper
|D
iscussionP
aper|
1998. 7429Lohmann, U., and Feichter, J.: Global indirect aerosol effects: a review, Atmos. Chem. Phys.,
5, 715–737, doi:10.5194/acp-5-715-2005, 2005. 7426Massoli, P., Lambe, A. T., Ahern, A. T., Williams, L. R., Ehn, M., Mikkila, J., Canagaratna, M.
R., Brune, W. H., Onasch, T. B., Jayne, J. T., Petaja, T., Kulmala, M., Laaksonen, A., Kolb,5
C. E., Davidovits, P., and Worsnop, D. R.: Relationship between aerosol oxidation level andhygroscopic properties of laboratory generated secondary organic aerosol (SOA) particles,Geophys. Res. Lett., 37(5), L24801, doi:10.1029/2010gl045258, 2010. 7426
Modini, R. L., Harris, B., and Ristovski, Z. D.: The organic fraction of bubble-generated,accumulation mode sea spray aerosol (SSA), Atmos. Chem. Phys., 10, 2867–2877,10
doi:10.5194/acp-10-2867-2010, 2010. 7432Moore, R. H., and Raymond, T. M.: HTDMA analysis of multicomponent dicarboxylic acid
aerosols with comparison to UNIFAC and ZSR, J. Geophys. Res.-Atmos., 113, 15, D04206,doi:10.1029/2007jd008660, 2008. 7441
Pankow, J. F.: An absorption-model of gas-particle partitioning involved in the formation of15
secondary organic aerosol, Atmos. Environ., 28, 189–193, 1994a. 7425Pankow, J. F.: An absorption-model of gas-particle partitioning of organic-compounds in the
atmosphere, Atmos. Environ., 28, 185–188, 1994b. 7425Park, D., Kim, S., Choi, N. K., and Hwang, J.: Development and performance test of a thermo-
denuder for separation of volatile matter from submicron aerosol particles, J. Aerosol Sci.,20
39, 1099–1108, doi:10.1016/j.jaerosei.2008.07.002, 2008. 7433Pathak, R. K., Stanier, C. O., Donahue, N. M., and Pandis, S. N.: Ozonolysis of alpha-pinene at
atmospherically relevant concentrations: Temperature dependence of aerosol mass fractions(yields), J. Geophys. Res.-Atmos., 112(8), D03201 doi:10.1029/2006jd007436, 2007. 7428
Paulsen, D., Dommen, J., Kalberer, M., Prevot, A. S. H., Richter, R., Sax, M., Steinbacher, M.,25
Weingartner, E., and Baltensperger, U.: Secondary organic aerosol formation by irradiationof 1,3,5-trimethylbenzene-NOx-H2O in a new reaction chamber for atmospheric chemistryand physics, Environ. Sci. Technol., 39, 2668–2678, 2005. 7428, 7430, 7437, 7438
Petters, M. D. and Kreidenweis, S. M.: A single parameter representation of hygroscopicgrowth and cloud condensation nucleus activity, Atmos. Chem. Phys., 7, 1961–1971,30
doi:10.5194/acp-7-1961-2007, 2007. 7426, 7432, 7447Petters, M. D., Kreidenweis, S. M., Snider, J. R., Koehler, K. A., Wang, Q., Prenni, A. J., and
Demott, P. J.: Cloud droplet activation of polymerized organic aerosol, Tellus Ser. B-Chem.
7453

ACPD11, 7423–7467, 2011
Volatility andhygroscopicity of
aging SOA in a smogchamber
T. Tritscher et al.
Title Page
Abstract Introduction
Conclusions References
Tables Figures
J I
J I
Back Close
Full Screen / Esc
Printer-friendly Version
Interactive Discussion
Discussion
Paper
|D
iscussionP
aper|
Discussion
Paper
|D
iscussionP
aper|
Phys. Meteorol., 58, 196–205, doi:10.1111/j.1600-0889.2006.00181.x, 2006. 7427Petters, M. D., Wex, H., Carrico, C. M., Hallbauer, E., Massling, A., McMeeking, G. R., Poulain,
L., Wu, Z., Kreidenweis, S. M., and Stratmann, F.: Towards closing the gap between hygro-scopic growth and activation for secondary organic aerosol – Part 2: Theoretical approaches,Atmos. Chem. Phys., 9, 3999–4009, doi:10.5194/acp-9-3999-2009, 2009. 74275
Prenni, A. J., Petters, M. D., Kreidenweis, S. M., DeMott, P. J., and Ziemann, P. J.: Clouddroplet activation of secondary organic aerosol, J. Geophys. Res.-Atmos., 112(12), D10223,doi:10.1029/2006JD007963, 2007. 7426
Qi, L., Nakao, S., Malloy, Q., Warren, B., and Cocker, D. R.: Can secondary organic aerosolformed in an atmospheric simulation chamber continuously age?, Atmos. Environ., 44, 2990–10
2996, doi:10.1016/j.atmosenv.2010.05.020, 2010. 7426, 7447Rader, D. J., and McMurry, P. H.: Application of the tandem differential mobility analyzer to
studies of droplet growth or evaporation, J. Aerosol Sci., 17, 771–787, 1986. 7429Reinhardt, A., Emmenegger, C., Gerrits, B., Panse, C., Dommen, J., Baltensperger, U., Zenobi,
R., and Kalberer, M.: Ultrahigh mass resolution and accurate mass measurements as a15
tool to characterize oligomers in secondary organic aerosols, Anal. Chem., 79, 4074–4082,doi:10.1021/ac062425v, 2007. 7426
Riipinen, I., Pierce, J. R., Donahue, N. M., and Pandis, S. N.: Equilibration time scales of or-ganic aerosol inside thermodenuders: Evaporation kinetics versus thermodynamics, Atmos.Environ., 44, 597–607, doi:10.1016/j.atmosenv.2009.11.022, 2010. 7433, 7438, 744520
Robinson, A. L., Donahue, N. M., Shrivastava, M. K., Weitkamp, E. A., Sage, A. M.,Grieshop, A. P., Lane, T. E., Pierce, J. R., and Pandis, S. N.: Rethinking organicaerosols: Semivolatile emissions and photochemical aging, Science, 315, 1259–1262,doi:10.1126/science.1133061, 2007. 7425
Rudich, Y., Donahue, N. M., and Mentel, T. F.: Aging of organic aerosol: Bridging the gap25
between laboratory and field studies, Annu. Rev. Phys. Chem., 58, 321–352, 2007. 7425Scheibel, H. G., and Porstendoerfer, J.: Generation of monodisperse Ag- and NaCl-aerosol
with particle diameters between 2 nm and 300 nm, J. Aerosol Sci., 14, 113–126, 1983. 7432Sjogren, S., Gysel, M., Weingartner, E., Alfarra, M. R., Duplissy, J., Cozic, J., Crosier, J.,
Coe, H., and Baltensperger, U.: Hygroscopicity of the submicrometer aerosol at the high-30
alpine site Jungfraujoch, 3580 m a.s.l., Switzerland, Atmos. Chem. Phys., 8, 5715–5729,doi:10.5194/acp-8-5715-2008, 2008. 7441
Stokes, R. H., and Robinson, R. A.: Interactions in aqueous nonelectrolyte solutions. I. Solute-
7454

ACPD11, 7423–7467, 2011
Volatility andhygroscopicity of
aging SOA in a smogchamber
T. Tritscher et al.
Title Page
Abstract Introduction
Conclusions References
Tables Figures
J I
J I
Back Close
Full Screen / Esc
Printer-friendly Version
Interactive Discussion
Discussion
Paper
|D
iscussionP
aper|
Discussion
Paper
|D
iscussionP
aper|
solvent equilibria, J. Phys. Chem., 70, 2126–2131, 1966. 7441Swietlicki, E., Hansson, H. C., Hameri, K., Svenningsson, B., Massling, A., McFiggans, G., Mc-
Murry, P. H., Petaja, T., Tunved, P., Gysel, M., Topping, D., Weingartner, E., Baltensperger,U., Rissler, J., Wiedensohler, A., and Kulmala, M.: Hygroscopic properties of submicrom-eter atmospheric aerosol particles measured with H-TDMA instruments in various environ-5
ments - a review, Tellus Ser. B-Chem. Phys. Meteorol., 60, 432–469, doi:10.1111/j.1600-0889.2008.00350.x, 2008. 7429
Taira, M., and Kanda, Y.: Continuous generation system for low-concentration gaseous nitrous-acid, Anal. Chem., 62, 630–633, 1990. 7435
Varutbangkul, V., Brechtel, F. J., Bahreini, R., Ng, N. L., Keywood, M. D., Kroll, J. H., Flagan,10
R. C., Seinfeld, J. H., Lee, A., and Goldstein, A. H.: Hygroscopicity of secondary organicaerosols formed by oxidation of cycloalkenes, monoterpenes, sesquiterpenes, and relatedcompounds, Atmos. Chem. Phys., 6, 2367–2388, doi:10.5194/acp-6-2367-2006, 2006. 7426
Villani, P., Picard, D., Marchand, N., and Laj, P.: Design and validation of a 6-volatility tandemdifferential mobility analyzer (VTDMA), Aerosol Sci. Technol., 41, 898–906, 2007. 7430,15
7433Volkamer, R., Jimenez, J. L., San Martini, F., Dzepina, K., Zhang, Q., Salcedo, D., Molina, L.
T., Worsnop, D. R., and Molina, M. J.: Secondary organic aerosol formation from anthro-pogenic air pollution: Rapid and higher than expected, Geophys. Res. Lett., 33(4), L17811,doi:10.1029/2006gl026899, 2006. 742520
Wehner, B., Philippin, S., and Wiedensohler, A.: Design and calibration of a thermodenuderwith an improved heating unit to measure the size-dependent volatile fraction of aerosolparticles, J. Aerosol Sci., 33, 1087–1093, 2002. 7431
Wu, Z. J., Poulain, L., Wehner, B., Wiedensohler, A., and Herrmann, H.: Characteriza-tion of the volatile fraction of laboratory-generated aerosol particles by thermodenuder-25
aerosol mass spectrometer coupling experiments, J. Aerosol Sci., 40, 603–612,doi:10.1016/j.jaerosci.2009.03.007, 2009. 7433
7455
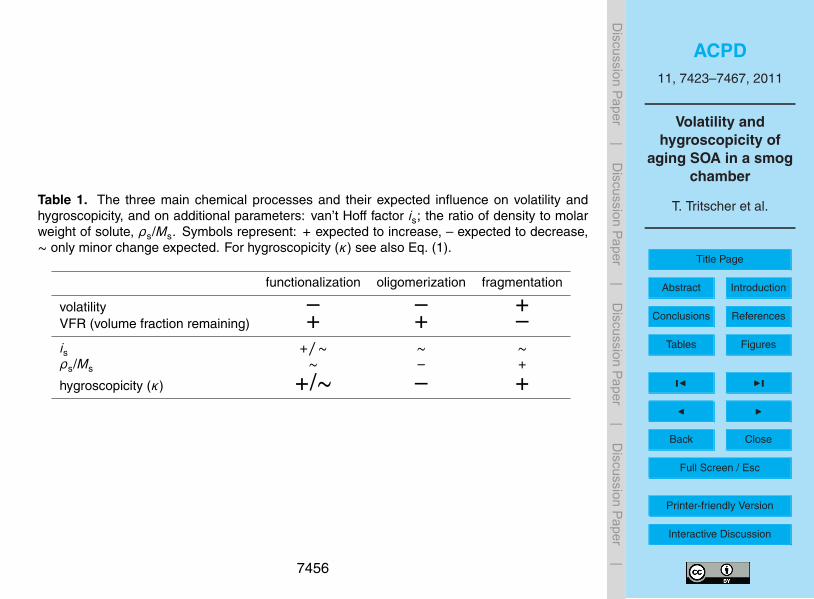
ACPD11, 7423–7467, 2011
Volatility andhygroscopicity of
aging SOA in a smogchamber
T. Tritscher et al.
Title Page
Abstract Introduction
Conclusions References
Tables Figures
J I
J I
Back Close
Full Screen / Esc
Printer-friendly Version
Interactive Discussion
Discussion
Paper
|D
iscussionP
aper|
Discussion
Paper
|D
iscussionP
aper|
Table 1. The three main chemical processes and their expected influence on volatility andhygroscopicity, and on additional parameters: van’t Hoff factor is; the ratio of density to molarweight of solute, ρs/Ms. Symbols represent: + expected to increase, – expected to decrease,∼ only minor change expected. For hygroscopicity (κ) see also Eq. (1).
functionalization oligomerization fragmentation
volatility – – +VFR (volume fraction remaining) + + –is +/∼ ∼ ∼ρs/Ms ∼ – +
hygroscopicity (κ) +/∼ – +
7456

ACPD11, 7423–7467, 2011
Volatility andhygroscopicity of
aging SOA in a smogchamber
T. Tritscher et al.
Title Page
Abstract Introduction
Conclusions References
Tables Figures
J I
J I
Back Close
Full Screen / Esc
Printer-friendly Version
Interactive Discussion
Discussion
Paper
|D
iscussionP
aper|
Discussion
Paper
|D
iscussionP
aper|
Table 2. Overview for all smog chamber experiments during the MUCHACHAS campaign 2009at PSI with detailed experiment conditions (AP and O3 input) and results from the V/H-TDMA.
exp. experiment exp. date nominal nominal comments on the hygroscopic growth factor volume fraction remaining comments onID/No. type AP input O3 input experiment at RH of 95% and (κ value) at temperature of 70 ◦C V/H-TDMA
dd mm yyyy [ppb] [ppb]beforeOHaging
2 h OHaging
4 h OHaging
beforeOHaging
2 h OHaging
4 h OHaging
ozonolysisonly
1 O3 only 26 Jan 2009 40 5001.32(0.083)
– – 0.71 – – thermogram
2 O3 only 18 Feb 2009 40 500 no AMS data1.28(0.069)
– – 0.81 – – thermogram
ozonolysisand lightOH, HONOphotolysis
3 O3 + HONO+ light
16 Jan 2009 40 100+300 only 1st part used,H2SO4 during HONO
1.37(0.096)
1.47(0.133)
1.50(0.139)
0.61 0.58 0.72 only ozonoly-sis part used;thermogram
4 O3 + HONO+ light
21 Jan 2009 10 150+501.38(0.113)
1.46(0.138)
1.48(0.141)
0.70 0.63 –
5 O3 + HONO+ light
11 Feb 2009 10 250+50 lights ON/OFF1.35(0.100)
1.42(0.138)
1.42(0.120)
0.68 0.64 0.70
6 O3 + HONO+ NO + light
19 Jan 2009 40 90+201.37(0.097)
1.43(0.116)
1.46(0.131)
0.66 0.58 – thermogram
7 O3 + HONO+ NO + light
13 Feb 2009 40 150+1001.31(0.084)
1.39(0.106)
1.39(0.108)
0.65 0.59 0.61
8 O3 + HONO+ NO + light
23 Jan 2009 10 2001.40(0.115)
1.42(0.123)
1.43(0.128)
0.71 0.64 0.78 thermogram
9 O3 + light 14 Jan 2009 40 200 very short experiment1.19*(0.084)
1.21*(0.094)
– 0.70 0.67 – *H-TDMA at 90%RH; only thermo-gram
10 O3+light 6 Feb 2009 10 200 lights ON/OFF1.40(0.115)
1.46(0.139)
1.49(0.148)
0.72 0.69 0.74
ozonolysisand darkOH, TMEozonolysis
11 O3 + TME 28 Jan 2009 40 500+200 long exp.1.29(0.072)
1.36(0.093)
1.39(0.104)
0.56 0.57 0.60 thermogram
12 O3 + TME 23 Feb 2009 10 500 no AMS data1.34(0.106)
1.40(0.129)
1.44(0.145)
0.670.60–0.63
0.61–0.65
13 O3 + TME +lights
2 Feb 2009 10 500+150+150
long exp.; lights ON atend of exp.
1.34(0.098)
1.41(0.125)
1.44(0.135)
0.65 0.62 – thermogram
14 O3 + TME +lights
9 Feb 2009 10 500+150 lights ON/OFF1.35(0.094)
1.42(0.137)
1.45(0.139)
0.660.62–0.66
0.66
15 O3 + TME +lights
25 Feb 2009 10 500 UV intensiv lights inaddition to TME; noAMS data
1.31(0.087)
1.35(0.103)
1.61(0.206)
0.63 0.62 0.82 (thermogram)
7457

ACPD11, 7423–7467, 2011
Volatility andhygroscopicity of
aging SOA in a smogchamber
T. Tritscher et al.
Title Page
Abstract Introduction
Conclusions References
Tables Figures
J I
J I
Back Close
Full Screen / Esc
Printer-friendly Version
Interactive Discussion
Discussion
Paper
|D
iscussionP
aper|
Discussion
Paper
|D
iscussionP
aper|
Fig. 1. Schematic of the combined volatility and hygroscopicity tandem differential mobilityanalyzer (V/H-TDMA) setup with the main instrument parts and sensors. The reference RHof the humidified branch is calculated from the dewpoint and temperature measured by a dewpoint mirror at the excess air outlet DMA2. The reference temperature for the V-branch is justbefore the outlet of the heater. The given residence times are measured between outlet ofDMA1 and DMA2 or DMA3, respectively.
7458

ACPD11, 7423–7467, 2011
Volatility andhygroscopicity of
aging SOA in a smogchamber
T. Tritscher et al.
Title Page
Abstract Introduction
Conclusions References
Tables Figures
J I
J I
Back Close
Full Screen / Esc
Printer-friendly Version
Interactive Discussion
Discussion
Paper
|D
iscussionP
aper|
Discussion
Paper
|D
iscussionP
aper|
Fig. 2. Thermograms, normalized volume fraction remaining (VFR) plotted against the mea-sured heater temperature, for sodium chloride (NaCl) (panel A), citric acid (panel B) and am-monium sulfate (AS) (panel C) as retrieved from the V-TDMA measurements. Different drydiameters (D0) are distinguished by color and the error bars represent the minimal and maxi-mal temperature during a scan.
7459
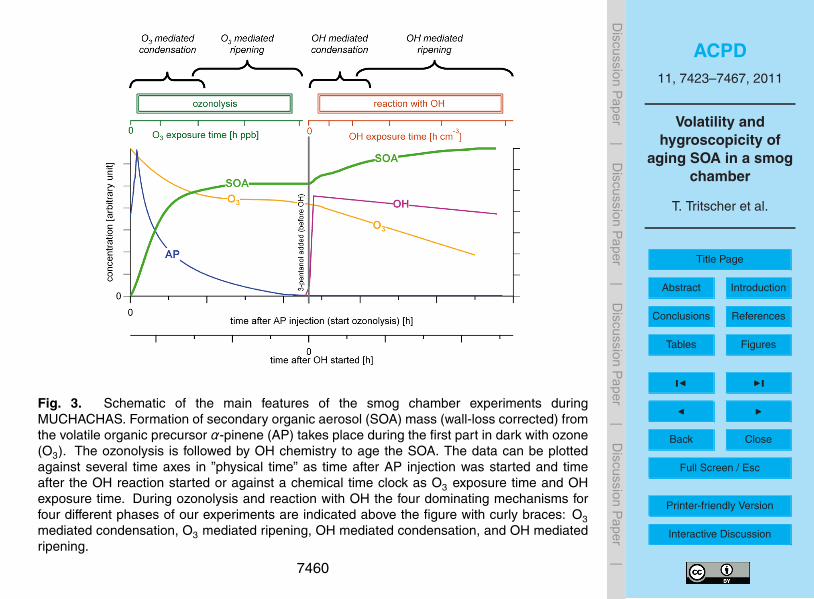
ACPD11, 7423–7467, 2011
Volatility andhygroscopicity of
aging SOA in a smogchamber
T. Tritscher et al.
Title Page
Abstract Introduction
Conclusions References
Tables Figures
J I
J I
Back Close
Full Screen / Esc
Printer-friendly Version
Interactive Discussion
Discussion
Paper
|D
iscussionP
aper|
Discussion
Paper
|D
iscussionP
aper|
Fig. 3. Schematic of the main features of the smog chamber experiments duringMUCHACHAS. Formation of secondary organic aerosol (SOA) mass (wall-loss corrected) fromthe volatile organic precursor α-pinene (AP) takes place during the first part in dark with ozone(O3). The ozonolysis is followed by OH chemistry to age the SOA. The data can be plottedagainst several time axes in ”physical time” as time after AP injection was started and timeafter the OH reaction started or against a chemical time clock as O3 exposure time and OHexposure time. During ozonolysis and reaction with OH the four dominating mechanisms forfour different phases of our experiments are indicated above the figure with curly braces: O3mediated condensation, O3 mediated ripening, OH mediated condensation, and OH mediatedripening.
7460

ACPD11, 7423–7467, 2011
Volatility andhygroscopicity of
aging SOA in a smogchamber
T. Tritscher et al.
Title Page
Abstract Introduction
Conclusions References
Tables Figures
J I
J I
Back Close
Full Screen / Esc
Printer-friendly Version
Interactive Discussion
Discussion
Paper
|D
iscussionP
aper|
Discussion
Paper
|D
iscussionP
aper|
Fig. 4. Mean VFR (circles) measured for SOA from three different experiment types, distin-guished with greenish, reddish and bluish color, at various heater temperatures with error barsrepresenting the standard deviation of VFR and temperature of multiple measurements duringthe experiment. Literature data (squares) from similar SOA studies were added for comparison.The black solid line represents a fit though all measured data of this study.
7461

ACPD11, 7423–7467, 2011
Volatility andhygroscopicity of
aging SOA in a smogchamber
T. Tritscher et al.
Title Page
Abstract Introduction
Conclusions References
Tables Figures
J I
J I
Back Close
Full Screen / Esc
Printer-friendly Version
Interactive Discussion
Discussion
Paper
|D
iscussionP
aper|
Discussion
Paper
|D
iscussionP
aper|
Fig. 5. All experiments of the ozonolysis part only. The color indicates the O3 concentration,blue for low O3 (<400 ppb) and orange for high O3 (≥400 ppb). The filled symbols representthe low α-pinene (AP) (10 ppb) and open symbols the high AP (40 ppb) precursor concentrationexperiments. The relative fraction of AP reacted, wall-loss corrected SOA mass concentration(org. mass), volatility expressed as VFR at 70 ◦C, the hygroscopic parameter κ, and the GF at95% RH (panel A–E) are plotted against the time after AP was injected into the smog chamber(physical time). The vertical lines indicate roughly the 90%-AP-reacted value for the four mainexperiment conditions: high/low AP (open/solid line, respectively), combined with high/low O3(orange/blue color, respectively).
7462

ACPD11, 7423–7467, 2011
Volatility andhygroscopicity of
aging SOA in a smogchamber
T. Tritscher et al.
Title Page
Abstract Introduction
Conclusions References
Tables Figures
J I
J I
Back Close
Full Screen / Esc
Printer-friendly Version
Interactive Discussion
Discussion
Paper
|D
iscussionP
aper|
Discussion
Paper
|D
iscussionP
aper|
Fig. 6. Time series of two α-pinene (AP) ozonolysis experiments followed by reaction with OHfrom HONO photolysis. The two phases of the experiment, ozonolysis and reaction with OH,are distinguished by open and closed symbols, respectively, and green and blue color is usedfor the low (10 ppb) and high (40 ppb) AP precursor concentration experiment, respectively.Panel (A) shows the organic aerosol mass (wall-loss corrected), panel (B) the VFR at 70 ◦Cand in panel (C) the hygroscopicity parameter κ (left axis) as well as the O:C ratio (right axis).The evolution of the VFR during O3 mediated ripening (ca. from −3 to 0 h) was linearly fittedand extrapolated to indicate the trend expected without reaction with OH. The grey dotted linesshown in panel (C) help to guide the eye to see the changing trends of κ in the four periods ofthe experiment.
7463

ACPD11, 7423–7467, 2011
Volatility andhygroscopicity of
aging SOA in a smogchamber
T. Tritscher et al.
Title Page
Abstract Introduction
Conclusions References
Tables Figures
J I
J I
Back Close
Full Screen / Esc
Printer-friendly Version
Interactive Discussion
Discussion
Paper
|D
iscussionP
aper|
Discussion
Paper
|D
iscussionP
aper|
Fig. 7. Volatility, expressed as VFR at 70 ◦C, and hygroscopicity parameter κ plotted againstthe chemical clock OH exposure time shown for the reaction with OH part of the experimentsonly. The color code in panel (A) and (B) represents the individual experiments; while thesymbols shape and filling indicate the experiment type and α-pinene (AP) input concentration,respectively. The filled symbols represent the low AP (10 ppb) and open symbols the highAP (40 ppb) precursor concentration experiments. Panel (C) and (D) show exactly the samedata as panels (A) and B, now arranged in groups of experiment type and color coded bytheir wall-loss corrected organic aerosol mass (note that the red color ranges from 120 tomax. 255 g/m3).
7464

ACPD11, 7423–7467, 2011
Volatility andhygroscopicity of
aging SOA in a smogchamber
T. Tritscher et al.
Title Page
Abstract Introduction
Conclusions References
Tables Figures
J I
J I
Back Close
Full Screen / Esc
Printer-friendly Version
Interactive Discussion
Discussion
Paper
|D
iscussionP
aper|
Discussion
Paper
|D
iscussionP
aper|
Fig. 8. Correlation of hygroscopicity parameter κ and VFR at 70 ◦C of α-pinene SOA shown inpanel (A) for all available experiments during the ozonolysis part only. The same correlation isshown in panel (B) for experiments No. 11-14 during the reaction with OH from TME in absenceof light (open symbols), sometimes with addition of lights (closed symbols). The data shown inpanel (B) are color coded by time after OH started.
7465

ACPD11, 7423–7467, 2011
Volatility andhygroscopicity of
aging SOA in a smogchamber
T. Tritscher et al.
Title Page
Abstract Introduction
Conclusions References
Tables Figures
J I
J I
Back Close
Full Screen / Esc
Printer-friendly Version
Interactive Discussion
Discussion
Paper
|D
iscussionP
aper|
Discussion
Paper
|D
iscussionP
aper|
Fig. 9. Results from low concentration α-pinene experiments No. 5 (OH from HONO photoly-sis, green) and 14 (OH from TME, yellow) are plotted as time series of: (A) wall-loss correctedorganic aerosol mass (org. mass), (B) volatility as VFR at 70 ◦C, (C) hygroscopicity parameterκ, and (D) O:C ratio. The lights were intermittently turned on and off during these two experi-ments. The double arrows above the figure indicate the periods with lights on. The symbols inpanel (B) and (C) indicate the dry diameter (D0) for the TDMA measurement and show the sizedependence of volatility and hygroscopicity.
7466

ACPD11, 7423–7467, 2011
Volatility andhygroscopicity of
aging SOA in a smogchamber
T. Tritscher et al.
Title Page
Abstract Introduction
Conclusions References
Tables Figures
J I
J I
Back Close
Full Screen / Esc
Printer-friendly Version
Interactive Discussion
Discussion
Paper
|D
iscussionP
aper|
Discussion
Paper
|D
iscussionP
aper|
Fig. A1. The relative fraction α-pinene (AP) reacted, SOA mass (org. mass), volatility as VFRat 70 ◦C, hygroscopicity parameter κ, and the O3 concentration (panel A–E) are plotted againstthe integrated O3 exposure time (chemical time). The color indicates the O3 concentration inblue for low O3 (<400 ppb) and orange for high O3 (≥400 ppb), respectively. The filled symbolsrepresent low AP and open symbols the high AP precursor experiments (compare Fig. 5).
7467
Related Documents


