Vol. XII December, 2014

Welcome message from author
This document is posted to help you gain knowledge. Please leave a comment to let me know what you think about it! Share it to your friends and learn new things together.
Transcript
Vol. XIIDecember, 2014
i
ISSN 0975-1211
REVELATION
The Research Journal
of
K.P.B. Hinduja College
Volume XII
December 2014
K.P.B. Hinduja College of Commerce
315, New Charni Road, Mumbai 400 004.

ii
ISSN 0975-1211
Editorial Board
Chief Editor: Dr. T.A.Shiware
Managing Editor: Dr. (Ms.) Minu Madlani
Executive Editor: Dr. (Ms.) Rajeshwary G.
Advisors:
1. Dr. J.F.Patil
2. Dr. S.K.G. Sundaram
3. Dr. L. M. Dani
4. Dr. G.M.Talhar
5. Dr. R.R.Khan
6. Dr. Madhu Nair
7. Dr S. Kaptan
Place of Publication: K.P.B. Hinduja College of Commerce
315, New Charni Road,
Mumbai 400004.
Views expressed in the articles are those of the authors and do not necessarily represent
those of the Editor of the Journal. All rights are reserved. No part of this publication may be
reproduced or copied in any form by any means without prior written permission.

iii
ISSN 0975-1211
Vol. No. 12 December 2014
Contents
Sr. No. Subjects Page No.
1 Foreword from the Chief Editor v
2. From the Executive Editor’s Desk vi
3. Perception Mapping On Purchase Behaviour of Smart Phone among
Working Women in the Corporate of Coimbatore City
Dr. Angamuthu
Balasubramaniam
1
4 Micro Finance- A Way to Alleviate Poverty
Shweta Sawhney
21
5 Trends In The Growth Of Higher Education In Andhra Pradesh
Dr. D. Pulla Rao
37
6 The Retail Revolution in Mumbai
Dr. L. R. Bahadur
58
7 A Study of Pre and Post Impact of Online trading in Indian Stock
Market
Dr. Gayatri Agarwal
68
8 Enhancing Airline Warehousing Productivity through State-Of-The-
Art Information Technology Implementation
Dr. Siddhartha Ghosh
74

iv
From the Editor’s Desk
The Research Journal Revelation is being brought out by K.P.B. Hinduja College of
Commerce with a view to assist academicians, professionals and researchers to share
information on topics related to Growth and Development of Business in India. The aim of
this Journal is to encourage researchers to contribute research articles based on
Industry Studies or on the Findings of Research Projects that have been executed. Issues
relevant to the growth and development of Indian Economy, in the streams of Arts, Science,
Social Sciences, Economics, Commerce and Management are also welcome.
Original research articles based on an up to date review of literature and supportive
primary/secondary data are invited.
Frequency of Publication: Biannual
Contact Address:
K.P.B. Hinduja College of Commerce, 315, New Charni Road, Mumbai.400 004.
Phone 022 4098 9000 Fax : 2385 93 97.
Email : [email protected]
Executive Editor’s E mail address: [email protected]
v
Foreword from the Chief Editor
India will have to radically transform its manufacturing sector by focusing on a large scale
labor-intensive factors by producing exportable goods and by reducing the share of
employment in agriculture from the present 58% to 25% by 2030, with industry doubling its
labor demand. To usher in a manufacturing revolution in India, the country’s exports have to
play a critical role and this must accelerate at a much faster pace to achieve a growth rate of
20-25% in real terms.
Small and medium enterprises (SMEs) play a significant role in generating millions of jobs.
India needs to enhance their scale of operations, to ensure better adoption of technology, to
provide innovative financing and a mechanism for upgrading the skills of workers. Labor-
intensive sectors like food processing, apparels and textile, leather and footwear contribute to
over 60 per cent of SMEs employment. Hence a greater focus on the growth of labor
intensive sectors will enable the absorption of a growing surplus of unskilled labor. As
energy costs have a major bearing on the manufacturing sector, India needs to make available
a continuous supply of power by removing constraints on coal and gas. It is a known fact that
freight and logistics costs are enormously high and that 70 per cent of container
transportation is through roads, a model shift from road to rail is therefore necessary. In
addition, port infrastructure needs a radical overhaul as the average turnaround time in India
is a 3.5 days as against a mere 10 hours in Hongkong. For large-scale manufacturing to take
off, India must be transformed into an attractive investment hub with businesses clearances
becoming less time –consuming, expensive and cumbersome.
India needs to focus on the development of industrial clusters where it can create an
ecosystem of supply-chain responsiveness, lower logistics costs, availability of labor and
vi
technology up gradation. These clusters will converge the advantages of higher innovation
and employment generation for small firms with scale and costs advantages of larger
organizations.
Finally, India needs to vigorously pursue FDP in manufacturing in defence, telecom,
transportation and power. Over the next two decades, there will be a huge shift of
manufacturing capacity from the developed to the emerging economies. India needs to
capture a disproportionate share of this shift to create jobs for its very young population.
Dr. T. A. Shiware
Chief Editor

vi
From the Executive Editor’s Desk…
The Indian Economy is firmly set on a high growth plan for the next few years. The
proportion of working age persons in the total population is on the rise. If the working age
population can be productively employed, the ratio of earners to dependents will keep rising
for the next few years yielding a large ‘demographic dividend’ of higher growth rates,
rapidly rising per capita income and rising consumption. Another trend that is visible is that
the Indian workforce has slowly moved from low productivity agriculture to higher
productivity sectors like industry and services. This change in trend points to a potential rise
in productivity, saving and investment. If the growth rate rises to 6.7 % or more in the next
two decades, it will enable the productive employment of an additional 8,00,000 to one
million youth who will enter the workforce. However, realization of the long cycle of high
growth will depend upon some critical pre-conditions being fulfilled. One pre-condition is
the accumulation of physical capital not just in plants and equipment’s, but also in
infrastructure such as roads, railways, ports, airports, communication and power. There has
been a remarkable improvement in this field during the past decade. In the power sector,
which is the main bottleneck today, new capacity has been created, but the sector is hobbled
by a shortage of coal supply. Fortunately the PMO is now focused on this challenge and one
can hope to see some forward movement in the near future.
An important pre-condition and a much bigger challenge is education. Education is the key to
equipping the workforce with the necessary knowledge and skills required to migrate from
low to high productivity jobs. The quality of education is poor and the learning levels are
declining. Hence it is an added responsibility of the government to provide not only quality

vii
education by providing education to all, but also to make an attempt to control the drop-out
level in schools and colleges.
Another problem the country faces is the challenge of hunger. There is a high incidence of
malnutrition. About 38% of Indians are malnourished; hence there is an urgent need to make
provision for quick distribution of food at reasonable rates to the poor. Bold imaginative
reforms in the distribution of food, as well as in the delivery of education services and
infrastructure are the key pre-conditions that India must fulfill in order to realize its potential
long cycle of high inclusive growth.
Dr. (Ms.) Rajeshwary
Executive Editor
1
Perception Mapping On Purchase Behaviour of Smart Phone among
Working Women in the Corporate of Coimbatore City∗Dr. Angamuthu Balasubramaniam
Abstract
This exploratory study aims to study the brand possession of smart phone and factors
that determine brand positioning of smart phone among working women. Self-designed
questionnaire has been used to collect the primary data and the data were collected from
200 working women in various corporate offices like Cognizant Technology Solutions,
First Source Solutions Ltd, Ugam, Ford Business Services Centre, Vanenburg Software
(India) Private Limited, VWR, Nous Infosystems, C Bay systems etc. Purposive
sampling method is most suitable for sample selection of current research work. This
study reported that majority of the working women have Samsung (28%) brand of smart
phone, followed by Micromax (23.5%) and Sony (20%). Chi-square analysis reveals
that there is a significant relationship of brand possession of Smart phone among
various age groups of working women. Factoring of various parameters are done using
SPSS and it is found that the factors like value added features, pricing and quality,
brand image of smart phone determine brand possession of smart phone. Finally, this
study explains that the purchase behavior of smart phone through the different
perceptual maps.
Keywords: Mobile phone, Smart phone, Purchase behavior, Perception
1 Introduction
With rapid technological developments, mobile phone has evolved from a mere
communication device to smart phone with an ability to tap a plethora of information &
services. A smart phone, or smart phone, is a mobile phone with more advanced
computing capability and connectivity than basic feature phones. The first smart phones, the
IBM Simon and Nokia Communicator 9000 were released way back in 1994 and 1996 respectively, and
integrated the features of a mobile phone and a personal digital assistant (PDA) for managing calendars
and contacts. Both were much larger than regular phones. It wasn’t until 2000 that the first real smart
∗ Assistant Professor of Commerce, Kovai Kalaimagal College of Arts and Science, Coimbatore.

2
phone, the Ericsson R380, was released. It wasn’t any larger than a regular phone, and in the early 2000s
many others followed suit, with phones like the Palm and Blackberry achieving big success. In 2007,
Apple released the iPhone, which eschewed hardware buttons for full touch screen control and has been
the template for smart phones ever since. In the 21st Century most of the mobile makers are released
variety of smart phones. The Worldwide mobile phones sales, which includes both smart
phone and feature phone sales, increased to 1.81 billion in the year of 2013from 1.75
billion over the year of 2012. Among the mobile makers, Samsung continued to be the
biggest mobile phone company internationally by selling 444.44 million devices in
2013. This is followed by Nokia, Apple, LG etc. (Refer Table -1)
Table – 1: Worldwide Mobile Phone Sales to End Users by Vendors
Company 2013 (Units in 000’s) 2012 (Units in 000’s)
Samsung 444,444.2 384,631.2
Nokia 250,793.1 333,938.0
Apple 150,785.9 130,133.2
LG 69,024.5 58,015.9
ZTE 59,898.8 67,344.4
Huawei 53,295.1 47,288.3
TCL Communication 49,531.3 37,176.6
Lenovo 45,284.7 28,151.4
Sony 37,595.7 31,394.2
Yulong 32,601.4 18,557.5
Others 613,710.0 609,544.9
Source: Gartner
Value Added Services of Smart phone Technology
The services provided over a mobile phone today role of voice communications to a
range of value added services. The value added service (VAS) is provided either
directly by the telecom operators themselves or by a third party Value Added Service
Provider (VASP). VASP connects to the core equipment of telecom operators through
inter-working units using protocols like short message peer-to-peer protocol (SMPP),
connecting either directly to the short message service centre (SMSC) or to a messaging
gateway that allows the telecom operators to have control of the content. In view of the
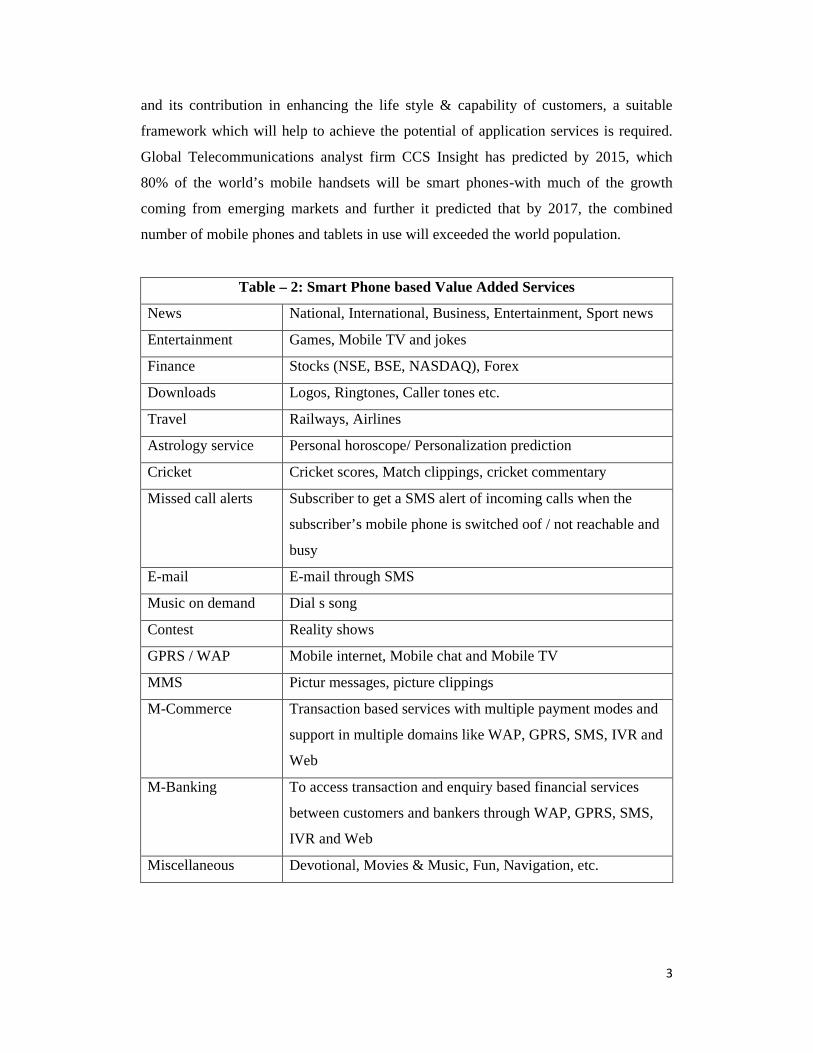
growing and likely unprecedented expansion of value added services (Refer Table – 2)
3
and its contribution in enhancing the life style & capability of customers, a suitable
framework which will help to achieve the potential of application services is required.
Global Telecommunications analyst firm CCS Insight has predicted by 2015, which
80% of the world’s mobile handsets will be smart phones-with much of the growth
coming from emerging markets and further it predicted that by 2017, the combined
number of mobile phones and tablets in use will exceeded the world population.
Table – 2: Smart Phone based Value Added Services
News National, International, Business, Entertainment, Sport news
Entertainment Games, Mobile TV and jokes
Finance Stocks (NSE, BSE, NASDAQ), Forex
Downloads Logos, Ringtones, Caller tones etc.
Travel Railways, Airlines
Astrology service Personal horoscope/ Personalization prediction
Cricket Cricket scores, Match clippings, cricket commentary
Missed call alerts Subscriber to get a SMS alert of incoming calls when the
subscriber’s mobile phone is switched oof / not reachable and
busy
E-mail E-mail through SMS
Music on demand Dial s song
Contest Reality shows
GPRS / WAP Mobile internet, Mobile chat and Mobile TV
MMS Pictur messages, picture clippings
M-Commerce Transaction based services with multiple payment modes and
support in multiple domains like WAP, GPRS, SMS, IVR and
Web
M-Banking To access transaction and enquiry based financial services
between customers and bankers through WAP, GPRS, SMS,
IVR and Web
Miscellaneous Devotional, Movies & Music, Fun, Navigation, etc.

4
Growth of Mobile Phone Services of India in the 21st Century
Here, the growth of mobile phone services measured through mobile subscription base.
The Year-on-Year trend growth rate of the subscriber base depicted a positive trend
over the periods from 2001-2002 to 2011-2012. The maximum growth of subscriber
base was 158.31 percent during the year 2002-2003 (Refer Table - 3). The above
discussion clearly indicates that the potential development and growth of mobile phone
service in India. The comparison of actual growth of mobile subscriber base declining
trend compared with expected growth from 2004-2005 to 2009-2010 (Refer Figure – 1).
The data predicts that the growth of mobile phone service in terms of subscriber base in
2014-2015 has crossed to 1000 million with the growth rate of 13.11 percent compared
to 2011-2012.
Table – 3:Trends in Mobile Services from 2001-2002 to 2011-2012
Year Subscribe (in Millions) Growth (%)
2001-2002 13 -
2002-2003 33.58 158.31
2003-2004 50 48.90
2004-2005 76 52.00
2005-2006 98.77 29.96
2006-2007 165.11 67.17
2007-2008 261.07 58.12
2008-2009 391.76 50.06
2009-2010 584.32 49.15
2010-2011 811.59 38.89
2011-2012 919.17 13.26
2014-2015* 1039.65 13.11
Source: Computed from secondary data
*forecast

5
Source: Secondary data
Growth of Mobile Phone Service in the Urban India
The urban mobile phone subscriber base since March 2007 is indicated in Figure 2. As
on 31st March 2012, the mobile services according to subscriber base in urban areas has
reached the 595.06 million mark as against 538.05 million as on 31st March 2011. The
urban subscriber base is steadily increasing with CAGR of 35.15 percent for six years
period from 2006-2007 to 2011-2012. Further, the data predict that mobile phone
subscriber in urban areas has reached to around 900 million at the end of 31st March
2015.
Source: Secondary data
6
2 Statement of the Problem
Smart phone became integral part of our life. The usage of smart phone depends on the
many vital points that make its necessity like applications, GPS functionality, organizer,
alarm & calendar, media playing, capturing precious moments of personal life on the
go, texting/messaging, the internet/web surfing, e-mail, operating system, life style,
social status and so on. The present era most of the peoples are using smart phone than
basic features phone and also the mobile makers are releasing variety of smart phones at
different prices in the competitive market. So, this study focuses on purchasing behavior
of smart phone among corporate workers because of those are having capable to buy
smart phone and live according to modern trend.
3. Objectives of the Study
1. To study the brand possession of Smart phone among working women and also study
the relationship of brand possession of smart phone among various age groups,
education, monthly income and marital status of the working women
2. To find out the factors that determine for brand positioning of smart phone among
working women
3. To draw out the perceptual map towards responsible factors on brand positioning
strategies of smart phone among working women
4. Hypotheses of the Study
1. Ho1: There is no significant relationship between age group, education, monthly
income, marital status of the working women and their brand possession of smart
phone.
2. Ho2: f1, f2, f3,………f4 determines that brand positioning of samrtphone among
working women.
5. Review of Literature
Babita et al. (2013) in their research attempt to analyze the purchase behavior of men
and women towards different branded apparels and to study the effect of promotional
activities on their purchasing. This study considers brand awareness includes
both brand recognition as well as brand recall. Brand recognition is the ability of
consumer to recognize prior knowledge of brand when they are asked questions about
7
that brand or when they are shown that specific brand. Chaitanya (2013) investigates
customers' choice for the mobile phones with a right blend of features and price. A
survey conducted among 214 Indian undergraduate student mobile phone users reveal
their criteria for selecting mobile phone with maximum features and an affordable price.
Feature-wise comparison is also made between mobile phones of most preferred
companies. Dhevika et al. (2013) studied brand switching among cellular network
service users and this study found that users’ satisfaction is the main influencing factors
for brand switching. Dapeno et al. (2012) their study explores the perceived importance
of various aspects of service quality and customer switching behavior in China's mobile
phone service sector. The study identifies the following seven critical factors, listed in
descending order of influence, that cause customers to switch mobile phone service
providers: core service failure, high price, ethical problems, competition, inconvenience,
service encounter failure, and influence from family/friends/group. Duhan et al. (2012)
in their study investigate to trace about the brand awareness and also know the effects
of brand name on purchase decision regarding the durables like television, refrigerator
and washing machine in the rural areas of Haryana. The results show
that brand awareness is increasing day-by-day among rural population due to effect of
information technology. Further, the survey has found that there were many issues faced
by rural people when they decide about brand of a particular product to use. Syed and
Ravi (2012) examines the consumer perception and their impact on purchase intentions
towards branded men` garments. The result of this research is socio-cultural and
personality related factors induce the purchase intention among the consumers. Arpita et
al. (2011) their research paper focuses on identifying factors responsible for brand-
awareness in the high- and low-involvement category products. The findings suggest
that brand functions play a significant role in consumers' purchase behaviour in high-
involvement products and advertising plays a significant role in low-involvement
product purchase decision. Krishna Kumar (2011) reported that occupational status has
no significant association over the time taken to decide on purchase, mode of purchase
and item possed. On the other hand, occupational status has significant influence over
the media creating awareness towards electronic goods. Matti (2011) investigate the
mobile phone feature preferences among male respondents in Finland. The results
indicate that battery/talk time is the most important feature for the respondents. The
respondents perceive there to be six logical factors among the feature preferences as

8
follows: business functionality, support functions, aesthetics + design, parts + processes,
solidity, and tones + games. Bong Gyou et al. (2010) analyze the influential factors on
continuous use intention for 3G mobile video phone services. The results showed that
attitude, subjective norm, and video phone function exert a significant influence on
continuous use intention for video phone services and video phone function and video
phone call quality exert influence on user attitude. Lalit and Manish (2009) reported that
the major factors influencing the choice of service provider were network coverage,
price, value-for-money and billing integrity, recommendations from family and friends,
customer service and company image. Further, network problem was observed to be the
most important reason for switching over to other mobile phone service provider.
Mody-Kamdar Rutu and Srivastava Mala (2009) in their study attempts to understand
how consistency of brand image across consumers is affected by the consumers’
involvement with the product category and familiarity with the brand. Vijayakumar
(2006) reported that the satisfaction derived by the subscribers of Airtel Network has
been influenced by the clarity of signals, availability of plan options, low call charges
and activation formalities. Revathy et al. (2005) found that the factors like lower service
charges offered by Department of Telecommunications (DOT) than other private
players, convenience of contact, accessibility, improvement of own business/profession,
prestige and status symbol as the influencing factors for the possession of cell phone
connections.
6. Research Methodology
The study is an exploratory in nature and based on survey method. The self-designed
questionnaire has been used to collect primary data. The data were collected from 200
women respondents who are working in various corporate offices of Coimbatore City,
Tamil Nadu State. The sample respondents are selected in various corporate offices that
are functioning in KGISL Campus & KCT Techpark (Saravanmpatty), Rathinam
Techzone (Eachanari) and TIDEL Park (Aerodrome). The secondary data has been used
to discuss the theoretical part of this study and the secondary data have been collected
from official reports of Telecom Regulatory Authority of India (TRAI), books, Journals
and various websites. Purposive sampling method has been adopted. The primary data
collected from respondents during the months of February, March and April’ 2014. The
statistical tools such as % analysis, Chi-square test(χ2), Kaiser-Meyer-Olkin (KMO) test,
9
Bartlett’s test of Sphercity and factor analysis were applied which are considered
appropriate to the current research.
7. Analysis and Interpretations
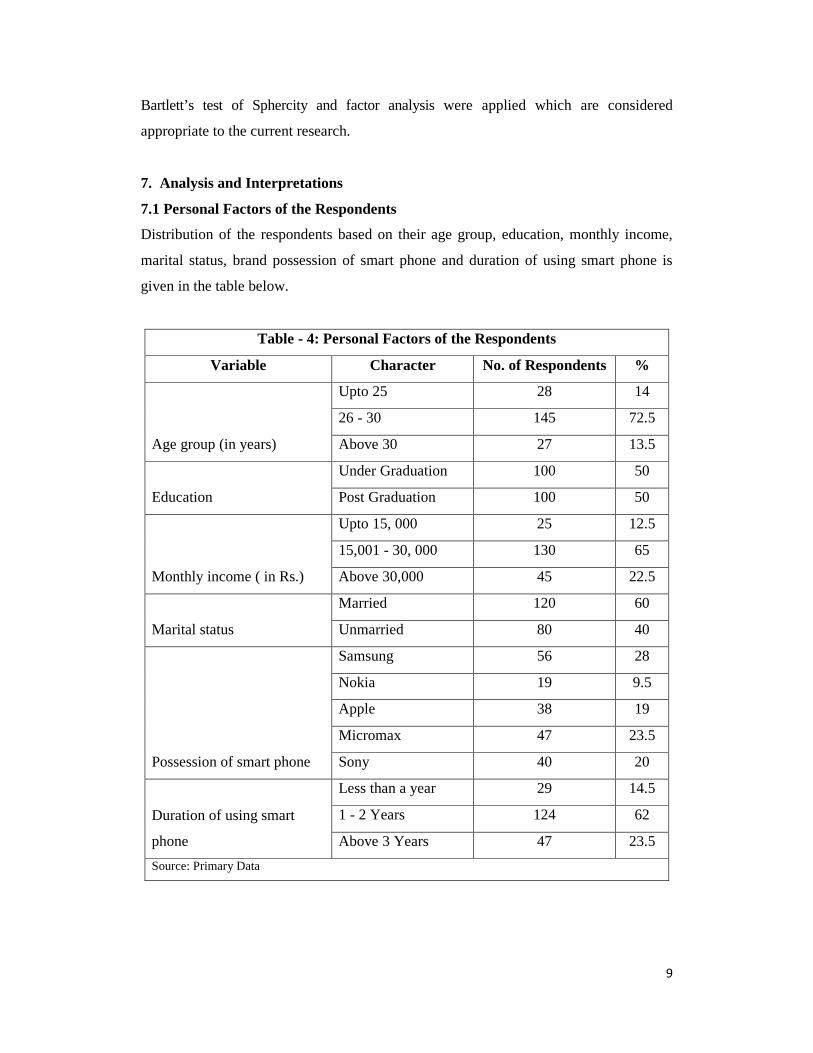
7.1 Personal Factors of the Respondents
Distribution of the respondents based on their age group, education, monthly income,
marital status, brand possession of smart phone and duration of using smart phone is
given in the table below.
Table - 4: Personal Factors of the Respondents
Variable Character No. of Respondents %
Age group (in years)
Upto 25 28 14
26 - 30 145 72.5
Above 30 27 13.5
Education
Under Graduation 100 50
Post Graduation 100 50
Monthly income ( in Rs.)
Upto 15, 000 25 12.5
15,001 - 30, 000 130 65
Above 30,000 45 22.5
Marital status
Married 120 60
Unmarried 80 40
Possession of smart phone
Samsung 56 28
Nokia 19 9.5
Apple 38 19
Micromax 47 23.5
Sony 40 20
Duration of using smart
phone
Less than a year 29 14.5
1 - 2 Years 124 62
Above 3 Years 47 23.5
Source: Primary Data

10
It could be collected from the table – 4 that the majority (72.5%) of the respondents
belongs to the age group of 26-30 years, 14% of the respondents belong to the age
group of upto 25 years and the remaining 13.5% of the respondents belongs to the age
group of Above 30 years. The sample includes half of the respondents have their
educational qualification is Post Graduation and the remaining half of them is Under
Graduation. This is followed by 65% of the respondents belongs to their monthly
income of Rs. 15, 001 – Rs.30,000 category compared upto Rs. 15, 000 (12.5%) and
High income (Above Rs.30,000) category. Nearly 6/10th of the respondents are married
amd the remaining 4/10th of them unmarried. Majority (28%) of the respondents have
Samsung brand of smart phone, followed by Micromax (23.5%), Sony (20%), Apple
(19%) and Nokia (9.5%). Little more than 6/10th of the respondents have using preferred
brand of smart phone for 1 to 2 years.
7.2 Relationship of personal profile of the Respondents and Brand Possession of
Samrt Phone
Here, χ2 analysis were used to test the relationship between independent and dependent
variable. The χ2 statistic is to carry out through the difference between the observed and
the expected frequencies in the cells of the contingency table using proper formula. The
framed hypotheses are:
Ho: There is no significant relationship between age group, education, monthly income,
marital status of the respondents and their brand possession of smart phone.
Ho1: There is no significant relationship between age group, education, monthly
income, marital status of the respondents and their brand possession of smart phone.
Table - 5: Relationship between Personal Factors and Brand Possession of
Smart phone
Variables
d
f Result TV
Age group & Brand possession
of smart phone
16.6
54* 8
Reject Ho &
Accept Ho1
15.51 @ 5% level &
20.09 @ 1% level
Education & Brand possession
of smart phone
4.18
8 4
Accept Ho &
Reject Ho1
9.49 @ 5% level &
13.23 @ 1% level
Monthly income & Brand 6.72 8 Accept Ho & 15.51 @ 5% level &
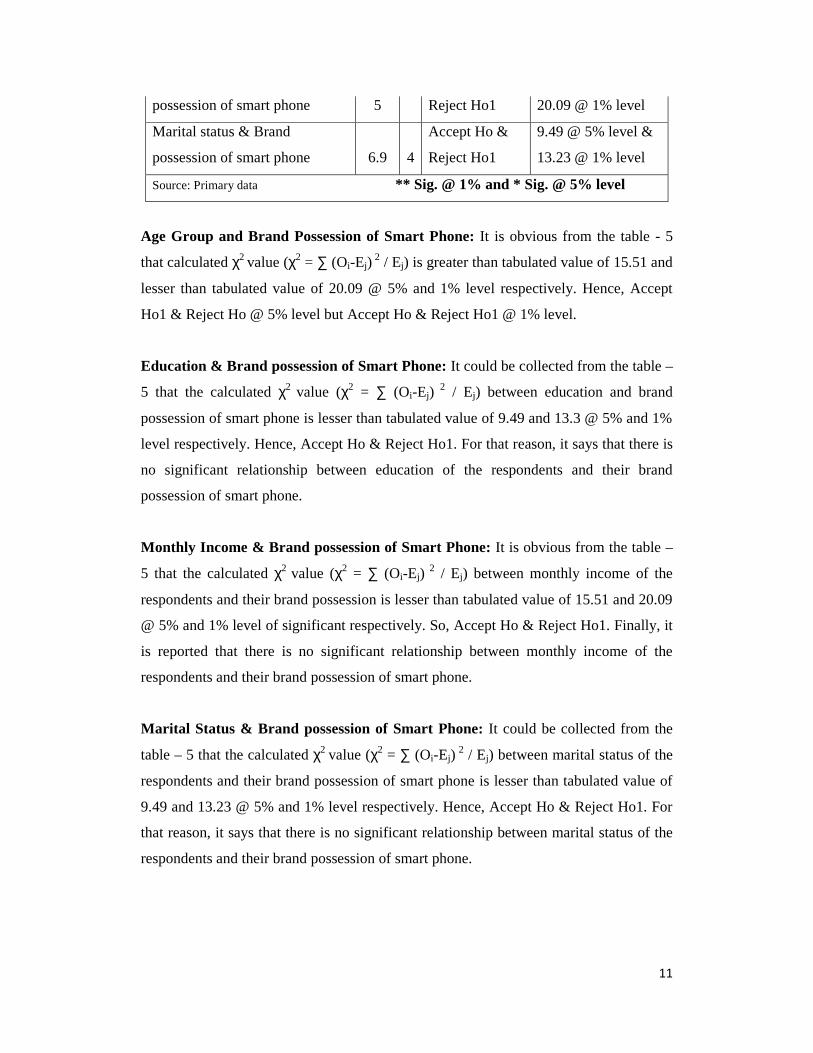
11
possession of smart phone 5 Reject Ho1 20.09 @ 1% level
Marital status & Brand
possession of smart phone 6.9 4
Accept Ho &
Reject Ho1
9.49 @ 5% level &
13.23 @ 1% level
Source: Primary data ** Sig. @ 1% and * Sig. @ 5% level
Age Group and Brand Possession of Smart Phone: It is obvious from the table - 5
that calculated χ2 value (χ2 = ∑ (Oi-Ej)2 / Ej) is greater than tabulated value of 15.51 and
lesser than tabulated value of 20.09 @ 5% and 1% level respectively. Hence, Accept
Ho1 & Reject Ho @ 5% level but Accept Ho & Reject Ho1 @ 1% level.
Education & Brand possession of Smart Phone: It could be collected from the table –
5 that the calculated χ2 value (χ2 = ∑ (Oi-Ej)2 / Ej) between education and brand
possession of smart phone is lesser than tabulated value of 9.49 and 13.3 @ 5% and 1%
level respectively. Hence, Accept Ho & Reject Ho1. For that reason, it says that there is
no significant relationship between education of the respondents and their brand
possession of smart phone.
Monthly Income & Brand possession of Smart Phone: It is obvious from the table –
5 that the calculated χ2 value (χ2 = ∑ (Oi-Ej)2 / Ej) between monthly income of the
respondents and their brand possession is lesser than tabulated value of 15.51 and 20.09
@ 5% and 1% level of significant respectively. So, Accept Ho & Reject Ho1. Finally, it
is reported that there is no significant relationship between monthly income of the
respondents and their brand possession of smart phone.
Marital Status & Brand possession of Smart Phone: It could be collected from the
table – 5 that the calculated χ2 value (χ2 = ∑ (Oi-Ej)2 / Ej) between marital status of the
respondents and their brand possession of smart phone is lesser than tabulated value of
9.49 and 13.23 @ 5% and 1% level respectively. Hence, Accept Ho & Reject Ho1. For
that reason, it says that there is no significant relationship between marital status of the
respondents and their brand possession of smart phone.

12
7.3 Responsible Factors that determine for brand positioning of Smart Phone
Initially, the KMO measures of sampling adequacy were used and it is an index that
compares the sizes of the observed correlation coefficients to the sizes of the partial
correlation Coefficients. It is derived as follows
=(∑∑r2ij)/( ∑∑r2ij)+( ∑∑a2
ij)
Further, Bartlett’s test of Sphericity tests studied whether the correlation matrix is an
identity matrix, which would indicate that the factor model is inappropriate or
appropriate. Here, chi-square also considered and it is calculated as follows
= [(n-1)-1/6(2p+1+2/p)] [In|S|+pIn(1/p) ∑Ij]
p=number of variables
k=number of components
Ij =jth eigen value of Sdf=(p-a) (p-2)/2
The responses against all the 14 variables are used to test the above tests. The
calculated value of KMO Measure of Sampling Adequacy comes out >0.6 and Bartlett’s
Test of Sphericity (Approx. χ2 2032.619** with df 91) significant @ 1% level. Further,
suggestion given by them this study has been used to further interpretation. Factor
analysis is a generic name given to a class of multivariate statistical methods whose
primary purpose is data reduction and summarization. Factor analysis identifies
common dimensions of factors from the observed variables that link together the
seemingly unrelated variables and provides insight in the underlying structure of the
data. The common intention of factor analytic technique is to find way of condensing
(summarizing) the information contained in a number of original variables into a smaller
group of new composite factors with a minimum loss of information. In this current
study, the Principal Component Analysis (PCA) was used. The PCA has been described
as a mathematical procedure that uses an orthogonal transformation to convert a set of
observations of possibly correlated variables into a set of uncorrelated variables called
principal components. PCA is usually done when we have a number of observed
variables that are believed to influence a given dependent variable, but then these
variables are so many that they are correlated. In this situation we want a smaller
number of important variables that will account for most of the variance in the observed
variables. Further, varimax rotations have been used in order to simplify the factor
structure by maximizing the variance of a column of pattern matrix because it is one of

13
the most popular methods used in several social sciences research papers. In addition
Eigen value is also used; it helps to find out the amount of variance in overall data. Finally,
determination of the factors based on the factor score are estimated for each factor with a
new name given about grouped variables. Below is the general form for the formula to
compute scores on the first component extracted (created) in a PCA
Fi = Wi1X1 + Wi2 X2 + ……………….. Wik Xk
Where,
Fi = Estimate of the ith factor
W1 = Factor (weight) score co-efficient
k = Number of variables
Factor analysis is performed in order to group the variables on priority basis based on
the strength of inter-correlation between these opinions, called ‘Factors’ and clustering
these variables in to the factors extracted and the results are presented in the following
tables. Table – 6 gives the rotated factor loadings, communalities, eigen values and the
percentage of variance explained by the factors. There were three factors each having
eigen value exceeding two for factors that determine brand positioning of s smart phone.
The Eigen values for three factors were 3.944, 2.894 and 2.538 respectively. Further,
factors have been extracted and these factors put together explain the total variance of
these factors to the extent of 66.96%. In order to reduce the number of factors and
enhance the interpretability, the factors are rotated. The rotation increases the quality of
interpretation of the factors. There are several methods of the initial factor matrix to
attain simple structure of the data. The varimax rotation is one such method to obtain
better result for interpretation is employed and the results are given in Table – 7.
Table – 6: Responsible Factors on Brand Positioning of Smart phone
Variables I II III Communalities
V1 -0.086 0.642 0.617 0.800
V2 0.314 0.754 -0.067 0.671
V3 0.042 0.907 0.182 0.857
V4 0.139 0.604 0.570 0.709
V5 0.676 0.301 0.287 0.630
V6 0.691 0.232 0.171 0.560

14
V7 0.778 0.111 0.148 0.639
V8 0.429 0.151 0.565 0.525
V9 0.727 0.300 0.160 0.644
V10 0.166 0.121 0.679 0.503
V11 0.615 -0.037 0.523 0.653
V12 0.350 -0.009 0.727 0.652
V13 0.523 0.663 0.046 0.715
V14 0.874 -0.042 0.230 0.819
Eigen Value 3.944 2.894 2.538 9.375
% of variance 28.171 20.669 18.126 66.966
Cum. % of Variance 28.171 48.840 66.966
Extraction Method: Principal Component Analysis.
Rotation Method: Varimax with Kaiser Normalization.
Source: Primary data

15
Table - 7: Clustering of Parameters into Factors that Determine Brand
Positioning of Smart phone
Factor Variables
Rotated Factor
Loadings
I - 28.171
Availability of value added services (V14) 0.874
E-mail accessibility (V7) 0.778
Wi-Fi connectivity (V9) 0.727
Large Random Access Memory (RAM) (V6) 0.691
High-end camera and high-quality audio, display
and digital media (V5) 0.676
Fit between smart phone and brand name (V11) 0.615
II - 20.669
Quality of the phone (V3) 0.907
Warranty & durability (V2) 0.754
Sales channel (V13) 0.663
Pricing (V1) 0.642
After sales service (V4) 0.604
III - 18.126
Advertising & Effective promotion (V12) 0.727
Global positioning system (V10) 0.679
Brand image & values (V8) 0.565
Source: Primary data
Table-7 explains that the 6 variables V14, V7, V9, V6, V5 and V11 were grouped
together as factor I and accounts for 28.171% of the total variance. The 5 variables V3,
V2, V13, V1 and V4 constituted the factor II and accounts for 20.669% of the total
variance. The 3 variables V12, V10 and V8 constituted the factor III and accounts for
18.126% of the total variance. Finally, factor analysis given factors like value added
features of smart phone, quality and pricing of smart phone, brand image that determine
brand positioning of smart phone.
7.4 Perceptual map towards Responsible Factors on Brand Positioning Strategies
of Smart Phone
The average factor scores for all the variables regarding responsible factors on brand
positioning strategies of smart phone which is used for building perceptual maps. Figure
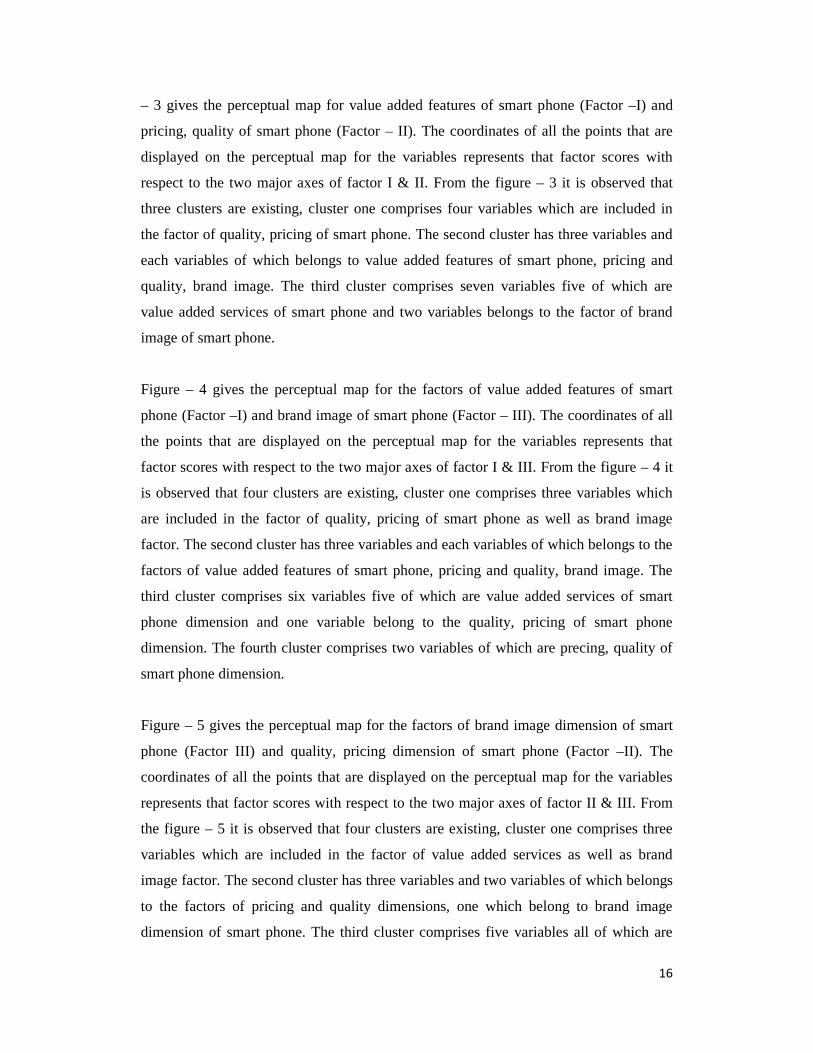
16
– 3 gives the perceptual map for value added features of smart phone (Factor –I) and
pricing, quality of smart phone (Factor – II). The coordinates of all the points that are
displayed on the perceptual map for the variables represents that factor scores with
respect to the two major axes of factor I & II. From the figure – 3 it is observed that
three clusters are existing, cluster one comprises four variables which are included in
the factor of quality, pricing of smart phone. The second cluster has three variables and
each variables of which belongs to value added features of smart phone, pricing and
quality, brand image. The third cluster comprises seven variables five of which are
value added services of smart phone and two variables belongs to the factor of brand
image of smart phone.
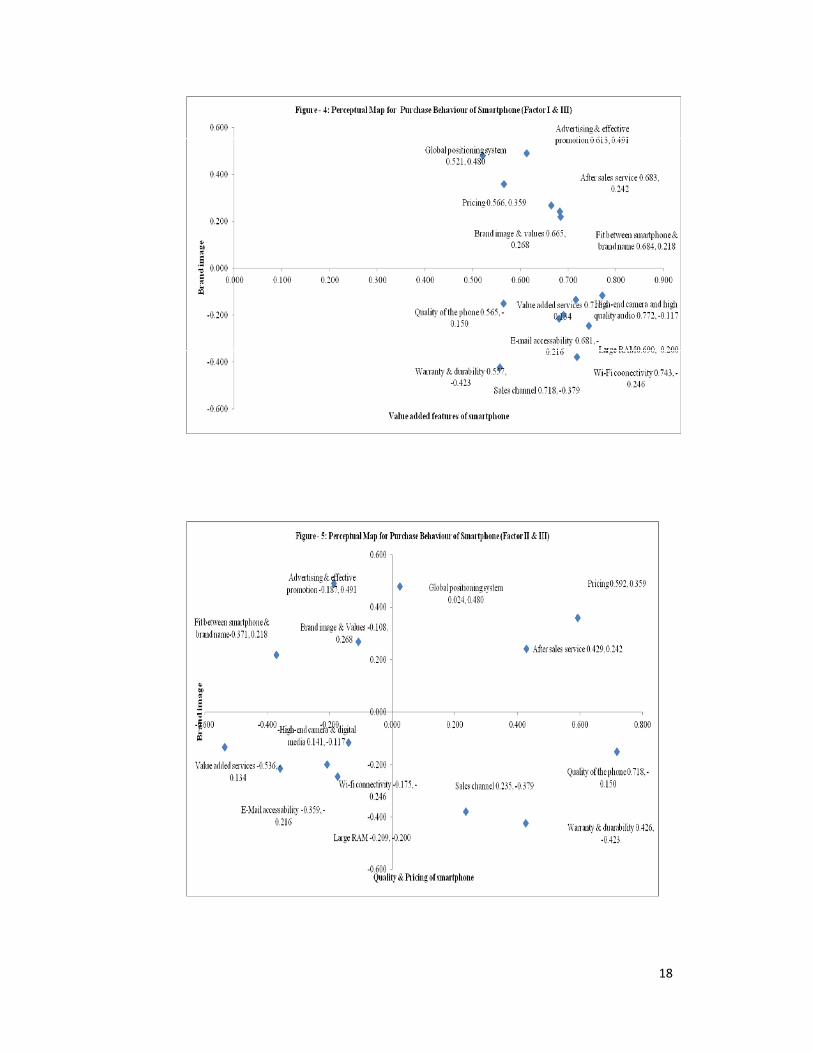
Figure – 4 gives the perceptual map for the factors of value added features of smart
phone (Factor –I) and brand image of smart phone (Factor – III). The coordinates of all
the points that are displayed on the perceptual map for the variables represents that
factor scores with respect to the two major axes of factor I & III. From the figure – 4 it
is observed that four clusters are existing, cluster one comprises three variables which
are included in the factor of quality, pricing of smart phone as well as brand image
factor. The second cluster has three variables and each variables of which belongs to the
factors of value added features of smart phone, pricing and quality, brand image. The
third cluster comprises six variables five of which are value added services of smart
phone dimension and one variable belong to the quality, pricing of smart phone
dimension. The fourth cluster comprises two variables of which are precing, quality of
smart phone dimension.
Figure – 5 gives the perceptual map for the factors of brand image dimension of smart
phone (Factor III) and quality, pricing dimension of smart phone (Factor –II). The
coordinates of all the points that are displayed on the perceptual map for the variables
represents that factor scores with respect to the two major axes of factor II & III. From
the figure – 5 it is observed that four clusters are existing, cluster one comprises three
variables which are included in the factor of value added services as well as brand
image factor. The second cluster has three variables and two variables of which belongs
to the factors of pricing and quality dimensions, one which belong to brand image
dimension of smart phone. The third cluster comprises five variables all of which are

17
the dimensions related to value added services of smart phone. The fourth cluster
comprises three variables and all of which are dimensions of pricing, quality of smart
phone.
18

19
8. Conclusion
Yesterday‘s luxuries are today‘s necessities. Now-a-days, all classes of people are using
cell phones but rich categories, youngsters, new technology adopters are using smart
phones. The completed research shows that most of the corporate womens are having
Samsung, Micromax and Sony brand of smart phones. Brand possession of smart phone
among women workers is not associated with their education, monthly income and
marital status whereas age group of the women workers associated with their brand
possession. There are three different factors namely value added features of smart phone,
quality and pricing of smart phone, brand image determine that brand positioning
strategies of smart phone among corporate women.
References
1. Arpita, K., & Sapna, R., (2011). “Antecedents to purchase decision of high and low
involvement products amongst Indian Youth”, International Journal of Business
Competition and Growth, Vol. 1, No.3 pp. 262 – 275.
2. Babita., Gaur Arti., Arora Nancy., and Bhardwaj Deepak., (2013). “Brand awareness
of readymade garments: A comparative study of males and females”, International
Journal of Managment, IT and Engineering, Vol.3, No.2, pp. 141-154.
3. Bong Gyou, L., Younghee, L., and Sang, C., (2010). “The continuous use behaviour
of 3G mobile video phone services”, International Journal of Mobile Communications,
Vol. 8, No.4 pp. 371 – 391.
4. Chaitanya, V., (2013). “What do Indian customers want in a cell phone? Strategies for
network providers and handset manufacturers”, International Journal of Indian Culture
and Business Management, Vol. 7, No.3 pp. 384 – 398.
5. Dapeno, L., Zhenzhong, M., and Liyun, Q., (2013). “Service quality and customer
switching behavior in China's mobile phone service sector”, Journal of Business
Research, Vol. 66, No. 8, pp. 1161-1167.
6. Dhevika, V.P.T., Latasri, O.T.V., & Maruthamuthu, S., (2013): “A study
on brand switching among cellular network service users in Tiruchirappalli”,
International Journals of Marketing and Technology, Vol.3, No.4, pp. 160-176.

20
7. Duhan, A., Pannu, R.S., Goyal, R., & Jain, P., (2012). “A study of brand awareness
regarding consumer durables in rural Haryana”, Indian Journal of Economics and
Development, Vol.8, No.4, pp.83-89.
8. Krishna Kumar, R., (2011). “Consumer Behaviour Towards Electronic Goods With
Reference To Occupational Factors - A Study In Cuddalore Town”, International
Referred Research Journal, Vol-2, No. 24, pp. 60-63.
9. Lalit, M., K., and Manish, J., (2009). “Factors Influencing the Selection of a Mobile
Phone Service Provider: An Empirical Study among Rural Consumers”, Asia-Pacific
Journal of Management Research and Innovation, Vol. 5, No. 4, pp. 128-136.
10. Matti, H., (2011). “Mobile phone feature preferences, customer satisfaction and
repurchase intent among male users”, Australasian Marketing Journal, Vol.19, No. 4, pp.
238-246.
11. Mody-Kamdar Rutu., and Srivastava Mala., (2009). “Brand Image Formation as a
function of involvement and familiarity”, The Journal of Indian Management & Strategy
8M, Vol.14, No.4, pp. 4-10.
12. Syed, A.S., & Ravi, A., (2012). “A study on consumer perception towards branded
men’s garments in hosur, Krishnagiri district, Tamilnadu”, South Asian Journal of
Marketing & Management Research, Vol.2, No.9, pp. 198-205.
13. Shalini Singh (2013) “Mobile Subscriptions approaches total global population in
2013”, The Hindu, 8-7-2013, P.No. 11.
14. Vijay Kumar, R., and Ruthra Priya, P., (2006): “Satisfaction derived by the Airtel
subscribers in Coimbatore”, Indian Journal of Marketing, Vol. XXXVI, No.1, P.No. 3.
15. Revathi, S., and Padmavathy, S., (2005): P”reference in cellular service providers in
the post liberalization era”, Indian Journal of marketing, Vol. XXXV, No.2, pp. 6-10, 20
.
http://www.phonearena.com/
http://listcrux.com/
http://www.techulator.com/
https://www.telstra.com.
http://www.ibtimes.com/
http://www.medianama.com/ and other websites

21
Micro Finance- A Way to Alleviate Poverty
∗Shweta Sawhney
Abstract
The article traces the fruition of the Microfinance insurrection in India as a potent tool for
poverty mitigation and women empowerment. Where institutional finance failed
Microfinance delivered. In a country like India, where almost 70 per cent of the
population is in the rural areas, with little or no access to main stream financing options,
microfinance has a huge role to play and a huge population to uplift. The paper discusses
the present scenario of microfinance Institutions (MFIs) in India. In spite of the
impressive figures, the supply side of microfinance in India is still presently abhorrently
inadequate to fill the fissure between demand and supply but it holds the promise to act as
a great opportunity for the financial sector and the economy as a whole.
Key Words: Financial services, savings, micro enterprises, integrated services
Introduction
There is growing interest in microfinance as one of the avenues to enable low income
population to access financial services. Micro finance is the provision of thrift, credit and
other financial services and products of very small amounts to the poor for enabling them
to raise their income levels and improve their living standards. It has been recognized that
micro finance helps the poor people meet their needs for small credit and other financial
services. The informal and flexible services offered to low-income borrowers for meeting
their modest consumption and livelihood needs have not only made micro finance
movement grow at a rapid pace across the world, but in turn has also impacted the lives
of millions of poor positively. Micro finance is the provision of financial services to low
∗ Assistant Professor, Mangalmay Institute of Management & Technology, Plot No. 8&9, Knowledge Park-
2, Greater Noida.
22
income clients including consumers and self employed who traditionally lack access to
banking and related services.
Microfinance is gathering momentum to become a significant force in India. The self
help group (SHG) model with bank lending to groups of (often) poor women without
collateral has become an accepted part of rural finance. “Microfinance” is often defined
as financial services for poor and low-income clients. In practice, the term is often used
more narrowly to refer to loans and other services from providers that identify themselves
as “microfinance institutions” (MFIs). ‘Microfinance refers to small scale financial
services for both credits and deposits- that are provided to people who farm or fish or
herd; operate small or micro enterprise where goods are produced, recycled, repaired, or
traded; provide services; work for wages or commissions; gain income from renting out
small amounts of land, vehicles, draft animals, or machinery and tools; and to other
individuals and local groups in developing countries in both rural and urban areas’-
Marguerite S. Robinson. Microfinance refers to a movement that envisages a world in
which low-income households have permanent access to a range of high quality financial
services to finance their income-producing activities, build assets, stabilize consumption,
and protect against risks. These services are not limited to credit, but include savings,
insurance, and money transfers.
Microfinance in India
In the case of India, the banking sector witnessed large scale branch extension after the
nationalization of banks in 1969, which facilitated a shift in focus of banking from class
banking to mass banking. It was, however, realized that, despite the wide spread of
formal financial institutions, these institutions were not able to gratify completely to the
small and frequent credit needs of most of the poor. This led to a search for alternative
policies and reforms for reaching out to the poor to satisfy their credit needs.
The non-availability of credit and banking facilities to the poor and deprived segments of
the society has always been a major concern in India. Accordingly, both the Government
and the Reserve Bank realized that direct efforts were required to address the credit needs
of poor. In response to this requirement, the micro finance movement started in India

23
with the introduction of SHG-bank linkage programme (SBLP) in the early 1990s. At
present, there are two models of micro finance delivery in India: the SBLP model and the
MFI model. The SBLP model has emerged as the dominant model in terms of number of
borrowers and loans outstanding.
Microfinance Clients
Microfinance clients are poor and low-income people that do not have access to other
formal financial institutions. Microfinance clients are usually self-employed, household-
based entrepreneurs. Their assorted “micro enterprises” include small retail shops, street
vending, artesian manufacture, and service provision. In rural areas, micro entrepreneurs
often have small income-generating activities such as food processing and trade; some
but far from all are farmers.
Data on the poverty status of clients is limited, but leans to suggest that most of the
microfinance clients fall near the poverty line, both above and below. Households in the
poorest 10% of the population, including the impoverished, are not traditional micro
credit clients because they lack stable cash flows to repay loans. Most clients below the
poverty line are in the upper half of the poor. Women often comprise the majority of
clients.
Over the past decade, a few MFIs have started developing a range of products to meet the
needs of other clients, including pensioners and salaried workers. Although little is
known about the universe of potential clients, the number of households without effective
access to financial services is gargantuan.
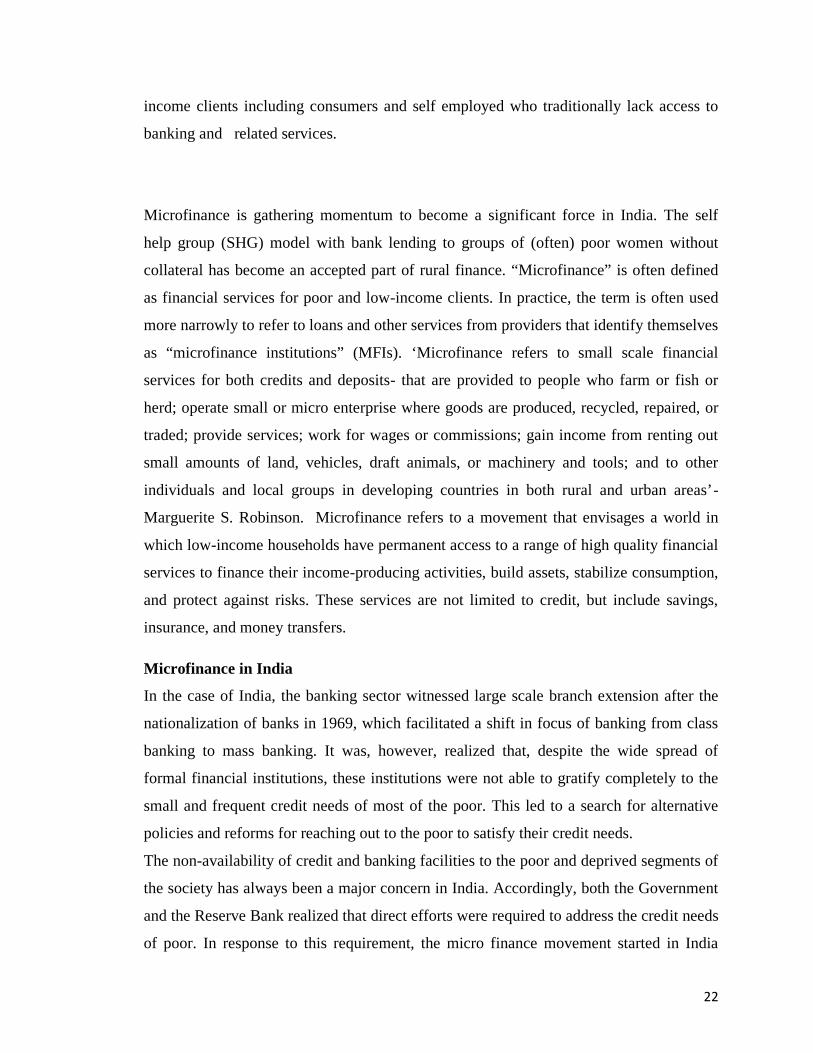
• Clients and Portfolio
This data reveals that Indian microfinance has reached at 86.2 million clients and the
portfolio outstanding of Rs. 351 billion including MFI channel actual data and SBLP
estimated data for March 2009
24
Figure1 Source : www.nabard.org
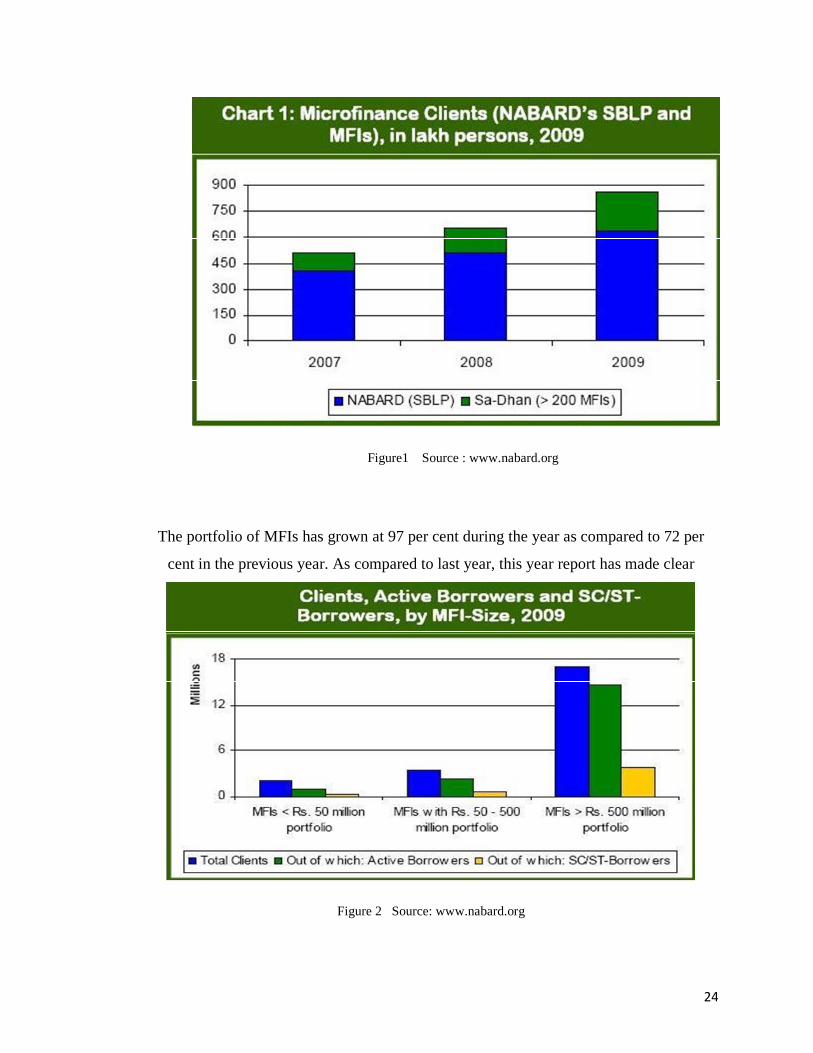
The portfolio of MFIs has grown at 97 per cent during the year as compared to 72 per
cent in the previous year. As compared to last year, this year report has made clear
Figure 2 Source: www.nabard.org

25
distinction between client outreach and active borrowers. Out of 22.6 million clients of
MFIs, 17.9 million (79 percent) are active borrowers. This year’s Quick Data is
contributed by 233 MFIs as against 223 MFIs in Quick Data 2008.
Microfinance data can be used by both private sector and public sector. We can collect
data related to microfinance through provider surveys ( surveys of financial institutions
and their regulators) and through household surveys.
Under the microfinance, loans are extended to the ‘Self Help Groups (SHG)’ who pools a
part of their income into a common fund from which they can borrow. The members of
the group decide on the minimum amount of deposit which ranges from Rs 20 to Rs 100
per month depending upon the size of the group. The group funds are deposited with a
Micro Finance Institution (MFI) against which they usually lend (The deposits are
usually placed with a bank by the MFI) at a credit deposit ratio of 4:1 but the ratio
improves with account performance record i.e. prompt repayment of loans.
Microfinance Delivery Vehicles
Most MFIs started as not-for-profit organizations like NGOs (non-governmental
organizations), credit unions and other financial cooperatives, and state-owned
development and postal savings banks. An increasing number of MFIs are now organized
as for-profit entities, often because it is a requirement to obtaining a license from banking
authorities to offer savings services. For-profit MFIs may be organized as non-bank
financial institutions (NBFIs), commercial banks that specialize in microfinance, or
microfinance departments of full-service banks.
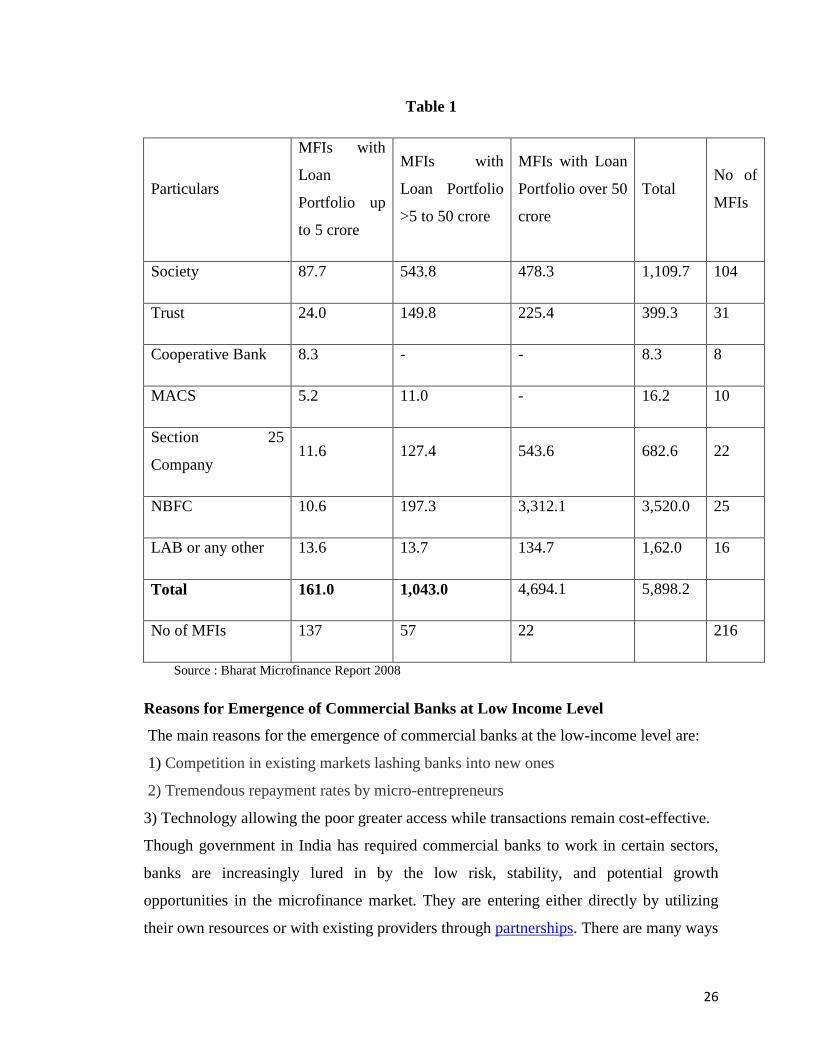
Most MFIs are societies and trusts. Among the large MFIs, most are NBFCs, but not-for-
profit organizations are also counted in this category.
26
Table 1
Particulars
MFIs with
Loan
Portfolio up
to 5 crore
MFIs with
Loan Portfolio
>5 to 50 crore
MFIs with Loan
Portfolio over 50
crore
TotalNo of
MFIs
Society 87.7 543.8 478.3 1,109.7 104
Trust 24.0 149.8 225.4 399.3 31
Cooperative Bank 8.3 - - 8.3 8
MACS 5.2 11.0 - 16.2 10
Section 25
Company11.6 127.4 543.6 682.6 22
NBFC 10.6 197.3 3,312.1 3,520.0 25
LAB or any other 13.6 13.7 134.7 1,62.0 16
Total 161.0 1,043.0 4,694.1 5,898.2
No of MFIs 137 57 22 216
Source : Bharat Microfinance Report 2008
Reasons for Emergence of Commercial Banks at Low Income Level
The main reasons for the emergence of commercial banks at the low-income level are:
1) Competition in existing markets lashing banks into new ones
2) Tremendous repayment rates by micro-entrepreneurs
3) Technology allowing the poor greater access while transactions remain cost-effective.
Though government in India has required commercial banks to work in certain sectors,
banks are increasingly lured in by the low risk, stability, and potential growth
opportunities in the microfinance market. They are entering either directly by utilizing
their own resources or with existing providers through partnerships. There are many ways
27
how women are empowered through microfinance such as it provides ability to save and
access loans, provides opportunity to undertake an economic activity, provides awareness
on local issues, banking transactions, MFL procedures, etc., provides skills for income
generation, helps in performing role in community development activities, etc.
The Impacts of Microfinance
Microfinance loans are used for starting new business as well as for existing businesses
or for non producing purposes such as for purchasing household items like refrigerator;
or for marriage of children etc. As per data available 30% of loans are used for starting a
new business; 22% were supposed to be used to buy stock for existing business, 30% to
repay an existing loan, 15% to buy a durable for household use, and 15% to smooth
household consumption. (Respondents could list more than one purpose). In other words,
while some households plan to use their loans to start a business and others use a loan to
expand a business they already have, many others use the loan for a non-business
purpose, such as repaying another loan, buying a television or meeting day-to-day
household expenses.
A feature of starting a business is that there are some costs that must be paid before any
revenue is earned. While a small business like those operated by households in our
sample may not require a lot of sturdy assets (machinery, property, etc.), they normally
need working capital, such as stock for business, fabric to make dresses, etc. And as there
is always a .fixed minimum time commitment in any of these businesses, it makes no
sense to operate them below a certain scale and hence it is hard to imagine operating even
these businesses without a minimum assurance of working capital. Many businesses also
have some assets, such as a sewing machine, stove, etc. The need to purchase assets and
working capital constitutes a .fixed cost of starting a business, and one impact of
microfinance may be that it enables households who would not or could not pay this
fixed cost without borrowing, to become entrepreneurs.
Current Trends in Microfinance
MFIs and commercial banks have enabled each to leverage their competitive advantages.
While MFIs are more knowledgeable at the community level for instance, banks have the
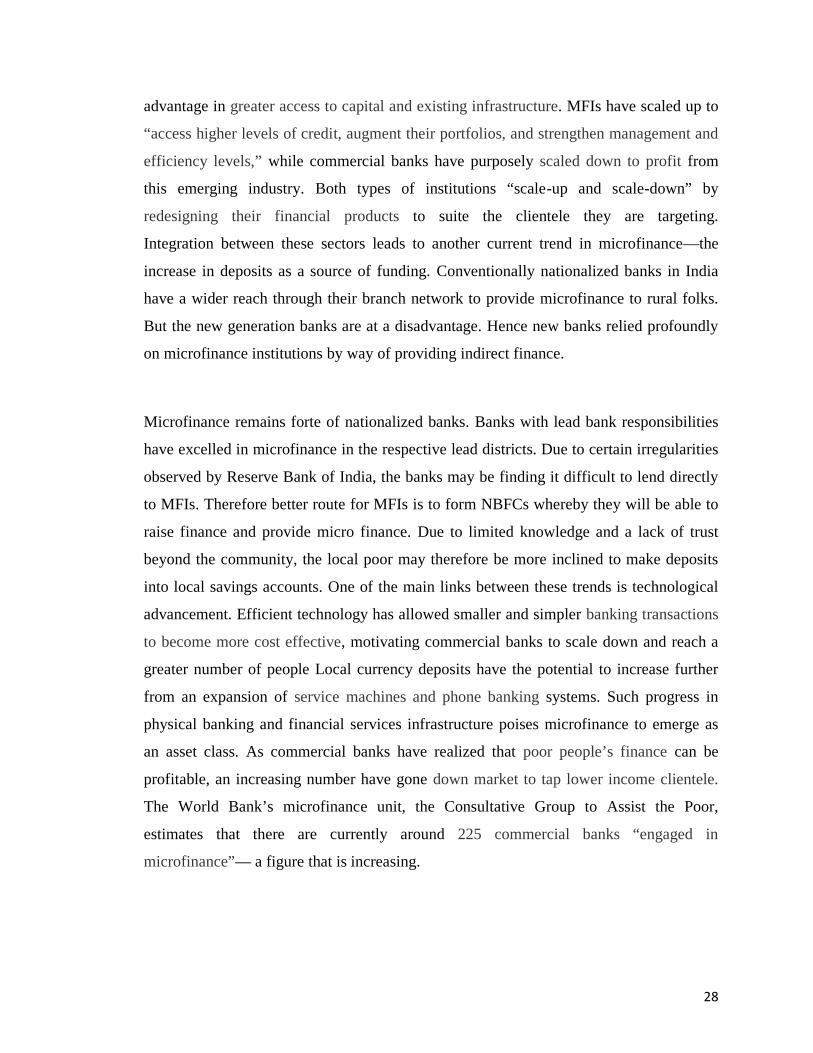
28
advantage in greater access to capital and existing infrastructure. MFIs have scaled up to
“access higher levels of credit, augment their portfolios, and strengthen management and
efficiency levels,” while commercial banks have purposely scaled down to profit from
this emerging industry. Both types of institutions “scale-up and scale-down” by
redesigning their financial products to suite the clientele they are targeting.
Integration between these sectors leads to another current trend in microfinance—the
increase in deposits as a source of funding. Conventionally nationalized banks in India
have a wider reach through their branch network to provide microfinance to rural folks.
But the new generation banks are at a disadvantage. Hence new banks relied profoundly
on microfinance institutions by way of providing indirect finance.
Microfinance remains forte of nationalized banks. Banks with lead bank responsibilities
have excelled in microfinance in the respective lead districts. Due to certain irregularities
observed by Reserve Bank of India, the banks may be finding it difficult to lend directly
to MFIs. Therefore better route for MFIs is to form NBFCs whereby they will be able to
raise finance and provide micro finance. Due to limited knowledge and a lack of trust
beyond the community, the local poor may therefore be more inclined to make deposits
into local savings accounts. One of the main links between these trends is technological
advancement. Efficient technology has allowed smaller and simpler banking transactions
to become more cost effective, motivating commercial banks to scale down and reach a
greater number of people Local currency deposits have the potential to increase further
from an expansion of service machines and phone banking systems. Such progress in
physical banking and financial services infrastructure poises microfinance to emerge as
an asset class. As commercial banks have realized that poor people’s finance can be
profitable, an increasing number have gone down market to tap lower income clientele.
The World Bank’s microfinance unit, the Consultative Group to Assist the Poor,
estimates that there are currently around 225 commercial banks “engaged in
microfinance”— a figure that is increasing.

29
Government Initiatives
In 1993, the Ministry of Human Resource Development, Government of India set up the
Rashtriya Mahila Kosh (RMK) with initial funding of Rs.310 million to act as a provider
of wholesale funds for the sector and to develop the sector through capacity building and
advocacy. In 1999, the SIDBI Foundation for micro credit was launched to provide both
financial and non financial support to MFIs. In 2001, the microfinance development fund
of Rs.1 billion was set up under NABARD to fund various development activities
relating to microfinance. It was later in 2005-06, re-designated as Regulating India’s
Microfinance Sector: A Suggested Framework of the Microfinance Development and
Equity Fund with an increased corpus of Rs.2 billion. In 2005, NBFCs engaged in
microfinance were permitted to obtain foreign equity investment subject to the
permission of the Foreign Investment Promotion Board. The minimum amounts were
$0.5 million when investment was less than 51% of the total equity, $5 million when it
was less between 51% and 75% of total equity and $7.5 million when investment was
greater than 75% of total equity. Government can contribute most effectively by:
• Setting sound macroeconomic policy that provides stability and low inflation
• Avoiding interest rate ceilings - when governments set interest rate limits, political
factors usually result in limits that are too low to permit sustainable delivery of credit that
involves high administrative costs—such as tiny loans for poor people. Such ceilings
often have the announced intention of protecting the poor, but are more likely to strangle
off the supply of credit
• Adjusting bank regulation to facilitate deposit taking by solid MFIs, once the country
has experience with sustainable microfinance delivery,
Creating government wholesale funds to support retail MFIs if funds can be lagged from
politics, and they can hire and protect strong technical management and avoid
disbursement pressure that force fund to support unpromising MFIs.
Challenges Ahead
A World Bank study assessing access to financial institutions found that amongst rural
households in Andhra Pradesh and Uttar Pradesh, 59% lack access to deposit account and
78% lack access to credit. Considering that the majority of the 360 million poor

30
households (urban and rural) lack access to formal financial services, the numbers of
customers to be reached, and the variety and quantum of services to be provided are
really large.
A tiny segment of this US$30 billion potential market has been reached so far and this is
unlikely to be addressed by MFIs and NGOs alone. Reaching this market requires serious
technology and human resources. However, 80% of the financial sector is still controlled
by public sector institutions. Competition, consolidation an capital, the convergence are
all being discussed to improve efficiency and outreach but significant opposition remains;
Microfinance on its own is unlikely to be able to address formidable challenges of
underdevelopment, poor infrastructure and governance.
There is still lot of policy focus on what activities are and are not allowed and not enough
operational freedom as yet for banks and financial institutions to design and deliver
programmes, and be responsible for their actions. Prescriptions and detailed circulars
often limit organizational innovation and market segmentation. If the right indicators are
monitored and operational freedom and incentives are clear, both public and private
banks have the capacity to rapidly address the remaining challenges. Regulation of the
microfinance sector poses unique challenges. They are worth enumerating as there
appears to be inadequate appreciation of these challenges in India.
The CGAP (Consultative Group to Assist the Poor), an international consortium of public
and private development agencies evolved a set of “Microfinance regulation consensus
guidelines” which have been adopted by its donor agencies. These guidelines are general
in nature and each country is expected to evolve its own regulatory framework based on
considerations of likely effectiveness and cost of supervision.
The regulation of microfinance poses certain unique challenges, different from bank
regulation.
• MFIs may not pose systemic challenges in the sense that it is unlikely that even the
largest MFIs are “too big to fail”. MFIs however deal with low income groups least likely

31
to bear downside risks, in a democratic country, politically the MFIs may be “too
sensitive to fail”.
• In the case of MFIs, most loans are collateral free and hence no such measures are
possible. On-time repayments on microfinance loans however tend to be high, though
experience shows that once a loan is overdue, the ultimate collection of the loan is less
likely, than in the case of loans that are backed by collateral (Rosenberg, 2008). As a
result, provisioning already delinquent loans needs to be more aggressive for micro credit
loans as compared to other loans.
• While bank failures may be contagious in the sense that the failure of one bank is
likely to impact solvency of others due to the interdependent nature of the payments
system, the interdependencies between group members in microfinance can lead at times
to a different kind of contagion effect. Widespread defaults can occur either if some
members start consistently defaulting or if there are rumors of MFI failures. An important
incentive for repayment of collateral free MFI loans is the ability to obtain larger loans in
the future. Any event which Regulating India’s Microfinance Sector: A Suggested
Framework 11 makes the possibility of future loans reduce considerably, has the potential
to trigger widespread defaults. A regulator of MFIs has therefore to be highly sensitive to
these realities.
• MFI customers are often first time users of financial services and usually have low
education. The responsibility on the MFI to offer the right products which suit their
members’ needs as well as provide adequate financial education and training to them is
considerable. Regulation needs to necessarily oversee this important element of MFI
operations.
• Merely formulating regulation regarding codes of conduct for MFIs and providing
channels for dispute resolution regarding MFI practices is not sufficient. MFI customers
need to be made aware of them by using appropriate communication. Moreover the
channels need to be easily accessible.
• The cost that MFIs would incur in complying with regulation needs to be considered,
as it may have an impact on their lending rates.

32
Criticism
High interest rates charged to borrowers is very much criticized. The real average
portfolio yield cited by the a sample of 704 microfinance institutions that voluntarily
submitted reports to the Micro Banking Bulletin in 2006 was 22.3% annually. However,
annual rates charged to clients are higher, as they also include local inflation and the bad
debt expenses of the microfinance institution. Muhammad Yunus has recently made
much of this point, and in his latest book argues that microfinance institutions that charge
more than 15% above their long-term operating costs should face penalties.
The role of donors has also been questioned. The Consultative Group to Assist the Poor
(CGAP) recently commented that "a large proportion of the money they spend is not
effective, either because it gets hung up in unsuccessful and often complicated funding
mechanisms or it goes to partners that are not held accountable for performance. In some
cases, poorly conceived programs have retarded the development of inclusive financial
systems by distorting markets and displacing domestic commercial initiatives with cheap
or free money.”
There has also been criticism of micro lenders for not taking more responsibility for the
working conditions of poor households, particularly when borrowers become quasi-wage
laborers, selling crafts or agricultural produce through an organization controlled by the
MFI. Critics maintain that there are few if any rules or standards in these cases governing
working hours, holidays, working conditions, safety or child labor, and few inspection
regimes to correct abuses.
Financial services, particularly credit, are not appropriate for all people at all times. For
loans that will be used for business purposes, micro credit best serves those who have
identified an economic opportunity and can capitalize on it if they have access to a small
amount of ready cash. Regardless of how loans are used, MFIs can provide long-term,
stable credit access only when clients have both the willingness and ability to meet
scheduled loan repayments.
33
Microfinance is particularly inappropriate for the penniless, who may need grants or
other public resources to improve their economic situation. Grants are a more efficient
way to transfer resources to the destitute than are loans that many will not be unable to
repay. Too much risk is placed on the MFI and client, when the only way a client can
repay a loan is by starting a successful business. Basic requirements like food, shelter,
and employment are often more urgently needed than financial services and should be
appropriately funded by government and donor subsidies.
Governments and development agencies often use microfinance as a tool to address
socio-economic problems such as relocation of refugees from civil dissension, generating
employment among demilitarized soldiers, or assistance following a natural disaster.
Microfinance may or may not be able to respond to these situations effectively, and
certainly not as a stand-alone intervention. Implementing a successful microfinance
program to address these types of situations depends upon a number of factors, the most
important of which is a client base capable of making regular repayments.
Conclusions
Providing microfinance to poor for starting business or improving existing business or
providing finance for household needs is a great step by government and the financial
institutions such as Grameen Bank, BARC, etc.
Micro-Finance can be a powerful instrument initiating a cyclical process of growth
and development.
Using microfinance as a platform to offer integrated services increases economies
of scope for all the organizations involved in trying to service the same base of
clienteles. With leveraged resources – assets, infrastructure, knowledge, distribution
channels, etc. – we can increase the capacity of the service offerings to reach more
clients and to reach them more effectively.
Micro-Finance activity improved access of rural poor to financial services, both
savings and credit.
Increased access signifies overcoming isolation of rural women in terms of their
access to financial services and denial of credit due to absence of collateral.
34
The pool of savings generated out of very small but regular contributions improved
access of the poor women to bank loans.
It could also help in strengthening poor families’ resistance to external shocks and
reducing dependence on moneylenders.
The observed support for consumption smoothening would not have been possible,
but for the SHGs internal support.
The predominance of borrowing for crop cultivation reflects support for meeting
working capital needs.
Possibilities could be of explored for using SHGs as a strong conduit for purveying crop
cultivation loans to very small and marginal farmers to step up crop loan finance.
MFIs that took steps of forge in offering integrated services to their clients and to partner
wherever it makes sense must be appreciated. The fight to assuage poverty is
too great a task for anyone or any one discipline to combat it alone. As an ingrained and
recognized leader in this mission, microfinance can serve as a bridge beyond banking and
development. It can be the link that brings together the services and products available
today to the people who need them most. Only through a collective effort will we have
the best chance of succeeding.
Bibliography
1. Almario,J., E. Jimenez and B.R. Pia (2006) : The development and implementation of
a uniform set of performance standards for all types of microfinance institutions in the
Philippines
(http://www.microfinanceregulationcenter.org/files/34558_file_Philippines_PESO.pdf)
2. Asian Banker (2007) : Upwardly Mobile Asian Banker August 13 Basu, P (2006):
Improving access to finance for India’s rural poor, Washington DC: World Bank CGAP
(2002) : Microfinance Consensus Guidelines
(http://www2.cgap.org/gm/document-1.9.2787/Guideline_RegSup.pdf)
3. CGAP (2008) : Note on Regulation of Branchless Banking in India
(http://www.cgap.org/gm/document-1.9.2322/India-Notes-On-Regulation-Branchless-
Banking-2008.pdf)
35
4. Economist (2009) : The power of mobile money Economist September 26th –
October 2nd
5. Ghate, P (2006) : Microfinance in India A State of the Sector Report, 2006, New
Delhi:
6. Microfinance India Ghate, P (2007) : Financial inclusion via exclusion? Economic
Times
7. Ghate, P, S Gunaranjan, V Mahajan, P Regy, F Sinha, and S Sinha (2007) :
Microfinance in India A State of the Sector Report, 2007, New Delhi: Microfinance India
8. Intellecap (2007) : Inverting the pyramid: The Changing face of Microfinance
(www.microfinancegateway.org)
9. Maegher, P (2002) : Microfinance Regulation in Developing Countries: A
Comparative Review of Current Practice IRIS Centre
(http://www.microfinancegateway.com)
10. Mahajan, V (2007) : Charting the History of Microfinance in India ISB Insight March
11. Micro credit Ratings International Ltd. (2005) A Study of the Regulatory
Environment and its implications for legal form by Microfinance Institutions in India
Final Report (http://www.microfinancegateway.com)
12. NABARD website. (http://www.nabard.org/)
13. Regulating India’s Microfinance Sector: A Suggested Framework 23 NCAER (2008)
Impact and sustainability of SHG Bank Linkage Programme
http://www.apmas.org/pdf%5CGTZ_NCAER.pdf.
14. Porteous, D (2006) : Competition and Microcredit Interest Rates
(http://www.cgap.org/)
15. Rajan, R (2008) : A Hundred Small Steps Draft Report of the Committee on Financial
Sector Reforms
(http://planningcommission.nic.in/reports/genrep/report_fr.htm)
16. Rangarajan, C (2008) : Report of the Committee on Financial inclusion
(http://www.nabard.org/pdf/report_financial/Full%20Report.pdf)
36
17. Reddy, Y V (2005) : Microfinance: Reserve Bank’s Approach, Address at the
Microfinance Conference organised by the Indian School of Business, August 6 Reserve
Bank of India (http://www.rbi.org.in/)
18. Reserve Bank of India (2009) : Handbook of Statistics on Indian Economy
(http://www.rbi.org.in/)
19. Rosenberg, R (2008) : How should governments regulate microfinance? In: S.
Sundaresan, ed.
20. Microfinance Emerging Trends and Challenges, (Cornwall: MPG Books pp) 85-107
21. Rutherford,S (2001): The Poor and their Money
(http://www.microfinancegateway.com)
22. Sa-dhan (2009) Bharat Microfinance Report
(http://www.indiamicrofinance.com/microfinance/microfinance-india/the-bharat-
microfinancereport-quick-data-2009.html)
23. Shankar, S (2007) Transaction Costs in Group Microcredit in India Management
Decision 45(8):1331-1342
24. Shylendra, H S (2006) : Microfinance Institutions in Andhra Pradesh Crisis and
Diagnosis
25. Economic and Political Weekly May 20 1959-1963
26. Srinivasan, N (2009) : Microfinance India State of the Sector Report, 2008 New
Delhi: Sage Publications
27. Tankha, A., (2006) : Challenges and potential for Indian banks to implement Business
Facilitator and Business Correspondent models A status report GTZ Rural Finance
Program India Paper October.

37
Trends in the Growth of Higher Education in Andhra Pradesh
Dr. D. Pulla Rao
Abstract
Higher education promotes social and economic development by building human and
technical capabilities of a society. The development of higher education is highly correlated
with the level of overall development. Andhra Pradesh is one of the few states, which had the
advantage of a sound educational system and structure. After formation of the state of
Andhra Pradesh in 1956, there has taken place a tremendous expansion in the growth of
higher education. The number of degree colleges increased from 158 in 1966-67 to 2,300 in
2006-07 and enrollment of students increased from 92,901 in 1966-67 to 10,78,386 in 2006-
07. The number of teachers increased from 4,563 in 1966-67 to 29,036 in 2006-07. The
highest number of Government colleges (17) situated in Mahaboonagar District and the
lowest number (4) in Vizianagaram District. The student-teacher ratio is recorded at optimum
level in Acharya Nagarjuna University area and the lowest in Kakatiya University area. So,
the Government must improve the infrastructural facilities and recruitment of teachers in the
backward areas. The Government gradually reducing the expenditure on education in the
total budget. It is not positive sign for the development of education. So, the Government
should increase the allocation of expenditure on education in general and on higher education
in particular.
Key Words: Higher education, enrolment, elementary education
Introduction
Andhra Pradesh has been recognized as the fifth largest state in the Indian Union with an
area of 2, 75,068 sq.kms. and the population of 8.46 crores as per the 2011Census. Andhra
Pradesh is the first state in India that has been formed on purely linguistic basis, out of a
several political units with different histories. Educationally, Andhra Pradesh is one of the
Professor of Economics, Andhra University, Visakhapatnam-3, A.P.
38
nine backward states in India, and it lowest among the Southern States. This state however,
has developed a sound educational system and structure and it was the first state to
implement the educational structure of 10+2+3 in 1969 as per the recommendations of
Kothari Commission.
University System of Education in Andhra Pradesh
Since independence, significant progress is seen in University system of education in Andhra
Pradesh. The ladder of general education is now within the purview of an ordinary man to get
higher level of education. The state of Andhra Pradesh has the privilege to establish three
universities prior to independence. At the time of inception of the state in 1956, the state had
three universities, firstly the Osmania University was established in 1918, with the
jurisdiction over the Telangana Region; Eight Years later, Andhra University was established
in 1926 with the jurisdiction over Coastal Andhra region including the districts of
Srikakulam, Visakhapatnam, East Godavari, West Godavari, Krishna, Guntur and Kurnool.
Another university was established in 1954 at the famous Hindu Holy place Tirupati as Sri
Venkateshwara University with the jurisdiction over the four districts of Rayalaseema
together with Nellore.
The increase in the number of colleges year after year and also the increasing demand for
post graduate education warranted the establishment of three post-graduate centres. They
were established at Warangal in the Osmania University area, at Guntur in Andhra University
area and then at Anantapur in the areas of Sri Venkateshwara University. These three post-
graduate centres by virtue of their good work and progress served as nucleau (nuclii) for the
establishment of three more universities in the state, viz, Kakatiya, Nagarjuna and Sri Krishna
Devaraya; the first to in 1976 and the third in 1981.
University education including higher education has an exclusive privilege enjoyed by the
twin cities; of Hyderabad and Secunderabad with a good number of universities in the city of
Hyderabad. Greater emphasis was also placed on professional and technical education in the
state. Though Andhra Pradesh is full-fledged in agriculture, the productivity per acre was
comparatively low. To equip the farmers with latest techniques and necessary skills and to
achieve rapid development in the agricultural sector through education, the Andhra Pradesh
39
Agricultural University (APAU) was established in 1964 with headquarters at Hyderabad.
The agriculture university used to conduct research on agricultural processes and
development of new agricultural techniques. It has 40 agricultural research centres and 5
animal feeding departments. A team of agriculturalists from Japan came to Bapatla
Agricultural College in the state in the year 1965 and carried out their research on rice and on
rice mills. Massuri rice is the latest development made by that University in the agricultural
sector.
Since Technology is the backbone of our country, the Government of Andhra Pradesh has
given priority to Science and technology right from the beginning. Hence the Jawaharlal
Nehru Technological University (JNTU) was established in 1972 in Hyderabad. This was
first of its kind the country. The central University was also established in Hyderabad in 1974
to fulfill the needs and aspirations of the majority of students in the system of higher
education.Several colleges under private management have been dominating the higher
education sector. In recent years, the non-formal education through the School of
Correspondence Courses is established in various universities in Andhra Pradesh. Some of
the Institutions of Correspondence courses provide the facility of appearing directly for
degree examinations without insisting on formal qualifications. The enrollment rate in these
courses improved significantly. The establishment of the Andhra Pradesh Open University at
Hyderabad in 1982 is considered as another milestone in the history of higher education in
the state of Andhra Pradesh. This is the first university in the country specially to provide
distant education.
In the sphere of higher education, the women’s education in higher learning institutions has
been given much importance. To provide better educational opportunities for women, the
State Government has established Sri Padmavathi Mahila University in 1983 at Tirupati. The
State Government took further initiative to open another University in 1985, the Telugu
University at Hyderabad to improve teaching and research in the field of culture and
language particularly in the Oriental Languages in the educational sector. Two units have
been started one at Rajahmundry in East Godavari District and the other at Srisailam in
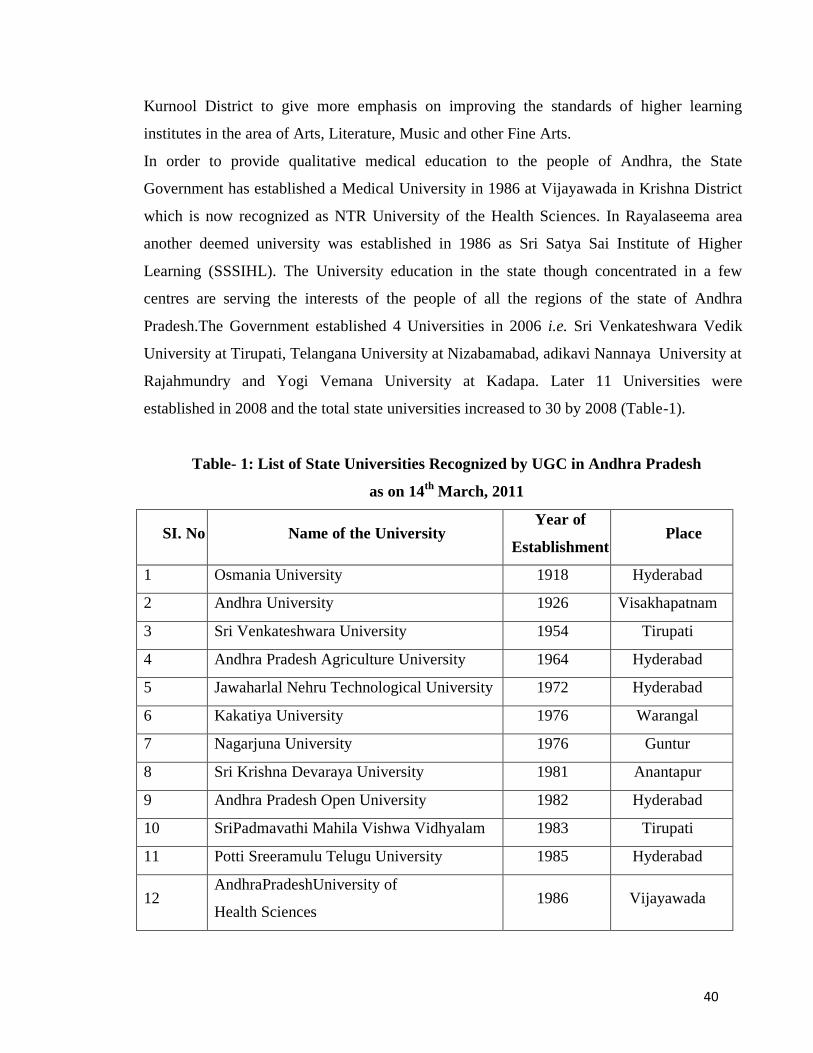
40
Kurnool District to give more emphasis on improving the standards of higher learning
institutes in the area of Arts, Literature, Music and other Fine Arts.
In order to provide qualitative medical education to the people of Andhra, the State
Government has established a Medical University in 1986 at Vijayawada in Krishna District
which is now recognized as NTR University of the Health Sciences. In Rayalaseema area
another deemed university was established in 1986 as Sri Satya Sai Institute of Higher
Learning (SSSIHL). The University education in the state though concentrated in a few
centres are serving the interests of the people of all the regions of the state of Andhra
Pradesh.The Government established 4 Universities in 2006 i.e. Sri Venkateshwara Vedik
University at Tirupati, Telangana University at Nizabamabad, adikavi Nannaya University at
Rajahmundry and Yogi Vemana University at Kadapa. Later 11 Universities were
established in 2008 and the total state universities increased to 30 by 2008 (Table-1).
Table- 1: List of State Universities Recognized by UGC in Andhra Pradesh
as on 14th March, 2011
SI. No Name of the UniversityYear of
EstablishmentPlace
1 Osmania University 1918 Hyderabad
2 Andhra University 1926 Visakhapatnam
3 Sri Venkateshwara University 1954 Tirupati
4 Andhra Pradesh Agriculture University 1964 Hyderabad
5 Jawaharlal Nehru Technological University 1972 Hyderabad
6 Kakatiya University 1976 Warangal
7 Nagarjuna University 1976 Guntur
8 Sri Krishna Devaraya University 1981 Anantapur
9 Andhra Pradesh Open University 1982 Hyderabad
10 SriPadmavathi Mahila Vishwa Vidhyalam 1983 Tirupati
11 Potti Sreeramulu Telugu University 1985 Hyderabad
12AndhraPradeshUniversity of
Health Sciences1986 Vijayawada
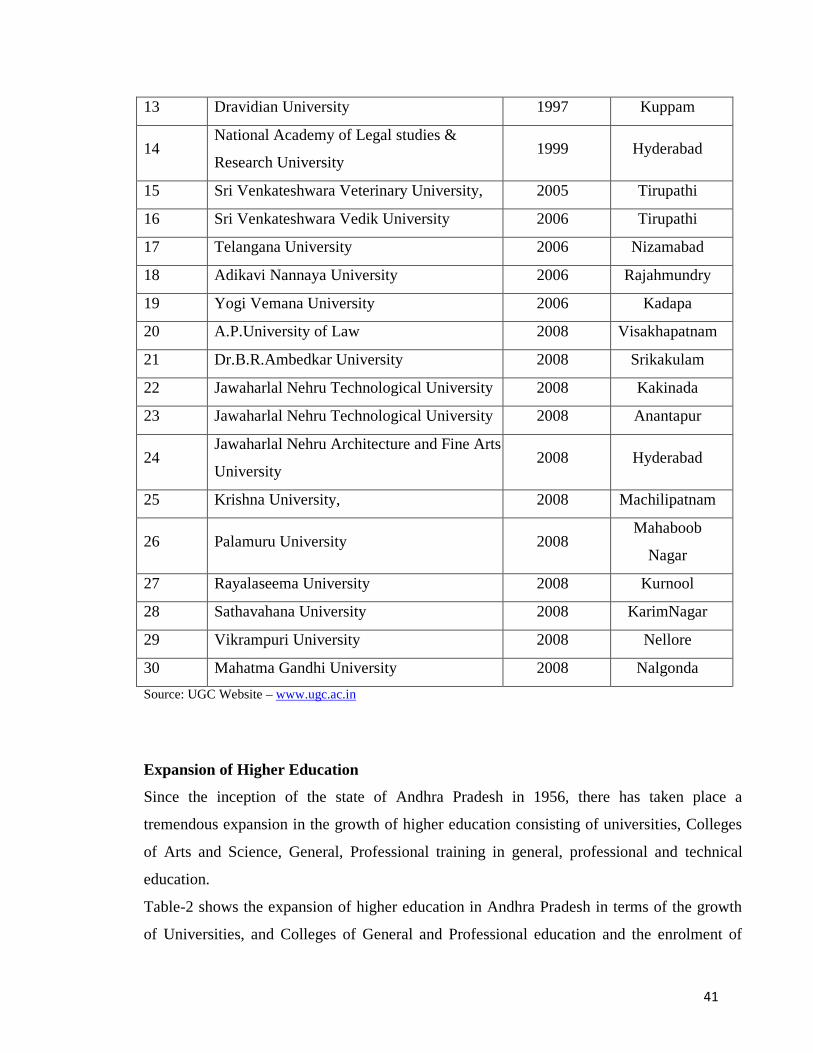
41
13 Dravidian University 1997 Kuppam
14National Academy of Legal studies &
Research University1999 Hyderabad
15 Sri Venkateshwara Veterinary University, 2005 Tirupathi
16 Sri Venkateshwara Vedik University 2006 Tirupathi
17 Telangana University 2006 Nizamabad
18 Adikavi Nannaya University 2006 Rajahmundry
19 Yogi Vemana University 2006 Kadapa
20 A.P.University of Law 2008 Visakhapatnam
21 Dr.B.R.Ambedkar University 2008 Srikakulam
22 Jawaharlal Nehru Technological University 2008 Kakinada
23 Jawaharlal Nehru Technological University 2008 Anantapur
24Jawaharlal Nehru Architecture and Fine Arts
University2008 Hyderabad
25 Krishna University, 2008 Machilipatnam
26 Palamuru University 2008Mahaboob
Nagar
27 Rayalaseema University 2008 Kurnool
28 Sathavahana University 2008 KarimNagar
29 Vikrampuri University 2008 Nellore
30 Mahatma Gandhi University 2008 Nalgonda
Source: UGC Website – www.ugc.ac.in
Expansion of Higher Education
Since the inception of the state of Andhra Pradesh in 1956, there has taken place a
tremendous expansion in the growth of higher education consisting of universities, Colleges
of Arts and Science, General, Professional training in general, professional and technical
education.
Table-2 shows the expansion of higher education in Andhra Pradesh in terms of the growth
of Universities, and Colleges of General and Professional education and the enrolment of
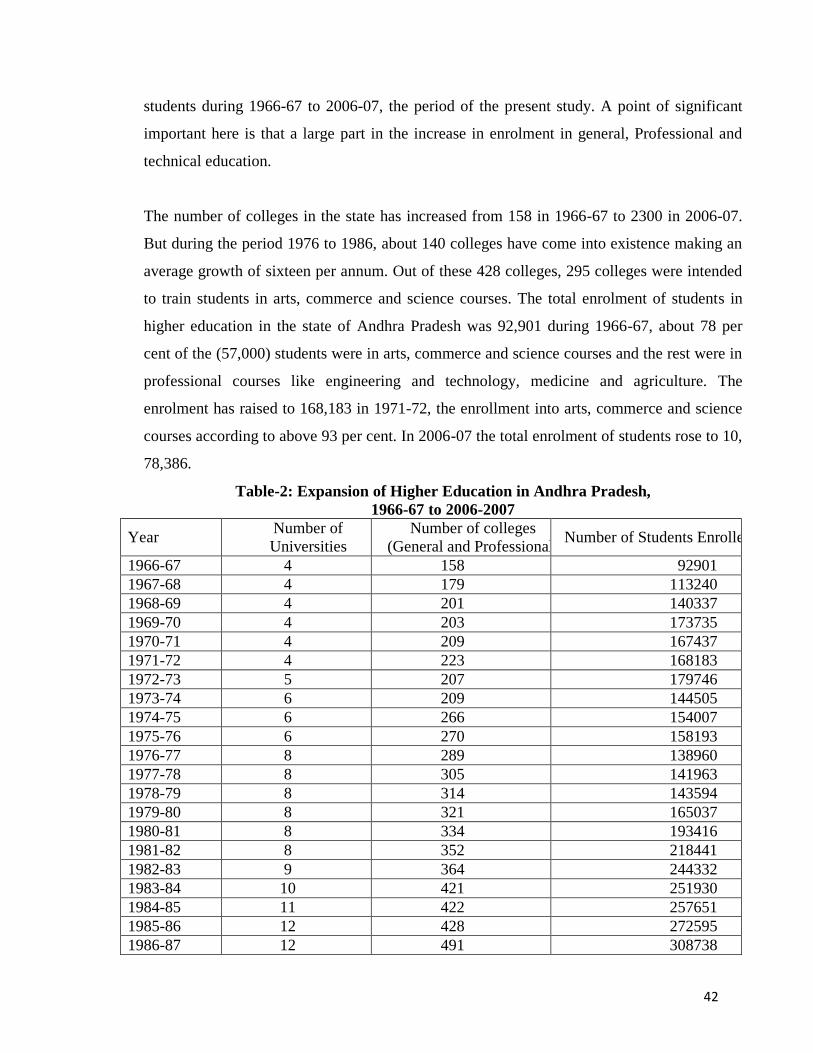
42
students during 1966-67 to 2006-07, the period of the present study. A point of significant
important here is that a large part in the increase in enrolment in general, Professional and
technical education.
The number of colleges in the state has increased from 158 in 1966-67 to 2300 in 2006-07.
But during the period 1976 to 1986, about 140 colleges have come into existence making an
average growth of sixteen per annum. Out of these 428 colleges, 295 colleges were intended
to train students in arts, commerce and science courses. The total enrolment of students in
higher education in the state of Andhra Pradesh was 92,901 during 1966-67, about 78 per
cent of the (57,000) students were in arts, commerce and science courses and the rest were in
professional courses like engineering and technology, medicine and agriculture. The
enrolment has raised to 168,183 in 1971-72, the enrollment into arts, commerce and science
courses according to above 93 per cent. In 2006-07 the total enrolment of students rose to 10,
78,386.
Table-2: Expansion of Higher Education in Andhra Pradesh,1966-67 to 2006-2007
YearNumber ofUniversities
Number of colleges(General and Professional)
Number of Students Enrolled
1966-67 4 158 929011967-68 4 179 1132401968-69 4 201 1403371969-70 4 203 1737351970-71 4 209 1674371971-72 4 223 1681831972-73 5 207 1797461973-74 6 209 1445051974-75 6 266 1540071975-76 6 270 1581931976-77 8 289 1389601977-78 8 305 1419631978-79 8 314 1435941979-80 8 321 1650371980-81 8 334 1934161981-82 8 352 2184411982-83 9 364 2443321983-84 10 421 2519301984-85 11 422 2576511985-86 12 428 2725951986-87 12 491 308738

43
1987-88 12 553 2922421988-89 12 612 2757461989-90 12 675 3353321990-91 12 735 3597941991-92 12 794 3706001992-93 12 851 3713311993-94 12 912 3832261994-95 12 969 4289191995-96 12 984 4667121996-97 12 1046 5219951997-98 13 1152 5696581998-99 13 1276 6038681999-2000 14 1430 6350632000-2001 14 1482 6643712001-2002 14 1746 6938792002-2003 14 1957 7696772003-2004 14 2022 7978572004-2005 14 2094 8664892005-2006 15 2189 9352652006-2007 19 2300 1078386
Note: No. of students excluding PUC/Intermediate/ Pre- Professional courses.
Source: Director of Public Instruction and Director of Higher Education, Andhra Pradesh, Hyderabad.
Table-3 shows the growth of students’ enrolment and the establishment of colleges. The
growth rate in the enrolment of students has increased at an overall growth 6.32 per cent
during the period, while colleges have registered an average compound growth rates during
the sub-periods indicate disturbing trends, particularly with regard to enrolment of students.
During 1977-88 the student enrolment registered 7.49 per cent. Later decade i.e., 1988-99
also the growth rate of students enrolment recorded 8.15 per cent. The growth rate of student
enrolment during 1999-2007 decreased to 7.86 per cent. It could be observed from the results
that the student enrolment increased significantly during the first three decades. But in the
last period i.e., 1999-2007 the growth rate of student enrolment slightly decreased. The
Programmes initiated in the first decade must have started showing the results in further
decades also.

44
Table-3: Compound Growth Rate of Colleges Established and Students Enrolled
Period Growth of Colleges Growth of Students
1966-67 to 1976-77 6.22 4.11
1977-78 to1987-88 6.13 7.49
1988-89 to1998-99 7.62 8.15
1999-2000 to2006-07 7.02 7.86
1966-67 to 2006-07 6.92 6.32
Source: Growth rates are calculated from the Table-2.
Table-4 shows growth of students in terms of increase over the preceding year and the
percentage increase there on in higher education in Andhra Pradesh. The enrolment of
students has been increasing consistency every year during the 40 years period. However,
there is a sudden decrease in the enrolment during the years 1970-71, 1973-74, 1976-77,
1987-88, and 1988-89 accounting for higher growth during the first three decades of the
period under study.
Table -4: Growth of Enrolment in Higher Education in Andhra Pradesh1966-67 to 2006-07
Year EnrolmentIncrease over thepreceding year Percentage increase
1966-67 92901 - -1967-68 113240 20339 21.891968-69 140337 2709 23.931969-70 173755 33398 23.801970-71 167437 -6298 -3.631971-72 168183 746 0.451972-73 179746 11563 6.881973-74 144505 -35241 -19.611974-75 154007 9502 6.581975-76 158193 4186 2.721976-77 138960 -19233 -12.601977-78 141963 3003 2.161978-79 143595 1631 1.151979-80 165037 21443 17.021980-81 193416 28379 15.101981-82 218441 25025 12.941982-83 244332 25891 11.851983-84 251930 7598 3.111984-85 257651 5721 2.271985-86 272595 14944 5.501986-87 308738 36143 13.25
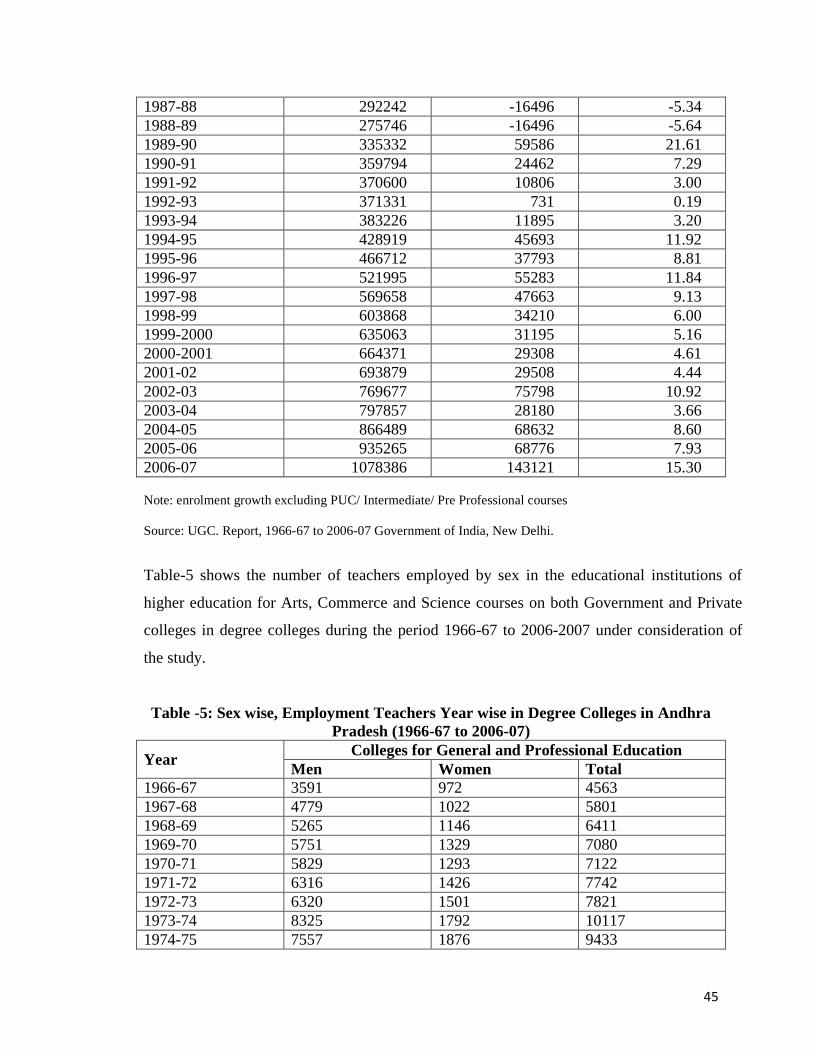
45
1987-88 292242 -16496 -5.341988-89 275746 -16496 -5.641989-90 335332 59586 21.611990-91 359794 24462 7.291991-92 370600 10806 3.001992-93 371331 731 0.191993-94 383226 11895 3.201994-95 428919 45693 11.921995-96 466712 37793 8.811996-97 521995 55283 11.841997-98 569658 47663 9.131998-99 603868 34210 6.001999-2000 635063 31195 5.162000-2001 664371 29308 4.612001-02 693879 29508 4.442002-03 769677 75798 10.922003-04 797857 28180 3.662004-05 866489 68632 8.602005-06 935265 68776 7.932006-07 1078386 143121 15.30
Note: enrolment growth excluding PUC/ Intermediate/ Pre Professional courses
Source: UGC. Report, 1966-67 to 2006-07 Government of India, New Delhi.
Table-5 shows the number of teachers employed by sex in the educational institutions of
higher education for Arts, Commerce and Science courses on both Government and Private
colleges in degree colleges during the period 1966-67 to 2006-2007 under consideration of
the study.
Table -5: Sex wise, Employment Teachers Year wise in Degree Colleges in AndhraPradesh (1966-67 to 2006-07)
YearColleges for General and Professional Education
Men Women Total1966-67 3591 972 45631967-68 4779 1022 58011968-69 5265 1146 64111969-70 5751 1329 70801970-71 5829 1293 71221971-72 6316 1426 77421972-73 6320 1501 78211973-74 8325 1792 101171974-75 7557 1876 9433
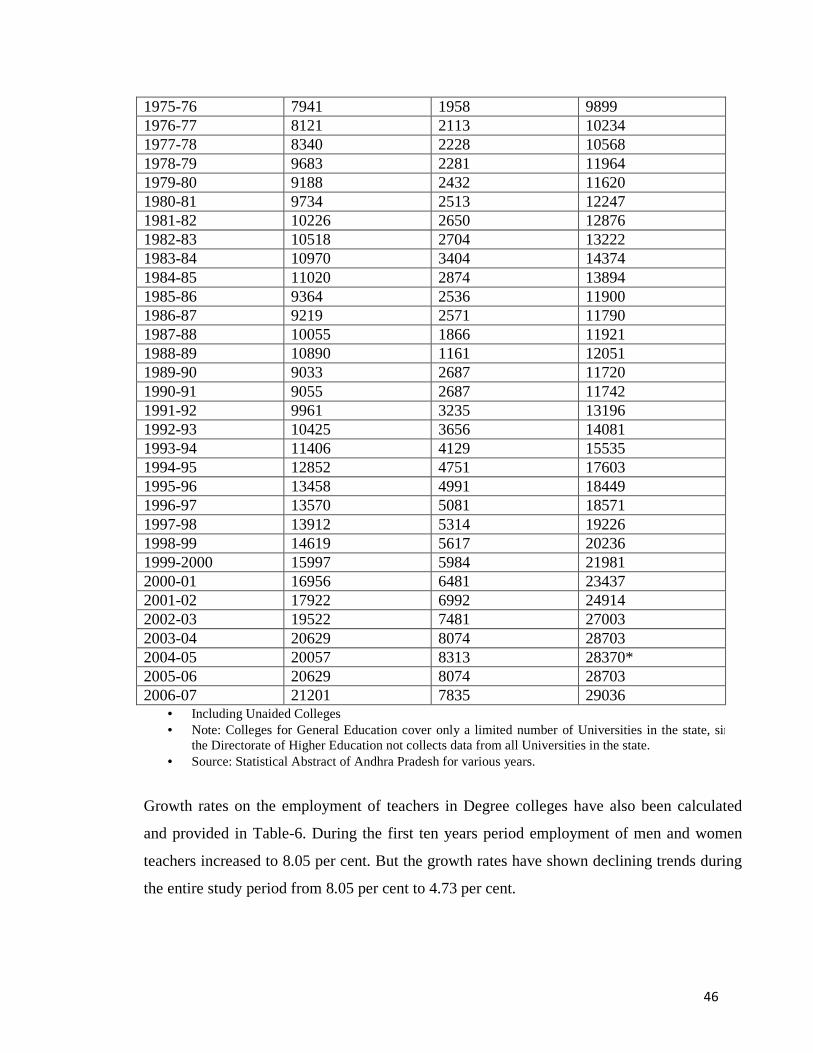
46
1975-76 7941 1958 98991976-77 8121 2113 102341977-78 8340 2228 105681978-79 9683 2281 119641979-80 9188 2432 116201980-81 9734 2513 122471981-82 10226 2650 128761982-83 10518 2704 132221983-84 10970 3404 143741984-85 11020 2874 138941985-86 9364 2536 119001986-87 9219 2571 117901987-88 10055 1866 119211988-89 10890 1161 120511989-90 9033 2687 117201990-91 9055 2687 117421991-92 9961 3235 131961992-93 10425 3656 140811993-94 11406 4129 155351994-95 12852 4751 176031995-96 13458 4991 184491996-97 13570 5081 185711997-98 13912 5314 192261998-99 14619 5617 202361999-2000 15997 5984 219812000-01 16956 6481 234372001-02 17922 6992 249142002-03 19522 7481 270032003-04 20629 8074 287032004-05 20057 8313 28370*2005-06 20629 8074 287032006-07 21201 7835 29036
• Including Unaided Colleges• Note: Colleges for General Education cover only a limited number of Universities in the state, since
the Directorate of Higher Education not collects data from all Universities in the state.• Source: Statistical Abstract of Andhra Pradesh for various years.
Growth rates on the employment of teachers in Degree colleges have also been calculated
and provided in Table-6. During the first ten years period employment of men and women
teachers increased to 8.05 per cent. But the growth rates have shown declining trends during
the entire study period from 8.05 per cent to 4.73 per cent.

47
Table -6: Compound Growth Rates
Period Men Women Total
10 Years Period
1966-67 to 1975-76 8.26 7.25 8.05
1976-77 to 1985-86 1.43 1.84 1.52
1986-87 to 1995-96 3.85 6.86 4.58
1996-97 to 2005-06 4.28 4.74 4.45
20 Years Period
1966-67 to 1985-86 4.91 4.91 4.91
1986-87 to 2005-06 4.11 5.89 4.55
40 Years Period
1966-67 to 2005-06 4.47 5.43 4.73
Source: Calculated from the Table-5
District wise Distribution of Colleges under Government and Private Management
Table-7 shows district wise distribution of colleges in the State. The table also provided
distribution of colleges by type of management. It is evident from the table that the twin
cities of Hyderabad and Secunderabad had the maximum number of colleges particularly
under private management. It is interesting to note that the private colleges have registered
twenty seven times increased compared to Government colleges during the period. This
reflects partly the Government Policy and the interest that private sector has shown in higher
education. The table also shows that a good number of Government colleges were established
in Chittore and Kurnool districts in the Rayalaseema region and East Godavari and West
Godavari districts in Coastal Andhra region. In the Telangana region a good number of
Government colleges are located in Karimnagar, Nizamabad and Medak districts.
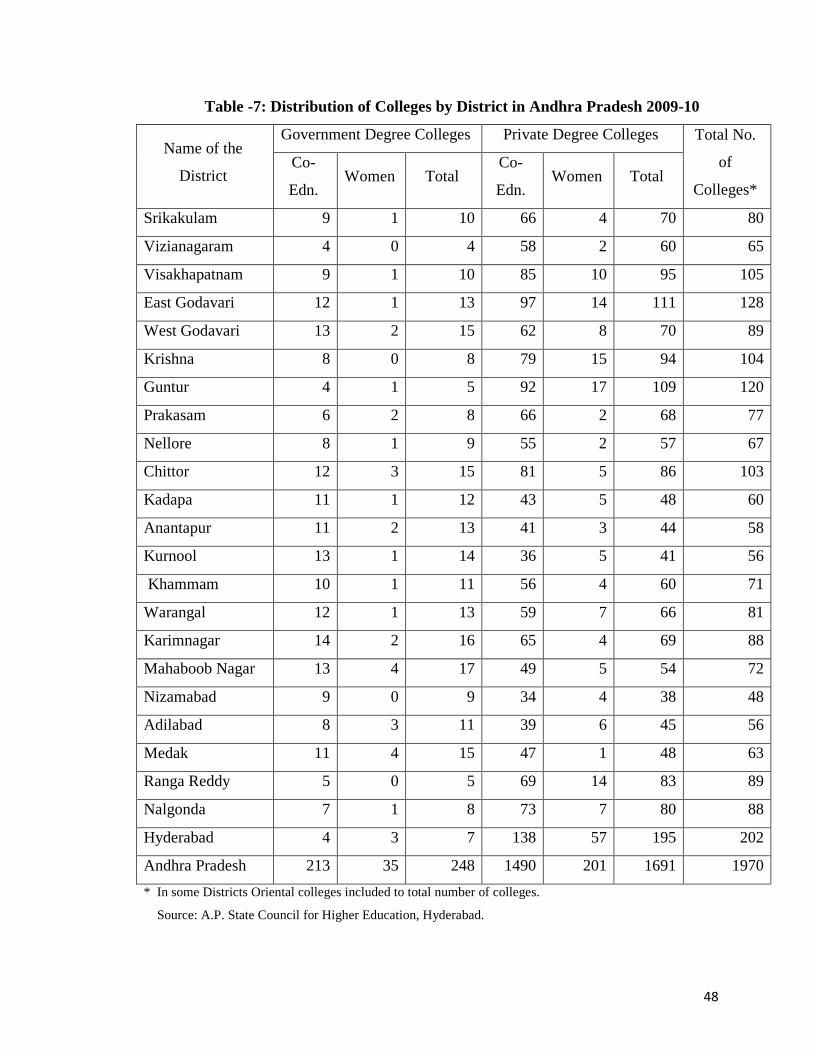
48
Table -7: Distribution of Colleges by District in Andhra Pradesh 2009-10
Name of the
District
Government Degree Colleges Private Degree Colleges Total No.
of
Colleges*
Co-
Edn.Women Total
Co-
Edn.Women Total
Srikakulam 9 1 10 66 4 70 80
Vizianagaram 4 0 4 58 2 60 65
Visakhapatnam 9 1 10 85 10 95 105
East Godavari 12 1 13 97 14 111 128
West Godavari 13 2 15 62 8 70 89
Krishna 8 0 8 79 15 94 104
Guntur 4 1 5 92 17 109 120
Prakasam 6 2 8 66 2 68 77
Nellore 8 1 9 55 2 57 67
Chittor 12 3 15 81 5 86 103
Kadapa 11 1 12 43 5 48 60
Anantapur 11 2 13 41 3 44 58
Kurnool 13 1 14 36 5 41 56
Khammam 10 1 11 56 4 60 71
Warangal 12 1 13 59 7 66 81
Karimnagar 14 2 16 65 4 69 88
Mahaboob Nagar 13 4 17 49 5 54 72
Nizamabad 9 0 9 34 4 38 48
Adilabad 8 3 11 39 6 45 56
Medak 11 4 15 47 1 48 63
Ranga Reddy 5 0 5 69 14 83 89
Nalgonda 7 1 8 73 7 80 88
Hyderabad 4 3 7 138 57 195 202
Andhra Pradesh 213 35 248 1490 201 1691 1970
* In some Districts Oriental colleges included to total number of colleges.
Source: A.P. State Council for Higher Education, Hyderabad.
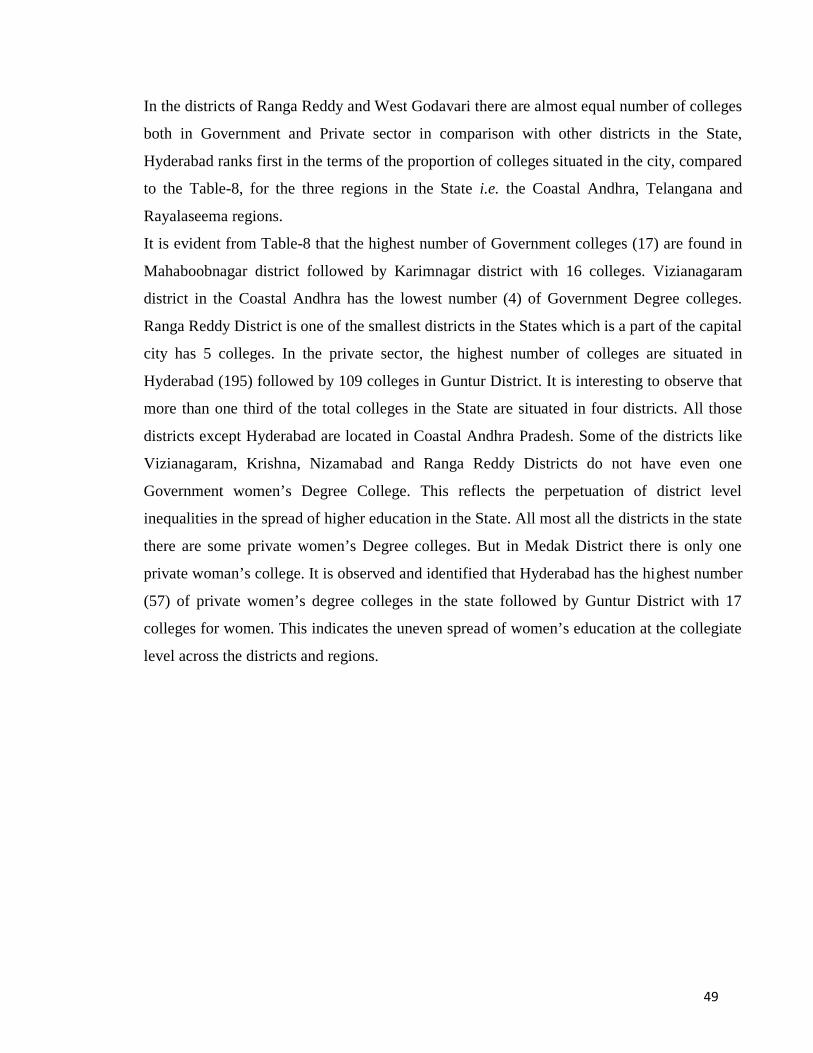
49
In the districts of Ranga Reddy and West Godavari there are almost equal number of colleges
both in Government and Private sector in comparison with other districts in the State,
Hyderabad ranks first in the terms of the proportion of colleges situated in the city, compared
to the Table-8, for the three regions in the State i.e. the Coastal Andhra, Telangana and
Rayalaseema regions.
It is evident from Table-8 that the highest number of Government colleges (17) are found in
Mahaboobnagar district followed by Karimnagar district with 16 colleges. Vizianagaram
district in the Coastal Andhra has the lowest number (4) of Government Degree colleges.
Ranga Reddy District is one of the smallest districts in the States which is a part of the capital
city has 5 colleges. In the private sector, the highest number of colleges are situated in
Hyderabad (195) followed by 109 colleges in Guntur District. It is interesting to observe that
more than one third of the total colleges in the State are situated in four districts. All those
districts except Hyderabad are located in Coastal Andhra Pradesh. Some of the districts like
Vizianagaram, Krishna, Nizamabad and Ranga Reddy Districts do not have even one
Government women’s Degree College. This reflects the perpetuation of district level
inequalities in the spread of higher education in the State. All most all the districts in the state
there are some private women’s Degree colleges. But in Medak District there is only one
private woman’s college. It is observed and identified that Hyderabad has the highest number
(57) of private women’s degree colleges in the state followed by Guntur District with 17
colleges for women. This indicates the uneven spread of women’s education at the collegiate
level across the districts and regions.
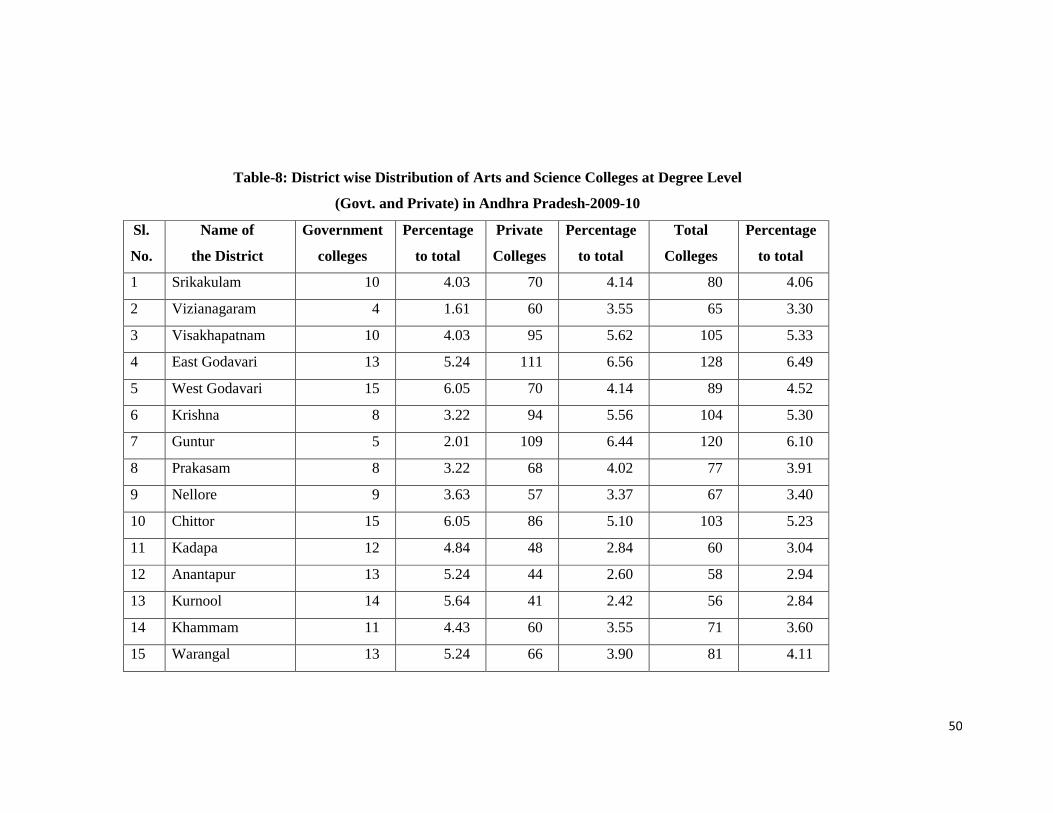
50
Table-8: District wise Distribution of Arts and Science Colleges at Degree Level
(Govt. and Private) in Andhra Pradesh-2009-10
Sl.
No.
Name of
the District
Government
colleges
Percentage
to total
Private
Colleges
Percentage
to total
Total
Colleges
Percentage
to total
1 Srikakulam 10 4.03 70 4.14 80 4.06
2 Vizianagaram 4 1.61 60 3.55 65 3.30
3 Visakhapatnam 10 4.03 95 5.62 105 5.33
4 East Godavari 13 5.24 111 6.56 128 6.49
5 West Godavari 15 6.05 70 4.14 89 4.52
6 Krishna 8 3.22 94 5.56 104 5.30
7 Guntur 5 2.01 109 6.44 120 6.10
8 Prakasam 8 3.22 68 4.02 77 3.91
9 Nellore 9 3.63 57 3.37 67 3.40
10 Chittor 15 6.05 86 5.10 103 5.23
11 Kadapa 12 4.84 48 2.84 60 3.04
12 Anantapur 13 5.24 44 2.60 58 2.94
13 Kurnool 14 5.64 41 2.42 56 2.84
14 Khammam 11 4.43 60 3.55 71 3.60
15 Warangal 13 5.24 66 3.90 81 4.11

51
16 Karimnagar 16 6.45 69 4.10 88 4.47
17 Mahaboob nagar 17 6.85 54 3.19 72 3.65
18 Nizamabad 9 3.63 38 2.25 48 2.44
19 Adilabad 11 4.43 45 2.66 56 2.84
20 Medak 15 6.05 48 2.84 63 3.20
21 Ranga Reddy 5 2.01 83 4.91 89 4.52
22 Nalgonda 8 3.22 80 4.73 88 4.47
23 Hyderabad 7 2.82 195 11.53 202 10.25
Total Andhra Pradesh 248 100 1691 100 1970 100
Source: Commissionerate of Collegiate Andhra Pradesh, Hyderabad.

52
The Table-9 Indicates University wise total number of students enrolled and the total number
of teachers employed by sex both in government and private degree colleges in the state
during the year 2008-09. It is evident from the table that the Osmania University occupied
the first place in the development of higher education both in enrolment of students (22.93%)
and in the recruitment of teachers (23.10%). This University was situated in Telangana
Region. The second place in the state is occupied by Andhra University in the enrolment of
students (22.67%) and by Acharya Nagarjuna University in the case of recruitment of
teachers (22.89%) Both the Universities were situated in Coastal Andhra region. Education
was started in Guntur District much earlier by the missionary enterprises with much zeal and
enthusiasm. The last place in the state occupied by Krishna Devaraya University in the
enrolment of the students (10.62%) and recruitment of the teachers (8.60%). This University
was situated in Rayalaseema region.
The expansion of higher education at all levels also influenced the entire development of
education in the State.

53
Table-9: University-wise Students Enrolled and Teachers Employed by Sex in Degree Colleges
(Both Government and Private) in Andhra Pradesh (2008-09)
Sl.
No
Name of the
University
Students Percenta
ge
to total
Teachers Percenta
ge
to totalMale
Femal
eTotal Male Female Total
1 Andhra University 49317 37449 86766 22.67 1660 796 2456 21.71
2Acharya Nagarjuna
University40982
25116
166143 17.28 1708 881 2589 22.89
3Sri Venkateshwara
university27516 20305 47821 12.49 1195 425 1620 14.32
4Sri Krishna
Devaraya University26177 14493 40670 10.62 771 202 973 8.60
5 Osmania University 46755 41029 87784 22.93 1410 1200 2610 23.10
6 Kakatiya University 30029 23548 53577 14.00 771 296 1067 9.43
Andhra Pradesh 22077616198
5382761 100.00 7515 3800 11315 100.00
Source: Statistical Abstract of Andhra Pradesh 2009.
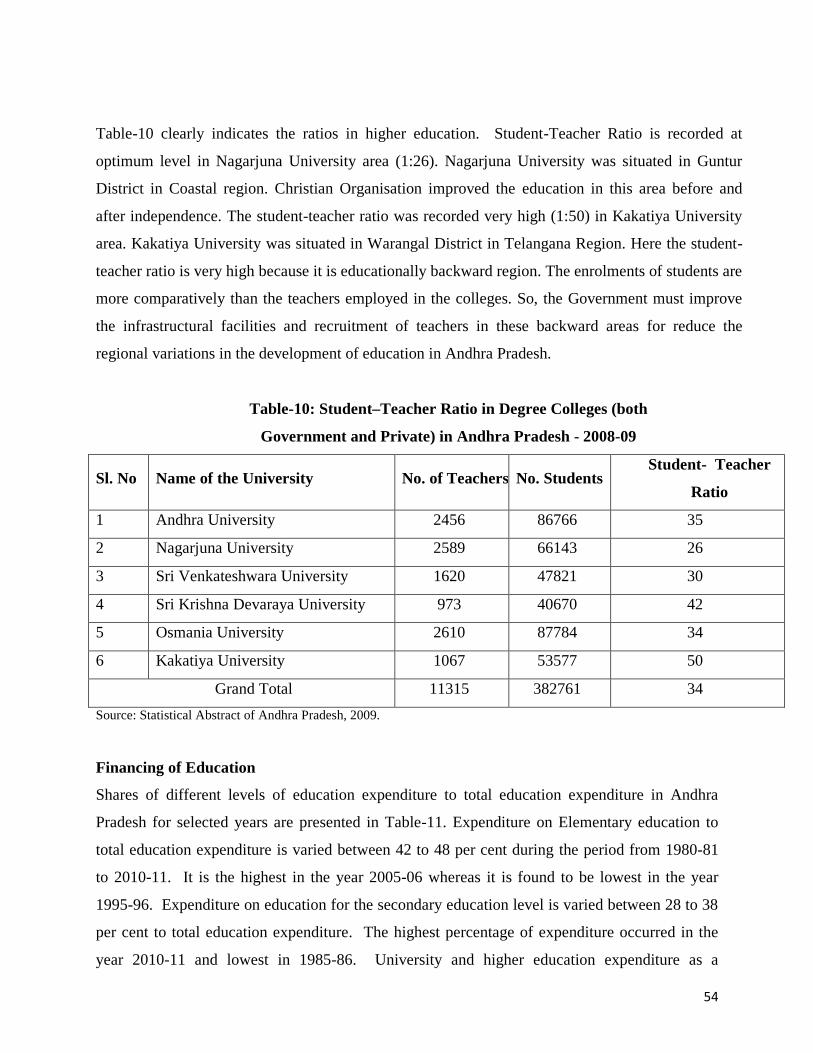
54
Table-10 clearly indicates the ratios in higher education. Student-Teacher Ratio is recorded at
optimum level in Nagarjuna University area (1:26). Nagarjuna University was situated in Guntur
District in Coastal region. Christian Organisation improved the education in this area before and
after independence. The student-teacher ratio was recorded very high (1:50) in Kakatiya University
area. Kakatiya University was situated in Warangal District in Telangana Region. Here the student-
teacher ratio is very high because it is educationally backward region. The enrolments of students are
more comparatively than the teachers employed in the colleges. So, the Government must improve
the infrastructural facilities and recruitment of teachers in these backward areas for reduce the
regional variations in the development of education in Andhra Pradesh.
Table-10: Student–Teacher Ratio in Degree Colleges (both
Government and Private) in Andhra Pradesh - 2008-09
Sl. No Name of the University No. of Teachers No. StudentsStudent- Teacher
Ratio
1 Andhra University 2456 86766 35
2 Nagarjuna University 2589 66143 26
3 Sri Venkateshwara University 1620 47821 30
4 Sri Krishna Devaraya University 973 40670 42
5 Osmania University 2610 87784 34
6 Kakatiya University 1067 53577 50
Grand Total 11315 382761 34
Source: Statistical Abstract of Andhra Pradesh, 2009.
Financing of Education
Shares of different levels of education expenditure to total education expenditure in Andhra
Pradesh for selected years are presented in Table-11. Expenditure on Elementary education to
total education expenditure is varied between 42 to 48 per cent during the period from 1980-81
to 2010-11. It is the highest in the year 2005-06 whereas it is found to be lowest in the year
1995-96. Expenditure on education for the secondary education level is varied between 28 to 38
per cent to total education expenditure. The highest percentage of expenditure occurred in the
year 2010-11 and lowest in 1985-86. University and higher education expenditure as a

55
percentage of total education expenditure ranges from 20 to 22 per cent. Moreover, the
percentage of education expenditure on university and higher education is steadily declining over
the last decade from 22.06 per cent in 2000-01 to 13.72 per cent by 2010-11. Regarding
expenditure on education level at technical education is ranged between 2 to 5 per cent. The
lowest expenditure is noticed in 2000-01 year (2.36%) where as the highest percentage is
witnessed in the year 2010-11.
During the entire period covering from 1980-81 to 2010-11, the percentage of
expenditure on education has been declined at elementary, university and higher education levels
and shows an increasing trend at secondary and technical education levels.
Table-11: Shares of Different Levels in Education Expenditure
in Andhra Pradesh
(Percentage)
Item1980-
81
1985-
86
1990-
91
1995-
96
2000-
01
2005-
06
2010-
11
Elementary Education 44.1 46.1 44.9 41.7 43.98 47.68 42.59
Secondary Education 29.4 28.1 28.4 31.6 30.15 29.92 38.22
University and Higher
Education20.3 20.2 22.0 20.3 22.06 17.88 13.72
Technical Education 3.1 2.9 3.1 2.9 2.36 3.20 4.45
Information relating to percentage of expenditure on education to the total budget (Revenue
Account) in Andhra Pradesh is furnished in Table-12. The total period covering from 1985-86 to
2008-09 is divided into two sub periods to compare the percentage of expenditure on education
to the total budget viz., 1985-86 to 1996-97 and 1997-98 to 2008-09. For the first sub period
1985-86 to 1996-97 the average percentage of expenditure on education is 3.34. Out of the total
12 years only five years are having greater than the average expenditure in the first sub period.
The second sub period has the average percentage of expenditure is 3.80. Seven years in the
second sub period have been witnessed greater than the average percentage of expenditure on
education. Regarding the total period of our study, the average percentage of expenditure on
education is 3.57 and the second period of our study (1997-98 to 2008-09) is recorded more than
the total average percentage of expenditure on education. The lowest percentage of expenditure

56
on education recorded at 1.27 per cent in 2000-01 and the highest percentage of expenditure on
education recorded at 7.16 per cent in 1989-90 in our study period.
Table -12: Percentage of Expenditure on Education to the Total Budget (RevenueAccounts) in Andhra Pradesh
Year Percentage1985-86 3.771986-87 3.621987-88 4.511988-89 4.871989-90 7.161990-91 2.941991-92 2.891992-93 2.421993-94 1.851994-95 1.621995-96 1.931996-97 2.541997-98 3.271998-99 4.43
199-2000 3.972000-01 1.272001-02 2.412002-03 3.912003-04 5.562004-05 5.842005-06 4.862006-07 3.932007-08 2.942008-09 3.28
Period Average Percentage of Expenditure on Education
1985-86 to 1996-97 3.34
1997-98 to 2008-09 3.80
1985-86 to 2008-09 3.57
Source: Calculated the data from different statistical abstract of Andhra Pradesh.
Conclusions
57
The above analysis evidently shows that the distribution of colleges across the districts and
regions of the state is not even. The spread of higher education is found to be unequal between
men and women and also between developed and under developed districts, regions in the state.
The capital city of Hyderabad has attracted all the premier institutions in the state including the
placement for headquarters of half a dozen Universities in the State. However the rate of growth
of enrolment in higher education is growing in the recent years, particularly after 1989-90. This
may be taken as a desirable trend provided the future expansion of colleges are equitable
distributed between gender and also among the under developed districts in the state.
The student-teacher ratio is recorded at optimum level in Acharya Nagarjuna University area (1:26)
i.e. in coastal region and the ratio is very high in Kakatiya University area (1:50), it is in Telangana
region. Here the student-teacher ratio is high while the educational back ground is less. So, the
Government must improve the infrastructural facilities and recruitment of the teachers in the
backward areas and reduce the regional disparities in the development of education in Andhra
Pradesh.
The financing of education is in the total study period, the average percentage of expenditure on
education is 3.57. The percentage of expenditure on education ranges from 1.27 per cent (2000-
2001) to 7.16 per cent (1989-90). The Government gradually reducing the expenditure on education
in the total budget. So, the Government should be increased the allocation of expenditure on
education for the development of education in Andhra Pradesh.
References
1. Chalam, K.S. (1993): Educational Policy for Human Resources Development, Rawat
Publications, Jaipur.
2. Chalam, K.S. (1988): Education and weaker sections, Inter-India Publications, New Delhi.
3. Chauhan, C.P.S. (2000): ‘Contemporary issues in Higher Education’, University News, AIU,
New Delhi, December 2004.
4. Chauhan, C.P.S. (1990): Higher Education in India: Achievements, Failures and Strategies,
Ashish Publishing House, New Delhi.
5. Government of India. National Policy on Education, 1968, Ministry of Education and
Culture, New Delhi, 1968.

58
6. Government of India. National Policy on Education (NPE), 1986 and its revised version
1992, MHRD, New Delhi, 1986 and 1992.
7. Mira Seth (2001): Women and development – The Indian experience, Sage Publications, New
Delhi.
8. Nurullah, S and Naik, J.P. (1943): History of Education in India during the British period,
Macmillan & Co. Ltd., Bombay.
9. Power, K.B. (2000): ‘Higher Education in the Twenty-First century’, University News, AIU,
New Delhi, December 4.
10. University Grants Commission. Annual Reports, 1959-60, 1993-94, 1995-96 and 1998-99,
UGC, New Delhi.
59
The Retail Revolution in Mumbai
Dr. L. R. Bahadur
Abstract
Retail is attracting huge attention from all entrepreneurs, business heads, investors as well as real
estate owners and builders. This area has remained largely an unexplored part of research till
date especially in the Indian context. Shopping is considered as an experience now rather than a
task. The study uses primary data through a two page questionnaire circulated among 200
organized retailers in Mumbai.
Key words: organized retail, competition, stocks, and promotions.
Introduction
Mumbai bears the tag of being the financial capital of the country and contributes around 5 per
cent of the country's GDP. Retail is an age-old trade in the city of Mumbai. The rising
consumerism and increasing purchasing power of the customer has led to significant growth of
organized retail market in Mumbai. The retail trade has undergone considerable shift in the last t
decade and more radical changes are foreseen. Mumbai being a commercial capital of India
keeps vibrating with trade and commerce activities of all shapes and forms.
The retail revolution in the country was sparked off in Mumbai, which began in the late 1990s,
when Crossroads mall was set up in Tardeo. Prior to this, there was no mall in the country.
India’s first mall was welcomed with great joy and the citizens of Mumbai were introduced to a
new concept of shopping. This marked the retail revolution in the country.
Traditionally the retail industry in Mumbai was largely unorganized. This format has been
established centuries ago and has a strong hold on the Indian mindset. In order to survive today,
this format should co-operate with the organized sector as competing with them will not be
viable.
Organized retail has recently started in India and is mainly concentrated to the metropolitan cities
like Mumbai and Delhi. Retail in India is growing fast due to a boom in this format of retail.
∗ Vice-Principal, H R College of Commerce & Economics, Churchgate, Mumbai.
60
Nearly 300 malls have been built showing the growth in this sector. Malls are spread all over the
city, stretching from Airman Point in South Mumbai to Bhayander in the Western Suburbs and
Kalyan in the Central Suburbs. The city is home to some of the most prominent and successful
malls in the country and the retail rentals are amongst the most expensive in the world.
A preliminary study done by the researcher shows that Mumbai witnessed a staggering 11.26
mn.sq. ft. of fresh retail space from 2010-2012. During this period, the central suburbs
experienced the maximum upcoming retail space. Even though there are as many as 14 malls
coming up in the Western Suburbs, none of them have a particularly large built up area. Navi
Mumbai accounts for only 13 per cent of imminent retail space in Mumbai. The Island City too
experiences a very low built up area of upcoming retail space. There are only 3 projects in this
zone and hence the Island City accounts for only 6 percent of the total supply. Through further
analysis, the reason behind this surprisingly low amount of upcoming mall space is the fact that
the Island City already has a large proportion of organized retail.
Research Methodology
The researcher has adopted analytical, descriptive and comparative methodology for this study.
The research has been conducted on the basis of primary and secondary data sources. The
primary data was collected from a total of 200 retailers in malls from all the four parts of
Mumbai who were surveyed for this research study. A two page questionnaire and personal
interview methods were used. The sampling method chosen is simple random sampling which is
a type of probability sampling.
Secondary data was collected through research papers, Newspapers, journals, websites, books,
project reports and so on.
Limitations of the Study
Constraints on time, womanpower and costs have influenced decisions on the study sample size.
Also the study is restricted to the city of Mumbai.
Observations and Inferences
A preliminary survey done by this researcher shows that there are all categories of shops in the
organized section of the retail market and it is quite evenly distributed with various category
shops. This shows that the retail industry is fast expanding especially the organized section,
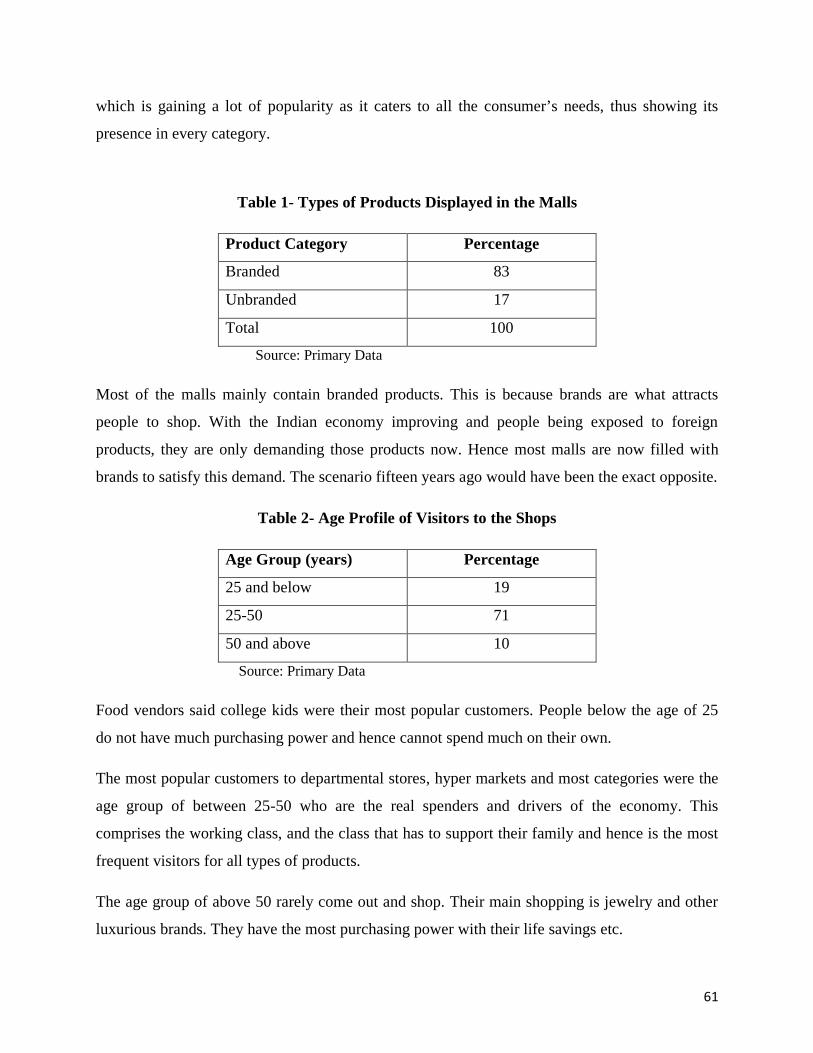
61
which is gaining a lot of popularity as it caters to all the consumer’s needs, thus showing its
presence in every category.
Table 1- Types of Products Displayed in the Malls
Product Category Percentage
Branded 83
Unbranded 17
Total 100
Source: Primary Data
Most of the malls mainly contain branded products. This is because brands are what attracts
people to shop. With the Indian economy improving and people being exposed to foreign
products, they are only demanding those products now. Hence most malls are now filled with
brands to satisfy this demand. The scenario fifteen years ago would have been the exact opposite.
Table 2- Age Profile of Visitors to the Shops
Age Group (years) Percentage
25 and below 19
25-50 71
50 and above 10
Source: Primary Data
Food vendors said college kids were their most popular customers. People below the age of 25
do not have much purchasing power and hence cannot spend much on their own.
The most popular customers to departmental stores, hyper markets and most categories were the
age group of between 25-50 who are the real spenders and drivers of the economy. This
comprises the working class, and the class that has to support their family and hence is the most
frequent visitors for all types of products.
The age group of above 50 rarely come out and shop. Their main shopping is jewelry and other
luxurious brands. They have the most purchasing power with their life savings etc.

62
Table 3- Sources of Purchase of Products
Purchases made Percent
Whole sale dealers 57
Directly from the company 43
Total 100
Source: Primary Data
When asked where they get their stock from, most answered wholesalers. The process explained
was that the companies sell their products to wholesalers who then sell it ahead to the retailers.
Table 4-Whether the retailers maintain stock
Option Percentage
Yes 75
No 25
Total 100
Source: Primary Data
Most of the retailers maintain stock. The excess stock that they have is always sold off during the
sale season. There are always certain shops in every mall that are never announcing a Sale and
these are the ones who do not maintain stock, and so never have to dispose off their stock. These
shops generally are the ones that take orders in advance for products and so never have to
maintain any excess stock. E.g.: Jewelry stores.
Table 5- After How Long the Retailers Dispose of the Stock
Period of Inventory (months) Percentage
1-3 months 30
3-6 months 38
6-9 months 12
> 9 months 20

63
Total 100
Source: Primary Data
Most retailers do not keep their stock for very long due to various reasons like spoilage or
changing tastes or change in season. The retailers that keep stock for long periods are the
luxurious brands that are less affected by external factors. Period of inventory depends on
demand and is inversely proportional. More demand will have fewer periods of inventory and
vice versa.
Table 6- Number of Customers Visiting the Stores on Weekdays
Particulars Percentage
>100 customers 48
100- 200 customers 34
200-300 customers 18
Total 100
Source: Primary Data
Table 7- Number of Customers Visiting the Stores on Weekends
Particulars Percentage
>100 25
100-200 48
200-300 24
300-400 3
Total 100
Source: Primary Data
Certain retail stores that sell everyday consumer items are not affected by the days of the week.
These products are essential to the consumers and are required on a regular basis. These stores
include groceries, fruit and vegetable vendors, stationary shops. While retail clothing, bags and
shoes stores remained emptier on the weekdays and more crowded on weekends as the
consumers have more time to choose from a wide variety of products and pick the best one.
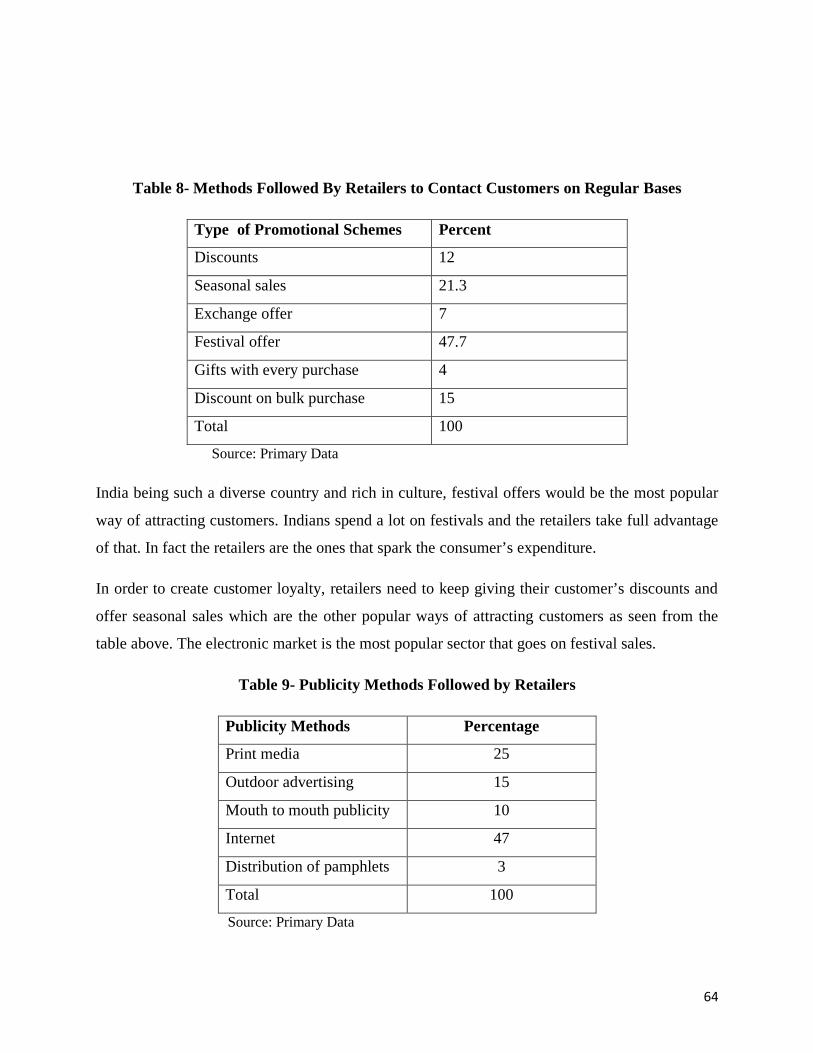
64
Table 8- Methods Followed By Retailers to Contact Customers on Regular Bases
Type of Promotional Schemes Percent
Discounts 12
Seasonal sales 21.3
Exchange offer 7
Festival offer 47.7
Gifts with every purchase 4
Discount on bulk purchase 15
Total 100
Source: Primary Data
India being such a diverse country and rich in culture, festival offers would be the most popular
way of attracting customers. Indians spend a lot on festivals and the retailers take full advantage
of that. In fact the retailers are the ones that spark the consumer’s expenditure.
In order to create customer loyalty, retailers need to keep giving their customer’s discounts and
offer seasonal sales which are the other popular ways of attracting customers as seen from the
table above. The electronic market is the most popular sector that goes on festival sales.
Table 9- Publicity Methods Followed by Retailers
Publicity Methods Percentage
Print media 25
Outdoor advertising 15
Mouth to mouth publicity 10
Internet 47
Distribution of pamphlets 3
Total 100
Source: Primary Data
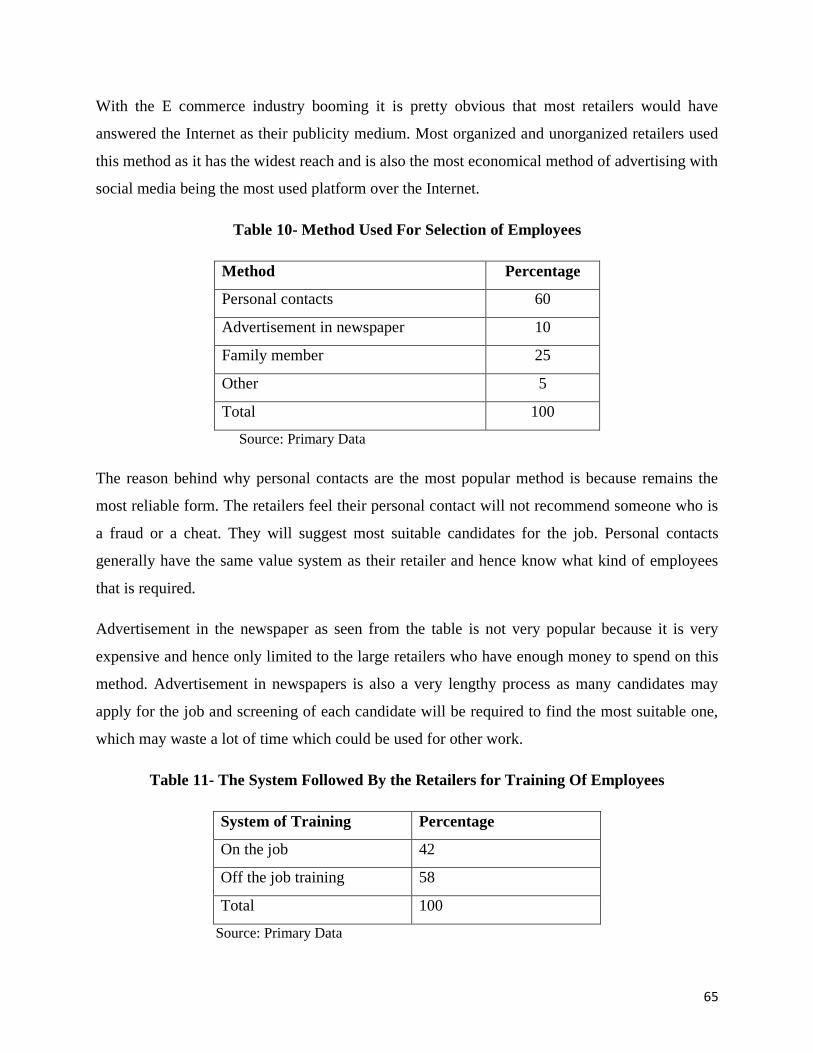
65
With the E commerce industry booming it is pretty obvious that most retailers would have
answered the Internet as their publicity medium. Most organized and unorganized retailers used
this method as it has the widest reach and is also the most economical method of advertising with
social media being the most used platform over the Internet.
Table 10- Method Used For Selection of Employees
Method Percentage
Personal contacts 60
Advertisement in newspaper 10
Family member 25
Other 5
Total 100
Source: Primary Data
The reason behind why personal contacts are the most popular method is because remains the
most reliable form. The retailers feel their personal contact will not recommend someone who is
a fraud or a cheat. They will suggest most suitable candidates for the job. Personal contacts
generally have the same value system as their retailer and hence know what kind of employees
that is required.
Advertisement in the newspaper as seen from the table is not very popular because it is very
expensive and hence only limited to the large retailers who have enough money to spend on this
method. Advertisement in newspapers is also a very lengthy process as many candidates may
apply for the job and screening of each candidate will be required to find the most suitable one,
which may waste a lot of time which could be used for other work.
Table 11- The System Followed By the Retailers for Training Of Employees
System of Training Percentage
On the job 42
Off the job training 58
Total 100
Source: Primary Data
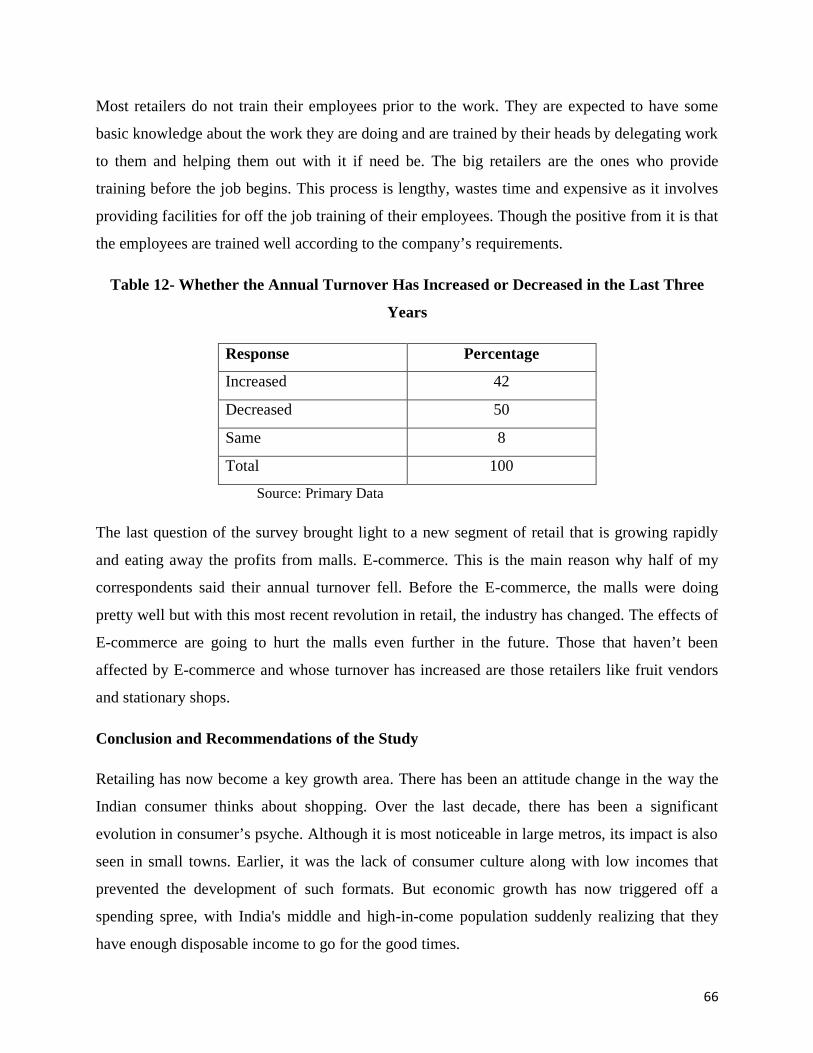
66
Most retailers do not train their employees prior to the work. They are expected to have some
basic knowledge about the work they are doing and are trained by their heads by delegating work
to them and helping them out with it if need be. The big retailers are the ones who provide
training before the job begins. This process is lengthy, wastes time and expensive as it involves
providing facilities for off the job training of their employees. Though the positive from it is that
the employees are trained well according to the company’s requirements.
Table 12- Whether the Annual Turnover Has Increased or Decreased in the Last Three
Years
Response Percentage
Increased 42
Decreased 50
Same 8
Total 100
Source: Primary Data
The last question of the survey brought light to a new segment of retail that is growing rapidly
and eating away the profits from malls. E-commerce. This is the main reason why half of my
correspondents said their annual turnover fell. Before the E-commerce, the malls were doing
pretty well but with this most recent revolution in retail, the industry has changed. The effects of
E-commerce are going to hurt the malls even further in the future. Those that haven’t been
affected by E-commerce and whose turnover has increased are those retailers like fruit vendors
and stationary shops.
Conclusion and Recommendations of the Study
Retailing has now become a key growth area. There has been an attitude change in the way the
Indian consumer thinks about shopping. Over the last decade, there has been a significant
evolution in consumer’s psyche. Although it is most noticeable in large metros, its impact is also
seen in small towns. Earlier, it was the lack of consumer culture along with low incomes that
prevented the development of such formats. But economic growth has now triggered off a
spending spree, with India's middle and high-in-come population suddenly realizing that they
have enough disposable income to go for the good times.

67
Shopping in malls has become the latest trend today. They are very popular among people of all
age groups. The reasons for their popularity are that they sell all kinds of branded goods. People
who opt for quality can get good products here without much effort. Furthermore, these malls are
not crowded and one can shop here with much comfort. Shopping in these spacious places is
indeed easy. Although they are crowded sometimes, there is ample space for easy movement,
which makes shopping fun and a memorable experience. To illustrate, since they are built in a
large area they are very spacious. In addition, climbing up and down the stairs can be avoided
because of the escalators as well as the lifts. Moreover, the malls not only sell commodities such
as garments, gadgets, cosmetics etc but also sell food items.
These shopping malls though are starting to face new healthy competition from the E-Commerce
retail industry which I classify as a whole new segment in the retail industry. This most recent
revolution has already brought about drastic changes in consumer behavior which has led to a
considerable drop in the number of people going to malls as they can sit at home and shop and
the products will come to them. The E-commerce industry is still at its infancy stages and has
already gained a lot of popularity and would certainly revolutionize the fast growing retail
industry.
Bibliography
http://www.ibef.org/industry/retail-india.aspx
https://www.dnb.co.in/IndianRetailIndustry/overview.asp
file:///Users/apple/Downloads/1317276845Asipac_Study_-
_Mall_Space_Demand_and_Supply_in_Mumbai.pdf

68
A Study of Pre and Post Impact of Online Trading in Indian Stock Market∗Dr. Gayatri Agarwal
Abstract
The stock market reforms introduced by the SEBI in the last two decades have changed the face
of the Indian stock market. These reforms had their impact on all the participants in the stock
market. An important participant in the stock market is the individual investors, representing the
households, and they form a very important part of the economy. The larger the individual
investors’ participation in the stock market, the more competitive and deeper the market gets.
Out of the several reforms undertaken by SEBI, this study has concentrated only on Online
trading in Indian Stock Market. The study aims to show the behaviour of investments of
individual investors before and after online trading came into existence. Hence the attempt has
been made to analyse the positive and negative impact of reforms in Indian Stock Market on the
individual investors in Mumbai.
Key Words: Online trading, Indian Stock Market, Individual Investors’
Introduction
The Online trading started in India on April 1, 2000 with as many as 79 members seeking
permission for the same. Internet trading is a method of trading in securities whereby it is
possible for the investors to buy and sell Stocks through the internet. It is also called as Online
Trading; the trading takes place under the “Order Routing System” through registered Stock
brokers on behalf of the clients for the execution of trader on Stock Exchange. Many Indian
investors are logging into the internet to put through their Stock Market Trades.
Review of Literature
Rahim (2013) in his Study made an attempt to find out the benefits of online share trading and
the problems faced by online share trading investors. The study was both descriptive and
analytical in nature. The data was collected through a survey and was analyzed with the help of
statistical tools like the Weighted Average Ranking Method and Garrett Ranking Method. It was
revealed from the study that the main benefits derived out of online share trading are wider
∗ Assistant Prof, Department of Accountancy, K.P.B.Hinduja College of Commerce, Mumbai.

69
choice, better value and source of information, whereas the major problems suffered by investors
through online share trading are inadequate availability of technology, poor communication
network and greater chances of fraud.
Srivastava (2011) studied the impact of internet growth on stock market transactions. The
internet commerce industry in India has grown manifold in the last couple of years leading to an
enormous growth in online trading, At the end of March 2010, 363 members, were permitted to
allow investors web based access to NSE’s trading system. In the fiscal year 2009-10, 5,143,705
clients were registered for online trading as against 2,279,098 registered clients in 2006-07. In
the year 2008-09, 25.71 per cent of the trading value in the capital market segment was traded
and executed through the internet. Hence, the Researcher concluded that a safe and robust
infrastructure is very necessary for carrying out trading activity through online or a mobile
gateway. It was suggested that fast internet connectivity should be provided at lower prices to
boost the digital commerce regime.
Singh (2010) examined whether investors who adopted internet stock trading perceived it
differently from non-adopters. The results of the analysis revealed that the attitude dimensions in
comparison to demographics contributed significantly in classifying investors as adopters or non-
adopters of internet stock trading. Taking demographics into consideration, inexperienced, young
and non-businessmen investors are more likely to use online trading compared to experienced,
aged and business investors.
Walia and Kumar (2007) in her Research Paper emphasized that there is no denying the fact that
internet trading had offered convenient trading at reduced cost. However, Indian investors have
not yet fully realized the importance of using technology for stock trading. The major findings of
the study are that Indian investors are very conservative and they do not change brokers for
trading. Online traders are more comfortable with online trading for its transparency and
complete control of the terminal.
Barber and Odean (2002) surveyed 1,607 investors who had switched to online trading from
phone based trading during the 1990’s. After moving to online trading it was observed that
investors trade more actively and speculatively. Online trading leads to lower trading costs,
improved execution speed and greater ease of access. The Study found that the investors who
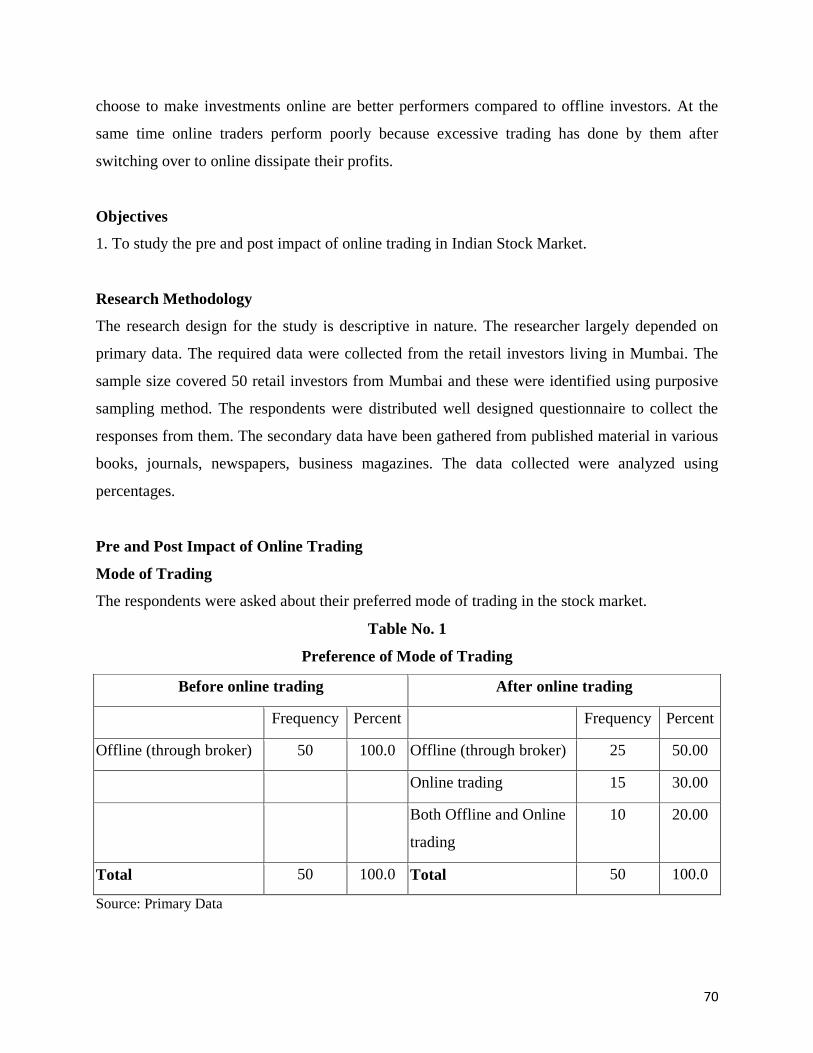
70
choose to make investments online are better performers compared to offline investors. At the
same time online traders perform poorly because excessive trading has done by them after
switching over to online dissipate their profits.
Objectives
1. To study the pre and post impact of online trading in Indian Stock Market.
Research Methodology
The research design for the study is descriptive in nature. The researcher largely depended on
primary data. The required data were collected from the retail investors living in Mumbai. The
sample size covered 50 retail investors from Mumbai and these were identified using purposive
sampling method. The respondents were distributed well designed questionnaire to collect the
responses from them. The secondary data have been gathered from published material in various
books, journals, newspapers, business magazines. The data collected were analyzed using
percentages.
Pre and Post Impact of Online Trading
Mode of Trading
The respondents were asked about their preferred mode of trading in the stock market.
Table No. 1
Preference of Mode of Trading
Before online trading After online trading
Frequency Percent Frequency Percent
Offline (through broker) 50 100.0 Offline (through broker) 25 50.00
Online trading 15 30.00
Both Offline and Online
trading
10 20.00
Total 50 100.0 Total 50 100.0
Source: Primary Data

71
The above table indicates that before Online Trading came into existence all the respondents had
to compulsorily trade through brokers i.e. offline trading. But after the onset of online trading
the majority of the respondents i.e. 50.00 per cent still prefer to trade through brokers, 30.00 per
cent of the respondents do Online Trading and only 20 per cent of the respondents had preferred
combination of both the mode of trading i.e. Online and Offline.
Hence, it can be concluded that even till date day Online trading is not very popular among
investors due to the following factors. The major barrier for the growth of Online Stock Trading
listed by respondents is computer illiteracy, Poor infrastructure and Risk Adverse Attitude of the
investors. The Respondents also found trading online as a complicated procedure. Only a few
respondents are Trading Online for its transparency and complete control of the terminal. It helps
investors in making their own decision with a close watch on market sensitivity by browsing
through various websites.
Trading Frequency
Trading in Stock Market takes place from Monday to Friday between 9:00 am to 3:30 pm. The
respondents were asked about the frequency of Trading in stock market to identify the
assertiveness of Trading by the respondents.
Table No. 2
Trading Frequency Pre and Post Online Trading
Prior Online Trading Post Online Trading
Frequency Percent Frequency Percent
Daily 14 28.00 Daily 21 42.00
Weekly 16 32.00 Weekly 17 34.00
Monthly 15 30.00 Monthly 09 18.00
Yearly 05 10.00 Yearly 03 6.00
Total 50 100.0 Total 50 100.0
Source: Primary Data
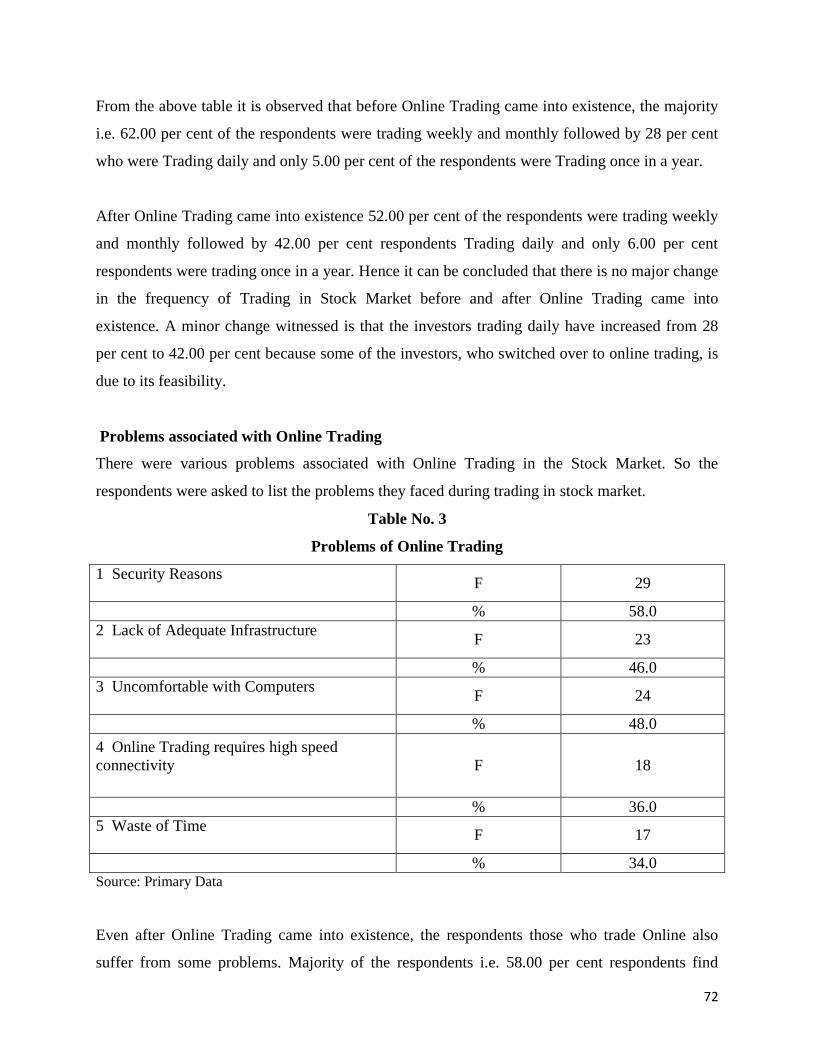
72
From the above table it is observed that before Online Trading came into existence, the majority
i.e. 62.00 per cent of the respondents were trading weekly and monthly followed by 28 per cent
who were Trading daily and only 5.00 per cent of the respondents were Trading once in a year.
After Online Trading came into existence 52.00 per cent of the respondents were trading weekly
and monthly followed by 42.00 per cent respondents Trading daily and only 6.00 per cent
respondents were trading once in a year. Hence it can be concluded that there is no major change
in the frequency of Trading in Stock Market before and after Online Trading came into
existence. A minor change witnessed is that the investors trading daily have increased from 28
per cent to 42.00 per cent because some of the investors, who switched over to online trading, is
due to its feasibility.
Problems associated with Online Trading
There were various problems associated with Online Trading in the Stock Market. So the
respondents were asked to list the problems they faced during trading in stock market.
Table No. 3
Problems of Online Trading
1 Security ReasonsF 29
% 58.02 Lack of Adequate Infrastructure
F 23
% 46.03 Uncomfortable with Computers
F 24
% 48.0
4 Online Trading requires high speedconnectivity F 18
% 36.05 Waste of Time
F 17
% 34.0Source: Primary Data
Even after Online Trading came into existence, the respondents those who trade Online also
suffer from some problems. Majority of the respondents i.e. 58.00 per cent respondents find

73
security as a major problem associated with Online Trading. Respondents fear if the trading done
by them through Online will be kept confidential. 48.00 respondents feel that only the computer
savvy investors can trade through Online and those who are not very well versed with computers
and internet will not get to trade. The next major problem associated with Online Trading is lack
of adequate infrastructure as 46.00 per cent respondents feel that only those brokerage firms
who have adequate infrastructure can provide the facility of Online Trading i.e. it cannot reach
the masses. 36.00 per cent respondents feel that Online Trading requires high speed connectivity
followed by waste of time (34 per cent respondents).
Hence, it can be concluded that through online trading has removed all the problems of Offline
Trading but it itself suffers from many drawbacks; than the respondents find it difficult to cope
up with these drawbacks so they trade Offline more i.e. through brokers than to Online Trading.
Conclusion
Online trading, one of the major market reforms is also not much popular among investors for
which a list of factors can be held responsible. The major barrier for the growth of online stock
trading listed were computer illiteracy, poor infrastructure and risk adverse attitude of investors.
Respondents also found trading through online as a complicated procedure. Only a few
respondents are trading online for its transparency and complete control of the terminal.
References
1.Barber, B. and Odean, T. (2002), “Online Investors: Do the Slow Die First?”, Review of
Financial Studies, Vol. 15, pp. 455 – 488.
2. Rahim, A. (2013), “Problems and Prospects of Online Share Trading Practices in India”,
International Journal of Marketing, Financial Services and Management Research, Vol. 2, No. 4,
pp. 150 – 155.
3.Singh Arwinder (2010), “Investors’ Adoption of Internet Stock Trading: A Study”, Vol. 15,
No. 1, pp. 1 – 21.
4.Srivastava Sarika (2011), “Impact of Internet Growth on the Online Stock Trading in India”,
Journal of Internet Banking and Commerce, Vol. 16, No.3, pp. 1 – 10.
5.Walia Nidhi and Kumar Ravinder (2007), “Online Stock Trading in India: An Empirical
Investigation”, Indian Journal of Marketing, Vol. XXXVII, No. 4.

74
Enhancing Airline Warehousing Productivity through State-Of-The-Art Information
Technology ImplementationDr. Siddhartha Ghosh
Abstract
The research is conducted at Jet Airways NSCB International Airport Kolkata. Jet Airways is the
largest airline of India, flying to fifty-nine destinations globally and having a fleet of 53 aircrafts.
It is largest in terms of revenue – for both passenger and cargo. With the airline’s cargo business
doubling up in the last couple of years, the organization is laying special emphasis on its cargo
segment. The purpose is to develop it as a global air cargo market leader by way of emulating the
cargo systems of International giants like Lufthansa Cargo and British Airways World Cargo.
Key Words: Warehouse, Work efficiency, Offloading
Introduction
The present compensation charges that Jet Airways has to bear on an yearly basis is around Rs.
30 lakhs and the internal escalation of the other operating costs is approximately Rs. 20 lakhs. By
improving the warehouse efficiency, it is aimed that the idle capacity of the space can be filled
up by 25% to 30% and by plugging the discrepancies of offloading, an approximate Rs. 20 lakh
to Rs. 30 lakh can be saved. Since the magnitude of the problem is very high, the airline
proposed the researcher to make a study in the above area. For such reasons, the research was
undertaken to have a detailed view of the problem and to analyse the gaps where there is scope
for improvement in the efficiency of warehousing operations.
It is expected that with the help of this research study the present unsystematic operations of
warehouse can be structured effectively, improvement in the work efficiency can be achieved by
avoiding the off loadings and by optimizing the manpower utilization with highest possible
productivity, the yearly compensation loss can be stopped resulting in further business
enhancement. The total expectation will be nearly a sixty lakh rupees earning to Jet Airways.
The research work proposes to achieve the following objectives :
a) To find out the present critical problematic areas / gaps in warehousing operations.
∗ School of Business Management, Shiksha Vihar, Bhubaneswar ,Orissa.
75
b) Protection of loss of revenue / cargo / business due to the present system.
c) Reasons and remedial measures to overcome operational problems.
d) Recommend optimal manpower utilization with maximum productivity.
e) How Information Technology can be the backbone in implementing the remedial measures.
f) Recommend remedial measures with IT application.
g) Cost Benefit Analysis with IT implementation.
Analysis of Present Cargo Operational System
To study the present cargo operational procedure in the aviation warehousing industry, we first
have to classify and distinguish between the types of cargo which will be the basis of our study.
Classification of Cargo
We will start by discussing the step-by-step explanation of the above’s procedures and identify
the Critical Problematic Areas (Cpas) or Gaps of the cargo warehousing functions in each stage.
The solutions or proposed recommendations to solve the said problems will be discussed in the
subsequent chapters.
Operational Procedures
Export Cargo
Step 1: Exporter books the cargo with the international airline and informs them about its exact
nature and quantity. The exporter has to take various factors into consideration before selecting a
particular international airline among the available competing airlines’. These factors are the
detrimental aspects for the competing airlines since these are the reasons why they lose the
business from the exporter. This is the Critical Problematic Area No. I which needs to be
addressed by the international airlines’ immediately in order to avoid the loss of business from
the exporter.
Factors
i) Immediate international connection or minimum waiting time at the transit station.
ii) Optimal expenditure with relation to total journey time, subject to exceptions.
The exporter before making a booking has two choices.
1. Select the airline which has least total journey time but having a steep cargo fare charge.

76
2. Select the airline which has comparatively cheap cargo fare but having a long journey time
from origin to destination.
iii) Tariff rates offered by competing airlines- keeping other factors constant, the exporter would
always prefer to give business to the international airline whose rates are cheaper.
iv) Quality of service – The exporters’ previous experience viz., positive or negative, with the
respective airlines plays a vital role in getting the business.
Step 2
International airline after getting booking, confirms it only after analyzing certain factors. These
are the detrimental factors for the airline which does not confirm the booking. These factors are
Critical Problematic Area No. 2 , which needs to be addressed in order to retain the business
from the exporter.
i. Space Availability: The aircraft space for cargo is limited because out of the whole space
the passenger baggage is given foremost priority and the remaining space is allocated for cargo.
If only the available space for cargo is sufficient, then only the airline accepts / confirms booking
for cargo from the exporter.
ii. Prior Commitments: Even if the cargo space is available then also sometimes fresh
bookings from exporters are denied because of backlog cargo commitments from the previous
exporters.
iii. Need for Immediate Connection: Sometimes shipper book cargo on the condition of
immediate connection to the destination or in other words some shipments require urgent
transportation. But if the airline do not have a immediate connecting flight to the repective
destination, then the airlines refuse the booking.
iv. Priority Incase Of Exceptional Cargo: The airlines’ charge very high tariff rates for
exceptional cargo such as gold , jewellery, ornaments, silver or foreign currency. The rates are
much higher than that of general cargo. So if an airline gets booking for these shipments, they
are given maximum priority. Here even if space is not available or backlog commitments are
huge, then also previous bookings are offloaded and the exceptional cargo is sent in its place.
Step 3
After the international airline confirms booking on the basis of above criteria, it sub-contracts the
booking with the domestic airline – like Jet Airways or Indian Airlines. For the purpose, the
international carriers have an Interline Agreement with the domestic airlines.
Step 4
77
Once the booking is confirmed by the international and domestic airlines’, the shipper or his
agent deposits the cargo at the Customs Export Warehouse in the NSCB International Airport.
Offloading
Offloading is a major problematic area that needs to be addressed by the aviation industry in
order to attract / retain the cargo business from the exporters.
Example : Jet Airways flight 9w616 for Mumbai at 1800 hrs. is a major cargo flight. Bulk of the
Mumbai international cargo moves in that flight. Say, if out of 4 tonnes of manifested load only
2.5 tonnes get uplifted and rest 1.5 gets bumped-off , it will have an adverse effect on the
business of Jet Airways because the exporter who holds this cargo will not only be unsatisfied
but also will miss the international connection or fail to deliver it to the importer at the right time
and thereby incur additional costs. Because of the failure on the part of the airlines, the exporter
will be unwilling to give the subsequent businesses to the same airline, in this case Jet Airways.
Off loadings may be due to various reasons which are the Critical Problematic Areas / Gaps in
the cargo operations and which needs to be addressed at the earliest to avoid loss of business
from the shippers.
Reasoning:
1. Shortage Of Space
(Critical Problematic Area No. Iii)
2. Shortage Of Time
(Critical Problematic Area No. Iv)
3. Non / Late Arrival Of Equipments
(Critical Problematic Area No. V)
4. Delay At International Warehouse
(Critical Problematic Area No. Vi)
Operational Procedure – Import Cargo
With the arrival of incoming flight, the import cargo and its document are offloaded and
segregated. The following documents are checked and matched with the import cargo.
1) Import Cargo Manifest.
2) Airwaybill.
3) Consol Cargo Manifest.

78
At the destination after tallying the shipments with the documents, a Customs Import General
Manifest Number (IGM No.) is obtained by the airlines. It’s a registration or identification
number for each flight’s import cargo. The documents and the cargo is deposited at the import
terminal where the Warehouse Cargo Officer verifies and inspects the shipments and issues a
acceptance certification.
After the above formalities, the Cargo Arrival Notice (CAN) is sent to the importer by the
airlines on the basis of which the importer takes the delivery from the import warehouse.
Highlights
I. Analysis of Present System
1.Classification of cargo types.
2.Operational procedure for each cargo types.
3.Factors that enhances / reduces the cargo business for the airline.
The reducing factors are the critical problem areas and overcoming of those will enhance the
airline’s cargo business.
4.Types of documents and documentation procedures.
II. Analysis Of Critical Problematic Areas / Gaps
1.Detrimental factors while taking booking.
2.Detrimental factors while booking confirmation.
3.Offloading due space shortage.
4.Offloading due time constraint.
5.Offloading due late arrival of equipments.
6.Offloading due delay at international warehouse.
7.Discrepancies in origin station at loading point.
8.Various discrepancy types.
Research Findings (Stage –I)
Outcome Of Demand Analysis –
Repositioning cargo inventory vis-à-vis service
Jet Airways operates three series of aircrafts at Kolkata airport, namely :-
• Boeing 737 800 Series ( Biggest with maximum space ).
• Boeing 737 700 Series ( Smallest with minimum space ).

79
• Boeing 737 400 Series ( Medium sized in between above two ).
By the demand analysis study it is found that in some of the flights maximum offloading takes
place regularly and in some group of flights there is maximum space wastage on a regular basis
which ultimately results in business loss for the airline. Therefore a repositioning of aircraft
series is proposed with reference to its cargo load.
Following is the Proposal
I. Findings And Recommendations
Flight Sector Departure
(Hrs.)
Present
Series
Present
Loading Status
Proposed
Series
9W202 Mumbai 0625 737 700 Maximum Offloading 737 800
9W515 Bangalore 0615 737 700 Maximum Offloading 737 400
9W913 Delhi 1725 737 700 Maximum Offloading 737 800
9W616 Mumbai 1800 737 400 Maximum Offloading 737 800
9W212 Mumbai 2040 737 800 Maximum Space Wastage 737 700
9W912 Delhi 2055 737 800 Maximum Space Wastage 737 400
9W902 Delhi 0855 737 800 Maximum Space Wastage 737 700
9W617 Bagdogra 1220 737 800 Maximum Space Wastage 737 400
Recommended Automatic Tracking System
The Research Work Proposes To Develop An Integrated Online Software System Whereby The
Agencies Involved In The Cargo Operations Viz., Indian Customs, Domestic Airlines,
International Airlines, Exporters And Destination Will Have A Direct Access With Each Other
And Each Establishment’s Database Will Be Shared By All The Stations, Resulting In A
Transparent Interchange Of Data And A Knowledge On Exact Status Of Cargo At Each Stage
And Thereby Enabling Its Traceability.
Integrated Online Software System
Revised It Implementation (Tracking) System

80
I. Export Cargo
Proposed Expected Results
The integrated online software system should
be such that each of the domestic and
international airlines’ flight time table would
be available on the internet.
This would enable the exporters to plan and
select the airline as per their suitability namely,
they would be able to find out that which airline
have an immediate international connection to
the destination or which airline would have a
minimum waiting time at the transit station.
Along with the sharing of flight timetable,
the cargo fare structure of each domestic /
international airline with the total journey
time in each route is also to be posted online.
This would help the exporter to decide on the
aspect of optimal expenditure with relation to the
total journey time.
Another component of fare structure is the
tariff rates, which is also to be shared and
posted online for all the airlines.
Exporter will be able to select the tariff rate of a
airline as per its suitability.
The system should show the amount of total
cargo space of each flight for all the airlines
and with every booking, same amount of
space to be blocked.
This would indicate the cargo space availability
of each flight for all the airlines.
For each destination sectors of the respective
airlines’ a software database is proposed to
be maintained which would record the
backlog cargo commitments ( on the basis of
“Urgency Rating”) along with its comparison
with the space availability.
This would aid the airline to identify the priority
shipments.
Along with the backlog cargo commitment
software database a parallel Exceptional
Cargo Software Database is also to be
maintained.
Airlines’ worldwide will be able to give topmost
priority to exceptional cargo. Exceptional cargo
like valuables should be given priority because
their rates are much higher than the general cargo
and perishables to be given priority because of
their nature.

81
Unlike at present, where airway bill and
general cargo security declaration is filled up
manually and then transferred to concerned
agencies, there should be a system of online
sharing of airway bill and General Cargo
Security Declaration.
This would result in online document evaluation
by Customs, forwarding of Carting Order and
subsequent electronic transfer of Shipping Bill
and Green Copy. This procedure will not only
save time but also will be cost-efficient in the
long run.
After Customs approval, all the above
documents would be downloaded by the
domestic airline, on the basis of which they
will prepare the electronic cargo manifest
and distribute it online to all the stations.
Customs after receiving the manifest would
generate a Export General Manifest Number
(EGM No.) electronically.
All the documents to be forwarded /
distributed electronically to the destination.
Destination will get a PRE – ALERT tracking
status of cargo.
To overcome the problem of offloading, an
online Cargo Offloading Software system is
to be incorporated where the cutoff time for
each component of operation is to be derived
and as soon as it is achieved and updated, a
subsequent cut-off time for next operation is
to be placed.
This would solve the problem of :-
a) Shortage of time at tarmac due late cargo
arrival.
b) Late release of cargo from international
warehouse due delay in handing over the
documents.
c) Late cargo release from international
warehouse due Customs delay.
d) Warehouse operational delay.
Note: Since the system would be online / electronic and on a sharing basis, the errors will be
detected at the point of occurrence itself and modified, unlike at present where it is detected at
the destination after the whole operation is over.
Since the perishable cargo holding airline is not
required to follow the FIFO Policy in taking cargo
delivery from the Export Warehouse, it creates a
critical problem for the general cargo holding airline
which is ahead in the queue to take delivery and who
has an immediate flight. To overcome this critical
This would make the Customs and other
general cargo hoding airlines’, to have a
clear-cut planning in following FIFO
policy and the problem of offloading can
be averted.
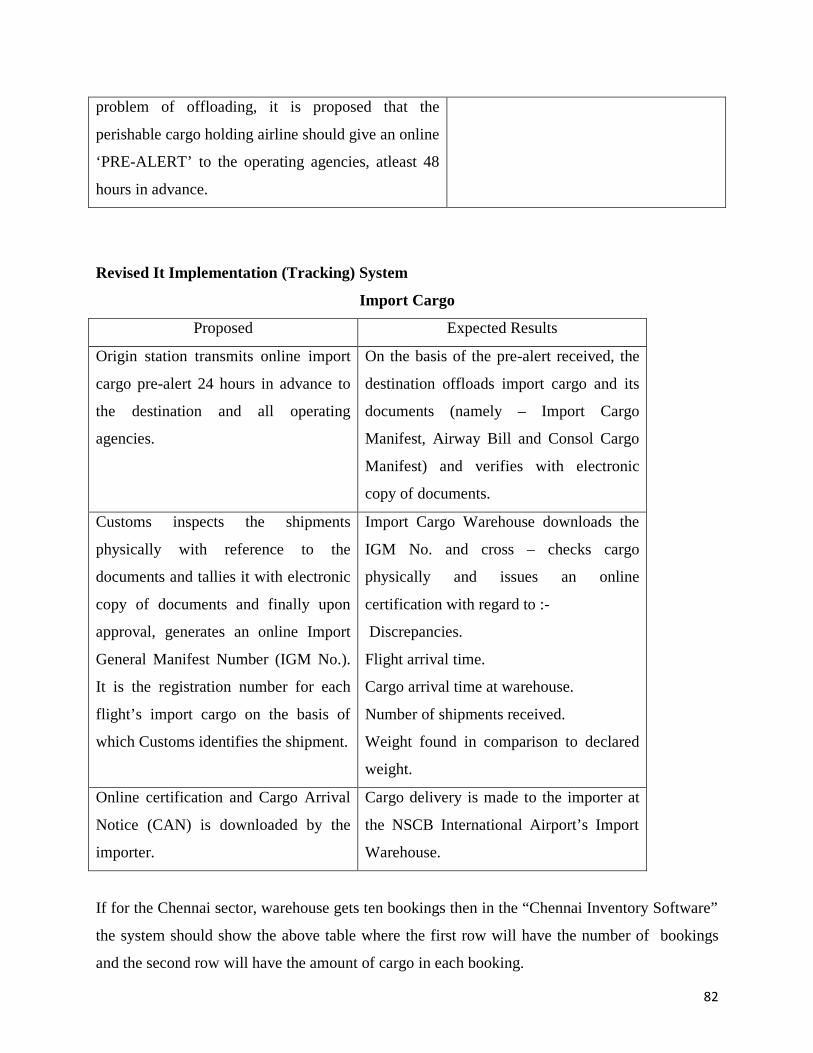
82
problem of offloading, it is proposed that the
perishable cargo holding airline should give an online
‘PRE-ALERT’ to the operating agencies, atleast 48
hours in advance.
Revised It Implementation (Tracking) System
Import Cargo
Proposed Expected Results
Origin station transmits online import
cargo pre-alert 24 hours in advance to
the destination and all operating
agencies.
On the basis of the pre-alert received, the
destination offloads import cargo and its
documents (namely – Import Cargo
Manifest, Airway Bill and Consol Cargo
Manifest) and verifies with electronic
copy of documents.
Customs inspects the shipments
physically with reference to the
documents and tallies it with electronic
copy of documents and finally upon
approval, generates an online Import
General Manifest Number (IGM No.).
It is the registration number for each
flight’s import cargo on the basis of
which Customs identifies the shipment.
Import Cargo Warehouse downloads the
IGM No. and cross – checks cargo
physically and issues an online
certification with regard to :-
Discrepancies.
Flight arrival time.
Cargo arrival time at warehouse.
Number of shipments received.
Weight found in comparison to declared
weight.
Online certification and Cargo Arrival
Notice (CAN) is downloaded by the
importer.
Cargo delivery is made to the importer at
the NSCB International Airport’s Import
Warehouse.
If for the Chennai sector, warehouse gets ten bookings then in the “Chennai Inventory Software”
the system should show the above table where the first row will have the number of bookings
and the second row will have the amount of cargo in each booking.
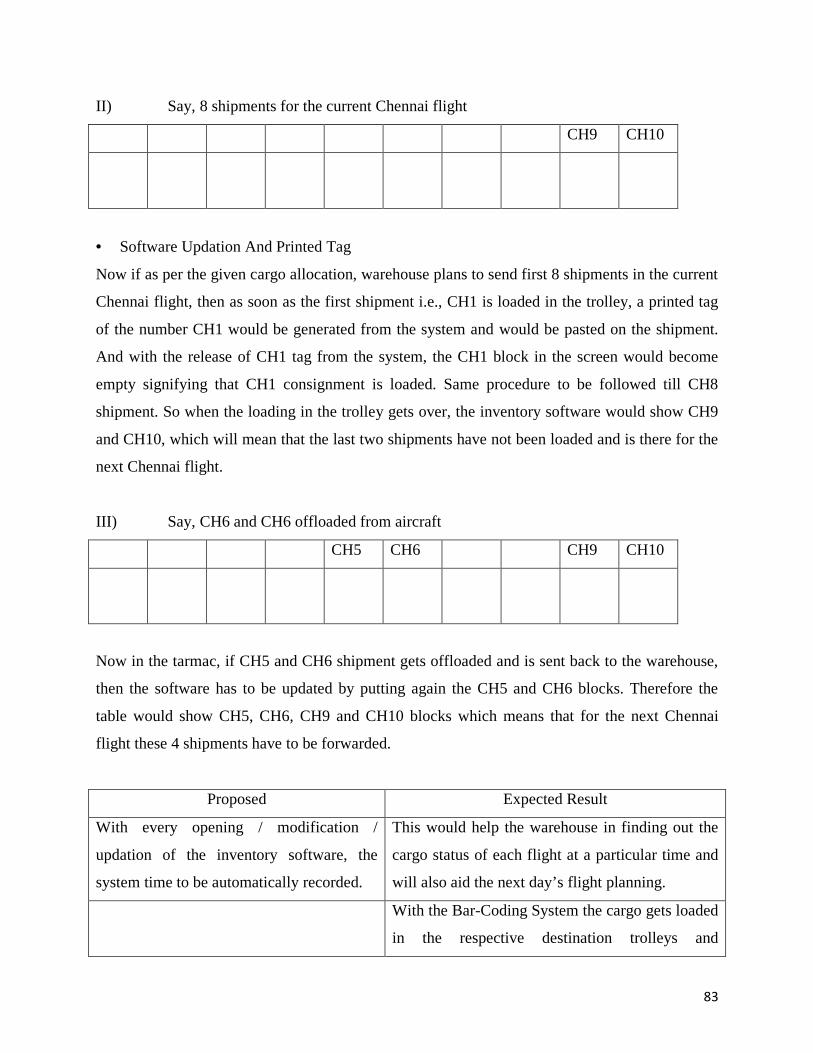
83
II) Say, 8 shipments for the current Chennai flight
CH9 CH10
• Software Updation And Printed Tag
Now if as per the given cargo allocation, warehouse plans to send first 8 shipments in the current
Chennai flight, then as soon as the first shipment i.e., CH1 is loaded in the trolley, a printed tag
of the number CH1 would be generated from the system and would be pasted on the shipment.
And with the release of CH1 tag from the system, the CH1 block in the screen would become
empty signifying that CH1 consignment is loaded. Same procedure to be followed till CH8
shipment. So when the loading in the trolley gets over, the inventory software would show CH9
and CH10, which will mean that the last two shipments have not been loaded and is there for the
next Chennai flight.
III) Say, CH6 and CH6 offloaded from aircraft
CH5 CH6 CH9 CH10
Now in the tarmac, if CH5 and CH6 shipment gets offloaded and is sent back to the warehouse,
then the software has to be updated by putting again the CH5 and CH6 blocks. Therefore the
table would show CH5, CH6, CH9 and CH10 blocks which means that for the next Chennai
flight these 4 shipments have to be forwarded.
Proposed Expected Result
With every opening / modification /
updation of the inventory software, the
system time to be automatically recorded.
This would help the warehouse in finding out the
cargo status of each flight at a particular time and
will also aid the next day’s flight planning.
With the Bar-Coding System the cargo gets loaded
in the respective destination trolleys and

84
subsequently in the aircraft.
Plugging the Discrepancies
Proposed Expected Results
50% of discrepancies occur at origin station warehouse
and 50% occur at origin station’s tarmac. To overcome
it, the electronic pre-alert system at origin should cover
all discrepancy points. Each point will have an open and
close system. Before releasing the cargo from
warehouse to tarmac, the 50% of the discrepancy points
(of warehouse) to be closed. Since average flight ground
time is 40 minutes, after 30 minutes at the tarmac, the
tarmac personnel to confirm warehouse in wireless to
close the tarmac discrepancy points i.e., rest 50%.
Moment the whole system is
closed, there is no chance of
discrepancy at the destination.
Types Of Discrepancies Place Where Discrepancy Occurs
Airwaybill received without cargo Origin warehouse / tarmac
Cargo received without airwaybill Origin warehouse / tarmac
Airwaybill and cargo both not received Origin warehouse / tarmac
Manifest showing wrong airwaybill number Origin warehouse
Excess landing Origin warehouse
Short landing Origin warehouse / tarmac
Misrouted cargo Origin warehouse / tarmac
Damage Tarmac
Wrong airwaybill number sticker on cargo Origin warehouse
Missing / Theft / Pilferage Tarmac
Overcarry Tarmac
Proposed Results of Implementing Revised Tracking System
Saving Of Compensation Due It Implementation
With the implementation of IT systems, it is expected that the discrepancies and other
operational failures occurring due to the present faulty system would be plugged then and there
and the compensations which were made to the customers until now would be saved
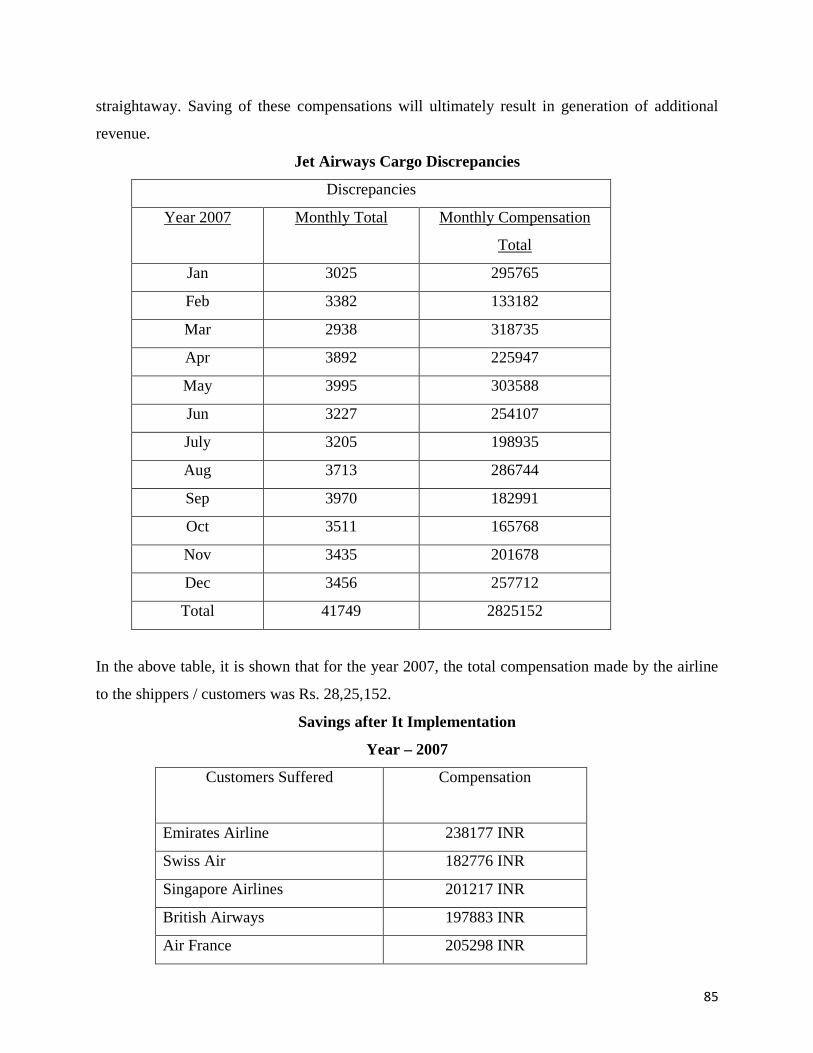
85
straightaway. Saving of these compensations will ultimately result in generation of additional
revenue.
Jet Airways Cargo Discrepancies
Discrepancies
Year 2007 Monthly Total Monthly Compensation
Total
Jan 3025 295765
Feb 3382 133182
Mar 2938 318735
Apr 3892 225947
May 3995 303588
Jun 3227 254107
July 3205 198935
Aug 3713 286744
Sep 3970 182991
Oct 3511 165768
Nov 3435 201678
Dec 3456 257712
Total 41749 2825152
In the above table, it is shown that for the year 2007, the total compensation made by the airline
to the shippers / customers was Rs. 28,25,152.
Savings after It Implementation
Year – 2007
Customers Suffered Compensation
Emirates Airline 238177 INR
Swiss Air 182776 INR
Singapore Airlines 201217 INR
British Airways 197883 INR
Air France 205298 INR

86
UPS 200419 INR
Kuwait Airways 195637 INR
KLM Cargo 201116 INR
Royal Jordanian 193771 INR
Lufthansa Cargo 202422 INR
Etihad Crystal Cargo 198608 INR
Gulf Air 203391 INR
Thai Airways 199873 INR
Qatar Airways 204564 INR
TOTAL : 28,25,152 INR©
©Rs. 28,25,152 is the total compensation amount that would be saved after the implementation
of Information Technology in warehousing operations. In the previous table ( viz., Jet Airways
Cargo Discrepancies for Year 2007), it is realized that a compensation of Rs. 28,25,152/- was
made by Jet Airways in 2007 due to the occurrence of various types of discrepancies. In the
above table , the break-up of customers who suffered due to the discrepancies vis-à-vis their
respective compensation amount for the year 2007 is mentioned.
With the proposed implementation of Revised IT Cargo Tracking System, it is expected that the
said compensation of Rs. 28,25,152/- would be saved straightaway by overcoming the
discrepancies and that the discrepancies would be plugged at the point of occurrence itself.
Conclusion
The study in its course has identified the major loopholes in the cargo operations of Jet Airways
which resulted in loss of business for the airline. On the basis of it, a IT enabled automated
tracking system is suggested to overcome not only the operational problems but also to eliminate
the compensations. The study also has devised remedies to stop the offloadings, which otherwise
creates a negative impact in the market and suggested ways to plug the discrepancies at the point
of occurrence itself. The work recommends the flight-wise aircraft series planning and allocation
based on the load so that there is minimal space wastage and /or offloading. The research
proposes to incorporate automated Bar-Coding System to keep track of each cargo shipment for
the respective destination sectors.
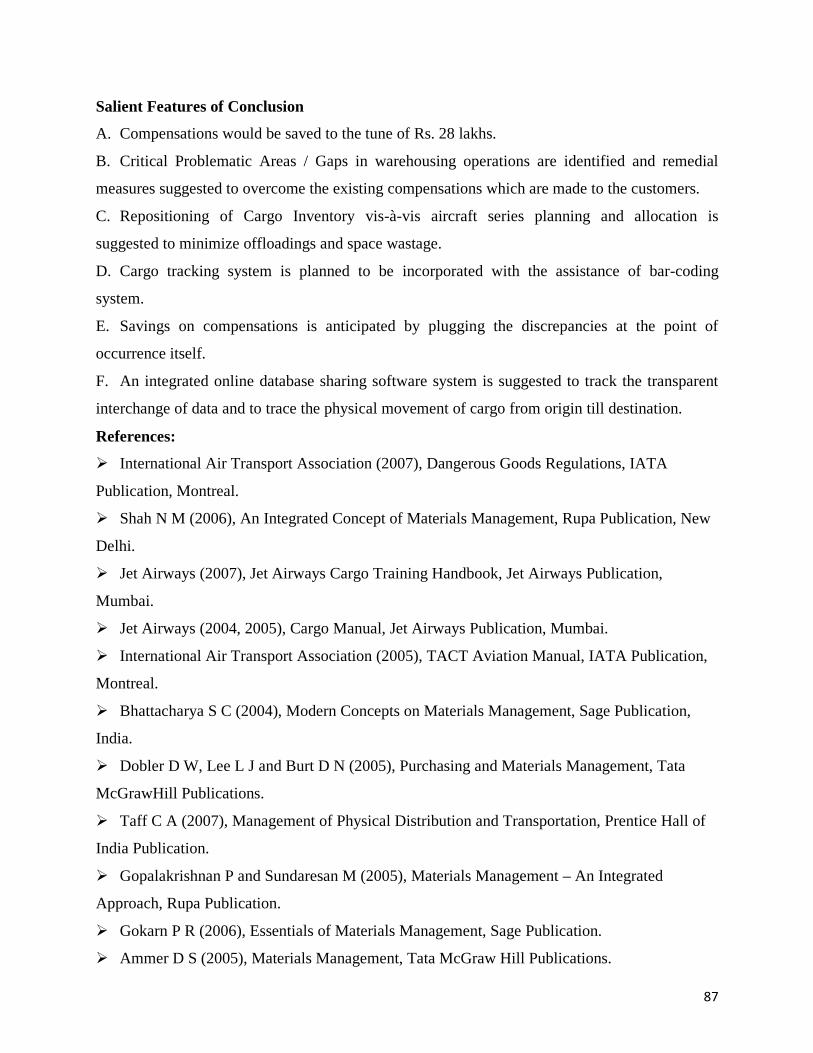
87
Salient Features of Conclusion
A. Compensations would be saved to the tune of Rs. 28 lakhs.
B. Critical Problematic Areas / Gaps in warehousing operations are identified and remedial
measures suggested to overcome the existing compensations which are made to the customers.
C. Repositioning of Cargo Inventory vis-à-vis aircraft series planning and allocation is
suggested to minimize offloadings and space wastage.
D. Cargo tracking system is planned to be incorporated with the assistance of bar-coding
system.
E. Savings on compensations is anticipated by plugging the discrepancies at the point of
occurrence itself.
F. An integrated online database sharing software system is suggested to track the transparent
interchange of data and to trace the physical movement of cargo from origin till destination.
References:
International Air Transport Association (2007), Dangerous Goods Regulations, IATA
Publication, Montreal.
Shah N M (2006), An Integrated Concept of Materials Management, Rupa Publication, New
Delhi.
Jet Airways (2007), Jet Airways Cargo Training Handbook, Jet Airways Publication,
Mumbai.
Jet Airways (2004, 2005), Cargo Manual, Jet Airways Publication, Mumbai.
International Air Transport Association (2005), TACT Aviation Manual, IATA Publication,
Montreal.
Bhattacharya S C (2004), Modern Concepts on Materials Management, Sage Publication,
India.
Dobler D W, Lee L J and Burt D N (2005), Purchasing and Materials Management, Tata
McGrawHill Publications.
Taff C A (2007), Management of Physical Distribution and Transportation, Prentice Hall of
India Publication.
Gopalakrishnan P and Sundaresan M (2005), Materials Management – An Integrated
Approach, Rupa Publication.
Gokarn P R (2006), Essentials of Materials Management, Sage Publication.
Ammer D S (2005), Materials Management, Tata McGraw Hill Publications.

88
REVELATION
The Research Journal of K. P. B. Hinduja College
(Published in June and December Every Year)
Subscription Form
Yearly Subscription:
Institutional: Rs. 500 for two issues Individual: Rs. 400/ for two issues
Foreign Annual: US $30/ for two issues
I /We herewith enclose a DD/Cheque for Rs. ____________________________towards
Subscription for 1Year, 2Years, 3Years
Name______________________________________________________________
Educational Institution/ Company ________________________________________
Address ____________________________________________________________
City:____________________________Pin_____________ Country____________
E-mail Address ___________________________________
Phone No. ______________
Send your payments by Demand Draft in favour of K.P.B. Hinduja College of Commerce
payable at Mumbai, India to
The Principal
Revelation
K.P.B. Hinduja College of Commerce,
315, New Charni Road, Mumbai 400 004.
Ph. 022 4098 90 00 Fax : 022 2385 93 97.
Email: [email protected]
89
Guidelines for Contributors
1. All articles received by the Journal will first be reviewed by the Editor and then referred
to the Advisors. The decision of the advisors will be final.
2. The soft copies of the paper typed in MS Word format ‘Times Roman’ font, and Font
Size 12 should be sent to the Executive Editor through Email.
The E-mail address of the Executive Editor: [email protected]
3. The maximum length of the articles should be restricted to 3000 words including tables,
chart and references. Foot notes and end notes should preferably be avoided.
4. All articles should be typed in 1 ½ spacing on A4 sized paper.
5. A declaration by the authors stating that the article is their original work and has neither
been published nor been submitted for publication elsewhere should accompany the
article.
6. The first page should include the following:
a. Title of the article
b. Name of the author
c. Designation and the name of the educational institution where employed
d. Complete address for communication
e. E-mail address of all the authors
7. Tables and Charts should appear in the paper wherever relevant. All tables and charts
should be numbered serially.
8. An article should end with a conclusion summarizing the findings of the paper.
9. References:
The author should provide complete references, numbered, at the end, of the article with
necessary information as in the specimen:
Articles: Kamenta J (1967), “On Estimation of the CES Production Function” International
Economic Review, Vol. 8, No.2, pp. 180-189.
Books: Bhatia B S and Batra G S (2003), Entrepreneurship and Small Business
Management, Deep and Deep Publications Pvt. Ltd., New Delhi.
10. The articles published in the Journal are the property of the College and it shall not be
published in full or in part without written permission from the College.

90
Related Documents