POPULATION REFERENCE BUREAU March 2008 Vol. 63, No. 1 n In 2005, 62 million migrants from less developed countries moved to more developed countries. n The number of international migrants in more developed countries more than doubled between 1985 and 2005, from almost 55 million to 120 million. n Those who cross national borders usually move to nearby countries. Managing Migration: The Global Challenge by Philip Martin and Gottfried Zürcher

Welcome message from author
This document is posted to help you gain knowledge. Please leave a comment to let me know what you think about it! Share it to your friends and learn new things together.
Transcript

POPULATION REFERENCE BUREAU
March 2008Vol. 63, No. 1
n In 2005, 62 million migrants from less developed countries moved to more developed countries.
n The number of international migrants in more developed countries more than doubled between 1985 and 2005, from almost 55 million to 120 million.
n Those who cross national borders usually move to nearby countries.
Managing Migration: The Global Challenge by Philip Martin and Gottfried Zürcher

Population Reference BureauThe Population Reference Bureau informs people around the world about population, health, and the environment, and empowers them to use that information to advance the well-being of current and future generations.
OfficersFrancis L. Price, Chair of the Board
President and Chief Executive Officer, Q3 Stamped Metal, Inc. and Q3 JMC Inc., Columbus, OhioTerry D. Peigh, Vice Chair of the Board
Senior Vice President, Managing Director, The Interpublic Group of Companies, New YorkWilliam P. Butz, President and Chief Executive Officer
Population Reference Bureau, Washington, D.C.Faith Mitchell, Secretary of the Board
Vice President for Program and Strategy, Grantmakers in Health, Washington, D.C.Montague Yudelman, Assistant Secretary of the Board
Senior Fellow, World Wildlife Fund, Washington, D.C.Richard F. Hokenson, Treasurer of the Board
Director, Hokenson and Company, Lawrenceville, New Jersey
TrusteesGeorge Alleyne, Director Emeritus, Pan American Health Organization/World Health Organization, Washington, D.C.Wendy Baldwin, Director, Poverty, Gender, and Youth Program, The Population Council, New YorkJoel E. Cohen, Abby Rockefeller Mauzé Professor of Populations, Rockefeller University and Head,
Laboratory of Populations, Rockefeller and Columbia Universities, New YorkJames H. Johnson Jr., William Rand Kenan Jr. Distinguished Professor and Director,
Urban Investment Strategies Center, University of North Carolina, Chapel HillWolfgang Lutz, Professor and Leader, World Population Project, International Institute for Applied
Systems Analysis and Director, Vienna Institute of Demography of the Austrian Academy of Sciences, Vienna, AustriaElizabeth Maguire, President and Chief Executive Officer, Ipas, Chapel Hill, North CarolinaGary B. Schermerhorn, Managing Director of Technology, Goldman, Sachs & Company, New YorkLeela Visaria, Independent Researcher, Ahmedabad, India
Marlene Lee, Population Bulletin Editor; Senior Policy Analyst, Domestic Programs
Sandra Yin, EditorBecca Gurney, Design and Production
The Population Bulletin is published four times a year and distributed to members of the Population Reference Bureau. Population Bulletins are also available for $7 each (discounts for bulk orders). To become a PRB member or to order PRB materials, contact PRB, 1875 Connecticut Ave., NW, Suite 520, Washington, DC 20009-5728; Tel.: 800-877-9881; Fax: 202-328-3937; E-mail: [email protected]; Website: www.prb.org.
The suggested citation, if you quote from this publication, is: Philip Martin and Gottfried Zürcher, “Managing Migration: The Global Challenge” Population Bulletin 63, no.1 (2008). For permission to reproduce portions from the Population Bulletin, write to PRB, Attn: Permissions; or e-mail: [email protected].
Cover photo: © Mark Henley/PANOS
© 2008 Population Reference Bureau. All rights reserved. ISSN 0032-468X
Printed on recycled paper PRINTED WITHSOY INK
TM

www.prb.org 1
Introduction ............................................................................................................................................... 3
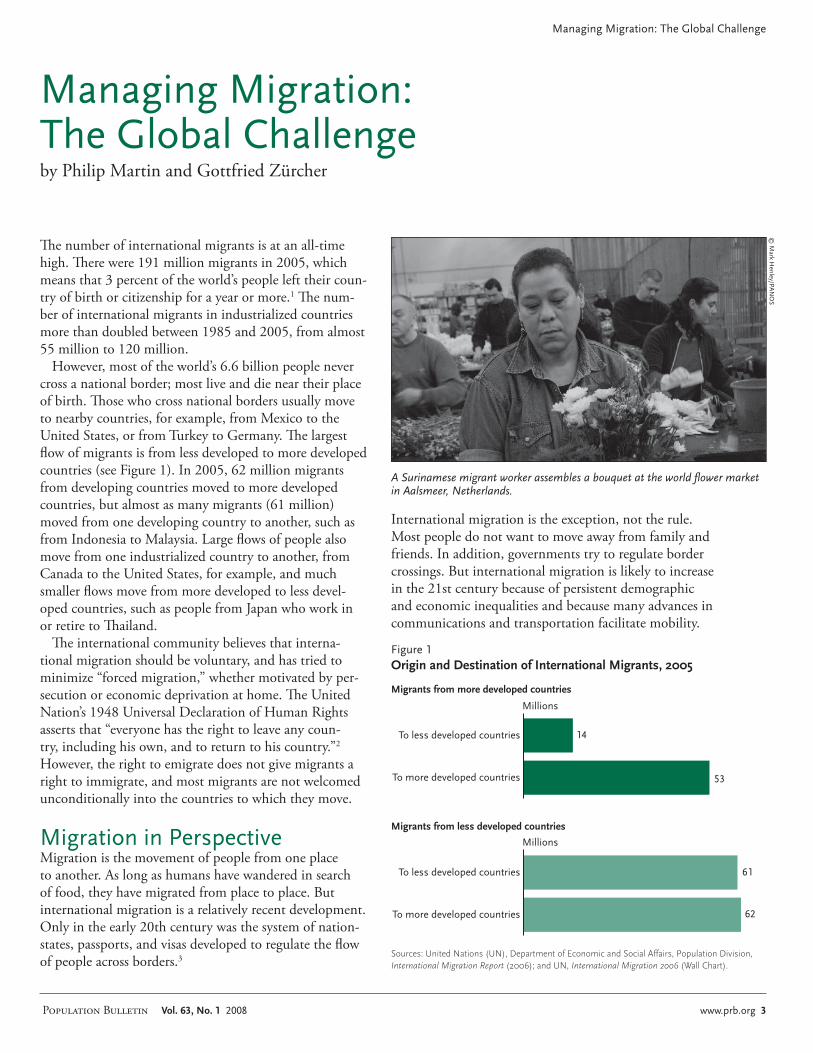
Figure 1. Origin and Destination of International Migrants, 2005 ............................................ 3
Migration in Perspective ........................................................................................................................... 3
Why People Migrate .................................................................................................................................. 4
Table 1. Factors That Encourage Migration by Type of Migrant ................................................ 4
Effects of Globalization.............................................................................................................................. 5
Figure 2. World Population by Continent, 1750 to 2050 .............................................................. 6
Figure 3. Economically Active Population, 1985 to 2015 ............................................................. 7
Regional Migration Trends ........................................................................................................................ 7
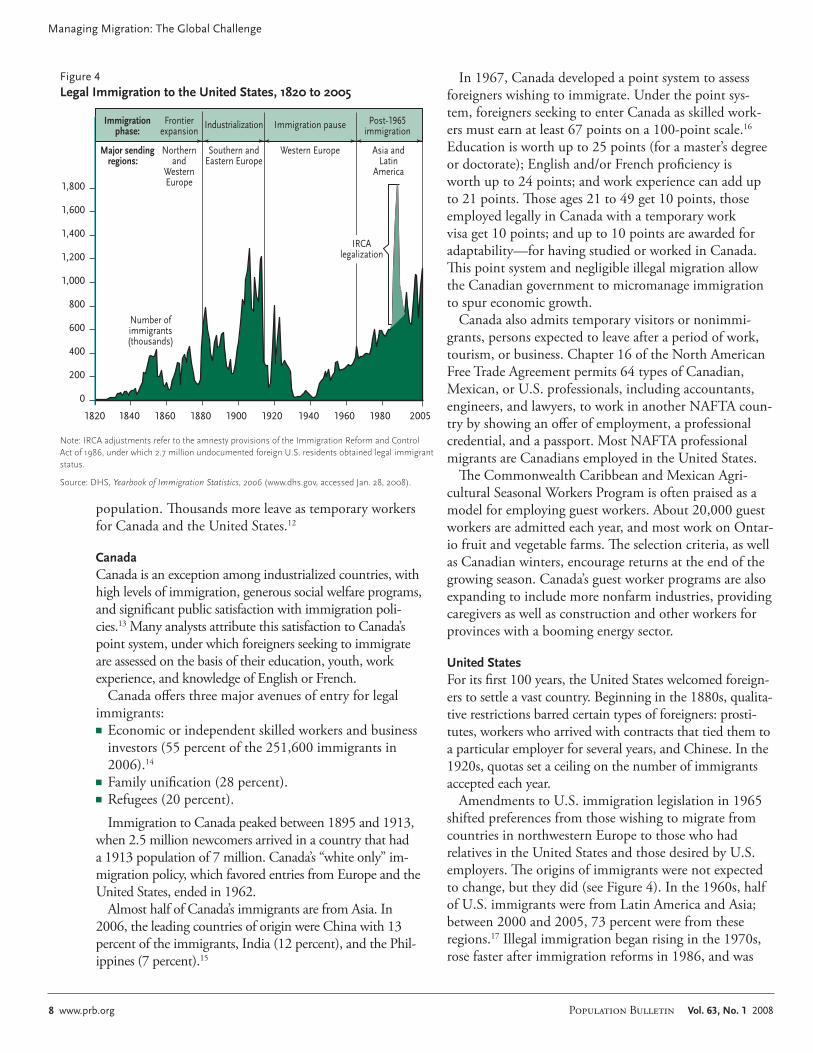
Figure 4. Legal Immigration to the United States, 1820 to 2005................................................. 8
Table 2. Immigration Status of Foreigners in the United States by Category, 2004 to 2006 .............................................................................................. 9
Figure 5. Status of Foreign-Born U.S. Residents, 2006 ............................................................... 9
Table 3. Foreigners and Foreign Workers in Western Europe, 2005 ........................................ 12
Table 4. Immigration Required to Avoid Population Decline in Europe, 2000 to 2050 .............................................................................................. 13
Reducing Unwanted Migration ............................................................................................................... 16
Box 1. Refugees and Asylum Seekers..................................................................................... 17
Remittances ............................................................................................................................................. 18
Figure 6. Remittances to Less Developed Countries, 2000 to 2006 .......................................... 18
Managing Migration ................................................................................................................................ 19
References ................................................................................................................................................ 19
Suggested Resources .............................................................................................................................. 20
March 2008Vol. 63, No. 1
Managing Migration: The Global Challenge

Managing Migration: The Global Challenge
2 www.prb.org Population Bulletin Vol. 63, No. 1 2008
About the Authors
Philip Martin studied labor economics and agricultural economics at the University of Wisconsin-Madison, where he earned his Ph.D. in 1975. He is professor of agricultural economics at the University of California-Davis (UCD), chair of the University of California’s Comparative Immigration and Integration Program, and editor of Migration News, a monthly summary of current migration developments.
Martin has published extensively on farm labor, labor migration, economic development, and immigration issues. He testifies before the U.S. Congress and state and local agencies on these issues, and provides assistance to other countries, for which he was awarded UCD’s Distinguished Public Service award in 1994.
Gottfried Zürcher is director general of the International Center for Migration Policy Development in Vienna, which is supported by 30 European governments to improve migration management.
The authors thank Jeanne Batalova and Veronika Bilger for reviewing this publication. This Population Bulletin is based in part on Philip Martin and Jonas Widgren, “International Migration: Facing the Challenge,” Population Bulletin 57, no. 1 (2002).
© 2008 by the Population Reference Bureau. All rights reserved.
Managing Migration: The Global Challenge
Population Bulletin Vol. 63, No. 1 2008 www.prb.org 3
The number of international migrants is at an all-time high. There were 191 million migrants in 2005, which means that 3 percent of the world’s people left their coun-try of birth or citizenship for a year or more.1 The num-ber of international migrants in industrialized countries more than doubled between 1985 and 2005, from almost 55 million to 120 million.
However, most of the world’s 6.6 billion people never cross a national border; most live and die near their place of birth. Those who cross national borders usually move to nearby countries, for example, from Mexico to the United States, or from Turkey to Germany. The largest flow of migrants is from less developed to more developed countries (see Figure 1). In 2005, 62 million migrants from developing countries moved to more developed countries, but almost as many migrants (61 million) moved from one developing country to another, such as from Indonesia to Malaysia. Large flows of people also move from one industrialized country to another, from Canada to the United States, for example, and much smaller flows move from more developed to less devel-oped countries, such as people from Japan who work in or retire to Thailand.
The international community believes that interna-tional migration should be voluntary, and has tried to minimize “forced migration,” whether motivated by per-secution or economic deprivation at home. The United Nation’s 1948 Universal Declaration of Human Rights asserts that “everyone has the right to leave any coun-try, including his own, and to return to his country.”2 However, the right to emigrate does not give migrants a right to immigrate, and most migrants are not welcomed unconditionally into the countries to which they move.
Migration in PerspectiveMigration is the movement of people from one place to another. As long as humans have wandered in search of food, they have migrated from place to place. But international migration is a relatively recent development. Only in the early 20th century was the system of nation-states, passports, and visas developed to regulate the flow of people across borders.3
International migration is the exception, not the rule. Most people do not want to move away from family and friends. In addition, governments try to regulate border crossings. But international migration is likely to increase in the 21st century because of persistent demographic and economic inequalities and because many advances in communications and transportation facilitate mobility.
Figure 1Origin and Destination of International Migrants, 2005
Sources: United Nations (UN), Department of Economic and Social Affairs, Population Division, International Migration Report (2006); and UN, International Migration 2006 (Wall Chart).
�� ��
��
��
��
��
Millions
To more developed countries
To less developed countries
��
��
��
Millions
Migrants from less developed countries
Migrants from more developed countries
To more developed countries
To less developed countries
© M
ark Henley/PA
NO
S
A Surinamese migrant worker assembles a bouquet at the world flower market in Aalsmeer, Netherlands.
Managing Migration: The Global Challenge by Philip Martin and Gottfried Zürcher

Managing Migration: The Global Challenge
4 www.prb.org Population Bulletin Vol. 63, No. 1 2008
Borders proliferated over the last century, sometimes plac-ing legal and administrative boundaries between extended families, friends, and trading partners where there were none before. There were 193 generally recognized nation-states in 2000, more than four times the 43 in 1900.4 Each nation-state distinguishes citizens and foreigners; uses border controls to inspect those seeking entry; and determines what foreigners can do while inside the coun-try, whether they are tourists, students, guest workers, or immigrants.
Most countries discourage immigration—they do not welcome the arrival of foreigners who wish to settle and become naturalized citizens. Some also discourage emigration. This was the situation in communist nations as symbolized by the Berlin Wall, which was used to deter crossing from East to West Germany between 1961 and 1989. Today, North Korea continues to prevent its citi-zens from leaving the country.
Five major countries plan for the arrival of immigrants: the United States, which accepted 1.2 million immigrants in 2006; Canada, which accepted 250,000; Australia 125,000; New Zealand 50,000; and Israel 25,000.5 In-dustrialized countries had planned to accept 1.5 million immigrants a year. The number of newcomers arriving in these countries each year exceeds the number planned, suggesting that many are temporary visitors or unauthor-ized foreigners who find ways to settle rather than new-comers who enter explicitly as potential new citizens.
Perspectives on the rising number of migrants can be framed by two extremes. At one extreme, organizations ranging from the Catholic Church to the World Bank have called for more migration, arguing that people should not be confined to their countries of birth by national borders and that more migration would speed
economic growth and development in both sending and receiving countries.
At the other extreme, in virtually every industrialized country, organizations are demanding sharp reductions in immigration. In the United States, the Federation for American Immigration Reform (FAIR) argues that un-skilled newcomers hurt low-skilled U.S. workers, have negative environmental effects, and threaten established U.S. cultural values. Political parties in many European countries have called for reducing immigration at one time or another. For example, during the 1995 French presi-dential campaign, the National Front in France proposed removing up to 3 million non-Europeans from France in order to reduce the number of Muslim residents.6
Amid regular reports of migrants dying in deserts and drowning at sea, some experts consider international migration unmanageable, with migrants scaling or tun-neling under the walls intended to keep them out. The late President Houari Boumedienne of Algeria made an appeal for more foreign aid for the Group of 77 develop-ing countries, warning that if industrialized countries did not provide more foreign aid, “No quantity of atomic bombs could stem the tide of billions … who will some day leave the poor southern part of the world to erupt into the relatively accessible spaces of the rich northern hemisphere looking for survival.”7
The first step toward making migration manageable is to understand why people migrate. Most people do not want to cross national borders, and even though the number of migrants is at an all-time high, international migration is still low relative to the 97 percent of the world’s residents who did not migrate. Furthermore, economic growth can turn emigration nations into destinations for migrants, as it did for Ireland, Italy, and Korea. The challenge is to manage migration by reducing the differences that encourage people to cross borders, while taking into account how investment, remittances, and aid can stimulate economic develop-ment and reduce migration pressures in the countries that migrants leave.
Why People MigrateInternational migration is usually a carefully consid-ered individual or family decision. The major reasons to migrate to another country can be grouped into two categories: economic and noneconomic (see Table 1). The factors that encourage a migrant to actually move fall into three categories: demand-pull, supply-push, and net-works. An economic migrant may be encouraged to move by employer recruitment of guest workers, or demand-pull reasons. Migrants crossing borders for noneconomic
Table 1Factors That Encourage Migration by Type of Migrant
Type of migrant Demand-pull Supply-push Network/other
EconomicLabor recruitment (guest workers)
Unemployment or underemployment; low wages (farmers whose crops fail)
Job and wage information flows
NoneconomicFamily unification (family members join spouse)
Fleeing war and persecution (dis-placed persons and refugees/asylum seekers)
Communications; transportation; assistance organizations; desire for new experience/adventure
Note: All three factors may encourage a person to migrate. The importance of pull, push, and net-work factors can change over time.
Source: P. Martin and J. Widgren, International Migration: Facing the Challenge (2002): table 1.
Factors

Managing Migration: The Global Challenge
Population Bulletin Vol. 63, No. 1 2008 www.prb.org 5
reasons may be moving to escape unemployment or persecution, or supply-push factors.
A worker in rural Mexico may decide to migrate to the United States because a friend or relative tells him of a job. In this case, the availability of higher wage jobs is a demand-pull factor. The same worker may not have a reg-ular job at home or may face debts from a family mem-ber’s medical emergency, and these supply-push factors also encourage emigration. For this worker, a network of friends and relatives already played a role by providing information on jobs and wages in the United States. This network and others pave the way at many points during the migration process. Networks encompass everything from moneylenders who provide the funds needed to pay a smuggler for help crossing the border to employers or friends and relatives at the destination who help migrants find jobs and places to live.
Demand-pull, supply-push, and network factors rarely exert equal pressure in an individual migration decision, and their importance can change over time. Generally, demand-pull and supply-push factors are strongest at the beginning of a migration flow, and network factors become more important as a migration stream matures.
The first migrant workers are often recruited, beginning the migration flow. In the 1940s, for instance, the U.S. government sent recruiters to rural Mexico to fill jobs on U.S. farms. Migrants returned with savings, encouraging more people to seek U.S. jobs and fueling unauthorized migration. After this migration stream had been estab-lished, network factors ranging from settled friends and relatives to the expectation that men, particularly young ones, should “go north for opportunity” sustained migra-tion between rural Mexico and rural America after the Mexico-U.S. Bracero program ended in 1964. A similar process played out in Western Europe: After governments stopped recruiting Turks and other southern European workers from 1973 to 1974, more arrived to unify fami-lies or to seek asylum.
One of the most important noneconomic motivations for crossing national borders is family unification. In such cases, the immigrant in the destination country is a demand-pull factor for family migration. Spouses and children join the immigrant first and may be followed by parents and brothers and sisters, in so-called chain migration.
Globalization has made people everywhere aware of conditions and opportunities abroad. Tourism has be-come a major industry, as people cross national borders to experience new cultures, different weather, or the wonders of nature. Many young people find a period of foreign study or work experience enriching. In some cases, former colonies have become independent nations, but traditional migration patterns persist, with a continuing
flow from India and Pakistan to the United Kingdom and from the Philippines to the United States.
Immigration policies aim to facilitate wanted migration, such as tourism, and to deter unwanted migrants, includ-ing those who arrive on tourist visas and do not depart as scheduled. However, it is often hard for inspectors at ports of entry to distinguish between, for instance, a legitimate tourist and a potential unauthorized worker. Most coun-tries require visas from foreigners wishing to enter and maintain consulates abroad to screen potential visitors to determine if they are truly tourists or students who intend to return home. At many U.S. consulates around the world, most applicants for tourist visas are rejected.
Effects of Globalization Globalization has increased links between countries, as evidenced by sharply rising flows of goods and capital over national borders and the growth of international and regional bodies that regulate such movements. However, controlling the entry and stay of people is a core element of national sovereignty, and flows of people are not governed by a comprehensive global migration regime. Most nation-states do not welcome newcomers as immigrants, but almost all of the industrialized or high-income countries have guest worker programs that allow local employers to recruit and employ foreign workers. These countries also attract signifi-cant numbers of unauthorized or irregular migrant workers.
Most of the world’s people are in developing countries, as is most population growth. The world’s population, which reached 6 billion in October 1999, is growing by 1.3 percent or 80 million a year, with 97 percent of the growth in developing countries. In the past, significant demographic differences between areas prompted large-scale migration. For example, Europe had 21 percent of the world’s almost 1 billion residents in 1800 and the Americas had 4 percent. When there were five Europeans for every American, millions of Europeans emigrated to North and South America in search of economic oppor-tunity as well as religious and political freedom.
Will history repeat itself? Africa and Europe have roughly equal populations today, but by 2050, Africa is projected to have three times more residents (see Figure 2, page 6). If Africa remains poorer than Europe, the two continents’ diverging demographic trajectories may propel young people from overcrowded cities such as Cairo and Lagos to move to Berlin and Rome.
Two types of economic differences encourage inter-national migration: inequality between countries and inequality within a country. The world’s almost 200 nation-states have per capita incomes that range from less than $250 per person per year to more than $50,000, a

Managing Migration: The Global Challenge
6 www.prb.org Population Bulletin Vol. 63, No. 1 2008
difference that provides a significant incentive for people, especially young adults, to migrate for higher wages and more opportunities.
Uneven geographic distribution in the growth of the world’s labor force is another dimension of economic inequality between nation-states that adds to international migration pressures. The world’s labor force of 3.1 bil-lion in 2005 included 600 million workers in the more developed countries and 2.4 billion in the less developed countries (see Figure 3). Almost all labor force growth is projected to be in the lower-income countries: The work force in these countries is projected to increase by about 425 million between 2005 and 2015, while the labor force in higher-income countries is projected to remain stable.
Income inequality within a country may also contribute to international migration. In lower-income countries, 40 percent of workers are employed in agriculture, a sector in which workers’ earnings are often lower than average. Low farm wages and incomes provide an added incentive for farm workers and farmers to migrate to urban areas, where wages, incomes, and opportunities are better. This migra-tion is one reason the urban share of the world’s population surpassed 50 percent for the first time in 2008.8
Industrialized countries had “great migrations” off the land in the past, providing workers for expanding factories, fueling population growth in cities, and adding to emi-gration pressures. Similar migrations are underway today in countries from China to Mexico, and this rural-urban migration has three implications for international migra-tion. First, ex-farmers and farm workers are most likely to
accept 3-D (dirty, dangerous, difficult) jobs inside their countries or abroad. Second, rural-urban migrants often make physical as well as cultural transitions, and many find the transition as easy abroad as at home. Many Mexi-cans, for example, find adapting to Los Angeles as easy as navigating Mexico City. Third, as rural-urban migrants get one step closer to the country’s exits, it is usually easier to obtain visas and documents for legal migration in the cities or to make arrangements for illegal migration.
Demographic and economic differences encourage migration, but it takes networks or links between areas to support actual moves. Migration networks include communication factors that enable people to learn about opportunities abroad, the migration infrastructure that actually transports migrants over national borders, and the rights regime that allows them to remain abroad. These networks have been shaped and reinforced by three major transformations in the past half-century: the com-munications, transportation, and rights revolutions.
The communications revolution helps potential mi-grants learn about opportunities abroad. The best infor-mation comes from migrants established abroad, since they can provide family and friends with understandable information. Cheaper communications help migrants quickly transmit job information and advice on how to cross national borders. For example, friends and fam-ily in rural Mexico may hear about California farm jobs before people living in nearby cities with unemployment rates of more than 20 percent hear the news. Meanwhile, films and television programs depicting life in high-income countries may encourage people, particularly the young, to assume that migration will inevitably lead to economic betterment.
One major benefit of the transportation revolution has been the declining cost of travel. With today’s relatively low transportation costs, traveling anywhere in the world legally typically costs less than $2,500. Getting smuggled into a country may cost up to $20,000. Most studies sug-gest faster payback times for migrants today than in the past, so that even migrants who pay high smuggling fees can usually repay them within two or three years.
While the communications and transportation revolu-tions help migrants to learn about opportunities and to cross national borders, the human rights revolution affects their ability to stay. After World War II, most indus-trialized countries strengthened the constitutional and political rights of people within their borders to prevent a recurrence of fascism, and most granted social or eco-nomic rights to residents in their evolving welfare states without distinguishing between citizens and migrants.
As migration increased in the 1990s, some Euro-pean countries and the United States began to roll
Figure 2World Population by Continent, 1750 to 2050
*Projected.
Source: United Nations, The World at Six Billion (1999): table 2.
�
�
�
�
�
��Oceania
Northern America
Latin America & Caribbean
Africa
Europe
Asia
����*������������������������
■ Oceania■ North America■ Latin America & Caribbean■ Africa■ Europe■ Asia
Billions

Managing Migration: The Global Challenge
Population Bulletin Vol. 63, No. 1 2008 www.prb.org 7
back socioeconomic rights for migrants in an effort to manage migration. For example, in the early 1990s, more than 1,000 foreigners a day applied for asylum in Germany. The government distributed them throughout the country and required local communities to provide housing and food. But, when Germans discovered that more than 90 percent of these foreigners did not need protection, there was a backlash that included attacks on foreigners.
After World War II, many European governments put liberal asylum provisions into their postwar constitutions to prevent another situation in which refugees perish because other countries return them to a country that persecutes them, as happened in Nazi Germany. With the strain caused by increased migration, the German government responded in three ways. First, it required asylum seekers from countries such as Turkey to obtain visas, allowing prescreening. Second, it imposed fines on airlines that brought foreigners to Germany without visas and other documents. Third, Germany and other Euro-pean Union (EU) countries agreed to make it difficult for foreigners from “safe” countries or who transited through safe countries en route to Germany to apply for asylum.9 In this way, the constitutional protection of asylum was maintained, but making it harder to apply reduced the number of asylum applicants.
The United States pursued a similar strategy of restrict-ing migrant rights in order to reduce the number of migrants entering the country. The 1993 North Ameri-can Free Trade Agreement (NAFTA) was expected to speed up economic and job growth in Mexico, reducing Mexico-U.S. migration. Instead, Mexico-U.S. migration surged during a recession, prompting California voters in 1994 to approve Proposition 187, which would have denied unauthorized foreigners access to state-funded services. A federal judge stopped implementation of Proposition 187, but some of its provisions were included in 1996 federal immigration reforms.
Proposition 187 led to a national debate over im-migrant numbers and rights, especially access to social assistance. President Bill Clinton argued that the number of needy migrants should be reduced in order to con-tinue giving legal immigrants access to welfare benefits. Employers argued that a better solution would allow immigration to remain at high levels but reduce access to social assistance.10 Employers won, so immigration remained high and welfare benefits were curbed. But benefits to poor children and elderly immigrants were restored during the economic boom of the late 1990s.
Balancing migrant numbers and migrant rights is a major challenge. Countries with the highest shares of migrants in their labor forces, such as the oil-exporting
countries in the Persian Gulf, tend to extend few rights to migrants—it is very hard for a guest worker to win immi-grant status and naturalize in Saudi Arabia or the United Arab Emirates. Countries with relatively fewer guest workers, such as Sweden and other Scandinavian coun-tries, tend to grant more rights to foreigners. The trade-off is apparent in World Trade Organization negotiations, where some developing countries argue that their migrant “service providers” should not have to earn the minimum wage in the destination country. Requiring payment of a minimum wage, they reason, will reduce the number of migrant workers.11
Regional Migration TrendsMost people who cross national borders do not go far, so most international migration occurs within regions. This section reviews the most notable migration flows in the major world regions.
North and South AmericaThe North American migration system includes the world’s major emigration and immigration destinations, whether defined in absolute numbers or by per capita rates: 300,000 to 400,000 Mexicans move each year to the United States, and Canada aims to increase its popu-lation by 1 percent a year through immigration. Canada and the United States represent about 5 percent of the world’s population but receive over half of the world’s anticipated immigrants. Emigration rates from many Caribbean nations are high. Jamaica, with 2.7 million residents, loses about 27,000 a year, 1 percent of its
Figure 3Economically Active Population, 1985 to 2015
*Projected.
Source: International Labor Office, Laborsta Database (http://laborsta.ilo.org/, accessed Jan. 22, 2008).
2015
2010
2005
1995
1985
Less DevelopedMore DevelopedWorld
�.�
�.�
�.��.�
�.�
�.� �.� �.� �.� �.�
�.�
�.�
�.�
�.��.�
■ ���� ■ ���� ■ ���� ■ ����* ■ ����* Billions
Managing Migration: The Global Challenge
8 www.prb.org Population Bulletin Vol. 63, No. 1 2008
population. Thousands more leave as temporary workers for Canada and the United States.12
CanadaCanada is an exception among industrialized countries, with high levels of immigration, generous social welfare programs, and significant public satisfaction with immigration poli-cies.13 Many analysts attribute this satisfaction to Canada’s point system, under which foreigners seeking to immigrate are assessed on the basis of their education, youth, work experience, and knowledge of English or French.
Canada offers three major avenues of entry for legal immigrants: nEconomic or independent skilled workers and business
investors (55 percent of the 251,600 immigrants in 2006).14
nFamily unification (28 percent).nRefugees (20 percent).
Immigration to Canada peaked between 1895 and 1913, when 2.5 million newcomers arrived in a country that had a 1913 population of 7 million. Canada’s “white only” im-migration policy, which favored entries from Europe and the United States, ended in 1962.
Almost half of Canada’s immigrants are from Asia. In 2006, the leading countries of origin were China with 13 percent of the immigrants, India (12 percent), and the Phil-ippines (7 percent).15
In 1967, Canada developed a point system to assess foreigners wishing to immigrate. Under the point sys-tem, foreigners seeking to enter Canada as skilled work-ers must earn at least 67 points on a 100-point scale.16 Education is worth up to 25 points (for a master’s degree or doctorate); English and/or French proficiency is worth up to 24 points; and work experience can add up to 21 points. Those ages 21 to 49 get 10 points, those employed legally in Canada with a temporary work visa get 10 points; and up to 10 points are awarded for adaptability—for having studied or worked in Canada. This point system and negligible illegal migration allow the Canadian government to micromanage immigration to spur economic growth.
Canada also admits temporary visitors or nonimmi-grants, persons expected to leave after a period of work, tourism, or business. Chapter 16 of the North American Free Trade Agreement permits 64 types of Canadian, Mexican, or U.S. professionals, including accountants, engineers, and lawyers, to work in another NAFTA coun-try by showing an offer of employment, a professional credential, and a passport. Most NAFTA professional migrants are Canadians employed in the United States.
The Commonwealth Caribbean and Mexican Agri-cultural Seasonal Workers Program is often praised as a model for employing guest workers. About 20,000 guest workers are admitted each year, and most work on Ontar-io fruit and vegetable farms. The selection criteria, as well as Canadian winters, encourage returns at the end of the growing season. Canada’s guest worker programs are also expanding to include more nonfarm industries, providing caregivers as well as construction and other workers for provinces with a booming energy sector.
United StatesFor its first 100 years, the United States welcomed foreign-ers to settle a vast country. Beginning in the 1880s, qualita-tive restrictions barred certain types of foreigners: prosti-tutes, workers who arrived with contracts that tied them to a particular employer for several years, and Chinese. In the 1920s, quotas set a ceiling on the number of immigrants accepted each year.
Amendments to U.S. immigration legislation in 1965 shifted preferences from those wishing to migrate from countries in northwestern Europe to those who had relatives in the United States and those desired by U.S. employers. The origins of immigrants were not expected to change, but they did (see Figure 4). In the 1960s, half of U.S. immigrants were from Latin America and Asia; between 2000 and 2005, 73 percent were from these regions.17 Illegal immigration began rising in the 1970s, rose faster after immigration reforms in 1986, and was
Figure 4Legal Immigration to the United States, 1820 to 2005
Note: IRCA adjustments refer to the amnesty provisions of the Immigration Reform and Control Act of 1986, under which 2.7 million undocumented foreign U.S. residents obtained legal immigrant status.
Source: DHS, Yearbook of Immigration Statistics, 2006 (www.dhs.gov, accessed Jan. 28, 2008).
Major sendingregions:
Northernand
WesternEurope
Southern andEastern Europe
Western Europe Asia andLatin
America
Immigrationphase:
Frontierexpansion
Industrialization Immigration pause Post-����immigration
Number ofimmigrants(thousands)
�
���
���
���
���
�,���
�,���
�,���
�,���
�,���
���� ���� ���� ���� ���� ���� ���� ���� ���� ����
IRCAlegalization

Managing Migration: The Global Challenge
Population Bulletin Vol. 63, No. 1 2008 www.prb.org 9
the first major immigration issue debated in Congress in the 21st century.
Foreigners enter the United States through a front door for legal permanent immigrants, a side door for legal temporary migrants, and a back door for the unauthor-ized (see Table 2). About two-thirds of legal immigrants are family-sponsored, which means that family members in the United States asked the government to admit their relatives. There are no limits on the number of immigrant visas available for immediate relatives of U.S. citizens, and 580,000 were admitted in 2006. There is a cap on the number of immigrant visas available to relatives of permanent residents and more distant relatives of U.S. citizens. Only 222,000 were admitted in 2006, resulting in long waits for visas. For example, in 2008, Mexican spouses of U.S. immigrants will need to wait six years for immigrant visas, and adult brothers and sisters in Mexico of U.S. citizens face a 13-year wait.18
Legal temporary migrants are foreigners who come to the United States to visit, work, or study. There are no limits on most types of temporary visitors; the United States is willing to accept more than the 30 million tourists and business visitors who arrived in 2006. Temporary foreign students and workers are more controversial. After the terrorist attacks of Sept. 11, 2001, the U.S. government required foreign students to undergo personal interviews before receiving visas to study in the United States and to pay a fee to support a database that tracks them while they are studying there.
Guest workers receive visas that tie them to a U.S. employ-er and specify how long they can stay. H-1B visa holders, for example, have at least a college degree and fill jobs that
normally require a college degree. They can stay up to six years and “adjust” to regular immigrant status if their U.S. employer deems them uniquely qualified to fill the job.
The number of guest workers admitted doubled in the 1990s and almost doubled again to nearly 400,000 in 2004, as Congress raised the cap at the request of high-tech firms.19 The annual cap on the number of H-1B visas available has now reverted to 65,000, but employers want far more. Critics of the H-1B program say that the easy availability of H-1B visas has discouraged Ameri-can citizens from studying and working in science and engineering fields.20
Unauthorized foreigners are persons in the United States in violation of U.S. immigration laws. Demo-grapher Jeff Passel estimated 11.5 million unauthorized foreigners in the United States in 2006, with the num-ber increasing by 770,000 a year.21 Of the 38.1 million foreign-born U.S. residents, 34 percent were naturalized U.S. citizens, 35 percent legal immigrants and temporary visitors, and 31 percent unauthorized (see Figure 5). Over half of the unauthorized foreigners entered the United States by evading border controls, while 45 percent en-tered legally but did not leave when required.22
MexicoMost Latin American countries send more people abroad than they receive as immigrants. Mexico is Latin Amer-ica’s major emigration country, sending up to 500,000 people (half of its net population increase) to the United States. Most made unauthorized entries. Mexico is also a transit country for Central Americans en route to the United States.
Figure 5Status of Foreign-Born United States Residents, 2006
Source: J. Passel, “U.S. Immigration Trends: A Focus on U.S. Agriculture and Califor-nia” (2008 presentation).
Naturalized U.S. citizens
Temporary Legal
Legal Permanent Residents
Unauthorized
Unauthorized��%
Temporary legal �%
Naturalized U.S. citizens
��%
Legal permanent residents
��%
Table 2Immigration Status of Foreigners in the United States, by Category, 2004 to 2006
Category2004
(thousands)2005
(thousands)2006
(thousands)Legal immigrants 958 1,122 1,266
Immediate relatives of U.S. citizens 418 436 580Other family-sponsored immigrants 214 213 222Employment-based 155 247 159Refugees and asylees 370 460 381Diversity and other immigrants 99 83 88Estimated emigration 308 312 316
Legal temporary migrants 30,781 32,003 33,667Pleasure/business 27,396 28,510 29,929Foreign students (F-1 visas)* 613 621 694Temporary foreign workers* 676 726 821
Illegal immigrationApprehensions 1,264 1,291 1,207Removals or deportations 189 203 —Unauthorized foreigners** 770 770 770
*Excludes their spouses and children. **Annual average based on estimated unauthorized entries between 2000 and 2006.
Sources: DHS, 2006 Yearbook of Immigration Statistics: tables 6, 26, and 35; and J. Passel, “U.S. Immigration Trends: A Focus on U.S. Agriculture and California” (2008 presentation).

Managing Migration: The Global Challenge
10 www.prb.org Population Bulletin Vol. 63, No. 1 2008
The Mexican and U.S. governments have taken several steps to reduce Mexico-U.S. migration. NAFTA lowered trade and investment barriers between Canada, Mexico, and the United States, and one hoped-for side effect was faster economic and job growth in Mexico that would reduce Mexico-U.S. migration.
In fact, workers displaced in Canada and in the United States tended not to migrate to Mexico, but some of the Mexicans displaced as a result of freer trade mi-grated to the United States. Mexico-U.S. migration was accelerated in the mid-1990s by an economic crisis in Mexico and in the late 1990s by an economic boom in the United States.
In 2000, Mexican President Vicente Fox made improv-ing conditions for Mexicans in the United States his top foreign policy priority. Calling Mexican migrants “heroes” for their remittances, Fox asked the U.S. government to approve broad immigration reform in 2001: the legaliza-tion of unauthorized Mexicans, a new and large-scale guest worker program, cooperation to reduce border vio-lence, and an exemption for Mexico from the U.S. cap on the number of immigrant visas available for each country. Shortly after Fox discussed these proposed changes with President Bush, the terrorist attacks of Sept. 11, 2001, prompted tighter immigration rules.
Central America, the Caribbean, and South AmericaThe seven countries of Central America, with 40 million residents, sent few immigrants to the United States until civil wars erupted in the mid-1980s. Fighting displaced tens of thousands of Guatemalans, Nicaraguans, and Salvadorans, many of whom found their way to the United States. The U.S. government initially granted asylum to Nicaraguans, who were fleeing a government the United States opposed, but not to Guatemalans and Salvadorans, who were fleeing governments the United States supported. Resulting lawsuits eventually allowed most Central Americans in the United States an oppor-tunity to become immigrants.23 Natural disasters, such as Hurricane Mitch in Honduras and Nicaragua in 1998 and earthquakes in El Salvador in 2001, led the U.S. government to grant unauthorized Central Americans in the United States “temporary protected status” so they could work legally and send home remittances to help in rebuilding.
The 15 independent Caribbean nations and dependen-cies have 40 million residents and some of the world’s highest emigration rates. The largest four are Cuba, the Dominican Republic, Haiti, and Jamaica. At least 10 percent of those born in these countries now live in the United States. For example, there are 1 million Cuban-born U.S. residents, and Cubans continue to
arrive as legal immigrants as well as illegally in small boats. Under the “wet-foot, dry-foot policy,” if Cubans are intercepted at sea, they are returned to Cuba, but if they reach U.S. land, they can stay as immigrants. Most Cuban immigrants have settled in South Florida, where their business and political success have helped turn Mi-ami into a gateway to Latin America.24
Dominican immigrants are concentrated in New York City, and network ties are so strong that half of the residents of the Dominican Republic have relatives in the United States.25 Haiti shares the island of Hispaniola with the Dominican Republic. Fleeing the poorest country in the Western Hemisphere, Haitians migrate to the neighboring Dominican Republic as well as to the United States.26 In order to reduce the outmigration of Haitians, the U.S. government threatened military intervention in 1994 to restore to power the elected president, Jean-Bertrand Aristide. Aristide regained the presidency, but the economy continued to flounder, prompting some Haitians to continue to attempt the 720-mile trip by boat to Florida.
Jamaicans have been migrating to the United Kingdom and the United States for decades, both as temporary workers and immigrants.
Today, some descendents of Europeans and Japanese who emigrated to South America are returning to their ancestral countries of origin. For example, economic turmoil in Argentina prompted some of the descendants of immigrants from Italy and Spain to move to these countries, and several hundred thousand ethnic Japanese Brazilians and Peruvians have moved to Japan. Colombia and Ecuador are major sources of migrants to Spain, and ever-strengthening networks promise more emigrants from these countries.
EuropeEurope has traditionally been a source of immigrants, with over 60 million people leaving between 1820 and 1914.27 War and the creation of new nation-states prompted migration within Europe during the first half of the 20th century, including the exchange of Greeks and Turks in the 1920s and the migration of Germans to West Germany after World War II. Many also migrated between overseas provinces and their colonial powers, such as Algeria and France, and between colonies and mother countries, such as India and Pakistan and the United Kingdom.
Western European nations such as France and Germany recruited guest workers in the 1960s to fill jobs producing goods for export. The need for foreign workers, first from Italy and other southern European countries and later from countries that ranged from Morocco to Turkey, was

Managing Migration: The Global Challenge
Population Bulletin Vol. 63, No. 1 2008 www.prb.org 11
supposed to be short-lived. However, with undervalued currencies spurring investment by Europeans and Ameri-cans, employers from Volkswagen to Renault asked for more guest workers, and governments complied. Some guest workers settled and formed or unified families, lead-ing to the aphorism: “Nothing is more permanent than temporary workers.”28
From 1973 to 1974, guest worker recruitment stopped in the wake of a recession attributed to oil price hikes. However, European governments did not force guest workers to leave, even if they lost their jobs and were collecting social welfare benefits. Instead, France and Germany offered “departure bonuses” to encourage settled migrants who lost their jobs to leave, but most migrants knew that economic conditions were even worse at home and thus elected to stay. European nations today are struggling to integrate these guest workers and their children. High unemployment rates among these foreign residents—often twice the overall rate—make many Eu-ropeans reluctant to see immigration rise.
In 2007, the EU comprised 27 of the more than 40 countries of Europe, and about two-thirds of Europe’s 730 million people. A core principle of the EU is “freedom of movement,” meaning that an EU national may travel to another EU member state and live, study, or work on an equal basis with native-born residents. For example, a French worker who applies for a job at Volkswagen in Ger-many must be treated just like a German applicant, and can complain if a private employer discriminates in favor of local workers. Public-sector jobs, however, can be restricted to residents born in the country.
Relatively few EU nationals move from one country to another, although an increasing number of northern Europeans are retiring in southern European countries such as Spain and Portugal. More young people are studying outside their country of citizenship as curricula are standardized and teaching in English spreads. The EU added 10 member states in Central Europe in 2004, and Bulgaria and Romania joined in 2007. However, the “old” EU-15 countries, such as France and Germany, that earlier recruited guest workers and got unanticipated settlers, have been reluctant to allow Poles, Czechs, and Romanians freedom of movement to seek jobs.
Most foreigners in EU countries are from outside the EU, from countries such as Morocco, the former Yugosla-via, and Turkey. Some of these non-EU countries, includ-ing Croatia and Turkey, could become EU member states, which would give their nationals freedom-of-movement rights immediately or after a transition period. Fears of too much migration have complicated Turkey’s accession negotiations. Turkey applied for EU entry in 1987, was rebuffed in 1989, and has reapplied.
If allowed entry, Turkey, a country of 74 million, would be the most populous EU member state by 2015, when a growing Turkey would surpass a shrinking Germany. Turkey’s high unemployment rate also raises concern that a possible new wave of migrants might prove hard to em-ploy if Turkey were to join the EU. Some 2 million Turks worked in Western European countries in the 1960s and 1970s, and many stayed. Today, about 3.5 million Turks live in Western Europe, two-thirds in Germany. These Turks, their children, and grandchildren have high unemployment rates, and many have not learned Ger-man. Fears that Turkish-speaking ghettos could become a source of Islamic fundamentalism complicate Turkey’s bid to join the EU. On the other hand, many Turks who migrated to northern Europe have become successful, opening businesses that employ Germans and getting elected to local, state, and federal offices.
The EU Commission believes that opening new chan-nels to work in Europe could further discourage illegal migration. It has proposed a blue-card program under which highly skilled non-EU foreign professionals, such as computer programmers from India and health care workers from Africa, could enter a European country, work, and eventually settle.
Both the commission and individual countries are developing “mobility partnership agreements” with particular countries that send migrants. Under these agreements, a country such as Senegal agrees to police its harbors to discourage migrants from leaving in small boats for Spain’s Canary Islands, and Spain admits several thousand Senegalese to work legally for a year or two. Spain and Italy have signed mobility partner-ship agreements with countries ranging from Albania to Senegal, and the EU opened a job center in Mali in 2007 to provide information on jobs available to legal workers in Europe. More Africans want to migrate than there are legal jobs available for them in Europe, so it is not clear if the agreements and job centers will add to or cut illegal migration.
The EU’s approach to a common immigration policy is illustrated by its rules governing foreigners settled in a particular EU country and border-free travel. EU nationals can move to any other EU country to live and work, but non-EU nationals cannot move from one EU country to another until they have been a legal resident for at least five years. For example, Turkish residents of Germany cannot move to France until they have lived in Germany legally for at least five years.
In 1999, the Amsterdam Treaty required that new EU member states adopt border control rules that allow freedom of movement across internal borders between EU member states. These states must also

Managing Migration: The Global Challenge
12 www.prb.org Population Bulletin Vol. 63, No. 1 2008
follow a common set of rules for checks at borders between EU and non-EU states. The treaty effectively expanded the free-travel zone established between the Benelux Economic Union (Netherlands, Belgium, Luxembourg), Germany, France, Italy, Spain, Portu-gal, Greece, Austria, Denmark, Finland, and Sweden, under the 1985 Schengen Agreement and the 1990 Schengen Convention. The agreement led to a com-mon system for issuing visas and a database that includes information on people that the EU member countries want to exclude.29 Ireland and the United Kingdom, already EU members in 1999 and not signa-tories of the Schengen agreements, still enforce border controls with other EU member states.
Germany had the most foreign residents of any EU member in 2005, some 6.8 million, followed by France with 3.3 million (in 1999), the United Kingdom with 3 million, and Italy and Spain with 2.7 million each (see Table 3). Luxembourg had the highest percentage of foreigners among residents—40 percent—followed by Switzerland with 20 percent and Austria with 10 percent.
The European population is aging and shrinking. The EU today has four workers for each retiree. By 2050, the ratio is projected to be two workers per retiree. In order to finance the retirement of such a large cohort of retirees, EU countries will have to reduce pension benefits or encourage more people to work longer. Other alternatives are to increase the number of workers, either by increas-ing fertility or immigration. Most European countries make payments to families with children, and these poli-cies are credited with keeping fertility near replacement
level (2.1 children per woman, on average) in France and Scandinavia. Other European countries are increasing child payments in a bid to boost fertility.
Immigration would have to be very high to stave off population decline in countries such as Italy (see Table 4). The UN Population Division estimated the number of immigrants that various countries would have to admit to maintain their 1995 populations, labor forces, and ratios of younger to older persons.
The Big Four EU countries (France, Germany, Italy, and the United Kingdom) received about 88 percent of the EU’s immigrants in 1995. To maintain their 1995 populations at current fertility rates, immigration would have to triple, from 237,000 a year to 677,000 a year; immigration to Italy would have to increase over 42 times its mid-1990s level. To maintain their 1995 labor forces, the Big Four would have to increase immigration to 1.1 million a year, and to “save social security” or maintain the ratio of persons 18 to 64 years old to persons 65 and older, immigration would have to increase 37-fold, to almost 9 million a year, including 2.3 million a year to Italy.
Opinion polls suggest that most Europeans do not wel-come more immigration.30 EU nations currently receive 300,000 to 500,000 legal newcomers a year, including returning citizens, family members of settled foreigners, guest workers, and asylum applicants. In addition, up to 500,000 unauthorized foreigners enter the EU annually, though not all remain as residents. Any suggestion to in-crease current immigration flows or legalize unauthorized foreigners tends to produce strong political opposition from EU nationals.31
Opposition to immigration and legalization of unau-thorized immigrants is also strong in Russia, the most populous European country with 142 million residents. Although the population in Russia is shrinking by about 700,000 a year, most Russians do not welcome immigra-tion as a way to stop the decrease. Ease of movement among the Commonwealth of Independent States (CIS) that were part of the Soviet Union and higher wages in Russia draw migrants from CIS to Russia. Workers from Moldova and Tajikistan earn up to 10 times more in con-struction and service jobs in Moscow and other Russian cities than they would at home. Responses to this migra-tion stream have included both anti-migrant movements and efforts to legalize migrants.
Asia Asia, home to 60 percent of the world’s people, is a major source of immigrants for countries in North America. People also migrate within Asia, usually as guest workers expected to leave after two years. Thai workers migrate
Table 3Foreigners and Foreign Workers in Western Europe, 2005
Foreign population
(thousands)
Percent of total
population
Foreign labor force
(thousands)
Percent of total labor
forceAustria 802 10 418 12Belgium 901 9 435 9Denmark 270 5 109 4France 3,263 6 1,456 5Germany 6,756 9 3,823 9Ireland 259 6 102 6Italy 2,671 5 1,479 6Luxembourg 181 40 196 63Netherlands 691 4 288 3Norway 222 5 159 7Spain 2,739 6 1,689 8Sweden 480 5 216 5Switzerland 1,512 20 830 21United Kingdom 3,035 5 1,504 5
Note: Data for foreign population in France are for 1999. Data for foreign labor force in Ire-land, 2002; Italy, 2003; and Sweden, 2004.
Source: Organisation for Economic Co-operation and Development, International Migration Outlook (2007): tables A.15 and A2.3.

Managing Migration: The Global Challenge
Population Bulletin Vol. 63, No. 1 2008 www.prb.org 13
to Taiwan to fill construction jobs, for example, and Filipinos work as domestic helpers in Hong Kong and Saudi Arabia. Significant rural-urban migration also oc-curs within countries. In 2001, 130 million Chinese lived outside the places they were registered. Most had moved east from villages in the interior to cities and coastal provinces.32
Policy reforms in the mid-1960s in Canada and the United States eased entry for Asian professionals. They were joined in the United States by 1 million Southeast Asian refugees after the Vietnam War ended in 1975. Asians continue to emigrate to traditional immigration countries, and many go abroad to study, with some set-tling there after graduation.
Asia includes some of the world’s most rapidly aging nations and leading countries of emigration. In the fu-ture, migration may match labor demand in one country with supply in another. However, Asian nations vary widely in their policies toward migrants.
Japan and KoreaJapan and South Korea are homogenous and largely closed societies where most low-skilled foreign workers have been students and trainees or unauthorized entrants. Japan has debated whether to open itself to unskilled foreign workers, but has not yet done so, while Korea introduced a migrant-worker system in 2004.
Japan’s 2005 census reported 770,000 foreign workers, or 1.3 percent of the labor force. The largest group is Ko-reans who have been living in Japan for decades, followed by 240,000 descendants of ethnic-Japanese emigrants to South America. These Portuguese-speaking Japanese are concentrated in the small factories that often supply parts to Toyota and other major firms. The second-largest group is mostly Chinese trainees, 140,000 in 2007, with
three-year contracts that tie them to a particular employer and often pay them only half the minimum wage. Finally, there are foreign professionals, including Americans working for Japanese multinationals and Filipina en-tertainers. An estimated 200,000 unauthorized foreign workers live in Japan.
The number of Japanese ages 15 to 64 (working age) was 85 million in 2005, but is expected to fall to 72 million by 2025. Japan has shifted much of its pro-ductive capacity abroad to lower labor costs. To stabilize the population and labor force, Japan is debating whether to open itself to immigrants, to admit guest workers who would be expected to leave after several years, or to persuade Japanese workers to work longer and more productively.
Like Japan, South Korea introduced foreign workers as trainees to fill jobs in small and mid-sized firms offering so-called 3-D jobs, which are dirty, dangerous, and dif-ficult. However, high broker fees and sometimes abusive conditions led to runaways, since unauthorized workers could earn more than legal trainees. In 2004, the Employ-ment Permit System began to treat migrants who enter Korea legally with a work contract as workers entitled to the minimum wage. Many of the unauthorized migrants already in Korea were unwilling to return to their coun-tries of origin, pay broker fees and learn Korean, and return legally, so 200,000 were still unauthorized among the 910,000 foreigners in Korea at the end of 2006.
TaiwanTaiwan began to import migrant workers to help con-struct high-priority infrastructure projects in 1990, including highways and subways. Migrants soon spread to factories and later to private households as caregivers. By May 2007, the number of foreign workers in Taiwan hit a
Table 4Immigration Required to Avoid Population Decline in the European Union, 2000 to 2050
Immigrants, 1995
(thousands)Migrants
(thousands)Multiple of 1995
immigrationMigrants
(thousands)Multiple of 1995
immigrationMigrants
(thousands)Multiple of 1995
immigrationEU (15 countries)** 270 949 4 1,588 6 13,480 50Big 4 EU 237 677 3 1,093 5 8,884 37
France 7 29 4 109 16 1,792 256Germany 204 344 2 487 2 3,630 18Italy 6 251 42 372 62 2,268 378United Kingdom 20 53 3 125 6 1,194 60
Other EU (11 countries) 33 272 8 495 15 4,596 139United States 760 128 0 359 0 11,851 16
*Migrants needed to maintain 1995 population ratio of persons ages 15-64 to those ages 65 or older. **The EU-15 consists of Austria, Belgium, Denmark, Finland, France, Germany, Greece, Ireland, Italy, Luxembourg, Netherlands, Portugal, Spain, Sweden, and the United Kingdom.
Source: United Nations, “Replacement Migration: Is It a Solution to Declining and Aging Population?” (www.un.org, accessed May 7, 2001).
1995 population
Average annual number of migrants required from 2000-2050 to maintain:
1995 working-age population Population support ratio*

Managing Migration: The Global Challenge
14 www.prb.org Population Bulletin Vol. 63, No. 1 2008
record 347,000, and half were in service jobs. As foreign workers moved from one-time infrastructure projects to providing care for the elderly and children, the govern-ment promise of a “natural” end to migrant employment was lost. Migrants are entitled to at least Taiwan’s mini-mum wage of NT$15,840 (US$480) a month in 2007, but employers may deduct up to NT$4,000 a month for room and board, and most do.
Most of Taiwan’s migrants are from Thailand, the Philip-pines, and Vietnam. They often complain about the high fees brokers charge for arranging employment. The maxi-mum fee should be about a month’s wages for each year of a worker’s contract, but many migrants report paying much more, up to 30 percent of what they expect to earn in fees and interest charges. Because of these fees, which are deducted from the migrant’s pay, some migrants can earn more as unauthorized workers, so they run away from the employer to whom they have been assigned.
South and Southeast AsiaThe Philippines is the major labor exporter in Asia. According to the Philippine government, there are 83 million Filipinos at home and 8 million abroad; they re-mit, or send home, $1 billion a month, equivalent to 10 percent of the country’s gross domestic product (GDP). In recognition of the importance of migrants and their remittances to the economy, the Philippine president wel-comes returning migrants at Christmas in a Pamaskong Handog sa OFWs (“Welcome home overseas foreign workers”) ceremony.
One million Filipinos leave the country to work each year, including about 75 percent who fill jobs that range from domestic helper to driver to construction worker in countries from Saudi Arabia to Canada. The remaining 250,000 leave the country to work on the world’s ships.
Over half of the migrants leaving the Philippines are women, and some are vulnerable to abuse in the private households in which they work. Legislation now re-quires the government to protect migrants abroad. Also, in 2007, a new program required a minimum wage for Filipinas abroad.
Most migration in Asia involves workers moving from one country to another in the region for temporary employment. Migration of Asian workers closer to home is exemplified by the migration of more than 1 million Indonesian workers to Malaysia and more than 1 mil-lion Burmese to Thailand. In these cases, workers move from a poorer to a richer neighboring country, with all the countries involved classified as developing. Many of these migrants are unauthorized despite periodic efforts to legalize and manage these migrant worker flows. Today, the governments in both Malaysia and Thailand
are adopting stricter policies, with Malaysia’s paramili-tary force RELA checking for unauthorized migrants and some provincial governments in Thailand restricting the movement of migrants and their right to use cell phones.33
The Asian financial crisis of 1997 and 1998 began in Thailand, when foreigners stopped lending money. Unemployment rose sharply. To open up jobs for Thais, the Thai government announced a crackdown on unau-thorized foreign workers. The effort to substitute Thais for Burmese workers largely failed, as exemplified in rice milling. Thailand is a major rice exporter, and most of the workers who carry 100 kilogram bags of rice from the mills to trucks are Burmese migrants. After the govern-ment stopped allowing Burmese to work in rice mills in 1998, the Thai workers who replaced them complained that the bags were too heavy. The government suggested reducing the rice bags to 50 kilograms. Mill owners refused, and the Thai government allowed migrants from Burma, Cambodia, and Laos to continue working in rice mills and other economic sectors.
Most Asian nations assert that they are not countries of immigration—most do not invite foreigners to settle—and some do not welcome guest workers. Singapore and Hong Kong are the exceptions. Both encourage the im-migration of professionals and 30 percent of Singapore’s workers are foreigners.
Singapore welcomes foreign professionals and their families as settlers, but rotates unskilled migrant workers in and out of the country. Less-skilled migrants may not bring their families, and their employers pay a signifi-cant levy or tax on migrant wages to encourage them to hire Singaporean workers if they are available. Female migrants are subject to pregnancy tests and sent home if they become pregnant; marrying a Singaporean citizen does not guarantee a low-skilled migrant the right to settle in Singapore.
Hong Kong, the financial and supply-chain hub for mainland China, includes many professionals, both na-tive- and foreign-born, who hire domestic helpers, usually from the Philippines and Indonesia. These domestics were paid at least the minimum wage of HK$3,480 (US$446) a month in 2006, and given free room and board.34
India is both a source of migrants—sending millions of migrants abroad for every kind of job, from information technology specialists and doctors and nurses to con-struction workers and laborers—and a major receiver of migrants from Bangladesh, Bhutan, and Nepal. One-sixth of the workers from the Indian state of Kerala are believed to be working abroad, and their remittances help to give the 32 million residents in Kerala higher-than-average levels of education and health care.35

Managing Migration: The Global Challenge
Population Bulletin Vol. 63, No. 1 2008 www.prb.org 15
Middle EastThe Middle East, which stretches from Western Asia to North Africa, has witnessed some of the world’s largest population and labor flows in the past 50 years.
After oil prices rose in the 1970s, workers from Bangladesh to Egypt migrated to the Gulf states to fill the jobs created by higher oil revenues. After oil price hikes from 1973 to 1974, Gulf oil exporters turned to foreign contractors and workers to build infrastructure projects such as roads and bridges. Migrants from South and Southeast Asia—Indians, Pakistanis, Filipinos, and Indonesians—continue to dominate the private-sector work forces of these exporters. The demand for labor has shifted from construction to services, and from men to women. Despite efforts to “nationalize” Gulf work forces by prohibiting foreigners from filling some jobs, foreigners fill 90 percent or more of private-sector jobs.
By 2005, the Gulf Cooperation Council (Kuwait, Oman, Qatar, Saudi Arabia, and the United Arab Emirates) had 13 million foreigners among 36 million residents, including 6.5 million foreigners among the 25 million residents of Saudi Arabia. In part because these countries discourage women from working, fertility is high; half of the native-born population is under 18; and labor forces are growing by more than 3 percent a year, raising unemployment among young citizens. In the past, oil-rich governments guaranteed jobs to native-born residents, but rapid population growth has made this policy unsustainable.36 Instead, Saudi Arabia and other oil exporting countries have required that only some jobs be filled by the native-born.
Israel welcomes Jews to immigrate under the law of return. Immigration to Israel increased rapidly after 1989 with the opening of borders in Eastern Europe and the demise of the Soviet Union. Some 200,000 im-migrants arrived in 1990, a one-year surge of 4 percent over Israel’s population of 5 million residents. Many of the Jews who immigrated to Israel were well-educated professionals who helped to turn Israel into a high-tech center. Some then emigrated to the United States and Germany.
Israel occupied the West Bank and Gaza after wars in 1973 and 1976, and allowed Palestinian residents from these areas to commute to jobs in Israel. In the late 1980s, more than 100,000 Palestinians commuted daily to jobs in Israel. During the intifada that began in the late 1980s, Israel limited the number of commuting Pal-estinians to reduce terrorist incidents and began to allow migrants to enter from Thailand, Romania, and other countries to fill jobs once held by Palestinians.
AfricaIn 2006, Africa had one-seventh of the world’s popu-lation, one-fourth of the world’s nation-states, and one-quarter of the world’s 10 million refugees.37 Many national borders in Africa were drawn by colonial gov-ernments, so that nomadic tribes that continued their traditional migrations became international migrants after independence. The tribal structure of many African societies means that neighboring African countries some-times host refugees from each other. For example, there are Mauritanian refugees in Mali, and Malian refugees in Mauritania.
In 1994, Africa witnessed one of the world’s largest refugee movements in recent times, as 2 million Rwan-dans left their country. Some 500,000 mostly ethnic Tutsi residents were killed in a genocide organized by the Hutu government. When the Tutsi-led rebel army defeated the government’s military forces, Rwanda’s leaders fled, and encouraged Hutus to flee with them to avoid retaliation. Many of the Hutus later returned home, but in 2006, about 10 percent of the world’s refugees remained in the Great Lakes region in eastern Africa.38
Traditionally the richest country in its region, South Africa is a major destination for migrants south of the Sa-hara Desert. More than 200,000 migrants from Lesotho, Swaziland, and Mozambique were recruited to work in South African mines in the 1980s. These migrants were housed in barracks and rotated in and out of the coun-try. Apartheid ended in 1994, and the government of Nelson Mandela discouraged the recruitment of foreign miners. However, few South Africans wanted to move to remote areas and work in the mines. Instead, machines replaced miners.
The black-majority government was reluctant to deport unauthorized migrants who arrived from neighboring countries that had sheltered anti-apartheid activists, and at least 3 million arrived between 1994 and 2000.39 As unemployment among South Africans rose, attacks were made on foreigners in the cities, and opinion polls sug-gested that one-quarter of South Africans wanted immi-gration stopped. The South African government contin-ues to grapple with employers asking for easier entry for professionals, in part to replace those South Africans who emigrate, as well as the entry of unauthorized foreigners from neighboring countries such as Zimbabwe.
Oceania—Pacific Islands Oceania is the world’s least populous region, with 34 mil-lion people in 2006, including almost two-thirds in Aus-tralia. Australia and New Zealand welcome immigrants from around the world and permit freedom of movement between them under the Trans-Tasman Travel Agreement.

Managing Migration: The Global Challenge
16 www.prb.org Population Bulletin Vol. 63, No. 1 2008
The United Kingdom originally shipped criminals to Aus-tralia. Free British and European immigrants also arrived, and immigration peaked during the gold rush of 1851 to 1860. Australia encouraged immigration from Europe after World War II, but ended its so-called White Australian im-migration policy in 1971, easing the entry of Asians.
New Zealand’s immigration history is different. British settlers made a treaty with indigenous Maori in 1840. The number of Maori declined because of disease and warfare as the number of European settlers rose. New Zealand admits about 35,000 immigrants a year, increas-ing its population by almost 1 percent.
Both Australia and New Zealand select most of their immigrants using point systems that award individu-als points for youth, knowledge of English, skills, and previous work experience in the country. From 2005 to 2006, 17 percent of Australia’s immigrants were from the United Kingdom, followed by 14 percent from New Zealand and 8 percent each from India and China. From 2004 to 2005, 33 percent of New Zealand’s immigrants were from the United Kingdom, followed by China (10 percent), and South Africa and India at 7 percent each.40
Australia and New Zealand historically welcomed set-tlers, not guest workers. However, both countries have recently expanded their temporary-worker programs to admit both skilled and seasonal workers. Australia offers a visa that allows skilled foreign workers to remain up to four years. Both Australia and New Zealand have a pro-gram that allows people ages 18 to 30 to work seasonal jobs in agriculture.
Most Pacific islands have relatively few residents, often 200,000 to 400,000, and unusual migration issues. The Commonwealth of the Northern Mariana Islands (CNMI), a U.S. territory that sets its own immigration policies, includes only 44 percent CNMI natives, who are U.S. citizens. The other residents are guest workers from China, the Phillippines, and other Asian countries. The CNMI government permits Chinese and other firms to establish garment shops on the island, to import women to sew clothes, and to then send the clothes to the United States with “Made in the USA” labels.41
Global warming that causes ocean levels to rise might lead to emigration from many Pacific islands, including Kiribati, the Marshall Islands, and Tuvalu. Each of these island nations is considering options for emigration.
Reducing Unwanted MigrationMost of the migrants arriving in industrialized countries are not wanted. Less than half are immigrants who have been invited to settle. Unauthorized migration is a major issue in the United States and many European countries,
prompting many leaders to look for solutions that mini-mize push factors in sending countries.
The 30 high-income countries, as defined by the World Bank, contain one-sixth of the world’s people but pro-duce five-sixths of the world’s economic output. Most of the changes that would speed up development and reduce unwanted migration lie within the developing countries that are the source of most migrants. However, trade, investment, and aid policies of the industrialized nations can accelerate the narrowing of the demographic and economic differences that motivate migration.
Trade and InvestmentTrade means that a good is produced in one country, taken over borders, and used in another. Economic theory suggests that if countries specialize in producing those goods in which each has a comparative advantage, the residents of all countries that trade will be better off. This means that, if Mexico can produce TV sets more cheaply than the United States can, and the United States can produce corn more cheaply than it can pro-duce TV sets, Mexico should produce televisions and send them to the United States in exchange for corn. In this way, Americans get cheaper TVs and Mexicans get cheaper tortillas. With trade accelerating economic and job growth in both countries, less Mexico-U.S. migra-tion would occur.
Migration and trade were substitutes between Europe and the Americas.42 For more than a century, Europeans migrated to North America, until restrictive laws in the 1920s almost stopped the flow. When these restrictions were relaxed in the 1960s, European economies were expanding more rapidly than the U.S. economy. This fast growth narrowed gaps in wages and incomes and reduced transatlantic migration to a trickle. A similar story of narrowing wage and income gaps due to freer trade and investment explains why emigration from southern Euro-pean nations such as Italy and Spain slowed in the 1970s and 1980s, just when Italians and Spaniards won the right to live and work anywhere in the European Union.
The U.S. Commission for the Study of International Migration and Cooperative Economic Development, which seeks mutually beneficial ways to reduce unwanted migration, concluded that “expanded trade between the [migrant-] sending countries and the United States is the single most important remedy.” In fact, trade has expand-ed rapidly. In 2005, merchandise trade topped $10 tril-lion for the first time, equivalent to almost one-fourth of the world’s $45 trillion GNP.43 Germany and the United States are the world’s leading exporters of goods, almost $1 trillion each. China is third, with exports worth $760 billion in 2005.

Managing Migration: The Global Challenge
Population Bulletin Vol. 63, No. 1 2008 www.prb.org 17
However, when countries become more open to trade, adjustments can displace workers and increase migra-tion. For example, NAFTA accelerated the closure of television factories in the United States and their expansion in Mexico, and the displacement of Mexi-can corn farmers by U.S. corn. Displaced U.S. workers were unlikely to migrate to Mexico, but some Mexican corn farmers migrated to the United States. In this case, trade stimulated migration, at least in the short to medium term.
Migration resulting from increased trade may be small-er and may last for a shorter time if foreign investment accelerates job growth in the migrant-sending country. Foreign direct investment (FDI) totaled $665 billion in 2004, but more than two-thirds went to high-income countries, such as when British firms buy U.S. firms. Investments in developing countries go to places where investors expect maximum profits. China received almost a quarter of the total $211 billion invested in developing countries in 2004.44 In most developing countries, about
Box 1 Refugees and Asylum SeekersPolitical persecution at home encourages some migrants to cross national borders. The 1951 Geneva Convention defines a refugee as a person outside his or her country of citizenship who does not want to return “owing to a well-founded fear of being persecuted for reasons of race, religion, nationality, membership in a particular social group, or political opinion.” Countries that sign the Geneva Convention pledge not to “refoul” or return those recognized as refugees to places where they could be persecuted.1
Most of the world’s 9.9 million refugees in 2006 fled to neighboring countries, where governments or the United Nations High Commis-sioner for Refugees (UNHCR) can provide temporary assistance. Some of those living in refugee camps are allowed to move to third countries as immigrants and begin their lives anew. Other foreigners travel directly to the country where they would like to start new lives and then they request asylum, asking to be recognized as refugees and to be given immigrant status.2
Most refugees are from developing countries and move to other de-veloping countries, while most asylum seekers are from less developed countries and move to more developed countries. In 2006, Pakistan and Iran hosted about 20 percent of all refugees worldwide—most from Afghanistan, the top refugee-producing country (see figures). The United States was the third leading host of refugees, and the top five refugee-hosting countries had 40 percent of the total.
The major sources of refugees were Afghanistan and Iraq, a third of the total, followed by Sudan, Somalia, and the Democratic Republic of
Congo; these five countries produced over half of the world’s refugees. Afghani refugees included those who fled the Taliban rule as well as those who supported the Taliban after the U.S.-led coalition toppled the Taliban government. Iraqis fled fighting that broke out after the U.S.-led invasion in 2003. Most moved to neighboring Jordan and Syria. Con-flict between the Muslim north and the Christian south of Sudan, and between Arab herders and indigenous pastoralists in Darfur, moved refugees to Chad, Kenya, and other neighboring countries. Similarly, in Somalia and the Democratic Republic of Congo, internal conflicts have sent refugees fleeing over the last decade. Somalian refugees also fled when Ethiopia invaded the country in 2006.
The sources of asylum seekers are more diverse. Only two of the five major refugee-producing countries were among the top five origin countries for asylum seekers with pending cases in 2006 (Iraq and the Democratic Republic of Congo), and the top five origin countries accounted for only one in five asylum seekers. Fewer than one-quarter of asylum seekers are recognized as refugees in need of protection, but more are allowed to remain because it is difficult to return them to their countries of origin.
References1. United Nations High Commissioner for Refugees (UNHCR), Statistical Year-book, accessed online at www.unhcr.org/statistics.html, on Jan. 28, 2008.
2. UNHCR, Refugees by Numbers 2006 Edition, accessed online at www.unhcr.org, on Jan. 18, 2008.
Top 5 Host Countries for Refugees
Source: UNHCR, 2006 Global Trends: Refugees, Asylum-seekers, Returnees, Internally Displaced and Stateless Persons (www.unhcr.org/statistics.html, accessed Aug.1, 2007).
Top 5 Origin Countries for Refugees
Source: UNHCR, 2006 Global Trends: Refugees, Asylum-seekers, Returnees, Internally Displaced and Stateless Persons (www.unhcr.org/statistics.html, accessed Aug.1, 2007).
Jordan
Germany
United States
Iran
Pakistan
���,���
���,���
���,���
���,���
�,���,���
Dem. Republicof Congo
Somalia
Sudan
Iraq
Afghanistan
���,���
���,���
���,���
�,���,���
�,���,���

Managing Migration: The Global Challenge
18 www.prb.org Population Bulletin Vol. 63, No. 1 2008
$10,000 in foreign investment is associated with one “good job,” making it clear that more jobs linked to FDI are created in China than other developing countries.
Even if FDI decreases migration in the long term, it may increase migration in the short and medium term. This might occur for several reasons. Foreign professionals may arrive to manage these investments, and job oppor-tunities may attract workers. Jobs created by FDI may also increase internal migration such as migration from rural areas to cities.
Aid and InterventionOfficial Development Assistance (ODA) funds are given or lent to developing nations to speed their economic and job growth. In 2005, the Organisation for International Co-operation and Development (OECD) nations that are members of the Development Assistance Committee provided a record $107 billion in ODA. Almost two-thirds of ODA came from five countries: United States, $28 billion; Japan, $13 billion; and the United Kingdom, Germany, and France, $10 billion each.45
Many appeals have been made to increase aid and to redirect it to promote equitable development. At the UN’s Social Summit in Copenhagen in March 1995, the Group of 77 (130 developing nations) pledged to fol-low a 20-20 distribution formula if they received more aid. Under this formula, 20 percent of ODA would go to meet basic human needs, such as building and staff-ing schools and hospitals, and governments receiving aid would devote at least 20 percent of their expenditures to basic human needs.
Instead of the 20-20 formula, the major donors focused on debt relief. Many developing countries, including some
with corrupt governments, took on external debt to build new capital cities or launch nonproductive projects. Inter-est on these foreign debts eat up an increasing share of gov-ernment revenues. The Heavily Indebted Poor Countries Initiative between 1996 and 2006 approved debt-reduction packages for 30 countries, including 25 in Africa.46
Trade, investment, and aid takes time to reduce emigra-tion pressures and may even increase emigration in the short run. But these economic policies narrow differences over time and, after wage gaps are narrowed to four to one or five to one, economically motivated migration virtually ceases, especially if economic growth is faster in the poorer country.
The alternative to slow but steady economic progress is humanitarian intervention, or military intervention to head off emigration. The United States restored deposed Haitian President Jean-Bertrand Aristide to power in 1994 in part to stop the exodus of Haitians to Florida. The U.S. military presence in Haiti cost about $140 mil-lion a month, or the equivalent of Haiti’s annual GDP.
RemittancesMillions of people live outside their country of birth, and they send billions of dollars to their countries of origin. These remittances are among the fastest-growing interna-tional financial flows.
Formal remittances to developing countries doubled between the late 1980s and mid-1990s to almost $60 bil-lion a year, doubled again by 2002, and almost doubled again to $208 billion in 2006 (see Figure 6). The total flow of remittances is actually larger than the formal amount. Some remittances are sent home informally, with friends or relatives or via unregulated transfer agents, rather than through banks or regulated financial institu-tions. In 2006, India received the most remittances ($27 billion), followed by Mexico ($25 billion), China ($22 billion), and the Philippines ($15 billion).
International organizations such as the World Bank ad-vocate more labor migration to generate more remittances and speed development in the migrants’ countries of ori-gin. More migration, this argument runs, generates more remittances and reduces poverty. Remittances can also have other favorable effects. Through a multiplier effect, migrants increase spending in their home countries when they send money back to buy materials and hire workers to improve their housing. Similarly, when migrants make savings deposits in their country of origin, banks can lend remittance deposits to provide the funds needed for infra-structure, business development, and expansion.
Most researchers agree that the best way to increase remittances is to ensure that migrant-sending countries
Figure 6Remittances to Less Developed Countries, 2000 to 2006
Source: The World Bank, Migration and Remittances Factbook (http://econ.worldbank.org, accessed Jan. 22, 2008).
����������������������������
����
���
���
���
���
���US�(billions)

Managing Migration: The Global Challenge
Population Bulletin Vol. 63, No. 1 2008 www.prb.org 19
have sound fundamental economic policies, including an appropriate exchange rate and a banking system that is cost-efficient and friendly to remitters and recipients.
The UN held a high-level dialogue on International Migration and Development in September 2006 that acknowledged the importance of remittances for the de-velopment of migrant countries of origin. One outcome was the Global Forum on Migration and Development, a non-UN body that brings governments together to promote coherence in the policies each country pursues. One of its goals is to prevent cases in which, for ex-ample, a rich country government provides aid to speed development but has trade policies that block imports from migrant-sending countries. The hope is that more coherent policies might lead to matching aid funds for migrant remittances, thereby increasing the develop-ment impact of these remittances. Another possible policy outcome would be new temporary-worker pro-grams providing return bonuses that workers can invest upon their return home.
Managing MigrationThe number of international migrants—people living outside their country of citizenship—is at an all-time high. The number is likely to continue increasing because of demand-pull factors in receiving countries, supply-push factors in sending countries, and networks that create communications and transportation infrastructures that help migrants learn about opportunities abroad and take advantage of them. Countries that try to manage migration by making it harder to apply for asylum or restricting welfare benefits may face protests by human rights advocates.
Every one of the world’s countries participates in the international migration system as a destination for mi-grants, a transit country, or an area of origin. Many coun-tries participate in the migration system in all three ways. For example, Mexico sends migrants to the United States, receives Central American migrants, and allows Central Americans transit en route to the United States.
Most migrants do not move far from home, and each of the world’s continents has a migration system with unique characteristics. As a result, each region and individual countries face different challenges. In the United States, the large number of unauthorized migrants is a prominent issue. In the European Union, the unexpected settlement of guest workers and the challenge of integrating their children and grandchildren is the subject of political and cultural debates. And in oil-exporting countries, very high shares of foreign workers in the private sector have raised concerns about job prospects for native-born youth.
Demographic and economic differences promote in-ternational migration. Narrowing these differences would likely reduce migration from one country to another. Many international organizations and governments in developing countries have recognized the importance of the money that migrants send home from abroad and are seeking ways to use these remittances to accelerate economic development. Trade, investment, and aid can also acceler-ate economic growth in lower-income countries. However, even if sending and receiving countries reach free trade and investment agreements that reduce migration in the long term, a short-term increase in migration is still possible, highlighting the complexity of managing migration.
ReferencesUnited Nations (UN), 1. Report of the Secretary-General on International Migra-tion (A/60/871) (2006); and UN, International Migration 2006 (table), accessed online at www.un.org/esa/population/publications/2006Migration_Chart/2006IttMig_chart.htm, on Jan. 28, 2008.UN, 2. Article 13(2) of the Universal Declaration of Human Rights, accessed online at www.un.org/Overview/rights.html, on Jan. 21, 2008.John Torpey, 3. The Invention of the Passport: Surveillance, Citizenship and the State (Cambridge, England: Cambridge University Press, 1999).Charles C. Lemert, 4. Social Things: An Introduction to the Sociological Life (Lanham, MD: Rowman & Littlefield, 2005): 176.Department of Homeland Security, 5. Immigration Statistics, accessed online at www.dhs.gov/immigrationstatistics, on Aug. 1, 2007; Citizenship and Immigration Canada (CIC), Facts and Figures 2006, Immigration Overview: Permanent and Temporary Residents, accessed online at www.cic.gc.ca, on Aug. 1, 2007; Australian Government Department of Immigration and Citizenship, Immigration Update 2006-2007, accessed online at www.immi.gov.au, on Aug. 1, 2007; New Zealand Department of Labour, Migration Trends 05/06Report, accessed online at www.dol.govt.nz, on Aug. 1, 2007; and Jewish Virtual Library, Immigration to Israel by Period of Immigration and Last Continent of Residence, accessed online at www.jewishvirtuallibrary.org, on Aug. 1, 2007.Liz Fekete, “Issues in the French Presidential Elections,” accessed online at 6. www.irr.org.United Kingdom, on Jan. 21, 2008.Michael S. Teitelbaum, “Right Versus Right: Immigration and Refugee 7. Policy in the United States,” Foreign Affairs 59, no. 1 (1980): 45-46.George Martine, 8. State of World Population 2007: Unleashing the Potential of Urban Growth (New York: United Nations, 2007), also online at www.unfpa.org/swp/2007/english/introduction.html.Sylvie Da Lomba, 9. The Right to Seek Refugee Status in the European Union (Antwerp, Netherlands: Intersentia, 2004). Details of the three U.S. laws enacted in 1996 are at 10. Migration News, http://migration.ucdavis.edu/. One provision that was dropped from the final bill would have made legal immigrants deportable if they received more than 12 months of welfare benefits. In the late 1990s, legal immi-grants’ and children’s access to some welfare benefits was restored.Martin Ruhs and Philip Martin, “Numbers vs. Rights: Trade Offs and Guest 11. Worker Programs,” International Migration Review (forthcoming, 2008).For more information, see the Economic Commission for Latin America 12. at www.eclac.org.Charles M. Beach, Alan G. Green, and Jeffrey G. Reitz, eds., 13. Canadian Immigration Policy for the 21st Century (Montreal and Kingston: McGill-Queen’s University Press, 2003).There were another 5,500 or 2 percent other immigrants in 2006. CIC, 14. Facts and Figures 2006: Canada, Permanent Residents by Category, accessed online at www.cic.gc.ca, on Jan. 21, 2008. CIC, “Skilled Workers and Professionals: Who Can Apply—Six Selec-15. tion Factors and Pass Mark,” accessed online at www.cic.gc.ca, on Jan. 21, 2008.

Managing Migration: The Global Challenge
20 www.prb.org Population Bulletin Vol. 63, No. 1 2008
Philip Martin and Elizabeth Midgley, “Immigration: Shaping and Reshap-16. ing America. Revised and Updated 2nd Edition,” Population Bulletin 61, no. 4 (2006): figure 1.Waiting lists are published in the Department of State Visa Bulletin. U.S. 17. Department of State, “Visa Bulletin,” accessed online at http://travel.state.gov/visa/frvi/bulletin/bulletin_1360.html, on Jan. 21, 2008.Since there is no limit on the number of H-1B visa holders who can be 18. employed by nonprofit organizations such as universities, and each year up to 20,000 foreign students who earn master’s and doctorates from U.S. universities can receive H-1B visas, the number admitted each year exceeds 100,000. Michael Teitelbaum, “Do We Need More Scientists?” 19. The Public Interest, no. 153 (2003): 40-53. Teitelbaum noted that U.S. students tend to avoid fields of study that require six or more years of graduate study followed by five to 10 years of low-paid postdoctoral research, the pattern in many basic sciences.Jeffrey S. Passel, “U.S. Immigration Trends: A Focus on U.S. Agricul-20. ture and California,” presented at Labor Markets in a Global Economy, International Agricultural Trade Consortium in Washington, DC, on Jan. 7, 2008. Pew Hispanic Center, 21. Modes of Entry for the Unauthorized Migrant Popula-tion, May 22, 2006, accessed online at http://pewhispanic.org/factsheets, on Jan. 21, 2008.The settlement of the 22. American Baptist Churches v. Thornburgh lawsuit in 1991 allowed many Central Americans to remain in the United States. The Nicaraguan Adjustment and Central American Relief Act of 1997 allowed many to become immigrants.Alejandro Portes and Alex Stepick, 23. City on the Edge: the Transformation of Miami (Berkeley, CA: University of California Press, 1993).Peggy Levitt, 24. The Transnational Villagers (Berkeley, CA: University of California Press, 2001).Anthony P. Maingot, “Emigration Dynamics in the Caribbean: The cases 25. of Haiti and the Dominican Republic,” in Emigration Dynamics in Devel-oping Countries Vol. 3, ed. Reginald Appleyard (Brookfield, VT: Ashgate, 1999): 178-231.Klaus Bade concluded that the number of European emigrants is 60 mil-26. lion to 65 million, of whom 10 million to15 million returned. Klaus J. Bade, Europa in Bewegung. Migration vom späten 18. Jahrhundert bis zur Gegenwart. (Munich: C.H. Beck, 2000): 142. Philip L. Martin, 27. Guestworker Programs: Lessons from Europe (Washington, DC: U.S. Department of Labor, Bureau of International Labor Affairs, 1980).EUROPA, “Abolition of Internal Borders and Creation of a Single EU 28. External Frontier,” accessed online at http://ec.europa.eu/justice_home, on Jan. 28, 2008.Franco Frattini, “Shaping Migration Patterns,” speech to the European 29. Parliament, Sept. 20, 2007, accessed online at http://ec.europa.eu, on Jan. 21, 2008.A poll released in December 2007 found that over 80 percent of Germans 30. and Britons thought that immigrants should have to pass language tests to remain in these countries. Tony Barber, “Europeans Want Tests for Im-migrants,” Financial Times, Dec. 13, 2007.Andre Sapir, “Who is Afraid of Globalization? The Challenge of Domestic 31. Adjustment in Europe and America,” Centre for Economic Policy Research Discussion Paper 2595 (2000), accessed online at www.cepr.org, on Jan. 20, 2008.The National Bureau of Statistics estimated 130 million Chinese were 32. living outside the place they were registered to live in June 2001; most moved from inland rural areas to coastal areas. “China: Rural, Tourism, Hong Kong,” Migration News 8, no. 9 (2001). RELA, Malaysia’s paramilitary force, has been accused of human rights 33. abuses, with migrant advocates asserting that RELA volunteers have planted evidence to justify arrests of foreigners and use excessive force in their policing. “Southeast Asia,” Migration News 14, no. 3 (2007).Wages and other rules for domestic helpers are online at 34. www.labour.gov.hk.Jason DeParle, “Jobs Abroad Support ‘Model’ State in India,” 35. The New York Times, Sept. 7, 2007.
Marcus Noland and Howard Pack, 36. The Arab Economies in a Changing World (Washington, DC: Peter J. Peterson Institute for International Economics, 2007). United Nations High Commissioner for Refugees (UNHCR), 37. 2006 Glob-al Trends: Table 1, accessed online at www.unhcr.org, on Jan. 28, 2008.Africa’s Great Lakes region is located in eastern Africa and includes coun-38. tries surrounding Lake Kivu, Lake Tanganyika, and Lake Victoria.Ann M. Simmons, “South Africa Seeks to Pull Refugees’ Welcome Mat,” 39. Los Angeles Times, May 4, 2001.Australian Government, Department of Immigration and Citizenship, 40. Fact Sheet: Key Facts in Immigration, accessed online at www.immi.gov.au, on Jan. 21, 2008; and Immigration New Zealand, Migration Trends 2004/2005, accessed online at www.immigration.govt.nz, on Jan. 21, 2008.Government Accountability Office, “Commonwealth of the Northern 41. Mariana Islands. Serious Economic, Fiscal, and Accountability Chal-lenges,” GAO Highlights, Feb. 8, 2007. Legislation pending in Congress in December 2007, opposed by the Marianas government, would subject the islands to U.S. immigration policies.Timothy J. Hatton and Jeffrey G. Williamson, 42. The Age of Mass Migration: Causes and Economic Impact (New York: Oxford University Press, 1998). This book focuses on the period between 1850 and 1914, when 55 million Europeans emigrated.U.S. Commission for the Study of International Migration and Coopera-43. tive Economic Development, Unauthorized Migration: An Economic Devel-opment Response (Washington, DC: Government Printing Office, 1990): xv; and World Bank, World Development Indicators 2007 (Washington, DC: World Bank, 2007): tables 1 and 5.World Bank, 44. World Development Indicators 2007: table 5. Organisation for Economic Co-operation and Development (OECD), 45. “Development Aid,” OECD in Figures, accessed online at www.oecd.org, on Jan. 21, 2008. International Monetary Fund, “Debt Relief Under the Heavily Indebted 46. Poor Countries (HIPC) Initiative,” accessed online at www.imf.org/external/np/exr/facts/hipc.htm, on Jan. 21, 2008.
Suggested ResourcesCastles, Stephen, and Mark Miller. The Age of Migration: Interna-
tional Population Movements in the Modern World. New York: The Guilford Press, 2003.
Cornelius, Wayne, et al., eds. Controlling Immigration: A Global Perspective. Stanford, CA: Stanford University Press, 2002.
International Center for Migration Policy Development. www.icmpd.org
International Migration and Development. www.unmigration.orgInternational Organization for Migration. World Migration Report
www.iom.intMartin, Philip, and Elizabeth Midgley. “Immigration: Shaping
and Reshaping America, 2d ed.” Population Bulletin 61, no. 4 (2006).
Martin, Philip, and Jonas Widgren. “International Migration: Facing the Challenge.” Population Bulletin 57, no. 1 (2002).
Massey, Douglas S., et al. Worlds in Motion: Understanding Interna-tional Migration at the End of the Millennium. New York: Oxford University Press, 1998.
Migration News. http://migration.ucdavis.eduWorld Bank. Global Economic Prospects 2006.
http://econ.worldbank.org

Visit www.prb.org to Find:
Articles and Reports. New data and analysis on topics as diverse as gender, reproductive health, environment, and race/ethnicity.
Graphics Bank. PowerPoint slides of population-related information, ready for use in presentations or in the classroom.
PRB Discuss Online. Available at http://discuss.prb.org. Join online discussions with experts on newsworthy population, health, and environment topics, trends, and issues. Transcripts of each discussion are archived on PRB’s website.
DataFinder. Search a world database of 132 population, health, and environment variables for 210 countries, 27 world regions and subregions, and the world. A separate U.S. database includes 244 social, economic, and demo-graphic variables for each of the 50 states and the District of Columbia.
For Educators. Access online lesson plans, maps, and educational resources.
For Journalists. Highlights news releases, frequently asked questions, webcasts, and a dictionary of population terms.
“PRB News” and “Events & Training.” Announces monthly policy seminars, intern and fellowship applications, and workshops, as well as news from PRB’s Communications, Domestic, and International programs.
E-Mail This. Send e-mails to others with links to PRB content.
Country Pages. Scan up-to-date population, health, and environment data for any of 210 countries, and find links to related PRB articles and reports and organizations’ websites.
WebUpdate. Sign up to receive e-mail announcements about new web content and PRB-sponsored seminars and briefings.
Become a Member of PRB
With new perspectives shaping public policies every day, you need to be well informed. As a member of the Popula-tion Reference Bureau, you will receive reliable information on United States and world population trends—properly analyzed and clearly presented in readable language. Each year you will receive four Population Bulletins, the annual World Population Data Sheet, and complimentary copies of special publications. We welcome you to join PRB today.
Recent Population Bulletins
I n f o r m . E m p o w e r . A d v a n c e . w w w . p r b . o r g
Individual .............................$50 Library .................................. $75 Corporation ....................... $300 Lifetime Membership .... $5,000
Population Reference Bureau Circulation Dept. , P.O. Box 96152 Washington, DC 20077-7553
For faster service, call 800-877-9881 Or visit www.prb.org Or e-mail [email protected] Or fax 202-328-3937
Volume 63 (2008) No. 1 Managing Migration: The Global Challenge by Philip Martin and Gottfried Zürcher
Volume 62 (2007) No. 1 Population: A Lively Introduction, 5th ed. by Joseph A. McFalls Jr.
No. 2 Challenges and Opportunities—The Population of the Middle East and North Africa by Farzaneh Roudi-Fahimi and Mary Mederios Kent
No. 3 World Population Highlights: Key Findings From PRB’s 2007 World Population Data Sheet by Population Reference Bureau staff
No. 4 Immigration and America’s Black Population by Mary Mederios Kent
Volume 61 (2006) No. 1 The Global Challenge of HIV and AIDS by Peter R. Lamptey, Jami L. Johnson, and Marya Khan
No. 2 Controlling Infectious Diseases by Mary M. Kent and Sandra Yin
No. 3 India’s Population Reality: Reconciling Change and Tradition by Carl Haub and O.P. Sharma
No. 4 Immigration: Shaping and Reshaping America by Philip Martin and Elizabeth Midgley
Volume 60 (2005) No. 1 Global Aging: The Challenge of Success by Kevin Kinsella and David R. Phillips
No. 2 New Marriages, New Families: U.S. Racial and Hispanic Intermarriage by Sharon M. Lee and Barry Edmonston

POPULATION REFERENCE BUREAU1875 Connecticut Ave., NW, Suite 520 | Washington, DC 20009-5728 202-483-1100 | 202-328-3937 (fax) | www.prb.org
Managing Migration: The Global Challenge The number of international migrants is at an all-time high. There were 191 million migrants in 2005, which means that 3 percent of the world’s people left their country of birth or citizen-ship for a year or more. The number of international migrants in industrialized countries more than doubled between 1985 and 2005, from almost 55 million to 120 million.
Those who cross national borders usually move to nearby countries, for example from Mexico to the United States, or from Turkey to Germany. The largest flow of migrants is from less developed to more developed countries. In 2005, 62 million migrants from developing countries moved to more developed countries, but almost as many mi-grants (61 million) moved from one developing country to another.
Related Documents