Vol. 4, No. 1, 2009 January, 2009 RNI No. UPENG/2006/22736

Welcome message from author
This document is posted to help you gain knowledge. Please leave a comment to let me know what you think about it! Share it to your friends and learn new things together.
Transcript
Vol. 4, No. 1, 2009January, 2009
RNI No. UPENG/2006/22736
JOURNAL OF ECO-FRIENDLY AGRICULTURE(A bi-annual Scientific Research Journal)
Doctor’s Krishi Evam Bagwani Vikas Sanstha(Doctor’s Agricultural and Horticultural Development Society)
Registration No. 131380
Chief PatronDr. C. D. Mayee, Chairman, ASRB, New Delhi
ChairmanDr. R. P. Srivastava, Former Director and Principal Scientist, CISH, Lucknow
SUBSCRIPTIONAll authors should be member of the Sanstha (Society). The life membership fee for scientist working in India is Rs. 2,000 andUS $ 1000 for abroad. For institutions/libraries Rs.12,000 in India & US $ 2,500 for abroad.
ANNUAL MEMBERSHIP FEE
Personal Institution
India Rs. 200 Rs. 2,000 One year Abroad US$ 100 US $ 200
India Rs. 400 Rs. 4,000 Two years
Abroad US$ 200 US $ 400 India Rs. 500 Rs. 5,000 Three years
Abroad US$ 250 US $ 500
Dr. P. S. Chandurkar, Plant Protection Advisor, GOI,Faridabad
Dr. M. D. Pathak, Chairman, CRDWML, Lucknow & FormerDirector, Training & Research, IRRI, Manila
Dr. Seema Wahab, Advisor, DBT, New Delhi
Dr. T.P. Rajendran, ADG (PP), ICAR, New Delhi
Dr. S.N. Puri, Vice-chancellor, CAU-Imphal.
Dr. V. M. Pawar, Director, Biotec International, Delhi andFormer Vice-Chancellor, MAU, Parbhani
Dr. P. K. Singh,Senior Scientist I.N.S.A. Dept. of Botany BHUVaranasi and Former Vice-Chancellor, CSAUA&T, Kanpur
Dr. Rakesh Tuli, Director, NBRI, Lucknow
Dr. R. K. Pathak, Chief Consultant, NHM, Krishi Bhawan,New Delhi and Former Director, CISH, Lucknow
Dr. A.K. Yadav, Director, NCOF, Ghaziabad
Dr. R. J. Rabindra, Director, Project Directorate of BiologicalControl, Bangalore
Editorial Advisory Board
Editor-in-ChiefDr. R.P. Srivastava, Former Director, CISH, Lucknow.
EditorsDr. A. K. Misra, Project Coordinator, CISH, Lucknow
Dr. Ram Kishun, former Head, Crop Protection, CISH, LucknowDr. Jagdish Chandra, Former Principal Scientist, Entomology, IISR, Lucknow
Dr. R. M. Khan, Principal Scientist, Nematology, CISH, Lucknow
Owner Doctor’s Krishi Evam Bagwani Vikas Sanstha, Printer and Publisher Dr. Ram Prakash Srivastava, printed at Neelam Printers, Narhi, Near Hazratganj,Lucknow and published at 108, Lekhraj Khazana, Faizabad Road, Lucknow.
Dr. O.M. Bambawale, Director, NCIPM, IARI Campus,New Delhi
Dr. V. K. Gupta, Chief Editor, Oriental Insects, P.O. Box358120, Gainesville, Florida (USA)
Dr. A. N. Mukhopadhyay, Former Vice-Chancellor, AssamAgri. Univ., Jorhat, Assam
Dr. R. C. Saxena, Former Principal Scientist, ICIPE (Kenya)
Dr. R. K. Anand, Former Principal Scientist, IARI, New Delhi
Dr. Alok Kalra, Scientist, CIMAP, Lucknow
Dr. B. N. Vyas, Vice-President, Godrej Agrovet Ltd., Mumbai
Dr. S. Ramarethinam, Executive Director, T. Stains and Co.Ltd. Coimbatore.
Dr. G.P. Shetty, Director, Multiplex Group of Companies,Bangalore
Dr. M.C. Gopinathan, Director (R&D) EID Parry (India) Ltd.Bangalore
Dr. O. P. Singh, President, Dhanuka Pesticide Ltd., NewDelhi
©2009
Effect of different combinations of organic manure on growthand yield of ginger (Zingiber officinale Rosc.)
S.P. Singh, R. Chaudhary and A.K. Mishra
Department of Horticulture, Tirhut College of Agriculture, (RAU, Pusa) Dholi, Muzaffarpur - 83 121, INDIA.Email: [email protected]
ABSTRACT
A field experiment was conducted during kharif season of 2003-04 and 2005-06 to study the effect of differentcombinations of organic manures on growth, yield and cost : benefit ratio of ginger (Zingber officinale Rosc.). Applicationof different organic manurial combinations significantly influenced the growth and yield attributes of ginger duringthree years of consecutive experimentation. However, application of FYM @ 330 qha-1 + pongamia oil cake @ 8.30 qha-
1 + neem oil cake @ 8.30 qh-1 + sterameal @ 8.30 qh-1 + rock phosphate @ 8.30 qha-1 + wood ash @ 8.30 qha-1 gave themaximum plant height (60.13 cm), number of tillers per plant (21.66) and fresh rhizome yield (20.09 tha-1), givingmaximum profit of Rs.2.24 per unit cost as compared to other organic manurial combination as well as inorganicinput (recommended dose of N:P:K::80:50:100 kgha-1) serving as control.
Key words: Ginger (Zingiber officnale Rosc.), Farm yard manure, Pongamia oil cake, Neem oil Cake, Sterameal, Rockphosphate, Wood ash, Yield, Yield attributes.
Journal of Eco-friendly Agriculture 4(1): 22-24 : 2009
INTRODUCTION
Ginger (Zingiber officinale Rosc.) is one of the importantspices crop all over the world and India is the largestproducer, consumers and exporter in the world. It is also animportant cash crop of Bihar occupying in an area of 808thousand hectare with production of 1208 ton (2005-06). Itis marketed in different forms such as raw ginger, bleacheddry ginger, ginger powder, ginger bear, brined ginger, gingerwine, ginger squash, ginger flakes etc. and is usually one ofthe important constituents of ayurvedic medicine, pickles,chatani and dish vegetables used in daily domestic purpose.Farmers grow ginger either as sole crop or inter crop withpigeon pea and chilli.
Consistent and indiscriminate use of inorganicfertilizers has caused serous damage to the soil and ecology.In recent years, organic agriculture has been gainingconsiderable importance and many farmers are switchingover to this traditional method of cultivation as a means toproduce safe food stuff and conserve the environment.Application of organic manures has various advantages likeincreasing soil physical properties, water holding capacityand organic carbon content apart from supplying goodquality of nutrients. Combined application of differentorganic sources like FYM, oil cake, rock phosphate, woodash, vermicompost and bio-fertilizers results in high yieldin addition to improvement in the quality. Estimate by SOEL-Survey show that India has 41,000ha (0.03 % of totalagricultural area) under organic farm, producing agriculturalcrops like plantation, spice, pulses, fruits, vegetables and oil
seeds etc. Since, spices, like ginger form a part of many ethnicmedicines, the demand for organically produced ginger isalso increasing considerably in the developed countries(Parthasarathy and Rajeev, 2006). In the present scenario ofquest for increasing productivity and quality of food, theecofriendly way out to achieve this goal is through the use oforganic inputs. It will not only be helpful for sustainableagricultural development but will also avoid chemicalisedfarming (Ghosh, 2000 and Sarkar, 2001). Hence, thisexperiment was laid out to asses the effect of different inputsof organic combinations for production of healthy gingerrhizome with maximum cost : benefit ratio.
MATERIAL AND METHODS
The experiment was carried out at the Farm ofDepartment of Horticulture, T.C.A., Dholi of RajendraAgricultural, Bihar, Pusa, and Samastipur during 2003-06.The treatment comprised of eight combination of organicfertilizers namely, T
1 - A+B+C+D+E+F, T
2 - O+B+C+D+E+F
(A-Absent); T3 - A+O+C+D+E+F (B-Absent); T
4 -
A+B+O+D+E+F (C-Absent); T5 - A+B+C+O+E+F (D-Absent);
T6 - A+B+C+D+O+F (E-Absent); T
7 - A+B+C+D+E+O
(F-Absent) and T8 - Control (Recommended dose of
N:P:K:80:50:100 kg/ha).
The letters A, B, C, D, E and F denotes: FYM @ 330 q/ha, pongamia oil Cake @ 8.30 q/ha, neem oil cake @ 8.30 q/ha, sterameal @ 8.30 q/ha, rock phosphate @ 8.30 q/ha,wood ash @ 8.30 q/ha, respectively.
There were eight treatments including control and
Effect of different combinations of organic manure on growth and yield of ginger (Zingiber officinale Rosc.)
Journal of Eco-friendly Agriculture 4(1) 2009 23
(Inorganic fertilizers) were replicated thrice in randomizedblock design.
The experimental plot soil was of sandy loam texturewith pH-7.6, EC-0.39 dsm-1, organic carbon 0.38% andavailable N, P, K was 114.0, 16.0, 100.00 kgha-1, respectively.Disease free healthy rhizomes of cultivar Nadia with uniformsize of 25 to 30 g (average weight) were planted in the 3rdweek of May every year under All India Co-ordinate researchProject on spices. The plot size for each treatment was 3.0 x1.0m with a spacing of 30 x 20cm. In control plots full dose ofP and K were applied as basal dose during field preparationwhereas nitrogenous fertilizers was divided into three equalsplits, the first split dose of nitrogen applied as top dressingat two to four leaf stage after first weeding in the availabilityof adequate moisture and rest two third dose of nitrogenwas applied 30 days after first application and thirdapplication of nitrogenous fertilizer as top dressing was done30 days after second split application of nitrogen in thepresence of adequate moisture. The crop was harvested atfull maturity (250 days after sowing) and yield data wasrecorded. The plant height and number of tillers plant–1 wererecorded before harvesting.
RESULTS AND DISCUSSION
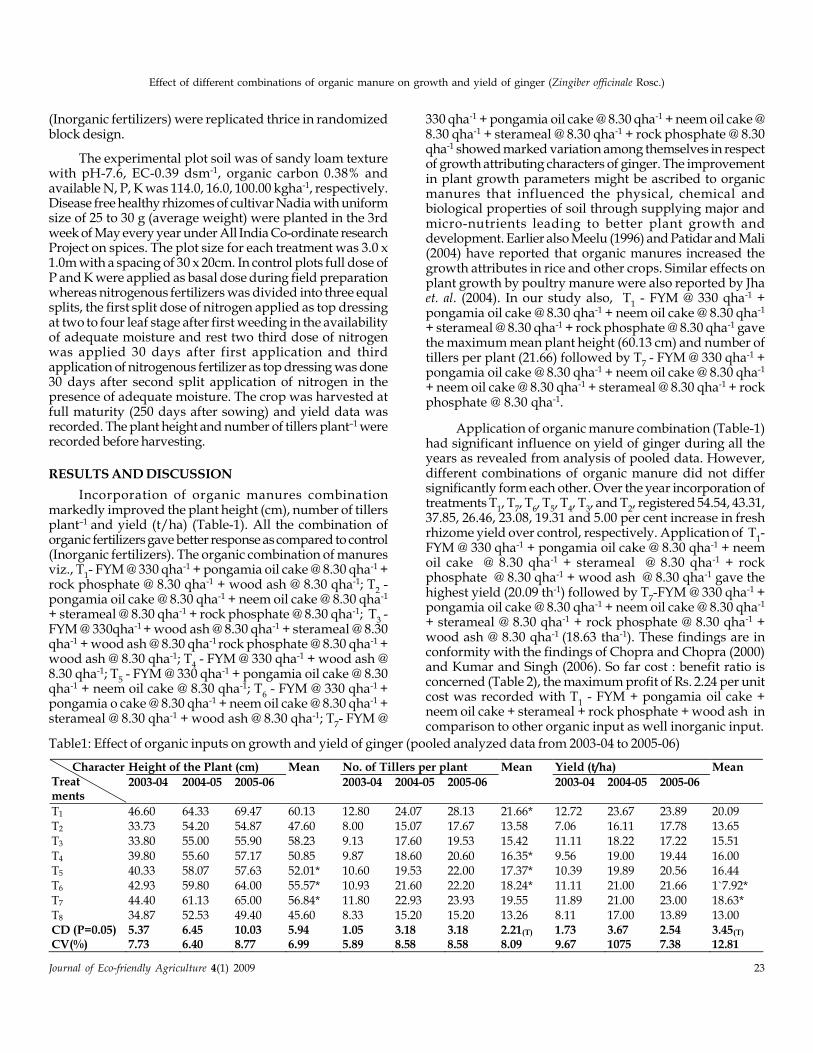
Incorporation of organic manures combinationmarkedly improved the plant height (cm), number of tillersplant–1 and yield (t/ha) (Table-1). All the combination oforganic fertilizers gave better response as compared to control(Inorganic fertilizers). The organic combination of manuresviz., T
1- FYM @ 330 qha-1 + pongamia oil cake @ 8.30 qha-1 +
rock phosphate @ 8.30 qha-1 + wood ash @ 8.30 qha-1; T2 -
pongamia oil cake @ 8.30 qha-1 + neem oil cake @ 8.30 qha-1
+ sterameal @ 8.30 qha-1 + rock phosphate @ 8.30 qha-1; T3 -
FYM @ 330qha-1 + wood ash @ 8.30 qha-1 + sterameal @ 8.30qha-1 + wood ash @ 8.30 qha-1 rock phosphate @ 8.30 qha-1 +wood ash @ 8.30 qha-1; T
4 - FYM @ 330 qha-1 + wood ash @
8.30 qha-1; T5 - FYM @ 330 qha-1 + pongamia oil cake @ 8.30
qha-1 + neem oil cake @ 8.30 qha-1; T6 - FYM @ 330 qha-1 +
pongamia o cake @ 8.30 qha-1 + neem oil cake @ 8.30 qha-1 +sterameal @ 8.30 qha-1 + wood ash @ 8.30 qha-1; T
7- FYM @
330 qha-1 + pongamia oil cake @ 8.30 qha-1 + neem oil cake @8.30 qha-1 + sterameal @ 8.30 qha-1 + rock phosphate @ 8.30qha-1 showed marked variation among themselves in respectof growth attributing characters of ginger. The improvementin plant growth parameters might be ascribed to organicmanures that influenced the physical, chemical andbiological properties of soil through supplying major andmicro-nutrients leading to better plant growth anddevelopment. Earlier also Meelu (1996) and Patidar and Mali(2004) have reported that organic manures increased thegrowth attributes in rice and other crops. Similar effects onplant growth by poultry manure were also reported by Jhaet. al. (2004). In our study also, T
1 - FYM @ 330 qha-1 +
pongamia oil cake @ 8.30 qha-1 + neem oil cake @ 8.30 qha-1
+ sterameal @ 8.30 qha-1 + rock phosphate @ 8.30 qha-1 gavethe maximum mean plant height (60.13 cm) and number oftillers per plant (21.66) followed by T
7 - FYM @ 330 qha-1 +
pongamia oil cake @ 8.30 qha-1 + neem oil cake @ 8.30 qha-1
+ neem oil cake @ 8.30 qha-1 + sterameal @ 8.30 qha-1 + rockphosphate @ 8.30 qha-1.
Application of organic manure combination (Table-1)had significant influence on yield of ginger during all theyears as revealed from analysis of pooled data. However,different combinations of organic manure did not differsignificantly form each other. Over the year incorporation oftreatments T
1, T
7, T
6, T
5, T
4, T
3, and T
2, registered 54.54, 43.31,
37.85, 26.46, 23.08, 19.31 and 5.00 per cent increase in freshrhizome yield over control, respectively. Application of T
1-
FYM @ 330 qha-1 + pongamia oil cake @ 8.30 qha-1 + neemoil cake @ 8.30 qha-1 + sterameal @ 8.30 qha-1 + rockphosphate @ 8.30 qha-1 + wood ash @ 8.30 qha-1 gave thehighest yield (20.09 th-1) followed by T
7-FYM @ 330 qha-1 +
pongamia oil cake @ 8.30 qha-1 + neem oil cake @ 8.30 qha-1
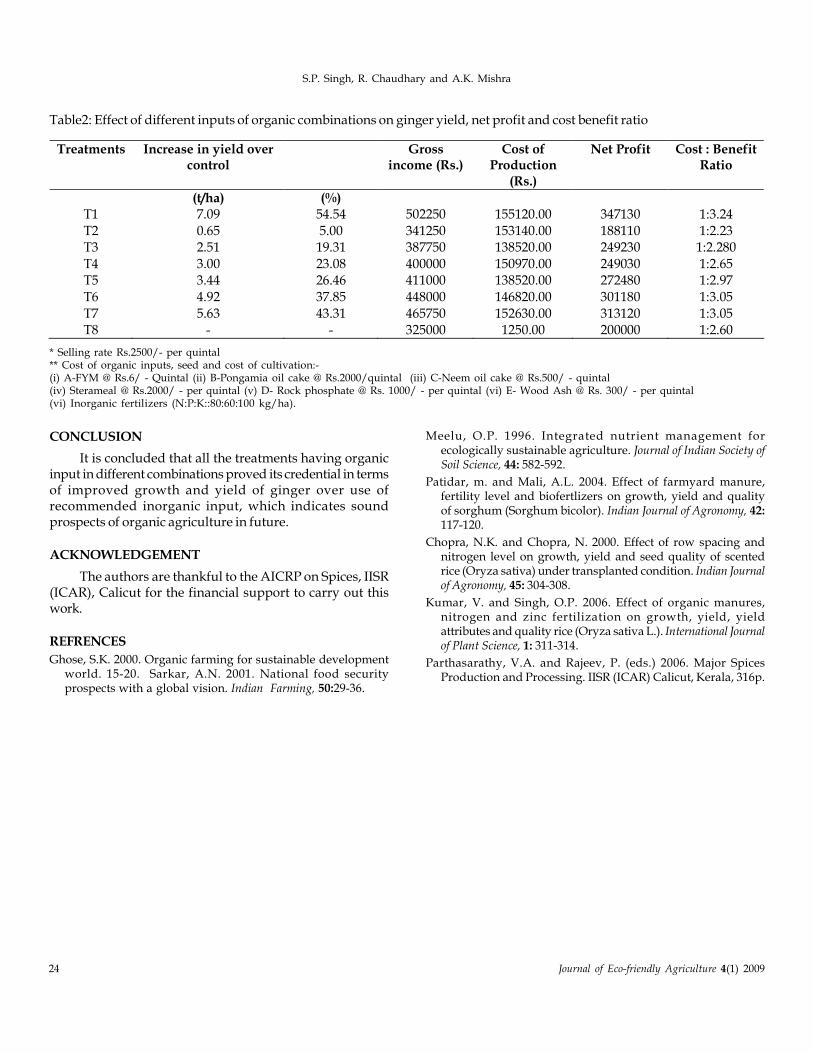
+ sterameal @ 8.30 qha-1 + rock phosphate @ 8.30 qha-1 +wood ash @ 8.30 qha-1 (18.63 tha-1). These findings are inconformity with the findings of Chopra and Chopra (2000)and Kumar and Singh (2006). So far cost : benefit ratio isconcerned (Table 2), the maximum profit of Rs. 2.24 per unitcost was recorded with T
1 - FYM + pongamia oil cake +
neem oil cake + sterameal + rock phosphate + wood ash incomparison to other organic input as well inorganic input.
Table1: Effect of organic inputs on growth and yield of ginger (pooled analyzed data from 2003-04 to 2005-06)
Height of the Plant (cm) No. of Tillers per plant Yield (t/ha) Character Treat ments
2003-04 2004-05 2005-06
Mean
2003-04 2004-05 2005-06
Mean
2003-04 2004-05 2005-06
Mean
T1 46.60 64.33 69.47 60.13 12.80 24.07 28.13 21.66* 12.72 23.67 23.89 20.09 T2 33.73 54.20 54.87 47.60 8.00 15.07 17.67 13.58 7.06 16.11 17.78 13.65 T3 33.80 55.00 55.90 58.23 9.13 17.60 19.53 15.42 11.11 18.22 17.22 15.51
T4 39.80 55.60 57.17 50.85 9.87 18.60 20.60 16.35* 9.56 19.00 19.44 16.00 T5 40.33 58.07 57.63 52.01* 10.60 19.53 22.00 17.37* 10.39 19.89 20.56 16.44 T6 42.93 59.80 64.00 55.57* 10.93 21.60 22.20 18.24* 11.11 21.00 21.66 1`7.92* T7 44.40 61.13 65.00 56.84* 11.80 22.93 23.93 19.55 11.89 21.00 23.00 18.63* T8 34.87 52.53 49.40 45.60 8.33 15.20 15.20 13.26 8.11 17.00 13.89 13.00 CD (P=0.05) 5.37 6.45 10.03 5.94 1.05 3.18 3.18 2.21(T) 1.73 3.67 2.54 3.45(T) CV(%) 7.73 6.40 8.77 6.99 5.89 8.58 8.58 8.09 9.67 1075 7.38 12.81
24 Journal of Eco-friendly Agriculture 4(1) 2009
S.P. Singh, R. Chaudhary and A.K. Mishra
CONCLUSION
It is concluded that all the treatments having organicinput in different combinations proved its credential in termsof improved growth and yield of ginger over use ofrecommended inorganic input, which indicates soundprospects of organic agriculture in future.
ACKNOWLEDGEMENT
The authors are thankful to the AICRP on Spices, IISR(ICAR), Calicut for the financial support to carry out thiswork.
REFRENCES
Ghose, S.K. 2000. Organic farming for sustainable developmentworld. 15-20. Sarkar, A.N. 2001. National food securityprospects with a global vision. Indian Farming, 50:29-36.
Meelu, O.P. 1996. Integrated nutrient management forecologically sustainable agriculture. Journal of Indian Society ofSoil Science, 44: 582-592.
Patidar, m. and Mali, A.L. 2004. Effect of farmyard manure,fertility level and biofertlizers on growth, yield and qualityof sorghum (Sorghum bicolor). Indian Journal of Agronomy, 42:117-120.
Chopra, N.K. and Chopra, N. 2000. Effect of row spacing andnitrogen level on growth, yield and seed quality of scentedrice (Oryza sativa) under transplanted condition. Indian Journalof Agronomy, 45: 304-308.
Kumar, V. and Singh, O.P. 2006. Effect of organic manures,nitrogen and zinc fertilization on growth, yield, yieldattributes and quality rice (Oryza sativa L.). International Journalof Plant Science, 1: 311-314.
Parthasarathy, V.A. and Rajeev, P. (eds.) 2006. Major SpicesProduction and Processing. IISR (ICAR) Calicut, Kerala, 316p.
Treatments Increase in yield over control
Gross income (Rs.)
Cost of Production
(Rs.)
Net Profit Cost : Benefit Ratio
(t/ha) (%) T1 7.09 54.54 502250 155120.00 347130 1:3.24
T2 0.65 5.00 341250 153140.00 188110 1:2.23 T3 2.51 19.31 387750 138520.00 249230 1:2.280
T4 3.00 23.08 400000 150970.00 249030 1:2.65 T5 3.44 26.46 411000 138520.00 272480 1:2.97
T6 4.92 37.85 448000 146820.00 301180 1:3.05
T7 5.63 43.31 465750 152630.00 313120 1:3.05 T8 - - 325000 1250.00 200000 1:2.60
Table2: Effect of different inputs of organic combinations on ginger yield, net profit and cost benefit ratio
* Selling rate Rs.2500/- per quintal** Cost of organic inputs, seed and cost of cultivation:-(i) A-FYM @ Rs.6/ - Quintal (ii) B-Pongamia oil cake @ Rs.2000/quintal (iii) C-Neem oil cake @ Rs.500/ - quintal(iv) Sterameal @ Rs.2000/ - per quintal (v) D- Rock phosphate @ Rs. 1000/ - per quintal (vi) E- Wood Ash @ Rs. 300/ - per quintal(vi) Inorganic fertilizers (N:P:K::80:60:100 kg/ha).
©2009
Comparison of average observed ESP and salt dynamics withthe empirical equations and models
M.S.Kahlon, K.L.Khera and A.S.Josan
Department of Soils, Punjab Agricultural University, Ludhiana-141004,(Punjab) IndiaE-mail : [email protected]
ABSTRACT
Amongst the empirical equations used for predicting the sodicity hazards of irrigation waters, the Modified Ayersand Westcot equation could fairly and accurately predict the build up of ESP under all saline sodic water conditionsfollowed by Rhodes, Suarez and Bower equation. Bower equation over estimates the values at all RSC
iw levels,
whereas Suarez equation underestimates the values. The modified simple mathematical models proposed by Breslerand Burns to predict salt dynamics in soil were also tested under practical irrigated conditions in sandy loam soil. Saltconcentration in soil profile was well predicted by Bresler model (based on the law of conservation of mass whichstates that the amount of salts added by water minus the amount leached out is equal to the net increment of salt inthe soil layer) without any modification after different irrigations, while the model proposed by Burns (based onestimating both the downward leaching of salts after irrigation and the capillary movement of anions to the soilsurface after evaporation) could not predict the salt concentration as the actual and estimated values differed to agreat extent. If only downward component of Burns model (neglecting upward movement of salts through evaporation)was taken into consideration, the estimated values of salt concentration were in good agreement with the observedvalues.
Key words : Bower, Rhodes, Empirical equations, Bresler, Burns, Salt dynamic model, ESP, Sodicity hazard.
Journal of Eco-friendly Agriculture 4(1): 25-29 : 2009
INTRODUCTION
The sodium adsorption ratio (SAR) of soil and drainagewater is a common index of the suitability of a water forirrigation or the environmental consequence of a water forirrigation or the environmental consequence of irrigation.Since the SAR of drainage water is a valuable measure of themaximum SAR within the root zone, empirical equationshave been developed to predict drainage water SAR basedon leaching fraction and chemical composition of theirrigation water.
Bower et al (1968) reported that it was more logical andfeasible to relate the sodium hazard of irrigation water to theSAR of the water draining from the rootzone. If noprecipitation of salts or solution of cations from soilconstituents occurred during irrigation cycles, then whenthe concentration and composition of the soil solution in therootzone were at steady state. The SAR of drainage water(SAR
dw) and that of the irrigation (SAR
iw) were related by
the equation.
dw iw
1SAR = SAR
LF
Suarez (1981) criticised Bower equation and did notaccept a constant pH value of 8.4 for the soil solution inequilibrium with CaCO
3. He proposed that determination of
pH of the equilibrium solution (pHequ
) is necessary for proper
use of pHc concept and that pH
equ depends on the leaching
fraction (LF), partial pressure of carbon dioxide (PCO2) and
solution composition. Validity of the combination of Mg andCa was also questioned.
A pre-requisite for understanding irrigationmanagement problem with saline sodic water is a knowledgeof the process of salt accumulation and leaching in therhizosphere during irrigation. In a complex system, such assoil, mathematical models for salt dynamics helpconsiderably in simplifying and understanding the variousprocesses taking place in the soil. Most of the earlierinvestigations regarding the mechanism of leaching andaccumulations of salts in soils (Day and Forsythe, 1957;Miller et al., 1965, and Nielsen and Biggar,1962) were carriedout on soils of uniform mechanical and chemicalcomposition and uniform moisture contents and underconditions of steady state flow. Another disadvantage ofthese models is that no account is taken of the redistributionof salts under evaporative conditions. Kumar and Oswal(1984) and Kapoor and Pal (1986) modified the modelsproposed by the Burns (1974) and Bresler (1967) which weresimple and based on the principle that the net increment ofsalt into a section of the soil profile is equal to the amount ofsalt added by the influent water minus the amount leachedout in the drainage water. These models took into accountthe redistribution of salts under evaporative conditions.There has been limited validation of these models underactual field conditions. In view of the scanty information on
26 Journal of Eco-friendly Agriculture 4(1) 2009
M.S.Kahlon, K.L.Khera and A.S.Josan
the above mentioned aspects, the present investigation wasundertaken with the objective to compare actual observedESP with the empirical equations and to study the saltleaching and accumulation pattern in the rhizosphere usingan existing salt water dynamic models (Bresler 1967 andBurns 1974) to optimize irrigation practices under arid andsemi-arid conditions.
MATERIALS AND METHODS
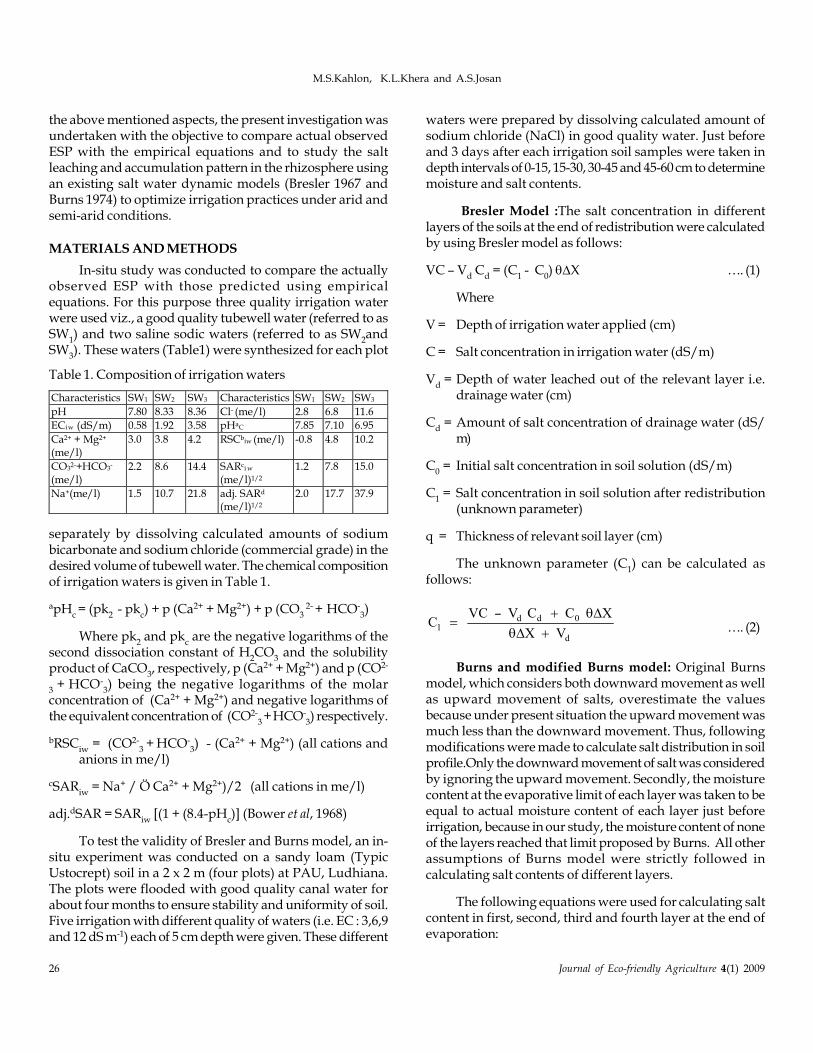
In-situ study was conducted to compare the actuallyobserved ESP with those predicted using empiricalequations. For this purpose three quality irrigation waterwere used viz., a good quality tubewell water (referred to asSW
1) and two saline sodic waters (referred to as SW
2and
SW3). These waters (Table1) were synthesized for each plot
waters were prepared by dissolving calculated amount ofsodium chloride (NaCl) in good quality water. Just beforeand 3 days after each irrigation soil samples were taken indepth intervals of 0-15, 15-30, 30-45 and 45-60 cm to determinemoisture and salt contents.
Bresler Model :The salt concentration in differentlayers of the soils at the end of redistribution were calculatedby using Bresler model as follows:
VC – Vd C
d = (C
1 - C
0) X …. (1)
Where
V = Depth of irrigation water applied (cm)
C = Salt concentration in irrigation water (dS/m)
Vd = Depth of water leached out of the relevant layer i.e.
drainage water (cm)
Cd = Amount of salt concentration of drainage water (dS/
m)
C0 = Initial salt concentration in soil solution (dS/m)
C1 = Salt concentration in soil solution after redistribution
(unknown parameter)
q = Thickness of relevant soil layer (cm)
The unknown parameter (C1) can be calculated as
follows:
d d 01
d
VC V C C XC
X V
–
…. (2)
Burns and modified Burns model: Original Burnsmodel, which considers both downward movement as wellas upward movement of salts, overestimate the valuesbecause under present situation the upward movement wasmuch less than the downward movement. Thus, followingmodifications were made to calculate salt distribution in soilprofile.Only the downward movement of salt was consideredby ignoring the upward movement. Secondly, the moisturecontent at the evaporative limit of each layer was taken to beequal to actual moisture content of each layer just beforeirrigation, because in our study, the moisture content of noneof the layers reached that limit proposed by Burns. All otherassumptions of Burns model were strictly followed incalculating salt contents of different layers.
The following equations were used for calculating saltcontent in first, second, third and fourth layer at the end ofevaporation:
Table 1. Composition of irrigation waters
Characteristics SW1 SW2 SW3 Characteristics SW1 SW2 SW3
pH 7.80 8.33 8.36 Cl- (me/l) 2.8 6.8 11.6
ECiw (dS/m) 0.58 1.92 3.58 pHaC 7.85 7.10 6.95
Ca2+ + Mg2+
(me/l) 3.0 3.8 4.2 RSCb
iw (me/l) -0.8 4.8 10.2
CO32-+HCO3
-
(me/l) 2.2 8.6 14.4 SARc
i w
(me/l)1/2 1.2 7.8 15.0
Na+(me/l) 1.5 10.7 21.8 adj. SARd
(me/l)1/2 2.0 17.7 37.9
separately by dissolving calculated amounts of sodiumbicarbonate and sodium chloride (commercial grade) in thedesired volume of tubewell water. The chemical compositionof irrigation waters is given in Table 1.
apHc = (pk
2 - pk
c) + p (Ca2+ + Mg2+) + p (CO
3 2-
+
HCO-
3)
Where pk2 and pk
c are the negative logarithms of the
second dissociation constant of H2CO
3 and the solubility
product of CaCO3, respectively, p (Ca2+ + Mg2+) and p (CO2-
3 +
HCO-
3) being the negative logarithms of the molar
concentration of (Ca2+ + Mg2+) and negative logarithms ofthe equivalent concentration of (CO2-
3 +
HCO-
3) respectively.
bRSCiw
= (CO2-3
+ HCO-
3) - (Ca2+ + Mg2+) (all cations and
anions in me/l)
cSARiw
= Na+ / Ö Ca2+ + Mg2+)/2 (all cations in me/l)
adj.dSAR = SARiw
[(1 + (8.4-pHc)] (Bower et al, 1968)
To test the validity of Bresler and Burns model, an in-situ experiment was conducted on a sandy loam (TypicUstocrept) soil in a 2 x 2 m (four plots) at PAU, Ludhiana.The plots were flooded with good quality canal water forabout four months to ensure stability and uniformity of soil.Five irrigation with different quality of waters (i.e. EC : 3,6,9and 12 dS m-1) each of 5 cm depth were given. These different
Comparison of average observed ESP and salt dynamics with the empirical equations and models
Journal of Eco-friendly Agriculture 4(1) 2009 27
Salt content of first layer after the salt addedfrom second,third and fourth layers due to capillary action=
S
f11 + S
f21 Z
C21 + 3S
T21 3Z
C21 + 4S
T21 4Z
C21….(3)
Salt retained in the second layer after the salt
from fourth layer moved into first layer through secondlayer = ( 1- 4Z
C21) 4S
T21…...(4)
Salt retained in the third layer after the salt has movedfourth into second layer through third layer
= 4ST31
(1- 4ZC31
) …. (5)
Amount of salt retained in fourth layer RST41
= (1- Zc41
) Sf41
…. (6)
An attempt was made to calculate values of saltconcentration at different layers of the soil at the end ofredistribution of each irrigation assuming only downwardmovement of salts and neglecting the upward movement.Following equation was used for such calculations .
Tijfi1
i 1 j i j 1
SC
d M, ,
….(7)
Some of the notations used in above equations areexplained below:-
Sf11
= Total salt content of ist layer at moisture content offield capacity
ZC21
= Fraction of water loss from second layer after istirrigation due capillary rise
3ST21
= New salt content of second layer after first irrigationat the end of evaporation when salt had moved up fromthe 3rd layer
3ZC21
= Fraction of water loss from the 3rd layer after firstirrigation through the second into first layer due tocapillary rise.
Cfi1
= Salt concentration of ith layer after the jth irrigation atthe moisture content of field capacity (dS/m)
di-1, j
= Total amount of water drained from the ith-1 layerafter jth irrigation
Mi, j-1
= Total moisture content of the ith layer after jth-1irrigationat the end of evaporation
STij
= Total salt content of ith layer after jth irrigation beforeany drainage from the layer
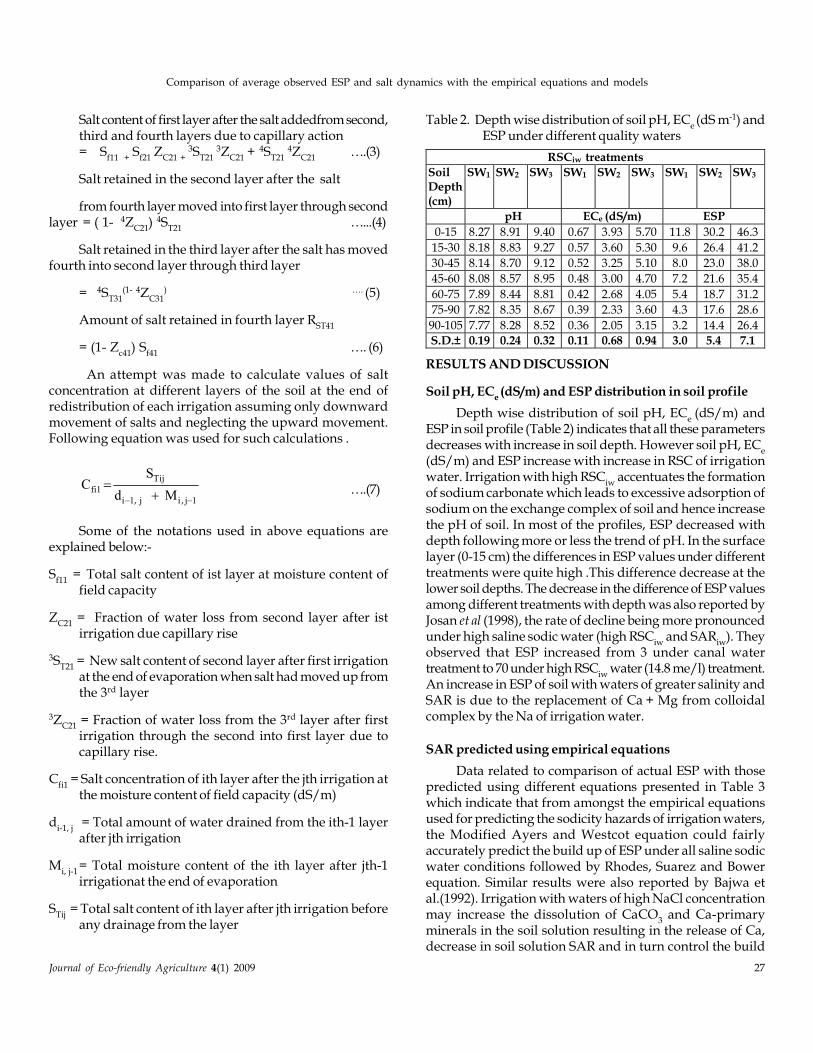
RESULTS AND DISCUSSION
Soil pH, ECe (dS/m) and ESP distribution in soil profile
Depth wise distribution of soil pH, ECe
(dS/m) andESP in soil profile (Table 2) indicates that all these parametersdecreases with increase in soil depth. However soil pH, EC
e
(dS/m) and ESP increase with increase in RSC of irrigationwater. Irrigation with high RSC
iw accentuates the formation
of sodium carbonate which leads to excessive adsorption ofsodium on the exchange complex of soil and hence increasethe pH of soil. In most of the profiles, ESP decreased withdepth following more or less the trend of pH. In the surfacelayer (0-15 cm) the differences in ESP values under differenttreatments were quite high .This difference decrease at thelower soil depths. The decrease in the difference of ESP valuesamong different treatments with depth was also reported byJosan et al (1998), the rate of decline being more pronouncedunder high saline sodic water (high RSC
iw and SAR
iw). They
observed that ESP increased from 3 under canal watertreatment to 70 under high RSC
iw water (14.8 me/l) treatment.
An increase in ESP of soil with waters of greater salinity andSAR is due to the replacement of Ca + Mg from colloidalcomplex by the Na of irrigation water.
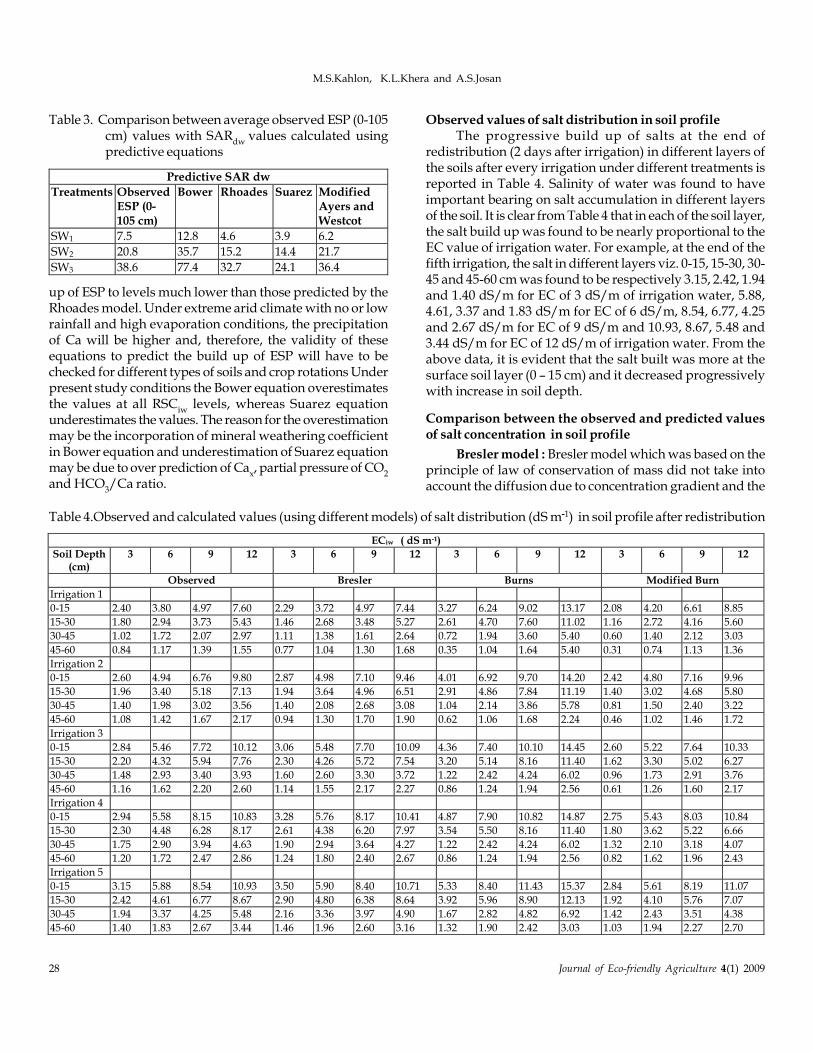
SAR predicted using empirical equations
Data related to comparison of actual ESP with thosepredicted using different equations presented in Table 3which indicate that from amongst the empirical equationsused for predicting the sodicity hazards of irrigation waters,the Modified Ayers and Westcot equation could fairlyaccurately predict the build up of ESP under all saline sodicwater conditions followed by Rhodes, Suarez and Bowerequation. Similar results were also reported by Bajwa etal.(1992). Irrigation with waters of high NaCl concentrationmay increase the dissolution of CaCO
3 and Ca-primary
minerals in the soil solution resulting in the release of Ca,decrease in soil solution SAR and in turn control the build
Table 2. Depth wise distribution of soil pH, ECe (dS m-1) and
ESP under different quality waters
RSCiw treatments
Soil Depth (cm)
SW1 SW2 SW3 SW1 SW2 SW3 SW1 SW2 SW3
pH ECe (dS/m) ESP
0-15 8.27 8.91 9.40 0.67 3.93 5.70 11.8 30.2 46.3
15-30 8.18 8.83 9.27 0.57 3.60 5.30 9.6 26.4 41.2
30-45 8.14 8.70 9.12 0.52 3.25 5.10 8.0 23.0 38.0
45-60 8.08 8.57 8.95 0.48 3.00 4.70 7.2 21.6 35.4
60-75 7.89 8.44 8.81 0.42 2.68 4.05 5.4 18.7 31.2
75-90 7.82 8.35 8.67 0.39 2.33 3.60 4.3 17.6 28.6
90-105 7.77 8.28 8.52 0.36 2.05 3.15 3.2 14.4 26.4
S.D.± 0.19 0.24 0.32 0.11 0.68 0.94 3.0 5.4 7.1
28 Journal of Eco-friendly Agriculture 4(1) 2009
M.S.Kahlon, K.L.Khera and A.S.Josan
up of ESP to levels much lower than those predicted by theRhoades model. Under extreme arid climate with no or lowrainfall and high evaporation conditions, the precipitationof Ca will be higher and, therefore, the validity of theseequations to predict the build up of ESP will have to bechecked for different types of soils and crop rotations Underpresent study conditions the Bower equation overestimatesthe values at all RSC
iw levels, whereas Suarez equation
underestimates the values. The reason for the overestimationmay be the incorporation of mineral weathering coefficientin Bower equation and underestimation of Suarez equationmay be due to over prediction of Ca
x, partial pressure of CO
2
and HCO3/Ca ratio.
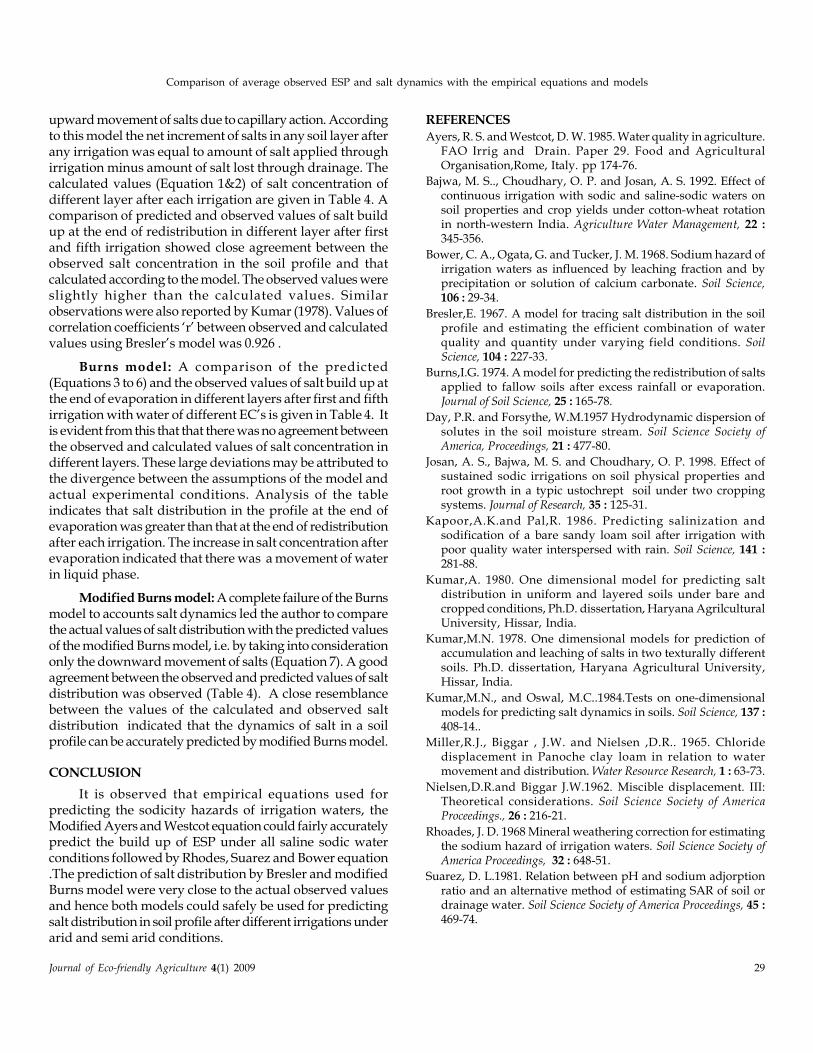
Observed values of salt distribution in soil profileThe progressive build up of salts at the end of
redistribution (2 days after irrigation) in different layers ofthe soils after every irrigation under different treatments isreported in Table 4. Salinity of water was found to haveimportant bearing on salt accumulation in different layersof the soil. It is clear from Table 4 that in each of the soil layer,the salt build up was found to be nearly proportional to theEC value of irrigation water. For example, at the end of thefifth irrigation, the salt in different layers viz. 0-15, 15-30, 30-45 and 45-60 cm was found to be respectively 3.15, 2.42, 1.94and 1.40 dS/m for EC of 3 dS/m of irrigation water, 5.88,4.61, 3.37 and 1.83 dS/m for EC of 6 dS/m, 8.54, 6.77, 4.25and 2.67 dS/m for EC of 9 dS/m and 10.93, 8.67, 5.48 and3.44 dS/m for EC of 12 dS/m of irrigation water. From theabove data, it is evident that the salt built was more at thesurface soil layer (0 – 15 cm) and it decreased progressivelywith increase in soil depth.
Comparison between the observed and predicted valuesof salt concentration in soil profile
Bresler model : Bresler model which was based on theprinciple of law of conservation of mass did not take intoaccount the diffusion due to concentration gradient and the
Table 3. Comparison between average observed ESP (0-105cm) values with SAR
dw values calculated using
predictive equations
Predictive SAR dw
Treatments Observed ESP (0-105 cm)
Bower Rhoades Suarez Modified Ayers and Westcot
SW1 7.5 12.8 4.6 3.9 6.2
SW2 20.8 35.7 15.2 14.4 21.7
SW3 38.6 77.4 32.7 24.1 36.4
Table 4.Observed and calculated values (using different models) of salt distribution (dS m-1) in soil profile after redistribution
ECiw ( dS m-1)
Soil Depth (cm)
3 6 9 12 3 6 9 12 3 6 9 12 3 6 9 12
Observed Bresler Burns Modified Burn
Irrigation 1
0-15 2.40 3.80 4.97 7.60 2.29 3.72 4.97 7.44 3.27 6.24 9.02 13.17 2.08 4.20 6.61 8.85
15-30 1.80 2.94 3.73 5.43 1.46 2.68 3.48 5.27 2.61 4.70 7.60 11.02 1.16 2.72 4.16 5.60
30-45 1.02 1.72 2.07 2.97 1.11 1.38 1.61 2.64 0.72 1.94 3.60 5.40 0.60 1.40 2.12 3.03
45-60 0.84 1.17 1.39 1.55 0.77 1.04 1.30 1.68 0.35 1.04 1.64 5.40 0.31 0.74 1.13 1.36
Irrigation 2
0-15 2.60 4.94 6.76 9.80 2.87 4.98 7.10 9.46 4.01 6.92 9.70 14.20 2.42 4.80 7.16 9.96
15-30 1.96 3.40 5.18 7.13 1.94 3.64 4.96 6.51 2.91 4.86 7.84 11.19 1.40 3.02 4.68 5.80
30-45 1.40 1.98 3.02 3.56 1.40 2.08 2.68 3.08 1.04 2.14 3.86 5.78 0.81 1.50 2.40 3.22
45-60 1.08 1.42 1.67 2.17 0.94 1.30 1.70 1.90 0.62 1.06 1.68 2.24 0.46 1.02 1.46 1.72
Irrigation 3
0-15 2.84 5.46 7.72 10.12 3.06 5.48 7.70 10.09 4.36 7.40 10.10 14.45 2.60 5.22 7.64 10.33
15-30 2.20 4.32 5.94 7.76 2.30 4.26 5.72 7.54 3.20 5.14 8.16 11.40 1.62 3.30 5.02 6.27
30-45 1.48 2.93 3.40 3.93 1.60 2.60 3.30 3.72 1.22 2.42 4.24 6.02 0.96 1.73 2.91 3.76
45-60 1.16 1.62 2.20 2.60 1.14 1.55 2.17 2.27 0.86 1.24 1.94 2.56 0.61 1.26 1.60 2.17
Irrigation 4
0-15 2.94 5.58 8.15 10.83 3.28 5.76 8.17 10.41 4.87 7.90 10.82 14.87 2.75 5.43 8.03 10.84
15-30 2.30 4.48 6.28 8.17 2.61 4.38 6.20 7.97 3.54 5.50 8.16 11.40 1.80 3.62 5.22 6.66
30-45 1.75 2.90 3.94 4.63 1.90 2.94 3.64 4.27 1.22 2.42 4.24 6.02 1.32 2.10 3.18 4.07
45-60 1.20 1.72 2.47 2.86 1.24 1.80 2.40 2.67 0.86 1.24 1.94 2.56 0.82 1.62 1.96 2.43
Irrigation 5
0-15 3.15 5.88 8.54 10.93 3.50 5.90 8.40 10.71 5.33 8.40 11.43 15.37 2.84 5.61 8.19 11.07
15-30 2.42 4.61 6.77 8.67 2.90 4.80 6.38 8.64 3.92 5.96 8.90 12.13 1.92 4.10 5.76 7.07
30-45 1.94 3.37 4.25 5.48 2.16 3.36 3.97 4.90 1.67 2.82 4.82 6.92 1.42 2.43 3.51 4.38
45-60 1.40 1.83 2.67 3.44 1.46 1.96 2.60 3.16 1.32 1.90 2.42 3.03 1.03 1.94 2.27 2.70
Comparison of average observed ESP and salt dynamics with the empirical equations and models
Journal of Eco-friendly Agriculture 4(1) 2009 29
upward movement of salts due to capillary action. Accordingto this model the net increment of salts in any soil layer afterany irrigation was equal to amount of salt applied throughirrigation minus amount of salt lost through drainage. Thecalculated values (Equation 1&2) of salt concentration ofdifferent layer after each irrigation are given in Table 4. Acomparison of predicted and observed values of salt buildup at the end of redistribution in different layer after firstand fifth irrigation showed close agreement between theobserved salt concentration in the soil profile and thatcalculated according to the model. The observed values wereslightly higher than the calculated values. Similarobservations were also reported by Kumar (1978). Values ofcorrelation coefficients ‘r’ between observed and calculatedvalues using Bresler’s model was 0.926 .
Burns model: A comparison of the predicted(Equations 3 to 6) and the observed values of salt build up atthe end of evaporation in different layers after first and fifthirrigation with water of different EC’s is given in Table 4. Itis evident from this that that there was no agreement betweenthe observed and calculated values of salt concentration indifferent layers. These large deviations may be attributed tothe divergence between the assumptions of the model andactual experimental conditions. Analysis of the tableindicates that salt distribution in the profile at the end ofevaporation was greater than that at the end of redistributionafter each irrigation. The increase in salt concentration afterevaporation indicated that there was a movement of waterin liquid phase.
Modified Burns model: A complete failure of the Burnsmodel to accounts salt dynamics led the author to comparethe actual values of salt distribution with the predicted valuesof the modified Burns model, i.e. by taking into considerationonly the downward movement of salts (Equation 7). A goodagreement between the observed and predicted values of saltdistribution was observed (Table 4). A close resemblancebetween the values of the calculated and observed saltdistribution indicated that the dynamics of salt in a soilprofile can be accurately predicted by modified Burns model.
CONCLUSION
It is observed that empirical equations used forpredicting the sodicity hazards of irrigation waters, theModified Ayers and Westcot equation could fairly accuratelypredict the build up of ESP under all saline sodic waterconditions followed by Rhodes, Suarez and Bower equation.The prediction of salt distribution by Bresler and modifiedBurns model were very close to the actual observed valuesand hence both models could safely be used for predictingsalt distribution in soil profile after different irrigations underarid and semi arid conditions.
REFERENCESAyers, R. S. and Westcot, D. W. 1985. Water quality in agriculture.
FAO Irrig and Drain. Paper 29. Food and AgriculturalOrganisation,Rome, Italy. pp 174-76.
Bajwa, M. S.., Choudhary, O. P. and Josan, A. S. 1992. Effect ofcontinuous irrigation with sodic and saline-sodic waters onsoil properties and crop yields under cotton-wheat rotationin north-western India. Agriculture Water Management, 22 :345-356.
Bower, C. A., Ogata, G. and Tucker, J. M. 1968. Sodium hazard ofirrigation waters as influenced by leaching fraction and byprecipitation or solution of calcium carbonate. Soil Science,106 : 29-34.
Bresler,E. 1967. A model for tracing salt distribution in the soilprofile and estimating the efficient combination of waterquality and quantity under varying field conditions. SoilScience, 104 : 227-33.
Burns,I.G. 1974. A model for predicting the redistribution of saltsapplied to fallow soils after excess rainfall or evaporation.Journal of Soil Science, 25 : 165-78.
Day, P.R. and Forsythe, W.M.1957 Hydrodynamic dispersion ofsolutes in the soil moisture stream. Soil Science Society ofAmerica, Proceedings, 21 : 477-80.
Josan, A. S., Bajwa, M. S. and Choudhary, O. P. 1998. Effect ofsustained sodic irrigations on soil physical properties androot growth in a typic ustochrept soil under two croppingsystems. Journal of Research, 35 : 125-31.
Kapoor,A.K.and Pal,R. 1986. Predicting salinization andsodification of a bare sandy loam soil after irrigation withpoor quality water interspersed with rain. Soil Science, 141 :281-88.
Kumar,A. 1980. One dimensional model for predicting saltdistribution in uniform and layered soils under bare andcropped conditions, Ph.D. dissertation, Haryana AgrilculturalUniversity, Hissar, India.
Kumar,M.N. 1978. One dimensional models for prediction ofaccumulation and leaching of salts in two texturally differentsoils. Ph.D. dissertation, Haryana Agricultural University,Hissar, India.
Kumar,M.N., and Oswal, M.C..1984.Tests on one-dimensionalmodels for predicting salt dynamics in soils. Soil Science, 137 :408-14..
Miller,R.J., Biggar , J.W. and Nielsen ,D.R.. 1965. Chloridedisplacement in Panoche clay loam in relation to watermovement and distribution. Water Resource Research, 1 : 63-73.
Nielsen,D.R.and Biggar J.W.1962. Miscible displacement. III:Theoretical considerations. Soil Science Society of AmericaProceedings., 26 : 216-21.
Rhoades, J. D. 1968 Mineral weathering correction for estimatingthe sodium hazard of irrigation waters. Soil Science Society ofAmerica Proceedings, 32 : 648-51.
Suarez, D. L.1981. Relation between pH and sodium adjorptionratio and an alternative method of estimating SAR of soil ordrainage water. Soil Science Society of America Proceedings, 45 :469-74.
©2009
Biomediated release of phosphorus in rice growing soils ofJammu
Arvind Singh and A K Bhat
Division of Soil Science and Agricultural chemistry
FOA, SKUAST-J, Chatha, Jammu (J&K) India
ABSTRACT
The mineralization of added organic P in soils being less understood necessitated to evaluation of different sources oforganics. The performance of phosphate solubilising bacteria (PSB) in different soils of Jammu has been variable insolubilising phosphorus. PSB in soils of R.S.Pura was able to solubilise phosphorus to the tune of 19.40 mg kg-1, onthe other hand the survival of PSB in Chodroi soil was poor. Rice residues and wheat residues amended soils releasedlesser phosphorus than Sesbania and water hyacinth. Phosphorus mineralsable rate in the soils under study wasobserved in the range of 0.02% to 0.40% kg-1day-1.
Key Words : Organics-Residues –PSB-Soils
Journal of Eco-friendly Agriculture 4(1): 30-34 : 2009
INTRODUCTION
Much attention has been devoted to determine plant,biological and environmental factors influencing the releaseand mineralization of N from plant residues (Vanlauwe etal, 1996, Bhat et al., 1996). However, relatively few studieshave been made on the incorporation of plant residues onphosphorus cycling and its contribution to plant nutrition(Dalal, 1979; Mclaughlin et al., 1988a; Umrit and Friesen,1994). Of these studies, most were focused on chemicalreactions particularly, the effect of plant residues on portionand inorganic P fraction of soil (lyamuremye et al., 1996),few have considered biological transformation associatedwith the release of phosphorus from residues and subsequentaccumulation and turnover of organic P duringdecomposition (Mclaughlin et al., 1988a). Conventionallyavailable inorganic P soil testing may not properly assessthe potential contribution of residues phosphorus andphosphorus transformation following the decomposition ofresidues. Phosphorus immobilization by microorganisms,turnover of microbial P and mineralization of microbialbyproducts seem to major process regulating phosphoruscycling and phosphorus availability from plant residues(Mclaughlin et al., 1988b).
Varadarajan and Samuel (1958) and Mandal and Khan(1972) reported that substantial quantity of fertilizer can besupplemented through the incorporation of crop residuesinto the soil because the mineralization of organic forms ofphosphorus in soil contributes significantly to plant P uptake,although quantification of organic phosphorusmineralization has been impeded by methodology(Randhawa, 2005).
The efficiency of phosphatic fertilizer is very low dueto chemical fixation within a short period of its applicationin the soil complex. Besides poor solubility of native soil P,some times there is a build up of insoluble phosphorus dueto phosphatic fertilizers applied over a long period. In thissituation, seed or soil inoculation of phosphatic solubilizingmicroorganisms may benefit the crop by increasing Pavailability from insoluble source (Gaur, 1990). Because soilmicroorganisms have enromous potential in producing soilphosphates for plant growth. Phosphorus biofertilizers inthe form of microoganisms can help in increasing theavailability of accumulated phosphates for plant growth bysolubilization (Goldstein, 1986 and Gyaneshwar et al., 2002).Keeping these facts in view the experiment was designed toassess the impact of organics in releasing phosphorus in thesoils of Jammu.
MATERIALS AND METHODS
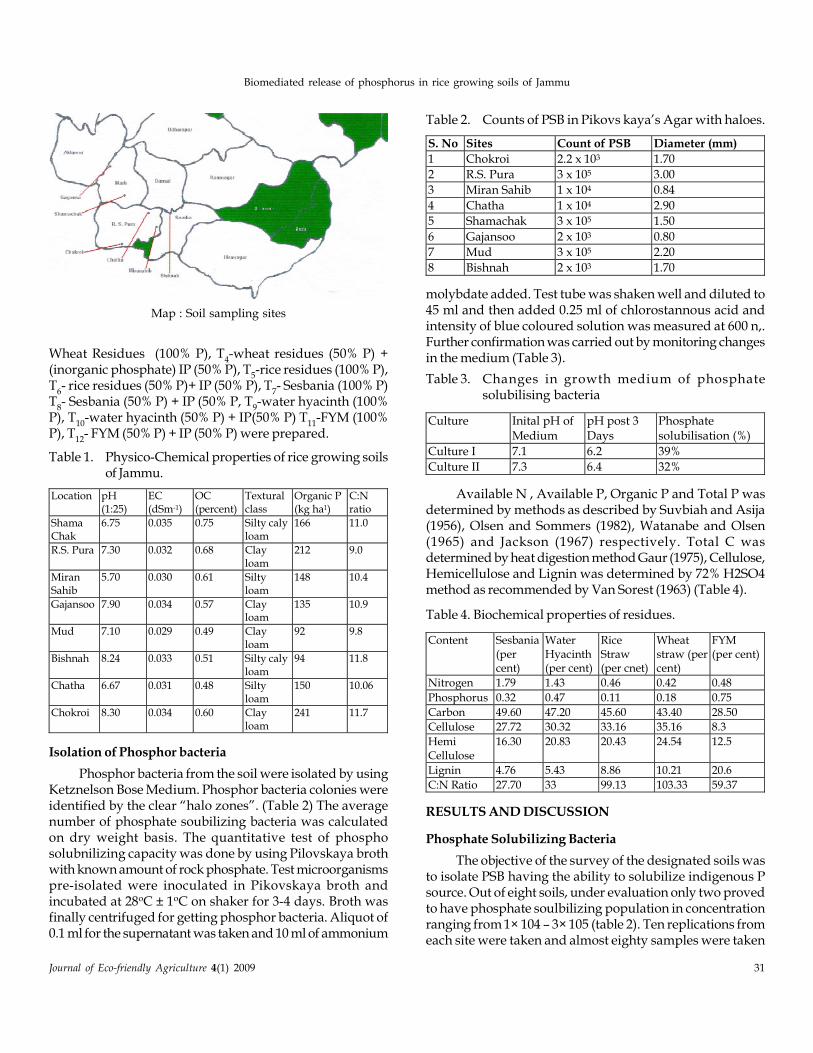
Jammu district of J & K State sprawls on an area of 3.2lakh hectares and is located between 32o44" and 32o55Nlatitude and 74o5’E longitude. Soil samples (0-15 cm depth)were obtained from different rice growing areas of Jammudistrict (map) for investigation and analyzed for differentphysico-chemical properties (Table 1). Soil samples (20 gm)from each site (Table 1) were incubated at 32oC ± 1 through aperiod of 59 days with and without residues and the P releasewas analyzed by ascorbic acid method through 0, 2, 9, 16,23, 30, 44 and 59 days of incubation at 60% of WHC. Loss ofmoisture was replenished at regular interval. To assess theimpact of organic residues (Table 4) and PSB on the releaseof P, twelve treatments namely, To- control, T
1 – inorganic
phosphorus, T2-phosphte solubilizing bacteria (PSB), T
3 –
Biomediated release of phosphorus in rice growing soils of Jammu
Journal of Eco-friendly Agriculture 4(1) 2009 31
Wheat Residues (100% P), T4-wheat residues (50% P) +
(inorganic phosphate) IP (50% P), T5-rice residues (100% P),
T6- rice residues (50% P)+ IP (50% P), T
7- Sesbania (100% P)
T8- Sesbania (50% P) + IP (50% P, T
9-water hyacinth (100%
P), T10
-water hyacinth (50% P) + IP(50% P) T11
-FYM (100%P), T
12- FYM (50% P) + IP (50% P) were prepared.
Isolation of Phosphor bacteria
Phosphor bacteria from the soil were isolated by usingKetznelson Bose Medium. Phosphor bacteria colonies wereidentified by the clear “halo zones”. (Table 2) The averagenumber of phosphate soubilizing bacteria was calculatedon dry weight basis. The quantitative test of phosphosolubnilizing capacity was done by using Pilovskaya brothwith known amount of rock phosphate. Test microorganismspre-isolated were inoculated in Pikovskaya broth andincubated at 28oC ± 1oC on shaker for 3-4 days. Broth wasfinally centrifuged for getting phosphor bacteria. Aliquot of0.1 ml for the supernatant was taken and 10 ml of ammonium
molybdate added. Test tube was shaken well and diluted to45 ml and then added 0.25 ml of chlorostannous acid andintensity of blue coloured solution was measured at 600 n,.Further confirmation was carried out by monitoring changesin the medium (Table 3).
Available N , Available P, Organic P and Total P wasdetermined by methods as described by Suvbiah and Asija(1956), Olsen and Sommers (1982), Watanabe and Olsen(1965) and Jackson (1967) respectively. Total C wasdetermined by heat digestion method Gaur (1975), Cellulose,Hemicellulose and Lignin was determined by 72% H2SO4method as recommended by Van Sorest (1963) (Table 4).
Table 1. Physico-Chemical properties of rice growing soilsof Jammu.
Location pH (1:25)
EC (dSm-1)
OC (percent)
Textural class
Organic P (kg ha1)
C:N ratio
Shama Chak
6.75 0.035 0.75 Silty caly loam
166 11.0
R.S. Pura 7.30 0.032 0.68 Clay loam
212 9.0
Miran Sahib
5.70 0.030 0.61 Silty loam
148 10.4
Gajansoo 7.90 0.034 0.57 Clay loam
135 10.9
Mud 7.10 0.029 0.49 Clay loam
92 9.8
Bishnah 8.24 0.033 0.51 Silty caly loam
94 11.8
Chatha 6.67 0.031 0.48 Silty loam
150 10.06
Chokroi 8.30 0.034 0.60 Clay loam
241 11.7
Map : Soil sampling sites
Table 2. Counts of PSB in Pikovs kaya’s Agar with haloes.
S. No Sites Count of PSB Diameter (mm)
1 Chokroi 2.2 x 10³ 1.70
2 R.S. Pura 3 x 10⁵ 3.00
3 Miran Sahib 1 x 10⁴ 0.84
4 Chatha 1 x 10⁴ 2.90
5 Shamachak 3 x 10⁵ 1.50
6 Gajansoo 2 x 10³ 0.80
7 Mud 3 x 10⁵ 2.20
8 Bishnah 2 x 10³ 1.70
Table 3. Changes in growth medium of phosphatesolubilising bacteria
Culture Inital pH of Medium
pH post 3 Days
Phosphate solubilisation (%)
Culture I 7.1 6.2 39%
Culture II 7.3 6.4 32%
Table 4. Biochemical properties of residues.
Content Sesbania (per cent)
Water Hyacinth (per cent)
Rice Straw (per cnet)
Wheat straw (per cent)
FYM (per cent)
Nitrogen 1.79 1.43 0.46 0.42 0.48
Phosphorus 0.32 0.47 0.11 0.18 0.75
Carbon 49.60 47.20 45.60 43.40 28.50
Cellulose 27.72 30.32 33.16 35.16 8.3
Hemi Cellulose
16.30 20.83 20.43 24.54 12.5
Lignin 4.76 5.43 8.86 10.21 20.6
C:N Ratio 27.70 33 99.13 103.33 59.37
RESULTS AND DISCUSSION
Phosphate Solubilizing Bacteria
The objective of the survey of the designated soils wasto isolate PSB having the ability to solubilize indigenous Psource. Out of eight soils, under evaluation only two provedto have phosphate soulbilizing population in concentrationranging from 1× 10⁴ – 3× 10⁵ (table 2). Ten replications fromeach site were taken and almost eighty samples were taken
32 Journal of Eco-friendly Agriculture 4(1) 2009
Arvind Singh and A K Bhat
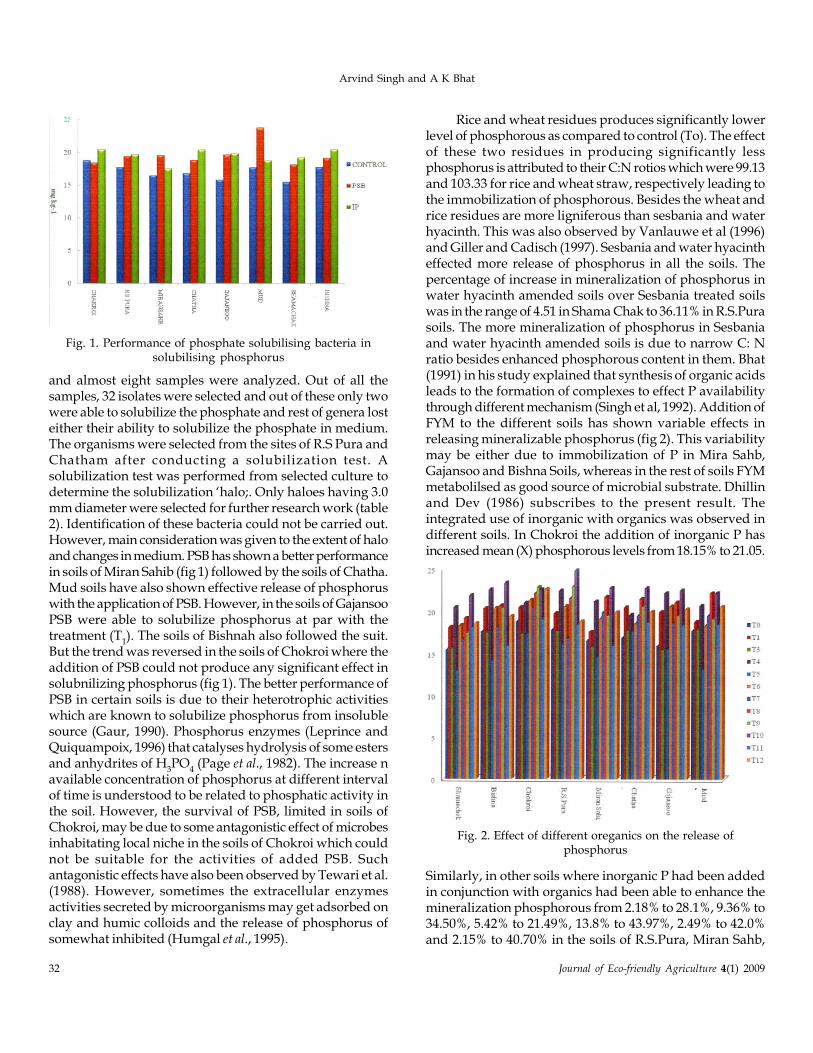
and almost eight samples were analyzed. Out of all thesamples, 32 isolates were selected and out of these only twowere able to solubilize the phosphate and rest of genera losteither their ability to solubilize the phosphate in medium.The organisms were selected from the sites of R.S Pura andChatham after conducting a solubilization test. Asolubilization test was performed from selected culture todetermine the solubilization ‘halo;. Only haloes having 3.0mm diameter were selected for further research work (table2). Identification of these bacteria could not be carried out.However, main consideration was given to the extent of haloand changes in medium. PSB has shown a better performancein soils of Miran Sahib (fig 1) followed by the soils of Chatha.Mud soils have also shown effective release of phosphoruswith the application of PSB. However, in the soils of GajansooPSB were able to solubilize phosphorus at par with thetreatment (T
1). The soils of Bishnah also followed the suit.
But the trend was reversed in the soils of Chokroi where theaddition of PSB could not produce any significant effect insolubnilizing phosphorus (fig 1). The better performance ofPSB in certain soils is due to their heterotrophic activitieswhich are known to solubilize phosphorus from insolublesource (Gaur, 1990). Phosphorus enzymes (Leprince andQuiquampoix, 1996) that catalyses hydrolysis of some estersand anhydrites of H
3PO
4 (Page et al., 1982). The increase n
available concentration of phosphorus at different intervalof time is understood to be related to phosphatic activity inthe soil. However, the survival of PSB, limited in soils ofChokroi, may be due to some antagonistic effect of microbesinhabitating local niche in the soils of Chokroi which couldnot be suitable for the activities of added PSB. Suchantagonistic effects have also been observed by Tewari et al.(1988). However, sometimes the extracellular enzymesactivities secreted by microorganisms may get adsorbed onclay and humic colloids and the release of phosphorus ofsomewhat inhibited (Humgal et al., 1995).
Rice and wheat residues produces significantly lowerlevel of phosphorous as compared to control (To). The effectof these two residues in producing significantly lessphosphorus is attributed to their C:N rotios which were 99.13and 103.33 for rice and wheat straw, respectively leading tothe immobilization of phosphorous. Besides the wheat andrice residues are more ligniferous than sesbania and waterhyacinth. This was also observed by Vanlauwe et al (1996)and Giller and Cadisch (1997). Sesbania and water hyacintheffected more release of phosphorus in all the soils. Thepercentage of increase in mineralization of phosphorus inwater hyacinth amended soils over Sesbania treated soilswas in the range of 4.51 in Shama Chak to 36.11% in R.S.Purasoils. The more mineralization of phosphorus in Sesbaniaand water hyacinth amended soils is due to narrow C: Nratio besides enhanced phosphorous content in them. Bhat(1991) in his study explained that synthesis of organic acidsleads to the formation of complexes to effect P availabilitythrough different mechanism (Singh et al, 1992). Addition ofFYM to the different soils has shown variable effects inreleasing mineralizable phosphorus (fig 2). This variabilitymay be either due to immobilization of P in Mira Sahb,Gajansoo and Bishna Soils, whereas in the rest of soils FYMmetabolilsed as good source of microbial substrate. Dhillinand Dev (1986) subscribes to the present result. Theintegrated use of inorganic with organics was observed indifferent soils. In Chokroi the addition of inorganic P hasincreased mean (X) phosphorous levels from 18.15% to 21.05.
Fig. 1. Performance of phosphate solubilising bacteria insolubilising phosphorus
Fig. 2. Effect of different oreganics on the release ofphosphorus
Similarly, in other soils where inorganic P had been addedin conjunction with organics had been able to enhance themineralization phosphorous from 2.18% to 28.1%, 9.36% to34.50%, 5.42% to 21.49%, 13.8% to 43.97%, 2.49% to 42.0%and 2.15% to 40.70% in the soils of R.S.Pura, Miran Sahb,
Biomediated release of phosphorus in rice growing soils of Jammu
Journal of Eco-friendly Agriculture 4(1) 2009 33
Chatha, Gajansoo, Shamachak and mud, respectively.Increases in mineralization might be due to the competitinwith P linked to Fe, Al and Ca that keeps part of organic P insoluble form. This is in contrast to the observation by Singhand Bagel (1993) that addition of 60 kg ha-1 P with organicsresulted lowering of P by 0.2 to 0.8 units.
Mineralisation rates of phosphorus deduced in thepresent study was observed in the range of 0.02 to 0.40 mgkg-1 day-1 and were lesser than those observed by Oehl et al.,(2001) and Hernandiz – Valencia and lopex- Hernandiz(1998). However it is well within the range described byRandhawa (2005).
In order to probe into joint effects of variousindependent variables on the release of phosphorus, the datawere subjected to multiple regression analysis using the bestpossible regression models involving statistical programmedSPSS 7.5 version. The adequacies of these models were alsotested. These regression models along with coefficient ofmultiple determination (Pearson’s r2) values have been givenin Table 5. All the fitted models were best fit as can be judgedwith the help of r2 value which was highly significant foreach individual regression equation, displaying that thereis joint contribution of different variables and had moresignificant effect unlike individual impact. It is worth notingthat for all the organics wheat straw, the consolidated impactof variables in their respective models was enhanced wheninorganic P was added. For Sesbania, FYM, water hyacinthand rice straw, the percent contribution of independentvariables increased from 62.80% to 67.50% to 79.70%, 56.30%to 75.60% and 49% to 61.00%, respectively, when inorganicP was added to these organics. But in case of wheat strawalone it was more (67.40%) as compared to wheat straw +inorganic P (54.20%). Further, for individual parameters aswell as its combination with inorganic P, the includedindependent variables were same. However, in some cases,the direction of relationships were opposite for instance incase of FYM had significantly inverse effect on it; whereas,this variable had direct effect when FYM was coupled withinorganic P. The increase in available P with the applicationof FYM was probably due to the addition of FYM and reducedfixation of phosphorus through chelating process. But FYMwas not able to reduce fixation in all the soils probably dueto the poor metabolization of carbon substrate in these soils.All the individual relationships between independentvariables under correlation with FYM effect on the relativerelease of phosphorus is also evident by highly significantcorrelation (r = 0.375). This view has also been held by Guptaet al., (1988) and Dhillon and Dave (1986). The significantand highly significant contribution of independent variableshave been marked with * and **, respectively (Table 5).
CONCLUSION
The conclusion drawn from the experiment, thatorganics like Sesbania and water hyacinth degraded faster
Table 5 Regression models of various study biochemicalparameters including maximum variables (Entermethod) and coefficients of determinations.
S. No Study parameter Regression model Coefficient of multiple
determination (%)
1 Sesbania 5541.10 + 396.05**X2 - 58.12**X3 + 0.98 X4 - 3.67 X5 + 11.47**X6 - 7.34**X8 - 19.11**X9
62.80**
2 Sesbania + IP 9385.67 + 594.82**X2 - 95. 40**X3 - 0.34X4 + 15.46**X5 + 16.05**X6 - 13.51**X5 - 29.46**X9
67.50**
3 FYM -34110.9 + 354.26**X1- 892.08**X2 41.00**X4 - 31.51**X5 - 55.08**X7 + 3.08**X8 - 486.48**X9
62.60**
4 FYM + IP -36169.4 + 347.44** X1 - 975.02** X2
-46.41** X4 - 34.194**X5 - 84.39 X9+4.189** X7 + 535.77** X9
79.70**
5 Wheat straw -12983.2 - 136.18** X1 + 2.42 X2 - 0.31** X3 - 33.97 X4 - 4.47 X7 + 42.26** X8 + 34.96** X9
67.40**
6 Wheat straw + IP
-14129.1 - 178.47** X9 - 10.89-0.29** X9-52.92 X9 + 4.67 X9 + 18.26 X9 + 48.29** X9
59.20**
7 Water hyacinth -29607.7+147.80** X1-295.03** + 121.07** X2 - 100.93 X3 - 8.48 X5 + 91.20** X7 + 242.93** X9
56.30**
8 Water hyacinth + IP
-35620.7 + 224.83** X1 - 411.32 X2+ 166.61X3 - 114.14** X5 - 14.01** X7 + 101.28** X8 + 289.25** X9
75.60**
9 Rice straw -1245.03+134.07**X1 + 186.25X2 -14.723X4 -112.52X5 -26.18X7 + 107.11X8 - 41.99*X9
49.00**
10 Rice straw + IP -12346.4-12.06X1 + 353.02X2
33.75**X4 + 177.80**X5 -212.57**X7 - 28.68X8 + 47.47*X9
61.00**
Independent variables: X1, X
2, X
3, X
4, X
5, X
6, X
7, X
8, X
9 represent N, P,
C, Cellulose , Hemicellulose, lignin, C:N. C:P, C:N:P, respectively.
* Significant at 5% probability level.
than wheat and rice residues, suggested that beneficial effectof former is immediate whereas, latter builds sustainablecarbon vis-à-vis phosphorus in soils. Isolation of P S B andtheir better performance in some soils indicates that congenialsoil niche for these microbes is essential. Further investigationis needed to explore the PSB biodiversity in soils of Jammufor isolation and selection of promising phosphate solubilsersfor harnessing better crop yield.
ACKNOWLEDGEMENT
Authors are thankful to Prof. V.K.Jalali, Ex HOD Div.of Soil Sci. & Agricultural Chemistry for providing facilitiesfor conducting this work at FOA, Chatha.
34 Journal of Eco-friendly Agriculture 4(1) 2009
Arvind Singh and A K Bhat
REFERENCES
Bhat, A.K.; Beri, V. and Sidhu, B.S. (1991). Effect of long-termrecycling of crop residues on soil productivity. Indian Societyof Soil Science, 39: 380-382.
Bhat, A.K. (1991). Existence of organic acids on incorporation ofcrop residues to soil. Advances in Plant Science, 4: 329-336.
Dalal, R.C. (1979). Mineralization of carbon and phosphorus fromcarbon-14 and phosphorus-32 labeled plant material added tosoil. Soil Science Society of American Journal, 43: 913-916.
Dhillin, N.S. and Dev, G. (1986). Effect of applied P, FYM andmoisture regimes as transformation of inorganic phosphate.Journal of the Indian Society of Soil Science, 34: 605-607.
Gaur, A.C. (1990). Phosphate Solubilizing Microorganisms asBiofertilizer. Omega scientific publishers. New Delhi, I.
Gaur, A.C. (1975). Analysis of compost. In: A Manual of RuralComposting. Project field document no. 25, FAO (U.N.O) pp89.
Griller, K.E. and Cadisch, G. (1997). Driven by nature? A sense ofarrival and departure? In: “Driven by Nature: Plant LitterQuality and Decomposition”. (G. Cadish and K.E. Giller eds.),pp. 393-399. CAB International, Wallingford, UK.
Goldstein, A.T.L. (1986). Bacterial phosphate solubilization.Historical perspective and future prospects. American Journalof Alternative Agriculture, 1: 57-65.
Gupta, A.P; Antil, R.S. and Narwal, R.P. (1988). Effect of farmyardmanure on organic carbon, available N and P content of soilduring different periods of wheat growth. Journal of the IndianSociety of the Soil Science, 36: 269-273.
Gyaneshwar, P.; Kumar, G.N. and Parekh, L.J. (2002). Effect ofbuffering on the phosphate solubilizing ability ofmicroorganism’s world. Journal of Microbial Biotechnology. 14:669-673.
Hernandiz-Valencia, I. and Lopezo-Hernandiz, D. (1998).Allocation of phosphorus in a tropical savanna. Chemosphere,39: 199-207.
Hungal, Q.; Shindo, H. and Gosh, T.B. (1995). Adsorption, activitiesad kinetics of acid phosphates as influenced bymontmorillonite with different inter layer material. SoilScience, 159: 271-278.
Iyamuremye, F.R.; Dick, R.P. and Bahan, J. (1996). Organicamendments and phosphorus dynamics: Distribution of soilphosphorus fractions. Soil Science, 161: 436-443.
Jackson, M.L. (1967). Soil Chemical Analysis. Prentice Hall ofIndia Pvt. Ltd. New Delhi.
Ketznelson, H. and Bose B. (1959). Metabilic activity andphosphate dissolving capability of bacterial isolates formwheat roots, rhizosphere and non-rhizosphere soil. Canadian.Journal of Micorobiolgy, 5: 79-89.
Leprince, F. and Quiquampoix, H. (1996). Extracellular enzymeactivity in soil: Effect of pH and ionic strength on theinteraction with montmorillonite of two acid phosphatessecreted by the actomycorrhizal fungus Hebelomacylindrosporum. European journal of Soil Science, 47: 511-522.
Mandal, L.N. and Khan, S.K. (1972). Release of phosphorus frominsoluble phosphatic fertilizer in acidic low land rice soils.Journal of the Indian Society of Soil Science, 20: 343-353.
Mclaughlin, M.J; Alston, A.M. and Martin, J.K. (1988a).Phosphorus cycling in wheat-posture rotation I. The source ofphosphorus taken up by wheat. Australian journal of SoilResearch, 26: 323-331.
Mclaughlin, M.J; Alston, A.M. and Martin, J.K. (1988b).Phosphorus cycling in wheat-posture rotation II. The role ofthe microbial biomass in phosphorus cycling. Australian Journalof Soil Research, 26: 333-342.
Oehl, F.; Oberson, A.; Sinaj, S. and Frossard, E. (2001). Organicphosphorus studies using isotopic dilution techniques. soilScience Society of American Journal, 65: 780-787.inc.
Olsen, S.R. and Sommers, L.E. (1982). Phosphorus. In: Methods ofSoil Analysis. Part-2. 2nd edn., A.L. Page et al. (eds.), AmericanSociety of Agronomy, Madison, pp. 403-430.
Page, A.L.; Miller. R.H. and Kenney, D.R. (1982). In: “Methods ofSoil Analysis, Part 2. Chemical and Micorbiologicalproperties”. Second edn. American Society of Agronomy andSoil Science Society of America, Inc. Madison, WI.
Randhawa, P. (2005). Effect of green manure addition on soilorganic phosphorus mineralization. Nutrient Cycling inAgrosystem, 73: 181-189.
Singh, A. and Bahel, G.S. (1993). Phosphate equilbria in soils inrelation to added P, Sesbania aculeate corporation andcropping – A study of solubility relationships. Journal of theIndian Society of Soil Science, 14: 233-237.
Singh, Y.; Singh, V. and Khind, C.S. (1992) Nutrient transformationin soil amended with green manures. Advances in Soil Science,20: 237-39.
Subbiah, B.V. and Asija, G.L. (1956). A rapid procedure for theestimation of available nitrogen in soils. Current Science, 25:259-260.
Tewari, S.C.; Tewari, B.K. and Mishra, R.R. (1988). Enzymeactivities in soils: Effects of leaching, ignition, autoclavingand fumigation. Soil Biology and Biochemistry, 20: 583-585.
Umrit, G. and Friesen, D.K. (1994). The effect of C:P ratio of plantresidues added to the soils of contrasting phosphate sorptioncapacities on P uptake by Panicum maximum. Plant and Soil, 158:
Vanlauwe, B.; Nwoke, O.; Sanginga, N. and Merckz, R. (1996).Impact of residue quality on the C and N mineralization ofleaf and root residues of three agro-forestry species. Plant andSoil, 183: 221-231.
VanSoest, P.J. (1963). Ore of detergents in the analysis of fibrousfeeds. II. A rapid method for the determination of fibre andlignin. Journal of Association Office Agricultural Chemistry, 46:829.
Varadarjan, S. and Samuel, D.M. (1958). Crop residues of paddyand their manorial value. Madras Agriculture, 43: 341-345 275-285.
Watanabe, F.S. and Olsen, S.R. (1965). Test of an ascorbic acidmethod for determination of phosphorus in water andNaHCO
3 extracts from soil. Soil Science Society of American
Proceedings, 30: 51-55.
©2009
Effect of vermicompost amended alluvial soil on growth andmetabolic responses of rice (Oryza sativa L.) plants
S.N Panday* and Amalesh Yadav
Botany Department, Lucknow University, Lucknow – 226007, Uttar Pradesh, India
ABSTRACT
The pot experiment conducted with low fertile allvial soil amended with vericompost at 0, 10%, 25%, 50% and 75%showed higher stimulatory effects at 50.0 per cent amendment level of vericompost than the NPK (120:60:60) withrespect to growth and biochemical responses in Oryza sativa L.
Key words: Vermicompost, alluvial soil, Oryza sativa L, metabolic responses.
Journal of Eco-friendly Agriculture 4(1): 35-37 : 2009
INTRODUCTION
The generation of huge amount of solid waste materialsby urban population in many cities is a worldwideenvironmental pollution problem. Another serious problemis decline in food production through loss of soil quality dueto excess application of inorganic fertilizers. These pose agreat socio-economic problems and loss in food quality(Edwards, 1995; Bisht et at; 2007). Emphasis is currently beinglaid on use of vermicompost in agriculture with a view tominimize the synthetic chemical fertilizers inputs andcurtailing down the environmental pollution.Vermicomposting offers a key strategy against the negativeconsequences of excess use of inorganic fertilizers inagricultural fields and discharge of soil wastes into the openenvironment. The degradable solid waste materialconversion into organic compost using earthworms becamea product to sustain the agricultural and environmentalquality.
Benefits of compost application in agriculture dependsupon the sources of production and physico-chemicalproperties of vermicompost. These, particularly the essentialnutrients level in the vermicompost, affect the metabolicactivities in plants, consequently, the growth of the plants.Some workers reported it unsuitable for amendment in thesoil because of high content of heavy metals in it (Fernandezand Ramirez 2002). Therefore, study was undertaken toevaluate the fertilizers value of vermicompost produced fromurban population (Badashah bagh area, Lucknow) and itsimpact in amendment of alluvial soil of low fertility ongrowth and physiological responses of rice (Oryza sativa L.).The results were compared with that of NPK (120:60:60)applied soil.
MATERTALS AND METHODS
The vermicompost samples were collected from“Muskan Jyoti Society”, that produces it from urban solidwastes in Badshah bagh area, Lucknow. The samplescollected at 10 consecutive days and pooled to make acomposite sample was analyzed for its fertilizer value (Table1). The composite soil sample collected from Aliganj area,Lucknow was also analyzed for their physico-chemicalproperties. Vermicompost was amended in soil at differentgrades viz, 0, 10.0, 25.0, 50.0 and 75.0%. A control treatment
Corresponding Author : [email protected]
Table 1: Physio – chemical properties of composite alluvialsoil of Lucknow and vermicompost samples usedin the experiment.
Parameters Average value
Alluvial Soil Vermicompost
Texture Sandy loam -
Bulk density 1.48 1.76
pH 7.50 6.35
Electrical conductivity (m
mhos/cm)
0.32 0.40
Organic mater (%) 0.19 48.85
Available N (Kgha-1) 160.00 250.00
Available P (Kgha-1) 75.00 200.00
Available K (Kgha-1) 78.00 180.00
Available Zn (ppm) 1.45 5.50
Available Cu (ppm) 0.80 1.62
Available Fe (ppm) 2.26 4.50
with NPK (120:60:60) was simultaneously run forcomparision. Each treatment was triplicated. The rice (Oryzasativa L.) plants were grown in earthen pots filled withvermicompost and NPK amended soils. Test plants wereobserved for visible symptoms, growth (length, biomass,yield) and metabolic responses (chlorophyll a and b contents,amylase, catalase and peroxidase activity). The plants were
36 Journal of Eco-friendly Agriculture 4(1) 2009
S.N Panday and Amalesh Yadav
harvested from the soil level, washed with deionised water,blotted dry, chopped into fine pieces and later dried in aforced air oven at 70oC for 24 hours at 68 days growth for drymatter yield. Biochemical parameters were determined inyoung leaves (3rd to 4th leaf from the top). The photosyntheticpigments (chlorophyll a, b) was estimated following themethod of Lichtenthaler (1983). The method followed forassaying the catalase and amylase activity was of Eullerand Josephson (1959) and Katsuni and Fekuhara (1969),respectively. Data presented in the table are the mean ± SEvalues of the three replicates and were statistically tested bystudent ‘t’ test.
mild calcareous nature and deficient in some micro nutrients(Table –1) as also described by Agarwala et al. (1979).
The vermicompost amendment in soil increased therice, Oriza sativa L. plant growth. The maximum growth yieldwas observed at 50.0% amendment level. Tillering was dosein dependent. Leaf tip burning and chlorosis (in youngleaves) of plants grown at 75.0% amendment was noticedspreading from the top. These could be due to the disordersin availability of some essential elements at high dose ofvermicompost amendment in soil (Agrawala and Sharma,
Table 2: The effect of vermicompost amendment in alluvial soil on growth and metabolic responses in rice, Oryza sativa L.plants at 65 days growth.
Parameters NPK (120:60:60) Vermicompost amendment (%)
O 10 25 50 75
Length (cm) 21.92 19.0 24.66 25.61 29.16 28.86
± 1.66 ± 0.63 ± 2.52** ± 1.51* ± 1.21* ± 1.01
Dry weight (g)/plant 4.10 3.00 3.45 4.61 5.54 508
± 0.01 ± 0.02 ± 0.02 ± 0.02 ± 0.01 ± 0.02
Tillers/plant 1.34 1.32 2.66 3.00 3.00 4.66
± 1.16* ± 0002 ± 2.33* ± 0.33 ± 0.33 ± 1.53*
Chlorophyll
mg/g/F.W.
a 2.80 1.82 2.30 4.07 4.00 3.60
± 0.13 ± 0.13 ± 0.12 ± 0.20 ± 0.11 ± 0.12
b 2.10 0.98 1.80 2.82 3.10 2.01
± 0.20 ± 0.43 0.04 0.04 0.13 0.11
Amylase (mg/g F.W) 9.40 6.23 8.56 10.22 10.85 6.88
± 1.50 ± 0.1.52* ± 1.16* ± 0.33 ± 0.02 ± 1.21
Catalase (mg/g F.W.) 42.50 32.00 48.60 55.20 58.81 60.50
± 0.43 ± 0.13 ± 0.11 ± 1.21* ± 0.33 ± 1.21
Peroxidase (mg/g F.W)
40.90 15.35 70.56 40.31 39.20 35.00
± 0.20 ± 0.43 ± 0.24 ± 0.26 ± 0.04 ± 0.02
RESULTS AND DISCUSSION
The vermicompost (VC) was slightly acidic. Itcontained high organic matter, essential macro nutrient(available N 25.0, P 200 and K 180 Kg ha-1) and micronutrients(DTPA extractable available Zn 5.5, Cu 1.62 and Fe 4.5 ppm).The vermicompost, produced from other sources of solidwaste materials had high fertilizer values indicating itssuitability for amendment in agricultural fields as reportedby some workers (Atiyeh et al; 2002; Zaller, 2007). Highorganic matter content with humic substances and growthhormones make it suitable in improveing the soil quality(Cavender et at; 2003). Composite sample of alluvial soilcollected from Aliganj area, Lucknow, used for graded levelof vermicompost amendment (0, 10, 25, 50 and 75%) was of
1976). The pigment contents (chlorophyll a and b) increasedwith increase in amendment levels but did not showsignificant difference above 25.0% level. The amylase activitywas stimulated upto 50.0% level while further increasingbeyond this supperesed amylase activities in leaves. Theamylase activity hydorlyze the starch to provide energy forthe metabolic activities in plant cell, (Thevenot et al., 1992).Thus, the increased biomass yield in rice plant may becorrelated with increased amylase activity.
The peroxidase activity was found maximum at 10.0%amendment level and declined with further increase. Thecatalase activity was low at 25.0 and 50.0% level comparedto control. Catalase activity was maximum at 75.0% leveldue to the increase in stress conditions created by nutritional
F.W. = Fresh weight, ± -SE value, *Significant at 0.05 level, **Significant at 0.01 level.
Journal of Eco-friendly Agriculture 4(1) 2009 37
Effect of vermicompost amended alluvial soil on growth and metabolic responses of rice (Oryza sativa L.) plants
disorders. The production of H2O
2 during stress conditions
damage the cells, converted into H2 O and O
2 by catalase.
The peroxidase and catalase activities protect plant cellsunder stress conditions by their antioxidative reactions inplants. The growth and metabolic attributes of vermicompostamendment in rice was more effective at 50.0% than the NPK(120:60:60) in alluvial soil.
CONCLUSION
It can thus be concluded from the findings that thevermicompost produced from solid wastes is suitable topromote growth of rice plants in alluvial soil. Its amendmentat 50.0 per cent level in the less alluvial soil was foundeffective in stimulating the growth and metabolic process ofrice than the NPK (120:60:60).
REFERENCES
Agrawala, S.C. and Sharma, C.P. 1976. Rcognisiningmicronutrients disorders of crop plants on the basis of visiblesymptoms and plant analysis. Botany Department, LucknowUniversity, Lucknow, India.
Agarwala, S.C.; Methrotra, N.K. and Sharma C.P 1979. Nutritionaldisorders associated with problem soils of Uttar Pradesh. In;Micronutrients in agriculture Lucknow University, Lucknow.71-86.
Atiyeh, R.M.; Arancon, N.Q.; Edwards, C.A. and Metzger, J.D.2002. Incorporation of earthworm-processed organic wastesinto green house container media for production of marigolds.Bioresource Technology. 81:103-108.
Bisht, K.; Kulshrestha, K.Mahapatra, B.S. 2007. Qualitycharacteristics of mustard grown by inorganic and organicfarming. Journal of Ecofriendly Agriculture. 2:120-122.
Cavender, N.D.; Atiyeh, R.M.; Michael, K. 2003. Vermicompoststimulates mycorrhizall colonization of roots of Sorghumbicolor at the expence of plant growth. Pedobiologia 47:85-89.
Edwards, C.A. 1995. Commercial and environmental potentialof vermicomposting, A historical overview. Biocyle Waste Recyl.24:62-63.
Euller, H.; Josephson, k. 1959. Method uber kalatani liebigs Anoncatalase activity. Annals Botany. 452: 158-184.
Fernadez, R. and Ramirez, A. 2002. Goquimica de lacontaminacion urbana. Ciencia. 10:94-101.
Jordao, C.P.; Fialho, L.L.; Cecon, P.R.; Matos, A.T.; Neves, J.C.L.;Mendonca, E.S. and Fontes, R.L.F. 2005. Effect of Cu, Ni andZn on lettuce grown in metal-enriched vermicompostamended soil. Water, Air and Soil Pollution. 174: 21-38.
Katsuni, M.; and Fekuhara. 1969. The activity of amylase in shootand its relation to induced elongation. Physiol. Plan, 22:68-75.
Lichtenthaler, H.K. and Wellburn, A.R.1983. Determination ofchlorophyll a and b of leaf extracts in different solvents.Biochemistry Society Transition. 11: 591-598.
Thevenot, C.; Lauriere, C.; Mayer, c. and Daussant, J. 1992. Aamylase changes during development and germination ofmaize kernels. Journal of Plant Physiology 140:61-65.
Zaller JG (2007). Vermicompost as a substitue for peat in pottingmedia: Effects on germination, biomass allocation, yields andfruit quality of three tomato varieties. Sci. Mort., 112: 191 –199.
©2009
F2 Population size for breeding for resistance to root and Stalk
lodging in Maize (Zea mays L)
D.K. Verma1 and K.R.Dhiman2
Division of Plant BreedingICAR Research Complex for NEH region, Umiam, Meghalaya, India –793 103
Present address:1 Dr D K Verma, Senior Scientist (Genetics/Cytogenetics), IARI regional station Pusa, Samastipur, Bihar – 848 125 E-mail: [email protected]. Dr K R Dhiman, Pricipal Scientist and head CPRI Regional station, Kufri, Shimla, H.P.
ABSTRACT
The experiment conducted to estimate changes in genetical parameters with changes in population size and to obtainadequate F-2 population size for traits like resistance to root and stalk lodging at maize Breeding Block Umian(Barapani) Meghalaya indicated possibilities of further work with lower number of plants.
Key words: Population size, resistance breeding, lodging, maize.
Journal of Eco-friendly Agriculture 4(1): 41-44 : 2009
INTRODUCTION
Root and stalk lodging is one of the most importanttrait in commercial maize breeding. One of the main causesthat increase root and stalk lodging is presence of pathogenslike Fusarium, so the maize breeder has to pay special attentionto resistance to these pathogens during the selection process.The generation of maximum gene recombination being theF
2 population, its influence was studied for grain yield and
other traits, but there is no evidence of the optimal size of F2
population necessary to develop hybrid combinationsresistant to pathogens of maize root and stalk lodging.Therefore, an attempt was made to estimate changes ingenetical parameters with changes in population size andto obtain the adequate F
2 population size for trait such as
resistance to root and stalk lodging.
MATERIAL AND METHODS
The genetic material evaluated in the present study wasF2 population RCM-98 derived from cross of two inbred lines,RC-AGM-INB-56 and RC-AGM-INB-67. Inbred line RCM-AGM-INB-56 is derived from crossing RCM 1-1 x RC-AGM-INB-67 (Khasi Riew Hadem) germplasm for which the FAOmaturity group is 550. RC-AGM-INB-56 has good generalcombining ability and is tolerant to root and stalk lodging.The inbred line RC-AGM-INB-67, a semi-dent type for whichthe FAO maturity group is 700 RC-AGM-INB-67, hasexcellent general combining ability, but sensitive to rootlodging in Umian (Barapani), Meghalaya, India conditions.F
1 generation of RC-AGM-INB-56 x RC-AGM-INB-67 was
self pollinated in 2000 to obtain F2 population. In 2001, 225
S0 plants randomly selected from F2 population RC-AGM-
INB-67 were selfed and crossed to six plants of tester that
was inbred line RC-AGM-INB-2. Inbred line RC-AGM-INB-25 is a flint type, derived from Khasian germplasm for whichthe FAO maturity group is 450. RC-AGM-INB-25 shows highheterotic effects with both RC-AGM-INB-56 and RC-AGM-INB-67 inbred line, and is tolerant to root lodging.
A total of 225 entries (half-sib progenies) were evaluatedwithin 35 sets of a replication within sets randomizedincomplete block experiment (Cochran and Cox, 1957). Eachset consisted of 15 half-sib progenies completely randomizedwith each of the three replications. The entries were grownat Maize Breeding Block, Umian (Barapani), Meghalaya, Indiain 2002 and in 2003. A plot consisted of 5m long hand-dibbled rows with 0.60m between rows. Over-planted plotswere thinned to a uniform plant density of approximately67,284 plants ha-1. All experiments were manually cultivatedand weeded as necessary for proper weed control. Data werecollected at harvest for root and stalk lodging on five scalesnamely, 1-stalk broken bellow the tassel, 2-stalk brokenabove the ear, 3-stalk broken at the level of the ear, 4-stalkbroken bellow the ear, 5-totally lodged stalk.
The analysis of data was based on plot means. Datawere analysed by pooling over sets and combining acrossenvironments. From basic population size of 225 half-sibprogenies (25 sets with 20 half-sib progenies) 53,130population with size of 100 half-sib progenies, 3,268,760population with size of 200 half-sib progenies and 3,268,760population with size of 300 half-sib progenies were obtainedthrough computer simulation. Form total number ofcombinations 30 samples for each population sizes, except500 where only one sample was possible were randomlyselected. Comparisons of mean values between different
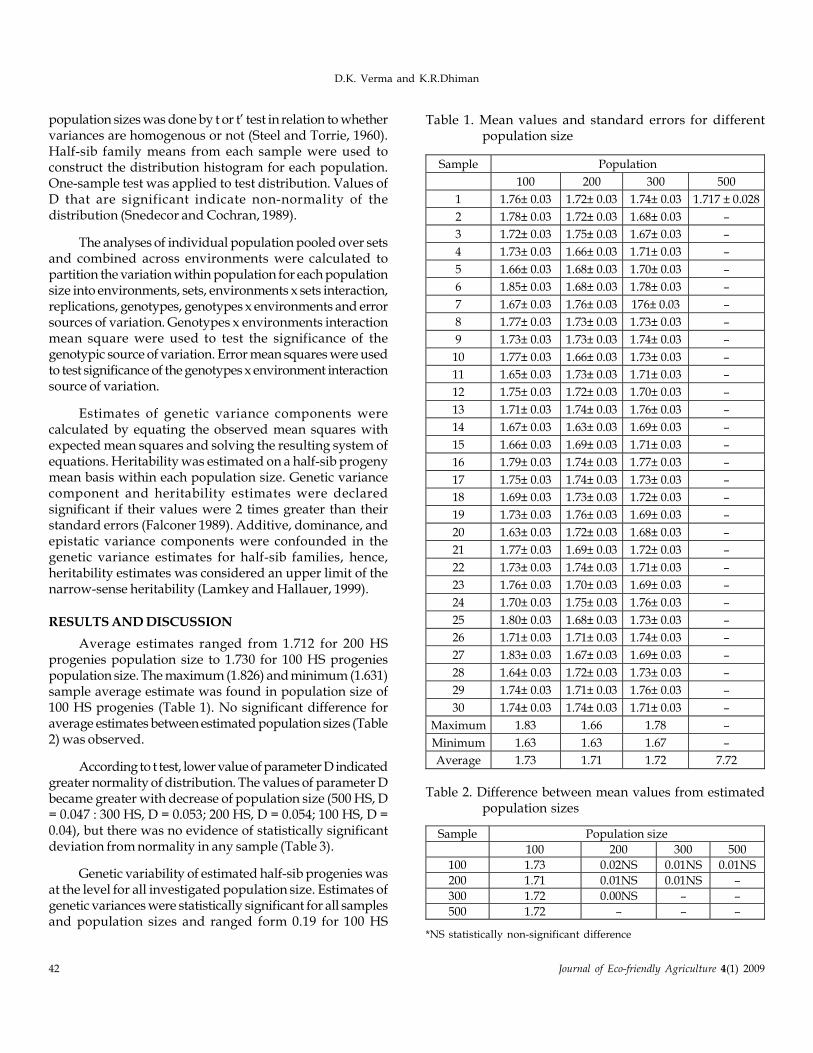
42 Journal of Eco-friendly Agriculture 4(1) 2009
D.K. Verma and K.R.Dhiman
population sizes was done by t or t’ test in relation to whethervariances are homogenous or not (Steel and Torrie, 1960).Half-sib family means from each sample were used toconstruct the distribution histogram for each population.One-sample test was applied to test distribution. Values ofD that are significant indicate non-normality of thedistribution (Snedecor and Cochran, 1989).
The analyses of individual population pooled over setsand combined across environments were calculated topartition the variation within population for each populationsize into environments, sets, environments x sets interaction,replications, genotypes, genotypes x environments and errorsources of variation. Genotypes x environments interactionmean square were used to test the significance of thegenotypic source of variation. Error mean squares were usedto test significance of the genotypes x environment interactionsource of variation.
Estimates of genetic variance components werecalculated by equating the observed mean squares withexpected mean squares and solving the resulting system ofequations. Heritability was estimated on a half-sib progenymean basis within each population size. Genetic variancecomponent and heritability estimates were declaredsignificant if their values were 2 times greater than theirstandard errors (Falconer 1989). Additive, dominance, andepistatic variance components were confounded in thegenetic variance estimates for half-sib families, hence,heritability estimates was considered an upper limit of thenarrow-sense heritability (Lamkey and Hallauer, 1999).
RESULTS AND DISCUSSION
Average estimates ranged from 1.712 for 200 HSprogenies population size to 1.730 for 100 HS progeniespopulation size. The maximum (1.826) and minimum (1.631)sample average estimate was found in population size of100 HS progenies (Table 1). No significant difference foraverage estimates between estimated population sizes (Table2) was observed.
According to t test, lower value of parameter D indicatedgreater normality of distribution. The values of parameter Dbecame greater with decrease of population size (500 HS, D= 0.047 : 300 HS, D = 0.053; 200 HS, D = 0.054; 100 HS, D =0.04), but there was no evidence of statistically significantdeviation from normality in any sample (Table 3).
Genetic variability of estimated half-sib progenies wasat the level for all investigated population size. Estimates ofgenetic variances were statistically significant for all samplesand population sizes and ranged form 0.19 for 100 HS
Table 1. Mean values and standard errors for differentpopulation size
Table 2. Difference between mean values from estimatedpopulation sizes
Sample Population size
100 200 300 500
100 1.73 0.02NS 0.01NS 0.01NS
200 1.71 0.01NS 0.01NS –
300 1.72 0.00NS – –
500 1.72 – – –
*NS statistically non-significant difference
Sample Population
100 200 300 500
1 1.76± 0.03 1.72± 0.03 1.74± 0.03 1.717 ± 0.028
2 1.78± 0.03 1.72± 0.03 1.68± 0.03 –
3 1.72± 0.03 1.75± 0.03 1.67± 0.03 –
4 1.73± 0.03 1.66± 0.03 1.71± 0.03 –
5 1.66± 0.03 1.68± 0.03 1.70± 0.03 –
6 1.85± 0.03 1.68± 0.03 1.78± 0.03 –
7 1.67± 0.03 1.76± 0.03 176± 0.03 –
8 1.77± 0.03 1.73± 0.03 1.73± 0.03 –
9 1.73± 0.03 1.73± 0.03 1.74± 0.03 –
10 1.77± 0.03 1.66± 0.03 1.73± 0.03 –
11 1.65± 0.03 1.73± 0.03 1.71± 0.03 –
12 1.75± 0.03 1.72± 0.03 1.70± 0.03 –
13 1.71± 0.03 1.74± 0.03 1.76± 0.03 –
14 1.67± 0.03 1.63± 0.03 1.69± 0.03 –
15 1.66± 0.03 1.69± 0.03 1.71± 0.03 –
16 1.79± 0.03 1.74± 0.03 1.77± 0.03 –
17 1.75± 0.03 1.74± 0.03 1.73± 0.03 –
18 1.69± 0.03 1.73± 0.03 1.72± 0.03 –
19 1.73± 0.03 1.76± 0.03 1.69± 0.03 –
20 1.63± 0.03 1.72± 0.03 1.68± 0.03 –
21 1.77± 0.03 1.69± 0.03 1.72± 0.03 –
22 1.73± 0.03 1.74± 0.03 1.71± 0.03 –
23 1.76± 0.03 1.70± 0.03 1.69± 0.03 –
24 1.70± 0.03 1.75± 0.03 1.76± 0.03 –
25 1.80± 0.03 1.68± 0.03 1.73± 0.03 –
26 1.71± 0.03 1.71± 0.03 1.74± 0.03 –
27 1.83± 0.03 1.67± 0.03 1.69± 0.03 –
28 1.64± 0.03 1.72± 0.03 1.73± 0.03 –
29 1.74± 0.03 1.71± 0.03 1.76± 0.03 –
30 1.74± 0.03 1.74± 0.03 1.71± 0.03 –
Maximum 1.83 1.66 1.78 –
Minimum 1.63 1.63 1.67 –
Average 1.73 1.71 1.72 7.72
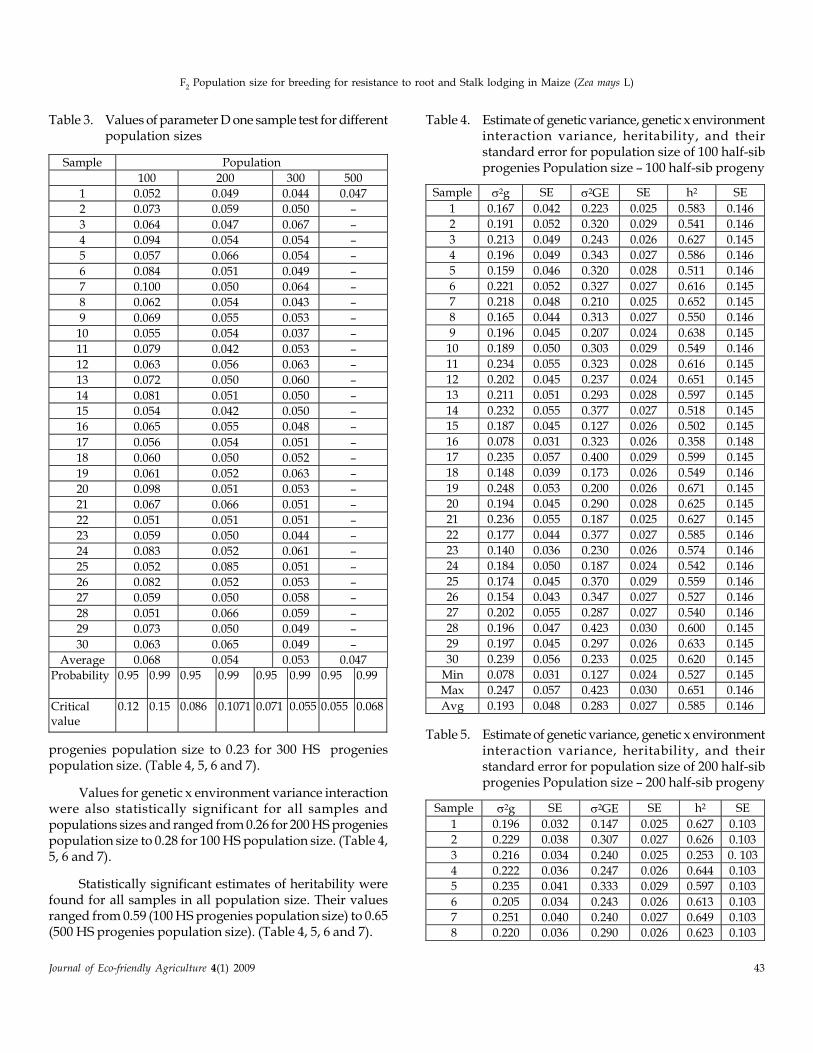
Journal of Eco-friendly Agriculture 4(1) 2009 43
F2 Population size for breeding for resistance to root and Stalk lodging in Maize (Zea mays L)
Table 3. Values of parameter D one sample test for differentpopulation sizes
Sample Population
100 200 300 500
1 0.052 0.049 0.044 0.047
2 0.073 0.059 0.050 –
3 0.064 0.047 0.067 –
4 0.094 0.054 0.054 –
5 0.057 0.066 0.054 –
6 0.084 0.051 0.049 –
7 0.100 0.050 0.064 –
8 0.062 0.054 0.043 –
9 0.069 0.055 0.053 –
10 0.055 0.054 0.037 –
11 0.079 0.042 0.053 –
12 0.063 0.056 0.063 –
13 0.072 0.050 0.060 –
14 0.081 0.051 0.050 –
15 0.054 0.042 0.050 –
16 0.065 0.055 0.048 –
17 0.056 0.054 0.051 –
18 0.060 0.050 0.052 –
19 0.061 0.052 0.063 –
20 0.098 0.051 0.053 –
21 0.067 0.066 0.051 –
22 0.051 0.051 0.051 –
23 0.059 0.050 0.044 –
24 0.083 0.052 0.061 –
25 0.052 0.085 0.051 –
26 0.082 0.052 0.053 –
27 0.059 0.050 0.058 –
28 0.051 0.066 0.059 –
29 0.073 0.050 0.049 –
30 0.063 0.065 0.049 –
Average 0.068 0.054 0.053 0.047
Probability 0.95 0.99 0.95 0.99 0.95 0.99 0.95 0.99
Critical value
0.12 0.15 0.086 0.1071 0.071 0.055 0.055 0.068
progenies population size to 0.23 for 300 HS progeniespopulation size. (Table 4, 5, 6 and 7).
Values for genetic x environment variance interactionwere also statistically significant for all samples andpopulations sizes and ranged from 0.26 for 200 HS progeniespopulation size to 0.28 for 100 HS population size. (Table 4,5, 6 and 7).
Statistically significant estimates of heritability werefound for all samples in all population size. Their valuesranged from 0.59 (100 HS progenies population size) to 0.65(500 HS progenies population size). (Table 4, 5, 6 and 7).
Table 4. Estimate of genetic variance, genetic x environmentinteraction variance, heritability, and theirstandard error for population size of 100 half-sibprogenies Population size – 100 half-sib progeny
Sample 2g SE 2GE SE h2 SE
1 0.167 0.042 0.223 0.025 0.583 0.146
2 0.191 0.052 0.320 0.029 0.541 0.146
3 0.213 0.049 0.243 0.026 0.627 0.145
4 0.196 0.049 0.343 0.027 0.586 0.146
5 0.159 0.046 0.320 0.028 0.511 0.146
6 0.221 0.052 0.327 0.027 0.616 0.145
7 0.218 0.048 0.210 0.025 0.652 0.145
8 0.165 0.044 0.313 0.027 0.550 0.146
9 0.196 0.045 0.207 0.024 0.638 0.145
10 0.189 0.050 0.303 0.029 0.549 0.146
11 0.234 0.055 0.323 0.028 0.616 0.145
12 0.202 0.045 0.237 0.024 0.651 0.145
13 0.211 0.051 0.293 0.028 0.597 0.145
14 0.232 0.055 0.377 0.027 0.518 0.145
15 0.187 0.045 0.127 0.026 0.502 0.145
16 0.078 0.031 0.323 0.026 0.358 0.148
17 0.235 0.057 0.400 0.029 0.599 0.145
18 0.148 0.039 0.173 0.026 0.549 0.146
19 0.248 0.053 0.200 0.026 0.671 0.145
20 0.194 0.045 0.290 0.028 0.625 0.145
21 0.236 0.055 0.187 0.025 0.627 0.145
22 0.177 0.044 0.377 0.027 0.585 0.146
23 0.140 0.036 0.230 0.026 0.574 0.146
24 0.184 0.050 0.187 0.024 0.542 0.146
25 0.174 0.045 0.370 0.029 0.559 0.146
26 0.154 0.043 0.347 0.027 0.527 0.146
27 0.202 0.055 0.287 0.027 0.540 0.146
28 0.196 0.047 0.423 0.030 0.600 0.145
29 0.197 0.045 0.297 0.026 0.633 0.145
30 0.239 0.056 0.233 0.025 0.620 0.145
Min 0.078 0.031 0.127 0.024 0.527 0.145
Max 0.247 0.057 0.423 0.030 0.651 0.146
Avg 0.193 0.048 0.283 0.027 0.585 0.146
Table 5. Estimate of genetic variance, genetic x environment
interaction variance, heritability, and theirstandard error for population size of 200 half-sibprogenies Population size – 200 half-sib progeny
Sample 2g SE 2GE SE h2 SE
1 0.196 0.032 0.147 0.025 0.627 0.103
2 0.229 0.038 0.307 0.027 0.626 0.103
3 0.216 0.034 0.240 0.025 0.253 0. 103
4 0.222 0.036 0.247 0.026 0.644 0.103
5 0.235 0.041 0.333 0.029 0.597 0.103
6 0.205 0.034 0.243 0.026 0.613 0.103
7 0.251 0.040 0.240 0.027 0.649 0.103
8 0.220 0.036 0.290 0.026 0.623 0.103
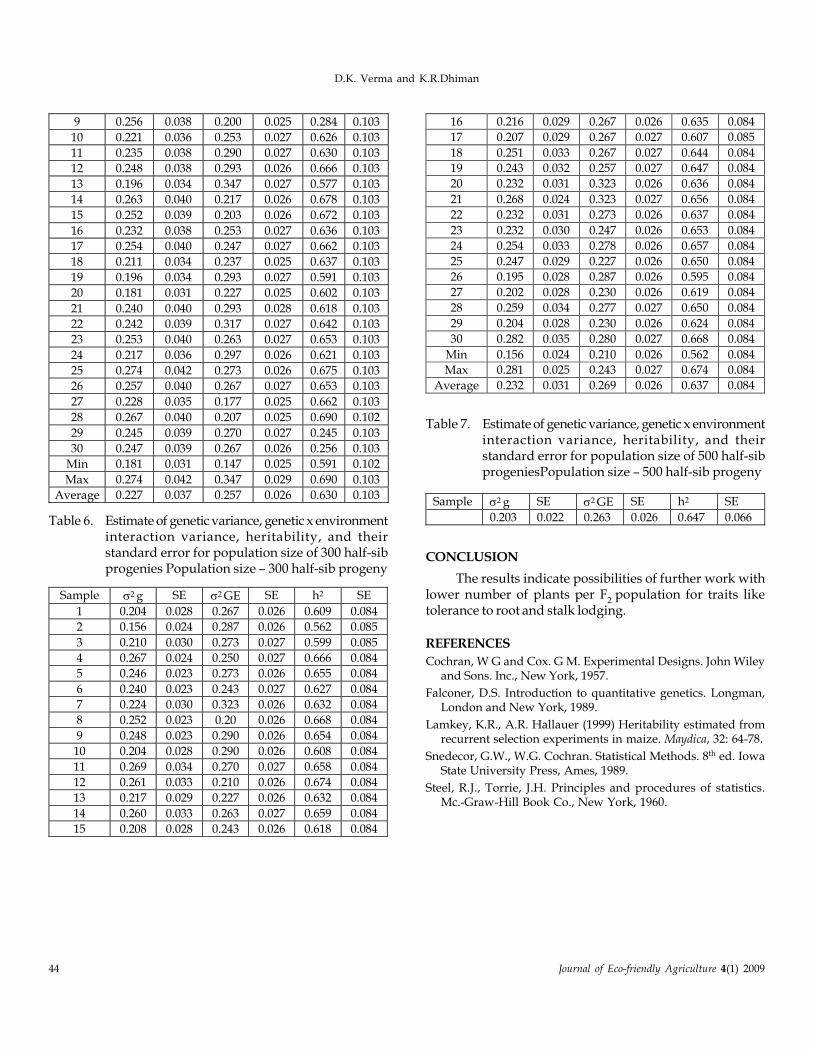
44 Journal of Eco-friendly Agriculture 4(1) 2009
D.K. Verma and K.R.Dhiman
CONCLUSION
The results indicate possibilities of further work withlower number of plants per F
2 population for traits like
tolerance to root and stalk lodging.
REFERENCES
Cochran, W G and Cox. G M. Experimental Designs. John Wileyand Sons. Inc., New York, 1957.
Falconer, D.S. Introduction to quantitative genetics. Longman,London and New York, 1989.
Lamkey, K.R., A.R. Hallauer (1999) Heritability estimated fromrecurrent selection experiments in maize. Maydica, 32: 64-78.
Snedecor, G.W., W.G. Cochran. Statistical Methods. 8th ed. IowaState University Press, Ames, 1989.
Steel, R.J., Torrie, J.H. Principles and procedures of statistics.Mc.-Graw-Hill Book Co., New York, 1960.
9 0.256 0.038 0.200 0.025 0.284 0.103
10 0.221 0.036 0.253 0.027 0.626 0.103
11 0.235 0.038 0.290 0.027 0.630 0.103
12 0.248 0.038 0.293 0.026 0.666 0.103
13 0.196 0.034 0.347 0.027 0.577 0.103
14 0.263 0.040 0.217 0.026 0.678 0.103
15 0.252 0.039 0.203 0.026 0.672 0.103
16 0.232 0.038 0.253 0.027 0.636 0.103
17 0.254 0.040 0.247 0.027 0.662 0.103
18 0.211 0.034 0.237 0.025 0.637 0.103
19 0.196 0.034 0.293 0.027 0.591 0.103
20 0.181 0.031 0.227 0.025 0.602 0.103
21 0.240 0.040 0.293 0.028 0.618 0.103
22 0.242 0.039 0.317 0.027 0.642 0.103
23 0.253 0.040 0.263 0.027 0.653 0.103
24 0.217 0.036 0.297 0.026 0.621 0.103
25 0.274 0.042 0.273 0.026 0.675 0.103
26 0.257 0.040 0.267 0.027 0.653 0.103
27 0.228 0.035 0.177 0.025 0.662 0.103
28 0.267 0.040 0.207 0.025 0.690 0.102
29 0.245 0.039 0.270 0.027 0.245 0.103
30 0.247 0.039 0.267 0.026 0.256 0.103
Min 0.181 0.031 0.147 0.025 0.591 0.102
Max 0.274 0.042 0.347 0.029 0.690 0.103
Average 0.227 0.037 0.257 0.026 0.630 0.103
Table 6. Estimate of genetic variance, genetic x environment
interaction variance, heritability, and theirstandard error for population size of 300 half-sibprogenies Population size – 300 half-sib progeny
Sample 2 g SE 2 GE SE h2 SE
1 0.204 0.028 0.267 0.026 0.609 0.084
2 0.156 0.024 0.287 0.026 0.562 0.085
3 0.210 0.030 0.273 0.027 0.599 0.085
4 0.267 0.024 0.250 0.027 0.666 0.084
5 0.246 0.023 0.273 0.026 0.655 0.084
6 0.240 0.023 0.243 0.027 0.627 0.084
7 0.224 0.030 0.323 0.026 0.632 0.084
8 0.252 0.023 0.20 0.026 0.668 0.084
9 0.248 0.023 0.290 0.026 0.654 0.084
10 0.204 0.028 0.290 0.026 0.608 0.084
11 0.269 0.034 0.270 0.027 0.658 0.084
12 0.261 0.033 0.210 0.026 0.674 0.084
13 0.217 0.029 0.227 0.026 0.632 0.084
14 0.260 0.033 0.263 0.027 0.659 0.084
15 0.208 0.028 0.243 0.026 0.618 0.084
Table 7. Estimate of genetic variance, genetic x environmentinteraction variance, heritability, and theirstandard error for population size of 500 half-sibprogeniesPopulation size – 500 half-sib progeny
Sample 2 g SE 2 GE SE h2 SE
0.203 0.022 0.263 0.026 0.647 0.066
16 0.216 0.029 0.267 0.026 0.635 0.084
17 0.207 0.029 0.267 0.027 0.607 0.085
18 0.251 0.033 0.267 0.027 0.644 0.084
19 0.243 0.032 0.257 0.027 0.647 0.084
20 0.232 0.031 0.323 0.026 0.636 0.084
21 0.268 0.024 0.323 0.027 0.656 0.084
22 0.232 0.031 0.273 0.026 0.637 0.084
23 0.232 0.030 0.247 0.026 0.653 0.084
24 0.254 0.033 0.278 0.026 0.657 0.084
25 0.247 0.029 0.227 0.026 0.650 0.084
26 0.195 0.028 0.287 0.026 0.595 0.084
27 0.202 0.028 0.230 0.026 0.619 0.084
28 0.259 0.034 0.277 0.027 0.650 0.084
29 0.204 0.028 0.230 0.026 0.624 0.084
30 0.282 0.035 0.280 0.027 0.668 0.084
Min 0.156 0.024 0.210 0.026 0.562 0.084
Max 0.281 0.025 0.243 0.027 0.674 0.084
Average 0.232 0.031 0.269 0.026 0.637 0.084
©2009
In vitro bio-efficacy of horticultural mineral oils againstSanjose scale, Quadraspidiotus perniciosus (Comstock), onApple in Kashmir
M.A. Parrey, A.Q. Rather, N.A. Wani, A.R. Wani and Asmat Maqbool
Division of Entomology, Sher-e-Kashmir University of Agricultural Sciences and Technology of Kashmir-Shalimar Srinagar-191121 (J & K), India
ABSTRACT
The trials conducted for testing the effects of five horticultural mineral oils, viz., P.D. spray oil, ATSO oil, Orchex oil,Arbofine tree spray oil and H. P. oil @ 1,2, and 3% concentrations with Diesel oil @ 4.76% as check against Sanjosescale, Quadraspidiotus perniciosus (Comstock) infesting Red Delicious cv. of apple in the year 2004 during dormancy,at two locations, Tailbal (Srinagar) and Hanjiwara Pattan (Baramulla), revealed the order of efficacy of the treatmentsas H.P oil > P.D. spray oil > Arbofine > Orchex > ATSO > Diesel oil. The overall efficacy of different horticulturalmineral oils revealed that spraying of these oils @ 2% was very effective in managing sanjose sacle.
Key words: Apple, bio-efficacy, HMO’s, Sanjose scale.
Journal of Eco-friendly Agriculture 4(1): 45-48 : 2009
INTRODUCTION
Apple fruit is widely grown in the temperate zones ofthe world. In Jammu and Kashmir, largely a temperate belt,apple is cultivated commercially and the economy of thestate is dependent to a greater extent on this fruit crop. Thearea under this crop in the State exceeds 2.21 lakh hectaresand production stands more than 11 lakh metric tones(Anonymous’ 1998). A wide variety of insect pests occur onapple in the valley at varying levels of infestation andaccordingly cause damage to this fruit crop reducing yieldas well as quality. Some insect pests constitute one of themajor constraints for erratic and low production of applefruit. Among these, Sanjose scale, Quadraspidiotus perniciousus(Comstock) sucking sap from the bark, foliage and the fruitand recognized as a key pest of the apple crop in Kashmirvalley is highly destructive. The waxy coating on the pestmakes it very difficult to control. Gupta and Dogra (1988)reported that the severity of damage caused by Sanjose scale,Quadraspidiotus perniciosus (Comstock) is a major concern onapple in Himachal pradesh.
The reddish round spots, appearing on the fruit as aresult of pest infestation, gives it bad shape and reduces themarket value. The pest is widely distributed in all applegrowing-countries of the world (Singh, 1963; Bhalla andGupta, 1993). The prolonged sucking of cell sap from twigsand branches renders them weak, dry and causes ultimatelydeath. Although diesel oil emulsion insecticides do managethe pest yet they do not offer a solution on long term basis.The repeated sprays of insecticides, besides contaminatingthe environment, are causing a serous threat to naturalenemies and develop resistance in the pest. Horticulturalmineral oils have been reported to play a vital role in
controlling this pest owing to their compatibility withenvironment, biocontrol agents and other methods. Thepresent investigation were, therefore, undertaken to evaluatesome new horticultural mineral oils along with theconventional spray oils aiming at to evaluate andrecommend the most appropriate for the control of Sanjosescale.
MATERIALS & METHODS
The experiment was conducted at Tailbal (Srinagar)and Hanjiwara (Pattan) on Red Delicious cv. of apple treesof uniform age (15-20 years) during the year 2004. Thetreatments (Table 1) were sprayed with the help of motorizedsprayer. Live Sanjose scale population was counted on fourspots, each having one square centimeter area, per three twigsper tree form all three quadrants one day before treatmentand at subsequent intervals of 10th, 20th, 30th and 40th dayafter treatment. There were three replications in eachconcentration in each treatment. The data were subjected tothe analysis of variance and the critical difference at 5% levelof significance was worked out.
RESULTS AND DISCUSSION
The data on mean live sanjose scale-population / cm2
ranged from 12.88-22.49 and 8.54-18.43 before treatment and5.133-0.883; 4.88-1.06; 3.020-0.583; 3.31-0.256 and 3.286-2.880 after treatment in late dormancy period of ATSO oil,Ochex oil, P.D spray oil, Arbofine, H.P oil and diesel oil(Table, 1) respectively at - Tailbal (Srinagar). On 40th dayafter treatment (DAT) the mean live sanjose scale populationwas 0.883-3.730 and 1.800-3.753 at Tailbal and Hanjiwara,
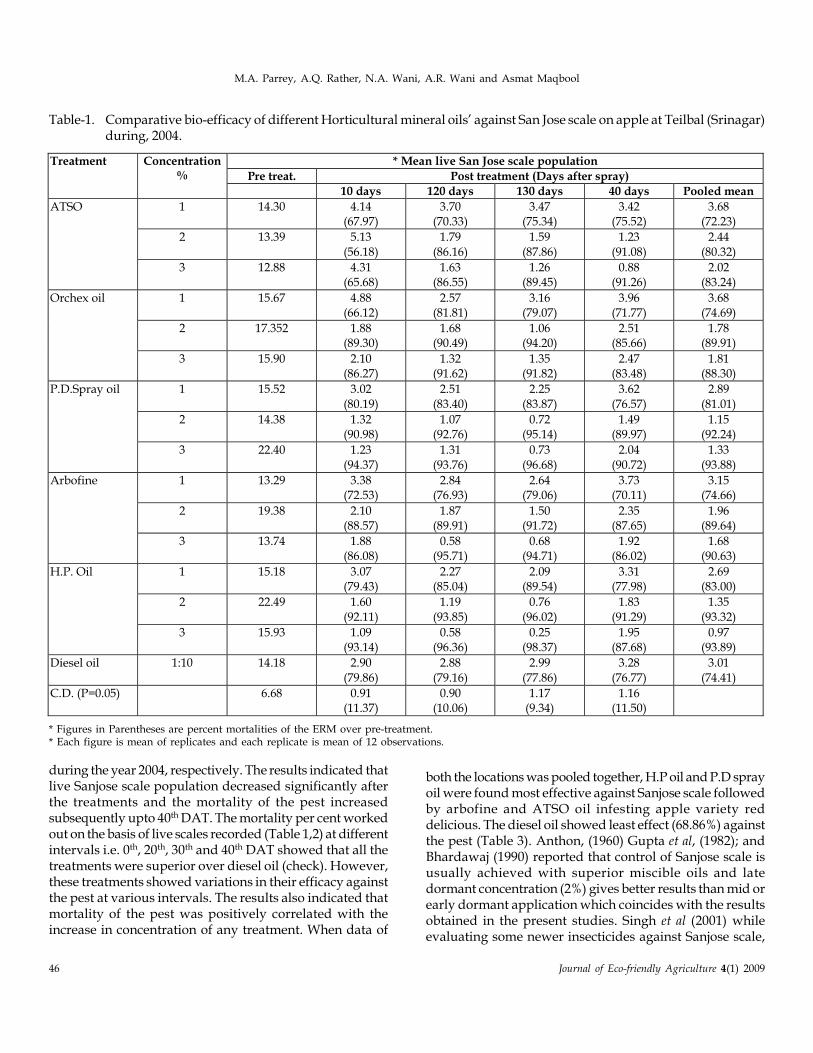
46 Journal of Eco-friendly Agriculture 4(1) 2009
M.A. Parrey, A.Q. Rather, N.A. Wani, A.R. Wani and Asmat Maqbool
during the year 2004, respectively. The results indicated thatlive Sanjose scale population decreased significantly afterthe treatments and the mortality of the pest increasedsubsequently upto 40th DAT. The mortality per cent workedout on the basis of live scales recorded (Table 1,2) at differentintervals i.e. 0th, 20th, 30th and 40th DAT showed that all thetreatments were superior over diesel oil (check). However,these treatments showed variations in their efficacy againstthe pest at various intervals. The results also indicated thatmortality of the pest was positively correlated with theincrease in concentration of any treatment. When data of
both the locations was pooled together, H.P oil and P.D sprayoil were found most effective against Sanjose scale followedby arbofine and ATSO oil infesting apple variety reddelicious. The diesel oil showed least effect (68.86%) againstthe pest (Table 3). Anthon, (1960) Gupta et al, (1982); andBhardawaj (1990) reported that control of Sanjose scale isusually achieved with superior miscible oils and latedormant concentration (2%) gives better results than mid orearly dormant application which coincides with the resultsobtained in the present studies. Singh et al (2001) whileevaluating some newer insecticides against Sanjose scale,
Table-1. Comparative bio-efficacy of different Horticultural mineral oils’ against San Jose scale on apple at Teilbal (Srinagar)during, 2004.
* Mean live San Jose scale population
Pre treat. Post treatment (Days after spray)
Treatment Concentration %
10 days 120 days 130 days 40 days Pooled mean
1 14.30 4.14 (67.97)
3.70 (70.33)
3.47 (75.34)
3.42 (75.52)
3.68 (72.23)
2 13.39 5.13
(56.18)
1.79
(86.16)
1.59
(87.86)
1.23
(91.08)
2.44
(80.32)
ATSO
3 12.88 4.31 (65.68)
1.63 (86.55)
1.26 (89.45)
0.88 (91.26)
2.02 (83.24)
1 15.67 4.88 (66.12)
2.57 (81.81)
3.16 (79.07)
3.96 (71.77)
3.68 (74.69)
2 17.352 1.88 (89.30)
1.68 (90.49)
1.06 (94.20)
2.51 (85.66)
1.78 (89.91)
Orchex oil
3 15.90 2.10 (86.27)
1.32 (91.62)
1.35 (91.82)
2.47 (83.48)
1.81 (88.30)
1 15.52 3.02
(80.19)
2.51
(83.40)
2.25
(83.87)
3.62
(76.57)
2.89
(81.01)
2 14.38 1.32 (90.98)
1.07 (92.76)
0.72 (95.14)
1.49 (89.97)
1.15 (92.24)
P.D.Spray oil
3 22.40 1.23
(94.37)
1.31
(93.76)
0.73
(96.68)
2.04
(90.72)
1.33
(93.88)
1 13.29 3.38 (72.53)
2.84 (76.93)
2.64 (79.06)
3.73 (70.11)
3.15 (74.66)
2 19.38 2.10 (88.57)
1.87 (89.91)
1.50 (91.72)
2.35 (87.65)
1.96 (89.64)
Arbofine
3 13.74 1.88 (86.08)
0.58 (95.71)
0.68 (94.71)
1.92 (86.02)
1.68 (90.63)
1 15.18 3.07 (79.43)
2.27 (85.04)
2.09 (89.54)
3.31 (77.98)
2.69 (83.00)
2 22.49 1.60
(92.11)
1.19
(93.85)
0.76
(96.02)
1.83
(91.29)
1.35
(93.32)
H.P. Oil
3 15.93 1.09 (93.14)
0.58 (96.36)
0.25 (98.37)
1.95 (87.68)
0.97 (93.89)
Diesel oil 1:10 14.18 2.90
(79.86)
2.88
(79.16)
2.99
(77.86)
3.28
(76.77)
3.01
(74.41)
C.D. (P=0.05) 6.68 0.91 (11.37)
0.90 (10.06)
1.17 (9.34)
1.16 (11.50)
* Figures in Parentheses are percent mortalities of the ERM over pre-treatment.* Each figure is mean of replicates and each replicate is mean of 12 observations.
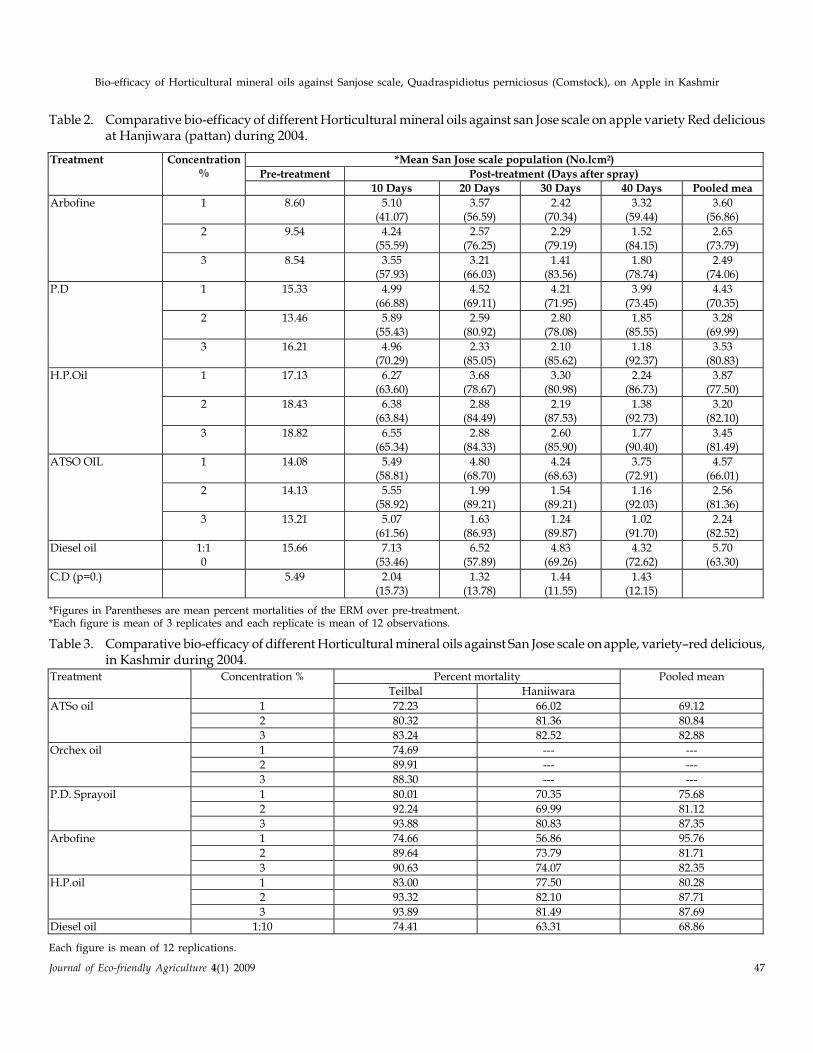
Journal of Eco-friendly Agriculture 4(1) 2009 47
Bio-efficacy of Horticultural mineral oils against Sanjose scale, Quadraspidiotus perniciosus (Comstock), on Apple in Kashmir
Table 2. Comparative bio-efficacy of different Horticultural mineral oils against san Jose scale on apple variety Red deliciousat Hanjiwara (pattan) during 2004.
*Figures in Parentheses are mean percent mortalities of the ERM over pre-treatment.*Each figure is mean of 3 replicates and each replicate is mean of 12 observations.
Table 3. Comparative bio-efficacy of different Horticultural mineral oils against San Jose scale on apple, variety–red delicious,in Kashmir during 2004.
*Mean San Jose scale population (No.lcm2)
Pre-treatment Post-treatment (Days after spray)
Treatment Concentration %
10 Days 20 Days 30 Days 40 Days Pooled mea
1 8.60 5.10 (41.07)
3.57 (56.59)
2.42 (70.34)
3.32 (59.44)
3.60 (56.86)
2 9.54 4.24 (55.59)
2.57 (76.25)
2.29 (79.19)
1.52 (84.15)
2.65 (73.79)
Arbofine
3 8.54 3.55 (57.93)
3.21 (66.03)
1.41 (83.56)
1.80 (78.74)
2.49 (74.06)
1 15.33 4.99
(66.88)
4.52
(69.11)
4.21
(71.95)
3.99
(73.45)
4.43
(70.35)
2 13.46 5.89 (55.43)
2.59 (80.92)
2.80 (78.08)
1.85 (85.55)
3.28 (69.99)
P.D
3 16.21 4.96 (70.29)
2.33 (85.05)
2.10 (85.62)
1.18 (92.37)
3.53 (80.83)
1 17.13 6.27 (63.60)
3.68 (78.67)
3.30 (80.98)
2.24 (86.73)
3.87 (77.50)
2 18.43 6.38 (63.84)
2.88 (84.49)
2.19 (87.53)
1.38 (92.73)
3.20 (82.10)
H.P.Oil
3 18.82 6.55 (65.34)
2.88 (84.33)
2.60 (85.90)
1.77 (90.40)
3.45 (81.49)
1 14.08 5.49 (58.81)
4.80 (68.70)
4.24 (68.63)
3.75 (72.91)
4.57 (66.01)
2 14.13 5.55 (58.92)
1.99 (89.21)
1.54 (89.21)
1.16 (92.03)
2.56 (81.36)
ATSO OIL
3 13.21 5.07 (61.56)
1.63 (86.93)
1.24 (89.87)
1.02 (91.70)
2.24 (82.52)
Diesel oil 1:1 0
15.66 7.13 (53.46)
6.52 (57.89)
4.83 (69.26)
4.32 (72.62)
5.70 (63.30)
C.D (p=0.) 5.49 2.04 (15.73)
1.32 (13.78)
1.44 (11.55)
1.43 (12.15)
Percent mortality Treatment Concentration %
Teilbal Haniiwara
Pooled mean
1 72.23 66.02 69.12
2 80.32 81.36 80.84
ATSo oil
3 83.24 82.52 82.88
1 74.69 --- ---
2 89.91 --- ---
Orchex oil
3 88.30 --- ---
1 80.01 70.35 75.68
2 92.24 69.99 81.12
P.D. Sprayoil
3 93.88 80.83 87.35
1 74.66 56.86 95.76
2 89.64 73.79 81.71
Arbofine
3 90.63 74.07 82.35
1 83.00 77.50 80.28
2 93.32 82.10 87.71
H.P.oil
3 93.89 81.49 87.69
Diesel oil 1:10 74.41 63.31 68.86
Each figure is mean of 12 replications.
48 Journal of Eco-friendly Agriculture 4(1) 2009
M.A. Parrey, A.Q. Rather, N.A. Wani, A.R. Wani and Asmat Maqbool
Q. pernicisous (Comstock) on apple in Uttaranchal concludedthat two sprays of koranda, methyl demeton and carbosulfan@ 0.05% caused very effective reduction of San Jose scale.Dinabandhoo and Bhalla (1975); Thakur and Hameed (1980a,b) and Bhardwaj (1988) evaluated some insecticides onapple and reported that methyl demeton, dimethoate andPhosphamidon @ 0.02% proved to be more effective incontrolling the pest.
CONCLUSION
It is concluded that spraying of these oils @ 2%concentrations was very effective in reducing Sanjose scalein the apple orchards. Therefore, these horticultural mineraloils (HMO’s) should be selected for the sound managementof this devastating pest.
REFERENCES
Anonymous, 1998. Directorate of Horticulture (statistical wing),Jammu and Kashmir Srinagar Govt. Anthon, E.W. 1960.Insecticidal control of San Jose scale on fruits. Journal of EconomicEntomology, 53:1085-1087.
Bhall, O.P. and Gupta, P.R. 1993. (Insect pest of temperate fruits),PP, 1557-1589. In K.L Chadha and O.P. Pareek (eds). Advancesin horticulture-fruit crop, Vol.3: Malhotra publishing house,New Delhi.
Bhardwaj, S.P, 1998. Effect of summer applications of insecticideson Sanjose scale (Quadraspidiotus perniciosus) in orchards ofApple (Malus primla) Indian Jammu of Agricultural Science,58:655-56.
Bhardwaj, S.P, 1990. Field evaluation of miscible oils againstSanjose scale on apple. Journal of tree science, 9:44:46.
Dinabandhoo, C.L. and Bhalla, O.P 1975, Comparative studieson dormant and prebloom sprayings for the control of Sanjosescale. Indian of Agricultural Science, 45:60-62.
Gupta, P.R and Dogra, G.S 1998. Insect pests of temperate fruitsand their control. Tree protection (eds, Gupta, V.K. andSharma, N.R). Indian society of tree science, Department offorestry, Solan, H.P. India.
Gupta, P.R. Bhardwaj, S.P. and Bhalla, O.P. 1982. Control of Sanjosescale Quadraspidiotus perniciosus (comstock) with miscible oilsand their combinations with fenitrothion. Journal ofEntomological research, 6 : 140-145.
Singh, S.S, Tiwari, H.C, and Roo, K.M.2001. Evaluation of somemodem insecticides against Sanjose scale, Quadraspidiotusperniciosus (comstock) on apple. Journal of entomological Research,25: 69-71.
Singh, C. 1963 Sanjose scale-a menace to hill orchards. IndianHorticulture, 7: 6-8.
Thakur, A.K and Hameed, S.F 1980a. Biological performance ofsome organophosphorus insecticides against Quadraspidiotusperniciosus Comstock on apple. Proceeding of Indian Academy ofScience B 89:587-601.
Thakur, A.K and Hameed, S.F. 1980 b. toxicity of someorganophosphorus insecticides to the crawlers of Sanjosescale, Quadraspidiotus perniciosus Comst. pesticides, 14: 10-12.
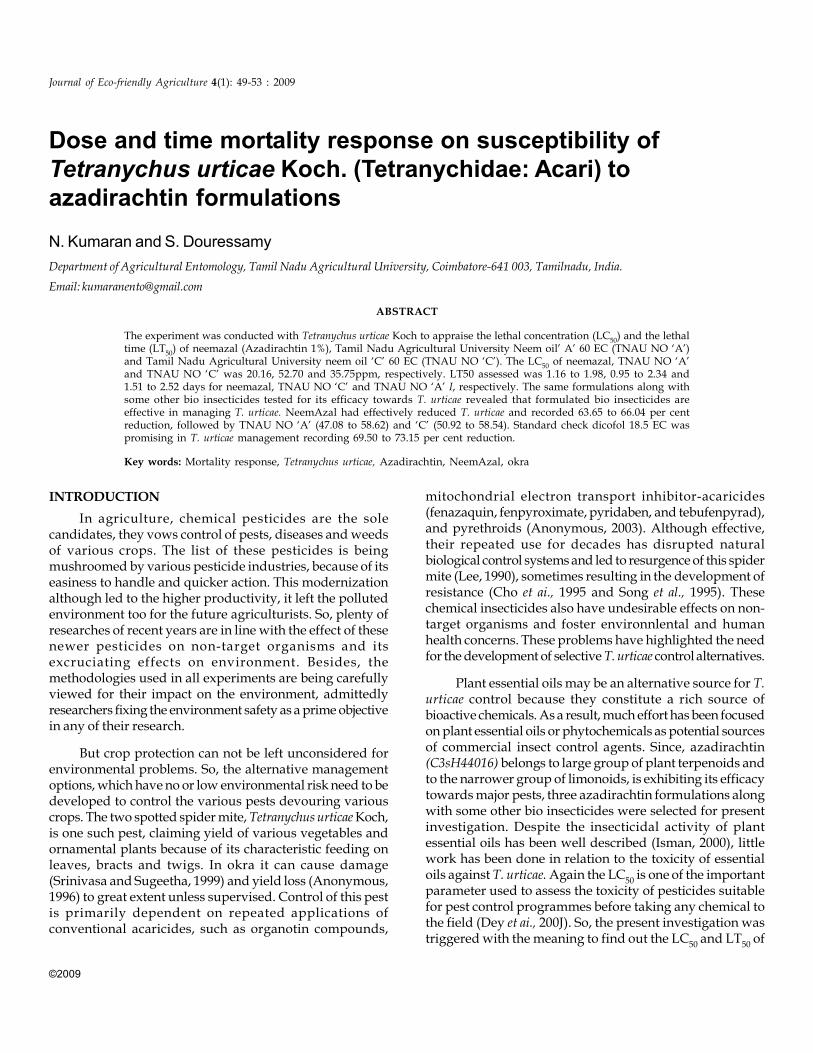
©2009
Dose and time mortality response on susceptibility ofTetranychus urticae Koch. (Tetranychidae: Acari) toazadirachtin formulations
N. Kumaran and S. Douressamy
Department of Agricultural Entomology, Tamil Nadu Agricultural University, Coimbatore-641 003, Tamilnadu, India.
Email: [email protected]
ABSTRACT
The experiment was conducted with Tetranychus urticae Koch to appraise the lethal concentration (LC50
) and the lethaltime (LT
50) of neemazal (Azadirachtin 1%), Tamil Nadu Agricultural University Neem oil’ A’ 60 EC (TNAU NO ‘A’)
and Tamil Nadu Agricultural University neem oil ‘C’ 60 EC (TNAU NO ‘C’). The LC50
of neemazal, TNAU NO ‘A’and TNAU NO ‘C’ was 20.16, 52.70 and 35.75ppm, respectively. LT50 assessed was 1.16 to 1.98, 0.95 to 2.34 and1.51 to 2.52 days for neemazal, TNAU NO ‘C’ and TNAU NO ‘A’ I, respectively. The same formulations along withsome other bio insecticides tested for its efficacy towards T. urticae revealed that formulated bio insecticides areeffective in managing T. urticae. NeemAzal had effectively reduced T. urticae and recorded 63.65 to 66.04 per centreduction, followed by TNAU NO ‘A’ (47.08 to 58.62) and ‘C’ (50.92 to 58.54). Standard check dicofol 18.5 EC waspromising in T. urticae management recording 69.50 to 73.15 per cent reduction.
Key words: Mortality response, Tetranychus urticae, Azadirachtin, NeemAzal, okra
Journal of Eco-friendly Agriculture 4(1): 49-53 : 2009
INTRODUCTION
In agriculture, chemical pesticides are the solecandidates, they vows control of pests, diseases and weedsof various crops. The list of these pesticides is beingmushroomed by various pesticide industries, because of itseasiness to handle and quicker action. This modernizationalthough led to the higher productivity, it left the pollutedenvironment too for the future agriculturists. So, plenty ofresearches of recent years are in line with the effect of thesenewer pesticides on non-target organisms and itsexcruciating effects on environment. Besides, themethodologies used in all experiments are being carefullyviewed for their impact on the environment, admittedlyresearchers fixing the environment safety as a prime objectivein any of their research.
But crop protection can not be left unconsidered forenvironmental problems. So, the alternative managementoptions, which have no or low environmental risk need to bedeveloped to control the various pests devouring variouscrops. The two spotted spider mite, Tetranychus urticae Koch,is one such pest, claiming yield of various vegetables andornamental plants because of its characteristic feeding onleaves, bracts and twigs. In okra it can cause damage(Srinivasa and Sugeetha, 1999) and yield loss (Anonymous,1996) to great extent unless supervised. Control of this pestis primarily dependent on repeated applications ofconventional acaricides, such as organotin compounds,
mitochondrial electron transport inhibitor-acaricides(fenazaquin, fenpyroximate, pyridaben, and tebufenpyrad),and pyrethroids (Anonymous, 2003). Although effective,their repeated use for decades has disrupted naturalbiological control systems and led to resurgence of this spidermite (Lee, 1990), sometimes resulting in the development ofresistance (Cho et ai., 1995 and Song et al., 1995). Thesechemical insecticides also have undesirable effects on non-target organisms and foster environnlental and humanhealth concerns. These problems have highlighted the needfor the development of selective T. urticae control alternatives.
Plant essential oils may be an alternative source for T.urticae control because they constitute a rich source ofbioactive chemicals. As a result, much effort has been focusedon plant essential oils or phytochemicals as potential sourcesof commercial insect control agents. Since, azadirachtin(C3sH44016) belongs to large group of plant terpenoids andto the narrower group of limonoids, is exhibiting its efficacytowards major pests, three azadirachtin formulations alongwith some other bio insecticides were selected for presentinvestigation. Despite the insecticidal activity of plantessential oils has been well described (Isman, 2000), littlework has been done in relation to the toxicity of essentialoils against T. urticae. Again the LC
50 is one of the important
parameter used to assess the toxicity of pesticides suitablefor pest control programmes before taking any chemical tothe field (Dey et ai., 200J). So, the present investigation wastriggered with the meaning to find out the LC
50 and LT
50 of
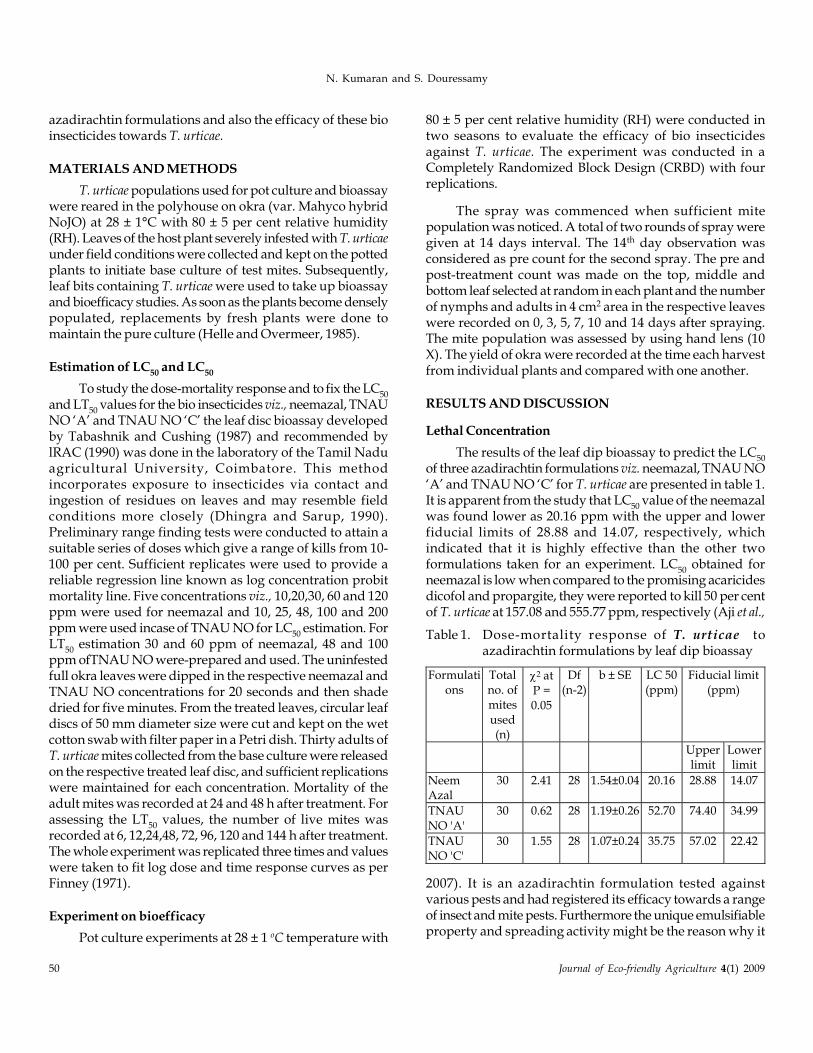
50 Journal of Eco-friendly Agriculture 4(1) 2009
N. Kumaran and S. Douressamy
azadirachtin formulations and also the efficacy of these bioinsecticides towards T. urticae.
MATERIALS AND METHODS
T. urticae populations used for pot culture and bioassaywere reared in the polyhouse on okra (var. Mahyco hybridNoJO) at 28 ± 1°C with 80 ± 5 per cent relative humidity(RH). Leaves of the host plant severely infested with T. urticaeunder field conditions were collected and kept on the pottedplants to initiate base culture of test mites. Subsequently,leaf bits containing T. urticae were used to take up bioassayand bioefficacy studies. As soon as the plants become denselypopulated, replacements by fresh plants were done tomaintain the pure culture (Helle and Overmeer, 1985).
Estimation of LC50
and LC50
To study the dose-mortality response and to fix the LC50
and LT50
values for the bio insecticides viz., neemazal, TNAUNO ‘A’ and TNAU NO ‘C’ the leaf disc bioassay developedby Tabashnik and Cushing (1987) and recommended bylRAC (1990) was done in the laboratory of the Tamil Naduagricultural University, Coimbatore. This methodincorporates exposure to insecticides via contact andingestion of residues on leaves and may resemble fieldconditions more closely (Dhingra and Sarup, 1990).Preliminary range finding tests were conducted to attain asuitable series of doses which give a range of kills from 10-100 per cent. Sufficient replicates were used to provide areliable regression line known as log concentration probitmortality line. Five concentrations viz., 10,20,30, 60 and 120ppm were used for neemazal and 10, 25, 48, 100 and 200ppm were used incase of TNAU NO for LC
50 estimation. For
LT50
estimation 30 and 60 ppm of neemazal, 48 and 100ppm ofTNAU NO were-prepared and used. The uninfestedfull okra leaves were dipped in the respective neemazal andTNAU NO concentrations for 20 seconds and then shadedried for five minutes. From the treated leaves, circular leafdiscs of 50 mm diameter size were cut and kept on the wetcotton swab with filter paper in a Petri dish. Thirty adults ofT. urticae mites collected from the base culture were releasedon the respective treated leaf disc, and sufficient replicationswere maintained for each concentration. Mortality of theadult mites was recorded at 24 and 48 h after treatment. Forassessing the LT
50 values, the number of live mites was
recorded at 6, 12,24,48, 72, 96, 120 and 144 h after treatment.The whole experiment was replicated three times and valueswere taken to fit log dose and time response curves as perFinney (1971).
Experiment on bioefficacy
Pot culture experiments at 28 ± 1 oC temperature with
80 ± 5 per cent relative humidity (RH) were conducted intwo seasons to evaluate the efficacy of bio insecticidesagainst T. urticae. The experiment was conducted in aCompletely Randomized Block Design (CRBD) with fourreplications.
The spray was commenced when sufficient mitepopulation was noticed. A total of two rounds of spray weregiven at 14 days interval. The 14th day observation wasconsidered as pre count for the second spray. The pre andpost-treatment count was made on the top, middle andbottom leaf selected at random in each plant and the numberof nymphs and adults in 4 cm2 area in the respective leaveswere recorded on 0, 3, 5, 7, 10 and 14 days after spraying.The mite population was assessed by using hand lens (10X). The yield of okra were recorded at the time each harvestfrom individual plants and compared with one another.
RESULTS AND DISCUSSION
Lethal Concentration
The results of the leaf dip bioassay to predict the LC50
of three azadirachtin formulations viz. neemazal, TNAU NO‘A’ and TNAU NO ‘C’ for T. urticae are presented in table 1.It is apparent from the study that LC
50 value of the neemazal
was found lower as 20.16 ppm with the upper and lowerfiducial limits of 28.88 and 14.07, respectively, whichindicated that it is highly effective than the other twoformulations taken for an experiment. LC
50 obtained for
neemazal is low when compared to the promising acaricidesdicofol and propargite, they were reported to kill 50 per centof T. urticae at 157.08 and 555.77 ppm, respectively (Aji et al.,
Table 1. Dose-mortality response of T. urticae toazadirachtin formulations by leaf dip bioassay
Formulations
Total no. of mites
used (n)
2 at
P = 0.05
Df (n-2)
b ± SE LC 50 (ppm)
Fiducial limit (ppm)
Upper limit
Lower limit
Neem Azal
30 2.41 28 1.54±0.04 20.16 28.88 14.07
TNAU
NO 'A'
30 0.62 28 1.19±0.26 52.70 74.40 34.99
TNAU NO 'C'
30 1.55 28 1.07±0.24 35.75 57.02 22.42
2007). It is an azadirachtin formulation tested againstvarious pests and had registered its efficacy towards a rangeof insect and mite pests. Furthermore the unique emulsifiableproperty and spreading activity might be the reason why it
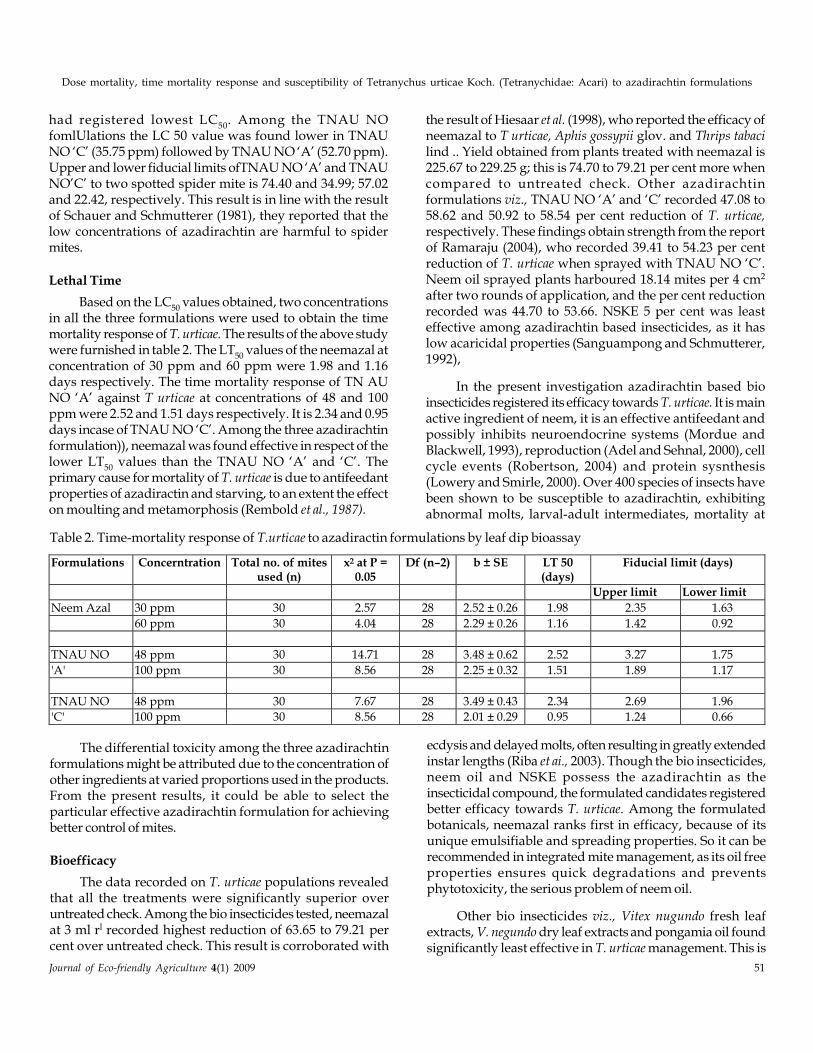
Journal of Eco-friendly Agriculture 4(1) 2009 51
Dose mortality, time mortality response and susceptibility of Tetranychus urticae Koch. (Tetranychidae: Acari) to azadirachtin formulations
had registered lowest LC50
. Among the TNAU NOfomlUlations the LC 50 value was found lower in TNAUNO ‘C’ (35.75 ppm) followed by TNAU NO ‘A’ (52.70 ppm).Upper and lower fiducial limits ofTNAU NO ‘A’ and TNAUNO’C’ to two spotted spider mite is 74.40 and 34.99; 57.02and 22.42, respectively. This result is in line with the resultof Schauer and Schmutterer (1981), they reported that thelow concentrations of azadirachtin are harmful to spidermites.
Lethal Time
Based on the LC50
values obtained, two concentrationsin all the three formulations were used to obtain the timemortality response of T. urticae. The results of the above studywere furnished in table 2. The LT
50 values of the neemazal at
concentration of 30 ppm and 60 ppm were 1.98 and 1.16days respectively. The time mortality response of TN AUNO ‘A’ against T urticae at concentrations of 48 and 100ppm were 2.52 and 1.51 days respectively. It is 2.34 and 0.95days incase of TNAU NO ‘C’. Among the three azadirachtinformulation)), neemazal was found effective in respect of thelower LT
50 values than the TNAU NO ‘A’ and ‘C’. The
primary cause for mortality of T. urticae is due to antifeedantproperties of azadiractin and starving, to an extent the effecton moulting and metamorphosis (Rembold et al., 1987).
the result of Hiesaar et al. (1998), who reported the efficacy ofneemazal to T urticae, Aphis gossypii glov. and Thrips tabacilind .. Yield obtained from plants treated with neemazal is225.67 to 229.25 g; this is 74.70 to 79.21 per cent more whencompared to untreated check. Other azadirachtinformulations viz., TNAU NO ‘A’ and ‘C’ recorded 47.08 to58.62 and 50.92 to 58.54 per cent reduction of T. urticae,respectively. These findings obtain strength from the reportof Ramaraju (2004), who recorded 39.41 to 54.23 per centreduction of T. urticae when sprayed with TNAU NO ‘C’.Neem oil sprayed plants harboured 18.14 mites per 4 cm2
after two rounds of application, and the per cent reductionrecorded was 44.70 to 53.66. NSKE 5 per cent was leasteffective among azadirachtin based insecticides, as it haslow acaricidal properties (Sanguampong and Schmutterer,1992),
In the present investigation azadirachtin based bioinsecticides registered its efficacy towards T. urticae. It is mainactive ingredient of neem, it is an effective antifeedant andpossibly inhibits neuroendocrine systems (Mordue andBlackwell, 1993), reproduction (Adel and Sehnal, 2000), cellcycle events (Robertson, 2004) and protein sysnthesis(Lowery and Smirle, 2000). Over 400 species of insects havebeen shown to be susceptible to azadirachtin, exhibitingabnormal molts, larval-adult intermediates, mortality at
Table 2. Time-mortality response of T.urticae to azadiractin formulations by leaf dip bioassay
Formulations Concerntration Total no. of mites used (n)
x2 at P = 0.05
Df (n–2) b ± SE LT 50 (days)
Fiducial limit (days)
Upper limit Lower limit
Neem Azal 30 ppm 30 2.57 28 2.52 ± 0.26 1.98 2.35 1.63
60 ppm 30 4.04 28 2.29 ± 0.26 1.16 1.42 0.92
TNAU NO 48 ppm 30 14.71 28 3.48 ± 0.62 2.52 3.27 1.75
'A' 100 ppm 30 8.56 28 2.25 ± 0.32 1.51 1.89 1.17
TNAU NO 48 ppm 30 7.67 28 3.49 ± 0.43 2.34 2.69 1.96
'C' 100 ppm 30 8.56 28 2.01 ± 0.29 0.95 1.24 0.66
The differential toxicity among the three azadirachtin
formulations might be attributed due to the concentration ofother ingredients at varied proportions used in the products.From the present results, it could be able to select theparticular effective azadirachtin formulation for achievingbetter control of mites.
Bioefficacy
The data recorded on T. urticae populations revealedthat all the treatments were significantly superior overuntreated check. Among the bio insecticides tested, neemazalat 3 ml rl recorded highest reduction of 63.65 to 79.21 percent over untreated check. This result is corroborated with
ecdysis and delayed molts, often resulting in greatly extendedinstar lengths (Riba et ai., 2003). Though the bio insecticides,neem oil and NSKE possess the azadirachtin as theinsecticidal compound, the formulated candidates registeredbetter efficacy towards T. urticae. Among the formulatedbotanicals, neemazal ranks first in efficacy, because of itsunique emulsifiable and spreading properties. So it can berecommended in integrated mite management, as its oil freeproperties ensures quick degradations and preventsphytotoxicity, the serious problem of neem oil.
Other bio insecticides viz., Vitex nugundo fresh leafextracts, V. negundo dry leaf extracts and pongamia oil foundsignificantly least effective in T. urticae management. This is
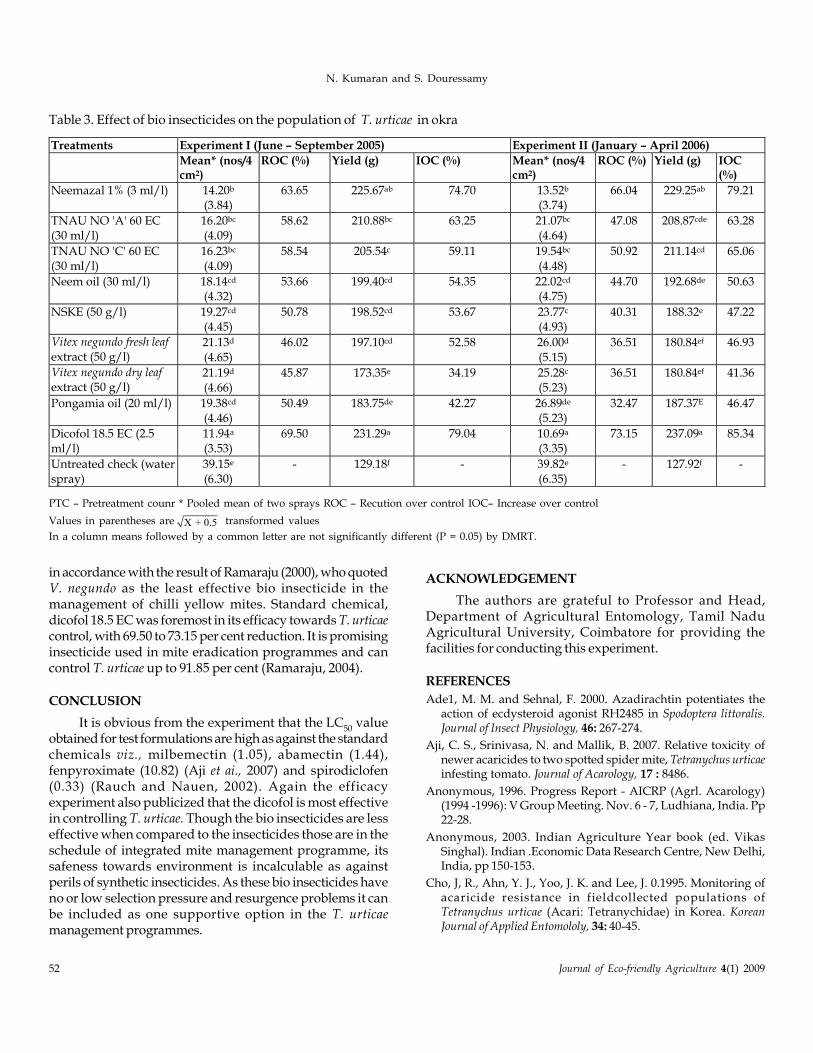
52 Journal of Eco-friendly Agriculture 4(1) 2009
N. Kumaran and S. Douressamy
in accordance with the result of Ramaraju (2000), who quotedV. negundo as the least effective bio insecticide in themanagement of chilli yellow mites. Standard chemical,dicofol 18.5 EC was foremost in its efficacy towards T. urticaecontrol, with 69.50 to 73.15 per cent reduction. It is promisinginsecticide used in mite eradication programmes and cancontrol T. urticae up to 91.85 per cent (Ramaraju, 2004).
CONCLUSION
It is obvious from the experiment that the LC50
valueobtained for test formulations are high as against the standardchemicals viz., milbemectin (1.05), abamectin (1.44),fenpyroximate (10.82) (Aji et ai., 2007) and spirodiclofen(0.33) (Rauch and Nauen, 2002). Again the efficacyexperiment also publicized that the dicofol is most effectivein controlling T. urticae. Though the bio insecticides are lesseffective when compared to the insecticides those are in theschedule of integrated mite management programme, itssafeness towards environment is incalculable as againstperils of synthetic insecticides. As these bio insecticides haveno or low selection pressure and resurgence problems it canbe included as one supportive option in the T. urticaemanagement programmes.
ACKNOWLEDGEMENT
The authors are grateful to Professor and Head,Department of Agricultural Entomology, Tamil NaduAgricultural University, Coimbatore for providing thefacilities for conducting this experiment.
REFERENCES
Ade1, M. M. and Sehnal, F. 2000. Azadirachtin potentiates theaction of ecdysteroid agonist RH2485 in Spodoptera littoralis.Journal of Insect Physiology, 46: 267-274.
Aji, C. S., Srinivasa, N. and Mallik, B. 2007. Relative toxicity ofnewer acaricides to two spotted spider mite, Tetranychus urticaeinfesting tomato. Journal of Acarology, 17 : 8486.
Anonymous, 1996. Progress Report - AICRP (Agrl. Acarology)(1994 -1996): V Group Meeting. Nov. 6 - 7, Ludhiana, India. Pp22-28.
Anonymous, 2003. Indian Agriculture Year book (ed. VikasSinghal). Indian .Economic Data Research Centre, New Delhi,India, pp 150-153.
Cho, J, R., Ahn, Y. J., Yoo, J. K. and Lee, J. 0.1995. Monitoring ofacaricide resistance in fieldcollected populations ofTetranychus urticae (Acari: Tetranychidae) in Korea. KoreanJournal of Applied Entomololy, 34: 40-45.
Table 3. Effect of bio insecticides on the population of T. urticae in okra
Treatments Experiment I (June – September 2005) Experiment II (January – April 2006)
Mean* (nos/4 cm2)
ROC (%) Yield (g) IOC (%) Mean* (nos/4 cm2)
ROC (%) Yield (g) IOC (%)
Neemazal 1% (3 ml/l) 14.20b (3.84)
63.65 225.67ab 74.70 13.52b (3.74)
66.04 229.25ab 79.21
TNAU NO 'A' 60 EC (30 ml/l)
16.20bc
(4.09) 58.62 210.88bc 63.25 21.07bc
(4.64) 47.08 208.87cde 63.28
TNAU NO 'C' 60 EC (30 ml/l)
16.23bc (4.09)
58.54 205.54c 59.11 19.54bc (4.48)
50.92 211.14cd 65.06
Neem oil (30 ml/l) 18.14cd (4.32)
53.66 199.40cd 54.35 22.02cd (4.75)
44.70 192.68de 50.63
NSKE (50 g/l) 19.27cd (4.45)
50.78 198.52cd 53.67 23.77c (4.93)
40.31 188.32e 47.22
Vitex negundo fresh leaf
extract (50 g/l) 21.13d
(4.65)
46.02 197.10cd 52.58 26.00d
(5.15)
36.51 180.84ef 46.93
Vitex negundo dry leaf extract (50 g/l)
21.19d (4.66)
45.87 173.35e 34.19 25.28c (5.23)
36.51 180.84ef 41.36
Pongamia oil (20 ml/l) 19.38cd (4.46)
50.49 183.75de 42.27 26.89de (5.23)
32.47 187.37E 46.47
Dicofol 18.5 EC (2.5 ml/l)
11.94a (3.53)
69.50 231.29a 79.04 10.69a
(3.35) 73.15 237.09a 85.34
Untreated check (water spray)
39.15e (6.30)
- 129.18f - 39.82e
(6.35) - 127.92f -
PTC – Pretreatment counr * Pooled mean of two sprays ROC – Recution over control IOC– Increase over control
Values in parentheses are X + 0.5 transformed values
In a column means followed by a common letter are not significantly different (P = 0.05) by DMRT.
Journal of Eco-friendly Agriculture 4(1) 2009 53
Dose mortality, time mortality response and susceptibility of Tetranychus urticae Koch. (Tetranychidae: Acari) to azadirachtin formulations
Dey, P. K., Sarkar, P. K. and Somochoudhury, A. K. 2001. Efficacyof different treatments schedule of profenefos against majorpests of chillies. Pestology, 25: 26-29.
Dhingra, S. and Sarup, P. 1990. Development of techniques fordetecting resistance in crop pests to insecticides. Journal ofEntomological Research, 14: 156-163.
Dikshit, A. K., Lal, O. P. and Srivastava, Y. N. 2000. Persistence 9fpyrethroid and nicotinyl insecticides on okra fruits. PesticideResearch Journal, 12: 227-231.
FAO Report, 2005. Agricultural production data base. Food andAgriculture Organisation. http//:appsfao.org/faostat/
Finney, D. J. 1971. Probit Analysis. Cambridge University Press,London. 333p.
Helle, W. and Overmeer, W. P. J. 1985. Rearing techniques. In :Spider mites, their biology, Natural enemies and control Volume lA.,(eds. W. Helle and M. W. Sabelis). Elsevier Publications, NewYork. p 335-340.
Hiiesaar, K., Luik, A., Kuusik, A. and Metspalu, L. 1998. Theeffect of Neemazal- TIS on the mortality of mite Tetranychusurticae Koch and some insects - Aphis gossypii glov. and Thripstabaci lind. Practice Oriented Results on Use and ProductionofNeem-Ingredients and Pheromones VIII”; Proceedings ofthe 8th Workshop; Hohensolms, Germany, February 16-18,1998.
IRAC, 1990. Proposed insecticide I acaricide susceptibility tests,International Resistance Action Committee Method NO.7.Bulletin of European Plant Protection Organization, 20: 399- 400.
Isman, M. B. 2000. Plant essential oils for pest and diseasemanagement. Crop Protection, 19: 603-608.
Lee, S. W. 1990. Studies on the pest status and integrated mitemanagement in apple orchards. Ph. D. dissertation, SeoulNational University. Suwon.
Lowery, D. T. and Smirle, M. 1. 2000. Toxicity of insecticides tooblique banded leaf roller, Choristoneura rosaceana, larvae andadults exposed previously to neem seed oil. EntomologyExperimenta Applicata, 95: 201-207.
Mordue, A. J. and Blackwell, A. 1993. Azadirachtin: an update.Journal of Insect Physiology, 39: 903-924.
Ramaraju, K. 2002. Evaluation of Fenpropathrin 10EC (Danitol)and botanicals against yellow mite, Polyphagotarsonemus latus
(Banks) on chillies. Pestology, 26: 44-46.
Ramaraju, K. 2004. Evaluation ofacaricides and TNAU neem oilsagainst spider mite, Tetranychus urticae (Koch) on bhendi andbrinjal. Madras Agriculture Journal, 91: 425-429.
Rauch, N. and Nauen, R. 2002. Spirodiclofen resistance riskassessment in Tetranychus urticae (Acari: Tetranychidae): abiochemical approach. Pesticide Biochemistry and Physiology, 74:91-101.
Rembold, H., Uhl, M. and Muller, T. H. 1987. Effect of Azadirachtinon hormone titers during the gonadotropic cycle of Locustamigratoria. In : Natural Pesticides from Neem Tree and other TropicalPlants. Proceedings of 3rd International Neem Conference(Nairobi, Kenya, 1986), 289-298.
Riba, M., Maru, J. and Sans, A. 2003. Influence of azadirachtin ondevelopment and reproduction of Nezara viridula L. (Het:Pentatomidae). Journal of Applied Entomology, 127: 37-41.
Robertson, S. L. 2004. Studies on the mode of action of azadirachtinfrom the neem tree Azadirachta indica, using insect cell lines.PhD thesis, University of Aberdeen, United Kingdom.
Sanguampong, V. and Schmutterer, H. 1992. Laborversucheuberdie wirkung von Niemol and neem samenextraktenbeider gemeinen spinnmilbe, Tetranyehus urtieae Koch.(AcariTetranychidae). Z. Pjianzenkr. Pjianzenschutry, 99: 637-646.
Schauer, M. and Schmutterer, H. 1981. Effects of neem kernelextracts on the two spotted spider mite, Tetranyehus urticae.In: Natural Pesticides from the Neem Tree and other Tropical Plants.Proceedings of 1 sl International Neem Conference (Rottach-EgernI980) 259-266.
Song, C., Kim, G. H., Aim, S. J., Park, N. 1. and Cho, K. Y. 1995.Acaricide susceptibilities of field-collected populations of twospotted spider mite, Tetranyehus urticae (Acari: Tetranychidae)from apple orchards. Korean Journal of Applied Entomololy, 34:328-333.
Srinivasa, N. and Sugeetha, G. 1999. Bioeffectiveness of certainbotanicals and synthetic pesticides against okra spider mite.Tetranychus maefarlanei. Journal of Acarology, 15: 1-5.
Tabashnik, B. E. and Cushing, N. 1. 1987. Leaf residues vs topicalbioassays for assessing insecticide resistance in diamond backmoth, Plutella xylostella 1. FAO Plant Protection Bulletin, 35: 11-14.
©2009
Comparative persistance toxicity of insecticides/ biopesticidesagainst Helicoverpa armigera on chickpea
Ritu Srivastava and K.D. Upadhayay
C.S.A University of Agriculture & Technology, Department of Entomology, Kanpur-208002
ABSTRACT
Studies conducted on persistent toxicity/ residual toxicity of different insecticides mixture, biopesticides and botanicalsagainst H. armigera to manage its population below ETL revealed that roket 0.05% was the most persistent insecticidegiving continued mortality of its larvae up to 10 days after spray. It was closely followed by colphos 0-05% andprofenofos 0.05%, whereas eucalyptus formulation proved to be the least persistent. However, nimbicidine (neemformulation) and eucalyptus formulation registered 53.33 per cent mortality in both the treatments.
Key words: Helicoverpa armigera, insecticides, biopesticides, persistance toxicity.
Journal of Eco-friendly Agriculture 4(1): 54-56 : 2009
INTRODUCTION
The residual toxicity resulting from foliar spray ofinsecticides could be of great significance in IPM, an effectiveperiod over which an insecticide could persist in biologicallyactive form under field conditions. The period of effectivenesscan be evaluated on the basis of PT and RPT values denotingpersistent toxicity and relative persistent toxicity. The presentinvestigation was therefore, undertaken to study thepersistent toxicity of commercially available synergisticmixture of synthetic pyrethroids and organophosphatesalong with combinations of biopesticide and insecticides,and biopesticides and botanicals against H. armigerainfesting chickpea.
MATERIALS AND METHODS
To test the persistency of different insecticides mixture,a field trial was conducted at C.S.A. University of Agricultureand Technology, Kanpur during Rabi season of twoconsecutive years, 2003-2004 and 2004-05. Chickpea cultivarKPG 59 was used as test crop. The experiment was laid outin Randomized Block Design having thirteen treatmentsincluding control in three replications. The sowing was donein plot size of 3.6X3 m2 with plot to plot spacing of 30 cm.The first spraying was given at 50.0 per cent flowering stagefollowed by second spraying after 15 days.
Laboratory reared Helicoverpa armigera third instarlarvae were used to test persistency. The leaves from thetreated and control plots were brought to the laboratory atan internal of on, 1,3,7,10 and 15 days after treatment in fieldand kept in petridishes. One larvae (IIIrd instar) was releasedinto each tube and 10 such petridishes formed onereplication. Three replications of each treatment includingthe control were maintained. Observations on mortality wererecorded after 24, 48 and 72h exposure period. The data on
mortality were corrected by using Abott’s formula (1925).Persistence toxicity and relative persistence toxicity indicesfollowing Sarup et al. (1970) were also worked out.
RESULTS AND DISCUSSION
It is evident from Table- 1 that insecticides mixture (roket44 EC and colphos 405 EC) and profenofos 50 EC were foundsignificantly superior than other treatments.
Hundred percent larval mortality was observed in roket0.05 per cent and the lowest of 46.66 per cent in neemarin 2.0per cent formulation treated leaves at 72h exposure periodafter zero hour of spraying. It was followed by colphos 0.05per cent (93.33%) and profenofos 0.05% (90.00%), which wereat par with each other during 2003-04. All the combinationof insecticides/ biopesticides/ botanicals (nimbicidine+biolep, endosulfan + nimbicidine and endosulfan+biolep)were at par with each other with mean mortality rangingfrom 73.33 per cent to 76.67 per cent, respectively. Nimbicidineand eucalyptus formulation registered the maximum(53.33%) mortality.
When leaves were fed to larvae after three days ofspraying, it was observed that in the treatments withbotanicals and B.t. formulation, the per cent larval mortalitygradually decreased (36.67% to 13.33%). Roket and colphosagain caused highest mortality of 93.33 per cent and 83.33per cent, respectively, followed by profenofos (66.67%).
After seven days of spraying, the highest larvalmortality (73.33%) was observed in colphos and roket treatedplots. No significant difference was observed among thetreatments endosulfan+Biolep, profenofos, endosulfan andendosulfan+nimbicidine with respect to larval mortality at72h exposure period, after seven days of spaying.
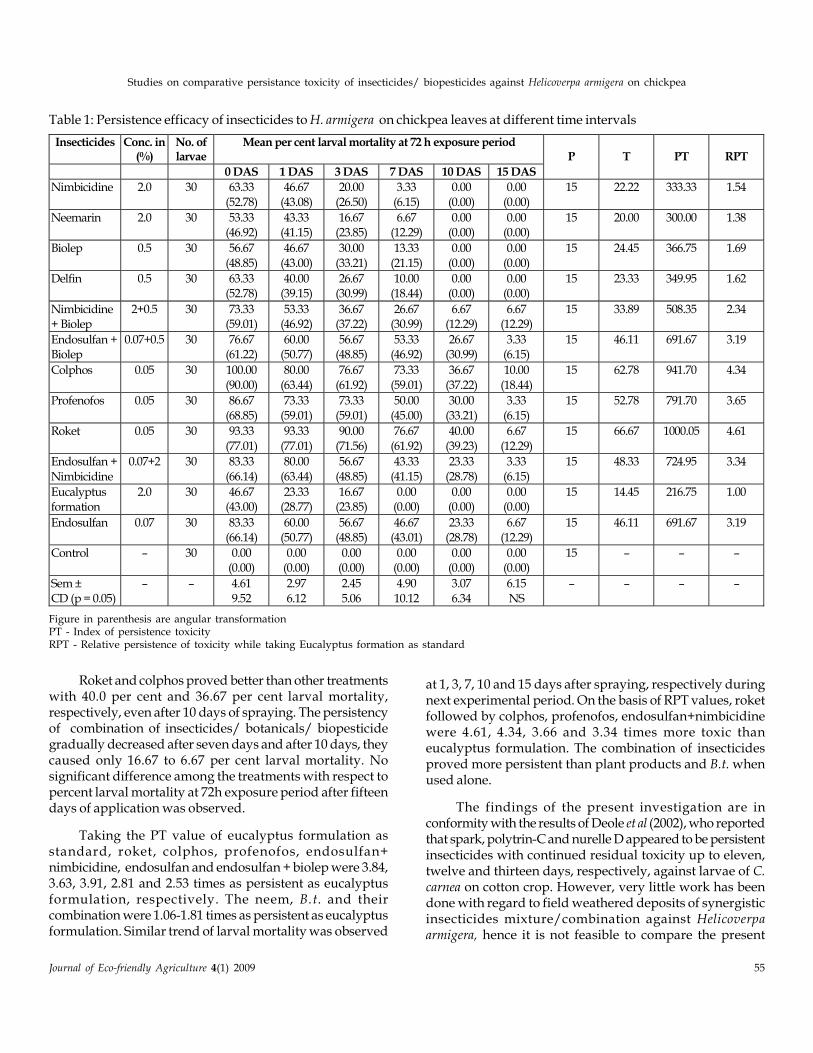
Studies on comparative persistance toxicity of insecticides/ biopesticides against Helicoverpa armigera on chickpea
Journal of Eco-friendly Agriculture 4(1) 2009 55
Roket and colphos proved better than other treatmentswith 40.0 per cent and 36.67 per cent larval mortality,respectively, even after 10 days of spraying. The persistencyof combination of insecticides/ botanicals/ biopesticidegradually decreased after seven days and after 10 days, theycaused only 16.67 to 6.67 per cent larval mortality. Nosignificant difference among the treatments with respect topercent larval mortality at 72h exposure period after fifteendays of application was observed.
Taking the PT value of eucalyptus formulation asstandard, roket, colphos, profenofos, endosulfan+nimbicidine, endosulfan and endosulfan + biolep were 3.84,3.63, 3.91, 2.81 and 2.53 times as persistent as eucalyptusformulation, respectively. The neem, B.t. and theircombination were 1.06-1.81 times as persistent as eucalyptusformulation. Similar trend of larval mortality was observed
at 1, 3, 7, 10 and 15 days after spraying, respectively duringnext experimental period. On the basis of RPT values, roketfollowed by colphos, profenofos, endosulfan+nimbicidinewere 4.61, 4.34, 3.66 and 3.34 times more toxic thaneucalyptus formulation. The combination of insecticidesproved more persistent than plant products and B.t. whenused alone.
The findings of the present investigation are inconformity with the results of Deole et al (2002), who reportedthat spark, polytrin-C and nurelle D appeared to be persistentinsecticides with continued residual toxicity up to eleven,twelve and thirteen days, respectively, against larvae of C.carnea on cotton crop. However, very little work has beendone with regard to field weathered deposits of synergisticinsecticides mixture/combination against Helicoverpaarmigera, hence it is not feasible to compare the present
Table 1: Persistence efficacy of insecticides to H. armigera on chickpea leaves at different time intervals
Insecticides Conc. in (%)
No. of larvae
Mean per cent larval mortality at 72 h exposure period
0 DAS 1 DAS 3 DAS 7 DAS 10 DAS 15 DAS
P T PT RPT
Nimbicidine 2.0 30 63.33
(52.78)
46.67
(43.08)
20.00
(26.50)
3.33
(6.15)
0.00
(0.00)
0.00
(0.00)
15 22.22 333.33 1.54
Neemarin 2.0 30 53.33 (46.92)
43.33 (41.15)
16.67 (23.85)
6.67 (12.29)
0.00 (0.00)
0.00 (0.00)
15 20.00 300.00 1.38
Biolep 0.5 30 56.67
(48.85)
46.67
(43.00)
30.00
(33.21)
13.33
(21.15)
0.00
(0.00)
0.00
(0.00)
15 24.45 366.75 1.69
Delfin 0.5 30 63.33 (52.78)
40.00 (39.15)
26.67 (30.99)
10.00 (18.44)
0.00 (0.00)
0.00 (0.00)
15 23.33 349.95 1.62
Nimbicidine + Biolep
2+0.5 30 73.33 (59.01)
53.33 (46.92)
36.67 (37.22)
26.67 (30.99)
6.67 (12.29)
6.67 (12.29)
15 33.89 508.35 2.34
Endosulfan + Biolep
0.07+0.5 30 76.67 (61.22)
60.00 (50.77)
56.67 (48.85)
53.33 (46.92)
26.67 (30.99)
3.33 (6.15)
15 46.11 691.67 3.19
Colphos 0.05 30 100.00
(90.00)
80.00
(63.44)
76.67
(61.92)
73.33
(59.01)
36.67
(37.22)
10.00
(18.44)
15 62.78 941.70 4.34
Profenofos 0.05 30 86.67
(68.85)
73.33
(59.01)
73.33
(59.01)
50.00
(45.00)
30.00
(33.21)
3.33
(6.15)
15 52.78 791.70 3.65
Roket 0.05 30 93.33
(77.01)
93.33
(77.01)
90.00
(71.56)
76.67
(61.92)
40.00
(39.23)
6.67
(12.29)
15 66.67 1000.05 4.61
Endosulfan +
Nimbicidine
0.07+2 30 83.33
(66.14)
80.00
(63.44)
56.67
(48.85)
43.33
(41.15)
23.33
(28.78)
3.33
(6.15)
15 48.33 724.95 3.34
Eucalyptus formation
2.0 30 46.67 (43.00)
23.33 (28.77)
16.67 (23.85)
0.00 (0.00)
0.00 (0.00)
0.00 (0.00)
15 14.45 216.75 1.00
Endosulfan 0.07 30 83.33 (66.14)
60.00 (50.77)
56.67 (48.85)
46.67 (43.01)
23.33 (28.78)
6.67 (12.29)
15 46.11 691.67 3.19
Control – 30 0.00 (0.00)
0.00 (0.00)
0.00 (0.00)
0.00 (0.00)
0.00 (0.00)
0.00 (0.00)
15 – – –
Sem ±
CD (p = 0.05)
– – 4.61
9.52
2.97
6.12
2.45
5.06
4.90
10.12
3.07
6.34
6.15
NS
– – – –
Figure in parenthesis are angular transformationPT - Index of persistence toxicityRPT - Relative persistence of toxicity while taking Eucalyptus formation as standard
56 Journal of Eco-friendly Agriculture 4(1) 2009
Ritu Srivastava and K.D. Upadhayay
studies. It was also concluded from the present study thatinsecticides mixture having either cypermethrin withprofenofos or ethion as their components could be bestutilized to control this pest under field conditions. This facthas also been reported by several workers (Dhingra et al.(2003), Singh et al (2003), Chandrakar and Srivastava (2001)and Ujagir et al. (1997).
CONCLUSION
It is concluded that insecticide mixture (rocket 44 ECand colphos 405 EC) and profenofos 50 EC are significantlysuperior giving 100, 93.33 and 90.00 per cent larval mortalityat 72h exposure period. The biopesticide nimbicidine (neemformulation) and eucalyptus formulation registered themaximum mortality (53.33%), among all the biopesticidetreatments. Taking the PT value of eucalytus formulation asstandard, roket, colphos and profenofos, endosulfan+nimbicidine, endosulfan and endosulfan+biolep are 3.84,3.63, 3.91, 2.81 and 2.53 times as persistence as eucalyptusformulations, respectively. On the basis of RPT values, roketfollowed by colphos, profenofos, endosulfan+nimbicidineare 4.61, 4.34, 3.66 and 3.34 times more toxic than eucalyptusformulation.
REFERENCES
Abott, W.S. 1925. A method of computing the effectiveness of aninsecticide. Journal of Economic Entomology, 18: 265-67.
Chandrakar, H.K. and Srivastava. S.K. 2001. Effect of insecticideson control of Helicoverpa armigera (Hub.) and their subsequentresurgence on chickpea. Environment and Ecology, 19: 477-478.
Deole, S.A.; Bodhode, S.N.; Mahajan, L.B.; Deotaale, V.Y. andSharnagat, B.K. 2000. Residual toxicity of some pesticides usedin cotton pest management against a chrysopid (C. carnea).Journal of soil crops, 10 : 279-281.
Dhingra S.; Kadandaram, M.H.; Hegde, R.S. and Srivastava, C.2003. Evaluation of defferent insecticides mixture against thirdinstar larvae of Helicoverpa armigera (Hubner). Annals of PlantProtection Sciences, 11 : 274-276.
Sarup, P.; Singh, D.S.; Amrapuri, S. and Rattan, L. 1970 Resistantand relative toxicity of some important pesticides to the adultof sugarcane leaf hopper, Pyrilla perpusilla Walker, Indian Journalof Entomology, 32: 256-267.
Singh S.S.; Tiwari, B.C. and Rao, V.K. 2003. Comparative efficacyof some modern insecticides and neem based formulationagainst cabbage butterfly, Pieris brassicae. Indian Journal ofEntomology, 65: 264-267.
Ujagir, R.; Chaubey, A.K.; Sehgal, V.K.Sani, G.C. and Singh J.P1997. Evaluation of some insecticides against H. armigera onchickpea at Badaun, Uttar Pradesh, India. International Chickpeaand Pigeonpea Newsletter, 4:22-24
©2009
Individual and joint effect of endosulfan and biolep ontobacco caterpillar, Spodoptera litura (Fab.)
HAIDAR ALI AND M. SHAFIQ ANSARI*
Department of Plant Protection, Faculty of Agricultural Sciences, Aligarh Muslim University, Aligarh-202002, U.P. (India)
e.mail: <[email protected]>
ABSTRACT
Individual and joint effect of endosulfan and biolep (B. thuringiensis formulation) studied on third instar larvae ofSpodoptera litura revealed that endosulfan caused a well marked mortality even at a lower concentration of 0.0078 percent while biolep was most effective at higher concentrations of 1, 2 and 3 per cent. Results of joint effect showed anadditive effect with 1.0 per cent biolep mixed endosulfan while 0.5 per cent biolep showed a non-additive effect exceptfor a few concentrations of 0.0625, 0.0312 and 0.0156 per cent. However, an antagonistic effect was observed at 0.25per cent of biolep.
Key words: Spodoptera litura, biolep (B. thuringiensis), endosulfan, Lc50,
temperature.
Journal of Eco-friendly Agriculture 4(1): 57-60 : 2009
The tobacco caterpillar, S. litura (Lepidoptera:Noctuiidae) is a polyphagous insect pest and has beenrecorded damaging 63 plant species belonging to 22 families(Prasad and Bhattacharya, 1975; Jat and Bhardwaj, 2005;Dhawan et al., 2007). Wide range of insecticidesindiscriminately used against this pest has resulted indevelopment of resistance (Mathirajan and Regupathy, 2002;Chalam et al., 2003), mammalian, avian and fish toxicity,biomagnifications and resurgence of insect pests. Latha etal. (2002) studied the insect pathogens, Bacillus thuringiensisvar. kurstaki (Btk) and found effective against S. litura (Fab.)Therefore, efforts have been made to determine the individualand joint effect of endosulfan and biolep, a commercialformulation of B. thuringiensis which is eco-friendly, safe,easy to use, and cheap (Carlton, 1988) as compared tochemical pesticides. Further, the activity of B. thuringiensiscan be compounded if the insecticide is used in combinationwith doses low enough for the natural enemies to sustainand to function simultaneously. Benz (1991) found that themost insecticides were compatible with B. thuringiensishaving synergistic effect, little or no effect on sporegermination or cell multiplication.
MATERIALS AND METHODS
The nucleus culture of S. litura was maintained in theBOD chamber at 27±1°C and 60-70 per cent relative humidity.The caterpillars were reared on fresh castor leaves, Ricinuscommunis. In order to maintain hygienic conditions the faecalmatter and dried leaves were removed daily from the rearingglass jars. Third instar larvae were selected for bioassay. Inthe first experiment, different concentrations of endosulfanalone (0.125, 0.0625, 0.0312, 0.0156, 0.0078, 0.0039, 0.00195
and 0.000975 per cent) were prepared in distilled water. Inthe 2nd experiment, 3, 2, 1, 0.5, 0.25, 0.125 and 0.015 per centconcentration of biolep (a commercial formulation of B.thuringiensis var. Kurstaki HD-1 3a, 3b, 90-102 billion spores/gm) was prepared in 0.008 per cent normal saline solution.Fresh castor leaves were impregnated in desiredconcentrations, dried at room temperature and was offeredto 3rd instar larvae. Five larvae were taken for eachconcentration and was replicated thrice. The impregnatedleaves were removed after 24-hr (I experiment) and 12-hr (IIexperiment) and then fresh leaves were provided to the larvae.Mortality count was made 24–hr (I experiment) and 12-hr (IIexperiment) after treatment. A parallel control was also runfor each concentration. For the observation on mortality aftertreatment, the same number of 3rd instar larvae and desiredconcentrations of endosulfan and biolep were used andeach set of desired concentration was replicated thrice. Themoribund larvae were treated as dead. Corrected mortality(Abbott, 1925) was obtained and the data were subjected toprobit analysis (Finney, 1952).
To study the joint effect of biolep and endosulfan,desired concentration of biolep (1, 0.5 and 0.25 per cent) wasmixed with different concentration of endosulfan (0.125,0.0625, 0.03125, 0.0156, 0.0078, 0.0039 and 0.00195 per cent).Rest of the experimental procedures were the same asfollowed in case of individual treatment of endusulfan andbiolep.
RESULTS AND DISCUSSION
Table-1 revealed that susceptibility of 3rd instar larvaewas increased with increase in concentration of endosulfan.
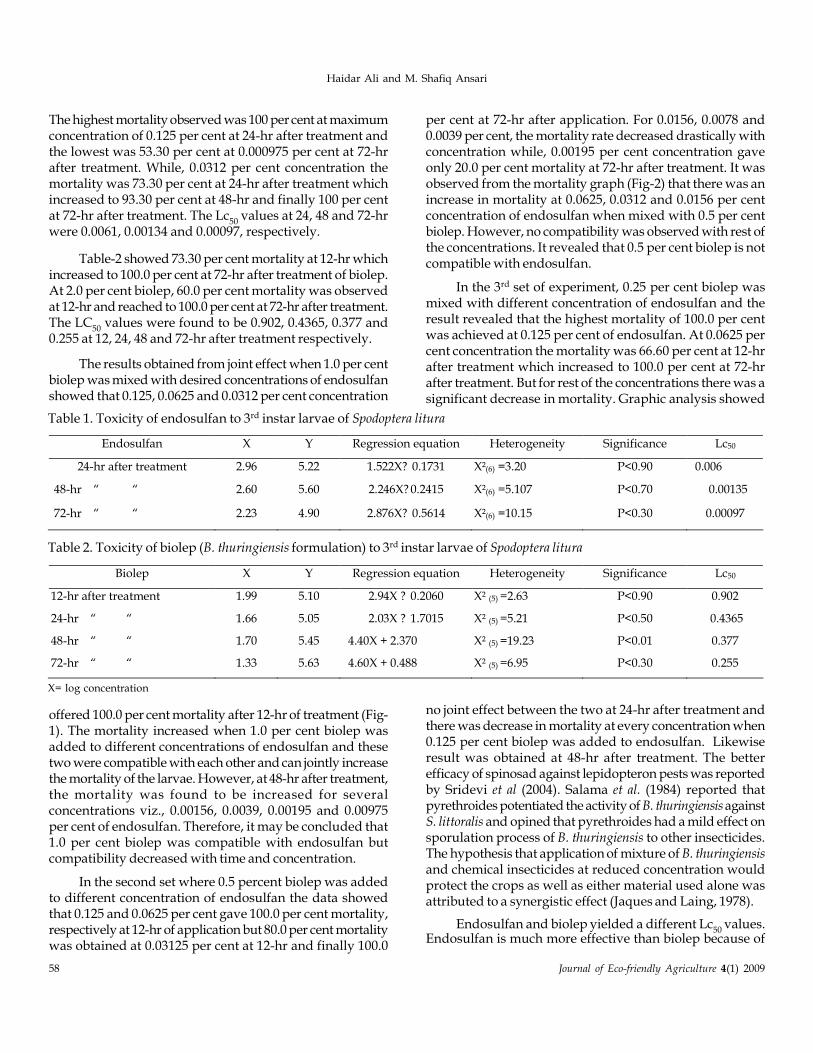
58 Journal of Eco-friendly Agriculture 4(1) 2009
Haidar Ali and M. Shafiq Ansari
The highest mortality observed was 100 per cent at maximumconcentration of 0.125 per cent at 24-hr after treatment andthe lowest was 53.30 per cent at 0.000975 per cent at 72-hrafter treatment. While, 0.0312 per cent concentration themortality was 73.30 per cent at 24-hr after treatment whichincreased to 93.30 per cent at 48-hr and finally 100 per centat 72-hr after treatment. The Lc
50 values at 24, 48 and 72-hr
were 0.0061, 0.00134 and 0.00097, respectively.
Table-2 showed 73.30 per cent mortality at 12-hr whichincreased to 100.0 per cent at 72-hr after treatment of biolep.At 2.0 per cent biolep, 60.0 per cent mortality was observedat 12-hr and reached to 100.0 per cent at 72-hr after treatment.The LC
50 values were found to be 0.902, 0.4365, 0.377 and
0.255 at 12, 24, 48 and 72-hr after treatment respectively.
The results obtained from joint effect when 1.0 per centbiolep was mixed with desired concentrations of endosulfanshowed that 0.125, 0.0625 and 0.0312 per cent concentration
per cent at 72-hr after application. For 0.0156, 0.0078 and0.0039 per cent, the mortality rate decreased drastically withconcentration while, 0.00195 per cent concentration gaveonly 20.0 per cent mortality at 72-hr after treatment. It wasobserved from the mortality graph (Fig-2) that there was anincrease in mortality at 0.0625, 0.0312 and 0.0156 per centconcentration of endosulfan when mixed with 0.5 per centbiolep. However, no compatibility was observed with rest ofthe concentrations. It revealed that 0.5 per cent biolep is notcompatible with endosulfan.
In the 3rd set of experiment, 0.25 per cent biolep wasmixed with different concentration of endosulfan and theresult revealed that the highest mortality of 100.0 per centwas achieved at 0.125 per cent of endosulfan. At 0.0625 percent concentration the mortality was 66.60 per cent at 12-hrafter treatment which increased to 100.0 per cent at 72-hrafter treatment. But for rest of the concentrations there was asignificant decrease in mortality. Graphic analysis showed
Table 1. Toxicity of endosulfan to 3rd instar larvae of Spodoptera litura
Endosulfan X Y Regression equation Heterogeneity Significance Lc50
24-hr after treatment 2.96 5.22 1.522X? 0.1731 X²(6) =3.20 P<0.90 0.006
48-hr “ “ 2.60 5.60 2.246X? 0.2415 X²(6) =5.107 P<0.70 0.00135
72-hr “ “ 2.23 4.90 2.876X? 0.5614 X²(6) =10.15 P<0.30 0.00097
Table 2. Toxicity of biolep (B. thuringiensis formulation) to 3rd instar larvae of Spodoptera litura
Biolep X Y Regression equation Heterogeneity Significance Lc50
12-hr after treatment 1.99 5.10 2.94X ? 0.2060 X² (5) =2.63 P<0.90 0.902
24-hr “ “ 1.66 5.05 2.03X ? 1.7015 X² (5) =5.21 P<0.50 0.4365
48-hr “ “ 1.70 5.45 4.40X + 2.370 X² (5) =19.23 P<0.01 0.377
72-hr “ “ 1.33 5.63 4.60X + 0.488 X² (5) =6.95 P<0.30 0.255
X= log concentration
offered 100.0 per cent mortality after 12-hr of treatment (Fig-1). The mortality increased when 1.0 per cent biolep wasadded to different concentrations of endosulfan and thesetwo were compatible with each other and can jointly increasethe mortality of the larvae. However, at 48-hr after treatment,the mortality was found to be increased for severalconcentrations viz., 0.00156, 0.0039, 0.00195 and 0.00975per cent of endosulfan. Therefore, it may be concluded that1.0 per cent biolep was compatible with endosulfan butcompatibility decreased with time and concentration.
In the second set where 0.5 percent biolep was addedto different concentration of endosulfan the data showedthat 0.125 and 0.0625 per cent gave 100.0 per cent mortality,respectively at 12-hr of application but 80.0 per cent mortalitywas obtained at 0.03125 per cent at 12-hr and finally 100.0
no joint effect between the two at 24-hr after treatment andthere was decrease in mortality at every concentration when0.125 per cent biolep was added to endosulfan. Likewiseresult was obtained at 48-hr after treatment. The betterefficacy of spinosad against lepidopteron pests was reportedby Sridevi et al (2004). Salama et al. (1984) reported thatpyrethroides potentiated the activity of B. thuringiensis againstS. littoralis and opined that pyrethroides had a mild effect onsporulation process of B. thuringiensis to other insecticides.The hypothesis that application of mixture of B. thuringiensisand chemical insecticides at reduced concentration wouldprotect the crops as well as either material used alone wasattributed to a synergistic effect (Jaques and Laing, 1978).
Endosulfan and biolep yielded a different Lc50
values.Endosulfan is much more effective than biolep because of
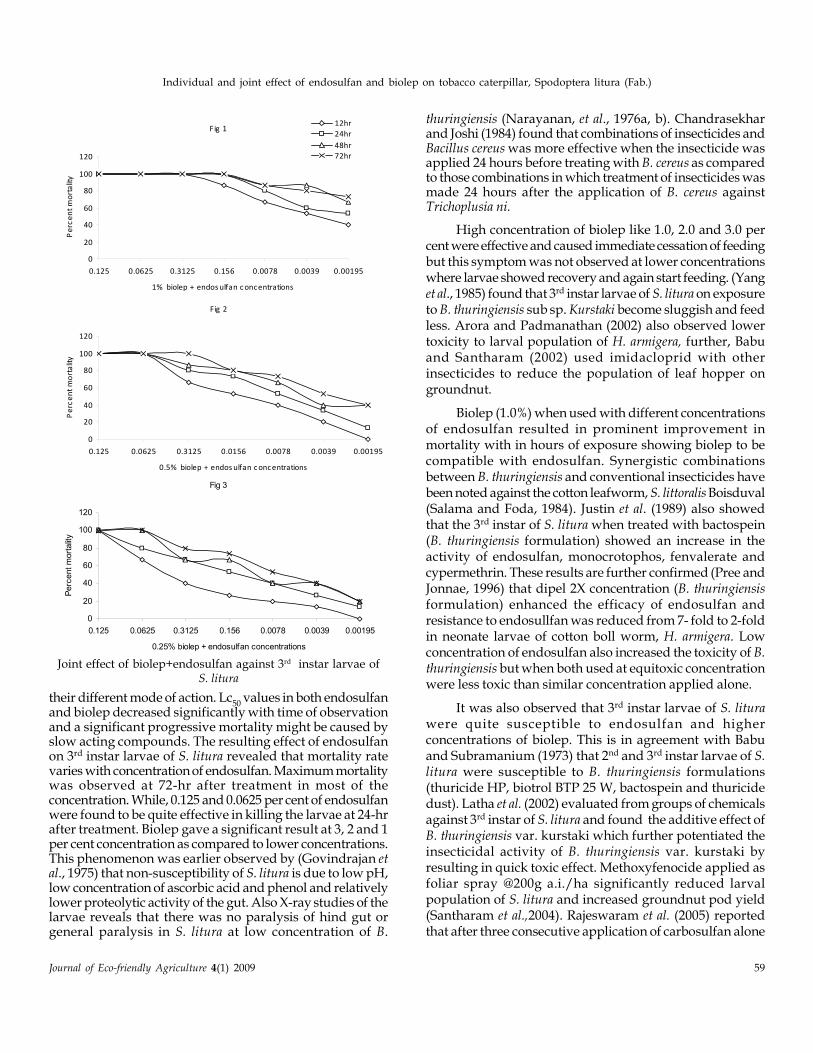
Individual and joint effect of endosulfan and biolep on tobacco caterpillar, Spodoptera litura (Fab.)
Journal of Eco-friendly Agriculture 4(1) 2009 59
their different mode of action. Lc50
values in both endosulfanand biolep decreased significantly with time of observationand a significant progressive mortality might be caused byslow acting compounds. The resulting effect of endosulfanon 3rd instar larvae of S. litura revealed that mortality ratevaries with concentration of endosulfan. Maximum mortalitywas observed at 72-hr after treatment in most of theconcentration. While, 0.125 and 0.0625 per cent of endosulfanwere found to be quite effective in killing the larvae at 24-hrafter treatment. Biolep gave a significant result at 3, 2 and 1per cent concentration as compared to lower concentrations.This phenomenon was earlier observed by (Govindrajan etal., 1975) that non-susceptibility of S. litura is due to low pH,low concentration of ascorbic acid and phenol and relativelylower proteolytic activity of the gut. Also X-ray studies of thelarvae reveals that there was no paralysis of hind gut orgeneral paralysis in S. litura at low concentration of B.
thuringiensis (Narayanan, et al., 1976a, b). Chandrasekharand Joshi (1984) found that combinations of insecticides andBacillus cereus was more effective when the insecticide wasapplied 24 hours before treating with B. cereus as comparedto those combinations in which treatment of insecticides wasmade 24 hours after the application of B. cereus againstTrichoplusia ni.
High concentration of biolep like 1.0, 2.0 and 3.0 percent were effective and caused immediate cessation of feedingbut this symptom was not observed at lower concentrationswhere larvae showed recovery and again start feeding. (Yanget al., 1985) found that 3rd instar larvae of S. litura on exposureto B. thuringiensis sub sp. Kurstaki become sluggish and feedless. Arora and Padmanathan (2002) also observed lowertoxicity to larval population of H. armigera, further, Babuand Santharam (2002) used imidacloprid with otherinsecticides to reduce the population of leaf hopper ongroundnut.
Biolep (1.0%) when used with different concentrationsof endosulfan resulted in prominent improvement inmortality with in hours of exposure showing biolep to becompatible with endosulfan. Synergistic combinationsbetween B. thuringiensis and conventional insecticides havebeen noted against the cotton leafworm, S. littoralis Boisduval(Salama and Foda, 1984). Justin et al. (1989) also showedthat the 3rd instar of S. litura when treated with bactospein(B. thuringiensis formulation) showed an increase in theactivity of endosulfan, monocrotophos, fenvalerate andcypermethrin. These results are further confirmed (Pree andJonnae, 1996) that dipel 2X concentration (B. thuringiensisformulation) enhanced the efficacy of endosulfan andresistance to endosullfan was reduced from 7- fold to 2-foldin neonate larvae of cotton boll worm, H. armigera. Lowconcentration of endosulfan also increased the toxicity of B.thuringiensis but when both used at equitoxic concentrationwere less toxic than similar concentration applied alone.
It was also observed that 3rd instar larvae of S. liturawere quite susceptible to endosulfan and higherconcentrations of biolep. This is in agreement with Babuand Subramanium (1973) that 2nd and 3rd instar larvae of S.litura were susceptible to B. thuringiensis formulations(thuricide HP, biotrol BTP 25 W, bactospein and thuricidedust). Latha et al. (2002) evaluated from groups of chemicalsagainst 3rd instar of S. litura and found the additive effect ofB. thuringiensis var. kurstaki which further potentiated theinsecticidal activity of B. thuringiensis var. kurstaki byresulting in quick toxic effect. Methoxyfenocide applied asfoliar spray @200g a.i./ha significantly reduced larvalpopulation of S. litura and increased groundnut pod yield(Santharam et al.,2004). Rajeswaram et al. (2005) reportedthat after three consecutive application of carbosulfan alone
Fig 1
0
20
40
60
80
100
120
0.125 0.0625 0.3125 0.156 0.0078 0.0039 0.00195
1% biolep + endos ulfan c oncentrations
Pe
rce
nt
mo
rta
lity
12hr
24hr
48hr
72hr
Fig 2
0
20
40
60
80
100
120
0.125 0.0625 0.3125 0.0156 0.0078 0.0039 0.00195
0.5% biolep + endos ulfan c oncentrations
Pe
rce
nt
mo
rta
lity
Fig 3
0
20
40
60
80
100
120
0.125 0.0625 0.3125 0.156 0.0078 0.0039 0.00195
0.25% biolep + endosulfan concentrations
Pe
rce
nt m
ort
alit
y
Joint effect of biolep+endosulfan against 3rd instar larvae ofS. litura
60 Journal of Eco-friendly Agriculture 4(1) 2009
Haidar Ali and M. Shafiq Ansari
and in combination brought down aphids, leaf hoppers andthrips population over control. Combined effect of B.thuringiensis var. kurstaki and SINPV with insecticides wasfound significantly superior over control of the larvas of S.litura on cauliflower (Jat and Bhardwaj, 2005).
CONCLUSION
The results reveal that only higher concentrations ofbiolep were compatible with endosulfan than the lowerconcentrations. The same results were also obtained by (Zaz,1990) that endosulfan at 4.0 percent was compatible with B.thuringiensis at high concentration of 7.4X10⁸.
ACKNOWLEDGMENTS
The authors are grateful to the Dean, Faculty ofAgricultural Sciences and Chairman, Department of PlantProtection, Aligarh Muslim University, Aligarh for providingall the necessary facilities for the experiment.
REFERECES
Abbott, W.S. 1925. A method of computing the effectiveness ofan insecticide. Journal of Economic Entomology, 18: 265-267.
Arora, R. and Padmanathan, N. 2002. Field evaluation of nativeNPV for the management of Helicoverpa armigera. Annals ofPlant Protective Science, 10:184-187.
Babu, K.R. and Santharam, G. 2002. Bioefficacy of imidaclopridagainst leaf hopper on groundnut. Annals of Plant ProtectionScience, 10:69-71.
Babu, P.C.S. and Subramaniam, T.R. 1973. Studies with Bacillusthuringiensis Berliner on Spodoptera litura. Madras AgriculturalJournal, 60 :487-491.
Benz, G. 1971. Synergism of micro-organisms and chemicalinsecticides. In H.D. Burges and N.W. Hussey (Eds.) “Microbialcontrol of insects and mites” pp. 327-355 Acad. Press, Londonand New York.
Carlton, B.C. 1988. Development of genetically improved strainsof Bacillus thuringiensis a biological insecticide. AmericanChemical Society, 9: 260-297.
Chalam, M.S.V., Ramchandra Rao, G. and Chinnabba, 2003.Insectcide resistance and its management in cotton aphid inGuntur district. Annals of Plant Protection Science, 11: 228-231.
Chandrasekhar, S. and Joshi, F.L. 1984. Toxicity of someinsecticides used alone and in combination with Bacillus cerusagainst the cabbage semilooper, Trichoplusia ni (Hubner).Indian Journal of Entomology, 46: 323-330.
Dhawan, A.K., Kumar, Ashwinder and Kumar, Ravinder 2007.Relative toxicity of new insecticides against Spodoptera litura.Annals of Plant Protection Science, 15: 235-281.
Finney, D.G. 1952. Probit analysis. Camb. Univ. Press, London.
Govindrajan, R., Jayaraj, S. and Narayanan, K. 1975. Observationon the nature of resistance in Spodoptera Litura (F.) to infectionby Bacillus thuringiensis. Indian Journal of Experimental Biology,13:548-550.
Jaques, R.P. and Laing, D.R. 1978. Efficacy of mixture of Bacillusthuringiensis, viruses and chlordimeform against insect ofcabbage. Canadian Entomology, 110: 443-448.
Jat, M.C. and Bhardwaj, S.C. 2005. Effect of different set oftreatments against 3rd and 5th instar larvae of Spodoptera lituraon cauliflower. Annals of Plant Protection Science, 13: 307-310.
Justin, C.G.L., Rabindra, R.J. and Jayaraj, S. 1989. Increasedinsecticide susceptibility in Heliothis armigera and Spodopteralitura larvae due to Bacillus thuringiensis Berliner treatment.Insect Science Application, 10: 573-576.
Latha, E.S., Krishnayya, P.V. and Subbarathanam, G.V. 2002.Additive effect of certain chemicals on the efficacy of Bacillusthuringiensis var. kurstaki against Spodoptera litura. Annals ofPlant Protective Science, 10:5-11.
Mathirajan, V.G. and Reghupathy, A. 2002. Toxicity ofthiamethoxam to Aphis gossypii, Amrasca devastanis, Nilaparvatalugens and Sogatella furcifera. Annals of Plant Protection Science,10:369-370.
Narayanan, K., Govindarajan, R., Jayaraj, S. and Muthu, M. 1976.X-ray studies on the effect of Bacillus thuringiensis Berliner onthe feeding activity in three species of lepidoptera. CurrentScience, 45:772.
Narayanan, K., Jayaraj, S. and Govindarajan, R. 1976. Furtherobservation on the mode of action of Bacillus thuringiensis onPapillio demoleus and Spodoptera litura. Journal of InvertebratePathology, 28: 269-270.
Prasad, J. and Bhattacharya, A.K. 1975. Growth and developmentof Spodoptera littoralis (Boised) on several plants. Z. Angew.Entomology., 79: 34-48.
Pree David, J. and Jonnae, C.D. 1996. Toxicity of mixture ofBacillus thuringiensis with endosulfan and other insecticides tothe cotton bollworm, Helicoverpa armigera. Pesticide Science, 48:199-204.
Rajeswaram, J., Santharam, G., Kuttalam, S. and Chandrasekran,S. 2005. Biological compatibility of carbosulfan,methyldemeton, carbendazim, magnesium sulphate and theireffects on sucking pests of cotton. Annals of Plant ProtectionScience, 13:27-33.
Salama, H.S. and Foda, M.S. 1984. Studies on the susceptibility ofsome cotton pests to various strains B. thuringiensis. Zeitschriftfur Pflanzenkrankheiten und Pflanzenschutz, 91:65-79.
Santharam, G.K., Babu, K.R., KuttalaM, S. and Chandrasekran, S.2004. Bioefficacy of methoxyfenocide against Helicoverpaarmigera and Spodoptera litura on groundnut. Annals of PlantProtection Science, 12:21-24.
Sridevi, Krishnayya, T. and Rao, P.A. 2004. Efficacy of microbialsalone and in combinations on larval mortality of Helicoverpaarmigera (Hub.) Annals of Plant Protection Science, 12:243-247.
Yang, L.C., yen, D.F. and Hsu, E.L. 1985. Secondary effect of Bacillusthuringiensis var. Kurstaki to larvae of Spodoptera litura. ChineseJournal of Entomology, 5:19-21.
Zaz, G.M. 1990. Relative effectiveness of Bacillus cerus Franklandand Frankland, Bacillus thuringiensis and endosulfan againstSpodoptera litura on caulliflower. Indian Journal ofPlant Protection,18: 85-88.
©2009
Eco-friendly management of mango malformation (Fusariummoniliforme var. subglutinans = Fusarium subglutinans)through certain plant leaf extracts
P. Kumar1, A. K. Misra1, B. K. Pandey1, S. P. Misra2 and D. R. Modi3
1.Central Institute for Subtropical Horticulture, Rehmankhera, PO. Kakori, Lucknow-227 107 (U.P.), 2.Rewa Agriculture College, Rewa-486 003(M.P.),
3.Communicating author : Department of Biotechnology, B.B.A. University, Lucknow- 226 025, U.P., India
ABSTRACT
Leaf extract of twenty-three plants were evaluated for their antifungal activity against fungi causing mangomalformation, Fusarium moniliforme var. subglutinan s= Fusarium subglutinans. Although, all the leaf extracts checkedthe radial growth of test fungus, extracts of Azadirachta indica A. Juss., Achyrenthes roses and Calotropis gigantea provedmore effective against F. subglutinans. While, the leaf extract from Eagle marmelos (L.) Corr., Ricinus communis L. andFicus racemosa L. were found less effective. It was also found that isolate F1 from Sabour was comparatively lessaggressive among all the isolates of F. subglutinans.
Key words: Plant extracts, mango malformation, antifungal activity, Fusarium moniliforme var. subglutinans, vegetativemalformation.
Journal of Eco-friendly Agriculture 4(1): 61-64 : 2009
INTRODUCTION
Mango (Mangifera indica L.) is an important fruit cropwidely grown under subtropical and tropical climate.Malformation is a severe threat to its cultivars in India andseveral other countries causing great economic loss to themango production (Kumar et al., 1993; Kumar andChakrabarti, 1997; Misra et al., 2000). It is estimated thatapproximately 50.0-80.0 per cent losses occur every year inIndia (Kumar and Chakrabarti, 1997). It also causes grossdeformations of vegetative and floral tissues in mango (Ploetz,2001). Fusarium subglutinans (=Fusarium moniliforme var.subglutinans) is isolated from vegetative as well as floralmalformed tissue (Kumar and Beniwal., 1987; Chakrabartiand Ghosal, 1989). Application of different fungicidesthough tried (Misra et al., 2002),which may adversely affectthe environment, has not given satisfactory result andrepeated applications are required. At present removal ofaffected tissue is reported, which control the disease to someextent (Singh et al., 1983). The presence of antifungalcompounds in managing the disease in certain plants havebeen recognized (Mahadevan, 1982). In other reports also,botanicals have been reported to control the growth of fungalpathogens (Bhatnagar et al., 2004; Mamatha and Rai, 2004;Ramanathan et al., 2004; Khan et al., 1998, Gupta et al., 2007).The present study was, therefore, undertaken to evaluateextracts of twenty-three different plants species (selected onthe basis of literature) for their antifungal activity againstthe mango malformation pathogen, F. subglutinans.
MATERIALS AND METHODS
Twenty three plant species reported to have antifungalactivity, were selected (Table 2). Efficacy of leaf extracts ofthese was evaluated against five different isolates of F.subglutinans isolated from the different agroclimatic areasfrom the floral malformed tissues showing variablemorphological growth characters (Table-1). Leaves ofselected plants were thoroughly washed and shade driedafter removing extra water through blotting paper. Extractswere made as per method described by Gerard et al., (1994).Fifty grams of leaf samples from each plant species weremixed with 50.0 ml of sterile distilled water, crushed in mortarand pestle and then filtered through fine muslin cloth. Theextracts were subjected to low speed centrifugation at 3000rpm for 5 min and supernatant was decanted. This wasrandomly designated as 100.0% concentration. Clearsupernatant of plant extracts were diluted with steriledistilled water of equal quantity to get concentration of 50.0%and this dilution was tested for antifungal activity bypoisoned food technique (Grover and Moore, 1962). Ten ml.of each plant extract was incorporated in 90.0 ml of PDAand sterilized. From this sterilised medium, 20.0 ml of theamended medium was poured in sterilized petriplates. Theplates were inoculated with seven days old cultures of F.subglutinans grown on PDA with uniform disc of five mm ofeach of the five isolates seperately (F1, F4, F10, F11 and F18).Suitable control with fungus in PDA was also maintained.The radial growths (diameter) of the colony were measured
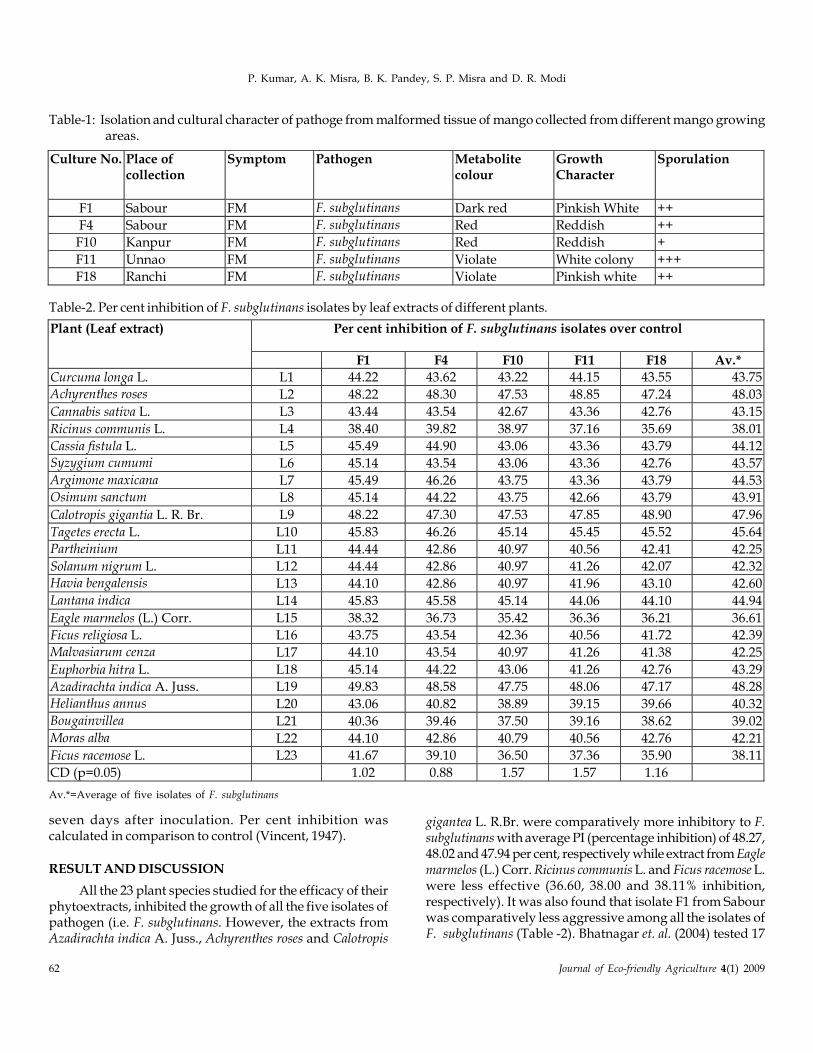
62 Journal of Eco-friendly Agriculture 4(1) 2009
P. Kumar, A. K. Misra, B. K. Pandey, S. P. Misra and D. R. Modi
seven days after inoculation. Per cent inhibition wascalculated in comparison to control (Vincent, 1947).
RESULT AND DISCUSSION
All the 23 plant species studied for the efficacy of theirphytoextracts, inhibited the growth of all the five isolates ofpathogen (i.e. F. subglutinans. However, the extracts fromAzadirachta indica A. Juss., Achyrenthes roses and Calotropis
gigantea L. R.Br. were comparatively more inhibitory to F.subglutinans with average PI (percentage inhibition) of 48.27,48.02 and 47.94 per cent, respectively while extract from Eaglemarmelos (L.) Corr. Ricinus communis L. and Ficus racemose L.were less effective (36.60, 38.00 and 38.11% inhibition,respectively). It was also found that isolate F1 from Sabourwas comparatively less aggressive among all the isolates ofF. subglutinans (Table -2). Bhatnagar et. al. (2004) tested 17
Table-1: Isolation and cultural character of pathoge from malformed tissue of mango collected from different mango growingareas.
Culture No. Place of collection
Symptom Pathogen Metabolite colour
Growth Character
Sporulation
F1 Sabour FM F. subglutinans Dark red Pinkish White ++
F4 Sabour FM F. subglutinans Red Reddish ++
F10 Kanpur FM F. subglutinans Red Reddish +
F11 Unnao FM F. subglutinans Violate White colony +++
F18 Ranchi FM F. subglutinans Violate Pinkish white ++
Table-2. Per cent inhibition of F. subglutinans isolates by leaf extracts of different plants.
Per cent inhibition of F. subglutinans isolates over control Plant (Leaf extract)
F1 F4 F10 F11 F18 Av.*
Curcuma longa L. L1 44.22 43.62 43.22 44.15 43.55 43.75
Achyrenthes roses L2 48.22 48.30 47.53 48.85 47.24 48.03
Cannabis sativa L. L3 43.44 43.54 42.67 43.36 42.76 43.15
Ricinus communis L. L4 38.40 39.82 38.97 37.16 35.69 38.01
Cassia fistula L. L5 45.49 44.90 43.06 43.36 43.79 44.12
Syzygium cumumi L6 45.14 43.54 43.06 43.36 42.76 43.57
Argimone maxicana L7 45.49 46.26 43.75 43.36 43.79 44.53
Osimum sanctum L8 45.14 44.22 43.75 42.66 43.79 43.91
Calotropis gigantia L. R. Br. L9 48.22 47.30 47.53 47.85 48.90 47.96
Tagetes erecta L. L10 45.83 46.26 45.14 45.45 45.52 45.64
Partheinium L11 44.44 42.86 40.97 40.56 42.41 42.25
Solanum nigrum L. L12 44.44 42.86 40.97 41.26 42.07 42.32
Havia bengalensis L13 44.10 42.86 40.97 41.96 43.10 42.60
Lantana indica L14 45.83 45.58 45.14 44.06 44.10 44.94
Eagle marmelos (L.) Corr. L15 38.32 36.73 35.42 36.36 36.21 36.61
Ficus religiosa L. L16 43.75 43.54 42.36 40.56 41.72 42.39
Malvasiarum cenza L17 44.10 43.54 40.97 41.26 41.38 42.25
Euphorbia hitra L. L18 45.14 44.22 43.06 41.26 42.76 43.29
Azadirachta indica A. Juss. L19 49.83 48.58 47.75 48.06 47.17 48.28
Helianthus annus L20 43.06 40.82 38.89 39.15 39.66 40.32
Bougainvillea L21 40.36 39.46 37.50 39.16 38.62 39.02
Moras alba L22 44.10 42.86 40.79 40.56 42.76 42.21
Ficus racemose L. L23 41.67 39.10 36.50 37.36 35.90 38.11
CD (p=0.05) 1.02 0.88 1.57 1.57 1.16
Av.*=Average of five isolates of F. subglutinans
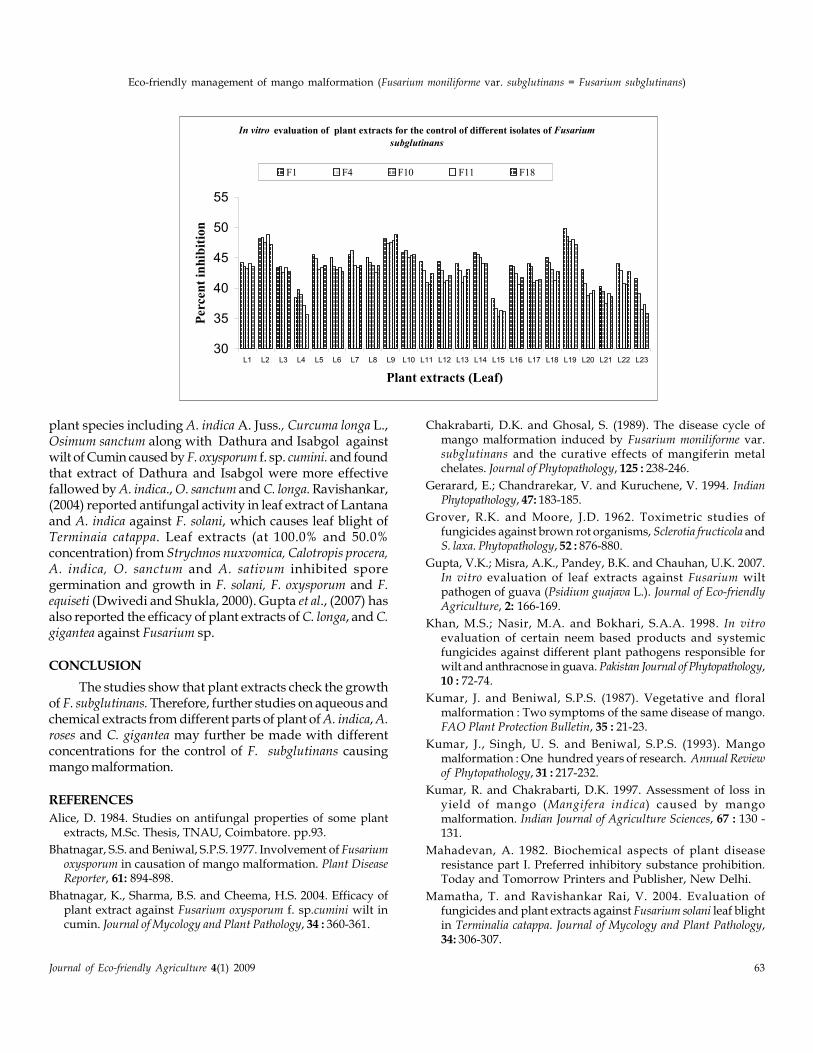
Journal of Eco-friendly Agriculture 4(1) 2009 63
Eco-friendly management of mango malformation (Fusarium moniliforme var. subglutinans = Fusarium subglutinans)
plant species including A. indica A. Juss., Curcuma longa L.,Osimum sanctum along with Dathura and Isabgol againstwilt of Cumin caused by F. oxysporum f. sp. cumini. and foundthat extract of Dathura and Isabgol were more effectivefallowed by A. indica., O. sanctum and C. longa. Ravishankar,(2004) reported antifungal activity in leaf extract of Lantanaand A. indica against F. solani, which causes leaf blight ofTerminaia catappa. Leaf extracts (at 100.0% and 50.0%concentration) from Strychnos nuxvomica, Calotropis procera,A. indica, O. sanctum and A. sativum inhibited sporegermination and growth in F. solani, F. oxysporum and F.equiseti (Dwivedi and Shukla, 2000). Gupta et al., (2007) hasalso reported the efficacy of plant extracts of C. longa, and C.gigantea against Fusarium sp.
CONCLUSION
The studies show that plant extracts check the growthof F. subglutinans. Therefore, further studies on aqueous andchemical extracts from different parts of plant of A. indica, A.roses and C. gigantea may further be made with differentconcentrations for the control of F. subglutinans causingmango malformation.
REFERENCES
Alice, D. 1984. Studies on antifungal properties of some plantextracts, M.Sc. Thesis, TNAU, Coimbatore. pp.93.
Bhatnagar, S.S. and Beniwal, S.P.S. 1977. Involvement of Fusariumoxysporum in causation of mango malformation. Plant DiseaseReporter, 61: 894-898.
Bhatnagar, K., Sharma, B.S. and Cheema, H.S. 2004. Efficacy ofplant extract against Fusarium oxysporum f. sp.cumini wilt incumin. Journal of Mycology and Plant Pathology, 34 : 360-361.
Chakrabarti, D.K. and Ghosal, S. (1989). The disease cycle ofmango malformation induced by Fusarium moniliforme var.subglutinans and the curative effects of mangiferin metalchelates. Journal of Phytopathology, 125 : 238-246.
Gerarard, E.; Chandrarekar, V. and Kuruchene, V. 1994. IndianPhytopathology, 47: 183-185.
Grover, R.K. and Moore, J.D. 1962. Toximetric studies offungicides against brown rot organisms, Sclerotia fructicola andS. laxa. Phytopathology, 52 : 876-880.
Gupta, V.K.; Misra, A.K., Pandey, B.K. and Chauhan, U.K. 2007.In vitro evaluation of leaf extracts against Fusarium wiltpathogen of guava (Psidium guajava L.). Journal of Eco-friendlyAgriculture, 2: 166-169.
Khan, M.S.; Nasir, M.A. and Bokhari, S.A.A. 1998. In vitroevaluation of certain neem based products and systemicfungicides against different plant pathogens responsible forwilt and anthracnose in guava. Pakistan Journal of Phytopathology,10 : 72-74.
Kumar, J. and Beniwal, S.P.S. (1987). Vegetative and floralmalformation : Two symptoms of the same disease of mango.FAO Plant Protection Bulletin, 35 : 21-23.
Kumar, J., Singh, U. S. and Beniwal, S.P.S. (1993). Mangomalformation : One hundred years of research. Annual Reviewof Phytopathology, 31 : 217-232.
Kumar, R. and Chakrabarti, D.K. 1997. Assessment of loss inyield of mango (Mangifera indica) caused by mangomalformation. Indian Journal of Agriculture Sciences, 67 : 130 -131.
Mahadevan, A. 1982. Biochemical aspects of plant diseaseresistance part I. Preferred inhibitory substance prohibition.Today and Tomorrow Printers and Publisher, New Delhi.
Mamatha, T. and Ravishankar Rai, V. 2004. Evaluation offungicides and plant extracts against Fusarium solani leaf blightin Terminalia catappa. Journal of Mycology and Plant Pathology,34: 306-307.
In vitro evaluation of plant extracts for the control of different isolates of Fusarium
subglutinans
30
35
40
45
50
55
L1 L2 L3 L4 L5 L6 L7 L8 L9 L10 L11 L12 L13 L14 L15 L16 L17 L18 L19 L20 L21 L22 L23
Plant extracts (Leaf)
Per
cen
t in
hib
itio
n
F1 F4 F10 F11 F18
64 Journal of Eco-friendly Agriculture 4(1) 2009
P. Kumar, A. K. Misra, B. K. Pandey, S. P. Misra and D. R. Modi
Misra, A.K., Pandey, D. and Singh, V.K. 2000. MangoMalformation-An overview. In : Advances in plant diseasesmanagement (ed. Udit Narain, K. Kumar and MukeshSrivastav). Advance Publishing Concept. Mayapuri, NewDelhi. pp. 185-214.
Misra, A.K., Singh, V.K. and Saini, J.P. 2002. Effect of interval andnumber of sprays of carbendazim for the control of mangomalformation. Indian Journal of Plant Pathology, 20: 75-77.
Ramanathan, A., Marimuthu, T. and Raguchander, T. 2004. Effectof plant extract on growth in Pythium aphanidermatum. Journalof Mycology and Plant Pathology, 34 : 315-317.
Singh, D.S., Pathak, P.A. and Singh, R.D. (1983). Studies on controlof malformation in mango cv. Bombay Green. PunjabHorticulture Journal, 23 : 220-221.
Vincent, J.M. 1947. Distortion of fungal hyphae in presence ofcertain inhibitors. Nature, 96 : 596
©2009
Eco-friendly approach for the management of Bacterial SoftRot of Radish seed crop
M. R. B. Raju*, V. Pal and I. Jalali
Department of Plant Pathology, CCS Haryana Agricultural University, Hisar- 125004, Haryana, IndiaE-mail*: [email protected]
ABSTRACT
In an effort made to evaluate antagonistic rhizosphere bacteria (Pseudomonas fluorescens, Hisar isolate B-10; Bacillussp., Hisar isolate B-13), organic amendments (mustard and cotton cake) and plant extracts (marigold and eucalyptus)in 29 different treatment combinations for the management of bacterial soft rot (Pectobacterium carotovorum subsp.carotovorum) of radish seed crop, combined treatments i.e., organic amendments + bioagents + plant extracts, organicamendments + bioagents or bioagents + plant extracts were found to be more effective in reducing disease incidencethan against individual treatments. Treatment of stecklings with marigold (20%) + Pseudomonas fluorescens isolate B-10 (108 cfu ml-1) + soil amendment with mustard cake provided maximum soft rot control (78.4% reduction overcontrol). This treatment was found superior to dip treatment with streptocycline and soil application of bleachingpowder recording 22.2 and 81.5 per cent disease incidence, respectively.
Key words: Radish, seed crop, bacterial soft rot, Pseudomonas fluorescens, Bacillus sp., mustard cake, cotton cake,marigold, eucalyptus and integrated disease management.
Journal of Eco-friendly Agriculture 4(1): 65-68 : 2009
INTRODUCTION
Radish (Raphanus sativus L.) is one of the importantvegetable crops grown round the year in most parts of India.The production of its seed, an important input in qualityvegetable production, has adversely been affected by a newbacterial soft rot disease resulting in total crop losses inHaryana recently in some instances. The disease was for thefirst time noticed in radish seed growing regions of Haryanaduring 2002 (Anonymous, 2002), which in the later yearsoccurred in epidemic form. It is characterized by yellowingof leaves, poor seed setting, wilting and finally death of theplant resulting in total crop losses. Little informationavailable on this disease needed eco-friendly approachesfor its long lasting management keeping in view the hazardsposed by agricultural chemicals. Integrated approach forenhanced disease control using plant extracts, biocontrolagents or some conventional methods singly or incombination has been illustrated (De et al., 1996; Raju andRaoof, 2002). Use of plant extracts (garlic clove extract) withfungicidal mixture (ammonium copper phosphate) resultedin inhibition of E. chrysanthemi, Xanthomonas campestris pv.campestris and Pseudomonas syringae in vitro whereas in field,integration of garlic extract, peat oxyhumate and fungicidalmixture treatments resulted in optimum control of bacterialdiseases of tomato (Komorova and Korunets, 1997). Thepresent study aims at finding an optimum treatmentcombination using antagonistic rhizosphere bacteria, organicamendments and plant extracts found effective in our earlier
studies (Raju et al., 2004; Raju et al., 2005).
MATERIAL AND METHODS
A two year field study was conducted during 2003-04and 2004-05 at Research area, Department of PlantPathology, CCS Haryana Agricultural University with 29treatment combinations using biocontrol agents, organicamendments and plant extracts each replicated thrice in arandomized block design. Treated radish stecklings of thecv. Punjab safeda (70 days old) were transplanted in plots(3.6 x 3.6 m) at a spacing of 60 x 60 cm. Pectobacteriumcarotovorum subsp. carotovorum (108 cfu ml-1, 18 h old), theincitant of bacterial soft rot of radish seed crop obtained fromdiseased radish, was applied to the cut surface of radishsteckling with cotton swab for induction of soft rot.
Compatibility of the biocontrol agents with plantextracts and agrochemicals: For devising any suitableenvironmentally safe integrated management strategy for thecontrol of plant diseases using bioagents in combinationwith plant extracts or chemicals, it is necessary to determinetheir compatibility before integrating them for theireffectiveness in field. The antagonistic rhizosphere bacteriawere tested by filter paper disc assay for their compatibilitywith plant extracts and agrochemicals. Plant extracts weretested at 10.0 and 20.0 per cent conc. whereas, antibiotics at100 and 250 ppm. Inhibition zones were recorded and theantibacterial activity of plant extracts and agrochemicals was
66 Journal of Eco-friendly Agriculture 4(1) 2009
M. R. B. Raju, V. Pal and I. Jalali
expressed as inhibition annulus (Smale and Keils, 1966).
Inhibition annulus = (R1
- R2) (R
1 + R
2)
R1= radius of zone of inhibition + radius of bacterial agar
assay disc
R2 = Radius of bacterial assay disc
Integrated management: Two antagonists, viz.,Pseudomonas fluorescens (Hisar isolate B-10) and Bacillus sp(Hisar isolate, B-13), organic soil amendments (Mustard andcotton cake) and phytoncides (aqueous leaf extracts ofmarigold and eucalyptus) exhibiting maximum inhibitionof P. c. subsp. carotovorum in the in vitro and pot study werefurther evaluated in 29 treatment combinations underartificial inoculation conditions. Bacterial bio-control agents(18 h old fresh growth) were applied by dipping of stecklingsin antagonistic bacterial suspension (108 cfu ml-1) for 2 hbefore inoculation with soft rot causing bacterium. Organicamendments were added @ 250 kg ha-1 to the soil in the pitsbefore transplanting of the radish stecklings. Treatment withbotanicals included dipping of cut ends of the stecklings in10.0 per cent aqueous plant extract for 6 h followed by airdrying before inoculation with the test pathogen. Incombination treatments, stecklings were initially dipped inplants extracts for 6 h, air-dried followed by treatment withbiocontrol agents. Streptocycline (dip treatment of stecklingsin 250 ppm for 2 h) and soil application of bleaching powder(12.5 kg ha-1) were used for comparison as standard checks.Stecklings inoculated with the test pathogen alone constitutedpathogen inoculated check.
All the recommended agronomic practices werefollowed in raising the radish seed crop. Data on soft rotincidence was taken periodically throughout the study andexpressed as per cent disease incidence. Seed yield wasrecorded and expressed as per cent increase in seed yieldover pathogen-inoculated control. Observations on diseaseincidence and seed yield were recorded in individualtreatments separately and were compared with pathogen-inoculated check. Data on seed yield was expressed as Kgha-1.
RESULTS AND DISCUSSION
Compatibility of the antagonists with plant extractsand agrochemicals: Marigold at 10.0 per cent (37.7 mm2
inhibition annuulus) and tetracycline at 100 ppm (57.4 mm2)were found to be least toxic to the bioagents tested (Table 1)among the aqueous leaf extracts and antibiotics tested. P.fluorescens (B-10) was more tolerant to all the tested treatmentsthan Bacillus sp. (B-13) marigold and eucalyptus at 10.0 percent did not have any adverse effect on the growth of B-10. Ingeneral, the bio-agents were found to be more sensitive toantibiotics than the plant extracts tested.
Integrated management: It is clear from the resultspresented in Table 2 that dip treatment of stecklings in
Table 1: In vitro compatibility of the potential bioagents withantibiotics and plant extracts found effectiveagainst P. c. subsp. carotovorum
Bioagent
B-10 (Pseudomonas
fluorescens)
B-13 (Bacillus sp.)
Treatment Conc.
(%) Inhibition zone (mm)
Inhibition
annulus (mm2)
Inhibition zone
(mm)
Inhibition
annulus (mm2)
Mean (mm2)
Marigold 10.0% 0.0 0.0 4.0 75.4 37.7
20.0% 2.0 47.6 6.0 114.9 81.3
Eucalyptus 10.0% 0.0 0.0 5.0 98.1 49.1 20.0% 1.3 22.5 7.7 166.7 94.6
Streptocycline 100 ppm 2.7 47.6 4.3 75.4 61.5
250 ppm 5.3 106.2 8.0 175.8 141.0
Tetracycline 100 ppm 0.3 16.5 5.3 98.1 57.3
250 ppm 4.7 98.1 10.0 235.5 166.8
Control - 0.0 0.0 0.0 0.0 Mean - - 42.3 - 129.9
P. fluorescens (109 cfu ml-1) for 2 h was most effective amongindividual treatments in controlling radish soft rot (23.9 %)and provided significantly higher yields (407.4 kg ha-1) overcontrol during both the crop seasons. Soil amendment withmustard cake @ 250 kg ha-1 (56.1 % soft rot reduction) anddip treatment of stecklings in aqueous leaf extracts ofMarigold (55.2 %) were also found superior to thecorresponding individual treatments i.e., cotton cake andaqueous leaf extracts of eucalyptus.
The combined treatments, marigold leaf extract + P.fluorescens were found effective in providing the maximumcontrol (70.5 % reduction) of soft rot among all the two-waycombination treatments (Table 2). In general, treatments
Mean of three replications
CD (P=0.05) Treatments 12.0 Biocontrol agents 6.0 Trts. X Biocontrol ageents 16.2
% soft rot incidence incontrol -
% soft rot incidence in treatmentPer cent Reduction in soft rot over control x 100
% soft rot incidence incontrol
Number of seedlings showing soft rotPer cent D isease
incidence = x 100Total number of seedlings
in the plot
Seed yield in Treatment Seed yield in controlPercent Increase in
yield over control= x100
Seed yield in control
Eco-Friendly Approach For The Management Bacterial Soft Rot of Radish Seed Crop
Journal of Eco-friendly Agriculture 4(1) 2009 67
comprising of marigold leaf extract, P. fluorescens or mustardcake were more effective in checking radish soft rot incidence.However, P. fluorescens + cotton cake was found more effective(68.1 % reduction) as compared to P. f + Mustard (61.4 %) inchecking soft rot development. In terms of yield promotion,irrespective of the treatment, the incorporation of P. fluorescensresulted in significant increase in yields. In two-waycombination treatments, maximum yields (460.6 kg ha-1) wasobtained when stecklings were treated with marigold leafextract + P. fluorescens followed by 424.5 kg ha-1 with
treatment consisting of marigold + mustard cake. Thetreatment comprising of Bacillus sp. + cotton cake was leasteffective (319.9 kg ha-1) amongst the two combinationtreatments in terms of yield promotion.
The results reported herein indicate that integratedtreatment comprising of aqueous leaf extract of marigold (10%), P. fluorescens (109 cfu ml-1) and mustard cake (250 kg ha-
1) provided maximum soft rot control (79.4 % reduction)followed by eucalyptus + P. fluorescens + mustard cake (75.0% reduction), these treatments were equally effective to the
Table 2: Integrated management of bacterial soft rot of radish seed crop under disease stress conditions
2004 2005 Cumulative data (2004+2005)
Treatment Soft rot Incidence
(%)
Seed yield
(Kg ha-1)
? Soft rot Incidence
(%)
Seed yield
(Kg ha-1)
Mean soft rot incidence
(%)
Per cent reduction in
soft rot
Mean seed yield
(Kg ha-1)
Per cent increase in seed yield
Marigold 31.6(34.2) 335.0 37.3(37.7) 314.4 34.5(36.0) 55.2 324.7 332.2
Eucalyptus 31.1(33.9) 304.5 40.8(39.7) 265.5 36.0(36.9) 53.3 285.0 279.4
Mustard cake 30.5(33.5) 293.8 37.1(37.5) 282.5 33.8(35.5) 56.1 288.2 283.6
Cotton cake 34.5(36.0) 254.9 44.7(41.9) 200.3 39.6(39.0) 48.5 227.6 203.0
Pseudomonas fluorescens 17.1(24.4) 437.4 30.8(33.7) 377.4 23.9(29.3) 68.9 407.4 442.2
Bacillus sp. 27.9(31.9) 372.0 36.0(36.9) 315.1 32.0(34.4) 58.5 343.6 357.3
Marigold + Mustard cake 19.7(26.3) 433.8 27.5(31.6) 415.2 23.6(29.1) 69.3 424.5 465.0
Marigold + Cotton cake 25.6(30.4) 370.1 33.0(35.1) 347.1 29.3(32.8) 61.9 358.6 377.3
Eucalyptus + Mustard cake 21.5(27.6) 353.4 31.2(33.9) 342.0 26.3(30.9) 65.8 347.7 362.8
Eucalyptus + Cotton cake 28.4(32.2) 354.0 34.0(35.7) 330.1 31.2(34.0) 59.4 342.1 355.3
Marigold + P.f 18.8(25.7) 489.6 26.7(31.1) 431.5 22.7(28.5) 70.5 460.6 513.0
Marigold + Bacillus sp. 31.2(34.0) 334.2 38.5(38.4) 308.6 34.9(36.2) 54.7 321.4 327.8
Eucalyptus + P.f 19.4(26.2) 442.2 29.4(32.9) 382.0 24.4(29.6) 68.2 412.1 448.5
Eucalyptus + Bacillus sp. 30.7(33.6) 313.4 39.5(39.0) 293.5 35.1(35.7) 54.4 303.5 303.9
P.f + Mustard 26.2(30.8) 376.4 33.1(35.1) 363.8 29.7(33.0) 61.4 370.1 392.6
Bacillus sp.+ Mustard cake 30.7(33.7) 338.3 36.8(37.3) 314.7 33.7(35.5) 56.2 326.5 334.6
P.f + cotton cake 19.5(26.3) 426.4 29.6(33.0) 397.4 24.6(29.7) 68.1 411.9 448.2
B.sp + Cotton cake 33.5(35.4) 326.0 36.8(37.4) 313.7 35.2(36.4) 54.3 319.9 325.8
Marigold + P.f + Mustard 12.3(20.5) 589.4 19.4(26.1) 539.9 15.8(23.4) 79.4 564.7 651.6
Marigold + P.f + Cotton 17.1(24.4) 443.6 28.0(32.0) 405.0 22.5(28.4) 70.7 424.3 464.8
Marigold + B.sp + Mustard 22.1(28.0) 423.3 29.6(32.9) 380.4 25.8(30.6) 66.4 401.8 434.9
Marigold + B.sp + cotton 28.6(32.3) 362.3 35.0(36.3) 338.0 31.8(31.3) 58.7 350.2 366.1
Eucalyptus + P.f + Mustard 13.8(21.8) 497.1 24.7(29.8) 434.3 19.2(26.0) 75.0 465.7 519.9
Eucalyptus+ P.f + Cotton 16.7(24.1) 484.7 28.9(32.5) 409.9 22.8(28.5) 70.4 447.3 495.3
Eucalyptus + B.sp + Mustard 18.4(25.4) 461.7 26.3(30.9) 441.7 22.4(28.3) 70.9 451.7 501.2
Eucalyptus + B.sp + cotton 25.0(30.0) 389.1 33.9(35.6) 326.1 29.5(32.9) 61.7 357.6 375.9
Bleaching powder 62.8(52.4) 94.4 71.5(57.7) 73.2 67.2(55.0) 12.7 83.8 11.5
Streptocycline 13.4(21.5) 386.8 22.2(28.1) 352.8 17.8(25.0) 76.9 369.8 392.2
Inoculated control 65.5(54.0) 79.6 88.4(70.1) 70.7 76.9(61.4) - 75.1 -
* Mean of three replications ; P.f= Pseudomonas fluorescens; B.sp = Bacillus sp.
CD(P=0.05) Disease incidence Seed yield Treatments (12.0) 38.0 Years (6.1) 23.2 Trt. x Years (8.6) 32.9
68 Journal of Eco-friendly Agriculture 4(1) 2009
M. R. B. Raju, V. Pal and I. Jalali
dip treatment of stecklings with streptocycline (250 ppm)during the two year study. The treatment involving marigold+ Pseudomonas fluorescens + mustard cake was found superioramong all the treatment combinations both in terms ofdisease suppression as well as yield promotion (564.7 kgha-1). All the treatments (treatments involving combinationof three inputs) were found to be statistically at par witheach other. However, significantly higher yields wereobtained in eucalyptus + P. fluorescens + mustard cake (465.7kg ha-1), eucalyptus + P. fluorescens + cotton cake (447.3 kgha-1) and eucalyptus + Bacillus sp. + mustard cake (451.7 kgha-1) in comparison to other treatment combinations.However, two-year study indicated that soft rot incidencewas significantly more and seed yield was significantly lessduring the 2004-05 crop season. Soil treatment withbleaching powder provided minimum control of disease(12.7 % reduction over control) and resulted in minimumseed yield (83.8 kg ha-1).
Among the treatments comprising of one componenti.e. dip treatment of stecklings in suspension of P. fluorescensfor 2 h and dip treatment in aqueous extracts of marigoldprovided soft rot control statistically at par with antibiotic(streptocycline) dip treatment. At the same time, increasedseed yield was recorded in P. fluorescens treatment incomparison to streptocycline dip treatment. The increasedseed yields recorded in treatments receiving P. fluorescens (B-10) may be due to the plant growth promoting substancesand the antibiotics produced by rhizosphere bacteria whichmight have checked the development of the pathogen andpromoted yields (Shabaev et al, 1998). Among the treatmentswith two components, marigold + P. fluorescens providedmaximum control of soft rot under disease stress conditions.Whereas, treatments comprising of three components, viz.,aqueous plant extracts + antagonistic rhizosphere bacteria+ organic amendments, aqueous leaf extracts of marigold +P. fluorescens + mustard cake provided maximum protectionof radish stecklings from P. c. subsp. carotovorum followedby eucalyptus + P. fluorescens + mustard cake. Least controlof soft rot was recorded in marigold + Bacillus sp + cottoncake. In general, higher disease incidence was recordedduring 2004-05 crop season which can be attributed to theprevalence of congenial environmental conditions(temperature and rainfall). Jalali and associates (2004) fromtheir study offered positive indications that application ofmarigold and Eucalyptus citriodora aqueous leaf extract couldbe effectively used in the management of soft rot of potatocaused by Pectobacterium carotovorum subsp. carotovorum. Theeffectives of marigold and P. fluorescens (B-10) observed inthe present study are in conformity with the earlier findings.Successful control of bacterial diseases of tomato wasobtained by spray of garlic suspension and soil applicationof peat oxyhumate (Komorova and Korunets, 1997). In thepresent investigation, effort made to integrate bioagents,organic amendments and plant extracts, for the managementbacterial soft rot of radish seed crop was found effective in
checking incidence and increasing seed yield substantiallyunder artificial disease stress conditions.
CONCLUSION
It can be concluded from the present studies that inregions where the disease is a major problem, organic soilamendment with mustard cake (250 kg ha-1) in combinationwith dip treatment of radish stecklings with marigold leafextract (10.0%) for 6 h + P. fluorescens (isolate B-10 @ 109 cfuml-1) for 2 h may provide effective soft rot reduction in radishseed crop. However, the effectiveness depends upon thepopulation of test pathogen in soil and weather variablesexisting during the crop growth period, which in turn mayinfluence the disease incidence.
REFERENCES
Anonymous. 2002. Studies on recently occurring bacterialdiseases of various crops in Haryana. Technical report, CCSHaryana Agricultural University, Hisar. pp. 4-6.
De, R. K., Chaudhary, R. G. and Naimuddin. 1996. Comparativeefficacy of bio-control agents and fungicides for controllingchickpea wilt caused by Fusarium oxysporum f.sp. ciceri. IndianJournal of Agricultural Science, 66: 370-373.
Jalali, I., Chhabra, M. L. and Pal, V. 2004. Botanicals for themanagement of soft rot of potato (Pectobacterium carotovorumsubsp. carotovorum). In : Proceedings on National Seminar onResearch and Developments in Production, Protection Quality,Processing and Marketing of Medicinal and Aromatic Plants. CCSHaryana Agricultural University, Hisar. pp. 100-101.
Komorova, M. S. and Korunets, I. V. 1997. Biological means forcontrol of bacterial diseases of tomatoes. Zashchita KarautinRastnii. No. 4, 27. Belarussian Research Institute of PlantProtection, Belarus.
Raju, M. R. B. and Raoof, M. A. 2003. Integrated approach for themanagement of castor wilt (Fusarium oxysporum f. sp. riciniNanda and Prasad). Indian Journal of Plant Protection 31: 64-67.
Raju, M. R. B., Pal, V. and Jalali, I. 2004. Evaluation of antibacterialactivity of some medicinal plants against Pectobacteriumcarotovorum subsp. carotovorum causing soft rot of radish. In:National Seminar on Research and Developments in Production,Protection, Quality, Processing and Marketing of Medicinal andAromatic Plants. Medicinal, Aromatic and Under utilized plantssection, CCS HAU, Hisar, Feb. 27-29, 2004. 100 p.
Raju, M. R. B., Pal, V. and Jalali, I. 2005. Effective antagonisticrhizosphere bacteria for the management of bacterial soft rotof radish seed crop. In: North Zone meet and symposium May 2-3, 2005 organized by ISMPP, Jammu, pp 64-65.
Shabaev, V. P., Safrina, D. S. and Murik, V. A. 1998. Effects ofrhizosphere bacterium Pf 20 and ectomycorrhizal fungi,Glomus mosseae on the yield and growth of the radish as afunction of mineral nutrition. Agrokhimiya 6: 34-41
Smale, B. C. and Keils, H. L. 1966. A biochemical study of theinter-varietal resistance of Pyrus communis to fire blight.Phytochemistry 5: 113-120.
©2009
Effect of two ectomycorrhiza inoculants on growthperformance and nutrient uptake of Himalayan Cypress(Cupressus torulosa) seedlings
M.M. Dar , M.A.Khan1 , M. Y. Zargar and T.H.Masoodi
Division of Environmental Science, S.K. University of Agricultural Sciences & Technology of Kashmir, Shalimar, Srinagar – 191 121, (J & K), India1 Correspondence: GPO. Box. 726, Srinagar- 1i90001, Kashmir, India[ E-mail: [email protected]]
ABSTRACT
Among the ectomycorrhizal inoculants, mixed inoculation of Pisolithus tinctorius + Laccaria laccata on Himalayancypress (Cupressus torulosa D.Don) seedlings resulted in maximum and significant increase in plant height (46.36 %),root length (43.33 %), collar diameter (44.51 %), shoot biomass (57.8 %), leaf biomass (69.12 %) and root biomass (64%) over uninoculated control, followed by their individual inoculations. The treatment combination of P. tinctorius +L. laccata and phosphorus dose of 70 mg plant-1 proved best and resulted in highest increase in plant height (87.50 %),collar diameter (82.35 %), shoot biomass (88.50 %) and root biomass (131.33 %) over control. Nutrient uptake by C.torulosa was influenced by ectomycorrizae and different levels of phosphorus and their combinations under nurseryconditions. The inoculation of P. tinctorius + L. laccata exhibited maximum increase in nitrogen (51 %) in phosphorus(70 %) and in potassium (52.63 %) contents of seedling over control, while the treatment combination of P. tinctorius+L. laccata and 70 mg phosphorus plant-1 resulted in highest increase in nitrogen (68.85%), phosphorus (160o%) andpotassium (70.96 %) contents of seedling over control. The findings indicate that the ectomycorrhizal inoculants meritadequate attention and wider application for the production /protection of forest seedlings in nurseries.
Key words: Growth performance, Nutrient uptake, Cupressus torulosa, Ectomycorrhizal inoculants.
Journal of Eco-friendly Agriculture 4(1): 69-72 : 2009
Himalayan cypress (Cupressus torulasa D.Don) is a largeevergreen tree belonging to family Cupraceae. The tree has alocal distribution in the western Himalayas from Chamba toNepal and occurs in patches of varying extent, either pureand / or in association with deodar, spruce, silver fir, bluepine or oak. The importance of ectomycorrhizal associationwith forest tree roots arises from the fact that these treesusually have low rooting densities as compared to theagricultural crops, thus limiting their ability to absorbimmobile soil nutrients (Read, 1993). Like other soils, forestsoils also face acute shortage of essential nutrient mainlydue to continuous erosion. Moreover, ectomycorrhizal fungi,in addition to their deep penetration in the soil, form a mantelor sheath on the root surface and penetrate between thecortical cells to form a complex root system called Hartig net(Harley and Smith, 1983). Ectomycorrhiza also appear toincrease the tolerance of trees to drought, high soiltemperature, soil toxins and very low soil acidity (Marx andCordell, 1989 ). Fertilization of forest soil is not easy as forestsoccupy remote, less accessible and less fertile lands. Thus,use of native microbial inoculants as natural nutrientmobilizer gains importance for better growth, developmentand survival of forest seedlings. Recent research work by
Dar et al (2008) established the beneficial impact ofecotomycorrhizal inoculants and nutrient uptake by Cedrusdeodora under nursery conditions. Himalayan cypress alsofaces severe problems in the successful establishment underexisting nursery conditions. Most of the seedlings die within1-3 years owing to low amount of soluble nutrients in theraw humus zone (Verma, 1991). In order to give impetus tothe raising of Himalayan cypress seedling in the nursery,this communication aims at exploitation of efficientectomycorrhizae for the better growth and development ofHimalayan cypress.
MATERIAL AND METHODS
The experiments were carried out in the Forest Nurserysituated at a distance of 60 km from Srinagar city in northwestdirection at 1524 m above sea level at the Regional ResearchStation and Faculty of Agriculture, SKUAST-K, Wadura,Sopore during 2006-2007. Cupressus seedlings (12- months-old) growing in polybags (9”x7”) of almost equal height (20±1 cm) and collar diameter (3.3 ±0.5 mm), were selected forthe present investigation. Three types of inocula designatedas ECM-1,ECM-2 and ECM-3 were used. The ECM-1 was thepure culture of P. tinctorius and L. laccata, respectively.. The
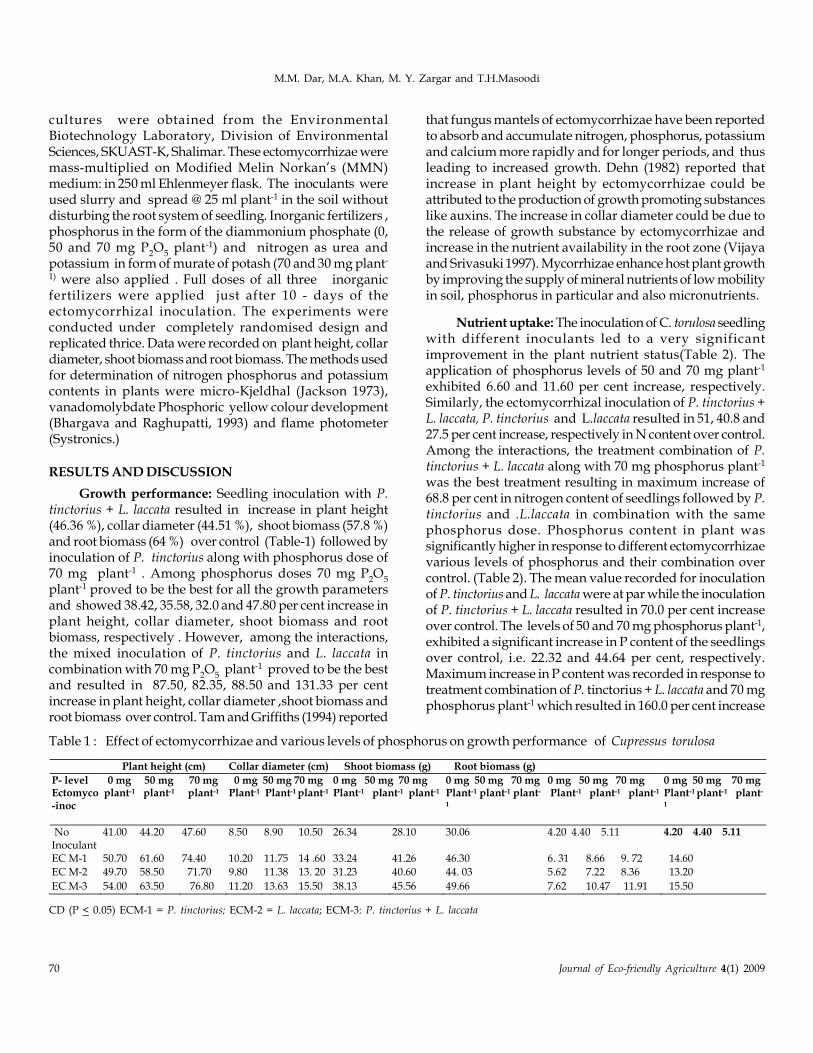
70 Journal of Eco-friendly Agriculture 4(1) 2009
M.M. Dar, M.A. Khan, M. Y. Zargar and T.H.Masoodi
cultures were obtained from the EnvironmentalBiotechnology Laboratory, Division of EnvironmentalSciences, SKUAST-K, Shalimar. These ectomycorrhizae weremass-multiplied on Modified Melin Norkan’s (MMN)medium: in 250 ml Ehlenmeyer flask. The inoculants wereused slurry and spread @ 25 ml plant-1 in the soil withoutdisturbing the root system of seedling. Inorganic fertilizers ,phosphorus in the form of the diammonium phosphate (0,50 and 70 mg P
2O
5 plant-1) and nitrogen as urea and
potassium in form of murate of potash (70 and 30 mg plant-
1) were also applied . Full doses of all three inorganicfertilizers were applied just after 10 - days of theectomycorrhizal inoculation. The experiments wereconducted under completely randomised design andreplicated thrice. Data were recorded on plant height, collardiameter, shoot biomass and root biomass. The methods usedfor determination of nitrogen phosphorus and potassiumcontents in plants were micro-Kjeldhal (Jackson 1973),vanadomolybdate Phosphoric yellow colour development(Bhargava and Raghupatti, 1993) and flame photometer(Systronics.)
RESULTS AND DISCUSSION
Growth performance: Seedling inoculation with P.tinctorius + L. laccata resulted in increase in plant height(46.36 %), collar diameter (44.51 %), shoot biomass (57.8 %)and root biomass (64 %) over control (Table-1) followed byinoculation of P. tinctorius along with phosphorus dose of70 mg plant-1 . Among phosphorus doses 70 mg P
2O
5
plant-1 proved to be the best for all the growth parametersand showed 38.42, 35.58, 32.0 and 47.80 per cent increase inplant height, collar diameter, shoot biomass and rootbiomass, respectively . However, among the interactions,the mixed inoculation of P. tinctorius and L. laccata incombination with 70 mg P
2O
5 plant-1 proved to be the best
and resulted in 87.50, 82.35, 88.50 and 131.33 per centincrease in plant height, collar diameter ,shoot biomass androot biomass over control. Tam and Griffiths (1994) reported
that fungus mantels of ectomycorrhizae have been reportedto absorb and accumulate nitrogen, phosphorus, potassiumand calcium more rapidly and for longer periods, and thusleading to increased growth. Dehn (1982) reported thatincrease in plant height by ectomycorrhizae could beattributed to the production of growth promoting substanceslike auxins. The increase in collar diameter could be due tothe release of growth substance by ectomycorrhizae andincrease in the nutrient availability in the root zone (Vijayaand Srivasuki 1997). Mycorrhizae enhance host plant growthby improving the supply of mineral nutrients of low mobilityin soil, phosphorus in particular and also micronutrients.
Nutrient uptake: The inoculation of C. torulosa seedlingwith different inoculants led to a very significantimprovement in the plant nutrient status(Table 2). Theapplication of phosphorus levels of 50 and 70 mg plant-1
exhibited 6.60 and 11.60 per cent increase, respectively.Similarly, the ectomycorrhizal inoculation of P. tinctorius +L. laccata, P. tinctorius and L.laccata resulted in 51, 40.8 and27.5 per cent increase, respectively in N content over control.Among the interactions, the treatment combination of P.tinctorius + L. laccata along with 70 mg phosphorus plant-1
was the best treatment resulting in maximum increase of68.8 per cent in nitrogen content of seedlings followed by P.tinctorius and .L.laccata in combination with the samephosphorus dose. Phosphorus content in plant wassignificantly higher in response to different ectomycorrhizaevarious levels of phosphorus and their combination overcontrol. (Table 2). The mean value recorded for inoculationof P. tinctorius and L. laccata were at par while the inoculationof P. tinctorius + L. laccata resulted in 70.0 per cent increaseover control. The levels of 50 and 70 mg phosphorus plant-1,exhibited a significant increase in P content of the seedlingsover control, i.e. 22.32 and 44.64 per cent, respectively.Maximum increase in P content was recorded in response totreatment combination of P. tinctorius + L. laccata and 70 mgphosphorus plant-1 which resulted in 160.0 per cent increase
Table 1 : Effect of ectomycorrhizae and various levels of phosphorus on growth performance of Cupressus torulosa
Plant height (cm) Collar diameter (cm) Shoot biomass (g) Root biomass (g)
P- level Ectomyco-inoc
0 mg plant-1
50 mg plant-1
70 mg plant-1
0 mg 50 mg 70 mg Plant-1 Plant-1 plant-1
0 mg 50 mg 70 mg Plant-1 plant-1 plant-1
0 mg 50 mg 70 mg Plant-1 plant-1 plant-
1
0 mg 50 mg 70 mg Plant-1 plant-1 plant-1
0 mg 50 mg 70 mg Plant-1 plant-1 plant-
1
No Inoculant
41.00 44.20 47.60 8.50 8.90 10.50 26.34 28.10 30.06 4.20 4.40 5.11 4.20 4.40 5.11
EC M-1 50.70 61.60 74.40 10.20 11.75 14 .60 33.24 41.26 46.30 6. 31 8.66 9. 72 14.60
EC M-2 49.70 58.50 71.70 9.80 11.38 13. 20 31.23 40.60 44. 03 5.62 7.22 8.36 13.20
EC M-3 54.00 63.50 76.80 11.20 13.63 15.50 38.13 45.56 49.66 7.62 10.47 11.91 15.50
CD (P < 0.05) ECM-1 = P. tinctorius; ECM-2 = L. laccata; ECM-3: P. tinctorius + L. laccata
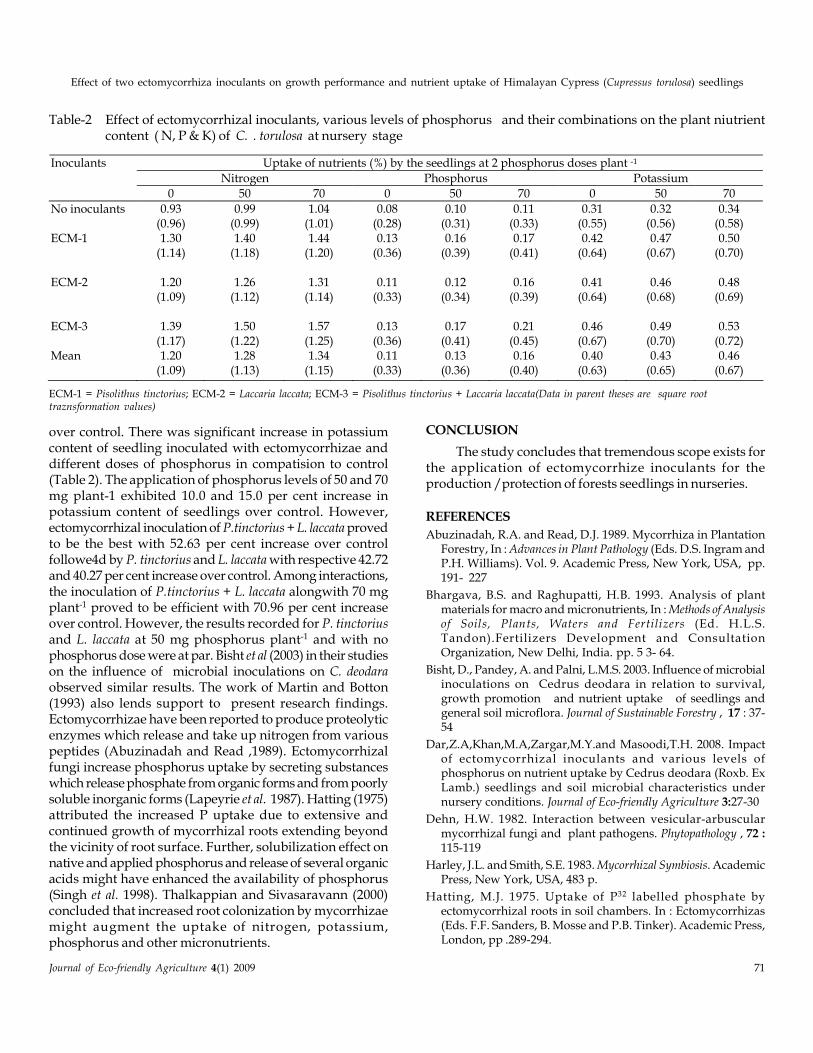
Effect of two ectomycorrhiza inoculants on growth performance and nutrient uptake of Himalayan Cypress (Cupressus torulosa) seedlings
Journal of Eco-friendly Agriculture 4(1) 2009 71
over control. There was significant increase in potassiumcontent of seedling inoculated with ectomycorrhizae anddifferent doses of phosphorus in compatision to control(Table 2). The application of phosphorus levels of 50 and 70mg plant-1 exhibited 10.0 and 15.0 per cent increase inpotassium content of seedlings over control. However,ectomycorrhizal inoculation of P.tinctorius + L. laccata provedto be the best with 52.63 per cent increase over controlfollowe4d by P. tinctorius and L. laccata with respective 42.72and 40.27 per cent increase over control. Among interactions,the inoculation of P.tinctorius + L. laccata alongwith 70 mgplant-1 proved to be efficient with 70.96 per cent increaseover control. However, the results recorded for P. tinctoriusand L. laccata at 50 mg phosphorus plant-1 and with nophosphorus dose were at par. Bisht et al (2003) in their studieson the influence of microbial inoculations on C. deodaraobserved similar results. The work of Martin and Botton(1993) also lends support to present research findings.Ectomycorrhizae have been reported to produce proteolyticenzymes which release and take up nitrogen from variouspeptides (Abuzinadah and Read ,1989). Ectomycorrhizalfungi increase phosphorus uptake by secreting substanceswhich release phosphate from organic forms and from poorlysoluble inorganic forms (Lapeyrie et al. 1987). Hatting (1975)attributed the increased P uptake due to extensive andcontinued growth of mycorrhizal roots extending beyondthe vicinity of root surface. Further, solubilization effect onnative and applied phosphorus and release of several organicacids might have enhanced the availability of phosphorus(Singh et al. 1998). Thalkappian and Sivasaravann (2000)concluded that increased root colonization by mycorrhizaemight augment the uptake of nitrogen, potassium,phosphorus and other micronutrients.
CONCLUSION
The study concludes that tremendous scope exists forthe application of ectomycorrhize inoculants for theproduction /protection of forests seedlings in nurseries.
REFERENCES
Abuzinadah, R.A. and Read, D.J. 1989. Mycorrhiza in PlantationForestry, In : Advances in Plant Pathology (Eds. D.S. Ingram andP.H. Williams). Vol. 9. Academic Press, New York, USA, pp.191- 227
Bhargava, B.S. and Raghupatti, H.B. 1993. Analysis of plantmaterials for macro and micronutrients, In : Methods of Analysisof Soils, Plants, Waters and Fertilizers (Ed. H.L.S.Tandon).Fertilizers Development and ConsultationOrganization, New Delhi, India. pp. 5 3- 64.
Bisht, D., Pandey, A. and Palni, L.M.S. 2003. Influence of microbialinoculations on Cedrus deodara in relation to survival,growth promotion and nutrient uptake of seedlings andgeneral soil microflora. Journal of Sustainable Forestry , 17 : 37-54
Dar,Z.A,Khan,M.A,Zargar,M.Y.and Masoodi,T.H. 2008. Impactof ectomycorrhizal inoculants and various levels ofphosphorus on nutrient uptake by Cedrus deodara (Roxb. ExLamb.) seedlings and soil microbial characteristics undernursery conditions. Journal of Eco-friendly Agriculture 3:27-30
Dehn, H.W. 1982. Interaction between vesicular-arbuscularmycorrhizal fungi and plant pathogens. Phytopathology , 72 :115-119
Harley, J.L. and Smith, S.E. 1983. Mycorrhizal Symbiosis. AcademicPress, New York, USA, 483 p.
Hatting, M.J. 1975. Uptake of P32 labelled phosphate byectomycorrhizal roots in soil chambers. In : Ectomycorrhizas(Eds. F.F. Sanders, B. Mosse and P.B. Tinker). Academic Press,London, pp .289-294.
Table-2 Effect of ectomycorrhizal inoculants, various levels of phosphorus and their combinations on the plant niutrientcontent ( N, P & K) of C. . torulosa at nursery stage
ECM-1 = Pisolithus tinctorius; ECM-2 = Laccaria laccata; ECM-3 = Pisolithus tinctorius + Laccaria laccata(Data in parent theses are square roottraznsformation values)
Uptake of nutrients (%) by the seedlings at 2 phosphorus doses plant -1
Nitrogen Phosphorus Potassium
Inoculants
0 50 70 0 50 70 0 50 70
No inoculants ECM-1 ECM-2 ECM-3 Mean
0.93 (0.96) 1.30
(1.14)
1.20 (1.09)
1.39
(1.17) 1.20
(1.09)
0.99 (0.99) 1.40
(1.18)
1.26 (1.12)
1.50
(1.22) 1.28
(1.13)
1.04 (1.01) 1.44
(1.20)
1.31 (1.14)
1.57
(1.25) 1.34
(1.15)
0.08 (0.28) 0.13
(0.36)
0.11 (0.33)
0.13
(0.36) 0.11
(0.33)
0.10 (0.31) 0.16
(0.39)
0.12 (0.34)
0.17
(0.41) 0.13
(0.36)
0.11 (0.33) 0.17
(0.41)
0.16 (0.39)
0.21
(0.45) 0.16
(0.40)
0.31 (0.55) 0.42
(0.64)
0.41 (0.64)
0.46
(0.67) 0.40
(0.63)
0.32 (0.56) 0.47
(0.67)
0.46 (0.68)
0.49
(0.70) 0.43
(0.65)
0.34 (0.58) 0.50
(0.70)
0.48 (0.69)
0.53
(0.72) 0.46
(0.67)
72 Journal of Eco-friendly Agriculture 4(1) 2009
M.M. Dar, M.A. Khan, M. Y. Zargar and T.H.Masoodi
Jackson, M.L. 1973. Soil Chemical Analysis. Prentice Hall of IndiaPrivate Limited, New Delhi.
Lapeyrie, F., Chilvers, G.A. and Bhem, C.A. 1987. Mycorrhiza inPlantation Forestry. In : Advances in Plant Pathology (Eds. D.S.Ingram and P.H. Williams) vol. 9. Academic Press, New York,USA, pp .191-227.
Martin, F. and Botton, B. 1993. Nitrogen metabolism ofectomycorrhizal fungi and ectomycorrhizae, In : Advances inPlant Pathology (Eds. D.S Ingram and P.H. Williams) vol. 9.Academic Press, New York, USA. pp. 83-102.
Marx, D.H. and Cordell, C.E. 1989. The use of specificectomycorrhizas to improve artificial forestation practices.In : Biotechnology of Fungi for Improving Plant Growth (Eds.J.M. Whipps and R.D. Lumsden). Cambridge University Press,Port Chester Melbourne Sydney, New York. pp .1-25.
Read, D.J. 1993. Mycorrhiza in plant communities, pp 1-31. In :Advances in Plant Pathology (Eds. D.S. Ingram and P.H. Williams)Vol. 9. Academic Press, New York, USA.
Singh, A.K., Ram, H. and Maurya, B.R. 1998. Effect of nitrogenand phosphorus on microbial population. Indian Journal ofAgricultural Chemistry, 31 : 90-94.
Tam, P.C.F. and Griffiths, D.A. 1994. Mycorrhizal association inHong Kong Fagaceae.VI. Growth and nutrient uptake byCastanopsis fiss seedlings inoulated with ectmycorrhizalfungi. Mycorrhiza, 4: 169-172.
Thalkappian, P. and Sivasaravann, A. 2000. Effect of phosphoruslevels on the mycorrhizal colonization growth, yield andnutrient uptake of cassava (Manihot esculenta Crantz) inalluvial soils of coastal Tamil Nadu. Mycorrhiza News, 11 : 15-17.
Verma, A. 1991. History of mycorrhizal research in India currentstatus. Indian Journal of Microbiology, 31 : 323-332.
Vijaya, T. and Srivasuki, K.P. 1997. Response of forest legumesto Glomus fasciculatum. Journal of Indian Botanical Society, 76 :157-160.
©2009
In vitro performance of compost water extracts on Grapevineleaf blight pathogen
K. Praveena Deepthi1, T. Vithal Reddy2 and T. Narsi Reddy3
1,2Dept. of Plant Pathology, College of Agriculture, AANGRA University, Rajendranagar, Hyderabad-30, Andhra Pradesh, India.3Grape Research Station, Rajendranagar, Hyderabad-30, Andhra Pradesh, India.e-mail : (dispiral @ yahoo.com)
ABSTRACT
Leaf blight disease in grapevine caused by Alternaria vitis (Cav.) Sacc. is becoming serious in Andhra Pradesh, India.Hence studies were carried out to develop a management strategy with cold sterilized compost water extracts ofdifferent materials like vermicompost, sugarcane press mud, FYM + fish meal + paddy straw at 70:15:15 (weight /weight) and the extracts of organic materials like neem seed kernels (NSKE), Grape berry fermented juice (GBJ)against the mycelial growth and spore germination of A. vitis. Among all the treatments, a 10-day fermented GBJ at25.0 and 50.0 per cent; 20-and 30-day fermented GBJ at 50.0 per cent showed 100.0 per cent inhibition of mycelialgrowth followed by a 20-day fermented NSKE at 10.0 per cent (50.7%), 10 day fermented GBJ at 50.0 per cent showedhighest inhibition of spore germination (93.64%). Compost water extracts were found effective in inhibiting the sporegermination.
Key Words: Grapevine, Alternaria, compost water extracts, neem seed kernel extract, grape berry fermented juice.
Journal of Eco-friendly Agriculture 4(1): 73-76 : 2009
INTRODUCTION
A foliar disease in grapevine caused by Alternaria vitis(Cav.) Sacc, a minor problem till recent times, has now becomea serious problem in Andhra Pradesh, India. The diseasewas first reported (Vidhyasekaran et al., 1961) on Khandharivariety of grape in TamilNadu and later in Haryana (Suhaget al., 1982) on Thompson seedless, Beauti Seedless, Perlette,Delight, Kishmish Charni and Kishmish Beli varieties.
Compost water extract is made from compostsuspended in a barrel of water for 7-14 days (Steve Diver,2002). When the compost decomposition is invigoratedthrough adjuvants like biocontrol agents or molasses etc.then the extracts are called as compost tea. The key factorsinfluencing the effectiveness of the compost were the age ofthe compost and nature of its source ingredients (Brinton etal., 1996). Compost teas are very beneficial in plant diseasemanagement and they can be included in the integrateddisease management strategies of field and horticulturalcrops (Block, 1997; Orlikowski and Wolski, 2000; Quarels,2001). Even the addition of this organic extracts to growingmedia encourage the growth of benign organisms, whichsuppress the plant diseases (Dixon et al., 1998). Compostteas show multiple modes of activity in suppressing plantdiseases like, induced resistance, antibiosis and competition.Regardless of the mode of action, prophylactic applicationbefore pathogen infection is necessary for optimal controlthrough all known mode of actions (Scheuerell and Mahaffee,2002). The water extracts of cattle and horse manure ad grape
marc reduced mycelial growth and inhibited conidialgermination of Botrytis cineria and reduced the incidence ondetached grape leaves (Ketterer, 1992). Similarly thefermented extracts of composted microbiologically activesubstrates significantly reduced the infestation of grapeleaves by Plasmapara viticola under growth chamberconditions (Sackenheim et al., 1994).
In India no work has been done against grapevinediseases with compost extracts made from biologically activeorganic materials. In view of importance of Alternaria leafblight disease the present investigation was taken up to testthe efficacy of compost water extracts and other organicextracts like grape berry fermented juice and neem seed kernelextract against the pathogen.
MATERIALS AND METHODS
Isolation of pathogen
The pathogen, Alternaria vitis was isolated from theleaves of Thompson seedless variety, showing typicalsymptoms, collected from Grape Research Stations,Rajendranagar. Pure cultures were made by single sporeisolations and maintained on PDA medium (Ho & Ko, 1997).Water extracts of neem seed kernels (NSKE), vermicompost(VCE), sugarcane press mud (SPME), FYM + paddy straw at75:25 (FYME), FYM + fish meal + paddy straw at 70:15:15(FME), grape berry fermented juice (GBJ), were tested atdifferent concentrations against A. vitis.
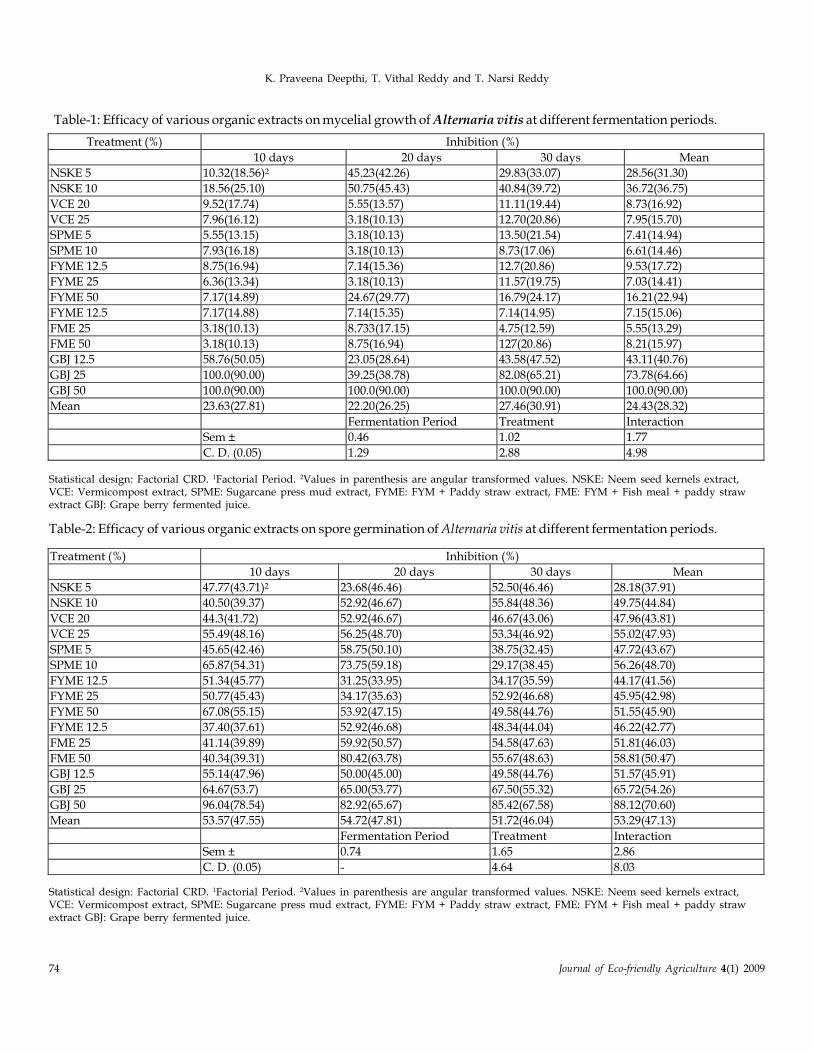
74 Journal of Eco-friendly Agriculture 4(1) 2009
K. Praveena Deepthi, T. Vithal Reddy and T. Narsi Reddy
Treatment (%) Inhibition (%)
10 days 20 days 30 days Mean
NSKE 5 10.32(18.56)2 45.23(42.26) 29.83(33.07) 28.56(31.30)
NSKE 10 18.56(25.10) 50.75(45.43) 40.84(39.72) 36.72(36.75)
VCE 20 9.52(17.74) 5.55(13.57) 11.11(19.44) 8.73(16.92)
VCE 25 7.96(16.12) 3.18(10.13) 12.70(20.86) 7.95(15.70)
SPME 5 5.55(13.15) 3.18(10.13) 13.50(21.54) 7.41(14.94)
SPME 10 7.93(16.18) 3.18(10.13) 8.73(17.06) 6.61(14.46)
FYME 12.5 8.75(16.94) 7.14(15.36) 12.7(20.86) 9.53(17.72)
FYME 25 6.36(13.34) 3.18(10.13) 11.57(19.75) 7.03(14.41)
FYME 50 7.17(14.89) 24.67(29.77) 16.79(24.17) 16.21(22.94)
FYME 12.5 7.17(14.88) 7.14(15.35) 7.14(14.95) 7.15(15.06)
FME 25 3.18(10.13) 8.733(17.15) 4.75(12.59) 5.55(13.29)
FME 50 3.18(10.13) 8.75(16.94) 127(20.86) 8.21(15.97)
GBJ 12.5 58.76(50.05) 23.05(28.64) 43.58(47.52) 43.11(40.76)
GBJ 25 100.0(90.00) 39.25(38.78) 82.08(65.21) 73.78(64.66)
GBJ 50 100.0(90.00) 100.0(90.00) 100.0(90.00) 100.0(90.00)
Mean 23.63(27.81) 22.20(26.25) 27.46(30.91) 24.43(28.32)
Fermentation Period Treatment Interaction
Sem ± 0.46 1.02 1.77
C. D. (0.05) 1.29 2.88 4.98
Table-1: Efficacy of various organic extracts on mycelial growth of Alternaria vitis at different fermentation periods.
Statistical design: Factorial CRD. 1Factorial Period. 2Values in parenthesis are angular transformed values. NSKE: Neem seed kernels extract,VCE: Vermicompost extract, SPME: Sugarcane press mud extract, FYME: FYM + Paddy straw extract, FME: FYM + Fish meal + paddy strawextract GBJ: Grape berry fermented juice.
Table-2: Efficacy of various organic extracts on spore germination of Alternaria vitis at different fermentation periods.
Treatment (%) Inhibition (%)
10 days 20 days 30 days Mean
NSKE 5 47.77(43.71)2 23.68(46.46) 52.50(46.46) 28.18(37.91)
NSKE 10 40.50(39.37) 52.92(46.67) 55.84(48.36) 49.75(44.84)
VCE 20 44.3(41.72) 52.92(46.67) 46.67(43.06) 47.96(43.81)
VCE 25 55.49(48.16) 56.25(48.70) 53.34(46.92) 55.02(47.93)
SPME 5 45.65(42.46) 58.75(50.10) 38.75(32.45) 47.72(43.67)
SPME 10 65.87(54.31) 73.75(59.18) 29.17(38.45) 56.26(48.70)
FYME 12.5 51.34(45.77) 31.25(33.95) 34.17(35.59) 44.17(41.56)
FYME 25 50.77(45.43) 34.17(35.63) 52.92(46.68) 45.95(42.98)
FYME 50 67.08(55.15) 53.92(47.15) 49.58(44.76) 51.55(45.90)
FYME 12.5 37.40(37.61) 52.92(46.68) 48.34(44.04) 46.22(42.77)
FME 25 41.14(39.89) 59.92(50.57) 54.58(47.63) 51.81(46.03)
FME 50 40.34(39.31) 80.42(63.78) 55.67(48.63) 58.81(50.47)
GBJ 12.5 55.14(47.96) 50.00(45.00) 49.58(44.76) 51.57(45.91)
GBJ 25 64.67(53.7) 65.00(53.77) 67.50(55.32) 65.72(54.26)
GBJ 50 96.04(78.54) 82.92(65.67) 85.42(67.58) 88.12(70.60)
Mean 53.57(47.55) 54.72(47.81) 51.72(46.04) 53.29(47.13)
Fermentation Period Treatment Interaction
Sem ± 0.74 1.65 2.86
C. D. (0.05) - 4.64 8.03
Statistical design: Factorial CRD. 1Factorial Period. 2Values in parenthesis are angular transformed values. NSKE: Neem seed kernels extract,VCE: Vermicompost extract, SPME: Sugarcane press mud extract, FYME: FYM + Paddy straw extract, FME: FYM + Fish meal + paddy strawextract GBJ: Grape berry fermented juice.
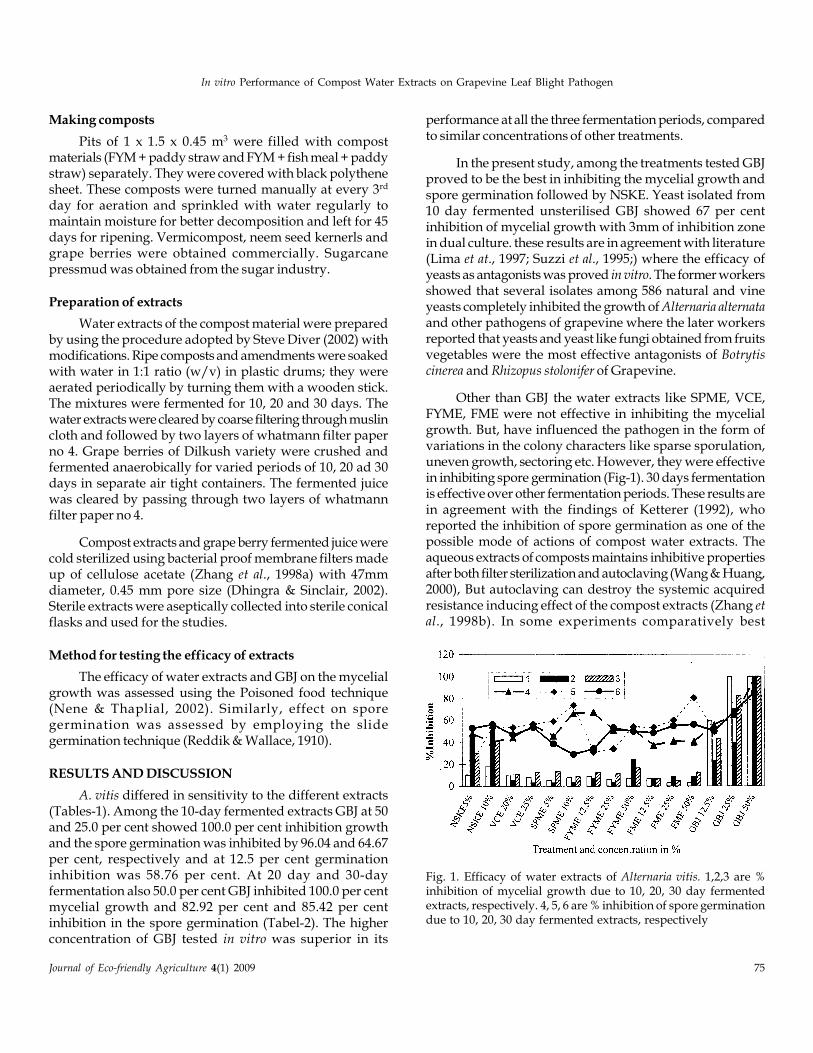
Journal of Eco-friendly Agriculture 4(1) 2009 75
In vitro Performance of Compost Water Extracts on Grapevine Leaf Blight Pathogen
Making composts
Pits of 1 x 1.5 x 0.45 m3 were filled with compostmaterials (FYM + paddy straw and FYM + fish meal + paddystraw) separately. They were covered with black polythenesheet. These composts were turned manually at every 3rd
day for aeration and sprinkled with water regularly tomaintain moisture for better decomposition and left for 45days for ripening. Vermicompost, neem seed kernerls andgrape berries were obtained commercially. Sugarcanepressmud was obtained from the sugar industry.
Preparation of extracts
Water extracts of the compost material were preparedby using the procedure adopted by Steve Diver (2002) withmodifications. Ripe composts and amendments were soakedwith water in 1:1 ratio (w/v) in plastic drums; they wereaerated periodically by turning them with a wooden stick.The mixtures were fermented for 10, 20 and 30 days. Thewater extracts were cleared by coarse filtering through muslincloth and followed by two layers of whatmann filter paperno 4. Grape berries of Dilkush variety were crushed andfermented anaerobically for varied periods of 10, 20 ad 30days in separate air tight containers. The fermented juicewas cleared by passing through two layers of whatmannfilter paper no 4.
Compost extracts and grape berry fermented juice werecold sterilized using bacterial proof membrane filters madeup of cellulose acetate (Zhang et al., 1998a) with 47mmdiameter, 0.45 mm pore size (Dhingra & Sinclair, 2002).Sterile extracts were aseptically collected into sterile conicalflasks and used for the studies.
Method for testing the efficacy of extracts
The efficacy of water extracts and GBJ on the mycelialgrowth was assessed using the Poisoned food technique(Nene & Thaplial, 2002). Similarly, effect on sporegermination was assessed by employing the slidegermination technique (Reddik & Wallace, 1910).
RESULTS AND DISCUSSION
A. vitis differed in sensitivity to the different extracts(Tables-1). Among the 10-day fermented extracts GBJ at 50and 25.0 per cent showed 100.0 per cent inhibition growthand the spore germination was inhibited by 96.04 and 64.67per cent, respectively and at 12.5 per cent germinationinhibition was 58.76 per cent. At 20 day and 30-dayfermentation also 50.0 per cent GBJ inhibited 100.0 per centmycelial growth and 82.92 per cent and 85.42 per centinhibition in the spore germination (Tabel-2). The higherconcentration of GBJ tested in vitro was superior in its
performance at all the three fermentation periods, comparedto similar concentrations of other treatments.
In the present study, among the treatments tested GBJproved to be the best in inhibiting the mycelial growth andspore germination followed by NSKE. Yeast isolated from10 day fermented unsterilised GBJ showed 67 per centinhibition of mycelial growth with 3mm of inhibition zonein dual culture. these results are in agreement with literature(Lima et at., 1997; Suzzi et al., 1995;) where the efficacy ofyeasts as antagonists was proved in vitro. The former workersshowed that several isolates among 586 natural and vineyeasts completely inhibited the growth of Alternaria alternataand other pathogens of grapevine where the later workersreported that yeasts and yeast like fungi obtained from fruitsvegetables were the most effective antagonists of Botrytiscinerea and Rhizopus stolonifer of Grapevine.
Other than GBJ the water extracts like SPME, VCE,FYME, FME were not effective in inhibiting the mycelialgrowth. But, have influenced the pathogen in the form ofvariations in the colony characters like sparse sporulation,uneven growth, sectoring etc. However, they were effectivein inhibiting spore germination (Fig-1). 30 days fermentationis effective over other fermentation periods. These results arein agreement with the findings of Ketterer (1992), whoreported the inhibition of spore germination as one of thepossible mode of actions of compost water extracts. Theaqueous extracts of composts maintains inhibitive propertiesafter both filter sterilization and autoclaving (Wang & Huang,2000), But autoclaving can destroy the systemic acquiredresistance inducing effect of the compost extracts (Zhang etal., 1998b). In some experiments comparatively best
Fig. 1. Efficacy of water extracts of Alternaria vitis. 1,2,3 are %inhibition of mycelial growth due to 10, 20, 30 day fermentedextracts, respectively. 4, 5, 6 are % inhibition of spore germinationdue to 10, 20, 30 day fermented extracts, respectively
76 Journal of Eco-friendly Agriculture 4(1) 2009
K. Praveena Deepthi, T. Vithal Reddy and T. Narsi Reddy
performances were obtained with filter sterilized extracts(Labrie et al., 2001; Wang & Huang, 2000; Hardy &Sivasithamparam 1991; Nakasone et al., 1999; Cronin et al.,1996), on the other hand the inhibitory nature of compostextracts was lost upon both filter sterilization andautoclaving (Mc Quilken et al., 1994). This indicates that theefficacy of water extracts depends not only on the keyingredients, age of compost (Brinton et al., 1996), but also onthe method of sterilization. All these results indicate that theefficacy of compost water extracts is a result of complexinteractions of various factors like source ingredients, age ofcomposts, fermentation periods, method of sterilization, typeof pathogen upon which it has to act.
CONCLUSION
From the present study it is concluded that GBJ andNSKE were best in inhibiting the A. vitis in vitro. However,compost water extracts have inhibitory effects on the sporegermination of the pathogen. Effect of the water extracts inthe disease suppression and physiology of host, theirmechanism of protection offered need to be studied.
REFERENCES
Block, D. 1997. disease suppression on the links. Bio cycle, 38: 62-65.
Brinton, W.F., Trankner, A. and Droffner, M.1996. Investigationsinto liquid compost extracts. Biocycle, 37: 68-70.
Cronin. M. J., Yohalem, D.S., Harris, R.F. and Ahdrews, J. H.1996. Putative mechnisms and dynamics of inhibition of theapple scab pathogen Venturia inaequalis by compost extracts.Soil Biology and Bio chemistry, 28: 121-1249.
Dhingra, O. D. and Sinclair, J. B. 2002. Sterilization of apparatusand culture media. Basic Plant pathology methods. LowisPublishers – London. pp 1-9.
Dixon, G. R., Walsh, U.F. ad Szmidt, R. A. K. 1998. Suppression ofplant pathogens by organic extracts a review. Proceedings of theInternational symposium on composting use of compostedmaterials for horticulture. UK. Acta horticulturae, 469: 383-390.
Hardy, G. E. and Sivasithamparam, K. 1991. Effect of sterile andnon sterile leachates extracted form composted cucalyptusbark and fine bark container media on Phytophthora spp. SoilBiology and Biochemistry, 23: 25-30.
Ho, W.C. and Ko, W. H. 1997. A simple method for obtainingsingle spore isolation of fungi. Botanical bulletin of Academia –Sionica, 38: 41-44.
Ketterer, N., Fisher, B., Weltzien, H. C., Verhoeff, K., Maratharkis,N. E. and Williamson, B. 1992. Biological control of Botrytis cinereaon grapevine by compost extracts and their microorganisms in pureculture. Proceedings of the 10th International Botrytissymposium. Greece. pp 179-186.
Labrie, C., Leclerc, P., Cote, N., Roy, s., Brzeznski, R., Hogue, R.and Beaulien, C. 2001. Effect of chitin waste based compostsproduced by two phase composting on two oomycete plantpathogens. Plant and Soil, 235: 27-34.
Lima, G., Ippolito, a., Nigro, F. and Salerno, M. 1997. Effectivenessof aureobasidium pullans and Candida oleophila against postharvest straw berry rots. Post harvest biology and technology 10:169-178.
Mc Quilken, M. P., Whipp, J. M. and lynch, J. M. 1994. Effect ofwater extracts of composted manure straw mixture on theplant pathogen Botrytis cinerea. World Journal of Microbiologyand Biotechnology, 10: 20-26.
Nakasone, A. K., Bettiol W., Souza, R. M., and De souzza, R. M.1999. The effect of water extracts of organic matter on plantpathogens. Summa phyto pathologica, 25: 330-335.
Nene, Y. L. and Thaplial, P. N. 2002 Fungicides in plant diseasecontrol. Oxford and IBB publishing co pvt ltd. New Delhi.
Orlikowski, L. and Wolski, T. 2000. The use of composts andtheir extracts in the biological protection of plants againstdisease. Ochrona Roslin, 44: 34-35.
Quarels, W. 2001. compost tea for organic farming and gardening.The IPM Practioner, 23: 1-8.
Reddik, D. and Wallace, E. 1910. On a laboratory method ofdetermining the fungicidal value of a spray mixture orsolution. Science, 31: 798.
Sackenheim, R., Wetlzien, H. C. and Kast, W. K. 1994. Effect ofmicroflora composition in the phyllosphere on biologicalregulation of grape vine fungal diseases. Vitis, 33: 235-240.
Scheuerell, S. and Mahaffee, W. F. 2002. compost tea Principlesand prospects for plant disease control. Compost Science andUtilisation, 10: 313-338.
Steve Diver. 2002. Notes. on compost teas. http://www.attra.org/attra-pub/PDF/compost-tea-notes.pdf.
Suhag, L.S. Kaushik, J.C., and Duhan, J.C. 1982. Etiology andepidemiology of fungal foliar Diseases on Grapevine. IndianJournal of Mycology and Plant Pathology, 12: 191-197.
Suzzi, G., Romano, P., Ponti, I. and Montaschi, M. 1995. Naturalwine yeasts as biocontrol agents. Journal of Applied bacteriology,78: 304-308.
Vidhyasekaran, D, Lalitha Kumari, and Govinda Swamy, C.V.1969. First record of Alternaria blight of grapevine. IndianPhytopathology Bulletin, 22: 500-501.
Wang, P. C. and Huang, J. W. 2000. Characteristics for inhibitionof cucumber damping off by spent forests mushroom compost.Plant Pathology Bulletin, 9: 137-144.
Zhang, W., Dick, W. A., Davis, K. R., Tu, J. C. and Hoitink, H. A.J. 1998a. Systemic acquired resistance induced by compostwater extracts in Arabidopsis. Molecular approaches in Biologicalcontrol, 21: 129-132.
Zhang, W., Han, D. Y., Dick, W. A., Davis, K. R. and Hoitink, H.A. J. 1998b. Compost and compost water extracts inducedsystemic acquired resistance in cucumber ad Arobiodopsis.Phytopathology, 88: 450-455.
©2009
Evaluation of eco-friendly antagonists isolated from leaf basedliquid biodynamic pesticides against guava wilt diseasecaused by Fusarium sp.
V. K. Gupta, A. K. Misra, B. K. Pandey, R. A. Ram, S. P. Misra1 and U. K. Chauhan2
Central Institute for Subtropical Horticulture, Rehmankhera, PO. Kakori, Lucknow-227 107 (U.P.)1 Rewa Agriculture College, Rewa-486 003 (M.P.), 2Communicating author : A.P.S. University, Rewa-486 003 (M.P.)e-mail: [email protected], [email protected]
ABSTRACT
Frequent occurring antagonists, isolated from five leaves based liquid biodynamic pesticide perpetrations (LLBP) viz.Azadirachta indica, Calotropis gigantea, Pongamia pinnata, Lantana camara and Ricinuns communis were evaluated in vitrofor their antifungal activity against five isolates each of F. oxysporum f. sp. psidii and F. solani, collected from differentlocations showing variations in their cultural characters. Although, all the antagonists inhibited the growth of thepathogens significantly, the antagonist isolated from R. communis L. proved best (37.24-45.04 % inhibition) followedby C. gigantea (35.76-43.70% inhibition) against selected isolates of F. solani. In case F. oxysporum f. sp. psidii, bacterialisolate isolated from R. communis (LLBP 2) showed greater inhibition capacity (33.11-40.27% inhibition) against thefive selected isolates of F. oxysporum f. sp. psidii.
Key words: Leaves based liquid biodynamic pesticide, guava wilt, antifungal activity, Fusarium oxysporum f. sp.
Journal of Eco-friendly Agriculture 4(1): 77-79 : 2009
psidii, Fusarium solani.
INTRODUCTION
Guava (Psidium guajava L.), an important fruit crop, iswidely grown under subtropical and tropical climate. Wiltdisease, one of the major threats to guava cultivation, iscaused by several pathogens, but the important ones areFusarium oxysporum f. sp. psidii and F. solani (Prasad et al.,1952; Chattopadhyaya and Bhattachariya, 1968; Edwardand Srivastava, 1957; Edward, 1961; Pandey and Dwivedi,1985). Its management through chemicals being ineffectiveand moreover not possible due to huge soil mass (Misra,2006). Therefore, investigations on safer and effectivemanagemnt technique was needed. Gupta et al, 2007although reported some botanicals effective against guavawilt, but there is need to identify the effective antagonists,which can multiply itself in the huge soil mass and checkthe disease. Earlier management of mango bacterial cankerdisease (MBCD) through antagonist from leaves based liquidbiodynamic pesticide preparation was reported by Kishunet al., (2006). There is good prospect for development ofbiodynamic-based organic bio-fungicide for management offungal diseases of white molds of field crops (Fravel, 1999).Diver (1999) also suggested biodynamic agriculture for thecontrol of diseases of field crops. However, no such workhas been taken up in case of guava wilt pathogens. Therefore,the present study was undertaken to evaluate antagonistsfrom five leaves based liquid biodynamic pesticide
preparation for its antifungal activity against wilt pathogenisolates (F. oxysporum f. sp. psidii and F. solani) of guava,isolated from different agroclimatic zones of India.
MATERIALS AND METHODS
Most frequent antagonists, one from each, isolated fromfive leaves based liquid biodynamic pesticide (LLBP) fromAzadirachta indica (LLBP 1), Calotropis gigantea (LLBP 2),Pongamia pinnata (LLBP 3), Lantana camara (LLBP 4) andRicinuns communis (LLBP 5) were selected for the antifungalactivities (Table 1). Liquid preparations had the compositionof 25 kg leaf (A. indica, C. gigantea, P. pinnata, L. camara and R.communis separately), 5 liters of cow urine, 5 kg cow dung,one biodynamic set (BD 502-507) and 150 liters of water.These were kept in plastic drum for 10 days for build up ofantagonist population. Samples derived from these liquidpreparations were subjected to low speed centrifugation at3000 rpm for 5 min and supernatant decanted. This wasrandomly designated as 100.0 per cent concentration. Fromthis 100µl of the clear supernatant were spread in four PDApetri plates (25µl each) for the isolation of antagonist. Onemicrobial colony, which showed the maximum frequency ineach leaves based liquid biodynamic pesticide were isolatedand tested for their antifungal activity by duel culturetechnique (Vincent, 1947) in a replicated trial. The plateswere inoculated with antagonist and test fungus on PDAwith uniform disc of 5 mm each of 5 isolates of F. oxysporumf. sp. psidii (i.e. F10, F18, F24, F30 and F38) and five isolates
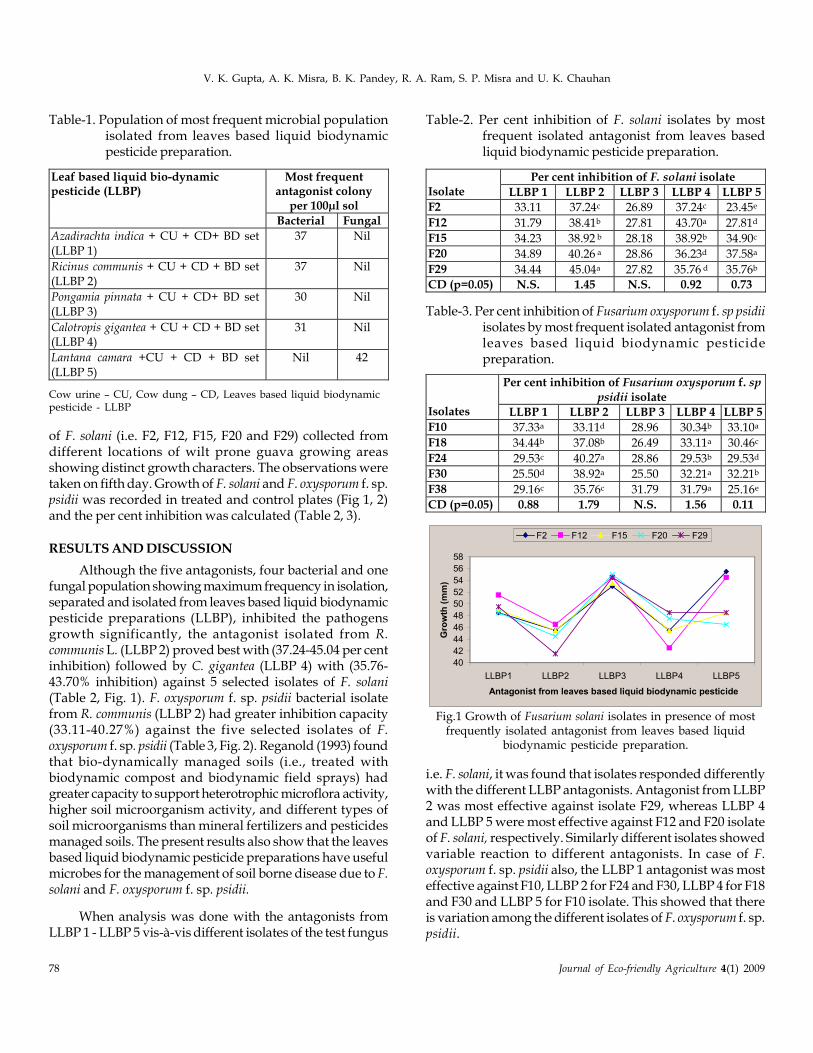
78 Journal of Eco-friendly Agriculture 4(1) 2009
V. K. Gupta, A. K. Misra, B. K. Pandey, R. A. Ram, S. P. Misra and U. K. Chauhan
of F. solani (i.e. F2, F12, F15, F20 and F29) collected fromdifferent locations of wilt prone guava growing areasshowing distinct growth characters. The observations weretaken on fifth day. Growth of F. solani and F. oxysporum f. sp.psidii was recorded in treated and control plates (Fig 1, 2)and the per cent inhibition was calculated (Table 2, 3).
RESULTS AND DISCUSSION
Although the five antagonists, four bacterial and onefungal population showing maximum frequency in isolation,separated and isolated from leaves based liquid biodynamicpesticide preparations (LLBP), inhibited the pathogensgrowth significantly, the antagonist isolated from R.communis L. (LLBP 2) proved best with (37.24-45.04 per centinhibition) followed by C. gigantea (LLBP 4) with (35.76-43.70% inhibition) against 5 selected isolates of F. solani(Table 2, Fig. 1). F. oxysporum f. sp. psidii bacterial isolatefrom R. communis (LLBP 2) had greater inhibition capacity(33.11-40.27%) against the five selected isolates of F.oxysporum f. sp. psidii (Table 3, Fig. 2). Reganold (1993) foundthat bio-dynamically managed soils (i.e., treated withbiodynamic compost and biodynamic field sprays) hadgreater capacity to support heterotrophic microflora activity,higher soil microorganism activity, and different types ofsoil microorganisms than mineral fertilizers and pesticidesmanaged soils. The present results also show that the leavesbased liquid biodynamic pesticide preparations have usefulmicrobes for the management of soil borne disease due to F.solani and F. oxysporum f. sp. psidii.
When analysis was done with the antagonists fromLLBP 1 - LLBP 5 vis-à-vis different isolates of the test fungus
i.e. F. solani, it was found that isolates responded differentlywith the different LLBP antagonists. Antagonist from LLBP2 was most effective against isolate F29, whereas LLBP 4and LLBP 5 were most effective against F12 and F20 isolateof F. solani, respectively. Similarly different isolates showedvariable reaction to different antagonists. In case of F.oxysporum f. sp. psidii also, the LLBP 1 antagonist was mosteffective against F10, LLBP 2 for F24 and F30, LLBP 4 for F18and F30 and LLBP 5 for F10 isolate. This showed that thereis variation among the different isolates of F. oxysporum f. sp.psidii.
Table-1. Population of most frequent microbial populationisolated from leaves based liquid biodynamicpesticide preparation.
Most frequent antagonist colony
per 100µl sol
Leaf based liquid bio-dynamic pesticide (LLBP)
Bacterial Fungal
Azadirachta indica + CU + CD+ BD set (LLBP 1)
37 Nil
Ricinus communis + CU + CD + BD set (LLBP 2)
37 Nil
Pongamia pinnata + CU + CD+ BD set (LLBP 3)
30 Nil
Calotropis gigantea + CU + CD + BD set (LLBP 4)
31 Nil
Lantana camara +CU + CD + BD set (LLBP 5)
Nil 42
Cow urine – CU, Cow dung – CD, Leaves based liquid biodynamicpesticide - LLBP
Table-2. Per cent inhibition of F. solani isolates by mostfrequent isolated antagonist from leaves basedliquid biodynamic pesticide preparation.
Per cent inhibition of F. solani isolate Isolate LLBP 1 LLBP 2 LLBP 3 LLBP 4 LLBP 5 F2 33.11 37.24c 26.89 37.24c 23.45e
F12 31.79 38.41b 27.81 43.70a 27.81d
F15 34.23 38.92 b 28.18 38.92b 34.90c
F20 34.89 40.26 a 28.86 36.23d 37.58a
F29 34.44 45.04a 27.82 35.76 d 35.76b
CD (p=0.05) N.S. 1.45 N.S. 0.92 0.73
40
42
44
46
48
50
52
54
56
58
LLBP1 LLBP2 LLBP3 LLBP4 LLBP5
Antagonist from leaves based liquid biodynamic pesticide
Gro
wth
(m
m)
F2 F12 F15 F20 F29
Fig.1 Growth of Fusarium solani isolates in presence of mostfrequently isolated antagonist from leaves based liquid
biodynamic pesticide preparation.
Table-3. Per cent inhibition of Fusarium oxysporum f. sp psidiiisolates by most frequent isolated antagonist fromleaves based liquid biodynamic pesticidepreparation.
Per cent inhibition of Fusarium oxysporum f. sp psidii isolate
Isolates LLBP 1 LLBP 2 LLBP 3 LLBP 4 LLBP 5
F10 37.33a 33.11d 28.96 30.34b 33.10a
F18 34.44b 37.08b 26.49 33.11a 30.46c
F24 29.53c 40.27a 28.86 29.53b 29.53d
F30 25.50d 38.92a 25.50 32.21a 32.21b
F38 29.16c 35.76c 31.79 31.79a 25.16e
CD (p=0.05) 0.88 1.79 N.S. 1.56 0.11
Journal of Eco-friendly Agriculture 4(1) 2009 79
Evaluation of antagonists isolated from leaf against guava wilt disease based liquid biodynamic pesticides
CONCLUSION
The antagonists isolated show promise against soilborne pathogens F. solani and F. oxysporum f. sp. psidii. Thesecan either be used in raw form or suitable preparation for thecontrol of the disease. As different isolates of F. solani and F.oxysporum f. sp. psidii respond differently to the differentantagonists, consortium of different effective antagonists,may be recommended for the control of wilt disease of guava.
ACKNOWLEDGEMENT
Authors are thankful to Dr. B.M.C. Reddy, DirectorCISH, Lucknow for providing necessary facilities.
40
42
44
46
48
50
52
54
56
58
BD1 BD2 BD3 BD4 BD5
Antagonist from leaves based liquid biodynamic pesticide.
Gro
wth
(m
m)
F10 F18 F24 F30 F38
Fig.2 Growth of Fusarium oxysporum f. sp psidii isolates inpresence of most frequently isolated antagonist from leaves
based liquid biodynamic pesticide preparation.
REFETRENCES
Chattapadhyay, S. B. and Bhattacharjya, S. K. (1968). Investigationson the wilt disease of guava (Psidium guajava L.) in West BengalI. Indian Journal of Agriculture Sciences, 38: 65 -72.
Diver, S. (1999). Biodynamic farming and compost preparations.<http://www.attra.org/attra-pub/covercrop.html>.
Edward, J. C. (1961). Rootstock trails for guava wilt control.Allahabad Farmer, 35: 5-9.
Edward, J. C. and Srivastava, R. N. (1957). Studies on guava wilt.Allahabad Farmer, 31: 144-146.
Gupta, V. K., Misra, A. K., Pandey, B. K. and Chauhan, U. K.(2007). In vitro evaluation of leaf extracts against Fusariumwilt pathogens of guava (Psidium guajava L.). Journal of Eco-friendly Agriculture, 2:166-169.
Kishun, R., Mishra, D., Ram, R. A. and Verma, A. K. (2006).Management of mango bacterial canker disease throughantagonists. Journal of Eco-friendly Agriculture, 1: 54-56.
Misra, A. K. (2006). Wilt of guava-a disease of nationalimportance. Indian Phytopathology. 59: 269-280.
Pandey, R. R. and Dwivedi, R. S. (1985). Fusarium oxysporum f. sp.psidii as a pathogen causing wilt in guava in Varanasi district,Indian Phytopathology, 114: 243-248.
Prasad, N., Mehta, P. R. and Lal, S. B. (1952). Fusarium wilt ofguava (Psidium guajava L.) in UP. Nature, 169:753.
Reganold, J.P., Palmer, A.S., Lockhart, J.C. and Macgregor, A.N.(1993). Soil quality and financial performance of biodynamicand conventional farms in New Zealand. Science. April 16. p.344-349.
Vincent, J. M. (1947). Distortion of fungal hyphae in presence ofcertain inhibitors. Nature, 96: 596
©2009
Interaction effect of Heterorhabditis indica and ArbusularMycorhizal Fungus, Glomus intraradices on the developmentand reproduction of Meloidogyne incognita (Kofoid and white)in Tomato
*S.S Husaini and Kiran Kumar, K.C.
Project Drictorate of Biological Control (ICAR), P.B.No. 2491, HA farm Post, Hebbal, Bangolare 560024, India.*[email protected]
ABSTRACT
An experiment was conducted under net house conditions at PDBC, Bangalore to evaluate the interaction effect ofentomopathogenic nematode (EPN), Heterorhabditis indica at three dosage and Arbuscular Mycorhizal Fungus (AMF),and Glomus intraradices on the development and reproduction of root-knot nematode, Meloidogyne incognita in tomato.Observations recorded at harvest revealed that application of H. indica @ 4x10⁵/m2 along with AMF reduced the no. ofgalls and egg masses per root system, no. of eggs/eggmass and hatch rate of eggs. Enhancement in growth, developmentand yield of tomato in terms of shoot height, shoot weight, root weight, no. of branches/plant, no. of flowers, no. of fruitsand fruit yield was obtained. This treatment was followed by the H. indica. @ 2x10⁵/m2 + AMF and H. indica alone @4x10⁵/m2. The persistence of H. indica was more in the plot receiving a dose of 4x10⁵/m2 followed by 2x10⁵ and 1x10⁵s/m2. However, there was no difference in per cent mortality of Galleria melonella larvae by H. indica with or without AMfungus treatments.
Keywords : Meloidogyne incognita, Entomopathogenic nematode, development & reproduction, tomato, Glomus intraradices
Journal of Eco-friendly Agriculture 4(1): 80-84 : 2009
INTRODUCTION
Root-knot nematodes (Meloidogyne spp.) are the mosteconomically important plant parasitic nematode groupworld wide, attacking nearly every cultivated plant,reducing production. Tomato suffers an extensivequantitative and qualitative damage through out the tropicsand subtropics (Netscher and Sikora, 1990). Chemicalnematicides can be used to manage nematodes but are oftenhighly toxic. Limited nematicide availability and high costsof treatment have created a need to find alternatives ofhazardous chemicals in nematode management (Barker etal., 1994). Entomopathogenic nematodes (EPN) of thefamilies, Steinernematidae and Heterorhabditidae areavailable commercially to control soil insect pest. Hussaini(2003) conducted extensive surveys for EPN in different partsof India and documented several species/isolates. Severalworkers have reported an antagonistic interaction betweenEPN and plant parasitic nematodes. Suppressive effects ofEPN have been demonstrated (Bird and Bird 1986; Gouge etal., 1997, Grewal et al., 1999, lewis et al., 2001, Perry et al.,1998; Ishibashi and Kondo 1987., Smitley et al., 1992). Thisaspect has gained impetus because there are few availableand effective biological control methods for PPN managementand this antagonism is an off-target effect of an insectpathogen widely used. The possible mechanisms ofinteraction between EPN and PPN reported are that they
share a common habitat in the soil which leads to spatialcompetition and crowding of nematodes near the roots ofhost plants (Bird and Bird, 1986); and build up of nematodeantagonists (Ishibashi and Kondo, 1986). An ArbuscularMycorhizal Fungus, G. fasciculatum was found effectiveagainst root-knot nematode by several workers (smith, 1987;Kiran Kumar et al., 2006). From the preliminary experimentin pot culture experiments reduction of invasion anddevelopment of root-knot nematode in tomato due to EPNand AMF application was found. A standard dosage andmethod of application of EPN to suppress PPN in field/nethouse experiments is not well documented (Bird and Bird,1986). In turf, Smitley et al., (1992) used a mix of 2.47 x 10⁹
H.bacteriophora and 2.08 x 10⁹ S.carpocapsae IJ/ha, whereas asingle application of 2.47x 10⁹ S.riobrave IJ/ha suppressedplant parasitic nematodes in field experiments. Tsai and Yeh(1995) found that suppression varied with plant parasiticnematode and host plant species.
The present investigation was aimed at to demonstratethe efficacy of H. indica in combination with AMF on thedevelopment and reproduction of root knot nematode, M.incognita (Kofoid and White), growth and yield of tomato andalso to document the effect of AMF on the persistence andpathogenicity of H. indica.
Interaction Effect of Heterorhabditis indica and Arbusular Mycorhizal Fungus, Glomus intraradices
Journal of Eco-friendly Agriculture 4(1) 2009 81
MATERIALS AND METHODS
M. incognita culture
Root-knot infested tomato (Lycopersicon esulentum Mill.var. Pusa Ruby) plants from the culture fields wereuprooted. The roots were first rinsed and washed gently inrunning tap water to remove all adhering soil particlesavoiding loss of egg masses. Clean roots were teased withthe help of a pair of teasing needles to expose gravid femalescarrying egg masses.
The collected egg masses were hatched and emerginginfective juveniles (IJs) inoculated on tomato plants inearthen clay pots filled with sterilized soil. Pure cultures ofM. incognita thus obtained were multiplied by transferringto large pots using steam-sterilized sand soil mix (1:1) andtomato as a host plant. The culture pots were maintainedregularly in the green house and the same culture was usedas a inoculmn.
Extraction of egg masses was done by uprooting thetomato plants from culture pots, the roots gently washedunder running tap water and then egg masses from suchroots were detached gently with the help of a forceps andplaced in layer of thin water in Petri plate. Larvae hatchedout after 24 to 72 hours were collected in water, countedand used for inoculation.
Entomopathogenic nematode culture
The larvae of greater wax moth, Galleria mellonella, werecollected from the abandoned beehives in the GKVK campus,Bangalore and were maintained on artificial diet (Dutky etal. 1964). The adults were kept in the oviposition cage for egglaying and the eggs were transferred to artificial diet. Purecultures of EPN species. H. indica PDBC EN 13:31 was rearedon last instar wax moth larvae. The IJs were stored in tissueculture flask (250ml) at a density of 500IJs/ml for 5 days.
Glomus intraradices culture
Arbuscular mycorhzal fungus, Glomus intraradicesmixed consortium, supplied by TERI, New Delhi inpowdered form consisted of 200 infective propogulesgram–1. Roots of the tomato plants were treated with thispowdered culture at the time of transplanting.
Preparation of tomato seedling and transplanting
Seeds of tomato (L. esculentum Mill. var. Pusa Ruby),procured from an authentic source, were surface sterilizedwith 10.0 per cent H
2O
2 for 3 min. and washed with distilled
water before germination. Surface sterilized seeds of tomatowere broadcasted in the 12" size of pots or flat trays with
drainage hole at the bottom (15 cm deep). After three weeks,the seedlings, ready were transplanted.
Experiment layout
The experiment was conducted in a net house at PDBC,Bangalore with eight treatments and five replications withplot size of 1m2. The treatments included were : T1 -H.indica@1x10⁵/m2 ; T2 - H.indica@2x10⁵/m2 ; T3 -H.indica@4x10⁵/m2; T4 - H.indica@1x10⁵/m2 + AMF; T5 -H.indica@2x10⁵/m2 + AMF; T6 - H.indica@4x10⁵/m2 +AMF; T7 - AMF alone and T8 - Control (no EPN, no AMF).
The inoculation of root-knot nematode, EPN and AMFwas done at the time of transplanting.
Hatch rate of root-knot nematode eggs
Egg masses were collected from tomato plants infectedwith RKN and treated with NaOCl (0.1%) to dissolve theegg matrix and separate the individual eggs. A knownnumber of eggs (50) were carefully transferred to each vialcontaining 10 ml of distilled water and incubated at roomtemperature (28±2oC) for 96h. Observations were recordedat 24,72 and 96h.
Persistence of EPM
A known volume (200g) of soil from each treatmentwas collected randomly in a plastic container with lid atharvest and subjected to baiting technique using 5 Gallerialarvae box-1 and the mortality rate was recorded at 24, 48, 72and 96h.
RESULTS AND DISCUSSION
Growth and yield of tomato
The data presented in the Table 1 revealed that growthof tomato plants was significantly increased in treated plotscompared to control. However, H. indica @4 x 10⁵/m2 + AMFtreated plots recorded highest shoot length (132.8cm), rootlength (38.0 cm) and no. of branches/plant (25.2). Maximumfresh and dry shoot weight (268.4g and 39.6g) and rootweight (22.6 and 3.45), respectively. This treatment isfollowed by H. indica @4 x 10⁵/m2 + AMF and H. indica @4x 10⁵/m2 alone. Whereas, in control minimum shoot andlength (92.0cm and 22.0cm), no of branches (14.2) plant-1
and minimum shoot and root weight were recorded.
The number of flowers and fruits plant–1 and weightof the fruits were recorded and presented in the Table 2. Thesame trend with maximum flowers (24.0), fruits (21.0)plant–1 and yield (582g) plant–1 in the plants treated with H.indica @4 x 10⁵/m2 + AMF followed by H. indica @4 x 10⁵/m2
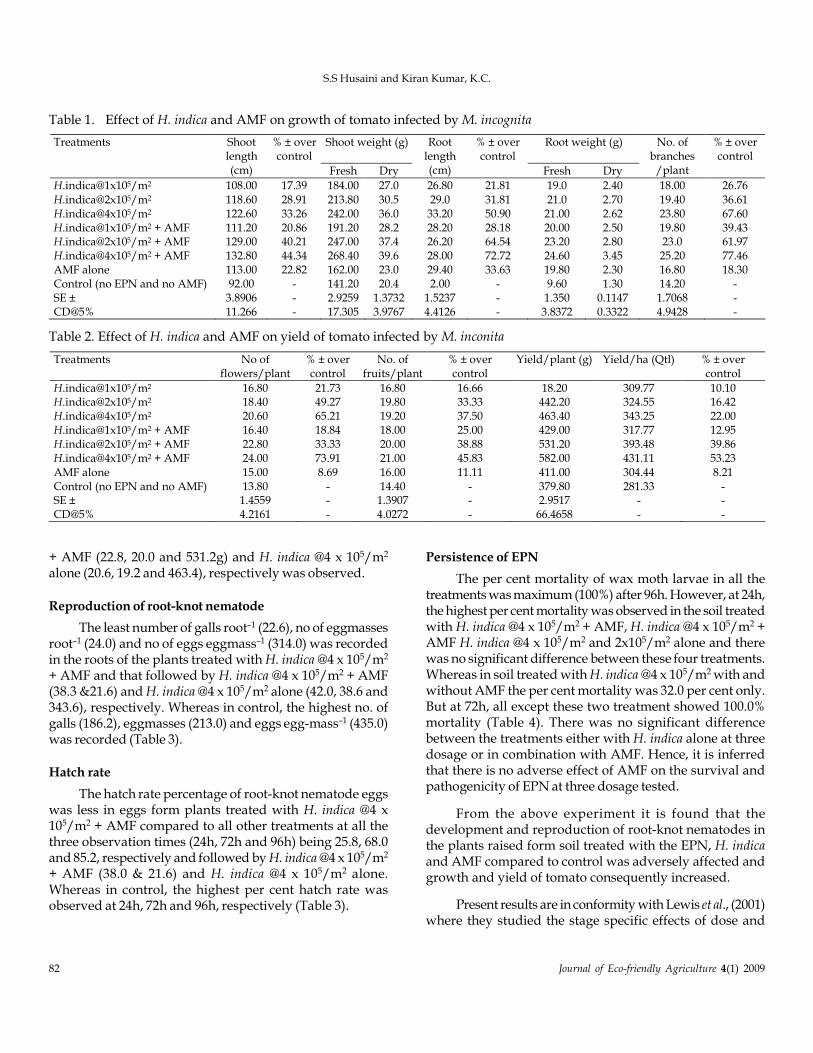
82 Journal of Eco-friendly Agriculture 4(1) 2009
S.S Husaini and Kiran Kumar, K.C.
+ AMF (22.8, 20.0 and 531.2g) and H. indica @4 x 10⁵/m2
alone (20.6, 19.2 and 463.4), respectively was observed.
Reproduction of root-knot nematode
The least number of galls root–1 (22.6), no of eggmassesroot–1 (24.0) and no of eggs eggmass–1 (314.0) was recordedin the roots of the plants treated with H. indica @4 x 10⁵/m2
+ AMF and that followed by H. indica @4 x 10⁵/m2 + AMF(38.3 &21.6) and H. indica @4 x 10⁵/m2 alone (42.0, 38.6 and343.6), respectively. Whereas in control, the highest no. ofgalls (186.2), eggmasses (213.0) and eggs egg-mass–1 (435.0)was recorded (Table 3).
Hatch rate
The hatch rate percentage of root-knot nematode eggswas less in eggs form plants treated with H. indica @4 x10⁵/m2 + AMF compared to all other treatments at all thethree observation times (24h, 72h and 96h) being 25.8, 68.0and 85.2, respectively and followed by H. indica @4 x 10⁵/m2
+ AMF (38.0 & 21.6) and H. indica @4 x 10⁵/m2 alone.Whereas in control, the highest per cent hatch rate wasobserved at 24h, 72h and 96h, respectively (Table 3).
Persistence of EPN
The per cent mortality of wax moth larvae in all thetreatments was maximum (100%) after 96h. However, at 24h,the highest per cent mortality was observed in the soil treatedwith H. indica @4 x 10⁵/m2 + AMF, H. indica @4 x 10⁵/m2 +AMF H. indica @4 x 10⁵/m2 and 2x10⁵/m2 alone and therewas no significant difference between these four treatments.Whereas in soil treated with H. indica @4 x 10⁵/m2 with andwithout AMF the per cent mortality was 32.0 per cent only.But at 72h, all except these two treatment showed 100.0%mortality (Table 4). There was no significant differencebetween the treatments either with H. indica alone at threedosage or in combination with AMF. Hence, it is inferredthat there is no adverse effect of AMF on the survival andpathogenicity of EPN at three dosage tested.
From the above experiment it is found that thedevelopment and reproduction of root-knot nematodes inthe plants raised form soil treated with the EPN, H. indicaand AMF compared to control was adversely affected andgrowth and yield of tomato consequently increased.
Present results are in conformity with Lewis et al., (2001)where they studied the stage specific effects of dose and
Shoot weight (g) Root weight (g)
Treatments Shoot length (cm)
% ± over control
Fresh Dry
Root length (cm)
% ± over control
Fresh Dry
No. of branches
/plant
% ± over control
H.indica@1x10⁵/m2 108.00 17.39 184.00 27.0 26.80 21.81 19.0 2.40 18.00 26.76
H.indica@2x10⁵/m2 118.60 28.91 213.80 30.5 29.0 31.81 21.0 2.70 19.40 36.61 H.indica@4x10⁵/m2 122.60 33.26 242.00 36.0 33.20 50.90 21.00 2.62 23.80 67.60 H.indica@1x10⁵/m2 + AMF 111.20 20.86 191.20 28.2 28.20 28.18 20.00 2.50 19.80 39.43 H.indica@2x10⁵/m2 + AMF 129.00 40.21 247.00 37.4 26.20 64.54 23.20 2.80 23.0 61.97 H.indica@4x10⁵/m2 + AMF 132.80 44.34 268.40 39.6 28.00 72.72 24.60 3.45 25.20 77.46 AMF alone 113.00 22.82 162.00 23.0 29.40 33.63 19.80 2.30 16.80 18.30 Control (no EPN and no AMF) 92.00 - 141.20 20.4 2.00 - 9.60 1.30 14.20 - SE ± 3.8906 - 2.9259 1.3732 1.5237 - 1.350 0.1147 1.7068 - CD@5% 11.266 - 17.305 3.9767 4.4126 - 3.8372 0.3322 4.9428 -
Table 1. Effect of H. indica and AMF on growth of tomato infected by M. incognita
Table 2. Effect of H. indica and AMF on yield of tomato infected by M. inconita
Treatments No of flowers/plant
% ± over control
No. of fruits/plant
% ± over control
Yield/plant (g) Yield/ha (Qtl) % ± over control
H.indica@1x10⁵/m2 16.80 21.73 16.80 16.66 18.20 309.77 10.10 H.indica@2x10⁵/m2 18.40 49.27 19.80 33.33 442.20 324.55 16.42 H.indica@4x10⁵/m2 20.60 65.21 19.20 37.50 463.40 343.25 22.00 H.indica@1x10⁵/m2 + AMF 16.40 18.84 18.00 25.00 429.00 317.77 12.95 H.indica@2x10⁵/m2 + AMF 22.80 33.33 20.00 38.88 531.20 393.48 39.86 H.indica@4x10⁵/m2 + AMF 24.00 73.91 21.00 45.83 582.00 431.11 53.23
AMF alone 15.00 8.69 16.00 11.11 411.00 304.44 8.21 Control (no EPN and no AMF) 13.80 - 14.40 - 379.80 281.33 - SE ± 1.4559 - 1.3907 - 2.9517 - - CD@5% 4.2161 - 4.0272 - 66.4658 - -
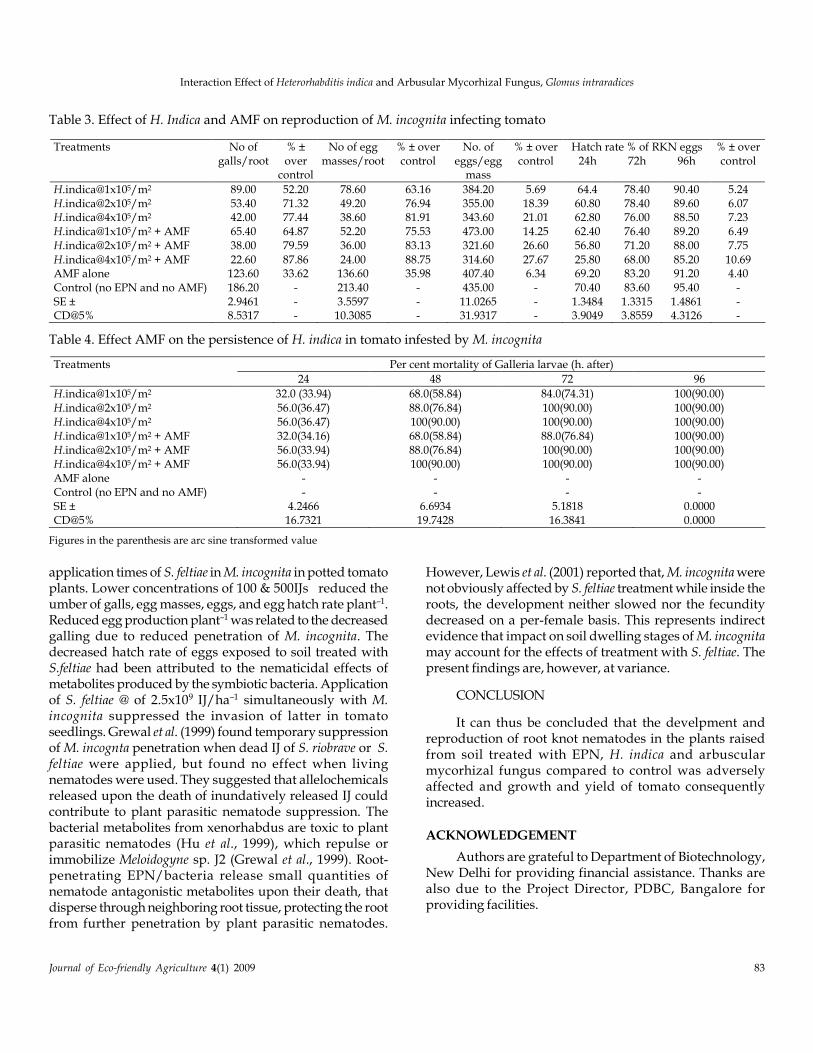
Interaction Effect of Heterorhabditis indica and Arbusular Mycorhizal Fungus, Glomus intraradices
Journal of Eco-friendly Agriculture 4(1) 2009 83
application times of S. feltiae in M. incognita in potted tomatoplants. Lower concentrations of 100 & 500IJs reduced theumber of galls, egg masses, eggs, and egg hatch rate plant–1.Reduced egg production plant–1 was related to the decreasedgalling due to reduced penetration of M. incognita. Thedecreased hatch rate of eggs exposed to soil treated withS.feltiae had been attributed to the nematicidal effects ofmetabolites produced by the symbiotic bacteria. Applicationof S. feltiae @ of 2.5x10⁹ IJ/ha–1 simultaneously with M.incognita suppressed the invasion of latter in tomatoseedlings. Grewal et al. (1999) found temporary suppressionof M. incognta penetration when dead IJ of S. riobrave or S.feltiae were applied, but found no effect when livingnematodes were used. They suggested that allelochemicalsreleased upon the death of inundatively released IJ couldcontribute to plant parasitic nematode suppression. Thebacterial metabolites from xenorhabdus are toxic to plantparasitic nematodes (Hu et al., 1999), which repulse orimmobilize Meloidogyne sp. J2 (Grewal et al., 1999). Root-penetrating EPN/bacteria release small quantities ofnematode antagonistic metabolites upon their death, thatdisperse through neighboring root tissue, protecting the rootfrom further penetration by plant parasitic nematodes.
However, Lewis et al. (2001) reported that, M. incognita werenot obviously affected by S. feltiae treatment while inside theroots, the development neither slowed nor the fecunditydecreased on a per-female basis. This represents indirectevidence that impact on soil dwelling stages of M. incognitamay account for the effects of treatment with S. feltiae. Thepresent findings are, however, at variance.
CONCLUSION
It can thus be concluded that the develpment andreproduction of root knot nematodes in the plants raisedfrom soil treated with EPN, H. indica and arbuscularmycorhizal fungus compared to control was adverselyaffected and growth and yield of tomato consequentlyincreased.
ACKNOWLEDGEMENT
Authors are grateful to Department of Biotechnology,New Delhi for providing financial assistance. Thanks arealso due to the Project Director, PDBC, Bangalore forproviding facilities.
Table 3. Effect of H. Indica and AMF on reproduction of M. incognita infecting tomato
Hatch rate % of RKN eggs Treatments No of galls/root
% ± over
control
No of egg masses/root
% ± over control
No. of eggs/egg
mass
% ± over control 24h 72h 96h
% ± over control
H.indica@1x10⁵/m2 89.00 52.20 78.60 63.16 384.20 5.69 64.4 78.40 90.40 5.24 H.indica@2x10⁵/m2 53.40 71.32 49.20 76.94 355.00 18.39 60.80 78.40 89.60 6.07 H.indica@4x10⁵/m2 42.00 77.44 38.60 81.91 343.60 21.01 62.80 76.00 88.50 7.23 H.indica@1x10⁵/m2 + AMF 65.40 64.87 52.20 75.53 473.00 14.25 62.40 76.40 89.20 6.49 H.indica@2x10⁵/m2 + AMF 38.00 79.59 36.00 83.13 321.60 26.60 56.80 71.20 88.00 7.75
H.indica@4x10⁵/m2 + AMF 22.60 87.86 24.00 88.75 314.60 27.67 25.80 68.00 85.20 10.69 AMF alone 123.60 33.62 136.60 35.98 407.40 6.34 69.20 83.20 91.20 4.40 Control (no EPN and no AMF) 186.20 - 213.40 - 435.00 - 70.40 83.60 95.40 - SE ± 2.9461 - 3.5597 - 11.0265 - 1.3484 1.3315 1.4861 - CD@5% 8.5317 - 10.3085 - 31.9317 - 3.9049 3.8559 4.3126 -
Table 4. Effect AMF on the persistence of H. indica in tomato infested by M. incognita
Per cent mortality of Galleria larvae (h. after) Treatments
24 48 72 96
H.indica@1x10⁵/m2 32.0 (33.94) 68.0(58.84) 84.0(74.31) 100(90.00)
H.indica@2x10⁵/m2 56.0(36.47) 88.0(76.84) 100(90.00) 100(90.00) H.indica@4x10⁵/m2 56.0(36.47) 100(90.00) 100(90.00) 100(90.00) H.indica@1x10⁵/m2 + AMF 32.0(34.16) 68.0(58.84) 88.0(76.84) 100(90.00) H.indica@2x10⁵/m2 + AMF 56.0(33.94) 88.0(76.84) 100(90.00) 100(90.00) H.indica@4x10⁵/m2 + AMF 56.0(33.94) 100(90.00) 100(90.00) 100(90.00) AMF alone - - - - Control (no EPN and no AMF) - - - - SE ± 4.2466 6.6934 5.1818 0.0000 CD@5% 16.7321 19.7428 16.3841 0.0000
Figures in the parenthesis are arc sine transformed value
84 Journal of Eco-friendly Agriculture 4(1) 2009
S.S Husaini and Kiran Kumar, K.C.
REFERENCES
Barker, K.R., R.S. Hussey , L.R., Krusberg, G.W. Bird, R. A. Dunn,H. Ferris, V. R Ferris D.W Freckman, C. J. Gabriel, P.S GrewalA.E. MacGuidwin, D.F. Riddler, P. A. Roberts, and D.P Schmitt,1994. Plant and soil nematodes: societal impact and focus forthe future. Journal of Nematology, 26: 127-137.
Bird, A.F and J. Bird. 1986. Observations in the use of insectparasitic nematodes as a means of biological control of root-knot nematodes. International Journal for Parasitology, 16: 511-516.
Dutky, S.R., J.V. Thompson and G.E. Cantwell. 1964. A techniquefor the mss propogation of the DD-136 nematode. Journal ofInsect Pathology, 6: 417-422.
Gouge, D.H., L.L. Lee, J.R. Van-Berkum, T.J. Henneberry, K.A.Smith, J.R. Berkum 1997. Suppression of plant parasiticnematodes in cotton using the entomopathogenic nematodeSteinernema riobravis (Cabanillas, Poinar, and Raulston)(Rhabditida: steinernematidae). (eds., P. Dugger and D.ARichter) New Orleans, LA, USA, January 6-10, Volume 2. 1324-1326.
Grewal P.S., E.E. Lewis, Sudha Venkatachari and S. venkatachari.1999. Allelopathy: a possible mechanism of suppression ofplant-parasitic nematodes by entomopathogenic nematodes.Nematology, 1: 735-743.
Hu, K. I. Jiannxiong and J. M . Webster. 1990. Nematicidalmetabolites produced by Photorhabdus luminescens(Enerobacteriaceae) bacterial symbiont of entomopathogenicnematodes, Nematology, 1: 457-469.
Hussaini, S.S 2003. Progress of Research work onentomopathogenic nematodes in India, p. 27-68. In: Hussaini,S.S. et al., (Eds.) Current status of Research on EntomopathogenicNematodes in India, Project Directorate of Biological Control,Bangalore, Precision Phototype services, Bangalore, pp 218.
Ishibashi, N. and E. Kondo. 1986. Steinernema feltiae (DD136)and S.glaseri: Persistence in soil and bark compost and theirinfluence on native nematodes Indian Journal of Nematology, 18:310-316.
Ishibashi, N. and E. Kondo. 1987. Dynamics of the entomogenousnematode Steinernema felitiae applied to soil with andwithout nematicide treatment. Indian, Journal of Nematology,19: 404-412.
Kiran Kumar, K. C., K.Krishnappa, N. G. Ravichndra, K.R.Sreenivasa, K.Karuna, and B. Ravikumar, 2006. Effect ofnursery treatment with bioagents and botanicals o survivaland multiplication of Meloidogyne incognita on tomato. Journalof Soil Biology and Ecolog, 26: 96-102.
Lewis, E.E., P.S. Grewal and S. Sardanelli, 2001. interactionsbetween the Steinernema feltiae-Xenorhabdus bovienii insectpathogen complex and the root-knot nematode Meloidogyneincognita. Biological Control, 21: 55-62.
Netscher, C. and R.A. Sikora. 1990. Nematode parasites ofvegetables. In: Plant parasitic nematodes in tropics andsubtropics agriculture. (Eds. M. Luc, R.A. Sikora and J. Bridge)pp 237-283. CAB, UK.
Perry, R.N., W. M. Hominick, J Beane, and B. Briscoe. 1998. Effectof the entomopathhogenic nematodes, Steinernema feltiae andS. carpocapsae, on the potato cyst nematode, Globoderarostochiensis, in pot trials. Biocontrol-Science and Technology, 8:175-180.
Smitley, D.R., F.W. Warner and G.W. Bird. 1992. Influence ofirrigation and Heterorhabditis bacteriophora on plant parasiticnematodes in turf. Journal of Nematology 24: 637-641.
Tsai, B.Y. and H.L. Yeh. 1995. Effect of Steinernema carpocapsaein the infectivity of Pratylenchus coffeae and Meloidogyne javanica.Plant Pathology Bulletin, 4: 106-100.
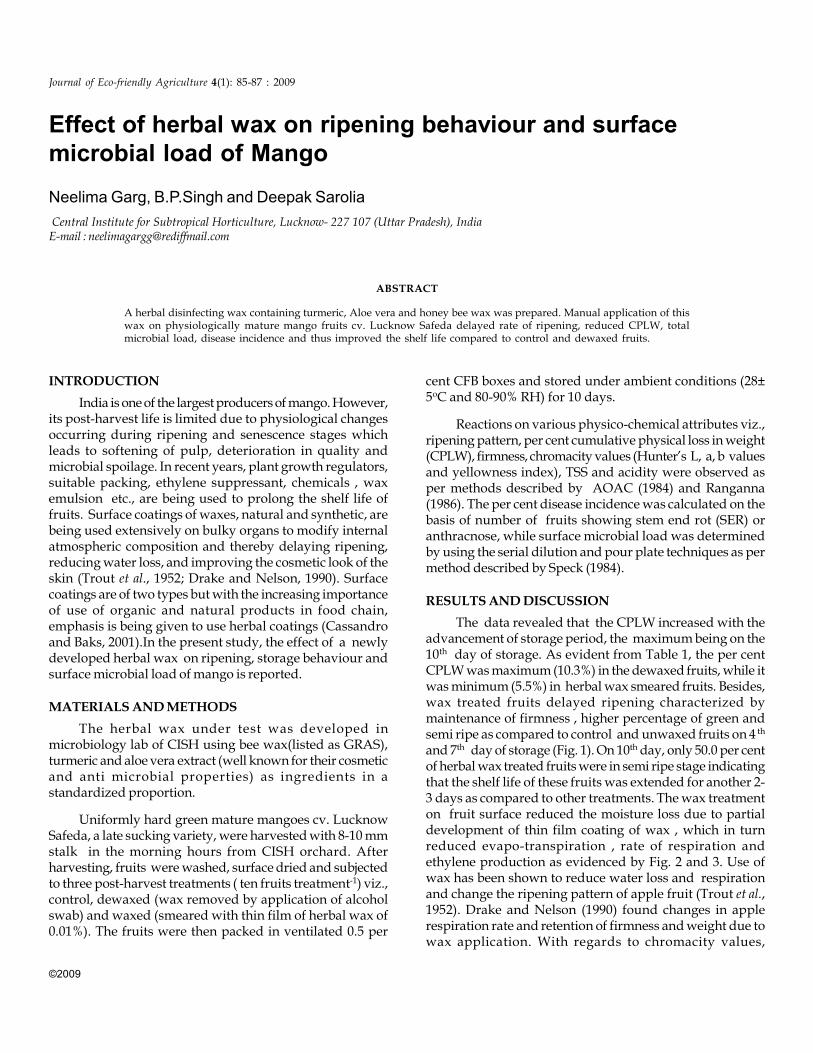
©2009
Effect of herbal wax on ripening behaviour and surfacemicrobial load of Mango
Neelima Garg, B.P.Singh and Deepak Sarolia
Central Institute for Subtropical Horticulture, Lucknow- 227 107 (Uttar Pradesh), IndiaE-mail : [email protected]
ABSTRACT
A herbal disinfecting wax containing turmeric, Aloe vera and honey bee wax was prepared. Manual application of thiswax on physiologically mature mango fruits cv. Lucknow Safeda delayed rate of ripening, reduced CPLW, totalmicrobial load, disease incidence and thus improved the shelf life compared to control and dewaxed fruits.
Journal of Eco-friendly Agriculture 4(1): 85-87 : 2009
INTRODUCTION
India is one of the largest producers of mango. However,its post-harvest life is limited due to physiological changesoccurring during ripening and senescence stages whichleads to softening of pulp, deterioration in quality andmicrobial spoilage. In recent years, plant growth regulators,suitable packing, ethylene suppressant, chemicals , waxemulsion etc., are being used to prolong the shelf life offruits. Surface coatings of waxes, natural and synthetic, arebeing used extensively on bulky organs to modify internalatmospheric composition and thereby delaying ripening,reducing water loss, and improving the cosmetic look of theskin (Trout et al., 1952; Drake and Nelson, 1990). Surfacecoatings are of two types but with the increasing importanceof use of organic and natural products in food chain,emphasis is being given to use herbal coatings (Cassandroand Baks, 2001).In the present study, the effect of a newlydeveloped herbal wax on ripening, storage behaviour andsurface microbial load of mango is reported.
MATERIALS AND METHODS
The herbal wax under test was developed inmicrobiology lab of CISH using bee wax(listed as GRAS),turmeric and aloe vera extract (well known for their cosmeticand anti microbial properties) as ingredients in astandardized proportion.
Uniformly hard green mature mangoes cv. LucknowSafeda, a late sucking variety, were harvested with 8-10 mmstalk in the morning hours from CISH orchard. Afterharvesting, fruits were washed, surface dried and subjectedto three post-harvest treatments ( ten fruits treatment-1) viz.,control, dewaxed (wax removed by application of alcoholswab) and waxed (smeared with thin film of herbal wax of0.01%). The fruits were then packed in ventilated 0.5 per
cent CFB boxes and stored under ambient conditions (28±5oC and 80-90% RH) for 10 days.
Reactions on various physico-chemical attributes viz.,ripening pattern, per cent cumulative physical loss in weight(CPLW), firmness, chromacity values (Hunter’s L, a, b valuesand yellowness index), TSS and acidity were observed asper methods described by AOAC (1984) and Ranganna(1986). The per cent disease incidence was calculated on thebasis of number of fruits showing stem end rot (SER) oranthracnose, while surface microbial load was determinedby using the serial dilution and pour plate techniques as permethod described by Speck (1984).
RESULTS AND DISCUSSION
The data revealed that the CPLW increased with theadvancement of storage period, the maximum being on the10th day of storage. As evident from Table 1, the per centCPLW was maximum (10.3%) in the dewaxed fruits, while itwas minimum (5.5%) in herbal wax smeared fruits. Besides,wax treated fruits delayed ripening characterized bymaintenance of firmness , higher percentage of green andsemi ripe as compared to control and unwaxed fruits on 4 th
and 7th day of storage (Fig. 1). On 10th day, only 50.0 per centof herbal wax treated fruits were in semi ripe stage indicatingthat the shelf life of these fruits was extended for another 2-3 days as compared to other treatments. The wax treatmenton fruit surface reduced the moisture loss due to partialdevelopment of thin film coating of wax , which in turnreduced evapo-transpiration , rate of respiration andethylene production as evidenced by Fig. 2 and 3. Use ofwax has been shown to reduce water loss and respirationand change the ripening pattern of apple fruit (Trout et al.,1952). Drake and Nelson (1990) found changes in applerespiration rate and retention of firmness and weight due towax application. With regards to chromacity values,
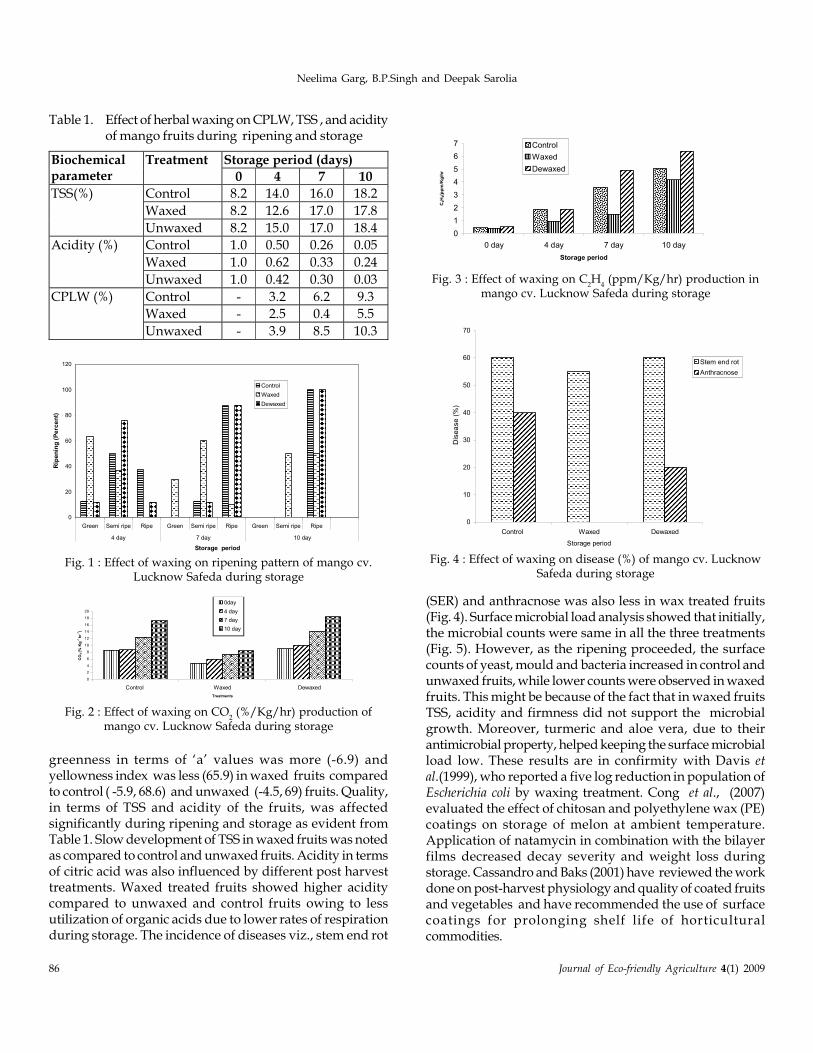
86 Journal of Eco-friendly Agriculture 4(1) 2009
Neelima Garg, B.P.Singh and Deepak Sarolia
Fig. 2: Effect of waxing on CO2 (% /Kg/ hr ) production of mango cv. Lucknow Safeda during storage
0
2
4
6
8
10
12
14
16
18
20
Control Waxed Dewaxed
Treatments
CO
2 (%
Kg
-1 h
r-1)
0day
4 day
7 day
10 day
Table 1. Effect of herbal waxing on CPLW, TSS , and acidityof mango fruits during ripening and storage
Storage period (days) Biochemical parameter
Treatment
0 4 7 10
Control 8.2 14.0 16.0 18.2
Waxed 8.2 12.6 17.0 17.8
TSS(%)
Unwaxed 8.2 15.0 17.0 18.4
Control 1.0 0.50 0.26 0.05
Waxed 1.0 0.62 0.33 0.24
Acidity (%)
Unwaxed 1.0 0.42 0.30 0.03
Control - 3.2 6.2 9.3
Waxed - 2.5 0.4 5.5
CPLW (%)
Unwaxed - 3.9 8.5 10.3
greenness in terms of ‘a’ values was more (-6.9) andyellowness index was less (65.9) in waxed fruits comparedto control ( -5.9, 68.6) and unwaxed (-4.5, 69) fruits. Quality,in terms of TSS and acidity of the fruits, was affectedsignificantly during ripening and storage as evident fromTable 1. Slow development of TSS in waxed fruits was notedas compared to control and unwaxed fruits. Acidity in termsof citric acid was also influenced by different post harvesttreatments. Waxed treated fruits showed higher aciditycompared to unwaxed and control fruits owing to lessutilization of organic acids due to lower rates of respirationduring storage. The incidence of diseases viz., stem end rot
Fig. 4: Effect of waxing on disease (%) of mango cv.
Lucknow Safeda on 10th day of storage
0
10
20
30
40
50
60
70
Control Waxed Dewaxed
Storage period
Dis
ea
se (
%)
Stem end rot
Anthracnose
Fig. 2 : Effect of waxing on CO2 (%/Kg/hr) production of
mango cv. Lucknow Safeda during storage
Fig. 4 : Effect of waxing on disease (%) of mango cv. LucknowSafeda during storage
Fig. 1: Effect of waxing on ripening pattern of mango cv. Lucknow
Safeda during storage
0
20
40
60
80
100
120
Green Semi ripe Ripe Green Semi ripe Ripe Green Semi ripe Ripe
4 day 7 day 10 day
Storage period
Rip
en
ing
(P
erc
en
t)
Control
Waxed
Dewaxed
Fig. 1 : Effect of waxing on ripening pattern of mango cv.Lucknow Safeda during storage
Fig. 3: Effect of waxing on C2H4(ppm/Kg/hr) production in mango
cv. Lucknow Safeda during storage.
0
1
2
3
4
5
6
7
0 day 4 day 7 day 10 day
Storage period
C2H
4(p
pm
/Kg
/hr
Control
Waxed
Dewaxed
Fig. 3 : Effect of waxing on C2H
4 (ppm/Kg/hr) production in
mango cv. Lucknow Safeda during storage
(SER) and anthracnose was also less in wax treated fruits(Fig. 4). Surface microbial load analysis showed that initially,the microbial counts were same in all the three treatments(Fig. 5). However, as the ripening proceeded, the surfacecounts of yeast, mould and bacteria increased in control andunwaxed fruits, while lower counts were observed in waxedfruits. This might be because of the fact that in waxed fruitsTSS, acidity and firmness did not support the microbialgrowth. Moreover, turmeric and aloe vera, due to theirantimicrobial property, helped keeping the surface microbialload low. These results are in confirmity with Davis etal.(1999), who reported a five log reduction in population ofEscherichia coli by waxing treatment. Cong et al., (2007)evaluated the effect of chitosan and polyethylene wax (PE)coatings on storage of melon at ambient temperature.Application of natamycin in combination with the bilayerfilms decreased decay severity and weight loss duringstorage. Cassandro and Baks (2001) have reviewed the workdone on post-harvest physiology and quality of coated fruitsand vegetables and have recommended the use of surfacecoatings for prolonging shelf life of horticulturalcommodities.
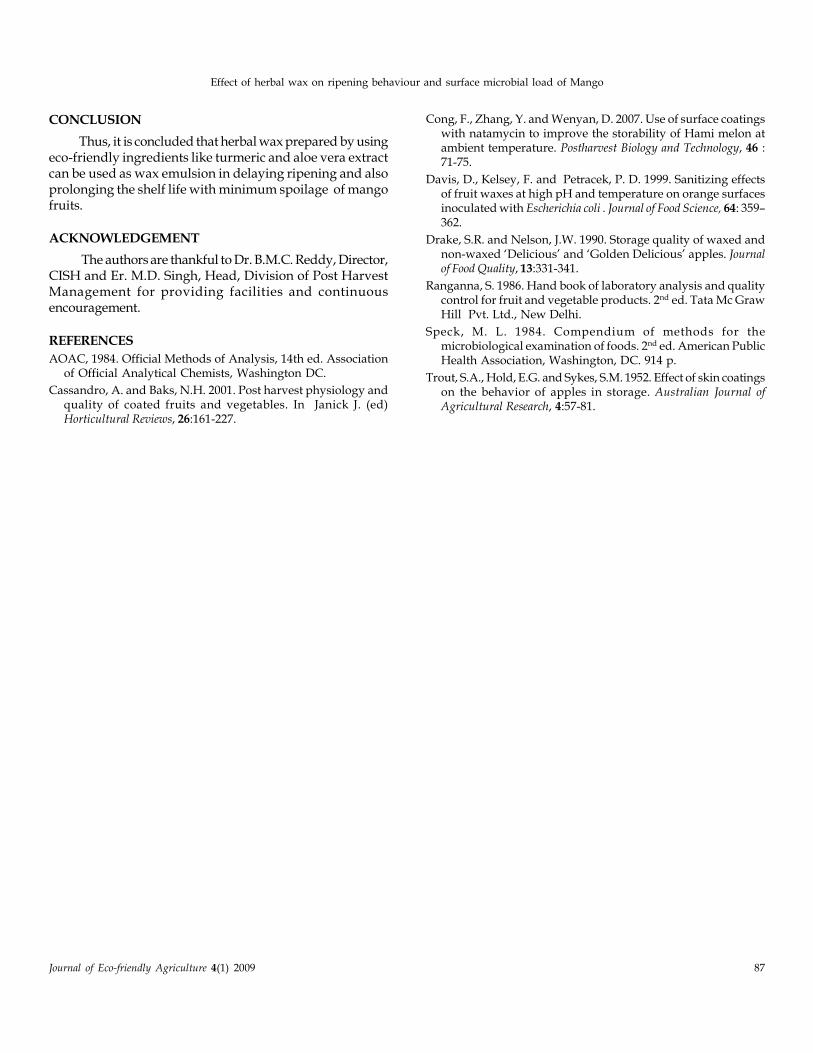
Effect of herbal wax on ripening behaviour and surface microbial load of Mango
Journal of Eco-friendly Agriculture 4(1) 2009 87
CONCLUSION
Thus, it is concluded that herbal wax prepared by usingeco-friendly ingredients like turmeric and aloe vera extractcan be used as wax emulsion in delaying ripening and alsoprolonging the shelf life with minimum spoilage of mangofruits.
ACKNOWLEDGEMENT
The authors are thankful to Dr. B.M.C. Reddy, Director,CISH and Er. M.D. Singh, Head, Division of Post HarvestManagement for providing facilities and continuousencouragement.
REFERENCES
AOAC, 1984. Official Methods of Analysis, 14th ed. Associationof Official Analytical Chemists, Washington DC.
Cassandro, A. and Baks, N.H. 2001. Post harvest physiology andquality of coated fruits and vegetables. In Janick J. (ed)Horticultural Reviews, 26:161-227.
Cong, F., Zhang, Y. and Wenyan, D. 2007. Use of surface coatingswith natamycin to improve the storability of Hami melon atambient temperature. Postharvest Biology and Technology, 46 :71-75.
Davis, D., Kelsey, F. and Petracek, P. D. 1999. Sanitizing effectsof fruit waxes at high pH and temperature on orange surfacesinoculated with Escherichia coli . Journal of Food Science, 64: 359–362.
Drake, S.R. and Nelson, J.W. 1990. Storage quality of waxed andnon-waxed ‘Delicious’ and ‘Golden Delicious’ apples. Journalof Food Quality, 13:331-341.
Ranganna, S. 1986. Hand book of laboratory analysis and qualitycontrol for fruit and vegetable products. 2nd ed. Tata Mc GrawHill Pvt. Ltd., New Delhi.
Speck, M. L. 1984. Compendium of methods for themicrobiological examination of foods. 2nd ed. American PublicHealth Association, Washington, DC. 914 p.
Trout, S.A., Hold, E.G. and Sykes, S.M. 1952. Effect of skin coatingson the behavior of apples in storage. Australian Journal ofAgricultural Research, 4:57-81.
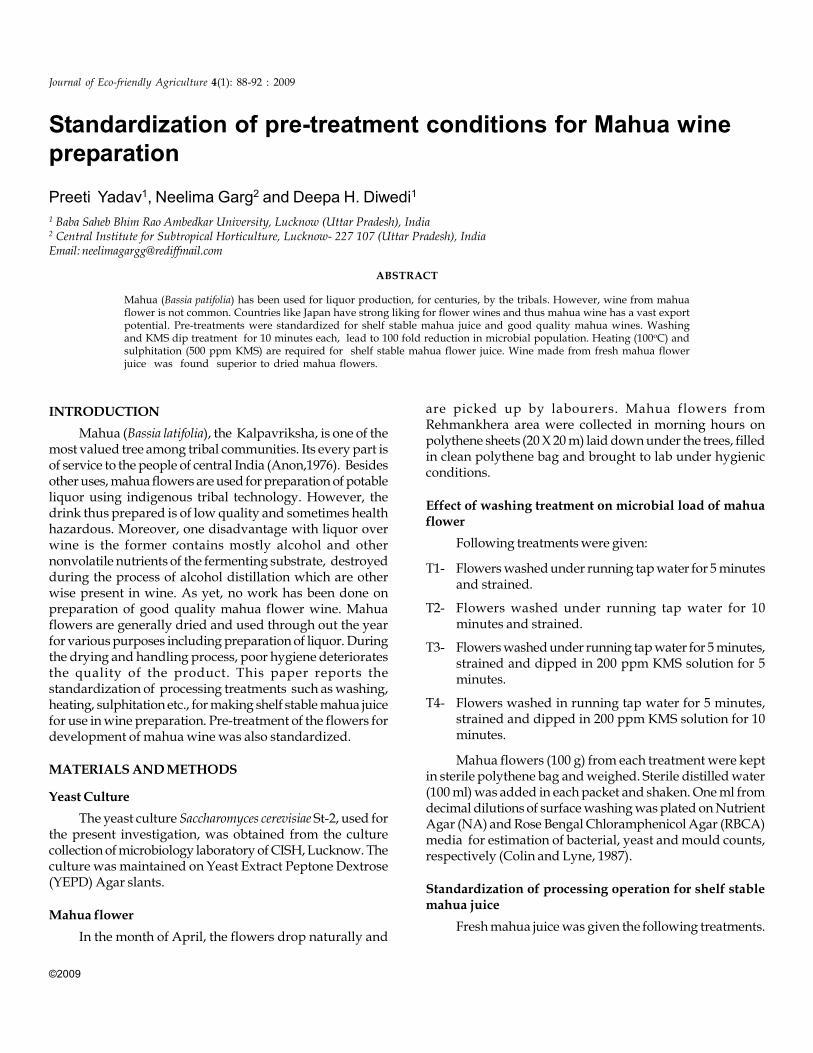
©2009
Standardization of pre-treatment conditions for Mahua winepreparation
Preeti Yadav1, Neelima Garg2 and Deepa H. Diwedi1
1 Baba Saheb Bhim Rao Ambedkar University, Lucknow (Uttar Pradesh), India2 Central Institute for Subtropical Horticulture, Lucknow- 227 107 (Uttar Pradesh), IndiaEmail: [email protected]
ABSTRACT
Mahua (Bassia patifolia) has been used for liquor production, for centuries, by the tribals. However, wine from mahuaflower is not common. Countries like Japan have strong liking for flower wines and thus mahua wine has a vast exportpotential. Pre-treatments were standardized for shelf stable mahua juice and good quality mahua wines. Washingand KMS dip treatment for 10 minutes each, lead to 100 fold reduction in microbial population. Heating (100oC) andsulphitation (500 ppm KMS) are required for shelf stable mahua flower juice. Wine made from fresh mahua flowerjuice was found superior to dried mahua flowers.
Journal of Eco-friendly Agriculture 4(1): 88-92 : 2009
INTRODUCTION
Mahua (Bassia latifolia), the Kalpavriksha, is one of themost valued tree among tribal communities. Its every part isof service to the people of central India (Anon,1976). Besidesother uses, mahua flowers are used for preparation of potableliquor using indigenous tribal technology. However, thedrink thus prepared is of low quality and sometimes healthhazardous. Moreover, one disadvantage with liquor overwine is the former contains mostly alcohol and othernonvolatile nutrients of the fermenting substrate, destroyedduring the process of alcohol distillation which are otherwise present in wine. As yet, no work has been done onpreparation of good quality mahua flower wine. Mahuaflowers are generally dried and used through out the yearfor various purposes including preparation of liquor. Duringthe drying and handling process, poor hygiene deterioratesthe quality of the product. This paper reports thestandardization of processing treatments such as washing,heating, sulphitation etc., for making shelf stable mahua juicefor use in wine preparation. Pre-treatment of the flowers fordevelopment of mahua wine was also standardized.
MATERIALS AND METHODS
Yeast Culture
The yeast culture Saccharomyces cerevisiae St-2, used forthe present investigation, was obtained from the culturecollection of microbiology laboratory of CISH, Lucknow. Theculture was maintained on Yeast Extract Peptone Dextrose(YEPD) Agar slants.
Mahua flower
In the month of April, the flowers drop naturally and
are picked up by labourers. Mahua flowers fromRehmankhera area were collected in morning hours onpolythene sheets (20 X 20 m) laid down under the trees, filledin clean polythene bag and brought to lab under hygienicconditions.
Effect of washing treatment on microbial load of mahuaflower
Following treatments were given:
T1- Flowers washed under running tap water for 5 minutesand strained.
T2- Flowers washed under running tap water for 10minutes and strained.
T3- Flowers washed under running tap water for 5 minutes,strained and dipped in 200 ppm KMS solution for 5minutes.
T4- Flowers washed in running tap water for 5 minutes,strained and dipped in 200 ppm KMS solution for 10minutes.
Mahua flowers (100 g) from each treatment were keptin sterile polythene bag and weighed. Sterile distilled water(100 ml) was added in each packet and shaken. One ml fromdecimal dilutions of surface washing was plated on NutrientAgar (NA) and Rose Bengal Chloramphenicol Agar (RBCA)media for estimation of bacterial, yeast and mould counts,respectively (Colin and Lyne, 1987).
Standardization of processing operation for shelf stablemahua juice
Fresh mahua juice was given the following treatments.
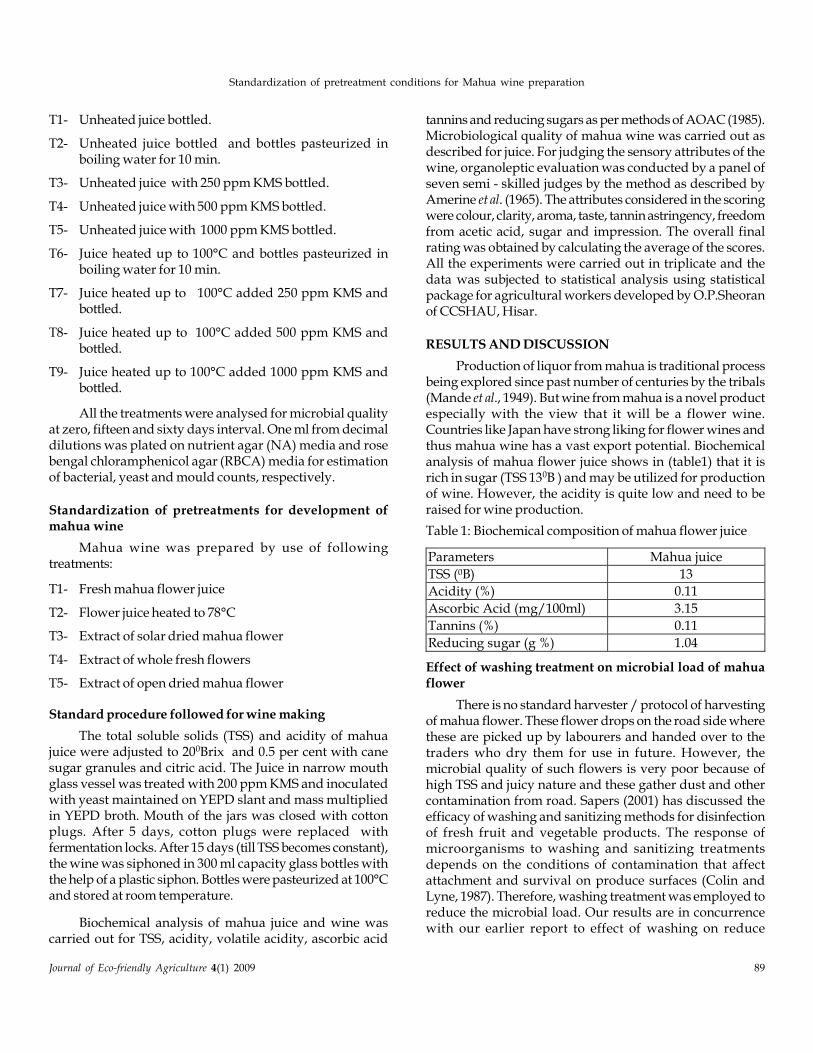
Standardization of pretreatment conditions for Mahua wine preparation
Journal of Eco-friendly Agriculture 4(1) 2009 89
T1- Unheated juice bottled.
T2- Unheated juice bottled and bottles pasteurized inboiling water for 10 min.
T3- Unheated juice with 250 ppm KMS bottled.
T4- Unheated juice with 500 ppm KMS bottled.
T5- Unheated juice with 1000 ppm KMS bottled.
T6- Juice heated up to 100°C and bottles pasteurized inboiling water for 10 min.
T7- Juice heated up to 100°C added 250 ppm KMS andbottled.
T8- Juice heated up to 100°C added 500 ppm KMS andbottled.
T9- Juice heated up to 100°C added 1000 ppm KMS andbottled.
All the treatments were analysed for microbial qualityat zero, fifteen and sixty days interval. One ml from decimaldilutions was plated on nutrient agar (NA) media and rosebengal chloramphenicol agar (RBCA) media for estimationof bacterial, yeast and mould counts, respectively.
Standardization of pretreatments for development ofmahua wine
Mahua wine was prepared by use of followingtreatments:
T1- Fresh mahua flower juice
T2- Flower juice heated to 78°C
T3- Extract of solar dried mahua flower
T4- Extract of whole fresh flowers
T5- Extract of open dried mahua flower
Standard procedure followed for wine making
The total soluble solids (TSS) and acidity of mahuajuice were adjusted to 200Brix and 0.5 per cent with canesugar granules and citric acid. The Juice in narrow mouthglass vessel was treated with 200 ppm KMS and inoculatedwith yeast maintained on YEPD slant and mass multipliedin YEPD broth. Mouth of the jars was closed with cottonplugs. After 5 days, cotton plugs were replaced withfermentation locks. After 15 days (till TSS becomes constant),the wine was siphoned in 300 ml capacity glass bottles withthe help of a plastic siphon. Bottles were pasteurized at 100°Cand stored at room temperature.
Biochemical analysis of mahua juice and wine wascarried out for TSS, acidity, volatile acidity, ascorbic acid
tannins and reducing sugars as per methods of AOAC (1985).Microbiological quality of mahua wine was carried out asdescribed for juice. For judging the sensory attributes of thewine, organoleptic evaluation was conducted by a panel ofseven semi - skilled judges by the method as described byAmerine et al. (1965). The attributes considered in the scoringwere colour, clarity, aroma, taste, tannin astringency, freedomfrom acetic acid, sugar and impression. The overall finalrating was obtained by calculating the average of the scores.All the experiments were carried out in triplicate and thedata was subjected to statistical analysis using statisticalpackage for agricultural workers developed by O.P.Sheoranof CCSHAU, Hisar.
RESULTS AND DISCUSSION
Production of liquor from mahua is traditional processbeing explored since past number of centuries by the tribals(Mande et al., 1949). But wine from mahua is a novel productespecially with the view that it will be a flower wine.Countries like Japan have strong liking for flower wines andthus mahua wine has a vast export potential. Biochemicalanalysis of mahua flower juice shows in (table1) that it isrich in sugar (TSS 130B ) and may be utilized for productionof wine. However, the acidity is quite low and need to beraised for wine production.
Table 1: Biochemical composition of mahua flower juice
Parameters Mahua juice
TSS (0B) 13
Acidity (%) 0.11
Ascorbic Acid (mg/100ml) 3.15
Tannins (%) 0.11
Reducing sugar (g %) 1.04 Effect of washing treatment on microbial load of mahuaflower
There is no standard harvester / protocol of harvestingof mahua flower. These flower drops on the road side wherethese are picked up by labourers and handed over to thetraders who dry them for use in future. However, themicrobial quality of such flowers is very poor because ofhigh TSS and juicy nature and these gather dust and othercontamination from road. Sapers (2001) has discussed theefficacy of washing and sanitizing methods for disinfectionof fresh fruit and vegetable products. The response ofmicroorganisms to washing and sanitizing treatmentsdepends on the conditions of contamination that affectattachment and survival on produce surfaces (Colin andLyne, 1987). Therefore, washing treatment was employed toreduce the microbial load. Our results are in concurrencewith our earlier report to effect of washing on reduce
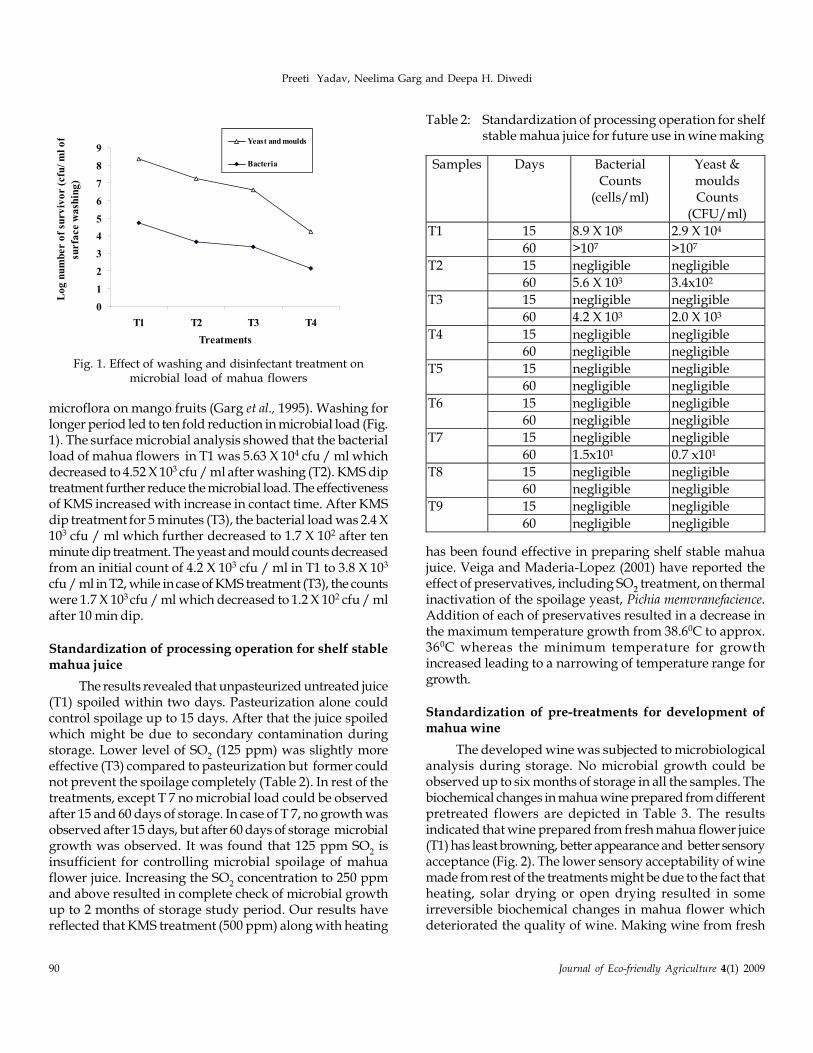
90 Journal of Eco-friendly Agriculture 4(1) 2009
Preeti Yadav, Neelima Garg and Deepa H. Diwedi
microflora on mango fruits (Garg et al., 1995). Washing forlonger period led to ten fold reduction in microbial load (Fig.1). The surface microbial analysis showed that the bacterialload of mahua flowers in T1 was 5.63 X 10⁴ cfu / ml whichdecreased to 4.52 X 10³ cfu / ml after washing (T2). KMS diptreatment further reduce the microbial load. The effectivenessof KMS increased with increase in contact time. After KMSdip treatment for 5 minutes (T3), the bacterial load was 2.4 X10³ cfu / ml which further decreased to 1.7 X 10² after tenminute dip treatment. The yeast and mould counts decreasedfrom an initial count of 4.2 X 10³ cfu / ml in T1 to 3.8 X 10³
cfu / ml in T2, while in case of KMS treatment (T3), the countswere 1.7 X 10³ cfu / ml which decreased to 1.2 X 10² cfu / mlafter 10 min dip.
Standardization of processing operation for shelf stablemahua juice
The results revealed that unpasteurized untreated juice(T1) spoiled within two days. Pasteurization alone couldcontrol spoilage up to 15 days. After that the juice spoiledwhich might be due to secondary contamination duringstorage. Lower level of SO
2 (125 ppm) was slightly more
effective (T3) compared to pasteurization but former couldnot prevent the spoilage completely (Table 2). In rest of thetreatments, except T 7 no microbial load could be observedafter 15 and 60 days of storage. In case of T 7, no growth wasobserved after 15 days, but after 60 days of storage microbialgrowth was observed. It was found that 125 ppm SO
2 is
insufficient for controlling microbial spoilage of mahuaflower juice. Increasing the SO
2 concentration to 250 ppm
and above resulted in complete check of microbial growthup to 2 months of storage study period. Our results havereflected that KMS treatment (500 ppm) along with heating
has been found effective in preparing shelf stable mahuajuice. Veiga and Maderia-Lopez (2001) have reported theeffect of preservatives, including SO
2 treatment, on thermal
inactivation of the spoilage yeast, Pichia memvranefacience.Addition of each of preservatives resulted in a decrease inthe maximum temperature growth from 38.60C to approx.360C whereas the minimum temperature for growthincreased leading to a narrowing of temperature range forgrowth.
Standardization of pre-treatments for development ofmahua wine
The developed wine was subjected to microbiologicalanalysis during storage. No microbial growth could beobserved up to six months of storage in all the samples. Thebiochemical changes in mahua wine prepared from differentpretreated flowers are depicted in Table 3. The resultsindicated that wine prepared from fresh mahua flower juice(T1) has least browning, better appearance and better sensoryacceptance (Fig. 2). The lower sensory acceptability of winemade from rest of the treatments might be due to the fact thatheating, solar drying or open drying resulted in someirreversible biochemical changes in mahua flower whichdeteriorated the quality of wine. Making wine from fresh
Fig. 1 : Effect of washing and disinfectant treatment on
microbial load of mahua flowers
0
1
2
3
4
5
6
7
8
9
T1 T2 T3 T4
Treatments
Lo
g n
um
ber
of
surv
ivo
r (c
fu/
ml
of
surf
ace
wa
shin
g)
Yeast and moulds
Bacteria
Table 2: Standardization of processing operation for shelfstable mahua juice for future use in wine making
Samples Days Bacterial
Counts (cells/ml)
Yeast &
moulds Counts
(CFU/ml)
15 8.9 X 10⁸ 2.9 X 10⁴ T1
60 >107 >107
15 negligible negligible T2
60 5.6 X 10³ 3.4x10²
15 negligible negligible T3
60 4.2 X 10³ 2.0 X 10³
15 negligible negligible T4
60 negligible negligible
15 negligible negligible T5
60 negligible negligible
15 negligible negligible T6
60 negligible negligible
15 negligible negligible T7
60 1.5x101 0.7 x101
15 negligible negligible T8
60 negligible negligible
15 negligible negligible T9
60 negligible negligible
Fig. 1. Effect of washing and disinfectant treatment onmicrobial load of mahua flowers
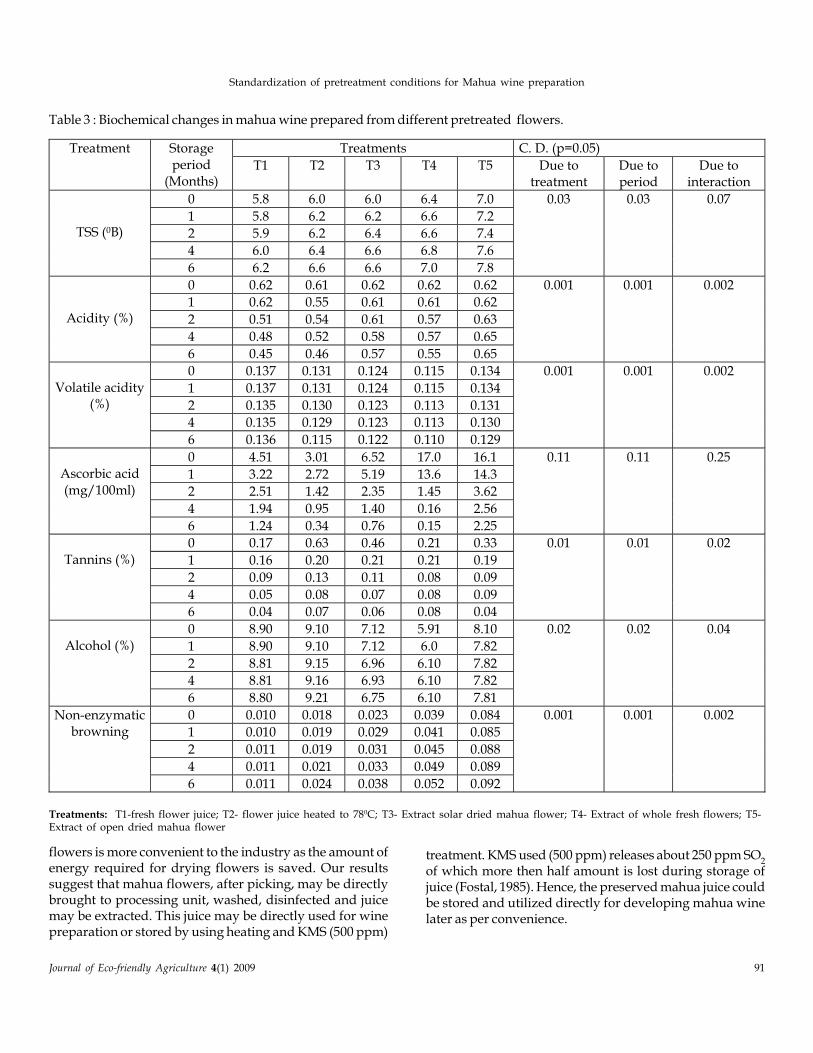
Standardization of pretreatment conditions for Mahua wine preparation
Journal of Eco-friendly Agriculture 4(1) 2009 91
Table 3 : Biochemical changes in mahua wine prepared from different pretreated flowers.
Treatments C. D. (p=0.05) Treatment Storage
period (Months)
T1 T2 T3 T4 T5 Due to treatment
Due to period
Due to interaction
0 5.8 6.0 6.0 6.4 7.0
1 5.8 6.2 6.2 6.6 7.2
2 5.9 6.2 6.4 6.6 7.4
4 6.0 6.4 6.6 6.8 7.6
TSS (0B)
6 6.2 6.6 6.6 7.0 7.8
0.03 0.03 0.07
0 0.62 0.61 0.62 0.62 0.62
1 0.62 0.55 0.61 0.61 0.62
2 0.51 0.54 0.61 0.57 0.63
4 0.48 0.52 0.58 0.57 0.65
Acidity (%)
6 0.45 0.46 0.57 0.55 0.65
0.001 0.001 0.002
0 0.137 0.131 0.124 0.115 0.134
1 0.137 0.131 0.124 0.115 0.134
2 0.135 0.130 0.123 0.113 0.131
4 0.135 0.129 0.123 0.113 0.130
Volatile acidity (%)
6 0.136 0.115 0.122 0.110 0.129
0.001 0.001 0.002
0 4.51 3.01 6.52 17.0 16.1
1 3.22 2.72 5.19 13.6 14.3
2 2.51 1.42 2.35 1.45 3.62
4 1.94 0.95 1.40 0.16 2.56
Ascorbic acid
(mg/100ml)
6 1.24 0.34 0.76 0.15 2.25
0.11 0.11 0.25
0 0.17 0.63 0.46 0.21 0.33
1 0.16 0.20 0.21 0.21 0.19
2 0.09 0.13 0.11 0.08 0.09
4 0.05 0.08 0.07 0.08 0.09
Tannins (%)
6 0.04 0.07 0.06 0.08 0.04
0.01 0.01 0.02
0 8.90 9.10 7.12 5.91 8.10
1 8.90 9.10 7.12 6.0 7.82
2 8.81 9.15 6.96 6.10 7.82
4 8.81 9.16 6.93 6.10 7.82
Alcohol (%)
6 8.80 9.21 6.75 6.10 7.81
0.02 0.02 0.04
0 0.010 0.018 0.023 0.039 0.084
1 0.010 0.019 0.029 0.041 0.085
2 0.011 0.019 0.031 0.045 0.088
4 0.011 0.021 0.033 0.049 0.089
Non-enzymatic browning
6 0.011 0.024 0.038 0.052 0.092
0.001 0.001 0.002
Treatments: T1-fresh flower juice; T2- flower juice heated to 780C; T3- Extract solar dried mahua flower; T4- Extract of whole fresh flowers; T5-Extract of open dried mahua flower
flowers is more convenient to the industry as the amount ofenergy required for drying flowers is saved. Our resultssuggest that mahua flowers, after picking, may be directlybrought to processing unit, washed, disinfected and juicemay be extracted. This juice may be directly used for winepreparation or stored by using heating and KMS (500 ppm)
treatment. KMS used (500 ppm) releases about 250 ppm SO2
of which more then half amount is lost during storage ofjuice (Fostal, 1985). Hence, the preserved mahua juice couldbe stored and utilized directly for developing mahua winelater as per convenience.
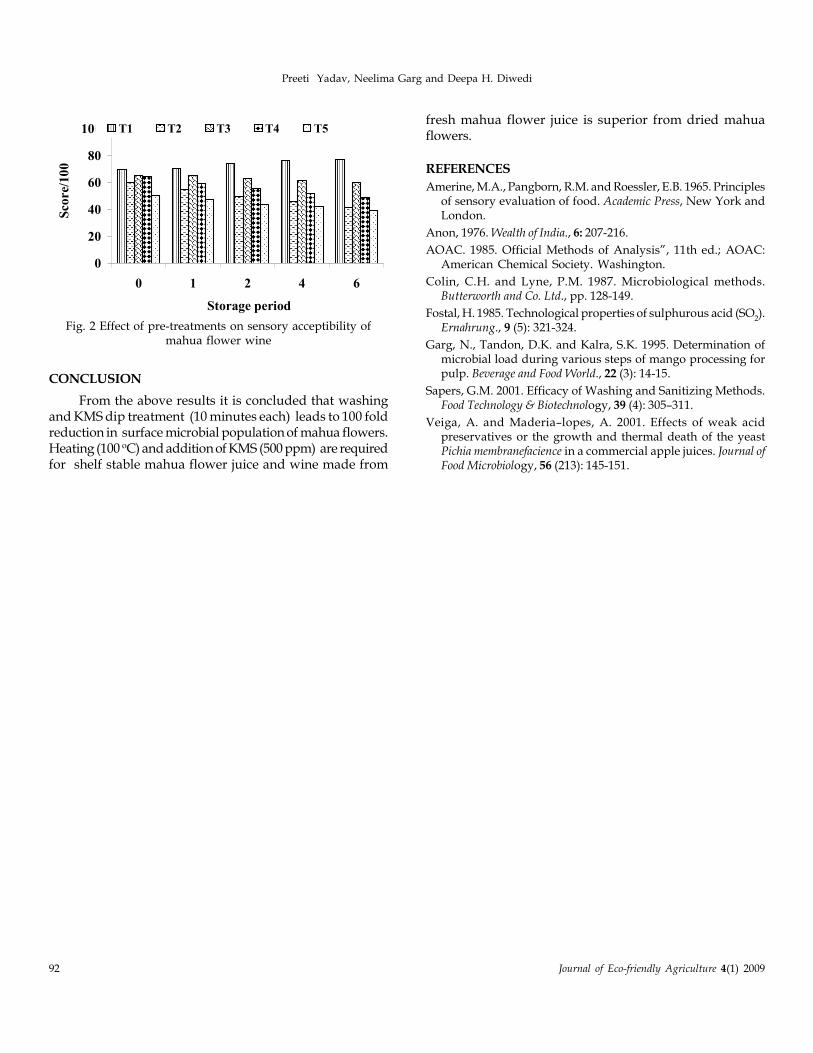
92 Journal of Eco-friendly Agriculture 4(1) 2009
Preeti Yadav, Neelima Garg and Deepa H. Diwedi
CONCLUSION
From the above results it is concluded that washingand KMS dip treatment (10 minutes each) leads to 100 foldreduction in surface microbial population of mahua flowers.Heating (100 oC) and addition of KMS (500 ppm) are requiredfor shelf stable mahua flower juice and wine made from
Fig. 2: Effect of pretreatments on sensory
acceptibility of mahua flower wine
0
20
40
60
80
100
0 1 2 4 6
Storage period
Sco
re/1
00
T1 T2 T3 T4 T5fresh mahua flower juice is superior from dried mahuaflowers.
REFERENCES
Amerine, M.A., Pangborn, R.M. and Roessler, E.B. 1965. Principlesof sensory evaluation of food. Academic Press, New York andLondon.
Anon, 1976. Wealth of India., 6: 207-216.
AOAC. 1985. Official Methods of Analysis”, 11th ed.; AOAC:American Chemical Society. Washington.
Colin, C.H. and Lyne, P.M. 1987. Microbiological methods.Butterworth and Co. Ltd., pp. 128-149.
Fostal, H. 1985. Technological properties of sulphurous acid (SO2).
Ernahrung., 9 (5): 321-324.
Garg, N., Tandon, D.K. and Kalra, S.K. 1995. Determination ofmicrobial load during various steps of mango processing forpulp. Beverage and Food World., 22 (3): 14-15.
Sapers, G.M. 2001. Efficacy of Washing and Sanitizing Methods.Food Technology & Biotechnology, 39 (4): 305–311.
Veiga, A. and Maderia–lopes, A. 2001. Effects of weak acidpreservatives or the growth and thermal death of the yeastPichia membranefacience in a commercial apple juices. Journal ofFood Microbiology, 56 (213): 145-151.
Fig. 2 Effect of pre-treatments on sensory acceptibility ofmahua flower wine
©2009
Influence of Integrated Nutrient Management on soil carbonmineralization in Maize-Wheat cropping system of typichaplustepts
Gayatri Verma and A.K. Mathur
Department Agricultural Chemistry and Soil Science, Rajasthan College of Agriculture, Udaipur, Rajasthan 313301, India* email ID – gayatriverma [email protected]
Journal of Eco-friendly Agriculture 4(1): 93-95 : 2009
Long-term field experiment on sandy clay loam soilswith maize-wheat cropping system at Instructional Farm,Rajasthan College of Agriculture, Udaipur were studied. Theclimate of the experimental site is sub-tropical, characterizedby mild winters and distinct summers. The mean annualrainfall of the region varies from 650 to 750 mm. Theexperiment consisted of 12 treatments replicated four timesin a randomized block design. These are : T
1-100% NPK
(based on soil test values); T2-100% NPK + Zn; T
3-100% NPK
+ S; T4-100% NPK + Zn + S; T
5-100% NPK + seed treatment
with Azotobacter; T6 -FYM @ 20 t ha-1; + (100% NPK - NPK
of FYM); T7 -100% NPK + FYM @ 20 t ha-1; T
8 - FYM @ 20 t
ha-1; T9
-100% NPK; T10
100% NP; T11
- 100% N and T12
-control. The details of the experimental site are presented inTable 1.
Fresh soil samples at the harvest of maize crop (2004-05) and wheat crop (2005-06) were drawn to assess carbonmineralization. Carbon mineralization was determined bythe method of Jenkinson and Powlson (1976). freshly drawnsoil samples were incubated for 3 days, fumigated withchloroform for about 18 to 24 hours and after 24 hoursfumigation, chloroform was removed by repeatedevacuations. 50 g of soil sample was placed in Mason jar.Approximately 1.0 ml of water was added to the bottom ofeach mason jar to prevent soil desiccation. The soil samplewas then incubated in closed gas tight mason jar for a periodof 10 days.
A vial containing 1.0 ml of 2.0 M NaOH was placedinto each meason jar. Blank jar without soil was similarlymaintained during the incubation period. After theincubation period the vials were titrated to determine thetotal C respired. Then an amount of BaCl
2 equivalent to the
initial quantity of NaOH was added to each vial(respirometer). The contents of the respirometer was thentitrated using phenolphthalein indicator with 0.1 M HCl.The amount of CO2-C evolved during the incubation wascalculated from the volume of acid needed to attain pH 7from the blank minus that required for the samples.
Soil carbon is one of the most important indicators ofsoil quality because of its role in physical, chemical and
SHORT COMMUNICATION
Table 1. Initial physical and chemical characteristics of soil
Characteristics Value
A. Mechanical composition
Sand (%) 35.3
Silt (%) 39.1
Clay (%) 25.6
Textural class Sandy clay loam
Taxanomic class Typic Haplustepts
B. Physical:
Bulk density (Mg m-3) 1.48
Particle density (Mg m-3) 2.63
Hydraulic conductivity (cm hr-1) 0.278
Field capacity (%) 29.40
Permanent wilting point (%) 6.45
Available water (%) 22.95
C. Chemical:
pH (1:2) 8.2
Electrical conductivity (dS/m at 25oC)
0.48
CEC [cmol (p+) kg-1] 15.50
Organic carbon (%) 0.85
CaCO3 (%) 3.28
Available nitrogen (kg ha-1) 427.75
Available phosphorus (kg ha-1) 22.4
Available potassium (kg ha-1) 671
Available sulphur (mg kg-1) 21.0
biological processes. Soil carbon pool generally consists ofseries of fractions from very active to passive and slow pool.These fractions act as highly sensitive indicators of soilfertility ad productivity. Long-term fertilizer experimentshave consistently shown the benefits of organic manuring,adequate fertilization and crop rotations on soil carboncontent (Reeves, 1997). Since information on the carbonsequestration is scanty, there is dire need of conductingrelevant investigations. Keeping in view this fact, the presentstudy on effect of integrated nutrient management on carbon
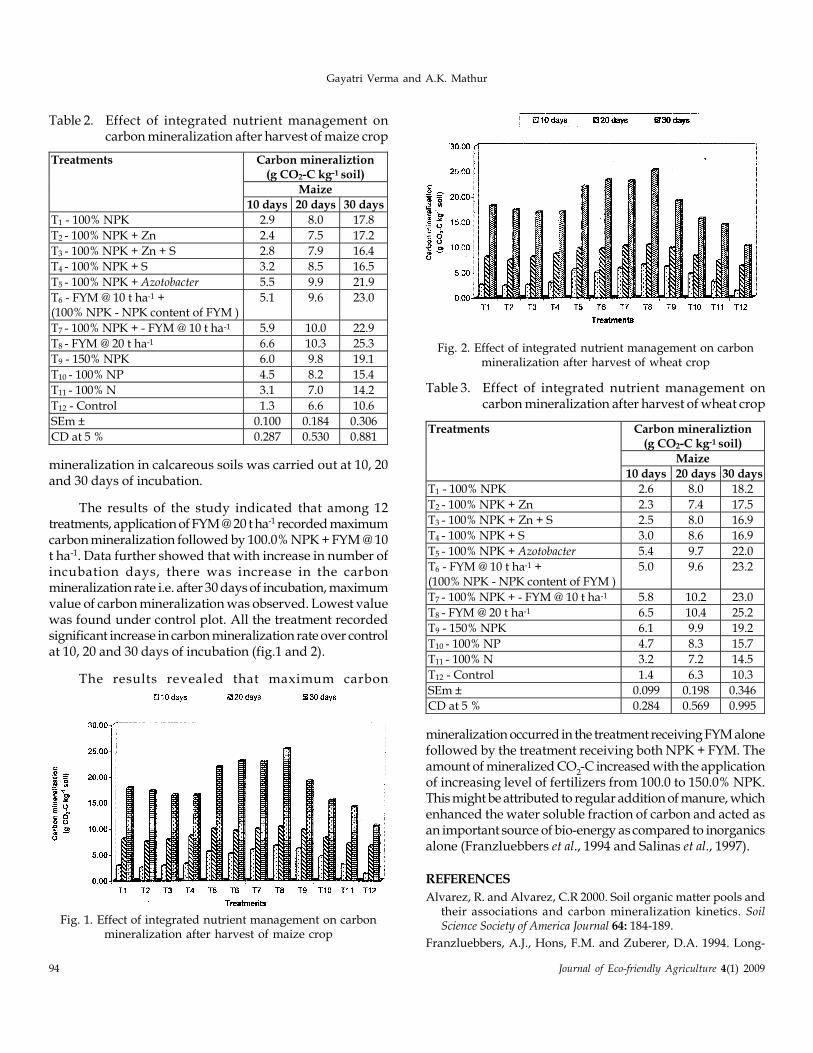
94 Journal of Eco-friendly Agriculture 4(1) 2009
Gayatri Verma and A.K. Mathur
mineralization in calcareous soils was carried out at 10, 20and 30 days of incubation.
The results of the study indicated that among 12treatments, application of FYM @ 20 t ha-1 recorded maximumcarbon mineralization followed by 100.0% NPK + FYM @ 10t ha-1. Data further showed that with increase in number ofincubation days, there was increase in the carbonmineralization rate i.e. after 30 days of incubation, maximumvalue of carbon mineralization was observed. Lowest valuewas found under control plot. All the treatment recordedsignificant increase in carbon mineralization rate over controlat 10, 20 and 30 days of incubation (fig.1 and 2).
The results revealed that maximum carbon
Table 2. Effect of integrated nutrient management oncarbon mineralization after harvest of maize crop
Carbon mineraliztion (g CO2-C kg-1 soil)
Maize
Treatments
10 days 20 days 30 days
T1 - 100% NPK 2.9 8.0 17.8
T2 - 100% NPK + Zn 2.4 7.5 17.2
T3 - 100% NPK + Zn + S 2.8 7.9 16.4
T4 - 100% NPK + S 3.2 8.5 16.5
T5 - 100% NPK + Azotobacter 5.5 9.9 21.9
T6 - FYM @ 10 t ha-1 + (100% NPK - NPK content of FYM )
5.1 9.6 23.0
T7 - 100% NPK + - FYM @ 10 t ha-1 5.9 10.0 22.9
T8 - FYM @ 20 t ha-1 6.6 10.3 25.3
T9 - 150% NPK 6.0 9.8 19.1
T10 - 100% NP 4.5 8.2 15.4
T11 - 100% N 3.1 7.0 14.2
T12 - Control 1.3 6.6 10.6
SEm ± 0.100 0.184 0.306
CD at 5 % 0.287 0.530 0.881
Fig. 1. Effect of integrated nutrient management on carbonmineralization after harvest of maize crop
Fig. 2. Effect of integrated nutrient management on carbonmineralization after harvest of wheat crop
mineralization occurred in the treatment receiving FYM alonefollowed by the treatment receiving both NPK + FYM. Theamount of mineralized CO
2-C increased with the application
of increasing level of fertilizers from 100.0 to 150.0% NPK.This might be attributed to regular addition of manure, whichenhanced the water soluble fraction of carbon and acted asan important source of bio-energy as compared to inorganicsalone (Franzluebbers et al., 1994 and Salinas et al., 1997).
REFERENCES
Alvarez, R. and Alvarez, C.R 2000. Soil organic matter pools andtheir associations and carbon mineralization kinetics. SoilScience Society of America Journal 64: 184-189.
Franzluebbers, A.J., Hons, F.M. and Zuberer, D.A. 1994. Long-
Table 3. Effect of integrated nutrient management oncarbon mineralization after harvest of wheat crop
Carbon mineraliztion (g CO2-C kg-1 soil)
Maize
Treatments
10 days 20 days 30 days
T1 - 100% NPK 2.6 8.0 18.2
T2 - 100% NPK + Zn 2.3 7.4 17.5
T3 - 100% NPK + Zn + S 2.5 8.0 16.9
T4 - 100% NPK + S 3.0 8.6 16.9
T5 - 100% NPK + Azotobacter 5.4 9.7 22.0
T6 - FYM @ 10 t ha-1 + (100% NPK - NPK content of FYM )
5.0 9.6 23.2
T7 - 100% NPK + - FYM @ 10 t ha-1 5.8 10.2 23.0
T8 - FYM @ 20 t ha-1 6.5 10.4 25.2
T9 - 150% NPK 6.1 9.9 19.2
T10 - 100% NP 4.7 8.3 15.7
T11 - 100% N 3.2 7.2 14.5
T12 - Control 1.4 6.3 10.3
SEm ± 0.099 0.198 0.346
CD at 5 % 0.284 0.569 0.995

Journal of Eco-friendly Agriculture 4(1) 2009 95
Influence of Integrated Nutrient Management on soil carbon mineralization in Maize-Wheat cropping system of typic haplustepts
term changes in soil carbon and nitrogen pools in wheatmanagement systems. Soil Society of America Journal 58: 1693-1645.
Jenkinson, D.S. and Powlson, D.S.1976. Effect of biocidal treatmenton metabolism in soil V.A method for measuring soilbiomass. Soil Biology and Biochemistry 8: 209-213.
Reeves, D.W. 1987. The role of soil organic matter in maintainingsoil quality in continuous cropping systems. Soil and Research43: 131-167.
Salinas, J.R., Hons, F.M and Matocha, J.E. 1997. Long term effectsof tillage and fertilization on soil organic matter dynamics.Soil Science society of America Journal 61: 152-159.
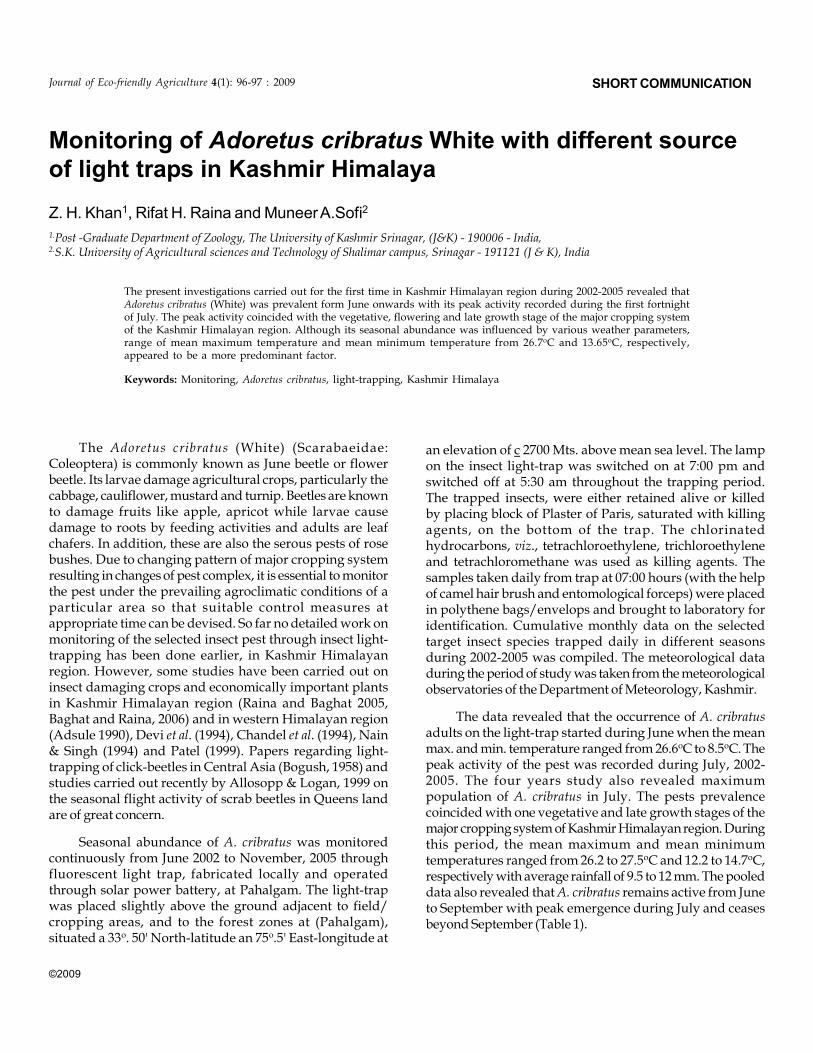
©2009
Monitoring of Adoretus cribratus White with different sourceof light traps in Kashmir Himalaya
Z. H. Khan1, Rifat H. Raina and Muneer A.Sofi2
1.Post -Graduate Department of Zoology, The University of Kashmir Srinagar, (J&K) - 190006 - India,2.S.K. University of Agricultural sciences and Technology of Shalimar campus, Srinagar - 191121 (J & K), India
The present investigations carried out for the first time in Kashmir Himalayan region during 2002-2005 revealed thatAdoretus cribratus (White) was prevalent form June onwards with its peak activity recorded during the first fortnightof July. The peak activity coincided with the vegetative, flowering and late growth stage of the major cropping systemof the Kashmir Himalayan region. Although its seasonal abundance was influenced by various weather parameters,range of mean maximum temperature and mean minimum temperature from 26.7oC and 13.65oC, respectively,appeared to be a more predominant factor.
Keywords: Monitoring, Adoretus cribratus, light-trapping, Kashmir Himalaya
Journal of Eco-friendly Agriculture 4(1): 96-97 : 2009
The Adoretus cribratus (White) (Scarabaeidae:Coleoptera) is commonly known as June beetle or flowerbeetle. Its larvae damage agricultural crops, particularly thecabbage, cauliflower, mustard and turnip. Beetles are knownto damage fruits like apple, apricot while larvae causedamage to roots by feeding activities and adults are leafchafers. In addition, these are also the serous pests of rosebushes. Due to changing pattern of major cropping systemresulting in changes of pest complex, it is essential to monitorthe pest under the prevailing agroclimatic conditions of aparticular area so that suitable control measures atappropriate time can be devised. So far no detailed work onmonitoring of the selected insect pest through insect light-trapping has been done earlier, in Kashmir Himalayanregion. However, some studies have been carried out oninsect damaging crops and economically important plantsin Kashmir Himalayan region (Raina and Baghat 2005,Baghat and Raina, 2006) and in western Himalayan region(Adsule 1990), Devi et al. (1994), Chandel et al. (1994), Nain& Singh (1994) and Patel (1999). Papers regarding light-trapping of click-beetles in Central Asia (Bogush, 1958) andstudies carried out recently by Allosopp & Logan, 1999 onthe seasonal flight activity of scrab beetles in Queens landare of great concern.
Seasonal abundance of A. cribratus was monitoredcontinuously from June 2002 to November, 2005 throughfluorescent light trap, fabricated locally and operatedthrough solar power battery, at Pahalgam. The light-trapwas placed slightly above the ground adjacent to field/cropping areas, and to the forest zones at (Pahalgam),situated a 33o. 50' North-latitude an 75o.5' East-longitude at
an elevation of c 2700 Mts. above mean sea level. The lampon the insect light-trap was switched on at 7:00 pm andswitched off at 5:30 am throughout the trapping period.The trapped insects, were either retained alive or killedby placing block of Plaster of Paris, saturated with killingagents, on the bottom of the trap. The chlorinatedhydrocarbons, viz., tetrachloroethylene, trichloroethyleneand tetrachloromethane was used as killing agents. Thesamples taken daily from trap at 07:00 hours (with the helpof camel hair brush and entomological forceps) were placedin polythene bags/envelops and brought to laboratory foridentification. Cumulative monthly data on the selectedtarget insect species trapped daily in different seasonsduring 2002-2005 was compiled. The meteorological dataduring the period of study was taken from the meteorologicalobservatories of the Department of Meteorology, Kashmir.
The data revealed that the occurrence of A. cribratusadults on the light-trap started during June when the meanmax. and min. temperature ranged from 26.6oC to 8.5oC. Thepeak activity of the pest was recorded during July, 2002-2005. The four years study also revealed maximumpopulation of A. cribratus in July. The pests prevalencecoincided with one vegetative and late growth stages of themajor cropping system of Kashmir Himalayan region. Duringthis period, the mean maximum and mean minimumtemperatures ranged from 26.2 to 27.5oC and 12.2 to 14.7oC,respectively with average rainfall of 9.5 to 12 mm. The pooleddata also revealed that A. cribratus remains active from Juneto September with peak emergence during July and ceasesbeyond September (Table 1).
SHORT COMMUNICATION
Journal of Eco-friendly Agriculture 4(1) 2009 97
Monitoring of Adoretus cribratus (White) Scarabaeidae: Coleoptera with different source of light traps in Kashmir Himalaya
The present findings indicated that the mean maximumtemperature (26.7oC) and mean min. (temp 13.6oC) as wellas rainfall of 10 mm proved conducive for the multiplicationof the A. criticus. Correlations of light-trap catches of otherinsect pests with weather parameters have also been reportedby Bhatanagar & Saxena, 1995.
The authors are thankful to Head Department ofZoology, University of Kashmir for providing necessaryfacilities. The help rendered by Entomology experts Dr. V.VRamamurthy, IARI, New Delhi and Dr. Sudhir Singh,Scientist-C, FRI Deharadun is duly acknowledged. Thanksare also due to Meteorology Department, Kashmir forproviding meterological data.
REFERENCES
Adsule. V.M., Patial, S.M. & Kharie, V.M. 1990. Relativeabundance of scarabaeid beetles on light-trap. Journal ofMaharashtra Agricultural University, 15: 344-346.
Allosopp, P.G & Logan, D.P. 1999: Seasonal flight activity ofScarab beetles Coleoptera: Scarabaeidae associated withsugarcane in queens land. Australian Journal of Entomology 38:219-226
Bhagat, R.C and Raina, R.H. 2006: Report on the insects collectedthrough light traps from agricultural and horticultural plantsfrom (Pahalgam Jammu & Kashmir) Journal of Insect Science,19: 37-42
Bhatanagar, Anju & R. Saxena 1995. Environmental correlationsof population build up of rice insect pest through light catchesOryza, 36: 241-245
Bogush, P.P. 1958: Some results of collecting click-beetles(Coleoptera: Elateridae) with light-traps in central AsiaEntomol. Obozr. 31: 347-57. Entomological Review, 37: 291-299.
Chandel, R.S., Gupta, P.R. & Chander, R. 1994: diversity ofscarahaeid beetles in mid hills of Himachal Pradesh, HimachalJournal of Agricultural Research 20: 98-101
Devi, N., Rah, D, & Kashyap, N.P. 1994: Relative abundance ofsome white-grub beetles. Journal of Entomological Research, 12:139-142
Nain, P & Singh, J. 1994: Importance of weather factors on lighttrap catches of Searabaeid beetles (Col. scarabaeidae) GicrnaleItalianodi Entomologia, 7: 137-141
Patel, B.D. and Patel G.M. 1999: first record of new species ofwhite grubs, Gujrat Agricultural Research. Journal, 25: 110-111
Raina, R.H. and Bhagat, R.C: 2005 Light trapping study of insectsdamaging agricultural and Forestry plantation in SrinagarKashmir Bullatin of Agricultural Science, 49:53-53.
Table 1. Seasonal abundance of A. critratus adults during 2002-2005 in Kashmir Himalayan region.
Meteorological data
Temperature oC
Year Month No. of adults collected
Max. Min.
Rainfall (mm)
2002 June nil 25.0 8.7 14.0
July 60 26.9 12.2 12.2
Aug. 15 26.1 14.3 11.0
Sept. 11 21.6 7.1 15.0
2003 June nil 25.6 7.7 10.0
July 45 26.2 13.4 11.0
Aug. 22 25.4 12.1 4.6
Sept. 8 22.9 9.3 5.0
2004 June 59 26.6 8.5 12.0
July 252 26.5 14.3 9.5
Aug. 85 25.7 13.6 7.5
Sept. 77 22.2 8.2 10.0
2005 June 58 26.6 7.3 12.0
July 260 27.5 14.7 9.5
Aug. 89 26.3 14.0 7.7
Sept. 57 9.2 9.2 10.5
©2009
Preliminary observations on the natural enemies of Lymantriaobfuscata Walker infesting Willow tree in Kashmir Valley
Zakir Hussain, Muneer Sofi , Rifat Raina and Mudasir
Division of EntomologySher-e-Kashmir University of Agricultural Sciences and Technology, Shalimar campus, Srinagar, 1911 21 (J & K), India
Journal of Eco-friendly Agriculture 4(1): 98 : 2009
The Indian Gypsy moth, Lymantria obfuscata Walker[Lymantriidae :Lepidoptera] is a major pest of Willowcausing defoliation. Natural enemies of the pest were studiedin Kashmir with objective of collecting informations on pupalparasitoids when there is pesticide umbrella found in allagro habitates during 2006-07.From two study sites as manyas 895 pupae were collected and caged. Four pupalparasitoids namely Pimpla sp.(Ichneumonidae:Hymenoptera),Theronia atalantae (Ichneumonidae:Hymenoptera), Brachymeria intermedia Nees (Chalcididae:Hymenoptera) and Brachymeria lasus Walker were recordedfrom all sites.
The findings of the present investigation were more orless in line with observation of Masoodi et al (1986). The
SHORT COMMUNICATION
results of this suggest that pupal parasitoids were found inabundance in valley under social plantation.The parasitoids,Pimpla sp. and B. intermedia Nees were found in greaternumbers at the both sites while T. atalantae and B. lasus Walkerwere less abundant. These observations suggest that thepreponderance of these parasitoids may be utilized againstother major lepidopteran pests infesting different crops inthe valley.
Refrences
Masoodi,M.A, Trali, A.R;Bhat.A.M (1986). Incidence of parasitesof Lymantria obfuscata (Lymantridae : Lepidoptera) in Kashmir-Entomophaga 31940, 401-404.
Guidelines to the Authors
The Journal of Eco-friendly Agriculture is a biannual journal published in English by the Doctor’s Krishi Evam Bagwani Vikas Sanstha, Lucknow, India. Thisjournal is published half yearly in the month of January and July. Journal is devoted to basic and applied aspects of Agriculture, Horticulture,Environmental Science and Human Ecology and welcomes original research papers in these areas. The articles can be published as full research paperor as short communication. The Editorial Board may invite important short reviews from eminent scientists working in the respective fields. Authorsmay note that the articles submitted to the Journal of Eco-friendly Agriculture are not submitted simultaneously to any other journal for publication.All Research papers and review articles submitted for publication will be reviewed by referees. Authors may provide the names of at least five refereeswith complete postal address, who can be approached to review the paper. However, final decision will rest with the Editorial Board.
Content: The articles published in this journal should be related to eco-friendly agriculture viz; bio-pesticides, bio-agents, bio-fertilizers, IPM, IDM,INM and other allied eco-friendly areas. Special emphasis must be laid on the qualitative aspects of modern agro practices interventions vis-a-visenvironmental sustainaibility at large.
Preparation of manuscript : Articles (3 copies) should be computer typed in double space in font size 12 (Arial or New Times Roman) on one sideof good quality bond paper in A 4 size with one inch margin on all four sides. After acceptance of the paper, the revised article in final computerisedtyped format (one original and two hard copies) should be sent along with a CD. Use a new CD and ensure that the electronic version is free of virus.Mention file name, name of the software and version used and name of the corresponding author. File format of the text should be MS Word.
Full research paper should be divided into following headings: Title (bold, upper lower case font size 16), author’s name (font size 14, upperlower case), complete address of the author(s) (italized, font size 12) and e-mail address (if available). Short communications should not exceedfour typed pages and should contain title, author’s address, e-mail address (if available), text, table, figures, acknowledgments and references. In fullpaper title should be short, brief and clear. It should be written in bold. Title will be followed by author’s full name with initials. If there are more thanone author, use ‘and’ before the last name. Title, author(s) name and address should be written in sentence with left margin aligned. Two years fielddata are the minimum requirement for publication of full paper. However for laboratory trials sufficient replications of the treatments are required.
Title : It should normally be short running into not more than 6-8 words.
Abstract: It should cover the main findings of the research paper and should not exceed 150 words.
Key words: Maximum of 6 words. Separate the words with comma (,). It is for both, full and short communication.
Text : It should be divided into Introduction, Materials and Methods, Results and Discussion, Conclusions Acknowledgements and References.Footnotes should be avoided. New paragraphs should be indicated by clear indentation. Metric units of weights and measures should be used.Tables, figures and legends should be given on separate pages.
Introduction: It should be brief with clear objectives and justification for taking up the study. This section should have a very short review on workdone in the concerned area. However introduction heading is not to be given.
Materials and Methods: All procedures followed in the experimentation should be indicated in brief. Methods adopted from other references shouldbe indicated by quoting proper references. If a new method is included, it should be given in detail so that other workers may be able to use it.
Results and Discussion: This should be combined to avoid repetition. Do not describe the results already indicated in table or graph but blend it withthe discussion with supporting references. All the data presented in the paper should be statistically analysed.
Conclusion : A short conclusion may be written.
Acknowledgments: This should appear after the main text.
References: Literature cited should be arranged alphabetically (names of authors) with year, title of paper, name of the journal, volume and pages.Citation of personal communication should be avoided but if necessary, it may be cited in the text as: (G.S. Fraenkel-personal communication). Thisshould not be included in the reference list. Write full name of the Journal. For e.g., references should be quoted as follows:
Mathur, A.C.; Krishnaiah, K. and Tandon, P.L. 1974. Control of tomato fruit borer (Heliothis armigera Hüb.). Pesticides, 8 : 34-35.
Pasricha, N. S. 1998. Integrated nutrient and water management for sustainable crop production. In: Ecological Agriculture and Sustainable Development,Vol. I. (eds. G. S. Dhaliwal, N. S. Randhawa, R. Arora and A.K. Dhawan). Indian Eco. Soc. and CRPID, Chandigarh, p. 521-535.
Book by one author:
Cressie, N.A.C. 1993. Statistics for Spatial Data. John Wiley, New York, 900 p.
Book edited by more than one author:
Pedigo, L.P. and Nuntin, G.D. (eds.). 1994. Handbook of Sampling Methods for Arthropods in Agriculture. CRC Press, Boca Raton, Florida, 714 p.
Page charges: All authors should be the member of this Sanstha (Society) before or during the submission of research paper/review article.Responsibility of membership fee would rest with senior author/next author, in case any author(s) has left the institutions, where the studies were
conducted. It should be sent in form of DD in favour of Doctor’s Krishi Evam Bagwani Vikas Sanstha payable at Lucknow. Research paper/Review will not be printed unless the dues are cleared.
The Society will bear the cost of publication. However, due to increase in postal charges and printing costs, a uniform amount of Rs. 300/- (US $ 20)for each full article and Rs. 200/- (US $ 15) for the short communications will be charged.
Reprints: Fifty reprints may be made available to authors at Rs 200/- (US $ 5) per printed page.
Declaration: Interpretations and data presented in the research paper and reviews will be the sole responsibility of the author(s) and not the Journalof Eco-friendly Agriculture. Mention of the proprietary products does not necessarily mean its endorsement by the Sanstha (Society).
Use of Materials Published in the Journal: Persons interested to use the illustrations published in the Journal of Eco-friendly Agriculture shouldobtain permission from Chairman, Doctor’s Krishi Evam Bagwani Vikas Sanstha and must provide a line crediting author(s) and Journal of Eco-friendlyAgriculture as a source of material. Original manuscripts and other related materials are discarded one month after publication.
CORRESPONDING ADDRESS FOR SUBMISSION OF THE MANUSCRIPT
Dr. R.P. Srivastava, Chairman, Doctor’s Krishi Evam Bagwani Vikas Sanstha,A-601, Sector-4, Indira Nagar,Lucknow-226 016 (U.P.) India,Phone No. 91-522-2342815 (O), 3251389 (R), Fax 91-522-2351389, e-mail: [email protected]. Website : ecoagrijournal.com
Please Provide E-mail address in All Correspondence
Summary Proceedings and Recommendations : National Conference on Eco-friendly Approaches inSustainable Agriculture and Horticulture Production ...................................................................................................................... 1
Organic Farming
Organic farming practices in white onion (Allium cepa L.) - V.Sankar, D.Veragagavathatham and M.Kannan ............................... 17
Effect of different combinations of organic manure on growth and yield of ginger (Zingiber officinale Rosc.). - S.P. Singh,R. Chaudhary and A.K. Mishra ............................................................................................................................................................ 22
Comparison of average observed ESP and salt dynamics with the empirical equations and models - M.S.Kahlon,K.L.Khera and A.S.Josan............................................................................................................................................................................ 25
Biomediated release of phosphorus in rice growing soils of Jammu - Arvind Singh and A K Bhat ................................................. 30
Effect of vermicompost amended alluvial soil on growth and metabolic responses of rice (Oryza sativa L.) plants -S.N Panday and Amalesh Yadav .............................................................................................................................................................. 35
Genetics
Gene effects on yield in Maize under different environmental conditions - Ajaz A. Lone and M.Z.K. Warsi ................................ 38
F2 Population size for breeding for resistance to root and stalk lodging in Maize (Zea mays L) - D.K. Verma and
K.R.Dhiman ............................................................................................................................................................................................... 41
Entomology
In vitro Bio-efficacy of Horticultural mineral oils against Sanjose scale, Quadraspidiotus perniciosus (Comstock),on Apple in Kashmir - M.A. Parrey, A.Q. Rather, N.A. Wani, A.R. Wani and Asmat Maqbool ....................................................... 45
Dose and time mortality response on susceptibility of Tetranychus urticae Koch. (Tetranychidae: Acari) to azadirachtinformulations - N. Kumaran and S. Douressamy ................................................................................................................................... 49
Comparative persistance toxicity of insecticides/ biopesticides against Helicoverpa armigera on chickpea -Ritu Srivastava and K.D. Upadhayay ..................................................................................................................................................... 54
Individual and joint effect of endosulfan and biolep on tobacco caterpillar, Spodoptera litura (Fab.) - Haidar Ali andM. Shafiq Ansari ........................................................................................................................................................................................ 57
Plant Pathology
Eco-friendly management of mango malformation (Fusarium moniliforme var. subglutinans = Fusarium subglutinans)through certain plant leaf extracts - P. Kumar, A. K. Misra, B. K. Pandey, R. A. Ram, S. P. Misra and D. R. Modi ..................... 61
Eco-friendly approach for the management of Bacterial Soft Rot of Radish seed crop - M. R. B. Raju, V. Pal and I. Jalali ......... 65
Effect of two ectomycorrhiza inoculants on growth performance and nutrient uptake of Himalayan Cypress(Cupressus torulosa) seedlings - M.M. Dar , M.A.Khan , M. Y. Zargar and T.H.Masoodi .............................................................. 69
In vitro performance of compost water extracts on Grapevine leaf blight pathogen - K. Praveena Deepthi, T. Vithal Reddyand T. Narsi Reddy ................................................................................................................................................................................... 73
Evaluation of Eco-friendly antagonists isolated from leaf based liquid biodynamic pesticides against guava wiltdisease caused by Fusarium sp. - V. K. Gupta, A. K. Misra, B. K. Pandey, S. P. Misra and U. K. Chauhan .................................... 77
Nematology
Interaction effect of Heterorhabditis indica and Arbusular Mycorhizal Fungus, Glomus intraradices on thedevelopment and reproduction of Meloidogyne incognita (Kofoid and white) in Tomato - S.S Husaini andKiran Kumar, K.C. ..................................................................................................................................................................................... 80
Post Harvest Technology
Effect of herbal wax on ripening behaviour and surface microbial load of Mango - Neelima Garg, B.P.Singh andDeepak Sarolia ........................................................................................................................................................................................... 85
Standardization of pre-treatment conditions for Mahua wine preparation - Preeti Yadav, Neelima Garg andDeepa H. Diwedi ........................................................................................................................................................................................ 88
Short Communication
Influence of Integrated Nutrient Management on soil carbon mineralization in Maize-Wheat cropping system oftypic haplustepts - Gayatri Verma and A.K. Mathur .......................................................................................................................... 93
Monitoring of Adoretus cribratus White with different source of light traps in Kashmir Himalaya - Z. H. Khan,Rifat H. Raina and Muneer A.Sofi ............................................................................................................................................................ 96
Preliminary observations on the natural enemies of Lymantria obfuscata walker infesting Willow tree inKashmir Valley - Zakir Hussain, Muneer Sofi , Rifat Raina and Mudasir .......................................................................................... 98
Contents
Related Documents