report no. 95/52 I voc emissions from external floating roof tanks: comparison of remote measurements by laser with calculation methods Prepared for the CONCAWE Air Quality Management Group, based on work carried out by the Special Task Force on DIAL measurement of gasoline tanks (AQ/STF-44): B. Smithers (Chairman) J. McKay G. Van Ophem K. Van Parijs L. White (Technical Coordinator) Reproduction permitted with due acknowledgement © CONCAWE Brussels January 1995

Welcome message from author
This document is posted to help you gain knowledge. Please leave a comment to let me know what you think about it! Share it to your friends and learn new things together.
Transcript
report no. 95/52
I
voc emissions from external floating roof tanks: comparison of remote measurements by laser with calculation methods Prepared for the CONCAWE Air Quality Management Group, based on work carried out by the Special Task Force on DIAL measurement of gasoline tanks (AQ/STF-44):
B. Smithers (Chairman) J. McKay G. Van Ophem K. Van Parijs L. White (Technical Coordinator) Reproduction permitted with due acknowledgement © CONCAWE Brussels January 1995

report no. 95/52
II
ABSTRACT
Hydrocarbon emissions from storage tanks are normally calculated using procedures published by the American Petroleum Institute.
A laser-based technique has been used to measure remotely the emissions of
hydrocarbons from floating roof tanks. The measurements obtained have confirmed the accuracy of the recently updated API estimation method for external floating roof tanks.
The ability of the remote measurement technique was demonstrated by comparison
with direct measurements of emissions during the loading of a barge KEYWORDS
API, hydrocarbon emissions, laser, measurement, storage tank, VOC. NOTE
Considerable efforts have been made to assure the accuracy and reliability of the information contained in this publication. However, neither CONCAWE nor any company participating in CONCAWE can accept liability for any loss, damage or injury whatsoever resulting from the use of this information.
This report does not necessarily represent the views of any company participating in
CONCAWE.
report no. 95/52
III
CONTENTS Page
SUMMARY V
1. INTRODUCTION 1
2. OBJECTIVES 3
3. PLANNING 4
3.1. SITE SELECTION AND DESCRIPTION 4
3.2. WIND DATA 5
4. REMOTE MEASUREMENT BY A LASER TECHNIQUE USING DIAL 6
4.1. THE TECHNIQUE 6
4.2. THE EQUIPMENT 6
5. BARGE LOADING 8
5.1. BARGE LOADING EMISSION FACTORS 8
5.2. BARGE LOADING EMISSION MEASUREMENTS 8
5.3. DETAILS OF BARGE LOADING OPERATIONS 9
5.4. DIRECT MEASUREMENTS AND RESULTS 9
6. TANKS 12
6.1. THE API 2517 CALCULATION PROCEDURE 12
6.2 INPUT PARAMETERS FOR CALCULATIONS 13
6.2.1. Tank Details 13 6.2.2. Product True Vapour Pressure 14 6.2.3. Product Bulk Temperature 14 6.2.4. Wind Speed 14 6.2.5 Rim Seal Factors 15 6.2.6. Clingage Factor 15 6.2.7. Tank Throughput 15
6.3. MEASUREMENT PERIODS 15
6.4. DATA OUTPUT 16
report no. 95/52
IV
6.5. ADDENDUM TO API 2517 17
7. COMPARISON OF RESULTS 20
7.1 BARGE EMISSIONS AND DIAL VALIDATION 20
7.2 COMPARISON OF MEASURED AND CALCULATED TANK EMISSIONS 20
8. CONCLUSIONS 23
9. ACKNOWLEDGEMENTS 24
10 REFERENCES 25
APPENDIX SPECTRASYNE LTD. TECHNICAL REPORT NO. TR 9413, STUDIES OF VOC EMISSIONS FROM EXTERNAL FLOATING ROOF TANKS AND BARGE LOADING, NOVEMBER 1993 27

report no. 95/52
V
SUMMARY
Storage tanks are one of the many sources of VOC emissions. In the oil industry, emissions from tanks have traditionally been computed due to the considerable technical difficulties and costs in undertaking individual tank measurements. Calculation procedures derived by the American Petroleum Institute (API), and periodically updated, are used for this purpose world-wide. API Publication 2517 applies to external floating roof (EFR) tanks
Recently a remote measurement technique for VOCs has become available.
Known as DIAL, it uses a laser to measure the concentrations of VOCs downwind of a source of emissions. The VOC emissions can then be determined from the concentration and the wind speed.
On the basis of short-term measurements of tank emissions using DIAL for periods
of less than an hour, there have been suggestions that the API calculation methods for tanks were in serious error with measurements averaging 2.7 times calculated emissions. For this reason, CONCAWE initiated a comparative study in which continuous long-term emission measurements and calculations were to be undertaken for up to 96 hours for a group of five tanks.
In addition, CONCAWE planned to validate the DIAL output by comparison with the
direct measurement of emissions from a vent pipe during the loading of gasoline into a barge. For the barge loading, the emissions measured by DIAL were within 10% of the direct measured value. Also, the value calculated using API Publication 2514A for Marine Vessel Transfer Operations was within 3% of the direct measurement.
In the comparative tank study over 90 hours, the DIAL measurement was 56%
greater than the API 2517 calculated emissions. However, API 2517 was amended in May 1994 with the result that the difference between the DIAL measurement and the Addendum to API 2517 was reduced from 56% to 10%. Emissions were mainly from the guide poles which are fitted, one per tank, to prevent the rotation of the EFRs.
A number of short-term differences between measurements and calculations which
were observed during the study are discussed. Further studies could consider large tanks with significantly lower height-to-diameter ratios than those involved in this study. Possible reasons for the differences observed in this study could be components of any such future studies.
The preliminary planning and continuous technical liaison were considered essential
to the success of this comparative study. In the event, contingency plans aiming for the collection of two sets of comparative data proved vital due to operational problems and adverse meteorology which resulted in only one set of data being useable.
This study indicates that, in the context of the serious concerns which have been
raised, API 2517 provided a reasonable estimate of tank emissions over the measurement period. The calculations based on the Addendum to API 2517 compare well with the DIAL measurements. The Addendum is considered to represent adequately the emissions from the various sources associated with the study tanks and their operation.

report no. 95/52
1
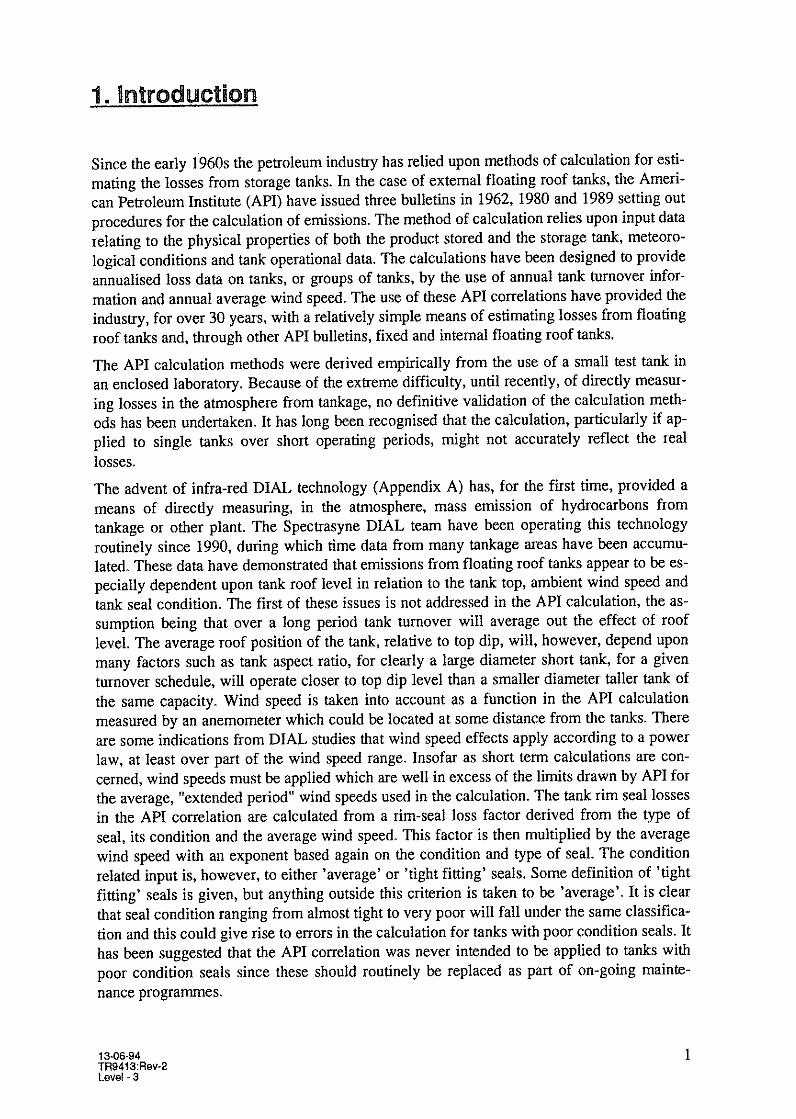
1. INTRODUCTION
Emissions of volatile organic compounds, VOCs, are of concern because together with nitrogen oxides, NOx, they form photochemical oxidants, including ozone. The prevention of a build-up of ozone, a so-called secondary pollutant, in the lower part of the atmosphere can only be controlled by means of the two primary pollutants, VOCs and NOx.
Over recent years, regulatory pressure to reduce VOC emissions has resulted in
controls on both mobile and stationary sources. In the latter case the European Union’s Stage I Directive requires vapour recovery in bulk gasoline storage and distribution. It includes controls on barge loading emissions and it sets an efficiency for tankage emission controls.
On a broader European front, the UN-ECE has published a VOC Protocol. This requires each “major VOC-emitting Party” to the Protocol “to reduce its
national emissions of VOCs by at least 30% by the year 1999, using 1988 levels as a basis or any other annual level during the period 1984 to 1990, which it may specify upon signature of or accession to the present Protocol”.
It is likely that as national emission databases are developed, both for EU and
UN-ECE purposes, the pressures on the oil industry to validate its methodology for the assessment of VOC emissions will increase.
Since the storage of volatile products in fixed roof tanks would lead to the
displacement of vapours in the tank to the atmosphere during tank filling, such products are normally stored in internal or external floating roof tanks which essentially eliminate the vapour space and hence displacement emissions. However some emissions do occur from external floating roof tanks due to the wind effect on roof to tank wall seals and on various roof fittings.
Whilst it has been reported that the apportionment of refinery oil losses, including
emissions from tankage, are too small to be determined by mass balance accounting techniques 1, others have nevertheless attempted to allocate losses in this manner 2. Against this background, the measurement of emissions from tankage has been attempted using a remote laser technique known as DIAL (see Section 4). On the basis of short term measurements by DIAL 3 it has been suggested that the calculation procedure derived by the American Petroleum Institute in Publication API 2517 4 is in serious error. The short term measurements were made over periods of 10 to 48 minutes and covered various groups of different tanks. The ratios of measured emissions to calculated emissions ranged from 0.8 to 5.8, averaging 2.7. For CONCAWE this raised important questions of:
- whether API 2517 was adequate for tanks in the conditions covered by
the Publication; - whether API 2517 was being applied to tanks which were outside its
scope, not least because the poor condition of the tanks was not recognised or acknowledged;
- whether short-term, highly discontinuous measurements by DIAL were representative bearing in mind the fluctuations in both tank emissions and background emissions. The latter have to be subtracted from total measured emissions to obtain the emissions from tankage.
In the overall consideration of refinery oil losses, the apportionment of emissions
between different activities is of particular importance to an operator since it is the operator who has to take appropriate action.
report no. 95/52
2
The availability of DIAL facilities offered CONCAWE an opportunity to attempt the
validation of emission calculations by remote measurement. It was against this background that CONCAWE initiated the project which is the
subject of this report.
report no. 95/52
3
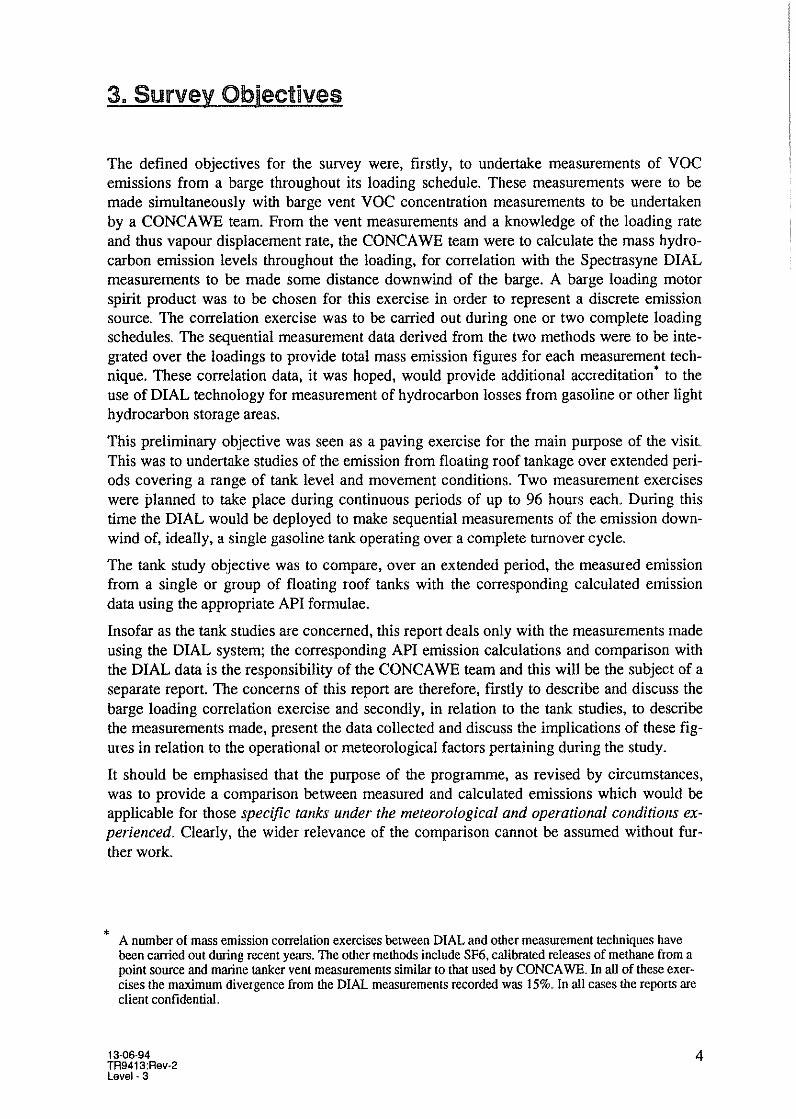
2. OBJECTIVES
The main objective was to use the DIAL technique to measure emissions continuously from a group of external floating roof gasoline tanks during a full turnover of one tank whilst other tanks remained static and to compare the results with emissions calculated independently using API 2517.
An important complementary objective was to validate the capability of DIAL to
measure mass emissions remotely and continuously under the field conditions pertaining. Emissions from a discrete source relative to both space and time, e.g. the vent line of a barge during a loading cycle involving gasoline, were to be measured using DIAL. The results could be compared both with emission data obtained independently using a conventional analytical technique and with the calculation procedure derived by the American Petroleum Institute in Publication API 2514A. 5
report no. 95/52
4
3. PLANNING
From the onset, CONCAWE considered both effective planning and continuous technical liaison throughout the project between the DIAL team and site personnel essential to its success.
In early discussions with Spectrasyne, a company specialising in environmental
monitoring, it was confirmed that the DIAL facility could be operated for up to 96 hours continuously. This meant that the site selected must have tanks with a turnover within this period. Also to avoid the frequent and disruptive relocation of the facility during measurements, both the site and the timing of the project needed to be selected on the basis of a suitable record of sequential wind direction data (ideally the wind direction should not veer over more than 90° during the tank turnover period).
A pre-project visit was made to the potential measurement site by the CONCAWE
Special Task Force, STF: - to select the tanks to be studied; - to assess their physical condition including fittings; and - to note typical operating patterns. Barge loading operations were also assessed during the visit. Spectrasyne also visited the site to ascertain its suitability with respect to access
for the DIAL facility (including parking), the availability of services, and the on-site health and safety requirements.
The visits were essential for both site familiarisation and planning purposes. In the 2 week on-site period, emission measurements during at least 2 tank
turnovers and 2 barge loadings were planned. It was recognised that there would need to be a reasonable break between the 2 periods of up to 96 hours of continuous operation. Advantage would be taken of this break to assess progress in the first trial, any lessons for the second trial, and to carry out any short-term studies of specific events.
During the on-site measurement period it was planned to have STF members
available as necessary round the clock to ensure that a comprehensive log of all events was maintained at all times even if the DIAL measurements were disrupted for any reason. Hourly project schedules covering all the information to be collected were prepared. A PC program based on API 2517 would be available throughout the project to perform provisional calculations at any appropriate opportunity.
In the case of the barge loading exercise, STF members were to be responsible
for the in situ measurement of hydrocarbon content of the vent gas and for its sampling for subsequent laboratory compositional analysis.
Finally, the achievement of the primary objective depended to a large extent on
the prevailing meteorological conditions which could be forecast but not guaranteed. Therefore some risk was involved but planning for two measurement periods reduced this risk.

report no. 95/52
5
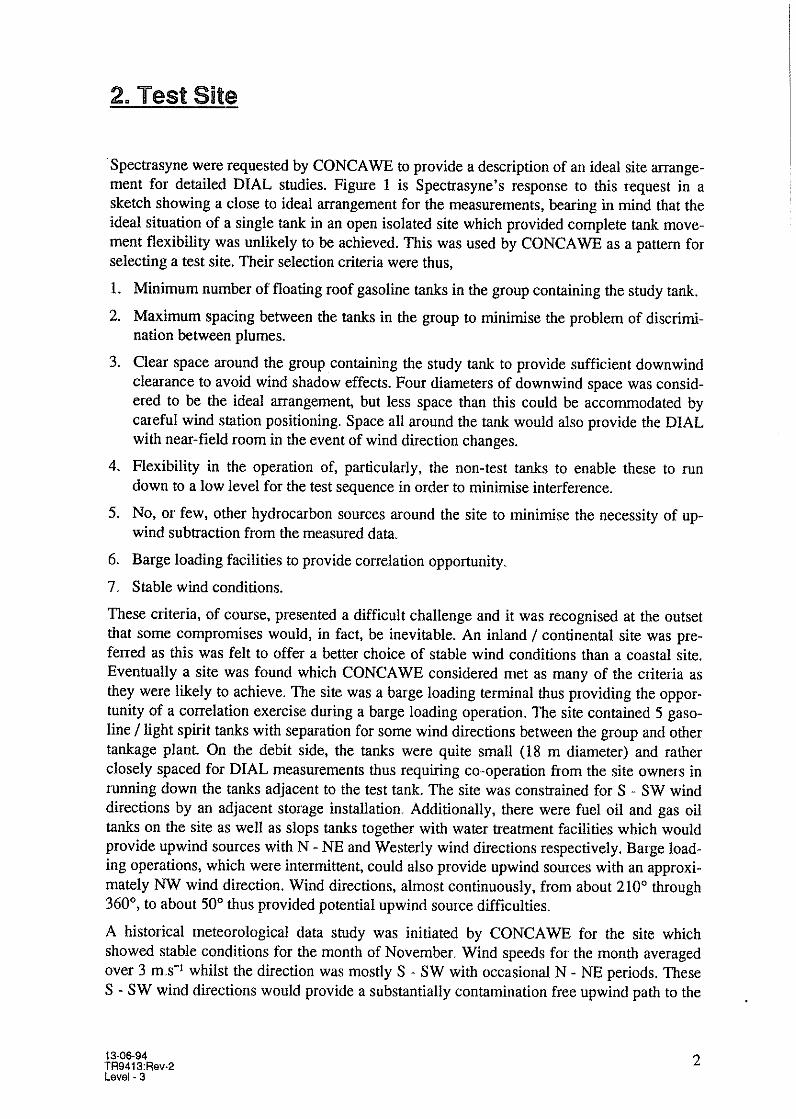
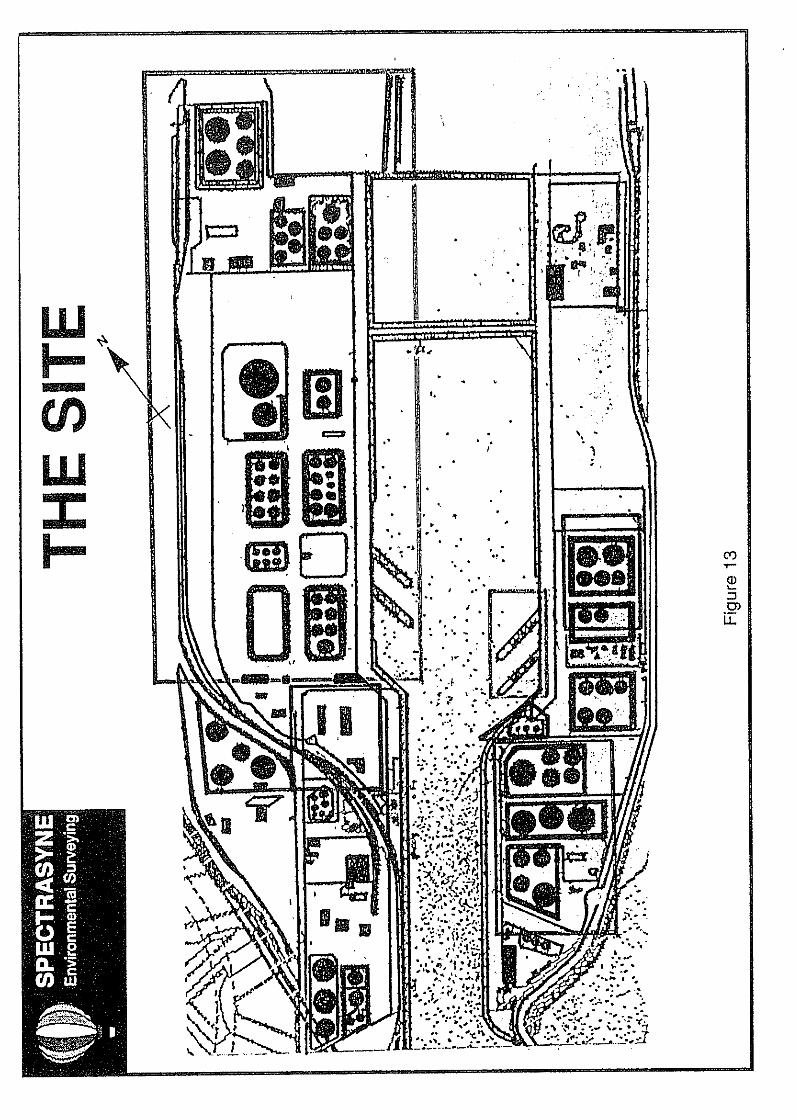
3.1. SITE SELECTION AND DESCRIPTION
The preferred test site was to be a non-coastal site in continental Europe with barge loading facilities. An initial screening of a number of possible sites was undertaken based on photographs and plot plans. The site selected by CONCAWE was based on the ideal measurement criteria defined by Spectrasyne in its report (see Appendix, Figure 1).
The site, although not ideal, was considered to be best suited because of its level topography with a relatively well segregated group of 5 gasoline tanks and consistent wind conditions during a period when the study could be scheduled. The relatively few tanks adjacent to the five “study” tanks hold non-
volatile products. There was also an operational possibility of main- taining products in 4 of the 5 study tanks at low levels during the measure- ment period. The terminal is fed by pipeline. The tanks are used for the temporary storage of
products prior to barge loading. It is also possible to load barges directly by pipeline.
Adjacent facilities include a number of other terminals for petroleum products fed
by barge and/or pipeline, and other industrial facilities.
3.2. WIND DATA
An important factor in considering long-term continuous measurements by DIAL was the meteorological situation at the site. In the absence of multi-year average data, hourly wind and precipitation records for October to December in the previous year were plotted and examined. These showed that winds mainly tended to blow either up or down the river with very variable speeds. Within the other timing constraints, a window of 4 weeks from the second week in November to the first week in December was chosen to avoid prolonged periods of calm. However during this period it was accepted that wind speeds could be intermittently high for a relatively large number of hours.
In the event, for the period of the second measurement period it was reported in the press that “an early winter causes havoc in Europe” due to the
development of a giant anticyclone over Russia. The impact of this is referred to in Section 6.3.
report no. 95/52
6
4. REMOTE MEASUREMENT BY A LASER TECHNIQUE USING DIAL
Two DIAL facilities are available in Europe. One is operated by the UK National Physical Laboratory and one by Spectrasyne, an independent environmental surveying company.
Spectrasyne was selected for the CONCAWE project with a contractual
responsibility for the remote measurement of emissions. The following description of the technique and the equipment is reproduced with
kind permission from the Spectrasyne brochure.
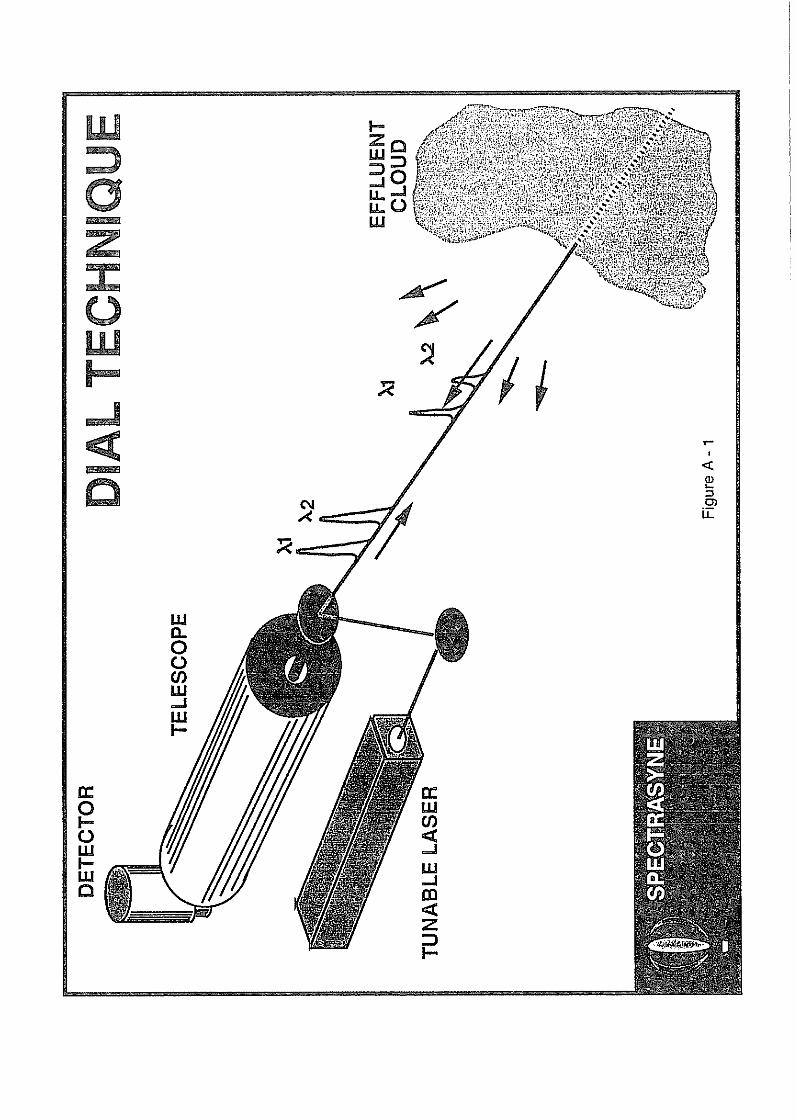
4.1. THE TECHNIQUE
The remote sensing method used by Spectrasyne is a laser based technique known as DIAL, or Differential Absorption LIDAR. LIDAR is itself an acronym for light detection and ranging, and is the optical analogue of the better known radar. Over the last 15 years the technique has been developed and refined in a project involving the UK National Physical Laboratory (NPL) and BP, and is now available as a commercial tool through Spectrasyne.
The Spectrasyne DIAL system is single-ended; this means that the light used to
make the measurement is sent out from the mobile Environmental Monitoring Unit (EMU) and returned for detection back at the EMU by backscattering of the light from particles in the air. In this sense, the dust particles and aerosols are being used as backreflectors, albeit rather weak ones.
DIAL relies on a differential return signal from two closely spaced wavelengths
one of which is absorbed more strongly by the molecule being detected. The size of the differential signal indicates the concentration of the absorbing pollutant molecules along the path being monitored. The laser light is in short pulses and time resolution of the backscattered light gives the range resolution needed in the measurement. Scanning the laser beam across the site allows range resolved concentration measurements to be made across the whole area and 2 and 3 dimensional maps of emissions to be generated. This is one of the few ways of tracing the source of leaks or "fugitive" emissions.
Spectrasyne's DIAL system is one of only two worldwide with the capability of
using tuneable infrared light to measure hydrocarbons. It also has visible and ultraviolet sources for measuring other airborne molecules.
4.2. THE EQUIPMENT
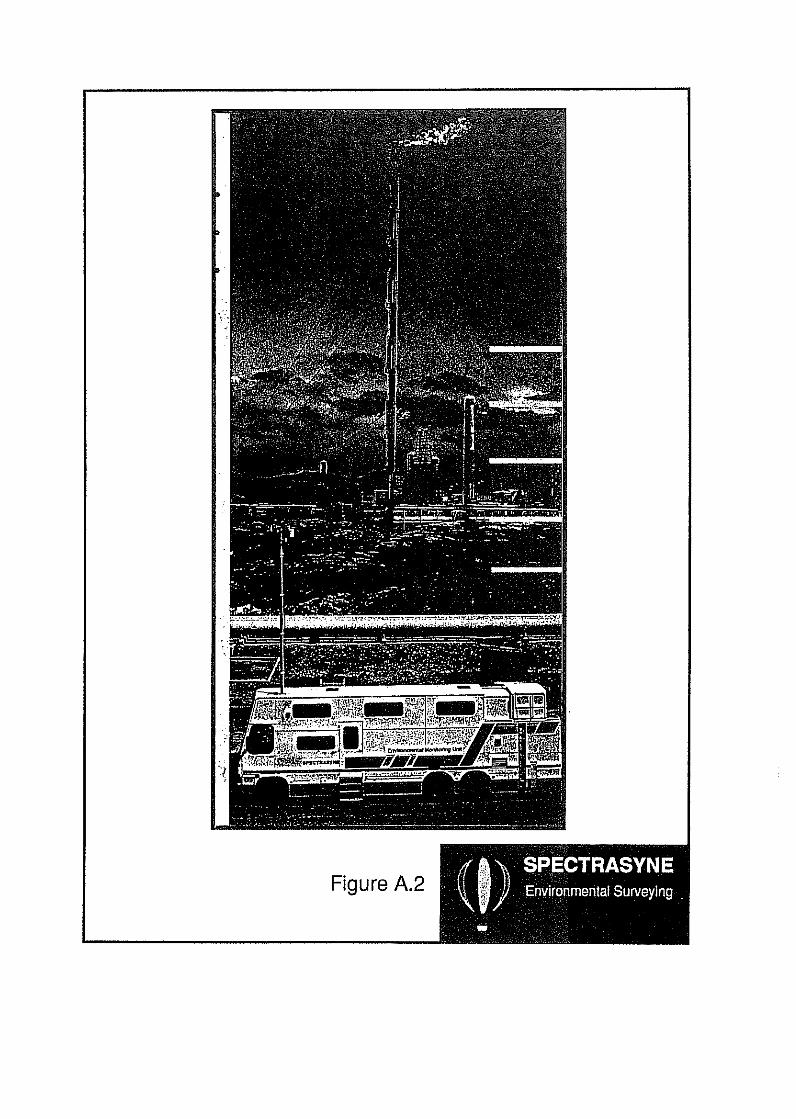
Built in 1990, the Spectrasyne Environmental Monitoring Unit (EMU) is a 12 metre long mobile unit containing all the equipment necessary to make the measurements and process the data collected.

report no. 95/52
7
Lasers The EMU contains two complete Nd: YAG pumped, dual wavelength dye lasers
(see Appendix, Section A3) to provide a multi-wavelength tuneable source for DIAL measurements. Both systems are based around 1.4 Joule, 10 Hz, Nd: YAG lasers. One of the systems is used to generate tuneable ultraviolet and visible radiation and is equipped with frequency doubling and tripling crystals to achieve this. The second system generates a beam of narrow band, tuneable infrared radiation by means of a unique infrared source assembly.
Telescope The output beams from the laser systems are directed into the area being
monitored by means of a computer controlled steering mirror system which rotates in two planes. Collection is via a Cassegrain-type receiving telescope.
Data processing Data processing is performed via a sophisticated, high speed data
communication network which has been developed in parallel with a unique Micro Vax based software package.
The EMU is equipped with an extendable meteorological mast and a number of
mobile, telemetric stations which are used to measure wind speed and direction, temperature and humidity. These are used in conjunction with the DIAL concentration measurements to calculate mass emission fluxes.

report no. 95/52
8
5. BARGE LOADING
5.1. BARGE LOADING EMISSION FACTORS
Inland barges transporting gasoline within Europe are designed to the ADNR 6
regulations. These require that the vapours displaced from all of the cargo tanks during loading operations are collected in a common vapour pipe and either passed to a shore-side vapour recovery system or released to atmosphere through a high velocity vent. The latter is designed to give the vapours sufficient momentum to ensure that they are dispersed well above the barge deck level.
The concentration and composition of the vapours displaced will be dependent on
both the residual vapours from the previous cargo left in the empty tank and from the vapours generated from the cargo being loaded. Residual vapours will not be present if the tanks have been cleaned or gas-freed prior to loading. Where residual vapours exist they will be dominant in the vented vapour during about the first 75% of the full loading period into each cargo tank. 5
Emission factors for barge loading are given in CONCAWE Report 85/54 7,
derived from API 2514A. 5 These factors are shown in Table 1. Table 1 VOC Emission Factors for Barge Loading Operations Previous
Cargo Cargo Tank Condition Average Filling Emissions
(liquid equivalent) % of liquid volume loaded
Average Filling Emissions (liquid equivalent) % of liquid weight loaded
Volatile Uncleaned 0.078 0.064 Volatile Cleaned, Gas-Freed 0.04 0.033 Non-volatile Cleaned or Uncleaned 0.04 0.033
5.2. BARGE LOADING EMISSION MEASUREMENTS
Barge vapour collection systems are designed so that all of the vapours displaced during loading are emitted from a single vent. Thus the total volume of hydrocarbons emitted during loading can be determined by measuring the hydrocarbon concentration of the vapours vented and making the assumption that the volume discharged equals the volume of product loaded. To calculate the mass of vapours emitted, the composition of the vapours can be analysed to derive the average molecular weight.
The validation of the DIAL was undertaken during a complete barge loading
operation by comparing the mass of vapours vented, calculated from direct measurements, with DIAL flux measurements. This is discussed in Section 7.1.
report no. 95/52
9
5.3. DETAILS OF BARGE LOADING OPERATIONS
Measurements of emissions were undertaken during the loading of a barge with a cargo of 950 m3 of gasoline into the cargo tanks over a period of about 220 minutes. Generally two cargo tanks were filled at a time. Loading was continuous except for one interruption. The previous cargo carried by the barge had also been gasoline. No cleaning or gas-freeing of the barge had been undertaken after the discharge of the previous cargo.
5.4. DIRECT MEASUREMENTS AND RESULTS
Measurements of the hydrocarbon concentration of the vapour being vented were made every five minutes using an oxygen depletion technique. The measured values are given in Table 2 overpage. The concentration varied during the loading cycle as different cargo tanks were filled or topped up, the resultant vapour being a mix of the residual vapour from the previous cargo and the vapour generated from the gasoline being loaded. The residual vapour concentration was of the order of 9% by volume, whereas the concentration of the saturated vapour generated by the gasoline loaded was about 26% by volume. The average vent concentration was 15.3% by volume.

report no. 95/52
10
Table 2 Barge Loading - Direct Vent Emission Measurements
Time Hydrocarbon Concentration % vol
Operation Cumulative Emissions kg
05:25 Loading started 05:30 9.5 05:35 9.5 * 8 05:40 11.4 16 05:45 12.9 26 05:50 13.8 36 05:55 14.3 47 06:00 13.8 * 59 06:05 14.3 70 06:10 14.8 82 06:15 14.8 94 06:20 15.2 105 06:25 15.2 117 06:30 15.2 * 129 06:35 16.2 142 06:40 16.7 154 06:45 15.7 168 06:50 15.7 180 06:55 8.6 Changeover of cargo tanks 190 07:00 8.6 * 197 07:05 8.6 203 07:10 9.5 211 07:15 12.4 219 07:20 13.3 229 07:25 12.9 240 07:30 12.9 * 251 07:35 12.9 261 07:40 21.0 274 07:45 21.4 291 07:50 16.7 * Changeover of cargo tanks 307 07:55 16.7 320 08:00 16.7 334 08:05 19.5 348 08:10 Loading stopped 356 08:40 Loading restarted 356 08:45 19.0 363 08:50 20.0 * 378 08:55 24.8 395 09:00 26.2 413 09:05 26.2 * 430 09:10 Loading completed 435
* vapour sample taken for subsequent analysis

report no. 95/52
11
Eight vapour samples were taken during the loading operations and subsequently analysed for composition. The average vapour composition is shown in Table 3.
Table 3 Average Vapour Composition
Compound % Hydrocarbon by volume
C1 0.0 C2 0.0 C3 1.3 C4 50.1 C5 15.3 C6+ 33.3
The average molecular weight of the hydrocarbons was 69. As the molecular
weight of gasoline vapour is normally between 64 and 66, the higher value from the barge vent indicated the influence of the residual vapour that would have correspondingly fewer light ends than freshly evaporated vapour due to "weathering".
From Table 1 the average emission factor for loading an uncleaned barge with
volatile cargo is 0.078% as volume liquid equivalent of the volume loaded. This is equivalent to a factor of 0.064% by weight, assuming the density of the condensed vapour is 0.6 kg/l.
Using the average molecular weight of 69, the calculated total mass of
hydrocarbons emitted during the loading of 950 m3 of gasoline was 435 kg. With a gasoline density of 0.733 kg/l this gives an emission of :
(435x100)/(950x0.733x1000) = 0.062% by weight The result of this test shows good agreement with the published API emission
factor of 0.064% by weight.
report no. 95/52
12
6. TANKS
6.1. THE API 2517 CALCULATION PROCEDURE
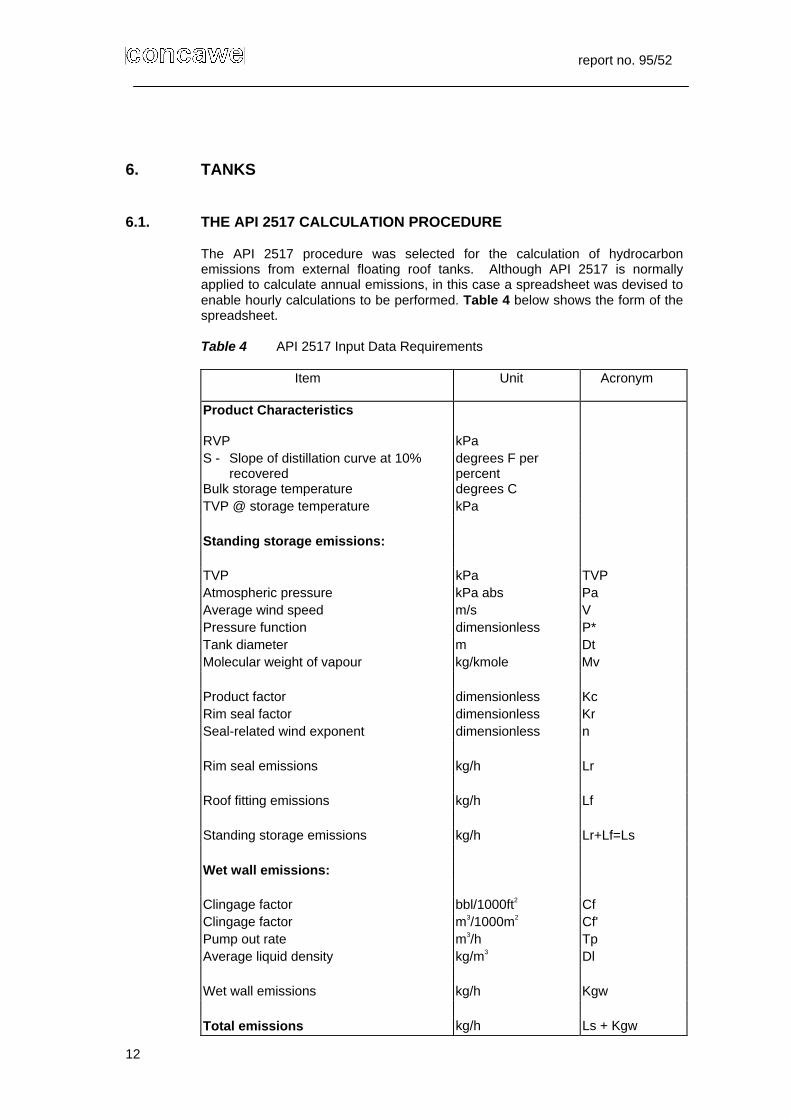
The API 2517 procedure was selected for the calculation of hydrocarbon emissions from external floating roof tanks. Although API 2517 is normally applied to calculate annual emissions, in this case a spreadsheet was devised to enable hourly calculations to be performed. Table 4 below shows the form of the spreadsheet.
Table 4 API 2517 Input Data Requirements
Item
Unit Acronym
Product Characteristics
RVP kPa S - Slope of distillation curve at 10%
recovered degrees F per percent
Bulk storage temperature degrees C TVP @ storage temperature kPa Standing storage emissions: TVP kPa TVP Atmospheric pressure kPa abs Pa Average wind speed m/s V Pressure function dimensionless P* Tank diameter m Dt Molecular weight of vapour kg/kmole Mv Product factor dimensionless Kc Rim seal factor dimensionless Kr Seal-related wind exponent dimensionless n Rim seal emissions kg/h Lr Roof fitting emissions kg/h Lf Standing storage emissions kg/h Lr+Lf=Ls Wet wall emissions: Clingage factor bbl/1000ft2 Cf Clingage factor m3/1000m2 Cf' Pump out rate m3/h Tp Average liquid density kg/m3 Dl Wet wall emissions kg/h Kgw Total emissions kg/h Ls + Kgw

report no. 95/52
13
6.2. INPUT PARAMETERS FOR CALCULATIONS
6.2.1. Tank Details
The gasoline tank farm, which was selected for the comparative hydrocarbon emissions study, contained 5 external floating roof tanks for the handling of various grades of gasoline. The particulars for these tanks which are relevant to the API 2517 emission calculation are:
- external floating roof seal types - roof fittings: types and number Tank dimensions, external floating roof seal types and their condition, and the
number and type of roof fittings are listed in Table 5 below. Four tanks were provided with liquid mounted resilient material primary seals plus
weather shields (X). In one of these tanks the resilient material of the primary seal was partly missing and considered below average condition (B). The condition of the primary seals plus weather shields for two external floating roof tanks was considered to be average (A), and for one external floating roof tank was a tight-fit (T). The fifth tank was provided with a wiper type primary and secondary seal (Y). The primary seal was vapour mounted and provided with a liquid skirt. The seal had been recently installed and was in a tight-fit condition (T).
Table 5 Tank Data
Tank No. 40 41 42 43 46 Diameter [m] 19.5 19.5 19.5 19.5 17.0 Height [m] 18.4 18.4 18.4 18.4 12.9 External Floating Roof Seal type Y X X X X Seal Condition T A B A T Access Hatch, bolted, gasketed 3 3 3 2 2 Slotted Guide-pole, gasketed sliding cover, without float
1
1
1
1
1
Gauge-well, unbolted, ungasketed 1 1 1 1 1 Gauge-hatch/Sample Well, bolted cover, gasketed
3
3
3
3
3
Vacuum Breaker 1 1 1 1 1 Roof Legs (3-inch diameter) Pontoon area 6 6 6 6 5 Centre area 4 4 4 4 3 Rim Vent (6-inch diameter) 1 1 1 1 1
A Product Quality Log provided essential product quality details and an hourly
printout of tank movements was available from the control room computer for entry onto a spreadsheet. A Movements Log provided information on all oil movements in and out of the terminal by pipeline and barge which was important in monitoring likely changes in emissions from different sources.

report no. 95/52
14
6.2.2. Product True Vapour Pressure
The RVP, reported from the product quality certificate, has been used to calculate the product true vapour pressure (TVP).
6.2.3. Product Bulk Temperature
Product bulk storage temperatures were available from the tank readout in the site control room.
6.2.4. Wind Speed
The hourly average wind speed, in m/sec, was used in the emission calculation. API 2517 advises that the wind speed be user-specified or else taken from meteorological records. It contains tabulated data for a range of locations in the US. Outside the US, it is usual for wind data to be obtained from the nearest meteorological station. In accord with this practice, for this study data were obtained from an official automatic environmental monitoring station located a distance of some 7 km from the terminal. The wind speed and direction monitor is calibrated monthly. This location was selected as being representative for the area. The data are shown in Figure 1.
Figure 1 Wind Speed for the Study Period
Time (h)
m/s
0
2
4
6
8
10
12
0 5 10 15 20 25 30 35 40 45 50 55 60 65 70 75 80 85
The DIAL facility provided a local source of wind data and overall the two data
sets showed reasonable agreement. For the study period the average wind speeds were 4.4 and 4.5 m/s for the remote and local measurements respectively.
report no. 95/52
15
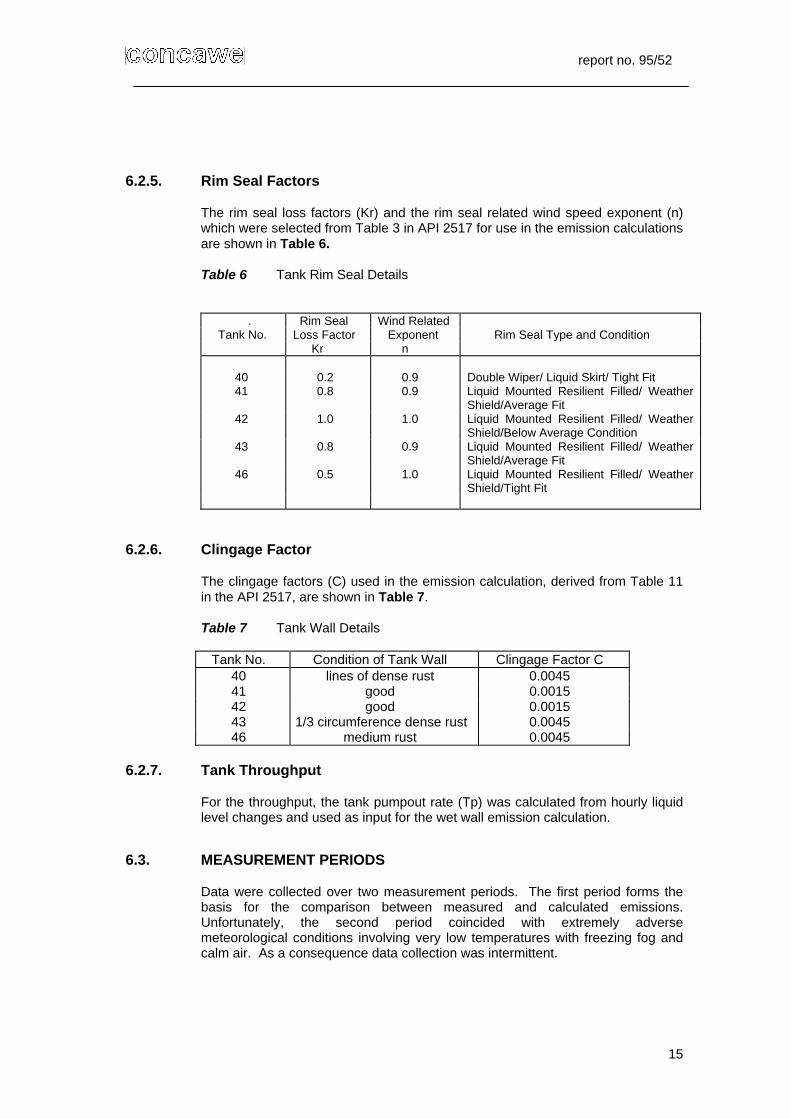
6.2.5. Rim Seal Factors
The rim seal loss factors (Kr) and the rim seal related wind speed exponent (n) which were selected from Table 3 in API 2517 for use in the emission calculations are shown in Table 6.
Table 6 Tank Rim Seal Details
. Rim Seal Wind Related Tank No. Loss Factor Exponent Rim Seal Type and Condition
Kr n
40 0.2 0.9 Double Wiper/ Liquid Skirt/ Tight Fit 41 0.8 0.9 Liquid Mounted Resilient Filled/ Weather
Shield/Average Fit 42 1.0 1.0 Liquid Mounted Resilient Filled/ Weather
Shield/Below Average Condition 43 0.8 0.9 Liquid Mounted Resilient Filled/ Weather
Shield/Average Fit 46 0.5 1.0 Liquid Mounted Resilient Filled/ Weather
Shield/Tight Fit
6.2.6. Clingage Factor
The clingage factors (C) used in the emission calculation, derived from Table 11 in the API 2517, are shown in Table 7.
Table 7 Tank Wall Details
Tank No. Condition of Tank Wall Clingage Factor C 40 lines of dense rust 0.0045 41 good 0.0015 42 good 0.0015 43 1/3 circumference dense rust 0.0045 46 medium rust 0.0045
6.2.7. Tank Throughput
For the throughput, the tank pumpout rate (Tp) was calculated from hourly liquid level changes and used as input for the wet wall emission calculation.
6.3. MEASUREMENT PERIODS
Data were collected over two measurement periods. The first period forms the basis for the comparison between measured and calculated emissions. Unfortunately, the second period coincided with extremely adverse meteorological conditions involving very low temperatures with freezing fog and calm air. As a consequence data collection was intermittent.
report no. 95/52
16
6.4. DATA OUTPUT
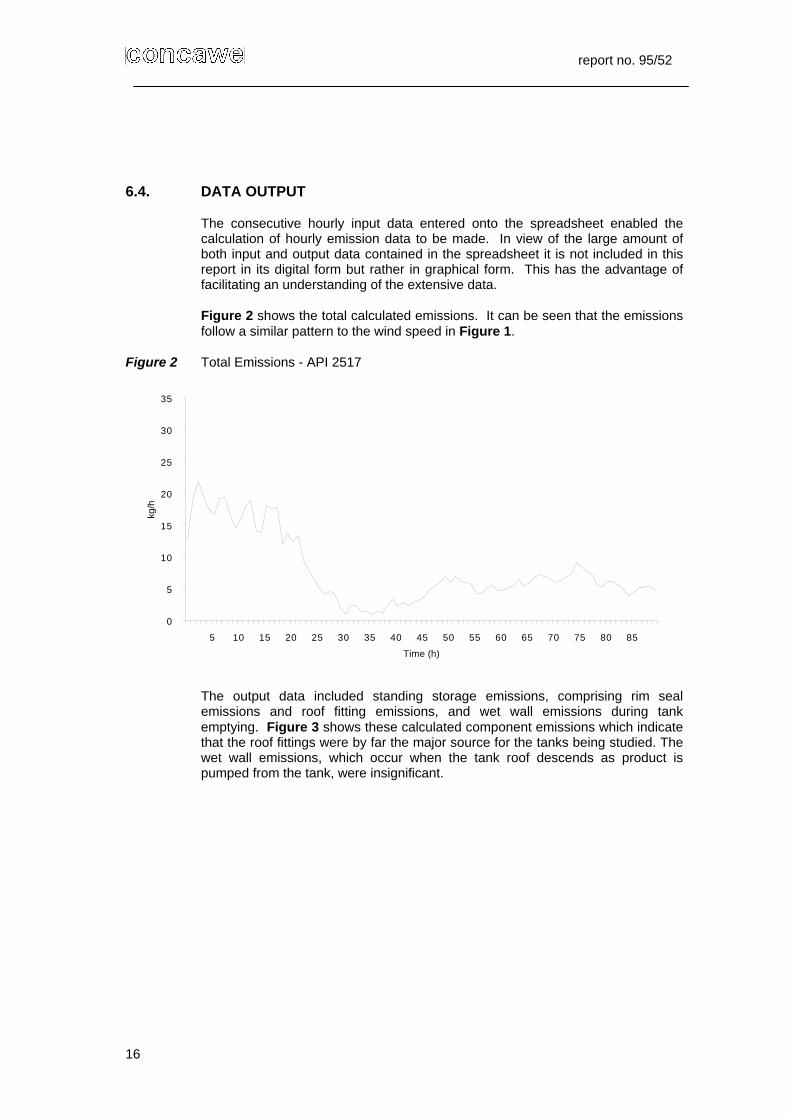
The consecutive hourly input data entered onto the spreadsheet enabled the calculation of hourly emission data to be made. In view of the large amount of both input and output data contained in the spreadsheet it is not included in this report in its digital form but rather in graphical form. This has the advantage of facilitating an understanding of the extensive data.
Figure 2 shows the total calculated emissions. It can be seen that the emissions
follow a similar pattern to the wind speed in Figure 1. Figure 2 Total Emissions - API 2517
Time (h)
kg/h
0
5
10
15
20
25
30
35
5 10 15 20 25 30 35 40 45 50 55 60 65 70 75 80 85
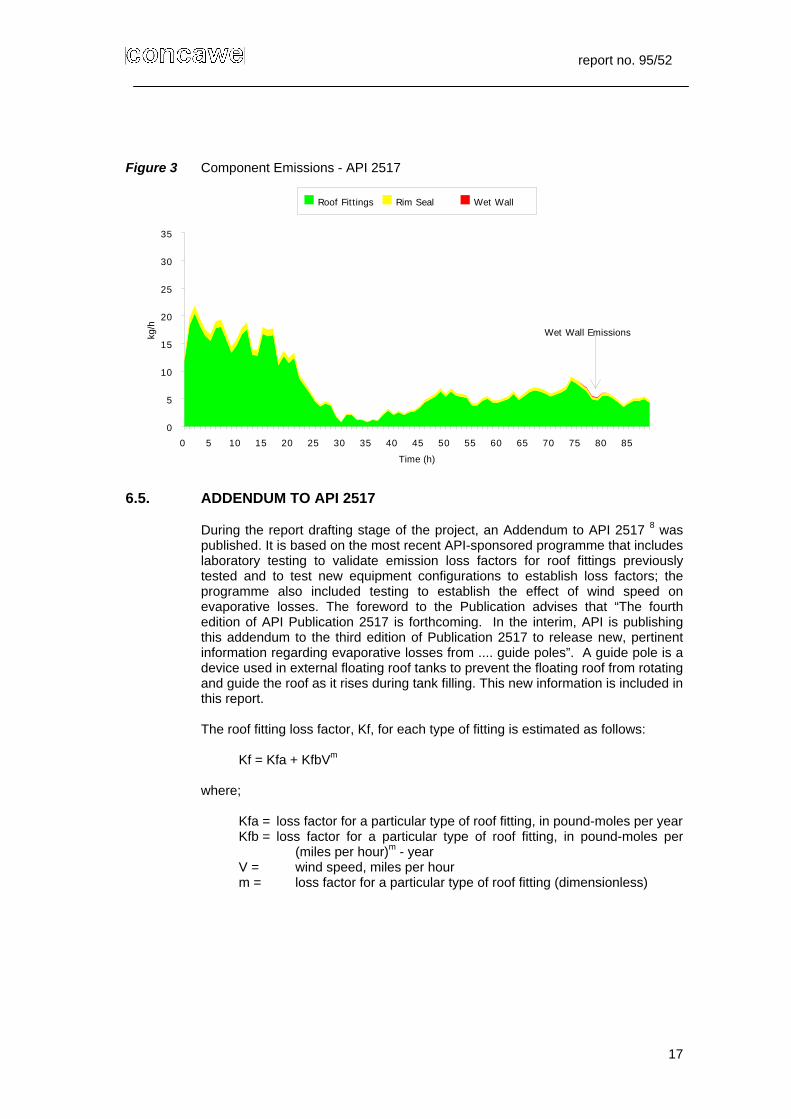
The output data included standing storage emissions, comprising rim seal
emissions and roof fitting emissions, and wet wall emissions during tank emptying. Figure 3 shows these calculated component emissions which indicate that the roof fittings were by far the major source for the tanks being studied. The wet wall emissions, which occur when the tank roof descends as product is pumped from the tank, were insignificant.
report no. 95/52
17
Figure 3 Component Emissions - API 2517
Time (h)
kg/h
0
5
10
15
20
25
30
35
0 5 10 15 20 25 30 35 40 45 50 55 60 65 70 75 80 85
Roof Fittings Rim Seal Wet Wall
Wet Wall Emissions
6.5. ADDENDUM TO API 2517
During the report drafting stage of the project, an Addendum to API 2517 8 was published. It is based on the most recent API-sponsored programme that includes laboratory testing to validate emission loss factors for roof fittings previously tested and to test new equipment configurations to establish loss factors; the programme also included testing to establish the effect of wind speed on evaporative losses. The foreword to the Publication advises that “The fourth edition of API Publication 2517 is forthcoming. In the interim, API is publishing this addendum to the third edition of Publication 2517 to release new, pertinent information regarding evaporative losses from .... guide poles”. A guide pole is a device used in external floating roof tanks to prevent the floating roof from rotating and guide the roof as it rises during tank filling. This new information is included in this report.
The roof fitting loss factor, Kf, for each type of fitting is estimated as follows: Kf = Kfa + KfbVm
where; Kfa = loss factor for a particular type of roof fitting, in pound-moles per year Kfb = loss factor for a particular type of roof fitting, in pound-moles per
(miles per hour)m - year V = wind speed, miles per hour m = loss factor for a particular type of roof fitting (dimensionless)

report no. 95/52
18
The changes in the factors for the study tanks in this report are shown in Table 8. Table 8 Comparison of Previous and Revised API Factors
Kfa Kfb m API 2517 0 260 1.20 Addendum to API 2517 40.7 311 1.29
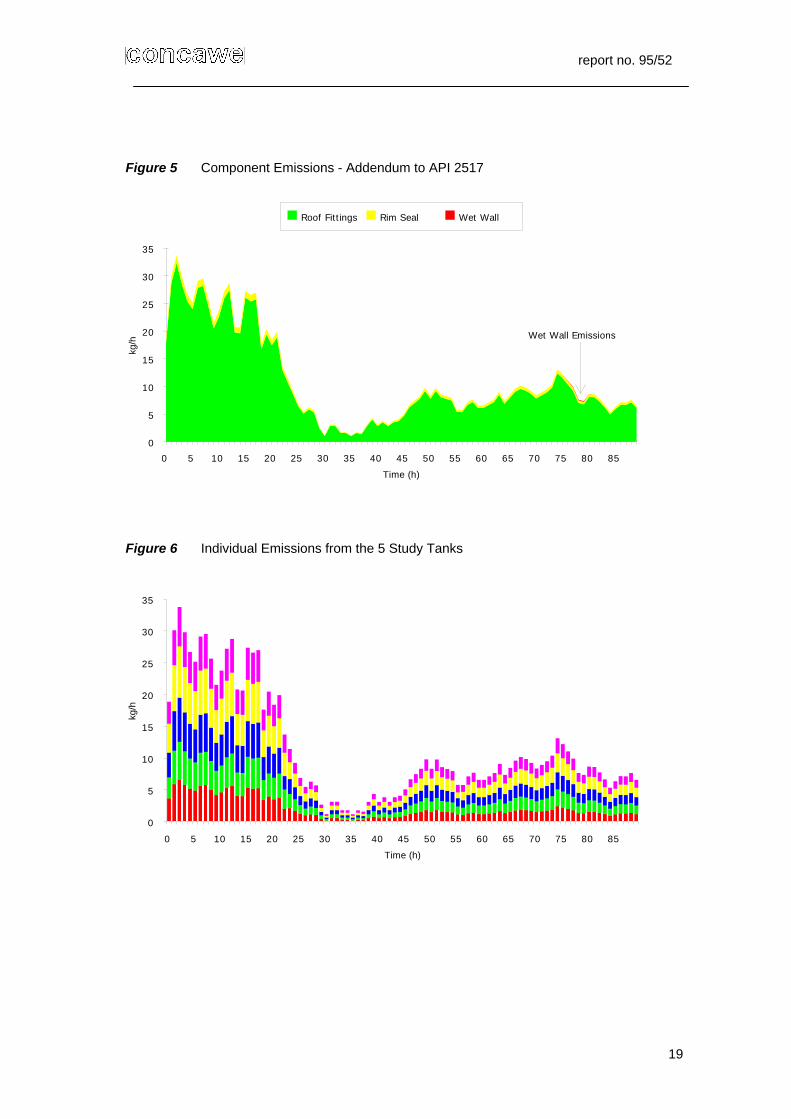
The apparently large impact of the Addendum is shown in Figure 4 which plots
the Addendum data together with the original data shown in Figure 2. Figure 5 shows the component emissions from which, by comparison with Figure 3, it can be seen that the increase is associated with the roof fittings. The reasons for the increase are discussed in Section 7.2. Individual total emissions for each of the 5 study tanks are shown in Figure 6. It can be seen that the emissions are fairly evenly spread amongst all of the tanks.
Figure 4 Total Emissions - API 2517 vs Addendum to API2517
TIme (h)
kg/h
0
5
10
15
20
25
30
35
0 5 10 15 20 25 30 35 40 45 50 55 60 65 70 75 80 85
API 2517 Addendum to API 2517
report no. 95/52
19
Figure 5 Component Emissions - Addendum to API 2517
Time (h)
kg/h
0
5
10
15
20
25
30
35
0 5 10 15 20 25 30 35 40 45 50 55 60 65 70 75 80 85
Roof Fitt ings Rim Seal Wet Wall
Wet Wall Emissions
Figure 6 Individual Emissions from the 5 Study Tanks
Time (h)
kg/h
0
5
10
15
20
25
30
35
0 5 10 15 20 25 30 35 40 45 50 55 60 65 70 75 80 85

report no. 95/52
20
7. COMPARISON OF RESULTS
The Spectrasyne report is included as the Appendix.
7.1. BARGE EMISSIONS AND DIAL VALIDATION
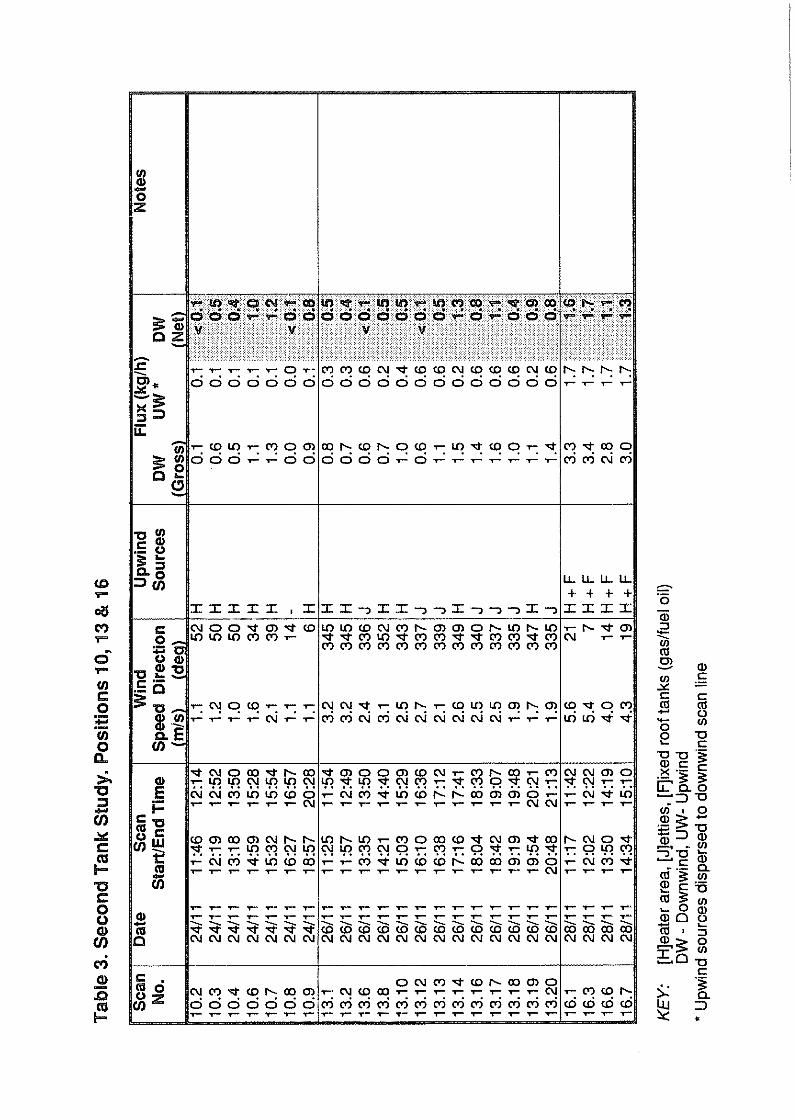
DIAL scans were taken sequentially some 36 m downwind during the whole of the barge loading operations and for a short period afterwards (see Appendix, Table 1).
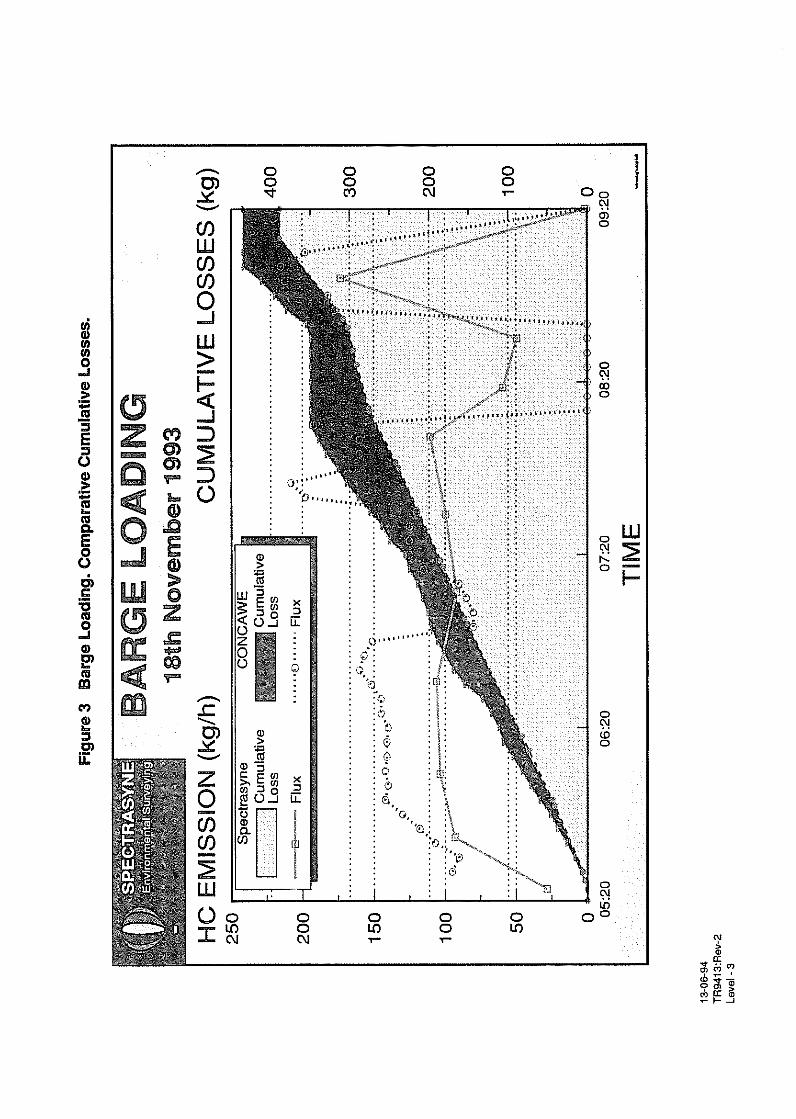
The DIAL data were plotted in 5 minute periods to match the directly measured
data. The two data sets are compared in Figure 7. Figure 7 Barge Loading - Comparison Between Direct (Vent) and Remote (DIAL)
Measurements.
Time
Cum
ulat
ive
Loss
kg
0
50
100
150
200
250
300
350
400
450
05:20 06:20 07:20 08:20 09:200.0
50.0
100.0
150.0
200.0
250.0
Flux
kg/
h
CONCAWECumulative Loss
DIAL CumulativeLoss
CONCAWE Flux DIAL Flux
During the period of interruption of loading when no vapour was emitted from the
vent the DIAL still indicated some emissions. This was probably due to the slow dispersion of the emissions from the barge across the DIAL scan line in the low wind speed.
The total hydrocarbon emissions as calculated using DIAL were 390 kg. This
compares to 435 kg from the direct measurements. The relatively close agreement, approximately 10%, demonstrates that the DIAL could measure the total flux from an emission source under the field conditions pertaining at the time.
7.2. COMPARISON OF MEASURED AND CALCULATED TANK EMISSIONS
To facilitate the comparison between the DIAL measurements and the calculated emissions both data sets were processed into 15 minute intervals expressed on kg/h basis. In the case of DIAL, the tabulated data from the Spectrasyne report were used to derive the 15 minute data; the calculated hourly data were simply plotted in 15 minute intervals.

report no. 95/52
21
Figure 8 shows the DIAL emissions plotted at 15 minute intervals over the whole measurement period of some 90 hours; the emissions calculated by API 2517 and by the Addendum to API 2517 are shown as line plots.
Figure 8 Emissions - DIAL vs API 2517 and Addendum to API 2517
Time (h)
kg/h
0
5
10
15
20
25
30
35
40
45
50
0 5 10 15 20 25 30 35 40 45 50 55 60 65 70 75 80 85
DIAL Addendum API 2517 API 2517
On comparing the calculated data for the periods when DIAL data were available,
the DIAL measurement was 56% greater than the API 2517 calculated emission. However the Addendum to 2517 refers to an error in the wind speed measurement in the test programme to derive some of the factors for API 2517. The result is that for the CONCAWE study, the difference should have been 26% rather than 56%. For the Addendum to API 2517, which in any event introduces factors which supersede API 2517, the DIAL measurement was 10% greater than that for the Addendum to API 2517.
In spite of the relatively good agreement between the measured and calculated
data sets, particularly for the Addendum to API 2517, there were periods when differences between the two were more pronounced.
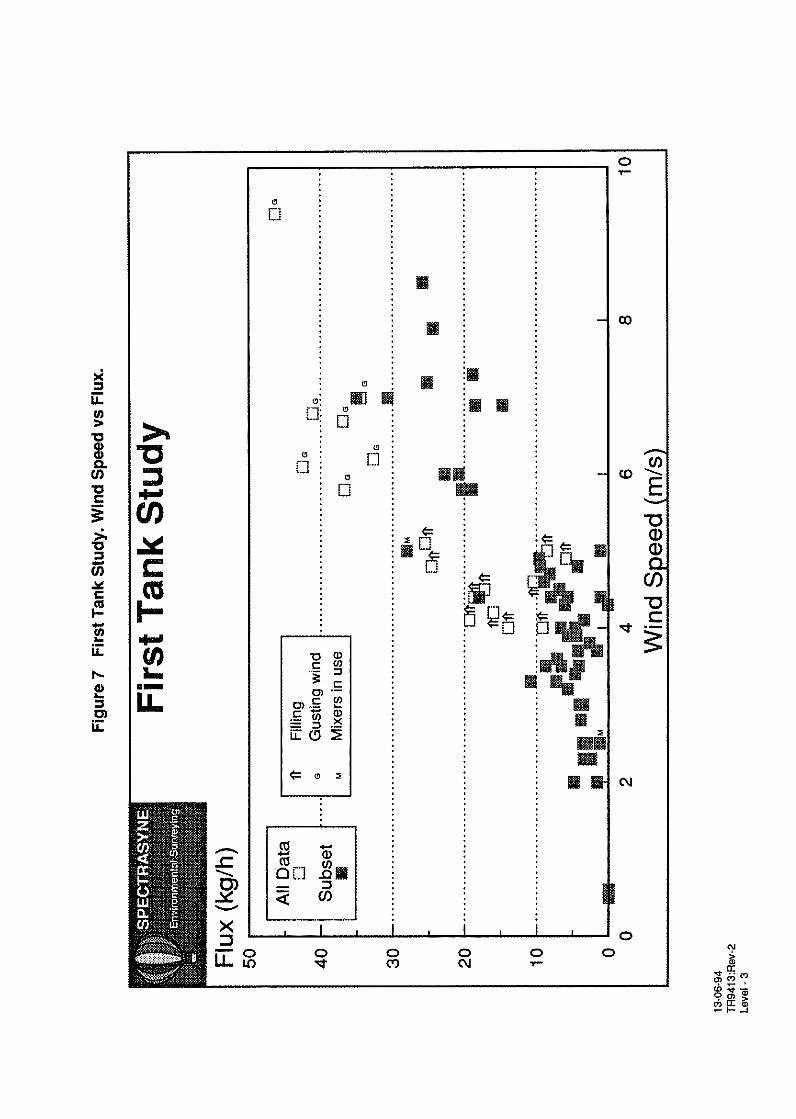
In the early part of the study, during a period of relatively high average wind
speeds, gusting wind conditions were experienced over one period of 4 hours and a second period of 2 hours (hours 2-6 and 14-16). API 2517 states that the emission equations were developed for average wind speeds ranging from 2-15 mph and should only be used within this range. The Addendum to API 2517 advises “due to a lack of test data at higher wind speeds it is recommended that table of factors not be used for wind speeds above 15 mph” (6.7 m/s). Wind speeds above this value were experienced during the early part of the study as can be seen from Figure 1. However in the absence of any alternative, the factors were used and resulted in the good overall agreement between measured and calculated losses as referred above. Some of the short-term differences between the measured and calculated emissions may have reflected a gusting effect. In view of the non-linear dependence of emissions on wind speed, the sum of the individual hourly calculated data was compared with the product of an hourly calculated loss based on the average wind speed and the total number of hours. The latter loss was within 10% of the total for the individual hourly data. It is emphasised that the reasons for, and the sources of, the differences coincident with these periods of gusting winds were not resolved in this study.
report no. 95/52
22
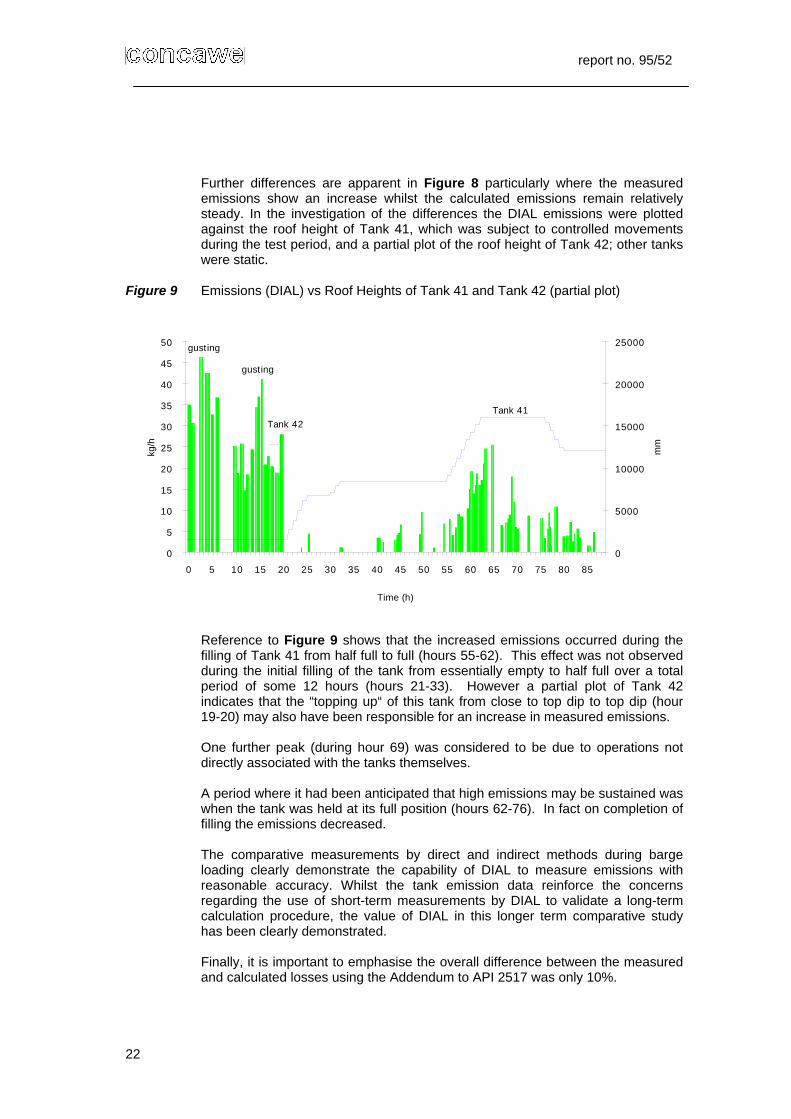
Further differences are apparent in Figure 8 particularly where the measured
emissions show an increase whilst the calculated emissions remain relatively steady. In the investigation of the differences the DIAL emissions were plotted against the roof height of Tank 41, which was subject to controlled movements during the test period, and a partial plot of the roof height of Tank 42; other tanks were static.
Figure 9 Emissions (DIAL) vs Roof Heights of Tank 41 and Tank 42 (partial plot)
Time (h)
kg/h
0
5
10
15
20
25
30
35
40
45
50
0 5 10 15 20 25 30 35 40 45 50 55 60 65 70 75 80 85
0
5000
10000
15000
20000
25000
mm
Tank 41Tank 42
gusting
gusting
Reference to Figure 9 shows that the increased emissions occurred during the
filling of Tank 41 from half full to full (hours 55-62). This effect was not observed during the initial filling of the tank from essentially empty to half full over a total period of some 12 hours (hours 21-33). However a partial plot of Tank 42 indicates that the “topping up“ of this tank from close to top dip to top dip (hour 19-20) may also have been responsible for an increase in measured emissions.
One further peak (during hour 69) was considered to be due to operations not
directly associated with the tanks themselves. A period where it had been anticipated that high emissions may be sustained was
when the tank was held at its full position (hours 62-76). In fact on completion of filling the emissions decreased.
The comparative measurements by direct and indirect methods during barge
loading clearly demonstrate the capability of DIAL to measure emissions with reasonable accuracy. Whilst the tank emission data reinforce the concerns regarding the use of short-term measurements by DIAL to validate a long-term calculation procedure, the value of DIAL in this longer term comparative study has been clearly demonstrated.
Finally, it is important to emphasise the overall difference between the measured
and calculated losses using the Addendum to API 2517 was only 10%.

report no. 95/52
23
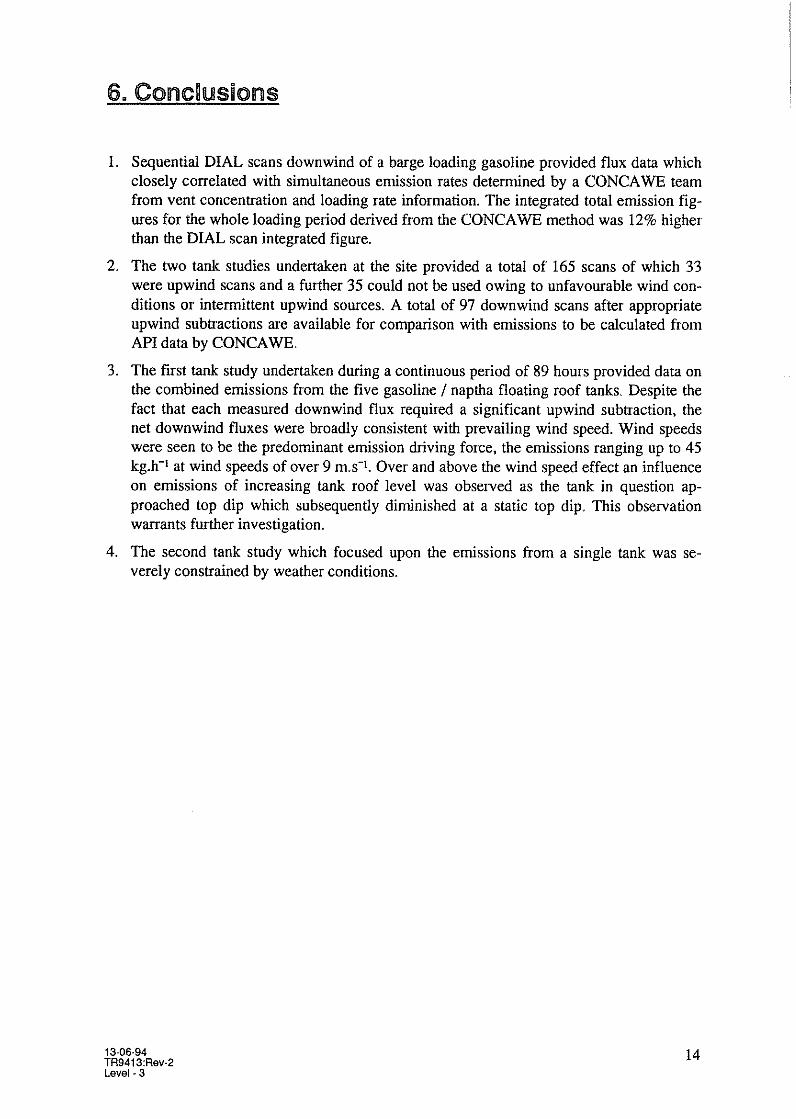
8. CONCLUSIONS
1 The validation of DIAL measurements under field conditions was an
important objective. The direct measurement of emissions during barge loading and the calculation of emissions using an established factor were in close agreement; the remote measurement by DIAL was within 10% of the measured value.
2 For tank emissions, the overall agreement between the API 2517
calculated emissions and DIAL measurements was considered reasonable. There were a number of incidences where spikes occurred in the measured emissions. In some instances there were possible operational reasons which could explain these but since they could not be quantified the data were plotted “as measured”.
3 The Addendum to API 2517 resulted in good agreement between
measured and calculated emissions. 4 The discrepancies incurred during periods of gusting winds were only
partially offset by the revised emission factors in the Addendum. The reasons for, and the sources of, the differences coincident with these periods of gusting winds were not resolved in this study.
5 The indicated emissions which occurred during the latter half of tank filling
and possibly during topping up were unexpected. This is an area for possible further investigation.
6 The emissions arising from the exposure of the wet wall as the tank roof
was lowered were insignificant. 7 It is considered unequivocally that the detailed initial planning for the
relatively long term, continuous measurements and the technical liaison provided throughout were fundamental to the success of the project.
8 In view of the high costs involved in the project and the acknowledged risk
of it not being successful, the planning for both two barge loading operations and two tank studies was important. In the event, only one barge loading operation was covered for operational reasons and only one tank study for meteorological reasons.
9 Any future work could be directed at large tanks having significantly
different height-to-diameter ratios. Emissions during filling could be a component of such studies.
10 This study indicated that, in the context of the serious concerns which have
been raised, API 2517 provided a reasonable estimate of emissions over the measurement period.
11 The Addendum to API 2517 was considered to represent adequately the
emissions from the various sources associated with the tanks and their operation.

report no. 95/52
24
9. ACKNOWLEDGEMENTS
CONCAWE gratefully acknowledges the considerable assistance given by the
staff associated with the test site during all phases of the measurement programme and without which this comparative study would not have been possible.
report no. 95/52
25
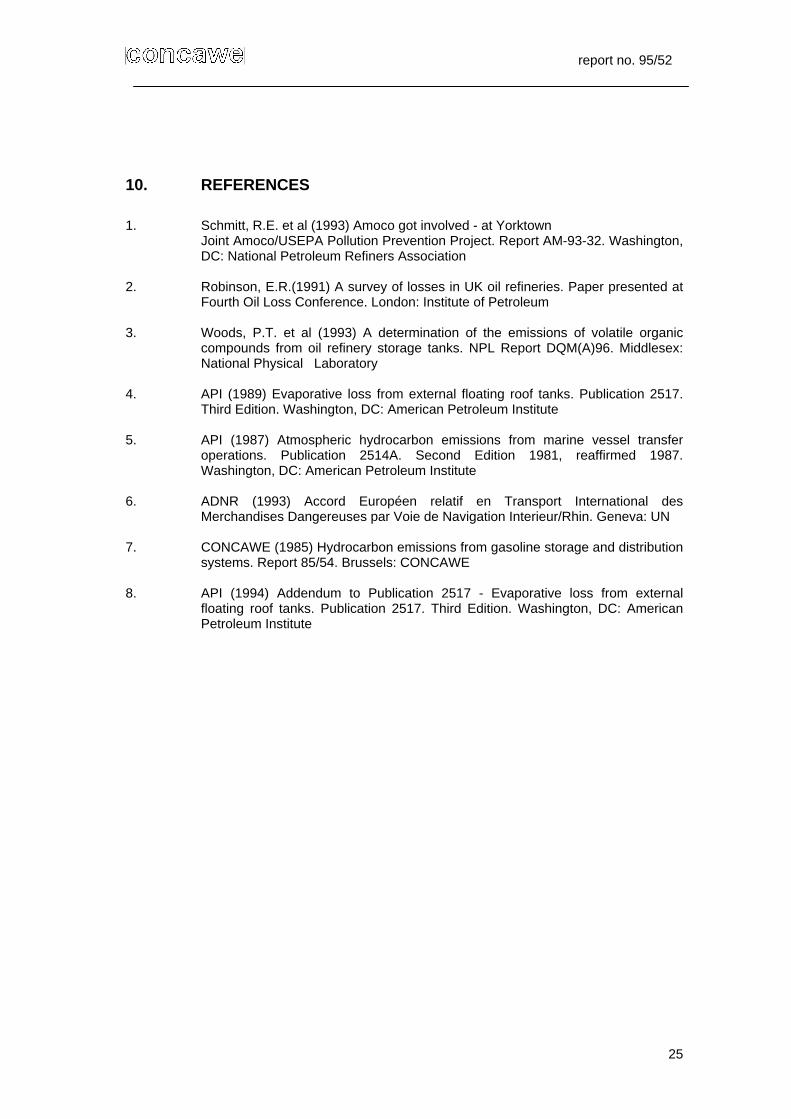
10. REFERENCES
1. Schmitt, R.E. et al (1993) Amoco got involved - at Yorktown Joint Amoco/USEPA Pollution Prevention Project. Report AM-93-32. Washington,
DC: National Petroleum Refiners Association 2. Robinson, E.R.(1991) A survey of losses in UK oil refineries. Paper presented at
Fourth Oil Loss Conference. London: Institute of Petroleum 3. Woods, P.T. et al (1993) A determination of the emissions of volatile organic
compounds from oil refinery storage tanks. NPL Report DQM(A)96. Middlesex: National Physical Laboratory
4. API (1989) Evaporative loss from external floating roof tanks. Publication 2517.
Third Edition. Washington, DC: American Petroleum Institute 5. API (1987) Atmospheric hydrocarbon emissions from marine vessel transfer
operations. Publication 2514A. Second Edition 1981, reaffirmed 1987. Washington, DC: American Petroleum Institute
6. ADNR (1993) Accord Européen relatif en Transport International des
Merchandises Dangereuses par Voie de Navigation Interieur/Rhin. Geneva: UN 7. CONCAWE (1985) Hydrocarbon emissions from gasoline storage and distribution
systems. Report 85/54. Brussels: CONCAWE 8. API (1994) Addendum to Publication 2517 - Evaporative loss from external
floating roof tanks. Publication 2517. Third Edition. Washington, DC: American Petroleum Institute

report no. 95/52
26
APPENDIX SPECTRASYNE LTD. TECHNICAL REPORT NO. TR 9413, STUDIES OF VOC EMISSIONS FROM EXTERNAL FLOATING ROOF TANKS AND BARGE LOADING, NOVEMBER 1993.


Related Documents