Vitamin and mineral requirements in human nutrition Second edition

Welcome message from author
This document is posted to help you gain knowledge. Please leave a comment to let me know what you think about it! Share it to your friends and learn new things together.
Transcript
Vitamin and mineralrequirements
in human nutrition
Second edition
P000i-00xx 3/12/05 8:54 PM Page i
WHO Library Cataloguing-in-Publication Data
Joint FAO/WHO Expert Consultation on Human Vitamin and Mineral Requirements (1998 : Bangkok, Thailand).Vitamin and mineral requirements in human nutrition : report of a joint FAO/WHO expert consultation, Bangkok, Thailand, 21–30 September 1998.
1.Vitamins — standards 2.Micronutrients — standards 3.Trace elements — standards4.Deficiency diseases — diet therapy 5.Nutritional requirements I.Title.
ISBN 92 4 154612 3 (LC/NLM Classification: QU 145)
© World Health Organization and Food and Agriculture Organization of the United Nations2004
All rights reserved. Publications of the World Health Organization can be obtained from Market-ing and Dissemination, World Health Organization, 20 Avenue Appia, 1211 Geneva 27, Switzerland(tel: +41 22 791 2476; fax: +41 22 791 4857; e-mail: [email protected]). Requests for permis-sion to reproduce or translate WHO publications — whether for sale or for noncommercial distri-bution — should be addressed to Publications, at the above address (fax: +41 22 791 4806; e-mail:[email protected]), or to Chief, Publishing and Multimedia Service, Information Division, Foodand Agriculture Organization of the United Nations, 00100 Rome, Italy.
The designations employed and the presentation of the material in this publication do not implythe expression of any opinion whatsoever on the part of the World Health Organization and theFood and Agriculture Organization of the United Nations concerning the legal status of anycountry, territory, city or area or of its authorities, or concerning the delimitation of its frontiersor boundaries. Dotted lines on maps represent approximate border lines for which there may notyet be full agreement.
The mention of specific companies or of certain manufacturers’ products does not imply that theyare endorsed or recommended by the World Health Organization and the Food and AgricultureOrganization of the United Nations in preference to others of a similar nature that are not men-tioned. Errors and omissions excepted, the names of proprietary products are distinguished byinitial capital letters.
The World Health Organization and the Food and Agriculture Organization of the United Nationsdo not warrant that the information contained in this publication is complete and correct andshall not be liable for any damages incurred as a result of its use.
Designed by minimum graphicsTypeset by SNP Best-set Typesetter Ltd., Hong KongPrinted in China by Sun Fung
VITPR 3/12/05 16:50 Page ii
Contents
Foreword xiiiAcknowledgements xvii
1. Concepts, definitions and approaches used to define nutritionalneeds and recommendations 11.1 Introduction 11.2 Definition of terms 2
1.2.1 Estimated average requirement 21.2.2 Recommended nutrient intake 21.2.3 Apparently healthy 31.2.4 Protective nutrient intake 31.2.5 Upper tolerable nutrient intake level 41.2.6 Nutrient excess 41.2.7 Use of nutrient intake recommendations in population
assessment 51.3 Approaches used in estimating nutrient intakes for optimal
health 61.3.1 The clinical approach 81.3.2 Nutrient balance 81.3.3 Functional responses 91.3.4 Optimal intake 10
1.4 Conclusions 12References 14
2. Vitamin A 172.1 Role of vitamin A in human metabolic processes 17
2.1.1 Overview of vitamin A metabolism 172.1.2 Biochemical mechanisms for vitamin A functions 19
2.2 Populations at risk for, and consequences of, vitamin Adeficiency 202.2.1 Definition of vitamin A deficiency 202.2.2 Geographic distribution and magnitude 202.2.3 Age and sex 21
iii
VITPR 3/12/05 16:50 Page iii
VITAMIN AND MINERAL REQUIREMENTS IN HUMAN NUTRITION
iv
2.2.4 Risk factors 222.2.5 Morbidity and mortality 23
2.3 Units of expression 242.4 Sources and supply patterns of vitamin A 27
2.4.1 Dietary sources 272.4.2 Dietary intake and patterns 272.4.3 World and regional supply and patterns 27
2.5 Indicators of vitamin A deficiency 292.5.1 Clinical indicators of vitamin A deficiency 292.5.2 Subclinical indicators of vitamin A deficiency 30
2.6 Evidence used for making recommendations 312.6.1 Infants and children 322.6.2 Adults 332.6.3 Pregnant women 332.6.4 Lactating women 342.6.5 Elderly 35
2.7 Recommendations for vitamin A requirements 352.8 Toxicity 362.9 Recommendations for future research 37References 37
3. Vitamin D 453.1 Role of vitamin D in human metabolic processes 45
3.1.1 Overview of vitamin D metabolism 453.1.2 Calcium homeostasis 46
3.2 Populations at risk for vitamin D deficiency 483.2.1 Infants 483.2.2 Adolescents 483.2.3 Elderly 483.2.4 Pregnant and lactating women 49
3.3 Evidence used for estimating recommended intakes 513.3.1 Lack of accuracy in estimating dietary intake and skin
synthesis 513.3.2 Use of plasma 25-OH-D as a measure of vitamin D
status 513.4 Recommended intakes for vitamin D 533.5 Toxicity 543.6 Recommendations for future research 55References 55
4. Calcium 594.1 Introduction 594.2 Chemistry and distribution of calcium 60
VITPR 3/12/05 16:50 Page iv
4.3 Biological role of calcium 614.4 Determinants of calcium balance 62
4.4.1 Calcium intake 624.4.2 Calcium absorption 624.4.3 Urinary calcium 654.4.4 Insensible losses 66
4.5 Criteria for assessing calcium requirements and recommended nutrient intakes 664.5.1 Methodology 664.5.2 Populations at risk for calcium deficiency 69
4.6 Recommendations for calcium requirements 694.6.1 Infants 694.6.2 Children 704.6.3 Adolescents 714.6.4 Adults 724.6.5 Menopausal women 724.6.6 Ageing adults 734.6.7 Pregnant women 734.6.8 Lactating women 73
4.7 Upper limits 744.8 Comparisons with other recommendations 744.9 Ethnic and environmental variations in the prevalence of
osteoporosis 754.9.1 Ethnicity 764.9.2 Geography 764.9.3 Culture and diet 774.9.4 The calcium paradox 78
4.10 Nutritional factors affecting calcium requirement 784.10.1 Sodium 784.10.2 Protein 794.10.3 Vitamin D 814.10.4 Implications 81
4.11 Conclusions 834.12 Recommendations for future research 85References 85
5. Vitamin E 945.1 Role of vitamin E in human metabolic processes 945.2 Populations at risk for vitamin E deficiency 975.3 Dietary sources and possible limitations to vitamin E supply 1005.4 Evidence used for estimating recommended intakes 1015.5 Toxicity 103
CONTENTS
v
VITPR 3/12/05 16:50 Page v
VITAMIN AND MINERAL REQUIREMENTS IN HUMAN NUTRITION
vi
5.6 Recommendations for future research 103References 104
6. Vitamin K 1086.1 Introduction 1086.2 Biological role of vitamin K 1086.3 Overview of vitamin K metabolism 110
6.3.1 Absorption and transport 1106.3.2 Tissue stores and distribution 1116.3.3 Bioactivity 1126.3.4 Excretion 112
6.4 Populations at risk for vitamin K deficiency 1136.4.1 Vitamin K deficiency bleeding in infants 1136.4.2 Vitamin K prophylaxis in infants 1146.4.3 Vitamin K deficiency in adults 115
6.5 Sources of vitamin K 1156.5.1 Dietary sources 1156.5.2 Bioavailability of vitamin K from foods 1166.5.3 Importance of intestinal bacterial synthesis as
a source of vitamin K 1176.6 Information relevant to the derivation of recommended
vitamin K intakes 1176.6.1 Assessment of vitamin K status 1176.6.2 Dietary intakes in infants and their adequacy 1186.6.3 Factors of relevance to classical vitamin K deficiency
bleeding 1196.6.4 Factors of relevance to late vitamin K deficiency
bleeding 1206.6.5 Dietary intakes in older infants, children, and adults
and their adequacy 1206.7 Recommendations for vitamin K intakes 122
6.7.1 Infants 0–6 months 1226.7.2 Infants (7–12 months), children, and adults 125
6.8 Toxicity 1266.9 Recommendations for future research 126References 126
7. Vitamin C 1307.1 Introduction 1307.2 Role of vitamin C in human metabolic processes 130
7.2.1 Background biochemistry 1307.2.2 Enzymatic functions 130
VITPR 3/12/05 16:50 Page vi
7.2.3 Miscellaneous functions 1317.3 Consequences of vitamin C deficiency 1317.4 Populations at risk for vitamin C deficiency 1327.5 Dietary sources of vitamin C and limitations to vitamin C
supply 1347.6 Evidence used to derive recommended intakes of vitamin C 135
7.6.1 Adults 1357.6.2 Pregnant and lactating women 1377.6.3 Children 1377.6.4 Elderly 1387.6.5 Smokers 138
7.7 Recommended nutrient intakes for vitamin C 1387.8 Toxicity 1397.9 Recommendations for future research 139References 139
8. Dietary antioxidants 1458.1 Nutrients with an antioxidant role 1458.2 The need for biological antioxidants 1458.3 Pro-oxidant activity of biological antioxidants 1478.4 Nutrients associated with endogenous antioxidant mechanisms 1508.5 Nutrients with radical-quenching properties 151
8.5.1 Vitamin E 1518.5.2 Vitamin C 1538.5.3 b-Carotene and other carotenoids 154
8.6 A requirement for antioxidant nutrients 1568.7 Recommendations for future research 158References 158
9. Thiamine, riboflavin, niacin, vitamin B6, pantothenic acid,and biotin 1649.1 Introduction 1649.2 Thiamine 165
9.2.1 Background 1659.2.2 Biochemical indicators 1669.2.3 Factors affecting requirements 1679.2.4 Evidence used to derive recommended intakes 1679.2.5 Recommended nutrient intakes for thiamine 168
9.3 Riboflavin 1699.3.1 Background 1699.3.2 Biochemical indicators 1709.3.3 Factors affecting requirements 171
CONTENTS
vii
VITPR 3/12/05 16:50 Page vii
VITAMIN AND MINERAL REQUIREMENTS IN HUMAN NUTRITION
viii
9.3.4 Evidence used to derive recommended intakes 1719.3.5 Recommended nutrient intakes for riboflavin 172
9.4 Niacin 1739.4.1 Background 1739.4.2 Biochemical indicators 1749.4.3 Factors affecting requirements 1749.4.4 Evidence used to derive recommended intakes 1759.4.5 Recommended nutrient intakes for niacin 175
9.5 Vitamin B6 1759.5.1 Background 1759.5.2 Biochemical indicators 1779.5.3 Factors affecting requirements 1789.5.4 Evidence used to derive recommended intakes 1789.5.5 Recommended nutrient intakes for vitamin B6 179
9.6 Pantothenate 1809.6.1 Background 1809.6.2 Biochemical indicators 1809.6.3 Factors affecting requirements 1819.6.4 Evidence used to derive recommended intakes 1819.6.5 Recommended nutrient intakes for pantothenic acid 182
9.7 Biotin 1829.7.1 Background 1829.7.2 Biochemical indicators 1839.7.3 Evidence used to derive recommended intakes 1839.7.4 Recommended nutrient intakes for biotin 184
9.8 General considerations for B-complex vitamins 1849.8.1 Notes on suggested recommendations 1849.8.2 Dietary sources of B-complex vitamins 185
9.9 Recommendations for future research 185References 186
10. Selenium 19410.1 Role of selenium in human metabolic processes 19410.2 Selenium deficiency 196
10.2.1 Non-endemic deficiencies of selenium 19610.2.2 Keshan disease 19710.2.3 Kaschin-Beck disease 19810.2.4 Selenium status and susceptibility to infection 19810.2.5 Selenium and thyroid hormones 200
10.3 The influence of diet on selenium status 20010.4 Absorption and bioavailability 20410.5 Criteria for assessing selenium requirements 204
VITPR 3/12/05 16:50 Page viii
10.6 Recommended selenium intakes 20610.6.1 Adults 20610.6.2 Infants 20610.6.3 Pregnant and lactating women 208
10.7 Upper limits 20910.8 Comparison with other estimates 20910.9 Recommendations for future research 210References 211
11. Magnesium 21711.1 Tissue distribution and biological role of magnesium 21711.2 Populations at risk for, and consequences of,
magnesium deficiency 21811.3 Dietary sources, absorption, and excretion of magnesium 21811.4 Criteria for assessing magnesium requirements and allowances 22011.5 Recommended intakes for magnesium 22211.6 Upper limits 22511.7 Comparison with other estimates 22511.8 Recommendations for future research 225References 226
12. Zinc 23012.1 Role of zinc in human metabolic processes 23012.2 Zinc metabolism and homeostasis 23112.3 Dietary sources and bioavailability of zinc 23212.4 Populations at risk for zinc deficiency 23412.5 Evidence used to estimate zinc requirements 235
12.5.1 Infants, children, and adolescents 23612.5.2 Pregnant women 23812.5.3 Lactating women 23812.5.4 Elderly 239
12.6 Interindividual variations in zinc requirements andrecommended nutrient intakes 239
12.7 Upper limits 24012.8 Adequacy of zinc intakes in relation to requirement estimates 24112.9 Recommendations for future research 242References 243
13. Iron 24613.1 Role of iron in human metabolic processes 24613.2 Iron metabolism and absorption 246
13.2.1 Basal iron losses 24613.2.2 Requirements for growth 247
CONTENTS
ix
VITPR 3/12/05 16:50 Page ix
VITAMIN AND MINERAL REQUIREMENTS IN HUMAN NUTRITION
x
13.2.3 Menstrual iron losses 24913.2.4 Iron absorption 25013.2.5 Inhibition of iron absorption 25213.2.6 Enhancement of iron absorption 25413.2.7 Iron absorption from meals 25513.2.8 Iron absorption from the whole diet 25513.2.9 Iron balance and regulation of iron absorption 256
13.3 Iron deficiency 25813.3.1 Populations at risk for iron deficiency 25813.3.2 Indicators of iron deficiency 26013.3.3 Causes of iron deficiency 26113.3.4 Prevalence of iron deficiency 26213.3.5 Effects of iron deficiency 263
13.4 Iron requirements during pregnancy and lactation 26413.5 Iron supplementation and fortification 26713.6 Evidence used for estimating recommended nutrient intakes 26813.7 Recommendations for iron intakes 27113.8 Recommendations for future research 272References 272
14. Vitamin B12 27914.1 Role of vitamin B12 in human metabolic processes 27914.2 Dietary sources and availability 27914.3 Absorption 28014.4 Populations at risk for, and consequences of, vitamin B12
deficiency 28014.4.1 Vegetarians 28014.4.2 Pernicious anaemia 28114.4.3 Atrophic gastritis 281
14.5 Vitamin B12 interaction with folate or folic acid 28214.6 Criteria for assessing vitamin B12 status 28314.7 Recommendations for vitamin B12 intakes 284
14.7.1 Infants 28514.7.2 Children 28514.7.3 Adults 28514.7.4 Pregnant women 28614.7.5 Lactating women 286
14.8 Upper limits 28614.9 Recommendations for future research 287References 287
15. Folate and folic acid 28915.1 Role of folate and folic acid in human metabolic processes 289
VITPR 3/12/05 16:50 Page x
15.2 Populations at risk for folate deficiency 29415.3 Dietary sources of folate 29415.4 Recommended nutrient intakes for folate 29515.5 Differences in bioavailability of folic acid and food folate:
implications for the recommended intakes 29715.6 Considerations in viewing recommended intakes for folate 297
15.6.1 Neural tube defects 29715.6.2 Cardiovascular disease 29815.6.3 Colorectal cancer 298
15.7 Upper limits 29915.8 Recommendations for future research 299References 300
16. Iodine 30316.1 Role of iodine in human metabolic processes 30316.2 Populations at risk for iodine deficiency 30416.3 Dietary sources of iodine 30516.4 Recommended intakes for iodine 306
16.4.1 Infants 30716.4.2 Children 30916.4.3 Adults 30916.4.4 Pregnant women 310
16.5 Upper limits 31116.5.1 Iodine intake in areas of moderate iodine deficiency 31216.5.2 Iodine intake in areas of iodine sufficiency 31316.5.3 Excess iodine intake 314
References 315
17. Food as a source of nutrients 31817.1 Importance of defining food-based recommendations 31817.2 Dietary diversification when consuming cereal- and
tuber-based diets 32517.2.1 Vitamin A 32517.2.2 Vitamin C 32517.2.3 Folate 32617.2.4 Iron and zinc 326
17.3 How to accomplish dietary diversity in practice 32717.4 Practices which will enhance the success of food-based
approaches 32817.5 Delineating the role of supplementation and food fortification
for micronutrients which cannot be supplied by food 32917.5.1 Fortification 330
CONTENTS
xi
VITPR 3/12/05 16:50 Page xi

VITAMIN AND MINERAL REQUIREMENTS IN HUMAN NUTRITION
xii
17.5.2 Supplementation 33217.6 Food-based dietary guidelines 33317.7 Recommendations for the future 33517.8 Future research needs 335References 336
Annex 1: Recommended nutrient intakes – minerals 338Annex 2: Recommended nutrient intakes – water- and fat-soluble
vitamins 340
VITPR 3/12/05 16:50 Page xii
Foreword
In the past 20 years, micronutrients have assumed great public health im-portance. As a consequence, considerable research has been carried out tobetter understand their physiological role and the health consequences ofmicronutrient-deficient diets, to establish criteria for defining the degree ofpublic health severity of micronutrient malnutrition, and to develop preven-tion and control strategies.
One of the main outcomes of this process is greatly improved knowledgeof human micronutrient requirements, which is a crucial step in understand-ing the public health significance of micronutrient malnutrition and identify-ing the most appropriate measures to prevent them. This process also led tosuccessive expert consultations and publications organized jointly by theFood and Agriculture Organization of the United Nations (FAO), the WorldHealth Organization (WHO) and the International Atomic Energy Agency(IAEA) providing up-to-date knowledge and defining standards for micronu-trient requirements in 19731, 19882 and in 19963. In recognition of this rapidlydeveloping field, and the substantial new advances that have been made sincethe most recent publication in 1996, FAO and WHO considered it appropri-ate to convene a new expert consultation to re-evaluate the role of micronu-trients in human health and nutrition.
To this end, background papers on the major vitamins, minerals and traceelements were commissioned and reviewed at a Joint FAO/WHO ExpertConsultation (Bangkok, 21–30 September 1998). That Expert Consultationwas assigned three main tasks:
• Firstly, the Consultation was asked to review the full range of vitamin andmineral requirements—19 micronutrients in all—including their role in
xiii
1 Trace elements in human nutrition. Report of a WHO Expert Committee. Geneva, WorldHealth Organization, 1973 (WHO Technical Report Series, No. 532).
2 Requirements of vitamin A, iron, folate and vitamin B12. Report of a Joint FAO/WHOExpert Consultation. Rome, Food and Agriculture Organization of the United Nations,1988 (FAO Food and Nutrition Series, No. 23).
3 Trace elements in human nutrition and health. Geneva, World Health Organization, 1996.
VITPR 3/12/05 16:50 Page xiii
VITAMIN AND MINERAL REQUIREMENTS IN HUMAN NUTRITION
xiv
normal human physiology and metabolism, and conditions of deficiency.This included focusing on and revising the requirements for essential vita-mins and minerals, including vitamins A, C, D, E, and K; the B vitamins;calcium; iron; magnesium; zinc; selenium; and iodine, based on the avail-able scientific evidence.
• Secondly, the Consultation was asked to prepare a report that wouldinclude recommended nutrient intakes for vitamins A, C, D, E, and K; theB vitamins; calcium; iron; magnesium; zinc; selenium; and iodine. Thereport should provide practical advice and recommendations which willconstitute an authoritative source of information to all those from MemberStates who work in the areas of nutrition, agriculture, food production anddistribution, and health promotion.
• Thirdly, the Consultation was asked to identify key issues for futureresearch concerning each vitamin and mineral under review and to makepreliminary recommendations on that research.
The present report presents the outcome of the Consultation combinedwith up-to-date evidence that has since become available to answer a numberof issues which remained unclear or controversial at the time of the Consul-tation. It was not originally thought that such an evidence-based consultationprocess would be so controversial, but the reality is that there are surprisinglyfew data on specific health status indicators on which to base conclusions,whereas there is a great deal of information relative to overt deficiency diseaseconditions. The defining of human nutrient requirements and recommendedintakes are therefore largely based on expert interpretation and consensus onthe best available scientific information.
When looking at recommended nutrient intakes (RNIs) in industrializedcountries over the last 25 years, it is noticeable that for some micronutrientsthese have gradually increased. The question is whether this is the result ofbetter scientific knowledge and understanding of the biochemical role of thenutrients, or whether the criteria for setting requirement levels have changed,or a combination of both. The scientific knowledge base has vastly expanded,but it appears that more rigorous criteria for defining recommended levels isalso a key factor.
RNIs for vitamins and minerals were initially established on the under-standing that they are meant to meet the basic nutritional needs of over 97%of the population. However, a fundamental criterion in industrialized coun-tries has become one of the presumptive role that these nutrients play in “pre-venting” an increasing range of disease conditions that characterize affectedpopulations. The latter approach implies trying to define the notion of
VITPR 3/12/05 16:50 Page xiv
“optimal nutrition”, and this has been one of the factors nudging definedrequirements to still higher levels.
This shift in the goal for setting RNIs is not without reason. The popula-tions that are targeted for prevention through “optimal nutrition” are char-acterized by sedentary lifestyles and longer life expectancy. The populationsin industrialized countries are ageing, and concern for the health of the olderperson has grown accordingly. In contrast, the micronutrient needs of popu-lation groups in developing countries are still viewed in terms of millionsexperiencing deficiency, and are then more appropriately defined as those thatwill satisfy basic nutritional needs of physically active younger populations.Nevertheless, one also needs to bear in mind the double burden of under- andovernutrition, which is growing rapidly in many developing countries.
Concern has been raised about possible differences in micronutrient needsof populations with different lifestyles for a very practical reason. The logicbehind the establishment of micronutrient needs of industrialized nations hascome about at the same time as a large and growing demand for a wide varietyof supplements and fortificants, and manufacturers have responded quicklyto meet this market. This phenomenon could easily skew national strategiesfor nutritional development, with an increased tendency to seek to resolve themicronutrient deficiency problems of developing countries by promotingsupplements and fortification strategies, rather than through increasing theconsumption of adequate and varied diets. Higher levels of RNIs often set indeveloped countries can easily be supported because they can be met withsupplementation in addition to food which itself is often fortified. In contrast,it often becomes difficult to meet some of the micronutrient needs in somepopulations of developing countries by consuming locally available food,because foods are often seasonal, and neither supplementation nor fortifica-tion reach vulnerable population groups.
Among the nutrients of greatest concern is calcium; the RNI may be difficult to meet in the absence of dairy products. The recently revised UnitedStates/Canada dietary reference intakes (DRIs) propose only an acceptableintake (AI) for calcium instead of a recommended daily allowance (RDA) inrecognition of the fact that intake data are out of step with the relatively highintake requirements observed with experimentally derived values.1
Another nutrient of concern is iron, particularly during pregnancy, wheresupplementation appears to be essential during the second half of pregnancy.
FOREWORD
xv
1 Food and Nutrition Board. Dietary reference intakes for calcium, phosphorus, magnesium,vitamin D, and fluoride. Washington, DC. National Academy Press. 1997.
VITPR 3/12/05 16:50 Page xv
VITAMIN AND MINERAL REQUIREMENTS IN HUMAN NUTRITION
xvi
Folic acid requirements are doubled for women of childbearing age to preventthe incidence of neural tube defects in the fetus. Conversion factors forcarotenoids are under review, with the pending conclusion that servings ofgreen leafy vegetables needed to meet vitamin A requirements probably needto be at least doubled. In view of this uncertainty, only “recommended safeintakes” rather than RNIs are provided for this vitamin.
Selenium is the subject of growing interest because of its properties as anantioxidant. The RNIs recommended herein for this micronutrient are gen-erally lower than those derived by the United States Food and NutritionBoard because the latter are calculated on a cellular basis, whereas the presentreport relies on more traditional whole-body estimates.1
Are these “developments” or “new understandings” appropriate for andapplicable in developing countries? The scientific evidence for answering thisquestion is still emerging, but the time may be near when RNIs may need tobe defined differently, taking into account the perspective of developing coun-tries based on developing country data. There may be a need to identify somebiomarkers that are specific to conditions in each developing country. Thereis therefore a continuing urgent need for research to be carried out in devel-oping countries about their specific nutrient needs. The current situation alsoimplies that the RNIs for the micronutrients of concern discussed above willneed to be re-evaluated as soon as significant additional data are available.
Kraisid Tontisirin Graeme ClugstonDirector DirectorDivision of Food and Nutrition Department of Nutrition forFood and Agriculture Organization Health and Developmentof the United Nations World Health Organization
1 Food and Nutrition Board. Dietary reference intakes for vitamin C, vitamin E, seleniumand carotenoids. A report of the Panel on Dietary Antioxidants and Related Compounds.Washington, DC, National Academy Press, 2000.
VITPR 3/12/05 16:50 Page xvi
Acknowledgements
We wish to thank the authors of the background papers: Leif Hallberg,Department of Clinical Nutrition, Göteborg University, Annedalsklinikerna,Sahlgrenska University Hospital, Göteborg, Sweden; Glenville Jones, Depart-ment of Biochemistry—Medicine, Queen’s University, Kingston, Ontario,Canada; Madhu Karmarkar, Senior Adviser, International Council forControl of Iodine Deficiency Disorders, New Delhi, India; Mark Levine,National Institute of Diabetes & Digestive & Kidney Diseases, National Insti-tute of Health, Bethesda, MD, USA; Donald McCormick, Department ofBiochemistry, Emory University School of Medicine, Atlanta, GA, USA;Colin Mills, Director, Postgraduate Studies, Rowett Research Institute,Bucksburn, Scotland; Christopher Nordin, Institute of Medical and Veteri-nary Sciences, Clinical Biochemistry Division, Adelaide, Australia; MariaTheresa Oyarzum, Institute of Nutrition and Food Technology (INTA), University of Chile, Santiago, Chile; Chandrakant Pandav, Regional Coordinator, South-Asia and Pacific International Council for Control of Iodine Deficiency Disorders; and Additional Professor, Center for Community Medicine, All India Institute of Medical Sciences, New Delhi,India; Brittmarie Sandström,1 Research Department of Human Nutrition, TheRoyal Veterinary and Agricultural University, Frederiksberg, Denmark; JohnScott, Department of Biochemistry, Trinity College, Dublin, Ireland; MartinShearer, Vitamin K Research Unit of the Haemophilia Centre, The RayneInstitute, St Thomas’s Hospital, London, England; Ajay Sood, Department ofEndocrinology and Metabolism, All India Institute of Medical Sciences, NewDelhi, India; David Thurnham, Howard Professor of Human Nutrition,School of Biomedical Sciences, Northern Ireland Centre for Diet and Health,University of Ulster, Londonderry, Northern Ireland; Maret Traber, LinusPauling Institute, Department of Nutrition and Food Management, OregonState University, Corvallis, OR, USA; Ricardo Uauy, Director, Institute ofNutrition and Food Technology (INTA), University of Chile, Santiago,
xvii
1 Deceased.
VITPR 3/12/05 16:50 Page xvii
VITAMIN AND MINERAL REQUIREMENTS IN HUMAN NUTRITION
xviii
Chile; Barbara Underwood, formerly Scholar-in-Residence, Food and Nutrition Board, Institute of Medicine, National Academy of Sciences, Washington, DC, USA; and Cees Vermeer, Faculteit der Geneeskunde Biochemie, Department of Biochemistry, University of Maastricht, Maas-tricht, Netherlands.
A special acknowledgement is made to the following individuals for theirvaluable contributions to, and useful comments on, the background docu-ments: Christopher Bates, Medical Research Council, Human NutritionResearch, Cambridge, England; Robert E. Black, Department of InternationalHealth, Johns Hopkins School of Hygiene and Public Health, Baltimore, MD,USA; James Blanchard, Pharmaceutical Sciences, Department of Pharmacol-ogy and Toxicology, University of Arizona, Tucson, AZ, USA; ThomasBothwell, Faculty of Medicine, University of the Witwatersrand, Witwater-srand, South Africa; Chen Chunming, Senior Adviser, Chinese Academy ofPreventive Medicine, Beijing, China; William Cohn, F. Hoffman-La RocheLtd, Division of Vitamins, Research and Technology Development, Basel,Switzerland; François Delange, International Council for Control of IodineDeficieny Disorders, Brussels, Belgium; C. Gopalan, President, NutritionFoundation of India, New Delhi, India; Robert P. Heaney, Creighton Uni-versity Medical Center, Omaha, NE, USA; Basil Hetzel, Children’s HealthDevelopment Foundation, Women’s and Children’s Hospital, North Ade-laide, Australia; Glenville Jones, Department of Biochemistry—Medicine,Queen’s University, Kingston, Ontario, Canada; Walter Mertz,1 Rockville,MD, USA; Ruth Oniang’o, Jomo Kenyatta University of Agriculture andTechnology, Nairobi, Kenya; Robert Parker, Division of Nutritional Sciences,Cornell University, Ithaca, NY, USA; Robert Russell, Professor of Medicineand Nutrition and Associate Director, Human Nutrition Research Center onAging, Tufts University, United States Department of Agriculture Agricul-tural Research Service, Boston, MA, USA; Tatsuo Suda, Department of Bio-chemistry, Showa University School of Dentistry, Tokyo, Japan; John Suttie,Department of Biochemistry, University of Wisconsin-Madison, Madison,WI, USA; Henk van den Berg, TNO Nutrition and Food Research Institute,Zeist, Netherlands; Keith West Jr., Johns Hopkins School of Hygiene andPublic Health, Division of Human Nutrition, Baltimore, MD, USA; andParvin Zandi, Head, Department of Food Science and Technology, NationalNutrition & Food Technology Research Institute, Tehran, Islamic Republicof Iran.
1 Deceased.
VITPR 3/12/05 16:50 Page xviii
Acknowledgements are also made to the members of the Secretariat: RatkoBuzina, formerly Programme of Nutrition, WHO, Geneva, Switzerland; JoanMarie Conway, Consultant, FAO, Rome, Italy; Richard Dawson, Consultant,Food and Nutrition Division, FAO, Rome, Italy; Sultana Khanum, Pro-gramme of Nutrition, WHO, Geneva, Switzerland; John R. Lupien, formerlyDirector, Food and Nutrition Division, FAO, Rome, Italy; Blab Nandi,Senior Food and Nutrition Officer, FAO Regional Office for Asia and thePacific, Bangkok, Thailand; Joanna Peden, Public Health Nutrition Unit,London School of Hygiene and Tropical Medicine, London, England; andZeina Sifri, Consultant, Food and Nutrition Division, FAO, Rome, Italy.
Finally, we express our special appreciation to Guy Nantel who coordi-nated the FAO edition of the report, and to Bruno de Benoist who wasresponsible for the WHO edition in close collaboration with Maria Anders-son. We also wish to thank Kai Lashley and Ann Morgan for their assistancein editing the document and Anna Wolter for her secretarial support.
ACKNOWLEDGEMENTS
xix
VITPR 3/12/05 16:50 Page xix

VITPR 3/12/05 16:50 Page xx
1. Concepts, definitions and approachesused to define nutritional needs andrecommendations
1
1.1 IntroductionThe dietary requirement for a micronutrient is defined as an intake level whichmeets a specified criteria for adequacy, thereby minimizing risk of nutrientdeficit or excess. These criteria cover a gradient of biological effects related toa range of nutrient intakes which, at the extremes, include the intake requiredto prevent death associated with nutrient deficit or excess. However, for nutri-ents where insufficient data on mortality are available, which is the case formost micronutrients discussed in this report, other biological responses mustbe defined. These include clinical disease as determined by signs and symp-toms of nutrient deficiency, and subclinical conditions identified by specificbiochemical and functional measures. Measures of nutrient stores or criticaltissue pools may also be used to determine nutrient adequacy.
Functional assays are presently the most relevant indices of subclinical con-ditions related to vitamin and mineral intakes. Ideally, these biomarkersshould be sensitive to changes in nutritional state while at the same time bespecific to the nutrient responsible for the subclinical deficiency. Often, themost sensitive indicators are not the most specific; for example, plasma fer-ritin, a sensitive indicator of iron status, may change not only in response toiron supply, but also as a result of acute infection or chronic inflammatoryprocesses. Similarly anaemia, the defining marker of dietary iron deficiency,may also result from, among other things, deficiencies in folate, vitamin B12
or copper.The choice of criteria used to define requirements is of critical importance,
since the recommended nutrient intake to meet the defined requirement willclearly vary, depending, among other factors, on the criterion used to definenutrient adequacy (1, 2, 3). Unfortunately, the information base to scientifi-cally support the definition of nutritional needs across age ranges, sex andphysiologic states is limited for many nutrients. Where relevant and possible,requirement estimates presented here include an allowance for variations inmicronutrient bioavailability and utilization. The use of nutrient balance todefine requirements has been avoided whenever possible, since it is now
VIT1_P001-016 3/12/05 16:53 Page 1
VITAMIN AND MINERAL REQUIREMENTS IN HUMAN NUTRITION
2
generally recognized that balance can be reached over a wide range of nutri-ent intakes. However, requirement levels defined using nutrient balance havebeen used if no other suitable data are available.
1.2 Definition of termsThe following definitions relate to the micronutrient intake from food andwater required to promote optimal health, that is, prevent vitamin and mineraldeficiency and avoid the consequences of excess. Upper limits of nutrientintake are defined for specific vitamins and minerals where there is a poten-tial problem with excess either from food or from food in combination withnutrient supplements.
1.2.1 Estimated average requirementEstimated average requirement (EAR) is the average daily nutrient intake levelthat meets the needs of 50% of the “healthy” individuals in a particular ageand gender group. It is based on a given criteria of adequacy which will varydepending on the specified nutrient. Therefore, estimation of requirementstarts by stating the criteria that will be used to define adequacy and thenestablishing the necessary corrections for physiological and dietary factors.Once a mean requirement value is obtained from a group of subjects, thenutrient intake is adjusted for interindividual variability to arrive at a recommendation (4, 5, 6).
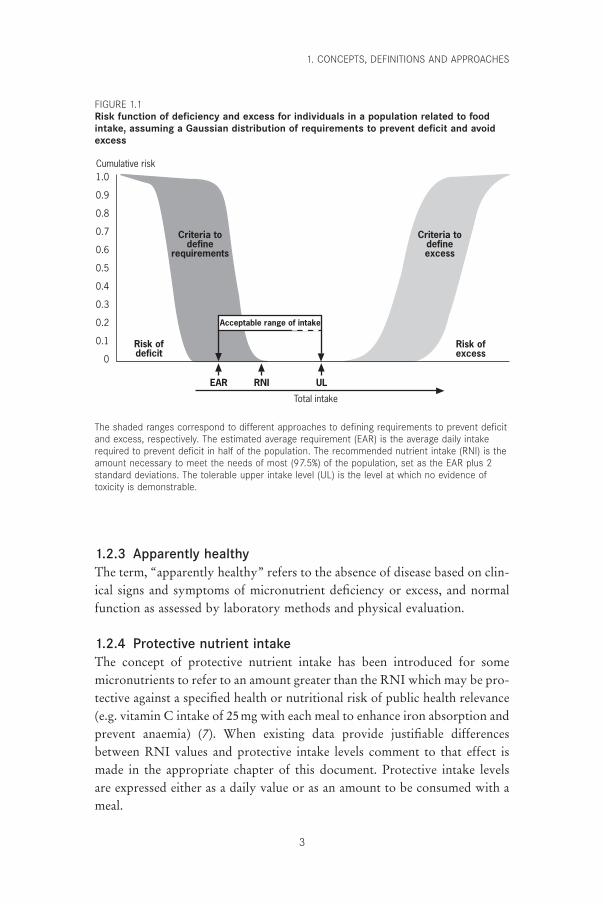
1.2.2 Recommended nutrient intakeRecommended nutrient intake (RNI) is the daily intake, set at the EAR plus2 standard deviations (SD), which meets the nutrient requirements of almostall apparently healthy individuals in an age- and sex-specific populationgroup. If the distribution of requirement values is not known, a Gaussian ornormal distribution can be assumed, and from this it is expected that the meanrequirement plus 2 SD will cover the nutrient needs of 97.5% of the popula-tion. If the SD is not known, a value based on each nutrient’s physiology canbe used and in most cases a variation in the range of 10–12.5% can be assumed(exceptions are noted within relevant chapters). Because of the considerabledaily variation in micronutrient intake, daily requirement refers to the averageintake over a period of time. The cumulative risk function for deficiency andtoxicity is defined in Figure 1.1, which illustrates that as nutrient intakeincreases the risk of deficit drops and at higher intakes the risk of toxicityincreases. The definition of RNI used in this report is equivalent to that ofthe recommended dietary allowance (RDA) as used by the Food and Nutri-tion Board of the United States National Academy of Sciences (4, 5, 6).
VIT1_P001-016 3/12/05 16:53 Page 2
1.2.3 Apparently healthyThe term, “apparently healthy” refers to the absence of disease based on clin-ical signs and symptoms of micronutrient deficiency or excess, and normalfunction as assessed by laboratory methods and physical evaluation.
1.2.4 Protective nutrient intakeThe concept of protective nutrient intake has been introduced for somemicronutrients to refer to an amount greater than the RNI which may be pro-tective against a specified health or nutritional risk of public health relevance(e.g. vitamin C intake of 25mg with each meal to enhance iron absorption andprevent anaemia) (7). When existing data provide justifiable differencesbetween RNI values and protective intake levels comment to that effect ismade in the appropriate chapter of this document. Protective intake levels are expressed either as a daily value or as an amount to be consumed with ameal.
1. CONCEPTS, DEFINITIONS AND APPROACHES
3
Criteria todefine
requirements
Criteria todefineexcess
1.0
0.9
0.8
0.7
0.6
0.5
0.4
0.3
0.2
0.1
0
Total intake
Risk ofdeficit
Risk ofexcess
Cumulative risk
Acceptable range of intake
EAR RNI UL
The shaded ranges correspond to different approaches to defining requirements to prevent deficitand excess, respectively. The estimated average requirement (EAR) is the average daily intakerequired to prevent deficit in half of the population. The recommended nutrient intake (RNI) is theamount necessary to meet the needs of most (97.5%) of the population, set as the EAR plus 2standard deviations. The tolerable upper intake level (UL) is the level at which no evidence oftoxicity is demonstrable.
FIGURE 1.1Risk function of deficiency and excess for individuals in a population related to foodintake, assuming a Gaussian distribution of requirements to prevent deficit and avoidexcess
VIT1_P001-016 3/12/05 16:53 Page 3
VITAMIN AND MINERAL REQUIREMENTS IN HUMAN NUTRITION
4
1.2.5 Upper tolerable nutrient intake levelUpper limits (ULs) of nutrient intake have been set for some micronutrientsand are defined as the maximum intake from food, water and supplementsthat is unlikely to pose risk of adverse health effects from excess in almost all(97.5%) apparently healthy individuals in an age- and sex-specific populationgroup (see Figure 1.1). ULs should be based on long-term exposure to allfoods, including fortified food products. For most nutrients no adverse effectsare anticipated when they are consumed as foods because their absorptionand/or excretion are regulated. The special situation of consumption of nutri-tional supplements which, when added to the nutrient intake from food, mayresult in a total intake in excess of the UL is addressed for specific micronu-trients in subsequent chapters, as appropriate. The ULs as presented here do not meet the strict definition of the “no observed effect level” (NOEL)used in health risk assessment by toxicologists because in most cases, adose–response curve for risk from exposure to a nutrient will not be available(8). For additional details on derivation of ULs, please refer to standard textson this subject (9, 10).
The range of intakes between the RNI and UL should be considered suf-ficient to prevent deficiency while avoiding toxicity. If no UL can be derivedfrom experimental or observational data in humans, the UL can be definedfrom available data on the range of observed dietary intake of apparentlyhealthy populations. In the absence of known adverse effects a default valuefor the UL of 10 times the RNI is frequently used (5, 10, 11).
1.2.6 Nutrient excessTraditional toxicology-based approaches to assessing adverse health effectsfrom nutrient excess start by defining either the highest intake level at whichno observed adverse effects of biological significance are found (i.e. the noobserved adverse effect level (NOAEL)), or the lowest intake level at whichadverse effects are observed (i.e. the lowest observed adverse effect level thatare (LOAEL)). Uncertainty or modifying factors are then used to adjust aknown NOAEL or LOAEL to define reference doses which representchronic intake levels that are considered safe, or of no significant health risk,for humans. The nature of the adjustment used to modify the acceptableintake indicated by the NOAEL or LOAEL is based on the type and qualityof the available data and its applicability to human populations (5, 9, 11).
Uncertainty factors are used in several circumstances: when the experi-mental data on toxicity is obtained from animal studies; when the data fromhumans are insufficient to fully account for variability of populations orspecial sensitivity subgroups of the general population; when the NOAEL
VIT1_P001-016 3/12/05 16:53 Page 4
has been obtained in studies of insufficient duration to assure chronic safety;when the database which supports the NOAEL is incomplete; or when theexperimental data provide a LOAEL instead of a true NOAEL. The usualvalue for each uncertainty factor is 10, leading to a 10-fold reduction in theacceptable intake level for each of the considerations listed above. The reduc-tions may be used in isolation or in combination depending on the specificmicronutrient being assessed.
Modifying factors are additional uncertainty factors which have a value of1 or more but less than 10, and are based on expert judgement of the overallquality of the data available. Given the paucity of human data, the limitationsof animal models and uncertainties of interpretation, the traditional toxico-logical approach to determining limits for intake, as summarized here, may infact lead to the definition of intakes which promote or even induce deficiencyif followed by a population. This has recently been recognized by the WHOInternational Programme on Chemical Safety, and a special risk assessmentmodel has been derived for elements that are both essential and have poten-tial toxicity (5, 9).
1.2.7 Use of nutrient intake recommendations in populationassessment
Recommendations given in this report are generally presented as populationRNIs with a corresponding UL where appropriate. They are not intended todefine the daily requirements of an individual. However “healthy” individu-als consuming within the range of the RNI and the UL can expect to mini-mize their risk of micronutrient deficit and excess. Health professionals caringfor special population groups that do not meet the defined characterizationof “healthy” should, where possible, adjust these nutrient-based recommen-dations to the special needs imposed by disease conditions and/or environ-mental situations.
The use of dietary recommendations in assessing the adequacy of nutrientintakes of populations requires good quantitative information about the dis-tribution of usual nutrient intakes as well as knowledge of the distribution ofrequirements. The assessment of intake should include all sources of intake,that is, food, water and supplements; appropriate dietary and food composi-tion data are thus essential to achieve a valid estimate of intakes. The day-to-day variation in individual intake can be minimized by collecting intake dataover several days. There are several statistical approaches that can be used toestimate the prevalence of inadequate intakes from the distribution of intakesand requirements. One such approach the EAR cut-point method whichdefines the fraction of a population that consumes less than the EAR for a
1. CONCEPTS, DEFINITIONS AND APPROACHES
5
VIT1_P001-016 3/12/05 16:53 Page 5
VITAMIN AND MINERAL REQUIREMENTS IN HUMAN NUTRITION
6
given nutrient. It assumes that the variability of individual intakes is at leastas large as the variability in requirements and that the distribution of intakesand requirements are independent of each other. The latter is most likely tobe true in the case of vitamins and minerals, but clearly not for energy. TheEAR cut-point method requires a single population with a symmetrical dis-tribution around the mean. If these conditions are met, the prevalence of inad-equate intakes corresponds to the proportion of intakes that fall below theEAR. It is clearly inappropriate to examine mean values of population intakeand RNI to define the population at risk of inadequacy. The relevant infor-mation is the proportion of intakes in a population group that is below theEAR, not below the RNI (4, 5).
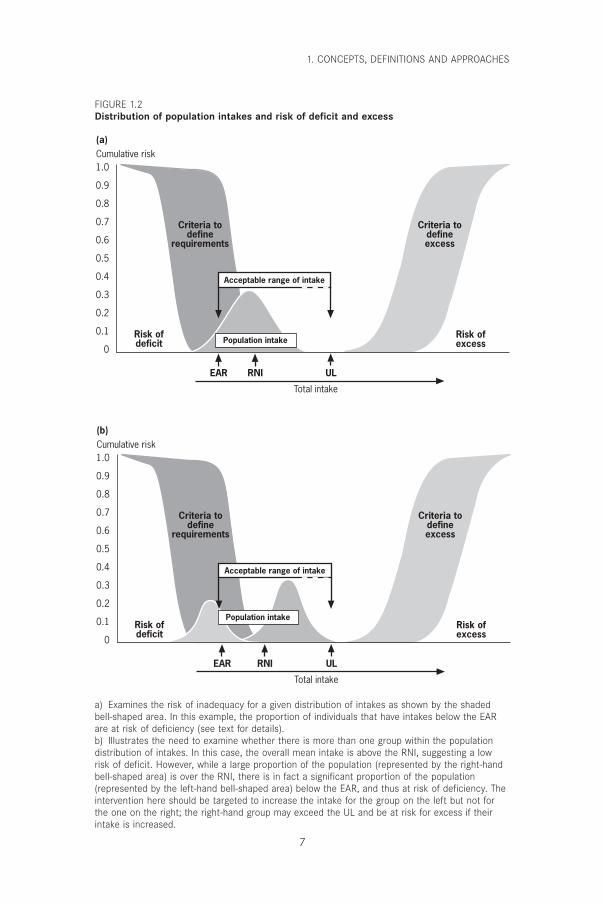
Figure 1.2 serves to illustrate the use of nutrient intake recommendationsin risk assessment considering the model presented in Figure 1.1; the distribu-tions of nutrient intakes for a population have been added to explore risk ofexcess or deficit (2, 4, 5). Figure 1.2a presents the case of a single populationwith intakes ranging from below the EAR to the UL with a mean intake closeto the RNI. The fraction of the population that is below the EAR representsthe prevalence of deficit; as depicted in the figure this is a sizeable group despitethe fact that the mean intake for the population is close to the RNI. Figure1.2b presents the case of a bimodal distribution of population intakes wherethe conditions to use the EAR cut-point method are not met. In this case it isclear that a targeted intervention to increase the intake of one group but notthe other is needed. For example, if we examine the iron intake of a popula-tion we may find that vegetarians may be well below the recommended intakewhile those who consume meat may be getting sufficient iron. To achieve ade-quacy in this case we need to increase iron intake in the former but not thelatter group (2, 12).
1.3 Approaches used in estimating nutrient intakes foroptimal health
The methods used to estimate nutritional requirements have changed overtime. Four currently used approaches are briefly outlined below: the clinicalapproach, nutrient balance, functional indicators of nutritional sufficiency(biochemical, physiological, molecular), and optimal nutrient intake. Adetailed analysis of the relative merits of these approaches is beyond the scopeof this chapter, but additional information on each can be found in subsequentchapters of this report. When no information is available the default approachto define a recommended intake based on the range of observed intakes of“healthy” populations is used.
VIT1_P001-016 3/12/05 16:53 Page 6
1. CONCEPTS, DEFINITIONS AND APPROACHES
7
Criteria todefine
requirements
Criteria todefineexcess
Population intake
Criteria todefine
requirements
Criteria todefineexcess
Population intake
1.0
0.9
0.8
0.7
0.6
0.5
0.4
0.3
0.2
0.1
0
Total intake
Risk ofdeficit
Risk ofexcess
Cumulative risk
1.0
0.9
0.8
0.7
0.6
0.5
0.4
0.3
0.2
0.1
0
Total intake
Risk ofdeficit
Risk ofexcess
Cumulative risk
Acceptable range of intake
EAR RNI UL
(a)
Acceptable range of intake
EAR RNI UL
(b)
a) Examines the risk of inadequacy for a given distribution of intakes as shown by the shadedbell-shaped area. In this example, the proportion of individuals that have intakes below the EARare at risk of deficiency (see text for details).b) Illustrates the need to examine whether there is more than one group within the populationdistribution of intakes. In this case, the overall mean intake is above the RNI, suggesting a lowrisk of deficit. However, while a large proportion of the population (represented by the right-handbell-shaped area) is over the RNI, there is in fact a significant proportion of the population(represented by the left-hand bell-shaped area) below the EAR, and thus at risk of deficiency. Theintervention here should be targeted to increase the intake for the group on the left but not forthe one on the right; the right-hand group may exceed the UL and be at risk for excess if theirintake is increased.
FIGURE 1.2Distribution of population intakes and risk of deficit and excess
VIT1_P001-016 3/12/05 16:53 Page 7
VITAMIN AND MINERAL REQUIREMENTS IN HUMAN NUTRITION
8
1.3.1 The clinical approachThe traditional criteria to define essentiality of nutrients for human healthrequire that a) a disease state, or functional or structural abnormality is presentif the nutrient is absent or deficient in the diet and, b) that the abnormalitiesare related to, or a consequence of, specific biochemical or functional changesthat can be reversed by the presence of the essential dietary component. End-points considered in recent investigations of essentiality of nutrients in exper-imental animals and humans include: reductions in ponderal or linear growthrates, altered body composition, compromised host defense systems, impair-ment of gastrointestinal or immune function, abnormal cognitive perform-ance, increased susceptibility to disease, increased morbidity and changes inbiochemical measures of nutrient status. To establish such criteria for partic-ular vitamins and minerals requires a solid understanding of the biologicaleffects of specific nutrients, as well as sensitive instrumentation to measurethe effects, and a full and precise knowledge of the amount and chemical formof nutrients supplied by various foods and their interactions (2, 12).
1.3.2 Nutrient balanceNutrient balance calculations typically involve assessing input and output andestablishing requirement at the point of equilibrium (except in the case ofchildhood, pregnancy and lactation where the additional needs for growth,tissue deposition and milk secretion are considered). However, in most cases,balance based on input–output measurements is greatly influenced by priorlevel of intake, that is, subjects adjust to high intakes by increasing outputand, conversely, they lower output when intake is low. Thus, if sufficient timeis provided to accommodate to a given level of intake, balance can be achieved,and for this reason, the exclusive use of nutrient balance to define require-ments should be avoided whenever possible (1, 5, 13).
In the absence of alternative sources of data, a starting point in definingnutritional requirements using the balance methodology is the use of facto-rial estimates of nutritional need. The “factorial model” is based on measur-ing the components that must be replaced when the intake of a specificnutrient is minimal or nil. This is the minimum possible requirement valueand encompasses a) replacement of losses from excretion and utilization atlow or no intake, b) the need to maintain body stores and, c) an intake thatis usually sufficient to prevent clinical deficiency (6). Factorial methodsshould be used only as a first approximation for the assessment of individualrequirements, or when functional clinical or biochemical criteria of adequacyhave not been established. Furthermore, although nutrient balance studiesmay be of help in defining mineral needs, they are of little use for defining
VIT1_P001-016 3/12/05 16:53 Page 8
vitamin requirements (14, 15). This is because the carbon dioxide formed onthe oxidation of vitamins is lost in expired air or hard to quantify, since itbecomes part of the body pool and cannot be traced to its origin unless thevitamin is provided in an isotopically labelled form (15).
1.3.3 Functional responsesVarious biomarkers are presently being evaluated for their specificity and sen-sitivity to assess nutrient-related organ function and thus predict deficiencyor toxicity.
In terms of defining nutrient needs for optimal function, recent efforts havefocused on the assessment of:
• Neurodevelopment: monitoring electro-physiologic responses to definedsensory stimuli; sleep–wake cycle organization; and neurobehavioural tests(16, 17, 18).
• Bone health: measuring bone mineral density by X-ray absorptiometry;markers of collagen synthesis and turnover; and hormonal responses asso-ciated with bone anabolism and catabolism (19, 20).
• Biochemical normalcy: measuring plasma and tissue concentrations of sub-strates or nutrient responsive enzymes, hormones or other indices of ana-bolic and catabolic activity; and plasma concentrations and tissue retentionin response to a fixed nutrient load (21, 22).
• Immune function: measuring humoral and cellular response to antigens andmitogens in vitro or in vivo; antibody response to weak antigens such asimmunizations; T-cell populations; cytokine responses; and mediators ofinflammation related to tissue protection and damage (23, 24).
• Body composition and tissue metabolic status: using stable isotope ass-essment of body compartments (e.g. body water, lean and fat mass); radiation-determined body compartments measured by dual energy X-ray absorptiometry (DEXA) and computerized tomography; electrical impedance and conductivity to determine body compartments; and finally,magnetic resonance imaging and spectroscopy of body and organ com-partments (i.e. brain and muscle high energy phosphate content) (25, 26).
• Bioavailability: evaluating stable and radioactive isotopes of mineral andvitamin absorption and utilization (7, 27).
• Gene expression: assessing the expression of multiple human mRNA withspecific fluorescent cDNAs probes (which currently evaluate from10000–15000 genes at a time and will soon be able to assess the expressionof the full genome); and laser detection of hybridized genes to revealmRNA abundance in relation to a given nutrient intake level. These novel
1. CONCEPTS, DEFINITIONS AND APPROACHES
9
VIT1_P001-016 3/12/05 16:53 Page 9
VITAMIN AND MINERAL REQUIREMENTS IN HUMAN NUTRITION
10
tools provide a powerful means of assessing the amount of nutrientrequired to trigger a specific mRNA response in a given tissue. These arein fact the best criteria for defining selenium needs without having tomeasure the key selenium dependent enzymes (i.e. liver or red blood cellglutathione peroxidase [GSHPx]) (28). In this case the measurement of suf-ficiency is based on the GSHPx–mRNA response to selenium supplyrather than measuring the enzymatic activity of the corresponding protein.Micro-array systems tailored to evaluate nutrient modulated expression ofkey genes may become the most effective way of assessing human nutri-tional requirements in the future (29).
1.3.4 Optimal intakeOptimal intake is a relatively new approach to deriving nutrient requirements.The question “Optimal intake for what?” is usually answered with the sug-gestion that a balanced diet or specific nutrients can improve physical andmental performance, enhance immunity, prevent cancer, or add healthy yearsto our life. This response is unfortunately often used too generally, and isusually unsupported by appropriate population-based controlled randomizedstudies (15). The preferred approach to define optimal intake is to clearlyestablish the function of interest and the level of desired function (30). Theselected function should be related in a plausible manner to the specific nutri-ent or food and serve to promote health or prevent disease.
If there is insufficient information from which to derive recommendationsbased on actual data using any of the approaches described above, the cus-tomary intake (based on an appropriate knowledge of food composition andfood consumption) of healthy populations becomes a reasonable defaultapproach. Indeed, the presently recommended nutrient intakes for terminfants of several vitamins and minerals are based on this paradigm. Thus, thenutrient intake of the breast-fed infant becomes the relevant criteria since itis assumed that human milk is the optimal food for human growth and devel-opment. In this case, all other criteria are subservient to the estimate obtainedfrom assessment of the range of documented intake observed in the full termbreast-fed infant. Precise knowledge of human milk composition and volumeof intake for postnatal age allows for the definition of the range of intakestypical for breast-fed infants. A notable exception, however, is the require-ment for vitamin K at birth, since breast milk contains little vitamin K, and the sterile colon does not provide the vitamin K formed by colonicmicroorganisms.
VIT1_P001-016 3/12/05 16:53 Page 10
Planners using RNIs are often faced with different, sometimes conflictingnumbers, recommended by respectable national scientific bodies that haveused varying approaches to define them (31, 32). In order to select the mostappropriate for a given population, national planners should consider theinformation base and the criteria that led to the numerical derivation beforedetermining which correspond more closely with the setting for which thefood-based dietary guidelines are intended. The quantified RNI estimatesderived from these various approaches may differ for one or more specificnutrients, but the effect of these numeric differences in establishing food-based dietary guidelines for the general population is often of a lesser signif-icance (2, 12, 33). Selected examples of how various criteria are used to definenumerical estimates of nutritional requirements are given below. More detailis provided in the respective chapters on individual micronutrients that follow.
CalciumAdequate calcium intake levels suggested for the United States of America arehigher than those accepted internationally, and extend the increased needs ofadolescents to young adults (i.e. those aged < 24 years) on the basis of evidencethat peak bone mass continues to increase until that age is reached (see Chapter4). Results of bone density measurements support the need for calcium intakebeyond that required for calcium balance and retention for growth. However,the situation in most Asian countries suggests that their populations may havesufficient calcium retention and bone mass despite lower levels of intake. Thisreport acknowledges these differences and suggests that calcium intake mayneed to be adjusted for dietary factors (e.g. observed animal protein, sodiumintake, vitamin D intake) and for sun exposure (which is related to geographiclocation/latitude, air pollution and other environmental conditions), sinceboth affect calcium retention.
IronIn the case of iron, the differences in quantification of obligatory losses madeby various expert groups is possibly explained by differences in environmen-tal sanitation and the prevalence of diarrhoea (34). In addition, the concernabout iron excess may be greater in places where anaemia is no longer an issue,such as in northern Europe, while in other areas iron deficiency is of para-mount significance. The use of different bioavailability adjustment factors inthe definition of iron RNIs is a useful concept because the presence of dietarycomponents that affect bioavailability differs between and within a given ecological setting. The present Expert Consultation established a rec-ommendation based on absorbed iron; the RNI thus varies according to the
1. CONCEPTS, DEFINITIONS AND APPROACHES
11
VIT1_P001-016 3/12/05 16:53 Page 11
VITAMIN AND MINERAL REQUIREMENTS IN HUMAN NUTRITION
12
bioavailability of iron in the diet. Recommended RNIs are provided for fourbioavailability factors, 5%, 10%, 12% and 15%, depending on the composi-tion of the typical local diet (see Chapter 13).
FolateFood fortification or supplementation strategies will commonly be needed tosatisfy the 400mg/day folate recommended for adolescents and adults in thisreport (based on the intake required before conception and during early preg-nancy to prevent neural tube defects) (35). Consumption from traditionalfood sources is not sufficient to meet this goal; however, food fortificationand the advent of novel foods developed by traditional breeding or by geneticmodification may eventually make it possible to meet the RNI with food-based approaches.
1.4 ConclusionsThe quantitative definition of nutrient needs and their expression as recom-mended nutrient intakes have been important components of food and nutri-tion policy and programme implementation. RNIs provide the firm scientificbasis necessary to satisfy the requirements of a group of healthy individualsand define adequacy of diets. Yet, by themselves, they are not sufficient asinstruments of nutrition policy and programmes. In fact, single nutrient-basedapproaches have been of limited use in the establishment of nutritional anddietary priorities consistent with broad public health interests at the nationaland international levels (36).
In contrast to RNIs, food-based dietary guidelines (FBDGs) as instru-ments of policy are more closely linked to diet–health relationships of relevance to a particular country or region (12). FBDGs provide a broad per-spective that examines the totality of the effects of a given dietary pattern ina given ecological setting, considering socioeconomic and cultural factors, andthe biological and physical environment, all of which affect the health andnutrition of a given population or community (2, 5). Defining the relevantpublic health problems related to diet is an essential first step in developingnutrient intake goals in order to promote overall health and reduce health risksin view of the multifactorial nature of disease. Thus, FBDGs take into accountthe customary dietary pattern, the foods available, and the factors that deter-mine the consumption of foods and indicate what aspects should be modified.
By utilizing the two approaches of FBDGs and RNIs, broad public healthinterests are supported by the use of empirically defined nutrient require-ments. The role of RNIs in the development and formulation of FBDGs issummarized in Figure 1.3. The multiple final users and applications of these
VIT1_P001-016 3/12/05 16:53 Page 12
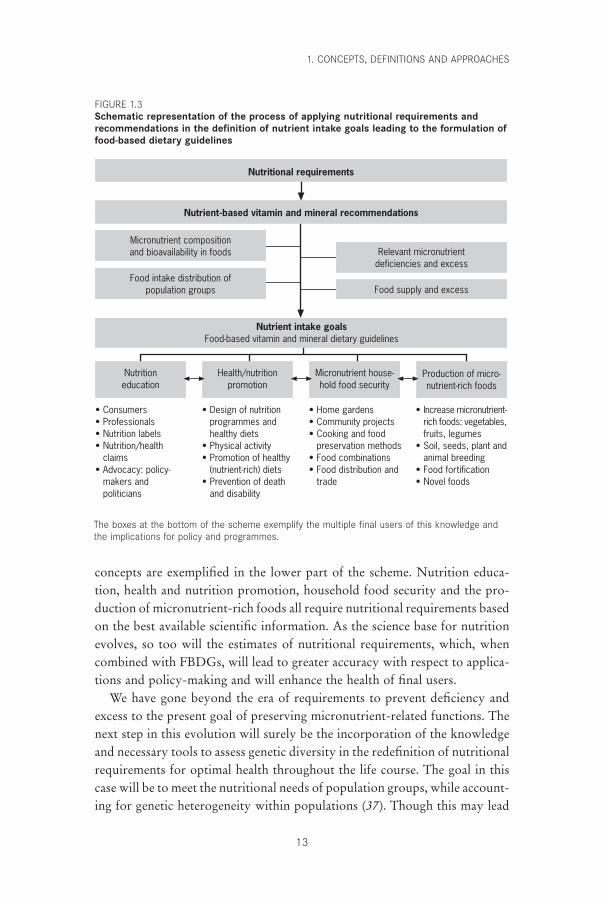
concepts are exemplified in the lower part of the scheme. Nutrition educa-tion, health and nutrition promotion, household food security and the pro-duction of micronutrient-rich foods all require nutritional requirements basedon the best available scientific information. As the science base for nutritionevolves, so too will the estimates of nutritional requirements, which, whencombined with FBDGs, will lead to greater accuracy with respect to applica-tions and policy-making and will enhance the health of final users.
We have gone beyond the era of requirements to prevent deficiency andexcess to the present goal of preserving micronutrient-related functions. Thenext step in this evolution will surely be the incorporation of the knowledgeand necessary tools to assess genetic diversity in the redefinition of nutritionalrequirements for optimal health throughout the life course. The goal in thiscase will be to meet the nutritional needs of population groups, while account-ing for genetic heterogeneity within populations (37). Though this may lead
1. CONCEPTS, DEFINITIONS AND APPROACHES
13
Nutritional requirements
Nutrient-based vitamin and mineral recommendations
Micronutrient compositionand bioavailability in foods
Food intake distribution ofpopulation groups
Relevant micronutrientdeficiencies and excess
Food supply and excess
Nutrient intake goalsFood-based vitamin and mineral dietary guidelines
Production of micro-nutrient-rich foods
Micronutrient house-hold food security
Health/nutritionpromotion
Nutritioneducation
• Consumers• Professionals• Nutrition labels• Nutrition/health
claims• Advocacy: policy-
makers andpoliticians
• Design of nutrition programmes and healthy diets
• Physical activity• Promotion of healthy
(nutrient-rich) diets• Prevention of death
and disability
• Home gardens• Community projects• Cooking and food
preservation methods• Food combinations• Food distribution and
trade
• Increase micronutrient- rich foods: vegetables,
fruits, legumes• Soil, seeds, plant and
animal breeding• Food fortification• Novel foods
The boxes at the bottom of the scheme exemplify the multiple final users of this knowledge andthe implications for policy and programmes.
FIGURE 1.3Schematic representation of the process of applying nutritional requirements andrecommendations in the definition of nutrient intake goals leading to the formulation offood-based dietary guidelines
VIT1_P001-016 3/12/05 16:53 Page 13
VITAMIN AND MINERAL REQUIREMENTS IN HUMAN NUTRITION
14
to the apparent contradiction of attempting to meet the requirements of pop-ulations based on the diverse and heterogeneous needs of individuals, it is infact, a necessary step in providing optimal health—a long life, free of physi-cal and mental disability—to all individuals.
References1. Young VR. W.O. Atwater Memorial Lecture and the 2001 ASNS President’s
Lecture. Human nutrient requirements: the challenge of the post-genome era.Journal of Nutrition, 2002, 132:621–629.
2. Uauy R, Hertrampf E. Food-based dietary recommendations: possibilities andlimitations. In: Bowman B, Russell R, eds. Present knowledge in nutrition, 8thed. Washington, DC, International Life Sciences Institute Press, 2001:636–649.
3. Aggett PJ et al. Recommended dietary allowances (RDAs), recommendeddietary intakes (RDIs), recommended nutrient intakes (RNIs), and populationreference intakes (PRIs) are not “recommended intakes”. Journal of Pediatricand Gastroenterology Nutrition, 1997, 25:236–241.
4. Food and Nutrition Board. Dietary reference intakes: applications in dietaryassessment. Washington, DC, National Academy Press, 2001.
5. Trace elements in human nutrition and health. Geneva, World Health Organization, 1996.
6. Energy and protein requirements. Report of a Joint FAO/WHO/UNU ExpertConsultation. Geneva, World Health Organization, 1985 (WHO TechnicalReport Series, No. 724; http://whqlibdoc.who.int/trs/WHO_TRS_724_(chp1--chp6).pdf, accessed 26 June 2004; http://whqlibdoc.who.int/trs/WHO_TRS_724_(chp7–chp13).pdf, accessed 26 June 2004).
7. Cook JD, Reddy MB. Effect of ascorbic acid intake on nonheme-iron absorp-tion from a complete diet. American Journal of Clinical Nutrition, 2001,73:93–98.
8. Olivares M, Araya M, Uauy R. Copper homeostasis in infant nutrition: deficitand excess. Journal of Pediatric and Gastroenterology Nutrition, 2000, 31:102–111.
9. Principles and methods for the assessment of risk from essential trace elements.Geneva, World Health Organization, 2002 (Environmental Health Criteria,No. 228).
10. Food and Nutrition Board. Dietary reference intakes. A risk assessment modelfor establishing upper intake levels for nutrients. Washington, DC, NationalAcademy Press, 1999.
11. Assessing human health risks of chemicals: derivation of guidance values forhealth-based exposure limits. Geneva, World Health Organization, 1994(Environmental Health Criteria, No. 170).
12. Preparation and use of food-based dietary guidelines. Report of a JointFAO/WHO Consultation. Geneva, World Health Organization, 1996 (WHOTechnical Report Series, No. 880).
13. Hegsted M, Linkswiler HM. Long-term effects of level of protein intake oncalcium metabolism in young adult women. Journal of Nutrition, 1981,111:244–251.
14. Food and Nutrition Board. Dietary reference intakes for vitamin A, vitaminK, arsenic, boron, chromium, copper, iodine, iron, manganese, molybdenum,nickel, silicon, vanadium, and zinc. Washington, DC, National AcademyPress, 2002.
VIT1_P001-016 3/12/05 16:53 Page 14
15. Food and Nutrition Board. Dietary reference intakes for vitamin C, vitamin E,selenium, and carotenoids. Washington, DC, National Academy Press, 2000.
16. Fenstrom J, Uauy R, Arroyo P, eds. Nutrition and brain. Basel, Karger AG,2001.
17. Lozoff B. Perinatal iron deficiency and the developing brain. PediatricResearch, 2000, 48:137–139.
18. Carlson SE, Neuringer M. Polyunsaturated fatty acid status and neuro-development: a summary and critical analysis of the literature. Lipids, 1999,34:171–178.
19. Flohr F et al. Bone mineral density and quantitative ultrasound in adults with cystic fibrosis. European Journal of Endocrinology, 2002,146:531–536.
20. Black AJ et al. A detailed assessment of alterations in bone turnover, calciumhomeostasis, and bone density in normal pregnancy. Journal of Bone andMineral Research, 2000, 15:557–563.
21. Prohaska JR, Brokate B. Lower copper, zinc-superoxide dismutase protein butnot mRNA in organs of copper-deficient rats. Archives of Biochemistry andBiophysics, 2001, 393:170–176.
22. Mize CE et al. Effect of phosphorus supply on mineral balance at high calciumintakes in very low birth weight infants. American Journal of Clinical Nutri-tion, 1995, 62:385–391.
23. Chandra RK. Nutrition and the immune system from birth to old age. Euro-pean Journal of Clinical Nutrition, 2002, 56(Suppl. 3):S73–S76.
24. Sandstrom B et al. Acrodermatitis enteropathica, zinc metabolism, copperstatus, and immune function. Archives of Pediatrics and Adolescent Medicine,1994, 148:980–985.
25. Bertocci LA, Mize CE, Uauy R. Muscle phosphorus energy state in very-low-birth-weight infants: effect of exercise. American Journal of Physiology,1992, 262:E289–E294.
26. Mayfield SR, Uauy R, Waidelich D. Body composition of low-birth-weightinfants determined by using bioelectrical resistance and reactance. AmericanJournal of Clinical Nutrition, 1991, 54:296–303.
27. Lonnerdal B. Bioavailability of copper. American Journal of Clinical Nutri-tion, 1996, 63(Suppl.):S821–S829.
28. Weiss Sachdev S, Sunde RA. Selenium regulation of transcript abundance andtranslational efficiency of glutathione peroxidase-1 and -4 in rat liver. Bio-chemical Journal, 2001, 357:851–858.
29. Endo Y et al. Dietary protein quantity and quality affect rat hepatic geneexpression. Journal of Nutrition, 2002, 132:3632–3637.
30. Koletzko B et al. Growth, development and differentiation: a functional food science approach. British Journal of Nutrition, 1998, 80(Suppl. 1):S5–S45.
31. Howson CP, Kennedy ET, Horwitz A, eds. Prevention of micronutrient defi-ciencies. Tools for policymakers and public health workers. Washington, DC,National Academy Press, 1998.
32. Preventing iron deficiency in women and children: technical consensus on keyissues. Boston, The International Nutrition Foundation, and Ottawa, The Micronutrient Initiative, 1999 (http://www.micronutrient.org/resources/publications/nvironbk.pdf, accessed 24 June 2004).
33. Nutrition and your health: dietary guidelines for Americans, 5th ed. Washing-ton, DC, United States Department of Health and Human Services, and
1. CONCEPTS, DEFINITIONS AND APPROACHES
15
VIT1_P001-016 3/12/05 16:53 Page 15
VITAMIN AND MINERAL REQUIREMENTS IN HUMAN NUTRITION
16
United States Department of Agriculture, 2000 (http://www.health.gov/dietaryguidelines/dga2000/document/frontcover.htm, accessed 24 June 2004).
34. Albonico M et al. Epidemiological evidence for a differential effect of hook-worm species, Ancylostoma duodenale or Necator americanus, on iron statusof children. International Journal of Epidemiology, 1998, 27:530–537.
35. Oakley GP, Adams MJ, Dickinson CM. More folic acid for everyone, now. Journal of Nutrition, 1996, 126(Suppl.):S751–S755.
36. International Conference on Nutrition. World declaration and plan of actionfor nutrition, 1992. Rome, Food and Agriculture Organization of the UnitedNations, 1992.
37. Ames BN, Elson-Schwab I, Silver EA. High-dose vitamin therapy stimulatesvariant enzymes with decreased coenzyme binding affinity (increased K(m)):relevance to genetic disease and polymorphisms. American Journal of ClinicalNutrition, 2002, 75:616–658.
VIT1_P001-016 3/12/05 16:53 Page 16
2. Vitamin A
17
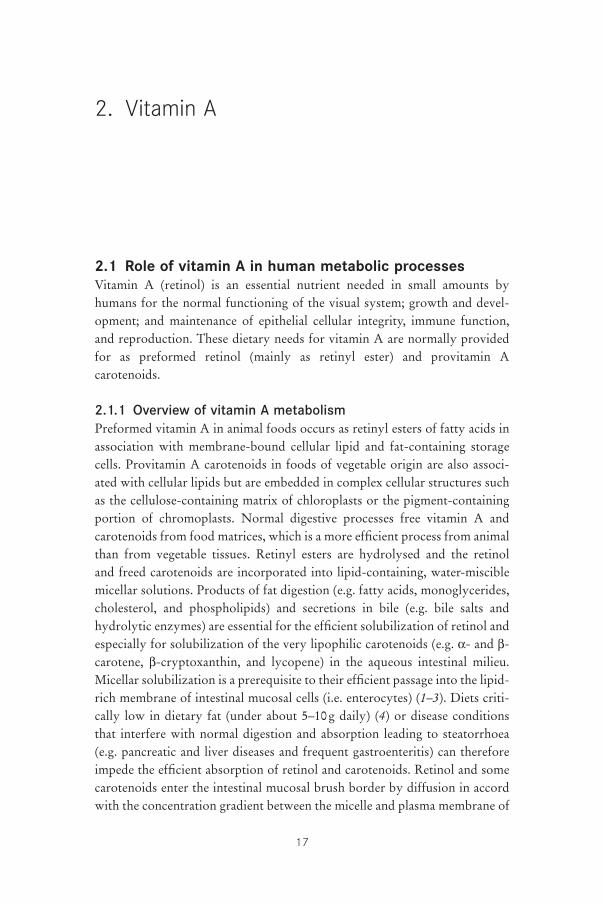
2.1 Role of vitamin A in human metabolic processesVitamin A (retinol) is an essential nutrient needed in small amounts byhumans for the normal functioning of the visual system; growth and devel-opment; and maintenance of epithelial cellular integrity, immune function,and reproduction. These dietary needs for vitamin A are normally providedfor as preformed retinol (mainly as retinyl ester) and provitamin Acarotenoids.
2.1.1 Overview of vitamin A metabolismPreformed vitamin A in animal foods occurs as retinyl esters of fatty acids inassociation with membrane-bound cellular lipid and fat-containing storagecells. Provitamin A carotenoids in foods of vegetable origin are also associ-ated with cellular lipids but are embedded in complex cellular structures suchas the cellulose-containing matrix of chloroplasts or the pigment-containingportion of chromoplasts. Normal digestive processes free vitamin A andcarotenoids from food matrices, which is a more efficient process from animalthan from vegetable tissues. Retinyl esters are hydrolysed and the retinol and freed carotenoids are incorporated into lipid-containing, water-misciblemicellar solutions. Products of fat digestion (e.g. fatty acids, monoglycerides,cholesterol, and phospholipids) and secretions in bile (e.g. bile salts andhydrolytic enzymes) are essential for the efficient solubilization of retinol andespecially for solubilization of the very lipophilic carotenoids (e.g. a- and b-carotene, b-cryptoxanthin, and lycopene) in the aqueous intestinal milieu.Micellar solubilization is a prerequisite to their efficient passage into the lipid-rich membrane of intestinal mucosal cells (i.e. enterocytes) (1–3). Diets criti-cally low in dietary fat (under about 5–10g daily) (4) or disease conditionsthat interfere with normal digestion and absorption leading to steatorrhoea(e.g. pancreatic and liver diseases and frequent gastroenteritis) can thereforeimpede the efficient absorption of retinol and carotenoids. Retinol and somecarotenoids enter the intestinal mucosal brush border by diffusion in accordwith the concentration gradient between the micelle and plasma membrane of
P017-044 3/12/05 16:56 Page 17
VITAMIN AND MINERAL REQUIREMENTS IN HUMAN NUTRITION
18
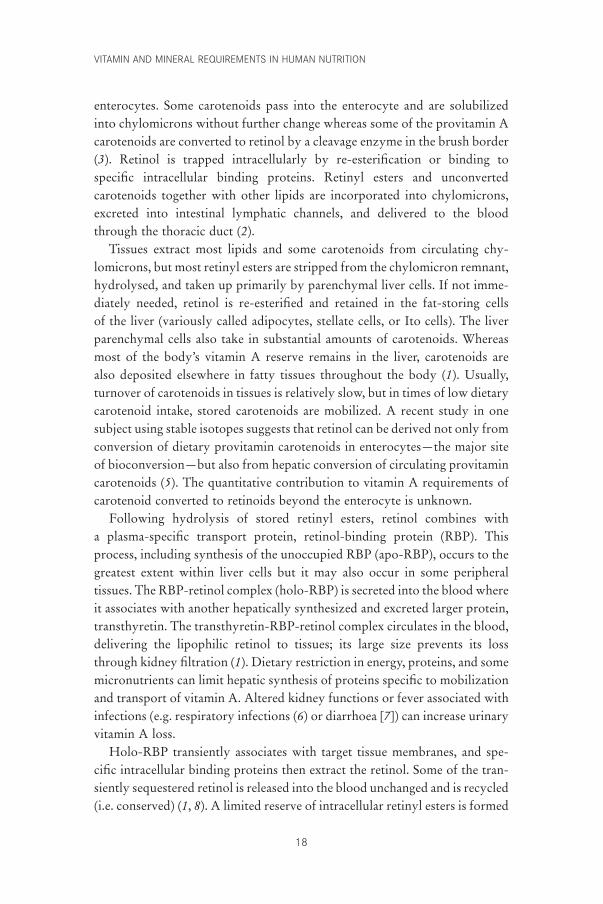
enterocytes. Some carotenoids pass into the enterocyte and are solubilizedinto chylomicrons without further change whereas some of the provitamin Acarotenoids are converted to retinol by a cleavage enzyme in the brush border(3). Retinol is trapped intracellularly by re-esterification or binding to specific intracellular binding proteins. Retinyl esters and unconvertedcarotenoids together with other lipids are incorporated into chylomicrons,excreted into intestinal lymphatic channels, and delivered to the bloodthrough the thoracic duct (2).
Tissues extract most lipids and some carotenoids from circulating chy-lomicrons, but most retinyl esters are stripped from the chylomicron remnant,hydrolysed, and taken up primarily by parenchymal liver cells. If not imme-diately needed, retinol is re-esterified and retained in the fat-storing cells of the liver (variously called adipocytes, stellate cells, or Ito cells). The liverparenchymal cells also take in substantial amounts of carotenoids. Whereasmost of the body’s vitamin A reserve remains in the liver, carotenoids are also deposited elsewhere in fatty tissues throughout the body (1). Usually,turnover of carotenoids in tissues is relatively slow, but in times of low dietarycarotenoid intake, stored carotenoids are mobilized. A recent study in onesubject using stable isotopes suggests that retinol can be derived not only fromconversion of dietary provitamin carotenoids in enterocytes—the major siteof bioconversion—but also from hepatic conversion of circulating provitamincarotenoids (5). The quantitative contribution to vitamin A requirements ofcarotenoid converted to retinoids beyond the enterocyte is unknown.
Following hydrolysis of stored retinyl esters, retinol combines with a plasma-specific transport protein, retinol-binding protein (RBP). Thisprocess, including synthesis of the unoccupied RBP (apo-RBP), occurs to thegreatest extent within liver cells but it may also occur in some peripheraltissues. The RBP-retinol complex (holo-RBP) is secreted into the blood whereit associates with another hepatically synthesized and excreted larger protein,transthyretin. The transthyretin-RBP-retinol complex circulates in the blood,delivering the lipophilic retinol to tissues; its large size prevents its lossthrough kidney filtration (1). Dietary restriction in energy, proteins, and somemicronutrients can limit hepatic synthesis of proteins specific to mobilizationand transport of vitamin A. Altered kidney functions or fever associated withinfections (e.g. respiratory infections (6) or diarrhoea [7]) can increase urinaryvitamin A loss.
Holo-RBP transiently associates with target tissue membranes, and spe-cific intracellular binding proteins then extract the retinol. Some of the tran-siently sequestered retinol is released into the blood unchanged and is recycled(i.e. conserved) (1, 8). A limited reserve of intracellular retinyl esters is formed
P017-044 3/12/05 16:56 Page 18
that subsequently can provide functionally active retinol and its oxidationproducts (i.e. isomers of retinoic acid) as needed intracellularly. These bio-logically active forms of vitamin A are associated with specific cellular proteins which bind with retinoids within cells during metabolism and withnuclear receptors that mediate retinoid action on the genome (9). Retinoidsmodulate the transcription of several hundreds of genes (10–12). In additionto the latter role of retinoic acid, retinol is the form required for functions inthe visual (13) and reproductive systems (14) and during embryonic develop-ment (15).
Holo-RBP is filtered into the glomerulus but recovered from the kidneytubule and recycled. Normally vitamin A leaves the body in urine only asinactive metabolites resulting from tissue utilization and in bile secretions aspotentially recyclable active glucuronide conjugates of retinol (8). No singleurinary metabolite has been identified which accurately reflects tissue levelsof vitamin A or its rate of utilization. Hence, at this time urine is not a usefulbiological fluid for assessment of vitamin A nutriture.
2.1.2 Biochemical mechanisms for vitamin A functionsVitamin A functions at two levels in the body: the first is in the visual cyclein the retina of the eye; the second is in all body tissues where it systemicallymaintains the growth and soundness of cells. In the visual system, carrier-bound retinol is transported to ocular tissue and to the retina by intracellu-lar binding and transport proteins. Rhodopsin, the visual pigment critical todim-light vision, is formed in rod cells after conversion of all-trans-retinol toretinaldehyde, isomerization to the 11-cis-form, and binding to opsin. Alter-ation of rhodopsin through a cascade of photochemical reactions results inthe ability to see objects in dim light (13). The speed at which rhodopsin isregenerated is related to the availability of retinol. Night blindness is usuallyan indicator of inadequate available retinol, but it can also be due to a deficitof other nutrients that are critical to the regeneration of rhodopsin, such asprotein and zinc, and to some inherited diseases, such as retinitis pigmentosa.
The growth and differentiation of epithelial cells throughout the body areespecially affected by vitamin A deficiency (VAD). In addition, goblet cellnumbers are reduced in epithelial tissues and as a consequence, mucous secre-tions (with their antimicrobial components) diminish. Cells lining protectivetissue surfaces fail to regenerate and differentiate, hence they flatten and accu-mulate keratin. Both factors—the decline in mucous secretions and loss of cel-lular integrity—reduce the body’s ability to resist invasion from potentiallypathogenic organisms. Pathogens can also compromise the immune systemby directly interfering with the production of some types of protective secre-
2. VITAMIN A
19
P017-044 3/12/05 16:56 Page 19
VITAMIN AND MINERAL REQUIREMENTS IN HUMAN NUTRITION
20
tions and cells (11). Classical symptoms of xerosis (drying or non-wetability)and desquamation of dead surface cells as seen in ocular tissue (i.e. xeroph-thalmia) are the external evidence of the changes also occurring to variousdegrees in internal epithelial tissues.
Current understanding of the mechanism of vitamin A action within cellsoutside the visual cycle is that cellular functions are mediated through spe-cific nuclear receptors. Binding with specific isomers of retinoic acid (i.e. all-trans- and 9-cis-retinoic acid) activates these receptors. Activated receptorsbind to DNA response elements located upstream of specific genes to regu-late the level of expression of those genes (12). These retinoid-activated genesregulate the synthesis of a large number of proteins vital to maintainingnormal physiologic functions. There may, however, be other mechanisms ofaction that are as yet undiscovered (10).
2.2 Populations at risk for, and consequences of, vitamin A deficiency
2.2.1 Definition of vitamin A deficiencyVAD is not easily defined. WHO defines it as tissue concentrations of vitaminA low enough to have adverse health consequences even if there is no evi-dence of clinical xerophthalmia (16). In addition to the specific signs andsymptoms of xerophthalmia and the risk of irreversible blindness, non-specific symptoms include increased morbidity and mortality, poor repro-ductive health, increased risk of anaemia, and contributions to slowed growthand development. However, these nonspecific adverse effects may be causedby other nutrient deficits as well, making it difficult to attribute non-ocularsymptoms specifically to VAD in the absence of biochemical measurementsreflective of vitamin A status.
2.2.2 Geographic distribution and magnitudeIn 1995, WHO estimated the global distribution of VAD (Table 2.1) and cat-egorized countries according to the seriousness of VAD as a public healthproblem on the basis of both clinical and moderate and severe subclinical(prevalence of low blood levels of retinol) indicators of deficiency (16, 17). Itwas estimated that about 3 million children have some form of xerophthalmiaand, on the basis of blood levels, another 250 million are subclini-cally deficient (17). The magnitude of the subclinical estimate is currentlybeing re-evaluated to establish quantitatively a benchmark for measuringprevalence trends. The actual number of subclinical deficiencies based on theprevalence of low serum levels of retinol, however, remains uncertain because
P017-044 3/12/05 16:56 Page 20
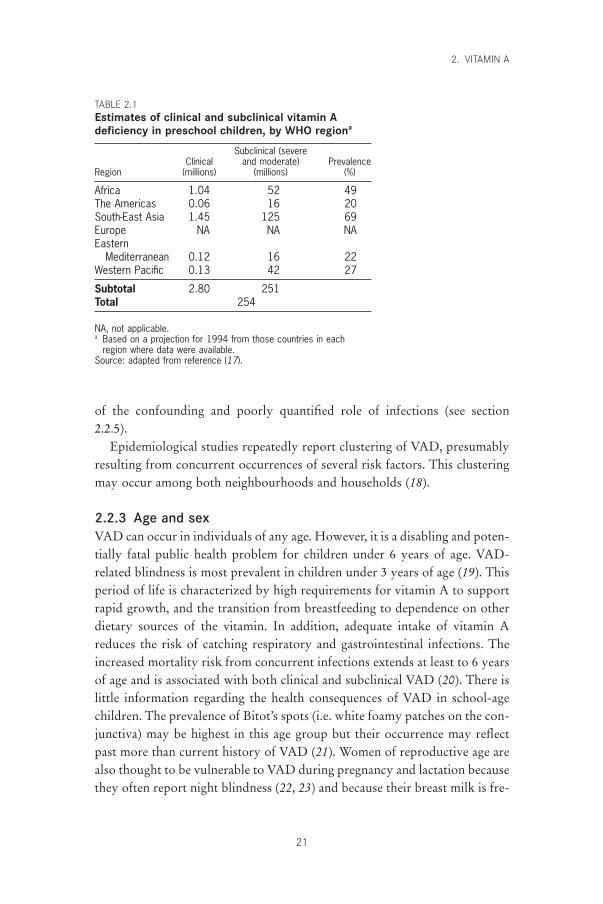
of the confounding and poorly quantified role of infections (see section 2.2.5).
Epidemiological studies repeatedly report clustering of VAD, presumablyresulting from concurrent occurrences of several risk factors. This clusteringmay occur among both neighbourhoods and households (18).
2.2.3 Age and sexVAD can occur in individuals of any age. However, it is a disabling and poten-tially fatal public health problem for children under 6 years of age. VAD-related blindness is most prevalent in children under 3 years of age (19). Thisperiod of life is characterized by high requirements for vitamin A to supportrapid growth, and the transition from breastfeeding to dependence on otherdietary sources of the vitamin. In addition, adequate intake of vitamin Areduces the risk of catching respiratory and gastrointestinal infections. Theincreased mortality risk from concurrent infections extends at least to 6 yearsof age and is associated with both clinical and subclinical VAD (20). There islittle information regarding the health consequences of VAD in school-agechildren. The prevalence of Bitot’s spots (i.e. white foamy patches on the con-junctiva) may be highest in this age group but their occurrence may reflectpast more than current history of VAD (21). Women of reproductive age arealso thought to be vulnerable to VAD during pregnancy and lactation becausethey often report night blindness (22, 23) and because their breast milk is fre-
2. VITAMIN A
21
TABLE 2.1Estimates of clinical and subclinical vitamin Adeficiency in preschool children, by WHO regiona
Subclinical (severeClinical and moderate) Prevalence
Region (millions) (millions) (%)
Africa 1.04 52 49The Americas 0.06 16 20South-East Asia 1.45 125 69Europe NA NA NAEastern
Mediterranean 0.12 16 22Western Pacific 0.13 42 27
Subtotal 2.80 251Total 254
NA, not applicable.a Based on a projection for 1994 from those countries in each
region where data were available.Source: adapted from reference (17).
P017-044 3/12/05 16:56 Page 21
VITAMIN AND MINERAL REQUIREMENTS IN HUMAN NUTRITION
22
quently low in vitamin A (24, 25). Not all night blindness in pregnant women,however, responds to vitamin A treatment (23).
There is no consistent, clear indication in humans of a sex differential invitamin A requirements during childhood. Growth rates, and presumably theneed for vitamin A, from birth to 10 years for boys are consistently higherthan those for girls (26). In the context of varied cultural and community settings, however, variations in gender-specific child-feeding and care prac-tices are likely to subsume a small sex differential in requirements to accountfor reported sex differences in the prevalence of xerophthalmia. Pregnant and lactating women require additional vitamin A to support maternal and fetaltissue growth and lactation losses, additional vitamin A which is not neededby other post-adolescent adults (27).
2.2.4 Risk factorsVAD is most common in populations consuming most of their vitamin Aneeds from provitamin carotenoid sources and where minimal dietary fat is available (28). About 90% of ingested preformed vitamin A is absorbed,whereas the absorption efficiency of provitamin A carotenoids varies widely,depending on the type of plant source and the fat content of the accompany-ing meal (29). Where possible, an increased intake of dietary fat is likely toimprove the absorption of vitamin A in the body.
In areas with endemic VAD, fluctuations in the incidence of VAD through-out the year reflect the balance between intake and need. Periods of generalfood shortage (and specific shortages in vitamin A-rich foods) coincide withpeak incidence of VAD and common childhood infectious diseases (e.g. diar-rhoea, respiratory infections, and measles). Seasonal food availability influ-ences VAD prevalence directly by influencing access to provitamin A sources;for example, the scarcity of mangoes in hot arid months followed by the glut-ting of the market with mangoes during harvest seasons (30). Seasonal growthspurts in children, which frequently follow seasonal post-harvest increases inenergy and macronutrient intakes, can also affect the balance. These increasesare usually obtained from staple grains (e.g. rice) and tubers (e.g. light-coloured yams) that are not, however, good sources of some micronutrients(e.g. vitamin A) to support the growth spurt (31).
Food habits and taboos often restrict consumption of potentially goodfood sources of vitamin A (e.g. mangoes and green leafy vegetables). Culture-specific factors for feeding children, adolescents, and pregnant and lactatingwomen are common (28, 32–34). Illness- and childbirth-related proscriptionsof the use of specific foods pervade many traditional cultures (35). Such influ-ences alter short- and long-term food distribution within families. However,
P017-044 3/12/05 16:56 Page 22
some cultural practices can be protective of vitamin A status and they needto be identified and reinforced.
2.2.5 Morbidity and mortalityThe consequences of VAD are manifested differently in different tissues. In the eye, the symptoms and signs, together referred to as xerophthalmia,have a long, well-recognized history and have until recently been the basis for estimating the global burden from the disease (19). Although ocular symp-toms and signs are the most specific indicators of VAD, they occur only afterother tissues have impaired functions that are less specific and less easilyassessed.
The prevalence of ocular manifestations (i.e. xerophthalmia or clinicalVAD) is now recognized to far underestimate the magnitude of the problemof functionally significant VAD. Many more preschool-age children, andperhaps older children and women who are pregnant or lactating, have theirhealth compromised when they are subclinically deficient. In young children,subclinical deficiency, like clinical deficiency, increases the severity of someinfections, particularly diarrhoea and measles, and increases the risk of death(20, 36). Moreover, the incidence (37) and prevalence (38) of diarrhoea mayalso increase with subclinical VAD. Meta-analyses conducted by three inde-pendent groups using data from several randomized trials provide convinc-ing evidence that community-based improvement of the vitamin A status ofdeficient children aged 6 months to 6 years reduces their risk of dying by20–30% on average (20, 39, 40). Mortality in children who are blind from ker-atomalacia or who have corneal disease is reported to be from 50% to 90%(19, 41), and measles mortality associated with VAD is increased by up to50% (42). Limited data are available from controlled studies of the possiblelink between morbidity history and vitamin A status of pregnant and lactat-ing women (43).
There are discrepancies in the link between incidence and severity of infec-tious morbidity of various etiologies and vitamin A status. A great deal of evidence supports an association of VAD with severity of an infection onceacquired, except for respiratory diseases, which are non-responsive to treat-ment (16, 36–38, 44). The severity of pneumonia associated with measles,however, is an exception because it decreases with the treatment of vitamin Asupplementation (42, 45).
Infectious diseases depress circulating retinol and contribute to vitamin Adepletion. Enteric infections may alter the absorptive surface area, competefor absorption-binding sites, and increase urinary loss (7, 46, 47). Febrile systemic infections also increase urinary loss (6, 48) and metabolic utilization
2. VITAMIN A
23
P017-044 3/12/05 16:56 Page 23
VITAMIN AND MINERAL REQUIREMENTS IN HUMAN NUTRITION
24
rates and may reduce apparent retinol stores if fever occurs frequently (49).In the presence of latent deficiency, disease occurrence is often associated withprecipitating ocular signs (50, 51). Measles virus infection is especially devas-tating to vitamin A metabolism, adversely interfering with both efficienciesof utilization and conservation (42, 51, 52). Severe protein–energy malnutri-tion affects many aspects of vitamin A metabolism, and even when someretinyl ester stores are still present, malnutrition—often coupled with infec-tion—can prevent transport-protein synthesis, resulting in immobilization ofexisting vitamin A stores (53).
The compromised integrity of the epithelium, together with the possiblealteration in hormonal balance at severe levels of deficiency, impairs normalreproductive functions in animals (9, 14, 15, 24, 54, 55). Controlled humanstudies are, of course, lacking. In animals and humans, congenital anomaliescan result if the fetus is exposed to severe deficiency or large excesses ofvitamin A at critical periods early in gestation (first trimester) when fetalorgans are being formed (24, 56). Reproductive performance, as measured byinfant outcomes, in one community-based clinical intervention trial, however,was not influenced by vitamin A status (43).
The growth of children may be impaired by VAD. Interventions withvitamin A only have not consistently demonstrated improved growth in community studies because VAD seldom occurs in isolation from other nutrient deficiencies that also affect growth and may be more limiting (57).
A lack of vitamin A can affect iron metabolism when deficiencies of bothnutrients coexist and particularly in environments that favour frequent infec-tions (58). Maximum haemoglobin response occurs when iron and vitamin Adeficiencies are corrected together (59). VAD appears to influence the avail-ability of storage iron for use by haematopoietic tissue (59, 60). However,additional research is needed to clarify the mechanisms of the apparent interaction.
2.3 Units of expressionIn blood, tissues, and human milk, vitamin A levels are conventionallyexpressed in mg/dl or mmol/l of all-trans-retinol. Except for postprandial con-ditions, most of the circulating vitamin A is retinol whereas in most tissues(such as the liver), secretions (such as human milk), and other animal foodsources, it exists mainly as retinyl esters, which are frequently hydrolysedbefore analytical detection.
To express the vitamin A activity of carotenoids in diets on a commonbasis, a Joint FAO/WHO Expert Group (61) in 1967 introduced the concept
P017-044 3/12/05 16:56 Page 24
of the retinol equivalent (RE) and established the following relationshipsamong food sources of vitamin A:
1 mg retinol = 1 RE1 mg b-carotene = 0.167 mg RE1 mg other provitamin A = 0.084 mg RE.carotenoids
These equivalencies were derived from balance studies to account for the lessefficient absorption of carotenoids (at that time thought to be about one thirdthat of retinol) and their bioconversion to vitamin A (one half for b-caroteneand one fourth for other provitamin A carotenoids). It was recognized at thetime that the recommended conversion factors (i.e. 1 :6 for vitamin A:b-carotene and 1 :12 for vitamin A:all other provitamin carotenoids) were onlybest approximations for a mixed diet, which could under- or overestimatebioavailability depending not only on the quantity and source of carotenoidsin the diet, but also on how the foods were processed and served (e.g. cookedor raw, whole or puréed, with or without fat). In 1988, a Joint FAO/WHOExpert Consultation (62) confirmed these conversion factors for operationalapplication in evaluating mixed diets. In reaching its conclusion, the Consul-tation noted the controlled depletion–repletion studies in adult men using adark adaptation endpoint that reported a 2 :1 equivalency of supplemental b-carotene to retinol (63), and the range of factors that could alter the equiva-lency ratio when dietary carotenoids replaced supplements.
Recently there has been renewed interest in re-examining conventionalconversion factors by using more quantitative stable isotope techniques formeasuring whole-body stores in response to controlled intakes (64–66) andby following post-absorption carotenoids in the triacylglycerol-rich lipopro-tein fraction (67–70). The data are inconsistent but suggest that revisiontoward lower absorbability of provitamin A carotenoids is warranted (64, 68,69). These studies indicate that the conditions that limit carotenoids fromentering enterocytes rather than conversion once in the enterocyte are more significant than previously thought (71).
Other evidence questions the validity of factors used earlier, which sug-gests that 6mg of food-sourced b-carotene is equivalent to 2mg pure b-carotene in oil, and equivalent to 1mg dietary retinol. Currently, however,only one study has used post-absorptive serum carotenoids to directlycompare, in healthy, adequately nourished adult humans in Holland, theabsorption of carotene in oil with that of dietary b-carotene from a mixed dietpredominately containing vegetables (72). The investigators reported that
2. VITAMIN A
25
P017-044 3/12/05 16:56 Page 25
VITAMIN AND MINERAL REQUIREMENTS IN HUMAN NUTRITION
26
about 7mg of b-carotene from the mixed predominately vegetable diet isequivalent to 1mg pure b-carotene when it is provided in oil. Assuming that2mg b-carotene in the enterocyte is equivalent to 1mg retinol, the conversionfactor would be 1 :14 for b-carotene and 1 :28 for other provitamin Acarotenoids. Other researchers using a similar methodology have reportedfactors from a variety of specific food sources that fall within this range.Lowest bioavailability is reported for leafy green vegetables and raw carrotsand highest for fruit/tuber diets (68, 73–75). In view of the data available todate, conversion factors from usual mixed vegetable diets of 1 :14 for b-carotene and 1 :28 for other provitamin A carotenoids as suggested by Vanhet Hof et al. (72) are recommended. Where green leafy vegetables or fruitsare more prominent than in the usual diet in Holland, adjustment to higheror lower conversion factors could be considered. For example, in the UnitedStates of America where fruits constitute a larger portion of the diet, the Foodand Nutrition Board of the Institute of Medicine suggests retinol activityequivalency (RAE) factors of 12 :1 for b-carotene and 24 :1 for other provit-amin A carotenoids (76).
Retinol equivalents in a diet are calculated as the sum of the weight of theretinol portion of preformed vitamin A plus the weight of b-carotene dividedby its conversion factor, plus the weight of other provitamin A carotenoidsdivided by their conversion factor (62). Most recent food composition tablesreport b-carotene and, sometimes, other provitamin A carotenoids as mg/gedible portion. However, older food composition tables frequently reportvitamin A as international units (IUs). The following conversion factors canbe used to calculate comparable values as mg:
1 IU retinol = 0.3 mg retinol1 IU b-carotene = 0.6 mg b-carotene1 IU retinol = 3 IU b-carotene.
It is strongly recommended that weight or molar units replace the use ofIUs to decrease confusion and overcome limitations in the non-equivalenceof the IU values for retinol and b-carotene. For example, after converting allvalues from food composition tables to weight units, the vitamin A equiva-lency of a mixed diet should be determined by dividing the weight by the rec-ommended weight equivalency value for preformed and specific provitaminA carotenoids. Hence, if a diet contained 150mg retinol, 1550mg b-carotene,and 1200mg other provitamin A carotenoids, the vitamin A equivalency of thediet would be:
150 mg + (1550 mg ∏ 14) + (1200 mg ∏ 28) = 304 mg retinol equivalency.
P017-044 3/12/05 16:56 Page 26
2.4 Sources and supply patterns of vitamin A2.4.1 Dietary sourcesPreformed vitamin A is found almost exclusively in animal products, such ashuman milk, glandular meats, liver and fish liver oils (especially), egg yolk,whole milk, and other dairy products. Preformed vitamin A is also used tofortify processed foods, which may include sugar, cereals, condiments, fats,and oils (77). Provitamin A carotenoids are found in green leafy vegetables(e.g. spinach, amaranth, and young leaves from various sources), yellow veg-etables (e.g. pumpkins, squash, and carrots), and yellow and orange non-citrusfruits (e.g. mangoes, apricots, and papayas). Red palm oil produced in severalcountries worldwide is especially rich in provitamin A (78). Some otherindigenous plants also may be unusually rich sources of provitamin A. Suchexamples are the palm fruit known in Brazil as burití, found in areas alongthe Amazon River (as well as elsewhere in Latin America) (79), and the fruitknown as gac in Viet Nam, which is used to colour rice, particularly on cere-monial occasions (80). Foods containing provitamin A carotenoids tend tohave less biologically available vitamin A but are more affordable than animalproducts. It is mainly for this reason that carotenoids provide most of thevitamin A activity in the diets of economically deprived populations.
2.4.2 Dietary intake and patternsAlthough vitamin A status cannot be assessed from dietary intake alone,dietary intake assessment can provide evidence of risk of an inadequate status.However, quantitative collection of dietary information is fraught with mea-surement problems. These problems arise both from obtaining representativequantitative dietary histories from individuals, communities, or both, andfrom interpreting these data while accounting for differences in bioavailabil-ity, preparation losses, and variations in food composition data among pop-ulation groups (77). This is especially difficult in populations consuming mostof their dietary vitamin A from provitamin carotenoid sources. Simplifiedguidelines have been developed recently in an effort to improve the collectionof reliable dietary intake information from individuals and communities (69, 81).
2.4.3 World and regional supply and patternsIn theory, the world’s food supply is sufficient to meet global requirementsfor vitamin A. Great differences exist, however, in the availability of sources(animal and vegetable) and in per capita consumption of the vitamin amongdifferent countries, age categories, and socioeconomic groups. VAD as aglobal public health problem is therefore largely due to inequitable food dis-
2. VITAMIN A
27
P017-044 3/12/05 16:56 Page 27
VITAMIN AND MINERAL REQUIREMENTS IN HUMAN NUTRITION
28
tribution among and within countries and households in relation to the needfor ample bioavailable vitamin A sources (82, 83).
FAO global estimates for 1984 indicate that preformed vitamin A consti-tuted about one third of total dietary vitamin A activity (62). World avail-ability of vitamin A for human consumption at that time was approximately220mg of preformed retinol per capita per day and 560mg RE from provita-min carotenoids (about 3400mg carotenoids for a 1 :6 conversion factor) perperson per day, a total of about 790mg RE. These values are based on supplyestimates and not consumption estimates. Losses commonly occur duringfood storage and processing, both industrially and in the home (77).
The estimated available regional supply of vitamin A from a more recentglobal evaluation shown in Table 2.2 illustrates the variability in amounts andsources of vitamin A. This variability is linked to access to the available supplyof foods containing vitamin A, which varies with household income, withpoverty being a yardstick for risk of VAD. VAD is most prevalent in South-East Asia, Africa, and the Western Pacific (Table 2.1), where vegetable sourcescontribute nearly 80% or more of the available supply of retinol equivalents.Furthermore, in South-East Asia the total available supply is about half ofthat of most other regions and is particularly low in animal sources. In con-trast, the Americas, Eastern Mediterranean, and Europe have a supply rangingfrom 700 to 1000mg RE/day, one third of which comes from animal sources.Based on national data from the United States Continuing Survey of FoodConsumption (84) and the third National Health and Nutrition ExaminationSurvey (85) mean dietary intakes of children aged 0–6 years were estimatedto be 864 ± 497 and 921 ± 444mg RE per day, respectively. In the Dietary andNutritional Survey of British Adults (86), the median intake of men andwomen aged 35–49 years was 1118mg RE and 926mg RE, respectively, whichcorresponded to serum retinol concentrations of 2.3mmol/l and 1.8mmol/l,respectively. In a smaller scale survey in the United Kingdom, median intakesfor non-pregnant women who did not consume liver or liver products duringthe survey week were reported to be 686mg RE per day (87).
The available world supply figures in Table 2.2 were recently recalculatedusing a bioavailability ratio of 1 :30 for retinol to other provitamin Acarotenoids (88). This conversion factor was justified on the basis of one pub-lished controlled intervention study conducted in Indonesia (89) and a limitednumber of other studies not yet published in full. Applying the unconfirmedconversion factor to the values in Table 2.2 would lead to the conclusion thatregional and country needs for vitamin A could not be met from predomi-nantly vegetarian diets. However, this is inconsistent with the preponderanceof epidemiological evidence. Most studies report a positive response when
P017-044 3/12/05 16:56 Page 28
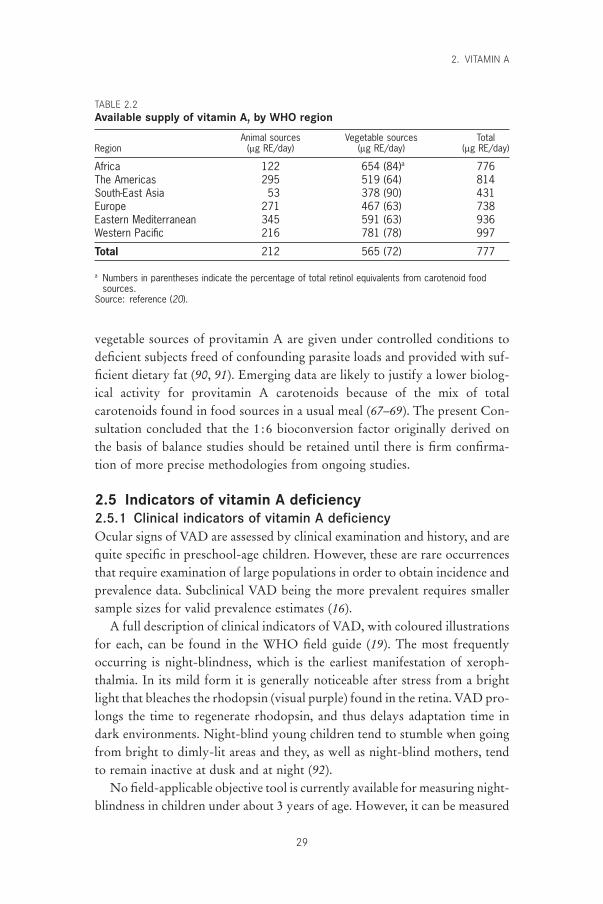
vegetable sources of provitamin A are given under controlled conditions todeficient subjects freed of confounding parasite loads and provided with suf-ficient dietary fat (90, 91). Emerging data are likely to justify a lower biolog-ical activity for provitamin A carotenoids because of the mix of totalcarotenoids found in food sources in a usual meal (67–69). The present Con-sultation concluded that the 1 :6 bioconversion factor originally derived onthe basis of balance studies should be retained until there is firm confirma-tion of more precise methodologies from ongoing studies.
2.5 Indicators of vitamin A deficiency2.5.1 Clinical indicators of vitamin A deficiencyOcular signs of VAD are assessed by clinical examination and history, and arequite specific in preschool-age children. However, these are rare occurrencesthat require examination of large populations in order to obtain incidence andprevalence data. Subclinical VAD being the more prevalent requires smallersample sizes for valid prevalence estimates (16).
A full description of clinical indicators of VAD, with coloured illustrationsfor each, can be found in the WHO field guide (19). The most frequentlyoccurring is night-blindness, which is the earliest manifestation of xeroph-thalmia. In its mild form it is generally noticeable after stress from a brightlight that bleaches the rhodopsin (visual purple) found in the retina. VAD pro-longs the time to regenerate rhodopsin, and thus delays adaptation time indark environments. Night-blind young children tend to stumble when goingfrom bright to dimly-lit areas and they, as well as night-blind mothers, tendto remain inactive at dusk and at night (92).
No field-applicable objective tool is currently available for measuring night-blindness in children under about 3 years of age. However, it can be measured
2. VITAMIN A
29
TABLE 2.2Available supply of vitamin A, by WHO region
Animal sources Vegetable sources TotalRegion (mg RE/day) (mg RE/day) (mg RE/day)
Africa 122 654 (84)a 776The Americas 295 519 (64) 814South-East Asia 53 378 (90) 431Europe 271 467 (63) 738Eastern Mediterranean 345 591 (63) 936Western Pacific 216 781 (78) 997
Total 212 565 (72) 777
a Numbers in parentheses indicate the percentage of total retinol equivalents from carotenoid foodsources.
Source: reference (20).
P017-044 3/12/05 16:56 Page 29
VITAMIN AND MINERAL REQUIREMENTS IN HUMAN NUTRITION
30
by history in certain cultures (93). In areas where night-blindness is prevalent,many cultures coin a word descriptive of the characteristic symptom that theycan reliably recall on questioning, making this a useful tool for assessing theprevalence of VAD (94). It must be noted that questioning for night-blindnessis not always a reliable assessment measure where a local term is absent. Inaddition, there is no clearly defined blood retinol level that is directly associ-ated with occurrence of the symptom, such that could be used in conjunctionwith questioning. Vitamin A-related night-blindness, however, respondsrapidly (usually within 1–2 days) to administration of vitamin A.
2.5.2 Subclinical indicators of vitamin A deficiencyDirect measurement of concentrations of vitamin A in the liver (where it isstored) or in the total body pool relative to known specific vitamin A-relatedconditions (e.g. night-blindness) would be the indicator of choice for deter-mining requirements. This cannot be done with the methodology currentlyavailable for population use. There are several more practical biochemicalmethods for estimating subclinical vitamin A status but all have limitations(16, 93, 95, 96). Each method is useful for identifying deficient populations,but not one of these indicators is definitive or directly related quantitativelyto disease occurrence. The indicators of choice are listed in Table 2.3. Theseindicators are less specific to VAD than clinical signs of the eye and less sen-sitive than direct measurements for evaluating subclinical vitamin A status.WHO recommends that where feasible at least two subclinical biochemicalindicators, or one biochemical and a composite of non-biochemical riskfactors, should be measured and that both types of indicators should point todeficiency in order to identify populations at high risk of VAD (16). Cut-offpoints given in Table 2.3 represent the consensus gained from practical expe-rience in comparing populations with some evidence of VAD with thosewithout VAD. There are no field studies that quantitatively relate the preva-lence of adverse health symptoms (e.g. incidence or prevalence of severe diar-rhoeal disease) and relative levels of biologic indicator cut-off values.Furthermore, each of the biochemical indicators listed is subject to con-founding factors which may be unrelated to vitamin A status (e.g. infections).
Although all biochemical indicators currently available have limitations,the preferred biochemical indicator for population assessment is the distribu-tion of serum levels of vitamin A (serum retinol). Only at very low bloodlevels (<0.35mmol/l) is there an association with corneal disease prevalence(97). Blood levels between 0.35 and 0.70mmol/l are likely to characterize sub-clinical deficiency (98), but subclinical deficiency may still be present at levels
P017-044 3/12/05 16:56 Page 30
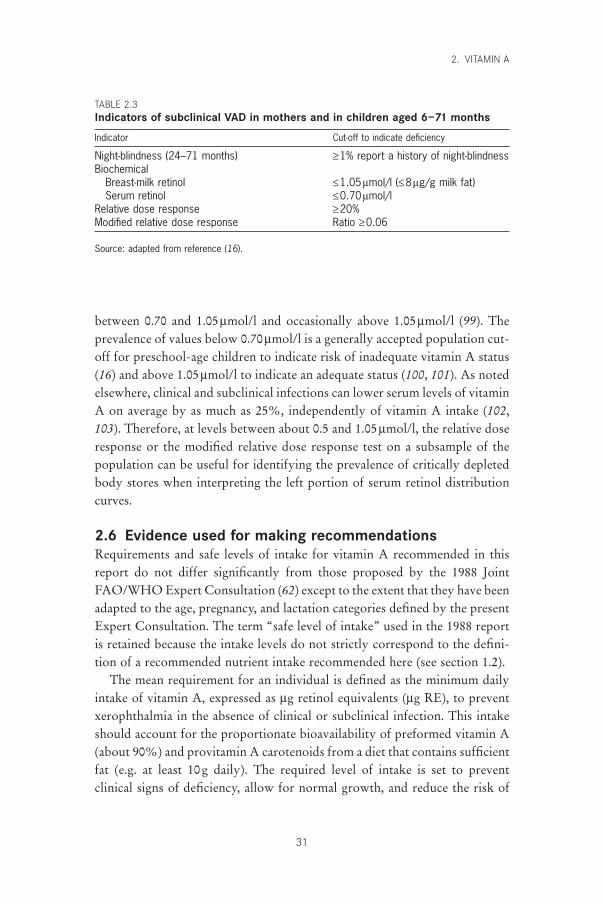
between 0.70 and 1.05mmol/l and occasionally above 1.05mmol/l (99). Theprevalence of values below 0.70mmol/l is a generally accepted population cut-off for preschool-age children to indicate risk of inadequate vitamin A status(16) and above 1.05mmol/l to indicate an adequate status (100, 101). As notedelsewhere, clinical and subclinical infections can lower serum levels of vitaminA on average by as much as 25%, independently of vitamin A intake (102,103). Therefore, at levels between about 0.5 and 1.05mmol/l, the relative doseresponse or the modified relative dose response test on a subsample of the population can be useful for identifying the prevalence of critically depletedbody stores when interpreting the left portion of serum retinol distributioncurves.
2.6 Evidence used for making recommendationsRequirements and safe levels of intake for vitamin A recommended in thisreport do not differ significantly from those proposed by the 1988 JointFAO/WHO Expert Consultation (62) except to the extent that they have beenadapted to the age, pregnancy, and lactation categories defined by the presentExpert Consultation. The term “safe level of intake” used in the 1988 reportis retained because the intake levels do not strictly correspond to the defini-tion of a recommended nutrient intake recommended here (see section 1.2).
The mean requirement for an individual is defined as the minimum dailyintake of vitamin A, expressed as mg retinol equivalents (mg RE), to preventxerophthalmia in the absence of clinical or subclinical infection. This intakeshould account for the proportionate bioavailability of preformed vitamin A(about 90%) and provitamin A carotenoids from a diet that contains sufficientfat (e.g. at least 10g daily). The required level of intake is set to prevent clinical signs of deficiency, allow for normal growth, and reduce the risk of
2. VITAMIN A
31
TABLE 2.3Indicators of subclinical VAD in mothers and in children aged 6–71 months
Indicator Cut-off to indicate deficiency
Night-blindness (24–71 months) ≥1% report a history of night-blindnessBiochemical
Breast-milk retinol £1.05mmol/l (£8mg/g milk fat)Serum retinol £0.70mmol/l
Relative dose response ≥20%Modified relative dose response Ratio ≥0.06
Source: adapted from reference (16).
P017-044 3/12/05 16:56 Page 31
VITAMIN AND MINERAL REQUIREMENTS IN HUMAN NUTRITION
32
vitamin A-related severe morbidity and mortality within any given popula-tion. It does not allow for frequent or prolonged periods of infections or otherstresses.
The safe level of intake for an individual is defined as the average contin-uing intake of vitamin A required to permit adequate growth and othervitamin A-dependent functions and to maintain an acceptable total bodyreserve of the vitamin. This reserve helps offset periods of low intake or increased need resulting from infections and other stresses. Useful indica-tors include a plasma retinol concentration above 0.70mmol/l, which is associated with a relative dose response below 20%, or a modified relativedose response below 0.06. For lactating women, breast-milk retinol levelsabove 1.05mmol/l (or above 8mg/g milk fat) are considered to reflect minimalmaternal stores because levels above 1.05mmol/l are common in populationsknown to be healthy and without evidence of insufficient dietary vitamin A(24, 25).
2.6.1 Infants and childrenVitamin A requirements for infants are calculated from the vitamin A pro-vided in human milk. During at least the first 6 months of life, exclusivebreastfeeding can provide sufficient vitamin A to maintain health, permitnormal growth, and maintain sufficient stores in the liver (104).
Reported retinol concentrations in human milk vary widely from countryto country (0.70–2.45mmol/l). In some developing countries, the vitamin Aintake of breast-fed infants who grow well and do not show signs of defi-ciency ranges from 120 to 170mg RE/day (25, 104). Such intakes are consid-ered adequate to cover infant requirements if the infant’s weight is assumedto be at least at the 10th percentile according to WHO standards (62).However, this intake is unlikely to build adequate body stores, given thatxerophthalmia is common in preschool-age children in the same communi-ties with somewhat lower intakes. Because of the need for vitamin A tosupport the growth rate of infancy, which can vary considerably, a require-ment estimate of 180mg RE/day seems appropriate.
The safe level for infants up to 6 months of age is based on observationsof breast-fed infants in communities in which good nutrition is the norm.Average consumption of human milk by such infants is about 750ml/dayduring the first 6 months (104). Assuming an average concentration of vitaminA in human milk of about 1.75mmol/l, the mean daily intake would be about375mg RE, which is therefore the recommended safe level. From 7–12 months,human milk intake averages 650ml/day, which would provide 325mg ofvitamin A daily. Because breast-fed infants in endemic vitamin A-deficient
P017-044 3/12/05 16:56 Page 32
populations are at increased risk of death from 6 months onward, the require-ment and recommended safe intake levels are increased to 190mg RE/day and400mg RE/day, respectively.
The requirement (with allowance for variability) and the recommendedsafe intake for older children may be estimated from those derived for lateinfancy (i.e. 20 and 39mg RE/kg body weight/day) (62). On this basis, andincluding allowances for storage requirements and variability, requirementsfor preschool-age children would be in the range of 200–400mg RE daily. Inpoor communities where children 1–6 years old are reported to have intakesof about 100–200mg RE/day, signs of VAD do occur; in southern India thesesigns were relieved and risk of mortality was reduced when the equivalent of350–400mg RE/day was given to children weekly (105). In the United States,most preschool-age children maintain serum retinol levels of 0.70mmol/l orhigher while consuming diets providing 300–400mg RE/day (from the data-bank for the third National Health and Nutrition Examination Survey[http://www.cdc.gov/nchs/nhanes.htm]).
2.6.2 AdultsEstimates for the requirements and recommended safe intakes for adults arealso extrapolated from those derived for late infancy, i.e. 4.8 and 9.3mg RE/kgbody weight/day (62). Detailed account of how the requirement for vitaminA is arrived at is provided in the FAO/WHO report of 1988 (62) and is notrepeated here because no new studies have been published that indicate a needto revise the assumptions on which those calculations were based. The safeintakes recommended are consistent with the per capita vitamin A content inthe food supply of countries that show adequate vitamin A status in all sectorsof the population. Additional evidence that the existing safe level of intake isadequate for adults on a population basis is provided by an analysis of dietarydata from the 1990 survey of British adults in whom there was no evidenceof VAD (86). In another survey in the United Kingdom, the median intake ofvitamin A among non-pregnant women who did not consume liver or liverproducts during the survey week was 686mg RE/day (87). This value is sub-stantially above the estimated mean requirement for pregnant women and fallsquite short of the amount at which teratology risk is reported (106–108).About one third of the calculated retinol equivalents consumed by the Britishwomen came from provitamin A sources (20% from carrots).
2.6.3 Pregnant womenDuring pregnancy, women need additional vitamin A to sustain the growth of the fetus and to provide a limited reserve in the fetal liver, as
2. VITAMIN A
33
P017-044 3/12/05 16:56 Page 33
VITAMIN AND MINERAL REQUIREMENTS IN HUMAN NUTRITION
34
well as to maintain their own tissue growth. Currently, there are no reliablefigures available for the specific vitamin A requirements for these processes(27).
Newborn infants need around 100mg of retinol daily to meet their needsfor growth. During the third trimester the fetus grows rapidly and, althoughobviously smaller in size than the infant born full term, the fetus presumablyhas similar needs. Incremental maternal needs associated with pregnancy areassumed to be provided from maternal reserves in populations of adequatelynourished healthy mothers. In populations consuming vitamin A at the basalrequirement, an additional increment of 100mg/day during the full gestationperiod should enhance maternal storage during early pregnancy and allow foradequate amounts of vitamin A to be available for the rapidly growing fetusin late pregnancy. However, this increment may be minimal for women whonormally ingest only the basal requirement of vitamin A, inasmuch as theneeds and growth rate of the fetus will not be affected by the mother’s initialvitamin A reserves.
A recent study in Nepal (43), where night-blindness is prevalent in preg-nant women, provided 7000mg RE (about 23300IU) weekly to pregnant andlactating women (equivalent to 1000mg RE/day). This level of intake nor-malized serum levels of vitamin A and was associated with a decrease in preva-lence of night-blindness and a decrease in maternal mortality. However, thefindings of this study need to be confirmed. In the interim period it seemsprudent, recognizing that a large portion of the world’s population of preg-nant women live under conditions of deprivation, to increase by 200mg REthe recommended safe level to ensure adequacy of intake during pregnancy.Because therapeutic levels of vitamin A are generally higher than preventivelevels, the safe intake level recommended during pregnancy is 800mg RE/day.Women who are or who might become pregnant should carefully limit theirtotal daily vitamin A intake to a maximum of 3000mg RE (10000IU) to minimize risk of fetal toxicity (109).
2.6.4 Lactating womenIf the amount of vitamin A recommended for infants is supplied by humanmilk, mothers who are breastfeeding should intake at least as much vitaminA in their diets as is needed to replace the amount lost through breastfeed-ing. Thus, the increments in basal and safe recommended intakes during lac-tation are 180mg RE and 350mg RE, respectively. After the infant reaches theage of 6 months or when solid foods are introduced, the mother’s need foradditional amounts of vitamin A lessens.
P017-044 3/12/05 16:56 Page 34
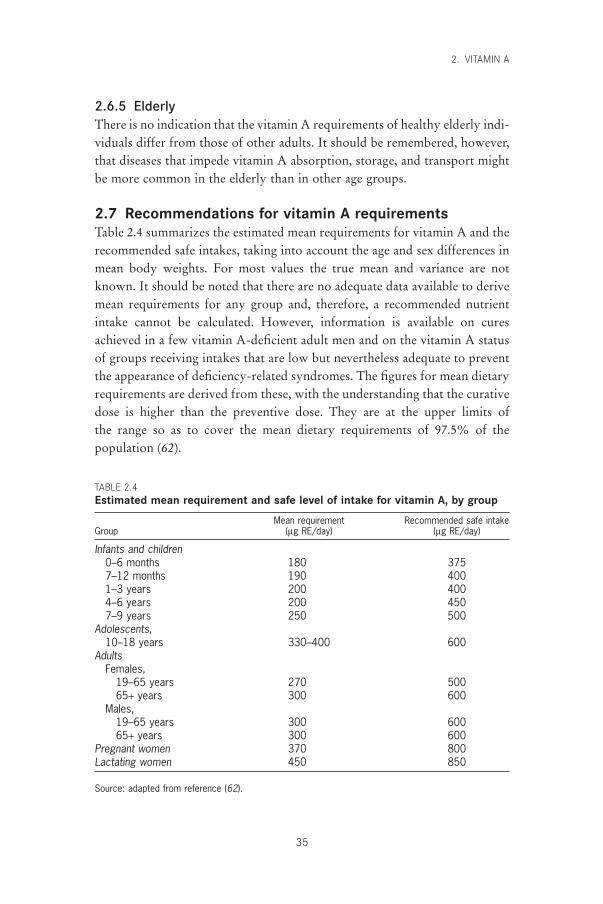
2.6.5 ElderlyThere is no indication that the vitamin A requirements of healthy elderly indi-viduals differ from those of other adults. It should be remembered, however,that diseases that impede vitamin A absorption, storage, and transport mightbe more common in the elderly than in other age groups.
2.7 Recommendations for vitamin A requirementsTable 2.4 summarizes the estimated mean requirements for vitamin A and therecommended safe intakes, taking into account the age and sex differences inmean body weights. For most values the true mean and variance are notknown. It should be noted that there are no adequate data available to derivemean requirements for any group and, therefore, a recommended nutrientintake cannot be calculated. However, information is available on curesachieved in a few vitamin A-deficient adult men and on the vitamin A statusof groups receiving intakes that are low but nevertheless adequate to preventthe appearance of deficiency-related syndromes. The figures for mean dietaryrequirements are derived from these, with the understanding that the curativedose is higher than the preventive dose. They are at the upper limits of the range so as to cover the mean dietary requirements of 97.5% of the population (62).
2. VITAMIN A
35
TABLE 2.4Estimated mean requirement and safe level of intake for vitamin A, by group
Mean requirement Recommended safe intakeGroup (mg RE/day) (mg RE/day)
Infants and children0–6 months 180 3757–12 months 190 4001–3 years 200 4004–6 years 200 4507–9 years 250 500
Adolescents,10–18 years 330–400 600
AdultsFemales,
19–65 years 270 50065+ years 300 600
Males,19–65 years 300 60065+ years 300 600
Pregnant women 370 800Lactating women 450 850
Source: adapted from reference (62).
P017-044 3/12/05 16:56 Page 35
VITAMIN AND MINERAL REQUIREMENTS IN HUMAN NUTRITION
36
In calculating the safe intake, a normative storage requirement was calcu-lated as a mean for adults equivalent to 434mg RE/day, and the recommendedsafe intake was derived in part by using this value plus 2 standard deviations.It is doubtful that this value can be applied to growing children. The safeintake for children was compared with the distribution of intakes and com-parable serum vitamin A levels reported for children 0–6 years of age fromthe United States and with distributions of serum levels of vitamin A of chil-dren aged 9–62 months in Australia (110), where evidence of VAD is rare.
2.8 ToxicityBecause vitamin A is fat soluble and can be stored, primarily in the liver,routine consumption of large amounts of vitamin A over a period of time canresult in toxic symptoms, including liver damage, bone abnormalities andjoint pain, alopecia, headaches, vomiting, and skin desquamation. Hypervit-aminosis A appears to be due to abnormal transport and distribution ofvitamin A and retinoids caused by overloading of the plasma transport mechanisms (111).
The smallest daily supplement associated with liver cirrhosis that has beenreported is 7500mg taken for 6 years (107, 108). Very high single doses canalso cause transient acute toxic symptoms that may include bulgingfontanelles in infants; headaches in older children and adults; and vomiting,diarrhoea, loss of appetite, and irritability in all age groups. Rarely does tox-icity occur from ingestion of food sources of preformed vitamin A. When thisoccurs, it usually results from very frequent consumption of liver products.Toxicity from food sources of provitamin A carotenoids is not reported,except for the cosmetic yellowing of skin.
Infants, including neonates (112), administered single doses equivalent to15000–30000mg retinol (50000–100000IU) in oil generally show no adversesymptoms. However, daily prophylactic or therapeutic doses should notexceed 900mg, which is well above the mean requirement of about 200mg/dayfor infants. An increase in bulging fontanelles occurred in infants under 6months of age in one endemically deficient population given two or moredoses of 7500mg or 15000mg preformed vitamin A in oil (113, 114), but otherlarge-scale controlled clinical trials have not reported increased bulging afterthree doses of 7500mg given with diphtheria-pertussis-tetanus immunizationsat about 6, 10, and 14 weeks of age (115). No effects were detected at 3 yearsof age that related to transient vitamin A-induced bulging that had occurredbefore 6 months of age (112, 116).
Most children aged 1–6 years tolerate single oral doses of 60000mg (200000IU) vitamin A in oil at intervals of 4–6 months without adverse
P017-044 3/12/05 16:56 Page 36
symptoms (107). Occasionally diarrhoea or vomiting is reported but thesesymptoms are transient with no lasting sequelae. Older children seldom experience toxic symptoms unless they habitually ingest vitamin A in excessof 7500mg (25000IU) for prolonged periods of time (107).
When women take vitamin A at daily levels of more than 7500mg (25000IU) during the early stages of gestation, fetal anomalies and poor reproduc-tive outcomes are reported (108). One report suggests an increased risk of ter-atogenicity at intakes as low as 3000mg (10000IU), but this is not confirmedby other studies (108). Women who are pregnant or might become pregnantshould avoid taking excessive amounts of vitamin A. A careful review of the latest available information by a WHO Expert Group recommended thatdaily intakes in excess of 3000mg (10000IU), or weekly intakes in excess of7500mg (25000IU) should not be taken at any period during gestation (109).High doses of vitamin A (60000mg, or 200000IU) can be safely given tobreastfeeding mothers for up to 2 months postpartum and up to 6 weeks tomothers who are not breastfeeding.
2.9 Recommendations for future researchFurther research is needed in the following areas:
• the interaction of vitamin A and iron with infections, as they relate toserum levels and disease incidence and prevalence;
• the relationship between vitamin A, iron, and zinc and their roles in theseverity of infections;
• the nutritional role of 9-cis retinoic acid and the mechanism which regu-lates its endogenous production;
• the bioavailability of provitamin A carotenoids from different classes of leafy and other green and orange vegetables, tubers, and fruits as typically provided in diets (e.g. relative to the level of fat in the diet ormeal);
• identification of a reliable indicator of vitamin A status for use in direct quantification of mean requirements and for relating status to func-tions.
References1. Blomhoff R et al. Vitamin A metabolism: new perspectives on absorption,
transport, and storage. Physiological Reviews, 1991, 71:951–990.2. Ong DE. Absorption of vitamin A. In: Blomhoff R, ed. Vitamin A in health
and disease. New York, NY, Marcel Dekker, 1994:37–72.3. Parker RS. Absorption, metabolism, and transport of carotenoids. FASEB
Journal, 1996, 10:542–551.4. Jayarajan P, Reddy V, Mohanram M. Effect of dietary fat on absorption of
2. VITAMIN A
37
P017-044 3/12/05 16:56 Page 37
VITAMIN AND MINERAL REQUIREMENTS IN HUMAN NUTRITION
38
b-carotene from green leafy vegetables in children. Indian Journal of MedicalResearch, 1980, 71:53–56.
5. Novotny JA et al. Compartmental analysis of the dynamics of b-carotenemetabolism in an adult volunteer. Journal of Lipid Research, 1995, 36:1825–1838.
6. Stephensen CB et al. Vitamin A is excreted in the urine during acute infec-tion. American Journal of Clinical Nutrition, 1994, 60:388–392.
7. Alvarez JO et al. Urinary excretion of retinol in children with acute diarrhea.American Journal of Clinical Nutrition, 1995, 61:1273–1276.
8. Green MH, Green JB. Dynamics and control of plasma retinol. In: BlomhoffR, ed. Vitamin A in health and disease. New York, NY, Marcel Dekker,1994:119–133.
9. Ross C, Gardner EM. The function of vitamin A in cellular growth and differentiation, and its roles during pregnancy and lactation. In: Allen L, King J, Lönnerdal B, eds. Nutrient regulation during pregnancy, lactation,and infant growth. New York, NY, Plenum Press, 1994:187–200.
10. Chambon P. A decade of molecular biology of retinoic acid receptors. FASEBJournal, 1996, 10:940–954.
11. Ross AC, Stephensen CB. Vitamin A and retinoids in antiviral responses.FASEB Journal, 1996, 10:979–985.
12. Pemrick SM, Lucas DA, Grippo JF. The retinoid receptors. Leukemia, 1994,8(Suppl. 3):S1–S10.
13. Rando RR. Retinoid isomerization reactions in the visual system. In:Blomhoff R, ed. Vitamin A in health and disease. New York, NY, MarcelDekker, 1994:503–529.
14. Eskild LW, Hansson V. Vitamin A functions in the reproductive organs. In:Blomhoff R, ed. Vitamin A in health and disease. New York, NY, MarcelDekker, 1994:531–559.
15. Morriss-Kay GM, Sokolova N. Embryonic development and pattern forma-tion. FASEB Journal, 1996, 10:961–968.
16. Indicators for assessing vitamin A deficiency and their application in moni-toring and evaluating intervention programmes. Geneva, World HealthOrganization, 1996 (WHO/NUT/96.10; http://whqlibdoc.who.int/hq/1996/WHO_NUT_96.10.pdf, accessed 24 June 2004).
17. Global prevalence of vitamin A deficiency. Geneva, World Health Organiza-tion, 1995 (WHO/NUT/95.3).
18. Katz J et al. Clustering of xerophthalmia within households and villages.International Journal of Epidemiology, 1993, 22:709–715.
19. Sommer A. Vitamin A deficiency and its consequences: a field guide to detection and control, 3rd ed. Geneva, World Health Organization, 1994.
20. Beaton GH et al. Effectiveness of vitamin A supplementation in the controlof young child morbidity and mortality in developing countries. Geneva,United Nations Administrative Committee on Coordination/Subcommitteeon Nutrition, 1993 (ACC/SCN State-of-the-art Series, Nutrition Policy Discussion Paper No. 13).
21. Sommer A, Emran N, Tjakrasudjatma S. Clinical characteristics of vitaminA responsive and nonresponsive Bitot’s spots. American Journal of Ophthalmology, 1980, 90:160–171.
22. Bloem MW, Matzger H, Huq N. Vitamin A deficiency among women in the reproductive years: an ignored problem. In: Report of the XVI IVACG
P017-044 3/12/05 16:56 Page 38
Meeting. Washington, DC, International Vitamin A Consultative Group,ILSI Human Nutrition Institute, 1994.
23. Christian P et al. Night blindness of pregnancy in rural Nepal—nutritional and health risks. International Journal of Epidemiology, 1998,27:231–237.
24. Wallingford JC, Underwood BA. Vitamin A deficiency in pregnancy, lacta-tion, and the nursing child. In: Baurenfeind JC, ed. Vitamin A deficiency andits control. New York, NY, Academic Press, 1986:101–152.
25. Newman V. Vitamin A and breast-feeding: a comparison of data from devel-oped and developing countries. Food and Nutrition Bulletin, 1994,15:161–176.
26. Physical status: the use and interpretation of anthropometry. Report of aWHO Expert Committee. Geneva, World Health Organization, 1995 (WHOTechnical Report Series, No. 854).
27. Committee on Nutritional Status During Pregnancy and Lactation. VitaminsA, E, and K. In: Nutrition during pregnancy. Part II. Nutrient supplements.Washington, DC, National Academy Press, 1990:336–350.
28. Mele L et al. Nutritional and household risk factors for xerophthalmia inAceh, Indonesia: a case–control study. American Journal of Clinical Nutri-tion, 1991, 53:1460–1465.
29. Erdman J Jr. The physiologic chemistry of carotenes in man. Clinical Nutri-tion, 1988, 7:101–106.
30. Marsh RR et al. Improving food security through home gardening: a casestudy from Bangladesh. In: Technology for rural homes: research and exten-sion experiences. Reading, The Agricultural Extension and Rural Develop-ment Department, University of Reading, 1995.
31. Sinha DP, Bang FB. Seasonal variation in signs of vitamin A deficiency inrural West Bengal children. Lancet, 1973, 2:228–231.
32. Johns T, Booth SL, Kuhnlein HV. Factors influencing vitamin A intake andprogrammes to improve vitamin A status. Food and Nutrition Bulletin, 1992,14:20–33.
33. Tarwotjo I et al. Dietary practices and xerophthalmia among Indonesian children. American Journal of Clinical Nutrition, 1982, 35:574–581.
34. Zeitlan MF et al. Mothers’ and children’s intakes of vitamin A in ruralBangladesh. American Journal of Clinical Nutrition, 1992, 56:136–147.
35. Mahadevan I. Belief systems in food of the Telugu-speaking people of theTelengana region. Indian Journal of Social Work, 1961, 21:387–396.
36. Anonymous. Vitamin A supplementation in northern Ghana: effects on clinicattendance, hospital admissions, and child mortality. Ghana VAST StudyTeam. Lancet, 1993, 342:7–12.
37. Barreto ML et al. Effect of vitamin A supplementation on diarrhoea and acutelower-respiratory-tract infections in young children in Brazil. Lancet, 1994,344:228–231.
38. Bhandari N, Bhan MK, Sazawal S. Impact of massive dose of vitamin A given to preschool children with acute-diarrhoea on subsequent respiratoryand diarrhoeal morbidity. British Medical Journal, 1994, 309:1404–1407.
39. Fawzi WW et al. Vitamin A supplementation and child mortality. A meta-analysis. Journal American Medical Association, 1993, 269:898–903.
40. Glasziou PP, Mackerras DEM. Vitamin A supplementation in infectious diseases: a meta-analysis. British Medical Journal, 1993, 306:366–370.
2. VITAMIN A
39
P017-044 3/12/05 16:56 Page 39
VITAMIN AND MINERAL REQUIREMENTS IN HUMAN NUTRITION
40
41. Menon K, Vijayaraghavan K. Sequelae of severe xerophthalmia: a follow-upstudy. American Journal of Clinical Nutrition, 1979, 33:218–220.
42. Hussey GD, Klein M. A randomized controlled trial of vitamin A in chil-dren with severe measles. New England Journal of Medicine, 1990, 323:160–164.
43. West KP et al. Impact of weekly supplementation of women with vitamin Aor beta-carotene on fetal, infant and maternal mortality in Nepal. In: Reportof the XVIII IVACG Meeting. Sustainable control of vitamin A deficiency.Washington, DC, International Vitamin A Consultative Group, ILSI HumanNutrition Institute, 1997:86.
44. The Vitamin A and Pneumonia Working Group. Potential interventions forthe prevention of childhood pneumonia in developing countries: a meta-analysis of data from field trials to assess the impact of vitamin A supple-mentation on pneumonia morbidity and mortality. Bulletin of the WorldHealth Organization, 1995, 73:609–619.
45. Coutsoudis A, Broughton M, Coovadia HM. Vitamin A supplementationreduces measles morbidity in young African children: a randomized,placebo-controlled, double blind trial. American Journal of Clinical Nutri-tion, 1991, 54:890–895.
46. Solomons NW, Keusch GT. Nutritional implications of parasitic infections.Nutrition Reviews, 1981, 39:149–161.
47. Feachem RG. Vitamin A deficiency and diarrhoea: a review of interrelation-ships and their implications for the control of xerophthalmia and diarrhoea.Tropical Disease Bulletin, 1987, 84:R1–R16.
48. Thurnham DI, Singkamani R. The acute phase response and vitamin A statusin malaria. Transactions of the Royal Society of Tropical Medicine andHygiene, 1991, 85:194–199.
49. Campos FACS, Flores H, Underwood BA. Effect of an infection on vitaminA status of children as measured by the relative dose response (RDR). Amer-ican Journal of Clinical Nutrition, 1987, 46:91–94.
50. Curtale F et al. Intestinal helminths and xerophthalmia in Nepal. Journal ofTropical Pediatrics, 1995, 41:334–337.
51. Sommer A, West KP Jr. Infectious morbidity. In: Vitamin A deficiency,health, survival, and vision. New York, NY, Oxford University Press,1996:19–98.
52. Foster A, Yorston D. Corneal ulceration in Tanzanian children: relationshipbetween measles and vitamin A deficiency. Transactions of the Royal Societyof Tropical Medicine and Hygiene, 1992, 86:454–455.
53. Arroyave G et al. Serum and liver vitamin A and lipids in children with severeprotein malnutrition. American Journal of Clinical Nutrition, 1961,9:180–185.
54. Bates CJ. Vitamin A in pregnancy and lactation. Proceedings of the NutritionSociety, 1983, 42:65–79.
55. Takahashi Y et al. Vitamin A deficiency and fetal growth and developmentin the rat. Journal of Nutrition, 1975, 105:1299–1310.
56. Public Affairs Committee of the Teratology Society. Teratology Society Position Paper. Recommendations for vitamin A use during pregnancy. Teratology, 1987, 35:269–275.
57. Underwood BA. The role of vitamin A in child growth, development andsurvival. In: Allen L, King J, Lönnerdal B, eds. Nutrient regulation duringpregnancy, lactation, and infant growth. New York, NY, Plenum Press, 1994:195–202.
P017-044 3/12/05 16:56 Page 40
58. IVACG Statement on vitamin A and iron interactions. Washington, DC,International Vitamin A Consultative Group, ILSI Human Nutrition Insti-tute, 1998 (http://ivacg.ilsi.org/publications/publist.cfm?publicationid=219,accessed 24 June 2004).
59. Suharno D et al. Supplementation with vitamin A and iron for nutritionalanaemia in pregnant women in West Java, Indonesia. Lancet, 1993,342:1325–1328.
60. Sijtsma KW et al. Iron status in rats fed on diets containing marginal amountsof vitamin A. British Journal of Nutrition, 1993, 70:777–785.
61. Requirements of vitamin A, thiamine, riboflavin and niacin. Report of a JointFAO/WHO Expert Group. Geneva, World Health Organization, 1967(WHO Technical Report Series, No. 362).
62. Requirements of vitamin A, iron, folate and vitamin B12. Report of a JointFAO/WHO Expert Consultation. Rome, Food and Agriculture Organiza-tion of the United Nations, 1988 (FAO Food and Nutrition Series, No. 23).
63. Sauberlich HE et al. Vitamin A metabolism and requirement in human sub-jects studied with the use of labeled retinol. Vitamins and Hormones, 1974,32:251–275.
64. Tang G et al. Green and yellow vegetables can maintain body stores ofvitamin A in Chinese children. American Journal of Clinical Nutrition, 1999,70:1069–1076.
65. Furr HC et al. Vitamin A concentrations in liver determined by isotope dilution assay with tetradeuterated vitamin A and by biopsy in generally healthy adult humans. American Journal of Clinical Nutrition, 1989,49:713–716.
66. Haskell MJ et al. Plasma kinetics of an oral dose of [2H4] retinyl acetate inhuman subjects with estimated low or high total body stores of vitamin A.American Journal of Clinical Nutrition, 1998, 68:90–95.
67. van den Berg H, van Vliet T. Effect of simultaneous, single oral doses of b-carotene with lutein or lycopene on the b-carotene and retinyl ester responsesin the triacylglycerol-rich lipoprotein fraction of men. American Journal ofClinical Nutrition, 1998, 68:82–89.
68. Castenmiller JJ, West CE. Bioavailability and bioconversion of carotenoids.Annual Review of Nutrition, 1998, 18:19–38.
69. Parker RS et al. Bioavailability of carotenoids in human subjects. Proceed-ings of the Nutrition Society, 1999, 58:1–8.
70. van Vliet T, Schreurs WH, van den Berg H. Intestinal b-carotene absorptionand cleavage in men: response of b-carotene and retinyl esters in the trigly-ceride-rich lipoprotein fraction after a single oral dose of b-carotene. Amer-ican Journal Clinical Nutrition, 1995, 62:110–116.
71. Edwards AJ et al. A novel extrinsic reference method for assessing the vitaminA value of plant foods. American Journal of Clinical Nutrition, 2001,74:348–355.
72. Van het Hof KH et al. Bioavailability of lutein from vegetables is five timeshigher than that of b-carotene. American Journal of Clinical Nutrition, 1991,70:261–268.
73. de Pee S et al. Orange fruit is more effective than dark-green, leafy vegeta-bles in increasing serum concentrations of retinol and beta-carotene inschoolchildren in Indonesia. American Journal of Clinical Nutrition, 1998,68:1058–1067.
74. Miccozzi MS et al. Plasma carotenoid response to chronic intake of selected
2. VITAMIN A
41
P017-044 3/12/05 16:56 Page 41
VITAMIN AND MINERAL REQUIREMENTS IN HUMAN NUTRITION
42
foods and b-carotene supplements in men. American Journal of ClinicalNutrition, 1992, 55:1120–1125.
75. Torronen R et al. Serum b-carotene response to supplementation with rawcarrots, carrot juice or purified b-carotene in healthy non-smoking women.Nutrition Reviews, 1996, 16:565–575.
76. Food and Nutrition Board. Dietary reference intakes for vitamin A, vitaminK, arsenic, boron, chromium, copper, iodine, iron, manganese, molybdenum,nickel, silicon, vanadium, and zinc. Washington, DC, National AcademyPress, 2002.
77. Rodriguez-Amaya DB. Carotenoids and food preparation: the retention ofprovitamin A carotenoids in prepared, processed, and stored foods. Arlington,VA, John Snow and Opportunities for Micronutrient Interventions Project,1997 (http://www.mostproject.org/carrots2.pdf, accessed 24 June 2004).
78. Booth SL, Johns T, Kuhnlein HV. Natural food sources of vitamin A andprovitamin A. UNU Food and Nutrition Bulletin, 1992, 14:6–19.
79. Advisory Committee on Technology Innovations. Burití palm. In: Underex-ploited tropical plants with promising economic value. Report of an Ad Hoc Panel of the Advisory Committee on Technology Innovations, Board on Science and Technology for International Development, Commission onInternational Relations. Washington, DC, National Academy of Sciences,1975:133–137.
80. Vuong LT. An indigenous fruit of North Vietnam with an exceptionally highb-carotene content. Sight and Life Newsletter, 1997, 2:16–18.
81. Report of the International Vitamin A Consultative Group. Guidelines forthe development of a simplified dietary assessment to identify groups at riskfor inadequate intake of vitamin A. Washington, DC, International Life Sciences Institute, Nutrition Foundation, 1989.
82. Périssé J, Polacchi W. Geographical distribution and recent changes in worldsupply of vitamin A. Food and Nutrition, 1980, 6:21–27.
83. Second report on the world nutrition situation. Volume 1. Global and regionalresults. Washington, DC, United Nations Administrative Committee onCoordination/Subcommittee on Nutrition, 1992.
84. Food and nutrient intakes by individuals in the United States, by sex and age,1994–96. Washington, DC, United States Department of Agriculture, Agri-cultural Research Service, 1998 (Nationwide Food Surveys Report, 96–2).
85. National Health and Nutrition Examination Survey III, 1988–1994 [CD-ROM]. Hyatsville, MD, Centers for Disease Control and Prevention, 1998(CD-ROM Series 11, No. 2A).
86. Gregory J et al. The Dietary and Nutritional Survey of British Adults.London, Her Majesty’s Stationery Office, 1990.
87. Tyler HA, Day MJL, Rose HJ. Vitamin A and pregnancy. Lancet, 1991,337:48–49.
88. Bloem MW, de Pee S, Darnton-Hill I. Vitamin A deficiency in India,Bangladesh and Nepal. In: Gillespie S, ed. Malnutrition in South Asia. A regional profile. Kathmandu, United Nations Children’s Fund RegionalOffice for South Asia, 1997:125–144.
89. de Pee S et al. Lack of improvement in vitamin A status with increased consumption of dark-green leafy vegetables. Lancet, 1995, 346:75–81.
90. Yin S et al. Green and yellow vegetables rich in provitamin A carotenoidscan sustain vitamin A status in children. FASEB Journal, 1998, 12:A351.
91. Jalal F et al. Serum retinol concentrations in children are affected by food
P017-044 3/12/05 16:56 Page 42
sources of b-carotene, fat intake, and anthelmintic drug treatment. AmericanJournal of Clinical Nutrition, 1998, 68:623–629.
92. Christian P et al. Working after the sun goes down. Exploring how nightblindness impairs women’s work activities in rural Nepal. European Journalof Clinical Nutrition, 1998, 52:519–524.
93. Underwood BA, Olson JA, eds. A brief guide to current methods of assess-ing vitamin A status. A report of the International Vitamin A ConsultativeGroup. Washington, DC, International Life Sciences Institute, NutritionFoundation, 1993.
94. Sommer A et al. History of night blindness: a simple tool for xerophthalmiascreening. American Journal of Clinical Nutrition, 1980, 33:887–891.
95. Underwood BA. Biochemical and histological methodologies for assessingvitamin A status in human populations. In: Packer L, ed. Methods in enzy-mology: retinoids, part B. New York, NY, Academic Press, 1990:242–250.
96. Olson JA. Measurement of vitamin A status. Voeding, 1992, 53:163–167.97. Sommer A, Muhilal H. Nutritional factors in corneal xerophthalmia and
keratomalacia. Archives of Ophthalmology, 1982, 100:399–403.98. Wachtmeister L et al. Attempts to define the minimal serum level of vitamin
A required for normal visual function in a patient with severe fat malab-sorption. Acta Ophthalmologica, 1988, 66:341–348.
99. Flores H et al. Assessment of marginal vitamin A deficiency in Brazilian children using the relative dose response procedure. American Journal ofClinical Nutrition, 1984, 40:1281–1289.
100. Flores H et al. Serum vitamin A distribution curve for children aged 2–6yknown to have adequate vitamin A status: a reference population. AmericanJournal of Clinical Nutrition, 1991, 54:707–711.
101. Onlu Pilch SM. Analysis of vitamin A data from the health and nutritionexamination surveys. Journal of Nutrition, 1987, 117:636–640.
102. Christian P et al. Hyporetinolemia, illness symptoms, and acute phaseprotein response in pregnant women with and without night blindness.American Journal of Clinical Nutrition, 1998, 67:1237–1243.
103. Filteau SM et al. Influence of morbidity on serum retinol of children in acommunity-based study in northern Ghana. American Journal of ClinicalNutrition, 1993, 58:192–197.
104. Complementary feeding of young children in developing countries: a review of current scientific knowledge. Geneva, World Health Organization, 1998(WHO/NUT/98.1; http://www.who.int/child-adolescenthealth/publications/NUTRITION/WHO_NUT_98.1.htm, accessed 24 June 2004).
105. Rahmathullah L et al. Reduced mortality among children in Southern Indiareceiving a small weekly dose of vitamin A. New England Journal of Medi-cine, 1990, 323:929–935.
106. Miller RK et al. Periconceptional vitamin A use: how much is teratogenic?Reproductive Toxicology, 1998, 12:75–88.
107. Hathcock JN et al. Evaluation of vitamin A toxicity. American Journal ofClinical Nutrition, 1990, 52:183–202.
108. Hathcock JN. Vitamins and minerals: efficacy and safety. American Journalof Clinical Nutrition, 1997, 66:427–437.
109. Safe vitamin A dosage during pregnancy and lactation. Geneva, World HealthOrganization, 1998 (WHO/NUT/98.4; http://whqlibdoc.who.int/hq/1998/WHO_NUT_98.4.pdf, accessed 24 June 2004).
110. Karr M et al. Age-specific reference intervals for plasma vitamin A, E and
2. VITAMIN A
43
P017-044 3/12/05 16:56 Page 43
VITAMIN AND MINERAL REQUIREMENTS IN HUMAN NUTRITION
44
beta-carotene and for serum zinc, retinol-binding protein and prealbumin for Sydney children aged 9–62 months. International Journal of Vitamin andNutrition Research, 1997, 67:432–436.
111. Smith FR, Goodman DS. Vitamin A transport in human vitamin A toxicity.New England Journal of Medicine, 1976, 294:805–808.
112. Humphrey JH et al. Neonatal vitamin A supplementation: effect on devel-opment and growth at 3y of age. American Journal of Clinical Nutrition,1998, 68:109–117.
113. Baqui AH et al. Bulging fontanelle after supplementation with 25,000IUvitamin A in infancy using immunization contacts. Acta Paediatrica, 1995,84:863–866.
114. de Francisco A et al. Acute toxicity of vitamin A given with vaccines ininfancy. Lancet, 1993, 342:526–527.
115. WHO/CHD Immunisation-linked Vitamin A Supplementation StudyGroup. Randomised trial to assess benefits and safety of vitamin A supple-mentation linked to immunisation in early infancy. Lancet, 1998,352:1257–1263.
116. van Dillen J, de Francisco A, Ovenrweg-Plandsoen WCG. Long-term effectof vitamin A with vaccines. Lancet, 1996, 347:1705.
P017-044 3/12/05 16:56 Page 44
3. Vitamin D
45
3.1 Role of vitamin D in human metabolic processesVitamin D is required to maintain normal blood levels of calcium and phos-phate, which are in turn needed for the normal mineralization of bone, musclecontraction, nerve conduction, and general cellular function in all cells of thebody. Vitamin D achieves this after its conversion to the active form 1,25-dihydroxyvitamin D [1,25-(OH)2D], or calcitriol. This active form regulatesthe transcription of a number of vitamin D-dependent genes which code forcalcium-transporting proteins and bone matrix proteins.
Vitamin D also modulates the transcription of cell cycle proteins, whichdecrease cell proliferation and increase cell differentiation of a number of spe-cialized cells of the body (e.g. osteoclastic precursors, enterocytes, ker-atinocytes). This property may explain the actions of vitamin D in boneresorption, intestinal calcium transport, and skin. Vitamin D also possessesimmunomodulatory properties that may alter responses to infections in vivo.These cell differentiating and immunomodulatory properties underlie thereason why vitamin D derivatives are now used successfully in the treatmentof psoriasis and other skin disorders.
3.1.1 Overview of vitamin D metabolismVitamin D, a seco-steroid, can either be made in the skin from a cholesterol-like precursor (7-dehydrocholesterol) by exposure to sunlight or can be pro-vided pre-formed in the diet (1). The version made in the skin is referred toas vitamin D3 whereas the dietary form can be vitamin D3 or a closely-relatedmolecule of plant origin known as vitamin D2 . Because vitamin D can be madein the skin, it should not strictly be called a vitamin, and some nutritionaltexts refer to the substance as a prohormone and to the two forms as cole-calciferol (D3) and ergocalciferol (D2).
From a nutritional perspective, the two forms are metabolized similarly in humans, are equal in potency, and can be considered equivalent. It is now firmly established that vitamin D3 is metabolized first in the liver to 25-hydroxyvitamin D (calcidiol) (2) and subsequently in the kidneys to
P045-058 3/12/05 16:57 Page 45
VITAMIN AND MINERAL REQUIREMENTS IN HUMAN NUTRITION
46
1,25-(OH)2D (calcitriol) (3) to produce a biologically active hormone. The1,25-(OH)2D compound, like all vitamin D metabolites, is present in theblood complexed to the vitamin D-binding protein, a specific a-globulin. Cal-citriol is believed to act on target cells in a similar way to a steroid hormone.Free hormone crosses the plasma membrane and interacts with a specificnuclear receptor known as the vitamin D receptor, a DNA-binding, zinc-finger protein with a relative molecular mass of 55000 (4). This ligand-recep-tor complex binds to a specific vitamin D-responsive element and, withassociated transcription factors (e.g. retinoid X receptor), enhances transcrip-tion of mRNAs which code for calcium-transporting proteins, bone matrixproteins, or cell cycle-regulating proteins (5). As a result of these processes,1,25-(OH)2D stimulates intestinal absorption of calcium and phosphate andmobilizes calcium and phosphate by stimulating bone resorption (6). Thesefunctions serve the common purpose of restoring blood levels of calcium andphosphate to normal when concentrations of the two ions are low.
Lately, interest has focused on other cellular actions of calcitriol. With thediscovery of 1,25-(OH)2D receptors in many classically non-target tissuessuch as brain, various bone marrow-derived cells, skin, and thymus (7), theview has been expressed that 1,25-(OH)2D induces fusion and differentiationof macrophages (8, 9). This effect has been widely interpreted to mean thatthe natural role of 1,25-(OH)2D is to induce osteoclastogenesis from colonyforming units (i.e. granulatory monocytes in the bone marrow). Calcitriol alsosuppresses interleukin-2 production in activated T-lymphocytes (10, 11), aneffect which suggests the hormone might play a role in immuno-modulation in vivo. Other tissues (e.g. skin) are directly affected by exoge-nous administration of vitamin D, though the physiologic significance of theseeffects is poorly understood. The pharmacologic effects of 1,25-(OH)2D areprofound and have resulted in the development of vitamin D analogues, whichare approved for use in hyperproliferative conditions such as psoriasis (12).
Clinical assays measure 1,25-(OH)2D2 and 1,25-(OH)2D3, collectivelycalled 1,25-(OH)2D. Similarly, calcidiol is measured as 25-OH-D but it is amixture of 25-OH-D2 and 25-OH-D3. For the purposes of this document,1,25-(OH)2D and 25-OH-D will be used to refer to calcitriol and calcidiol,respectively.
3.1.2 Calcium homeostasisIn calcium homeostasis, 1,25-(OH)2D works in conjunction with parathyroidhormone (PTH) to produce its beneficial effects on the plasma levels ofionized calcium and phosphate (5, 13). The physiologic loop (Figure 3.1) startswith the calcium receptor of the parathyroid gland (14). When the level of
P045-058 3/12/05 16:57 Page 46
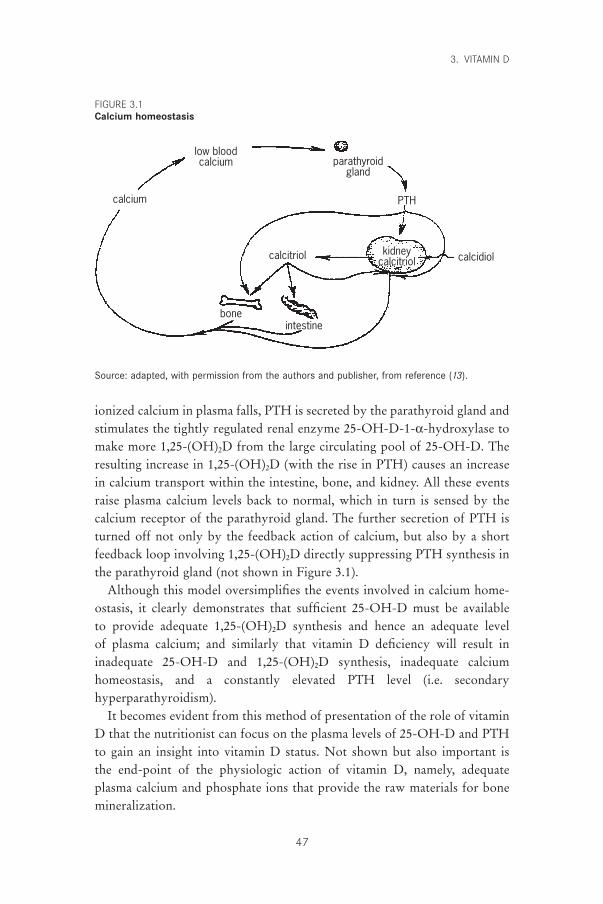
ionized calcium in plasma falls, PTH is secreted by the parathyroid gland andstimulates the tightly regulated renal enzyme 25-OH-D-1-a-hydroxylase tomake more 1,25-(OH)2D from the large circulating pool of 25-OH-D. Theresulting increase in 1,25-(OH)2D (with the rise in PTH) causes an increasein calcium transport within the intestine, bone, and kidney. All these eventsraise plasma calcium levels back to normal, which in turn is sensed by thecalcium receptor of the parathyroid gland. The further secretion of PTH isturned off not only by the feedback action of calcium, but also by a shortfeedback loop involving 1,25-(OH)2D directly suppressing PTH synthesis inthe parathyroid gland (not shown in Figure 3.1).
Although this model oversimplifies the events involved in calcium home-ostasis, it clearly demonstrates that sufficient 25-OH-D must be available to provide adequate 1,25-(OH)2D synthesis and hence an adequate level of plasma calcium; and similarly that vitamin D deficiency will result in inadequate 25-OH-D and 1,25-(OH)2D synthesis, inadequate calcium homeostasis, and a constantly elevated PTH level (i.e. secondary hyperparathyroidism).
It becomes evident from this method of presentation of the role of vitaminD that the nutritionist can focus on the plasma levels of 25-OH-D and PTHto gain an insight into vitamin D status. Not shown but also important is the end-point of the physiologic action of vitamin D, namely, adequate plasma calcium and phosphate ions that provide the raw materials for bonemineralization.
3. VITAMIN D
47
kidneycalcitriol
low bloodcalcium
calcium
parathyroidgland
PTH
boneintestine
calcitriol calcidiol
Source: adapted, with permission from the authors and publisher, from reference (13).
FIGURE 3.1Calcium homeostasis
P045-058 3/12/05 16:57 Page 47
VITAMIN AND MINERAL REQUIREMENTS IN HUMAN NUTRITION
48
3.2 Populations at risk for vitamin D deficiency3.2.1 InfantsInfants constitute a population at risk for vitamin D deficiency because of rel-atively large vitamin D needs brought about by their high rate of skeletalgrowth. At birth, infants have acquired in utero the vitamin D stores that mustcarry them through the first months of life. A recent survey of Frenchneonates revealed that 64% had 25-OH-D values below 30nmol/l, the lowerlimit of the normal range (15). Breast-fed infants are particularly at riskbecause of the low concentrations of vitamin D in human milk (16). Thisproblem is further compounded in some infants fed human milk by a restric-tion in exposure to ultraviolet (UV) light for seasonal, latitudinal, cultural, orsocial reasons. Infants born in the autumn months at extreme latitudes areparticularly at risk because they spend the first 6 months of their life indoorsand therefore have little opportunity to synthesize vitamin D in their skinduring this period. Consequently, although vitamin D deficiency is rare indeveloped countries, sporadic cases of rickets are still being reported in manynorthern cities but almost always in infants fed human milk (17–20).
Infant formulas are supplemented with vitamin D at levels ranging from 40international units (IU) or 1mg/418.4kJ to 100IU or 2.5mg/418.4kJ, thatprovide approximately between 6mg and 15mg of vitamin D, respectively.These amounts of dietary vitamin D are sufficient to prevent rickets.
3.2.2 AdolescentsAnother period of rapid growth of the skeleton occurs at puberty andincreases the need not for the vitamin D itself, but for the active form 1,25-(OH)2D. This need results from the increased conversion of 25-OH-D to1,25-(OH)2D in adolescents (21). Unlike infants, however, adolescents usuallyspend more time outdoors and therefore usually are exposed to levels of UVlight sufficient for synthesizing vitamin D for their needs. Excess productionof vitamin D in the summer and early autumn months is stored mainly in theadipose tissue (22) and is available to sustain high growth rates in the wintermonths that follow. Insufficient vitamin D stores during this period ofincreased growth can lead to vitamin D insufficiency (23).
3.2.3 ElderlyOver the past 20 years, clinical research studies of the basic biochemicalmachinery for handling vitamin D have suggested an age-related decline in many key steps of vitamin D action (24), including the rate of skin synthesis,the rate of hydroxylation (leading to the activation to the hormonal form),
P045-058 3/12/05 16:57 Page 48
and the response of target tissues (e.g. bone) (25). Not surprisingly, a numberof independent studies from around the world have shown that there appearsto be vitamin D deficiency in a subset of the elderly population, character-ized by low blood levels of 25-OH-D coupled with elevations in plasma PTHand alkaline phosphatase (26). There is evidence that this vitamin D deficiencycontributes to declining bone mass and increases the incidence of hip frac-tures (27). Although some of these studies may exaggerate the extent of theproblem by focusing on institutionalized individuals or inpatients withdecreased sun exposures, in general they have forced health professionals tore-address the vitamin D intake of this segment of society and look at poten-tial solutions to correct the problem. Table 3.1 presents the findings of severalstudies that found that modest increases in vitamin D intakes (between 10 and20mg/day) reduce the rate of bone loss and the incidence of hip fractures.
These findings have led several agencies and researchers to suggest anincrease in recommended vitamin D intakes for the elderly from 2.5–5mg/day to a value that is able to maintain normal 25-OH-D levels in theelderly, such as 10–15mg/day. This vitamin D intake results in lower rates ofbone loss and is proposed for the middle-aged (50–70 years) and old-aged (>70 years) populations (33). The increased requirements are justified mainlyon the grounds of the reduction in skin synthesis of vitamin D, a linear reduc-tion occurring in both men and women that begins with the thinning of theskin at age 20 years (24).
3.2.4 Pregnant and lactating womenElucidation of the changes in calciotropic hormones occurring during preg-nancy and lactation has revealed a role for vitamin D in the former but notdefinitively in the latter. Even in pregnancy, the changes in vitamin D metab-olism which occur, namely an increase in the maternal plasma levels of 1,25-(OH)2D (34) due to a putative placental synthesis of the hormone (35), do notseem to impinge greatly on the maternal vitamin D requirements. The concernthat modest vitamin D supplementation might be deleterious to the fetus isnot justified. Furthermore, because transfer of vitamin D from mother to fetusis important for establishing the neonate’s growth rate, the goal of ensuringadequate vitamin D status with conventional prenatal vitamin D supplementsprobably should not be discouraged.
In lactating women there appears to be no direct role for vitamin D becauseincreased calcium needs are regulated by the PTH-related peptide (36, 37),and recent studies have failed to show any change in vitamin D metabolitesduring lactation (38, 39). As stated above, the vitamin D content of human
3. VITAMIN D
49
P045-058 3/12/05 16:57 Page 49
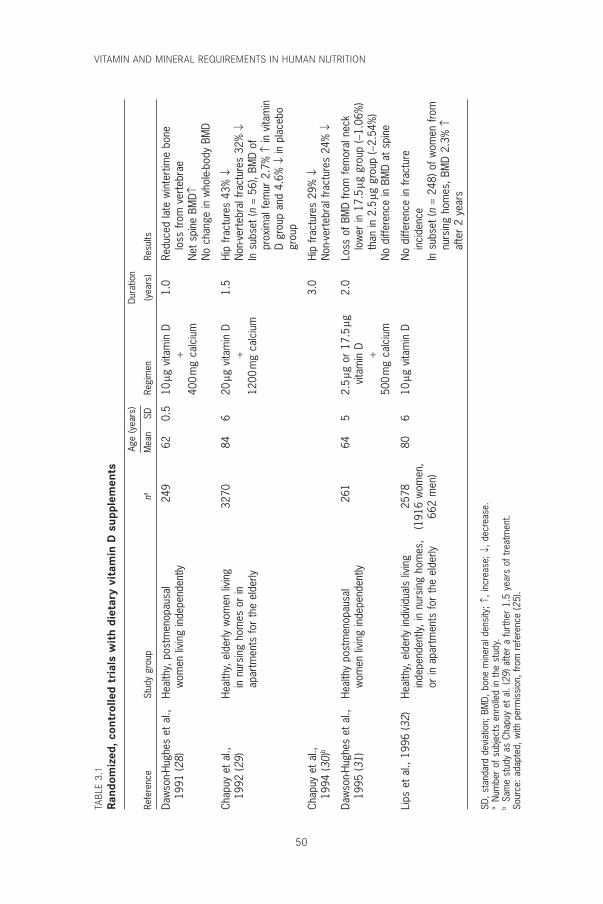
VITAMIN AND MINERAL REQUIREMENTS IN HUMAN NUTRITION
50
TABL
E 3.
1Ra
ndom
ized
, con
trol
led
tria
ls w
ith
diet
ary
vita
min
D s
uppl
emen
ts
Age
(yea
rs)
Dura
tion
Refe
renc
eSt
udy
grou
pna
Mea
nSD
Regi
men
(yea
rs)
Resu
lts
Daw
son-
Hugh
es e
t al
.,He
alth
y, p
ostm
enop
ausa
l24
962
0.5
10mg
vita
min
D1.
0Re
duce
d la
te w
inte
rtim
e bo
ne19
91 (2
8)w
omen
livi
ng in
depe
nden
tly+
loss
from
ver
tebr
ae40
0m
g ca
lciu
mN
et s
pine
BM
D≠N
o ch
ange
in w
hole
-bod
y BM
D
Chap
uy e
t al
.,He
alth
y, e
lder
ly w
omen
livi
ng32
7084
620
mg v
itam
in D
1.5
Hip
frac
ture
s 43
% Ø
1992
(29)
in n
ursi
ng h
omes
or
in+
Non
-ver
tebr
al fr
actu
res
32%
Øap
artm
ents
for
the
elde
rly12
00m
g ca
lciu
mIn
sub
set
(n=
56),
BMD
ofpr
oxim
al fe
mur
2.7
% ≠
in v
itam
inD
grou
p an
d 4.
6% Ø
in p
lace
bogr
oup
Chap
uy e
t al
.,3.
0Hi
p fr
actu
res
29%
Ø19
94 (3
0)b
Non
-ver
tebr
al fr
actu
res
24%
Ø
Daw
son-
Hugh
es e
t al
.,He
alth
y po
stm
enop
ausa
l26
164
52.
5mg
or
17.5
mg2.
0Lo
ss o
f BM
D fro
m fe
mor
al n
eck
1995
(31)
wom
en li
ving
inde
pend
ently
vita
min
Dlo
wer
in 1
7.5
mg g
roup
(-1.
06%
)+
than
in 2
.5mg
gro
up (-
2.54
%)
500
mg
calc
ium
No
diffe
renc
e in
BM
D at
spi
ne
Lips
et
al.,
1996
(32)
Heal
thy,
eld
erly
indi
vidu
als
livin
g25
7880
610
mg v
itam
in D
No
diffe
renc
e in
frac
ture
inde
pend
ently
, in
nurs
ing
hom
es,
(191
6 w
omen
,in
cide
nce
or in
apa
rtm
ents
for
the
elde
rly66
2 m
en)
In s
ubse
t (n
=24
8) o
f wom
en fr
om
nurs
ing
hom
es, B
MD
2.3%
≠af
ter
2 ye
ars
SD, s
tand
ard
devi
atio
n; B
MD,
bon
e m
iner
al d
ensi
ty; ≠
, inc
reas
e; Ø
, dec
reas
e.a
Num
ber
of s
ubje
cts
enro
lled
in t
he s
tudy
.b
Sam
e st
udy
as C
hapu
y et
al.
(29)
afte
r a
furt
her
1.5
year
s of
tre
atm
ent.
Sour
ce: a
dapt
ed, w
ith p
erm
issi
on, f
rom
ref
eren
ce (2
5).
P045-058 3/12/05 16:57 Page 50
milk is low (16). Consequently, there is no great drain on maternal vitamin Dreserves either to regulate calcium homeostasis or to supply the need ofhuman milk. Because human milk is a poor source of vitamin D, rare cases ofnutritional rickets are still found, but these are almost always in breast-fedinfants deprived of sunlight exposure (17–20). Furthermore, there is little evi-dence that increasing calcium or vitamin D supplementation to lactatingmothers results in an increased transfer of calcium or vitamin D in milk (38).Thus, the current thinking, based on a clearer understanding of the role ofvitamin D in lactation, is that there is little purpose in recommending addi-tional vitamin D for lactating women. The goal for mothers who breastfeedtheir infants seems to be merely to ensure good nutrition and sunshine expo-sure in order to ensure normal vitamin D status during the perinatal period.
3.3 Evidence used for estimating recommended intakes
3.3.1 Lack of accuracy in estimating dietary intake and skin synthesis
The unique problem of estimating total intake of a substance that can be pro-vided in the diet or made in the skin by exposure to sunlight makes it diffi-cult to derive adequate total intakes of vitamin D for the general population.Moreover, accurate food composition data are not available for vitamin D,accentuating the difficulty in estimating dietary intakes. Whereas two recentUnited States national surveys have avoided even attempting this task, thesecond National Health and Nutrition Examination Survey (NHANES II)estimated vitamin D intakes to be 2.9mg/day and 2.3mg/day for younger andolder women, respectively. A recent study of elderly women by Kinyamu etal. (40) concurred with this assessment, finding an intake of 3.53mg/day.
Skin synthesis is equally difficult to estimate, being affected by such impon-derables as age, season, latitude, time of day, skin exposure, and sunscreen use.In vitamin D-replete individuals, estimates of skin synthesis are put at around10mg/day (24, 41), with total intakes estimated at 15mg/day (24).
3.3.2 Use of plasma 25-OH-D as a measure of vitamin D statusNumerous recent studies have used plasma 25-OH-D as a measure of vitaminD status, and there is a strong presumptive relationship of this variable withbone status. Thus, it is not surprising that several nutritional committees (e.g.the Food and Nutrition Board of the United States National Academy of Sci-ences’ Institute of Medicine in conjunction with Health Canada) have chosento use a biochemical basis for estimating required intakes and have used theseestimates to derive recommended intakes (33). The method used involves the
3. VITAMIN D
51
P045-058 3/12/05 16:57 Page 51
VITAMIN AND MINERAL REQUIREMENTS IN HUMAN NUTRITION
52
estimation of the mean group dietary intake of vitamin D required to main-tain the plasma 25-OH-D levels above 27nmol/l, which is the level necessaryto ensure normal bone health. Previously, many studies had established 27nmol/l as the lower limit of the normal range (e.g. NHANES III [42]). Thisdietary intake of vitamin D for each population group was rounded to thenearest 50IU (1.25mg) and then doubled to cover the needs of all individualswithin that group irrespective of sunlight exposure. This amount was termedadequate intake (AI) and was used in place of the recommended dietaryallowance (RDA), which had been used by United States agencies since 1941.The present Expert Consultation decided to use these figures as recommendednutrient intakes (RNIs) because it considered this to be an entirely logicalapproach to estimating the vitamin D needs for the global population.
Because many studies had recommended increases in vitamin D intakes forthe elderly, it might have been expected that the proposed increases in sug-gested intakes from 5mg/day (the RDA in the United States [43] and the RNIin Canada [44]) to between 10 and 15mg/day (AI) would be welcomed.However, a recent editorial in a prominent medical journal attacked the rec-ommendations as being too conservative (45). Furthermore, an article in thesame journal (46) reported the level of hypovitaminosis D to be as high as57% in a population of ageing (mean age, 62 years) medical inpatients in theBoston area.
Of course, such inpatients are by definition sick and should not be used tocalculate intakes of healthy individuals. Indeed, the new NHANES III study(42) of 18323 healthy individuals from all regions of the United States suggests that approximately 5% had values of 25-OH-D below 27nmol/l (seeTable 3.2). Although the data are skewed by sampling biases that favoursample collection in the southern states in winter months and northern statesin the summer months, even subsets of data collected in northern states in September give the incidence of low 25-OH-D in the elderly in the 6–18% range (47), compared with 57% in the institutionalized inpatient population (46) mentioned above. Ideally, such measurements in a healthypopulation should be made at the end of the winter months before UV irra-diation has reached a strength sufficient to allow skin synthesis of vitamin D.Thus, the NHANES III study may still underestimate the incidence ofhypovitaminosis D in a northern elderly population in winter. Nevertheless,in lieu of additional studies of selected human populations, it would seem that the recommendations of the Food and Nutrition Board are reasonableguidelines for vitamin D intakes, at least for the near future. This consideredapproach allows for a period of time to monitor the potential shortfalls of
P045-058 3/12/05 16:57 Page 52
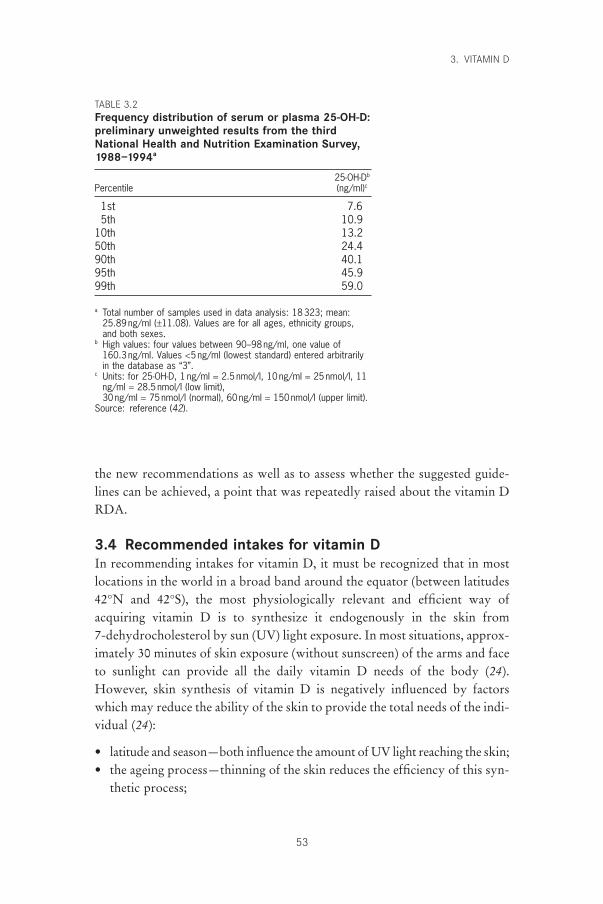
the new recommendations as well as to assess whether the suggested guide-lines can be achieved, a point that was repeatedly raised about the vitamin DRDA.
3.4 Recommended intakes for vitamin DIn recommending intakes for vitamin D, it must be recognized that in mostlocations in the world in a broad band around the equator (between latitudes42°N and 42°S), the most physiologically relevant and efficient way of acquiring vitamin D is to synthesize it endogenously in the skin from 7-dehydrocholesterol by sun (UV) light exposure. In most situations, approx-imately 30 minutes of skin exposure (without sunscreen) of the arms and faceto sunlight can provide all the daily vitamin D needs of the body (24).However, skin synthesis of vitamin D is negatively influenced by factorswhich may reduce the ability of the skin to provide the total needs of the indi-vidual (24):
• latitude and season—both influence the amount of UV light reaching the skin;• the ageing process—thinning of the skin reduces the efficiency of this syn-
thetic process;
3. VITAMIN D
53
TABLE 3.2Frequency distribution of serum or plasma 25-OH-D:preliminary unweighted results from the thirdNational Health and Nutrition Examination Survey,1988–1994a
25-OH-Db
Percentile (ng/ml)c
1st 7.65th 10.9
10th 13.250th 24.490th 40.195th 45.999th 59.0
a Total number of samples used in data analysis: 18323; mean:25.89ng/ml (±11.08). Values are for all ages, ethnicity groups,and both sexes.
b High values: four values between 90–98ng/ml, one value of 160.3ng/ml. Values <5ng/ml (lowest standard) entered arbitrarilyin the database as “3”.
c Units: for 25-OH-D, 1 ng/ml = 2.5nmol/l, 10ng/ml = 25nmol/l, 11ng/ml = 28.5nmol/l (low limit), 30ng/ml = 75nmol/l (normal), 60ng/ml = 150nmol/l (upper limit).
Source: reference (42).
P045-058 3/12/05 16:57 Page 53
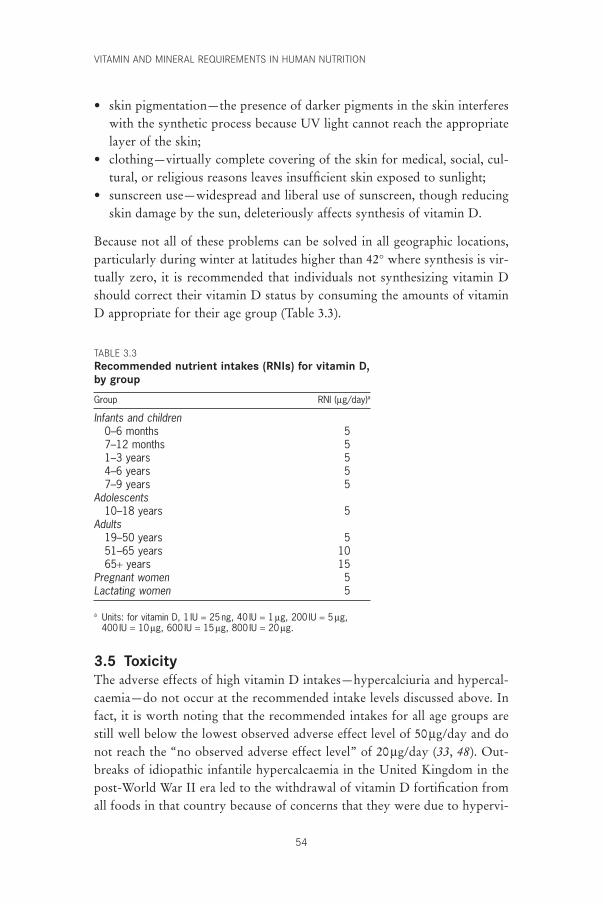
VITAMIN AND MINERAL REQUIREMENTS IN HUMAN NUTRITION
54
• skin pigmentation—the presence of darker pigments in the skin interfereswith the synthetic process because UV light cannot reach the appropriatelayer of the skin;
• clothing—virtually complete covering of the skin for medical, social, cul-tural, or religious reasons leaves insufficient skin exposed to sunlight;
• sunscreen use—widespread and liberal use of sunscreen, though reducingskin damage by the sun, deleteriously affects synthesis of vitamin D.
Because not all of these problems can be solved in all geographic locations,particularly during winter at latitudes higher than 42° where synthesis is vir-tually zero, it is recommended that individuals not synthesizing vitamin Dshould correct their vitamin D status by consuming the amounts of vitaminD appropriate for their age group (Table 3.3).
TABLE 3.3Recommended nutrient intakes (RNIs) for vitamin D,by group
Group RNI (mg/day)a
Infants and children0–6 months 57–12 months 51–3 years 54–6 years 57–9 years 5
Adolescents10–18 years 5
Adults19–50 years 551–65 years 1065+ years 15
Pregnant women 5Lactating women 5
a Units: for vitamin D, 1 IU = 25ng, 40 IU = 1 mg, 200 IU = 5 mg, 400 IU = 10 mg, 600 IU = 15 mg, 800 IU = 20 mg.
3.5 ToxicityThe adverse effects of high vitamin D intakes—hypercalciuria and hypercal-caemia—do not occur at the recommended intake levels discussed above. Infact, it is worth noting that the recommended intakes for all age groups arestill well below the lowest observed adverse effect level of 50mg/day and donot reach the “no observed adverse effect level” of 20mg/day (33, 48). Out-breaks of idiopathic infantile hypercalcaemia in the United Kingdom in thepost-World War II era led to the withdrawal of vitamin D fortification fromall foods in that country because of concerns that they were due to hypervi-
P045-058 3/12/05 16:57 Page 54
taminosis D. There are some suggestions in the literature that these outbreaksof idiopathic infantile hypercalcaemia may have involved genetic and dietarycomponents and were not due strictly to technical problems with over-fortification as was assumed (49, 50). In retrospect, the termination of the vitamin D fortification may have been counterproductive as it exposedsegments of the United Kingdom community to vitamin D deficiency andmay have discouraged other nations from starting vitamin D fortification pro-grammes (50). This is all the more cause for concern because hypovitaminosisD is still a problem worldwide, particularly in developing countries, at highlatitudes and in countries where skin exposure to sunlight is discouraged (51).
3.6 Recommendations for future researchFurther research is needed to determine the following:
• whether vitamin D supplements during pregnancy have any positive effectslater in life;
• whether vitamin D has a role in lactation;• the long-term effects of high vitamin D intakes;• whether dietary vitamin D supplements are as good as exposure to UV
light;• whether vitamin D is only needed for regulation of calcium and phosphate.
References1. Feldman D, Glorieux FH, Pike JW. Vitamin D. New York, NY, Academic
Press, 1997.2. Blunt JW, DeLuca HF, Schnoes HK. 25-hydroxycholecalciferol. A biologi-
cally active metabolite of vitamin D3. Biochemistry, 1968, 7:3317–3322.3. Fraser DR, Kodicek E. Unique biosynthesis by kidney of a biologically active
vitamin D metabolite. Nature, 1970, 228:764–766.4. Haussler MR. Vitamin D receptors: nature and function. Annual Review of
Nutrition, 1986, 6:527–562.5. Jones G, Strugnell S, DeLuca HF. Current understanding of the molecular
actions of vitamin D. Physiology Reviews, 1998, 78:1193–1231.6. DeLuca HF. The vitamin D story: a collaborative effort of basic science and
clinical medicine. FASEB Journal, 1988, 2:224–236.7. Pike JW. Vitamin D3 receptors: structure and function in transcription. Annual
Review of Nutrition, 1991, 11:189–216.8. Abe E et al. 1,25-dihydroxyvitamin D3 promotes fusion of mouse alveolar
macrophages both by a direct mechanism and by a spleen cell-mediated indi-rect mechanism. Proceedings of the National Academy of Sciences, 1983,80:5583–5587.
9. Bar-Shavit Z et al. Induction of monocytic differentiation and bone resorp-tion by 1,25-dihydroxyvitamin D3. Proceedings of the National Academy ofSciences, 1983, 80:5907–5911.
10. Bhalla AK et al. Specific high affinity receptors for 1,25-dihydroxyvitamin D3
3. VITAMIN D
55
P045-058 3/12/05 16:57 Page 55
VITAMIN AND MINERAL REQUIREMENTS IN HUMAN NUTRITION
56
in human peripheral blood mononuclear cells: presence in monocytes andinduction in T lymphocytes following activation. Journal of ClinicalEndocrinology and Metabolism, 1983, 57:1308–1310.
11. Tsoukas CD, Provvedini DM, Manolagas SC. 1,25-dihydroxyvitamin D3: anovel immunoregulatory hormone. Science, 1984, 224:1438–1440.
12. Kragballe K. Vitamin D analogs in the treatment of psoriasis. Journal of Cel-lular Biochemistry, 1992, 49:46–52.
13. Jones G, DeLuca HF. HPLC of vitamin D and its metabolites. In: Makin HLJ,Newton R, eds. High performance liquid chromatography and its applicationto endocrinology. Berlin, Springer-Verlag, 1988:95–139 (Monographs onEndocrinology, volume 30).
14. Brown EM, Pollak M, Hebert SC. The extracellular calcium-sensing receptor: its role in health and disease. Annual Review of Medicine, 1998,49:15–29.
15. Zeghund F et al. Subclinical vitamin D deficiency in neonates: definition andresponse to vitamin D supplements. American Journal of Clinical Nutrition,1997, 65:771–778.
16. Specker BL, Tsang RC, Hollis BW. Effect of race and diet on human milkvitamin D and 25-hydroxyvitamin D. American Journal of Diseases in Chil-dren, 1985, 139:1134–1137.
17. Pettifor JM, Daniels ED. Vitamin D deficiency and nutritional rickets in chil-dren. In: Feldman D, Glorieux FH, Pike JW. Vitamin D. New York, NY, Academic Press, 1997:663–678.
18. Binet A, Kooh SW. Persistence of vitamin D deficiency rickets in Toronto inthe 1990s. Canadian Journal of Public Health, 1996, 87:227–230.
19. Brunvand L, Nordshus T. Nutritional rickets—an old disease with new rele-vance. Nordisk Medicin, 1996, 111:219–221.
20. Gessner BD et al. Nutritional rickets among breast-fed black and Alaska nativechildren. Alaska Medicine, 1997, 39:72–74.
21. Aksnes L, Aarskog D. Plasma concentrations of vitamin D metabolites atpuberty: effect of sexual maturation and implications for growth. Journal ofClinical Endocrinology and Metabolism, 1982, 55:94–101.
22. Mawer EB et al. The distribution and storage of vitamin D and its metabolitesin human tissues. Clinical Science, 1972, 43:413–431.
23. Gultekin A et al. Serum 25-hydroxycholecalciferol levels in children and ado-lescents. Turkish Journal of Pediatrics, 1987, 29:155–162.
24. Holick MF. Vitamin D—new horizons for the 21st century. McCollum AwardLecture. American Journal of Clinical Nutrition, 1994, 60:619–630.
25. Shearer MJ. The roles of vitamins D and K in bone health and osteoporosisprevention. Proceedings of the Nutrition Society, 1997, 56:915–937.
26. Chapuy M-C, Meunier PJ. Vitamin D insufficiency in adults and the elderly.In: Feldman D, Glorieux FH, Pike JW. Vitamin D. New York, NY, AcademicPress, 1997:679–693.
27. Dawson-Hughes B et al. Effect of calcium and vitamin D supplementation onbone density in men and women 65 years of age or older. New EnglandJournal of Medicine, 1997, 337:670–676.
28. Dawson-Hughes B et al. Effect of vitamin D supplementation on wintertimeand overall bone loss in healthy postmenopausal women. Annals of InternalMedicine, 1991, 115:505–512.
29. Chapuy M-C et al. Vitamin D3 and calcium prevent hip fractures in elderlywomen. New England Journal of Medicine, 1992, 327:1637–1642.
P045-058 3/12/05 16:57 Page 56
30. Chapuy M-C et al. Effects of calcium and cholecalciferol treatment for threeyears on hip fractures in elderly women. British Medical Journal, 1994,308:1081–1082.
31. Dawson-Hughes B et al. Rates of bone loss in postmenopausal women randomly assigned to one of two dosages of vitamin D. American Journal ofClinical Nutrition, 1995, 61:1140–1145.
32. Lips P et al. Vitamin D supplementation and fracture incidence in elderlypersons: a randomized, placebo-controlled clinical trial. Annals of InternalMedicine, 1996, 124:400–406.
33. Food and Nutrition Board. Dietary reference intakes for calcium, phosphorus,magnesium, vitamin D, and fluoride. Washington, DC, National AcademyPress, 1997.
34. Bouillon R et al. Influence of the vitamin D-binding protein on the serum concentration of 1,25-dihydroxyvitamin D3. Significance of the free 1,25-dihydroxyvitamin D3 concentration. Journal of Clinical Investigation, 1981,67:589–596.
35. Delvin EE et al. In vitro metabolism of 25-hydroxycholecalciferol by isolatedcells from human decidua. Journal of Clinical Endocrinology and Metabolism,1985, 60:880–885.
36. Sowers MF et al. Elevated parathyroid hormone-related peptide associatedwith lactation and bone density loss. Journal of the American Medical Associ-ation, 1996, 276:549–554.
37. Prentice A. Calcium requirements of breast-feeding mothers. NutritionReviews, 1998, 56:124–127.
38. Sowers M et al. Role of calciotrophic hormones in calcium mobilization oflactation. American Journal of Clinical Nutrition, 1998, 67:284–291.
39. Kovacs CS, Kronenberg HM. Maternal-fetal calcium and bone metabolismduring pregnancy, puerperium, and lactation. Endocrine Reviews, 1997,18:832–872.
40. Kinyamu HK et al. Dietary calcium and vitamin D intake in elderly women:effect on serum parathyroid hormone and vitamin D metabolites. AmericanJournal of Clinical Nutrition, 1998, 67:342–348.
41. Fraser DR. The physiological economy of vitamin D. Lancet, 1983, 1:969–972.42. National Health and Nutrition Examination Survey III, 1988–1994 [CD-
ROM]. Hyatsville, MD, Centers for Disease Control and Prevention, 1998(CD-ROM Series 11, No. 2A).
43. Subcommittee on the Tenth Edition of the Recommended DietaryAllowances, Food and Nutrition Board. Recommended Dietary Allowances,10th ed. Washington, DC, National Academy Press, 1989.
44. Nutrition recommendations (1990). Ottawa, Health and Welfare Canada, 1990.45. Utiger RD. The need for more vitamin D. New England Journal of Medicine,
1998, 338:828–829.46. Thomas MK et al. Hypovitaminosis D in medical inpatients. New England
Journal of Medicine, 1998, 338:777–783.47. Looker AC, Gunter EW. Hypovitaminosis D in medical inpatients. New
England Journal of Medicine, 1998, 339:344–345.48. Lachance PA. International perspective: basis, need and application of recom-
mended dietary allowances. Nutrition Reviews, 1998, 56:S2–S4.49. Jones KL. Williams syndrome: an historical perspective of its evolution,
natural history, and etiology. American Journal of Medical Genetics, 1990,6(Suppl.):S89–S96.
3. VITAMIN D
57
P045-058 3/12/05 16:57 Page 57

VITAMIN AND MINERAL REQUIREMENTS IN HUMAN NUTRITION
58
50. Fraser D. The relation between infantile hypercalcemia and vitamin D—publichealth implications in North America. Pediatrics, 1967, 40:1050–1061.
51. Mawer EB, Davies M. Vitamin D deficiency, rickets and osteomalacia, areturning problem worldwide. In: Norman AW, Bouillon R, Thomasset M,eds. Vitamin D. Chemistry, biology and clinical applications of the steroidhormone. Riverside, CA, University of California, 1997:899–906.
P045-058 3/12/05 16:57 Page 58
4. Calcium
59
4.1 IntroductionIt has been nearly 30 years since the last FAO/WHO recommendations oncalcium intake were published in 1974 (1) and nearly 40 years since theexperts’ meeting in Rome (2), on whose findings these recommendations werebased. During this time, a paradigm shift has occurred with respect to theinvolvement of calcium in the etiology of osteoporosis. The previous reportswere written against the background of the Albright paradigm (3), accordingto which osteomalacia and rickets were due to calcium deficiency, vitamin Ddeficiency, or both, and osteoporosis was attributed to the failure of new boneformation secondary to negative nitrogen balance, osteoblast insufficiency, orboth. The rediscovery of earlier information that calcium deficiency led to thedevelopment of osteoporosis (not rickets and osteomalacia) in experimentalanimals (4) resulted in a re-examination of osteoporosis in humans, notablyin postmenopausal women. This re-examination yielded evidence in the late1960s that menopausal bone loss was not due to a decrease in bone formationbut rather to an increase in bone resorption (5–8); this has had a profoundeffect on our understanding of other forms of osteoporosis and has led to anew paradigm that is still evolving.
Although reduced bone formation may aggravate the bone loss process inelderly people (9) and probably plays a major role in corticosteroid osteo-porosis (10)—and possibly in osteoporosis in men (11)—bone resorption isincreasingly held responsible for osteoporosis in women and for the bonedeficit associated with hip fractures in elderly people of both sexes (12).Because bone resorption is also the mechanism whereby calcium deficiencydestroys bone, it is hardly surprising that the role of calcium in the patho-genesis of osteoporosis has received increasing attention and that recom-mended calcium intakes have risen steadily in the past 35 years from the nadirwhich followed the publication of the report from the Rome meeting in 1962(13). The process has been accelerated by the growing realization that insen-sible losses of calcium (e.g. via skin, hair, nails) need to be taken into accountin the calculation of calcium requirements.
P059-093 3/12/05 17:00 Page 59
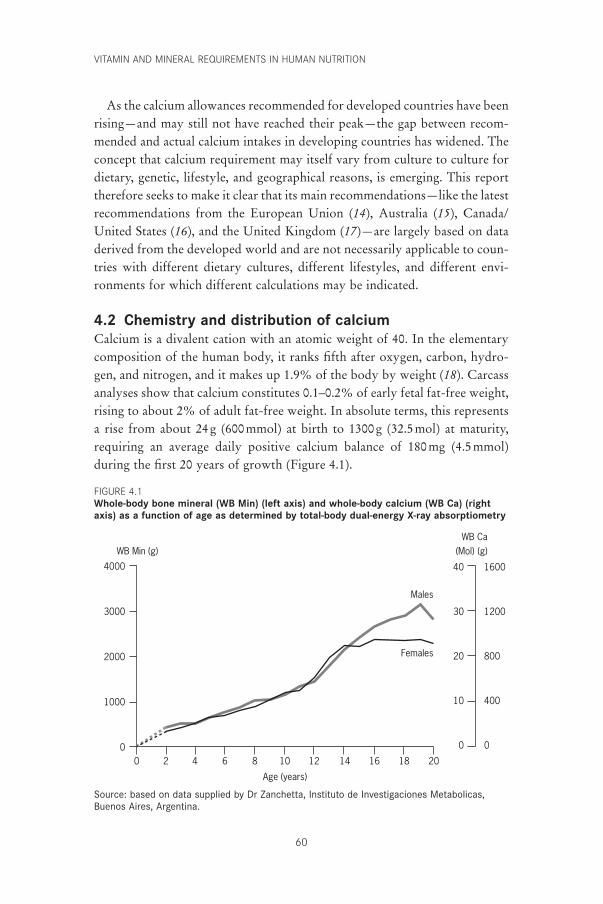
VITAMIN AND MINERAL REQUIREMENTS IN HUMAN NUTRITION
60
As the calcium allowances recommended for developed countries have beenrising—and may still not have reached their peak—the gap between recom-mended and actual calcium intakes in developing countries has widened. Theconcept that calcium requirement may itself vary from culture to culture fordietary, genetic, lifestyle, and geographical reasons, is emerging. This reporttherefore seeks to make it clear that its main recommendations—like the latestrecommendations from the European Union (14), Australia (15), Canada/United States (16), and the United Kingdom (17)—are largely based on dataderived from the developed world and are not necessarily applicable to coun-tries with different dietary cultures, different lifestyles, and different envi-ronments for which different calculations may be indicated.
4.2 Chemistry and distribution of calciumCalcium is a divalent cation with an atomic weight of 40. In the elementarycomposition of the human body, it ranks fifth after oxygen, carbon, hydro-gen, and nitrogen, and it makes up 1.9% of the body by weight (18). Carcassanalyses show that calcium constitutes 0.1–0.2% of early fetal fat-free weight,rising to about 2% of adult fat-free weight. In absolute terms, this representsa rise from about 24g (600mmol) at birth to 1300g (32.5mol) at maturity,requiring an average daily positive calcium balance of 180mg (4.5mmol)during the first 20 years of growth (Figure 4.1).
4000
3000
2000
1000
0
WB Min (g) (Mol) (g)WB Ca
1600
1200
800
400
0
40
30
20
10
0
20181614121086420
Age (years)
Males
Females
Source: based on data supplied by Dr Zanchetta, Instituto de Investigaciones Metabolicas,Buenos Aires, Argentina.
FIGURE 4.1Whole-body bone mineral (WB Min) (left axis) and whole-body calcium (WB Ca) (rightaxis) as a function of age as determined by total-body dual-energy X-ray absorptiometry
P059-093 3/12/05 17:00 Page 60
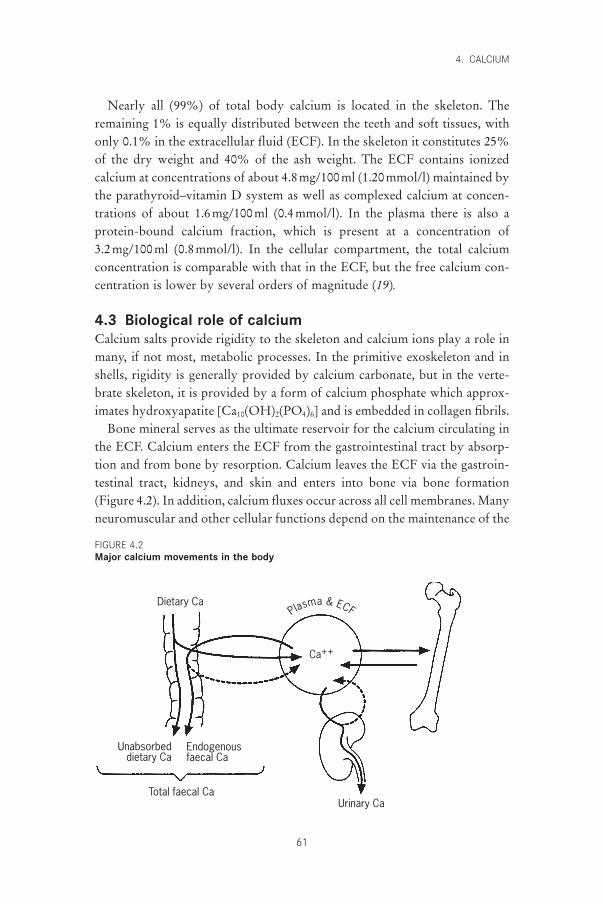
Nearly all (99%) of total body calcium is located in the skeleton. Theremaining 1% is equally distributed between the teeth and soft tissues, withonly 0.1% in the extracellular fluid (ECF). In the skeleton it constitutes 25%of the dry weight and 40% of the ash weight. The ECF contains ionizedcalcium at concentrations of about 4.8mg/100ml (1.20mmol/l) maintained bythe parathyroid–vitamin D system as well as complexed calcium at concen-trations of about 1.6mg/100ml (0.4mmol/l). In the plasma there is also aprotein-bound calcium fraction, which is present at a concentration of 3.2mg/100ml (0.8mmol/l). In the cellular compartment, the total calciumconcentration is comparable with that in the ECF, but the free calcium con-centration is lower by several orders of magnitude (19).
4.3 Biological role of calciumCalcium salts provide rigidity to the skeleton and calcium ions play a role inmany, if not most, metabolic processes. In the primitive exoskeleton and inshells, rigidity is generally provided by calcium carbonate, but in the verte-brate skeleton, it is provided by a form of calcium phosphate which approx-imates hydroxyapatite [Ca10(OH)2(PO4)6] and is embedded in collagen fibrils.
Bone mineral serves as the ultimate reservoir for the calcium circulating inthe ECF. Calcium enters the ECF from the gastrointestinal tract by absorp-tion and from bone by resorption. Calcium leaves the ECF via the gastroin-testinal tract, kidneys, and skin and enters into bone via bone formation(Figure 4.2). In addition, calcium fluxes occur across all cell membranes. Manyneuromuscular and other cellular functions depend on the maintenance of the
4. CALCIUM
61
Dietary Ca
Urinary Ca
Unabsorbeddietary Ca
Endogenousfaecal Ca
Total faecal Ca
Ca++
Plasma & ECF
FIGURE 4.2Major calcium movements in the body
P059-093 3/12/05 17:00 Page 61
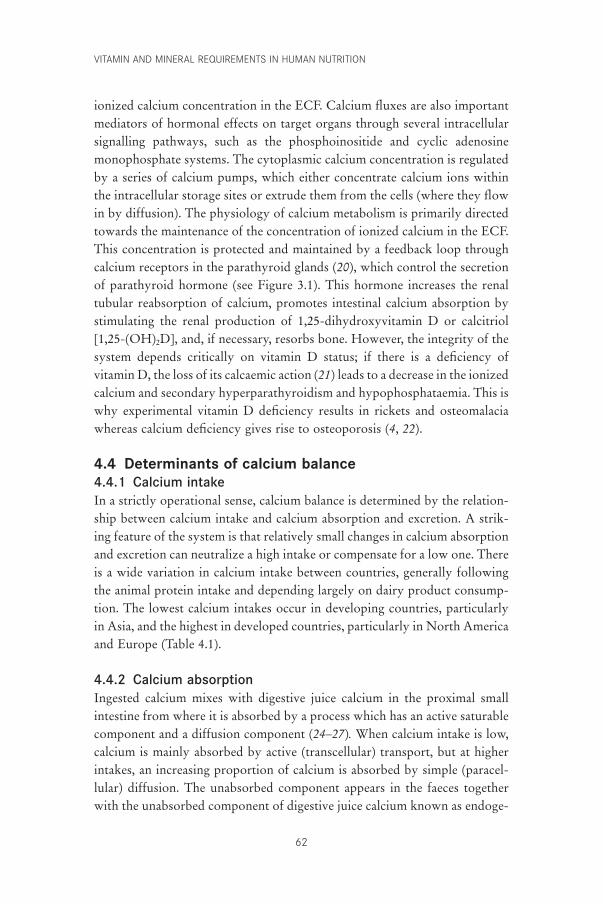
VITAMIN AND MINERAL REQUIREMENTS IN HUMAN NUTRITION
62
ionized calcium concentration in the ECF. Calcium fluxes are also importantmediators of hormonal effects on target organs through several intracellularsignalling pathways, such as the phosphoinositide and cyclic adenosinemonophosphate systems. The cytoplasmic calcium concentration is regulatedby a series of calcium pumps, which either concentrate calcium ions withinthe intracellular storage sites or extrude them from the cells (where they flowin by diffusion). The physiology of calcium metabolism is primarily directedtowards the maintenance of the concentration of ionized calcium in the ECF.This concentration is protected and maintained by a feedback loop throughcalcium receptors in the parathyroid glands (20), which control the secretionof parathyroid hormone (see Figure 3.1). This hormone increases the renaltubular reabsorption of calcium, promotes intestinal calcium absorption bystimulating the renal production of 1,25-dihydroxyvitamin D or calcitriol[1,25-(OH)2D], and, if necessary, resorbs bone. However, the integrity of thesystem depends critically on vitamin D status; if there is a deficiency ofvitamin D, the loss of its calcaemic action (21) leads to a decrease in the ionizedcalcium and secondary hyperparathyroidism and hypophosphataemia. This iswhy experimental vitamin D deficiency results in rickets and osteomalaciawhereas calcium deficiency gives rise to osteoporosis (4, 22).
4.4 Determinants of calcium balance4.4.1 Calcium intakeIn a strictly operational sense, calcium balance is determined by the relation-ship between calcium intake and calcium absorption and excretion. A strik-ing feature of the system is that relatively small changes in calcium absorptionand excretion can neutralize a high intake or compensate for a low one. Thereis a wide variation in calcium intake between countries, generally followingthe animal protein intake and depending largely on dairy product consump-tion. The lowest calcium intakes occur in developing countries, particularlyin Asia, and the highest in developed countries, particularly in North Americaand Europe (Table 4.1).
4.4.2 Calcium absorptionIngested calcium mixes with digestive juice calcium in the proximal smallintestine from where it is absorbed by a process which has an active saturablecomponent and a diffusion component (24–27). When calcium intake is low,calcium is mainly absorbed by active (transcellular) transport, but at higherintakes, an increasing proportion of calcium is absorbed by simple (paracel-lular) diffusion. The unabsorbed component appears in the faeces togetherwith the unabsorbed component of digestive juice calcium known as endoge-
P059-093 3/12/05 17:00 Page 62
nous faecal calcium. Thus, the faeces contain unabsorbed dietary calcium anddigestive juice calcium that was not reabsorbed (Figure 4.2).
True absorbed calcium is the total amount of calcium absorbed from thecalcium pool in the intestines and therefore contains both dietary and diges-tive juice components. Net absorbed calcium is the difference between dietarycalcium and faecal calcium and is numerically the same as true absorbedcalcium minus endogenous faecal calcium. At zero calcium intake, all thefaecal calcium is endogenous and represents the digestive juice calcium whichhas not been reabsorbed; net absorbed calcium at this intake is therefore neg-ative to the extent of about 200mg (5mmol) (28, 29). When the intake reachesabout 200mg (5mmol), dietary and faecal calcium become equal and netabsorbed calcium is zero. As calcium intake increases, net absorbed calciumalso increases, steeply at first but then, as the active transport becomes satu-rated, more slowly until the slope of absorbed on ingested calcium approaches linearity with an ultimate gradient of about 5–10% (24, 25, 30, 31). The relationship between intestinal calcium absorption and calcium intake,derived from 210 balance experiments performed in 81 individuals collectedfrom the literature (32–39), is shown in Figure 4.3.
True absorption is an inverse function of calcium intake, falling from some70% at very low intakes to about 35% at high intakes (Figure 4.4). Percent-age net absorption is negative at low intake, becomes positive as intakeincreases, reaches a peak of about 35% at an intake of about 400mg, and thenfalls off as intake increases further. True and net absorption converge as intake
4. CALCIUM
63
TABLE 4.1Daily protein and calcium intakes in different regions of the world, 1987–1989
Protein (g) Calcium (mg)
Region Total Animal Vegetable Total Animal Vegetable
North America 108.7 72.2 36.5 1031 717 314Europe 102.0 59.6 42.4 896 684 212Oceania 98.3 66.5 31.8 836 603 233Other developed 91.1 47.3 43.8 565 314 251USSR 106.2 56.1 50.1 751 567 184All developed 103.0 60.1 42.9 850 617 233
Africa 54.1 10.6 43.5 368 108 260Latin America 66.8 28.6 38.2 477 305 171Near East 78.7 18.0 60.7 484 223 261Far East 58.2 11.0 47.2 305 109 196Other developing 55.8 22.7 33.1 432 140 292All developing 59.9 13.3 46.6 344 138 206
Source: reference (23).
P059-093 3/12/05 17:00 Page 63
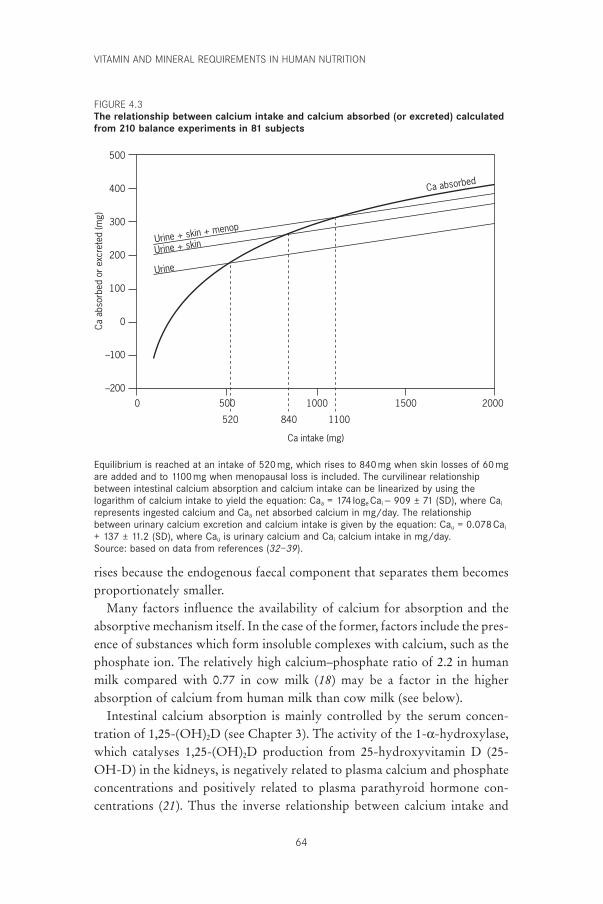
VITAMIN AND MINERAL REQUIREMENTS IN HUMAN NUTRITION
64
500
400
300
200
100
0
–100
–200
Ca a
bsor
bed
or e
xcre
ted
(mg)
Ca intake (mg)
2000150010005000
Urine + skin + menop
Urine + skin
Urine
Ca absorbed
520 840 1100
Equilibrium is reached at an intake of 520mg, which rises to 840mg when skin losses of 60mgare added and to 1100 mg when menopausal loss is included. The curvilinear relationshipbetween intestinal calcium absorption and calcium intake can be linearized by using thelogarithm of calcium intake to yield the equation: Caa = 174 loge Cai - 909 ± 71 (SD), where Cai
represents ingested calcium and Caa net absorbed calcium in mg/day. The relationshipbetween urinary calcium excretion and calcium intake is given by the equation: Cau = 0.078 Cai
+ 137 ± 11.2 (SD), where Cau is urinary calcium and Cai calcium intake in mg/day.Source: based on data from references (32–39).
rises because the endogenous faecal component that separates them becomes proportionately smaller.
Many factors influence the availability of calcium for absorption and theabsorptive mechanism itself. In the case of the former, factors include the pres-ence of substances which form insoluble complexes with calcium, such as thephosphate ion. The relatively high calcium–phosphate ratio of 2.2 in humanmilk compared with 0.77 in cow milk (18) may be a factor in the higherabsorption of calcium from human milk than cow milk (see below).
Intestinal calcium absorption is mainly controlled by the serum concen-tration of 1,25-(OH)2D (see Chapter 3). The activity of the 1-a-hydroxylase,which catalyses 1,25-(OH)2D production from 25-hydroxyvitamin D (25-OH-D) in the kidneys, is negatively related to plasma calcium and phosphateconcentrations and positively related to plasma parathyroid hormone con-centrations (21). Thus the inverse relationship between calcium intake and
FIGURE 4.3The relationship between calcium intake and calcium absorbed (or excreted) calculatedfrom 210 balance experiments in 81 subjects
P059-093 3/12/05 17:00 Page 64
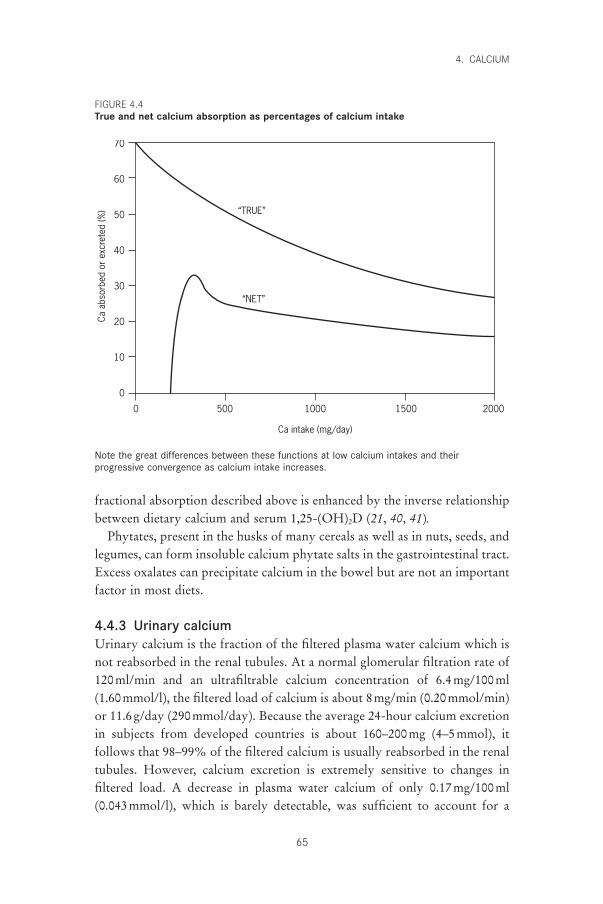
fractional absorption described above is enhanced by the inverse relationshipbetween dietary calcium and serum 1,25-(OH)2D (21, 40, 41).
Phytates, present in the husks of many cereals as well as in nuts, seeds, andlegumes, can form insoluble calcium phytate salts in the gastrointestinal tract.Excess oxalates can precipitate calcium in the bowel but are not an importantfactor in most diets.
4.4.3 Urinary calciumUrinary calcium is the fraction of the filtered plasma water calcium which isnot reabsorbed in the renal tubules. At a normal glomerular filtration rate of120ml/min and an ultrafiltrable calcium concentration of 6.4mg/100ml (1.60mmol/l), the filtered load of calcium is about 8mg/min (0.20mmol/min)or 11.6g/day (290mmol/day). Because the average 24-hour calcium excretionin subjects from developed countries is about 160–200mg (4–5mmol), itfollows that 98–99% of the filtered calcium is usually reabsorbed in the renaltubules. However, calcium excretion is extremely sensitive to changes in filtered load. A decrease in plasma water calcium of only 0.17mg/100ml(0.043mmol/l), which is barely detectable, was sufficient to account for a
4. CALCIUM
65
70
60
50
40
30
20
10
0
Ca a
bsor
bed
or e
xcre
ted
(%)
2000150010005000
Ca intake (mg/day)
“TRUE”
“NET”
Note the great differences between these functions at low calcium intakes and theirprogressive convergence as calcium intake increases.
FIGURE 4.4True and net calcium absorption as percentages of calcium intake
P059-093 3/12/05 17:00 Page 65
VITAMIN AND MINERAL REQUIREMENTS IN HUMAN NUTRITION
66
decrease in urinary calcium of 63mg (1.51mmol) when 27 subjects changedfrom a normal- to a low-calcium diet (42). This very sensitive renal responseto calcium deprivation combines with the inverse relationship betweencalcium intake and absorption to stabilize the plasma ionized calcium con-centration and to preserve the equilibrium between calcium entering andleaving the ECF over a wide range of calcium intakes. However, there isalways a significant obligatory loss of calcium in the urine (as there is in thefaeces), even on a low calcium intake, simply because maintenance of theplasma ionized calcium and, therefore, of the filtered load, prevents total elim-ination of calcium from the urine. The lower limit for urinary calcium indeveloped countries is about 140mg (3.5mmol) but depends on protein andsalt intakes. From this obligatory minimum, urinary calcium increases onintake with a slope of about 5–10% (30, 31, 43). In Figure 4.3, the relation-ship between urinary calcium excretion and calcium intake is represented bythe line which intersects the absorbed calcium line at an intake of 520mg.
4.4.4 Insensible lossesUrinary and endogenous faecal calcium are not the only forms of excretedcalcium; losses through skin, hair, and nails also need to be taken into account.These are not easily measured, but a combined balance and isotope procedurehas yielded estimates of daily insensible calcium losses in the range of 40–80mg (1–2mmol), which are unrelated to calcium intake (44, 45). Thus,the additional loss of a mean of 60mg (1.5mmol) as a constant to urinarycalcium loss raises the level of dietary calcium at which absorbed and excretedcalcium reach equilibrium from 520 to 840mg (13 to 21mmol) (Figure 4.3).
4.5 Criteria for assessing calcium requirements and recommended nutrient intakes
4.5.1 MethodologyAlthough it is well established that calcium deficiency causes osteoporosis in experimental animals, the contribution that calcium deficiency makes toosteoporosis in humans is much more controversial, in part due to the greatvariation in calcium intakes across the world (Table 4.1), which does notappear to be associated with any corresponding variation in the prevalence ofosteoporosis. This issue is dealt with at greater length in the section on nutri-tional factors (see section 4.10); in this section we will simply define what ismeant by calcium requirement and how it may be calculated.
The calcium requirement of an adult is generally recognized to be the intakerequired to maintain calcium balance and therefore skeletal integrity. The meancalcium requirement of adults is therefore the mean intake at which intake and
P059-093 3/12/05 17:00 Page 66
output are equal; at present this can only be determined by balance studiesconducted with sufficient care, and over a sufficiently long period of time toensure reasonable accuracy and then corrected for insensible losses. The rep-utation of the balance technique has been harmed by a few studies with inad-equate equilibration times and short collection periods, but this should not beallowed to detract from the value of the meticulous work of those who havecollected faecal and urinary samples for weeks or months from subjects onwell-defined diets. This meticulous work has produced valuable balance data,which are clearly valid; the mean duration of the 210 experiments from eightpublications used in this report to derive the recommended intakes was 90 dayswith a range of 6–480 days. (The four 6-day balance studies in the series useda non-absorbable marker and are therefore acceptable.)
The usual way of determining mean calcium requirement from balancestudies is by linear regression of calcium output (or calcium balance) on intakeand calculation of the mean intake at which intake and output are equal (orbalance is zero). This was probably first done in 1939 by Mitchell and Curzon(46), who arrived at a mean requirement of 9.8mg/kg/day or about 640mg/day(16mmol) for a mean body weight of 65kg. The same type of calculation wassubsequently used by many others who arrived at requirements ranging from200mg/day (5mmol/day) in male Peruvian prisoners (47) to 990mg/day (24.75mmol) in premenopausal women (48), but most values were about 600mg/day (15mmol) (31) without allowing for insensible losses. However,this type of simple linear regression yields a higher mean calcium requirement(640mg in the 210 balance experiments used here) (Figure 4.5a) than the inter-cept of absorbed and excreted calcium (520mg) (Figure 4.3) because it tendsto underestimate the negative calcium balance at low intake and overestimatethe positive balance at high intake. A better reflection of biological reality isobtained by deriving calcium output from the functions given previously (seesection 4.4.2) and then regressing that output on calcium intake. This yieldsthe result shown in Figure 4.5b where balance is more negative (i.e. the regres-sion line is above the line of equality) at low intakes and less positive (i.e. theregression line is below the line of equality) at high intakes than in the linearmodel, and yields a zero balance at 520mg, which is the same as that arrivedat in Figure 4.3 when excreted and absorbed calcium were equal.
An alternative way of calculating calcium requirement is to determine theintake at which the mean maximum positive balance occurs. This has beendone with a two-component, split, linear regression model in which calciumbalance is regressed on intake to determine the threshold intake above whichno further increase in calcium retention occurs (49). This may well be anappropriate way of calculating the calcium requirement of children and
4. CALCIUM
67
P059-093 3/12/05 17:00 Page 67
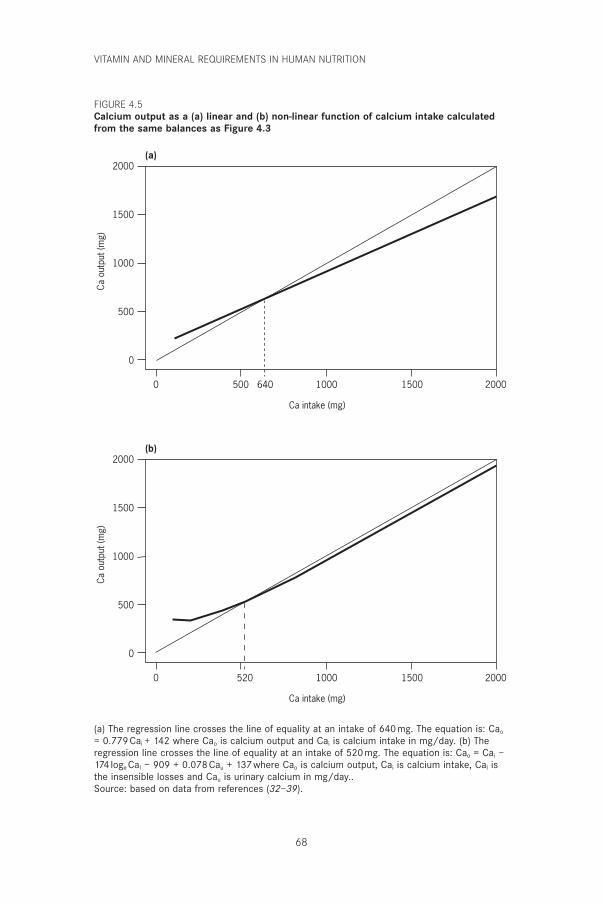
VITAMIN AND MINERAL REQUIREMENTS IN HUMAN NUTRITION
68
2000
1500
1000
500
0
Ca o
utpu
t (m
g)
2000150010005000
Ca intake (mg)
(a)
2000
1500
1000
500
0
Ca o
utpu
t (m
g)
2000150010005200
Ca intake (mg)
(b)
640
(a) The regression line crosses the line of equality at an intake of 640mg. The equation is: Cao
= 0.779 Cai + 142 where Cao is calcium output and Cai is calcium intake in mg/day. (b) Theregression line crosses the line of equality at an intake of 520 mg. The equation is: Cao = Cai –174 loge CaI – 909 + 0.078 Cau + 137where Cao is calcium output, Cai is calcium intake, Cal isthe insensible losses and Cau is urinary calcium in mg/day..Source: based on data from references (32–39).
FIGURE 4.5Calcium output as a (a) linear and (b) non-linear function of calcium intake calculatedfrom the same balances as Figure 4.3
P059-093 3/12/05 17:00 Page 68
adolescents (and perhaps pregnant and lactating women) who need to be inpositive calcium balance and in whom the difference between calcium intakeand output is therefore relatively large and measurable by the balance technique. However, in normal adults the difference between calcium intakeand output at high calcium intakes represents a very small difference betweentwo large numbers, and this calculation, therefore, carries too great an errorto calculate their requirement.
The Expert Consultation concurred that the most satisfactory way of cal-culating calcium requirement from current data is by using the intake level atwhich excreted calcium equals net absorbed calcium, which has the advantageof permitting separate analysis of the effects of changes in calcium absorptionand excretion. This intercept has been shown in Figure 4.3 to occur at an intakeof about 520mg, but when insensible losses of calcium of 60mg (1.5mmol)(44, 45) are taken into account, the intercept rises to 840mg, which was con-sidered to be as close as it is possible to get at present to the calcium require-ment of adults on Western-style diets. The intercept rises to about 1100mgdue to an increase in obligatory urinary calcium losses of 30mg (0.75mmol)at menopause (50). A value of 1100mg was thus proposed as the mean calciumrequirement of postmenopausal women (see below). However, this type ofcalculation cannot be easily applied to other high-risk populations (such aschildren) because there are not sufficient published data from these groups topermit a similar analysis of the relationship between calcium intake, absorp-tion, and excretion. An alternative is to estimate how much calcium each pop-ulation group needs to absorb to meet obligatory calcium losses and desirablecalcium retention, and then to calculate the intake required to provide this rateof calcium absorption. This is what has been done in section 4.6.
4.5.2 Populations at risk for calcium deficiencyIt is clear from Figure 4.1 that a positive calcium balance (i.e. net calciumretention) is required throughout growth, particularly during the first 2 yearsof life and during puberty and adolescence. These age groups therefore con-stitute populations at risk for calcium deficiency, as do pregnant women (espe-cially in the last trimester), lactating women, postmenopausal women, and,possibly, elderly men.
4.6 Recommendations for calcium requirements4.6.1 InfantsIn the first 2 years of life, the daily calcium increment in the skeleton is about 100mg (2.5mmol) (51). The urinary calcium of infants is about 10mg/day (0.25mmol/day) and is virtually independent of intake (52–56);
4. CALCIUM
69
P059-093 3/12/05 17:00 Page 69
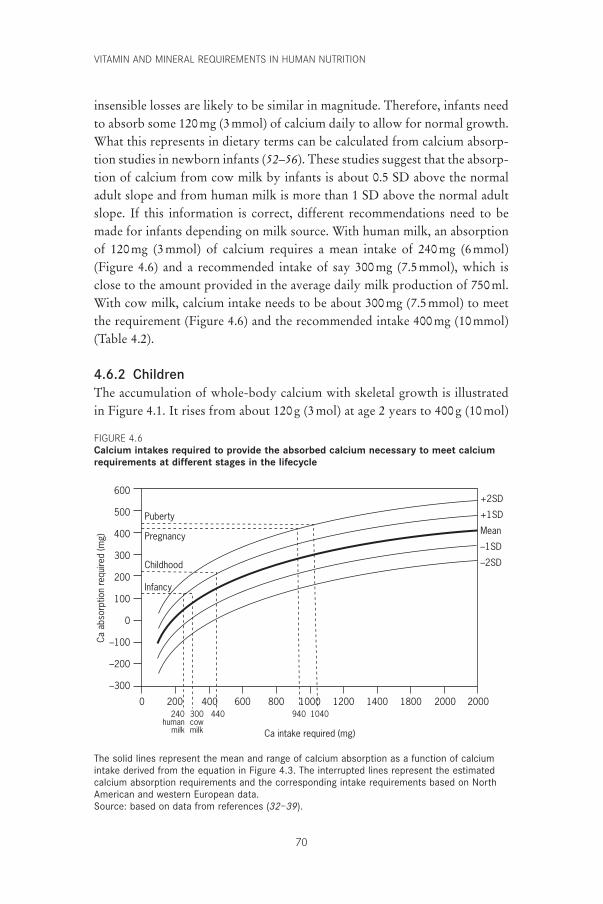
VITAMIN AND MINERAL REQUIREMENTS IN HUMAN NUTRITION
70
insensible losses are likely to be similar in magnitude. Therefore, infants needto absorb some 120mg (3mmol) of calcium daily to allow for normal growth.What this represents in dietary terms can be calculated from calcium absorp-tion studies in newborn infants (52–56). These studies suggest that the absorp-tion of calcium from cow milk by infants is about 0.5 SD above the normaladult slope and from human milk is more than 1 SD above the normal adultslope. If this information is correct, different recommendations need to bemade for infants depending on milk source. With human milk, an absorptionof 120mg (3mmol) of calcium requires a mean intake of 240mg (6mmol)(Figure 4.6) and a recommended intake of say 300mg (7.5mmol), which isclose to the amount provided in the average daily milk production of 750ml.With cow milk, calcium intake needs to be about 300mg (7.5mmol) to meetthe requirement (Figure 4.6) and the recommended intake 400mg (10mmol)(Table 4.2).
4.6.2 ChildrenThe accumulation of whole-body calcium with skeletal growth is illustratedin Figure 4.1. It rises from about 120g (3mol) at age 2 years to 400g (10mol)
600
500
400
300
200
100
0
–100
–200
–300
Ca a
bsor
ptio
n re
quire
d (m
g)
2000200018001400120010008006004002000
Ca intake required (mg)
240human
milk
300cowmilk
440 940 1040
Puberty
Pregnancy
Childhood
Infancy
+2SD
+1SD
Mean
–1SD
–2SD
The solid lines represent the mean and range of calcium absorption as a function of calciumintake derived from the equation in Figure 4.3. The interrupted lines represent the estimatedcalcium absorption requirements and the corresponding intake requirements based on NorthAmerican and western European data.Source: based on data from references (32–39).
FIGURE 4.6Calcium intakes required to provide the absorbed calcium necessary to meet calciumrequirements at different stages in the lifecycle
P059-093 3/12/05 17:00 Page 70
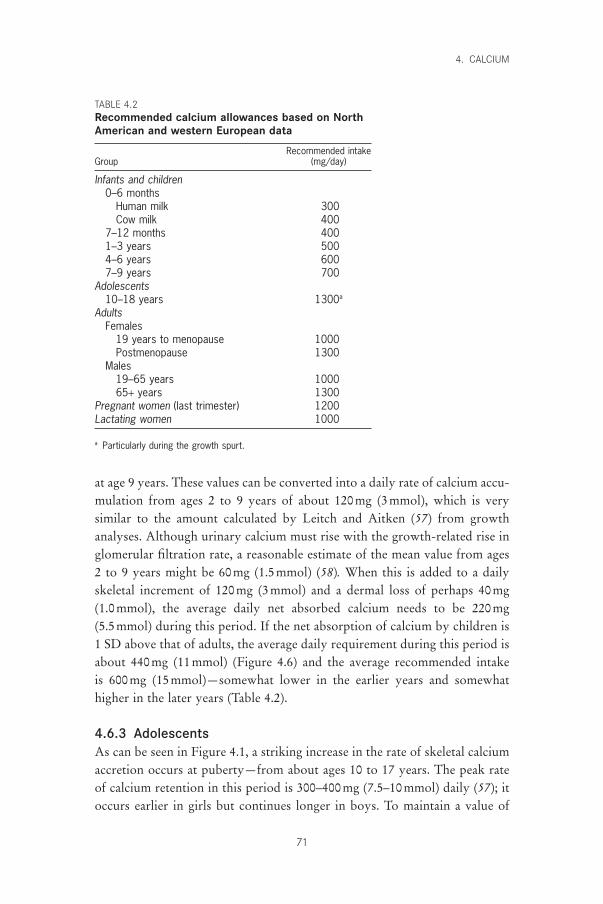
at age 9 years. These values can be converted into a daily rate of calcium accu-mulation from ages 2 to 9 years of about 120mg (3mmol), which is verysimilar to the amount calculated by Leitch and Aitken (57) from growthanalyses. Although urinary calcium must rise with the growth-related rise inglomerular filtration rate, a reasonable estimate of the mean value from ages2 to 9 years might be 60mg (1.5mmol) (58). When this is added to a dailyskeletal increment of 120mg (3mmol) and a dermal loss of perhaps 40mg (1.0mmol), the average daily net absorbed calcium needs to be 220mg (5.5mmol) during this period. If the net absorption of calcium by children is1 SD above that of adults, the average daily requirement during this period isabout 440mg (11mmol) (Figure 4.6) and the average recommended intake is 600mg (15mmol)—somewhat lower in the earlier years and somewhathigher in the later years (Table 4.2).
4.6.3 AdolescentsAs can be seen in Figure 4.1, a striking increase in the rate of skeletal calciumaccretion occurs at puberty—from about ages 10 to 17 years. The peak rateof calcium retention in this period is 300–400mg (7.5–10mmol) daily (57); itoccurs earlier in girls but continues longer in boys. To maintain a value of
4. CALCIUM
71
TABLE 4.2Recommended calcium allowances based on NorthAmerican and western European data
Recommended intakeGroup (mg/day)
Infants and children0–6 months
Human milk 300Cow milk 400
7–12 months 4001–3 years 5004–6 years 6007–9 years 700
Adolescents10–18 years 1300a
AdultsFemales
19 years to menopause 1000Postmenopause 1300
Males19–65 years 100065+ years 1300
Pregnant women (last trimester) 1200Lactating women 1000
a Particularly during the growth spurt.
P059-093 3/12/05 17:00 Page 71
VITAMIN AND MINERAL REQUIREMENTS IN HUMAN NUTRITION
72
300mg (7.5mmol) for the skeleton—taking into account 100mg (2.5mmol)for urinary calcium (58), and 40mg (1.0mmol) for insensible losses—the netabsorbed calcium during at least part of this period needs to be 440mg (11mmol) daily. Even with the assumption of high calcium absorption (+2SD), this requires an intake of 1040mg (26.0mmol) daily (Figure 4.6) and arecommended intake of 1300mg (32.5mmol) during the peak growth phase(Table 4.2). It is difficult to justify any difference between the allowances forboys and girls because, as mentioned above, although the growth spurt startsearlier in girls, it continues longer in boys. This recommended intake (whichis close to that derived differently by Matkovic and Heaney [49, 58]) is notachieved by many adolescents even in developed countries (59–61), but theeffects of this shortfall on their growth and bone status are unknown.
4.6.4 AdultsAs indicated earlier and for the reasons given, the Consultation concludedthat the mean apparent calcium requirement of adults in developed countriesis about 520mg (13mmol) but that this is increased by insensible losses tosome 840mg (21mmol) (Figure 4.3). This reasoning forms the basis of the recommended intake for adults of 1000mg (Table 4.2).
4.6.5 Menopausal womenThe most important single cause of osteoporosis—at least in developed coun-tries—is probably menopause, which is accompanied by an unequivocal andsustained rise in obligatory urinary calcium of about 30mg (0.75mmol) daily(50, 62, 63). Because calcium absorption certainly does not increase at thistime, and probably decreases (64, 65), this extra urinary calcium represents a negative calcium balance which is compatible with the average bone loss of about 0.5–1.0% per year after menopause. There is a consensus that theseevents are associated with an increase in bone resorption but controversy con-tinues about whether this is the primary event, the response to an increasedcalcium demand, or both. The results of calcium trials are clearly relevant.Before 1997, there had been 20 prospective trials of calcium supplementationin 857 postmenopausal women and 625 control subjects; these trials collec-tively showed a highly significant suppression of bone loss through calciumsupplementation (65). Another meta-analysis covering similar numbersshowed that calcium supplementation significantly enhanced the effect ofestrogen on bone (66). It is therefore logical to recommend sufficient addi-tional calcium after menopause to cover at least the extra obligatory loss ofcalcium in the urine. The additional dietary calcium needed to meet anincreased urinary loss of 30mg (0.75mmol) is 260mg/day (6.5mmol/day)
P059-093 3/12/05 17:00 Page 72
(Figure 4.3), which raises the daily requirement from 840mg (21mmol) to1100mg (27.5mmol) and the recommended intake from 1000 to 1300mg/day(25 to 32.5mmol/day) (Table 4.2), which is a little higher than that recom-mended by Canada and the United States (16) (see section 4.8).
4.6.6 Ageing adultsNot enough is known about bone and calcium metabolism during ageing to enable calculation of the calcium requirements of older men and womenwith any confidence. Calcium absorption tends to decrease with age in bothsexes (67–69) but whereas there is strong evidence that calcium requirementrises during menopause, corresponding evidence about ageing men is less convincing (32, 36). Nonetheless, as a precaution an extra allowance of 300mg/day (7.5mmol/day) for men over 65 years to raise their requirementto that of postmenopausal women was proposed (Table 4.2).
4.6.7 Pregnant womenThe calcium content of the newborn infant is about 24g (600mmol). Most ofthis calcium is laid down in the last trimester of pregnancy, during which the fetus retains about 240mg (6mmol) of calcium daily (51). There is some evidence that pregnancy is associated with an increase in calciumabsorption (associated with a rise in the plasma 1,25-(OH)2 D level) (70–72).For a maternal urinary calcium of 120mg (3mmol) and a maternal skin lossof 60mg (1.5mmol), the absorbed calcium should be 420mg (10.5mmol) daily. To achieve this optimal calcium absorption, the corresponding calciumintake would need to be at least 940mg (23.5mmol) (Figure 4.6). The recom-mended nutrient intake was thus set at 1200mg (30mmol) (Table 4.2), whichis similar to that proposed by Canada and the United States (16) (see section4.8).
4.6.8 Lactating womenThe calcium content of human milk is about 36mg/100ml (9mmol/l) (18). Alactating woman produces about 750ml of milk daily, which represents about280mg (7.0mmol) of calcium. For a maternal urinary calcium of 100mg/day(2.5mmol/day) and a maternal skin loss of 60mg/day (1.5mmol/day), therequired absorption is 440mg/day (11mmol/day)—the same as at puberty. Ifcalcium absorption efficiency is maximal (i.e. 2 SD above the normal adultmean)—possibly because of the effect of prolactin on the production of 1,25-(OH)2D (72)—the requirement would be about 1040mg (26.0mmol) and therecommended intake would be about 1300mg (32.5mmol). However,although it is known that bone is lost during lactation and restored after
4. CALCIUM
73
P059-093 3/12/05 17:00 Page 73
VITAMIN AND MINERAL REQUIREMENTS IN HUMAN NUTRITION
74
weaning (73, 74), early reports that this bone loss could be prevented bycalcium supplementation (75) have not been confirmed in controlled studies(76–78).
The prevailing view now is that calcium absorption does not increase, andmay even decrease, during lactation. It is increasingly thought that lactationalbone loss is not a nutritional problem but may be due to the parathyroidhormone-related peptide secreted by the breast (79) and is therefore beyondthe control of dietary calcium. In view of this uncertainty, the present rec-ommendations do not include any extra calcium allowance during lactation(Table 4.2); any risk to adolescent mothers is covered by the general recom-mendation of 1300mg for adolescents.
4.7 Upper limitsBecause of the inverse relationship between fractional calcium absorption andcalcium intake (Figure 4.4), a calcium supplement of 1000mg (25mmol) inconjunction with a Western-style diet only increases urinary calcium by about 60mg (1.5mmol). Urinary calcium also rises very slowly with intake (slopeof 5–10%) and the risk of kidney stones from dietary hypercalciuria musttherefore be negligible. In fact, it has been suggested that dietary calcium mayprotect against renal calculi because it binds dietary oxalate and reducesoxalate excretion (80, 81). Toxic effects of a high calcium intake have onlybeen described when the calcium is given as the carbonate form in very highdoses; this toxicity is caused as much by the alkali as by the calcium and isdue to precipitation of calcium salts in renal tissue (milk-alkali syndrome)(82). However, in practice an upper limit on calcium intake of 3g (75mmol)is recommended.
4.8 Comparisons with other recommendationsThe current recommendations of the European Union, Australia, Canada/United States United States, and the United Kingdom are given in Table 4.3.The present Expert Consultation’s recommendations for adults are very closeto those of Canada and the United States but higher than those of Australiaand the United Kingdom, which do not take into account insensible losses,and higher than those of the European Union, which assume 30% absorptionof dietary calcium. The British and European values make no allowance forageing or menopause. Recommendations for other high-risk groups are verysimilar in all five sets of recommendations except for the rather low allowancefor infants by Canada and the United States. Nonetheless, despite this broadmeasure of agreement among developed countries, the Consultation had some
P059-093 3/12/05 17:00 Page 74
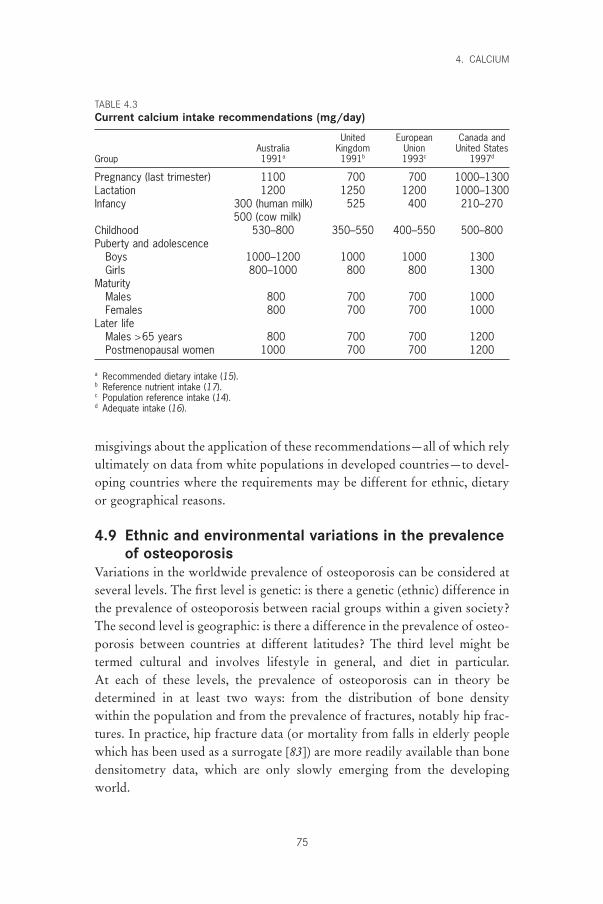
misgivings about the application of these recommendations—all of which relyultimately on data from white populations in developed countries—to devel-oping countries where the requirements may be different for ethnic, dietaryor geographical reasons.
4.9 Ethnic and environmental variations in the prevalenceof osteoporosis
Variations in the worldwide prevalence of osteoporosis can be considered atseveral levels. The first level is genetic: is there a genetic (ethnic) difference inthe prevalence of osteoporosis between racial groups within a given society?The second level is geographic: is there a difference in the prevalence of osteo-porosis between countries at different latitudes? The third level might betermed cultural and involves lifestyle in general, and diet in particular. At each of these levels, the prevalence of osteoporosis can in theory be determined in at least two ways: from the distribution of bone density within the population and from the prevalence of fractures, notably hip frac-tures. In practice, hip fracture data (or mortality from falls in elderly peoplewhich has been used as a surrogate [83]) are more readily available than bonedensitometry data, which are only slowly emerging from the developingworld.
4. CALCIUM
75
TABLE 4.3Current calcium intake recommendations (mg/day)
United European Canada andAustralia Kingdom Union United States
Group 1991a 1991b 1993c 1997d
Pregnancy (last trimester) 1100 700 700 1000–1300Lactation 1200 1250 1200 1000–1300Infancy 300 (human milk) 525 400 210–270
500 (cow milk)Childhood 530–800 350–550 400–550 500–800Puberty and adolescence
Boys 1000–1200 1000 1000 1300Girls 800–1000 800 800 1300
MaturityMales 800 700 700 1000Females 800 700 700 1000
Later lifeMales >65 years 800 700 700 1200Postmenopausal women 1000 700 700 1200
a Recommended dietary intake (15).b Reference nutrient intake (17).c Population reference intake (14).d Adequate intake (16).
P059-093 3/12/05 17:00 Page 75
VITAMIN AND MINERAL REQUIREMENTS IN HUMAN NUTRITION
76
4.9.1 EthnicityComparisons between racial groups within countries suggest substantial racialdifferences in the prevalence of osteoporosis. This was probably first notedby Trotter (84) when she showed that bone density (weight/volume) was significantly higher in skeletons from black than from Caucasian subjects in the United States. It was later shown that hip fracture rates were lower in blacks than Caucasians in South Africa (85) and the United States (86). These observations have been repeatedly confirmed (87, 88) withoutbeing fully explained but appear to be genetic in origin because the better bone status of Afro-Americans compared with Caucasians in the UnitedStates is already apparent in childhood (89) and cannot be accounted for bydifferences in body size (90). Nor can the difference in fracture rates betweenthese two groups be explained by differences in hip axis length (90); it seemsto be largely or wholly due to differences in bone density. Similarly, compar-isons between Caucasians and Samoans in New Zealand (91) have shown the latter to have the higher bone densities. Asians have lower bone densitiesthan Caucasians in New Zealand but these differences are largely accountedfor by differences in body size (91). In the United States, fracture rates are lower among Asians than among Caucasians but this may be accountedfor by their shorter hip axis length (92) and their lower incidence of falls (93). Bone density is generally lower in Asians than Caucasians within the United States (94) but again, this is largely accounted for by differencesin body size (95). There are also lower hip fracture rates for Hispanics,Chinese, Japanese and Koreans than Caucasians living in the United States(96, 97). The conclusion must be that there are probably genetic factors influ-encing the prevalence of osteoporosis and fractures, but it is impossible toexclude the role of differences in diet and lifestyle between ethnic communi-ties within a country.
4.9.2 GeographyThere are wide geographical variations in hip fracture incidence which cannotbe accounted for by ethnicity. In the United States, the age-adjusted incidenceof hip fracture in Caucasian women aged 65 years and over varied with geog-raphy but was high everywhere—ranging from 700 to 1000 per 100000 peryear (98). Within Europe, the age-adjusted hip fracture rates ranged from 280to 730 per 100000 women in one study (99) and from 419 to 545 per 100000in another (96) in which the comparable rates were 52.9 in Chile, 94.0 inVenezuela, and 247 in Hong Kong per 100000 per year. In another study(100), age-adjusted hip fracture rates in women in 12 European countriesranged from 46 per 100000 per year in Poland to 504 per 100000 in Sweden,
P059-093 3/12/05 17:00 Page 76
with a marked positive gradient from south to north and from poor to rich.In Chinese populations, the hip fracture rate is much lower in Beijing (87–97per 100000) than in Hong Kong (181–353 per 100000) (101) where the stan-dard of living is higher. Thus, there are marked geographic variations in hipfracture rates within the same ethnic groups; this may be due to differencesin diet but may also be due to variations in the supply of vitamin D from sun-light, both of which are discussed below.
4.9.3 Culture and dietIt can be concluded from the discussion above that there are probably ethnicand geographic differences in hip fracture rates. Intakes of calcium have beenknown for many years to vary greatly from one country to another, as isclearly shown in FAO food balance sheets (Table 4.1). Until fairly recently, itwas widely assumed that low calcium intakes had no injurious consequences.This view of the global situation underpinned the very conservative adequatecalcium intakes recommended by FAO/WHO in 1962 (2). At that time,osteoporosis was still regarded as a bone matrix disorder and the possibilitythat it could be caused by calcium deficiency was barely considered.
As previously stated, the paradigm has since changed. Calcium deficiencyis taken more seriously now and the apparent discrepancy between calciumintake and bone status worldwide has attracted considerable attention.However, with the exception of calcium deficiency rickets reported fromNigeria (102), no satisfactory explanation has been found for the apparentlylow prevalence of osteoporosis in developing countries on low calciumintakes; on international comparisons on a larger scale, it is very difficult toseparate genetic from environmental factors. Nonetheless, certain patternshave emerged which are likely to have biological significance, the most striking of which is the positive correlation between hip fracture rates and standard of living first noted by Hegsted when he observed that osteo-porosis was largely a disease of affluent industrialized cultures (103). He basedthis conclusion on a previously published review of hip fracture rates in 10countries (104) that strongly suggested a correlation between hip fracture rateand affluence. Another review of 19 regions and racial groups (105) confirmedthis by showing a gradient of age- and sex-adjusted hip fracture rates from 31per 100000 in South African Bantu to 968 per 100000 in Norway. In theanalysis of hip fracture rates in Beijing and Hong Kong referred to above(101), it was noted that the rates in both cities were much lower than in theUnited States.
Many other publications point to the same conclusion—that hip fractureprevalence (and by implication osteoporosis) is related to affluence and, con-
4. CALCIUM
77
P059-093 3/12/05 17:00 Page 77
VITAMIN AND MINERAL REQUIREMENTS IN HUMAN NUTRITION
78
sequently, to animal protein intake, as Hegsted pointed out, but also, para-doxically, to calcium intake because of the strong correlation between calciumand protein intakes within and between societies. This could be explained ifprotein actually increased calcium requirement (see section 4.10).
4.9.4 The calcium paradoxThe paradox that hip fracture rates are higher in developed countries where calcium intake is high than in developing countries where calciumintake is low probably has more than one explanation. Hegsted (103) wasprobably the first to note the close relationship between calcium and proteinintakes across the world (which is also true within countries [63]) and to hintat, but dismiss, the possibility that the adverse effect of high protein intakesmight outweigh the positive effect of high calcium intakes on calcium balance.He may have erred in dismissing this possibility since fracture risk hasrecently been shown to be a function of protein intake in North Americanwomen (106). There is also suggestive evidence that hip fracture rates (asjudged by mortality from falls in elderly people across the world) are a func-tion of protein intake, national income, and latitude (107). The latter associ-ation is particularly interesting in view of the strong evidence of vitamin Ddeficiency in hip fracture patients in the developed world (108–114) and thesuccessful prevention of such fractures with small doses of vitamin D andcalcium (115, 116) (see Chapter 3). It is therefore possible that hip fracturerates may be related to protein intake, vitamin D status, or both, and thateither of these factors could explain the calcium paradox.
4.10 Nutritional factors affecting calcium requirementThe calcium requirements proposed in Table 4.2 are based on data from devel-oped countries (notably Norway and the United States) and can only beapplied with any confidence to countries and populations with similar dietarycultures. Other dietary cultures may entail different calcium requirements andcall for different recommendations. In particular, the removal or addition ofany nutrient that affects calcium absorption or excretion must have an effecton calcium requirement. Two such nutrients are sodium and animal protein,both of which increase urinary calcium and therefore must be presumed toincrease calcium requirement. A third candidate is vitamin D because of itsrole in calcium homeostasis and calcium absorption.
4.10.1 SodiumIt has been known at least since 1961 that urinary calcium is related to urinarysodium (117) and that sodium administration raises calcium excretion, pre-
P059-093 3/12/05 17:00 Page 78
sumably because sodium competes with calcium for reabsorption in the renaltubules. Regarding the quantitative relationships between the renal handlingof sodium and calcium, the filtered load of sodium is about 100 times that ofcalcium (in molar terms) but the clearance of these two elements is similar atabout 1ml/min, which yields about 99% reabsorption and 1% excretion forboth (118). However, these are approximations which conceal the closedependence of urinary sodium on sodium intake and the weaker dependenceof urinary calcium on calcium intake. It is an empirical fact that urinarysodium and calcium are significantly related in normal and hypercalciuric sub-jects on freely chosen diets (119–122). The slope of urinary calcium on sodiumvaries in published work from about 0.6% to 1.2% (in molar terms); a rep-resentative figure is about 1%, that is, 100mmol of sodium (2.3g) takes outabout 1mmol (40mg) of calcium (63, 120). The biological significance of thisrelationship is supported by the accelerated osteoporosis induced by feedingsalt to rats on low-calcium diets (123) and the effects of salt administrationand salt restriction on markers of bone resorption in postmenopausal women(124, 125). Because salt restriction lowers urinary calcium, it is likely also tolower calcium requirement and, conversely, salt feeding is likely to increasecalcium requirement. This is illustrated in Figure 4.7, which shows that low-ering sodium intake by 100mmol (2.3g) from, for example, 150 to 50mmol(3.45 to 1.15g), reduces the theoretical calcium requirement from 840mg (21mmol) to 600mg (15mmol). However, the implications of this for globalcalcium requirements cannot be computed because information on sodiumintake is available from only a very few countries (126).
4.10.2 ProteinThe positive effect of dietary protein—particularly animal protein—onurinary calcium has also been known since at least the 1960s (127–129). Onestudy found that 0.85mg of calcium was lost for each gram of protein in thediet (130). A meta-analysis of 16 studies in 154 adult humans on proteinintakes of up to 200g found that 1.2mg of calcium was lost in the urine forevery 1-g rise in dietary protein (131). A small but more focused study showeda rise of 40mg in urinary calcium when dietary animal protein was raised from40 to 80g (i.e. within the physiological range) (132). This ratio of urinarycalcium to dietary protein (1mg to 1g) was adopted by the Expert Consulta-tion as a representative value. This means that a 40-g reduction in animalprotein intake from 60 to 20g (roughly the difference between the developedand developing regions shown in Table 4.1) would reduce calcium require-ment by the same amount as a 2.3-g reduction in dietary sodium (i.e. from840 to 600mg) (Figure 4.7).
4. CALCIUM
79
P059-093 3/12/05 17:00 Page 79
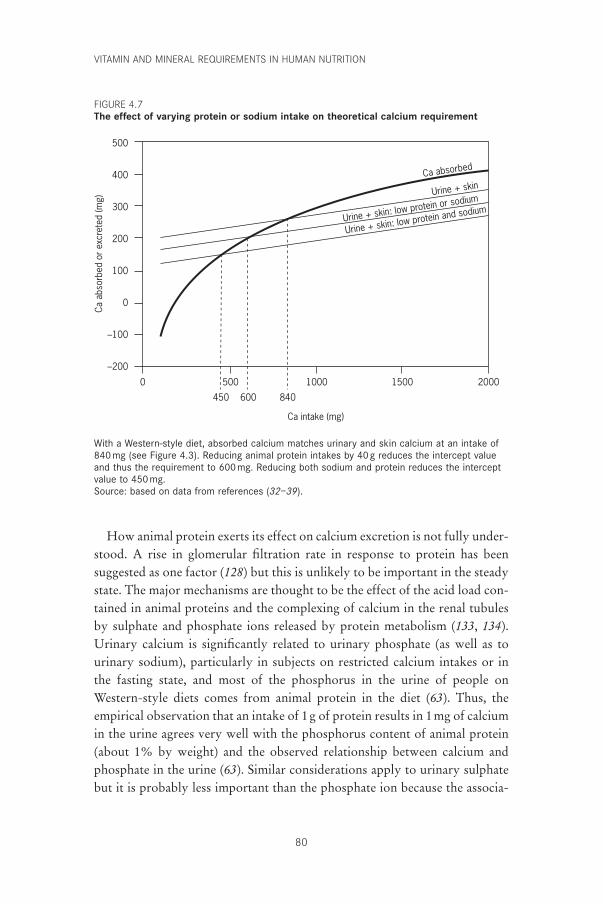
VITAMIN AND MINERAL REQUIREMENTS IN HUMAN NUTRITION
80
How animal protein exerts its effect on calcium excretion is not fully under-stood. A rise in glomerular filtration rate in response to protein has been suggested as one factor (128) but this is unlikely to be important in the steadystate. The major mechanisms are thought to be the effect of the acid load con-tained in animal proteins and the complexing of calcium in the renal tubulesby sulphate and phosphate ions released by protein metabolism (133, 134).Urinary calcium is significantly related to urinary phosphate (as well as tourinary sodium), particularly in subjects on restricted calcium intakes or inthe fasting state, and most of the phosphorus in the urine of people onWestern-style diets comes from animal protein in the diet (63). Thus, theempirical observation that an intake of 1g of protein results in 1mg of calciumin the urine agrees very well with the phosphorus content of animal protein(about 1% by weight) and the observed relationship between calcium andphosphate in the urine (63). Similar considerations apply to urinary sulphatebut it is probably less important than the phosphate ion because the associa-
500
400
300
200
100
0
–100
–200
Ca a
bsor
bed
or e
xcre
ted
(mg)
2000150010005000
Ca intake (mg)
Urine + skin
Urine + skin: low protein or sodium
Urine + skin: low protein and sodium
Ca absorbed
450 600 840
With a Western-style diet, absorbed calcium matches urinary and skin calcium at an intake of 840mg (see Figure 4.3). Reducing animal protein intakes by 40g reduces the intercept value and thus the requirement to 600mg. Reducing both sodium and protein reduces the interceptvalue to 450 mg.Source: based on data from references (32–39).
FIGURE 4.7The effect of varying protein or sodium intake on theoretical calcium requirement
P059-093 3/12/05 17:00 Page 80
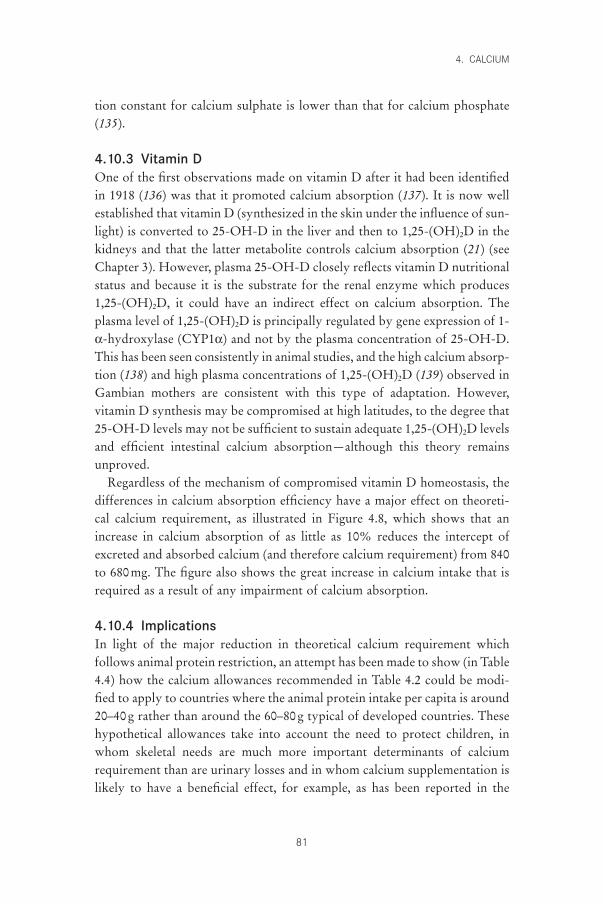
tion constant for calcium sulphate is lower than that for calcium phosphate(135).
4.10.3 Vitamin DOne of the first observations made on vitamin D after it had been identifiedin 1918 (136) was that it promoted calcium absorption (137). It is now wellestablished that vitamin D (synthesized in the skin under the influence of sun-light) is converted to 25-OH-D in the liver and then to 1,25-(OH)2D in thekidneys and that the latter metabolite controls calcium absorption (21) (seeChapter 3). However, plasma 25-OH-D closely reflects vitamin D nutritionalstatus and because it is the substrate for the renal enzyme which produces1,25-(OH)2D, it could have an indirect effect on calcium absorption. Theplasma level of 1,25-(OH)2D is principally regulated by gene expression of 1-a-hydroxylase (CYP1a) and not by the plasma concentration of 25-OH-D.This has been seen consistently in animal studies, and the high calcium absorp-tion (138) and high plasma concentrations of 1,25-(OH)2D (139) observed inGambian mothers are consistent with this type of adaptation. However,vitamin D synthesis may be compromised at high latitudes, to the degree that25-OH-D levels may not be sufficient to sustain adequate 1,25-(OH)2D levelsand efficient intestinal calcium absorption—although this theory remainsunproved.
Regardless of the mechanism of compromised vitamin D homeostasis, thedifferences in calcium absorption efficiency have a major effect on theoreti-cal calcium requirement, as illustrated in Figure 4.8, which shows that anincrease in calcium absorption of as little as 10% reduces the intercept ofexcreted and absorbed calcium (and therefore calcium requirement) from 840to 680mg. The figure also shows the great increase in calcium intake that isrequired as a result of any impairment of calcium absorption.
4.10.4 ImplicationsIn light of the major reduction in theoretical calcium requirement whichfollows animal protein restriction, an attempt has been made to show (in Table4.4) how the calcium allowances recommended in Table 4.2 could be modi-fied to apply to countries where the animal protein intake per capita is around20–40g rather than around the 60–80g typical of developed countries. Thesehypothetical allowances take into account the need to protect children, inwhom skeletal needs are much more important determinants of calciumrequirement than are urinary losses and in whom calcium supplementation islikely to have a beneficial effect, for example, as has been reported in the
4. CALCIUM
81
P059-093 3/12/05 17:00 Page 81
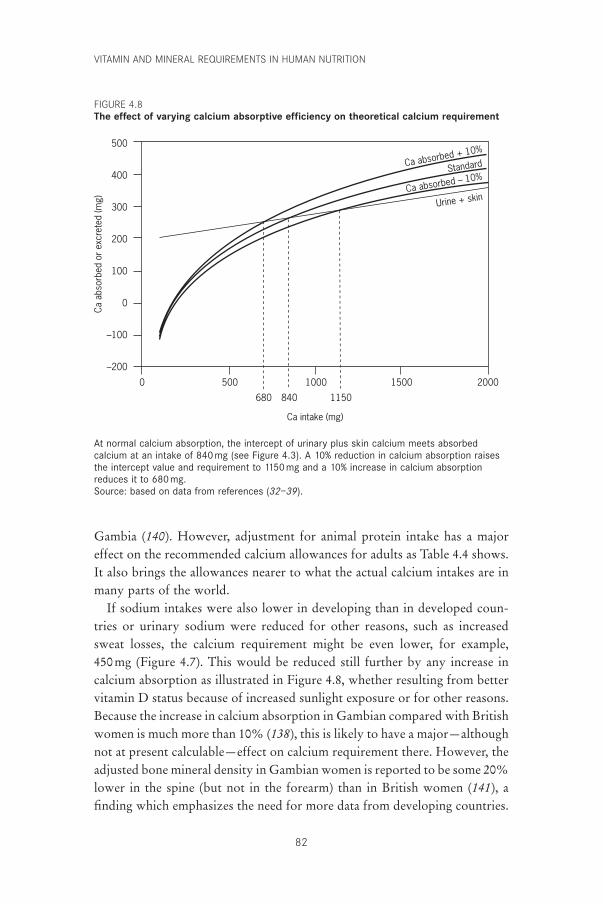
VITAMIN AND MINERAL REQUIREMENTS IN HUMAN NUTRITION
82
500
400
300
200
100
0
–100
–200
Ca a
bsor
bed
or e
xcre
ted
(mg)
2000150010005000
Ca intake (mg)
Ca absorbed + 10%
680 840 1150
Ca absorbed – 10%Standard
Urine + skin
At normal calcium absorption, the intercept of urinary plus skin calcium meets absorbedcalcium at an intake of 840 mg (see Figure 4.3). A 10% reduction in calcium absorption raisesthe intercept value and requirement to 1150mg and a 10% increase in calcium absorptionreduces it to 680mg.Source: based on data from references (32–39).
Gambia (140). However, adjustment for animal protein intake has a majoreffect on the recommended calcium allowances for adults as Table 4.4 shows.It also brings the allowances nearer to what the actual calcium intakes are inmany parts of the world.
If sodium intakes were also lower in developing than in developed coun-tries or urinary sodium were reduced for other reasons, such as increasedsweat losses, the calcium requirement might be even lower, for example, 450mg (Figure 4.7). This would be reduced still further by any increase incalcium absorption as illustrated in Figure 4.8, whether resulting from bettervitamin D status because of increased sunlight exposure or for other reasons.Because the increase in calcium absorption in Gambian compared with Britishwomen is much more than 10% (138), this is likely to have a major—althoughnot at present calculable—effect on calcium requirement there. However, theadjusted bone mineral density in Gambian women is reported to be some 20%lower in the spine (but not in the forearm) than in British women (141), afinding which emphasizes the need for more data from developing countries.
FIGURE 4.8The effect of varying calcium absorptive efficiency on theoretical calcium requirement
P059-093 3/12/05 17:00 Page 82
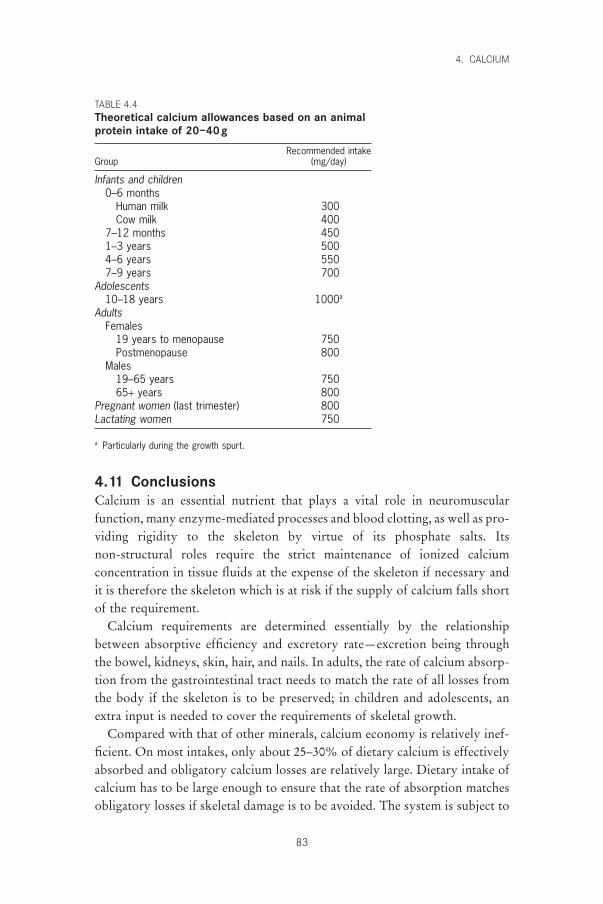
4.11 ConclusionsCalcium is an essential nutrient that plays a vital role in neuromuscular function, many enzyme-mediated processes and blood clotting, as well as pro-viding rigidity to the skeleton by virtue of its phosphate salts. Its non-structural roles require the strict maintenance of ionized calcium concentration in tissue fluids at the expense of the skeleton if necessary andit is therefore the skeleton which is at risk if the supply of calcium falls shortof the requirement.
Calcium requirements are determined essentially by the relationshipbetween absorptive efficiency and excretory rate—excretion being throughthe bowel, kidneys, skin, hair, and nails. In adults, the rate of calcium absorp-tion from the gastrointestinal tract needs to match the rate of all losses fromthe body if the skeleton is to be preserved; in children and adolescents, anextra input is needed to cover the requirements of skeletal growth.
Compared with that of other minerals, calcium economy is relatively inef-ficient. On most intakes, only about 25–30% of dietary calcium is effectivelyabsorbed and obligatory calcium losses are relatively large. Dietary intake ofcalcium has to be large enough to ensure that the rate of absorption matchesobligatory losses if skeletal damage is to be avoided. The system is subject to
4. CALCIUM
83
TABLE 4.4Theoretical calcium allowances based on an animalprotein intake of 20–40g
Recommended intakeGroup (mg/day)
Infants and children0–6 months
Human milk 300Cow milk 400
7–12 months 4501–3 years 5004–6 years 5507–9 years 700
Adolescents10–18 years 1000a
AdultsFemales
19 years to menopause 750Postmenopause 800
Males19–65 years 75065+ years 800
Pregnant women (last trimester) 800Lactating women 750
a Particularly during the growth spurt.
P059-093 3/12/05 17:00 Page 83
VITAMIN AND MINERAL REQUIREMENTS IN HUMAN NUTRITION
84
considerable interindividual variation in both calcium absorption and excre-tion for reasons that are not fully understood but which include vitamin Dstatus, sodium and protein intake, age, and menopausal status in women.Although it needs to be emphasized that calcium deficiency and negativecalcium balance must sooner or later lead to osteoporosis, this does not meanthat all osteoporosis can be attributed to calcium deficiency. On the contrary,there may be more osteoporosis in the world from other causes. Nonetheless,it would probably be agreed that any form of osteoporosis must inevitablybe aggravated by negative external calcium balance. Such negative balance—even for short periods—is prejudicial because it takes so much longer torebuild bone than to destroy it. Bone that is lost, even during short periodsof calcium deficiency, is only slowly replaced when adequate amounts ofcalcium become available.
In seeking to define advisable calcium intakes on the basis of physiologicalstudies and clinical observations, nutrition authorities have to rely largely ondata from developed countries living at relatively high latitudes. Although itis now possible to formulate recommendations that are appropriate to differ-ent stages in the lifecycle of the populations of these countries, extrapolationfrom these figures to other cultures and nutritional environments can only betentative and must rely on what is known of nutritional and environmentaleffects on calcium absorption and excretion. Nonetheless, an attempt in thisdirection has been made, in full knowledge that the speculative calculationsmay be incorrect because of other variables not yet identified.
No reference has been made in this discussion to the possible beneficialeffects of calcium in the prevention or treatment of pre-eclampsia (142), coloncancer (143), or hypertension (144) and no attempt has been made to use theseconditions as end-points on which to base calcium intakes. In each of theabove conditions, epidemiological data suggest an association with calciumintake, and experimentation with increased calcium intakes has now beentried. In each case the results have been disappointing, inconclusive, or nega-tive (145–147) and have stirred controversy (148–150). Because there is noclear consensus about optimal calcium intake for prevention or treatment ofthese conditions and also no clear mechanistic ideas on how dietary calciumintakes affect them, it is not possible to allow for the effect of health outcomesin these areas on the present calcium recommendations. However, althoughthe anecdotal information and positive effects of calcium observed in thesethree conditions cannot influence current recommendations, they do suggestthat generous calcium allowances may confer other benefits besides protect-ing the skeleton. Similarly, no reference has been made to the effects of phys-ical activity, alcohol, smoking, or other known risk factors on bone status
P059-093 3/12/05 17:00 Page 84
because the effects of these variables on calcium requirement are beyond therealm of simple calculation.
4.12 Recommendations for future researchFuture research should include the following:
• to recognize that there is an overwhelming need for more studies of calciummetabolism in developing countries;
• to investigate further the cultural, geographical, and genetic bases for dif-ferences in calcium intakes in different groups in developing countries;
• to establish the validity of different recommended calcium intakes basedon animal protein and sodium intakes;
• to clarify the role of dietary calcium in pre-eclampsia, colon cancer, andhypertension;
• to study the relationship between latitude, sun exposure, and synthesis ofvitamin D and intestinal calcium absorption in different geographical locations.
References1. Handbook on human nutritional requirements. Rome, Food and Agriculture
Organization of the United Nations, 1974.2. FAO/WHO Expert Group. Calcium requirements. Report of an FAO/WHO
Expert Group. Rome, Food and Agriculture Organization of the UnitedNations, 1962 (FAO Nutrition Meetings Report Series, No. 30).
3. Albright F, Reifenstein EC. The parathyroid glands and metabolic bonedisease. Baltimore, MA, Williams & Wilkins, 1948.
4. Nordin BEC. Osteomalacia, osteoporosis and calcium deficiency. ClinicalOrthopaedics and Related Research, 1960, 17:235–258.
5. Young MM, Nordin BEC. Effects of natural and artificial menopause on plasma and urinary calcium and phosphorus. Lancet, 1967, 2:118–120.
6. Stepan JJ et al. Bone loss and biochemical indices of bone remodeling in sur-gically induced postmenopausal women. Bone, 1987, 8:279–284.
7. Kelly PJ et al. Age and menopause-related changes in indices of bone turnover.Journal of Clinical Endocrinology and Metabolism, 1989, 69:1160–1165.
8. Christiansen C et al. Pathophysiological mechanisms of estrogen effect onbone metabolism. Dose–response relationships in early postmenopausalwomen. Journal of Clinical Endocrinology and Metabolism, 1982, 55:1124–1130.
9. Parfitt AM. Osteomalacia and related disorders. In: Avioli LV, Krane SM, eds.Metabolic bone disease and clinically related disorders, 2nd ed. Philadelphia,PA, WB Saunders, 1990:329–396.
10. Need AG. Corticosteroid hormones. In: Nordin BEC, Need AG, MorrisHA, eds. Metabolic bone and stone disease, 3rd ed. Edinburgh, Churchill Livingstone, 1993:43–62.
11. Horowitz M. Osteoporosis in men. In: Nordin BEC, Need AG, Morris HA,eds. Metabolic bone and stone disease, 3rd ed. Edinburgh, Churchill Living-stone, 1993:70–78.
12. Lips P et al. Histomorphometric profile and vitamin D status in patients with
4. CALCIUM
85
P059-093 3/12/05 17:00 Page 85
VITAMIN AND MINERAL REQUIREMENTS IN HUMAN NUTRITION
86
femoral neck fracture. Metabolic Bone Disease and Related Research, 1982,4:85–93.
13. Truswell S. Recommended dietary intakes around the world. Report byCommittee 1/5 of the International Union of Nutritional Sciences. NutritionAbstracts and Reviews, 1983, 53:939–1119.
14. Scientific Committee for Food. Nutrient and energy intakes for the EuropeanCommunity. Luxembourg, Office for Official Publications of the EuropeanCommunities, 1993 (Reports of the Scientific Committee for Food, Thirty-first Series).
15. Recommended dietary intakes for use in Australia. Canberra, National Healthand Medical Research Council, 1991.
16. Food and Nutrition Board. Dietary reference intakes for calcium, phospho-rus, magnesium, vitamin D, and fluoride. Washington, DC, NationalAcademy Press, 1997.
17. Department of Health. Dietary reference values for food energy and nutri-ents for the United Kingdom. Report of the Panel on Dietary Reference Valuesof the Committee on Medical Aspects of Food Policy. London, Her Majesty’sStationery Office, 1991.
18. Nordin BEC. Nutritional considerations. In: Nordin BEC, ed. Calcium,phosphate and magnesium metabolism. Edinburgh, Churchill Livingstone,1976:1–35.
19. Robertson WG, Marshall RW. Ionized calcium in body fluids. CriticalReviews in Clinical Laboratory Sciences, 1981, 15:85–125.
20. Brown EM, Hebert SC. Calcium-receptor-regulated parathyroid and renalfunction. Bone, 1997, 20:303–309.
21. Jones G, Strugnell SA, DeLuca HF. Current understanding of the molecularactions of vitamin D. Physiological Reviews, 1998, 78:1193–1231.
22. Wu DD et al. Regional patterns of bone loss and altered bone remodeling in response to calcium deprivation in laboratory rabbits. Calcified TissueInternational, 1990, 47:18–23.
23. Production yearbook, Vol. 44, 1990. Rome, Food and Agriculture Organiza-tion of the United Nations, 1991.
24. Ireland P, Fordtran JS. Effect of dietary calcium and age on jejunal calciumabsorption in humans studied by intestinal perfusion. Journal of ClinicalInvestigation, 1973, 52:2672–2681.
25. Heaney RP, Saville PD, Recker RR. Calcium absorption as a function ofcalcium intake. Journal of Laboratory and Clinical Medicine, 1975, 85:881–890.
26. Wilkinson R. Absorption of calcium, phosphorus and magnesium. In:Nordin BEC, ed. Calcium, phosphate and magnesium metabolism. Edin-burgh, Churchill Livingstone, 1976:36–112.
27. Marshall DH. Calcium and phosphate kinetics. In: Nordin BEC, ed.Calcium, phosphate and magnesium metabolism. Edinburgh, Churchill Livingstone, 1976:257–297.
28. Heaney RP, Skillman TG. Secretion and excretion of calcium by the humangastrointestinal tract. Journal of Laboratory and Clinical Medicine, 1964,64:29–41.
29. Nordin BEC, Horsman A, Aaron J. Diagnostic procedures. In: Nordin BEC,ed. Calcium, phosphate and magnesium metabolism. Edinburgh, ChurchillLivingstone, 1976:469–524.
P059-093 3/12/05 17:00 Page 86
30. Marshall DH, Nordin BEC, Speed R. Calcium, phosphorus and magnesiumrequirement. Proceedings of the Nutrition Society, 1976, 35:163–173.
31. Nordin BEC, Marshall DH. Dietary requirements for calcium. In: NordinBEC, ed. Calcium in human biology. Berlin, Springer-Verlag, 1988, 447–471.
32. Bogdonoff MD, Shock NW, Nichols MP. Calcium, phosphorus, nitrogen,and potassium balance studies in the aged male. Journal of Gerontology, 1953,8:272–288.
33. Clarkson EM et al. The effect of a high intake of calcium and phosphate innormal subjects and patients with chronic renal failure. Clinical Science, 1970,39:693–704.
34. Johnston FA, McMillan TJ, Derby-Falconer G. Calcium retained by youngwomen before and after adding spinach to the diet. Journal of the AmericanDietetic Association, 1952, 28:933–938.
35. Malm OJ. Calcium requirement and adaptation in adult men. ScandinavianJournal of Clinical Laboratory Investigation, 1958, 10(Suppl. 36):S1–S289.
36. Owen EC, Irving JT, Lyall A. The calcium requirements of older male sub-jects with special reference to the genesis of senile osteoporosis. Acta MedicaScandinavica, 1940, 103:235–250.
37. Steggerda FR, Mitchell HH. The calcium requirement of adult man and theutilization of the calcium in milk and in calcium gluconate. Journal of Nutri-tion, 1939, 17:253–262.
38. Steggerda FR, Mitchell HH. Further experiments on the calcium requirementof adult man and the utilization of the calcium in milk. Journal of Nutrition,1941, 21:577–588.
39. Steggerda FR, Mitchell HH. Variability in the calcium metabolism andcalcium requirements of adult human subjects. Journal of Nutrition, 1946,31:407–422.
40. Gallagher JC et al. Intestinal calcium absorption and serum vitamin Dmetabolites in normal subjects and osteoporotic patients. Journal of ClinicalInvestigation, 1979, 64:729–736.
41. Wishart JM et al. Relations between calcium intake, calcitriol, polymorphismsof the vitamin D receptor gene, and calcium absorption in premenopausalwomen. American Journal of Clinical Nutrition, 1997, 65:798–802.
42. MacFadyen IJ et al. Effect of variation in dietary calcium on plasma concen-tration and urinary excretion of calcium. British Medical Journal, 1965,1:161–164.
43. Heaney RP, Recker RR, Ryan RA. Urinary calcium in perimenopausalwomen: normative values. Osteoporosis International, 1999, 9:13–18.
44. Charles P et al. Calcium metabolism evaluated by 47Ca kinetics: estimationof dermal calcium loss. Clinical Science, 1983, 65:415–422.
45. Hasling C et al. Calcium metabolism in postmenopausal osteoporosis: theinfluence of dietary calcium and net absorbed calcium. Journal of Bone andMineral Research, 1990, 5:939–946.
46. Mitchell HH, Curzon EG. The dietary requirement of calcium and its significance. Actualités scientifiques et industrielles, volume 771 (nutrition).Paris, Hermann & Cie, 1939.
47. Hegsted DM, Moscoso I, Collazos CHC. Study of minimum calciumrequirements by adult men. Journal of Nutrition, 1952, 46:181–201.
48. Heaney RP, Recker RR, Saville PD. Menopausal changes in calcium balanceperformance. Journal of Laboratory and Clinical Medicine, 1978, 92:953–963.
4. CALCIUM
87
P059-093 3/12/05 17:00 Page 87
VITAMIN AND MINERAL REQUIREMENTS IN HUMAN NUTRITION
88
49. Matkovic V, Heaney RP. Calcium balance during human growth: evidencefor threshold behavior. American Journal of Clinical Nutrition, 1992,55:992–996.
50. Nordin BEC et al. Biochemical variables in pre- and postmenopausal women:reconciling the calcium and estrogen hypotheses. Osteoporosis International,1999, 9:351–357.
51. American Academy of Pediatrics Committee on Nutrition. Calcium require-ments in infancy and childhood. Pediatrics, 1978, 62:826–832.
52. Williams ML et al. Calcium and fat absorption in neonatal period. AmericanJournal of Clinical Nutrition, 1970, 23:1322–1330.
53. Hanna FM, Navarrete DA, Hsu FA. Calcium-fatty acid absorption in terminfants fed human milk and prepared formulas simulating human milk. Pediatrics, 1970, 45:216–224.
54. Widdowson EM. Absorption and excretion of fat, nitrogen, and miner-als from “filled” milks by babies one week old. Lancet, 1965, 2: 1099–1105.
55. Shaw JCL. Evidence for defective skeletal mineralization in low birthweightinfants: the absorption of calcium and fat. Pediatrics, 1976, 57:16–25.
56. Widdowson EM et al. Effect of giving phosphate supplements to breast-fedbabies on absorption and excretion of calcium, strontium, magnesium andphosphorus. The Lancet, 1963, 2:1250–1251.
57. Leitch I, Aitken FC. The estimation of calcium requirements: a re-examina-tion. Nutrition Abstracts and Reviews, 1959, 29:393–411.
58. Matkovic V. Calcium metabolism and calcium requirements during skeletalmodeling and consolidation of bone mass. American Journal of ClinicalNutrition, 1991, 54(Suppl. 1):S245–S260.
59. Abrams SA, Stuff JE. Calcium metabolism in girls: current dietary intakeslead to low rates of calcium absorption and retention during puberty. Amer-ican Journal of Clinical Nutrition, 1994, 60:739–743.
60. Truswell AS, Darnton-Hill I. Food habits of adolescents. Nutrition Reviews,1981, 39:73–88.
61. Marino DD, King JC. Nutritional concerns during adolescence. PediatricClinics of North America, 1980, 27:125–139.
62. Prince RL et al. The effects of menopause and age in calcitropic hormones:a cross-sectional study of 655 healthy women aged 35 to 90. Journal of Boneand Mineral Research, 1995, 10:835–842.
63. Nordin BEC, Polley KJ. Metabolic consequences of the menopause. A cross-sectional, longitudinal, and intervention study on 557 normal post-menopausal women. Calcified Tissue International, 1987, 41(Suppl.1):S1–S59.
64. Heaney RP et al. Calcium absorption in women: relationships to calciumintake, estrogen status, and age. Journal of Bone and Mineral Research, 1989,4:469–475.
65. Nordin BEC. Calcium and osteoporosis. Nutrition, 1997, 13:664–686.66. Nieves JW et al. Calcium potentiates the effect of estrogen and calcitonin on
bone mass: review and analysis. American Journal of Clinical Nutrition, 1998,67:18–24.
67. Morris HA et al. Calcium absorption in normal and osteoporotic post-menopausal women. Calcified Tissue International, 1991, 49:240–243.
68. Ebeling PR et al. Influence of age on effects of endogenous 1,25-dihydroxy-vitamin D on calcium absorption in normal women. Calcified Tissue International, 1994, 55:330–334.
P059-093 3/12/05 17:00 Page 88
69. Need AG et al. Intestinal calcium absorption in men with spinal osteoporo-sis. Clinical Endocrinology, 1998, 48:163–168.
70. Heaney RP, Skillman TG. Calcium metabolism in normal human pregnancy.Journal of Clinical Endocrinology and Metabolism, 1971, 33:661–670.
71. Kent GN et al. The efficiency of intestinal calcium absorption is increased inlate pregnancy but not in established lactation. Calcified Tissue International,1991, 48:293–295.
72. Kumar R et al. Elevated 1,25-dihydroxyvitamin D plasma levels in normalhuman pregnancy and lactation. Journal of Clinical Investigation, 1979,63:342–344.
73. Kent GN et al. Human lactation: forearm trabecular bone loss, increasedbone turnover, and renal conservation of calcium and inorganic phosphatewith recovery of bone mass following weaning. Journal of Bone and MineralResearch, 1990, 5:361–369.
74. López JM et al. Bone turnover and density in healthy women during breastfeeding and after weaning. Osteoporosis International, 1996, 6:153–159.
75. Chan GM et al. Effects of increased dietary calcium intake upon the calciumand bone mineral status of lactating adolescent and adult women. AmericanJournal of Clinical Nutrition, 1987, 46:319–323.
76. Prentice A et al. Calcium requirements of lactating Gambian mothers: effectsof a calcium supplement on breast-milk calcium concentration, maternalbone mineral content and urinary calcium excretion. American Journal ofClinical Nutrition, 1995, 62:58–67.
77. Kalkwarf HJ et al. The effect of calcium supplementation on bone densityduring lactation and after weaning. New England Journal of Medicine, 1997,337:523–528.
78. Allen LH. Women’s dietary calcium requirements are not increased by pregnancy or lactation. American Journal of Clinical Nutrition, 1998,67:591–592.
79. Sowers MF et al. Elevated parathyroid hormone-related peptide associatedwith lactation and bone density loss. Journal of the American Medical Association, 1996, 276:549–554.
80. Curhan GC et al. Comparison of dietary calcium with supplemental calciumand other nutrients as factors affecting the risk for kidney stones in women.Annals of Internal Medicine, 1997, 126:497–504.
81. Curhan GC et al. A prospective study of dietary calcium and other nutrientsand the risk of symptomatic kidney stones. New England Journal of Medi-cine, 1993, 328:833–838.
82. Burnett CH et al. Hypercalcaemia without hypercalciuria or hypophos-phatemia, calcinosis and renal insufficiency. A syndrome following pro-longed intake of milk and alkali. New England Journal of Medicine, 1949,240:787–794.
83. Eddy TP. Deaths from domestic falls and fractures. British Journal of Preventive and Social Medicine, 1972, 26:173–179.
84. Trotter M, Broman GE, Peterson RR. Densities of bones of white and Negroskeletons. Journal of Bone and Joint Surgery, 1960, 42(A):50–58.
85. Solomon L. Osteoporosis and fracture of the femoral neck in the SouthAfrican Bantu. Journal of Bone and Joint Surgery, 1968, 50(B2):2–13.
86. Bollet AJ, Engh G, Parson W. Sex and race incidence of hip fractures.Archives of Internal Medicine, 1965, 116:191–194.
4. CALCIUM
89
P059-093 3/12/05 17:00 Page 89
VITAMIN AND MINERAL REQUIREMENTS IN HUMAN NUTRITION
90
87. Cohn SH et al. Comparative skeletal mass and radial bone mineral contentin black and white women. Metabolism, 1977, 26:171–178.
88. DeSimone DP et al. Influence of body habitus and race on bone mineraldensity of the midradius, hip, and spine in aging women. Journal of Bone andMineral Research, 1989, 5:827–830.
89. Bell NH et al. Demonstration that bone mass is greater in black than in whitechildren. Journal of Bone and Mineral Research, 1991, 6:719–723.
90. Nelson DA et al. Ethnic differences in regional bone density, hip axis length,and lifestyle variables among healthy black and white men. Journal of Boneand Mineral Research, 1995, 10:782–787.
91. Cundy T et al. Sources of interracial variation in bone mineral density.Journal of Bone and Mineral Research, 1995, 10:368–373.
92. Cummings SR et al. Racial differences in hip axis lengths might explain racialdifferences in rates of hip fracture. Osteoporosis International, 1994, 4:226–229.
93. Davis JW et al. Incidence rates of falls among Japanese men and women livingin Hawaii. Journal of Clinical Epidemiology, 1997, 50:589–594.
94. Yano K et al. Bone mineral measurements among middle-aged and elderlyJapanese residents in Hawaii. American Journal of Epidemiology, 1984,119:751–764.
95. Ross PD et al. Body size accounts for most differences in bone densitybetween Asian and Caucasian women. Calcified Tissue International, 1996,59:339–343.
96. Silverman SL, Madison RE. Decreased incidence of hip fracture in Hispan-ics, Asians, and blacks: California hospital discharge data. American Journalof Public Health, 1988, 78:1482–1483.
97. Lauderdale D et al. Hip fracture incidence among elderly Asian-Americanpopulations. American Journal of Epidemiology, 1997, 146:502–509.
98. Villa ML, Nelson L. Race, ethnicity and osteoporosis. In: Marcus R, Feldman D, Kelsey J, eds. Osteoporosis. San Diego, CA, Academic Press,1996:435–447.
99. Bacon WE et al. International comparison of hip fracture rates in 1988–89.Osteoporosis International, 1996, 6:69–75.
100. Johnell A et al. The apparent incidence of hip fracture in Europe: a study ofnational register sources. Osteoporosis International, 1992, 2:298–302.
101. Xu L et al. Very low rates of hip fracture in Beijing, People’s Republic ofChina: the Beijing Osteoporosis Project. American Journal of Epidemiology,1996, 144:901–907.
102. Thacher TD et al. A comparison of calcium, vitamin D, or both for nutri-tional rickets in Nigerian children. New England Journal of Medicine, 1999,341:563–568.
103. Hegsted DM. Calcium and osteoporosis. Journal of Nutrition, 1986, 116:2316–2319.
104. Gallagher JC et al. Epidemiology of fractures of the proximal femur inRochester, Minnesota. Clinical Orthopaedics and Related Research, 1980,150:163–171.
105. Maggi S et al. Incidence of hip fractures in the elderly. A cross-national analy-sis. Osteoporosis International, 1991, 1:232–241.
106. Feskanich D et al. Protein consumption and bone fractures in women. American Journal of Epidemiology, 1996, 143:472–479.
P059-093 3/12/05 17:00 Page 90
107. Nordin BEC. Calcium in health and disease. Food, Nutrition and Agriculture, 1997, 20:13–24.
108. Aaron JE et al. Frequency of osteomalacia and osteoporosis in fractures ofthe proximal femur. Lancet, 1974, 2:229–233.
109. Aaron JE, Gallagher JC, Nordin BEC. Seasonal variation of histologicalosteomalacia in femoral neck fractures. Lancet, 1974, 2:84–85.
110. Baker MR et al. Plasma 25-hydroxy vitamin D concentrations in patientswith fractures of the femoral neck. British Medical Journal, 1979, 1:589.
111. Morris HA et al. Vitamin D and femoral neck fractures in elderly South Australian women. Medical Journal of Australia, 1984, 140:519–521.
112. von Knorring J et al. Serum levels of 25-hydroxyvitamin D, 24,25-dihydroxy-vitamin D and parathyroid hormone in patients with femoral neck fracturein southern Finland. Clinical Endocrinology, 1982, 17:189–194.
113. Pun KK et al. Vitamin D status among patients with fractured neck of femurin Hong Kong. Bone, 1990, 11:365–368.
114. Lund B, Sorenson OH, Christensen AB. 25-hydroxycholecalciferol and frac-tures of the proximal femur. Lancet, 1975, 2:300–302.
115. Chapuy MC et al. Vitamin D3 and calcium to prevent hip fractures in elderlywomen. New England Journal of Medicine, 1992, 327:1637–1642.
116. Boland R. Role of vitamin D in skeletal muscle function. Endocrine Reviews,1986, 7:434–448.
117. Walser M. Calcium clearance as a function of sodium clearance in the dog.American Journal of Physiology, 1961, 200:769–773.
118. Nordin BEC, Need AG. The effect of sodium on calcium requirement. In:Draper HH, ed. Advances in nutritional research. Volume 9. Nutrition andosteoporosis. New York, NY, Plenum Press, 1994:209–230.
119. Goulding A, Lim PE. Effects of varying dietary salt intake on the fastingexcretion of sodium, calcium and hydroxyproline in young women. NewZealand Medical Journal, 1983, 96:853–854.
120. Sabto J et al. Influence of urinary sodium on calcium excretion in normalindividuals. Medical Journal of Australia, 1984, 140:354–356.
121. Kleeman CR et al. Effect of variations in sodium intake on calcium excretionin normal humans. Proceedings of the Society for Experimental Biology, 1964,115:29–32.
122. Epstein FH. Calcium and the kidney. American Journal of Medicine, 1968,45:700–714.
123. Goulding A, Campbell D. Dietary NaCl loads promote calciuria and boneloss in adult oophorectomized rats consuming a low calcium diet. Journal ofNutrition, 1983, 113:1409–1414.
124. McParland BE, Goulding A, Campbell AJ. Dietary salt affects biochemicalmarkers of resorption and formation of bone in elderly women. BritishMedical Journal, 1989, 299:834–835.
125. Need AG et al. Effect of salt restriction on urine hydroxyproline excretion inpostmenopausal women. Archives of Internal Medicine, 1991, 151:757–759.
126. Elliott P et al. Intersalt revisited: further analyses of 24-hour sodium excre-tion and blood pressure within and across populations. British MedicalJournal, 1996, 312:1249–1253.
127. Hegsted DM, Linkswiler HM. Long-term effects of level of protein intakeon calcium metabolism in young adult women. Journal of Nutrition, 1981,111:244–251.
4. CALCIUM
91
P059-093 3/12/05 17:00 Page 91
VITAMIN AND MINERAL REQUIREMENTS IN HUMAN NUTRITION
92
128. Margen S et al. Studies in calcium metabolism. I. The calciuretic effect ofdietary protein. American Journal of Clinical Nutrition, 1974, 27:584–589.
129. Linkswiler HM et al. Protein-induced hypercalciuria. Federation Proceed-ings, 1981, 40:2429–2433.
130. Heaney RP. Protein intake and the calcium economy. Journal of the Ameri-can Dietetic Association, 1993, 93:1259–1260.
131. Kerstetter JE, Allen LH. Dietary protein increases urinary calcium. Journalof Nutrition, 1989, 120:134–136.
132. Nordin BEC et al. Dietary calcium and osteoporosis. In: Pietinen P, NishidaC, Khaltaev N, eds. Proceedings of the Second WHO Symposium on HealthIssues for the 21st Century: Nutrition and Quality of Life, Kobe, Japan, 24–26November 1993. Geneva, World Health Organization, 1996:181–198(WHO/NUT/95.7).
133. Schuette SA, Zemel MB, Linkswiler HM. Studies on the mechanism ofprotein-induced hypercalciuria in older men and women. Journal of Nutrition, 1980, 110:305–315.
134. Schuette SA et al. Renal acid, urinary cyclic AMP, and hydroxyproline excre-tion as affected by level of protein, sulfur amino acid, and phosphorus intake.Journal of Nutrition, 1981, 111:2106–2116.
135. Need AG, Horowitz M, Nordin BEC. Is the effect of dietary protein onurine calcium due to its phosphate content? Bone, 1998, 23(Suppl.):SA344.
136. Mellanby E. The part played by an “accessory factor” in the production ofexperimental rickets. A further demonstration of the part played by acces-sory food factors in the aetiology of rickets. Journal of Physiology, 1918,52:11–53.
137. Telfer SV. Studies in calcium and phosphorus metabolism. Quarterly Journalof Medicine, 1926, 20:1–6.
138. Fairweather-Tait S et al. Effect of calcium supplements and stage of lactationon the calcium absorption efficiency of lactating women accustomed to low calcium intakes. American Journal of Clinical Nutrition, 1995,62:1188–1192.
139. Prentice A et al. Biochemical markers of calcium and bone metabolism during18 months of lactation in Gambian women accustomed to a low calciumintake and in those consuming a calcium supplement. Journal of ClinicalEndocrinology and Metabolism, 1998, 83:1059–1066.
140. Dibba B et al. Effect of calcium supplementation on bone mineral accretionin Gambian children accustomed to a low calcium diet. American Journal ofClinical Nutrition, 2000, 71:544–549.
141. Aspray TJ et al. Low bone mineral content is common but osteoporotic frac-tures are rare in elderly rural Gambian women. Journal of Bone and MineralResearch, 1996, 11:1019–1025.
142. Bucher HC et al. Effect of calcium supplementation on pregnancy-inducedhypertension and pre-eclampsia. Journal of the American Medical Associa-tion, 1996, 275:1113–1117.
143. Garland CF, Garland FC, Gorham ED. Can colon cancer incidence and deathrates be reduced with calcium and vitamin D? American Journal of ClinicalNutrition, 1991, 54(Suppl.):S193–S201.
144. McCarron DA. Role of adequate dietary calcium intake in the prevention andmanagement of salt-sensitive hypertension. American Journal of ClinicalNutrition, 1997, 65(Suppl.):S712–S716.
145. Joffe GM et al. The relationship between abnormal glucose tolerance
P059-093 3/12/05 17:00 Page 92
and hypertensive disorders of pregnancy in healthy nulliparous women.American Journal of Obstetrics and Gynecology, 1998, 179:1032–1037.
146. Martinez ME, Willett WC. Calcium, vitamin D, and colorectal cancer: areview of the epidemiologic evidence. Cancer Epidemiology, Biomarkers andPrevention, 1998, 7:163–168.
147. Resnick LM. The role of dietary calcium in hypertension: a hierarchicaloverview. American Journal of Hypertension, 1999, 12:99–112.
148. DerSimonian R, Levine RJ. Resolving discrepancies between a meta-analysisand a subsequent large controlled trial. Journal of the American Medical Association, 1999, 282:664–670.
149. Mobarhan S. Calcium and the colon: recent findings. Nutrition Reviews,1999, 57:124–126.
150. McCarron DA, Reusser ME. Finding consensus in the dietary calcium-bloodpressure debate. Journal of the American College of Nutrition, 1999,18(Suppl.):S398–S405.
4. CALCIUM
93
P059-093 3/12/05 17:00 Page 93
94
5. Vitamin E
5.1 Role of vitamin E in human metabolic processesA large body of scientific evidence indicates that reactive free radicals areinvolved in many diseases, including heart disease and cancers (1). Cellscontain many potentially oxidizable substrates such as polyunsaturated fattyacids (PUFAs), proteins, and DNA. Therefore, a complex antioxidant defencesystem normally protects cells from the injurious effects of endogenouslyproduced free radicals as well as from species of exogenous origin such as cig-arette smoke and pollutants. Should our exposure to free radicals exceed theprotective capacity of the antioxidant defence system, a phenomenon oftenreferred to as oxidative stress (2), then damage to biological molecules mayoccur. There is considerable evidence that disease causes an increase in oxida-tive stress; therefore, consumption of foods rich in antioxidants, which arepotentially able to quench or neutralize excess radicals, may play an impor-tant role in modifying the development of disease.
Vitamin E is the major lipid-soluble antioxidant in the cell antioxidantdefence system and is exclusively obtained from the diet. The term “vitaminE” refers to a family of eight naturally-occurring homologues that are syn-thesized by plants from homogentisic acid. All are derivatives of 6-chromanoland differ in the number and position of methyl groups on the ring structure.The four tocopherol homologues (d-a-, d-b-, d-g-, and d-d-) have a saturated16-carbon phytyl side chain, whereas the four tocotrienols (d-a-, d-b-, d-g-,and d-d-) have three double bonds on the side chain. There is also a widelyavailable synthetic form, dl-a-tocopherol, prepared by coupling trimethyl-hydroquinone with isophytol. This consists of a mixture of eight stereoiso-mers in approximately equal amounts; these isomers are differentiated byrotations of the phytyl chain in various directions that do not occur naturally.
For dietary purposes, vitamin E activity is expressed as a-tocopherol equiv-alents (a-TEs). One a-TE is the activity of 1mg RRR-a-tocopherol (d-a-toco-pherol). To estimate the a-TE of a mixed diet containing natural forms ofvitamin E, the number of milligrams of b-tocopherol should be multiplied by0.5, g-tocopherol by 0.1, and a-tocotrienol by 0.3. Any of the synthetic all-rac-
P094-107 3/12/05 17:01 Page 94
a-tocopherols (dl-a-tocopherol) should be multiplied by 0.74. One milligramof the latter compound in the acetate form is equivalent to 1IU of vitamin E.
Vitamin E is an example of a phenolic antioxidant. Such molecules readilydonate the hydrogen from the hydroxyl (-OH) group on the ring structureto free radicals, making them unreactive. On donating the hydrogen, the phe-nolic compound itself becomes a relatively unreactive free radical because theunpaired electron on the oxygen atom is usually delocalized into the aromaticring structure thereby increasing its stability (3).
The major biological role of vitamin E is to protect PUFAs and other com-ponents of cell membranes and low-density lipoprotein (LDL) from oxida-tion by free radicals. Vitamin E is located primarily within the phospholipidbilayer of cell membranes. It is particularly effective in preventing lipid per-oxidation—a series of chemical reactions involving the oxidative deteriorationof PUFAs (see Chapter 8 on antioxidants). Elevated levels of lipid peroxida-tion products are associated with numerous diseases and clinical conditions(4). Although vitamin E is primarily located in cell and organelle membraneswhere it can exert its maximum protective effect, its concentration may onlybe one molecule for every 2000 phospholipid molecules. This suggests thatafter its reaction with free radicals it is rapidly regenerated, possibly by otherantioxidants (5).
Absorption of vitamin E from the intestine depends on adequate pancreaticfunction, biliary secretion, and micelle formation. Conditions for absorptionare like those for dietary lipid, that is, efficient emulsification, solubilizationwithin mixed bile salt micelles, uptake by enterocytes, and secretion into thecirculation via the lymphatic system (6). Emulsification takes place initially inthe stomach and then in the small intestine in the presence of pancreatic andbiliary secretions. The resulting mixed micelle aggregates the vitamin E mol-ecules, solubilizes the vitamin E, and then transports it to the brush bordermembrane of the enterocyte, probably by passive diffusion. Within the ente-rocyte, tocopherol is incorporated into chylomicrons and secreted into theintracellular space and lymphatic system and subsequently into the bloodstream. Tocopherol esters, present in processed foods and vitamin supple-ments, must be hydrolysed in the small intestine before absorption.
Vitamin E is transported in the blood by the plasma lipoproteins and ery-throcytes. Chylomicrons carry tocopherol from the enterocyte to the liver,where they are incorporated into parenchymal cells as chylomicron remnants.The catabolism of chylomicrons takes place in the systemic circulationthrough the action of cellular lipoprotein, lipase. During this process toco-pherol can be transferred to high-density lipoproteins (HDLs). The toco-pherol in HDLs can transfer to other circulating lipoproteins, such as LDLs
5. VITAMIN E
95
P094-107 3/12/05 17:01 Page 95
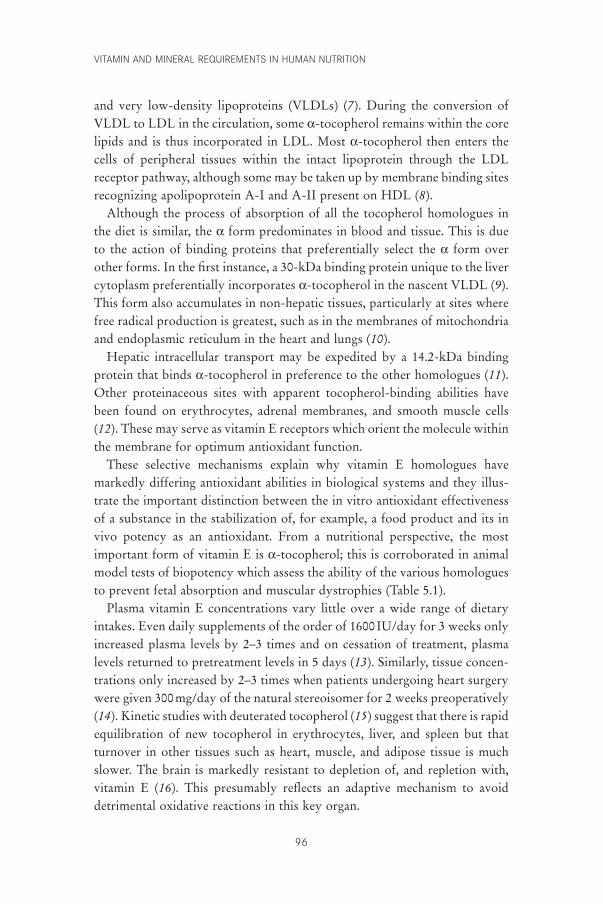
VITAMIN AND MINERAL REQUIREMENTS IN HUMAN NUTRITION
96
and very low-density lipoproteins (VLDLs) (7). During the conversion ofVLDL to LDL in the circulation, some a-tocopherol remains within the corelipids and is thus incorporated in LDL. Most a-tocopherol then enters thecells of peripheral tissues within the intact lipoprotein through the LDLreceptor pathway, although some may be taken up by membrane binding sitesrecognizing apolipoprotein A-I and A-II present on HDL (8).
Although the process of absorption of all the tocopherol homologues inthe diet is similar, the a form predominates in blood and tissue. This is dueto the action of binding proteins that preferentially select the a form overother forms. In the first instance, a 30-kDa binding protein unique to the livercytoplasm preferentially incorporates a-tocopherol in the nascent VLDL (9).This form also accumulates in non-hepatic tissues, particularly at sites wherefree radical production is greatest, such as in the membranes of mitochondriaand endoplasmic reticulum in the heart and lungs (10).
Hepatic intracellular transport may be expedited by a 14.2-kDa bindingprotein that binds a-tocopherol in preference to the other homologues (11).Other proteinaceous sites with apparent tocopherol-binding abilities havebeen found on erythrocytes, adrenal membranes, and smooth muscle cells(12). These may serve as vitamin E receptors which orient the molecule withinthe membrane for optimum antioxidant function.
These selective mechanisms explain why vitamin E homologues havemarkedly differing antioxidant abilities in biological systems and they illus-trate the important distinction between the in vitro antioxidant effectivenessof a substance in the stabilization of, for example, a food product and its invivo potency as an antioxidant. From a nutritional perspective, the mostimportant form of vitamin E is a-tocopherol; this is corroborated in animalmodel tests of biopotency which assess the ability of the various homologuesto prevent fetal absorption and muscular dystrophies (Table 5.1).
Plasma vitamin E concentrations vary little over a wide range of dietaryintakes. Even daily supplements of the order of 1600IU/day for 3 weeks onlyincreased plasma levels by 2–3 times and on cessation of treatment, plasmalevels returned to pretreatment levels in 5 days (13). Similarly, tissue concen-trations only increased by 2–3 times when patients undergoing heart surgerywere given 300mg/day of the natural stereoisomer for 2 weeks preoperatively(14). Kinetic studies with deuterated tocopherol (15) suggest that there is rapidequilibration of new tocopherol in erythrocytes, liver, and spleen but thatturnover in other tissues such as heart, muscle, and adipose tissue is muchslower. The brain is markedly resistant to depletion of, and repletion with,vitamin E (16). This presumably reflects an adaptive mechanism to avoiddetrimental oxidative reactions in this key organ.
P094-107 3/12/05 17:01 Page 96
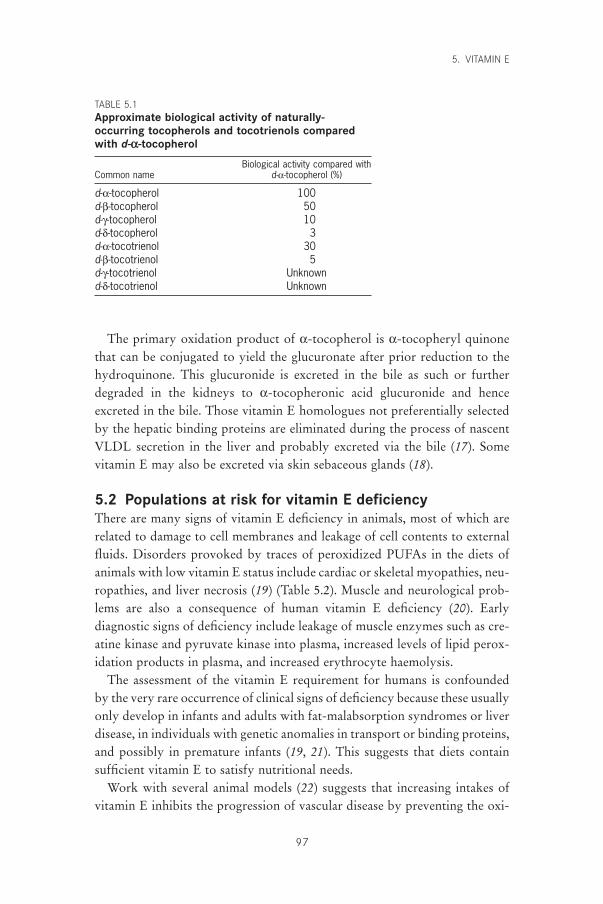
The primary oxidation product of a-tocopherol is a-tocopheryl quinonethat can be conjugated to yield the glucuronate after prior reduction to thehydroquinone. This glucuronide is excreted in the bile as such or furtherdegraded in the kidneys to a-tocopheronic acid glucuronide and henceexcreted in the bile. Those vitamin E homologues not preferentially selectedby the hepatic binding proteins are eliminated during the process of nascentVLDL secretion in the liver and probably excreted via the bile (17). Somevitamin E may also be excreted via skin sebaceous glands (18).
5.2 Populations at risk for vitamin E deficiencyThere are many signs of vitamin E deficiency in animals, most of which arerelated to damage to cell membranes and leakage of cell contents to externalfluids. Disorders provoked by traces of peroxidized PUFAs in the diets ofanimals with low vitamin E status include cardiac or skeletal myopathies, neu-ropathies, and liver necrosis (19) (Table 5.2). Muscle and neurological prob-lems are also a consequence of human vitamin E deficiency (20). Earlydiagnostic signs of deficiency include leakage of muscle enzymes such as cre-atine kinase and pyruvate kinase into plasma, increased levels of lipid perox-idation products in plasma, and increased erythrocyte haemolysis.
The assessment of the vitamin E requirement for humans is confounded by the very rare occurrence of clinical signs of deficiency because these usuallyonly develop in infants and adults with fat-malabsorption syndromes or liverdisease, in individuals with genetic anomalies in transport or binding proteins,and possibly in premature infants (19, 21). This suggests that diets containsufficient vitamin E to satisfy nutritional needs.
Work with several animal models (22) suggests that increasing intakes ofvitamin E inhibits the progression of vascular disease by preventing the oxi-
5. VITAMIN E
97
TABLE 5.1Approximate biological activity of naturally-occurring tocopherols and tocotrienols comparedwith d-a-tocopherol
Biological activity compared withCommon name d-a-tocopherol (%)
d-a-tocopherol 100d-b-tocopherol 50d-g-tocopherol 10d-d-tocopherol 3d-a-tocotrienol 30d-b-tocotrienol 5d-g-tocotrienol Unknownd-d-tocotrienol Unknown
P094-107 3/12/05 17:01 Page 97
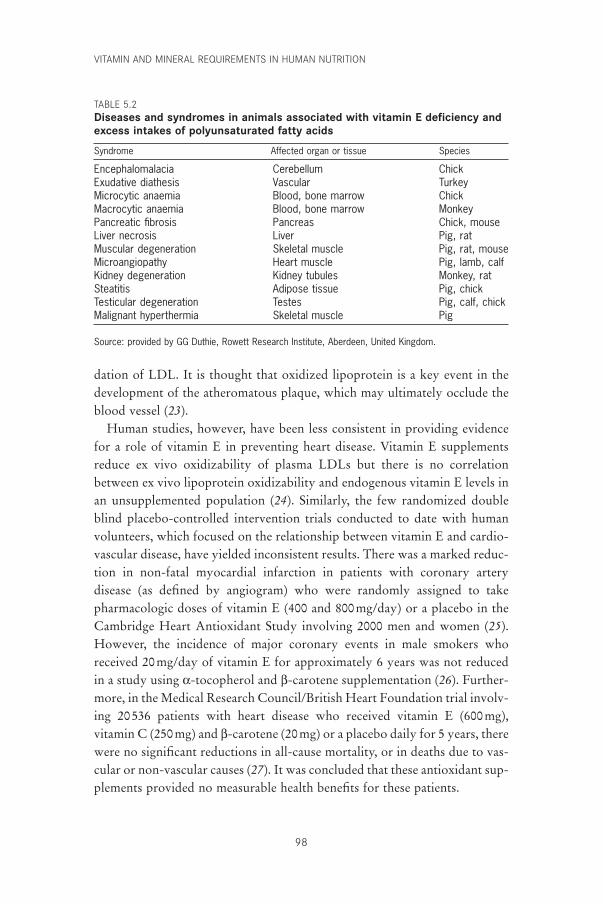
VITAMIN AND MINERAL REQUIREMENTS IN HUMAN NUTRITION
98
dation of LDL. It is thought that oxidized lipoprotein is a key event in thedevelopment of the atheromatous plaque, which may ultimately occlude theblood vessel (23).
Human studies, however, have been less consistent in providing evidencefor a role of vitamin E in preventing heart disease. Vitamin E supplementsreduce ex vivo oxidizability of plasma LDLs but there is no correlationbetween ex vivo lipoprotein oxidizability and endogenous vitamin E levels inan unsupplemented population (24). Similarly, the few randomized doubleblind placebo-controlled intervention trials conducted to date with humanvolunteers, which focused on the relationship between vitamin E and cardio-vascular disease, have yielded inconsistent results. There was a marked reduc-tion in non-fatal myocardial infarction in patients with coronary arterydisease (as defined by angiogram) who were randomly assigned to take pharmacologic doses of vitamin E (400 and 800mg/day) or a placebo in theCambridge Heart Antioxidant Study involving 2000 men and women (25).However, the incidence of major coronary events in male smokers whoreceived 20mg/day of vitamin E for approximately 6 years was not reducedin a study using a-tocopherol and b-carotene supplementation (26). Further-more, in the Medical Research Council/British Heart Foundation trial involv-ing 20536 patients with heart disease who received vitamin E (600mg),vitamin C (250mg) and b-carotene (20mg) or a placebo daily for 5 years, therewere no significant reductions in all-cause mortality, or in deaths due to vas-cular or non-vascular causes (27). It was concluded that these antioxidant sup-plements provided no measurable health benefits for these patients.
TABLE 5.2Diseases and syndromes in animals associated with vitamin E deficiency andexcess intakes of polyunsaturated fatty acids
Syndrome Affected organ or tissue Species
Encephalomalacia Cerebellum ChickExudative diathesis Vascular TurkeyMicrocytic anaemia Blood, bone marrow ChickMacrocytic anaemia Blood, bone marrow MonkeyPancreatic fibrosis Pancreas Chick, mouseLiver necrosis Liver Pig, ratMuscular degeneration Skeletal muscle Pig, rat, mouseMicroangiopathy Heart muscle Pig, lamb, calfKidney degeneration Kidney tubules Monkey, ratSteatitis Adipose tissue Pig, chickTesticular degeneration Testes Pig, calf, chickMalignant hyperthermia Skeletal muscle Pig
Source: provided by GG Duthie, Rowett Research Institute, Aberdeen, United Kingdom.
P094-107 3/12/05 17:01 Page 98
Epidemiological studies suggest that dietary vitamin E influences the riskof cardiovascular disease. Gey et al. (28) reported that lipid-standardizedplasma vitamin E concentrations in middle-aged men across 16 Europeancountries predicted 62% of the variance in the mortality from ischaemic heartdisease. In the United States both the Nurses Health Study (29), whichinvolved 87000 females in an 8-year follow-up, and the Health ProfessionalsFollow-up Study of 40000 men (30) concluded that persons taking supple-ments of 100mg/day or more of vitamin E for at least 2 years had approxi-mately a 40% lower incidence of myocardial infarction and cardiovascularmortality than those who did not. However, there was no influence of dietaryvitamin E alone on incidence of cardiovascular disease when those taking sup-plements were removed from the analyses. A possible explanation for the sig-nificant relationship between dietary vitamin E and cardiovascular disease inEuropean countries but not in the United States may be found in the fact thatacross Europe populations consume foods with widely differing amounts ofvitamin E. Sunflower seed oil, which is rich in a-tocopherol, tends to be con-sumed more widely in the southern European countries where a lower inci-dence of cardiovascular disease is reported, than in northern Europeancountries where soybean oil, which contains more of the g form, is preferred(31) (Table 5.3). A study carried out which compared plasma a-tocopheroland g-tocopherol concentrations in middle-aged men and women in Toulouse(southern France) with Belfast (Northern Ireland) found that the concentra-tions of g-tocopherol in Belfast were twice as high as those in Toulouse; a-tocopherol concentrations were identical in men in both countries but higherin women in Belfast than in Toulouse (P < 0.001) (32).
It has also been suggested that vitamin E supplementation (200–400mg/day) may be appropriate therapeutically to moderate some aspects ofdegenerative diseases such as Parkinson disease, reduce the severity of neu-rologic disorders such as tardive dyskinesia, prevent periventricular haemor-rhage in pre-term babies, reduce tissue injury arising from ischaemia andreperfusion during surgery, delay cataract development, and improve mobil-ity in arthritis sufferers (33). However, very high doses may also induceadverse pro-oxidant effects (34), and the long-term advantages of such treat-ments have not been proven. In fact, a double blind study to determine theinfluence of vitamin E (200mg/day) for 15 months on respiratory tract infec-tions in non-institutionalized persons over 60 years found no difference inincidence between groups, but that the number of symptoms and duration of fever and restricted activity were greater in those receiving the vitamin (35).
5. VITAMIN E
99
P094-107 3/12/05 17:01 Page 99
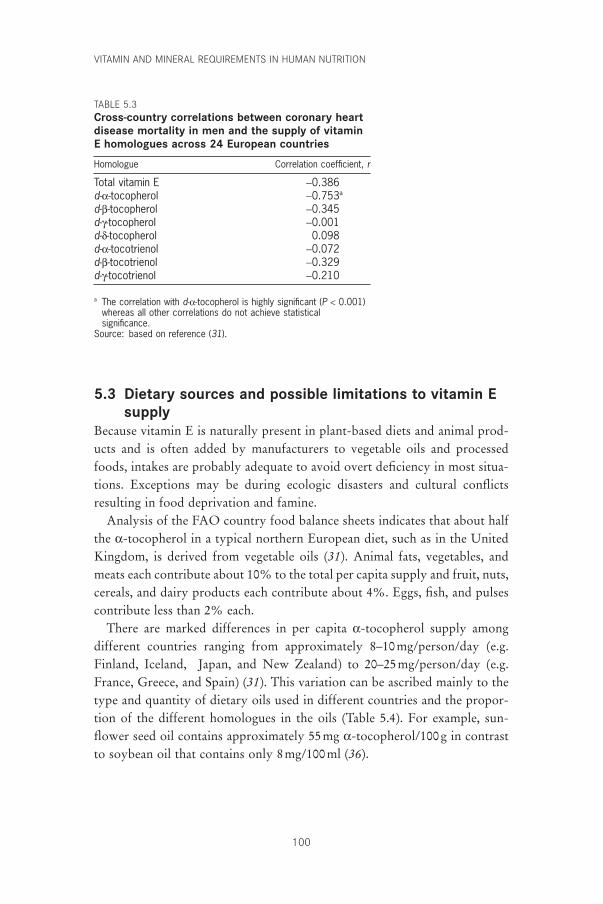
VITAMIN AND MINERAL REQUIREMENTS IN HUMAN NUTRITION
100
5.3 Dietary sources and possible limitations to vitamin Esupply
Because vitamin E is naturally present in plant-based diets and animal prod-ucts and is often added by manufacturers to vegetable oils and processedfoods, intakes are probably adequate to avoid overt deficiency in most situa-tions. Exceptions may be during ecologic disasters and cultural conflictsresulting in food deprivation and famine.
Analysis of the FAO country food balance sheets indicates that about halfthe a-tocopherol in a typical northern European diet, such as in the UnitedKingdom, is derived from vegetable oils (31). Animal fats, vegetables, andmeats each contribute about 10% to the total per capita supply and fruit, nuts,cereals, and dairy products each contribute about 4%. Eggs, fish, and pulsescontribute less than 2% each.
There are marked differences in per capita a-tocopherol supply among different countries ranging from approximately 8–10mg/person/day (e.g.Finland, Iceland, Japan, and New Zealand) to 20–25mg/person/day (e.g.France, Greece, and Spain) (31). This variation can be ascribed mainly to thetype and quantity of dietary oils used in different countries and the propor-tion of the different homologues in the oils (Table 5.4). For example, sun-flower seed oil contains approximately 55mg a-tocopherol/100g in contrastto soybean oil that contains only 8mg/100ml (36).
TABLE 5.3Cross-country correlations between coronary heartdisease mortality in men and the supply of vitaminE homologues across 24 European countries
Homologue Correlation coefficient, r
Total vitamin E -0.386d-a-tocopherol -0.753a
d-b-tocopherol -0.345d-g-tocopherol -0.001d-d-tocopherol 0.098d-a-tocotrienol -0.072d-b-tocotrienol -0.329d-g-tocotrienol -0.210
a The correlation with d-a-tocopherol is highly significant (P < 0.001)whereas all other correlations do not achieve statisticalsignificance.
Source: based on reference (31).
P094-107 3/12/05 17:01 Page 100
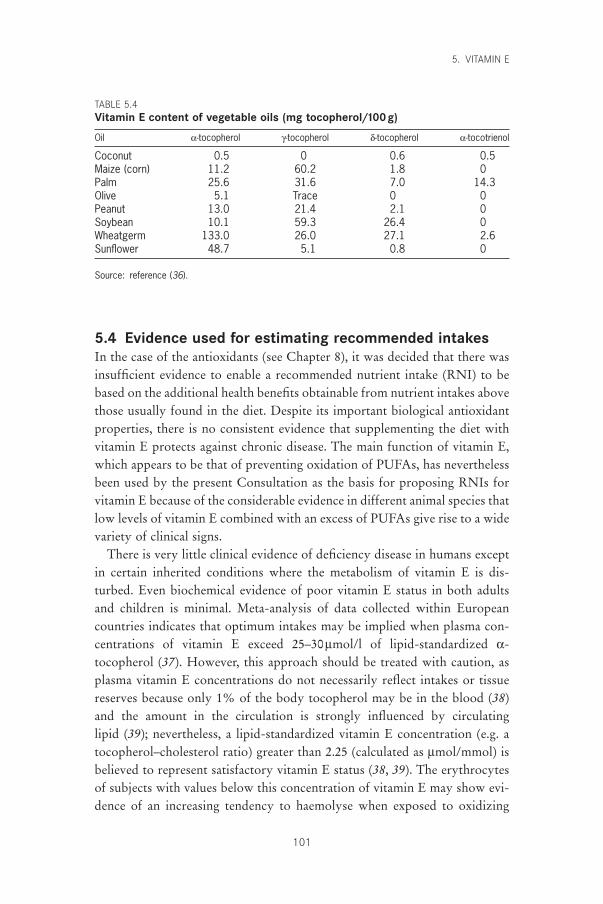
5.4 Evidence used for estimating recommended intakesIn the case of the antioxidants (see Chapter 8), it was decided that there wasinsufficient evidence to enable a recommended nutrient intake (RNI) to bebased on the additional health benefits obtainable from nutrient intakes abovethose usually found in the diet. Despite its important biological antioxidantproperties, there is no consistent evidence that supplementing the diet withvitamin E protects against chronic disease. The main function of vitamin E,which appears to be that of preventing oxidation of PUFAs, has neverthelessbeen used by the present Consultation as the basis for proposing RNIs forvitamin E because of the considerable evidence in different animal species thatlow levels of vitamin E combined with an excess of PUFAs give rise to a widevariety of clinical signs.
There is very little clinical evidence of deficiency disease in humans exceptin certain inherited conditions where the metabolism of vitamin E is dis-turbed. Even biochemical evidence of poor vitamin E status in both adultsand children is minimal. Meta-analysis of data collected within Europeancountries indicates that optimum intakes may be implied when plasma con-centrations of vitamin E exceed 25–30mmol/l of lipid-standardized a-tocopherol (37). However, this approach should be treated with caution, asplasma vitamin E concentrations do not necessarily reflect intakes or tissuereserves because only 1% of the body tocopherol may be in the blood (38)and the amount in the circulation is strongly influenced by circulating lipid (39); nevertheless, a lipid-standardized vitamin E concentration (e.g. atocopherol–cholesterol ratio) greater than 2.25 (calculated as mmol/mmol) isbelieved to represent satisfactory vitamin E status (38, 39). The erythrocytesof subjects with values below this concentration of vitamin E may show evi-dence of an increasing tendency to haemolyse when exposed to oxidizing
5. VITAMIN E
101
TABLE 5.4Vitamin E content of vegetable oils (mg tocopherol/100g)
Oil a-tocopherol g-tocopherol d-tocopherol a-tocotrienol
Coconut 0.5 0 0.6 0.5Maize (corn) 11.2 60.2 1.8 0Palm 25.6 31.6 7.0 14.3Olive 5.1 Trace 0 0Peanut 13.0 21.4 2.1 0Soybean 10.1 59.3 26.4 0Wheatgerm 133.0 26.0 27.1 2.6Sunflower 48.7 5.1 0.8 0
Source: reference (36).
P094-107 3/12/05 17:01 Page 101
VITAMIN AND MINERAL REQUIREMENTS IN HUMAN NUTRITION
102
agents and thus, such values should be taken as an indication of biochemicaldeficiency (40). However, the development of clinical evidence of vitamin Edeficiency (e.g. muscle damage or neurologic lesions) can take several yearsof exposure to extremely low vitamin E levels (41).
Dietary intakes of PUFAs have been used to assess the adequacy of vitaminE intakes by United States and United Kingdom advisory bodies. PUFAs arevery susceptible to oxidation and their increased intake, without a concomi-tant increase in vitamin E, can lead to a reduction in plasma vitamin E con-centrations (42) and to elevations in some indexes of oxidative damage inhuman volunteers (43). However, diets high in PUFAs tend also to be high invitamin E, and to set a dietary recommendation based on extremes of PUFAintake would deviate considerably from median intakes of vitamin E in mostpopulations of industrialized countries. Hence ‘safe’ allowances for the UnitedKingdom (men 10 and women 7mg/day) (44) and ‘arbitrary’ allowances forthe United States (men 10 and women 8mg/day) (45) for vitamin E intakesapproximate the median intake in those countries. It is worth noting that only11 (0.7%) out of 1629 adults in the 1986–1987 British Nutrition Survey had a-tocopherol–cholesterol ratios <2.25. Furthermore, although the high intake ofsoybean oil, with its high content of g-tocopherol, substitutes for the intake ofa-tocopherol in the British diet, a comparison of a-tocopherol–cholesterolratios found almost identical results in two groups of randomly-selected,middle-aged adults in Belfast (Northern Ireland) and Toulouse (France), twocountries with very different intakes of a-tocopherol (36) and cardiovascularrisk (32).
It has been suggested that when the main PUFA in the diet is linoleic acid,a d-a-tocopherol–PUFA ratio of 0.4 (expressed as mg tocopherol per gPUFA) is adequate for adult humans (46, 47). This ratio has been recom-mended in the United Kingdom for infant formulas (48). Use of this ratio tocalculate the vitamin E requirements of men and women with energy intakesof 2550 and 1940kcal/day, respectively, and containing PUFAs at 6% of theenergy intake (approximately 17g and 13g, respectively), (44) produced valuesof 7 and 5mg/day of a-TEs, respectively. In both the United States and theUnited Kingdom, median intakes of a-TE are in excess of these amounts andthe a-tocopherol–PUFA ratio is approximately 0.6 (49), which is well abovethe value of 0.4 that would be considered adequate for this ratio. The Nutri-tion Working Group of the International Life Sciences Institute Europe (50)has suggested an intake of 12mg a-tocopherol for a daily intake of 14gPUFAs to compensate for the high consumption of soybean oil in certaincountries, where over 50% of vitamin E intake is accounted for by the less
P094-107 3/12/05 17:01 Page 102
biologically active g form. As indicated above, however, plasma concentra-tions of a-tocopherol in subjects from Toulouse and Belfast suggest that anincreased amount of dietary vitamin E is not necessary to maintain satisfac-tory plasma concentrations (32).
At present, data are not sufficient to formulate recommendations forvitamin E intake for different age groups except for infancy. There is someindication that newborn infants, particularly if born prematurely, are vulner-able to oxidative stress because of low body stores of vitamin E, impairedabsorption, and reduced transport capacity resulting from low concentrationsof circulating low-density lipoproteins at birth (51). However, term infantsnearly achieve adult plasma vitamin E concentrations in the first week (52)and although the concentration of vitamin E in early human milk can be vari-able, after 12 days it remains fairly constant at 0.32mg a-TE/100ml milk (53).Thus a human-milk-fed infant consuming 850ml would have an intake of 2.7mg a-TE. It seems reasonable that formula milk should not contain less than 0.3mg a-TE/100ml of reconstituted feed and not less than 0.4mga-TE/g PUFA.
No specific recommendations concerning the vitamin E requirements inpregnancy and lactation have been made by other advisory bodies (44, 45)mainly because there is no evidence of vitamin E requirements different fromthose of other adults and, presumably, also because the increased energyintake during these periods would compensate for the increased needs forinfant growth and milk synthesis.
5.5 ToxicityVitamin E appears to have very low toxicity, and amounts of 100–200mg ofthe synthetic all-rac-a-tocopherol are consumed widely as supplements (29,30). Evidence of pro-oxidant damage has been associated with the feeding ofsupplements but usually only at very high doses (e.g. >1000mg/day) (34).Nevertheless, the recent report from The Netherlands of increased severityof respiratory tract infections in persons over 60 years who received 200mgvitamin E per day for 15 months, should be noted in case that is also an indi-cation of a pro-oxidant effect (35).
5.6 Recommendations for future researchMore investigation is required of the role of vitamin E in biological processeswhich do not necessarily involve its antioxidant function. These processesinclude:
5. VITAMIN E
103
P094-107 3/12/05 17:01 Page 103
VITAMIN AND MINERAL REQUIREMENTS IN HUMAN NUTRITION
104
• structural roles in the maintenance of cell membrane integrity;• anti-inflammatory effects by direct and regulatory interaction with the
prostaglandin synthetase complex of enzymes which participate in themetabolism of arachidonic acid;
• DNA synthesis;• interaction with the immune response;• regulation of intercellular signalling and cell proliferation through modu-
lation of protein kinase C.
Additionally, more investigation is required of the growing evidence thatinadequate vitamin E status may increase susceptibility to infection particu-larly by allowing the genomes of certain relatively benign viruses to convertto more virulent strains (54).
There is an important need to define optimum vitamin E intakes foryounger groups of healthy persons since supplements for people who arealready ill appear ineffective and can possibly be harmful in the elderly. Inter-vention trials with morbidity and mortality end-points will take years to com-plete, although the European Prospective Investigations on Cancer which hasalready been underway for more than 10 years (55) may provide some rele-vant information. One possible approach to circumvent this delay is to assessthe effects of different intakes of vitamin E on biomarkers of oxidative damageto lipids, proteins, and DNA as their occurrence in vivo is implicated in manydiseases, including vascular disease and certain cancers. However, clinicalstudies will always remain the gold standard.
References1. Diplock AT. Antioxidants and disease prevention. Molecular Aspects of
Medicine, 1994, 15:293–376.2. Sies H. Oxidative stress: an introduction. In: Sies H, ed. Oxidative stress: oxi-
dants and antioxidants. London, Academic Press, 1993:15–22.3. Scott G. Antioxidants in science, technology, medicine and nutrition. Chich-
ester, Albion Publishing, 1997.4. Duthie GG. Lipid peroxidation. European Journal of Clinical Nutrition, 1993,
47:759–764.5. Kagan VE. Recycling and redox cycling of phenolic antioxidants. Annals of
the New York Academy of Sciences, 1998, 854:425–434.6. Gallo-Torres HE. Obligatory role of bile for the intestinal absorption of
vitamin E. Lipids, 1970, 5:379–384.7. Traber MG et al. RRR- and SRR-a-tocopherols are secreted without dis-
crimination in human chylomicrons, but RRR-a-tocopherol is preferentiallysecreted in very low density lipoproteins. Journal of Lipid Research, 1990,31:675–685.
8. Traber MG. Regulation of human plasma vitamin E. In: Sies H, ed. Antioxi-
P094-107 3/12/05 17:01 Page 104
dants in disease mechanisms and therapeutic strategies. San Diego, CA, Acad-emic Press, 1996:49–63.
9. Traber MG, Kayden HJ. Preferential incorporation of a-tocopherol vs. g-tocopherol in human lipoproteins. American Journal of Clinical Nutrition,1989, 49:517–526.
10. Kornbrust DJ, Mavis RD. Relative susceptibility of microsomes from lung,heart, liver, kidney, brain and testes to lipid peroxidation: correlation withvitamin E content. Lipids, 1979, 15:315–322.
11. Dutta-Roy AK et al. Purification and partial characterisation of an a-tocopherol-binding protein from rabbit heart cytosol. Molecular and CellularBiochemistry, 1993, 123:139–144.
12. Dutta-Roy AK et al. Vitamin E requirements, transport, and metabolism: roleof a-tocopherol-binding proteins. Journal of Nutritional Biochemistry, 1994,5:562–570.
13. Esterbauer H et al. The role of lipid peroxidation and antioxidants in oxida-tive modification of LDL. Free Radicals in Biology and Medicine, 1992,13:341–390.
14. Mickle DAG et al. Effect of orally administered a-tocopherol acetate onhuman myocardial a-tocopherol levels. Cardiovascular Drugs and Therapy,1991, 5:309–312.
15. Traber MG, Ramakrishnan R, Kayden HJ. Human plasma vitamin E kineticsdemonstrate rapid recycling of plasma RRR-a-tocopherol. Proceedings of theNational Academy of Sciences, 1994, 91:10005–10008.
16. Bourne J, Clement M. Kinetics of rat peripheral nerve, forebrain and cerebel-lum a-tocopherol depletion: comparison with different organs. Journal ofNutrition, 1991, 121:1204–1207.
17. Drevon CA. Absorption, transport and metabolism of vitamin E. Free RadicalResearch Communications, 1991, 14:229–246.
18. Shiratori T. Uptake, storage and excretion of chylomicra-bound 3H-alpha-tocopherol by the skin of the rat. Life Sciences, 1974, 14:929–935.
19. McLaren DS et al. Fat soluble vitamins. In: Garrow JS, James WPT, eds.Human nutrition and dietetics. Edinburgh, Churchill Livingstone, 1993:208–238.
20. Sokol RJ. Vitamin E deficiency and neurologic disease. Annual Review ofNutrition, 1988, 8:351–373.
21. Traber MG et al. Impaired ability of patients with familial isolated vitamin Edeficiency to incorporate a-tocopherol into lipoproteins secreted by the liver.Journal of Clinical Investigation, 1990, 85:397–407.
22. Williams RJ et al. Dietary vitamin E and the attenuation of early lesion devel-opment in modified Watanabe rabbits. Atherosclerosis, 1992, 94:153–159.
23. Steinberg D et al. Beyond cholesterol. Modifications of low-density lipopro-tein that increase its atherogenicity. New England Journal of Medicine, 1989,320:915–924.
24. Dieber-Rotheneder M et al. Effect of oral supplementation with d-a-tocopherol on the vitamin E content of human low density lipoprotein andresistance to oxidation. Journal of Lipid Research, 1991, 32:1325–1332.
25. Stephens NG et al. Randomised control trial of vitamin E in patients withcoronary disease: Cambridge Heart Antioxidant Study (CHAOS). Lancet,1996, 347:781–786.
26. Rapola J et al. Randomised trial of alpha-tocopherol and beta-carotene sup-
5. VITAMIN E
105
P094-107 3/12/05 17:01 Page 105
VITAMIN AND MINERAL REQUIREMENTS IN HUMAN NUTRITION
106
plements on incidence of major coronary events in men with previous myocar-dial infarction. Lancet, 1997, 349:1715–1720.
27. Heart Protection Study Group. MRC/BHF heart protection study of antiox-idant vitamin supplementation in 20536 high-risk individuals: a randomisedplacebo-controlled trial. Lancet, 2002, 360:23–33.
28. Gey KF et al. Inverse correlation between plasma vitamin E and mortalityfrom ischaemic heart disease in cross-cultural epidemiology. American Journalof Clinical Nutrition, 1991, 53(Suppl.):S326–S334.
29. Stampler MJ et al. Vitamin E consumption and risk of coronary heart diseasein women. New England Journal of Medicine, 1993, 328:1444–1449.
30. Rimm EB et al. Vitamin E consumption and risk of coronary heart disease inmen. New England Journal of Medicine, 1993, 328:1450–1456.
31. Bellizzi MC et al. Vitamin E and coronary heart disease: the Europeanparadox. European Journal of Clinical Nutrition, 1994, 48:822–831.
32. Howard AN et al. Do hydroxy carotenoids prevent coronary heart disease?A comparison between Belfast and Toulouse. International Journal of Vitaminand Nutrition Research, 1996, 66:113–118.
33. Packer L. Vitamin E: biological activity and health benefits. Overview. In:Packer L, Fuchs J, eds. Vitamin E in health and disease. New York, NY, MarcelDekker, 1993:977–982.
34. Brown KM, Morrice PC, Duthie GG. Erythrocyte vitamin E and plasmaascorbate concentrations in relation to erythrocyte peroxidation in smokersand non-smokers: dose–response of vitamin E supplementation. AmericanJournal of Clinical Nutrition, 1997, 65:496–502.
35. Graat JM, Schouten EG, Kok FJ. Effect of daily vitamin E and multivitaminmineral supplementation on acute respiratory tract infections in elderlypersons: a randomized controlled trial. Journal of the American Medical Association, 2002, 288:715–721.
36. Slover HT. Tocopherols in foods and fats. Lipids, 1971, 6:291–296.37. Gey KF. Vitamin E and other essential antioxidants regarding coronary heart
disease: risk assessment studies. In: Packer L, Fuchs J, eds. Vitamin E in healthand disease. New York, NY, Marcel Dekker, 1993:589–634.
38. Horwitt MK et al. Relationship between tocopherol and serum lipid levels forthe determination of nutritional adequacy. Annals of the New York Academyof Sciences, 1972, 203:223–236 .
39. Thurnham DI et al. The use of different lipids to express serum tocopherol:lipid ratios for the measurement of vitamin E status. Annals of Clinical Biochemistry, 1986, 23:514–520.
40. Leonard PJ, Losowsky MS. Effect of alpha-tocopherol administration on redcell survival in vitamin E deficient human subjects. American Journal of Clin-ical Nutrition, 1971, 24:388–393.
41. Horwitt MK. Interpretation of human requirements for vitamin E. In:Machlin L, ed. Vitamin E, a comprehensive treatise. New York, NY, MarcelDekker, 1980:621–636.
42. Bunnell RH, De Ritter, Rubin SH. Effect of feeding polyunsaturated fattyacids with a low vitamin E diet on blood levels of tocopherol in men per-forming hard physical labor. American Journal of Clinical Nutrition, 1975,28:706–711.
43. Jenkinson A et al. Dietary intakes of polyunsaturated fatty acids and indices of oxidative stress in human volunteers. European Journal of ClinicalNutrition, 1999, 53:523–528.
P094-107 3/12/05 17:01 Page 106
44. Department of Health. Dietary reference values for food energy and nutrientsfor the United Kingdom. London, Her Majesty’s Stationery Office, 1991(Report on Health and Social Subjects, No. 41).
45. Subcommittee on the Tenth Edition of the Recommended DietaryAllowances, Food and Nutrition Board. Recommended dietary allowances,10th ed. Washington, DC, National Academy Press, 1989.
46. Bieri JG, Evarts RP. Tocopherols and fatty acids in American diets: the recommended allowance for vitamin E. Journal of the American Dietetic Association, 1973, 62:147–151.
47. Witting LA, Lee L. Dietary levels of vitamin E and polyunsaturated fatty acids and plasma vitamin E. American Journal of Clinical Nutrition, 1975,28:571–576.
48. Department of Health and Social Security. Artificial feeds for the young infant.London, Her Majesty’s Stationery Office, 1980 (Report on Health and SocialSubjects, No. 18).
49. Gregory JR et al. The Dietary and Nutritional Survey of British Adults.London, Her Majesty’s Stationery Office, 1990.
50. Nutrition Working Group of the International Life Science Institute Europe.Recommended daily amounts of vitamins and minerals in Europe. NutritionAbstracts and Reviews (Series A), 1990, 60:827–842.
51. Lloyd JK. The importance of vitamin E in nutrition. Acta Pediatrica Scandinavica, 1990, 79:6–11.
52. Kelly FJ et al. Time course of vitamin E repletion in the premature infant.British Journal of Nutrition, 1990, 63:631–638.
53. Jansson L, Akesson B, Holmberg L. Vitamin E and fatty acid composition ofhuman milk. American Journal of Clinical Nutrition, 1981, 34:8–13.
54. Beck MA. The influence of antioxidant nutrients on viral infection. NutritionReviews, 1998, 56:S140–S146.
55. Riboli E. Nutrition and cancer: background and rationale of the EuropeanProspective Investigation into Cancer (EPIC). Annals of Oncology, 1992,3:783–791.
5. VITAMIN E
107
P094-107 3/12/05 17:01 Page 107
108
6. Vitamin K
6.1 IntroductionVitamin K is an essential fat-soluble micronutrient, which is needed for aunique post-translational chemical modification in a small group of proteinswith calcium-binding properties, collectively known as vitamin K-dependentproteins or Gla proteins. Thus far, the only unequivocal role of vitamin K in health is in the maintenance of normal coagulation. The vitamin K-dependent coagulation proteins are synthesized in the liver and comprisefactors II, VII, IX, and X, which have a haemostatic role (i.e. they are proco-agulants that arrest and prevent bleeding), and proteins C and S, which havean anticoagulant role (i.e. they inhibit the clotting process). Despite thisduality of function, the overriding effect of nutritional vitamin K deficiencyis a bleeding tendency caused by the relative inactivity of the procoagulantproteins. Vitamin K-dependent proteins synthesized by other tissues includethe bone protein osteocalcin and matrix Gla protein, though their functionsremain to be clarified.
6.2 Biological role of vitamin KVitamin K is the family name for a series of fat-soluble compounds whichhave a common 2-methyl-1,4-naphthoquinone nucleus but differ in the struc-tures of a side chain at the 3-position. They are synthesized by plants and bac-teria. In plants the only important molecular form is phylloquinone (vitaminK1), which has a phytyl side chain. Bacteria synthesize a family of compoundscalled menaquinones (vitamin K2), which have side chains based on repeatingunsaturated 5-carbon (prenyl) units. These are designated menaquinone-n(MK-n) according to the number (n) of prenyl units. Some bacteria also syn-thesize menaquinones in which one or more of the double bonds is saturated.The compound 2-methyl-1,4-naphthoquinone (common name menadione)may be regarded as a provitamin because vertebrates can convert it to MK-4by adding a 4-prenyl side chain at the 3-position.
The biological role of vitamin K is to act as a cofactor for a specific carboxylation reaction that transforms selective glutamate (Glu) residues to
P108-129 3/12/05 17:04 Page 108
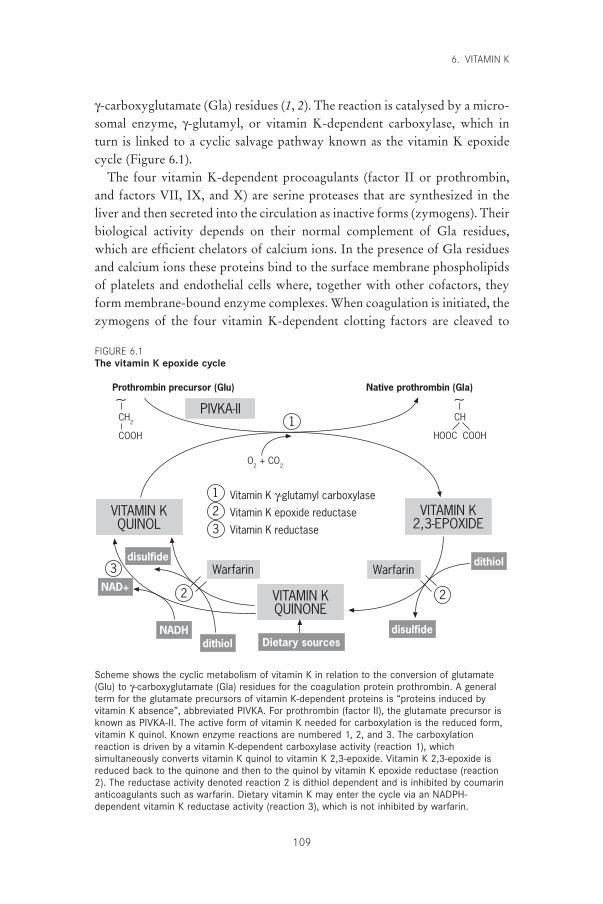
g-carboxyglutamate (Gla) residues (1, 2). The reaction is catalysed by a micro-somal enzyme, g-glutamyl, or vitamin K-dependent carboxylase, which inturn is linked to a cyclic salvage pathway known as the vitamin K epoxidecycle (Figure 6.1).
The four vitamin K-dependent procoagulants (factor II or prothrombin,and factors VII, IX, and X) are serine proteases that are synthesized in theliver and then secreted into the circulation as inactive forms (zymogens). Theirbiological activity depends on their normal complement of Gla residues,which are efficient chelators of calcium ions. In the presence of Gla residuesand calcium ions these proteins bind to the surface membrane phospholipidsof platelets and endothelial cells where, together with other cofactors, theyform membrane-bound enzyme complexes. When coagulation is initiated, thezymogens of the four vitamin K-dependent clotting factors are cleaved to
6. VITAMIN K
109
Prothrombin precursor (Glu)∼CH
2
COOH
∼CH
HOOC COOH
PIVKA-II
O2 + CO
2
VITAMIN KQUINOL
VITAMIN K2,3-EPOXIDE
1
123
3
2 2
Vitamin K g-glutamyl carboxylase
Vitamin K epoxide reductase
Vitamin K reductase
VITAMIN KQUINONE
Warfarin Warfarin
Dietary sourcesdisulfide
disulfide dithiol
dithiolNADH
NAD+
Native prothrombin (Gla)
Scheme shows the cyclic metabolism of vitamin K in relation to the conversion of glutamate(Glu) to g-carboxyglutamate (Gla) residues for the coagulation protein prothrombin. A generalterm for the glutamate precursors of vitamin K-dependent proteins is “proteins induced byvitamin K absence”, abbreviated PIVKA. For prothrombin (factor II), the glutamate precursor isknown as PIVKA-II. The active form of vitamin K needed for carboxylation is the reduced form,vitamin K quinol. Known enzyme reactions are numbered 1, 2, and 3. The carboxylationreaction is driven by a vitamin K-dependent carboxylase activity (reaction 1), whichsimultaneously converts vitamin K quinol to vitamin K 2,3-epoxide. Vitamin K 2,3-epoxide isreduced back to the quinone and then to the quinol by vitamin K epoxide reductase (reaction2). The reductase activity denoted reaction 2 is dithiol dependent and is inhibited by coumarinanticoagulants such as warfarin. Dietary vitamin K may enter the cycle via an NADPH-dependent vitamin K reductase activity (reaction 3), which is not inhibited by warfarin.
FIGURE 6.1The vitamin K epoxide cycle
P108-129 3/12/05 17:04 Page 109
VITAMIN AND MINERAL REQUIREMENTS IN HUMAN NUTRITION
110
yield the active protease clotting factors (1–3). Two other vitamin K-dependent proteins, protein C and protein S, play a regulatory role in the inhibition of coagulation. The function of protein C is to degrade phospho-lipid-bound activated factors V and VIII in the presence of calcium. ProteinS acts as a synergistic cofactor to protein C by enhancing the binding of acti-vated protein C to negatively charged phospholipids. There is evidence thatprotein S is synthesized by several tissues including the blood vessel wall andbone and may have other functions besides its well-established role as a coag-ulation inhibitor. Yet another vitamin K-dependent plasma protein (proteinZ) is suspected to have a haemostatic role but its function is currentlyunknown.
Apart from the coagulation proteins, several other vitamin K-dependentproteins have been isolated from bone, cartilage, kidney, lungs, and othertissues (4, 5). Only two, osteocalcin and matrix Gla protein (MGP), have been well characterized. Both are found in bone but MGP also occurs in cartilage, blood vessel walls, and other soft tissues. It seems likely that onefunction of MGP is to inhibit mineralization (6). Thus far, no clear biologi-cal role for osteocalcin has been established despite its being the major non-collagenous bone protein synthesized by osteoblasts (7–9). This failure toestablish a biological function for osteocalcin has hampered studies of the pos-sible detrimental effects of vitamin K deficiency on bone health. Evidence ofa possible association of a suboptimal vitamin K status with increased frac-ture risk remains to be confirmed (7–9).
6.3 Overview of vitamin K metabolism6.3.1 Absorption and transportDietary vitamin K, mainly phylloquinone, is absorbed chemically unchangedfrom the proximal intestine after solubilization into mixed micelles composedof bile salts and the products of pancreatic lipolysis (10). In healthy adults theefficiency of absorption of phylloquinone in its free form is about 80% (10,11). Within the intestinal mucosa the vitamin is incorporated into chylomi-crons, is secreted into the lymph, and enters the blood via the lacteals (11, 12).Once in the circulation, phylloquinone is rapidly cleared (10) at a rate consistent with its continuing association with chylomicrons and the chylomicron remnants, which are produced by lipoprotein lipase hydrolysisat the surface of capillary endothelial cells (13). After an overnight fast, morethan half of the circulating phylloquinone is still associated with triglyceride-rich lipoproteins, with the remainder being equally distributed between low-density and high-density lipoproteins (13). Although phylloquinone is
P108-129 3/12/05 17:04 Page 110
the major circulating form of vitamin K, MK-7 is also present in plasma, atlower concentrations and with a lipoprotein distribution similar to phyllo-quinone (13). Although phylloquinone in blood must have been derivedexclusively from the diet, it is not known whether circulating menaquinonessuch as MK-7 are derived from the diet, intestinal flora, or a combination ofthese sources.
6.3.2 Tissue stores and distributionUntil the 1970s, the liver was the only known site of synthesis of vitamin K-dependent proteins and hence was presumed to be the only significant storagesite for the vitamin. However, the discovery of vitamin K-dependentprocesses and proteins in a number of extra-hepatic tissues suggests that thismay not be the case (see section 6.2).
Human liver stores normally comprise about 90% menaquinones and 10%phylloquinone (14, 15). There is evidence that the phylloquinone liver storesare very labile; under conditions of severe dietary depletion, liver concentra-tions were reduced to about 25% of their initial levels after only 3 days (15).This high turnover of hepatic reserves of phylloquinone is in accord with thehigh losses of this vitamer through excretion (10).
Knowledge of hepatic stores of phylloquinone in different populationgroups is limited. Adult hepatic stores in a United Kingdom study were about11pmol/g (14) whereas in a study from Japan they were about two-fold higher(15). Such reserves are about 20000–40000-fold lower than those for retinolfor relative daily intakes of phylloquinone that are only about 10-fold lowerthan those of vitamin A (16).
The relationship between hepatic and total-body stores of vitamin K is notknown. Other sites of storage may be adipose tissue and bone; both areknown to be sites where vitamin K-bearing chylomicrons and chylomicronremnants may be taken up. It has been reported that the predominant vitamerin human cortical and trabecular bone is phylloquinone; unlike the situationin liver, no menaquinones higher than MK-8 were detected (17).
In contrast to the hepatic preponderance of long-chain menaquinones, the major circulating form of vitamin K is invariably phylloquinone. Themenaquinones MK-7, and possibly MK-8, are also present but the commonhepatic forms, MKs 9–13, are not detectable in blood plasma (16, 18). Thismay be a consequence of a different route of absorption (e.g. the possibilityof a portal route for long-chain MKs versus the established lymphatic routefor phylloquinone), but might also suggest that once in the liver, the lipophiliclong-chain menaquinones are not easily mobilized (16, 18, 19).
6. VITAMIN K
111
P108-129 3/12/05 17:04 Page 111
VITAMIN AND MINERAL REQUIREMENTS IN HUMAN NUTRITION
112
6.3.3 BioactivityVery little information exists on the relative effectiveness of the differenthepatic forms of K vitamins with respect to the coagulation function ofvitamin K in humans. This information is important because of the prepon-derance of long-chain menaquinones in human liver. Early bioassay data fromrats suggested that long-chain menaquinones (MK-7, -9, and -10) were moreefficient than phylloquinone in reversing vitamin K deficiency when singledoses were given parenterally and that their sustained effect on vitamin Kstatus may be due to their slower hepatic turnover (18, 19). Groenen-vanDooren et al. (20) also observed a longer duration of the biological responseof MK-9 compared with phylloquinone in vitamin K-deficient rats. On theother hand, Will and Suttie (21) showed that when given orally, the dietaryrequirement for MK-9 for the maintenance of prothrombin synthesis in ratsis higher than that for phylloquinone. They also reported that the initialhepatic turnover of MK-9 was two- to three-fold slower than that of phylloquinone.
Suttie (18) emphasized that the existence of a large pool of menaquinonesin human liver does not necessarily mean that menaquinones make a propor-tionately greater contribution to the maintenance of vitamin K sufficiency. In humans, however, the development of subclinical signs of vitamin K defi-ciency detected in dietary phylloquinone restriction studies argues againstthis, especially when placed alongside the lack of change of hepaticmenaquinone stores (15). One explanation is that many of the hepaticmenaquinones are not biologically available to the microsomal g-glutamyl car-boxylase because of their different subcellular location; for instance, they maybe located in the mitochondria and possibly other non-microsomal sites (18).
6.3.4 ExcretionVitamin K is extensively metabolized in the liver and excreted in the urineand bile. In tracer experiments about 20% of an injected dose of phylloqui-none was recovered in the urine whereas about 40–50% was excreted in thefaeces via the bile (10); the proportion excreted was the same regardless ofwhether the injected dose was 1mg or 45mg. It seems likely, therefore, thatabout 60–70% of the amount of phylloquinone absorbed from each meal willultimately be lost to the body by excretion. These results suggest that thebody stores of phylloquinone are being constantly replenished.
The main urinary excretory products have been identified as carboxylicacids with 5- and 7-carbon side chains, which are excreted as glucuronide con-jugates (10). The biliary metabolites have not been clearly identified but areinitially excreted as water-soluble conjugates and become lipid soluble during
P108-129 3/12/05 17:04 Page 112
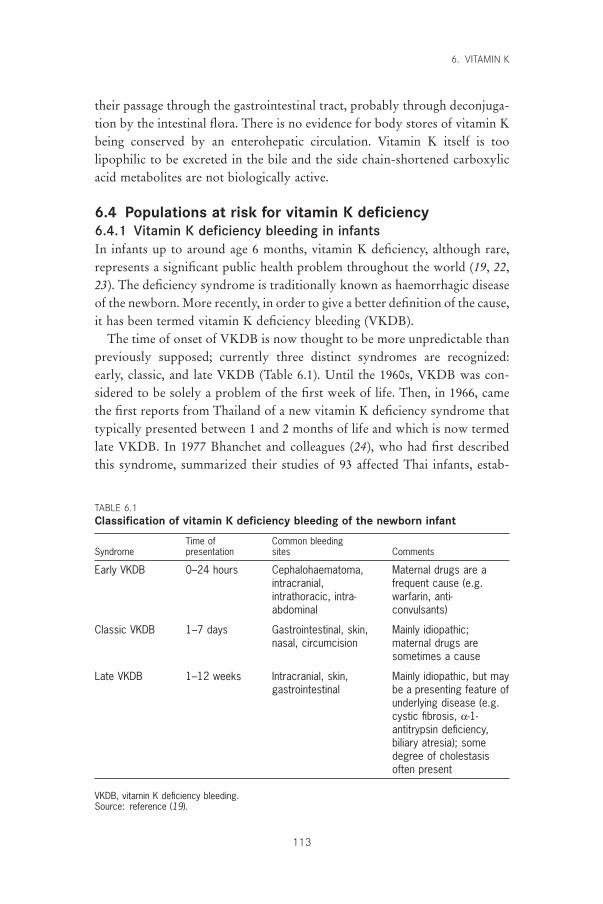
their passage through the gastrointestinal tract, probably through deconjuga-tion by the intestinal flora. There is no evidence for body stores of vitamin Kbeing conserved by an enterohepatic circulation. Vitamin K itself is toolipophilic to be excreted in the bile and the side chain-shortened carboxylicacid metabolites are not biologically active.
6.4 Populations at risk for vitamin K deficiency6.4.1 Vitamin K deficiency bleeding in infantsIn infants up to around age 6 months, vitamin K deficiency, although rare,represents a significant public health problem throughout the world (19, 22,23). The deficiency syndrome is traditionally known as haemorrhagic diseaseof the newborn. More recently, in order to give a better definition of the cause,it has been termed vitamin K deficiency bleeding (VKDB).
The time of onset of VKDB is now thought to be more unpredictable thanpreviously supposed; currently three distinct syndromes are recognized:early, classic, and late VKDB (Table 6.1). Until the 1960s, VKDB was con-sidered to be solely a problem of the first week of life. Then, in 1966, camethe first reports from Thailand of a new vitamin K deficiency syndrome thattypically presented between 1 and 2 months of life and which is now termedlate VKDB. In 1977 Bhanchet and colleagues (24), who had first describedthis syndrome, summarized their studies of 93 affected Thai infants, estab-
6. VITAMIN K
113
TABLE 6.1Classification of vitamin K deficiency bleeding of the newborn infant
Time of Common bleedingSyndrome presentation sites Comments
Early VKDB 0–24 hours Cephalohaematoma, Maternal drugs are aintracranial, frequent cause (e.g.intrathoracic, intra- warfarin, anti-abdominal convulsants)
Classic VKDB 1–7 days Gastrointestinal, skin, Mainly idiopathic;nasal, circumcision maternal drugs are
sometimes a cause
Late VKDB 1–12 weeks Intracranial, skin, Mainly idiopathic, but may gastrointestinal be a presenting feature of
underlying disease (e.g.cystic fibrosis, a-1-antitrypsin deficiency,biliary atresia); somedegree of cholestasisoften present
VKDB, vitamin K deficiency bleeding.Source: reference (19).
P108-129 3/12/05 17:04 Page 113
VITAMIN AND MINERAL REQUIREMENTS IN HUMAN NUTRITION
114
lishing the idiopathic history, preponderance of breast-fed infants (98%), andhigh incidence of intracranial bleeding (63%). More reports from south-eastAsia and Australia followed, and in 1983 McNinch et al. (25) reported thereturn of VKDB in the United Kingdom. This increased incidence wasascribed to a decrease in the practice of vitamin K prophylaxis and to anincreased trend towards exclusive human-milk feeding (25).
Without vitamin K prophylaxis, the incidence of late VKDB (per 100000births), based on acceptable surveillance data, has been estimated to be 4.4 inthe United Kingdom, 7.2 in Germany, and as high as 72 in Thailand (26). Ofreal concern is that late VKDB, unlike the classic form, has a high incidenceof death or severe and permanent brain damage resulting from intracranialhaemorrhage (19, 22, 23).
Epidemiological studies worldwide have identified two major risk factorsfor both classic and late VKDB: exclusive human-milk feeding and the failureto give any vitamin K prophylaxis (19, 22, 23). The increased risk for infantsfed human milk compared with formula milk is probably related to the rela-tively low concentrations of vitamin K (phylloquinone) in breast milk com-pared with formula milks (27–29). For classic VKDB, studies using thedetection of under-carboxylated prothrombin or proteins induced by vitaminK absence (PIVKA-II) as a marker of subclinical vitamin K deficiency havesuggested that it is the low cumulative intake of human milk in the first weekof life rather than an abnormally low milk concentration per se that seems tobe of greater relevance (30, 31). Thus, classic VKDB may be related, at leastin part, to a failure to establish early breast-feeding practices.
For late VKDB other factors seem to be important because the deficiencysyndrome occurs when breastfeeding is well established and mothers ofaffected infants seem to have normal concentrations of vitamin K in their milk(31). For instance, some (although not all) infants who develop late haemor-rhagic disease of the newborn are later found to have abnormalities of liverfunction that may affect their bile acid production and result in a degree ofmalabsorption of vitamin K. The degree of cholestasis may be mild and itscourse may be transient and self-correcting, but affected infants will have anincreased dietary requirement for vitamin K because of reduced absorptionefficiency.
6.4.2 Vitamin K prophylaxis in infantsAs bleeding can occur spontaneously and because no screening test is avail-able, it is now common paediatric practice to protect all infants by givingvitamin K supplements in the immediate perinatal period. Vitamin K pro-
P108-129 3/12/05 17:04 Page 114
phylaxis has had a chequered history but in recent years has become a high-profile issue of public health in many countries throughout the world. Thereasons for this are two-fold. First, there is now a convincing body of evi-dence showing that without vitamin K prophylaxis, infants have a small butreal risk of dying from, or being permanently brain damaged by, vitamin Kdeficiency in the first 6 months of life (19, 22, 23). The other, much less certainevidence stems from a reported epidemiological association between vitaminK given intramuscularly (but not orally) and the later development of child-hood cancer (32). The debate, both scientific and public, which followed thisand other publications has led to an increase in the use of multiple oral sup-plements instead of the traditional single intramuscular injection (usually of1mg phylloquinone) given at birth. Although most of the subsequent epi-demiological studies have not confirmed any cancer link with vitamin K pro-phylaxis, the issue is still not resolved (33, 34).
6.4.3 Vitamin K deficiency in adultsIn adults, primary vitamin K-deficient states that manifest as bleeding arealmost unknown except when the absorption of the vitamin is impaired as aresult of an underlying pathology (1).
6.5 Sources of vitamin K6.5.1 Dietary sourcesHigh-performance liquid chromatography can be used to accurately deter-mine the major dietary form of vitamin K (phylloquinone) in foods, and foodtables are being compiled for Western diets (16, 35, 36). Phylloquinone is dis-tributed ubiquitously throughout the diet, and the range of concentrations indifferent food categories is very wide. In general, the relative values in veg-etables confirm the known association of phylloquinone with photosynthetictissues, with the highest values (normally in the range 400–700mg/100g) beingfound in green leafy vegetables. The next best sources are certain vegetableoils (e.g. soybean, rapeseed, and olive), which contain 50–200mg/100g; othervegetable oils, such as peanut, corn, sunflower, and safflower, however,contain much lower amounts of phylloquinone (1–10mg/100g). The great differences between vegetable oils with respect to vitamin K content obvi-ously present problems for calculating the phylloquinone contents of oil-containing foods when the type of oil is not known.
Menaquinones seem to have a more restricted distribution in the diet thandoes phylloquinone. Menaquinone-rich foods are those with a bacterial fermentation stage. Yeasts, however, do not synthesize menaquinones. In
6. VITAMIN K
115
P108-129 3/12/05 17:04 Page 115
VITAMIN AND MINERAL REQUIREMENTS IN HUMAN NUTRITION
116
the typical diet of developed countries, nutritionally significant amounts oflong-chain menaquinones have been found in animal livers and fermentedfoods such as cheeses. The Japanese food natto (fermented soybeans) has amenaquinone content even higher than the phylloquinone content of greenleafy vegetables.
The relative dietary importance of MK-4 is more difficult to evaluatebecause concentrations in foods may well depend on geographic differencesin the use of menadione in animal husbandry. MK-4 may be synthesized inanimal tissues from menadione supplied in animal feed. Another imponder-able factor is the evidence that animal tissues and dairy produce may containsome MK-4 as a product of tissue synthesis from phylloquinone itself (37).
Knowledge of the vitamin K content of human milk has been the subjectof methodologic controversies with a 10-fold variation in reported values ofphylloquinone concentrations of mature human milk (38). Where milk sam-pling and analytical techniques have met certain criteria for their validity, thephylloquinone content of mature milk has generally ranged between 1 and 4mg/l, with average concentrations near the lower end of this range (28, 29,38). However, there is considerable intra- and intersubject variation, and levelsare higher in colostral milk than in mature milk (28). Menaquinone concen-trations in human milk have not been accurately determined but appear to bemuch lower than those of phylloquinone. Phylloquinone concentrations ininfant formula milk range from 3 to 16mg/l in unsupplemented formulas andup to 100mg/l in fortified formulas (26). Currently most formulas are forti-fied; typical phylloquinone concentrations are about 50mg/l.
6.5.2 Bioavailability of vitamin K from foodsVery little is known about the bioavailability of the K vitamins from differ-ent foods. It has been estimated that the efficiency of absorption of phyllo-quinone from boiled spinach (eaten with butter) is no greater than 10% (39)compared with an estimated 80% when phylloquinone is given in its free form(10, 11). This poor absorption of phylloquinone from green leafy vegetablesmay be explained by its location in chloroplasts and tight association with thethylakoid membrane, where naphthoquinone plays a role in photosynthesis.In comparison, the bioavailability of MK-4 from butter artificially enrichedwith this vitamer was more than two-fold higher than that of phylloquinonefrom spinach (39). The poor extraction of phylloquinone from leafy vegeta-bles, which as a category represents the single greatest food source of phyl-loquinone, may place a different perspective on the relative importance ofother foods with lower concentrations of phylloquinone (e.g. those contain-ing soybean and rapeseed oils) but in which the vitamin is not tightly bound
P108-129 3/12/05 17:04 Page 116
and its bioavailability likely to be greater. Even before bioavailability wastaken into account, fats and oils that are contained in mixed dishes were foundto make an important contribution to the phylloquinone content of theUnited States diet (40) and in a United Kingdom study, contributed 30% ofthe total dietary intake (41).
No data exist on the efficiency of intestinal absorption of dietary long-chainmenaquinones. Because the lipophilic properties of menaquinones are greaterthan those of phylloquinone, it is likely that the efficiency of their absorp-tion, in the free form, is low, as has been suggested by animal studies (18, 21).
6.5.3 Importance of intestinal bacterial synthesis as a source ofvitamin K
Intestinal microflora synthesize large amounts of menaquinones, which arepotentially available as a source of vitamin K (42). Quantitative measurementsat different sites of the human intestine have demonstrated that most of thesemenaquinones are present in the distal colon (42). Major forms produced are MK-10 and MK-11 by Bacteroides, MK-8 by Enterobacter, MK-7 by Veillonella, and MK-6 by Eubacterium lentum. It is noteworthy thatmenaquinones with very long chains (MKs 10–13) are known to be synthe-sized by members of the anaerobic genus Bacteroides, and are found in largeconcentrations in the intestinal tract but have not been detected in significantamounts in foods. The widespread presence of MKs 10–13 in human livers athigh concentrations (14, 15) therefore suggests that these forms, at least, orig-inate from intestinal synthesis (16).
It is commonly held that animals and humans obtain a significant fractionof their vitamin K requirement from direct absorption of menaquinones pro-duced by microfloral synthesis (43), but conclusive experimental evidencedocumenting the site and extent of absorption is singularly lacking (18, 19,23). The most promising site of absorption is the terminal ileum, where thereare some menaquinone-producing bacteria as well as bile salts. However, thebalance of evidence suggests that the bioavailability of bacterial menaquinonesis poor because they are for the most part tightly bound to the bacterial cyto-plasmic membrane and also because the largest pool is present in the colon,which lacks bile salts for their solubilization (19, 23).
6.6 Information relevant to the derivation ofrecommended vitamin K intakes
6.6.1 Assessment of vitamin K statusConventional coagulation assays are useful for detecting overt vitamin K-deficient states, which are associated with a risk of bleeding. However, they
6. VITAMIN K
117
P108-129 3/12/05 17:04 Page 117
VITAMIN AND MINERAL REQUIREMENTS IN HUMAN NUTRITION
118
offer only a relatively insensitive insight into vitamin K nutritional status andthe detection of subclinical vitamin K-deficient states. A more sensitivemeasure of vitamin K sufficiency can be obtained from tests that detect under-carboxylated species of vitamin K-dependent proteins. In states of vitamin Kdeficiency, under-carboxylated species of the vitamin K-dependent coagula-tion proteins are released from the liver into the blood; their levels increasewith the degree of severity of vitamin K deficiency. These under-carboxylatedforms (PIVKA) are unable to participate in the normal coagulation cascadebecause they are unable to bind calcium. The measurement of under-carboxylated prothrombin (PIVKA-II) is the most useful and sensitivehomeostatic marker of subclinical vitamin K deficiency (see also section 6.4.1).Importantly, PIVKA-II is detectable in plasma before any changes occur inconventional coagulation tests. Several types of assay for PIVKA-II have beendeveloped which vary in their sensitivity (44).
In the same way that vitamin K deficiency causes PIVKA-II to be releasedinto the circulation from the liver, a deficit of vitamin K in bone will causethe osteoblasts to secrete under-carboxylated species of osteocalcin (ucOC)into the bloodstream. It has been proposed that the concentration of circulating ucOC reflects the sufficiency of vitamin K for the carboxylationof this Gla protein in bone tissue (7, 45). Most assays for ucOC are indirectin that they rely on the differential absorption of carboxylated and under-carboxylated forms to hydroxyapatite and are thus difficult to interpret (46).
Other criteria of vitamin K sufficiency that have been used are plasma meas-urements of phylloquinone and the measurement of urinary Gla. It isexpected and found that the excretion of urinary Gla is decreased in individ-uals with vitamin K deficiency.
6.6.2 Dietary intakes in infants and their adequacyThe average intake of phylloquinone in infants fed human milk during thefirst 6 months of life has been reported to be less than 1mg/day; this is approx-imately 100-fold lower than the intake in infants fed a typical supplementedformula (29). This large disparity between intakes is reflected in plasma levels(Table 6.2).
Using the detection of PIVKA-II as a marker of subclinical deficiency, astudy from Germany concluded that a minimum daily intake of about 100mlof colostral milk (that supplies about 0.2–0.3mg of phylloquinone) is suffi-cient for normal haemostasis in a baby of about 3kg during the first week oflife (30, 47). Similar conclusions were reached in a Japanese study whichshowed a linear correlation between the prevalence of PIVKA-II and thevolume of breast milk ingested over 3 days (48); 95% of infants with
P108-129 3/12/05 17:04 Page 118
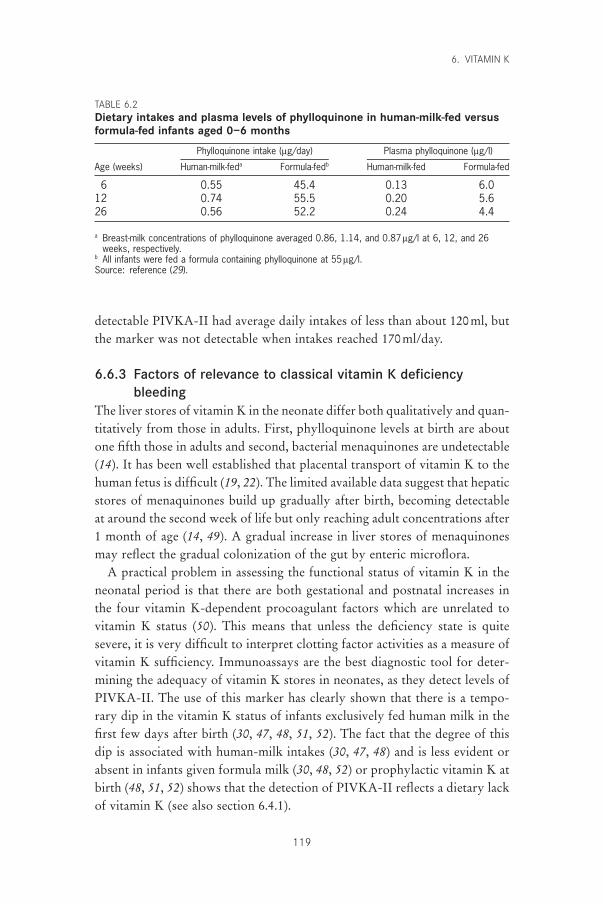
detectable PIVKA-II had average daily intakes of less than about 120ml, butthe marker was not detectable when intakes reached 170ml/day.
6.6.3 Factors of relevance to classical vitamin K deficiencybleeding
The liver stores of vitamin K in the neonate differ both qualitatively and quan-titatively from those in adults. First, phylloquinone levels at birth are aboutone fifth those in adults and second, bacterial menaquinones are undetectable(14). It has been well established that placental transport of vitamin K to thehuman fetus is difficult (19, 22). The limited available data suggest that hepaticstores of menaquinones build up gradually after birth, becoming detectableat around the second week of life but only reaching adult concentrations after1 month of age (14, 49). A gradual increase in liver stores of menaquinonesmay reflect the gradual colonization of the gut by enteric microflora.
A practical problem in assessing the functional status of vitamin K in theneonatal period is that there are both gestational and postnatal increases inthe four vitamin K-dependent procoagulant factors which are unrelated tovitamin K status (50). This means that unless the deficiency state is quitesevere, it is very difficult to interpret clotting factor activities as a measure ofvitamin K sufficiency. Immunoassays are the best diagnostic tool for deter-mining the adequacy of vitamin K stores in neonates, as they detect levels ofPIVKA-II. The use of this marker has clearly shown that there is a tempo-rary dip in the vitamin K status of infants exclusively fed human milk in thefirst few days after birth (30, 47, 48, 51, 52). The fact that the degree of thisdip is associated with human-milk intakes (30, 47, 48) and is less evident orabsent in infants given formula milk (30, 48, 52) or prophylactic vitamin K atbirth (48, 51, 52) shows that the detection of PIVKA-II reflects a dietary lackof vitamin K (see also section 6.4.1).
6. VITAMIN K
119
TABLE 6.2Dietary intakes and plasma levels of phylloquinone in human-milk-fed versusformula-fed infants aged 0–6 months
Phylloquinone intake (mg/day) Plasma phylloquinone (mg/l)
Age (weeks) Human-milk-feda Formula-fedb Human-milk-fed Formula-fed
6 0.55 45.4 0.13 6.012 0.74 55.5 0.20 5.626 0.56 52.2 0.24 4.4
a Breast-milk concentrations of phylloquinone averaged 0.86, 1.14, and 0.87 mg/l at 6, 12, and 26weeks, respectively.
b All infants were fed a formula containing phylloquinone at 55 mg/l.Source: reference (29).
P108-129 3/12/05 17:04 Page 119
VITAMIN AND MINERAL REQUIREMENTS IN HUMAN NUTRITION
120
6.6.4 Factors of relevance to late vitamin K deficiency bleedingThe natural tendency for human-milk-fed infants to develop a subclinicalvitamin K deficiency in the first 2–3 days of life is self-limiting. Comparisonsbetween untreated human-milk-fed infants and those who had receivedvitamin K or supplementary feeds clearly suggest that improvement invitamin K-dependent clotting activity is due to an improved vitamin K status.After the first week, vitamin K-dependent clotting activity increases are moregradual, and it is not possible to differentiate—from clotting factor assays—between the natural postnatal increase in the synthesis of the core proteinsand the increase achieved through an improved vitamin K status.
Use of the most sensitive assays for PIVKA-II show that there is still evi-dence of suboptimal vitamin K status in infants solely fed human milkbetween the ages of 1 and 2 months (52, 53). Deficiency signs are less commonin infants who have received adequate vitamin K supplementation (52, 53) orwho have been formula fed (52).
6.6.5 Dietary intakes in older infants, children, and adults andtheir adequacy
The only comprehensive national survey of phylloquinone intakes across allage groups (except infants aged 0–6 months) is that of the United States Foodand Drug Administration Total Diet Study, which was based on the 1987–88Nationwide Food Consumption Survey (40). For infants and children fromthe age of 6 months to 16 years, average phylloquinone intakes were abovethe current United States recommended dietary allowance (RDA) values fortheir respective age groups, more so for children up to 10 years than from 10to 16 years (Table 6.3) (40). No studies have been conducted that assess func-tional markers of vitamin K sufficiency in children.
Intakes for adults in the Total Diet Study (Table 6.3) were also close to orslightly higher than the current United States RDA values of 80mg for menand 65mg for women, although intakes were slightly lower than the RDA inthe 25–30-years age group (54). There is some evidence from an evaluation ofall the United States studies that older adults have higher dietary intakes ofphylloquinone than do younger adults (55).
The results from the United States are very similar to a detailed, seasonal-ity study conducted in the United Kingdom in which mean intakes in menand women (aged 22–54 years) were 72 and 64mg/day, respectively; no sig-nificant sex or seasonal variations were found (56). Another United Kingdomstudy suggested that intakes were lower in people who work as manuallabourers and in smokers, reflecting the lower intakes of green vegetables andhigh-phylloquinone content vegetable oil in these groups (57).
P108-129 3/12/05 17:04 Page 120
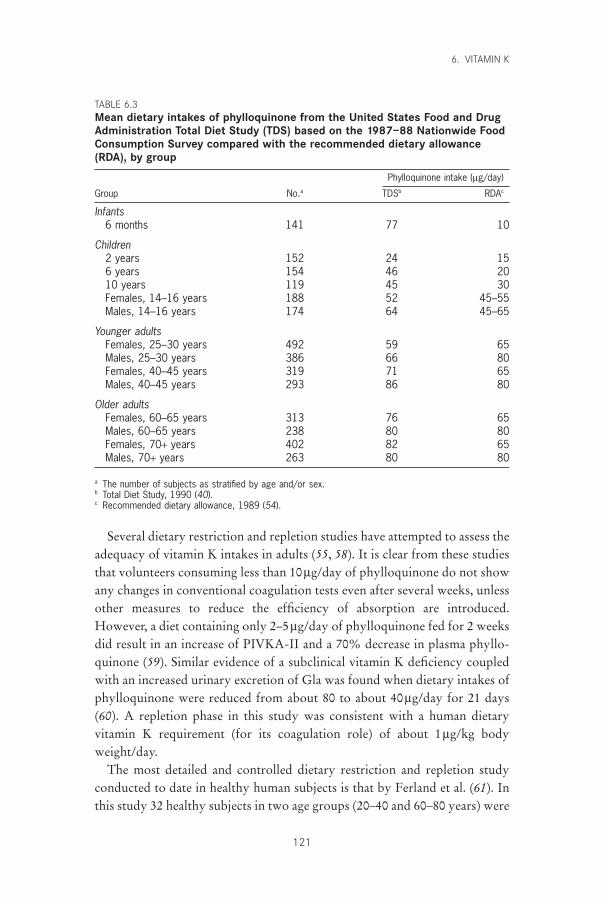
Several dietary restriction and repletion studies have attempted to assess theadequacy of vitamin K intakes in adults (55, 58). It is clear from these studiesthat volunteers consuming less than 10mg/day of phylloquinone do not showany changes in conventional coagulation tests even after several weeks, unlessother measures to reduce the efficiency of absorption are introduced.However, a diet containing only 2–5mg/day of phylloquinone fed for 2 weeksdid result in an increase of PIVKA-II and a 70% decrease in plasma phyllo-quinone (59). Similar evidence of a subclinical vitamin K deficiency coupledwith an increased urinary excretion of Gla was found when dietary intakes ofphylloquinone were reduced from about 80 to about 40mg/day for 21 days(60). A repletion phase in this study was consistent with a human dietaryvitamin K requirement (for its coagulation role) of about 1mg/kg bodyweight/day.
The most detailed and controlled dietary restriction and repletion studyconducted to date in healthy human subjects is that by Ferland et al. (61). Inthis study 32 healthy subjects in two age groups (20–40 and 60–80 years) were
6. VITAMIN K
121
TABLE 6.3Mean dietary intakes of phylloquinone from the United States Food and DrugAdministration Total Diet Study (TDS) based on the 1987–88 Nationwide FoodConsumption Survey compared with the recommended dietary allowance(RDA), by group
Phylloquinone intake (mg/day)
Group No.a TDSb RDAc
Infants6 months 141 77 10
Children2 years 152 24 156 years 154 46 2010 years 119 45 30Females, 14–16 years 188 52 45–55Males, 14–16 years 174 64 45–65
Younger adultsFemales, 25–30 years 492 59 65Males, 25–30 years 386 66 80Females, 40–45 years 319 71 65Males, 40–45 years 293 86 80
Older adultsFemales, 60–65 years 313 76 65Males, 60–65 years 238 80 80Females, 70+ years 402 82 65Males, 70+ years 263 80 80
a The number of subjects as stratified by age and/or sex.b Total Diet Study, 1990 (40).c Recommended dietary allowance, 1989 (54).
P108-129 3/12/05 17:04 Page 121
VITAMIN AND MINERAL REQUIREMENTS IN HUMAN NUTRITION
122
fed a mixed diet containing about 80mg/day of phylloquinone, which is theRDA for adult males in the United States (54). After 4 days on this baselinediet there was a 13-day depletion period during which the subjects were feda diet containing about 10mg/day. After this depletion phase the subjectsentered a 16-day repletion period during which, over 4-day intervals, theywere sequentially repleted with 5, 15, 25, and 45mg of phylloquinone. Thedepletion protocol had no effect on conventional coagulation and specificfactor assays but did induce a significant increase in PIVKA-II in both agegroups. The most dramatic change was in plasma levels of phylloquinone,which fell to about 15% of the values determined on day 1. The drop inplasma phylloquinone also suggested that the average dietary intake of theseparticular individuals before they entered the study had been greater than thebaseline diet of 80mg/day. The repletion protocol failed to bring the plasmaphylloquinone levels of the young subjects back above the lower limit of thenormal range (previously established in healthy adults) and the plasma levelsin the elderly group rose only slightly above this lower limit in the last 4 days.Another indication of a reduced vitamin K status in the young group was thefall in urinary output of Gla (to 90% of baseline) that was not seen in theelderly group; this suggested that the younger subjects were more suscepti-ble to the effects of an acute deficiency than were the older subjects.
One important dietary intervention study measured the carboxylationstatus of the bone vitamin K-dependent protein, osteocalcin, in response toaltered dietary intakes of phylloquinone (62). This was a crossover studywhich evaluated the effect in young adults of increasing the dietary intake of phylloquinone to 420mg/day for 5 days from a baseline intake of 100mg/day. Although total concentrations of osteocalcin were not affected,ucOC fell dramatically in response to the 420mg diet and by the end of the5-day supplementation period was 41% lower than the baseline value. Afterthe return to the mixed diet, the ucOC percentage rose significantly but after5 days had not returned to pre-supplementation values. This study suggeststhat the carboxylation of osteocalcin in bone might require higher dietaryintakes of vitamin K than those needed to sustain its haemostatic function.
6.7 Recommendations for vitamin K intakes6.7.1 Infants 0–6 monthsConsideration of the requirements of vitamin K for infants up to age 6 monthsis complicated by the need to prevent a rare but potentially devastating bleed-ing disorder which is caused by vitamin K deficiency. To protect the fewaffected infants, most developed and some developing countries have insti-tuted a blanket prophylactic policy to protect infants at risk, a policy that is
P108-129 3/12/05 17:04 Page 122
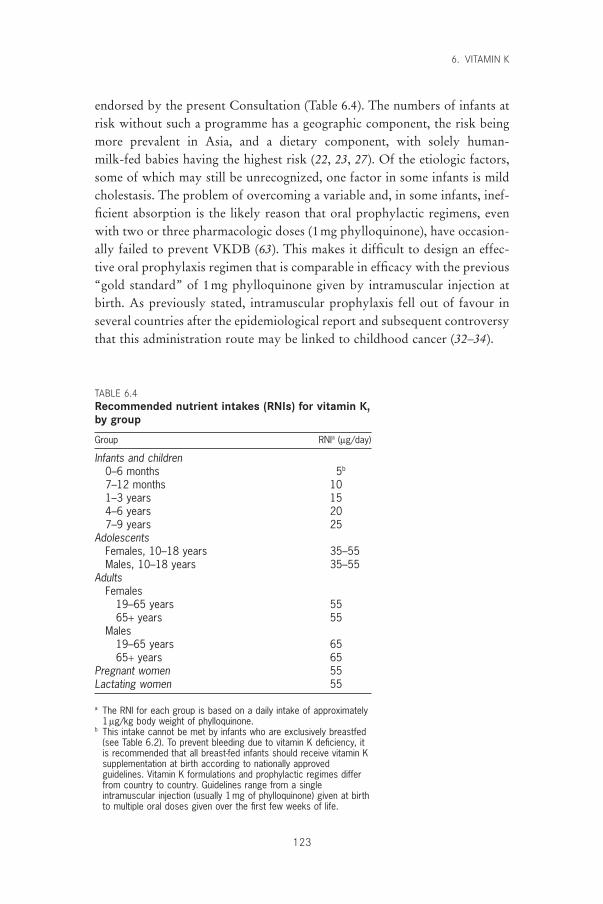
endorsed by the present Consultation (Table 6.4). The numbers of infants atrisk without such a programme has a geographic component, the risk beingmore prevalent in Asia, and a dietary component, with solely human-milk-fed babies having the highest risk (22, 23, 27). Of the etiologic factors,some of which may still be unrecognized, one factor in some infants is mildcholestasis. The problem of overcoming a variable and, in some infants, inef-ficient absorption is the likely reason that oral prophylactic regimens, evenwith two or three pharmacologic doses (1mg phylloquinone), have occasion-ally failed to prevent VKDB (63). This makes it difficult to design an effec-tive oral prophylaxis regimen that is comparable in efficacy with the previous“gold standard” of 1mg phylloquinone given by intramuscular injection atbirth. As previously stated, intramuscular prophylaxis fell out of favour inseveral countries after the epidemiological report and subsequent controversythat this administration route may be linked to childhood cancer (32–34).
6. VITAMIN K
123
TABLE 6.4Recommended nutrient intakes (RNIs) for vitamin K,by group
Group RNIa (mg/day)
Infants and children0–6 months 5b
7–12 months 101–3 years 154–6 years 207–9 years 25
AdolescentsFemales, 10–18 years 35–55Males, 10–18 years 35–55
AdultsFemales
19–65 years 5565+ years 55
Males19–65 years 6565+ years 65
Pregnant women 55Lactating women 55
a The RNI for each group is based on a daily intake of approximately1 mg/kg body weight of phylloquinone.
b This intake cannot be met by infants who are exclusively breastfed(see Table 6.2). To prevent bleeding due to vitamin K deficiency, itis recommended that all breast-fed infants should receive vitamin Ksupplementation at birth according to nationally approvedguidelines. Vitamin K formulations and prophylactic regimes differfrom country to country. Guidelines range from a singleintramuscular injection (usually 1mg of phylloquinone) given at birthto multiple oral doses given over the first few weeks of life.
P108-129 3/12/05 17:04 Page 123
VITAMIN AND MINERAL REQUIREMENTS IN HUMAN NUTRITION
124
Infants who have been entirely fed with supplemented formulas are wellprotected against VKDB and on intakes of around 50mg/day have plasmalevels that are about 10-fold higher than the adult average of about 1.0nmol/l(0.5mg/l) (29) (Table 6.2). Clearly then, an optimal intake would lie below anintake of 50mg/day. Cornelissen et al. (64) evaluated the effectiveness of givinginfants a daily supplement of 25mg phylloquinone after they had received asingle oral dose of 1mg at birth. This regimen resulted in median plasma levelsat ages 4, 8, and 12 weeks of around 2.2nmol/l (1.0mg/l) when sampled 20–28hours after the most recent vitamin K dose; this level corresponds to the upperend of the adult fasting range. In 12-week-old infants supplemented with thisregime, the median plasma level was about four-fold higher than that in acontrol group of unsupplemented infants (1.9 versus 0.5nmol/l). Also noneof the 50 supplemented infants had detectable PIVKA-II at 12 weeks com-pared with 15 of 131 infants (11.5%) in the control group. This regime hasnow been implemented in the Netherlands and surveillance data on lateVKDB suggest that it may be as effective as parenteral vitamin K prophylaxis(63).
The fact that VKDB is epidemiologically associated with breastfeedingmeans that it is not prudent to base requirements solely on normal intakes ofhuman milk and justifies the setting of a higher value that can only be met bysome form of supplementation. The current United States RDA for infants is5mg/day for the first 6 months (the greatest period of risk for VKDB) and 10mg/day during the second 6 months (54). These intakes are based on theadult RDA of 1mg/kg body weight/day. However, if the vitamin K contentof human milk is assumed to be about 2mg/l, exclusively breast-fed infantsaged 0–6 months may ingest only 20% of their presumed daily requirementof 5mg (54). Whether a figure of 5mg/day is itself safe is uncertain. In theUnited Kingdom the dietary reference value for infants is set at 10mg/day,which in relation to body weight (2mg/kg) is about double the estimate foradults (65). It was set with reference to the upper end of possible human milkconcentrations plus a further qualitative addition to allow for the absence ofhepatic menaquinones in early life and the presumed reliance on dietaryvitamin K alone.
The association of VKDB with breastfeeding does not mean that mostinfants are at risk of developing VKDB, as this is a rare vitamin K deficiencysyndrome. In contrast to measurements of PIVKA-II levels, comparisons ofvitamin K-dependent clotting activities have shown no detectable differencesbetween infants fed human milk and those fed artifical formula. The detec-tion of PIVKA-II with normal functional levels of vitamin K-dependent
P108-129 3/12/05 17:04 Page 124
coagulation factors does not imply immediate or even future haemorrhagicrisk for a particular individual. The major value of PIVKA-II measurementsin infants is to assess the prevalence of suboptimal vitamin K status in popu-lation studies. However, because of the potential consequences of VKDB, thepaediatric profession of most countries agrees that some form of vitamin Ksupplementation is necessary even though there are widespread differences inactual practice.
6.7.2 Infants (7–12 months), children, and adultsIn the past, the requirements for vitamin K have only considered its classicalfunction in coagulation; an RDA has been given for vitamin K in the UnitedStates (54, 58) and a safe and adequate intake level given in the United Kingdom(65). In both countries the adult RDA or adequate intake have been set at avalue of 1mg/kg body weight/day. Thus, in the United States the RDA for a79-kg man is listed as 80mg/day and for a 63-kg woman as 65mg/day (54).
At the time previous recommendations were set there were few data ondietary intakes of vitamin K (mainly phylloquinone) in different populations.The development of more accurate and wide-ranging food databases is nowhelping to redress this information gap. The results of several dietary intakestudies carried out in the United States and the United Kingdom suggest thatthe average intakes for adults are very close to the respective recommenda-tions of each country. In the United States, preliminary intake data alsosuggest that average intakes of phylloquinone in children and adolescentsexceed the RDA; in 6-month-old infants the intakes exceeded the RDA of 10mg by nearly eight-fold (40), reflecting the use of supplemented formulafoods. Because there is no evidence of even subclinical deficiencies of haemo-static function, a daily intake of 1mg/kg may still be used as the basis for therecommended nutrient intake (RNI). There is no basis as yet for making dif-ferent recommendations for pregnant and lactating women (Table 6.4).
The question remains whether the RNI should be raised to take intoaccount recent evidence that the requirements for the optimal carboxylationof vitamin K-dependent proteins in other tissues are greater than those forcoagulation. There is certainly evidence that the g-carboxylation of osteocal-cin can be improved by intakes somewhere between 100 and 420mg/day (62).If an RNI for vitamin K sufficiency is to be defined as that amount necessaryfor the optimal carboxylation of all vitamin K-dependent proteins, includingosteocalcin, then it seems clear that this RNI would lie somewhere above thecurrent intakes of many, if not most, of the population in the United Statesand the United Kingdom. However, because a clearly defined metabolic role
6. VITAMIN K
125
P108-129 3/12/05 17:04 Page 125
VITAMIN AND MINERAL REQUIREMENTS IN HUMAN NUTRITION
126
and biochemical proof of the necessity for fully g-carboxylated osteocalcinfor bone health is currently lacking, it would be unwise to make such a recommendation at this time.
6.8 ToxicityWhen taken orally, natural K vitamins seem free of toxic side effects. Thisapparent safety is bourne out by the common clinical administration of phyl-loquinone at doses of 10–20mg or greater. Some patients with chronic fat mal-absorption regularly ingest doses of this size without evidence of any harm.However, synthetic preparations of menadione or its salts are best avoided fornutritional purposes, especially for vitamin prophylaxis in neonates. Besideslacking intrinsic biological activity, the high reactivity of its unsubstituted 3-position has been associated with neonatal haemolysis and liver damage.
6.9 Recommendations for future researchThe following are recommended areas for future research:
• prevalence, causes, and prevention of VKDB in infants in different popu-lation groups;
• bioavailability of dietary phylloquinone (and menaquinones) from foodsand menaquinones from intestinal flora;
• significance of menaquinones to human requirements for vitamin K;• the physiological roles of vitamin K-dependent proteins in functions other
than coagulation;• the significance of under-carboxylated vitamin K-dependent proteins and
suboptimal vitamin K status to bone and cardiovascular health.
References1. Suttie JW. Vitamin K. In: Diplock AD, ed. Fat-soluble vitamins: their bio-
chemistry and applications. London, Heinemann, 1985:225–311.2. Furie B, Furie BC. Molecular basis of vitamin K-dependent g-carboxylation.
Blood, 1990, 75:1753–1762.3. Davie EW. Biochemical and molecular aspects of the coagulation cascade.
Thrombosis and Haemostasis, 1995, 74:1–6.4. Vermeer C. g-Carboxyglutamate-containing proteins and the vitamin K-
dependent carboxylase. Biochemical Journal, 1990, 266:625–636.5. Ferland G. The vitamin K-dependent proteins: an update. Nutrition Reviews,
1998, 56:223–230.6. Luo G et al. Spontaneous calcification of arteries and cartilage in mice lacking
matrix Gla protein. Nature, 1997, 386:78–81.7. Vermeer C, Jie K-S, Knapen MHJ. Role of vitamin K in bone metabolism.
Annual Review of Nutrition, 1995, 15:1–22.8. Binkley NC, Suttie JW. Vitamin K nutrition and osteoporosis. Journal of
Nutrition, 1995, 125:1812–1821.
P108-129 3/12/05 17:04 Page 126
9. Shearer MJ. The roles of vitamins D and K in bone health and osteoporosisprevention. Proceedings of the Nutrition Society, 1997, 56:915–937.
10. Shearer MJ, McBurney A, Barkhan P. Studies on the absorption and metabo-lism of phylloquinone (vitamin K1) in man. Vitamins and Hormones, 1974,32:513–542.
11. Shearer MJ, Barkhan P, Webster GR. Absorption and excretion of an oral dose of tritiated vitamin K1 in man. British Journal of Haematology, 1970,18:297–308.
12. Blomstrand R, Forsgren L. Vitamin K1-3H in man: its intestinal absorptionand transport in the thoracic duct lymph. Internationale Zeitschrift für Vita-minsforschung, 1968, 38:45–64.
13. Kohlmeier M et al. Transport of vitamin K to bone in humans. Journal ofNutrition, 1996, 126(Suppl.):S1192–S1196.
14. Shearer MJ et al. The assessment of human vitamin K status from tissue meas-urements. In: Suttie JW, ed. Current advances in vitamin K research. NewYork, NY, Elsevier, 1988:437–452.
15. Usui Y et al. Vitamin K concentrations in the plasma and liver of surgicalpatients. American Journal of Clinical Nutrition, 1990, 51:846–852.
16. Shearer MJ, Bach A, Kohlmeier M. Chemistry, nutritional sources, tissue dis-tribution and metabolism of vitamin K with special reference to bone health.Journal of Nutrition, 1996, 126(Suppl.): S1181–S1186.
17. Hodges SJ et al. Detection and measurement of vitamins K1 and K2 in humancortical and trabecular bone. Journal of Bone and Mineral Research, 1993,8:1005–1008.
18. Suttie JW. The importance of menaquinones in human nutrition. AnnualReview of Nutrition, 1995, 15:399–417.
19. Shearer MJ. Vitamin K metabolism and nutriture. Blood Reviews, 1992, 6:92–104.20. Groenen-van Dooren MMCL et al. Bioavailability of phylloquinone and
menaquinones after oral and colorectal administration in vitamin K-deficientrats. Biochemical Pharmacology, 1995, 50:797–801.
21. Will BH, Suttie JW. Comparative metabolism of phylloquinone andmenaquinone-9 in rat liver. Journal of Nutrition, 1992, 122:953–958.
22. Lane PA, Hathaway WE. Vitamin K in infancy. Journal of Pediatrics, 1985,106:351–359.
23. Shearer MJ. Fat-soluble vitamins: vitamin K. Lancet, 1995, 345:229–234.24. Bhanchet P et al. A bleeding syndrome in infants due to acquired prothrom-
bin complex deficiency: a survey of 93 affected infants. Clinical Pediatrics,1977, 16:992–998.
25. McNinch AW, Orme RL, Tripp JH. Haemorrhagic disease of the newbornreturns. Lancet, 1983, 1:1089–1090.
26. von Kries R, Hanawa Y. Neonatal vitamin K prophylaxis. Report of the Scientific and Standardization Subcommittee on Perinatal Haemostasis.Thrombosis and Haemostasis, 1993, 69:293–295.
27. Haroon Y et al. The content of phylloquinone (vitamin K1) in human milk,cows’ milk and infant formula foods determined by high-performance liquidchromatography. Journal of Nutrition, 1982, 112:1105–1117.
28. von Kries R et al. Vitamin K1 content of maternal milk: influence of the stageof lactation, lipid composition, and vitamin K1 supplements given to themother. Pediatric Research, 1987, 22:513–517.
29. Greer FR et al. Vitamin K status of lactating mothers, human milk and breast-feeding infants. Pediatrics, 1991, 88:751–756.
6. VITAMIN K
127
P108-129 3/12/05 17:04 Page 127
VITAMIN AND MINERAL REQUIREMENTS IN HUMAN NUTRITION
128
30. von Kries R, Becker A, Göbel U. Vitamin K in the newborn: influence ofnutritional factors on acarboxy-prothrombin detectability and factor II andVII clotting activity. European Journal of Pediatrics, 1987, 146:123–127.
31. von Kries R, Shearer MJ, Göbel U. Vitamin K in infancy. European Journalof Pediatrics, 1988, 147:106–112.
32. Golding J et al. Childhood cancer, intramuscular vitamin K, and pethidinegiven during labour. British Medical Journal, 1992, 305:341–346.
33. Draper G, McNinch A. Vitamin K for neonates: the controversy. BritishMedical Journal, 1994, 308:867–868.
34. von Kries R. Neonatal vitamin K prophylaxis: the Gordian knot still awaitsuntying. British Medical Journal, 1998, 316:161–162.
35. Booth SL, Davidson KW, Sadowski JA. Evaluation of an HPLC method forthe determination of phylloquinone (vitamin K1) in various food matrices.Journal of Agricultural and Food Chemistry, 1994, 42:295–300.
36. Booth SL et al. Vitamin K1 (phylloquinone) content of foods: a provisionaltable. Journal of Food Composition and Analysis, 1993, 6:109–120.
37. Thijssen HHW, Drittij-Reijnders MJ. Vitamin K distribution in rat tissues:dietary phylloquinone is a source of tissue menaquinone-4. British Journal ofNutrition, 1994, 72:415–425.
38. Canfield LM, Hopkinson JM. State of the art vitamin K in human milk.Journal of Pediatric Gastroenterology and Nutrition, 1989, 8:430–441.
39. Gijsbers BLMG, Jie K-SG, Vermeer C. Effect of food composition on vitaminK absorption in human volunteers. British Journal of Nutrition, 1996,76:223–229.
40. Booth SL, Pennington JAT, Sadowski JA. Food sources and dietary intakes of vitamin K-1 (phylloquinone) in the American diet: data from the FDA Total Diet Study. Journal of the American Dietetic Association, 1996,96:149–154.
41. Fenton ST et al. Nutrient sources of phylloquinone (vitamin K1) in Scottishmen and women [abstract]. Proceedings of the Nutrition Society, 1997, 56:301.
42. Conly JM, Stein K. Quantitative and qualitative measurements of K vitaminsin human intestinal contents. American Journal of Gastroenterology, 1992,87:311–316.
43. Davidson S, Passmore R, Eastwood MA. Davidson and Passmore humannutrition and dietetics, 8th ed. Edinburgh, Churchill Livingstone, 1986.
44. Widdershoven J et al. Four methods compared for measuring des-carboxy-prothrombin (PIVKA-II). Clinical Chemistry, 1987, 33:2074–2078.
45. Vermeer C, Hamulyák K. Pathophysiology of vitamin K-deficiency and oralanticoagulants. Thrombosis and Haemostasis, 1991, 66:153–159.
46. Gundberg CM et al. Vitamin K status and bone health: an analysis of methodsfor determination of undercarboxylated osteocalcin. Journal of ClinicalEndocrinology and Metabolism, 1998, 83: 258–266.
47. von Kries R et al. Vitamin K deficiency and vitamin K intakes in infants. In: Suttie JW, ed. Current advances in vitamin K research. New York, NY,Elsevier, 1988:515–523.
48. Motohara K et al. Relationship of milk intake and vitamin K supplementationto vitamin K status in newborns. Pediatrics, 1989, 84:90–93.
49. Kayata S et al. Vitamin K1 and K2 in infant human liver. Journal of PediatricGastroenterology and Nutrition, 1989, 8:304–307.
50. McDonald MM, Hathaway WE. Neonatal hemorrhage and thrombosis. Sem-inars in Perinatology, 1983, 7:213–225.
P108-129 3/12/05 17:04 Page 128
51. Motohara K, Endo F, Matsuda I. Effect of vitamin K administration oncarboxy-prothrombin (PIVKA-II) levels in newborns. Lancet, 1985,2:242–244.
52. Widdershoven J et al. Plasma concentrations of vitamin K1 and PIVKA-II inbottle-fed and breast-fed infants with and without vitamin K prophylaxis atbirth. European Journal of Pediatrics, 1988, 148:139–142.
53. Motohara K, Endo F, Matsuda I. Vitamin K deficiency in breast-fed infants atone month of age. Journal of Pediatric Gastroenterology and Nutrition, 1986,5:931–933.
54. Subcommittee on the Tenth Edition of the Recommended Dietary Allowances,Food and Nutrition Board. Recommended dietary allowances, 10th ed. Wash-ington, DC, National Academy Press, 1989.
55. Booth SL, Suttie JW. Dietary intake and adequacy of vitamin K. Journal ofNutrition, 1998, 128:785–788.
56. Price R et al. Daily and seasonal variation in phylloquinone (vitamin K1) intakein Scotland [abstract]. Proceedings of the Nutrition Society, 1996, 55:244.
57. Fenton S et al. Dietary vitamin K (phylloquinone) intake in Scottish men[abstract]. Proceedings of the Nutrition Society, 1994, 53:98.
58. Suttie JW. Vitamin K and human nutrition. Journal of the American DieteticAssociation, 1992, 92:585–590.
59. Allison PM et al. Effects of a vitamin K-deficient diet and antibiotics in normalhuman volunteers. Journal of Laboratory and Clinical Medicine, 1987,110:180–188.
60. Suttie JW et al. Vitamin K deficiency from dietary restriction in humans.American Journal of Clinical Nutrition, 1988, 47:475–480.
61. Ferland G, Sadowski JA, O’Brien ME. Dietary induced subclinical vitamin Kdeficiency in normal human subjects. Journal of Clinical Investigation, 1993,91:1761–1768.
62. Sokoll LJ et al. Changes in serum osteocalcin, plasma phylloquinone, andurinary g-carboxyglutamic acid in response to altered intakes of dietary phyl-loquinone in human subjects. American Journal of Clinical Nutrition, 1997,65:779–784.
63. Cornelissen M et al. Prevention of vitamin K deficiency bleeding: efficacy ofdifferent multiple oral dose schedules of vitamin K. European Journal of Pedi-atrics, 1997, 156:126–130.
64. Cornelissen EAM et al. Evaluation of a daily dose of 25 mg vitamin K1 toprevent vitamin K deficiency in breast-fed infants. Journal of Pediatric Gas-troenterology and Nutrition, 1993, 16:301–305.
65. Department of Health. Dietary reference values for food energy and nutrientsfor the United Kingdom. London, Her Majesty’s Stationery Office, 1991(Report on Health and Social Subjects No. 41).
6. VITAMIN K
129
P108-129 3/12/05 17:04 Page 129
130
7. Vitamin C
7.1 IntroductionVitamin C (chemical names: ascorbic acid and ascorbate) is a six-carbonlactone which is synthesized from glucose by many animals. Vitamin C is syn-thesized in the liver in some mammals and in the kidney in birds and reptiles.However, several species—including humans, non-human primates, guineapigs, Indian fruit bats, and Nepalese red-vented bulbuls—are unable to syn-thesize vitamin C. When there is insufficient vitamin C in the diet, humanssuffer from the potentially lethal deficiency disease scurvy (1). Humans andprimates lack the terminal enzyme in the biosynthetic pathway of ascorbicacid, l-gulonolactone oxidase, because the gene encoding for the enzyme hasundergone substantial mutation so that no protein is produced (2).
7.2 Role of vitamin C in human metabolic processes7.2.1 Background biochemistryVitamin C is an electron donor (reducing agent or antioxidant), and proba-bly all of its biochemical and molecular roles can be accounted for by thisfunction. The potentially protective role of vitamin C as an antioxidant is discussed in the antioxidants chapter of this report (see Chapter 8).
7.2.2 Enzymatic functionsVitamin C acts as an electron donor for 11 enzymes (3, 4). Three of thoseenzymes are found in fungi but not in humans or other mammals (5, 6) andare involved in reutilization pathways for pyrimidines and the deoxyribosemoiety of deoxynucleosides. Of the eight remaining human enzymes, threeparticipate in collagen hydroxylation (7–9) and two in carnitine biosynthesis(10, 11); of the three enzymes which participate in collagen hydroxylation,one is necessary for biosynthesis of the catecholamine norepinephrine (12,13), one is necessary for amidation of peptide hormones (14, 15), and one isinvolved in tyrosine metabolism (4, 16).
Ascorbate interacts with enzymes having either monooxygenase or dioxy-genase activity. The monooxygenases, dopamine b-monooxygenase and
P130-144 3/12/05 17:05 Page 130
peptidyl-glycine a-monooxygenase, incorporate a single oxygen atom into asubstrate, either a dopamine or a glycine-terminating peptide. The dioxyge-nases incorporate two oxygen atoms in two different ways: the enzyme 4-hydroxyphenylpyruvate dioxygenase incorporates two oxygen atoms intoone product; the other dioxygenase incorporates one oxygen atom into suc-cinate and one into the enzyme-specific substrate.
7.2.3 Miscellaneous functionsConcentrations of vitamin C appear to be high in gastric juice. Schorah et al.(17) found that the concentrations of vitamin C in gastric juice were several-fold higher (median, 249mmol/l; range, 43–909mmol/l) than those found in theplasma of the same normal subjects (median, 39mmol/l; range, 14–101mmol/l).Gastric juice vitamin C may prevent the formation of N-nitroso compounds,which are potentially mutagenic (18). High intakes of vitamin C correlate withreduced gastric cancer risk (19), but a cause-and-effect relationship has notbeen established. Vitamin C protects low-density lipoproteins ex vivo againstoxidation and may function similarly in the blood (20) (see Chapter 8).
A common feature of vitamin C deficiency is anaemia. The antioxidantproperties of vitamin C may stabilize folate in food and in plasma; increasedexcretion of oxidized folate derivatives in humans with scurvy has beenreported (21). Vitamin C promotes absorption of soluble non-haem iron pos-sibly by chelation or simply by maintaining the iron in the reduced (ferrous,Fe2+) form (22, 23). The effect can be achieved with the amounts of vitaminC obtained in foods. However, the amount of dietary vitamin C required toincrease iron absorption ranges from 25mg upwards and depends largely onthe amount of inhibitors, such as phytates and polyphenols, present in themeal (24). (See Chapter 13 for further discussion.)
7.3 Consequences of vitamin C deficiencyFrom the 15th century, scurvy was dreaded by seamen and explorers forcedto subsist for months on diets of dried beef and biscuits. Scurvy was describedby the Crusaders during the sieges of numerous European cities, and was alsoa result of the famine in 19th century Ireland. Three important manifestationsof scurvy—gingival changes, pain in the extremities, and haemorrhagic man-ifestations—precede oedema, ulcerations, and ultimately death. Skeletal andvascular lesions related to scurvy probably arise from a failure of osteoid formation. In infantile scurvy the changes are mainly at the sites of most active bone growth; characteristic signs are a pseudoparalysis of the limbscaused by extreme pain on movement and caused by haemorrhages under theperiosteum, as well as swelling and haemorrhages of the gums surrounding
7. VITAMIN C
131
P130-144 3/12/05 17:05 Page 131
VITAMIN AND MINERAL REQUIREMENTS IN HUMAN NUTRITION
132
erupting teeth (25). In adults, one of the early principle adverse effects of thecollagen-related pathology may be impaired wound healing (26).
Vitamin C deficiency can be detected from early signs of clinical deficiency,such as the follicular hyperkeratosis, petechial haemorrhages, swollen orbleeding gums, and joint pain, or from the very low concentrations of ascor-bate in plasma, blood, or leukocytes. The Sheffield studies (26, 27) and thelater studies in Iowa (28, 29) were the first major attempts to quantify vitaminC requirements. The studies indicated that the amount of vitamin C requiredto prevent or cure early signs of deficiency is between 6.5 and 10mg/day. Thisrange represents the lowest physiological requirement. The Iowa studies (28,29) and Kallner et al. (30) established that at tissue saturation, whole-bodyvitamin C content is approximately 20mg/kg, or 1500mg, and that duringdepletion vitamin C is lost at a rate of 3% of whole-body content per day.
Clinical signs of scurvy appear in men at intakes lower than 10mg/day (27)or when the whole-body content falls below 300mg (28). Such intakes areassociated with plasma ascorbate concentrations below 11mmol/l or leuko-cyte levels less than 2nmol/108 cells. However, plasma concentrations fall toaround 11mmol/l even when dietary vitamin C is between 10 and 20mg/day.At intakes greater than 25–35mg/day, plasma concentrations start to risesteeply, indicating a greater availability of vitamin C for metabolic needs. Ingeneral, plasma ascorbate closely reflects the dietary intake and rangesbetween 20 and 80mmol/l. During infection or physical trauma, the numberof circulating leukocytes increases and these take up vitamin C from theplasma (31, 32). Therefore, both plasma and leukocyte levels may not be veryprecise indicators of body content or status at such times. However, leuko-cyte ascorbate remains a better indicator of vitamin C status than plasmaascorbate most of the time and only in the period immediately after the onsetof an infection are both values unreliable.
Intestinal absorption of vitamin C is by an active, sodium-dependent,energy-requiring, carrier-mediated transport mechanism (33) and as intakeincreases, the tissues become progressively more saturated. The physiologi-cally efficient, renal-tubular reabsorption mechanism retains vitamin C in the tissues up to a whole-body content of ascorbate of about 20mg/kg body weight (30). However, under steady-state conditions, as intake rises from around 100mg/day there is an increase in urinary output so that at 1000mg/day almost all absorbed vitamin C is excreted (34, 35).
7.4 Populations at risk for vitamin C deficiencyThe populations at risk of vitamin C deficiency are those for whom the fruitand vegetable supply is minimal. Epidemics of scurvy are associated with
P130-144 3/12/05 17:05 Page 132
7. VITAMIN C
133
famine and war, when people are forced to become refugees and food supplyis small and irregular. Persons in whom the total body vitamin C content issaturated (i.e. 20mg/kg body weight) can subsist without vitamin C forapproximately 2 months before the appearance of clinical signs, and as littleas 6.5–10mg/day of vitamin C will prevent the appearance of scurvy. Ingeneral, vitamin C status will reflect the regularity of fruit and vegetable con-sumption; however, socioeconomic conditions are also factors as intake isdetermined not just by availability of food, but by cultural preferences and cost.
In Europe and the United States an adequate intake of vitamin C is indicated by the results of various national surveys (36–38). In Germany andthe United Kingdom, the mean dietary intakes of vitamin C in adult men andwomen were 75 and 72mg/day (36), and 87 and 76mg/day (37), respectively.In addition, a recent survey of elderly men and women in the UnitedKingdom reported vitamin C intakes of 72 (SD, 61) and 68 (SD, 60)mg/day,respectively (39). In the United States, in the third National Health and Nutri-tion Examination Survey (38), the median consumption of vitamin C fromfoods during the years 1988–91 was 73 and 84mg/day in men and women,respectively. In all of these studies there was a wide variation in vitamin Cintake. In the United States 25–30% of the population consumed less than 2.5servings of fruit and vegetables daily. Likewise, a survey of Latin Americanchildren suggested that less than 15% consumed the recommended intake offruits and vegetables (40). It is not possible to relate servings of fruits and vegetables to an exact amount of vitamin C, but the WHO dietary goal of 400g/day (41), aimed at providing sufficient vitamin C to meet the 1970FAO/WHO guidelines—that is, approximately 20–30mg/day—and lowerthe risk of chronic disease. The WHO goal has been roughly translated intothe recommendation of five portions of fruits and vegetables per day (42).
Reports from India show that the available supply of vitamin C is 43mg/capita/day, and in the different states of India it ranges from 27 to 66mg/day. In one study, low-income children consumed as little as 8.2mg/dayof vitamin C in contrast to a well-to-do group of children where the intakewas 35.4mg/day (43). Other studies done in developing countries foundplasma vitamin C concentrations lower than those reported for developedcountries, for example, 20–27mmol/l for apparently healthy adolescent boysand girls in China and 3–54mmol/l (median, 14mmol/l) for similarly agedGambian nurses (44, 45), although values obtained in a group of adults froma rural district in northern Thailand were quite acceptable (median, 44mmol/l;range, 17–118mmol/l) (46). However, it is difficult to assess the extent towhich subclinical infections are lowering the plasma vitamin C concentrationsseen in such countries.
P130-144 3/12/05 17:05 Page 133
VITAMIN AND MINERAL REQUIREMENTS IN HUMAN NUTRITION
134
Claims for a positive association between vitamin C consumption andhealth status are frequently made, but results from intervention studies areinconsistent. Low plasma concentrations are reported in patients with dia-betes (47) and infections (48) and in smokers (49), but the relative contribu-tion of diet and stress to these situations is uncertain (see Chapter 8 onantioxidants). Epidemiological studies indicate that diets with a high vitaminC content have been associated with lower cancer risk, especially for cancersof the oral cavity, oesophagus, stomach, colon, and lung (39, 50–52). However,there appears to be no effect of consumption of vitamin C supplements onthe development of colorectal adenoma and stomach cancer (52–54), and dataon the effect of vitamin C supplementation on coronary heart disease andcataract development are conflicting (55–74). Currently there is no consistentevidence from population studies that heart disease, cancers, or cataract devel-opment are specifically associated with vitamin C status. This of course doesnot preclude the possibility that other components in vitamin C-rich fruitsand vegetables provide health benefits, but it is not yet possible to isolate sucheffects from other factors such as lifestyle patterns of people who have a highvitamin C intake.
7.5 Dietary sources of vitamin C and limitations to vitamin C supply
Ascorbate is found in many fruits and vegetables (75). Citrus fruits and juicesare particularly rich sources of vitamin C but other fruits including cantaloupeand honeydew melons, cherries, kiwi fruits, mangoes, papaya, strawberries,tangelo, tomatoes, and water melon also contain variable amounts of vitaminC. Vegetables such as cabbage, broccoli, Brussels sprouts, bean sprouts, cau-liflower, kale, mustard greens, red and green peppers, peas, and potatoes maybe more important sources of vitamin C than fruits, given that the vegetablesupply often extends for longer periods during the year than does the fruitsupply.
In many developing countries, the supply of vitamin C is often determinedby seasonal factors (i.e. the availability of water, time, and labour for the man-agement of household gardens and the short harvesting season of many fruits).For example, mean monthly ascorbate intakes ranged from 0 to 115mg/dayin one Gambian community in which peak intakes coincided with the sea-sonal duration of the mango crop and to a lesser extent with orange and grape-fruit harvests. These fluctuations in dietary ascorbate intake were closelyreflected by corresponding variations in plasma ascorbate (11.4–68.4mmol/l)and human milk ascorbate (143–342mmol/l) (76).
Vitamin C is very labile, and the loss of vitamin C on boiling milk
P130-144 3/12/05 17:05 Page 134
provides one dramatic example of a cause of infantile scurvy. The vitamin Ccontent of food is thus strongly influenced by season, transport to market,length of time on the shelf and in storage, cooking practices, and the chlori-nation of the water used in cooking. Cutting or bruising of produce releasesascorbate oxidase. Blanching techniques inactivate the oxidase enzyme andhelp to preserve ascorbate; lowering the pH of a food will similarly achievethis, as in the preparation of sauerkraut (pickled cabbage). In contrast, heatingand exposure to copper or iron or to mildly alkaline conditions destroys thevitamin, and too much water can leach it from the tissues during cooking.
It is important to realize that the amount of vitamin C in a food is usuallynot the major determinant of a food’s importance for supply, but rather reg-ularity of intake. For example, in countries where the potato is an importantstaple food and refrigeration facilities are limited, seasonal variations in plasmaascorbate are due to the considerable deterioration in the potato’s vitamin Ccontent during storage; the content can decrease from 30 to 8mg/100g over8–9 months (77). Such data illustrate the important contribution the potatocan make to human vitamin C requirements even though the potato’s vitaminC concentration is low.
An extensive study has been made of losses of vitamin C during the pack-aging, storage, and cooking of blended foods (i.e. maize and soya-based relieffoods). Data from a United States international development programmeshow that vitamin C losses from packaging and storage in polythene bags ofsuch relief foods are much less significant than the 52–82% losses attributa-ble to conventional cooking procedures (78).
7.6 Evidence used to derive recommended intakes ofvitamin C
7.6.1 AdultsAt saturation the whole body content of ascorbate in adult males is approx-imately 20mg/kg, or 1500mg. Clinical signs of scurvy appear when the whole-body content falls below 300–400mg, and the last signs disappear when thebody content reaches about 1000mg (28, 30). Human studies have also estab-lished that ascorbate in the whole body is catabolized at an approximate rateof 3% per day (2.9% per day, SD, 0.6) (29).
There is a sigmoidal relationship between intake and plasma concentrationsof vitamin C (79). Below intakes of 30mg/day, plasma concentrations arearound 11mmol/l. Above this intake, plasma concentrations increase steeplyto 60mmol/l and plateau at around 80mmol/l, which represents the renalthreshold. Under near steady-state conditions, plateau concentrations ofvitamin C are achieved by intakes in excess of 200mg/day (Figure 7.1) (34).
7. VITAMIN C
135
P130-144 3/12/05 17:05 Page 135
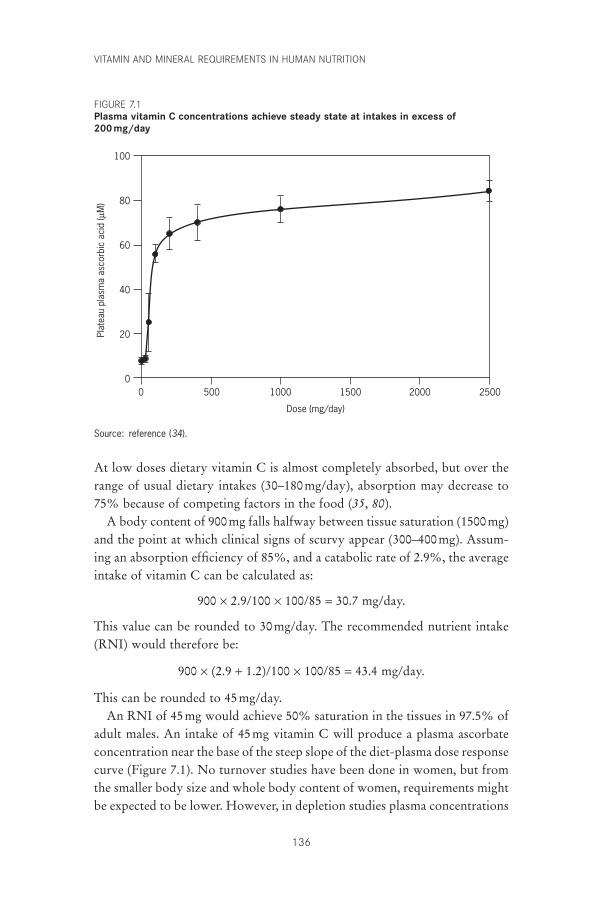
VITAMIN AND MINERAL REQUIREMENTS IN HUMAN NUTRITION
136
At low doses dietary vitamin C is almost completely absorbed, but over therange of usual dietary intakes (30–180mg/day), absorption may decrease to75% because of competing factors in the food (35, 80).
A body content of 900mg falls halfway between tissue saturation (1500mg)and the point at which clinical signs of scurvy appear (300–400mg). Assum-ing an absorption efficiency of 85%, and a catabolic rate of 2.9%, the averageintake of vitamin C can be calculated as:
900 ¥ 2.9/100 ¥ 100/85 = 30.7 mg/day.
This value can be rounded to 30mg/day. The recommended nutrient intake(RNI) would therefore be:
900 ¥ (2.9 + 1.2)/100 ¥ 100/85 = 43.4 mg/day.
This can be rounded to 45mg/day.An RNI of 45mg would achieve 50% saturation in the tissues in 97.5% of
adult males. An intake of 45mg vitamin C will produce a plasma ascorbateconcentration near the base of the steep slope of the diet-plasma dose responsecurve (Figure 7.1). No turnover studies have been done in women, but fromthe smaller body size and whole body content of women, requirements mightbe expected to be lower. However, in depletion studies plasma concentrations
100
80
60
40
20
0
Plat
eau
plas
ma
asco
rbic
aci
d (µ
M)
Dose (mg/day)
2500150010005000 2000
Source: reference (34).
FIGURE 7.1Plasma vitamin C concentrations achieve steady state at intakes in excess of 200mg/day
P130-144 3/12/05 17:05 Page 136
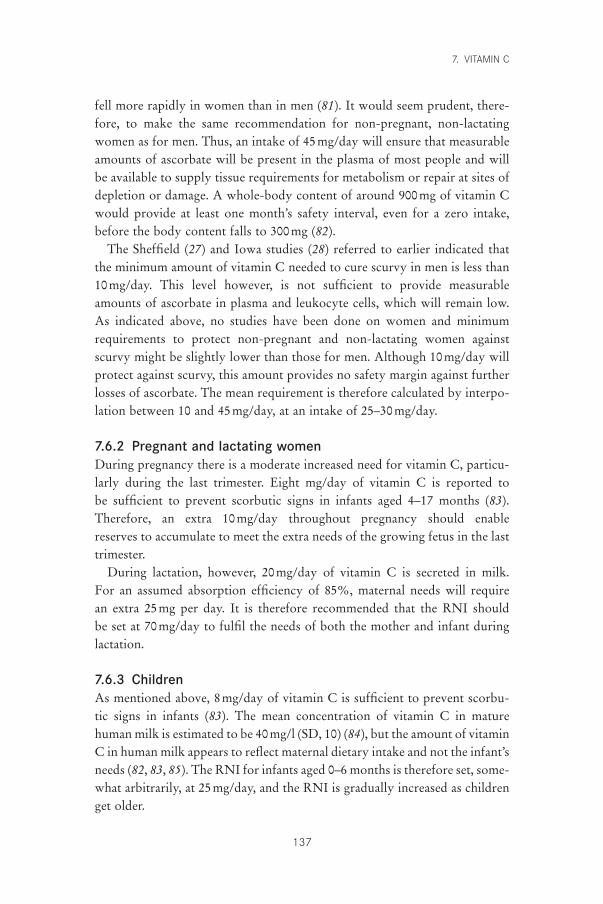
fell more rapidly in women than in men (81). It would seem prudent, there-fore, to make the same recommendation for non-pregnant, non-lactatingwomen as for men. Thus, an intake of 45mg/day will ensure that measurableamounts of ascorbate will be present in the plasma of most people and willbe available to supply tissue requirements for metabolism or repair at sites ofdepletion or damage. A whole-body content of around 900mg of vitamin Cwould provide at least one month’s safety interval, even for a zero intake,before the body content falls to 300mg (82).
The Sheffield (27) and Iowa studies (28) referred to earlier indicated thatthe minimum amount of vitamin C needed to cure scurvy in men is less than10mg/day. This level however, is not sufficient to provide measurableamounts of ascorbate in plasma and leukocyte cells, which will remain low.As indicated above, no studies have been done on women and minimumrequirements to protect non-pregnant and non-lactating women againstscurvy might be slightly lower than those for men. Although 10mg/day willprotect against scurvy, this amount provides no safety margin against furtherlosses of ascorbate. The mean requirement is therefore calculated by interpo-lation between 10 and 45mg/day, at an intake of 25–30mg/day.
7.6.2 Pregnant and lactating womenDuring pregnancy there is a moderate increased need for vitamin C, particu-larly during the last trimester. Eight mg/day of vitamin C is reported to be sufficient to prevent scorbutic signs in infants aged 4–17 months (83).Therefore, an extra 10mg/day throughout pregnancy should enable reserves to accumulate to meet the extra needs of the growing fetus in the lasttrimester.
During lactation, however, 20mg/day of vitamin C is secreted in milk. For an assumed absorption efficiency of 85%, maternal needs will require an extra 25mg per day. It is therefore recommended that the RNI should be set at 70mg/day to fulfil the needs of both the mother and infant during lactation.
7.6.3 ChildrenAs mentioned above, 8mg/day of vitamin C is sufficient to prevent scorbu-tic signs in infants (83). The mean concentration of vitamin C in maturehuman milk is estimated to be 40mg/l (SD, 10) (84), but the amount of vitaminC in human milk appears to reflect maternal dietary intake and not the infant’sneeds (82, 83, 85). The RNI for infants aged 0–6 months is therefore set, some-what arbitrarily, at 25mg/day, and the RNI is gradually increased as childrenget older.
7. VITAMIN C
137
P130-144 3/12/05 17:05 Page 137
VITAMIN AND MINERAL REQUIREMENTS IN HUMAN NUTRITION
138
7.6.4 ElderlyElderly people frequently have low plasma ascorbate values and intakes lowerthan those in younger people, often because of problems of poor dentition ormobility (86). Elderly people are also more likely to have underlying sub-clinical diseases, which can also influence plasma ascorbate concentrations (seeChapter 8 on antioxidants). It has been suggested, however, that the require-ments of elderly people do not differ substantially from those of youngerpeople in the absence of pathology which may influence absorption or renalfunctioning (82). The RNIs for the elderly are therefore the same as those foradults (45mg/day).
7.6.5 SmokersKallner et al. (87) reported that the turnover of vitamin C in smokers was50% greater than that in non-smokers. However, there is no evidence that thehealth of smokers would be influenced in any way by increasing their RNI.The Expert Consultation therefore found no justification for making a sepa-rate RNI for smokers.
7.7 Recommended nutrient intakes for vitamin CTable 7.1 presents a summary of the discussed RNIs for vitamin C by group.
TABLE 7.1Recommended nutrient intakes (RNIs) for vitamin C,by group
Group RNI (mg/day)a
Infants and children0–6 months 257–12 months 30b
1–3 years 30b
4–6 years 30b
7–9 years 35b
Adolescents10–18 years 40b
Adults19–65 years 4565+ years 45
Pregnant women 55Lactating women 70
a Amount required to half saturate body tissues with vitamin C in97.5% of the population. Larger amounts may often be required toensure an adequate absorption of non-haem iron.
b Arbitrary values.
P130-144 3/12/05 17:05 Page 138
7. VITAMIN C
139
7.8 ToxicityThe potential toxicity of excessive doses of supplemental vitamin C relates tointraintestinal events and to the effects of metabolites in the urinary system.Intakes of 2–3g/day of vitamin C produce unpleasant diarrhoea from theosmotic effects of the unabsorbed vitamin in the intestinal lumen in mostpeople (88). Gastrointestinal disturbances can occur after ingestion of as littleas 1g because approximately half of this amount would not be absorbed atthis dose (35).
Oxalate is an end-product of ascorbate catabolism and plays an importantrole in kidney stone formation. Excessive daily amounts of vitamin C producehyperoxaluria. In four volunteers who received vitamin C in doses rangingfrom 5 to 10g/day, mean urinary oxalate excretion approximately doubledfrom 50 to 87mg/day (range, 60–126mg/day) (89). However, the risk ofoxalate stone formation may become significant at high intakes of vitamin C(>1g) (90), particularly in subjects with high amounts of urinary calcium (89).
Vitamin C may precipitate haemolysis in some people, including those withglucose-6-phosphate dehydrogenase deficiency (91), paroxysmal nocturnalhaemaglobinuria (92), or other conditions where increased risk of red cellhaemolysis may occur or where protection against the removal of the prod-ucts of iron metabolism may be impaired, as in people with the haptoglobinHp2-2 phenotype (93). Of these, only the haptoglobin Hp2-2 condition wasassociated with abnormal vitamin C metabolism (lower plasma ascorbate thanexpected) and only in cases where intake of vitamin C was provided mainlyfrom dietary sources.
On the basis of the above, the Consultation agreed that 1g of vitamin Cappears to be the advisable upper limit of dietary intake per day.
7.9 Recommendations for future researchResearch is needed to gain a better understanding of the following:
• functions of endogenous gastric ascorbate and its effect on iron absorption;
• functional measurements of vitamin C status which reflect the whole-bodycontent of vitamin C and which are not influenced by infection;
• reasons for the vitamin C uptake by granulocytes which is associated withinfection.
References1. Stewart CP, Guthrie D, eds. Lind’s treatise on scurvy. Edinburgh, University
Press, 1953.2. Nishikimi M et al. Cloning and chromosomal mapping of the human non-
P130-144 3/12/05 17:05 Page 139
VITAMIN AND MINERAL REQUIREMENTS IN HUMAN NUTRITION
140
functional gene for L-gulono-gamma-lactone oxidase, the enzyme for L-ascorbic acid biosynthesis missing in man. Journal of Biological Chemistry,1994, 269:13685–13688.
3. Levine M. New concepts in the biology and biochemistry of ascorbic acid.New England Journal of Medicine, 1986, 314:892–902.
4. Englard S, Seifter S. The biochemical functions of ascorbic acid. AnnualReview of Nutrition, 1986, 6:365–406.
5. Wondrack LM, Hsu CA, Abbott MT. Thymine 7-hydroxylase and pyrimidinedeoxyribonucleoside 2¢-hydroxylase activities in Rhodotorula glutinis. Journalof Biological Chemistry, 1978, 253:6511–6515.
6. Stubbe JA. Identification of two alpha keto glutarate-dependent dioxygenasesin extracts of Rhodotorula glutinis catalyzing deoxyuridine hydroxylation.Journal of Biological Chemistry, 1985, 260:9972–9975.
7. Prockop DJ, Kivirikko KI. Collagens: molecular biology, diseases, and potential for therapy. Annual Review of Biochemistry, 1995, 64:403–434.
8. Peterkofsky B. Ascorbate requirement for hydroxylation and secretion of pro-collagen: relationship to inhibition of collagen synthesis in scurvy. AmericanJournal of Clinical Nutrition, 1991, 54(Suppl.):S1135–S1140.
9. Kivirikko KI, Myllyla R. Post-translational processing of procollagens. Annalsof the New York Academy of Sciences, 1985, 460:187–201.
10. Rebouche CJ. Ascorbic acid and carnitine biosynthesis. American Journal ofClinical Nutrition, 1991, 54(Suppl.):S1147–S1152.
11. Dunn WA et al. Carnitine biosynthesis from gamma-butyrobetaine and from exogenous protein-bound 6-N-trimethyl-L-lysine by the perfusedguinea pig liver. Effect of ascorbate deficiency on the in situ activity of gamma-butyrobetaine hydroxylase. Journal of Biological Chemistry, 1984,259:10764–10770.
12. Levine M et al. Ascorbic acid and in situ kinetics: a new approach to vitaminrequirements. American Journal of Clinical Nutrition, 1991, 54(Suppl.):S1157–S1162.
13. Kaufman S. Dopamine-beta-hydroxylase. Journal of Psychiatric Research,1974, 11:303–316.
14. Eipper B et al. Peptidylglycine alpha amidating monooxygenase: a multifunc-tional protein with catalytic, processing, and routing domains. Protein Science,1993, 2:489–497.
15. Eipper B, Stoffers DA, Mains RE. The biosynthesis of neuropeptides: peptidealpha amidation. Annual Review of Neuroscience, 1992, 15:57–85.
16. Lindblad B, Lindstedt G, Lindstedt S. The mechanism of enzymic formationof homogentisate from p-hydroxyphenyl pyruvate. Journal of the AmericanChemical Society, 1970, 92:7446–7449.
17. Schorah CJ et al. Gastric juice ascorbic acid: effects of disease and implicationsfor gastric carcinogenesis. American Journal of Clinical Nutrition, 1991,53(Suppl.):S287–S293.
18. Correa P. Human gastric carcinogenesis: a multistep and multifactorialprocess. First American Cancer Society Award Lecture on Cancer Epidemi-ology and Prevention. Cancer Research, 1992, 52:6735–6740.
19. Byers T, Guerrero N. Epidemiologic evidence for vitamin C and vitamin E in cancer prevention. American Journal of Clinical Nutrition, 1995, 62(Suppl.):S1385–S1392.
20. Jialal I, Grundy SM. Preservation of the endogenous antioxidants in low
P130-144 3/12/05 17:05 Page 140
density lipoprotein by ascorbate but not probucol during oxidative modifica-tion. Journal of Clinical Investigation, 1991, 87:597–601.
21. Stokes PL et al. Folate metabolism in scurvy. American Journal of ClinicalNutrition, 1975, 28:126–129.
22. Hallberg L, Brune M, Rossander-Hulthen L. Is there a physiological role ofvitamin C in iron absorption. Annals of the New York Academy of Sciences,1987, 498:324–332.
23. Hallberg L et al. Deleterious effects of prolonged warming of meals on ascor-bic acid content and iron absorption. American Journal of Clinical Nutrition,1982, 36:846–850.
24. Hallberg L. Wheat fiber, phytates and iron absorption. Scandinavian Journalof Gastroenterology, 1987, 129(Suppl.):S73–S79.
25. McLaren DS. A colour atlas of nutritional disorders. London, Wolfe MedicalPublications, 1992.
26. Bartley W, Krebs HA, O’Brien JRP. Vitamin C requirements of human adults.London, Her Majesty’s Stationery Office, 1953 (Medical Research CouncilSpecial Report Series No. 280).
27. Krebs NA, Peters RA, Coward KH. Vitamin C requirement of human adults:experimental study of vitamin C deprivation in man. Lancet, 1948,254:853–858.
28. Baker EM et al. Metabolism of ascorbic-1–14C acid in experimental humanscurvy. American Journal of Clinical Nutrition, 1969, 22:549–558.
29. Baker EM et al. Metabolism of 14C- and 3H-labeled L-ascorbic acid in humanscurvy. American Journal of Clinical Nutrition, 1971, 24:444–454.
30. Kallner A, Hartmann D, Hornig D. Steady-state turnover and body pool of ascorbic acid in man. American Journal of Clinical Nutrition, 1979,32:530–539.
31. Moser U, Weber F. Uptake of ascorbic acid by human granulocytes. Interna-tional Journal of Vitamin and Nutrition Research, 1984, 54:47–53.
32. Lee W et al. Ascorbic acid status: biochemical and clinical considerations.American Journal of Clinical Nutrition, 1998, 48:286–290.
33. McCormick DB, Zhang Z. Cellular assimilation of water-soluble vitamins inthe mammal: riboflavin, B6, biotin and C. Proceedings of the Society of Exper-imental Biology and Medicine, 1993, 202:265–270.
34. Levine M et al. Vitamin C pharmacokinetics in healthy volunteers: evidencefor a Recommended Dietary Allowance. Proceedings of the National Academyof Sciences, 1996, 93:3704–3709.
35. Graumlich J et al. Pharmacokinetic model of ascorbic acid in humans duringdepletion and repletion. Pharmaceutical Research, 1997, 14:1133–1139.
36. Arab L, Schellenberg B, Schlierf G. Nutrition and health. A survey of youngmen and women in Heidelberg. Annals of Nutrition and Metabolism, 1982,26:1–77.
37. Gregory JR et al. The Dietary and Nutritional Survey of British Adults.London, Her Majesty’s Stationery Office, 1990.
38. Interagency Board for Nutrition Monitoring and Related Research. Thirdreport on nutrition monitoring in the United States. Washington, DC, Gov-ernment Printing Office, 1995.
39. Finch S et al. National diet and nutrition survey: people aged 65 years and over.Volume 1. Report of the diet and nutrition survey. London, Her Majesty’s Stationery Office, 1998.
7. VITAMIN C
141
P130-144 3/12/05 17:05 Page 141
VITAMIN AND MINERAL REQUIREMENTS IN HUMAN NUTRITION
142
40. Basch CE, Syber P, Shea S. 5-a-day: dietary behavior and the fruit and veg-etable intake of Latino children. American Journal of Public Health, 1994,84:814–818.
41. Diet, nutrition and the prevention of chronic diseases. Report of a WHO StudyGroup. Geneva, World Health Organization, 1990 (WHO Technical ReportSeries, No. 797).
42. Williams C. Healthy eating: clarifying advice about fruit and vegetables.British Medical Journal, 1995, 310:1453–1455.
43. Narasinga Rao BS. Dietary intake of antioxidants in relation to nutrition pro-files of Indian population groups. In: Ong ASH, Niki E, Packer L, eds. Nutri-tion, lipids, health and disease. Champaign, IL, The American Oil Chemists’Society Press, 1995:343–353.
44. Chang-Claude JC. Epidemiologic study of precancerous lesions of the oesoph-agus in young persons in a high-incidence area for oesophageal cancer in China[dissertation]. Heidelberg, Heidelberg University, 1991.
45. Knowles J et al. Plasma ascorbate concentrations in human malaria [abstract].Proceedings of the Nutrition Society, 1991, 50:66.
46. Thurnham DI et al. Influence of malaria infection on peroxyl-radical trappingcapacity in plasma from rural and urban Thai adults. British Journal of Nutri-tion, 1990, 64:257–271.
47. Jennings PE et al. Vitamin C metabolites and microangiography in diabetesmellitis. Diabetes Research, 1987, 6:151–154.
48. Thurnham DI. b-Carotene, are we misreading the signals in risk groups? Some analogies with vitamin C. Proceedings of the Nutrition Society, 1994,53:557–569.
49. Faruque O et al. Relationship between smoking and antioxidant status. BritishJournal of Nutrition, 1995, 73:625–632.
50. Yong L et al. Intake of vitamins E, C, and A and risk of lung cancer. American Journal of Epidemiology, 1997, 146:231–243.
51. Byers T, Mouchawar J. Antioxidants and cancer prevention in 1997. In: Paoletti R et al., eds. Vitamin C: the state of the art in disease prevention sixtyyears after the Nobel Prize. Milan, Springer, 1998:29–40.
52. Schorah CJ. Vitamin C and gastric cancer prevention. In: Paoletti R et al., eds.Vitamin C: the state of the art in disease prevention sixty years after the NobelPrize. Milan, Springer, 1998:41–49.
53. Blot WJ et al. Nutrition intervention trials in Linxian, China: supplementa-tion with specific vitamin/mineral combinations, cancer incidence, anddisease-specific mortality in the general population. Journal of the NationalCancer Institute, 1993, 85:1483–1492.
54. Greenberg ER et al. A clinical trial of antioxidant vitamins to prevent colo-rectal adenoma. New England Journal of Medicine, 1994, 331:141–147.
55. Rimm EB et al. Vitamin E consumption and the risk of coronary heart diseasein men. New England Journal of Medicine, 1993, 328:1450–1456.
56. Sahyoun NR, Jacques PF, Russell RM. Carotenoids, vitamins C and E, andmortality in an elderly population. American Journal of Epidemiology, 1996,144:501–511.
57. Jha P et al. The antioxidant vitamins and cardiovascular disease: a criticalreview of the epidemiologic and clinical trial data. Annals of Internal Medi-cine, 1995, 123:860–872.
58. Losonczy KG, Harris TB, Havlik RJ. Vitamin E and vitamin C supplementuse and risk of all cause and coronary heart disease mortality in older persons:
P130-144 3/12/05 17:05 Page 142
7. VITAMIN C
143
the established populations for epidemiologic studies of the elderly. AmericanJournal of Clinical Nutrition, 1996, 64:190–196.
59. Enstrom JE, Kanim LE, Klein MA. Vitamin C intake and mortality among asample of the United States population. Epidemiology, 1992, 3:194–202.
60. Enstrom JE, Kanim LE, Breslow L. The relationship between vitamin Cintake, general health practices, and mortality in Alameda County, California.American Journal of Public Health, 1986, 76:1124–1130.
61. Seddon JM et al. Dietary carotenoids, vitamins A, C, and E, and advanced age-related macular degeneration. Journal of the American Medical Association,1994, 272:1413–1420 (erratum published in Journal of the American MedicalAssociation, 1995, 273:622).
62. Riemersma RA et al. Risk of angina pectoris and plasma concentrations of vita-mins A, C, and E and carotene. The Lancet, 1991, 337:1–5.
63. Gey KF et al. Increased risk of cardiovascular disease at suboptimal plasmaconcentrations of essential antioxidants: an epidemiological update withspecial attention to carotene and vitamin C. American Journal of ClinicalNutrition, 1993, 57(Suppl.):S787–S797.
64. Kushi LH et al. Dietary antioxidant vitamins and death from coronary heartdisease in postmenopausal women. New England Journal of Medicine, 1996,334:1156–1162.
65. Simon JA, Hudes ES, Browner WS. Serum ascorbic acid and cardiovasculardisease prevalence in US adults. Epidemiology, 1998, 9:316–321.
66. Jacques PF et al. Antioxidant status in persons with and without senilecataract. Archives of Ophthalmology, 1988, 106:337–340.
67. Robertson JM, Donner AP, Trevithick JR. A possible role for vitamins C andE in cataract prevention. American Journal of Clinical Nutrition, 1991,53(Suppl.):S346–S351.
68. Leske MC, Chylack LT, Wu S. The lens opacities case/control study: riskfactors for cataract. Archives of Opthalmology, 1991, 109:244–251.
69. Italian-American Cataract Study Group. Risk factors for age-related cortical,nuclear, and posterior sub-capsular cataracts. American Journal of Epidemiol-ogy, 1991, 133:541–553.
70. Goldberg J et al. Factors associated with age-related macular degeneration. Ananalysis of data from the first National Health and Nutrition ExaminationSurvey. American Journal of Epidemiology, 1988, 128:700–710.
71. Vitale S et al. Plasma antioxidants and risk of cortical and nuclear cataract. Epidemiology, 1993, 4:195–203.
72. Hankinson SE et al. Nutrient intake and cataract extraction in women: aprospective study. British Medical Journal, 1992, 305:335–339.
73. Mares-Perlman JA. Contribution of epidemiology to understanding relation-ships of diet to age-related cataract. American Journal of Clinical Nutrition,1997, 66:739–740.
74. Jacques PF et al. Long-term vitamin C supplement use and prevalence of earlyage-related lens opacities. American Journal of Clinical Nutrition, 1997,66:911–916.
75. Haytowitz D. Information from USDA’s Nutrient Data Book. Journal ofNutrition, 1995, 125:1952–1955.
76. Bates CJ, Prentice AM, Paul AA. Seasonal variations in vitamins A, C,riboflavin and folate intakes and status of pregnant and lactating women in arural Gambian community: some possible implications. European Journal ofClinical Nutrition, 1994, 48:660–668.
P130-144 3/12/05 17:05 Page 143
VITAMIN AND MINERAL REQUIREMENTS IN HUMAN NUTRITION
144
77. Paul AA, Southgate DAT. McCance and Widdowson’s the composition offoods. London, Her Majesty’s Stationery Office, 1978.
78. Committee on International Nutrition, Food and Nutrition Board. VitaminC fortification of food aid commodities: final report. Washington, DC, NationalAcademy Press, 1997.
79. Newton HMV et al. Relation between intake and plasma concentration ofvitamin C in elderly women. British Medical Journal, 1983, 287:1429.
80. Melethil SL, Mason WE, Chiang C. Dose dependent absorption and excretion ofvitamin C in humans. International Journal of Pharmacology, 1986, 31:83–89.
81. Blanchard J. Depletion and repletion kinetics of vitamin C in humans. Journalof Nutrition, 1991, 121:170–176.
82. Olson JA, Hodges RE. Recommended dietary intakes (RDI) of vitamin C inhumans. American Journal of Clinical Nutrition, 1987, 45:693–703.
83. Irwin MI, Hutchins BK. A conspectus of research on vitamin C requirementsin man. Journal of Nutrition, 1976, 106:821–879.
84. Complementary feeding of young children in developing countries: a review of current scientific knowledge. Geneva, World Health Organization, 1998(WHO/NUT/98.1; http://whqlibdoc.who.int/hq/1998/WHO_NUT_98.1.pdf,accessed 24 June 2004).
85. Van Zoeren-Grobben D et al. Human milk vitamin content after pasteurisa-tion, storage, or tube feeding. Archives of Diseases in Childhood, 1987,62:161–165.
86. Department of Health and Social Security. Nutrition and health in old age.London, Her Majesty’s Stationery Office, 1979 (Report on Health and SocialSubjects, No. 16).
87. Kallner AB, Hartmann D, Hornig DH. On the requirements of ascorbic acidin man: steady state turnover and body pool in smokers. American Journal ofClinical Nutrition, 1981, 34:1347–1355.
88. Kubler W, Gehler J. On the kinetics of the intestinal absorption of ascorbicacid: a contribution to the calculation of an absorption process that is not proportional to the dose. International Journal of Vitamin and NutritionResearch, 1970, 40:442–453.
89. Schmidt K-H et al. Urinary oxalate excretion after large intakes of ascorbicacid in man. American Journal of Clinical Nutrition, 1981, 34:305–311.
90. Urivetzky M, Kessaris D, Smith AD. Ascorbic acid overdosing: a risk factorfor calcium oxalate nephrolithiasis. Journal of Urology, 1992, 147:1215–1218.
91. Mehta JB, Singhal SB, Mehta BC. Ascorbic acid induced haemolysis in G-6-PD deficiency. Lancet, 1990, 336:944.
92. Iwamoto N et al. Haemolysis induced by ascorbic acid in paroxysmal noc-turnal haemoglobinuria. Lancet, 1994, 343:357.
93. Langlois MR et al. Effect of haptoglobin on the metabolism of vitamin C.American Journal of Clinical Nutrition, 1997, 66:606–610.
P130-144 3/12/05 17:05 Page 144
8. Dietary antioxidants
145
8.1 Nutrients with an antioxidant roleThe potential beneficial effects of antioxidants in protecting against diseasehave been used as an argument for recommending increasing intakes of severalnutrients above those derived by conventional methods. If it is possible toquantify such claims, antioxidant properties should be considered in decisionsconcerning the daily requirements of these nutrients. This section examinesmetabolic aspects of the most important dietary antioxidants—vitamins C andE, the carotenoids, and several minerals—and tries to define the populationswhich may be at risk of inadequacy to determine whether antioxidant prop-erties per se should be, and can be, considered in setting a requirement. In addi-tion, pro-oxidant metabolism and the importance of iron are also considered.
Members of the Food and Nutrition Board of the National ResearchCouncil in the United States recently defined a dietary antioxidant as a sub-stance in foods which significantly decreases the adverse effects of reactiveoxygen species, reactive nitrogen species, or both on normal physiologicalfunction in humans (1). It is recognized that this definition is somewhatnarrow because maintenance of membrane stability is also a feature of anti-oxidant function (2) and an important antioxidant function of both vitaminA (3) and zinc (4). However, it was decided to restrict consideration of anti-oxidant function in this document to nutrients which were likely to interactmore directly with reactive species.
8.2 The need for biological antioxidantsIt is now well established that free radicals, especially superoxide (O2
.-), nitricoxide (NO.), and other reactive species such as hydrogen peroxide (H2O2),are continuously produced in vivo (5–7). Superoxide in particular is producedby leakage from the electron transport chains within the mitochondria andmicrosomal P450 systems (8) or formed more deliberately, for example, byactivated phagocytes as part of the primary immune defence in response toforeign substances or to combat infection by microorganisms (9). Nitric oxideis produced from l-arginine by nitric oxide synthases, and these enzymes are
P145-163 3/12/05 17:06 Page 145
VITAMIN AND MINERAL REQUIREMENTS IN HUMAN NUTRITION
146
found in virtually every tissue of the mammalian body, albeit at widely dif-ferent levels (7). Nitric oxide is a free radical but is believed to be essentiallya beneficial metabolite and indeed it may react with lipid peroxides and func-tion as an antioxidant (10). Nitric oxide also serves as a mediator wherebymacrophages express cytotoxic activity against microorganisms and neoplas-tic cells (11). If nitric oxide is at a sufficiently high concentration, it can reactrapidly with superoxide in the absence of a catalyst to form peroxynitrite.Peroxynitrite is a potentially damaging nitrogen species which can reactthrough several different mechanisms, including the formation of an inter-mediate through a reaction with a hydroxyl radical (12).
To cope with potentially damaging reactive oxidant species (ROS), aerobictissues contain endogenously produced antioxidant enzymes such as super-oxide dismutase (SOD), glutathione peroxidase (GPx), and catalase as well asseveral exogenously acquired radical-scavenging substances such as vitaminsE and C and the carotenoids (13). Under normal conditions, the high con-centrations of SOD maintain superoxide concentrations at a level too low toallow the formation of peroxynitrite. It is also important to mention the antiox-idant, reduced glutathione (GSH). GSH is ubiquitous in aerobic tissues, andalthough it is not a nutrient, it is synthesized from sulfhydryl-containing aminoacids and is highly important in intermediary antioxidant metabolism (14).
Integrated antioxidant defences protect tissues and are presumably in equi-librium with continuously generated ROS to maintain tissues metabolicallyintact most of the time. Disturbances to the system occur when productionof ROS is rapidly increased, for example, by excessive exercise, high exposureto xenobiotic compounds (such as an anaesthetic, pollutants, or unusual food),infection, or trauma. Superoxide production is increased by activation ofNADPH oxidases in inflammatory cells or after the production of xanthineoxidase, which follows ischaemia. The degree of damage resulting from thetemporary imbalance depends on the ability of the antioxidant systems torespond to the oxidant or pro-oxidant load. Fruits and vegetables are goodsources of many antioxidants, and it is reported that diets rich in these foodsare associated with a lower risk of the chronic diseases of cancer (15) and heartdisease (16). Hence, it is believed that a healthful diet maintains the exoge-nous antioxidants at or near optimal levels thus reducing the risk of tissuedamage. The most prominent representatives of dietary antioxidants arevitamin C, tocopherols, carotenoids, and flavonoids (17–19). Requirementsfor flavonoids are not being considered at this time, as work on this subjectis still very much in its infancy. In contrast, several intervention studies havebeen carried out to determine whether supplements of the other nutrients canprovide additional benefits against diseases such as those mentioned above.
P145-163 3/12/05 17:06 Page 146
The components of biological tissues are an ideal mixture of substrates for oxidation. Polyunsaturated fatty acids (PUFAs), transition metals, andoxygen are present in abundance but are prevented from reaction by cellularorganization and structure. PUFAs are present in membranes but are alwaysfound with vitamin E. Transition metals, particularly iron, are bound to bothtransport and storage proteins; abundant binding sites on such proteinsprevent overloading the protein molecule with metal ions. Tissue structures,however, break down during inflammation and disease, and free iron andother transition metals have been detected during these periods (20, 21).
Potentially damaging metabolites can arise from interactions between tran-sition metals and the ROS described above. In particular, the highly reactivehydroxyl radical can be formed by the Fenton (reaction 1) and Haber-Weissreactions (reaction 2; with an iron-salt catalyst) (22). Pathologic conditionsgreatly increase the concentrations of both superoxide and nitric oxide, andthe formation of peroxynitrite has been demonstrated in macrophages, neu-trophils, and cultured endothelium (reaction 3) (12, 23).
During inflammation or other forms of stress and disease, the body adoptsnew measures to counter potential pro-oxidant damage. The body alters the transport and distribution of iron by blocking iron mobilization andabsorption, and stimulating iron uptake from plasma by liver, spleen, andmacrophages (3, 24, 25). Nitric oxide has been shown to play a role in thecoordination of iron traffic by mimicking the consequences of iron starvationand leading to the cellular uptake of iron (26). The changes accompanyingdisease are generally termed the acute-phase response and are, generally, pro-tective (27). Some of the changes in plasma acute-phase reactants which affectiron at the onset of disease or trauma are shown in Table 8.1.
8.3 Pro-oxidant activity of biological antioxidantsMost biological antioxidants are antioxidants because when they accept anunpaired electron, the free radical intermediate formed has a relatively longhalf-life in the normal biological environment. The long half-life means thatthese intermediates remain stable for long enough to interact in a controlledfashion with other intermediates which prevent autoxidation, and the excessenergy of the surplus electron is dissipated without damage to the tissues.Thus it is believed that the tocopheroxyl radical formed by oxidation of a-tocopherol is sufficiently stable to enable its reduction by vitamin C or
Reaction 1: Fe H O Fe OH OHReaction 2: O H O O OH OHReaction 3: NO O ONOO
22 2
3
2 2 2 2
2
+ + -
- -
-
+ = + ◊ +◊ + = + ◊ +
+ ◊ = ◊
8. DIETARY ANTIOXIDANTS
147
P145-163 3/12/05 17:06 Page 147
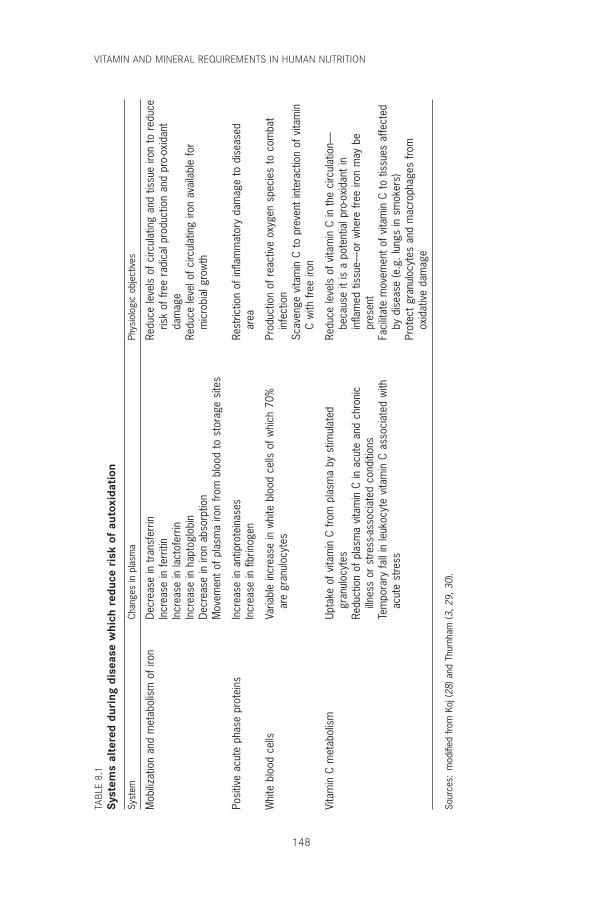
VITAMIN AND MINERAL REQUIREMENTS IN HUMAN NUTRITION
148
TABL
E 8.
1Sy
stem
s al
tere
d du
ring
dis
ease
whi
ch r
educ
e ri
sk o
f au
toxi
dati
on
Syst
emCh
ange
s in
pla
sma
Phys
iolo
gic
obje
ctiv
es
Mob
ilizat
ion
and
met
abol
ism
of i
ron
Decr
ease
in t
rans
ferr
inRe
duce
leve
ls o
f circ
ulat
ing
and
tissu
e iro
n to
red
uce
Incr
ease
in fe
rriti
nris
k of
free
rad
ical
pro
duct
ion
and
pro-
oxid
ant
Incr
ease
in la
ctof
errin
dam
age
Incr
ease
in h
apto
glob
inRe
duce
leve
l of c
ircul
atin
g iro
n av
aila
ble
for
Decr
ease
in ir
on a
bsor
ptio
nm
icro
bial
gro
wth
Mov
emen
t of
pla
sma
iron
from
blo
od t
o st
orag
e si
tes
Posi
tive
acut
e ph
ase
prot
eins
Incr
ease
in a
ntip
rote
inas
esRe
stric
tion
of in
flam
mat
ory
dam
age
to d
isea
sed
Incr
ease
in fi
brin
ogen
area
Whi
te b
lood
cel
lsVa
riabl
e in
crea
se in
whi
te b
lood
cel
ls o
f whi
ch 7
0%Pr
oduc
tion
of r
eact
ive
oxyg
en s
peci
es t
o co
mba
tar
e gr
anul
ocyt
esin
fect
ion
Scav
enge
vita
min
C t
o pr
even
t in
tera
ctio
n of
vita
min
C w
ith fr
ee ir
on
Vita
min
C m
etab
olis
mUp
take
of v
itam
in C
from
pla
sma
by s
timul
ated
Re
duce
leve
ls o
f vita
min
C in
the
circ
ulat
ion—
gr
anul
ocyt
esbe
caus
e it
is a
pot
entia
l pro
-oxi
dant
inRe
duct
ion
of p
lasm
a vi
tam
in C
in a
cute
and
chr
onic
infla
med
tis
sue—
or w
here
free
iron
may
be
illnes
s or
stre
ss-a
ssoc
iate
d co
nditi
ons
pres
ent
Tem
pora
ry fa
ll in
leuk
ocyt
e vi
tam
in C
ass
ocia
ted
with
Faci
litat
e m
ovem
ent
of v
itam
in C
to
tissu
es a
ffect
edac
ute
stre
ssby
dis
ease
(e.g
. lun
gs in
sm
oker
s)Pr
otec
t gr
anul
ocyt
es a
nd m
acro
phag
es fr
omox
idat
ive
dam
age
Sour
ces:
mod
ified
from
Koj
(28)
and
Thu
rnha
m (3
, 29,
30)
.
P145-163 3/12/05 17:06 Page 148
GSH to regenerate the quinol (31, 32) rather than oxidizing surroundingPUFAs. Similarly, the oxidized forms of vitamin C, the ascorbyl free radicaland dehydroascorbate, may be recycled back to ascorbate by GSH or theenzyme dehydroascorbate reductase (13). The ability to recycle these dietaryantioxidants may be an indication of their physiological essentiality to func-tion as antioxidants.
The biological antioxidant properties of the carotenoids depend very muchon oxygen tension and concentration (33, 34). At low oxygen tension b-carotene acts as a chain-breaking antioxidant whereas at high oxygen tensionit readily autoxidizes and exhibits pro-oxidant behaviour (33). Palozza (34)has reviewed much of the evidence and has suggested that b-carotene hasantioxidant activity between 2 and 20mmHg of oxygen tension, but at theoxygen tension in air or above (>150mmHg) it is much less effective as anantioxidant and can show pro-oxidant activity as the oxygen tension increases.Palozza (34) also suggested that autoxidation reactions of b-carotene may becontrolled by the presence of other antioxidants (e.g. vitamins E and C) orother carotenoids. There is some evidence that intake of large quantities offat-soluble nutrients such as b-carotene and other carotenoids may cause themto compete with each other during absorption and lower plasma concentra-tions of other nutrients derived from the diet. However, a lack of other antiox-idants is unlikely to explain the increased incidence of lung cancer that wasobserved in a a-tocopherol/b-carotene intervention study, because there wasno difference in cancer incidence between the group which received both b-carotene and a-tocopherol and the groups which received one treatment only(35).
The free radical formed from a dietary antioxidant is potentially a pro-oxidant as is any other free radical. In biological conditions that deviate fromthe norm, there is always the potential for an antioxidant free radical tobecome a pro-oxidant if a suitable receptor molecule is present to accept theelectron and promote the autoxidation (36). Mineral ions are particularlyimportant pro-oxidants. For example, vitamin C will interact with bothcopper and iron to generate cuprous or ferrous ions, respectively, both ofwhich are potent pro-oxidants (29, 37). Fortunately, mineral ions are tightly bound to proteins and are usually unable to react with tissue components unless there is a breakdown in tissue integrity. Such circum-stances can occur in association with disease and excessive phagocyte activa-tion, but even under these circumstances, there is rapid metabolicaccommodation in the form of the acute-phase response to minimize thepotentially damaging effects of an increase in free mineral ions in extracellu-lar fluids (Table 8.1).
8. DIETARY ANTIOXIDANTS
149
P145-163 3/12/05 17:06 Page 149
VITAMIN AND MINERAL REQUIREMENTS IN HUMAN NUTRITION
150
8.4 Nutrients associated with endogenous antioxidantmechanisms
Both zinc and selenium are intimately involved in protecting the body againstoxidant stress. Zinc combined with copper is found in the cytoplasmic formof SOD whereas zinc and magnesium occur in the mitochondrial enzyme.Superoxide dismutase is present in all aerobic cells and is responsible for thedismutation of superoxide (reaction 4).
Hydrogen peroxide is a product of this dismutation reaction and is removedby GPx, of which selenium is an integral component (reaction 5). To func-tion effectively, this enzyme also needs a supply of hydrogen, which it obtainsfrom reduced glutathione (GSH). Cellular concentrations of GSH are main-tained by the riboflavin-dependent enzyme glutathione reductase.
Four forms of selenium-dependent GPx have been described, each with dif-ferent activities in different parts of the cell (38). In addition, a selenium-dependent enzyme, thioredoxin reductase, was recently characterized inhuman erythrocytes. Thioredoxin reductase may be particularly important tothe thyroid gland because it can cope with higher concentrations of peroxideand hydroperoxides generated in the course of thyroid hormone synthesisbetter than can GPx (39). It has been suggested that in combination withiodine deficiency, the inability to remove high concentrations of hydrogenperoxide may cause atrophy in the thyroid gland, resulting in myxedematouscretinism (39).
SOD and GPx are widely distributed in aerobic tissues and, if no catalyticmetal ions are available, endogenously produced superoxide and hydrogenperoxide at physiological concentrations probably have limited, if any, dam-aging effects (36). SOD and GPx are of fundamental importance to the life ofthe cell, and their activity is not readily reduced by deficiencies in dietaryintake of zinc and selenium. In contrast, enzyme activity can be stimulatedby increased oxidant stress (e.g. ozone) (40). Activities of zinc-dependentenzymes have been shown to be particularly resistant to the influence ofdietary zinc (41), and although erythrocyte GPx activity correlates with sele-nium when the intake is below 60–80mg/day (42), there is no evidence ofimpaired clinical function at low GPx activities found in humans. Neverthe-less, one selenium intervention study reported remarkably lower risks ofseveral cancers in subjects taking supplements for 4.5 years at doses of 200mg/day (43). The effects were so strong on total cancer mortality that the study
Reaction 5: H O 2GSH GSSG 2H O2 2 2+ = +
Reaction 4: O O 2H H O O2 2+
2 2 2◊ + ◊ + = +
P145-163 3/12/05 17:06 Page 150
was stopped prematurely. However, the subjects were patients with a historyof basal or squamous cell carcinomas and were not typical of the general pop-ulation (43). In addition, a prospective analysis of serum selenium in cancerpatients (44) (1.72mmol/l) found very little difference from concentrations inmatched controls (1.63mmol/l) although the difference was significant (45).Furthermore, areas with high selenium intakes have a lower cancer incidencethan do those with low intakes, but the high selenium areas were the leastindustrialized (45).
8.5 Nutrients with radical-quenching propertiesVitamins C and E are the principal nutrients which possess radical-quenching properties. Both are powerful antioxidants, and the most impor-tant difference between these two compounds stems from their different sol-ubility in biological fluids. Vitamin C is water-soluble and is thereforeespecially found in the aqueous fractions of the cell and in body fluids whereasvitamin E is highly lipophilic and is found in membranes and lipoproteins.
8.5.1 Vitamin EVitamin E falls into the class of conventional antioxidants which generallyconsist of phenols or aromatic amines (see Chapter 5). In the case of the fourtocopherols that, together with the four tocotrienols constitute vitamin E, theinitial step involves a very rapid transfer of phenolic hydrogen to the recipi-ent free radical with the formation of a phenoxyl radical from vitamin E. Thephenoxyl radical is resonance stabilized and is relatively unreactive towardslipid or oxygen. It does not therefore continue the chain (33, 46). However,the phenoxyl radical is no longer an antioxidant and to maintain the antioxi-dant properties of membranes, it must be recycled or repaired (i.e. reconvertedto vitamin E) because the amount of vitamin E present in membranes can be several thousand-fold less than the amount of potentially oxidizable sub-strate (47). Water-soluble vitamin C is the popular candidate for this role (31),but thiols and particularly GSH can also function in this role in vitro (32,48–50).
There are eight possible isomers of vitamin E, but a-tocopherol (5,7,8-trimethyltocol) is the most biologically important antioxidant in vivo (46). Inplasma samples, more than 90% is present as a-tocopherol but there may beapproximately 10% of g-tocopherol. In foods such as margarine and soyproducts the g form may be predominant whereas palm oil products are richin the tocotrienols.
Vitamin E is found throughout the body in both cell and subcellular mem-branes. It is believed to be orientated with the quinol ring structure on the
8. DIETARY ANTIOXIDANTS
151
P145-163 3/12/05 17:06 Page 151
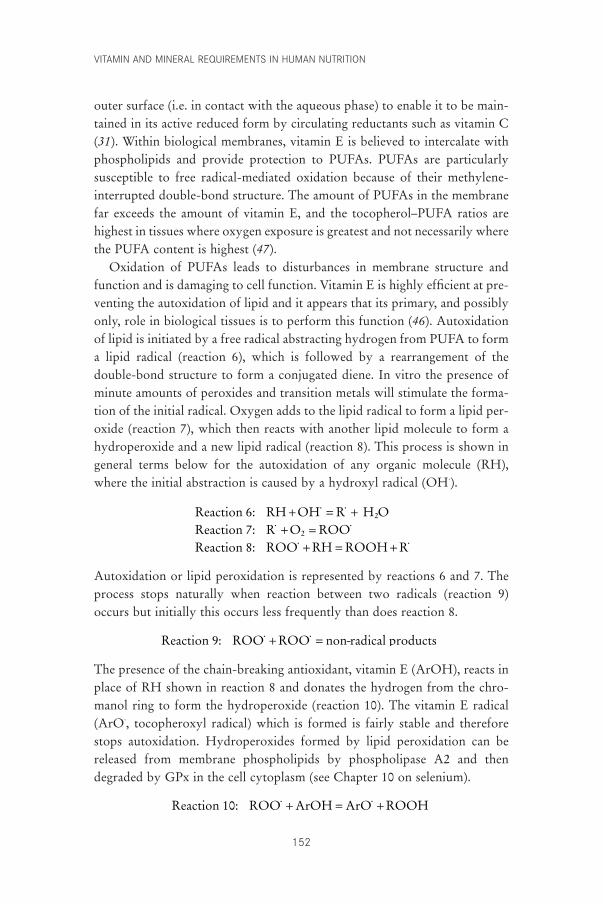
VITAMIN AND MINERAL REQUIREMENTS IN HUMAN NUTRITION
152
outer surface (i.e. in contact with the aqueous phase) to enable it to be main-tained in its active reduced form by circulating reductants such as vitamin C(31). Within biological membranes, vitamin E is believed to intercalate withphospholipids and provide protection to PUFAs. PUFAs are particularly susceptible to free radical-mediated oxidation because of their methylene-interrupted double-bond structure. The amount of PUFAs in the membranefar exceeds the amount of vitamin E, and the tocopherol–PUFA ratios arehighest in tissues where oxygen exposure is greatest and not necessarily wherethe PUFA content is highest (47).
Oxidation of PUFAs leads to disturbances in membrane structure andfunction and is damaging to cell function. Vitamin E is highly efficient at pre-venting the autoxidation of lipid and it appears that its primary, and possiblyonly, role in biological tissues is to perform this function (46). Autoxidationof lipid is initiated by a free radical abstracting hydrogen from PUFA to forma lipid radical (reaction 6), which is followed by a rearrangement of thedouble-bond structure to form a conjugated diene. In vitro the presence ofminute amounts of peroxides and transition metals will stimulate the forma-tion of the initial radical. Oxygen adds to the lipid radical to form a lipid per-oxide (reaction 7), which then reacts with another lipid molecule to form ahydroperoxide and a new lipid radical (reaction 8). This process is shown ingeneral terms below for the autoxidation of any organic molecule (RH),where the initial abstraction is caused by a hydroxyl radical (OH·).
Autoxidation or lipid peroxidation is represented by reactions 6 and 7. Theprocess stops naturally when reaction between two radicals (reaction 9)occurs but initially this occurs less frequently than does reaction 8.
The presence of the chain-breaking antioxidant, vitamin E (ArOH), reacts inplace of RH shown in reaction 8 and donates the hydrogen from the chro-manol ring to form the hydroperoxide (reaction 10). The vitamin E radical(ArO·, tocopheroxyl radical) which is formed is fairly stable and thereforestops autoxidation. Hydroperoxides formed by lipid peroxidation can bereleased from membrane phospholipids by phospholipase A2 and thendegraded by GPx in the cell cytoplasm (see Chapter 10 on selenium).
Reaction 10: ROO ArOH ArO ROOH◊ + = ◊ +
Reaction 9: ROO ROO non-radical products◊ + ◊ =
Reaction 6: RH OH R H OReaction 7: R OReaction 8: RH ROOH R
2
2
+ ◊ = ◊ +◊ + = ◊
◊ + = + ◊ROO
ROO
P145-163 3/12/05 17:06 Page 152
8.5.2 Vitamin CMany, if not all of the biological properties of vitamin C are linked to its redoxproperties (see Chapter 7). For example, the consequences of scurvy, such asthe breakdown of connective tissue fibres (51) and muscular weakness (52),are both linked to hydroxylation reactions in which ascorbate maintainsloosely bound iron in the ferrous form to prevent its oxidation to the ferricform, which makes the hydroxylase enzymes inactive (53). Ascorbate exhibitssimilar redox functions in catecholamine biosynthesis (53) and in microsomalcytochrome P450 enzyme activity, although the latter may only be importantin young animals (54). In the eye, vitamin C concentrations may be 50 timeshigher than in the plasma and may protect against the oxidative damage oflight (55). Vitamin C is also present in the gonads, where it may play a criti-cal role in sperm maturation (56). Spermatogenesis involves many more celldivisions than does oogenesis, resulting in an increased risk of mutation. Fraga et al. (57) reported that levels of sperm oxidized by nucleoside 8-OH-2¢-deoxyguanosine (an indicator of oxidative damage to DNA) variedinversely with the intake of vitamin C (5–250mg/day). No apparent effectson sperm quality were noted. Frei (58) also showed that vitamin C was supe-rior to all other biological antioxidants in plasma in protecting lipids exposedex vivo to a variety of sources of oxidative stress. The importance of vitaminC in stabilizing various plasma components such as folate, homocysteine, pro-teins and other micronutrients has not been properly evaluated. When bloodplasma is separated from erythrocytes, vitamin C is the first antioxidant todisappear.
Vitamin C is a powerful antioxidant because it can donate a hydrogen atomand form a relatively stable ascorbyl free radical (i.e. L-ascorbate anion, seeFigure 8.1). As a scavenger of ROS, ascorbate has been shown to be effectiveagainst the superoxide radical anion, hydrogen peroxide, the hydroxyl radical,and singlet oxygen (59, 60). Vitamin C also scavenges reactive nitrogen oxidespecies to prevent nitrosation of target molecules (61). The ascorbyl freeradical can be converted back to reduced ascorbate by accepting anotherhydrogen atom or it can undergo further oxidation to dehydroascorbate.Dehydroascorbate is unstable but is more fat soluble than ascorbate and istaken up 10–20 times more rapidly by erythrocytes, where it will be reducedback to ascorbate by GSH or NADPH from the hexose monophosphateshunt (56).
Thus, mechanisms exist to recycle vitamin C, which are similar to thosefor vitamin E. The existence of a mechanism to maintain plasma ascorbate inthe reduced state means that the level of vitamin C necessary for optimalantioxidant activity is not absolute because the turnover will change in
8. DIETARY ANTIOXIDANTS
153
P145-163 3/12/05 17:06 Page 153
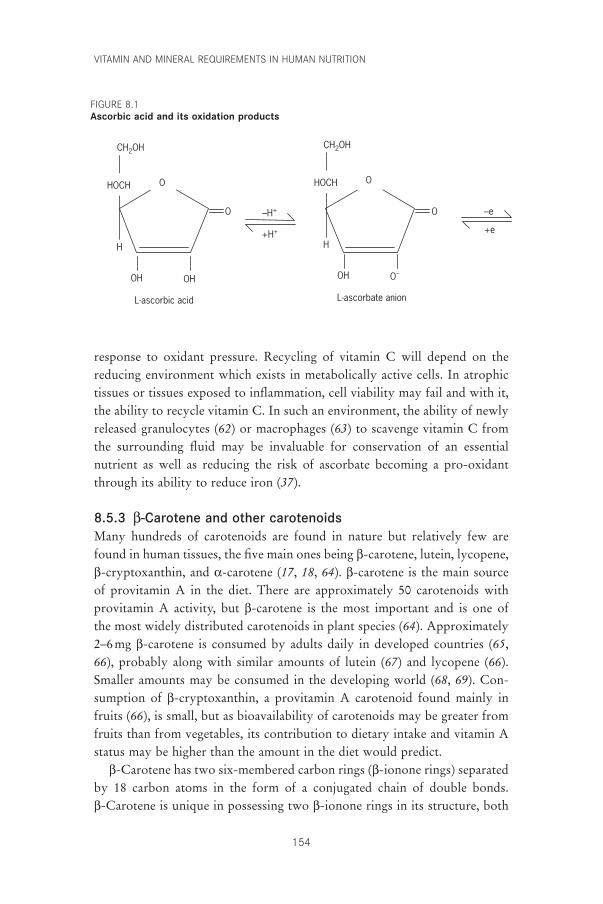
VITAMIN AND MINERAL REQUIREMENTS IN HUMAN NUTRITION
154
response to oxidant pressure. Recycling of vitamin C will depend on thereducing environment which exists in metabolically active cells. In atrophictissues or tissues exposed to inflammation, cell viability may fail and with it,the ability to recycle vitamin C. In such an environment, the ability of newlyreleased granulocytes (62) or macrophages (63) to scavenge vitamin C fromthe surrounding fluid may be invaluable for conservation of an essential nutrient as well as reducing the risk of ascorbate becoming a pro-oxidantthrough its ability to reduce iron (37).
8.5.3 b-Carotene and other carotenoidsMany hundreds of carotenoids are found in nature but relatively few arefound in human tissues, the five main ones being b-carotene, lutein, lycopene,b-cryptoxanthin, and a-carotene (17, 18, 64). b-carotene is the main sourceof provitamin A in the diet. There are approximately 50 carotenoids withprovitamin A activity, but b-carotene is the most important and is one of the most widely distributed carotenoids in plant species (64). Approximately2–6mg b-carotene is consumed by adults daily in developed countries (65,66), probably along with similar amounts of lutein (67) and lycopene (66).Smaller amounts may be consumed in the developing world (68, 69). Con-sumption of b-cryptoxanthin, a provitamin A carotenoid found mainly infruits (66), is small, but as bioavailability of carotenoids may be greater fromfruits than from vegetables, its contribution to dietary intake and vitamin Astatus may be higher than the amount in the diet would predict.
b-Carotene has two six-membered carbon rings (b-ionone rings) separatedby 18 carbon atoms in the form of a conjugated chain of double bonds. b-Carotene is unique in possessing two b-ionone rings in its structure, both
OH OH
HOCH O
CH2OH CH2OH
H
L-ascorbic acid
OH O–
HOCH O
H
L-ascorbate anion
–H+
+H+ +e
–eO O
FIGURE 8.1Ascorbic acid and its oxidation products
P145-163 3/12/05 17:06 Page 154
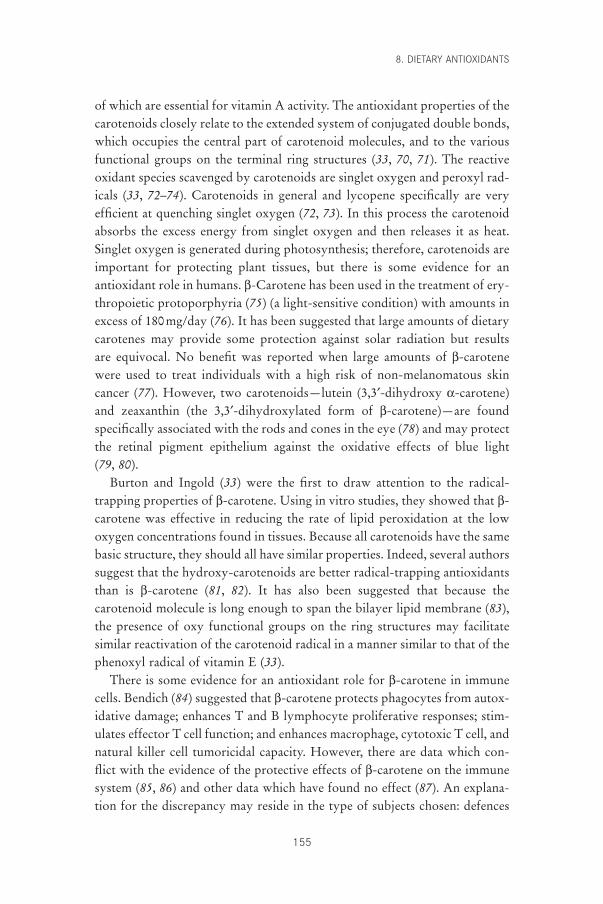
of which are essential for vitamin A activity. The antioxidant properties of thecarotenoids closely relate to the extended system of conjugated double bonds,which occupies the central part of carotenoid molecules, and to the variousfunctional groups on the terminal ring structures (33, 70, 71). The reactiveoxidant species scavenged by carotenoids are singlet oxygen and peroxyl rad-icals (33, 72–74). Carotenoids in general and lycopene specifically are veryefficient at quenching singlet oxygen (72, 73). In this process the carotenoidabsorbs the excess energy from singlet oxygen and then releases it as heat.Singlet oxygen is generated during photosynthesis; therefore, carotenoids areimportant for protecting plant tissues, but there is some evidence for anantioxidant role in humans. b-Carotene has been used in the treatment of ery-thropoietic protoporphyria (75) (a light-sensitive condition) with amounts inexcess of 180mg/day (76). It has been suggested that large amounts of dietarycarotenes may provide some protection against solar radiation but results are equivocal. No benefit was reported when large amounts of b-carotenewere used to treat individuals with a high risk of non-melanomatous skincancer (77). However, two carotenoids—lutein (3,3¢-dihydroxy a-carotene)and zeaxanthin (the 3,3¢-dihydroxylated form of b-carotene)—are foundspecifically associated with the rods and cones in the eye (78) and may protectthe retinal pigment epithelium against the oxidative effects of blue light (79, 80).
Burton and Ingold (33) were the first to draw attention to the radical-trapping properties of b-carotene. Using in vitro studies, they showed that b-carotene was effective in reducing the rate of lipid peroxidation at the lowoxygen concentrations found in tissues. Because all carotenoids have the samebasic structure, they should all have similar properties. Indeed, several authorssuggest that the hydroxy-carotenoids are better radical-trapping antioxidantsthan is b-carotene (81, 82). It has also been suggested that because thecarotenoid molecule is long enough to span the bilayer lipid membrane (83),the presence of oxy functional groups on the ring structures may facilitatesimilar reactivation of the carotenoid radical in a manner similar to that of thephenoxyl radical of vitamin E (33).
There is some evidence for an antioxidant role for b-carotene in immunecells. Bendich (84) suggested that b-carotene protects phagocytes from autox-idative damage; enhances T and B lymphocyte proliferative responses; stim-ulates effector T cell function; and enhances macrophage, cytotoxic T cell, andnatural killer cell tumoricidal capacity. However, there are data which con-flict with the evidence of the protective effects of b-carotene on the immunesystem (85, 86) and other data which have found no effect (87). An explana-tion for the discrepancy may reside in the type of subjects chosen: defences
8. DIETARY ANTIOXIDANTS
155
P145-163 3/12/05 17:06 Page 155
VITAMIN AND MINERAL REQUIREMENTS IN HUMAN NUTRITION
156
may be boosted in those at risk but it may not be possible to demonstrate anybenefit in healthy subjects (88).
8.6 A requirement for antioxidant nutrientsFree radicals are a product of tissue metabolism, and the potential damagewhich they can cause is minimized by the antioxidant capacity and repairmechanisms within the cell. Thus in a metabolically active tissue cell in ahealthy subject with an adequate dietary intake, damage to tissue will beminimal and most of the damage, if it does occur, will be repaired (36). Fruitand vegetables are an important dietary source of antioxidant nutrients, andit is now well established that individuals consuming generous amounts ofthese foods have a lower risk of chronic disease than those whose intake issmall (15, 16, 89). These observations suggest that the antioxidant nutrientrequirements of the general population can be met by a generous consump-tion of fruit and vegetables and the slogan “five portions a day” has been pro-moted to publicize this idea (90).
Occasionally, free radical damage may occur which is not repaired, and therisk of this happening may increase in the presence of infection or physicaltrauma. Such effects may exacerbate an established infection or may initiateirreversible changes leading to a state of chronic disease (e.g. a neoplasm oratherosclerotic lesions). Can such effects be minimized by a generous intakeof dietary antioxidants in the form of fruit and vegetables or are supplementsneeded?
It is generally recognized that certain groups of people have an increasedrisk of free radical-initiated damage. Premature infants, for example, are atincreased risk of oxidative damage because they are born with immatureantioxidant status (91–93) and this may be inadequate for coping with highlevels of oxygen and light radiation. People who smoke are exposed to freeradicals inhaled in the tobacco smoke and have an increased risk of many dis-eases. People abusing alcohol need to develop increased metabolic capacity tohandle the extra alcohol load. Similar risks may be faced by people workingin environments where there are elevated levels of volatile solvents (e.g. petroland cleaning fluids in distilleries and chemical plants). Car drivers and otherpeople working in dense traffic may be exposed to elevated levels of exhaustfumes. Human metabolism can adapt to a wide range of xenobiotic sub-stances, but metabolic activity may be raised as a result, leading to the consequent production of more ROS, which are potentially toxic to cellmetabolism.
Of the above groups, smokers are the most widely accessible and this hasmade them a target for several large antioxidant-nutrient intervention studies.
P145-163 3/12/05 17:06 Page 156
In addition, smokers often display low plasma concentrations of carotenoidsand vitamin C. However, no obvious benefits to the health of smokers haveemerged from these studies and, in fact, b-carotene supplements were associ-ated with an increased risk of lung cancer in two separate studies (35, 94) andwith more fatal cardiac events in one of them (95). There was no effect onsubsequent disease recurrences among other risk groups—identified by theiralready having had some non-malignant form of cancer, such as non-melanomatous skin cancer (77) or a colorectal adenoma (96)—after severalyears of elevated intakes of antioxidant nutrients. The use of b-carotene (77)or vitamin E alone or in combination with vitamin C (96) showed no bene-fits. Thus, the results of these clinical trials do not support the use of supple-mentation with antioxidant micronutrients as a means of reducing cancer oreven cardiovascular rates, although in the general population toxicity fromsuch supplements is very unlikely.
Some intervention trials, however, have been more successful in demon-strating a health benefit. Stich and colleagues (97, 98) gave large quantities ofb-carotene and sometimes vitamin A to chewers of betel quids in Kerala,India, and to Canadian Inuits with pre-malignant lesions of the oral tract andwitnessed reductions in leukoplakia and micronuclei from the buccal mucosa.Blot et al. (99) reported a 13% reduction in gastric cancer mortality in peopleliving in Linxian Province, People’s Republic of China, after taking a cocktailof b-carotene, vitamin E, and selenium. These studies are difficult to interpretbecause the subjects may have been marginally malnourished at the start andthe supplements may have merely restored nutritional adequacy. However,correcting malnutrition is unlikely to be the explanation for the positiveresults of a selenium supplementation study conducted in the United Statesin patients with a history of basal or squamous cell cancers of the skin (43).Interestingly, the intervention with 200mg/day of selenium for an average of4.5 years had no effect on the recurrence of the skin neoplasms (relative risk[RR], 1.10; confidence interval, 0.95–1.28). However, analysis of secondaryend-points showed significant reductions in total cancer mortality (RR, 0.5)and incidence (RR, 0.63) and in the incidences of lung, colorectal, and prostatecancers. The mean age of this group was 63 years and obviously they werenot a normal adult population, but results of further studies are awaited withkeen interest. In addition, results of the Cambridge Heart Antioxidant Studyhave provided some support for a beneficial effect of vitamin E in individu-als who have had a myocardial infarction (100). Recruits to the study wererandomly assigned to receive vitamin E (800 or 400mg/day) or a placebo.Initial results of the trial suggested a significant reduction in non-fatalmyocardial infarctions but a non-significant excess of cardiovascular deaths
8. DIETARY ANTIOXIDANTS
157
P145-163 3/12/05 17:06 Page 157
VITAMIN AND MINERAL REQUIREMENTS IN HUMAN NUTRITION
158
(100). The trial officially ended in 1996, but mortality has continued to bemonitored and the authors now report significantly fewer deaths in those whoreceived vitamin E for the full trial (101) (see Chapter 5 on vitamin E).However, very recently results from the Medical Research Council/BritishHeart Foundation intervention study in 20 536 patients with heart diseasewere reported (102). Patients received vitamin E (600 mg), vitamin C (250 mg)and b-carotene (20 mg) or placebo daily for five years. There were no signif-icant reductions in all cause mortality, or deaths due to vascular or non-vas-cular causes. Thus these antioxidant supplements provided no measurablehealth benefits for these patients.
In conclusion, some studies have shown that health benefits can beobtained by some people with an increased risk of disease from supplementsof antioxidant nutrients. The amounts of supplements used, however, havebeen large and the effect possibly has been pharmacologic. Further work isneeded to show whether more modest increases in nutrient intakes in healthyadult populations will delay or prevent the onset of chronic disease. There-fore, the available evidence regarding health benefits to be achieved byincreasing intakes of antioxidant nutrients does not assist in setting nutrientrequirements.
8.7 Recommendations for future researchIf nutrient intakes are ever to be recommended on the basis of antioxidantproperties then more research is needed to gain a better understanding of:
• The optimal plasma or tissue concentrations of nutrients to fully supportinteractions between antioxidant micronutrients like vitamins E and C, orvitamin E and Se to counter oxidant stress in the tissues.
• The mechanisms whereby micronutrients like vitamins A and C, and min-erals iron and zinc are reduced at the time of oxidant stress and the phys-iological purposes of the changes.
The minimal concentrations of antioxidant nutrients in humans to preventconversion of benign viruses to their more virulent forms as demonstrated byBeck and colleagues in mice (103).
References1. Young VR et al. Dietary reference intakes. Proposed definition and plan for
review of dietary antioxidant and related compounds. Washington, DC,National Academy Press, 1998.
2. Dormandy TL. An approach to free radicals. Lancet, 1983, 2:1010–1014.3. Thurnham DI. Antioxidants and pro-oxidants in malnourished populations.
Proceedings of the Nutrition Society, 1990, 48:247–259.4. Shankar AH, Prasad AS. Zinc and immune function: the biological basis of
P145-163 3/12/05 17:06 Page 158
altered resistance to infection. American Journal of Clinical Nutrition, 1998,68(Suppl.):S447–S463.
5. Halliwell B, Gutteridge JMC. Free radicals in biology and medicine, 2nd ed.Oxford, Clarendon Press, 1989.
6. Ames BN. Dietary carcinogens and anticarcinogens, oxygen radicals anddegenerative diseases. Science, 1983, 221:1256–1264.
7. Moncada S, Higgs EA. Mechanisms of disease: the L-arginine-nitric oxidepathway. New England Journal of Medicine, 1993, 329:2002–2012.
8. Fridovich I. Superoxide radical: an endogenous toxicant. Annual Review ofPharmacology and Toxicology, 1983, 23:239–257.
9. Baboire MB. Oxygen microbial killing of phagocytes. New England Journalof Medicine, 1973, 298:659–680.
10. Hogg N et al. Inhibition of low-density lipoprotein oxidation by nitric oxide.FEBS Letters, 1993, 334:170–174.
11. Hibbs JBJ et al. Nitric oxide: a cytotoxic activated macrophage effector molecule. Biochemical and Biophysical Research Communications, 1988,157:87–94.
12. Koppenol WH et al. Peroxynitrite, a cloaked oxidant formed by nitric oxideand superoxide. Chemical Research in Toxicology, 1992, 5:834–842.
13. Diplock AT et al. Functional food science and defence against reactive oxidative species. British Journal of Nutrition, 1998, 80(Suppl. 1):S77–S112.
14. Meister A. Glutathione metabolism and its selective modification. Journal ofBiological Chemistry, 1988, 263:17205–17206.
15. Hennekens CH. Micronutrients and cancer prevention. New EnglandJournal of Medicine, 1986, 315:1288–1289.
16. Van Poppel G et al. Antioxidants and coronary heart disease. Annals of Medicine, 1994, 26:429–434.
17. Thurnham DI. Carotenoids: functions and fallacies. Proceedings of the Nutrition Society, 1994, 53:77–87.
18. Rock CL, Jacob RA, Bowen PE. Update on the biological characteristics ofthe antioxidant micronutrients: vitamin C, vitamin E and the carotenoids.Journal of the American Dietetic Association, 1996, 96:693–702.
19. Hertog MGL et al. Dietary antioxidant flavonoids and risk of coronary heartdisease: the Zutphen Elderly Study. Lancet, 1993, 342:1007–1011.
20. Chevion M et al. Copper and iron are mobilised following myocardialischemia: possible predictive criteria for tissue injury. Proceedings of theNational Academy of Sciences, 1993, 90:1102–1106.
21. Beare S, Steward WP. Plasma free iron and chemotherapy toxicity. Lancet,1996, 347:342–343.
22. Halliwell B, Gutteridge JMC. Biologically relevant metal ion-dependenthydroxyl radical generation. An update. FEBS Letters, 1992, 307:108–112.
23. Carreras MC et al. Kinetics of nitric oxide and hydrogen peroxide produc-tion and formation of peroxynitrite during the respiratory burst of humanneutrophils. FEBS Letter, 1994, 341:65–68.
24. Thurnham DI. Iron as a pro-oxidant. In: Wharton BA, Ashwell M, eds. Iron,nutritional and physiological significance. London, Chapman & Hall,1995:31–41.
25. Weiss G, Wachter H, Fuchs D. Linkage of cell-mediated immunity to ironmetabolism. Immunology Today, 1995, 16:495–500.
26. Pantopoulos K, Weiss G, Hentze MW. Nitric oxide and the post-transcriptional control of cellular iron traffic. Trends in Cellular Biology,1994, 4:82–86.
8. DIETARY ANTIOXIDANTS
159
P145-163 3/12/05 17:06 Page 159
VITAMIN AND MINERAL REQUIREMENTS IN HUMAN NUTRITION
160
27. Thompson D, Milford-Ward A, Whicher JT. The value of acute phase proteinmeasurements in clinical practice. Annals of Clinical Biochemistry, 1992,29:123–131.
28. Koj A. Biological functions of acute phase proteins. In: Gordon AH, Koj A,eds. The acute phase response to injury and infection. London, Elsevier,1985:145–160.
29. Thurnham DI. b-Carotene, are we misreading the signals in risk groups?Some analogies with vitamin C. Proceedings of the Nutrition Society, 1994,53:557–569.
30. Thurnham DI. Impact of disease on markers of micronutrient status. Proceedings of the Nutrition Society, 1997, 56:421–431.
31. Packer JE, Slater TF, Willson RL. Direct observations of a free radical interaction between vitamin E and vitamin C. Nature, 1979, 278:737–738.
32. Niki E et al. Regeneration of vitamin E from a-chromanoxyl radical by glutathione and vitamin C. Chemistry Letters, 1982, 27:789–792.
33. Burton GW, Ingold KU. b-Carotene: an unusual type of lipid antioxidant.Science, 1984, 224:569–573.
34. Palozza P. Pro-oxidant actions of carotenoids in biologic systems. NutritionReviews, 1998, 56:257–265.
35. Heinonen OP et al. The effect of vitamin E and beta carotene on the inci-dence of lung cancer and other cancers in male smokers. New EnglandJournal of Medicine, 1994, 330:1029–1035.
36. Halliwell B, Gutteridge JMC, Cross CE. Free radicals, antioxidants, andhuman disease: where are we now? Journal of Laboratory and Clinical Med-icine, 1992, 119:598–620.
37. Stadtman ER. Ascorbic acid and oxidative inactivation of proteins. AmericanJournal of Clinical Nutrition, 1991, 54(Suppl.):S1125–S1128.
38. Arthur JR et al. Regulation of selenoprotein gene expression and thyroidhormone metabolism. Transactions of the Biochemical Society, 1996,24:384–388.
39. Howie AF et al. Identification of a 57-kilodalton selenoprotein in human thy-rocytes as thioredoxin reductase and evidence that its expression is regulatedthrough the calcium phosphoinositol-signalling pathway. Journal of ClinicalEndocrinology and Metabolism, 1998, 83:2052–2058.
40. Chow CK. Biochemical responses in lungs of ozone-tolerant rats. Nature,1976, 260:721–722.
41. Aggett PJ, Favier A. Zinc. International Journal of Vitamin and NutritionResearch, 1993, 63:301–307.
42. Alfthan G et al. Selenium metabolism and platelet glutathione per-oxidase activity in healthy Finnish men: effects of selenium yeast, selenite and selenate. American Journal of Clinical Nutrition, 1991,53:120–125.
43. Clark LC et al. Effects of selenium supplementation for cancer prevention inpatients with carcinoma of the skin. A randomised controlled trial. Journalof the American Medical Association, 1996, 276:1957–1963.
44. Willett WC et al. Prediagnostic serum selenium and risk of cancer. Lancet,1983, 2:130–134.
45. Willett WC et al. Vitamins A, E and carotene: effects of supplementation on their plasma levels. American Journal of Clinical Nutrition, 1983, 38:559–566.
46. Burton GW, Ingold KU. Autoxidation of biological molecules. 1. The antiox-
P145-163 3/12/05 17:06 Page 160
idant activity of vitamin E and related chain-breaking phenolic antioxidantsin vitro. Journal of the American Chemistry Society, 1981, 103:6472–6477.
47. Kornbrust DJ, Mavis RD. Relative susceptibility of microsomes from lung,heart, liver, kidney, brain and testes to lipid peroxidation: correlation withvitamin E content. Lipids, 1979, 15:315–322.
48. Wefers H, Sies H. The protection by ascorbate and glutathione against micro-somal lipid peroxidation is dependent on vitamin E. European Journal of Biochemistry, 1988, 174:353–357.
49. McCay PB. Vitamin E: interactions with free radicals and ascorbate. AnnualReview of Nutrition, 1985, 5:323–340.
50. Sies H, Murphy ME. The role of tocopherols in the protection of biologicalsystems against oxidative damage. Photochemistry and Photobiology, 1991,8:211–224.
51. Myllyla R, Kuutti-Savolainen E, Kivirikko KI. The role of ascorbate in theprolyl hydroxylase reaction. Biochemical and Biophysical Research Commu-nications, 1978, 83:441–448.
52. Hulse JD, Ellis SR, Henderson LM. b-Hydroxylation of trimethyllysine byan a-ketoglutarate-dependent mitochondrial dioxygenase. Journal of Biolog-ical Chemistry, 1978, 253:1654–1659.
53. Bates CJ. The function and metabolism of vitamin C in man. In: CounsellJN, Hornig DH, eds. Vitamin C—ascorbic acid. London, Applied SciencePublishers, 1981:1–22.
54. Zannoni VG, Lynch MM. The role of ascorbic acid in drug metabolism. DrugMetabolism Review, 1973, 2:57–69.
55. Koskela TK et al. Is the high concentration of ascorbic acid in the eye anadaptation to intense solar irradiation? Investigative Ophthalmology andVisual Science, 1989, 30:2265–2267.
56. Hornig DH. Distribution of ascorbic acid, metabolites and analogues in man and animals. Annals of the New York Academy of Sciences, 1975,258:103–118.
57. Fraga CG et al. Ascorbic acid protects against endogenous oxidative DNAdamage in human sperm. Proceedings of the National Academy of Sciences,1991, 88:11003–11006.
58. Frei B. Ascorbic acid protects lipids in human plasma and low-densitylipoprotein against oxidative damage. American Journal of Clinical Nutrition,1991, 54(Suppl.):S1113–S1118.
59. Rose RC. The ascorbate redox potential of tissues: a determinant or indica-tor of disease? News in Physiological Sciences, 1989, 4:190–195.
60. Weber P, Bendich A, Schalch W. Vitamin C and human health—a review ofrecent data relevant to human requirements. International Journal forVitamin and Nutrition Research, 1996, 66:19–30.
61. Tannenbaum SR, Wishnok JS, Leaf CD. Inhibition of nitrosamine formation by ascorbic acid. American Journal of Clinical Nutrition, 1991, 53(Suppl.):S247–S250.
62. Moser U, Weber F. Uptake of ascorbic acid by human granulocytes. Inter-national Journal for Vitamin and Nutrition Research, 1984, 54:47–53.
63. McGowen E et al. Ascorbic acid content and accumulation by alveolarmacrophages from cigarette smokers and non-smokers. Journal of Labora-tory and Clinical Medicine, 1984, 104:127–134.
64. Bendich A, Olson JA. Biological action of carotenoids. FASEB Journal, 1989,3:1927–1932.
8. DIETARY ANTIOXIDANTS
161
P145-163 3/12/05 17:06 Page 161
VITAMIN AND MINERAL REQUIREMENTS IN HUMAN NUTRITION
162
65. Gregory JR et al. The dietary and nutritional survey of British adults.London, Her Majesty’s Stationery Office, 1990.
66. Chug-Ahuja JK et al. The development and application of a carotenoid data-base for fruits, vegetables, and selected multicomponent foods. Journal of theAmerican Dietetics Association, 1993, 93:318–323.
67. Heinonen MI et al. Carotenoids in Finnish foods: vegetables, fruits, andberries. Journal of Agricultural and Food Chemistry, 1989, 37:655–659.
68. de Pee S, West C. Dietary carotenoids and their role in combatting vitaminA deficiency: a review of the literature. European Journal of Clinical Nutri-tion, 1996, 50:38–53.
69. Carotenoids: views and expert opinions of an IARC Working Group on theEvaluation of Cancer Preventive Agents, Lyon, 10–16 December 1997. Lyon,International Agency for Research on Cancer, 1998.
70. Stryker WS et al. The relation of diet, cigarette smoking, and alcohol con-sumption to plasma beta-carotene and alpha-tocopherol levels. AmericanJournal of Epidemiology, 1988, 127:283–296.
71. Mathews-Roth MM et al. Carotenoid chromophore length and protectionagainst photosensitization. Photochemistry and Photobiology, 1974, 19:217–222.
72. Foote CS, Denny RW. Chemistry of singlet oxygen. VII. Quenching by b-carotene. American Chemistry Society Journal, 1968, 90:6233–6235.
73. Di Mascio P, Kaiser S, Sies H. Lycopene as the most efficient biologicalcarotenoid singlet-oxygen quencher. Archives of Biochemistry and Biophysics,1989, 274:532–538.
74. Palozza P, Krinsky NI. b-Carotene and a-tocopherol are synergistic antiox-idants. Archives of Biochemistry and Biophysics, 1992, 297:184–187.
75. Mathews-Roth MM. Systemic photoprotection. Dermatologic Clinics, 1986,4:335–339.
76. Mathews-Roth MM et al. Beta-carotene therapy for erythropoietic proto-porphyria and other photosensitive diseases. Archives of Dermatology, 1977,113:1229–1232.
77. Greenberg ER et al. A clinical trial of beta carotene to prevent basal-cell andsquamous-cell cancers of the skin. New England Journal of Medicine, 1990,323:789–795.
78. Bone RA et al. Analysis of macula pigment by HPLC: retinal distributionand age study. Investigative Ophthalmology and. Visual Science, 1988,29:843–849.
79. Gerster H. Antioxidant protection of the ageing macula. Age and Ageing,1991, 20:60–69.
80. Seddon AM et al. Dietary carotenoids, vitamin A, C, and E, and advancedage-related macular degeneration. Journal of the American Medical Associa-tion, 1994, 272:1413–1420.
81. Terao J. Antioxidant activity of b-carotene-related carotenoids in solution.Lipids, 1989, 24:659–661.
82. Chopra M, Thurnham DI. In vitro antioxidant activity of lutein. In: WaldronKW, Johnson IT, Fenwick GR, eds. Food and cancer prevention. London,Royal Society of Chemistry, 1993:123–129.
83. Edge R, McGarvey DJ, Truscott TG. The carotenoids as anti-oxidants.Journal of Photochemistry and Photobiology (Series B:Biology), 1997,41:189–200.
P145-163 3/12/05 17:06 Page 162
84. Bendich A. Carotenoids and the immune response. Journal of Nutrition,1989, 119:112–115.
85. Pool-Zobel BL et al. Consumption of vegetables reduces genetic damage inhumans: first results of a human intervention trial with carotenoid-rich foods.Carcinogenesis, 1997, 18:1847–1850.
86. van Anterwerpen VL et al. Plasma levels of beta-carotene are inversely cor-related with circulating neutrophil counts in young male cigarette smokers.Inflammation, 1995, 19:405–414.
87. Daudu PA et al. Effect of low b-carotene diet on the immune functions ofadult women. American Journal of Clinical Nutrition, 1994, 60:969–972.
88. Krinsky NI. The evidence for the role of carotenoids in preventive health.Clinical Nutrition, 1988, 7:107–112.
89. Colditz GA et al. Increased green and yellow vegetable intake and loweredcancer deaths in an elderly population. American Journal of Clinical Nutri-tion, 1985, 41:32–36.
90. National Academy of Sciences. Diet and health. Implications for reducingchronic disease. Washington, DC, National Academy Press, 1989.
91. Sann L et al. Serum orosomucoid concentration in newborn infants. European Journal of Pediatrics, 1981, 136:181–185.
92. Kelly FJ et al. Time course of vitamin E repletion in the premature infant.British Journal of Nutrition, 1990, 63:631–638.
93. Moison RMW et al. Induction of lipid peroxidation by pulmonary surfac-tant by plasma of preterm babies. Lancet, 1993, 341:79–82.
94. Omenn GS et al. Effects of a combination of beta carotene and vitamin A onlung cancer and cardiovascular disease. New England Journal of Medicine,1996, 334:1150–1155.
95. Rapola JM et al. Randomised trial of a-tocopherol and b-carotene supple-ments on incidence of major coronary events in men with previous myocar-dial infarction. Lancet, 1997, 349:1715–1720.
96. Greenberg ER et al. A clinical trial of antioxidant vitamins to prevent col-orectal adenoma. New England Journal of Medicine, 1994, 331:141–147.
97. Stich HF et al. Remission of oral leukoplakias and micronuclei in tobacco/betel quid chewers treated with beta-carotene and with beta-carotene plusvitamin A. International Journal of Cancer, 1988; 42:195–199.
98. Stich HF, Hornby P, Dunn BP. A pilot beta-carotene intervention trial withInuits using smokeless tobacco. International Journal of Cancer, 1985,36:321–327.
99. Blot WJ et al. Nutrition intervention trials in Linxian, China: supplementa-tion with specific vitamin/mineral combinations, cancer incidence, anddisease specific mortality in the general population. Journal of the NationalCancer Institute, 1993, 85:1483–1492.
100. Stephens NG et al. Randomised control trial of vitamin E in patients with coronary disease: Cambridge Heart Antioxidant Study (CHAOS).Lancet, 1996, 347:781–786.
101. Mitchinson MJ et al. Mortality in the CHAOS trial. Lancet, 1999,353:381–382.
102. Heart Protection Study Group. MRC/BHF Heart Protection Study ofantioxidant vitamin supplementation in 20536 high-risk individuals: a randomised placebo-controlled trial. Lancet, 2002, 360:23–33.
103. Beck MA. Selenium and host defence towards viruses. Proceedings of theNutrition Society, 1999; 58:707–711.
8. DIETARY ANTIOXIDANTS
163
P145-163 3/12/05 17:06 Page 163
164
9. Thiamine, riboflavin, niacin, vitamin B6,pantothenic acid, and biotin
9.1 IntroductionThe B-complex vitamins covered here are listed in Table 9.1 along with thephysiological roles of the coenzyme forms and a brief description of clinicaldeficiency symptoms.
Rice and wheat are the staples for many populations of the world. Exces-sive refining and polishing of cereals removes considerable proportions of Bvitamins contained in these cereals. Clinical manifestations of deficiency ofsome B vitamins—such as beriberi (cardiac and dry), peripheral neuropathies,pellagra, and oral and genital lesions (related to riboflavin deficiency)—wereonce major public health problems in some parts of the world. These manifestations have now declined, the decline being brought about notthrough programmes which distribute synthetic vitamins but through changes in the patterns of food availability and consequent changes in dietarypractices.
Although many clinical manifestations of B-vitamin deficiencies havedecreased, there is evidence of widespread subclinical deficiency of these vita-mins (especially of riboflavin and pyridoxine). These subclinical deficiencies,although less dramatic in their manifestations, exert deleterious metaboliceffects. Despite the progress in reduction of large-scale deficiency in theworld, there are periodic reports of outbreaks of B-complex deficiencieswhich are linked to deficits of B vitamins in populations under various dis-tress conditions.
Refugee and displaced population groups (20 million people by currentUnited Nations estimates) are at risk for B-complex deficiency because mostcereal foods used under emergency situations are not fortified with micronu-trients (1). Recent reports have implicated the low B-complex content of dietsas a factor in the outbreak of peripheral neuropathy and visual loss observedin the adult population of Cuba (2–4). This deficiency in Cuba resulted fromthe consequences of an economic blockade (4).
Because of the extensive literature pertaining to the study of the B-complexvitamins, the references cited here have been limited to those published after
P164-193 3/12/05 17:06 Page 164
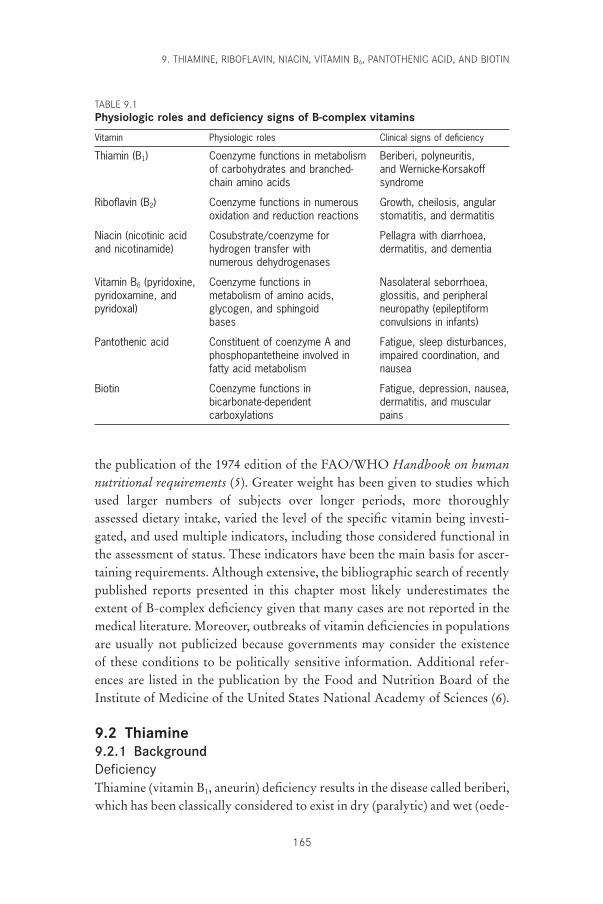
the publication of the 1974 edition of the FAO/WHO Handbook on humannutritional requirements (5). Greater weight has been given to studies whichused larger numbers of subjects over longer periods, more thoroughlyassessed dietary intake, varied the level of the specific vitamin being investi-gated, and used multiple indicators, including those considered functional inthe assessment of status. These indicators have been the main basis for ascer-taining requirements. Although extensive, the bibliographic search of recentlypublished reports presented in this chapter most likely underestimates theextent of B-complex deficiency given that many cases are not reported in themedical literature. Moreover, outbreaks of vitamin deficiencies in populationsare usually not publicized because governments may consider the existenceof these conditions to be politically sensitive information. Additional refer-ences are listed in the publication by the Food and Nutrition Board of theInstitute of Medicine of the United States National Academy of Sciences (6).
9.2 Thiamine9.2.1 BackgroundDeficiencyThiamine (vitamin B1, aneurin) deficiency results in the disease called beriberi,which has been classically considered to exist in dry (paralytic) and wet (oede-
9. THIAMINE, RIBOFLAVIN, NIACIN, VITAMIN B6, PANTOTHENIC ACID, AND BIOTIN
165
TABLE 9.1Physiologic roles and deficiency signs of B-complex vitamins
Vitamin Physiologic roles Clinical signs of deficiency
Thiamin (B1) Coenzyme functions in metabolism Beriberi, polyneuritis,of carbohydrates and branched- and Wernicke-Korsakoffchain amino acids syndrome
Riboflavin (B2) Coenzyme functions in numerous Growth, cheilosis, angularoxidation and reduction reactions stomatitis, and dermatitis
Niacin (nicotinic acid Cosubstrate/coenzyme for Pellagra with diarrhoea,and nicotinamide) hydrogen transfer with dermatitis, and dementia
numerous dehydrogenases
Vitamin B6 (pyridoxine, Coenzyme functions in Nasolateral seborrhoea,pyridoxamine, and metabolism of amino acids, glossitis, and peripheralpyridoxal) glycogen, and sphingoid neuropathy (epileptiform
bases convulsions in infants)
Pantothenic acid Constituent of coenzyme A and Fatigue, sleep disturbances,phosphopantetheine involved in impaired coordination, andfatty acid metabolism nausea
Biotin Coenzyme functions in Fatigue, depression, nausea,bicarbonate-dependent dermatitis, and muscularcarboxylations pains
P164-193 3/12/05 17:06 Page 165
VITAMIN AND MINERAL REQUIREMENTS IN HUMAN NUTRITION
166
matous) forms (7, 8). Beriberi occurs in human-milk-fed infants whosenursing mothers are deficient. It also occurs in adults with high carbohydrateintakes (mainly from milled rice) and with intakes of anti-thiamine factors,such as the bacterial thiaminases that are in certain ingested raw fish (7).Beriberi is still endemic in Asia. In relatively industrialized nations, the neu-rologic manifestations of Wernicke-Korsakoff syndrome are frequently asso-ciated with chronic alcoholism in conjunction with limited food consumption(9). Some cases of thiamine deficiency have been observed with patients whoare hypermetabolic, are on parenteral nutrition, are undergoing chronic renaldialysis, or have undergone a gastrectomy. Thiamine deficiency has also been observed in Nigerians who ate silk worms, Russian schoolchildren(Moscow), Thai rural elderly, Cubans, Japanese elderly, Brazilian XavanteIndians, French Guyanese, south-east Asian schoolchildren who wereinfected with hookworm, Malaysian detention inmates, and people withchronic alcoholism.
ToxicityThiamine toxicity is not a problem because renal clearance of the vitamin israpid.
Role in human metabolic processesThiamine functions as the coenzyme thiamine pyrophosphate (TPP) in themetabolism of carbohydrates and branched-chain amino acids. Specificallythe Mg2+-coordinated TPP participates in the formation of a-ketols (e.g.among hexose and pentose phosphates) as catalysed by transketolase and inthe oxidation of a-keto acids (e.g. pyruvate, a-ketoglutarate, and branched-chain a-keto acids) by dehydrogenase complexes (10, 11). Hence, when thereis insufficient thiamine, the overall decrease in carbohydrate metabolism andits interconnection with amino acid metabolism (via a-keto acids) has severeconsequences, such as a decrease in the formation of acetylcholine for neuralfunction.
9.2.2 Biochemical indicatorsIndicators used to estimate thiamine requirements are urinary excretion, ery-throcyte transketolase activity coefficient, erythrocyte thiamine, blood pyru-vate and lactate, and neurologic changes. The excretion rate of the vitamin andits metabolites reflects intake, and the validity of the assessment of thiaminenutriture is improved with load test. Erythrocyte transketolase activity coef-ficient reflects TPP levels and can indicate rare genetic defects. Erythrocytethiamine is mainly a direct measure of TPP but when combined with high
P164-193 3/12/05 17:06 Page 166
performance liquid chromatography (HPLC) separation can also provide ameasure of thiamine and thiamine monophosphate.
Thiamine status has been assessed by measuring urinary thiamine excretionunder basal conditions or after thiamine loading; transketolase activity; andfree and phosphorylated forms in blood or serum (6, 9). Although overlapwith baseline values for urinary thiamine was found with oral doses below 1mg, a correlation of 0.86 between oral and excreted amounts was found byBayliss et al. (12). The erythrocyte transketolase assay, in which an activitycoefficient based on a TPP stimulation of the basal level is given, continuesto be a main functional indicator (9), but some problems have been encoun-tered. Gans and Harper (13) found a wide range of TPP effects when thiamineintakes were adequate (i.e. above 1.5mg/day over a 3-day period). In somecases, the activity coefficient may appear normal after prolonged deficiency(14). This measure seemed poorly correlated with dietary intakes estimatedfor a group of English adolescents (15). Certainly, there are both interindi-vidual and genetic factors affecting the transketolase (16). Baines and Davies(17) suggested that it is useful to determine erythrocyte TPP directly because the coenzyme is less susceptible to factors that influence enzyme activity;there are also methods for determining thiamine and its phosphate esters inwhole blood (18).
9.2.3 Factors affecting requirementsBecause thiamine facilitates energy utilization, its requirements have tradi-tionally been expressed on the basis of energy intake, which can vary depend-ing on activity levels. However, Fogelholm et al. (19) found no difference inactivation coefficients for erythrocyte transketolase between a small group ofskiers and a less physically active group of control subjects. Also, a study withthiamine-restricted Dutch males whose intake averaged 0.43mg/day for 11weeks did not reveal an association between short bouts of intense exerciseand decreases in indicators of thiamine status (20). Alcohol consumption mayinterfere with thiamine absorption as well (9).
9.2.4 Evidence used to derive recommended intakesRecommendations for infants are based on adequate food intake. Mean thiamine content of human milk is 0.21mg/l (0.62mmol/l) (21), which corre-sponds to 0.16mg (0.49mmol) thiamine per 0.75 l of secreted milk per day. Theblood concentration for total thiamine averages 210 ± 53nmol/l for infants upto 6 months but decreases over the first 12–18 months of life (22).
A study of 13–14-year-old children related dietary intake of thiamine toseveral indicators of thiamine status (15). Sauberlich et al. (23) concluded from
9. THIAMINE, RIBOFLAVIN, NIACIN, VITAMIN B6, PANTOTHENIC ACID, AND BIOTIN
167
P164-193 3/12/05 17:06 Page 167
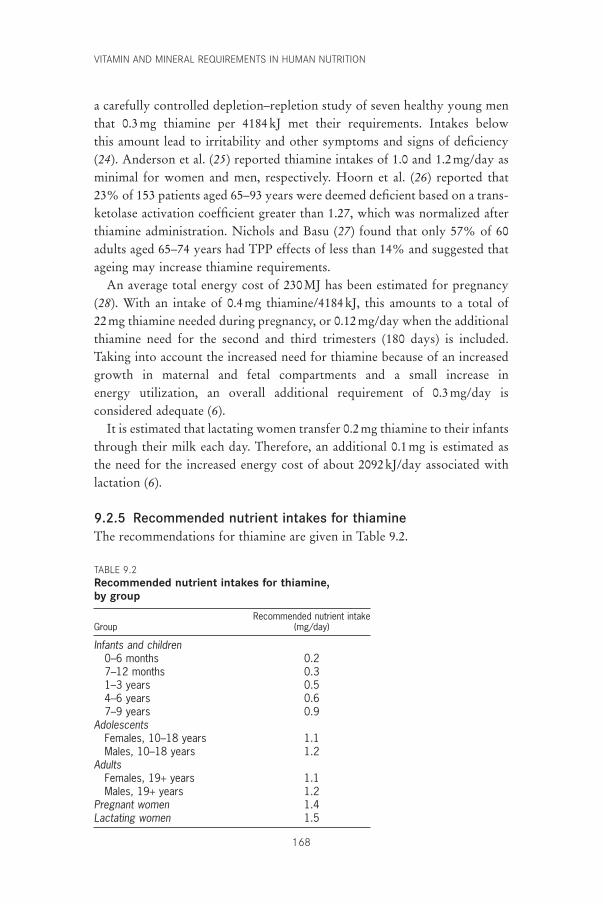
VITAMIN AND MINERAL REQUIREMENTS IN HUMAN NUTRITION
168
a carefully controlled depletion–repletion study of seven healthy young menthat 0.3mg thiamine per 4184kJ met their requirements. Intakes below this amount lead to irritability and other symptoms and signs of deficiency(24). Anderson et al. (25) reported thiamine intakes of 1.0 and 1.2mg/day asminimal for women and men, respectively. Hoorn et al. (26) reported that23% of 153 patients aged 65–93 years were deemed deficient based on a trans-ketolase activation coefficient greater than 1.27, which was normalized afterthiamine administration. Nichols and Basu (27) found that only 57% of 60adults aged 65–74 years had TPP effects of less than 14% and suggested thatageing may increase thiamine requirements.
An average total energy cost of 230MJ has been estimated for pregnancy(28). With an intake of 0.4mg thiamine/4184kJ, this amounts to a total of 22mg thiamine needed during pregnancy, or 0.12mg/day when the additionalthiamine need for the second and third trimesters (180 days) is included.Taking into account the increased need for thiamine because of an increasedgrowth in maternal and fetal compartments and a small increase in energy utilization, an overall additional requirement of 0.3mg/day is considered adequate (6).
It is estimated that lactating women transfer 0.2mg thiamine to their infantsthrough their milk each day. Therefore, an additional 0.1mg is estimated asthe need for the increased energy cost of about 2092kJ/day associated withlactation (6).
9.2.5 Recommended nutrient intakes for thiamineThe recommendations for thiamine are given in Table 9.2.
TABLE 9.2Recommended nutrient intakes for thiamine, by group
Recommended nutrient intakeGroup (mg/day)
Infants and children0–6 months 0.27–12 months 0.31–3 years 0.54–6 years 0.67–9 years 0.9
AdolescentsFemales, 10–18 years 1.1Males, 10–18 years 1.2
AdultsFemales, 19+ years 1.1Males, 19+ years 1.2
Pregnant women 1.4Lactating women 1.5
P164-193 3/12/05 17:06 Page 168
9.3 Riboflavin9.3.1 BackgroundDeficiencyRiboflavin (vitamin B2) deficiency results in the condition of hypo- or ariboflavinosis, with sore throat; hyperaemia; oedema of the pharyngeal andoral mucous membranes; cheilosis; angular stomatitis; glossitis; seborrheicdermatitis; and normochromic, normocytic anaemia associated with pure redcell cytoplasia of the bone marrow (8, 29). As riboflavin deficiency almostinvariably occurs in combination with a deficiency of other B-complex vita-mins, some of the symptoms (e.g. glossitis and dermatitis) may result fromother complicating deficiencies. The major cause of hyporiboflavinosis isinadequate dietary intake as a result of limited food supply, which is some-times exacerbated by poor food storage or processing. Children in develop-ing countries will commonly demonstrate clinical signs of riboflavindeficiency during periods of the year when gastrointestinal infections areprevalent. Decreased assimilation of riboflavin also results from abnormaldigestion, such as that which occurs with lactose intolerance. This conditionis highest in African and Asian populations and can lead to a decreased intakeof milk, as well as an abnormal absorption of the vitamin. Absorption ofriboflavin is also affected in some other conditions, for example, tropicalsprue, celiac disease, malignancy and resection of the small bowel, anddecreased gastrointestinal passage time. In relatively rare cases, the cause ofdeficiency is inborn errors in which the genetic defect is in the formation ofa flavoprotein (e.g. acyl-coenzyme A [coA] dehydrogenases). Also at risk areinfants receiving phototherapy for neonatal jaundice and perhaps those withinadequate thyroid hormone. Some cases of riboflavin deficiency have beenobserved in Russian schoolchildren (Moscow) and south-east Asian school-children (infected with hookworm).
ToxicityRiboflavin toxicity is not a problem because of limited intestinal absorption.
Role in human metabolic processesConversion of riboflavin to flavin mononucleotide (FMN) and then to thepredominant flavin, flavin adenine dinucleotide (FAD), occurs before theseflavins form complexes with numerous flavoprotein dehydrogenases and oxidases. The flavocoenzymes (FMN and FASD) participate in oxidation–reduction reactions in metabolic pathways and in energy production via therespiratory chain (10, 11).
9. THIAMINE, RIBOFLAVIN, NIACIN, VITAMIN B6, PANTOTHENIC ACID, AND BIOTIN
169
P164-193 3/12/05 17:06 Page 169
VITAMIN AND MINERAL REQUIREMENTS IN HUMAN NUTRITION
170
9.3.2 Biochemical indicatorsIndicators used to estimate riboflavin requirements are urinary flavin excre-tion, erythrocyte glutathione reductase activity coefficient, and erythrocyteflavin. The urinary flavin excretion rate of the vitamin and its metabolitesreflects intake; validity of assessment of riboflavin adequacy is improved withload test. Erythrocyte glutathione reductase activity coefficient reflects FADlevels; results are confounded by such genetic defects as glucose-6-phosphate dehydrogenase deficiency and heterozygous b-thalassemia. Erythrocyteflavin is largely a measure of FMN and riboflavin after hydrolysis of labileFAD and HPLC separation.
Riboflavin status has been assessed by measuring urinary excretion of thevitamin in fasting, random, and 24-hour specimens or by load return tests(amounts measured after a specific amount of riboflavin is given orally); meas-uring erythrocyte glutathione reductase activity coefficient; or erythrocyteflavin concentration (6, 9, 29). The HPLC method with fluorometry giveslower values for urinary riboflavin than do fluorometric methods, whichmeasure the additive fluorescence of similar flavin metabolites (30). Themetabolites can comprise as much as one third of total urinary flavin (31, 32)and in some cases may depress assays dependent on a biological responsebecause certain catabolites can inhibit cellular uptake (33). Under conditionsof adequate riboflavin intake (approximately 1.3mg/day for adults), an esti-mated 120mg (320nmol) total riboflavin or 80mg/g of creatinine is excreteddaily (32).
The erythrocyte glutathione reductase assay, with an activity coefficient(AC) expressing the ratio of activities in the presence and absence of addedFAD, continues to be used as a main functional indicator of riboflavin status,but some limitations in the technique have been noted. The reductase in ery-throcytes from individuals with glucose-6-phosphate dehydrogenase defi-ciency (often present in blacks) has an increased avidity for FAD, which makesthis test invalid (34). Sadowski (35) has set an upper limit of normality for theAC at 1.34 based on the mean value plus 2 standard deviations from severalhundred apparently healthy individuals aged 60 years and over. Suggestedguidelines for the interpretation of such enzyme ACs are as follows: less than1.2, acceptable; 1.2–1.4, low; greater than 1.4, deficient (9). In general agree-ment with earlier findings on erythrocyte flavin, Ramsay et al. (36) found acorrelation between cord blood and maternal erythrocyte deficiencies andsuggested that values greater than 40nmol/l could be considered adequate.
P164-193 3/12/05 17:06 Page 170
9.3.3 Factors affecting requirementsSeveral studies reported modest effects of physical activity on the erythrocyteglutathione reductase AC (37–41). A slight increase in the AC and decreasein urinary flavin of weight-reducing women (39) and older women under-going exercise training (41) were “normalized” with 20% additionalriboflavin. However, riboflavin supplementation did not lead to an increasein work performance when such subjects were not clinically deficient (42–45).
Bioavailability of riboflavin in foods, mostly as digestible flavocoenzymes, isexcellent at nearly 95% (6), but absorption of the free vitamin is limited to about27mg per single meal or dose in an adult (46). No more than about 7% of foodflavin is found as 8-a-FAD covalently attached to certain flavoprotein enzymes.Although some portions of the 8-a-(amino acid)-riboflavins are released byproteolysis of these flavoproteins, they do not have vitamin activity (47).
A lower fat–carbohydrate ratio may decrease the riboflavin requirementsof the elderly (48). Riboflavin interrelates with other B vitamins, notablyniacin, which requires FAD for its formation from tryptophan, and vitaminB6, which requires FMN for conversion of the phosphates of pyridoxine andpyridoxamine to the coenzyme pyridoxal 5¢-phosphate (PLP) (49). Contraryto earlier reports, no difference was seen in riboflavin status of women takingoral contraceptives when dietary intake was controlled by providing a singlebasic daily menu and meal pattern after 0.6mg riboflavin/4184kJ was givenin a 2-week acclimation period (50).
9.3.4 Evidence used to derive recommended intakesAs reviewed by Thomas et al. (51), early estimates of riboflavin content inhuman milk showed changes during the postpartum period; more recentinvestigations of flavin composition of both human (52) and cow (53) milkhave helped clarify the nature of the flavins present and provide better estimates of riboflavin equivalence. For human milk consumed by infants upto age 6 months, the riboflavin equivalence averages 0.35mg/l (931nmol/l) or0.26mg/0.75 l of milk/day (691nmol/0.75 l of milk/day) (6). For low-incomeIndian women with erythrocyte glutathione reductase activity ratios averag-ing 1.80 and a milk riboflavin content of 0.22mg/l, their breast-fed infantsaveraged AC ratios near 1.36 (54). Hence, a deficiency sufficient to reducehuman-milk riboflavin content by one third can lead to a mild subclinical deficiency in infants.
Studies of riboflavin status in adults include those by Belko et al. (38, 39)in modestly obese young women on low-energy diets, by Bates et al. (55) ondeficient Gambians, and by Kuizon et al. (56) on Filipino women. Most of a1.7-mg dose of riboflavin given to healthy adults consuming at least this
9. THIAMINE, RIBOFLAVIN, NIACIN, VITAMIN B6, PANTOTHENIC ACID, AND BIOTIN
171
P164-193 3/12/05 17:06 Page 171
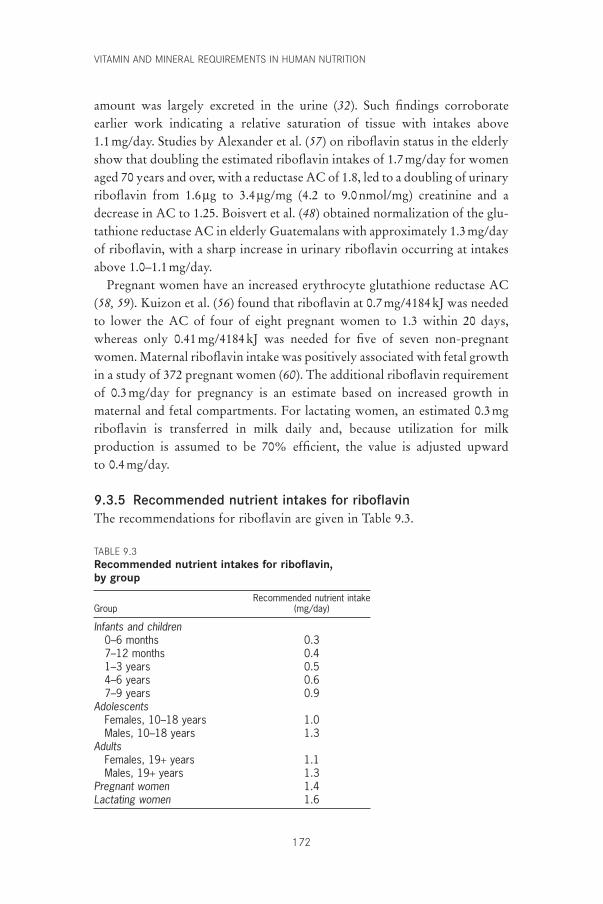
VITAMIN AND MINERAL REQUIREMENTS IN HUMAN NUTRITION
172
amount was largely excreted in the urine (32). Such findings corroborateearlier work indicating a relative saturation of tissue with intakes above 1.1mg/day. Studies by Alexander et al. (57) on riboflavin status in the elderlyshow that doubling the estimated riboflavin intakes of 1.7mg/day for womenaged 70 years and over, with a reductase AC of 1.8, led to a doubling of urinaryriboflavin from 1.6mg to 3.4mg/mg (4.2 to 9.0nmol/mg) creatinine and adecrease in AC to 1.25. Boisvert et al. (48) obtained normalization of the glu-tathione reductase AC in elderly Guatemalans with approximately 1.3mg/dayof riboflavin, with a sharp increase in urinary riboflavin occurring at intakesabove 1.0–1.1mg/day.
Pregnant women have an increased erythrocyte glutathione reductase AC(58, 59). Kuizon et al. (56) found that riboflavin at 0.7mg/4184kJ was neededto lower the AC of four of eight pregnant women to 1.3 within 20 days,whereas only 0.41mg/4184kJ was needed for five of seven non-pregnantwomen. Maternal riboflavin intake was positively associated with fetal growthin a study of 372 pregnant women (60). The additional riboflavin requirementof 0.3mg/day for pregnancy is an estimate based on increased growth inmaternal and fetal compartments. For lactating women, an estimated 0.3mgriboflavin is transferred in milk daily and, because utilization for milk production is assumed to be 70% efficient, the value is adjusted upward to 0.4mg/day.
9.3.5 Recommended nutrient intakes for riboflavinThe recommendations for riboflavin are given in Table 9.3.
TABLE 9.3Recommended nutrient intakes for riboflavin, by group
Recommended nutrient intakeGroup (mg/day)
Infants and children0–6 months 0.37–12 months 0.41–3 years 0.54–6 years 0.67–9 years 0.9
AdolescentsFemales, 10–18 years 1.0Males, 10–18 years 1.3
AdultsFemales, 19+ years 1.1Males, 19+ years 1.3
Pregnant women 1.4Lactating women 1.6
P164-193 3/12/05 17:06 Page 172
9.4 Niacin9.4.1 BackgroundDeficiencyNiacin (nicotinic acid) deficiency classically results in pellagra, which is a chronic wasting disease associated with a characteristic erythematous dermatitis that is bilateral and symmetrical, a dementia after mental changesincluding insomnia and apathy preceding an overt encephalopathy, and diar-rhoea resulting from inflammation of the intestinal mucous surfaces (8, 9, 61).At present, pellagra occurs endemically in poorer areas of Africa, China, andIndia. Its cause has been mainly attributed to a deficiency of niacin; however,its biochemical interrelationship with riboflavin and vitamin B6, which areneeded for the conversion of l-tryptophan to niacin equivalents (NEs), sug-gests that insufficiencies of these vitamins may also contribute to pellagra (62).Pellagra-like syndromes occurring in the absence of a dietary niacin deficiencyare also attributable to disturbances in tryptophan metabolism (e.g. Hartnupdisease with impaired absorption of the amino acid and carcinoid syndromewhere the major catabolic pathway routes to 5-hydroxytryptophan areblocked) (61). Pellagra also occurs in people with chronic alcoholism (61).Cases of niacin deficiency have been found in people suffering from Crohndisease (61).
ToxicityAlthough therapeutically useful in lowering serum cholesterol, administrationof chronic high oral doses of nicotinic acid can lead to hepatotoxicity as well as dermatologic manifestations. An upper limit (UL) of 35mg/day asproposed by the United States Food and Nutrition Board (6) was adopted bythis Consultation.
Role in human metabolic processesNiacin is chemically synonymous with nicotinic acid although the term is alsoused for its amide (nicotinamide). Nicotinamide is the other form of thevitamin; it does not have the pharmacologic action of the acid that is admin-istered at high doses to lower blood lipids, but exists within the redox-activecoenzymes, nicotinamide adenine dinucleotide (NAD) and its phosphate(NADP), which function in dehydrogenase–reductase systems requiringtransfer of a hydride ion (10, 11). NAD is also required for non-redox adeno-sine diphosphate–ribose transfer reactions involved in DNA repair (63) andcalcium mobilization. NAD functions in intracellular respiration and withenzymes involved in the oxidation of fuel substrates such as glyceraldehyde-3-phosphate, lactate, alcohol, 3-hydroxybutyrate, and pyruvate. NADP func-
9. THIAMINE, RIBOFLAVIN, NIACIN, VITAMIN B6, PANTOTHENIC ACID, AND BIOTIN
173
P164-193 3/12/05 17:06 Page 173
VITAMIN AND MINERAL REQUIREMENTS IN HUMAN NUTRITION
174
tions in reductive biosyntheses such as fatty acid and steroid syntheses and inthe oxidation of glucose-6-phosphate to ribose-5-phosphate in the pentosephosphate pathway.
9.4.2 Biochemical indicatorsIndicators used to estimate niacin requirements are urinary excretion, plasmaconcentrations of metabolites, and erythrocyte pyridine nucleotides. Theexcretion rate of metabolites—mainly N¢-methyl-nicotinamide and its 2- and 4-pyridones—reflects intake of niacin and is usually expressed as a ratioof the pyridones to N¢-methyl-nicotinamide. Concentrations of metabolites,especially 2-pyridone, are measured in plasma after a load test. Erythrocytepyridine nucleotides measure NAD concentration changes.
Niacin status has been monitored by daily urinary excretion of methylatedmetabolites, especially the ratio of the 2-pyridone to N¢-methyl-nicotinamide;erythrocyte pyridine nucleotides; oral dose uptake tests; erythrocyte NAD;and plasma 2-pyridone (6, 9). Shibata and Matsuo (64) found that the ratio ofurinary 2-pyridone to N¢-methyl-nicotinamide was as much a measure ofprotein adequacy as it was a measure of niacin status. Jacob et al. (65) foundthis ratio too insensitive to marginal niacin intake. The ratio of the 2-pyridone to N¢-methyl-nicotinamide also appears to be associated with theclinical symptoms of pellagra, principally the dermatitic condition (66). Inplasma, 2-pyridone levels change in reasonable proportion to niacin intake(65). As in the case of the erythrocyte pyridine nucleotides (nicotinamidecoenzymes), NAD concentration decreased by 70% whereas NADPremained unchanged in adult males fed diets with only 6 or 10mgNEs/day(67). Erythrocyte NAD provided a marker that was at least as sensitive asurinary metabolites of niacin in this study (67) and in a niacin depletion studyof elderly subjects (68).
9.4.3 Factors affecting requirementsThe biosynthesis of niacin derivatives on the pathway to nicotinamide coen-zymes stems from tryptophan, an essential amino acid found in protein, andas such, this source of NE increases niacin intake. There are several dietary,drug, and disease factors that reduce the conversion of tryptophan to niacin(61), such as the use of oral contraceptives (69). Although a 60-to-1 conver-sion factor represents the average for human utilization of tryptophan as anNE, there are substantial individual differences (70, 71). There is also an inter-dependence of enzymes within the tryptophan-to-niacin pathway wherevitamin B6 (as pyridoxal phosphate) and riboflavin (as FAD) are functional.
P164-193 3/12/05 17:06 Page 174
Further, riboflavin (as FMN) is required for the oxidase that forms coenzymicPLP from the alcohol and amine forms of phosphorylated vitamin B6 (49).
9.4.4 Evidence used to derive recommended intakesNiacin content of human milk is approximately 1.5mg/l (12.3mmol/l) and thetryptophan content is 210mg/l (1.0mmol/l) (21). Hence, the total content isapproximately 5mgNEs/l or 4mgNEs/0.75 l secreted daily in human milk.Recent studies (64, 70) together with those reported in the 1950s suggest that12.5mgNEs, which corresponds to 5.6mgNEs/4184kJ, is minimally suffi-cient for niacin intake in adults.
For pregnant women, where 230MJ is the estimated energy cost of pregnancy, calculated needs above those of non-pregnant women are 5.6mgNEs/4186kJ (1000kcal) ¥ 230000kJ (55000kcal), or 308mgNEs for the entirepregnancy or 1.7mgNEs/day (308mgNEs/180 days) for the second and thirdtrimester, which is about a 10% increase. In addition, about 2mgNEs/day isrequired for growth in maternal and fetal compartments (6).
For lactating women, an estimated 1.4mg preformed niacin is secreted daily,and an additional requirement of less than 1mg is needed to support theenergy expenditure of lactation. Hence, 2.4mgNEs/day is the additionalrequirement for lactating women.
9.4.5 Recommended nutrient intakes for niacinThe recommendations for niacin are given in Table 9.4.
9.5 Vitamin B6
9.5.1 BackgroundDeficiencyA deficiency of vitamin B6 alone is uncommon because it usually occurs inassociation with a deficit in other B-complex vitamins (72). Early biochemi-cal changes include decreased levels of plasma pyridoxal 5¢-phosphate (PLP)and urinary 4-pyridoxic acid. These are followed by decreases in synthesis oftransaminases (aminotransferases) and other enzymes of amino acid metabo-lism such that there is an increased presence of xanthurenate in the urine anda decreased glutamate conversion to the anti-neurotransmitter g-aminobu-tyrate. Hypovitaminosis B6 may often occur with riboflavin deficiency,because riboflavin is needed for the formation of the coenzyme PLP. Infantsare especially susceptible to insufficient intakes, which can lead to epilepti-form convulsions. Skin changes include dermatitis with cheilosis and glos-sitis. Moreover, there is usually a decrease in circulating lymphocytes and
9. THIAMINE, RIBOFLAVIN, NIACIN, VITAMIN B6, PANTOTHENIC ACID, AND BIOTIN
175
P164-193 3/12/05 17:06 Page 175
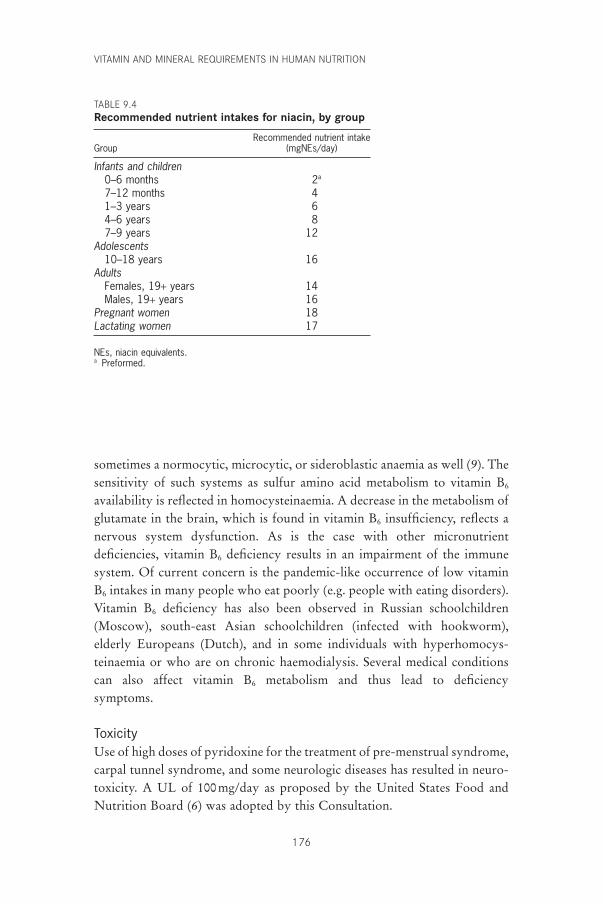
VITAMIN AND MINERAL REQUIREMENTS IN HUMAN NUTRITION
176
sometimes a normocytic, microcytic, or sideroblastic anaemia as well (9). Thesensitivity of such systems as sulfur amino acid metabolism to vitamin B6
availability is reflected in homocysteinaemia. A decrease in the metabolism ofglutamate in the brain, which is found in vitamin B6 insufficiency, reflects anervous system dysfunction. As is the case with other micronutrient deficiencies, vitamin B6 deficiency results in an impairment of the immunesystem. Of current concern is the pandemic-like occurrence of low vitaminB6 intakes in many people who eat poorly (e.g. people with eating disorders).Vitamin B6 deficiency has also been observed in Russian schoolchildren(Moscow), south-east Asian schoolchildren (infected with hookworm),elderly Europeans (Dutch), and in some individuals with hyperhomocys-teinaemia or who are on chronic haemodialysis. Several medical conditionscan also affect vitamin B6 metabolism and thus lead to deficiency symptoms.
ToxicityUse of high doses of pyridoxine for the treatment of pre-menstrual syndrome,carpal tunnel syndrome, and some neurologic diseases has resulted in neuro-toxicity. A UL of 100mg/day as proposed by the United States Food andNutrition Board (6) was adopted by this Consultation.
TABLE 9.4Recommended nutrient intakes for niacin, by group
Recommended nutrient intakeGroup (mgNEs/day)
Infants and children0–6 months 2a
7–12 months 41–3 years 64–6 years 87–9 years 12
Adolescents10–18 years 16
AdultsFemales, 19+ years 14Males, 19+ years 16
Pregnant women 18Lactating women 17
NEs, niacin equivalents.a Preformed.
P164-193 3/12/05 17:06 Page 176
Role in human metabolic processesThere are three natural vitamers (different forms of the vitamin) of vitaminB6, namely pyridoxine, pyridoxamine, and pyridoxal. All three must be phos-phorylated and the 5¢-phosphates of the first two vitamers are oxidized to thefunctional PLP, which serves as a carbonyl-reactive coenzyme to a number ofenzymes involved in the metabolism of amino acids. Such enzymes includeaminotransferases, decarboxylases, and dehydratases; d-aminolevulinate syn-thase in haem biosynthesis; and phosphorylase in glycogen breakdown andsphingoid base biosynthesis (10, 11).
9.5.2 Biochemical indicatorsIndicators used to estimate vitamin B6 requirements are PLP, urinary excre-tion, erythrocyte aminotransferases activity coefficients, tryptophan catabo-lites, erythrocyte and whole blood PLP, and plasma homocysteine. PLP is themajor form of vitamin B6 in all tissues and the plasma PLP concentrationreflects liver PLP. Plasma PLP changes fairly slowly in response to vitaminintake. The excretion rate of vitamin B6 and particularly its catabolite, 4-pyridoxate, reflects intake. Erythrocyte aminotransferases for aspartate andalanine reflect PLP levels and show large variations in activity coefficients.The urinary excretion of xanthurenate, a tryptophan catabolite, is typicallyused after a tryptophan load test.
Vitamin B6 status is most appropriately evaluated by using a combinationof the above indicators, including those considered as direct indicators (e.g.vitamer concentration in cells or fluids) and those considered to be indirector functional indicators (e.g. erythrocyte aminotransferase saturation by PLPor tryptophan metabolites) (9). Plasma PLP may be the best single indicatorbecause it appears to reflect tissue stores (73). Kretsch et al. (74) found thatdiets containing less than 0.05mg vitamin B6 given to 11 young women led toabnormal electroencephalograph patterns in two of the women and a plasmaPLP concentration of approximately 9nmol/l. Hence, a level ofabout 10nmol/lis considered sub-optimal. A plasma PLP concentration of 20nmol/l has been proposed as an index of adequacy (6) based on recent findings (73, 75).Plasma PLP levels have been reported to fall with age (6, 76). Urinary 4-pyridoxic acid level responds quickly to changes in vitamin B6 intake (73) andis therefore of questionable value in assessing status. However, a value higherthan 3mmol/day, achieved with an intake of approximately 1mg/day, has beensuggested to reflect adequate intake (77). Erythrocyte aminotransferases foraspartate and alanine are commonly measured before and after addition ofPLP to ascertain amounts of apoenzymes, the proportion of which increaseswith vitamin B6 depletion. Values of 1.5–1.6 for the aspartate aminotransferase
9. THIAMINE, RIBOFLAVIN, NIACIN, VITAMIN B6, PANTOTHENIC ACID, AND BIOTIN
177
P164-193 3/12/05 17:06 Page 177
VITAMIN AND MINERAL REQUIREMENTS IN HUMAN NUTRITION
178
and approximately 1.2 for the alanine aminotransferase have been suggestedas being adequate (9, 77). Catabolites from tryptophan and methionine havealso been used to assess vitamin B6 status. In a review of the relevant litera-ture, Leklem (77) suggested that a 24-hour urinary excretion of less than 65mmol xanthurenate after a 2-g oral dose of tryptophan indicates normalvitamin B6 status.
9.5.3 Factors affecting requirementsA recent review by Gregory (78) confirms that bioavailability of vitamin B6
in a mixed diet is about 75% (79), with approximately 8% of this total contributed by pyridoxine b-d-glucoside, which is about half as effectivelyutilized (78) as free B6 vitamers or their phosphates. The amine and aldehydeforms of vitamin B6 are probably about 10% less effective than pyridoxine(80). Despite the involvement of PLP with many enzymes affecting aminoacid metabolism, there seems to be only a slight effect of dietary proteins on vitamin B6 status (81). Several studies have reported decreases in indica-tors of vitamin B6 status in women receiving oral contraceptives (82, 83), butthis probably reflects hormonal stimulation of tryptophan catabolism rather than any deficiency of vitamin B6 per se. Subjects with pre-eclampsia oreclampsia have plasma PLP levels lower than those of healthy pregnantwomen (84, 85).
9.5.4 Evidence used to derive recommended intakesThe average intake of vitamin B6 for infants, based on human-milk content,is 0.13mg/l/day (86) or 0.1mg/0.75 l/day. With an average maternal dietaryintake of vitamin B6 of 1.4mg/day, human milk was found to contain 0.12mg/l, and plasma PLP of nursing infants averaged 54nmol/l (87). Extrapolation on the basis of metabolic body size, weight, and growth suggests 0.3mg/day as an adequate intake for infants 6–12 months of age (6).Information on vitamin B6 requirements for children is limited, but Heiskanen et al. (88) found an age-related decrease in erythrocyte PLP andan increase in the aspartate aminotransferase activation. However, this age-related decrease in erythrocyte PLP may accompany normal growth andhealth rather than reflect real deficiency.
In a review of earlier studies of men with various protein intakes,Linkswiler (89) concluded that normalization of a tryptophan load testrequired 1.0–1.5mg vitamin B6. Miller et al. (90) found that 1.6mg vitamin B6
led to plasma PLP levels above 30nmol/l for young men with various proteinintakes. From several investigations of young women (91–94), a requirementcloser to 1.0–1.2mg vitamin B6 could be estimated.
P164-193 3/12/05 17:06 Page 178
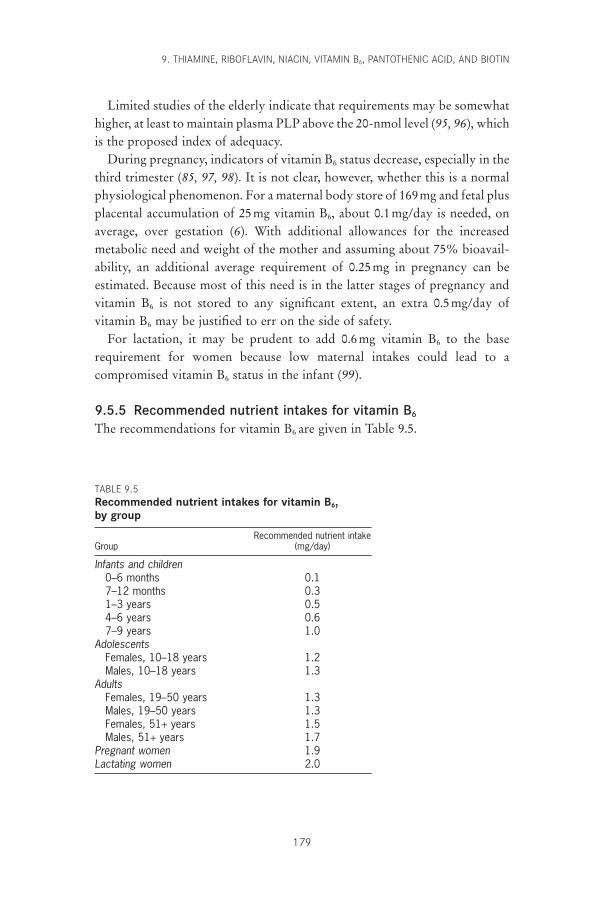
Limited studies of the elderly indicate that requirements may be somewhathigher, at least to maintain plasma PLP above the 20-nmol level (95, 96), whichis the proposed index of adequacy.
During pregnancy, indicators of vitamin B6 status decrease, especially in thethird trimester (85, 97, 98). It is not clear, however, whether this is a normalphysiological phenomenon. For a maternal body store of 169mg and fetal plusplacental accumulation of 25mg vitamin B6, about 0.1mg/day is needed, onaverage, over gestation (6). With additional allowances for the increased metabolic need and weight of the mother and assuming about 75% bioavail-ability, an additional average requirement of 0.25mg in pregnancy can be estimated. Because most of this need is in the latter stages of pregnancy andvitamin B6 is not stored to any significant extent, an extra 0.5mg/day ofvitamin B6 may be justified to err on the side of safety.
For lactation, it may be prudent to add 0.6mg vitamin B6 to the baserequirement for women because low maternal intakes could lead to a compromised vitamin B6 status in the infant (99).
9.5.5 Recommended nutrient intakes for vitamin B6
The recommendations for vitamin B6 are given in Table 9.5.
9. THIAMINE, RIBOFLAVIN, NIACIN, VITAMIN B6, PANTOTHENIC ACID, AND BIOTIN
179
TABLE 9.5Recommended nutrient intakes for vitamin B6, by group
Recommended nutrient intakeGroup (mg/day)
Infants and children0–6 months 0.17–12 months 0.31–3 years 0.54–6 years 0.67–9 years 1.0
AdolescentsFemales, 10–18 years 1.2Males, 10–18 years 1.3
AdultsFemales, 19–50 years 1.3Males, 19–50 years 1.3Females, 51+ years 1.5Males, 51+ years 1.7
Pregnant women 1.9Lactating women 2.0
P164-193 3/12/05 17:06 Page 179
VITAMIN AND MINERAL REQUIREMENTS IN HUMAN NUTRITION
180
9.6 Pantothenate9.6.1 BackgroundDeficiencyThe widespread occurrence of releasable pantothenic acid in food makes adietary deficiency unlikely (8, 9, 100, 101). If a deficiency occurs, it is usuallyaccompanied by deficits of other nutrients. The use of experimental animals,an antagonistic analogue (w-methylpantothenate) given to humans, and morerecently, the feeding of semi-synthetic diets virtually free of pantothenate(102), have all helped to define signs and symptoms of deficiency. Subjectsbecome irascible; develop postural hypotension; have rapid heart rate on exer-tion; suffer epigastric distress with anorexia and constipation; experiencenumbness and tingling of the hands and feet (“burning feet” syndrome); andhave hyperactive deep tendon reflexes and weakness of finger extensormuscles. Some cases of pantothenate deficiency have been observed in patientswith acne and other dermatitic conditions.
ToxicityToxicity is not a problem with pantothenate, as no adverse effects have beenobserved (6).
Role in human metabolic processesPantothenic acid is a component of CoA, a cofactor that carries acyl groupsfor many enzymatic processes, and of phosphopantetheine within acyl carrierproteins, a component of the fatty acid synthase complex (10, 11). The compounds containing pantothenate are most especially involved in fatty acidmetabolism and the pantothenate-containing prosthetic group additionallyfacilitates binding with appropriate enzymes.
9.6.2 Biochemical indicatorsIndicators used to estimate pantothenate requirements are urinary excretionand blood levels. Excretion rate reflects intake. Whole blood, which containsthe vitamin itself and pantothenate-containing metabolites, has a general cor-relation with intake; erythrocyte levels, however, seem more meaningful thanplasma or serum levels.
Relative correspondence to pantothenate status has been reported forurinary excretion and for blood content of both whole blood and erythro-cytes (6, 9). Fry et al. (102) reported a decline in urinary pantothenate levelsfrom approximately 3 to 0.8mg/day (13.7–3.6mmol/day) in young men fed adeficient diet for 84 days. Urinary excretion for a typical American diet wasfound to be 2.6mg/day (12mmol/day) (79). Pantothenate intake estimated for
P164-193 3/12/05 17:06 Page 180
adolescents was significantly correlated with pantothenate in urine (103).Whole-blood pantothenate fell from 1.95 to 1.41mg/ml (8.8 to 6.4mmol/l)when six adult males were fed a pantothenate-free diet (102). Whole-bloodcontent corresponded to intake (103), and the range in whole blood wasreported to be 1.57–2.66mg/ml (7.2–12.1mmol/l) (104). There is an excellentcorrelation of whole-blood concentrations of pantothenate with the erythro-cyte con-centration, with an average value being 334ng/ml (1.5mmol/l) (103).The lack of sufficient population data, however, suggests the current use ofan adequate intake rather than a recommended intake as a suitable basis for recommendations.
9.6.3 Factors affecting requirementsA measurement of urinary excretion of pantothenate after feeding a formula diet containing both bound and free vitamin indicates that approximately 50% of the pantothenate present in natural foods may bebioavailable (79).
9.6.4 Evidence used to derive recommended intakesInfant requirements are based on an estimation of the pantothenic acid content of human milk, which according to reported values is at least 2.2mg/l (21, 105). For a reported average human-milk intake of 0.75 l/day(106–108) these values suggest that 1.7mg/day is an adequate intake byyounger (0–6 months) infants. Taking into consideration growth and body size, 1.8mg/day may be extrapolated for older (7–12 months) infants(105).
The studies of Eissenstat et al. (103) of adolescents suggest that intakes of less than 4mg/day were sufficient to maintain blood and urinary pan-tothenate. Kathman and Kies (109) found a range of pantothenate intake of 4mg/day to approximately 8mg/day in 12 adolescents who were 11–16 yearsold. The usual pantothenate intake for American adults has been reported to be 4–7mg/day (102, 109–111). Hence, around 5mg/day is apparently adequate.
For pregnancy, there is only one relatively recent study that found lowerblood pantothenate levels but no difference in urinary excretion in pregnantwomen compared with non-pregnant controls (112).
During lactation, blood pantothenate concentrations were found to be significantly lower at 3 months postpartum (112). Given a loss of 1.7mg/day(7.8mmol/day) through milk supply and lower maternal blood concentrationscorresponding to intakes of about 5–6mg/day, the recommended intake for alactating woman may be increased to 7mg/day.
9. THIAMINE, RIBOFLAVIN, NIACIN, VITAMIN B6, PANTOTHENIC ACID, AND BIOTIN
181
P164-193 3/12/05 17:06 Page 181
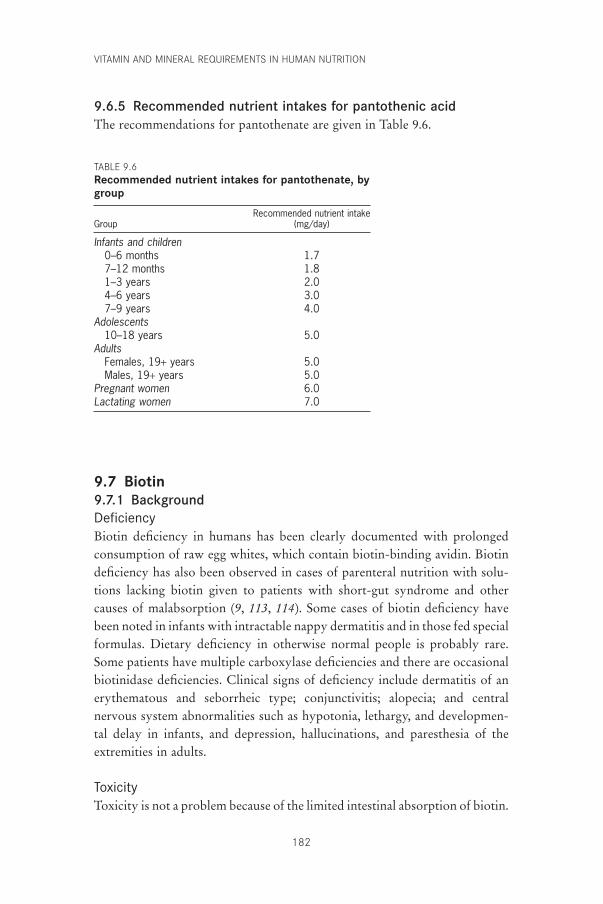
VITAMIN AND MINERAL REQUIREMENTS IN HUMAN NUTRITION
182
9.6.5 Recommended nutrient intakes for pantothenic acidThe recommendations for pantothenate are given in Table 9.6.
TABLE 9.6Recommended nutrient intakes for pantothenate, bygroup
Recommended nutrient intakeGroup (mg/day)
Infants and children0–6 months 1.77–12 months 1.81–3 years 2.04–6 years 3.07–9 years 4.0
Adolescents10–18 years 5.0
AdultsFemales, 19+ years 5.0Males, 19+ years 5.0
Pregnant women 6.0Lactating women 7.0
9.7 Biotin9.7.1 BackgroundDeficiencyBiotin deficiency in humans has been clearly documented with prolongedconsumption of raw egg whites, which contain biotin-binding avidin. Biotindeficiency has also been observed in cases of parenteral nutrition with solu-tions lacking biotin given to patients with short-gut syndrome and othercauses of malabsorption (9, 113, 114). Some cases of biotin deficiency havebeen noted in infants with intractable nappy dermatitis and in those fed specialformulas. Dietary deficiency in otherwise normal people is probably rare.Some patients have multiple carboxylase deficiencies and there are occasionalbiotinidase deficiencies. Clinical signs of deficiency include dermatitis of anerythematous and seborrheic type; conjunctivitis; alopecia; and centralnervous system abnormalities such as hypotonia, lethargy, and developmen-tal delay in infants, and depression, hallucinations, and paresthesia of theextremities in adults.
ToxicityToxicity is not a problem because of the limited intestinal absorption of biotin.
P164-193 3/12/05 17:06 Page 182
Role in human metabolic processesBiotin functions as a coenzyme within several carboxylases after its carboxylfunctional group becomes amide linked to the e-amino of specific lysylresidues of the apoenzymes (10, 11). In humans and other mammals, biotinoperates within four carboxylases. Three of the four biotin-dependent car-boxylases are mitochondrial (pyruvate carboxylase, methylcrotonyl-CoAcarboxylase, and propionyl-CoA carboxylase) whereas the fourth (acetyl-CoA carboxylase) is found in both mitochondria and the cytosol. In all thesecases, biotin serves as a carrier for the transfer of active bicarbonate into a substrate to generate a carboxyl product.
9.7.2 Biochemical indicatorsIndicators used to estimate biotin requirements are urinary excretion of biotinand excretion of 3-hydroxyisovalerate. The excretion rate of the vitamin and its metabolites in urine is assessed by avidin-based radioimmunoassaywith HPLC. Excretion of 3-hydroxyisovalerate inversely reflects the activityof b-methylcrotonyl-CoA carboxylase, which is involved in leucine metabolism.
Both indicators, urinary excretion of biotin as assessed with an avidin-basedradioimmunoassay with HPLC, and 3-hydroxyisovalerate excretion havebeen used to assess status (115). The isolation and chemical identification ofmore than a dozen metabolites of biotin established the main features of itsfunction in microbes and mammals (116, 117). Zempleni et al. have quanti-fied the major biotin metabolites (118). Both biotin and bis-norbiotin excre-tions were found to decline in parallel in individuals on a diet containing rawegg whites (115). In these individuals the levels of urinary 3-hydroxyiso-valerate, which increase as a result of decreased activity of b-methylcrotonyl-CoA carboxylase and altered leucine metabolism, rose from a normal meanof 112 to 272mmol/24 hours. Decreased excretion of biotin, abnormallyincreased excretion of 3-hydroxyisovalerate, or both have been associatedwith overt cases of biotin deficiency (119–124). The lack of sufficient popu-lation data, however, suggests the current use of an adequate intake rather thana recommended intake as a suitable basis for recommendations.
9.7.3 Evidence used to derive recommended intakesThe biotin content of human milk is estimated to be approximately 6mg/l (24nmol/l) based on several studies (125–127) that report values ranging fromabout 4 to 7mg/l (16.4–28.9nmol/l). Hence, the estimated intake of biotin foran infant consuming 0.75 l of human milk per day is 5mg/day during the firsthalf-year and for older infants (7–12 months of age) is perhaps 6mg/day.
9. THIAMINE, RIBOFLAVIN, NIACIN, VITAMIN B6, PANTOTHENIC ACID, AND BIOTIN
183
P164-193 3/12/05 17:06 Page 183
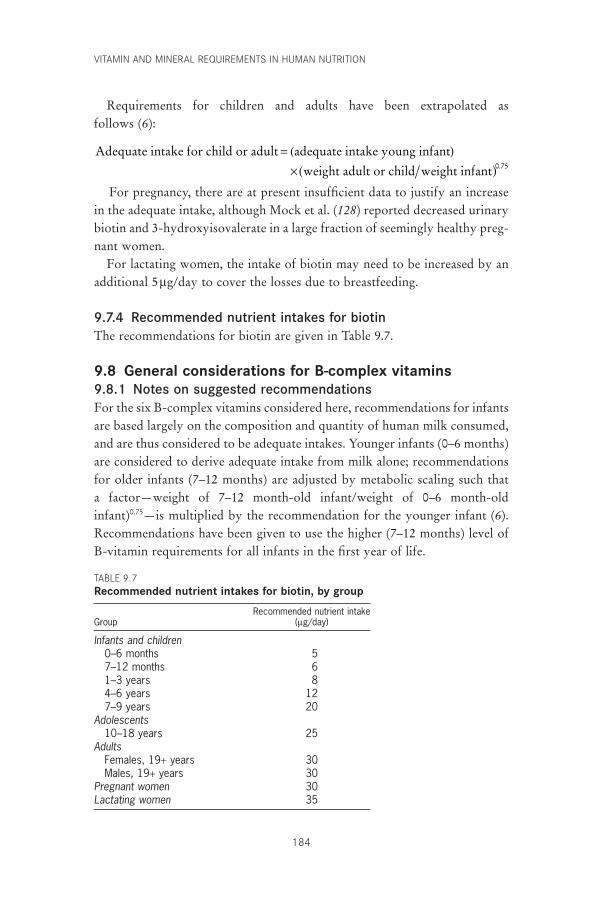
VITAMIN AND MINERAL REQUIREMENTS IN HUMAN NUTRITION
184
Requirements for children and adults have been extrapolated as follows (6):
For pregnancy, there are at present insufficient data to justify an increasein the adequate intake, although Mock et al. (128) reported decreased urinarybiotin and 3-hydroxyisovalerate in a large fraction of seemingly healthy preg-nant women.
For lactating women, the intake of biotin may need to be increased by anadditional 5mg/day to cover the losses due to breastfeeding.
9.7.4 Recommended nutrient intakes for biotinThe recommendations for biotin are given in Table 9.7.
9.8 General considerations for B-complex vitamins9.8.1 Notes on suggested recommendationsFor the six B-complex vitamins considered here, recommendations for infantsare based largely on the composition and quantity of human milk consumed,and are thus considered to be adequate intakes. Younger infants (0–6 months)are considered to derive adequate intake from milk alone; recommendationsfor older infants (7–12 months) are adjusted by metabolic scaling such that a factor—weight of 7–12 month-old infant/weight of 0–6 month-oldinfant)0.75—is multiplied by the recommendation for the younger infant (6).Recommendations have been given to use the higher (7–12 months) level ofB-vitamin requirements for all infants in the first year of life.
Adequate intake for child or adult adequate intake young infant
weight adult or child weight infant
= ( )¥( )0 75.
TABLE 9.7Recommended nutrient intakes for biotin, by group
Recommended nutrient intakeGroup (mg/day)
Infants and children0–6 months 57–12 months 61–3 years 84–6 years 127–9 years 20
Adolescents10–18 years 25
AdultsFemales, 19+ years 30Males, 19+ years 30
Pregnant women 30Lactating women 35
P164-193 3/12/05 17:06 Page 184
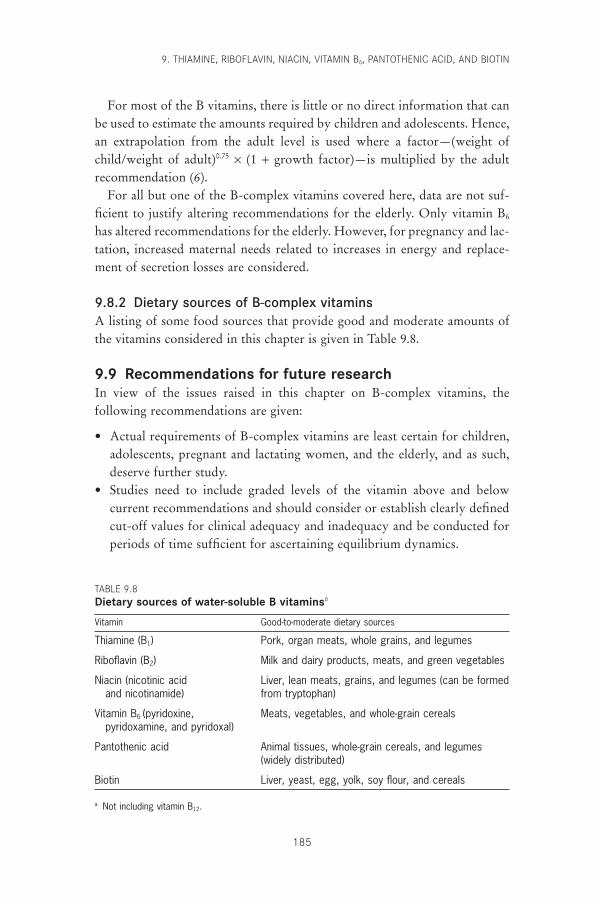
For most of the B vitamins, there is little or no direct information that canbe used to estimate the amounts required by children and adolescents. Hence,an extrapolation from the adult level is used where a factor—(weight ofchild/weight of adult)0.75 ¥ (1 + growth factor)—is multiplied by the adult recommendation (6).
For all but one of the B-complex vitamins covered here, data are not suf-ficient to justify altering recommendations for the elderly. Only vitamin B6
has altered recommendations for the elderly. However, for pregnancy and lac-tation, increased maternal needs related to increases in energy and replace-ment of secretion losses are considered.
9.8.2 Dietary sources of B-complex vitaminsA listing of some food sources that provide good and moderate amounts ofthe vitamins considered in this chapter is given in Table 9.8.
9.9 Recommendations for future researchIn view of the issues raised in this chapter on B-complex vitamins, the following recommendations are given:
• Actual requirements of B-complex vitamins are least certain for children,adolescents, pregnant and lactating women, and the elderly, and as such,deserve further study.
• Studies need to include graded levels of the vitamin above and belowcurrent recommendations and should consider or establish clearly definedcut-off values for clinical adequacy and inadequacy and be conducted forperiods of time sufficient for ascertaining equilibrium dynamics.
9. THIAMINE, RIBOFLAVIN, NIACIN, VITAMIN B6, PANTOTHENIC ACID, AND BIOTIN
185
TABLE 9.8Dietary sources of water-soluble B vitaminsa
Vitamin Good-to-moderate dietary sources
Thiamine (B1) Pork, organ meats, whole grains, and legumes
Riboflavin (B2) Milk and dairy products, meats, and green vegetables
Niacin (nicotinic acid Liver, lean meats, grains, and legumes (can be formedand nicotinamide) from tryptophan)
Vitamin B6 (pyridoxine, Meats, vegetables, and whole-grain cerealspyridoxamine, and pyridoxal)
Pantothenic acid Animal tissues, whole-grain cereals, and legumes(widely distributed)
Biotin Liver, yeast, egg, yolk, soy flour, and cereals
a Not including vitamin B12.
P164-193 3/12/05 17:06 Page 185
VITAMIN AND MINERAL REQUIREMENTS IN HUMAN NUTRITION
186
• For status indicators, additional functional tests would be useful forriboflavin (e.g. the activity of FMN-dependent pyridoxine [pyridoxamine]5¢-phosphate oxidase in erythrocytes), niacin (e.g. sensitive blood meas-ures, especially of NAD), and perhaps pantothenate.
• The food content and bioavailability of pantothenate and biotin needfurther investigation to establish the available and preferred food sourcesreasonable for different populations.
Primary efforts should now be in the arena of public health and nutrition edu-cation with emphasis on directing people and their governments to availableand healthful foods; the care necessary for their storage and preparation; andachievable means for adjusting intake with respect to age, sex, and healthstatus.
References1. Report on the nutrition situation of refugees and displaced populations.
Geneva, United Nations Administrative Committee on Coordination, Subcommittee on Nutrition, 1998 (Refugee Nutrition Information System,25).
2. Sadun A et al. Epidemic optic neuropathy in Cuba: eye findings. Archives ofOphthalmology, 1994, 112:691–699.
3. Ordunez-Garcia O et al. Cuban epidemic neuropathy, 1991–1994: historyrepeats itself a century after the “amblyopia of the blockade”. AmericanJournal of Public Health, 1996, 86:738–743.
4. Hedges R et al. Epidemic optic and peripheral neuropathy in Cuba: a uniquegeopolitical public health problem. Survey of Ophthalmology, 1997,41:341–353.
5. Passmore R, Nicol BM, Narayana Rao M. Handbook on human nutritionalrequirements. Geneva, World Health Organization, 1974 (WHO MonographSeries, No. 61).
6. Food and Nutrition Board. Dietary reference intakes for thiamin, riboflavin,niacin, vitamin B6, folate, vitamin B12, pantothenic acid, biotin, and choline.Washington, DC, National Academy Press, 1998.
7. McCormick DB. Thiamin. In: Shils ME, Young VR, eds. Modern nutrition inhealth and disease, 6th ed. Philadelphia, PA, Lea & Febiger, 1988:355–361.
8. McCormick DB. Vitamin, Structure and function of. In: Meyers RA, ed.Encyclopedia of molecular biology and molecular medicine, Vol. 6. Weinheim,VCH (Verlag Chemie), 1997:244–252.
9. McCormick DB, Greene HL. Vitamins. In: Burtis VA, Ashwood ER, eds.Tietz textbook of clinical chemistry, 2nd ed. Philadelphia, PA, WB Saunders,1994:1275–1316.
10. McCormick DB. Coenzymes, Biochemistry of. In: Meyers RA, ed. Encyclo-pedia of molecular biology and molecular medicine, Vol. 1. Weinheim, VCH(Verlag Chemie), 1996:396–406.
11. McCormick DB. Coenzymes, Biochemistry. In: Dulbecco R, ed. Encyclope-dia of human biology, 2nd ed. San Diego, CA, Academic Press, 1997:847–864.
12. Bayliss RM et al. Urinary thiamine excretion after oral physiological doses of
P164-193 3/12/05 17:06 Page 186
the vitamin. International Journal of Vitamin and Nutrition Research, 1984,54:161–164.
13. Gans DA, Harper AE. Thiamin status of incarcerated and nonincarceratedadolescent males: dietary intake and thiamin pyrophosphate response. American Journal of Clinical Nutrition, 1991, 53:1471–1475.
14. Schrijver J. Biochemical markers for micronutrient status and their interpre-tation. In: Pietrzik K, ed. Modern lifestyles, lower energy intake and micronu-trient status. Heidelberg, Springer-Verlag, 1991:55–85.
15. Bailey AL et al. Thiamin intake, erythrocyte transketolase (EC 2.2.1.1) activ-ity and total erythrocyte thiamin in adolescents. British Journal of Nutrition,1994, 72:111–125.
16. Singleton CK et al. The thiamin-dependent hysteretic behavior of humantransketolase: implications for thiamine deficiency. Journal of Nutrition, 1995,125:189–194.
17. Baines M, Davies G. The evaluation of erythrocyte thiamin diphosphate asan indicator of thiamin status in man, and its comparison with erythrocytetransketolase activity measurements. Annals of Clinical Biochemistry, 1988,25:698–705.
18. Gerrits J et al. Determination of thiamin and thiamin phosphates in wholeblood by reversed-phase liquid chromatography with precolumn derivatiza-tion. In: McCormick DB, Suttie JW, Wagner C, eds. Methods in enzymology.Vitamins and coenzymes. San Diego, CA, Academic Press, 1997, 279:74–82.
19. Fogelholm M et al. Dietary intake and thiamin, iron, and zinc status in eliteNordic skiers during different training periods. International Journal of SportNutrition, 1992, 2:351–365.
20. van der Beek EJ et al. Thiamin, riboflavin and vitamin B6: impact of restrictedintake on physical performance in man. Journal of American College of Nutri-tion, 1994, 13:629–640.
21. Committee on Nutrition. Composition of human milk: normative data. In:Forbes GB, Woodruff CW, eds. Pediatric nutrition handbook, 2nd ed. ElkGrove Village, IL, American Academy of Pediatrics, 1985:363–368.
22. Wyatt DT, Nelson D, Hillman RE. Age-dependent changes in thiamin con-centrations in whole blood and cerebrospinal fluid in infants and children.American Journal of Clinical Nutrition, 1991, 53:530–536.
23. Sauberlich HE et al. Thiamin requirement of the adult human. AmericanJournal of Clinical Nutrition, 1979, 32:2237–2248.
24. Wood B et al. A study of partial thiamin restriction in human volunteers.American Journal of Clinical Nutrition, 1980, 33:848–861.
25. Anderson SH, Charles TJ, Nicol AD. Thiamine deficiency at a district generalhospital: report of five cases. Quarterly Journal of Medicine, 1985, 55:15–32.
26. Hoorn RK, Flikweert JP, Westerink D. Vitamin B-1, B-2 and B-6 deficien-cies in geriatric patients, measured by coenzyme stimulation of enzyme activ-ities. Clinica Chemica Acta, 1975, 61:151–162.
27. Nichols HK, Basu TK. Thiamin status of the elderly: dietary intake andthiamin pyrophosphate response. Journal of American College of Nutrition,1994, 13:57–61.
28. Food and Nutrition Board. Nutrition during pregnancy. Part I. Weight gain.Part II. Nutrient supplements. Washington, DC, National Academy Press,1990.
9. THIAMINE, RIBOFLAVIN, NIACIN, VITAMIN B6, PANTOTHENIC ACID, AND BIOTIN
187
P164-193 3/12/05 17:06 Page 187
VITAMIN AND MINERAL REQUIREMENTS IN HUMAN NUTRITION
188
29. McCormick DB. Riboflavin. In: Shils ME, Olson JA, Shike M, eds. Modernnutrition in health and disease, 8th ed. Philadelphia, PA, Lea & Febiger,1994:366–375.
30. Smith MD. Rapid method for determination of riboflavin in urine by high-performance liquid chromatography. Journal of Chromatography, 1980,182:285–291.
31. Chastain JL, McCormick DB. Flavin catabolites: identification and quantita-tion in human urine. American Journal of Clinical Nutrition, 1987,46:830–834.
32. Roughead ZK, McCormick DB. Urinary riboflavin and its metabolites:effects of riboflavin supplementation in healthy residents of rural Georgia(USA). European Journal of Clinical Nutrition, 1991, 45:299–307.
33. Aw T-Y, Jones DP, McCormick DB. Uptake of riboflavin by isolated rat livercells. Journal of Nutrition, 1983, 113:1249–1254.
34. Nichoalds GE. Riboflavin. Symposium in laboratory medicine. In: LabbaeRF, ed. Symposium on Laboratory Assessment of Nutritional Status. Clinics inLaboratory Medicine Series, Vol. 1. Philadelphia, PA, WB Saunders, 1981,1:685–698.
35. Sadowski JA. Riboflavin. In: Hartz SC, Russell RM, Rosenberg IH, eds.Nutrition in the elderly. The Boston Nutritional Status Survey. London,Smith-Gordon, 1992:119–125.
36. Ramsay VP et al. Vitamin cofactor saturation indices for riboflavin, thiamine,and pyridoxine in placental tissue of Kenyan women. American Journal ofClinical Nutrition, 1983, 37:969–973.
37. Belko AZ et al. Effects of exercise on riboflavin requirements of youngwomen. American Journal of Clinical Nutrition, 1983, 37:509–517.
38. Belko AZ et al. Effects of aerobic exercise and weight loss on riboflavinrequirements of moderately obese, marginally deficient young women. American Journal of Clinical Nutrition, 1984, 40:553–561.
39. Belko AZ et al. Effects of exercise on riboflavin requirements: biological validation in weight reducing women. American Journal of Clinical Nutri-tion, 1985, 41:270–277.
40. Soares MJ et al. The effect of exercise on the riboflavin status of adult men.British Journal of Nutrition, 1993, 69:541–551.
41. Winters LR et al. Riboflavin requirements and exercise adaptation in olderwomen. American Journal of Clinical Nutrition, 1992, 56:526–532.
42. Powers HJ et al. Bicycling performance in Gambian children: effects of supplements of riboflavin or ascorbic acid. Human Nutrition and ClinicalNutrition, 1987, 41:59–69.
43. Prasad AP et al. Functional impact of riboflavin supplementation in urbanschool children. Nutrition Research, 1990, 10:275–281.
44. Tremblay A et al. The effects of a riboflavin supplementation on the nutri-tional status and performance of elite swimmers. Nutrition Research, 1984,4:201–208.
45. Weight LM, Myburgh KH, Noakes TD. Vitamin and mineral supplementa-tion: effect on the running performance of trained athletes. American Journalof Clinical Nutrition, 1988, 47:192–195.
46. Zempleni J, Galloway JR, McCormick DB. Pharmacokinetics of orally andintravenously administered riboflavin in healthy humans. American Journalof Clinical Nutrition, 1996, 63:54–66.
47. Chia CP, Addison R, McCormick DB. Absorption, metabolism, and excre-
P164-193 3/12/05 17:06 Page 188
tion of 8a-(amino acid)-riboflavins in the rat. Journal of Nutrition, 1978,108:373–381.
48. Boisvert WA et al. Riboflavin requirement of healthy elderly humans and itsrelationship to macronutrient composition of the diet. Journal of Nutrition,1993, 123:915–925.
49. McCormick DB. Two interconnected B vitamins: riboflavin and pyridoxine.Physiological Reviews, 1989, 69:1170–1198.
50. Roe DA et al. Factors affecting riboflavin requirements of oral contraceptiveusers and nonusers. American Journal of Clinical Nutrition, 1982, 35:495–501.
51. Thomas MR et al. The effects of vitamin C, vitamin B6, vitamin B12, folicacid, riboflavin, and thiamin on the breast milk and maternal status of well-nourished women at 6 months postpartum. American Journal of ClinicalNutrition, 1980, 33:2151–2156.
52. Roughead ZK, McCormick DB. Flavin composition of human milk. Ameri-can Journal of Clinical Nutrition, 1990, 52:854–857.
53. Roughead ZK, McCormick DB. A qualitative and quantitative assessment offlavins in cow’s milk. Journal of Nutrition, 1990, 120:382–388.
54. Bamji MS et al. Enzymatic evaluation of riboflavin status of infants. Euro-pean Journal of Clinical Nutrition, 1991, 45:309–313.
55. Bates CJ et al. Riboflavin status of adolescent vs. elderly Gambian subjectsbefore and during supplementation. American Journal of Clinical Nutrition,1989, 50:825–829.
56. Kuizon MD et al. Riboflavin requirement of Filipino women. EuropeanJournal of Clinical Nutrition, 1992, 46:257–264.
57. Alexander M et al. Relation of riboflavin nutriture in healthy elderly to intakeof calcium and vitamin supplements: evidence against riboflavin supplemen-tation. American Journal of Clinical Nutrition, 1984, 39:540–546.
58. Bates CJ et al. Riboflavin status in Gambian pregnant and lactating womenand its implications for recommended dietary allowances. American Journalof Clinical Nutrition, 1981, 34:928–935.
59. Vir SC, Love AH, Thompson W. Riboflavin status during pregnancy. American Journal of Clinical Nutrition, 1981, 34:2699–2705.
60. Badart-Smook A et al. Fetal growth is associated positively with maternal intake of riboflavin and negatively with maternal intake of linoleic acid. Journal of the American Dietetic Association, 1997,97:867–870.
61. McCormick DB. Niacin. In: Shils ME, Young VR, eds. Modern nutrition inhealth and disease, 6th ed. Philadelphia, PA, Lea & Febiger, 1988:370–375.
62. Carpenter KJ, Lewin WJ. A re-examination of the composition of diets associated with pellagra. Journal of Nutrition, 1985, 115:543–552.
63. Berger NA. Poly (ADP-ribose) in the cellular response to DNA damage.Radiation Research, 1985, 101:4–15.
64. Shibata K, Matsuo H. Effect of supplementing low protein diets with the lim-iting amino acids on the excretion of N¢-methylnicotinamide and its pyri-dones in rat. Journal of Nutrition, 1989, 119:896–901.
65. Jacob RA et al. Biochemical markers for assessment of niacin status in youngmen: urinary and blood levels of niacin metabolites. Journal of Nutrition,1989, 119:591–598.
66. Dillon JC et al. The urinary metabolites of niacin during the course of pella-gra. Annals of Nutrition and Metabolism, 1992, 36:181–185.
67. Fu CS et al. Biochemical markers for assessment of niacin status in young
9. THIAMINE, RIBOFLAVIN, NIACIN, VITAMIN B6, PANTOTHENIC ACID, AND BIOTIN
189
P164-193 3/12/05 17:06 Page 189
VITAMIN AND MINERAL REQUIREMENTS IN HUMAN NUTRITION
190
men: levels of erythrocyte niacin coenzymes and plasma tryptophan. Journalof Nutrition, 1989, 119:1949–1955.
68. Ribaya-Mercado JD et al. Effect of niacin status on gastrointestinal functionand serum lipids [abstract]. FASEB Journal, 1997, 11:179.
69. Rose DP, Braidman IP. Excretion of tryptophan metabolites as affected bypregnancy, contraceptive steroids, and steroid hormones. American Journalof Clinical Nutrition, 1971, 24:673–683.
70. Patterson JI et al. Excretion of tryptophan-niacin metabolites by young men:effects of tryptophan, leucine, and vitamin B6 intakes. American Journal ofClinical Nutrition, 1980, 33:2157–2167.
71. Horwitt MK, Harper AE, Henderson LM. Niacin-tryptophan relationshipsfor evaluating niacin equivalents. American Journal of Clinical Nutrition,1981, 34:423–427.
72. McCormick DB. Vitamin B6. In: Shils ME, Young VR, eds. Modern nutritionin health and disease, 6th ed. Philadelphia, PA, Lea & Febiger, 1988:376–382.
73. Liu A et al. Relationship between body store of vitamin B6 and plasma pyri-doxal-P clearance: metabolic balance studies in humans. Journal of Labora-tory and Clinical Medicine, 1985, 106:491–497.
74. Kretsch MJ, Sauberlich HE, Newbrun E. Electroencephalographic changesand periodontal status during short-term vitamin B-6 depletion of young,nonpregnant women. American Journal of Clinical Nutrition, 1991,53:1266–1274.
75. Bailey AL, Wright AJA, Southon S. Pyridoxal-5-phosphate determination inhuman plasma by high performance liquid chromatography: how appropri-ate are cut-off values for vitamin B6 deficiency? European Journal of Clini-cal Nutrition, 1999, 53:448–455.
76. Hamfelt A, Tuvemo T. Pyridoxal phosphate and folic acid concentration inblood and erythrocyte aspartate aminotransferase activity during pregnancy.Clinica Chemica Acta, 1972, 41:287–298.
77. Leklem JE. Vitamin B-6: a status report. Journal of Nutrition, 1990,120(Suppl. 11):S1503–S1507.
78. Gregory JF III. Bioavailability of vitamin B-6. European Journal of ClinicalNutrition, 1997, 51(Suppl. 1):S43–S48.
79. Tarr JB, Tamura T, Stokstad EL. Availability of vitamin B6 and pantothenatein an average American diet in man. American Journal of Clinical Nutrition,1981, 34:1328–1337.
80. Wozenski JR, Leklem JE, Miller LT. The metabolism of small doses of vitaminB-6 in men. Journal of Nutrition, 1980, 110:275–285.
81. Pannemans DLE, van den Berg H, Westerterp KR. The influence of proteinintake on vitamin B-6 metabolism differs in young and elderly humans.Journal of Nutrition, 1994, 124:1207–1214.
82. Shane B, Contractor SF. Assessment of vitamin B6 status. Studies on pregnantwomen and oral contraceptive users. American Journal of Clinical Nutrition,1975, 28:739–747.
83. Rose DP. Oral contraceptives and vitamin B6. In: Human vitamin B6 require-ments. Proceedings of a workshop: Letterman Army Institute of Research, Presidio of San Francisco, California, June 11–12 1976. Washington, DC,National Academy Press, 1978:193–201.
84. Brophy MH, Siiteri PK. Pyridoxal phosphate and hypertensive disorders of pregnancy. American Journal of Obstetrics and Gynecology, 1975,121:1075–1079.
P164-193 3/12/05 17:06 Page 190
85. Shane B, Contractor SF. Vitamin B6 status and metabolism in pregnancy. In:Tryfiates GP, ed. Vitamin B6 metabolism and role in growth. Westport, CT,Food & Nutrition Press, 1980:137–171.
86. West KD, Kirksey A. Influence of vitamin B6 intake on the content of the vitamin in human milk. American Journal of Clinical Nutrition, 1976,29:961–969.
87. Andon MB et al. Dietary intake of total and glycosylated vitamin B-6 and thevitamin B-6 nutritional status of unsupplemented lactating women and theirinfants. American Journal of Clinical Nutrition, 1989, 50:1050–1058.
88. Heiskanen K et al. Vitamin B-6 status during childhood: tracking from 2months to 11 years of age. Journal of Nutrition, 1995, 125:2985–2992.
89. Linkswiler HM. Vitamin B6 requirements of men. In: Human vitamin B6
requirements. Proceedings of a workshop: Letterman Army Institute ofResearch, Presidio of San Francisco, California, June 11–12 1976. Washington,DC, National Academy Press, 1978:279–290.
90. Miller LT, Leklem JE, Shultz TD. The effect of dietary protein on the metab-olism of vitamin B-6 in humans. Journal of Nutrition, 1985, 115:1663–1672.
91. Brown RR et al. Urinary 4-pyridoxic acid, plasma pyridoxal phosphate, anderythrocyte aminotransferase levels in oral contraceptive users receiving con-trolled intakes of vitamin B6. American Journal of Clinical Nutrition, 1975,28:10–19.
92. Kretsch MJ et al. Vitamin B-6 requirement and status assessment: youngwomen fed a depletion diet followed by a plant- or animal-protein diet withgraded amounts of vitamin B-6. American Journal of Clinical Nutrition, 1995,61:1091–1101.
93. Hansen CM, Leklem JE, Miller LT. Vitamin B-6 status of women with a con-stant intake of vitamin B-6 changes with three levels of dietary protein.Journal of Nutrition, 1996, 126:1891–1901.
94. Hansen CM, Leklem JE, Miller LT. Changes in vitamin B-6 status indicatorsof women fed a constant protein diet with varying levels of vitamin B-6.American Journal of Clinical Nutrition, 1997, 66:1379–1387.
95. Ribaya-Mercado JD et al. Vitamin B-6 requirements of elderly men andwomen. Journal of Nutrition, 1991, 121:1062–1074.
96. Selhub J et al. Vitamin status and intake as primary determinants of homo-cysteinemia in an elderly population. Journal of the American Medical Asso-ciation, 1993, 270:2693–2698.
97. Cleary RE, Lumeng L, Li T-K. Maternal and fetal plasma levels of pyridoxalphosphate at term: adequacy of vitamin B6 supplementation during preg-nancy. American Journal of Obstetrics and Gynecology, 1975, 121:25–28.
98. Lumeng L et al. Adequacy of vitamin B6 supplementation during pregnancy:a prospective study. American Journal of Clinical Nutrition, 1976,29:1376–1383.
99. Borschel MW. Vitamin B6 in infancy: requirements and current feeding prac-tices. In: Raiten DJ, ed. Vitamin B-6 metabolism in pregnancy, lactation andinfancy. Boca Raton, FL, CRC Press, 1995:109–124.
100. McCormick DB. Pantothenic acid. In: Shils ME, Young VR, eds. Modernnutrition in health and disease, 6th ed. Philadelphia, PA, Lea & Febiger,1988:383–387.
101. Plesofsky-Vig N. Pantothenic acid and coenzyme A. In: Shils ME, Olson JA,Shike M, eds. Modern nutrition in health and disease, 8th ed. Philadelphia,PA, Lea & Febiger, 1994:395–401.
9. THIAMINE, RIBOFLAVIN, NIACIN, VITAMIN B6, PANTOTHENIC ACID, AND BIOTIN
191
P164-193 3/12/05 17:06 Page 191
VITAMIN AND MINERAL REQUIREMENTS IN HUMAN NUTRITION
192
102. Fry PC, Fox HM, Tao HG. Metabolic response to a pantothenic acid defi-cient diet in humans. Journal of Nutritional Science and Vitaminology, 1976,22:339–346.
103. Eissenstat BR, Wyse BW, Hansen RG. Pantothenic acid status of adolescents.American Journal of Clinical Nutrition, 1986, 44:931–937.
104. Wittwer CT et al. Enzymes for liberation of pantothenic acid in blood: useof plasma pantetheinase. American Journal of Clinical Nutrition, 1989,50:1072–1078.
105. Picciano MF. Vitamins in milk. A. Water-soluble vitamins in human milk. In:Jensen RG, ed. Handbook of milk composition. San Diego, CA, AcademicPress, 1995.
106. Butte NF et al. Human milk intake and growth in exclusively breast-fedinfants. Journal of Pediatrics, 1984, 104:187–195.
107. Allen JC et al. Studies in human lactation: milk composition and daily secre-tion rates of macronutrients in the first year of lactation. American Journal ofClinical Nutrition, 1991, 54:69–80.
108. Heinig MJ et al. Energy and protein intakes of breast-fed and formula-fedinfants during the first year of life and their association with growth velocity:the DARLING Study. American Journal of Clinical Nutrition, 1993,58:152–161.
109. Kathman JV, Kies C. Pantothenic acid status of free living adolescent andyoung adults. Nutrition Research, 1984, 4:245–250.
110. Srinivasan V et al. Pantothenic acid nutritional status in the elderly—institu-tionalized and noninstitutionalized. American Journal of Clinical Nutrition,1981, 34:1736–1742.
111. Bul NL, Buss DH. Biotin, pantothenic acid and vitamin E in the Britishhousehold food supply. Human Nutrition: Applied Nutrition, 1982,36A:125–129.
112. Song WO, Wyse BW, Hansen RG. Pantothenic acid status of pregnant and lactating women. Journal of the American Dietetic Association, 1985,85:192–198.
113. McCormick DB. Biotin. In: Shils ME, Young VR, eds. Modern nutrition inhealth and disease, 6th ed. Philadelphia, PA, Lea & Febiger, 1988:436–439.
114. Mock DM. Biotin. In: Ziegler EE, Filer LJ Jr, eds. Present knowledge in nutrition, 7th ed. Washington, DC, International Life Sciences Institute, TheNutrition Foundation, 1996:220–235.
115. Mock NI et al. Increased urinary excretion of 3-hydroxyisovaleric acid anddecreased urinary excretion of biotin are sensitive early indicators ofdecreased status in experimental biotin deficiency. American Journal of Clin-ical Nutrition, 1997, 65:951–958.
116. McCormick DB, Wright LD. The metabolism of biotin and analogues. In:Florkin M, Stotz EH, eds. Comprehensive biochemistry, Vol. 21. Amsterdam,Elsevier, 1971:81–110.
117. McCormick DB. Biotin. In: Hegsted M, ed. Present knowledge in nutrition,4th ed. Washington, DC, The Nutrition Foundation, 1976:217–225.
118. Zempleni J, McCormick DB, Mock DM. Identification of biotin sulfone, bisnorbiotin methylketone, and tetranorbiotin-l-sulfoxide in human urine.American Journal of Clinical Nutrition, 1997, 65:508–511.
119. Mock DM et al. Biotin deficiency: an unusual complication of parenteral alimentation. New England Journal of Medicine, 1981,304:820–823.
P164-193 3/12/05 17:06 Page 192
120. Kien CL et al. Biotin-responsive in vivo carboxylase deficiency in two siblings with secretory diarrhea receiving total parenteral nutrition. Journalof Pediatrics, 1981, 99:546–550.
121. Gillis J et al. Biotin deficiency in a child on long-term TPN. Journal of Parenteral and Enteral Nutrition, 1982, 6:308–310.
122. Mock DM et al. Biotin deficiency complicating parenteral alimentation: diagnosis, metabolic repercussions, and treatment. Journal of Pediatrics, 1985,106:762–769.
123. Lagier P et al. Zinc and biotin deficiency during prolonged parenteral nutri-tion in infants. Presse Médicale, 1987, 16:1795–1797.
124. Carlson GL et al. Biotin deficiency complicating long-term parenteral nutri-tion in an adult patient. Clinical Nutrition, 1995, 14:186–190.
125. Holland B et al. McCance & Widdowson’s the composition of foods. 5threvised and extended edition. London, Her Majesty’s Stationery Office, 1991.
126. Salmenpera L et al. Biotin concentrations in maternal plasma and milk duringprolonged lactation. International Journal of Vitamin and Nutrition Research,1985, 55:281–285.
127. Hirano M et al. Longitudinal variations of biotin content in human milk.International Journal for Vitamin and Nutrition Research, 1992, 62:281–282.
128. Mock DM et al. Biotin status assessed longitudinally in pregnant women.Journal of Nutrition, 1997, 127:710–716.
9. THIAMINE, RIBOFLAVIN, NIACIN, VITAMIN B6, PANTOTHENIC ACID, AND BIOTIN
193
P164-193 3/12/05 17:06 Page 193
194
10. Selenium
10.1 Role of selenium in human metabolic processesOur understanding of the significance of selenium in the nutrition of humansubjects has grown rapidly during the past 20 years (1, 2). Demonstrations ofits essentiality to rats and farm animals were followed by appreciation thatthe development of selenium-responsive diseases often reflected the distribu-tion of geochemical variables which restricted the entry of the element fromsoils into food chains. Such findings were the stimulus to in-depth investiga-tions of the regional relevance of selenium in human nutrition (3). Thesestudies have now yielded an increased understanding of the complex meta-bolic role of this trace nutrient. Selenium has been implicated in the protec-tion of body tissues against oxidative stress, maintenance of defences againstinfection, and modulation of growth and development.
The selenium content of normal adult humans can vary widely. Values from3mg in New Zealanders to 14mg in some Americans reflect the profoundinfluence of the natural environment on the selenium contents of soils, crops,and human tissues. Approximately 30% of tissue selenium is contained in theliver, 15% in kidney, 30% in muscle, and 10% in blood plasma. Much of tissueselenium is found in proteins as selenoanalogues of sulfur amino acids; othermetabolically active forms include selenotrisulphides and other acid-labileselenium compounds. At least 15 selenoproteins have now been characterized.Examples are given in Table 10.1.
Functionally, there appear to be at least two distinct families of selenium-containing enzymes. The first includes the glutathione peroxidases (4) andthioredoxin reductase (5), which are involved in controlling tissue concen-trations of highly reactive oxygen-containing metabolites. These meta-bolites are essential at low concentrations for maintaining cell-mediatedimmunity against infections but highly toxic if produced in excess. The roleof selenium in the cytosolic enzyme, glutathione peroxidase (GSHPx), wasfirst illustrated in 1973. During stress, infection, or tissue injury, selenoen-zymes may protect against the damaging effects of hydrogen peroxide oroxygen-rich free radicals. This family of enzymes catalyses the destruction of
P194-216 3/12/05 17:07 Page 194
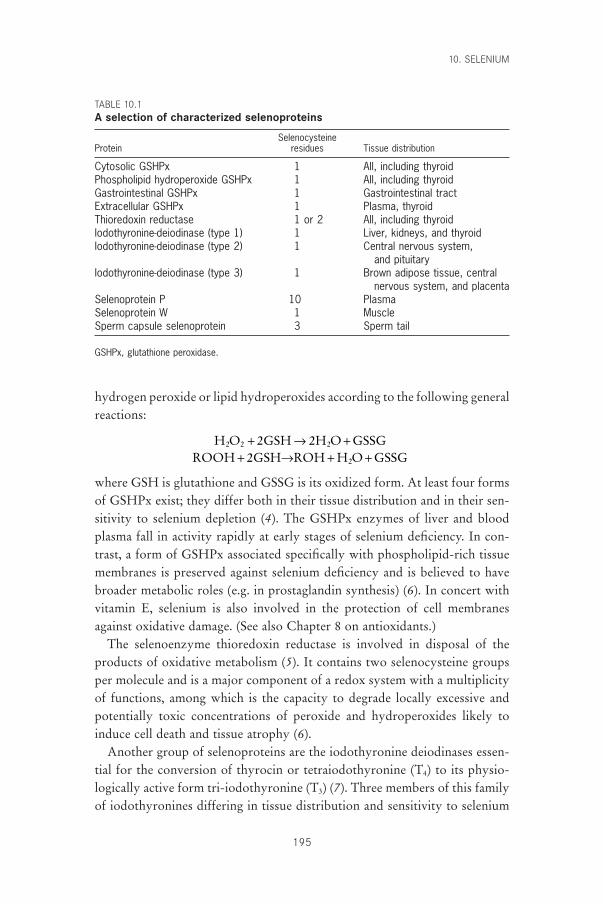
hydrogen peroxide or lipid hydroperoxides according to the following generalreactions:
where GSH is glutathione and GSSG is its oxidized form. At least four formsof GSHPx exist; they differ both in their tissue distribution and in their sen-sitivity to selenium depletion (4). The GSHPx enzymes of liver and bloodplasma fall in activity rapidly at early stages of selenium deficiency. In con-trast, a form of GSHPx associated specifically with phospholipid-rich tissuemembranes is preserved against selenium deficiency and is believed to havebroader metabolic roles (e.g. in prostaglandin synthesis) (6). In concert withvitamin E, selenium is also involved in the protection of cell membranesagainst oxidative damage. (See also Chapter 8 on antioxidants.)
The selenoenzyme thioredoxin reductase is involved in disposal of theproducts of oxidative metabolism (5). It contains two selenocysteine groupsper molecule and is a major component of a redox system with a multiplicityof functions, among which is the capacity to degrade locally excessive andpotentially toxic concentrations of peroxide and hydroperoxides likely toinduce cell death and tissue atrophy (6).
Another group of selenoproteins are the iodothyronine deiodinases essen-tial for the conversion of thyrocin or tetraiodothyronine (T4) to its physio-logically active form tri-iodothyronine (T3) (7). Three members of this familyof iodothyronines differing in tissue distribution and sensitivity to selenium
H O 2GSH 2H GSSGROOH 2GSH H GSSG
2 2 2
2
+ Æ ++ Æ + +
OROH O
10. SELENIUM
195
TABLE 10.1A selection of characterized selenoproteins
SelenocysteineProtein residues Tissue distribution
Cytosolic GSHPx 1 All, including thyroidPhospholipid hydroperoxide GSHPx 1 All, including thyroidGastrointestinal GSHPx 1 Gastrointestinal tractExtracellular GSHPx 1 Plasma, thyroidThioredoxin reductase 1 or 2 All, including thyroidIodothyronine-deiodinase (type 1) 1 Liver, kidneys, and thyroidIodothyronine-deiodinase (type 2) 1 Central nervous system,
and pituitaryIodothyronine-deiodinase (type 3) 1 Brown adipose tissue, central
nervous system, and placentaSelenoprotein P 10 PlasmaSelenoprotein W 1 MuscleSperm capsule selenoprotein 3 Sperm tail
GSHPx, glutathione peroxidase.
P194-216 3/12/05 17:07 Page 195
VITAMIN AND MINERAL REQUIREMENTS IN HUMAN NUTRITION
196
deficiency have been characterized (see Table 10.1). The consequences of alow selenium status on physiologic responses to a shortage of iodine arecomplex. The influence of a loss of selenium-dependent iodothyronine deio-dinase differs in its severity depending on whether a target tissue needs a pre-formed supply of T3 (e.g. via plasma) or whether, as with the brain, pituitarygland, and placenta, it can rely upon local synthesis of T3 from T4. Despitethis, marked changes in the T3–T4 ratio as a consequence of a reduced sele-nium status (when iodine supplies are also marginal) indicate the modifyinginfluence of selenium on thyroid hormone balance in both animal models andhuman subjects. The possible significance of this can be anticipated from thefact that whereas thyroid weights increase typically by 50% in rats offered aniodine-deficient diet, thyroid weight is increased 154% by diets concurrentlydeficient in both selenium and iodine (see also section 10.2.5).
Between 60% and 80% of selenium in human plasma is accounted for bya well-characterized fraction designated selenoprotein P, the function ofwhich has yet to be determined. It is thought to be a selenium storage proteinbecause there is limited evidence that it also has an antioxidant role. At least10 other selenoproteins exist, including one which is a component of the mito-chondrial capsule of sperm cells, damage to which may account for the devel-opment of sperm abnormalities during selenium deficiency. Other aspects ofthe function and metabolism of selenium are reviewed elsewhere (8, 9).
10.2 Selenium deficiency10.2.1 Non-endemic deficiencies of seleniumBiochemical evidence of selenium depletion (e.g. a decline in blood GSHPxactivity) is not uncommon in subjects maintained on parenteral or enteralfeeding for long periods (10, 11). Low selenium contents of some infant for-mulae have been reported to reduce infant serum selenium and GSHPx valuesto levels down to one fifth of normal in 5–8-month-old infants (12, 13). Thelow selenium content of many older infant formulae would have not onlybeen insufficient to meet infant requirements (12) but when used to supple-ment breast milk would have diluted the total selenium intake from maternalplus fortified milk. For this reason it has been recommended that formulamilks should provide at least 10mg selenium/day to complement the mater-nal supply of selenium (13, 14).
Clinical manifestations of deficiency arising from such situations areuncommon and poorly defined. They include muscular weakness and myalgiawith, in several instances, the development of congestive heart failure. In atleast one instance such pathologic signs have developed as a consequence ofa generally inadequate diet providing selenium at less than 10mg/day. The
P194-216 3/12/05 17:07 Page 196
2-year-old subject in question recovered rapidly after selenium administra-tion (15). With this last exception, virtually all of the above reports describeobservations in subjects under close medical supervision. This may well berelevant to the scarcity of consistent pathological findings (16).
10.2.2 Keshan diseaseKeshan disease was first described in the Chinese medical literature more than100 years ago, but not until 40 years after its widespread occurrence in 1935was it discovered that selenium deficiency was an important factor in its eti-ology (3). Endemic in children aged 2–10 years and in women of childbear-ing age, this disease has a geographic distribution covering localities fromnorth-east to south-west China. Typical manifestations are fatigue after evenmild exercise, cardiac arrhythmia and palpitations, loss of appetite, cardiacinsufficiency, cardiomegaly, and congestive heart failure. Pathological changesinclude a multifocal myocardial necrosis and fibrosis. The coronary arteriesare essentially unaffected. Ultrastructural studies show that membranousorganelles, such as mitochondria or sarcolemma, are affected earliest. Thedisease has a marked seasonal fluctuation in incidence (3) and may appear afteronly 3 months exposure to conditions in localities known to be associatedwith a high risk of myocarditis (3, 8). Once the disease is established, sele-nium is of little or no therapeutic value. However, prophylaxis consisting oforal administration of selenium 3 months before the periods of highest antic-ipated risk is highly effective.
Although geographic similarities in the distribution of Keshan disease andthe selenium- and vitamin E-responsive white muscle disease in animals firstprompted successful investigation of the relevance of a low selenium status,evidence has grown steadily that the disease is multifactorial in origin. Thestrongest suspicions have fallen on the development of a viral myocarditisprobably attributable to enhancement of the virulence of a coxsackie virusduring its passage through selenium-deficient host tissues (17). Althoughother nutritional variables such as a marginal vitamin E status may also beinvolved, the finding of extremely low selenium contents in staple crops ofaffected areas and convincing demonstrations of the prophylactic effective-ness of selenium administration leave no doubt that selenium deficiency is theprimary factor (3, 18).
Recent studies indicate that geochemical variables have an important influ-ence on the distribution of Keshan disease. Acid soils high in organic matterand iron oxide content appear to be responsible for fixing selenium in formsthat are poorly absorbed by staple crops which, in the instance of cereal grains,typically have a selenium content of less than 0.01mg/g (19). Similar geo-
10. SELENIUM
197
P194-216 3/12/05 17:07 Page 197
VITAMIN AND MINERAL REQUIREMENTS IN HUMAN NUTRITION
198
chemical conditions are believed to be associated with reports of selenium-responsive disorders resembling Keshan disease in the Transbaikalia region ofsouthern Siberia. In that region, dietary intakes of selenium are inadequate tomaintain blood GSHPx activity; biochemical indicators of tissue peroxidativedamage are elevated until selenium therapy is initiated (8).
10.2.3 Kaschin-Beck diseaseA selenium-responsive bone and joint disease (osteoarthropathy) has beendetected in children aged 5–13 years in China and less extensively in south-east Siberia. The disease is characterized by joint necrosis—epiphyseal degen-eration of the arm and leg joints resulting in structural shortening of thefingers and long bones with consequent growth retardation and stunting (3,20). Although not identical to Keshan disease, Kaschin-Beck disease alsooccurs in areas where the availability of soil selenium for crop growth is low.The selenium contents of hair and of whole blood are abnormally low andthe blood content of GSHPx is reduced. Although the disease is amelioratedby selenium therapy, other factors such as the frequent presence of myco-toxins in cereal grains grown in the area may be involved. A spontaneousdecrease in incidence from 1970 (44%) to 1980 (14%) to 1986 (1%) has beenattributed to general improvements in the nutritional status of Chinese rural communities (20).
10.2.4 Selenium status and susceptibility to infectionAs mentioned previously, expression of the cardiac lesions of Keshan diseaseprobably involve not only the development of selenium deficiency but alsoinfection with a coxsackie virus (strain CVB 3/0), initially non-virulent, butafter passage through a selenium deficient subject, becoming virulent andmyopathogenic. The enhancement of virulence of this RNA virus involvesmodifications to the nucleotide sequence of the phenotype which resemblethe wild-type virulent strain CVB 3/20 (17). These modifications were foundto be maintained and expressed during subsequent passage of the virusthrough experimental animals with a normal selenium status (21).
The enhancement of the virulence of a virus due to a selenium deficiency(resulting from either a nutritional challenge or an increased metabolicdemand on tissue selenium deposits) does not appear to be unique to the cox-sackie viruses. The early preclinical stages of development of human immuno-deficiency virus (HIV) infection are accompanied by a very marked declinein plasma selenium. Subclinical malnutrition assumes increased significanceduring the development of acquired immune deficiency syndrome (AIDS).However, for the nutrients affected, there are strong indications that only the
P194-216 3/12/05 17:07 Page 198
extent of the decline in selenium status has predictive value with respect toboth the rate of development of AIDS and its resulting mortality (22–25). Thevirulence of other RNA viruses such as hepatitis B and those associated withthe development of haemolytic anaemias are enhanced similarly by a declinein selenium status. The mechanisms underlying these effects are not yetresolved. However, there are indications that the loss of protective antioxi-dant functions dependent on selenium and vitamin E are both involved andthat the resulting structural changes in viral nucleotide sequences are repro-ducible and appear to provoke additional selenoprotein synthesis (26). It issuspected that this further depletes previously diminished pools of physio-logically available selenium and accelerates pathological responses (27–29).
Whatever mechanisms are involved, further understanding is needed of theinfluence of selenium status on susceptibility to viral diseases ranging fromcardiomyopathies to haemolytic anaemias. The relationship already illustratesthe difficulty of defining essential requirements of nutrients which may pri-marily maintain defences against infection. Studies of the effects of seleniumdeficiency in several experimental animal species have shown that the micro-bicidal activity of blood neutrophils is severely impaired even though phago-cytic activity remains unchanged (30, 31). The complexity of speciesdifferences in the influence of selenium status on the effectiveness of cell-mediated immune processes is summarized elsewhere (8).
The possibility that increased intakes of selenium might protect against thedevelopment of cancer in humans has generated great interest (32). Althougha number of epidemiological studies have reported no relationship betweenselenium and cancer risk (33), an analysis of the relationship between sele-nium and cancer suggests that the question of “whether selenium protectsagainst cancer” is still wide open (34). An increased intake of selenium appearsto stimulate tumorigenesis of pancreatic and skin cancer in some animalmodels. In contrast, the protective effect of higher exposures to seleniumobserved in several animal studies, together with small but statistically sig-nificant differences in selenium blood plasma levels detected in some retro-spective–prospective studies of subgroups of people developing cancer,explains the continuing interest in the anticarcinogenic potential of selenium.However, the results of prospective–retrospective studies had no predictivevalue for individuals and could have reflected non-specific influences ongroups. The association between low selenium intake and high cancer risk,although clearly of some interest, is in need of further investigation before aconclusion can be reached.
Although a biochemical mechanism can be postulated whereby seleniumcould protect against heart disease by influencing platelet aggregation
10. SELENIUM
199
P194-216 3/12/05 17:07 Page 199
VITAMIN AND MINERAL REQUIREMENTS IN HUMAN NUTRITION
200
(through an effect on the prostacyclin–thromboxane ratio), the epidemiolog-ical evidence linking selenium status and risk of cardiovascular disease is stillequivocal (33).
10.2.5 Selenium and thyroid hormonesThe importance of selenium for thyroid hormone metabolism (35, 36) isevident from changes in the T3–T4 ratio which develop after relatively mildselenium depletion in infants and elderly (65+ years) subjects. Decreases inthe T3–T4 ratio indicative of decreased thyroid hormone balance have beendetected when serum selenium falls below 0.9mmol/l (37). In a recent Scot-tish study, these decreases were correlated with a decline in dietary and plasmaselenium after the replacement of selenium-rich wheat from Canada and theUnited States with selenium-deficient wheat from European sources (38).
Communities noted for a high incidence of myxedematous cretinism havebeen found to have low plasma selenium status, low GSHPx activity, and lowiodine status (39), in addition to being exposed to high thiocyanate intakesfrom cassava. Restoration of iodine supply, particularly if excessive, tends toinduce a high peroxidative stress, through the action of iodide peroxidase inthe first step in iodine utilization by the thyroid. It is postulated that necro-sis and thyroid fibrosis leading to irreversible hypothyroidism result if a con-current deficiency of selenium limits peroxide destruction by the protectiveaction of the selenium-dependent enzymes, GSHPx and, more probably,thioredoxin reductase (40). In areas where myxedematous cretinism isendemic and characterized by persistent hypothyroidism, dwarfism, andstunting, it has been recommended that attempts to introduce iodine therapyfor mildly affected individuals should be preceded by an assessment of sele-nium status and rectification of any observed deficit (39). Although this sug-gestion is compatible with pathological observations on hypothyroid ratsdiffering in selenium status, its validity has yet to be assessed adequately inhumans (41, 42).
10.3 The influence of diet on selenium statusEnvironmental conditions and agricultural practices have a profound influ-ence on the selenium content of many foods. Table 10.2 illustrates the widerange of selenium content of the principal food groups and the variability inthe selenium content of dietary constituents in selected countries. This vari-ability is exceeded only by that found in the iodine content of foods.
Geographic differences in the content and availability of selenium fromsoils to food crops and animal products have a marked effect on the seleniumstatus of entire communities. For example, the distribution of Keshan disease
P194-216 3/12/05 17:07 Page 200
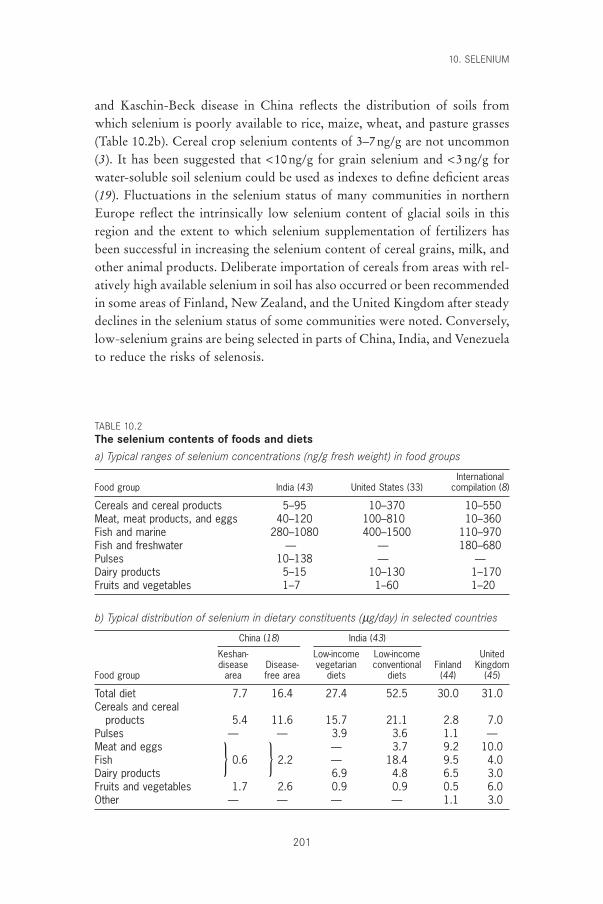
and Kaschin-Beck disease in China reflects the distribution of soils fromwhich selenium is poorly available to rice, maize, wheat, and pasture grasses(Table 10.2b). Cereal crop selenium contents of 3–7ng/g are not uncommon(3). It has been suggested that <10ng/g for grain selenium and <3ng/g forwater-soluble soil selenium could be used as indexes to define deficient areas(19). Fluctuations in the selenium status of many communities in northernEurope reflect the intrinsically low selenium content of glacial soils in thisregion and the extent to which selenium supplementation of fertilizers hasbeen successful in increasing the selenium content of cereal grains, milk, andother animal products. Deliberate importation of cereals from areas with rel-atively high available selenium in soil has also occurred or been recommendedin some areas of Finland, New Zealand, and the United Kingdom after steadydeclines in the selenium status of some communities were noted. Conversely,low-selenium grains are being selected in parts of China, India, and Venezuelato reduce the risks of selenosis.
10. SELENIUM
201
TABLE 10.2The selenium contents of foods and dietsa) Typical ranges of selenium concentrations (ng/g fresh weight) in food groups
InternationalFood group India (43) United States (33) compilation (8)
Cereals and cereal products 5–95 10–370 10–550Meat, meat products, and eggs 40–120 100–810 10–360Fish and marine 280–1080 400–1500 110–970Fish and freshwater — — 180–680Pulses 10–138 — —Dairy products 5–15 10–130 1–170Fruits and vegetables 1–7 1–60 1–20
b) Typical distribution of selenium in dietary constituents (mg/day) in selected countries
China (18) India (43)
Keshan- Low-income Low-income Uniteddisease Disease- vegetarian conventional Finland Kingdom
Food group area free area diets diets (44) (45)
Total diet 7.7 16.4 27.4 52.5 30.0 31.0Cereals and cereal
products 5.4 11.6 15.7 21.1 2.8 7.0Pulses — — 3.9 3.6 1.1 —Meat and eggs — 3.7 9.2 10.0Fish } 0.6 } 2.2 — 18.4 9.5 4.0Dairy products 6.9 4.8 6.5 3.0Fruits and vegetables 1.7 2.6 0.9 0.9 0.5 6.0Other — — — — 1.1 3.0
P194-216 3/12/05 17:07 Page 201
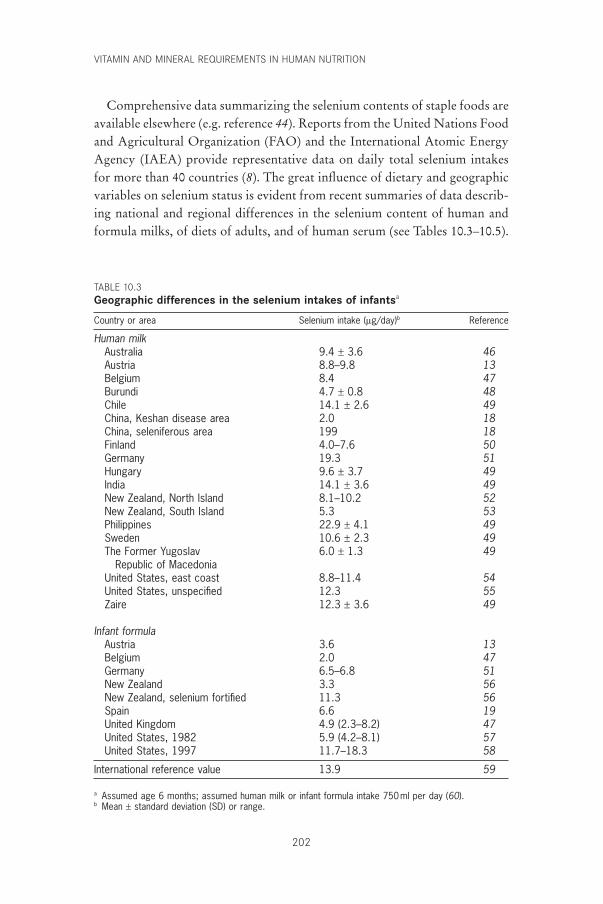
VITAMIN AND MINERAL REQUIREMENTS IN HUMAN NUTRITION
202
Comprehensive data summarizing the selenium contents of staple foods areavailable elsewhere (e.g. reference 44). Reports from the United Nations Foodand Agricultural Organization (FAO) and the International Atomic EnergyAgency (IAEA) provide representative data on daily total selenium intakesfor more than 40 countries (8). The great influence of dietary and geographicvariables on selenium status is evident from recent summaries of data describ-ing national and regional differences in the selenium content of human andformula milks, of diets of adults, and of human serum (see Tables 10.3–10.5).
TABLE 10.3Geographic differences in the selenium intakes of infantsa
Country or area Selenium intake (mg/day)b Reference
Human milkAustralia 9.4 ± 3.6 46Austria 8.8–9.8 13Belgium 8.4 47Burundi 4.7 ± 0.8 48Chile 14.1 ± 2.6 49China, Keshan disease area 2.0 18China, seleniferous area 199 18Finland 4.0–7.6 50Germany 19.3 51Hungary 9.6 ± 3.7 49India 14.1 ± 3.6 49New Zealand, North Island 8.1–10.2 52New Zealand, South Island 5.3 53Philippines 22.9 ± 4.1 49Sweden 10.6 ± 2.3 49The Former Yugoslav 6.0 ± 1.3 49
Republic of MacedoniaUnited States, east coast 8.8–11.4 54United States, unspecified 12.3 55Zaire 12.3 ± 3.6 49
Infant formulaAustria 3.6 13Belgium 2.0 47Germany 6.5–6.8 51New Zealand 3.3 56New Zealand, selenium fortified 11.3 56Spain 6.6 19United Kingdom 4.9 (2.3–8.2) 47United States, 1982 5.9 (4.2–8.1) 57United States, 1997 11.7–18.3 58
International reference value 13.9 59
a Assumed age 6 months; assumed human milk or infant formula intake 750ml per day (60).b Mean ± standard deviation (SD) or range.
P194-216 3/12/05 17:07 Page 202
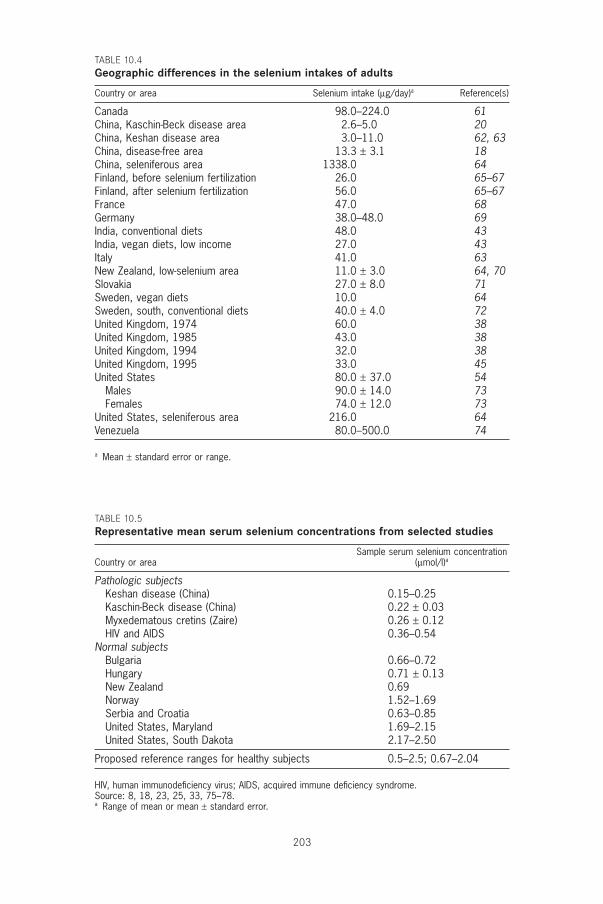
203
TABLE 10.4Geographic differences in the selenium intakes of adults
Country or area Selenium intake (mg/day)a Reference(s)
Canada 98.0–224.0 61China, Kaschin-Beck disease area 2.6–5.0 20China, Keshan disease area 3.0–11.0 62, 63China, disease-free area 13.3 ± 3.1 18China, seleniferous area 1338.0 64Finland, before selenium fertilization 26.0 65–67Finland, after selenium fertilization 56.0 65–67France 47.0 68Germany 38.0–48.0 69India, conventional diets 48.0 43India, vegan diets, low income 27.0 43Italy 41.0 63New Zealand, low-selenium area 11.0 ± 3.0 64, 70Slovakia 27.0 ± 8.0 71Sweden, vegan diets 10.0 64Sweden, south, conventional diets 40.0 ± 4.0 72United Kingdom, 1974 60.0 38United Kingdom, 1985 43.0 38United Kingdom, 1994 32.0 38United Kingdom, 1995 33.0 45United States 80.0 ± 37.0 54
Males 90.0 ± 14.0 73Females 74.0 ± 12.0 73
United States, seleniferous area 216.0 64Venezuela 80.0–500.0 74
a Mean ± standard error or range.
TABLE 10.5Representative mean serum selenium concentrations from selected studies
Sample serum selenium concentrationCountry or area (mmol/l)a
Pathologic subjectsKeshan disease (China) 0.15–0.25Kaschin-Beck disease (China) 0.22 ± 0.03Myxedematous cretins (Zaire) 0.26 ± 0.12HIV and AIDS 0.36–0.54
Normal subjectsBulgaria 0.66–0.72Hungary 0.71 ± 0.13New Zealand 0.69Norway 1.52–1.69Serbia and Croatia 0.63–0.85United States, Maryland 1.69–2.15United States, South Dakota 2.17–2.50
Proposed reference ranges for healthy subjects 0.5–2.5; 0.67–2.04
HIV, human immunodeficiency virus; AIDS, acquired immune deficiency syndrome.Source: 8, 18, 23, 25, 33, 75–78.a Range of mean or mean ± standard error.
P194-216 3/12/05 17:07 Page 203
VITAMIN AND MINERAL REQUIREMENTS IN HUMAN NUTRITION
204
10.4 Absorption and bioavailabilitySelenium compounds are generally very efficiently absorbed by humans, andselenium absorption does not appear to be under homeostatic control (79).For example, absorption of the selenite form of selenium is greater than 80%whereas that of selenium as selenomethionine or as selenate may be greaterthan 90% (79, 80). Therefore, the rate-limiting step determining the overallavailability of dietary selenium is not likely to be its absorption but rather itsconversion within tissues to its metabolically active forms (e.g. its incorpora-tion into GSHPx or 5¢-deiodinase) (40). A number of depletion–repletionexperiments have been carried out on animals to estimate the bioavailabilityof selenium in human foods (81). Based on the restoration of GSHPx activ-ity in depleted rats, the bioavailability of selenium in wheat is quite good,usually 80%, or better. The selenium in Brazil nuts and beef kidney alsoappears readily available (90% or more by most criteria). The selenium in tuna seems to be less available (perhaps only 20–60% of that absorbed fromselenite) than selenium from certain other seafoods (e.g. shrimp, crab, andBaltic herring). The selenium in a variety of mushrooms appears to be of uni-formly low availability to rats.
Data on the nutritional bioavailability of selenium to humans are sparse. Asupplementation study carried out on Finnish men of relatively low seleniumstatus showed that selenate selenium was as effective as the selenium in seleniferous wheat in increasing platelet GSHPx activity (82). The wheat selenium, however, increased plasma selenium levels more than did selenateselenium; and once the supplements were withdrawn, platelet GSHPx activity declined less in the group given wheat. This study showed the impor-tance of estimating not only short-term availability but also long-term reten-tion and the convertibility of tissue selenium stores into biologically activeforms.
10.5 Criteria for assessing selenium requirementsLevander (83) convincingly illustrated the impracticability of assessing sele-nium requirements from input–output balance data because the history ofselenium nutrition influences the proportion of dietary selenium absorbed,retained, or excreted. Because of the changing equilibria with selenium intake,experiments yield data which are of limited value for estimating minimalrequirements. Estimates of selenium requirements for adults range from 7.4to 80.0mg/day, these values having been derived from Chinese and NorthAmerican studies, respectively. Such discrepancies reflect differences in theusual daily selenium intakes of the experimental subjects and the extent to
P194-216 3/12/05 17:07 Page 204
which they were changed experimentally. This situation, not unique to sele-nium, emphasizes the importance of basing requirement estimates on func-tional criteria derived from evidence describing the minimum levels of intakewhich, directly or indirectly, reflect the normality of selenium-dependentprocesses.
New opportunities for the development of biochemical indexes of seleniumadequacy have yet to be exploited. Until this is done, the most suitable alter-native is to monitor changes in the relationship between serum selenium anddietary selenium supply, taking advantage of the relatively constant propor-tionality in the fraction of serum selenium to functionally significant GSHPx(84).
A detailed review of 36 reports describing serum selenium values in healthysubjects indicated that they ranged from a low of 0.52mmol/l in Serbia to ahigh of 2.5mmol/l in Wyoming and South Dakota in the United States (75).It was suggested that mean values within this range derived from 7502 appar-ently healthy individuals should be regarded tentatively as a standard fornormal reference. This survey clearly illustrated the influence of crop man-agement on serum selenium level; in Finland and New Zealand, selenium fortification of fertilizers for cereals increased serum selenium from 0.6 to 1.5mmol/l. The data in Table 10.5 also include representative mean serum sele-nium values (range, 0.15–0.54mmol/l) in subjects with specific diseases knownto be associated with disturbances in selenium nutrition or metabolism. Thesedata are derived from studies of Keshan disease, Kaschin-Beck disease, andspecific studies of cretinism, hypothyroidism, and HIV and AIDS where clin-ical outcome or prognosis has been related to selenium status.
The present Consultation adopted a virtually identical approach to deriveits estimates of basal requirements for selenium ( ) as the earlier WHO/FAO/IAEA assessment (85). As yet, there are no published reports suggest-ing that the basal estimates using serum selenium or GSHPx activity as crite-ria of adequacy are invalid. Some modification was, however, considerednecessary to estimate population minimum intakes with adequate allowancefor the variability (CV) associated with estimates of the average seleniumintakes from the typical diets of many communities. In the WHO/FAO/IAEA report (85), a CV of 16% was assumed for conventional diets and12.5% for the milk-based diets of infants to limit the risks of inadequacyarising from unexpectedly low selenium contents. More recent studies suggestthat the variability of selenium intake from diets for which the seleniumcontent has been predicted rather than measured may be substantially greaterthan previously estimated (Tables 10.3 and 10.4).
SeRbasal
10. SELENIUM
205
P194-216 3/12/05 17:07 Page 205
VITAMIN AND MINERAL REQUIREMENTS IN HUMAN NUTRITION
206
10.6 Recommended selenium intakes10.6.1 AdultsBecause balance techniques are inappropriate for determining seleniumrequirements, previous estimates of selenium requirements have been basedon epidemiological evidence derived from areas of China endemic or non-endemic for Keshan disease (18, 85). These comprehensive biochemical andclinical studies showed that Keshan disease did not occur in regions wherethe mean intake of selenium by adult males or females was greater than 19.1or 13.3mg/day, respectively. Although these intakes were sufficient to elimi-nate clinical evidence of myocarditis and other signs of Keshan disease, otherstudies showed that they were inadequate to restore erythrocyte or plasmaselenium concentrations or GSHPx activities to levels indicative of reserves.
In one study adult male subjects, initially of low selenium status, were givena carefully monitored diet providing selenium at 11mg/day together with sup-plements of selenomethionine given orally which provided 0, 10, 30, 60, or 90mg/day. Starting at overtly deficient levels, total daily selenium intakes of above 41mg/day were found sufficient to increase plasma GSHPx sub-stantially and to saturate plasma activity in 60-kg male subjects within 5–8 months. It was estimated that satisfactory levels of plasma selenium (>80mmol/l) and of GSHPx activity (>0.3mmol NADPH oxidized/min/l orapproximately two thirds of plasma saturation activity) indicative of adequateselenium reserves would be attained after intakes of approximately 27mg/dayby 65-kg male subjects (85). Such criteria which satisfy the definition ofaverage normative requirements for selenium ( ), have been used asthe basis for calculating recommended nutrient intake (RNI) values in thisreport after interpolating estimates of average requirements by allowing fordifferences in weight and basal metabolic rate of age groups up to 65 yearsand adding a 25% increase (2 ¥ assumed standard deviation) to allow for indi-vidual variability in the estimates of RNI (Table 10.6).
10.6.2 InfantsThe estimates of the RNI for infants (Table 10.6) are compatible with esti-mates of the international reference range of the selenium content of breastmilk (18.5mg/l; see Table 10.3); with data from an extensive internationalsurvey of breast milk selenium conducted by WHO and IAEA (49); and withmore recent WHO data (60) on the milk consumption of exclusively human-milk-fed infants in developed and developing countries. Data from the WHO/IAEA survey (49) suggest that the human milk from all six coun-tries included in the survey met the RNI of selenium for infants aged 0–6months. In two of six countries, Hungary and Sweden, the selenium content
SeRnormative
P194-216 3/12/05 17:07 Page 206
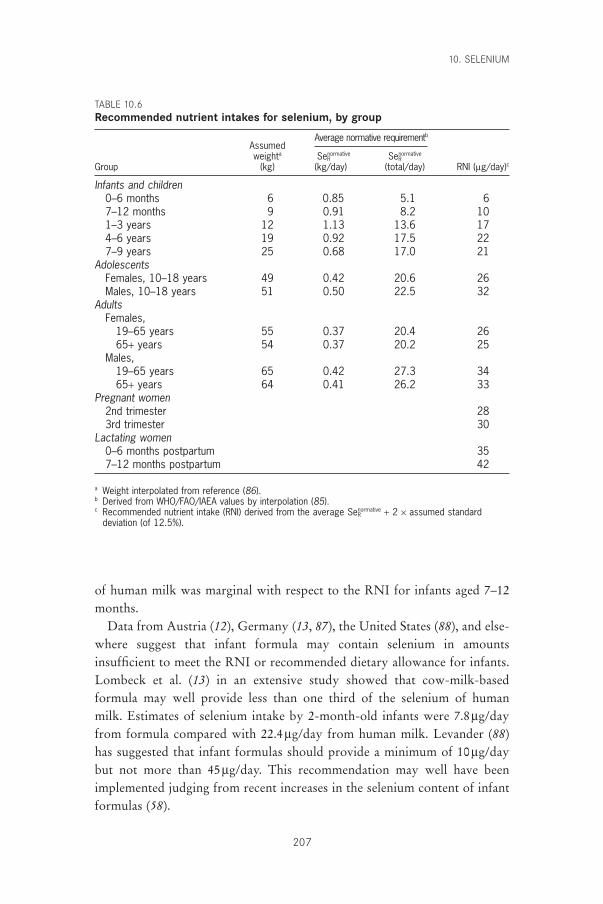
of human milk was marginal with respect to the RNI for infants aged 7–12months.
Data from Austria (12), Germany (13, 87), the United States (88), and else-where suggest that infant formula may contain selenium in amounts insufficient to meet the RNI or recommended dietary allowance for infants.Lombeck et al. (13) in an extensive study showed that cow-milk-basedformula may well provide less than one third of the selenium of human milk. Estimates of selenium intake by 2-month-old infants were 7.8mg/dayfrom formula compared with 22.4mg/day from human milk. Levander (88)has suggested that infant formulas should provide a minimum of 10mg/daybut not more than 45mg/day. This recommendation may well have beenimplemented judging from recent increases in the selenium content of infantformulas (58).
10. SELENIUM
207
TABLE 10.6Recommended nutrient intakes for selenium, by group
AssumedAverage normative requirementb
weighta SeRnormative SeR
normative
Group (kg) (kg/day) (total/day) RNI (mg/day)c
Infants and children0–6 months 6 0.85 5.1 67–12 months 9 0.91 8.2 101–3 years 12 1.13 13.6 174–6 years 19 0.92 17.5 227–9 years 25 0.68 17.0 21
AdolescentsFemales, 10–18 years 49 0.42 20.6 26Males, 10–18 years 51 0.50 22.5 32
AdultsFemales,
19–65 years 55 0.37 20.4 2665+ years 54 0.37 20.2 25
Males,19–65 years 65 0.42 27.3 3465+ years 64 0.41 26.2 33
Pregnant women2nd trimester 283rd trimester 30
Lactating women0–6 months postpartum 357–12 months postpartum 42
a Weight interpolated from reference (86).b Derived from WHO/FAO/IAEA values by interpolation (85).c Recommended nutrient intake (RNI) derived from the average SeR
normative + 2 ¥ assumed standarddeviation (of 12.5%).
P194-216 3/12/05 17:07 Page 207
VITAMIN AND MINERAL REQUIREMENTS IN HUMAN NUTRITION
208
10.6.3 Pregnant and lactating womenData from balance experiments are not sufficiently consistent for defining theincrease in selenium needed to support fetal growth and development duringpregnancy. For this reason the European Union Scientific Committee forFood (89), the United Kingdom Committee on Medical Aspects of FoodPolicy (90), and the Netherlands Food and Nutrition Council (91) have sug-gested that the component of selenium needed for human pregnancy isobtained by an adaptive increase in the efficiency of absorption of dietary sele-nium rather than by an increased dietary demand.
Others, contesting this view, have attempted to predict the increase of dietary selenium needed for pregnancy by factorial estimation of the likely quantity of selenium incorporated into the tissues of the fetus (60, 85).Such estimates have assumed that the total products of conception amount to 4.6–6kg lean tissue with a protein content of approximately 18.5–20%. If,as appears to be a reasonable assumption, the selenium content of this pro-tein resembles that of a skeletal muscle, growth of these tissues could account for between 1.0 and 4.5mg/day of selenium depending on whetherthe analyses reflect consumption of diets from a low-selenium (but non-pathogenic) environment such as that found in New Zealand (52, 53) or froma region with relatively high selenium intakes, such as the United States (see Table 10.3) (54, 55). Typically such estimates have assumed an 80%absorption and utilization of dietary selenium from which it would appearreasonable to estimate that allowing for a variability of estimates (CV, 12.5%),an increase of 2mg/day would be appropriate for the second trimester and 4mg/day would be appropriate for the third trimester of pregnancy (see Table 10.6).
As is evident from Table 10.3 the selenium content of human milk is sen-sitive to changes in maternal dietary selenium. The increase of maternaldietary selenium needed to meet requirements for lactation has been estimatedfrom the estimated RNI for infants aged 0–6 months and 7–12 months. Forthe period 0–6 months it is estimated that the infant must receive 6mg/day ofselenium from human milk; assuming that the selenium of maternal milk isused with an efficiency of 80% and given a SD of 12.5%, the increase ofmaternal dietary selenium required to produce this will be:
The corresponding increase needed to meet the infant RNI of 10mg/day for infants aged 7–12 months will be 16mg/day. Added to the non-pregnancy maternal RNI of 26mg/day, the total RNI for lactating women during the
610080
2 SD 9 g day¥ + ¥( ) = ◊m
P194-216 3/12/05 17:07 Page 208
first 6 months postpartum will be 35mg/day and for months 7–12 will be 42mg/day (Table 10.6).
As implied by the data in Tables 10.2–10.4, agricultural growing practices, geo-logic factors, and social deprivation enforcing the use of an abnormally wide rangeof dietary constituents may significantly modify the variability of dietary sele-nium intakes. If accumulated experience suggests that the CV of selenium intakemay be 40% or more, and tabulated rather than analysed data are used to predictthe dietary intake of selenium, the selenium allowances may have to be increasedaccordingly (85).
10.7 Upper limitsA comprehensive account of the clinically significant biochemical manifesta-tions of chronic and acute intoxication from selenium arising from high con-centrations in food, drinking water, and the environment was publishedjointly by WHO, the United Nations Environment Programme, and theInternational Labour Organization (ILO) (79). Common clinical features arehair loss and structural changes in the keratin of hair and nails, the develop-ment of icteroid skin, and gastrointestinal disturbances (92, 93). An increasedincidence of nail dystrophy has been associated with consumption of high-selenium foods supplying more than 900mg/day. These foods were grown inselenium-rich (seleniferous) soil from specific areas in China (94). A positiveassociation between dental caries and urinary selenium output under similarcircumstances has also been reported (95, 96).
Levander (33) stresses that the signs and symptoms of human overexpo-sure to selenium are not well defined. Furthermore, sensitive biochemicalmarkers of impending selenium intoxication have yet to be developed. In their absence, it is suggested that the upper tolerable nutrient intake level (UL) for selenium should be set, provisionally, at 400mg/day for adults. It is noteworthy that a maximum tolerable dietary concentration of 2mg/kg dry diet has been proposed for all classes of domesticated livestock and has proved satisfactory in use (97). This suggests that the proposed UL of 400mg/day for human subjects provides a fully adequate margin of safety. The UL for children and for pregnant or lactating women has yet to be determined.
10.8 Comparison with other estimatesCompared with WHO/FAO/IAEA (85), European Union (89), UnitedKingdom (90), and United States (86) recommendations, the present propos-als represent a significant decrease in the suggested need for selenium. Reasonsfor this are the following:
10. SELENIUM
209
P194-216 3/12/05 17:07 Page 209
VITAMIN AND MINERAL REQUIREMENTS IN HUMAN NUTRITION
210
• Current recommendations are based on a high weight range that do notreflect realities in many developing countries. Thus, there is a need to deriverecommendations which are applicable for a proportionally lower weightrange than that utilized in most developed countries.
• The decision, accepted by WHO, FAO, and IAEA (85), that it is neitheressential nor desirable to maintain selenium status at a level which fully sat-urates blood GSHPx activity when, based on current evidence, this is notan advantage for health.
• The decision to present estimates as RNIs which, although including anallowance for individual variability, do not provide for the possibility thatfoods may often differ widely in selenium content according to their geo-graphic sources.
The lower requirements presented in this report are physiologically justifi-able and will only give rise to concern if there are grounds for serious uncer-tainty as to the predictability of dietary selenium intake.
Food commodity inputs are changing rapidly and in some instances, unpre-dictably. Under most circumstances, it will be unreasonable to expect that theoften marked influence of geographic variability on the supply of seleniumfrom cereals and meats can be taken into account. Changes in trade patternswith respect to the sources of cereals and meats are already having significantinfluences on the selenium nutrition of consumer communities (38, 72). Suchevidence fully justifies the warning to allow for a high intrinsic variability ofdietary selenium content when estimating selenium requirements of popula-tions for which the principal sources of this micronutrient are unknown.
10.9 Recommendations for future researchRelationships between selenium status and pathologically relevant biochem-ical indexes of deficiency merit much closer study with the object of provid-ing more reliable and earlier means of detecting a suboptimal status.
Indications that a suboptimal selenium status may have much wider sig-nificance in influencing disease susceptibility must be pursued. Such studiesmust cover both the impact of selenium deficiency on protection againstoxidative damage during tissue trauma and its genetic implication for viral virulence.
We lack knowledge of the influence of soil composition on the seleniumcontent of cereals and animal tissues. Chinese experience with respect to thedramatic influence of soil iron and low pH on selenium availability may wellbe relevant to extensive tracts of lateritic soils in Africa and elsewhere. Thereare grounds for the belief that factors in common for selenium and iodine may
P194-216 3/12/05 17:07 Page 210
influence their supply and availability from soils into the human food chain.FAO should be encouraged to develop studies relevant to the influence of soilconditions on the supply of these two metabolically interdependent elementswhich affect human health.
The early detection of selenium toxicity (selenosis) is hindered by a lack ofsuitable biochemical indicators. Effective detection and control of selenosis in many developing countries awaits the development of improved specificdiagnostic techniques.
References1. Levander OA. Selenium. In: Mertz W, ed. Trace elements in human and animal
nutrition. 5th ed. Orlando, FL, Academic Press, 1986:209–279.2. Arthur JR, Beckett GJ. Neometabolic roles for selenium. Proceedings of the
Nutrition Society, 1994, 53:615–624.3. Ge K, Yang G. The epidemiology of selenium deficiency in the etiological
study of endemic diseases in China. American Journal of Clinical Nutrition,1993, 57(Suppl.):S259–S263.
4. Arthur JR et al. Regulation of selenoprotein gene expression and thyroidhormone metabolism. Transactions of the Biochemical Society, 1996,24:384–388.
5. Howie AF et al. Identification of a 57-kilodalton selenoprotein in human thy-rocytes as thioredoxin reductase. Journal of Clinical Endocrinology andMetabolism, 1998, 83:2052–2058.
6. Mairrino M et al. Reactivity of phospholipid hydroperoxide glutathione per-oxidase with membrane and lipoprotein lipid hydroperoxides. Free RadicalResearch Communications, 1991, 12:131–135.
7. Arthur J. Selenium biochemistry and function. In: Fischer PWF et al., eds.Trace elements in man and animals—9. Proceedings of the Ninth InternationalSymposium on Trace Elements in Man and Animals. Ottawa, NRC ResearchPress, 1997:1–5.
8. Reilly C. Selenium in food and health. London, Blackie Academic and Professional, 1996.
9. Anikina LV. Selenium-deficient cardiomyopathy (Keshan disease). In: BurkRF, ed. Fifth International Symposium on Selenium in Biology and Medicine.Nashville, TN, Vanderbilt University, 1992:122.
10. Brennan MF, Horwitz GD. Total parenteral nutrition in surgical patients.Advances in Surgery, 1984, 17:1–7.
11. van Rij AM et al. Selenium deficiency in total parenteral nutrition. AmericanJournal of Clinical Nutrition, 1979, 32:2076–2085.
12. Rossipal E, Tiran B. Selenium and glutathione peroxidase levels in healthyinfants and children in Austria and the influence of nutrition regimens on theselevels. Nutrition, 1995, 11(Suppl. 5):S573–S575.
13. Lombeck I et al. Selenium content of human milk, cows milk and cows milkinfant formulas. European Journal of Pediatrics, 1975, 139–145.
14. Okada A et al. Trace element metabolism in parenteral and enteral nutrition.Nutrition, 1995, 11:106–113.
15. Collip PJ, Chen SY. Cardiomyopathy and selenium deficiency in a two yearold girl. New England Journal of Medicine, 1981, 304:1304–1305.
10. SELENIUM
211
P194-216 3/12/05 17:07 Page 211
VITAMIN AND MINERAL REQUIREMENTS IN HUMAN NUTRITION
212
16. Lombeck I et al. Selenium intake of infants and young children, healthy chil-dren and dietetically treated patients with phenylketonuria. European Journalof Pediatrics, 1984, 143:99–102.
17. Levander OA, Beck MA. Interacting nutritional and infectious ecologies ofKeshan disease. Biological Trace Element Research, 1997, 56:5–21.
18. Yang G-Q et al. Human selenium requirements in China. In: Combs GF etal., eds. Selenium in biology and medicine. New York, NY, AVI Van Nostrand,1984:589–607.
19. Johnson CC et al. Studies of selenium distribution in soil, grain, drinking waterand human hair samples from the Keshan disease belt of Zhangjiakou district,Henei Province, China. Nottingham, British Geological Survey, 1996 (Over-seas Geology Series, Technical Report WC/96/52).
20. Li J-Y et al. Distribution of selenium in the microenvironment related toKaschin-Beck disease. In: Combs GF et al., eds. Selenium in biology and med-icine. New York, NY, AVI Van Nostrand, 1984:911–925.
21. Beck MA. The influence of antioxidant nutrients on viral infection. NutritionReviews, 1998, 56(Suppl.):S140–S146.
22. Baum MK, Shor-Posner G. Micronutrient status in relationship to mortalityin HIV-1 disease. Nutrition Reviews, 1998, 56(Suppl.):S135–S139.
23. Baum MK et al. High risk of HIV-related mortality is associated with sele-nium deficiency. Journal of Acquired Immune Deficiency Syndrome andHuman Retrovirology, 1997, 15:370–374.
24. Cirelli A, Ciardi M, DeSimone C. Serum selenium concentration and diseaseprogress in patients with HIV infection. Clinical Biochemistry, 1991,24:211–214.
25. Dworkin BM. Selenium deficiency in HIV infection and the acquiredimmunodeficiency syndrome (AIDS). Chemico-Biological Interactions, 1994,91:181–186.
26. Taylor EW, Nadimpalli RG, Ramanathan CS. Genomic structures of viralagents in relation to the synthesis of selenoproteins. Biological Trace ElementResearch, 1997, 56:63–91.
27. Zazzo JF et al. Is nonobstructive cardiomyopathy in AIDS a selenium deficiency-related disease? Journal of Parenteral and Enteral Nutrition, 1988,12:537–538.
28. Kavanaugh-McHugh AL, Ruff A, Pearlman A. Selenium deficiency and car-diomyopathy in acquired immunodeficiency syndrome. Journal of Parenteraland Enteral Nutrition, 1991, 15:347–349.
29. Ramanathan CS, Taylor EW. Computational genomic analysis of hemorrhagicfever viruses. Viral selenoproteins as a potential factor in pathogenesis. Bio-logical Trace Element Research, 1997, 56:93–106.
30. Serfass RE, Ganther HE. Defective microbial activity in glutathione peroxi-dase deficient neutrophils of selenium deficient rats. Nature, 1975,225:640–641.
31. Boyne R, Arthur JR. The response of selenium deficient mice to Candida albi-cans infection. Journal of Nutrition, 1986, 116:816–822.
32. Ip C, Sinha DK. Enhancement of mammary tumorigenesis by dietary sele-nium deficiency in rats with a high polyunsaturated fat intake. CancerResearch, 1981, 41:31–34.
33. Levander OA. A global view of human selenium nutrition. Annual Review ofNutrition, 1987, 7:227–250.
34. Birt DF, Pour PM, Pelling JC. The influence of dietary selenium on colon,
P194-216 3/12/05 17:07 Page 212
pancreas, and skin tumorigenesis. In: Wendel A, ed. Selenium in biology andmedicine. Berlin, Springer-Verlag, 1989:297–304.
35. Arthur JR, Nicol F, Beckett GJ. Selenium deficiency thyroid hormone metab-olism and thyroid hormone deiodinases. American Journal of Clinical Nutrition, 1993, 57(Suppl.):S236–S239.
36. Corrilain B et al. Selenium and the thyroid: how the relationship was established. American Journal of Clinical Nutrition, 1993, 57(Suppl.):S244–S248.
37. Olivieri O et al. Selenium, zinc and thyroid hormones in healthy subjects. LowT3/T4 ratio in the elderly is related to impaired selenium status. BiologicalTrace Element Research, 1996, 51:31–41.
38. MacPherson A et al. Loss of Canadian wheat imports lowers selenium intakeand status of the Scottish population. In: Fischer PWF et al., eds. Trace elements in man and animals – 9. Proceedings of the Ninth International Symposium on Trace Elements in Man and Animals. Ottawa, NRC ResearchPress, 1997:203–205.
39. Vanderpas JB et al. Selenium deficiency mitigates hypothyroxinimia in iodinedeficient subjects. American Journal of Clinical Nutrition, 1993,57(Suppl.):S271–S275.
40. Contempre B et al. Selenium deficiency and thyroid fibrosis. A key role formacrophages and TGF-beta. Molecular and Cellular Enyzmology, 1996,124:7–15.
41. Ma T, Guo J, Wang F. The epidemiology of iodine deficiency diseases in China.American Journal of Clinical Nutrition, 1993, 57(Suppl.):S264–S266.
42. Contempre B et al. Selenium and iodine in thyroid function: the combineddeficiency in the etiology of the involution of the thyroid leading to myx-oedematous cretinism. In: Browerman LE et al., eds. Thyroid and trace ele-ments. 6th Thyroid Symposium. Eggenberg, Barmhersige Brudes, 1996:35–39.
43. Mahalingam TR et al. Studies on some trace and minor elements in blood. Asurvey of the Kalpakkam (India) population. Part III. Studies on dietary intakeand its correlation to blood levels. Biological Trace Element Research, 1997,57:223–238.
44. Varo P, Koivistoinen P. Mineral element composition of Finnish foods. XII.General discussion and nutritional evaluation. Acta Agricultura Scandinavica,1980, 22(Suppl.):S165–S171.
45. United Kingdom dietary intake of selenium. London, Her Majesty’s StationeryOffice, 1997 (MAFF Food Surveillance Information Sheet, No. 126).
46. Cumming FJ, Fardy JJ, Woodward DR. Selenium and human lactation in Aus-tralia: milk and blood selenium levels in lactating women and selenium intakeof their breast-fed infants. Acta Paediatrica, 1992, 81:1058–1061.
47. Sumar S, Kondza B, Foster LH. Selenium levels in preterm infant formulaeand breast milk from the United Kingdom: a study of estimated intakes. In:Fischer PWF et al., eds. Trace elements in man and animals—9. Proceedingsof the Ninth International Symposium on Trace Elements in Man and Animals.Ottawa, NRC Research Press, 1997:282–283.
48. Robberecht H, Benemariya H, Dellstra H. Daily dietary intake of copper, zincand selenium of exclusively breast fed infants of middle-class women inBurundi, Africa. Biological Trace Element Research, 1995, 49:151–159.
49. Minor and trace elements in milk: report of a joint WHO/IAEA collaborativestudy. Geneva, World Health Organization, 1989.
50. Kumpulainen J et al. Longitudinal study on the dietary selenium intake of
10. SELENIUM
213
P194-216 3/12/05 17:07 Page 213
VITAMIN AND MINERAL REQUIREMENTS IN HUMAN NUTRITION
214
exclusively breast fed infants and their mothers in Finland. InternationalJournal of Vitamin and Nutrition Research, 1983, 53:420–426.
51. Lombeck I et al. Selenium content of human milk, cow’s milk and cow’s milkinfant formulas. European Journal of Paediatrics, 1975, 129:139–145.
52. Millar KR, Sheppard AD. a-Tocopherol and selenium levels in human andcow’s milk. New Zealand Journal of Science, 1972, 15:3–15.
53. Williams MMF. Selenium and glutathione peroxidase in mature human milk.Proceedings of the University of Otago Medical School, Dunedin, 1983,61:20–21.
54. Levander OA, Moser PB, Morris VC. Dietary selenium intake and seleniumconcentrations of plasma, erythrocytes, and breast milk in pregnant and post-partum lactating and nonlactating women. American Journal of Clinical Nutri-tion, 1987, 46:694–698.
55. Shearer TR, Hadjimarkos DM. Geographic distribution of selenium in humanmilk. Archives of Environmental Health, 1975, 30:230–233.
56. Darlow BA et al. Selenium status of New Zealand infants fed either a seleniumsupplemented or a standard formula. Journal of Paediatrics and Child Health,1995, 31:339–344.
57. Smith A, Picciano MF, Milner JA. Selenium intakes and status of human milkformula fed infants. American Journal of Clinical Nutrition, 1982, 35:521–526.
58. Lonnerdal B. Effects of milk and milk components on calcium, magnesium,and trace element absorption during infancy. Physiological Reviews, 1997,77:643–669.
59. Iyengar V, Wooittiez J. Trace elements in human clinical specimens: evaluationof literature to identify reference values. Clinical Chemistry, 1988, 34:474–481.
60. Complementary feeding of young children in developing countries: a review ofcurrent scientific knowledge. Geneva, World Health Organization, 1998(WHO/NUT/98.1).
61. Thomson JN, Erdody P, Smith DC. Selenium in Canadian foods and diets.Journal of Nutrition, 1975, 105:274–279.
62. Yang G et al. Endemic selenium intoxication of humans in China. AmericanJournal of Clinical Nutrition, 1983, 37:872–881.
63. Luo XM et al. Selenium intake and metabolic balance of 10 men from a lowselenium area of China. American Journal of Clinical Nutrition, 1985,42:31–37.
64. Parr RM et al. Human dietary intakes of trace elements: a global literaturesurvey mainly for the period 1970–1991. I. Data listings and sources of infor-mation. Vienna, International Atomic Energy Agency, 1992 (NAHRES 12).
65. Koivistoinen P, Varo P. Selenium in Finnish food. In: Combs GF et al., eds.Selenium in biology and medicine. New York, NY, Van Nostrand Reinhold,1987:645–651.
66. Mutanen M et al. Comparison of chemical analysis and calculation method inestimating selenium content of Finnish diets. Nutrition Research, 1985,5:693–697.
67. Mutanen M. Dietary intake and sources of selenium in young Finnish women.Human Nutrition (Applied Nutrition), 1984, 38:265–269.
68. Simonoff M, Simonoff G. Le selenium et la vie. [Selenium and life.] Paris,Masson, 1991.
69. Oster O, Prellwitz W. The daily dietary selenium intake of West Germanadults. Biological Trace Element Research, 1989, 20:1–14.
70. Robinson MT, Thomason CD. Status of the food supply and residents of New
P194-216 3/12/05 17:07 Page 214
Zealand. In: Combs GF et al., eds. Selenium in biology and medicine. NewYork, NY, Van Nostrand Reinhold, 1987:631–644.
71. Kadrabova J, Madaric A, Ginter E. Determination of the daily selenium intakein Slovakia. Biological Trace Element Research, 1998, 61:277–286.
72. Abdulla MA, Behbehani A, Dashti H. Dietary intake and bioavailability oftrace elements. Biological Trace Element Research, 1989, 21:173–178.
73. Levander OA, Morris VC. Dietary selenium levels needed to maintain balancein North American adults consuming self-selected diets. American Journal ofClinical Nutrition, 1984, 39:809–815.
74. Bratter P, Bratter N, Gwlik D. Selenium in human monitors related to theregional dietary intake levels in Venezuela. Journal of Trace Elements and Elec-trolytes in Health and Disease, 1993, 7:111–112.
75. Alfthan G, Neve J. Reference values for serum selenium in various areas evaluated according to the TRACY protocol. Journal of Trace Elements inMedicine and Biology, 1996, 10:77–87.
76. Diplock AT et al. Interaction of selenium and iodine deficiency diseases. In:Fischer PWF et al., eds. Trace elements in man and animals—9. Proceedingsof the Ninth International Symposium on Trace Elements in Man and Animals.Ottawa, NRC Research Press, 1997:63–68.
77. Diplock AT. Indexes of selenium status in human populations. AmericanJournal of Clinical Nutrition, 1993, 57(Suppl.):S256–S258.
78. Versieck J, Cornelis R. Trace elements in human plasma or serum. Boca Raton,FL, CRC Press, 1989.
79. Selenium. Geneva, World Health Organization, 1987 (Environmental HealthCriteria, No. 58).
80. Patterson BH et al. Kinetic modelling of selenium in humans using stableisotope tracers. Journal of Trace Elements and Electrolytes in Health andDisease, 1993, 7:117–120.
81. Mutanen M. Bioavailability of selenium. Annals of Clinical Research, 1986,18:48–54.
82. Levander OA et al. Bioavailability of selenium to Finnish men as assessed byplatelet glutathione peroxidase activity and other blood parameters. AmericanJournal of Clinical Nutrition, 1983, 37:887–897.
83. Levander OA. The global selenium agenda. In: Hurley LS et al., eds. Trace ele-ments in man and animals—6. Proceedings of the 6th International Symposiumon Trace Elements in Man and Animals. New York, NY, Plenum Press, 1988:1–5.
84. Gu Q-P et al. Distribution of selenium between plasma fractions in guineapigs and humans with various intakes of selenium. Journal of Trace Elementsin Medicine and Biology, 1998, 12:8–15.
85. Trace elements in human nutrition and health. Geneva, World Health Organization, 1996.
86. Subcommittee on the Tenth Edition of the Recommended DietaryAllowances, Food and Nutrition Board. Recommended dietary allowances,10th ed. Washington, DC, National Academy Press, 1989.
87. Lombeck I et al. The selenium status of healthy children. I. Serum seleniumconcentration at different ages; activity of glutathione peroxidase of erythro-cytes at different ages; selenium content of food of infants. European Journalof Paediatrics, 1977, 125:81–88.
88. Levander OA. Upper limit of selenium in infant formulas. Journal of Nutrition, 1989, 119:1869–1871.
89. Nutrient and energy intakes for the European Community: a report of the
10. SELENIUM
215
P194-216 3/12/05 17:07 Page 215
VITAMIN AND MINERAL REQUIREMENTS IN HUMAN NUTRITION
216
Scientific Committee for Food. Brussels, Commission of the European Com-munities, 1993.
90. Dietary reference values for food energy and nutrients for the United Kingdom.London, Her Majesty’s Stationery Office, 1991 (Report on Health and SocialSubjects, No. 41).
91. Recommended dietary allowances 1989 in the Netherlands. The Hague,Netherlands Food and Nutrition Council, 1989.
92. Smith MI, Franke KW, Westfall BB. The selenium problem in relation topublic health. United States Public Health Report, 1936, 51:1496–1505.
93. Smith MI, Westfall BB. Further field studies on the selenium problem in rela-tion to public health. United States Public Health Report, 1937, 52:1375–1384.
94. Yang G et al. Endemic selenium intoxication of humans in China. AmericanJournal of Clinical Nutrition, 1983, 37:872–881.
95. Hadjimarkos DM. Selenium in relation to dental caries. Food and CosmeticToxicology, 1973, 11:1083–1095.
96. Hadjimarkos DM, Storveik CA, Renmert LT. Selenium and dental caries. Aninvestigation among school children of Oregon. Journal of Paediatrics, 1952,40:451–455.
97. Commission on Natural Resources. Mineral tolerance of domestic animals.Washington, DC, National Academy of Sciences, 1980.
P194-216 3/12/05 17:07 Page 216
11. Magnesium
217
11.1 Tissue distribution and biological role of magnesiumThe human body contains about 760mg of magnesium at birth, approximately5g at age 4–5 months, and 25g when adult (1–3). Of the body’s magnesium,30–40% is found in muscles and soft tissues, 1% is found in extracellular fluid,and the remainder is in the skeleton, where it accounts for up to 1% of boneash (4, 5).
Soft tissue magnesium functions as a cofactor of many enzymes involved inenergy metabolism, protein synthesis, RNA and DNA synthesis, and mainte-nance of the electrical potential of nervous tissues and cell membranes. Of par-ticular importance with respect to the pathological effects of magnesiumdepletion is the role of this element in regulating potassium fluxes and itsinvolvement in the metabolism of calcium (6–8). Magnesium depletiondepresses both cellular and extracellular potassium and exacerbates the effectsof low-potassium diets on cellular potassium content. Muscle potassiumbecomes depleted as magnesium deficiency develops, and tissue repletion ofpotassium is virtually impossible unless magnesium status is restored to normal.In addition, low plasma calcium often develops as magnesium status declines.It is not clear whether this occurs because parathyroid hormone release is inhib-ited or, more probably, because of a reduced sensitivity of bone to parathyroidhormone, thus restricting withdrawal of calcium from the skeletal matrix.
Between 50% and 60% of body magnesium is located within bone, whereit is thought to form a surface constituent of the hydroxyapatite (calciumphosphate) mineral component. Initially much of this magnesium is readilyexchangeable with serum and therefore represents a moderately accessiblemagnesium store which can be drawn on in times of deficiency. However, theproportion of bone magnesium in this exchangeable form declines signifi-cantly with increasing age (9).
Significant increases in bone mineral density of the femur have been asso-ciated positively with rises in erythrocyte magnesium when the diets of sub-jects with gluten-sensitive enteropathy were fortified with magnesium (10).Little is known of other roles for magnesium in skeletal tissues.
P217-229 3/12/05 17:08 Page 217
VITAMIN AND MINERAL REQUIREMENTS IN HUMAN NUTRITION
218
11.2 Populations at risk for, and consequences of,magnesium deficiency
Pathological effects of primary nutritional deficiency of magnesium occurinfrequently in infants (11) but are even less common in adults unless a rela-tively low magnesium intake is accompanied by prolonged diarrhoea or exces-sive urinary magnesium losses (12). Susceptibility to the effects of magnesiumdeficiency rises when demands for magnesium increase markedly with theresumption of tissue growth during rehabilitation from general malnutrition(6, 13). Studies have shown that a decline in urinary magnesium excretionduring protein–energy malnutrition (PEM) is accompanied by a reducedintestinal absorption of magnesium. The catch-up growth associated withrecovery from PEM is achieved only if magnesium supply is increased sub-stantially (6, 14).
Most of the early pathological consequences of depletion are neurologic orneuromuscular defects (12, 15), some of which probably reflect the influenceof magnesium on potassium flux within tissues. Thus, a decline in magnesiumstatus produces anorexia, nausea, muscular weakness, lethargy, staggering,and, if deficiency is prolonged, weight loss. Progressively increasing with theseverity and duration of depletion are manifestations of hyperirritability,hyperexcitability, muscular spasms, and tetany, leading ultimately to convul-sions. An increased susceptibility to audiogenic shock is common in experi-mental animals. Cardiac arrhythmia and pulmonary oedema frequently havefatal consequences (12). It has been suggested that a suboptimal magnesiumstatus may be a factor in the etiology of coronary heart disease and hyper-tension but additional evidence is needed (16).
11.3 Dietary sources, absorption, and excretion ofmagnesium
Dietary deficiency of magnesium of a severity sufficient to provoke patho-logical changes is rare. Magnesium is widely distributed in plant and animalfoods, and geochemical and other environmental variables rarely have a majorinfluence on its content in foods. Most green vegetables, legume seeds, beans,and nuts are rich in magnesium, as are some shellfish, spices, and soya flour,all of which usually contain more than 500mg/kg fresh weight. Althoughmost unrefined cereal grains are reasonable sources, many highly-refinedflours, tubers, fruits, fungi, and most oils and fats contribute little dietarymagnesium (<100mg/kg fresh weight) (17–19). Corn flour, cassava and sagoflour, and polished rice flour have extremely low magnesium contents. Table11.1 presents representative data for the dietary magnesium intakes of infantsand adults.
P217-229 3/12/05 17:08 Page 218
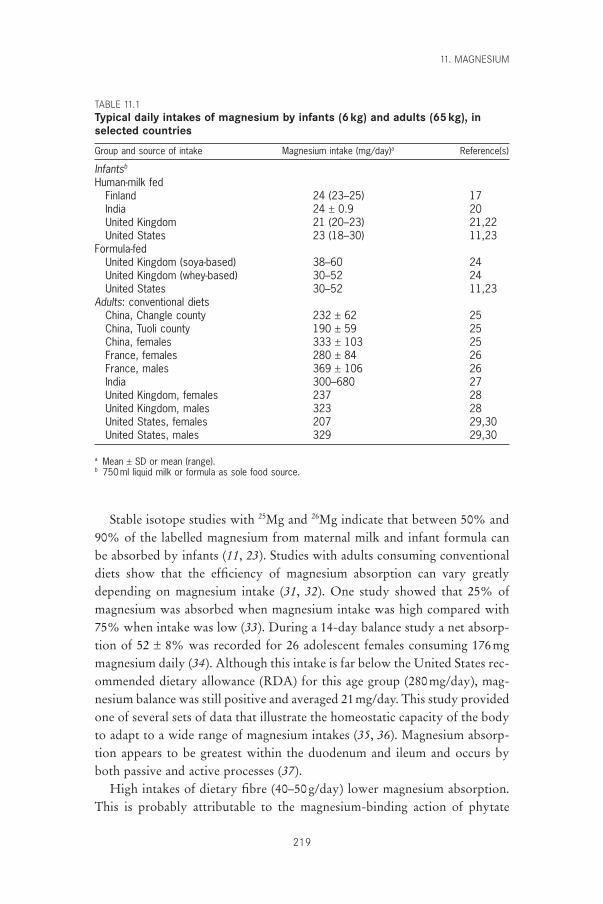
Stable isotope studies with 25Mg and 26Mg indicate that between 50% and90% of the labelled magnesium from maternal milk and infant formula canbe absorbed by infants (11, 23). Studies with adults consuming conventionaldiets show that the efficiency of magnesium absorption can vary greatlydepending on magnesium intake (31, 32). One study showed that 25% ofmagnesium was absorbed when magnesium intake was high compared with75% when intake was low (33). During a 14-day balance study a net absorp-tion of 52 ± 8% was recorded for 26 adolescent females consuming 176mgmagnesium daily (34). Although this intake is far below the United States rec-ommended dietary allowance (RDA) for this age group (280mg/day), mag-nesium balance was still positive and averaged 21mg/day. This study providedone of several sets of data that illustrate the homeostatic capacity of the bodyto adapt to a wide range of magnesium intakes (35, 36). Magnesium absorp-tion appears to be greatest within the duodenum and ileum and occurs byboth passive and active processes (37).
High intakes of dietary fibre (40–50g/day) lower magnesium absorption.This is probably attributable to the magnesium-binding action of phytate
11. MAGNESIUM
219
TABLE 11.1Typical daily intakes of magnesium by infants (6kg) and adults (65kg), inselected countries
Group and source of intake Magnesium intake (mg/day)a Reference(s)
Infantsb
Human-milk fedFinland 24 (23–25) 17India 24 ± 0.9 20United Kingdom 21 (20–23) 21,22United States 23 (18–30) 11,23
Formula-fedUnited Kingdom (soya-based) 38–60 24United Kingdom (whey-based) 30–52 24United States 30–52 11,23
Adults: conventional dietsChina, Changle county 232 ± 62 25China, Tuoli county 190 ± 59 25China, females 333 ± 103 25France, females 280 ± 84 26France, males 369 ± 106 26India 300–680 27United Kingdom, females 237 28United Kingdom, males 323 28United States, females 207 29,30United States, males 329 29,30
a Mean ± SD or mean (range).b 750ml liquid milk or formula as sole food source.
P217-229 3/12/05 17:08 Page 219
VITAMIN AND MINERAL REQUIREMENTS IN HUMAN NUTRITION
220
phosphorus associated with the fibre (38–40). However, consumption ofphytate- and cellulose-rich products increases magnesium intake (as theyusually contain high concentrations of magnesium) which often compensatesfor the decrease in absorption. The effects of dietary components such asphytate on magnesium absorption are probably critically important onlywhen magnesium intake is low. There is no consistent evidence that modestincreases in the intake of calcium (34–36), iron, or manganese (22) affect mag-nesium balance. In contrast, high intakes of zinc (142mg/day) decrease mag-nesium absorption and contribute to a shift towards negative balance in adultmales (41).
The kidney has a very significant role in magnesium homeostasis. Activereabsorption of magnesium takes place in the loop of Henle in the proximalconvoluted tubule and is influenced by both the urinary concentration ofsodium and probably by acid–base balance (42). The latter relationship maywell account for the observation drawn from Chinese studies that dietarychanges which result in increased urinary pH and decreased titratable acidityalso reduce urinary magnesium output by 35% despite marked increases inmagnesium input from vegetable protein diets (25). Several studies have nowshown that dietary calcium intakes in excess of 2600mg/day (37), particularlyif associated with high sodium intakes, contribute to a shift towards negativemagnesium balance or enhance its urinary output (42, 43).
11.4 Criteria for assessing magnesium requirements and allowances
In 1996, Shils and Rude (44) published a constructive review of past proce-dures used to derive estimates of magnesium requirements. They questionedthe view of many authors that metabolic balance studies are probably the onlypracticable, non-invasive techniques for assessing the relationship of magne-sium intake to magnesium status. At the same time, they emphasized the greatscarcity of data on variations in urinary magnesium output and on magne-sium levels in serum, erythrocytes, lymphocytes, bone, and soft tissues. Suchdata are needed to verify current assumptions that pathological responses toa decline in magnesium supply are not likely to occur if magnesium balanceremains relatively constant.
In view of Shils and Rude’s conclusion that many estimates of dietaryrequirements for magnesium were “based upon questionable and insufficientdata” (44), a closer examination is needed of the value of biochemical criteria for defining the adequacy of magnesium status (13). Possible candidates forfurther investigation include the effects of changes in magnesium intake onurinary magnesium–creatinine ratios (45), the relationships between serum
P217-229 3/12/05 17:08 Page 220
magnesium–calcium and magnesium–potassium concentrations (7, 8), andvarious other functional indicators of magnesium status.
The scarcity of studies from which to derive estimates of dietary allowancesfor magnesium has been emphasized by virtually all the agencies faced withthis task. One United Kingdom agency commented particularly on thescarcity of studies with young subjects, and circumvented the problem of dis-cordant data from work with adolescents and adults by restricting the rangeof studies considered (21). Using experimental data virtually identical to thoseused for a detailed critique of the basis for United States estimates (44), theScientific Committee for Food of the European Communities (46) proposedan acceptable range of intakes for adults of 150–500mg/day and described aseries of quasi-population reference intakes for specific age groups, whichincluded an increment of 30% to allow for individual variations in growth.Statements of acceptable intakes such as these leave uncertainty as to theextent of overestimation of derived recommended intakes.
It is questionable whether more reliable estimates of magnesium require-ments can be made until data from balance studies are supported by the useof biochemical indexes of adequacy that could reveal the development of manifestations of suboptimal status. Such indexes have been examined, forexample, by Nichols et al. (14) in their studies of the metabolic significanceof magnesium depletion during PEM. A loss of muscle and serum magnesiumresulted if total body magnesium retention fell below 2mg/kg/day and wasfollowed by a fall in the myofibrillar nitrogen–collagen ratio of muscle and afall in muscle potassium content. Repletion of tissue magnesium status pre-ceded a three-fold increase in muscle potassium content. Furthermore, itaccelerated, by 7–10 days, the rate of recovery of muscle mass and composi-tion initiated by restitution of nitrogen and energy supplies to infants previ-ously deficient.
Neurologic signs such as hyperirritability, apathy, tremors, and occasionalataxia accompanied by low concentrations of potassium and magnesium inskeletal muscle and strongly negative magnesium balances were reported bymany other studies of protein calorie deficiency in infants (47–49). Particu-larly noteworthy is evidence that all these effects are ameliorated or elimi-nated by increased oral magnesium, as were specific anomalies in theelectrocardiographic T-wave profiles of such malnourished subjects (49). Evi-dence that the initial rate of growth at rehabilitation is influenced by dietarymagnesium intake indicates the significance of this element for the etiologyof the PEM syndromes (31, 50).
Regrettably, detailed studies have yet to be carried out to define the natureof changes resulting from a primary deficiency of dietary magnesium. Defin-
11. MAGNESIUM
221
P217-229 3/12/05 17:08 Page 221
VITAMIN AND MINERAL REQUIREMENTS IN HUMAN NUTRITION
222
ition of magnesium requirements must therefore continue to be based on thelimited information provided by balance techniques, which give little or noindication of responses by the body to inadequacy in magnesium supply thatmay induce covert pathological changes, and reassurance must be sought fromthe application of dietary standards for magnesium in communities consum-ing diets differing widely in magnesium content (27). The inadequate defini-tion of lower acceptable limits of magnesium intake raises concern incommunities or individuals suffering from malnutrition or a wider variety ofnutritional or other diseases which influence magnesium metabolismadversely (12, 51, 52).
11.5 Recommended intakes for magnesiumThe infrequency with which magnesium deficiency develops in human-milk-fed infants implies that the content and physiological availability of mag-nesium in human milk meets the infants’ requirements. The intake of mater-nal milk from exclusively human-milk-fed infants 1–10 months of age rangesfrom 700 to 900ml/day in both industrialized and developing countries (53).If the magnesium content of milk is assumed to be 29mg/l (11, 54, 55), theintake from milk is 20–26mg/day, or approximately 0.04mg/kcal.
The magnesium in human milk is absorbed with substantially greater effi-ciency (about 80–90%) than that of formula milks (about 55–75%) or solidfoods (about 50%) (56), and such differences must be taken into account whencomparing differing dietary sources. For example, a daily intake of 23mg frommaternal milk probably yields 18mg available magnesium, a quantity similarto that of the 36mg or more suggested as meeting the requirements of younginfants given formula or other foods (see below).
An indication of a likely requirement for magnesium at other ages can be derived from studies of magnesium–potassium relationships in muscle (57) and the clinical recovery of young children rehabilitated from malnutri-tion with or without magnesium fortification of therapeutic diets. Nichols et al. (14) showed that 12mg magnesium/day was not sufficient to restore positive magnesium balance, serum magnesium content, or the magnesiumand potassium contents of muscle of children undergoing PEM rehabilitation.Muscle potassium was restored to normal by 42mg magnesium/day buthigher intakes of dietary magnesium, up to 160mg/day, were needed torestore muscle magnesium to normal. Although these studies show clearlythat magnesium synergized growth responses resulting from nutritional rehabilitation, they also indicated that rectification of earlier deficits of protein and energy was a prerequisite to initiation of this effect of magnesium.
P217-229 3/12/05 17:08 Page 222
Similar studies by Caddell et al. (49, 50) also illustrate the secondary sig-nificance of magnesium accelerating clinical recovery from PEM. They indi-cate that prolonged consumption of diets low in protein and energy and witha low ratio (<0.02) of magnesium (in milligrams) to energy (in kilocalories)can induce pathological changes which respond to increases in dietary mag-nesium supply. It is noteworthy that of the balance trials intended to inves-tigate magnesium requirements, none has yet included treatments with mag-nesium–energy ratios of <0.04 or induced pathological responses.
The relationship Mg = (kcal ¥ 0.0099) - 0.0117 (SE ± 0.0029) holds formany conventional diets (58). Some staple foods in common use have verylow magnesium contents; cassava, sago, corn flour or cornstarch, and polishedrice all have low magnesium–energy ratios (0.003–0.02) (18). Their widespreaduse merits appraisal of total dietary magnesium content.
It has been reported with increasing frequency that a high percentage (e.g.<70%) (26) of individuals from some communities in Europe have magne-sium intakes substantially lower than estimates of magnesium requirementsderived principally from United States and United Kingdom sources (21, 29).Such reports emphasize the need for reappraisal of estimates for reasons pre-viously discussed (44).
Recommended magnesium intakes proposed by the present Consultation arepresented in Table 11.2 together with indications of the relationships of each rec-ommendation to relevant estimates of the average requirements for dietaryprotein and energy (19). These recommended intakes must be regarded as pro-visional. Until additional data become available, these estimates reflect consid-eration of anxieties that previous recommendations for magnesium areoverestimates. The estimates provided by the Consultation make greaterallowance for developmental changes in growth rate and in protein and energyrequirements. In reconsidering data on which estimates were based cited in pre-vious reports (21, 29, 46), particular attention has been paid to balance datasuggesting that the experimental conditions established have provided rea-sonable opportunity for the development of equilibrium during the investi-gation (34, 60–62).
The detailed studies of magnesium economy during malnutrition and sub-sequent therapy, with or without magnesium supplementation, provide rea-sonable grounds that the dietary magnesium recommendations derived hereinfor young children are realistic. Data for other ages are more scarce and are confined to magnesium balance studies. Some studies have paid little attention to the influence of variations in dietary magnesium content and of the effects of growth rate before and after puberty on the normality of magnesium-dependent functions.
11. MAGNESIUM
223
P217-229 3/12/05 17:08 Page 223
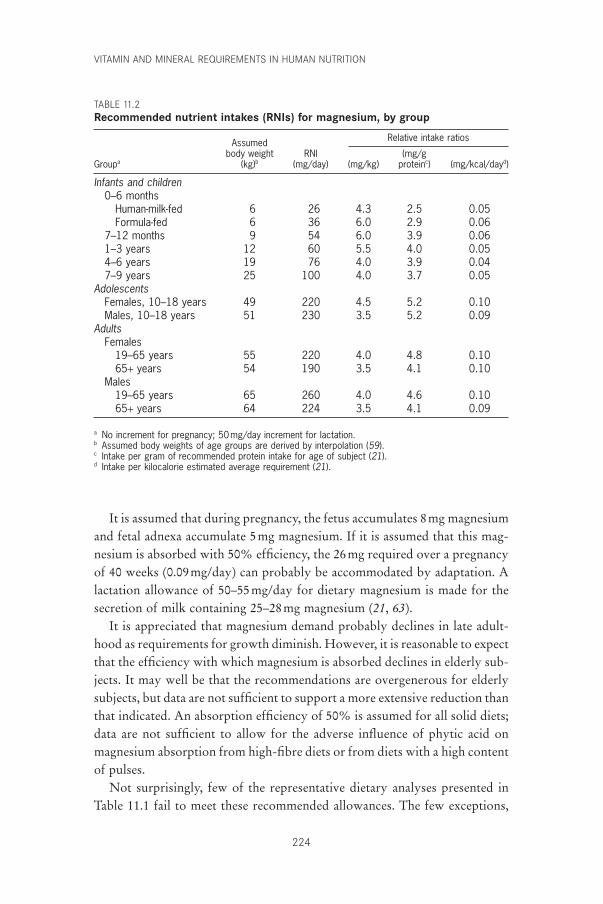
VITAMIN AND MINERAL REQUIREMENTS IN HUMAN NUTRITION
224
It is assumed that during pregnancy, the fetus accumulates 8mg magnesiumand fetal adnexa accumulate 5mg magnesium. If it is assumed that this mag-nesium is absorbed with 50% efficiency, the 26mg required over a pregnancyof 40 weeks (0.09mg/day) can probably be accommodated by adaptation. A lactation allowance of 50–55mg/day for dietary magnesium is made for thesecretion of milk containing 25–28mg magnesium (21, 63).
It is appreciated that magnesium demand probably declines in late adult-hood as requirements for growth diminish. However, it is reasonable to expectthat the efficiency with which magnesium is absorbed declines in elderly sub-jects. It may well be that the recommendations are overgenerous for elderlysubjects, but data are not sufficient to support a more extensive reduction thanthat indicated. An absorption efficiency of 50% is assumed for all solid diets;data are not sufficient to allow for the adverse influence of phytic acid onmagnesium absorption from high-fibre diets or from diets with a high contentof pulses.
Not surprisingly, few of the representative dietary analyses presented inTable 11.1 fail to meet these recommended allowances. The few exceptions,
TABLE 11.2Recommended nutrient intakes (RNIs) for magnesium, by group
Assumed Relative intake ratios
body weight RNI (mg/gGroupa (kg)b (mg/day) (mg/kg) proteinc) (mg/kcal/dayd)
Infants and children0–6 months
Human-milk-fed 6 26 4.3 2.5 0.05Formula-fed 6 36 6.0 2.9 0.06
7–12 months 9 54 6.0 3.9 0.061–3 years 12 60 5.5 4.0 0.054–6 years 19 76 4.0 3.9 0.047–9 years 25 100 4.0 3.7 0.05
AdolescentsFemales, 10–18 years 49 220 4.5 5.2 0.10Males, 10–18 years 51 230 3.5 5.2 0.09
AdultsFemales
19–65 years 55 220 4.0 4.8 0.1065+ years 54 190 3.5 4.1 0.10
Males19–65 years 65 260 4.0 4.6 0.1065+ years 64 224 3.5 4.1 0.09
a No increment for pregnancy; 50mg/day increment for lactation.b Assumed body weights of age groups are derived by interpolation (59).c Intake per gram of recommended protein intake for age of subject (21).d Intake per kilocalorie estimated average requirement (21).
P217-229 3/12/05 17:08 Page 224
deliberately selected for inclusion, are the marginal intakes (232 ± 62mg) ofthe 168 women of Changle County, People’s Republic of China, and the lowintake (190 ± 59mg) of 147 women surveyed from Tuoli County, People’sRepublic of China (25).
11.6 Upper limitsMagnesium from dietary sources is relatively innocuous. Contamination offood or water supplies with magnesium salt has been known to cause hyper-magnesaemia, nausea, hypotension, and diarrhoea. Intakes of 380mg magne-sium as magnesium chloride have produced such signs in women. Upperlimits of 65mg for children aged 1–3 years, 110mg for children aged 4–10years, and 350mg for adolescents and adults are suggested as tolerable limitsfor the daily intake of magnesium from foods and drinking water (64).
11.7 Comparison with other estimatesThe recommended intakes for infants aged 0–6 months take account of dif-ferences in the physiological availability of magnesium from maternal milk ascompared with infant formulas or solid foods. With the exception of the Cana-dian recommended nutrient intakes (RNIs), which are 20mg/day for infantsaged 0–4 months and 32mg/day for those aged 5–12 months (63), other coun-tries recommend intakes (as RDAs or RNIs) which substantially exceed thecapacity of the lactating mother to supply magnesium for her offspring.
Recommendations for other ages are based subjectively on the absence ofany evidence that magnesium deficiency of nutritional origin has occurredafter consumption of a range of diets sometimes supplying considerably lessthan the United States RDA or the United Kingdom RNI recommendations,which are based on estimates of average magnesium requirements of 3.4–7mg/kg body weight. The recommendations submitted herein assume thatdemands for magnesium, plus a margin of approximately 20% (to allow formethodological variability), are probably met by allowing approximately3.5–5mg/kg body weight from pre-adolescence to maturity. This assumptionyields estimates virtually identical to those for Canada. Expressed as magne-sium allowance (in milligrams) divided by energy allowance (in kilocalo-ries)—the latter based upon energy recommendations from United Kingdomestimates (21)—all of the recommendations of Table 11.2 exceed the provi-sionally estimated critical minimum magnesium–energy ratio of 0.02.
11.8 Recommendations for future researchThere is need for closer investigation of the biochemical changes that developas magnesium status declines. The responses to magnesium intake, which
11. MAGNESIUM
225
P217-229 3/12/05 17:08 Page 225
VITAMIN AND MINERAL REQUIREMENTS IN HUMAN NUTRITION
226
influence the pathological effects resulting from disturbances in potassiumutilization caused by low magnesium, should be studied. They may wellprovide an understanding of the influence of magnesium status on growth rateand neurologic integrity.
Closer investigation of the influence of magnesium status on the effective-ness of therapeutic measures during rehabilitation from PEM is also needed.The significance of magnesium in the etiology and consequences of PEM inchildren needs to be clarified. Claims that restoration of protein and energysupply aggravates the neurologic features of PEM if magnesium status is notimproved merit priority of investigation. Failure to clarify these aspects maycontinue to obscure some of the most important pathological features of anutritional disorder in which evidence already exists for the involvement of amagnesium deficit.
References1. Widdowson EM, McCance RA, Spray CM. The chemical composition of the
human body. Clinical Science, 1951, 10:113–125.2. Forbes GB. Human body composition: growth, aging, nutrition and activity.
New York, NY, Springer-Verlag, 1987.3. Schroeder HA, Nason AP, Tipton IH. Essential metals in man: magnesium.
Journal of Chronic Diseases, 1969, 21:815–841.4. Heaton FW. Magnesium in intermediary metabolism. In: Canatin M, Seelig M,
eds. Magnesium in health and disease. New York, NY, SP Medical and Scien-tific Books, 1976:43–55.
5. Webster PO. Magnesium. American Journal of Clinical Nutrition, 1987,45:1305–1312.
6. Waterlow JC. Protein-energy malnutrition. London, Edwin Arnold, 1992.7. Classen HG. Magnesium and potassium deprivation and supplementation in
animals and man: aspects in view of intestinal absorption. Magnesium, 1984,3:257–264.
8. Al-Ghamdi SM, Cameron EC, Sutton RA. Magnesium deficiency: patho-physiologic and clinical overview. American Journal of Kidney Diseases, 1994,24:737–754.
9. Breibart S et al. Relation of age to radiomagnesium in bone. Proceedings of theSociety of Experimental Biology and Medicine, 1960, 105:361–363.
10. Rude RK, Olerich M. Magnesium deficiency: possible role in osteoporosisassociated with gluten-sensitive enteropathy. Osteoporosis International, 1996,6:453–461.
11. Lönnerdal B. Magnesium nutrition of infants. Magnesium Research, 1995,8:99–105.
12. Shils ME. Magnesium in health and disease. Annual Review of Nutrition, 1988,8:429–460.
13. Gibson RS. Principles of nutritional assessment. New York, NY, Oxford Uni-versity Press, 1990.
14. Nichols BL et al. Magnesium supplement in protein-calorie malnutrition.American Journal of Clinical Nutrition, 1978, 31:176–188.
P217-229 3/12/05 17:08 Page 226
15. Shils ME. Experimental human magnesium depletion. Medicine, 1969, 48:61–85.
16. Elwood PC. Iron, magnesium and ischaemic heart disease. Proceedings of theNutrition Society, 1994, 53:599–603.
17. Koivistoinen P. Mineral element composition of Finnish foods. Acta Agricul-tura Scandinavica, 1980, 22(Suppl.):S7–S171.
18. Paul AA, Southgate DAT. The composition of foods. London, Her Majesty’sStationery Office, 1978.
19. Tan SP, Wenlock RW, Buss DH. Immigrant foods. Second supplement to thecomposition of foods. London, Her Majesty’s Stationery Office, 1985.
20. Belavady B. Lipid and trace element content of human milk. Acta PediatricaScandinavica, 1978, 67:566–569.
21. Department of Health. Dietary reference values for food energy and nutrientsfor the United Kingdom. London, Her Majesty’s Stationery Office, 1991(Report on Health and Social Subjects, No. 41).
22. Wisker E et al. Calcium, magnesium, zinc and iron balances in young women.American Journal of Clinical Nutrition, 1991, 54:533–559.
23. Lönnerdal B. Effects of milk and milk components on calcium, magnesiumand trace element absorption during infancy. Physiological Reviews, 1997,77:643–669.
24. Holland B, Unwin ID, Buss DH. Milk products and eggs. Fourth supplementto the composition of foods. Royal Society of Chemistry, Cambridge, 1989.
25. Hu J-F et al. Dietary intakes and urinary excretion of calcium and acids: across-sectional study of women in China. American Journal of Clinical Nutri-tion, 1993, 58:398–406.
26. Galan P et al. Dietary magnesium intake in a French adult population. Mag-nesium Research, 1997, 10:321–328.
27. Parr RM et al. Human dietary intakes of trace elements: a global literaturesurvey mainly for the period 1970–1991. Vienna, International Atomic EnergyAgency, 1992 (NAHRES 12).
28. Gregory J et al. The Dietary and Nutritional Survey of British Adults. London,Her Majesty’s Stationery Office, 1990.
29. Subcommittee on the Tenth Edition of the Recommended DietaryAllowances, Food and Nutrition Board. Recommended dietary allowances,10th ed. Washington, DC, National Academy Press, 1989.
30. Anonymous. Calcium and related nutrients: overview and methods. NutritionReviews, 1997, 55:335–341.
31. Spencer H et al. Magnesium absorption and metabolism in patients withchronic renal failure and in patients with normal renal function. Gastroen-terology, 1980, 79:26–34.
32. Seelig MS. Magnesium requirements in human nutrition. Journal of theMedical Society of New Jersey, 1982, 70:849–854.
33. Schwartz R, Spencer H, Welsh JH. Magnesium absorption in human subjects.American Journal of Clinical Nutrition, 1984, 39:571–576.
34. Andon MB et al. Magnesium balance in adolescent females consuming a low- or high-calcium diet. American Journal of Clinical Nutrition, 1996,63:950–953.
35. Abrams SA et al. Calcium and magnesium balance in 9–14 year old children.American Journal of Clinical Nutrition, 1997, 66:1172–1177.
11. MAGNESIUM
227
P217-229 3/12/05 17:08 Page 227
VITAMIN AND MINERAL REQUIREMENTS IN HUMAN NUTRITION
228
36. Sojka J et al. Magnesium kinetics in adolescent girls determined using stableisotopes: effects of high and low calcium intakes. American Journal of Physi-ology, 1997, 273: R710–R715.
37. Greger JL, Smith SA, Snedeker SM. Effect of dietary calcium and phosphoruslevels on the utilization of calcium, magnesium, manganese, and selenium byadult males. Nutrition Research, 1981, 1:315–325.
38. McCance RA, Widdowson EM. Mineral metabolism on dephytinised bread.Journal of Physiology, 1942, 101:304–313.
39. McCance RA, Widdowson EM. Mineral metabolism in healthy adults onwhite and brown bread dietaries. Journal of Physiology, 1942, 101:44–85.
40. Kelsay JL, Bahall KM, Prather ES. Effect of fiber from fruit and vegetables onthe metabolic responses of human subjects. American Journal of ClinicalNutrition, 1979, 32:1876–1880.
41. Spencer H, Norris C, Williams D. Inhibitory effect of zinc on magnesiumbalance and absorption in man. Journal of the American College of Nutrition,1994, 13:479–484.
42. Quarme GA, Disks JH. The physiology of renal magnesium handling. RenalPhysiology, 1986, 9:257–269.
43. Kesteloot H, Joosens JV. The relationship between dietary intake and urinaryexcretion of sodium, potassium, calcium and magnesium. Journal of HumanHypertension, 1990, 4:527–533.
44. Shils ME, Rude RK. Deliberations and evaluations of the approaches, end-points and paradigms for magnesium dietary recommendations. Journal ofNutrition, 1996, 126(Suppl.):S2398–S2403.
45. Matos V et al. Urinary phosphate creatinine, calcium/creatinine and magne-sium/creatinine ratios in a healthy pediatric population. Journal of Pediatrics,1997, 131:252–257.
46. Reference nutrient intakes for the European Community: a report of the Sci-entific Committee for Food. Brussels, Commission of the European Commu-nities, 1993.
47. Montgomery RD. Magnesium metabolism in infantile protein malnutrition.Lancet, 1960, 2:74–75.
48. Linder GC, Hansen DL, Karabus CD. The metabolism of magnesium andother inorganic cations and of nitrogen in acute kwashiorkor. Pediatrics, 1963,31:552–568.
49. Caddell JL. Magnesium deficiency in protein-calorie malnutrition: a follow-up study. Annals of the New York Academy of Sciences, 1969,162:874–890.
50. Caddell JL, Goodard DR. Studies in protein-calorie malnutrition. I. Chemi-cal evidence for magnesium deficiency. New England Journal of Medicine,1967, 276:533–535.
51. Brautbar N, Roy A, Hom P. Hypomagnesaemia and hypermagnesaemia. In:Sigel H, Sigel A, eds. Metals in biological systems. 26. Magnesium and its rolein biology, nutrition and physiology. New York, NY, Marcel Dekker,1990:215–320.
52. Elin RJ. The assessment of magnesium status in humans. In: Sigel H, Sigel A,eds. Metals in biological systems. 26. Magnesium and its role in biology, nutri-tion and physiology. New York, NY, Marcel Dekker, 1990:579–596.
53. Complementary feeding of young children in developing countries: a review ofcurrent scientific knowledge. Geneva, World Health Organization, 1998(WHO/NUT/98.1).
P217-229 3/12/05 17:08 Page 228
54. Iyengar GV. Elemental composition of human and animal milk. Vienna, Inter-national Atomic Energy Agency, 1982 (IAEA-TECDOC-296).
55. Liu YMP et al. Absorption of calcium and magnesium from fortified humanmilk by very low birth weight infants. Pediatric Research, 1989, 25:496–502.
56. Lönnerdal B. Effects of milk and milk components on calcium, magnesium,and trace element absorption during infancy. Physiological Reviews, 1997,77:643–669.
57. Dorup I. Magnesium and potassium deficiency: its diagnosis, occurrence andtreatment. Aarhus, University of Aarhus Institute of Physiology, 1994.
58. Manalo E, Flora RE, Duel SE. A simple method for estimating dietary mag-nesium. American Journal of Clinical Nutrition, 1967, 20:627–631.
59. Requirements of vitamin A, iron, folate and vitamin B12. Rome, Food andAgriculture Organization of the United Nations, 1988 (FAO Nutrition Series,No. 23).
60. Mahalko JR et al. Effect of a moderate increase in dietary protein on the reten-tion and excretion of Ca, Cu, Fe, Mg, P, and Zn by adult males. AmericanJournal of Clinical Nutrition, 1983, 37:8–14.
61. Hunt SM, Schofield FA. Magnesium balance and protein intake in the adulthuman female. American Journal of Clinical Nutrition, 1969, 22:367–373.
62. Marshall DH, Nordin BEC, Speed R. Calcium, phosphorus and magnesiumrequirement. Proceedings of the Nutrition Society, 1976, 35:163–173.
63. Scientific Review Committee. Nutrition recommendations: Health andWelfare, Canada. Report of the Scientific Review Committee. Ottawa, Supplyand Services, 1992.
64. Food and Nutrition Board. Dietary reference intakes for calcium, phosphorus,magnesium, vitamin D, and fluoride. Washington, DC, National AcademyPress, 1997.
11. MAGNESIUM
229
P217-229 3/12/05 17:08 Page 229
230
12. Zinc
12.1 Role of zinc in human metabolic processesZinc is present in all body tissues and fluids. The total body zinc content hasbeen estimated to be 30mmol (2g). Skeletal muscle accounts for approximately60% of the total body content and bone mass, with a zinc concen-tration of 1.5–3mmol/g (100–200mg/g), for approximately 30%. The concen-tration of zinc in lean body mass is approximately 0.46mmol/g (30mg/g).Plasma zinc has a rapid turnover rate and it represents only about 0.l% of totalbody zinc content. This level appears to be under close homeostatic control.High concentrations of zinc are found in the choroid of the eye (4.2mmol/gor 274mg/g) and in prostatic fluids (4.6–7.7mmol/l or 300–500mg/l) (1).
Zinc is an essential component of a large number (>300) of enzymes participating in the synthesis and degradation of carbohydrates, lipids, proteins, and nucleic acids as well as in the metabolism of other micronutri-ents. Zinc stabilizes the molecular structure of cellular components and mem-branes and in this way contributes to the maintenance of cell and organintegrity. Furthermore, zinc has an essential role in polynucleotide transcrip-tion and thus in the process of genetic expression. Its involvement in suchfundamental activities probably accounts for the essentiality of zinc for all lifeforms.
Zinc plays a central role in the immune system, affecting a number ofaspects of cellular and humoral immunity (2). Shankar and Prasad havereviewed the role of zinc in immunity extensively (2).
The clinical features of severe zinc deficiency in humans are growth retar-dation, delayed sexual and bone maturation, skin lesions, diarrhoea, alopecia,impaired appetite, increased susceptibility to infections mediated via defectsin the immune system, and the appearance of behavioural changes (1). Theeffects of marginal or mild zinc deficiency are less clear. A reduced growthrate and impairments of immune defence are so far the only clearly demon-strated signs of mild zinc deficiency in humans. Other effects, such asimpaired taste and wound healing, which have been claimed to result from alow zinc intake, are less consistently observed.
P230-245 3/12/05 17:09 Page 230
12.2 Zinc metabolism and homeostasisZinc absorption is concentration dependent and occurs throughout the small intestine. Under normal physiological conditions, transport processesof uptake are not saturated. Zinc administered in aqueous solutions to fastingsubjects is absorbed efficiently (60–70%), whereas absorption from solid dietsis less efficient and varies depending on zinc content and diet composition (3).
The major losses of zinc from the body are through the intestine and urine,by desquamation of epithelial cells, and in sweat. Endogenous intestinal lossescan vary from 7mmol/day (0.5mg/day) to more than 45mmol/day (3mg/day),depending on zinc intake—the higher the intake, the greater the losses (4).Urinary and integumental losses are of the order of 7–10mmol/day (0.5–0.7mg/day) each and depend less on normal variations in zinc intake (4). Starvation and muscle catabolism increase zinc losses in urine. Strenuous exercise and elevated ambient temperatures can lead to high losses throughperspiration.
The body has no zinc stores in the conventional sense. In conditions ofbone resorption and tissue catabolism, zinc is released and may be reutilizedto some extent. Human experimental studies with low zinc diets containing2.6–3.6mg/day (40–55mmol/day) have shown that circulating zinc levels andactivities of zinc-containing enzymes can be maintained within a normal rangeover several months (5, 6), a finding which highlights the efficiency of the zinchomeostasis mechanism. Controlled depletion–repletion studies in humanshave shown that changes in the endogenous excretion of intestinal, urinary,and integumental zinc as well as changes in absorptive efficiency are howbody zinc content is maintained (7–10). However, the underlying mechanismsare poorly understood.
Sensitive indexes for assessing zinc status are unknown at present. Staticindexes, such as zinc concentration in plasma, blood cells, and hair, andurinary zinc excretion are decreased in severe zinc deficiency. A number ofconditions that are unrelated to zinc status can affect all these indexes, espe-cially zinc plasma levels. Food intake, stress situations such as fever, infection,and pregnancy lower plasma zinc concentrations whereas, for example, long-term fasting increases it (11). However, on a population basis, reduced plasmazinc concentrations seem to be a marker for zinc-responsive growth reduc-tions (12, 13). Experimental zinc depletion studies suggest that changes inimmune response occur before reductions in plasma zinc concentrations are apparent (14). To date, it has not been possible to identify zinc-dependent enzymes which could serve as early markers for zinc status.
A number of functional indexes of zinc status have been suggested, forexample, wound healing, taste acuity, and visual adaptation to the dark (11).
12. ZINC
231
P230-245 3/12/05 17:09 Page 231
VITAMIN AND MINERAL REQUIREMENTS IN HUMAN NUTRITION
232
Changes in these functions are, however, not specific to zinc and these indexeshave not been proven useful for identifying marginal zinc deficiency inhumans thus far.
The introduction of stable isotope techniques in zinc research (15) hascreated possibilities for evaluating the relationship between diet and zincstatus and is likely to lead to a better understanding of the mechanisms under-lying the homeostatic regulation of zinc. Estimations of the turnover rates of administered isotopes in plasma or urine have revealed the existence of arelatively small but rapidly exchangeable body pool of zinc of about 1.5–3.0mmol (100–200mg) (16–19). The size of the pool seems to be corre-lated to habitual dietary intake and it is reduced in controlled depletion studies(18). The zinc pool was also found to be correlated to endogenous intestinalexcretion of zinc (19) and to total daily absorption of zinc. These data suggestthat the size of the pool depends on recently absorbed zinc and that a largerexchangeable pool results in larger endogenous excretion. Changes in endoge-nous intestinal excretion of zinc seem to be more important than changes inabsorptive efficiency for maintenance of zinc homeostasis (19).
12.3 Dietary sources and bioavailability of zincLean red meat, whole-grain cereals, pulses, and legumes provide the highestconcentrations of zinc: concentrations in such foods are generally in the rangeof 25–50mg/kg (380–760mmol/kg) raw weight. Processed cereals with lowextraction rates, polished rice, and chicken, pork or meat with high fat contenthave a moderate zinc content, typically between 10 and 25mg/kg (150–380mmol/kg). Fish, roots and tubers, green leafy vegetables, and fruits are onlymodest sources of zinc, having concentrations <10mg/kg (<150mmol/kg)(20). Saturated fats and oils, sugar, and alcohol have very low zinc contents.
The utilization of zinc depends on the overall composition of the diet.Experimental studies have identified a number of dietary factors as potentialpromoters or antagonists of zinc absorption (21). Soluble organic substancesof low relative molecular mass, such as amino and hydroxy acids, facilitatezinc absorption. In contrast, organic compounds forming stable and poorlysoluble complexes with zinc can impair absorption. In addition, competitiveinteractions between zinc and other ions with similar physicochemical prop-erties can affect the uptake and intestinal absorption of zinc. The risk of com-petitive interactions with zinc seems to be mainly related to the consumptionof high doses of these other ions, in the form of supplements or in aqueoussolutions. However, at levels present in food and at realistic fortificationlevels, zinc absorption appears not to be affected, for example, by iron orcopper (21).
P230-245 3/12/05 17:09 Page 232
Isotope studies with human subjects have identified two factors that,together with the total zinc content of the diet, are major determinants ofabsorption and utilization of dietary zinc. The first is the content of inositolhexaphosphate (phytate) in the diet and the second is the level and source ofdietary protein. Phytates are present in whole-grain cereals and legumes and in smaller amounts in other vegetables. They have a strong potential forbinding divalent cations and their depressive effect on zinc absorption hasbeen demonstrated in humans (21). The molar ratio between phytates and zincin meals or diets is a useful indicator of the effect of phytates in depressingzinc absorption. At molar ratios above the range of 6–10, zinc absorptionstarts to decline; at ratios above 15, absorption is typically less than 15% (20).The effect of phytate is, however, modified by the source and amount ofdietary proteins consumed. Animal proteins improve zinc absorption from aphytate-containing diet (22). Zinc absorption from some legume-based diets(e.g. white beans and lupin protein) is comparable with that from animal-protein-based diets despite a higher phytate content in the former (22, 23).High dietary calcium potentiated the antagonistic effects of phytates on zincabsorption in experimental studies. The results from human studies are lessconsistent and any effects seem to depend on the source of calcium and thecomposition of the diet (21, 23).
Several recently published absorption studies illustrate the effect of zinccontent and diet composition on fractional zinc absorption (19, 24–26). Theresults from the total diet studies, where all main meals of a day’s intake wereextrinsically labelled, show a remarkable consistency in fractional absorptiondespite relatively large variations in meal composition and zinc content (seeTable 12.1). Thus, approximately twice as much zinc is absorbed from a non-vegetarian or high-meat diet (25, 26) than from a diet based on rice and wheatflour (19). Data are lacking on zinc absorption from typical diets of develop-ing countries, which usually have high phytate contents.
The availability of zinc from the diet can be improved by reducing thephytate content and including sources of animal protein. Lower extractionrates of cereal grains will result in lower phytate content but at the same timethe zinc content is reduced, so that the net effect on zinc supply is limited.The phytate content can be reduced by activating the phytase present in mostphytate-containing foods or through the addition of microbial or fungal phy-tases. Phytases hydrolyse the phytate to lower inositol phosphates, resultingin improved zinc absorption (27, 28). The activity of phytases in tropicalcereals such as maize and sorghum is lower than that in wheat and rye (29).Germination of cereals and legumes increases phytase activity and addition ofsome germinated flour to ungerminated maize or sorghum followed by
12. ZINC
233
P230-245 3/12/05 17:09 Page 233
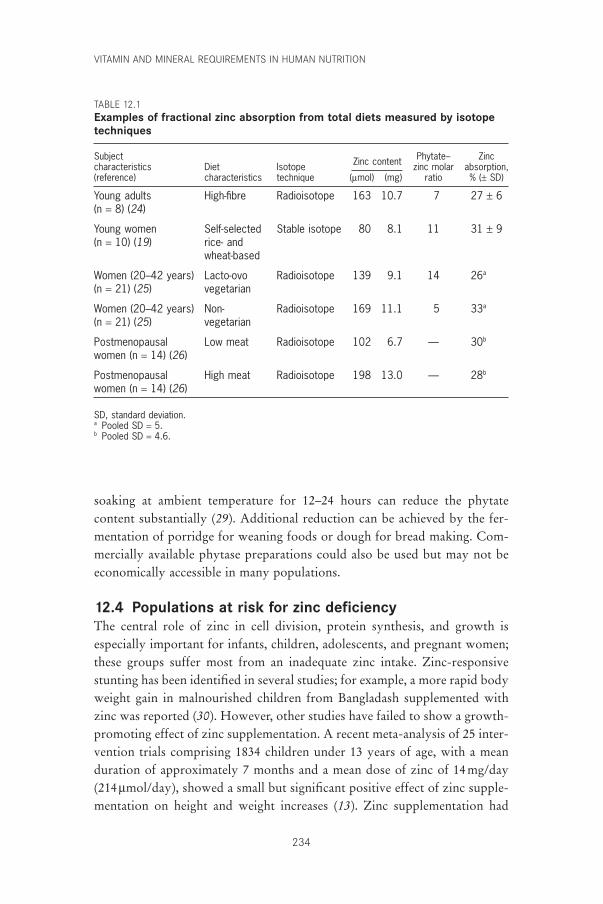
VITAMIN AND MINERAL REQUIREMENTS IN HUMAN NUTRITION
234
soaking at ambient temperature for 12–24 hours can reduce the phytatecontent substantially (29). Additional reduction can be achieved by the fer-mentation of porridge for weaning foods or dough for bread making. Com-mercially available phytase preparations could also be used but may not beeconomically accessible in many populations.
12.4 Populations at risk for zinc deficiencyThe central role of zinc in cell division, protein synthesis, and growth is especially important for infants, children, adolescents, and pregnant women;these groups suffer most from an inadequate zinc intake. Zinc-responsivestunting has been identified in several studies; for example, a more rapid bodyweight gain in malnourished children from Bangladash supplemented withzinc was reported (30). However, other studies have failed to show a growth-promoting effect of zinc supplementation. A recent meta-analysis of 25 inter-vention trials comprising 1834 children under 13 years of age, with a meanduration of approximately 7 months and a mean dose of zinc of 14mg/day(214mmol/day), showed a small but significant positive effect of zinc supple-mentation on height and weight increases (13). Zinc supplementation had
TABLE 12.1Examples of fractional zinc absorption from total diets measured by isotopetechniques
Subject Phytate– Zinccharacteristics Diet Isotope Zinc content zinc molar absorption,(reference) characteristics technique (mmol) (mg) ratio % (± SD)
Young adults High-fibre Radioisotope 163 10.7 7 27 ± 6(n = 8) (24)
Young women Self-selected Stable isotope 80 8.1 11 31 ± 9(n = 10) (19) rice- and
wheat-based
Women (20–42 years) Lacto-ovo Radioisotope 139 9.1 14 26a
(n = 21) (25) vegetarian
Women (20–42 years) Non- Radioisotope 169 11.1 5 33a
(n = 21) (25) vegetarian
Postmenopausal Low meat Radioisotope 102 6.7 — 30b
women (n = 14) (26)
Postmenopausal High meat Radioisotope 198 13.0 — 28b
women (n = 14) (26)
SD, standard deviation.a Pooled SD = 5.b Pooled SD = 4.6.
P230-245 3/12/05 17:09 Page 234
a positive effect when stunting was initially present; a more pronounced effecton weight gain was associated with initial low plasma zinc concentrations.
Results from zinc supplementation studies suggest that a low zinc statusin children not only affects growth but is also associated with an increasedrisk of severe infectious diseases (31). Episodes of acute diarrhoea were char-acterized by shorter duration and less severity in zinc-supplemented groups;reductions in incidence of diarrhoea were also reported. Other studies indi-cate that the incidence of acute lower respiratory tract infections and malariamay also be reduced by zinc supplementation. Prevention of suboptimal zincstatus and zinc deficiency in children by an increased intake and availabilityof zinc could consequently have a significant effect on child health in devel-oping countries.
The role of maternal zinc status on pregnancy outcome is still unclear. Pos-itive as well as negative associations between plasma zinc concentration andfetal growth or labour and delivery complications have been reported (32).Results of zinc supplementation studies also remain inconclusive (32). Inter-pretation of plasma zinc concentrations in pregnancy is complicated by theeffect of haemodilution, and the fact that low plasma zinc levels may reflectother metabolic disturbances (11). Zinc supplementation studies of pregnantwomen have been performed mainly in relatively well-nourished populations,which may be one of the reasons for the mixed results (32). A recent studyamong low-income American women with plasma zinc concentrations belowthe mean at enrolment in prenatal care showed that a zinc intake of 25mg/dayresulted in greater infant birth weights and head circumferences as well as areduced frequency of very low-birth-weight infants among non-obese womencompared with the placebo group (12).
12.5 Evidence used to estimate zinc requirementsThe lack of specific and sensitive indexes for zinc status limits the possibili-ties for evaluating zinc requirements from epidemiological observations. Pre-vious estimates, including those published in 1996 as a result of a collaborativeeffort by WHO, the Food and Agriculture Organization of the UnitedNations (FAO) and the International Atomic Energy Agency (IAEA) (33)have relied on the factorial technique, which involves totalling the require-ments for tissue growth, maintenance, metabolism, and endogenous losses.Experimental zinc repletion studies with low zinc intakes have clearly shownthat the body has a pronounced ability to adapt to different levels of zincintakes by changing the endogenous intestinal, urinary and integumental zinclosses (5–9, 34). The normative requirement for absorbed zinc was thusdefined as the obligatory loss during the early phase of zinc depletion before
12. ZINC
235
P230-245 3/12/05 17:09 Page 235
VITAMIN AND MINERAL REQUIREMENTS IN HUMAN NUTRITION
236
adaptive reductions in excretion take place and was set at 1.4mg/day for menand 1.0mg/day for women. To estimate the normative maintenance require-ments for other age groups, the respective basal metabolic rates were used forextrapolation. In growing individuals the rate of accretion and zinc contentof newly-formed tissues were used to derive estimates of requirements fortissue growth. Similarly, the retention of zinc during pregnancy (35) and thezinc concentration in milk at different stages of lactation (36) were used toestimate the physiological requirements in pregnancy and lactation.
The translation of these estimates of absorbed zinc into requirements fordietary zinc involves several considerations. First, the nature of the diet (i.e.its content of promoters and inhibitors of zinc absorption) determines thefraction of the dietary zinc that is potentially absorbable. Second, the effi-ciency of absorption of potentially available zinc is inversely related to thecontent of zinc in the diet. The review of available data from experimentalzinc absorption studies of single meals or total diets resulted in a division ofdiets into three categories—high, moderate, and low zinc bioavailability—asdetailed in Table 12.2 (33). To take account of the fact that the relationshipbetween efficiency of absorption and zinc content differs for these diets, algo-rithms were developed (33) and applied to the estimates of requirements forabsorbed zinc to achieve a set of figures for the average individual dietary zincrequirements (Table 12.3). The fractional absorption figures applied for thethree diet categories at intakes adequate to meet the normative requirementsfor absorbed zinc were 50%, 30%, and 15%, respectively. From these esti-mates and from the evaluation of data from dietary intake studies, mean pop-ulation intakes were identified which were deemed sufficient to ensure a lowprevalence of individuals at risk of inadequate zinc intake (33). Assumptionsmade in deriving zinc requirements for specific population groups are sum-marized below.
12.5.1 Infants, children, and adolescentsEndogenous losses of zinc in human-milk-fed infants were assumed to be 20mg/kg/day (0.31mmol/kg/day) whereas 40mg/kg/day (0.6mmol/kg/day)was assumed for infants fed formula or weaning foods (33). For other agegroups an average loss of 0.002mmol/basal kJ (0.57mg/basal kcal) was derivedfrom the estimates in adults. Estimated zinc increases for infant growth wereset at 120 and 140mg/kg/day (1.83–2.14mmol/kg/day) for female and maleinfants, respectively, for the first 3 months (33). These values decrease to 33mg/kg/day (0.50mmol/kg/day) for ages 6–12 months. For ages 1–10 years,the requirements for growth were based on the assumption that new tissuecontains 30mg/g (0.46mmol zinc/g) (33). For adolescent growth, a tissue-zinc
P230-245 3/12/05 17:09 Page 236
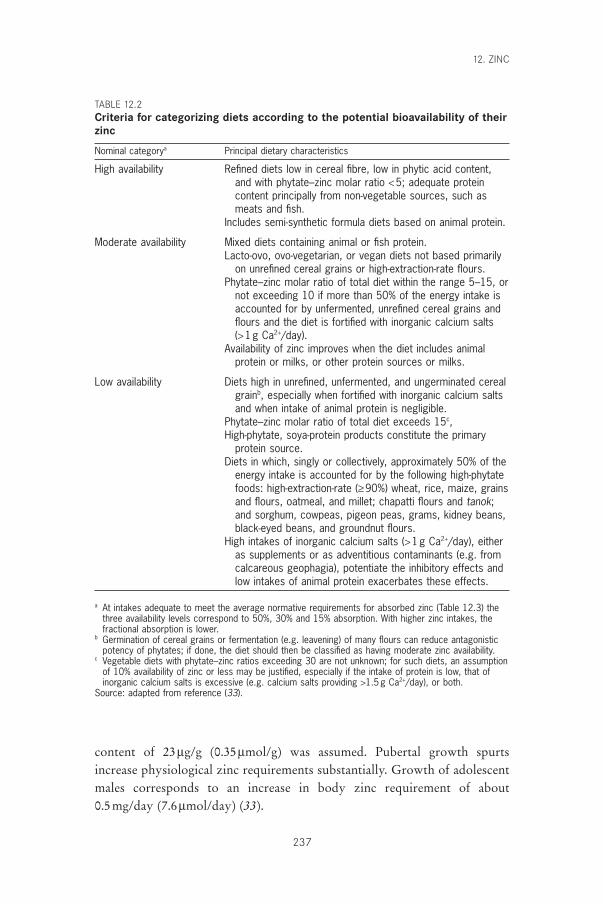
content of 23mg/g (0.35mmol/g) was assumed. Pubertal growth spurtsincrease physiological zinc requirements substantially. Growth of adolescentmales corresponds to an increase in body zinc requirement of about 0.5mg/day (7.6mmol/day) (33).
12. ZINC
237
TABLE 12.2Criteria for categorizing diets according to the potential bioavailability of theirzinc
Nominal categorya Principal dietary characteristics
High availability Refined diets low in cereal fibre, low in phytic acid content,and with phytate–zinc molar ratio <5; adequate proteincontent principally from non-vegetable sources, such asmeats and fish.
Includes semi-synthetic formula diets based on animal protein.
Moderate availability Mixed diets containing animal or fish protein.Lacto-ovo, ovo-vegetarian, or vegan diets not based primarily
on unrefined cereal grains or high-extraction-rate flours.Phytate–zinc molar ratio of total diet within the range 5–15, or
not exceeding 10 if more than 50% of the energy intake isaccounted for by unfermented, unrefined cereal grains andflours and the diet is fortified with inorganic calcium salts (>1g Ca2+/day).
Availability of zinc improves when the diet includes animalprotein or milks, or other protein sources or milks.
Low availability Diets high in unrefined, unfermented, and ungerminated cerealgrainb, especially when fortified with inorganic calcium saltsand when intake of animal protein is negligible.
Phytate–zinc molar ratio of total diet exceeds 15c,High-phytate, soya-protein products constitute the primary
protein source.Diets in which, singly or collectively, approximately 50% of the
energy intake is accounted for by the following high-phytatefoods: high-extraction-rate (≥90%) wheat, rice, maize, grainsand flours, oatmeal, and millet; chapatti flours and tanok;and sorghum, cowpeas, pigeon peas, grams, kidney beans,black-eyed beans, and groundnut flours.
High intakes of inorganic calcium salts (>1g Ca2+/day), eitheras supplements or as adventitious contaminants (e.g. fromcalcareous geophagia), potentiate the inhibitory effects andlow intakes of animal protein exacerbates these effects.
a At intakes adequate to meet the average normative requirements for absorbed zinc (Table 12.3) thethree availability levels correspond to 50%, 30% and 15% absorption. With higher zinc intakes, thefractional absorption is lower.
b Germination of cereal grains or fermentation (e.g. leavening) of many flours can reduce antagonisticpotency of phytates; if done, the diet should then be classified as having moderate zinc availability.
c Vegetable diets with phytate–zinc ratios exceeding 30 are not unknown; for such diets, an assumptionof 10% availability of zinc or less may be justified, especially if the intake of protein is low, that ofinorganic calcium salts is excessive (e.g. calcium salts providing >1.5g Ca2+/day), or both.
Source: adapted from reference (33).
P230-245 3/12/05 17:09 Page 237
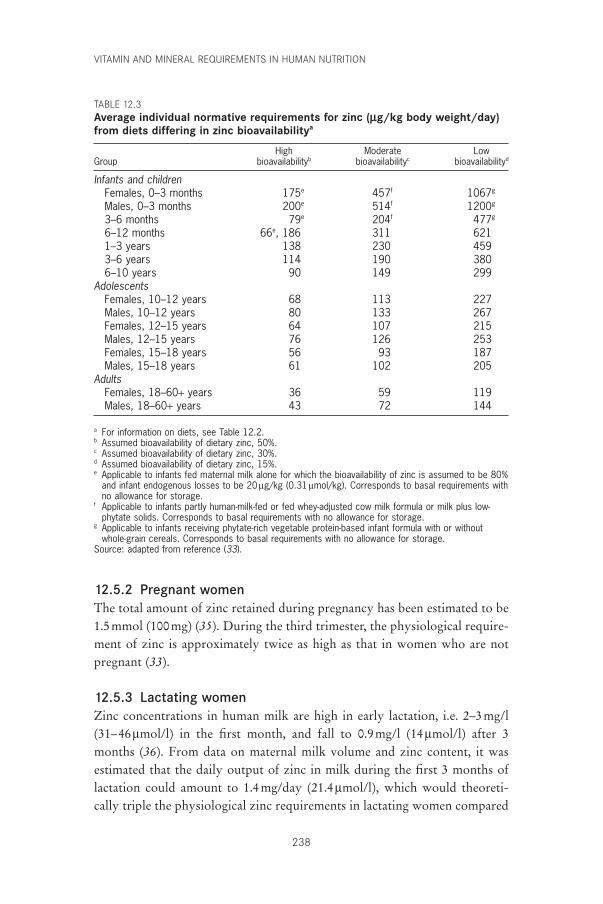
VITAMIN AND MINERAL REQUIREMENTS IN HUMAN NUTRITION
238
12.5.2 Pregnant womenThe total amount of zinc retained during pregnancy has been estimated to be1.5mmol (100mg) (35). During the third trimester, the physiological require-ment of zinc is approximately twice as high as that in women who are notpregnant (33).
12.5.3 Lactating womenZinc concentrations in human milk are high in early lactation, i.e. 2–3mg/l(31–46mmol/l) in the first month, and fall to 0.9mg/l (14mmol/l) after 3months (36). From data on maternal milk volume and zinc content, it wasestimated that the daily output of zinc in milk during the first 3 months oflactation could amount to 1.4mg/day (21.4mmol/l), which would theoreti-cally triple the physiological zinc requirements in lactating women compared
TABLE 12.3Average individual normative requirements for zinc (mg/kg body weight/day)from diets differing in zinc bioavailabilitya
High Moderate LowGroup bioavailabilityb bioavailabilityc bioavailabilityd
Infants and childrenFemales, 0–3 months 175e 457f 1067g
Males, 0–3 months 200e 514f 1200g
3–6 months 79e 204f 477g
6–12 months 66e, 186 311 6211–3 years 138 230 4593–6 years 114 190 3806–10 years 90 149 299
AdolescentsFemales, 10–12 years 68 113 227Males, 10–12 years 80 133 267Females, 12–15 years 64 107 215Males, 12–15 years 76 126 253Females, 15–18 years 56 93 187Males, 15–18 years 61 102 205
AdultsFemales, 18–60+ years 36 59 119Males, 18–60+ years 43 72 144
a For information on diets, see Table 12.2.b Assumed bioavailability of dietary zinc, 50%.c Assumed bioavailability of dietary zinc, 30%.d Assumed bioavailability of dietary zinc, 15%.e Applicable to infants fed maternal milk alone for which the bioavailability of zinc is assumed to be 80%
and infant endogenous losses to be 20 mg/kg (0.31 mmol/kg). Corresponds to basal requirements withno allowance for storage.
f Applicable to infants partly human-milk-fed or fed whey-adjusted cow milk formula or milk plus low-phytate solids. Corresponds to basal requirements with no allowance for storage.
g Applicable to infants receiving phytate-rich vegetable protein-based infant formula with or withoutwhole-grain cereals. Corresponds to basal requirements with no allowance for storage.
Source: adapted from reference (33).
P230-245 3/12/05 17:09 Page 238
with non-lactating, non-pregnant women. In setting the estimated require-ments for early lactation, it was assumed that part of this requirement iscovered by postnatal involution of the uterus and from skeletal resorption(33).
12.5.4 ElderlyA lower absorptive efficiency has been reported in the elderly, which couldjustify a dietary requirement higher than that for other adults. On the otherhand, endogenous losses seem to be lower in the elderly. Because of the sug-gested role of zinc in infectious diseases, an optimal zinc status in the elderlycould have a significant public health effect and is an area of zinc metabolismrequiring further research. Currently however, requirements for the elderlyare estimated to be the same as those for other adults.
12.6 Interindividual variations in zinc requirements andrecommended nutrient intakes
The studies (6–10) used to estimate the average physiological zinc require-ments with the factorial technique are based on a relatively small number of subjects and do not make any allowance for interindividual variations in obligatory losses at different intakes. Because zinc requirements are related totissue turnover rate and growth, it is reasonable to assume that variations inphysiological zinc requirements are of the same magnitude as variations inprotein requirements (37) and that the same figure (12.5%) for the interindi-vidual coefficient of variation (CV) could be adopted. However, unlikeprotein requirements, the derivation of dietary zinc requirements involvesestimating absorption efficiences. Consequently, variations in absorptive effi-ciency, not relevant in relation to estimates of protein requirements, may haveto be taken into account in the estimates of the total interindividual variationin zinc requirements. Systematic studies of the interindividual variations inzinc absorption under different conditions are few. In small groups of healthywell-nourished subjects, the reported variations in zinc absorption from adefined meal or diet are of the order of 20–40% and seem to be largely inde-pendent of age, sex, or diet characteristics (see Table 12.1). How much thesevariations, besides being attributable to methodological imprecision, reflectvariations in physiological requirement, effects of preceding zinc intake, etc.is not known. Based on the available data from zinc absorption studies (19,20, 23–28), it is tentatively suggested that the interindividual variation indietary zinc requirements, which includes variation in requirement forabsorbed zinc (i.e. variations in metabolism and turnover rate of zinc) andvariation in absorptive efficiency, corresponds to a CV of 25%. The recom-
12. ZINC
239
P230-245 3/12/05 17:09 Page 239
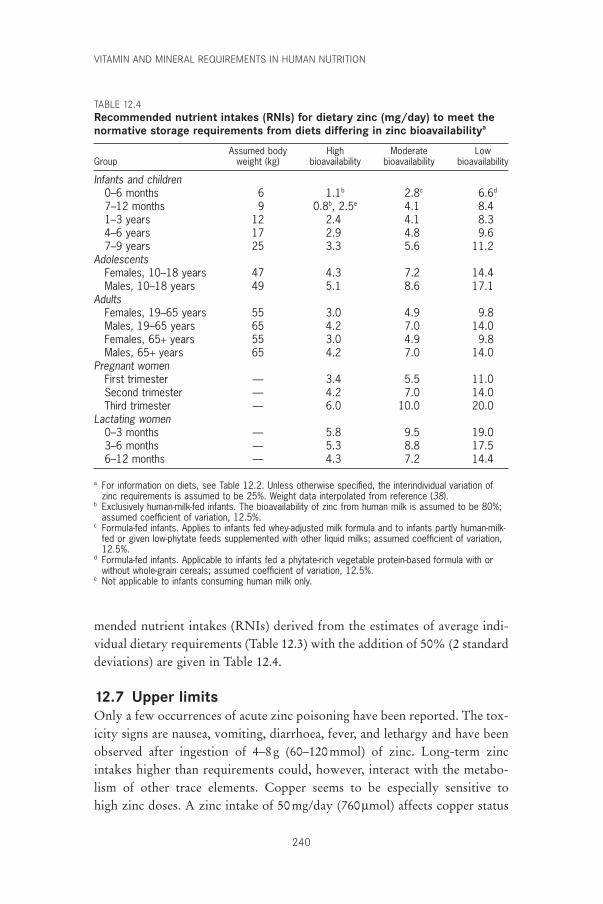
VITAMIN AND MINERAL REQUIREMENTS IN HUMAN NUTRITION
240
mended nutrient intakes (RNIs) derived from the estimates of average indi-vidual dietary requirements (Table 12.3) with the addition of 50% (2 standarddeviations) are given in Table 12.4.
12.7 Upper limitsOnly a few occurrences of acute zinc poisoning have been reported. The tox-icity signs are nausea, vomiting, diarrhoea, fever, and lethargy and have beenobserved after ingestion of 4–8g (60–120mmol) of zinc. Long-term zincintakes higher than requirements could, however, interact with the metabo-lism of other trace elements. Copper seems to be especially sensitive to high zinc doses. A zinc intake of 50mg/day (760mmol) affects copper status
TABLE 12.4Recommended nutrient intakes (RNIs) for dietary zinc (mg/day) to meet thenormative storage requirements from diets differing in zinc bioavailabilitya
Assumed body High Moderate LowGroup weight (kg) bioavailability bioavailability bioavailability
Infants and children0–6 months 6 1.1b 2.8c 6.6d
7–12 months 9 0.8b, 2.5e 4.1 8.41–3 years 12 2.4 4.1 8.34–6 years 17 2.9 4.8 9.67–9 years 25 3.3 5.6 11.2
AdolescentsFemales, 10–18 years 47 4.3 7.2 14.4Males, 10–18 years 49 5.1 8.6 17.1
AdultsFemales, 19–65 years 55 3.0 4.9 9.8Males, 19–65 years 65 4.2 7.0 14.0Females, 65+ years 55 3.0 4.9 9.8Males, 65+ years 65 4.2 7.0 14.0
Pregnant womenFirst trimester — 3.4 5.5 11.0Second trimester — 4.2 7.0 14.0Third trimester — 6.0 10.0 20.0
Lactating women0–3 months — 5.8 9.5 19.03–6 months — 5.3 8.8 17.56–12 months — 4.3 7.2 14.4
a For information on diets, see Table 12.2. Unless otherwise specified, the interindividual variation ofzinc requirements is assumed to be 25%. Weight data interpolated from reference (38).
b Exclusively human-milk-fed infants. The bioavailability of zinc from human milk is assumed to be 80%;assumed coefficient of variation, 12.5%.
c Formula-fed infants. Applies to infants fed whey-adjusted milk formula and to infants partly human-milk-fed or given low-phytate feeds supplemented with other liquid milks; assumed coefficient of variation,12.5%.
d Formula-fed infants. Applicable to infants fed a phytate-rich vegetable protein-based formula with orwithout whole-grain cereals; assumed coefficient of variation, 12.5%.
e Not applicable to infants consuming human milk only.
P230-245 3/12/05 17:09 Page 240
indexes, such as CuZn-superoxide dismutase in erythrocytes (39, 40). Lowcopper and ceruloplasmin levels and anaemia have been observed after zincintakes of 450–660mg/day (6.9–10mmol/day) (41, 42). Changes in serum lipidpattern and in immune response have also been observed in zinc supplemen-tation studies (43, 44). Because copper also has a central role in immunedefence, these observations should be studied further before large-scale zincsupplementation programmes are undertaken. Any positive effects of zincsupplementation on growth or infectious diseases could be offset by associ-ated negative effects on copper-related functions.
The upper level of zinc intake for an adult man is set at 45mg/day (690mmol/day) and extrapolated to other groups in relation to basal meta-bolic rate. For children this extrapolation means an upper limit of intake of23–28mg/day (350–430mmol/day), which is close to what has been used insome of the zinc supplementation studies. Except for excessive intakes ofsome types of seafood, such intakes are unlikely to be attained with most diets.Adventitious zinc in water from contaminated wells and from galvanizedcooking utensils could also lead to high zinc intakes.
12.8 Adequacy of zinc intakes in relation to requirementestimates
The risk of inadequate zinc intakes in children has been evaluated by com-paring the suggested estimates of zinc requirements (33) with available dataon food composition and dietary intake in different parts of the world (45).For this assessment, it was assumed that zinc requirements follow a Gaussiandistribution with a CV of 15% and that the correlation between intake andrequirement is very low. Zinc absorption from diets in Kenya, Malawi, andMexico was estimated to be 15%, based on the high phytate–zinc molar ratio(> 25) of these diets, whereas an absorption of 30% was assumed for diets inEgypt, Ghana, Guatemala, and Papua New Guinea. Diets of fermented maizeand cassava products (kenkey, banku, and gari) in Ghana, yeast leavenedwheat-based bread in Egypt, and the use of sago with a low phytate contentas the staple in Papua New Guinea were assumed to result in a lowerphytate–zinc molar ratio and a better zinc availability. However, on thesediets, 68–94% of children were estimated to be at risk for zinc deficiency inthese populations, with the exception of those in Egypt where the estimatewas 36% (45). The average daily zinc intakes of the children in the high-riskcountries were between 3.7 and 6.6mg (56–100mmol), and in Egypt, 5.2mg(80mmol) illustrating the impact of a low availability.
Most of the zinc supplementation studies have not provided dietary intakedata, which could be used to identify the zinc intake critical for beneficial
12. ZINC
241
P230-245 3/12/05 17:09 Page 241
VITAMIN AND MINERAL REQUIREMENTS IN HUMAN NUTRITION
242
growth effects. In a recent study in Chile, positive effects on height gain inboys after 14 months of zinc supplementation were noted (46). The intake inthe placebo group at the start of the study was 6.3 ± 1.3mg/day (96 ±20mmol/day) (n = 49). Because only 15% of the zinc intake of the Chileanchildren was derived from flesh foods, availability was assumed to be rela-tively low.
Krebs et al. (47) observed no effect of zinc supplementation on human-milk zinc content or on maternal zinc status of a group of lactating womenand judged their intake sufficient to maintain adequate zinc status through 7 months or more of lactation. The mean zinc intake of the non-supplementedwomen was 13.0 ± 3.4mg/day (199 ± 52mmol/day).
The efficiency of the homeostatic mechanisms for maintaining body zinccontent at low intakes, which formed the basis for the estimates of phy-siological requirements in the WHO/FAO/IAEA report (33), as well as thepresumed negative impact of a high-phytate diet on zinc status, has been confirmed in several experimental studies (10, 46, 48, 49). Reductions inurinary and intestinal losses maintained normal plasma zinc concentra-tions over a 5-week period in 11 men with zinc intakes of 2.45mg/day (37mmol/day) (10). In a similar repletion–depletion study with 15 men, anintake of 4mg/day (61mmol/day) from a diet with a molar phytate–zinc ratioof 58 for 7 weeks resulted in a reduction of urinary zinc excretion from 0.52± 0.18 to 0.28 ± 0.15mg/day (7.9 ± 2.8mmol/day to 4.3 ± 2.3mmol/day) (48).A significant reduction of plasma zinc concentrations and changes in cellularimmune response were observed. Effects on immunity were also observedwhen five young male volunteers consumed a zinc-restricted diet with a high-phytate content (molar ratio approximately 20) for 20–24 weeks (14). Subop-timal zinc status has also been documented in pregnant women consumingdiets with high phytate–zinc ratios (>17) (49). Frequent reproductive cyclingand high malaria prevalence also seemed to contribute to the impairment ofzinc status in this population group.
In conclusion, the approach used for derivation of average individualrequirements of zinc used in the 1996 WHO/FAO/IAEA report (33) and theresulting estimates still seem valid and useful for assessment of the adequacyof zinc intakes in population groups and for planning diets for defined pop-ulation groups.
12.9 Recommendations for future researchAs already indicated in the 1996 WHO/FAO/IAEA report (33), there is stillan urgent need to characterize the early functional effects of zinc deficiencyand to define their relation to pathologic changes. This knowledge is vital to
P230-245 3/12/05 17:09 Page 242
the understanding of the role of zinc deficiency in the etiology of stuntingand impaired immunocompetence.
For a better understanding of the relationship between diet and zincsupply, there is a need for further research which evaluates the availability ofzinc from diets typical of developing countries. The research should includean assessment of the feasibility of adopting realistic and culturally-acceptedfood preparation practices, such as fermentation, germination, and soaking,and of including available and inexpensive animal protein sources in plant-food-based diets.
References1. Hambridge KM, Casey CE, Krebs NF. Zinc. In: Mertz W, ed. Trace elements
in human and animal nutrition, 5th ed. Volume 2. Orlando, FL, AcademicPress, 1987:1–137.
2. Shankar AH, Prasad AS. Zinc and immune function: the biological basis ofaltered resistance to infection. American Journal of Clinical Nutrition, 1998,68(Suppl.):S447–S463.
3. Sandström B. Bioavailability of zinc. European Journal of Clinical Nutrition,1997, 51(Suppl. 1):S17–S19.
4. King JC, Turnlund JR. Human zinc requirements. In: Mills CF, ed. Zinc inhuman biology. New York, NY, Springer-Verlag, 1989:335–350.
5. Lukaski HC et al. Changes in plasma zinc content after exercise in men fed alow-zinc diet. American Journal of Physiology, 1984, 247:E88–E93.
6. Milne DB et al. Ethanol metabolism in postmenopausal women fed a diet mar-ginal in zinc. American Journal of Clinical Nutrition, 1987, 46:688–693.
7. Baer MJ, King JC. Tissue zinc levels and zinc excretion during experimentalzinc depletion in young men. American Journal of Clinical Nutrition, 1984,39:556–570.
8. Hess FM, King JC, Margen S. Zinc excretion in young women on low zincintakes and oral contraceptive agents. Journal of Nutrition, 1977,107:1610–1620.
9. Milne DB et al. Effect of dietary zinc on whole body surface loss of zinc:impact on estimation of zinc retention by balance method. American Journalof Clinical Nutrition, 1983, 38:181–186.
10. Johnson PE et al. Homeostatic control of zinc metabolism in men: zinc excre-tion and balance in men fed diets low in zinc. American Journal of ClinicalNutrition, 1993, 57:557–565.
11. Agett PJ, Favier A. Zinc. International Journal for Vitamin and NutritionResearch, 1993, 63:247–316.
12. Goldenberg RL et al. The effect of zinc supplementation on pregnancyoutcome. Journal of the American Medical Association, 1995, 274:463–468.
13. Brown KH, Peerson JM, Allen LH. Effect of zinc supplementation on chil-dren’s growth: a meta-analysis of intervention trials. Bibliotheca Nutritio etDieta, 1998, 54:76–83.
14. Beck FWJ et al. Changes in cytokine production and T cell subpopulations in experimentally induced zinc-deficient humans. American Journal of Physiology, 1997, 272:E1002–E1007.
15. Sandström B et al. Methods for studying mineral and trace element absorp-
12. ZINC
243
P230-245 3/12/05 17:09 Page 243
VITAMIN AND MINERAL REQUIREMENTS IN HUMAN NUTRITION
244
tion in humans using stable isotopes. Nutrition Research Reviews, 1993,6:71–95.
16. Wastney ME et al. Kinetic analysis of zinc metabolism in humans after simul-taneous administration of 65Zn and 70Zn. American Journal of Physiology, 1991,260:R134–R141.
17. Fairweather-Tait SJ et al. The measurement of exchangeable pools of zinc usingthe stable isotope 70Zn. British Journal of Nutrition, 1993, 70:221–234.
18. Miller LV et al. Size of the zinc pools that exchange rapidly with plasma zincin humans: alternative techniques for measuring and relation to dietary zincintake. Journal of Nutrition, 1994, 124:268–276.
19. Sian L et al. Zinc absorption and intestinal losses of endogenous zinc in youngChinese women with marginal zinc intakes. American Journal of ClinicalNutrition, 1996, 63:348–353.
20. Sandström B. Dietary pattern and zinc supply. In: Mills CF, ed. Zinc in humanbiology. New York, NY, Springer-Verlag, 1989:350–363.
21. Sandström B, Lönnerdal B. Promoters and antagonists of zinc absorption. In:Mills CF, ed. Zinc in human biology. New York, NY, Springer-Verlag,1989:57–78.
22. Sandström B et al. Effect of protein level and protein source on zinc absorp-tion in humans. Journal of Nutrition, 1998, 119:48–53.
23. Petterson D, Sandström B, Cederblad Å. Absorption of zinc from lupin(Lupinus angustifolius)-based foods. British Journal of Nutrition, 1994,72:865–871.
24. Knudsen E et al. Zinc absorption estimated by fecal monitoring of zinc stableisotopes validated by comparison with whole-body retention of zinc radioiso-topes in humans. Journal of Nutrition, 1995, 125:1274–1282.
25. Hunt JR, Matthys LA, Johnson LK. Zinc absorption, mineral balance, andblood lipids in women consuming controlled lactoovovegetarian and omniv-orous diets for 8 weeks. American Journal of Clinical Nutrition, 1998,67:421–430.
26. Hunt JR et al. High- versus low-meat diets: effects on zinc absorption, ironstatus, and calcium, copper, iron, magnesium, manganese, nitrogen, phospho-rus, and zinc balance in postmenopausal women. American Journal of Clini-cal Nutrition, 1995, 62:621–632.
27. Nävert B, Sandström B, Cederblad Å. Reduction of the phytate content ofbran by leavening in bread and its effect on absorption of zinc in man. BritishJournal of Nutrition, 1985, 53:47–53.
28. Sandström B, Sandberg AS. Inhibitory effects of isolated inositol phosphateson zinc absorption in humans. Journal of Trace Elements and Electrolytes inHealth and Disease, 1992, 6:99–103.
29. Gibson RS et al. Dietary interventions to prevent zinc deficiency. AmericanJournal of Clinical Nutrition, 1998, 68(Suppl.):S484–S487.
30. Simmer K et al. Nutritional rehabilitation in Bangladesh—the importance ofzinc. American Journal of Clinical Nutrition, 1988, 47:1036–1040.
31. Black MM. Zinc deficiency and child development. American Journal of Clin-ical Nutrition, 1998, 68(Suppl.):S464–S469.
32. Caulfield LE et al. Potential contribution of maternal zinc supplementationduring pregnancy to maternal and child survival. American Journal of Clini-cal Nutrition, 1998, 68(Suppl.):S499–S508.
33. Trace elements in human nutrition and health. Geneva, World Health Organization, 1996.
P230-245 3/12/05 17:09 Page 244
34. Taylor CM et al. Homeostatic regulation of zinc absorption and endogenouslosses in zinc-deprived men. American Journal of Clinical Nutrition, 1991,53:755–763.
35. Swanson CA, King JC. Zinc and pregnancy outcome. American Journal ofClinical Nutrition, 1987, 46:763–771.
36. Complementary feeding of young children in developing countries: a review ofcurrent scientific knowledge. Geneva, World Health Organization, 1998(WHO/NUT/98.1).
37. Energy and protein requirements. Report of a Joint FAO/WHO/UNU ExpertConsultation. Geneva, World Health Organization, 1985 (WHO TechnicalReport Series, No. 724).
38. Requirements of vitamin A, iron, folate, and vitamin B12. Report of a JointFAO/WHO Expert Consultation. Rome, Food and Agriculture Organizationof the United Nations, 1988 (FAO Food and Nutrition Series, No. 23).
39. Fischer PWF, Giroux A, L’Abbé MR. Effect of zinc supplementation oncopper status in adult man. American Journal of Clinical Nutrition, 1984,40:743–746.
40. Yadrick MK, Kenney MA, Winterfeldt EA. Iron, copper, and zinc status:response to supplementation with zinc or zinc and iron in adult females.American Journal of Clinical Nutrition, 1989, 49:145–150.
41. Patterson WP, Winkelmann M, Perry MC. Zinc-induced copper deficiency:megamineral sideroblastic anemia. Annals of Internal Medicine, 1985,103:385–386.
42. Porter KG et al. Anaemia and low serum-copper during zinc therapy. Lancet,1977, 2:774.
43. Hooper PL et al. Zinc lowers high-density lipoprotein-cholesterol levels.Journal of the American Medical Association, 1980, 244:1960–1962.
44. Chandra RK. Excessive intake of zinc impairs immune responses. Journal ofthe American Medical Association, 1984, 252:1443–1446.
45. Gibson RS, Ferguson EL. Assessment of dietary zinc in a population. Amer-ican Journal of Clinical Nutrition, 1998, 68(Suppl.):S430–S434.
46. Ruz M et al. A 14-month zinc-supplementation trial in apparently healthyChilean preschool children. American Journal of Clinical Nutrition, 1997,66:1406–1413.
47. Krebs NF et al. Zinc supplementation during lactation: effects on maternalstatus and milk zinc concentrations. American Journal of Clinical Nutrition,1995, 61:1030–1036.
48. Ruz M et al. Erythrocytes, erythrocyte membranes, neutrophils and plateletsas biopsy materials for the assessment of zinc status in humans. British Journalof Nutrition, 1992, 68:515–527.
49. Gibson RS, Huddle J-M. Suboptimal zinc status in pregnant Malawianwomen: its association with low intakes of poorly available zinc, frequentreproductive cycling, and malaria. American Journal of Clinical Nutrition,1998, 67:702–709.
12. ZINC
245
P230-245 3/12/05 17:09 Page 245
246
13. Iron
13.1 Role of iron in human metabolic processesIron has several vital functions in the body. It serves as a carrier of oxygen tothe tissues from the lungs by red blood cell haemoglobin, as a transportmedium for electrons within cells, and as an integrated part of importantenzyme systems in various tissues. The physiology of iron has been exten-sively reviewed (1–6).
Most of the iron in the body is present in the erythrocytes as haemoglo-bin, a molecule composed of four units, each containing one haem group andone protein chain. The structure of haemoglobin allows it to be fully loadedwith oxygen in the lungs and partially unloaded in the tissues (e.g. in themuscles). The iron-containing oxygen storage protein in the muscles, myo-globin, is similar in structure to haemoglobin but has only one haem unit andone globin chain. Several iron-containing enzymes, the cytochromes, alsohave one haem group and one globin protein chain. These enzymes act as electron carriers within the cell and their structures do not permit reversibleloading and unloading of oxygen. Their role in the oxidative metabolism is totransfer energy within the cell and specifically in the mitochondria. Other keyfunctions for the iron-containing enzymes (e.g. cytochrome P450) include thesynthesis of steroid hormones and bile acids; detoxification of foreign sub-stances in the liver; and signal controlling in some neurotransmitters, such asthe dopamine and serotonin systems in the brain. Iron is reversibly storedwithin the liver as ferritin and haemosiderin whereas it is transported betweendifferent compartments in the body by the protein transferrin.
13.2 Iron metabolism and absorption13.2.1 Basal iron lossesIron is not actively excreted from the body in urine or in the intestines. Ironis only lost with cells from the skin and the interior surfaces of the body—intestines, urinary tract, and airways. The total amount lost is estimated at 14mg/kg body weight/day (7). In children, it is probably more correct to relatethese losses to body surface. A non-menstruating 55-kg woman loses about
P246-278 3/12/05 17:09 Page 246
0.8mg Fe/day and a 70-kg man loses about 1mg/day. The range of individ-ual variation has been estimated to be ±15% (8).
Earlier studies suggested that sweat iron losses could be considerable, espe-cially in a hot, humid climate. However, new studies which took extensiveprecautions to avoid the interference of contamination of iron from the skinduring the collection of total body sweat have shown that sweat iron lossesare negligible (9).
13.2.2 Requirements for growthThe newborn term infant has an iron content of about 250–300mg (75mg/kgbody weight). During the first 2 months of life, haemoglobin concentrationfalls because of the improved oxygen situation in the newborn infant com-pared with the intrauterine fetus. This leads to a considerable redistributionof iron from catabolized erythrocytes to iron stores. This iron will cover theneeds of the term infant during the first 4–6 months of life and is why ironrequirements during this period can be provided by human milk, which con-tains very little iron. Because of the marked supply of iron to the fetus duringthe last trimester of pregnancy, the iron situation is much less favourable inthe premature and low-birth-weight infant than in the healthy term infant.An extra supply of iron is therefore needed in these infants during the first 6months of life.
In the term infant, iron requirements rise markedly after age 4–6 monthsand amount to about 0.7–0.9mg/day during the remaining part of the firstyear. These requirements are very high, especially in relation to body size andenergy intake (Table 13.1) (10).
In the first year of life, the term infant almost doubles its total iron storesand triples its body weight. The increase in body iron during this periodoccurs mainly during the latter 6 months. Between 1 and 6 years of age, thebody iron content is again doubled. The requirements for absorbed iron ininfants and children are very high in relation to their energy requirements.For example, in infants 6–12 months of age, about 1.5mg of iron need to beabsorbed per 4.184 MJ and about half of this amount is required up to age 4years.
In the weaning period, the iron requirements in relation to energy intakeare at the highest level of the lifespan except for the last trimester of preg-nancy, when iron requirements to a large extent have to be covered from theiron stores of the mother (see section 13.4 on iron and pregnancy). Infantshave no iron stores and have to rely on dietary iron alone. It is possible tomeet these high requirements if the diet has a consistently high content ofmeat and foods rich in ascorbic acid. In most developed countries today, infant
13. IRON
247
P246-278 3/12/05 17:09 Page 247
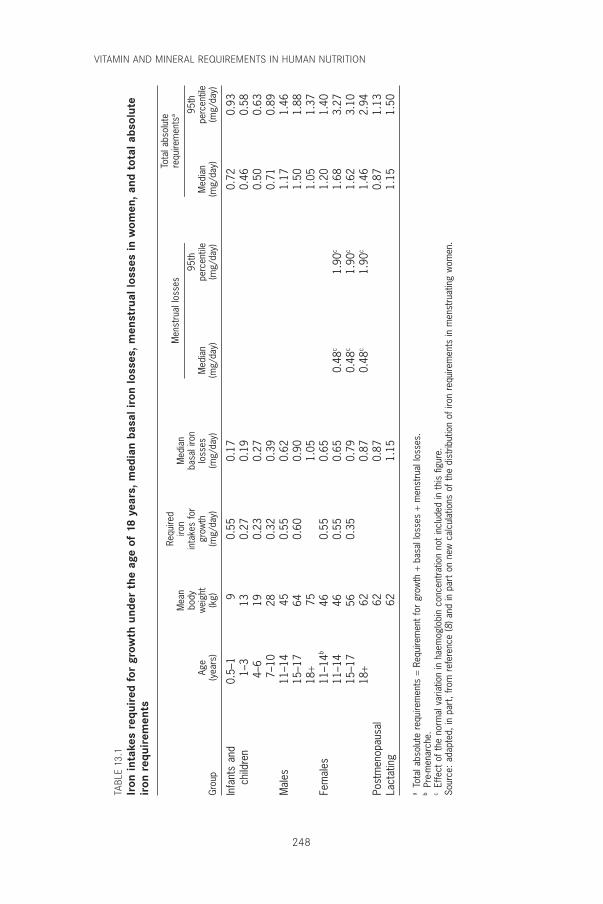
VITAMIN AND MINERAL REQUIREMENTS IN HUMAN NUTRITION
248
TABL
E 13
.1Ir
on in
take
s re
quir
ed f
or g
row
th u
nder
the
age
of
18 y
ears
, med
ian
basa
l iro
n lo
sses
, men
stru
al lo
sses
in w
omen
, and
tot
al a
bsol
ute
iron
req
uire
men
ts
Requ
ired
Tota
l abs
olut
e
Mea
niro
nM
edia
nM
enst
rual
loss
esre
quire
men
tsa
body
inta
kes
for
basa
l iro
n95
th95
thAg
ew
eigh
tgr
owth
loss
esM
edia
npe
rcen
tile
Med
ian
perc
entil
eG
roup
(yea
rs)
(kg)
(mg/
day)
(mg/
day)
(mg/
day)
(mg/
day)
(mg/
day)
(mg/
day)
Infa
nts
and
0.5–
19
0.55
0.17
0.72
0.93
child
ren
1–3
130.
270.
190.
460.
584–
619
0.23
0.27
0.50
0.63
7–10
280.
320.
390.
710.
89M
ales
11–1
445
0.55
0.62
1.17
1.46
15–1
764
0.60
0.90
1.50
1.88
18+
751.
051.
051.
37Fe
mal
es11
–14b
460.
550.
651.
201.
4011
–14
460.
550.
650.
48c
1.90
c1.
683.
2715
–17
560.
350.
790.
48c
1.90
c1.
623.
1018
+62
0.87
0.48
c1.
90c
1.46
2.94
Post
men
opau
sal
620.
870.
871.
13La
ctat
ing
621.
151.
151.
50
aTo
tal a
bsol
ute
requ
irem
ents
=Re
quire
men
t fo
r gr
owth
+ba
sal l
osse
s +
men
stru
al lo
sses
.b
Pre-
men
arch
e.c
Effe
ct o
f the
nor
mal
var
iatio
n in
hae
mog
lobi
n co
ncen
trat
ion
not
incl
uded
in t
his
figur
e.So
urce
: ada
pted
, in
part
, fro
m r
efer
ence
(8) a
nd in
par
t on
new
cal
cula
tions
of t
he d
istr
ibut
ion
of ir
on r
equi
rem
ents
in m
enst
ruat
ing
wom
en.
P246-278 3/12/05 17:09 Page 248
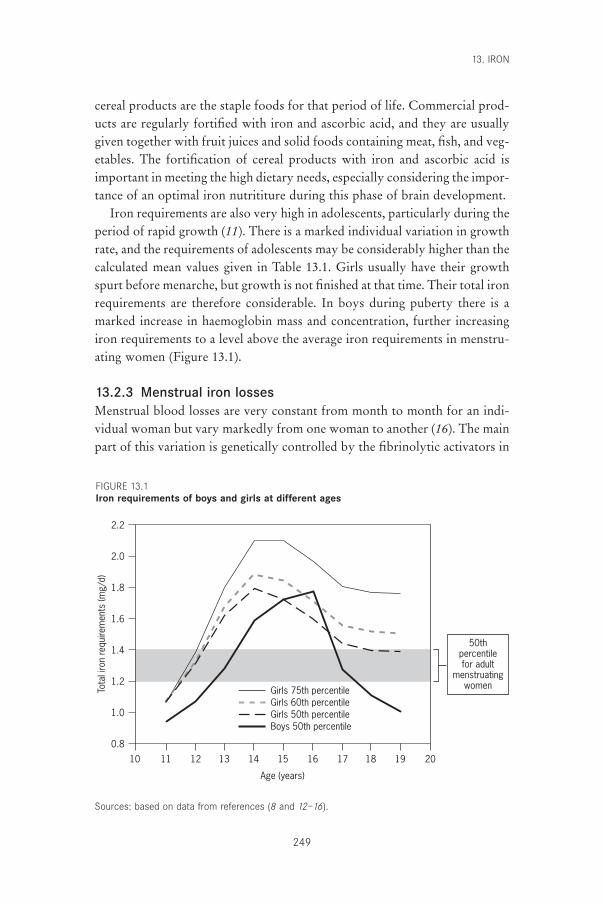
cereal products are the staple foods for that period of life. Commercial prod-ucts are regularly fortified with iron and ascorbic acid, and they are usuallygiven together with fruit juices and solid foods containing meat, fish, and veg-etables. The fortification of cereal products with iron and ascorbic acid isimportant in meeting the high dietary needs, especially considering the impor-tance of an optimal iron nutrititure during this phase of brain development.
Iron requirements are also very high in adolescents, particularly during theperiod of rapid growth (11). There is a marked individual variation in growthrate, and the requirements of adolescents may be considerably higher than thecalculated mean values given in Table 13.1. Girls usually have their growthspurt before menarche, but growth is not finished at that time. Their total ironrequirements are therefore considerable. In boys during puberty there is amarked increase in haemoglobin mass and concentration, further increasingiron requirements to a level above the average iron requirements in menstru-ating women (Figure 13.1).
13.2.3 Menstrual iron lossesMenstrual blood losses are very constant from month to month for an indi-vidual woman but vary markedly from one woman to another (16). The mainpart of this variation is genetically controlled by the fibrinolytic activators in
13. IRON
249
2.2
2.0
1.8
1.6
1.4
1.2
1.0
0.8
Tota
l iro
n re
quire
men
ts (m
g/d)
Age (years)
1513121110 14 16 17 18 19 20
Girls 75th percentileGirls 60th percentileGirls 50th percentileBoys 50th percentile
50thpercentilefor adult
menstruatingwomen
FIGURE 13.1Iron requirements of boys and girls at different ages
Sources: based on data from references (8 and 12–16).
P246-278 3/12/05 17:09 Page 249
VITAMIN AND MINERAL REQUIREMENTS IN HUMAN NUTRITION
250
the uterine mucosa—even in populations which are geographically widelyseparated (Burma, Canada, China, Egypt, England, and Sweden) (17, 18).These findings strongly suggest that the main source of variation in iron statusin different populations is not related to a variation in iron requirements butto a variation in the absorption of iron from the diets. (This statement disre-gards infestations with hookworms and other parasites.) The mean menstrualiron loss, averaged over the entire menstrual cycle of 28 days, is about 0.56mg/day. The frequency distribution of physiological menstrual bloodlosses is highly skewed. Adding the average basal iron loss (0.8mg/day) andits variation allows the distribution of the total iron requirements in adultwomen to be calculated as the convolution of the distributions of menstrualand basal iron losses (Figure 13.2). The mean daily total iron requirement is1.36mg. In 10% of women, it exceeds 2.27mg and in 5% it exceeds 2.84mg(19). In 10% of menstruating (still-growing) teenagers, the correspondingdaily total iron requirement exceeds 2.65mg, and in 5% of girls, it exceeds 3.2mg. The marked skewness of menstrual losses is a great nutritionalproblem because assessment of an individual’s iron losses is unreliable. Thismeans that women with physiological but heavy losses cannot be identifiedand reached by iron supplementation. The choice of contraceptive methodalso greatly influences menstrual losses.
In postmenopausal women and in physically active elderly people, the ironrequirements per unit of body weight are the same as in men. When physicalactivity decreases as a result of ageing, blood volume decreases and haemo-globin mass diminishes, leading to a shift of iron usage from haemoglobin andmuscle to iron stores. This implies a reduction of the daily iron requirements.Iron deficiency in the elderly is therefore seldom of nutritional origin but is usually caused by pathologic iron losses.
The absorbed iron requirements in different groups are summarized inTable 13.1. The iron requirements during pregnancy and lactation are dealtwith separately (see section 13.4).
13.2.4 Iron absorptionWith respect to the mechanism of absorption, there are two kinds of dietaryiron: haem iron and non-haem iron (20). In the human diet, the primarysources of haem iron are the haemoglobin and myoglobin from consumptionof meat, poultry, and fish whereas non-haem iron is obtained from cereals,pulses, legumes, fruits, and vegetables. The average absorption of haem ironfrom meat-containing meals is about 25% (21). The absorption of haem ironcan vary from about 40% during iron deficiency to about 10% during iron repletion (22). Haem iron can be degraded and converted to non-haem
P246-278 3/12/05 17:09 Page 250
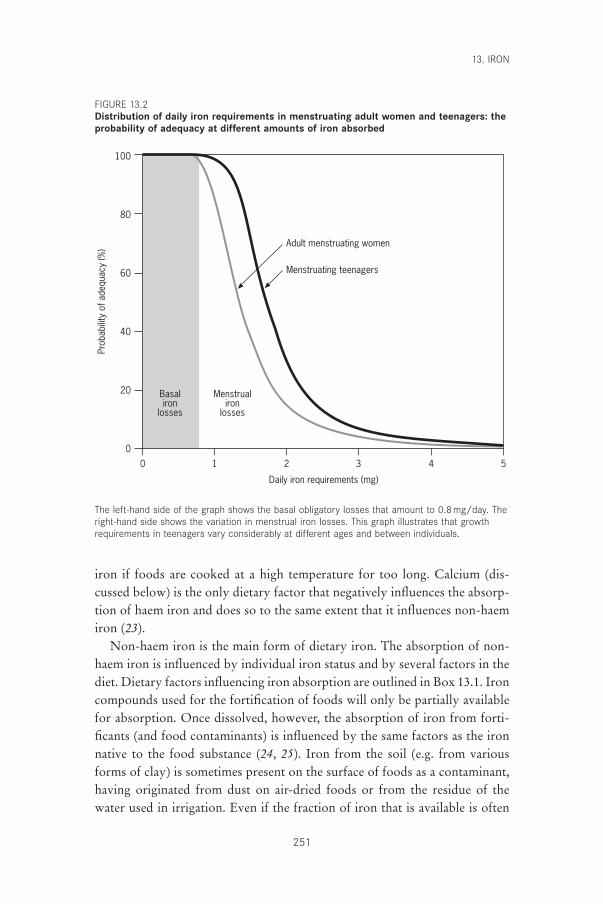
13. IRON
251
100
80
60
40
20
0
Prob
abilit
y of
ade
quac
y (%
)
Daily iron requirements (mg)
0 1 2 3 4 5
Adult menstruating women
Menstruating teenagers
Basaliron
losses
Menstrualiron
losses
The left-hand side of the graph shows the basal obligatory losses that amount to 0.8mg/day. Theright-hand side shows the variation in menstrual iron losses. This graph illustrates that growthrequirements in teenagers vary considerably at different ages and between individuals.
iron if foods are cooked at a high temperature for too long. Calcium (dis-cussed below) is the only dietary factor that negatively influences the absorp-tion of haem iron and does so to the same extent that it influences non-haemiron (23).
Non-haem iron is the main form of dietary iron. The absorption of non-haem iron is influenced by individual iron status and by several factors in thediet. Dietary factors influencing iron absorption are outlined in Box 13.1. Ironcompounds used for the fortification of foods will only be partially availablefor absorption. Once dissolved, however, the absorption of iron from forti-ficants (and food contaminants) is influenced by the same factors as the ironnative to the food substance (24, 25). Iron from the soil (e.g. from variousforms of clay) is sometimes present on the surface of foods as a contaminant,having originated from dust on air-dried foods or from the residue of thewater used in irrigation. Even if the fraction of iron that is available is often
FIGURE 13.2Distribution of daily iron requirements in menstruating adult women and teenagers: theprobability of adequacy at different amounts of iron absorbed
P246-278 3/12/05 17:09 Page 251
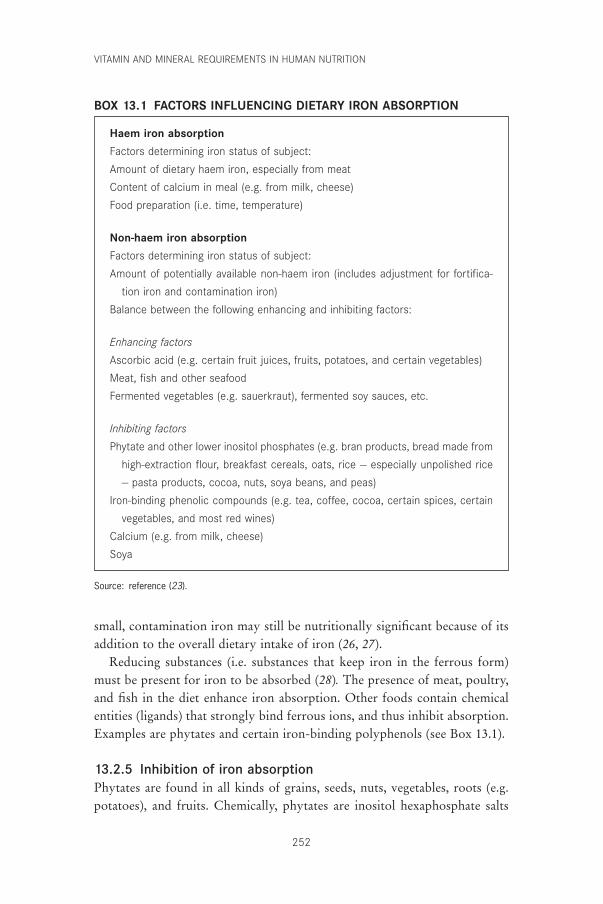
VITAMIN AND MINERAL REQUIREMENTS IN HUMAN NUTRITION
252
small, contamination iron may still be nutritionally significant because of itsaddition to the overall dietary intake of iron (26, 27).
Reducing substances (i.e. substances that keep iron in the ferrous form)must be present for iron to be absorbed (28). The presence of meat, poultry,and fish in the diet enhance iron absorption. Other foods contain chemicalentities (ligands) that strongly bind ferrous ions, and thus inhibit absorption.Examples are phytates and certain iron-binding polyphenols (see Box 13.1).
13.2.5 Inhibition of iron absorptionPhytates are found in all kinds of grains, seeds, nuts, vegetables, roots (e.g.potatoes), and fruits. Chemically, phytates are inositol hexaphosphate salts
Haem iron absorption
Factors determining iron status of subject:
Amount of dietary haem iron, especially from meat
Content of calcium in meal (e.g. from milk, cheese)
Food preparation (i.e. time, temperature)
Non-haem iron absorption
Factors determining iron status of subject:
Amount of potentially available non-haem iron (includes adjustment for fortifica-
tion iron and contamination iron)
Balance between the following enhancing and inhibiting factors:
Enhancing factors
Ascorbic acid (e.g. certain fruit juices, fruits, potatoes, and certain vegetables)
Meat, fish and other seafood
Fermented vegetables (e.g. sauerkraut), fermented soy sauces, etc.
Inhibiting factors
Phytate and other lower inositol phosphates (e.g. bran products, bread made from
high-extraction flour, breakfast cereals, oats, rice — especially unpolished rice
— pasta products, cocoa, nuts, soya beans, and peas)
Iron-binding phenolic compounds (e.g. tea, coffee, cocoa, certain spices, certain
vegetables, and most red wines)
Calcium (e.g. from milk, cheese)
Soya
BOX 13.1 FACTORS INFLUENCING DIETARY IRON ABSORPTION
Source: reference (23).
P246-278 3/12/05 17:09 Page 252
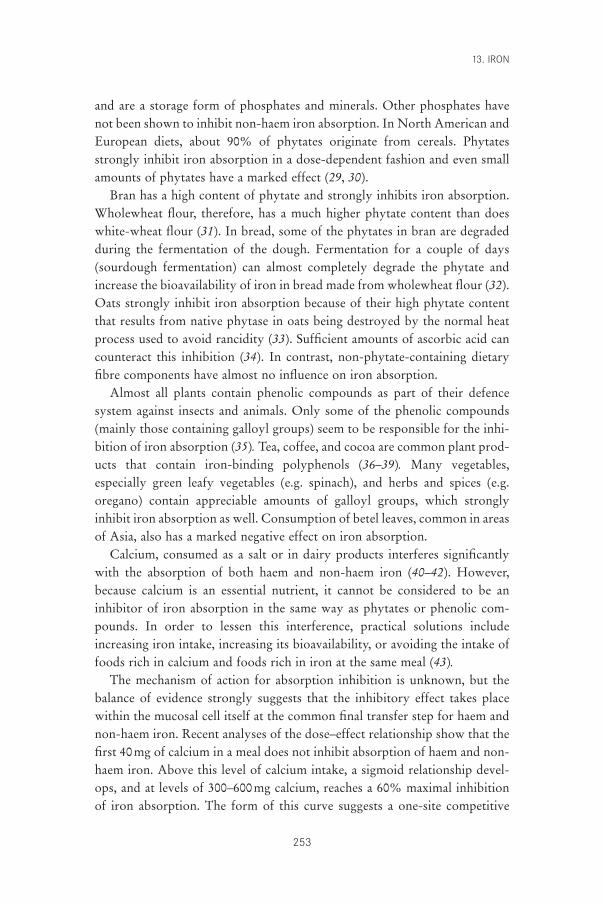
and are a storage form of phosphates and minerals. Other phosphates havenot been shown to inhibit non-haem iron absorption. In North American andEuropean diets, about 90% of phytates originate from cereals. Phytatesstrongly inhibit iron absorption in a dose-dependent fashion and even smallamounts of phytates have a marked effect (29, 30).
Bran has a high content of phytate and strongly inhibits iron absorption.Wholewheat flour, therefore, has a much higher phytate content than doeswhite-wheat flour (31). In bread, some of the phytates in bran are degradedduring the fermentation of the dough. Fermentation for a couple of days(sourdough fermentation) can almost completely degrade the phytate andincrease the bioavailability of iron in bread made from wholewheat flour (32).Oats strongly inhibit iron absorption because of their high phytate contentthat results from native phytase in oats being destroyed by the normal heatprocess used to avoid rancidity (33). Sufficient amounts of ascorbic acid cancounteract this inhibition (34). In contrast, non-phytate-containing dietaryfibre components have almost no influence on iron absorption.
Almost all plants contain phenolic compounds as part of their defencesystem against insects and animals. Only some of the phenolic compounds(mainly those containing galloyl groups) seem to be responsible for the inhi-bition of iron absorption (35). Tea, coffee, and cocoa are common plant prod-ucts that contain iron-binding polyphenols (36–39). Many vegetables,especially green leafy vegetables (e.g. spinach), and herbs and spices (e.g.oregano) contain appreciable amounts of galloyl groups, which stronglyinhibit iron absorption as well. Consumption of betel leaves, common in areasof Asia, also has a marked negative effect on iron absorption.
Calcium, consumed as a salt or in dairy products interferes significantlywith the absorption of both haem and non-haem iron (40–42). However,because calcium is an essential nutrient, it cannot be considered to be aninhibitor of iron absorption in the same way as phytates or phenolic com-pounds. In order to lessen this interference, practical solutions includeincreasing iron intake, increasing its bioavailability, or avoiding the intake offoods rich in calcium and foods rich in iron at the same meal (43).
The mechanism of action for absorption inhibition is unknown, but thebalance of evidence strongly suggests that the inhibitory effect takes placewithin the mucosal cell itself at the common final transfer step for haem andnon-haem iron. Recent analyses of the dose–effect relationship show that thefirst 40mg of calcium in a meal does not inhibit absorption of haem and non-haem iron. Above this level of calcium intake, a sigmoid relationship devel-ops, and at levels of 300–600mg calcium, reaches a 60% maximal inhibitionof iron absorption. The form of this curve suggests a one-site competitive
13. IRON
253
P246-278 3/12/05 17:09 Page 253
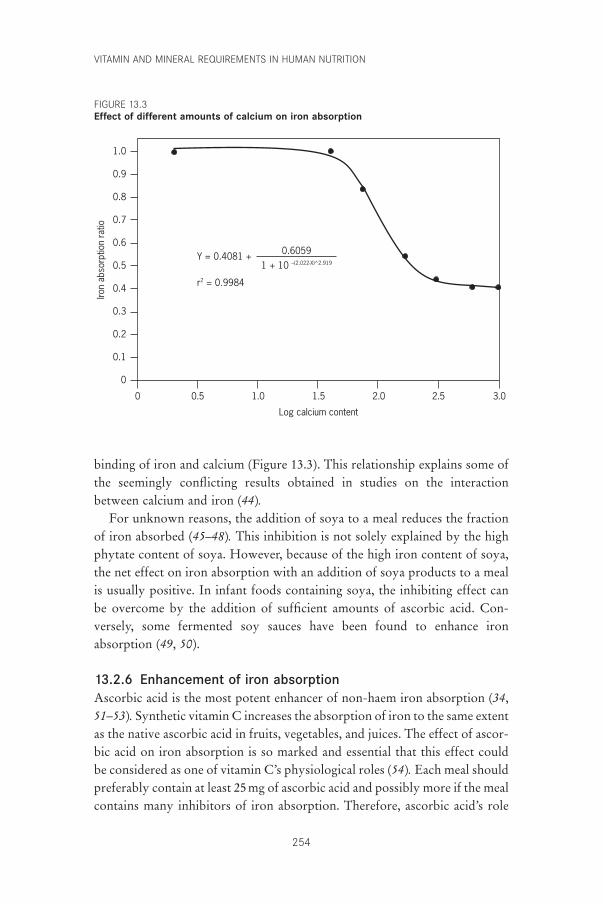
VITAMIN AND MINERAL REQUIREMENTS IN HUMAN NUTRITION
254
binding of iron and calcium (Figure 13.3). This relationship explains some ofthe seemingly conflicting results obtained in studies on the interactionbetween calcium and iron (44).
For unknown reasons, the addition of soya to a meal reduces the fractionof iron absorbed (45–48). This inhibition is not solely explained by the highphytate content of soya. However, because of the high iron content of soya,the net effect on iron absorption with an addition of soya products to a mealis usually positive. In infant foods containing soya, the inhibiting effect canbe overcome by the addition of sufficient amounts of ascorbic acid. Con-versely, some fermented soy sauces have been found to enhance iron absorption (49, 50).
13.2.6 Enhancement of iron absorptionAscorbic acid is the most potent enhancer of non-haem iron absorption (34,51–53). Synthetic vitamin C increases the absorption of iron to the same extentas the native ascorbic acid in fruits, vegetables, and juices. The effect of ascor-bic acid on iron absorption is so marked and essential that this effect couldbe considered as one of vitamin C’s physiological roles (54). Each meal shouldpreferably contain at least 25mg of ascorbic acid and possibly more if the mealcontains many inhibitors of iron absorption. Therefore, ascorbic acid’s role
Log calcium content
0
1.0
0.9
0.8
0.7
0.6
0.5
0.4
0.3
0.2
0.1
0
Iron
abso
rptio
n ra
tio
0.5 1.0 1.5 2.0 2.5 3.0
Y = 0.4081 + 0.60591 + 10 –(2.022-X)^2.919
r2 = 0.9984
FIGURE 13.3Effect of different amounts of calcium on iron absorption
P246-278 3/12/05 17:09 Page 254
in iron absorption should be taken into account when establishing therequirements for vitamin C, which currently are set only to prevent vitaminC deficiency (especially scurvy). (See Chapter 7.)
Meat, fish, and seafood all promote the absorption of non-haem iron(55–58). The mechanism for this effect has not been determined. It should bepointed out that meat also enhances the absorption of haem iron to about thesame extent (21). Meat thus promotes iron nutrition in two ways: it stimu-lates the absorption of both haem and non-haem iron and it provides the well-absorbed haem iron. Epidemiologically, the intake of meat has been found tobe associated with a lower prevalence of iron deficiency.
Organic acids, such as citric acid, have been found to enhance the absorp-tion of non-haem iron in some studies (29). This effect is not observed as con-sistently as is that of ascorbic acid (47, 52). Sauerkraut (59) and other fermentedvegetables and even some fermented soy sauces (49, 50) enhance iron absorp-tion. However, the nature of this enhancement has not yet been determined.
13.2.7 Iron absorption from mealsThe pool concept in iron absorption implies that there are two main pools inthe gastrointestinal lumen—one pool of haem iron and another pool of non-haem iron—and that iron absorption takes place independently from eachpool (24). The pool concept also implies that the absorption of iron from thenon-haem iron pool is a function of all the ligands present in the mixture offoods included in a meal. The absorption of non-haem iron from a certainmeal not only depends on its iron content but also, and to a marked degree,on the composition of the meal (i.e. the balance among all factors enhancingand inhibiting the absorption of iron). The bioavailability can vary more than10-fold in meals with similar contents of iron, energy, protein, and fat (20).The simple addition of certain spices (e.g. oregano) to a meal or the intake ofa cup of tea with a meal may reduce the bioavailability by one half or more.Conversely, the addition of certain vegetables or fruits containing ascorbicacid may double or even triple iron absorption, depending on the other prop-erties of the meal and the amounts of ascorbic acid present.
13.2.8 Iron absorption from the whole dietThere is limited information about the total amount of iron absorbed fromthe diet because no simple method for measuring iron absorption from thewhole diet has been available. Traditionally, it has been measured by chemi-cal balance methods using long balance periods or by determining the haemo-globin regeneration rate in subjects with induced iron deficiency anaemia anda well-controlled diet over a long period of time.
13. IRON
255
P246-278 3/12/05 17:09 Page 255
VITAMIN AND MINERAL REQUIREMENTS IN HUMAN NUTRITION
256
More recently, however, new techniques, based on radioiron tracers, havebeen developed to measure iron absorption from the whole diet. In the firststudies of this type to be conducted, all non-haem iron in all meals over periodsof 5–10 days was homogeneously labelled to the same specific activity with anextrinsic inorganic radioiron tracer (43, 60). Haem iron absorption was thenestimated. In a further study, haem and non-haem iron were separately labelledwith two radioiron tracers as biosynthetically labelled haemoglobin and as aninorganic iron salt (22). These studies showed that new information could beobtained, for example, about the average bioavailability of dietary iron in dif-ferent types of diets, the overall effects of certain factors (e.g. calcium) on ironnutrition, and the regulation of iron absorption in relation to iron status. Ironabsorption from the whole diet has been extrapolated from the sum of theabsorption of iron from the single meals included in the diet. However, it hasbeen suggested that the iron absorption of single meals may exaggerate theabsorption of iron from the whole diet (61, 62), as there is a large variation ofabsorption between meals. Despite this, studies where all meals in a diet arelabelled to the same specific activity (the same amount of radioactivity in eachmeal per unit iron) show that the sum of iron absorption from a great numberof single meals agrees with the total absorption from the diet. One studyshowed that iron absorption from a single meal was the same when the mealwas served in the morning after an overnight fast or at lunch or supper (63).The same observation was made in another study when a hamburger meal wasserved in the morning or 2–4 hours after a breakfast (42).
Because the sum of energy expenditure and intake set the limit for theamount of food eaten and for meal size, it is practical to relate the bioavail-ability of iron in different meals to energy content (i.e. the bioavailable nutri-ent density). The use of the concept of bioavailable nutrient density is afeasible way to compare bioavailability of iron in different meals, constructmenus, and calculate recommended intakes of iron (64).
Intake of energy and essential nutrients such as iron was probably consid-erably higher for early humans than it is today (65–67). The fact that low ironintake is associated with a low-energy lifestyle implies that the interactionbetween different factors influencing iron absorption, will be more critical.For example, the interaction between calcium and iron absorption probablyhad no importance in the nutrition of early humans, who had a diet withample amounts of both iron and calcium.
13.2.9 Iron balance and regulation of iron absorptionThe body has three unique mechanisms for maintaining iron balance. The firstis the continuous reutilization of iron from catabolized erythrocytes in the
P246-278 3/12/05 17:09 Page 256
body. When an erythrocyte dies after about 120 days, it is usually degradedby the macrophages of the reticular endothelium. The iron is released anddelivered to transferrin in the plasma, which brings the iron back to red bloodcell precursors in the bone marrow or to other cells in different tissues.Uptake and distribution of iron in the body is regulated by the synthesis oftransferrin receptors on the cell surface. This system for internal iron trans-port not only controls the rate of flow of iron to different tissues accordingto their needs, but also effectively prevents the appearance of free iron andthe formation of free radicals in the circulation.
The second mechanism involves access to the specific storage protein, fer-ritin. This protein stores iron in periods of relatively low need and releases itto meet excessive iron demands. This iron reservoir is especially important inthe third trimester of pregnancy.
The third mechanism involves the regulation of absorption of iron fromthe intestines; decreasing body iron stores trigger increased iron absorptionand increasing iron stores trigger decreased iron absorption. Iron absorptiondecreases until equilibrium is established between absorption and require-ment. For a given diet this regulation of iron absorption, however, can onlybalance losses up to a certain critical point beyond which iron deficiency willdevelop (68). About half of the basal iron losses are from blood and occurprimarily in the gastrointestinal tract. Both these losses and the menstrual ironlosses are influenced by the haemoglobin level; during the development of aniron deficiency, menstrual and basal iron losses will successively decreasewhen the haemoglobin level decreases. In a state of more severe iron defi-ciency, skin iron losses may also decrease. Iron balance (absorption equalslosses) may be present not only in normal subjects but also during iron defi-ciency and iron overload.
The three main factors that affect iron balance are absorption (intake andbioavailability of iron), losses, and stored amount. The interrelationshipamong these factors has recently been described in mathematical terms,making it possible to predict, for example, the amount of stored iron wheniron losses and bioavailability of dietary iron are known (69). In states ofincreased iron requirement or decreased bioavailability, the regulatory capac-ity to prevent iron deficiency is limited (68). However, the regulatory capac-ity seems to be extremely good in preventing iron overload in a state ofincreased dietary iron intake or bioavailability (69).
13. IRON
257
P246-278 3/12/05 17:09 Page 257
VITAMIN AND MINERAL REQUIREMENTS IN HUMAN NUTRITION
258
13.3 Iron deficiency13.3.1 Populations at risk for iron deficiencyPopulations most at risk for iron deficiency are infants, children, adolescents,and women of childbearing age, especially pregnant women. The weaningperiod in infants is especially critical because of the very high iron require-ment needed in relation to energy requirement (see section 13.2.2). Thanks tobetter information about iron deficiency and the addition of fortified cerealsto the diets of infants and children, the iron situation has markedly improvedin these groups in most developed countries, such that the groups currentlyconsidered to be most at risk are menstruating and pregnant women, and ado-lescents of both sexes. In developing countries, however, the iron situation isstill very critical in many groups—especially in infants in the weaning period.During this period, iron nutrition is of great importance for the adequatedevelopment of the brain and other tissues such as muscles, which are differ-entiated early in life.
Iron deficiency and iron deficiency anaemia are often incorrectly used assynonyms. A definition of these terms may clarify some of the confusionabout different prevalence figures given in the literature (70). Iron deficiencyis defined as a haemoglobin concentration below the optimum value in anindividual, whereas iron deficiency anaemia implies that the haemoglobinconcentration is below the 95th percentile of the distribution of haemoglobinconcentration in a population (disregarding effects of altitude, age and sex, etc.on haemoglobin concentration). The confusion arises due to the very widedistribution of the haemoglobin concentration in healthy, fully iron-repletesubjects (in women, 120–160g/l; in men, 140–180g/l) (71). During the devel-opment of a negative iron balance in subjects with no mobilizable iron fromiron stores (i.e. no visible iron in technically perfect bone marrow smears ora serum ferritin concentration <15mg/l), there will be an immediate impair-ment in the production of haemoglobin with a resulting decrease in haemo-globin and different erythrocyte indexes (e.g. mean corpuscular haemoglobinand mean corpuscular volume). In turn, this will lead to an overlap in the dis-tributions of haemoglobin in iron-deficient and iron-replete women (Figure13.4). The extent of overlap depends on the prevalence and severity of irondeficiency. In populations with more severe iron deficiency, for example, theoverlap is much less marked.
In women, anaemia is defined as a haemoglobin level <120g/l. For awoman who has her normal homeostatic value set at 150g/l, her haemoglo-bin level must decrease by 26% to 119g/l before she is considered to beanaemic, whereas for a woman who has her normal haemoglobin set at 121g/l, her haemoglobin level must only decrease by 1.5% to 119g/l. Iron
P246-278 3/12/05 17:09 Page 258
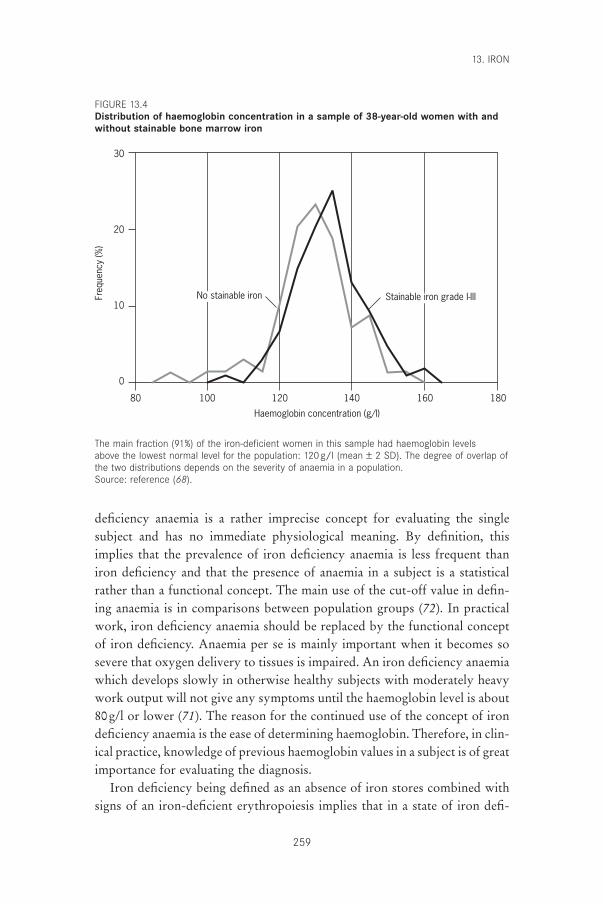
deficiency anaemia is a rather imprecise concept for evaluating the singlesubject and has no immediate physiological meaning. By definition, thisimplies that the prevalence of iron deficiency anaemia is less frequent thaniron deficiency and that the presence of anaemia in a subject is a statisticalrather than a functional concept. The main use of the cut-off value in defin-ing anaemia is in comparisons between population groups (72). In practicalwork, iron deficiency anaemia should be replaced by the functional conceptof iron deficiency. Anaemia per se is mainly important when it becomes sosevere that oxygen delivery to tissues is impaired. An iron deficiency anaemiawhich develops slowly in otherwise healthy subjects with moderately heavywork output will not give any symptoms until the haemoglobin level is about80g/l or lower (71). The reason for the continued use of the concept of irondeficiency anaemia is the ease of determining haemoglobin. Therefore, in clin-ical practice, knowledge of previous haemoglobin values in a subject is of greatimportance for evaluating the diagnosis.
Iron deficiency being defined as an absence of iron stores combined withsigns of an iron-deficient erythropoiesis implies that in a state of iron defi-
13. IRON
259
Haemoglobin concentration (g/l)
80
30
20
10
0
Freq
uenc
y (%
)
100 120 140 160 180
No stainable iron Stainable iron grade I-III
The main fraction (91%) of the iron-deficient women in this sample had haemoglobin levels above the lowest normal level for the population: 120g/l (mean ± 2 SD). The degree of overlap ofthe two distributions depends on the severity of anaemia in a population.Source: reference (68).
FIGURE 13.4Distribution of haemoglobin concentration in a sample of 38-year-old women with andwithout stainable bone marrow iron
P246-278 3/12/05 17:09 Page 259
VITAMIN AND MINERAL REQUIREMENTS IN HUMAN NUTRITION
260
ciency there is an insufficient supply of iron to various tissues. This occurs ata serum ferritin level <15mg/l. At this point, insufficient amounts of iron willbe delivered to transferrin, the circulating transport protein for iron, and thebinding sites for iron on transferrin will therefore contain less and less iron.This is usually described as a reduction in transferrin saturation. When trans-ferrin saturation drops to a certain critical level, erythrocyte precursors, whichcontinuously need iron for the formation of haemoglobin, will get an insuf-ficient supply of iron. At the same time, the supply of iron by transferrin toother tissues will also be impaired. Liver cells will get less iron, more trans-ferrin will be synthesized, and the concentration of transferrin in plasma willthen suddenly increase. Cells with a high turnover rate are the first ones tobe affected (e.g. intestinal mucosal cells with a short lifespan). The iron–trans-ferrin complex binds to transferrin receptors on certain cell surfaces and isthen taken up by invagination of the whole complex on the cell wall. Theuptake of iron seems to be related both to transferrin saturation and thenumber of transferrin receptors on the cell surface (73, 74). There is a markeddiurnal variation in the saturation of transferrin because the turnover rate ofiron in plasma is very high. This fact makes it difficult to evaluate the ironstatus from single determinations of transferrin saturation.
13.3.2 Indicators of iron deficiencyThe absence of iron stores (iron deficiency) can be diagnosed by showing thatthere is no stainable iron in the reticuloendothelial cells in bone marrowsmears or, more easily, by a low concentration of ferritin in serum (<15mg/l).Even if an absence of iron stores per se may not necessarily be associated withany immediate adverse effects, it is a reliable and good indirect indicator ofiron-deficient erythropoiesis and of an increased risk of a compromisedsupply of iron to different tissues.
Even before iron stores are completely exhausted, the supply of iron to theerythrocyte precursors in the bone marrow is compromised, leading to iron-deficient erythropoiesis (70). A possible explanation is that the rate of releaseof iron from stores is influenced by the amount of iron remaining. As men-tioned above, it can then be assumed that the supply of iron to other tissuesneeding iron is also insufficient because the identical transport system is used.During the development of iron deficiency haemoglobin concentration, trans-ferrin concentration, transferrin saturation, transferrin receptors in plasma,erythrocyte protoporphyrin, and erythrocyte indexes are changed. All theseindicators, however, show a marked overlap between normal and iron-deficient subjects, which makes it impossible to identify the single subjectwith mild iron deficiency by looking at any single one of these indicators.
P246-278 3/12/05 17:09 Page 260
Therefore, these tests are generally used in combination (e.g. for interpretingresults from the second National Health and Nutrition Examination Surveyin the United States [75, 76]). By increasing the number of tests used, the diag-nostic specificity then increases but the sensitivity decreases, and thus the trueprevalence of iron deficiency is markedly underestimated if multiple diag-nostic criteria are used. Fortunately, a low serum ferritin (<15mg/l) is alwaysassociated with an iron-deficient erythropoiesis. The use of serum ferritinalone as a measure will also underestimate the true prevalence of iron defi-ciency but to a lesser degree than when the combined criteria are used.
A diagnosis of iron deficiency anaemia can be suspected if anaemia ispresent in subjects who are iron-deficient as described above. Preferably, tofully establish the diagnosis, the subjects should respond adequately to irontreatment. The pitfalls with this method are the random variation in haemo-globin concentrations over time and the effect of the regression towards themean when a new measurement is made.
The use of serum ferritin has improved the diagnostic accuracy of iron defi-ciency. It is the only simple method available to detect early iron deficiency.Its practical value is somewhat reduced, however, by the fact that serum fer-ritin is a very sensitive acute-phase reactant and may be increased for weeksafter a simple infection with fever for a day or two (77). Several other condi-tions, such as use of alcohol (78, 79), liver disease, and collagen diseases, mayalso increase serum ferritin concentrations. Determination of transferrinreceptors in plasma has also been recommended in the diagnosis of iron defi-ciency. The advantage of this procedure is that it is not influenced by infec-tions. Its main use is in subjects who are already anaemic and it is not sensitiveenough for the early diagnosis of iron deficiency. The use of a combinationof determinations of serum ferritin and serum transferrin receptors has alsobeen suggested (80).
13.3.3 Causes of iron deficiencyNutritional iron deficiency implies that the diet cannot supply enough ironto cover the body’s physiological requirements for this mineral. Worldwidethis is the most common cause of iron deficiency. In many tropical countries,infestations with hookworms lead to intestinal blood losses that in some indi-viduals can be considerable. The average blood loss can be reliably estimatedby egg counts in stools. Usually the diet in these populations is also limitedwith respect to iron content and availability. The severity of the infestationsvaries markedly between subjects and regions.
In clinical practice, a diagnosis of iron deficiency must always lead to asearch for pathologic causes of blood loss (e.g. tumours in the gastrointesti-
13. IRON
261
P246-278 3/12/05 17:09 Page 261
VITAMIN AND MINERAL REQUIREMENTS IN HUMAN NUTRITION
262
nal tract or uterus, especially if uterine bleedings have increased or changedin regularity). Patients with achlorhydria absorb dietary iron less well (areduction of about 50%) than healthy individuals, and patients who haveundergone gastric surgery, especially if the surgery was extensive, may even-tually develop iron deficiency because of impaired iron absorption. Glutenenteropathy is another possibility to consider, especially in young patients.
13.3.4 Prevalence of iron deficiencyIron deficiency is probably the most common nutritional deficiency disorderin the world. A recent estimate based on WHO criteria indicated that around600–700 million people worldwide have marked iron deficiency anaemia (81),and the bulk of these people live in developing countries. In developed coun-tries, the prevalence of iron deficiency anaemia is much lower and usuallyvaries between 2% and 8%. However, the prevalence of iron deficiency,including both anaemic and non-anaemic subjects (see definitions above), ismuch higher. In developed countries, for example, an absence of iron storesor subnormal serum ferritin values is found in about 20–30% of women offertile age. In adolescent girls, the prevalence is even higher.
It is difficult to determine the prevalence of iron deficiency more exactlybecause representative populations for clinical investigation are hard to obtain.Laboratory methods and techniques for blood sampling need careful stan-dardization. One often neglected source of error (e.g. when samples from different regions, or samples taken at different times, are compared) comesfrom the use of reagent kits for determining serum ferritin that are not adequately calibrated to international WHO standards. In addition, seasonalvariations in infection rates influence the sensitivity and specificity of mostmethods used.
Worldwide, the highest prevalence figures for iron deficiency are found ininfants, children, adolescents, and women of childbearing age. Both betterinformation about iron deficiency prevention and increased consumption offortified cereals by infants and children have markedly improved the iron sit-uation in these groups in most developed countries, such that, the highestprevalence of iron deficiency today is observed in menstruating and pregnantwomen, and adolescents of both sexes.
In developing countries, where the prevalence of iron deficiency is veryhigh and the severity of anaemia is marked, studies on the distribution ofhaemoglobin in different population groups can provide important informa-tion that can then be used as a basis for action programmes (72). A moredetailed analysis of subsamples may then give excellent information for theplanning of more extensive programmes.
P246-278 3/12/05 17:09 Page 262
13.3.5 Effects of iron deficiencyStudies in animals have clearly shown that iron deficiency has several nega-tive effects on important functions in the body (3). The physical workingcapacity of rats is significantly reduced in states of iron deficiency, especiallyduring endurance activities (82, 83). This negative effect seems to be lessrelated to the degree of anaemia than to impaired oxidative metabolism in themuscles with an increased formation of lactic acid. Thus, the effect witnessedseems to be due to a lack of iron-containing enzymes which are rate limitingfor oxidative metabolism (84). Further to this, several groups have observeda reduction in physical working capacity in human populations with long-standing iron deficiency, and demonstrated an improvement in workingcapacity in these populations after iron administration (84).
The relationship between iron deficiency and brain function and develop-ment is very important to consider when choosing a strategy to combat iron deficiency (85–88). Several structures in the brain have a high iron con-tent; levels are of the same order of magnitude as those observed in the liver.The observation that the lower iron content of the brain in iron-deficientgrowing rats cannot be increased by giving iron at a later date strongly sug-gests that the supply of iron to brain cells takes place during an early phaseof brain development and that, as such, early iron deficiency may lead toirreparable damage to brain cells. In humans about 10% of brain-iron ispresent at birth; at the age of 10 years the brain has only reached half itsnormal iron content, and optimal amounts are first reached between the agesof 20 and 30 years.
Iron deficiency also negatively influences the normal defence systemsagainst infections. In animal studies, the cell-mediated immunologic responseby the action of T-lymphocytes is impaired as a result of a reduced formationof these cells. This in turn is due to a reduced DNA synthesis dependent onthe function of ribonucleotide reductase, which requires a continuous supplyof iron for its function. In addition, the phagocytosis and killing of bacteriaby the neutrophil leukocytes is an important component of the defence mech-anism against infections. These functions are impaired in iron deficiency aswell. The killing function is based on the formation of free hydroxyl radicalswithin the leukocytes, the respiratory burst, and results from the activationof the iron-sulfur enzyme NADPH oxidase and probably also cytochrome b(a haem enzyme) (89).
The impairment of the immunologic defence against infections that wasfound in animals is also regularly found in humans. Administration of ironnormalizes these changes within 4–7 days. It has been difficult to demonstrate,however, that the prevalence of infections is higher or that their severity is
13. IRON
263
P246-278 3/12/05 17:09 Page 263
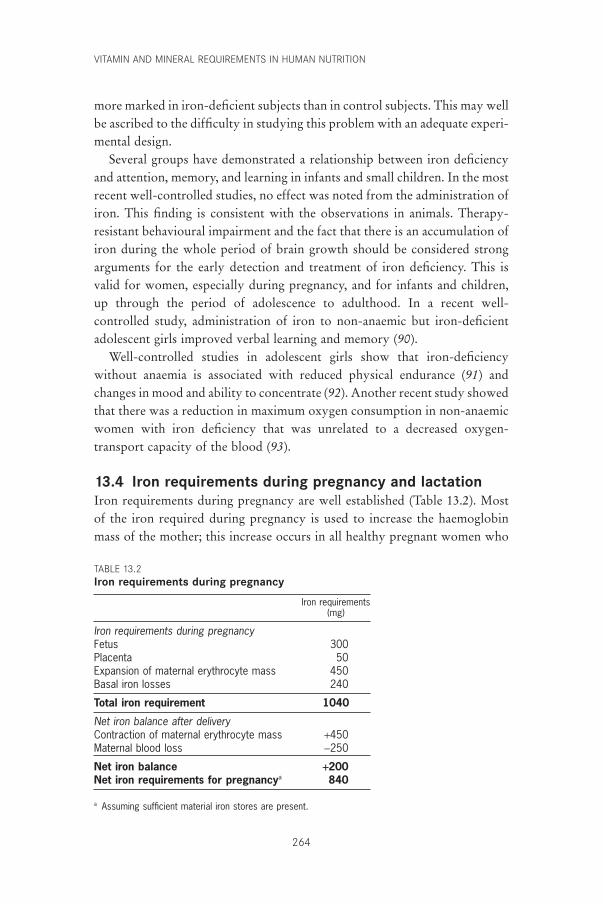
VITAMIN AND MINERAL REQUIREMENTS IN HUMAN NUTRITION
264
more marked in iron-deficient subjects than in control subjects. This may wellbe ascribed to the difficulty in studying this problem with an adequate experi-mental design.
Several groups have demonstrated a relationship between iron deficiencyand attention, memory, and learning in infants and small children. In the mostrecent well-controlled studies, no effect was noted from the administration ofiron. This finding is consistent with the observations in animals. Therapy-resistant behavioural impairment and the fact that there is an accumulation ofiron during the whole period of brain growth should be considered strongarguments for the early detection and treatment of iron deficiency. This isvalid for women, especially during pregnancy, and for infants and children,up through the period of adolescence to adulthood. In a recent well-controlled study, administration of iron to non-anaemic but iron-deficientadolescent girls improved verbal learning and memory (90).
Well-controlled studies in adolescent girls show that iron-deficiencywithout anaemia is associated with reduced physical endurance (91) andchanges in mood and ability to concentrate (92). Another recent study showedthat there was a reduction in maximum oxygen consumption in non-anaemicwomen with iron deficiency that was unrelated to a decreased oxygen-transport capacity of the blood (93).
13.4 Iron requirements during pregnancy and lactationIron requirements during pregnancy are well established (Table 13.2). Mostof the iron required during pregnancy is used to increase the haemoglobinmass of the mother; this increase occurs in all healthy pregnant women who
TABLE 13.2Iron requirements during pregnancy
Iron requirements(mg)
Iron requirements during pregnancyFetus 300Placenta 50Expansion of maternal erythrocyte mass 450Basal iron losses 240
Total iron requirement 1040
Net iron balance after deliveryContraction of maternal erythrocyte mass +450Maternal blood loss -250
Net iron balance +200Net iron requirements for pregnancya 840
a Assuming sufficient material iron stores are present.
P246-278 3/12/05 17:09 Page 264
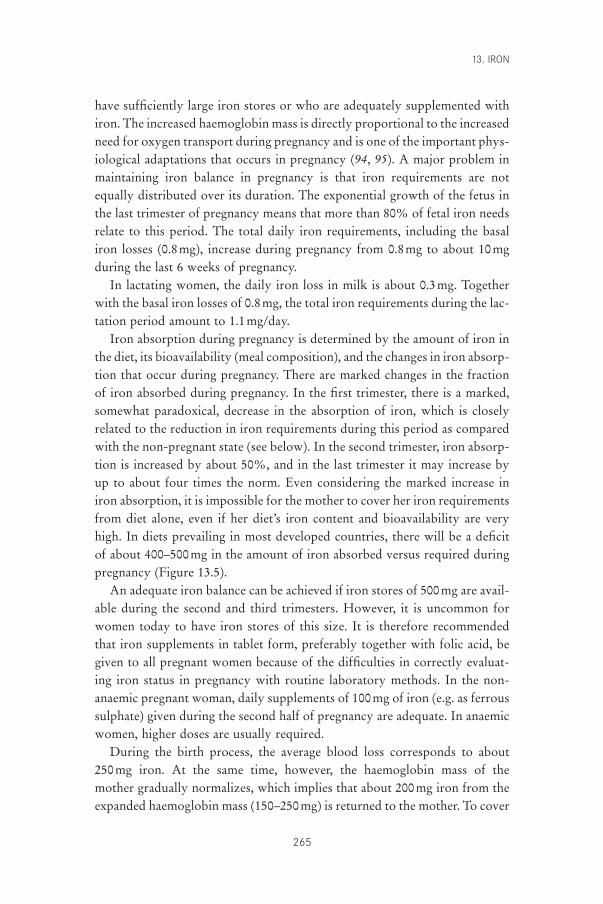
have sufficiently large iron stores or who are adequately supplemented withiron. The increased haemoglobin mass is directly proportional to the increasedneed for oxygen transport during pregnancy and is one of the important phys-iological adaptations that occurs in pregnancy (94, 95). A major problem inmaintaining iron balance in pregnancy is that iron requirements are notequally distributed over its duration. The exponential growth of the fetus inthe last trimester of pregnancy means that more than 80% of fetal iron needsrelate to this period. The total daily iron requirements, including the basaliron losses (0.8mg), increase during pregnancy from 0.8mg to about 10mgduring the last 6 weeks of pregnancy.
In lactating women, the daily iron loss in milk is about 0.3mg. Togetherwith the basal iron losses of 0.8mg, the total iron requirements during the lac-tation period amount to 1.1mg/day.
Iron absorption during pregnancy is determined by the amount of iron inthe diet, its bioavailability (meal composition), and the changes in iron absorp-tion that occur during pregnancy. There are marked changes in the fractionof iron absorbed during pregnancy. In the first trimester, there is a marked,somewhat paradoxical, decrease in the absorption of iron, which is closelyrelated to the reduction in iron requirements during this period as comparedwith the non-pregnant state (see below). In the second trimester, iron absorp-tion is increased by about 50%, and in the last trimester it may increase byup to about four times the norm. Even considering the marked increase iniron absorption, it is impossible for the mother to cover her iron requirementsfrom diet alone, even if her diet’s iron content and bioavailability are veryhigh. In diets prevailing in most developed countries, there will be a deficitof about 400–500mg in the amount of iron absorbed versus required duringpregnancy (Figure 13.5).
An adequate iron balance can be achieved if iron stores of 500mg are avail-able during the second and third trimesters. However, it is uncommon forwomen today to have iron stores of this size. It is therefore recommendedthat iron supplements in tablet form, preferably together with folic acid, begiven to all pregnant women because of the difficulties in correctly evaluat-ing iron status in pregnancy with routine laboratory methods. In the non-anaemic pregnant woman, daily supplements of 100mg of iron (e.g. as ferroussulphate) given during the second half of pregnancy are adequate. In anaemicwomen, higher doses are usually required.
During the birth process, the average blood loss corresponds to about 250mg iron. At the same time, however, the haemoglobin mass of the mother gradually normalizes, which implies that about 200mg iron from theexpanded haemoglobin mass (150–250mg) is returned to the mother. To cover
13. IRON
265
P246-278 3/12/05 17:09 Page 265
VITAMIN AND MINERAL REQUIREMENTS IN HUMAN NUTRITION
266
the needs of a woman after pregnancy, a further 300mg of iron must be accu-mulated in the iron stores in order for the woman to start her next pregnancywith about 500mg of stored iron; such restitution is not possible with presenttypes of diets.
There is an association between low haemoglobin values and prematurebirth. An extensive study (96) showed that a woman with a haematocrit of37% had twice the risk of having a premature birth, as did a woman with ahaematocrit between 41% and 44% (P £ 0.01). A similar observation wasreported in another extensive study in the United States (97). The subjectswere examined retrospectively and the cause of the lower haematocrit was notinvestigated.
Early in pregnancy there are marked hormonal, haemodynamic, andhaematologic changes. There is, for example, a very early increase in theplasma volume, which has been used to explain the physiological anaemia ofpregnancy observed in iron-replete women. The primary cause of this phe-nomenon, however, is more probably an increased ability of the haemoglo-bin to deliver oxygen to the tissues (fetus). This change is induced early inpregnancy by increasing the content of 2,3-diphospho-d-glycerate in the ery-throcytes, which shifts the haemoglobin–oxygen dissociation curve to theright. The anaemia is a consequence of this important adaptation and it is not
Iron requirement
Iron absorption
Iron deficit
Weeks
10
mg
Fe/d
ay
20
5
24 28 32 36 40
The shaded area represents the deficit of iron that has to be covered by iron from stores or ironsupplementation.
FIGURE 13.5Daily iron requirements and daily dietary iron absorption in pregnancy
P246-278 3/12/05 17:09 Page 266
primarily a desirable change, for example, to improve placental blood flow byreducing blood viscosity.
Another observation has similarly caused some confusion about the ration-ale of giving extra iron routinely in pregnancy. In extensive studies of preg-nant women, a U-shaped relationship between various pregnancycomplications and the haemoglobin level has been noted (i.e. there are morecomplications at both low and high levels). There is nothing to indicate,however, that high haemoglobin levels (within the normal non-pregnantrange) per se have any negative effects. The haemoglobin increase is causedby pathologic hormonal and haemodynamic changes induced by an increasedsensitivity to angiotensin II, which occurs in some pregnant women, leadingto a reduction in plasma volume, hypertension, and toxaemia of pregnancy.
Pregnancy in adolescents presents a special problem because iron is neededto cover the requirements of growth for the mother and the fetus. In coun-tries with very early marriage, a girl may get pregnant before menstruating.The combined iron requirements for growth and pregnancy are very high andthe iron situation is very serious for these adolescents.
In summary, the physiological adjustments occurring in pregnancy are notsufficient to balance its very marked iron requirements, and the pregnantwoman has to rely on her iron stores. In developed countries, the composi-tion of the diet has not been adjusted to the present low-energy-demandinglifestyles found there. As a result, women in these countries have insufficientor empty iron stores during pregnancy. This is probably the main cause of thecritical iron-balance situation in pregnant women in these countries today.The unnatural necessity to give extra nutrients such as iron and folate to oth-erwise healthy pregnant women should be considered in this perspective.
13.5 Iron supplementation and fortificationThe prevention of iron deficiency has become more urgent in recent yearswith the accumulation of evidence strongly suggesting a relationship betweeneven mild iron deficiency and impaired brain development, and especially soin view of the observation that functional defects affecting learning and behav-iour cannot be reversed by giving iron at a later date. As mentioned, iron defi-ciency is common both in developed and in developing countries. Greatefforts have been made by WHO to develop methods to combat iron deficiency.
Iron deficiency can generally be combated by one or more of the follow-ing three strategies: (1) iron supplementation (i.e. giving iron tablets to certaintarget groups such as pregnant women and preschool children); (2) iron for-tification of certain foods, such as flour; and (3) food and nutrition education
13. IRON
267
P246-278 3/12/05 17:09 Page 267
VITAMIN AND MINERAL REQUIREMENTS IN HUMAN NUTRITION
268
on improving the amount of iron absorbed from the diet by increasing theintake of iron and especially by improving the bioavailability of the dietaryiron.
Several factors determine the feasibility and effectiveness of different strate-gies, such as the health infrastructure of a society, the economy, and access tosuitable methods of iron fortification. The solutions are therefore often quitedifferent in developing and developed countries. There is a need to obtain newknowledge about the feasibility of different methods to improve iron nutri-tion and to apply present knowledge in more effective ways. Further to this,initiation of local activities on the issue of iron nutrition should be stimulatedwhile actions from governments are awaited.
13.6 Evidence used for estimating recommended nutrientintakes
To translate physiological iron requirements, given in Table 13.1, into dietaryiron requirements, the bioavailability of iron in different diets must be calcu-lated. It is also necessary to define an iron status where the supply of iron tothe erythrocyte precursors and other tissues begins to be compromised. Astate of iron-deficient erythropoiesis occurs when iron can no longer be mobi-lized from iron stores; iron can no longer be mobilized when stores are almostcompletely empty. A reduction then occurs, for example, in the concentrationof haemoglobin and in the average content of haemoglobin in the erythro-cytes (i.e. a reduction in mean corpuscular haemoglobin). At the same timethe concentration of transferrin in the plasma increases because of an insuffi-cient supply of iron to liver cells. These changes were recently shown to occurrather suddenly at a level of serum ferritin <15mg/l (68, 70). A continued neg-ative iron balance will further reduce the level of haemoglobin. Symptomsrelated to iron deficiency are less related to the haemoglobin level and moreto the fact that there is a compromised supply of iron to tissues.
The bioavailability of iron in meals consumed in countries with a Western-type diet has been measured by using different methods. Numerous single-meal studies have shown absorption of non-haem iron ranging from 5% to40% (59, 98, 99). Attempts have also been made to estimate the bioavailabil-ity of dietary iron in populations consuming Western-type diets by using indi-rect methods (e.g. calculation of the coverage of iron requirements in groupsof subjects with known dietary intake). Such studies suggest that in border-line iron-deficient subjects, the bioavailability from healthy diets may reacha level of around 14–16% (15% relates to subjects who have a serum ferritinvalue of <15mg/l or a reference dose absorption of 56.5%) (19).
New radioiron tracer techniques have enabled direct measurements of the
P246-278 3/12/05 17:09 Page 268
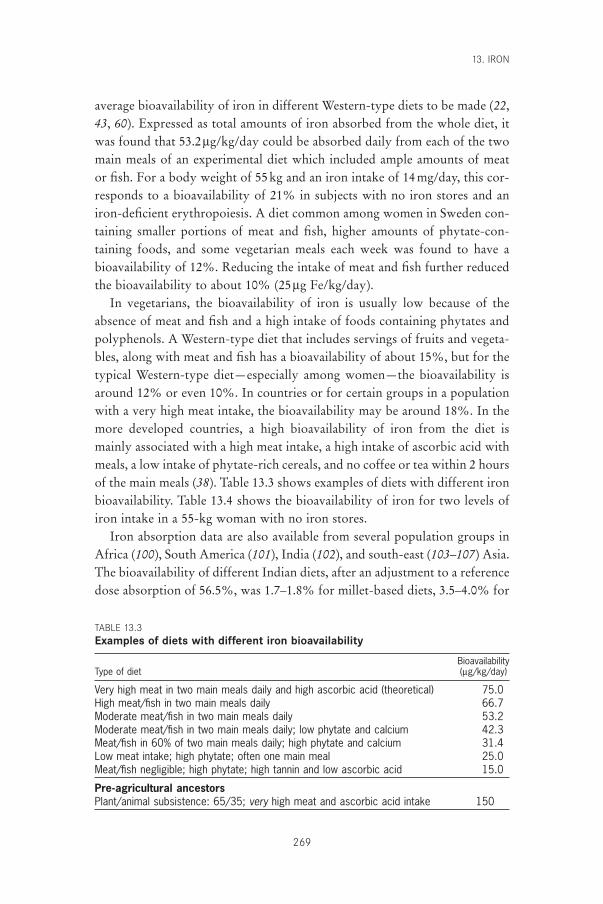
average bioavailability of iron in different Western-type diets to be made (22,43, 60). Expressed as total amounts of iron absorbed from the whole diet, itwas found that 53.2mg/kg/day could be absorbed daily from each of the twomain meals of an experimental diet which included ample amounts of meator fish. For a body weight of 55kg and an iron intake of 14mg/day, this cor-responds to a bioavailability of 21% in subjects with no iron stores and aniron-deficient erythropoiesis. A diet common among women in Sweden con-taining smaller portions of meat and fish, higher amounts of phytate-con-taining foods, and some vegetarian meals each week was found to have abioavailability of 12%. Reducing the intake of meat and fish further reducedthe bioavailability to about 10% (25mg Fe/kg/day).
In vegetarians, the bioavailability of iron is usually low because of theabsence of meat and fish and a high intake of foods containing phytates andpolyphenols. A Western-type diet that includes servings of fruits and vegeta-bles, along with meat and fish has a bioavailability of about 15%, but for thetypical Western-type diet—especially among women—the bioavailability isaround 12% or even 10%. In countries or for certain groups in a populationwith a very high meat intake, the bioavailability may be around 18%. In themore developed countries, a high bioavailability of iron from the diet ismainly associated with a high meat intake, a high intake of ascorbic acid withmeals, a low intake of phytate-rich cereals, and no coffee or tea within 2 hoursof the main meals (38). Table 13.3 shows examples of diets with different ironbioavailability. Table 13.4 shows the bioavailability of iron for two levels ofiron intake in a 55-kg woman with no iron stores.
Iron absorption data are also available from several population groups inAfrica (100), South America (101), India (102), and south-east (103–107) Asia.The bioavailability of different Indian diets, after an adjustment to a referencedose absorption of 56.5%, was 1.7–1.8% for millet-based diets, 3.5–4.0% for
13. IRON
269
TABLE 13.3Examples of diets with different iron bioavailability
BioavailabilityType of diet (mg/kg/day)
Very high meat in two main meals daily and high ascorbic acid (theoretical) 75.0High meat/fish in two main meals daily 66.7Moderate meat/fish in two main meals daily 53.2Moderate meat/fish in two main meals daily; low phytate and calcium 42.3Meat/fish in 60% of two main meals daily; high phytate and calcium 31.4Low meat intake; high phytate; often one main meal 25.0Meat/fish negligible; high phytate; high tannin and low ascorbic acid 15.0
Pre-agricultural ancestorsPlant/animal subsistence: 65/35; very high meat and ascorbic acid intake 150
P246-278 3/12/05 17:09 Page 269
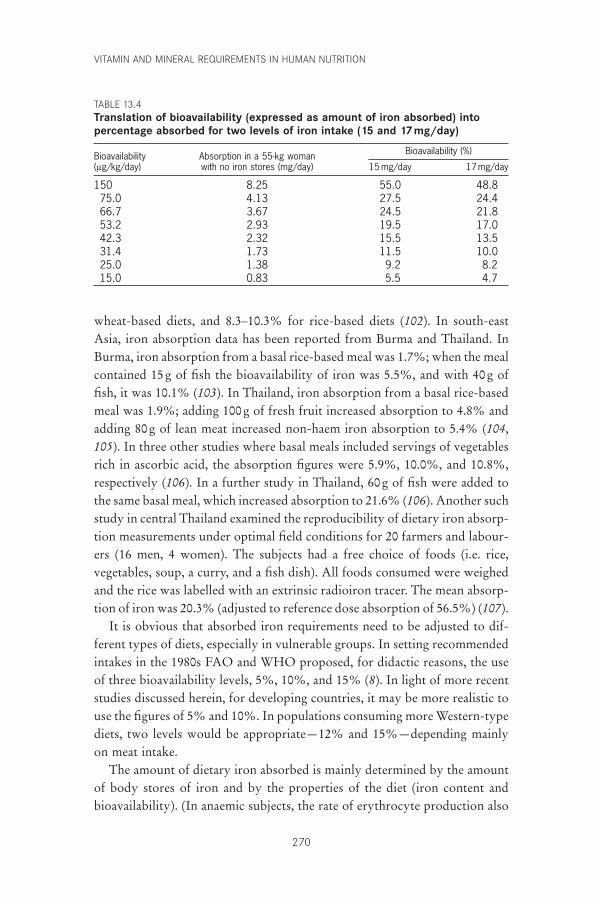
VITAMIN AND MINERAL REQUIREMENTS IN HUMAN NUTRITION
270
wheat-based diets, and 8.3–10.3% for rice-based diets (102). In south-eastAsia, iron absorption data has been reported from Burma and Thailand. InBurma, iron absorption from a basal rice-based meal was 1.7%; when the mealcontained 15g of fish the bioavailability of iron was 5.5%, and with 40g offish, it was 10.1% (103). In Thailand, iron absorption from a basal rice-basedmeal was 1.9%; adding 100g of fresh fruit increased absorption to 4.8% andadding 80g of lean meat increased non-haem iron absorption to 5.4% (104,105). In three other studies where basal meals included servings of vegetablesrich in ascorbic acid, the absorption figures were 5.9%, 10.0%, and 10.8%,respectively (106). In a further study in Thailand, 60g of fish were added tothe same basal meal, which increased absorption to 21.6% (106). Another suchstudy in central Thailand examined the reproducibility of dietary iron absorp-tion measurements under optimal field conditions for 20 farmers and labour-ers (16 men, 4 women). The subjects had a free choice of foods (i.e. rice,vegetables, soup, a curry, and a fish dish). All foods consumed were weighedand the rice was labelled with an extrinsic radioiron tracer. The mean absorp-tion of iron was 20.3% (adjusted to reference dose absorption of 56.5%) (107).
It is obvious that absorbed iron requirements need to be adjusted to dif-ferent types of diets, especially in vulnerable groups. In setting recommendedintakes in the 1980s FAO and WHO proposed, for didactic reasons, the useof three bioavailability levels, 5%, 10%, and 15% (8). In light of more recentstudies discussed herein, for developing countries, it may be more realistic touse the figures of 5% and 10%. In populations consuming more Western-typediets, two levels would be appropriate—12% and 15%—depending mainlyon meat intake.
The amount of dietary iron absorbed is mainly determined by the amountof body stores of iron and by the properties of the diet (iron content andbioavailability). (In anaemic subjects, the rate of erythrocyte production also
TABLE 13.4Translation of bioavailability (expressed as amount of iron absorbed) intopercentage absorbed for two levels of iron intake (15 and 17 mg/day)
Bioavailability Absorption in a 55-kg woman Bioavailability (%)
(mg/kg/day) with no iron stores (mg/day) 15mg/day 17mg/day
150 8.25 55.0 48.875.0 4.13 27.5 24.466.7 3.67 24.5 21.853.2 2.93 19.5 17.042.3 2.32 15.5 13.531.4 1.73 11.5 10.025.0 1.38 9.2 8.215.0 0.83 5.5 4.7
P246-278 3/12/05 17:09 Page 270
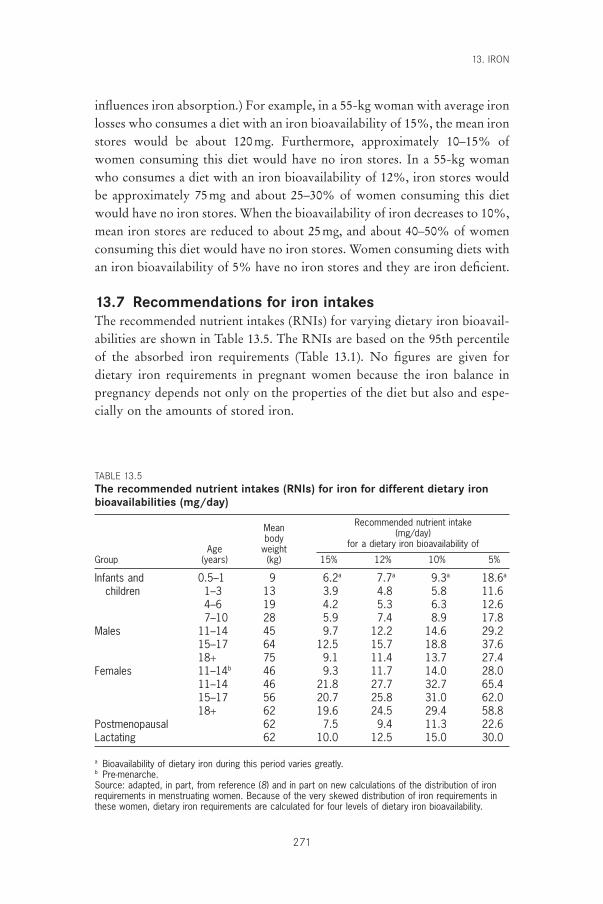
influences iron absorption.) For example, in a 55-kg woman with average ironlosses who consumes a diet with an iron bioavailability of 15%, the mean ironstores would be about 120mg. Furthermore, approximately 10–15% ofwomen consuming this diet would have no iron stores. In a 55-kg womanwho consumes a diet with an iron bioavailability of 12%, iron stores wouldbe approximately 75mg and about 25–30% of women consuming this dietwould have no iron stores. When the bioavailability of iron decreases to 10%,mean iron stores are reduced to about 25mg, and about 40–50% of womenconsuming this diet would have no iron stores. Women consuming diets withan iron bioavailability of 5% have no iron stores and they are iron deficient.
13.7 Recommendations for iron intakesThe recommended nutrient intakes (RNIs) for varying dietary iron bioavail-abilities are shown in Table 13.5. The RNIs are based on the 95th percentileof the absorbed iron requirements (Table 13.1). No figures are given fordietary iron requirements in pregnant women because the iron balance inpregnancy depends not only on the properties of the diet but also and espe-cially on the amounts of stored iron.
13. IRON
271
TABLE 13.5The recommended nutrient intakes (RNIs) for iron for different dietary ironbioavailabilities (mg/day)
Mean Recommended nutrient intake
body (mg/day)
Age weight for a dietary iron bioavailability of
Group (years) (kg) 15% 12% 10% 5%
Infants and 0.5–1 9 6.2a 7.7a 9.3a 18.6a
children 1–3 13 3.9 4.8 5.8 11.64–6 19 4.2 5.3 6.3 12.67–10 28 5.9 7.4 8.9 17.8
Males 11–14 45 9.7 12.2 14.6 29.215–17 64 12.5 15.7 18.8 37.618+ 75 9.1 11.4 13.7 27.4
Females 11–14b 46 9.3 11.7 14.0 28.011–14 46 21.8 27.7 32.7 65.415–17 56 20.7 25.8 31.0 62.018+ 62 19.6 24.5 29.4 58.8
Postmenopausal 62 7.5 9.4 11.3 22.6Lactating 62 10.0 12.5 15.0 30.0
a Bioavailability of dietary iron during this period varies greatly.b Pre-menarche.Source: adapted, in part, from reference (8) and in part on new calculations of the distribution of ironrequirements in menstruating women. Because of the very skewed distribution of iron requirements inthese women, dietary iron requirements are calculated for four levels of dietary iron bioavailability.
P246-278 3/12/05 17:09 Page 271
VITAMIN AND MINERAL REQUIREMENTS IN HUMAN NUTRITION
272
13.8 Recommendations for future researchThe following were identified as priority areas for future research efforts:
• Acquire knowledge of the content of phytate and iron-binding polyphe-nols in food, condiments, and spices and produce new food tables whichinclude such data.
• Acquire knowledge about detailed composition of common meals in dif-ferent regions of the world and their usual variation in composition toexamine the feasibility of making realistic recommendations about changesin meal composition, taking into consideration the effect of such changeson other nutrients (e.g. vitamin A).
• Give high priority to systematic research in the area of iron requirements.The very high iron requirements, especially in relation to energy require-ments, in the weaning period make it difficult to develop appropriate dietsbased on recommendations that are effective and realistic. Alternatives suchas home fortification of weaning foods should also be considered.
• Critically analyse the effectiveness of iron compounds used for fortification.
• Study models for improving iron supplementation—from the distributionof iron tablets to increasing the motivation of individuals to take iron sup-plements, especially during pregnancy.
References1. Bothwell TH et al. Iron metabolism in man. London, Blackwell Scientific
Publications, 1979.2. Hallberg L. Iron absorption and iron deficiency. Human Nutrition: Clinical
Nutrition, 1982, 36:259–278.3. Dallman PR. Biochemical basis for the manifestations of iron deficiency.
Annual Review of Nutrition, 1986, 6:13–40.4. Brock JH, Halliday JW, Powell LW. Iron metabolism in health and disease.
London, WB Saunders, 1994.5. Kühn LC. Control of cellular iron transport and storage at the molecular
level. In: Hallberg L, Asp N-G, eds. Iron nutrition in health and disease.London, John Libbey, 1996:17–29.
6. Mascotti DP, Rup D, Thach RE. Regulation of iron metabolism: translationaleffects mediated by iron, heme and cytokines. Annual Review of Nutrition,1995, 15:239–261.
7. Green R et al. Body iron excretion in man. A collaborative study. AmericanJournal of Medicine, 1968, 45:336–353.
8. Requirements of vitamin A, iron, folate and vitamin B12. Report of a JointFAO/WHO Expert Consultation. Rome, Food and Agriculture Or-ganization of the United Nations, 1988 (FAO Food and Nutrition Series, No. 23).
9. Brune M et al. Iron losses in sweat. American Journal of Clinical Nutrition,1986, 43:438–443.
P246-278 3/12/05 17:09 Page 272
10. Nutrient and energy intakes for the European Community: a report of theScientific Committee for Food. Brussels, Commission of the European Com-munities, 1993.
11. Rossander-Hulthén L, Hallberg L. Prevalence of iron deficiency in adoles-cents. In: Hallberg L, Asp N-G, eds. Iron nutrition in health and disease.London, John Libby, 1996:149–156.
12. Dallman PR, Siimes M. Percentile curves for hemoglobin and red cell volumein infancy and childhood. Journal of Pediatrics, 1979, 94:26–31.
13. Tanner JM, Whitehouse RH, Takaishi M. Standards from birth to maturityfor height, eight, height velocity, and weight velocity in British children, 1965,Part I. Archives of Diseases in Childhood, 1966, 41:454–471.
14. Tanner JM, Whitehouse RH, Takaishi M. Standards from birth to maturity for height, weight, height velocity, and weight velocity in British children, 1965, Part II. Archives of Diseases in Childhood, 1966, 41:613–632.
15. Karlberg P et al. The somatic development of children in a Swedish urbancommunity. Acta Paediatrica Scandinavica, 1976, 258(Suppl.):S5–S147.
16. Hallberg L et al. Menstrual blood loss—a population study. Variation at dif-ferent ages and attempts to define normality. Acta Obstetricia GynecologicaScandinavica, 1966, 45:320–351.
17. Rybo G-M, Hallberg L. Influence of heredity and environment on normalmenstrual blood loss. A study of twins. Acta Obstetricia Gynecologica Scan-dinavica, 1966, 45:389–410.
18. Rybo G-M. Plasminogen activators in the endometrium. I. Methodologicalaspects. II. Clinical aspects. Acta Obstetricia Gynecologica Scandinavica,1966, 45:411–450.
19. Hallberg L, Rossander-Hulthén L. Iron requirements in menstruatingwomen. American Journal of Clinical Nutrition, 1991, 54:1047–1058.
20. Hallberg L. Bioavailability of dietary iron in man. Annual Review of Nutri-tion, 1981, 1:123–147.
21. Hallberg L et al. Dietary heme iron absorption. A discussion of possiblemechanisms for the absorption-promoting effect of meat and for the regula-tion of iron absorption. Scandinavian Journal of Gastroenterology, 1979,14:769–779.
22. Hallberg L, Hulthén L, Gramatkovski E. Iron absorption from the wholediet in men: how effective is the regulation of iron absorption? AmericanJournal of Clinical Nutrition, 1997, 66:347–356.
23. Hallberg L et al. Inhibition of haem-iron absorption in man by calcium.British Journal of Nutrition, 1993, 69:533–540.
24. Hallberg L. The pool concept in food iron absorption and some of its impli-cations. Proceedings of the Nutrition Society, 1974, 33:285–291.
25. Hallberg L. Factors influencing the efficacy of iron fortification and the selection of fortification vehicles. In: Clydesdale FM, Wiemer KL, eds. Ironfortification of foods. New York, NY, Academic Press, 1985:17–28.
26. Hallberg L, Björn-Rasmussen E. Measurement of iron absorption from mealscontaminated with iron. American Journal of Clinical Nutrition, 1981, 34:2808–2815.
27. Hallberg L et al. Iron absorption from some Asian meals containing contamination iron. American Journal of Clinical Nutrition, 1983, 37:272–277.
28. Wollenberg P, Rummel W. Dependence of intestinal iron absorption on the
13. IRON
273
P246-278 3/12/05 17:09 Page 273
VITAMIN AND MINERAL REQUIREMENTS IN HUMAN NUTRITION
274
valency state of iron. Naunyn-Schmiedeberg’s Archives of Pharmacology,1987, 36:578–582.
29. Gillooly M et al. The effect of organic acids, phytates and polyphenols onabsorption of iron from vegetables. British Journal of Nutrition, 1983,49:331–342.
30. Hallberg L, Brune M, Rossander L. Iron absorption in man: ascorbic acidand dose-dependent inhibition by phytate. American Journal of ClinicalNutrition, 1989, 49:140–144.
31. Hallberg L, Rossander L, Skånberg A-B. Phytates and the inhibitory effectof bran on iron absorption in man. American Journal of Clinical Nutrition,1987, 45:988–996.
32. Brune M et al. Iron absorption from bread in humans: inhibiting effects ofcereal fiber, phytate and inositol phosphates with different numbers of phos-phate groups. Journal of Nutrition, 1992, 122:442–449.
33. Rossander-Hulthén L, Gleerup A, Hallberg L. Inhibitory effect of oat prod-ucts on non-haem iron absorption in man. European Journal of ClinicalNutrition, 1990, 44:783–791.
34. Siegenberg D et al. Ascorbic acid prevents the dose-dependent inhibitoryeffects of polyphenols and phytates on non-heme iron absorption. AmericanJournal of Clinical Nutrition, 1991, 53:537–541.
35. Brune M, Rossander L, Hallberg L. Iron absorption and phenolic com-pounds: importance of different phenolic structures. European Journal ofClinical Nutrition, 1989, 43:547–558.
36. Disler PB et al. The effect of tea on iron absorption. Gut, 1975, 16:193–200.37. Derman D et al. Iron absorption from a cereal-based meal containing cane
sugar fortified with ascorbic acid. British Journal of Nutrition, 1977, 38:261–269.
38. Morck TA, Lynch SE, Cook JD. Inhibition of food iron absorption by coffee.American Journal of Clinical Nutrition, 1983, 37:416–420.
39. Hallberg L, Rossander L. Effect of different drinks on the absorption of non-heme iron from composite meals. Human Nutrition: Applied Nutrition, 1982,36:116–123.
40. Hallberg L et al. Calcium: effect of different amounts on nonheme- andheme-iron absorption in humans. American Journal of Clinical Nutrition,1991, 53:112–119.
41. Hallberg L et al. Calcium and iron absorption: mechanism of action andnutritional importance. European Journal of Clinical Nutrition, 1992, 46:317–327.
42. Gleerup A, Rossander-Hulthén L, Hallberg L. Duration of the inhibitoryeffect of calcium on non-haem iron absorption in man. European Journal ofClinical Nutrition, 1993, 47:875–879.
43. Gleerup A et al. Iron absorption from the whole diet: comparison of the effectof two different distributions of daily calcium intake. American Journal ofClinical Nutrition, 1995, 61:97–104.
44. Hallberg L. Does calcium interfere with iron absorption? American Journalof Clinical Nutrition, 1998, 68:3–4.
45. Cook JD, Morck TA, Lynch SR. The inhibitory effects of soy products onnonheme iron absorption in man. American Journal of Clinical Nutrition,1981, 34:2622–2629.
46. Hallberg L, Hulthén L. Effect of soy protein on nonheme iron absorption inman. American Journal of Clinical Nutrition, 1982, 36:514–520.
P246-278 3/12/05 17:09 Page 274
13. IRON
275
47. Hallberg L, Rossander L. Improvement of iron nutrition in developing countries: comparison of adding meat, soy protein, ascorbic acid, citric acid, and ferrous sulphate on iron absorption from a simple Latin American-type of meal. American Journal of Clinical Nutrition, 1984,39:577–583.
48. Hurrell RF et al. Soy protein, phytate, and iron absorption in humans. American Journal of Clinical Nutrition, 1992, 56:573–578.
49. Baynes RD et al. The promotive effect of soy sauce on iron absorption in human subjects. European Journal of Clinical Nutrition, 1990,44:419–424.
50. Macfarlane BJ et al. The effect of traditional oriental soy products on ironabsorption. American Journal of Clinical Nutrition, 1990, 51:873–880.
51. Cook JD, Monsen ER. Vitamin C, the common cold and iron absorption.American Journal of Clinical Nutrition, 1977, 30:235–241.
52. Hallberg L, Brune M, Rossander L. Effect of ascorbic acid on iron absorp-tion from different types of meals. Studies with ascorbic-acid-rich foods andsynthetic ascorbic acid given in different amounts with different meals.Human Nutrition: Applied Nutrition, 1986, 40:97–113.
53. Derman DP et al. Importance of ascorbic acid in the absorption of iron frominfant foods. Scandinavian Journal of Haematology, 1980, 25:193–201.
54. Hallberg L, Brune M, Rossander-Hulthén L. Is there a physiological role ofvitamin C in iron absorption? Annals of the New York Academy of Sciences,1987, 498:324–332.
55. Layrisse M, Martinez-Torres C, Roch M. The effect of interaction of variousfoods on iron absorption. American Journal of Clinical Nutrition, 1968,21:1175–1183.
56. Layrisse M et al. Food iron absorption: a comparison of vegetable and animalfoods. Blood, 1969, 33:430–443.
57. Cook JD, Monson RR. Food iron absorption in human subjects. III. Comparison of the effect of animal proteins on nonheme iron absorption.American Journal of Clinical Nutrition, 1976, 29:859–867.
58. Björn-Rasmussen E, Hallberg L. Effect of animal proteins on the absorptionof food iron in man. Nutrition and Metabolism, 1979, 23:192–202.
59. Hallberg L, Rossander L. Absorption of iron from Western-type lunch and dinner meals. American Journal of Clinical Nutrition, 1982, 35:502–509.
60. Hulthén L et al. Iron absorption from the whole diet. Relation to meal com-position, iron requirements and iron stores. European Journal of ClinicalNutrition, 1995, 49:794–808.
61. Hallberg L, Hulthén L. Methods to study dietary iron absorption in man—an overview. In: Hallberg L, Asp N-G, eds. Iron nutrition in health anddisease. London, John Libbey, 1996:81–95.
62. Cook JD, Dassenko SA, Lynch SR. Assessment of the role of nonheme ironavailability in iron balance. American Journal of Clinical Nutrition, 1991,54:717–722.
63. Taylor PG et al. Iron bioavailability from diets consumed by different socio-economic strata of the Venezuelan population. Journal of Nutrition, 1995,25:1860–1868.
64. Hallberg L. Bioavailable nutrient density: a new concept applied in the inter-pretation of food iron absorption data. American Journal of Clinical Nutri-tion, 1981, 34:2242–2247.
P246-278 3/12/05 17:09 Page 275
VITAMIN AND MINERAL REQUIREMENTS IN HUMAN NUTRITION
276
65. Eaton SB, Konner M. Paleolithic nutrition: a consideration of its nature andcurrent implications. New England Journal of Medicine, 1985, 312:283–289.
66. Eaton SB, Nelson DA. Calcium in evolutionary perspective. AmericanJournal of Clinical Nutrition, 1991, 54(Suppl.):S281–S287.
67. Eaton SB, Eaton III SB, Konner M. Paleolithic nutrition revisited: a twelveyear retrospective on its nature and implications. European Journal of Clini-cal Nutrition, 1997, 51:207–216.
68. Hallberg L et al. Iron balance in menstruating women. European Journal ofClinical Nutrition, 1995, 49:200–207.
69. Hallberg L, Hulthén L, Garby L. Iron stores in man in relation to diet andiron requirements. European Journal of Clinical Nutrition, 1998, 52:623–631.
70. Hallberg L et al. Screening for iron deficiency: an analysis based on bone-marrow examinations and serum ferritin determinations in a populationsample of women. British Journal of Haematology, 1993, 85:787–798.
71. Wintrobe MM. Clinical hematology, 8th ed. Philadelphia, PA, Lea & Febiger,1981.
72. Yip R, Stoltzfus RJ. Assessment of the prevalence and the nature of iron defi-ciency for populations: the utility of comparing haemoglobin distributions.In: Hallberg L, Asp N-G, eds. Iron nutrition in health and disease. London,John Libby, 1996, 31–38.
73. Harford JB, Röuault TA, Klausner RD. The control of cellular iron home-ostasis. In: Brock JH et al., eds. Iron metabolism in health and disease.London, WB Saunders, 1994:123–149.
74. Baker E, Morgan EH. Iron transport. In: Brock JH et al., eds. Iron metabo-lism in health and disease. London, WB Saunders, 1994:63–95.
75. Pilch SM, Senti FRE. Assessment of the iron nutritional status of the US pop-ulation based on data collected in the second National Health and NutritionExamination Survey, 1976–1980. Bethesda, MD, Life Sciences ResearchOffice, Federation of American Societies for Experimental Biology, 1984.
76. Group ESW. Summary of a report on assessment of the iron nutritional statusof the United States population. American Journal of Clinical Nutrition, 1985,2:1318–1330.
77. Hulthén L et al. Effect of a mild infection on serum ferritin concentration—clinical and epidemiological implications. European Journal of Clinical Nutri-tion, 1998, 52:1–4.
78. Osler M, Minman N, Heitman BL. Dietary and non-dietary factors associ-ated with iron status in a cohort of Danish adults followed for six years. European Journal of Clinical Nutrition, 1998, 52:459–463.
79. Leggett BA et al. Factors affecting the concentrations of ferritin in serum ina healthy Australian population. Clinical Chemistry, 1990, 36:1350–1355.
80. Cook JD, Skikne B, Baynes R. The use of transferrin receptor for the assess-ment of iron status. In: Hallberg L, Asp N-G, eds. Iron nutrition in healthand disease. London, John Libbey, 1996, 49–58.
81. DeMaeyer E, Adiels-Tegman M, Raystone E. The prevalence of anemia inthe world. World Health Statistics Quarterly, 1985, 38:302–316.
82. Edgerton VR et al. Iron deficiency anemia and physical performance andactivity of rats. Journal of Nutrition, 1972, 102:381–399.
83. Finch CA et al. Iron deficiency in the rat. Physiological and biochemicalstudies of muscle dysfunction. Journal of Clinical Investigation, 1976,58:447–453.
P246-278 3/12/05 17:09 Page 276
84. Scrimshaw NS. Functional consequences of iron deficiency in human popu-lations. Journal of Nutrition Science and Vitaminology, 1984, 30:47–63.
85. Lozoff B, Jimenez E, Wolf A. Long-term developmental outcome of infantswith iron deficiency. New England Journal of Medicine, 1991, 325:687–694.
86. Youdim MBH. Brain iron: neurochemical and behavioural aspects. NewYork, NY, Taylor & Francis, 1988.
87. Beard JL, Connor JR, Jones BC. Iron in the brain. Nutrition Reviews, 1993,1:157–170.
88. Pollitt E. Iron deficiency and cognitive function. Annual Review of Nutri-tion, 1993, 13:521–537.
89. Brock JH. Iron in infection, immunity, inflammation and neoplasia. In: BrockJH et al., eds. Iron metabolism in health and disease. London, WB Saunders,1994:353–389.
90. Bruner AB et al. Randomised study of cognitive effects of iron supplemen-tation in non-anaemic iron-deficient adolescent girls. Lancet, 1996,348:992–996.
91. Rowland TW et al. The effect of iron therapy on the exercise capacity of non-anemic iron-deficient adolescent runners. American Journal of Diseases ofChildren, 1988, 142:165–169.
92. Ballin A et al. Iron state in female adolescents. American Journal of Diseasesof Children, 1992, 146:803–805.
93. Zhu YI, Haas JD. Iron depletion without anemia and physical performancein young women. American Journal of Clinical Nutrition, 1997, 66:334–341.
94. Hallberg L. Iron balance in pregnancy. In: Berger H, ed. Vitamins and min-erals in pregnancy and lactation. New York, NY, Raven Press, 1988:115–127(Nestlé Nutrition Workshop Series, Vol. 16).
95. Hallberg L. Iron balance in pregnancy and lactation. In: Fomon SJ, ZlotkinS, eds. Nutritional anemias. New York, NY, Raven Press, 1992:13–25 (NestléNutrition Workshop Series, Vol. 30).
96. Lieberman E et al. Association of maternal hematocrit with premature labor.American Journal of Obstetrics and Gynecology, 1988, 159:107–114.
97. Garn SM et al. Maternal hematological levels and pregnancy outcome. Seminars in Perinatology, 1981, 5:155–162.
98. Rossander L, Hallberg L, Björn-Rasmussen E. Absorption of iron frombreakfast meals. American Journal of Clinical Nutrition, 1979, 32:2484–2489.
99. Hallberg L, Rossander L. Bioavailability of iron from Western-type wholemeals. Scandinavian Journal of Gastroenterology, 1982, 17:151–160.
100. Galan P et al. Iron absorption from typical West African meals containingcontaminating Fe. British Journal of Nutrition, 1990, 64:541–546.
101. Acosta A et al. Iron absorption from typical Latin American meals. American Journal of Clinical Nutrition, 1984, 39:953–962.
102. Rao BSN, Vijayasarathy C, Prabhavathi T. Iron absorption from habitualdiets of Indians studied by the extrinsic tag technique. Indian Journal of Medicine, 1983, 77:648–657.
103. Aung-Than-Batu, Thein-Than, Thane-Toe. Iron absorption from SoutheastAsian rice-based meals. American Journal of Clinical Nutrition, 1976,29:219–225.
104. Hallberg L et al. Iron absorption from Southeast Asian diets. AmericanJournal of Clinical Nutrition, 1974, 27:826–836.
105. Hallberg L et al. Iron absorption from Southeast Asian diets. II. Role of
13. IRON
277
P246-278 3/12/05 17:09 Page 277
VITAMIN AND MINERAL REQUIREMENTS IN HUMAN NUTRITION
278
various factors that might explain low absorption. American Journal of Clin-ical Nutrition, 1977, 30:539–548.
106. Hallberg L et al. Iron absorption from Southeast Asian diets and the effectof iron fortification. American Journal of Clinical Nutrition, 1978,31:1403–1408.
107. Hallberg L, Björn-Rasmussen E, Rossander L. The measurement of food ironabsorption in man. A methodological study on the measurement of dietarynon-haem-Fe absorption when the subjects have a free choice of food items.British Journal of Nutrition, 1979, 41:283–289.
P246-278 3/12/05 17:09 Page 278
14. Vitamin B12
279
14.1 Role of vitamin B12 in human metabolic processesAlthough the nutritional literature still uses the term vitamin B12, a more specific name for vitamin B12 is cobalamin. Vitamin B12 is the largest of the Bcomplex vitamins, with a relative molecular mass of over 1000. It consists ofa corrin ring made up of four pyrroles with cobalt at the centre of the ring(1, 2).
There are several vitamin B12-dependent enzymes in bacteria and algae, butno species of plants have the enzymes necessary for vitamin B12 synthesis. Thisfact has significant implications for the dietary sources and availability ofvitamin B12. In mammalian cells, there are only two vitamin B12-dependentenzymes (3). One of these enzymes, methionine synthase, uses the chemicalform of the vitamin which has a methyl group attached to the cobalt and is called methylcobalamin (see Chapter 15, Figure 15.2). The otherenzyme, methylmalonyl coenzyme (CoA) mutase, uses a form of vitamin B12
that has a 5¢-adeoxyadenosyl moiety attached to the cobalt and is called 5¢-deoxyadenosylcobalamin, or coenzyme B12. In nature, there are two otherforms of vitamin B12: hydroxycobalamin and aquacobalamin, where hydroxyland water groups, respectively, are attached to the cobalt. The synthetic formof vitamin B12 found in supplements and fortified foods is cyanocobalamin,which has cyanide attached to the cobalt. These three forms of vitamin B12 are enzymatically activated to the methyl- or deoxyadenosylcobalamins in allmammalian cells.
14.2 Dietary sources and availabilityMost microorganisms, including bacteria and algae, synthesize vitamin B12,and they constitute the only source of the vitamin (4). The vitamin B12 syn-thesized in microorganisms enters the human food chain through incorpora-tion into food of animal origin. In many animals, gastrointestinal fermentationsupports the growth of these vitamin B12 synthesizing microorganisms, andsubsequently the vitamin is absorbed and incorporated into the animal tissues.This is particularly true for the liver, where vitamin B12 is stored in large con-
P279-288 3/12/05 17:10 Page 279
VITAMIN AND MINERAL REQUIREMENTS IN HUMAN NUTRITION
280
centrations. Products from herbivorous animals, such as milk, meat, and eggs,thus constitute important dietary sources of the vitamin, unless the animal issubsisting in one of the many regions known to be geochemically deficient incobalt (5). Milk from cows and humans contains binders with very high affin-ity for vitamin B12, though whether they hinder or promote intestinal absorp-tion is not entirely clear. Omnivores and carnivores, including humans, derivedietary vitamin B12 almost exclusively from animal tissues or products (i.e.milk, butter, cheese, eggs, meat, poultry). It appears that the vitamin B12
required by humans is not derived from microflora in any appreciable quan-tities, although vegetable fermentation preparations have been reported asbeing possible sources of vitamin B12 (6).
14.3 AbsorptionThe absorption of vitamin B12 in humans is complex (1, 2). Vitamin B12 in food is bound to proteins and is only released by the action of a high concentration of hydrochloric acid present in the stomach. This processresults in the free form of the vitamin, which is immediately bound to amixture of glycoproteins secreted by the stomach and salivary glands. Theseglycoproteins, called R-binders (or haptocorrins), protect vitamin B12 fromchemical denaturation in the stomach. The stomach’s parietal cells, whichsecrete hydrochloric acid, also secrete a glycoprotein called intrinsic factor.Intrinsic factor binds vitamin B12 and ultimately enables its active absorption.Although the formation of the vitamin B12–intrinsic factor complex was ini-tially thought to happen in the stomach, it is now clear that this is not thecase. At an acidic pH, the affinity of the intrinsic factor for vitamin B12 is lowwhereas its affinity for the R-binders is high. When the contents of thestomach enter the duodenum, the R-binders become partly digested by thepancreatic proteases, which in turn causes them to release their vitamin B12.Because the pH in the duodenum is more neutral than that in the stomach,the intrinsic factor has a high binding affinity to vitamin B12, and it quickly binds the vitamin as it is released from the R-binders. The vitaminB12–intrinsic factor complex then proceeds to the lower end of the small intestine, where it is absorbed by phagocytosis by specific ileal receptors (1, 2).
14.4 Populations at risk for, and consequences of, vitaminB12 deficiency
14.4.1 VegetariansBecause plants do not synthesize vitamin B12, individuals who consume dietscompletely free of animal products (vegan diets) are at risk of vitamin B12 defi-
P279-288 3/12/05 17:10 Page 280
ciency. This is not true of lacto-ovo vegetarians, who consume the vitamin ineggs, milk, and other dairy products.
14.4.2 Pernicious anaemiaMalabsorption of vitamin B12 can occur at several points during digestion (1,4). By far the most important condition resulting in vitamin B12 malabsorp-tion is the autoimmune disease called pernicious anaemia (PA). In most casesof PA, antibodies are produced against the parietal cells causing them toatrophy, and lose their ability to produce intrinsic factor and secretehydrochloric acid. In some forms of PA, the parietal cells remain intact butautoantibodies are produced against the intrinsic factor itself and attach to it,thus preventing it from binding vitamin B12. In another less common form ofPA, the antibodies allow vitamin B12 to bind to the intrinsic factor but preventthe absorption of the intrinsic factor–vitamin B12 complex by the ileal recep-tors. As is the case with most autoimmune diseases, the incidence of PAincreases markedly with age. In most ethnic groups, it is virtually unknownto occur before the age of 50, with a progressive rise in incidence thereafter(4). However, African American populations are known to have an earlier ageof presentation (4). In addition to causing malabsorption of dietary vitaminB12, PA also results in an inability to reabsorb the vitamin B12 which is secretedin the bile. Biliary secretion of vitamin B12 is estimated to be between 0.3 and0.5mg/day. Interruption of this so-called enterohepatic circulation of vitaminB12 causes the body to go into a significant negative balance for the vitamin.Although the body typically has sufficient vitamin B12 stores to last 3–5 years,once PA has been established, the lack of absorption of new vitamin B12 iscompounded by the loss of the vitamin because of negative balance. Whenthe stores have been depleted, the final stages of deficiency are often quiterapid, resulting in death in a period of months if left untreated.
14.4.3 Atrophic gastritisHistorically, PA was considered to be the major cause of vitamin B12 defi-ciency, but it was a fairly rare condition, perhaps affecting between one anda few per cent of elderly populations. More recently, it has been suggestedthat a far more common problem is that of hypochlorhydria associated withatrophic gastritis, where there is a progressive reduction with age of the abilityof the parietal cells to secrete hydrochloric acid (7). It is claimed that perhapsup to one quarter of elderly subjects could have various degrees ofhypochlorhydria as a result of atrophic gastritis. It has also been suggestedthat bacterial overgrowth in the stomach and intestine in individuals suffer-ing from atrophic gastritis may also reduce vitamin B12 absorption. The
14. VITAMIN B12
281
P279-288 3/12/05 17:10 Page 281
VITAMIN AND MINERAL REQUIREMENTS IN HUMAN NUTRITION
282
absence of acid in the stomach is postulated to prevent the release of protein-bound vitamin B12 contained in food but not to interfere with the absorptionof the free vitamin B12 found in fortified foods or supplements. Atrophic gas-tritis does not prevent the reabsorption of biliary vitamin B12 and thereforedoes not result in the negative balance seen in individuals with PA. Nonethe-less, it is agreed that with time, a reduction in the amount of vitamin B12
absorbed from the diet will eventually deplete vitamin B12 stores, resulting inovert deficiency.
When considering recommended nutrient intakes (RNIs) for vitamin B12
for the elderly, it is important to take into account the absorption of vitaminB12 from sources such as fortified foods or supplements as compared withdietary vitamin B12. In the latter instances, it is clear that absorption of intakesof less than 1.5–2.0mg/day is complete—that is, for daily intakes of less than1.5–2.0mg of free vitamin B12, the intrinsic factor-mediated system absorbsthat entire amount. It is probable that this is also true of vitamin B12 in forti-fied foods, although this has not been specifically examined. However,absorption of food-bound vitamin B12 has been reported to vary from 9% to60% depending on the study and the source of the vitamin, which is perhapsrelated to its incomplete release from food (8). This has led many to estimateabsorption as being up to 50% to correct for the bioavailability of vitamin B12
from food.
14.5 Vitamin B12 interaction with folate or folic acidOne of the vitamin B12-dependent enzymes, methionine synthase, functionsin one of the two folate cycles, namely, the methylation cycle (see Chapter15). This cycle is necessary to maintain availability of the methyl donor, S-adenosylmethionine. Interruption of the cycle reduces the level of S-adeno-sylmethionine. This occurs in PA and other causes of vitamin B12 deficiency,producing as a result demyelination of the peripheral nerves and the spinalcolumn, giving rise to the clinical condition called subacute combined degen-eration (1, 2). This neuropathy is one of the main presenting conditions inPA. The other principal presenting condition in PA is a megaloblastic anaemiamorphologically identical to that seen in folate deficiency. Disruption of themethylation cycle also causes a lack of DNA biosynthesis and anaemia.
The methyl trap hypothesis is based on the fact that once the cofactor 5,10-methylenetetrahydrofolate is reduced by its reductase to form 5-methylte-trahydrofolate, the reverse reaction cannot occur. This suggests that the onlyway for the 5-methyltetrahydrofolate to be recycled to tetrahydrofolate, andthus to participate in DNA biosynthesis and cell division, is through thevitamin B12-dependent enzyme methionine synthase. When the activity of this
P279-288 3/12/05 17:10 Page 282
synthase is compromised, as it would be in PA, the cellular folate will becomeprogressively trapped as 5-methyltetrahydrofolate (see Chapter 15, Figure15.2). This will result in a cellular pseudo-folate deficiency where, despiteadequate amounts of folate, anaemia will develop, which is identical to thatseen in true folate deficiency. Clinical symptoms of PA, therefore, includeneuropathy, anaemia, or both. Treatment with vitamin B12, if given intramus-cularly, will reactivate methionine synthase, allowing myelination to restart.The trapped folate will be released and DNA synthesis and generation of redcells will cure the anaemia. Treatment with high concentrations of folic acidwill treat the anaemia but not the neuropathy of PA. It should be stressed thatthe so-called “masking” of the anaemia of PA is generally agreed not to occurat concentrations of folate found in food or at intakes of the synthetic formof folic acid at usual RNI levels of 200 or 400mg/day (1). However, there issome evidence that amounts less than 400mg may cause a haematologicresponse and thus potentially treat the anaemia (9). The masking of theanaemia definitely occurs at high concentrations of folic acid (>1000mg/day).This becomes a concern when considering fortification with synthetic folicacid of a dietary staple such as flour (see Chapter 15).
In humans, the vitamin B12-dependent enzyme methylmalonyl CoAmutase functions both in the metabolism of propionate and certain aminoacids—converting them into succinyl CoA—and in the subsequent metabo-lism of these amino acids via the citric acid cycle. It is clear that in vitaminB12 deficiency the activity of the mutase is compromised, resulting in highplasma or urine concentrations of methylmalonic acid (MMA), a degradationproduct of methylmalonyl CoA mutase. In adults, this mutase does notappear to have any vital function, but it clearly has an important role duringembryonic life and in early development. Children deficient in this enzyme,through rare genetic mutations, suffer from mental retardation and otherdevelopmental defects.
14.6 Criteria for assessing vitamin B12 statusTraditionally it was thought that low vitamin B12 status was accompanied bya low serum or plasma vitamin B12 level (4). Recently, Lindenbaum et al. (10)challenged this assumption, by suggesting that a proportion of people withnormal serum and plasma vitamin B12 levels are in fact vitamin B12 deficient.They also suggested that elevation of plasma homocysteine and plasma MMAare more sensitive indicators of vitamin B12 status. Although plasma homo-cysteine can also be elevated because of folate or vitamin B6 deficiency, elevation of MMA apparently always occurs with poor vitamin B12 status.However, there may be other reasons why MMA is elevated, such as renal
14. VITAMIN B12
283
P279-288 3/12/05 17:10 Page 283
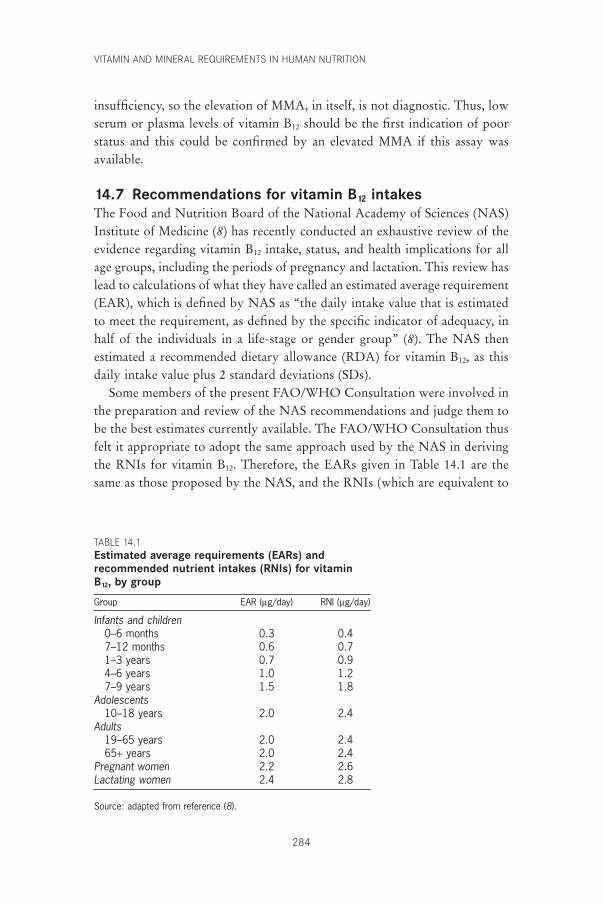
VITAMIN AND MINERAL REQUIREMENTS IN HUMAN NUTRITION
284
insufficiency, so the elevation of MMA, in itself, is not diagnostic. Thus, lowserum or plasma levels of vitamin B12 should be the first indication of poorstatus and this could be confirmed by an elevated MMA if this assay was available.
14.7 Recommendations for vitamin B12 intakesThe Food and Nutrition Board of the National Academy of Sciences (NAS)Institute of Medicine (8) has recently conducted an exhaustive review of theevidence regarding vitamin B12 intake, status, and health implications for allage groups, including the periods of pregnancy and lactation. This review haslead to calculations of what they have called an estimated average requirement(EAR), which is defined by NAS as “the daily intake value that is estimatedto meet the requirement, as defined by the specific indicator of adequacy, inhalf of the individuals in a life-stage or gender group” (8). The NAS then estimated a recommended dietary allowance (RDA) for vitamin B12, as thisdaily intake value plus 2 standard deviations (SDs).
Some members of the present FAO/WHO Consultation were involved inthe preparation and review of the NAS recommendations and judge them tobe the best estimates currently available. The FAO/WHO Consultation thusfelt it appropriate to adopt the same approach used by the NAS in derivingthe RNIs for vitamin B12. Therefore, the EARs given in Table 14.1 are thesame as those proposed by the NAS, and the RNIs (which are equivalent to
TABLE 14.1Estimated average requirements (EARs) andrecommended nutrient intakes (RNIs) for vitaminB12, by group
Group EAR (mg/day) RNI (mg/day)
Infants and children0–6 months 0.3 0.47–12 months 0.6 0.71–3 years 0.7 0.94–6 years 1.0 1.27–9 years 1.5 1.8
Adolescents10–18 years 2.0 2.4
Adults19–65 years 2.0 2.465+ years 2.0 2.4
Pregnant women 2.2 2.6Lactating women 2.4 2.8
Source: adapted from reference (8).
P279-288 3/12/05 17:10 Page 284
the RDAs used by the NAS) calculated as the EAR plus 2 SD. Supportingevidence for the recommendations for each age group is summarized below.
14.7.1 InfantsAs with other nutrients, the principal way to determine requirements ofinfants is to examine the levels in milk from mothers on adequate diets. Thereis a wide difference in the vitamin B12 values reported in human milk becauseof differences in methodology. The previous FAO/WHO Expert Consulta-tion (11) based their recommendations on milk vitamin B12 values of normalwomen of about 0.4mg/l. For an average milk production of 0.75 l/day, thevitamin B12 intake by infants would be 0.3mg/day (12). Other studies havereported concentrations of vitamin B12 in human milk in the range 0.4–0.8mg/l(13–17). Although daily intakes ranging from 0.02 to 0.05mg/day have beenfound to prevent deficiency (18, 19), these intakes are totally inadequate forlong-term health. Thus, based on the assumption that human milk containsenough vitamin B12 for optimum health, an EAR between 0.3 and 0.6mg/dayseems reasonable giving an RNI of between 0.4 and 0.7mg/day. It would seemappropriate to use the lower RNI figure of 0.4mg/day for infants aged 0–6months and the higher RNI figure of 0.7mg/day for infants aged 7–12 months(Table 14.1).
14.7.2 ChildrenThe Food and Nutrition Board of the NAS Institute of Medicine (8) sug-gested the same intakes for adolescents as those for adults (see section 14.7.3)with progressive reduction of intake for younger groups.
14.7.3 AdultsSeveral lines of evidence point to an adult average requirement of about 2.0mg/day. The amount of intramuscular vitamin B12 needed to maintain remission in people with PA suggests a requirement of about 1.5mg/day (10),but they would also be losing 0.3–0.5mg/day through interruption of theirenterohepatic circulation. This might suggest a requirement of 0.7–1.0mg/dayfor those without PA. Because vitamin B12 is not completely absorbed fromfood, an adjustment of 50% has to be added, giving a range of 1.4–2.0mg/day(4). Therapeutic response to dietary vitamin B12 suggests a minimum requirement of something less than 1.0mg/day (8), which again suggests arequirement of 2.0mg/day, allowing for the conservative correction that only half of dietary vitamin B12 is absorbed (8). Diets containing 1.8mg/dayseemed to maintain adequate status but intakes lower than this resulted insubjects showing some signs of deficiency (8). Furthermore, dietary intakes
14. VITAMIN B12
285
P279-288 3/12/05 17:10 Page 285
VITAMIN AND MINERAL REQUIREMENTS IN HUMAN NUTRITION
286
of less than 1.5mg/day were reported to be inadequate in some subjects (20).
In summary, the average requirement could be said to be 2mg/day (8). Assuming the variability of the requirements for vitamin B12 is accounted for by adding 2 SDs, the RNI for adults and the elderly becomes 2.4mg/day.
14.7.4 Pregnant womenThe previous FAO/WHO Expert Consultation (11) estimated that 0.1–0.2mg/day of vitamin B12 is transferred to the fetus during the last two trimesters of pregnancy. On the basis of fetal liver content from postmortem samples (21–23), there is further evidence that the fetus accumulates, on average, 0.1–0.2mg/day of vitamin B12 during pregnancies of women with diets which provide adequate levels of vitamin B12. It has been reported that children born to vegetarians or other women with a low vitamin B12 intake subsequently develop signs of clinical vitamin B12
deficiency such as neuropathy (13). Therefore, in order to derive an EAR for pregnant women, 0.2mg/day of vitamin B12 was added to the EAR foradults, to give an EAR of 2.2mg/day and a RNI of 2.6mg/day during pregnancy.
14.7.5 Lactating womenIt is estimated that 0.4mg/day of vitamin B12 is found in the human milk ofwomen with adequate vitamin B12 status (8). Therefore, an extra 0.4mg/day ofvitamin B12 is needed during lactation in addition to the normal adult require-ment of 2.0mg/day, giving a total EAR of 2.4mg/day and a RNI of 2.8mg/dayduring lactation.
14.8 Upper limitsThe absorption of vitamin B12 mediated by the glycoprotein, intrinsic factor, is limited to 1.5–2.0mg per meal because of the limited capacity of thereceptors. In addition, between 1% and 3% of any particular oral adminis-tration of vitamin B12 is absorbed by passive diffusion. Thus, if 1000mgvitamin B12 (sometimes used to treat those with PA) is taken orally, theamount absorbed would be 2.0mg by active absorption plus up to about 30mg by passive diffusion. Intake of 1000mg vitamin B12 has never been reportedto have any side-effects (8). Similar large amounts have been used in somepreparations of nutritional supplements without apparent ill effects. However,there are no established benefits for such amounts. Such high intakes thus rep-resent no benefit in those without malabsorption and should probably beavoided.
P279-288 3/12/05 17:10 Page 286
14.9 Recommendations for future researchBecause they do not consume any animal products, vegans are at risk ofvitamin B12 deficiency. It is generally agreed that in some communities theonly source of vitamin B12 is from contamination of food by microorganisms.When vegans move to countries where standards of hygiene are more strin-gent, there is good evidence that risk of vitamin B12 deficiency increases inadults and, particularly, in children born to and breastfed by women who arestrict vegans.
As standards of hygiene improve in developing countries, there is a concernthat the prevalence of vitamin B12 deficiency might increase. This should beascertained by estimating plasma vitamin B12 levels, preferably in conjunctionwith plasma MMA levels in representative adult populations and in infants.
Further research needs include the following:
• ascertaining the contribution that fermented vegetable foods make to thevitamin B12 status of vegan communities;
• investigating the prevalence of atrophic gastritis in developing countries todetermine its extent in exacerbating vitamin B12 deficiency.
References1. Weir DG, Scott JM. Cobalamins physiology, dietary sources and require-
ments. In: Sadler M, Strain JJ, Caballero B, eds. Encyclopedia of human nutri-tion. Volume 1. San Diego, CA, Academic Press, 1998:394–401.
2. Weir DG, Scott JM. Vitamin B12. In: Shils ME et al., eds. Modern nutrition inhealth and disease. Baltimore, MA, Williams & Wilkins, 1999:447–458.
3. Scott JM, Weir DG. Folate/vitamin B12 interrelationships. Essays in Biochemistry, 1994, 28:63–72.
4. Chanarin I. The megaloblastic anaemias, 2nd ed. Oxford, Blackwell ScientificPublications, 1979.
5. Smith RM. Cobalt. In: Mertz W, ed. Trace elements in human and animalnutrition, 5th ed. San Diego, CA, Academic Press, 1987:143–184.
6. van den Berg H, Dagnelie PC, van Staveren WA. Vitamin B12 and seaweed.Lancet, 1988, 1:242–243.
7. Carmel R. Prevalence of undiagnosed pernicious anaemia in the elderly.Archives of Internal Medicine, 1996, 156:1097–1100.
8. Food and Nutrition Board. Dietary reference intakes for thiamin, riboflavin,niacin, vitamin B6, folate, vitamin B12, pantothenic acid, biotin, and choline.Washington, DC, National Academy Press, 1998.
9. Savage DG, Lindenbaum J. Neurological complications of acquired cobalamindeficiency: clinical aspects. In: Wickramasinghe SM, ed. Bailliere’s clinicalhaematology: megaloblastic anaemia. London, Bailliere Tindall, 1995,8:657–678.
10. Lindenbaum J et al. Diagnosis of cobalamin deficiency. II. Relative sensitivi-ties of serum cobalamin, methylmalonic acid, and total homocysteine con-centrations. American Journal of Hematology, 1990, 34:99–107.
11. Requirements of vitamin A, iron, folate and vitamin B12. Report of a Joint
14. VITAMIN B12
287
P279-288 3/12/05 17:10 Page 287
VITAMIN AND MINERAL REQUIREMENTS IN HUMAN NUTRITION
288
FAO/WHO Expert Consultation. Rome, Food and Agriculture Organizationof the United Nations, 1988 (FAO Food and Nutrition Series, No. 23).
12. Collins RA et al. The folic acid and vitamin B12 content of the milk of variousspecies. Journal of Nutrition, 1951, 43:313–321.
13. Specker BL et al. Vitamin B-12: low milk concentrations are related to lowserum concentrations in vegetarian women and to methylmalonic aciduria intheir infants. American Journal of Clinical Nutrition, 1990, 52:1073–1076.
14. Donangelo CM et al. Iron, zinc, folate and vitamin B12 nutritional status andmilk composition of low-income Brazilian mothers. European Journal of Clinical Nutrition, 1989, 43:253–266.
15. Dagnelie PC et al. Nutrients and contaminants in human milk from motherson macrobiotic and omnivorous diets. European Journal of Clinical Nutrition,1992, 46:355–366.
16. Trugo NM, Sardinha F. Cobalamin and cobalamin-binding capacity in humanmilk. Nutrition Research, 1994, 14:22–33.
17. Ford C et al. Vitamin B12 levels in human milk during the first nine monthsof lactation. International Journal of Vitamin and Nutrition Research, 1996,66:329–331.
18. Srikantia SG, Reddy V. Megaloblastic anaemia of infancy and vitamin B12.British Journal of Haematology, 1967, 13:949–953.
19. Roberts PD et al. Vitamin B12 status in pregnancy among immigrants toBritain. British Medical Journal, 1973, 3:67–72.
20. Narayanan MM, Dawson DW, Lewis MJ. Dietary deficiency of vitamin B12 inassociation with low serum cobalamin levels in non-vegetarians. EuropeanJournal of Haematology, 1991, 47:115–118.
21. Baker SJ et al. Vitamin B12 deficiency in pregnancy and the puerperium. BritishMedical Journal, 1962, 1:1658–1661.
22. Loria A et al. Nutritional anemia. VI. Fetal hepatic storage of metabolites inthe second half of pregnancy. Journal of Pediatrics, 1977, 91:569–573.
23. Vaz Pinto A et al. Folic acid and vitamin B12 determination in fetal liver. American Journal of Clinical Nutrition, 1975, 28:1085–1086.
P279-288 3/12/05 17:10 Page 288
15. Folate and folic acid
289
15.1 Role of folate and folic acid in human metabolicprocesses
Folates accept one-carbon units from donor molecules and pass them on via various biosynthetic reactions (1). In their reduced form cellular folatesfunction conjugated to a polyglutamate chain. These folates are a mixture ofunsubstituted polyglutamyl tetrahydrofolates and various substituted one-carbon forms of tetrahydrofolate (e.g. 10-formyl-, 5,10-methylene-, and 5-methyl-tetrahydrofolate) (Figure 15.1). The reduced forms of the vitamin,particularly the unsubstituted dihydro and tetrahydro forms, are unstablechemically. They are easily split between the C-9 and N-10 bond to yield asubstituted pteridine and p-aminobenzoylglutamate, which have no biologicactivity (2). Substituting a carbon group at N-5 or N-10 decreases the ten-dency of the molecule to split; however, the substituted forms are also sus-ceptible to oxidative chemical rearrangements and, consequently, loss ofactivity (2). The folates found in food consist of a mixture of reduced folatepolyglutamates.
The chemical lability of all naturally-occurring folates results in a signifi-cant loss of biochemical activity during harvesting, storage, processing, andpreparation. Half or even three quarters of initial folate activity may be lostduring these processes. Although natural folates rapidly lose activity in foodsover periods of days or weeks, the synthetic form of this vitamin, folic acid,(e.g. in fortified foods) is almost completely stable for months or even years(2). In this form, the pteridine (2-amino-4-hydroxypteridine) ring is notreduced (Figure 15.1), rendering it very resistant to chemical oxidation.However, folic acid is reduced in cells by the enzyme dihydrofolate reductaseto the dihydro and tetrahydro forms (Figure 15.2). This takes place within theintestinal mucosal cells, and 5-methyltetrahydrofolate is released into theplasma.
Natural folates found in foods are all conjugated to a polyglutamyl chaincontaining different numbers of glutamic acids depending on the type of food.This polyglutamyl chain is removed in the brush border of the mucosal cells
P289-302 3/12/05 17:10 Page 289
290
CC
C
N
CN
CH
C
CH3
N
H
Folic acid
CO
NN
H
CC
C
N
CHN
C
C
CH3
N
5,10-Methylenetetrahydrofolate
CO Glutamate
Glutamate
Glutamate
Glutamate
Glutamate
NNH
H
H
CC
C
N
CHN
C
C
CH3
N
H
Tetrahydrofolate
CO
NNH
H
H
H
CC
C
N
CHN
C
C
CH3
N
CHO10-Formyltetrahydrofolate
CO
NNH
H
H
CC
C
N
CHN
NH2
NH2
NH2
NH2
NH2
C
CH2
CH2
CH2
CH2
CH2
CH2
C
CH3
N
H
5-Methyltetrahydrofolate
CO
NNH
H
H
CH3
FIGURE 15.1The chemical formula of folic acid (synthetic form) and the most important naturalfolates (in cells and thus in food the latter are conjugated to a polyglutamate tail)
P289-302 3/12/05 17:10 Page 290
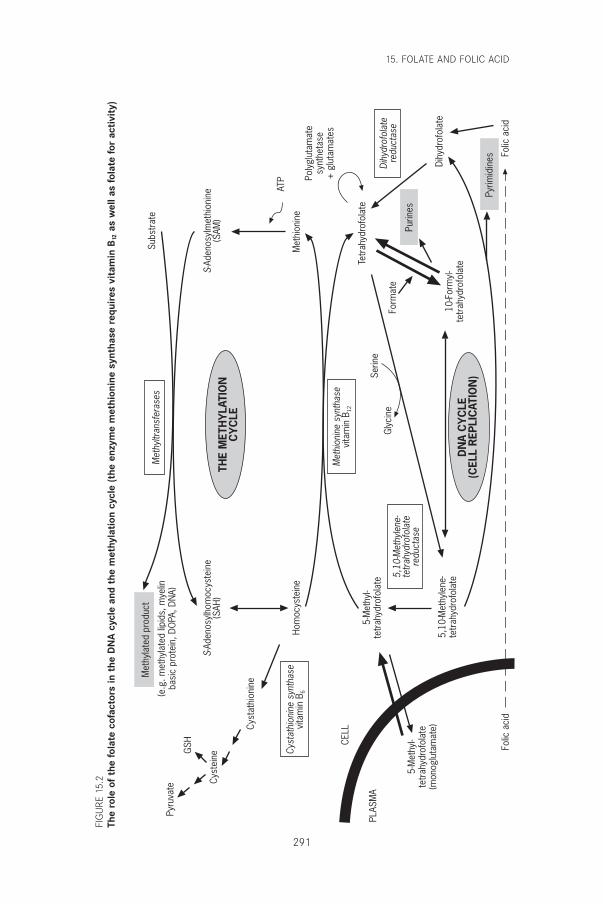
15. FOLATE AND FOLIC ACID
291
Met
hion
ine
synt
hase
vita
min
B12
Met
hyltr
ansf
eras
es
Cyst
athi
onin
e sy
ntha
sevi
tam
in B
6
5,10
-Met
hyle
ne-
tetr
ahyd
rofo
late
redu
ctas
e
Dihy
drof
olat
ere
duct
ase
THE
MET
HY
LATI
ON
CY
CLE
DN
A C
YC
LE(C
ELL
REP
LIC
ATIO
N)
Met
hyla
ted
prod
uct
(e.g
. met
hyla
ted
lipid
s, m
yelin
basi
c pr
otei
n, D
OPA
, DN
A)
Purin
es
Pyrim
idin
es Folic
aci
dFo
lic a
cid
CELL
PLAS
MA
5-M
ethy
l-te
trah
ydro
fola
te(m
onog
luta
mat
e)
5-M
ethy
l-te
trah
ydro
fola
te
5,10
-Met
hyle
ne-
tetr
ahyd
rofo
late
Tetr
ahyd
rofo
late
10-F
orm
yl-
tetr
ahyd
rofo
late
Form
ate
Serin
eG
lyci
ne
Dihy
drof
olat
e
Met
hion
ine
Poly
glut
amat
esy
nthe
tase
+ g
luta
mat
es
ATP
Hom
ocys
tein
e
S-Ad
enos
ylho
moc
yste
ine
(SAH
)S-
Aden
osyl
met
hion
ine
(SAM
)
Cyst
athi
onin
e
Cyst
eine
GSH
Pyru
vate
Subs
trat
e
FIG
URE
15.2
The
role
of
the
fola
te c
ofac
tors
in t
he D
NA
cyc
le a
nd t
he m
ethy
lati
on c
ycle
(the
enz
yme
met
hion
ine
synt
hase
req
uire
s vi
tam
in B
12as
wel
l as
fola
te fo
r ac
tivi
ty)
P289-302 3/12/05 17:10 Page 291
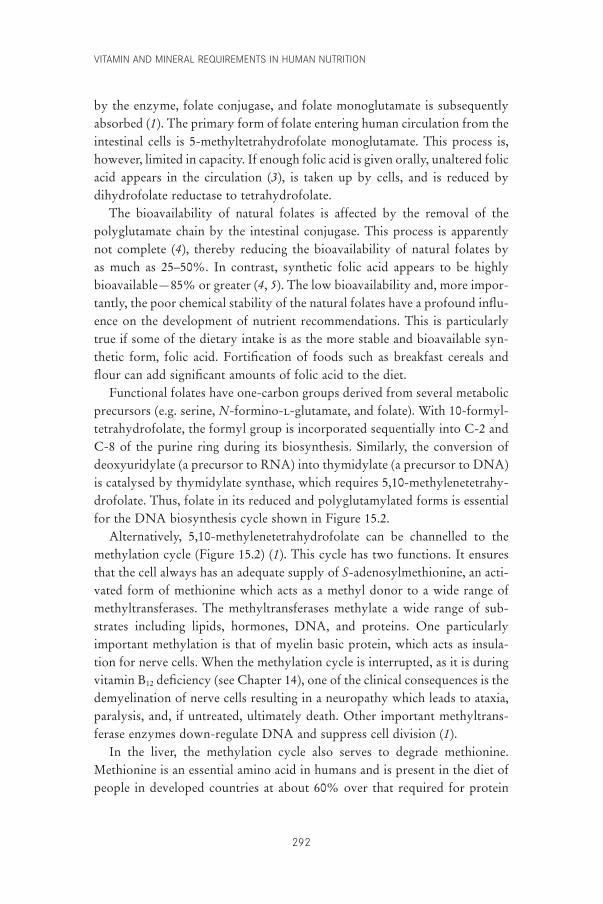
VITAMIN AND MINERAL REQUIREMENTS IN HUMAN NUTRITION
292
by the enzyme, folate conjugase, and folate monoglutamate is subsequentlyabsorbed (1). The primary form of folate entering human circulation from theintestinal cells is 5-methyltetrahydrofolate monoglutamate. This process is,however, limited in capacity. If enough folic acid is given orally, unaltered folicacid appears in the circulation (3), is taken up by cells, and is reduced by dihydrofolate reductase to tetrahydrofolate.
The bioavailability of natural folates is affected by the removal of thepolyglutamate chain by the intestinal conjugase. This process is apparentlynot complete (4), thereby reducing the bioavailability of natural folates by as much as 25–50%. In contrast, synthetic folic acid appears to be highlybioavailable—85% or greater (4, 5). The low bioavailability and, more impor-tantly, the poor chemical stability of the natural folates have a profound influ-ence on the development of nutrient recommendations. This is particularlytrue if some of the dietary intake is as the more stable and bioavailable syn-thetic form, folic acid. Fortification of foods such as breakfast cereals andflour can add significant amounts of folic acid to the diet.
Functional folates have one-carbon groups derived from several metabolicprecursors (e.g. serine, N-formino-l-glutamate, and folate). With 10-formyl-tetrahydrofolate, the formyl group is incorporated sequentially into C-2 andC-8 of the purine ring during its biosynthesis. Similarly, the conversion ofdeoxyuridylate (a precursor to RNA) into thymidylate (a precursor to DNA)is catalysed by thymidylate synthase, which requires 5,10-methylenetetrahy-drofolate. Thus, folate in its reduced and polyglutamylated forms is essentialfor the DNA biosynthesis cycle shown in Figure 15.2.
Alternatively, 5,10-methylenetetrahydrofolate can be channelled to themethylation cycle (Figure 15.2) (1). This cycle has two functions. It ensuresthat the cell always has an adequate supply of S-adenosylmethionine, an acti-vated form of methionine which acts as a methyl donor to a wide range ofmethyltransferases. The methyltransferases methylate a wide range of sub-strates including lipids, hormones, DNA, and proteins. One particularlyimportant methylation is that of myelin basic protein, which acts as insula-tion for nerve cells. When the methylation cycle is interrupted, as it is duringvitamin B12 deficiency (see Chapter 14), one of the clinical consequences is thedemyelination of nerve cells resulting in a neuropathy which leads to ataxia,paralysis, and, if untreated, ultimately death. Other important methyltrans-ferase enzymes down-regulate DNA and suppress cell division (1).
In the liver, the methylation cycle also serves to degrade methionine.Methionine is an essential amino acid in humans and is present in the diet ofpeople in developed countries at about 60% over that required for protein
P289-302 3/12/05 17:10 Page 292
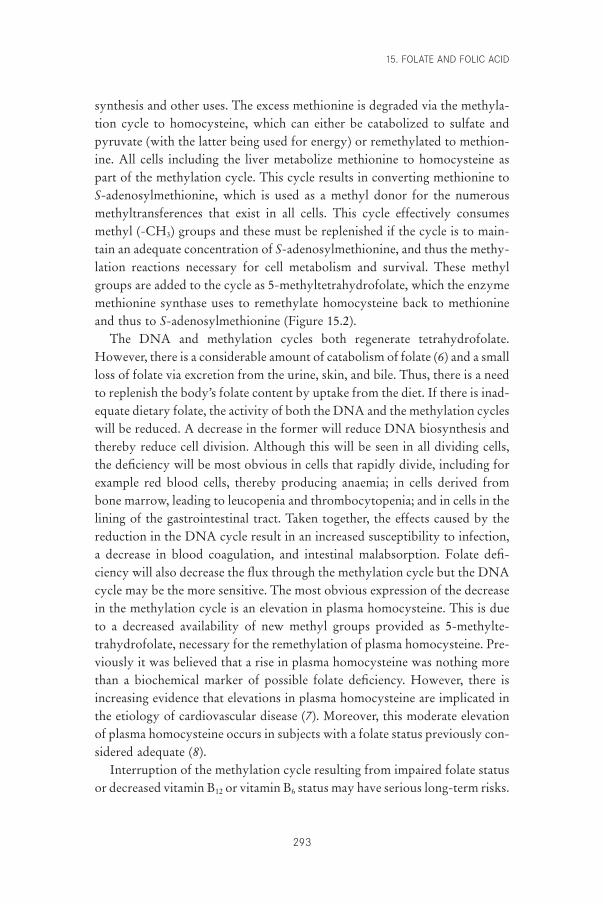
synthesis and other uses. The excess methionine is degraded via the methyla-tion cycle to homocysteine, which can either be catabolized to sulfate andpyruvate (with the latter being used for energy) or remethylated to methion-ine. All cells including the liver metabolize methionine to homocysteine aspart of the methylation cycle. This cycle results in converting methionine toS-adenosylmethionine, which is used as a methyl donor for the numerousmethyltransferences that exist in all cells. This cycle effectively consumesmethyl (-CH3) groups and these must be replenished if the cycle is to main-tain an adequate concentration of S-adenosylmethionine, and thus the methy-lation reactions necessary for cell metabolism and survival. These methylgroups are added to the cycle as 5-methyltetrahydrofolate, which the enzymemethionine synthase uses to remethylate homocysteine back to methionineand thus to S-adenosylmethionine (Figure 15.2).
The DNA and methylation cycles both regenerate tetrahydrofolate.However, there is a considerable amount of catabolism of folate (6) and a smallloss of folate via excretion from the urine, skin, and bile. Thus, there is a needto replenish the body’s folate content by uptake from the diet. If there is inad-equate dietary folate, the activity of both the DNA and the methylation cycleswill be reduced. A decrease in the former will reduce DNA biosynthesis andthereby reduce cell division. Although this will be seen in all dividing cells,the deficiency will be most obvious in cells that rapidly divide, including forexample red blood cells, thereby producing anaemia; in cells derived frombone marrow, leading to leucopenia and thrombocytopenia; and in cells in thelining of the gastrointestinal tract. Taken together, the effects caused by thereduction in the DNA cycle result in an increased susceptibility to infection,a decrease in blood coagulation, and intestinal malabsorption. Folate defi-ciency will also decrease the flux through the methylation cycle but the DNAcycle may be the more sensitive. The most obvious expression of the decreasein the methylation cycle is an elevation in plasma homocysteine. This is dueto a decreased availability of new methyl groups provided as 5-methylte-trahydrofolate, necessary for the remethylation of plasma homocysteine. Pre-viously it was believed that a rise in plasma homocysteine was nothing morethan a biochemical marker of possible folate deficiency. However, there isincreasing evidence that elevations in plasma homocysteine are implicated inthe etiology of cardiovascular disease (7). Moreover, this moderate elevationof plasma homocysteine occurs in subjects with a folate status previously con-sidered adequate (8).
Interruption of the methylation cycle resulting from impaired folate statusor decreased vitamin B12 or vitamin B6 status may have serious long-term risks.
15. FOLATE AND FOLIC ACID
293
P289-302 3/12/05 17:10 Page 293
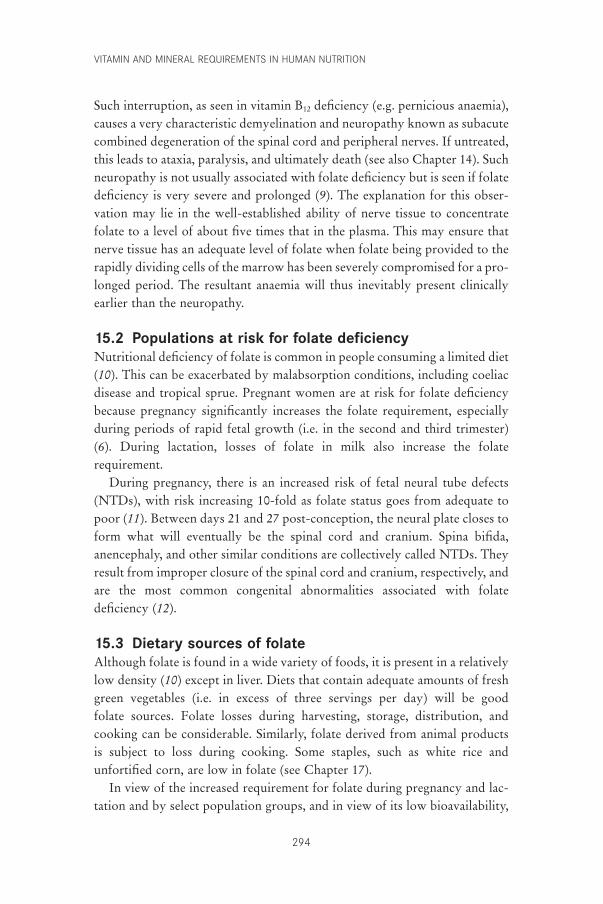
VITAMIN AND MINERAL REQUIREMENTS IN HUMAN NUTRITION
294
Such interruption, as seen in vitamin B12 deficiency (e.g. pernicious anaemia),causes a very characteristic demyelination and neuropathy known as subacutecombined degeneration of the spinal cord and peripheral nerves. If untreated,this leads to ataxia, paralysis, and ultimately death (see also Chapter 14). Suchneuropathy is not usually associated with folate deficiency but is seen if folatedeficiency is very severe and prolonged (9). The explanation for this obser-vation may lie in the well-established ability of nerve tissue to concentratefolate to a level of about five times that in the plasma. This may ensure thatnerve tissue has an adequate level of folate when folate being provided to therapidly dividing cells of the marrow has been severely compromised for a pro-longed period. The resultant anaemia will thus inevitably present clinicallyearlier than the neuropathy.
15.2 Populations at risk for folate deficiencyNutritional deficiency of folate is common in people consuming a limited diet(10). This can be exacerbated by malabsorption conditions, including coeliacdisease and tropical sprue. Pregnant women are at risk for folate deficiencybecause pregnancy significantly increases the folate requirement, especiallyduring periods of rapid fetal growth (i.e. in the second and third trimester)(6). During lactation, losses of folate in milk also increase the folate requirement.
During pregnancy, there is an increased risk of fetal neural tube defects(NTDs), with risk increasing 10-fold as folate status goes from adequate topoor (11). Between days 21 and 27 post-conception, the neural plate closes toform what will eventually be the spinal cord and cranium. Spina bifida, anencephaly, and other similar conditions are collectively called NTDs. Theyresult from improper closure of the spinal cord and cranium, respectively, andare the most common congenital abnormalities associated with folate deficiency (12).
15.3 Dietary sources of folateAlthough folate is found in a wide variety of foods, it is present in a relativelylow density (10) except in liver. Diets that contain adequate amounts of freshgreen vegetables (i.e. in excess of three servings per day) will be good folate sources. Folate losses during harvesting, storage, distribution, andcooking can be considerable. Similarly, folate derived from animal productsis subject to loss during cooking. Some staples, such as white rice and unfortified corn, are low in folate (see Chapter 17).
In view of the increased requirement for folate during pregnancy and lac-tation and by select population groups, and in view of its low bioavailability,
P289-302 3/12/05 17:10 Page 294
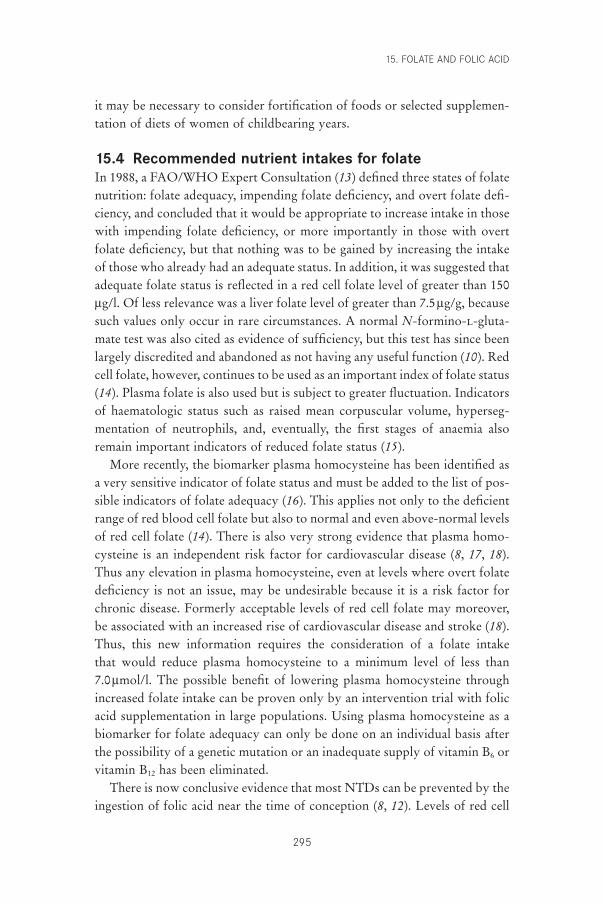
it may be necessary to consider fortification of foods or selected supplemen-tation of diets of women of childbearing years.
15.4 Recommended nutrient intakes for folateIn 1988, a FAO/WHO Expert Consultation (13) defined three states of folatenutrition: folate adequacy, impending folate deficiency, and overt folate defi-ciency, and concluded that it would be appropriate to increase intake in thosewith impending folate deficiency, or more importantly in those with overtfolate deficiency, but that nothing was to be gained by increasing the intakeof those who already had an adequate status. In addition, it was suggested thatadequate folate status is reflected in a red cell folate level of greater than 150mg/l. Of less relevance was a liver folate level of greater than 7.5mg/g, becausesuch values only occur in rare circumstances. A normal N-formino-l-gluta-mate test was also cited as evidence of sufficiency, but this test has since beenlargely discredited and abandoned as not having any useful function (10). Redcell folate, however, continues to be used as an important index of folate status(14). Plasma folate is also used but is subject to greater fluctuation. Indicatorsof haematologic status such as raised mean corpuscular volume, hyperseg-mentation of neutrophils, and, eventually, the first stages of anaemia alsoremain important indicators of reduced folate status (15).
More recently, the biomarker plasma homocysteine has been identified asa very sensitive indicator of folate status and must be added to the list of pos-sible indicators of folate adequacy (16). This applies not only to the deficientrange of red blood cell folate but also to normal and even above-normal levelsof red cell folate (14). There is also very strong evidence that plasma homo-cysteine is an independent risk factor for cardiovascular disease (8, 17, 18).Thus any elevation in plasma homocysteine, even at levels where overt folatedeficiency is not an issue, may be undesirable because it is a risk factor forchronic disease. Formerly acceptable levels of red cell folate may moreover,be associated with an increased rise of cardiovascular disease and stroke (18).Thus, this new information requires the consideration of a folate intake that would reduce plasma homocysteine to a minimum level of less than 7.0mmol/l. The possible benefit of lowering plasma homocysteine throughincreased folate intake can be proven only by an intervention trial with folicacid supplementation in large populations. Using plasma homocysteine as abiomarker for folate adequacy can only be done on an individual basis afterthe possibility of a genetic mutation or an inadequate supply of vitamin B6 orvitamin B12 has been eliminated.
There is now conclusive evidence that most NTDs can be prevented by theingestion of folic acid near the time of conception (8, 12). Levels of red cell
15. FOLATE AND FOLIC ACID
295
P289-302 3/12/05 17:10 Page 295
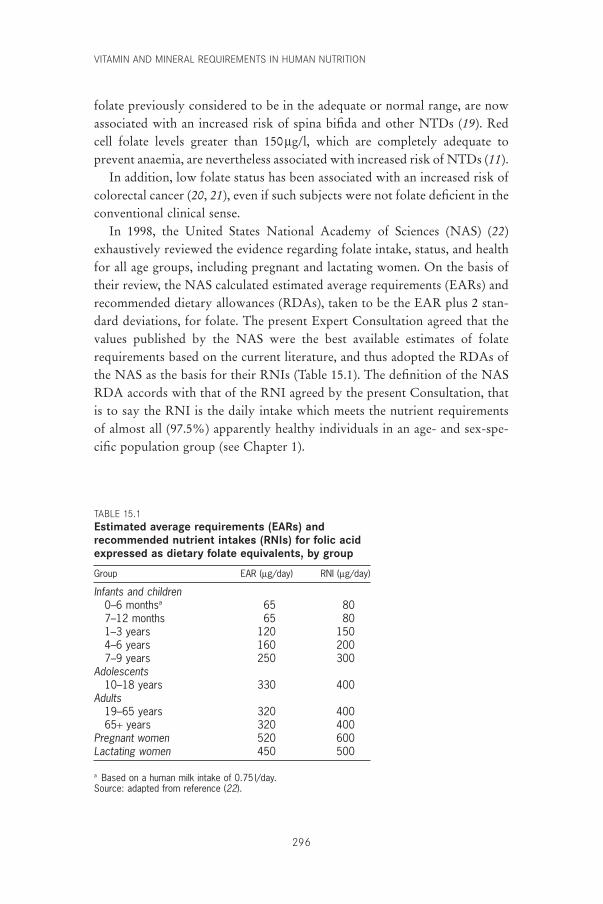
VITAMIN AND MINERAL REQUIREMENTS IN HUMAN NUTRITION
296
folate previously considered to be in the adequate or normal range, are nowassociated with an increased risk of spina bifida and other NTDs (19). Redcell folate levels greater than 150mg/l, which are completely adequate toprevent anaemia, are nevertheless associated with increased risk of NTDs (11).
In addition, low folate status has been associated with an increased risk ofcolorectal cancer (20, 21), even if such subjects were not folate deficient in theconventional clinical sense.
In 1998, the United States National Academy of Sciences (NAS) (22)exhaustively reviewed the evidence regarding folate intake, status, and healthfor all age groups, including pregnant and lactating women. On the basis oftheir review, the NAS calculated estimated average requirements (EARs) andrecommended dietary allowances (RDAs), taken to be the EAR plus 2 stan-dard deviations, for folate. The present Expert Consultation agreed that thevalues published by the NAS were the best available estimates of folaterequirements based on the current literature, and thus adopted the RDAs ofthe NAS as the basis for their RNIs (Table 15.1). The definition of the NASRDA accords with that of the RNI agreed by the present Consultation, thatis to say the RNI is the daily intake which meets the nutrient requirementsof almost all (97.5%) apparently healthy individuals in an age- and sex-spe-cific population group (see Chapter 1).
TABLE 15.1Estimated average requirements (EARs) andrecommended nutrient intakes (RNIs) for folic acidexpressed as dietary folate equivalents, by group
Group EAR (mg/day) RNI (mg/day)
Infants and children0–6 monthsa 65 807–12 months 65 801–3 years 120 1504–6 years 160 2007–9 years 250 300
Adolescents10–18 years 330 400
Adults19–65 years 320 40065+ years 320 400
Pregnant women 520 600Lactating women 450 500
a Based on a human milk intake of 0.75 l/day.Source: adapted from reference (22).
P289-302 3/12/05 17:10 Page 296
15.5 Differences in bioavailability of folic acid and food folate: implications for the recommended intakes
The RNIs suggested for groups in Table 15.1 assume that food folate is thesole source of dietary folate because most societies in developing countriesconsume folate from naturally-occurring sources. As discussed in the intro-duction (section 15.1), natural folates are found in a conjugated form in food,which reduces their bioavailability by perhaps as much as 50% (4). In addi-tion, natural folates are much less stable. If chemically pure folic acid (pteroyl-monoglutamate) is used to provide part of the RNI, by way of fortificationor supplementation, the total dietary folate, which contains conjugated forms(pteroylpolyglutamates), could be reduced by an appropriate amount.
The recommended daily intake of naturally-occurring mixed forms of folatein the diet for adults is 400mg/day. If for example 100mg is consumed as purefolic acid, on the basis of the assumption that, on average, the conjugated folatein natural foods is only half as available as synthetic folic acid this would beconsidered to be equivalent to 200mg of dietary mixed folate. Hence, only anadditional 200mg of dietary folate would be needed to meet the adult RNI.
The Consultation agreed with the following findings of the Food andNutrition Board of the United States NAS (22):
Since folic acid taken with food is 85% bioavailable but food folate isonly about 50% bioavailable, folic acid taken with food is 85/50 (i.e. 1.7)times more available. Thus, if a mixture of synthetic folic acid plus foodfolate has been fed, dietary folate equivalents (DFEs) are calculated asfollows to determine the EAR:
mg of DFE provided = [mg of food folate + (1.7 ¥ mg of synthetic folicacid)].
To be comparable to food folate, only half as much folic acid is needed iftaken on an empty stomach, i.e. 1mg of DFE = 1mg of food folate = 0.5mgof folic acid taken on an empty stomach = 0.6mg of folic acid with meals.
The experts from the NAS went on to say that the required estimates for thedietary folate equivalents could be lowered if future research indicates thatfood folate is more than 50% bioavailable (22).
15.6 Considerations in viewing recommended intakes forfolate
15.6.1 Neural tube defectsIt is now agreed that a supplement of 400mg of folic acid taken near the timeof conception will prevent most NTDs (23, 24). The recommendation to
15. FOLATE AND FOLIC ACID
297
P289-302 3/12/05 17:10 Page 297
VITAMIN AND MINERAL REQUIREMENTS IN HUMAN NUTRITION
298
prevent recurrence in women with a previous NTD birth remains 4.0mg/daybecause of the high increase in risk in such cases and because that was theamount used in the most definitive trial (25). Because of the poorer bioavail-ability and stability of food folate, a diet based on food folate will not beoptimum in the prevention of NTDs. One study determined that risk of NTDis 10-fold higher in people with poor folate status than in those with highnormal folate status, as reflected by a red cell folate level greater than 400mg/l(11). A further study suggests that an extra 200mg/day or possibly 100mg/day,if taken habitually in fortified food, would prevent most, if not all, folate-preventable NTDs (26). Ideally, an extra 400mg/day should be providedbecause this is the amount used in various intervention trials (12) and that canbe achieved by supplementation. This amount could not be introduced byway of fortification because exposure to high intakes of folic acid by peopleconsuming a large intake of flour would run the risk of preventing the diag-nosis of pernicious anaemia in the elderly. It is likely that depending on thestaple chosen it would be possible to increase intake in most women by 100mg/day without exposing other groups to an amount that might mask diseasessuch as pernicious anaemia. It is suggested that this amount, although notoptimal, will prevent most NTDs.
15.6.2 Cardiovascular diseasePlasma homocysteine concentration, if only moderately elevated, is an independent risk factor for cardiovascular disease (7, 8, 17) and stroke (18).Increased risk has been associated with values higher than 11mmol/l (8), whichis well within what is generally considered to be the normal range (5–15mmol/l) of plasma homocysteine levels (27). In addition, even in populationsthat are apparently normal and consuming diets adequate in folate, there is arange of elevation of plasma homocysteine (14) that could be lowered by anextra 100 or 200mg/day of folic acid (8, 27). Large-scale intervention trialsregarding the significance of interrelationships among folate levels, plasma homocysteine levels, and cardiovascular disease have not been completed and therefore it would be premature to introduce public health measures inthis area.
15.6.3 Colorectal cancerEvidence suggests a link between colorectal cancer and dietary folate intakeand folate status (20, 21). One study reported that women who take multivitamin supplements containing folic acid for prolonged periods have a significantly reduced risk of colorectal cancer (28). Currently
P289-302 3/12/05 17:10 Page 298
however, the scientific evidence is not sufficiently clear for rec-ommending increased folate intake in populations at risk for colorectal cancer.
15.7 Upper limitsThere is no evidence to suggest that it is possible to consume sufficient naturalfolate to pose a risk of toxicity (22). However, this clearly does not apply tofolic acid given in supplements or fortified foods. The main concern with for-tification of high levels of folic acid is the masking of the diagnosis of perni-cious anaemia, because high levels of folic acid correct the anaemia, allowingthe neuropathy to progress undiagnosed to a point where it may become irre-versible, even upon treatment with vitamin B12 (1, 29). Consumption of large amounts of folic acid might also pose other less well-defined risks. Certainly, consumption of milligram amounts of folic acid would be unde-sirable except in cases of pregnant women with a history of children withNTD. Savage and Lindenbaum (30) suggest that even at levels of the RNIgiven here, there is a decreased opportunity to diagnose pernicious anaemiain subjects.
The United States NAS (22), after reviewing the literature, has suggestedan upper level of 1000mg. Thus, 400mg/day of folic acid, in addition to dietary folate, would seem safe. There is probably no great risk of toxicity at a range of intakes between 400 and 1000mg of folic acid per day, with the exception of some increased difficulty in diagnosing pernicious anaemia.
15.8 Recommendations for future researchThere are many areas for future research, including:
• Folate status may be related to birth weight. Therefore, it is important tostudy the relationship between folate status and birth weight, especially inpopulations where low birth weight is prevalent.
• Folate status probably differs widely in different developing countries. Redcell folate levels are an excellent determinant of status. Such estimates inrepresentative populations would determine whether some communitiesare at risk for folate deficiency.
• Some evidence indicates that elevated plasma homocysteine is a risk factorfor cardiovascular disease and stroke. Elevated plasma homocysteine islargely related to poor folate status, with poor vitamin B6 status, poorvitamin B12 status, or both, also contributing. Having a genetic polymor-
15. FOLATE AND FOLIC ACID
299
P289-302 3/12/05 17:10 Page 299
VITAMIN AND MINERAL REQUIREMENTS IN HUMAN NUTRITION
300
phism, namely the C Æ T 677 variant in the enzyme 5,10-methylenete-trahydrofolate reductase, is also known to significantly increase plasmahomocysteine (31). The prevalence of elevated plasma homocysteine andits relationship to cardiovascular disease should be established in differentdeveloping countries.
• The relationship between folate deficiency and the incidence of NTDs indeveloping countries needs further investigation.
• More data should be generated on the bioavailability of natural folate fromdiets consumed in developing countries.
• Because the absorption of folate may be more efficient in humans withfolate deficiency, folate absorption in these populations requires additionalresearch.
• Quantification of the folate content of foods typically consumed in developing countries should be established for the different regions of theworld.
References1. Scott JM, Weir DG. Folate/vitamin B12 interrelationships. Essays in Biochem-
istry, 1994, 28:63–72.2. Blakley R. The biochemistry of folic acid and related pteridines. Amsterdam,
North Holland Publishing Company, 1969.3. Kelly P et al. Unmetabolized folic acid in serum: acute studies in subjects
consuming fortified food and supplements. American Journal of ClinicalNutrition, 1997. 69:1790–1795.
4. Gregory JF. Bioavailability of folate. European Journal of Clinical Nutrition,1997, 51:554–559.
5. Cuskelly CJ, McNulty H, Scott JM. Effect of increasing dietary folate on red-cell folate : implications for prevention of neural tube defects. Lancet,1996, 347:657–659.
6. McPartlin J et al. Accelerated folate breakdown in pregnancy. Lancet, 1993,341:148–149.
7. Scott JM, Weir DG. Homocysteine and cardiovascular disease. QuarterlyJournal of Medicine, 1996, 89:561–563.
8. Wald NJ et al. Homocysteine and ischaemic heart disease: results of a prospec-tive study with implications on prevention. Archives of Internal Medicine,1998, 158:862–867.
9. Manzoor M, Runcie J. Folate-responsive neuropathy: report of 10 cases.British Medical Journal, 1976, 1:1176–1178.
10. Chanarin I. The megaloblastic anaemias, 2nd ed. Oxford, Blackwell ScientificPublications, 1979.
11. Daly LE et al. Folate levels and neural tube defects. Implications for prevention. Journal of the American Medical Association, 1995, 274:1698–1702.
12. Scott JM et al. The role of folate in the prevention of neural tube defects. Proceedings of the Nutrition Society, 1994, 53:631–636.
13. Requirements of vitamin A, iron, folate and vitamin B12. Report of a
P289-302 3/12/05 17:10 Page 300
Joint FAO/WHO Expert Consultation. Rome, Food and Agriculture Organization of the United Nations, 1988 (FAO Food and Nutrition Series,No. 23).
14. Sauberlich H. Folate status in the US population groups. In: Bailey LB, ed. Folate in health and disease. New York, NY, Marcel Dekker,1995:171–194.
15. Lindenbaum J et al. Diagnosis of cobalamin deficiency. II. Relative sensitivities of serum cobalamin, methylmalonic acid, and total homocysteine concentrations. American Journal of Hematology, 1990, 34:99–107.
16. Selhub J et al. Vitamin status and intake as primary determinants of homo-cysteinemia in an elderly population. Journal of the American Medical Association, 1993, 270:2693–2698.
17. Boushey CJ et al. A quantitative assessment of plasma homocysteine as a riskfactor for vascular disease. Journal of the American Medical Association, 1995,274:1049–1057.
18. Perry IJ et al. Prospective study of serum total homocysteine concentrationsand risk of stroke in middle aged British men. Lancet, 1995, 346:1395–1398.
19. Kirke PM et al. Maternal plasma folate and vitamin B12 are independent riskfactors for neural tube defects. Quarterly Journal of Medicine, 1993, 86:703–708.
20. Mason JB. Folate status: effect on carcinogenesis. In: Bailey LB, ed. Folate inhealth and disease. New York, NY, Marcel Dekker, 1995:361–378.
21. Kim YI et al. Colonic mucosal concentrations of folate correlate well withblood measurements of folate in persons with colorectal polyps. AmericanJournal of Clinical Nutrition, 1998, 68:866–872.
22. Food and Nutrition Board. Dietary reference intakes for thiamin, riboflavin,niacin, vitamin B6, folate, vitamin B12, pantothenic acid, biotin, and choline.Washington, DC, National Academy Press, 1998.
23. Department of Health. Folic acid and the prevention of neural tube defects.Report from an Expert Advisory Group. London, Her Majesty’s StationeryOffice, 1992.
24. Centers for Disease Control and Prevention. Recommendations for the use offolic acid to reduce the number of cases of spina bifida and other neural tubedefects. Morbidity and Mortality Weekly Report, 1992, 41:1–7.
25. MRC Vitamin Study Research Group. Prevention of neural tube defects:results of the Medical Research Council Vitamin Study. Lancet, 1991,338:131–137.
26. Daly S et al. Minimum effective dose of folic acid for food fortification toprevent neural tube defects. Lancet, 1997, 350:1666–1669.
27. Refsum H et al. Homocysteine and cardiovascular disease. Annual Review ofMedicine, 1998, 49:31–62.
28. Giovannucci E et al. Multivitamin use, folate and colorectal cancer in women in the Nurses’ Health Study. Annals of Internal Medicine, 1998,129:517–524.
29. Weir DG, Scott JM. Vitamin B12. In: Shils ME et al., eds. Modern nutrition in health and disease. Baltimore, MA, Williams & Wilkins, 1999:447–458.
30. Savage DG, Lindenbaum J. Neurological complications of acquired cobalamindeficiency: clinical aspects. In: Wickramasinghe SM, ed. Bailliere’s clinical
15. FOLATE AND FOLIC ACID
301
P289-302 3/12/05 17:10 Page 301

VITAMIN AND MINERAL REQUIREMENTS IN HUMAN NUTRITION
302
haematology: megaloblastic anaemia. London, Bailliere Tindall, 1995, 8:657–678.
31. Whitehead AS et al. A genetic defect in 5,10-methylenetetrahydrofolate reductase in neural tube defects. Quarterly Journal of Medicine, 1995,88:763–766.
P289-302 3/12/05 17:10 Page 302
303
16. Iodine
16.1 Role of iodine in human metabolic processesAt present, the only physiological role known for iodine in the human bodyis in the synthesis of thyroid hormones by the thyroid gland. Therefore, thedietary requirement of iodine is determined by normal thyroxine (T4) pro-duction by the thyroid gland without stressing the thyroid iodide trappingmechanism or raising thyroid stimulating hormone (TSH) levels.
Iodine from the diet is absorbed throughout the gastrointestinal tract.Dietary iodine is converted into the iodide ion before it is absorbed. Theiodide ion is 100% bioavailable and absorbed totally from food and water.This is, however, not true for iodine within thyroid hormones ingested fortherapeutic purposes.
Iodine enters the circulation as plasma inorganic iodide, which is clearedfrom the circulation by the thyroid and kidney. The iodide is used by thethyroid gland for synthesis of thyroid hormones, and the kidney excretesexcess iodine with urine. The excretion of iodine in the urine is a goodmeasure of iodine intake. In a normal population with no evidence of clini-cal iodine deficiency either in the form of endemic goitre or endemic cre-tinism, urinary iodine excretion reflects the average daily iodine requirement.Therefore, for determining the iodine requirements and the iodine intake, theimportant indexes are serum T4 and TSH levels (exploring thyroid status) andurinary iodine excretion (exploring iodine intake). A simplified diagram ofthe metabolic circuit of iodine is given in Figure 16.1.
All biological actions of iodide are attributed to the thyroid hormones. Themajor thyroid hormone secreted by the thyroid gland is T4. T4 in circulationis taken up by the cells and is de-iodinated by the enzyme 5¢-monodeiodinasein the cytoplasm to convert it into triiodothyronine (T3), the active form ofthyroid hormone. T3 traverses to the nucleus and binds to the nuclear recep-tor. All the biological actions of T3 are mediated through the binding to thenuclear receptor, which controls the transcription of a particular gene to bringabout the synthesis of a specific protein.
P303-317 3/12/05 17:11 Page 303
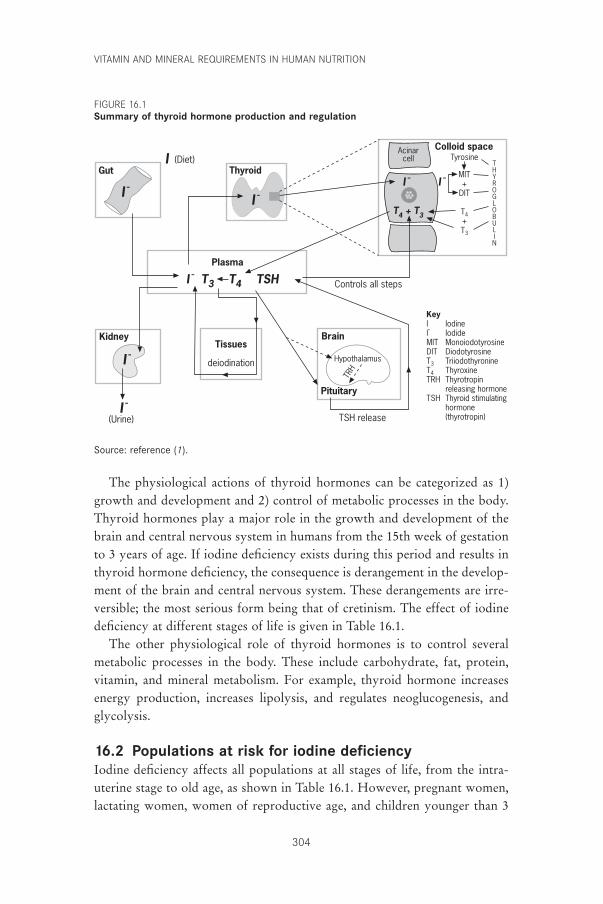
VITAMIN AND MINERAL REQUIREMENTS IN HUMAN NUTRITION
304
I -
I -
(Urine)
KidneyTissues
deiodination
Brain
Pituitary
Hypothalamus
TRH
TSH release
I - T3 T4 TSH
Plasma
I -
Thyroid
I -
GutI (Diet)
I -
Acinarcell
T4 + T3
Colloid spaceTyrosine
MIT+
DIT
T4+T3
THYROGLOBULIN
I -
Controls all steps
KeyI IodineI- IodideMIT MonoiodotyrosineDIT DiodotyrosineT3 TriiodothyronineT4 ThyroxineTRH Thyrotropin
releasing hormoneTSH Thyroid stimulating
hormone (thyrotropin)
Source: reference (1).
The physiological actions of thyroid hormones can be categorized as 1)growth and development and 2) control of metabolic processes in the body.Thyroid hormones play a major role in the growth and development of thebrain and central nervous system in humans from the 15th week of gestationto 3 years of age. If iodine deficiency exists during this period and results inthyroid hormone deficiency, the consequence is derangement in the develop-ment of the brain and central nervous system. These derangements are irre-versible; the most serious form being that of cretinism. The effect of iodinedeficiency at different stages of life is given in Table 16.1.
The other physiological role of thyroid hormones is to control severalmetabolic processes in the body. These include carbohydrate, fat, protein,vitamin, and mineral metabolism. For example, thyroid hormone increasesenergy production, increases lipolysis, and regulates neoglucogenesis, andglycolysis.
16.2 Populations at risk for iodine deficiencyIodine deficiency affects all populations at all stages of life, from the intra-uterine stage to old age, as shown in Table 16.1. However, pregnant women, lactating women, women of reproductive age, and children younger than 3
FIGURE 16.1Summary of thyroid hormone production and regulation
P303-317 3/12/05 17:11 Page 304
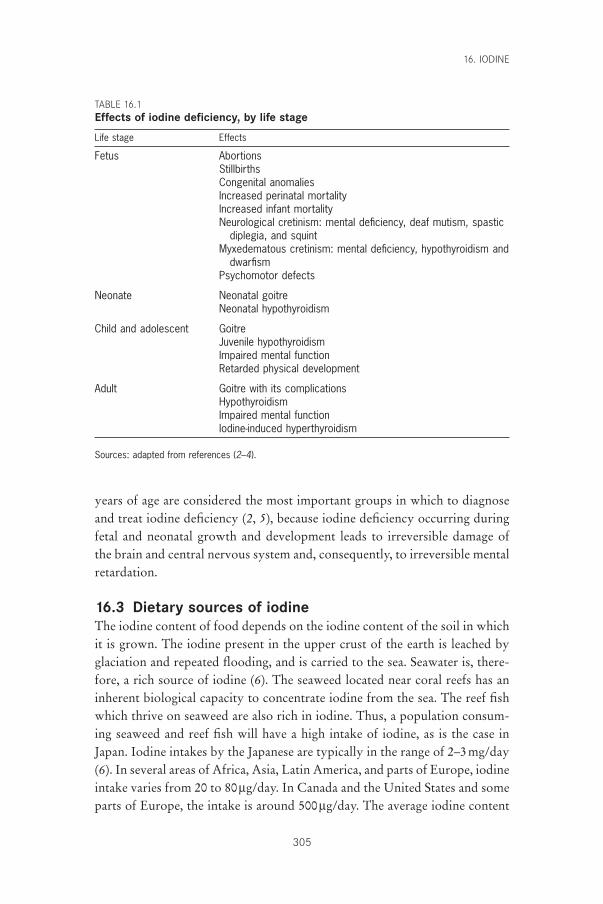
years of age are considered the most important groups in which to diagnoseand treat iodine deficiency (2, 5), because iodine deficiency occurring duringfetal and neonatal growth and development leads to irreversible damage ofthe brain and central nervous system and, consequently, to irreversible mentalretardation.
16.3 Dietary sources of iodineThe iodine content of food depends on the iodine content of the soil in whichit is grown. The iodine present in the upper crust of the earth is leached byglaciation and repeated flooding, and is carried to the sea. Seawater is, there-fore, a rich source of iodine (6). The seaweed located near coral reefs has aninherent biological capacity to concentrate iodine from the sea. The reef fishwhich thrive on seaweed are also rich in iodine. Thus, a population consum-ing seaweed and reef fish will have a high intake of iodine, as is the case inJapan. Iodine intakes by the Japanese are typically in the range of 2–3mg/day(6). In several areas of Africa, Asia, Latin America, and parts of Europe, iodineintake varies from 20 to 80mg/day. In Canada and the United States and someparts of Europe, the intake is around 500mg/day. The average iodine content
16. IODINE
305
TABLE 16.1Effects of iodine deficiency, by life stage
Life stage Effects
Fetus AbortionsStillbirthsCongenital anomaliesIncreased perinatal mortalityIncreased infant mortalityNeurological cretinism: mental deficiency, deaf mutism, spastic
diplegia, and squintMyxedematous cretinism: mental deficiency, hypothyroidism and
dwarfismPsychomotor defects
Neonate Neonatal goitreNeonatal hypothyroidism
Child and adolescent GoitreJuvenile hypothyroidismImpaired mental functionRetarded physical development
Adult Goitre with its complicationsHypothyroidismImpaired mental functionIodine-induced hyperthyroidism
Sources: adapted from references (2–4).
P303-317 3/12/05 17:11 Page 305
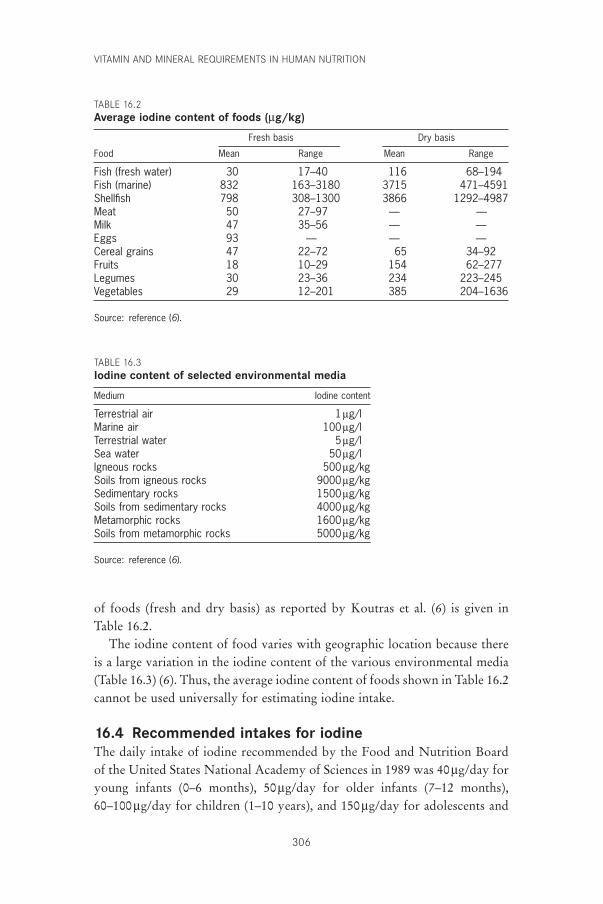
VITAMIN AND MINERAL REQUIREMENTS IN HUMAN NUTRITION
306
TABLE 16.3Iodine content of selected environmental media
Medium Iodine content
Terrestrial air 1mg/lMarine air 100mg/lTerrestrial water 5mg/lSea water 50mg/lIgneous rocks 500mg/kgSoils from igneous rocks 9000mg/kgSedimentary rocks 1500mg/kgSoils from sedimentary rocks 4000mg/kgMetamorphic rocks 1600mg/kgSoils from metamorphic rocks 5000mg/kg
Source: reference (6).
TABLE 16.2Average iodine content of foods (mg/kg)
Fresh basis Dry basis
Food Mean Range Mean Range
Fish (fresh water) 30 17–40 116 68–194Fish (marine) 832 163–3180 3715 471–4591Shellfish 798 308–1300 3866 1292–4987Meat 50 27–97 — —Milk 47 35–56 — —Eggs 93 — — —Cereal grains 47 22–72 65 34–92Fruits 18 10–29 154 62–277Legumes 30 23–36 234 223–245Vegetables 29 12–201 385 204–1636
Source: reference (6).
of foods (fresh and dry basis) as reported by Koutras et al. (6) is given in Table 16.2.
The iodine content of food varies with geographic location because thereis a large variation in the iodine content of the various environmental media(Table 16.3) (6). Thus, the average iodine content of foods shown in Table 16.2cannot be used universally for estimating iodine intake.
16.4 Recommended intakes for iodineThe daily intake of iodine recommended by the Food and Nutrition Boardof the United States National Academy of Sciences in 1989 was 40mg/day foryoung infants (0–6 months), 50mg/day for older infants (7–12 months),60–100mg/day for children (1–10 years), and 150mg/day for adolescents and
P303-317 3/12/05 17:11 Page 306
16. IODINE
307
adults (7). These values approximate to 7.5mg/kg/day for infants aged 0–12months, 5.4mg/kg/day for children aged 1–10 years, and 2mg/kg/day for ado-lescents and adults. These amounts are proposed to allow normal T4 produc-tion without stressing the thyroid iodide trapping mechanism or raising TSHlevels.
16.4.1 InfantsThe recommendation of 40mg/day for infants aged 0–6 months (or 8mg/kg/day, 7mg/100kcal, or 50mg/l milk) is probably based on the observa-tion reported in the late 1960s that the iodine content of human milk wasapproximately 50mg/l and the assumption that nutrition of the human-milk-fed infant growing at a satisfactory rate represents an adequate level of nutrient intake (8, 9). However, recent data indicate that the iodine content of human milk varies markedly as a function of the iodine intake of the pop-ulation (10). For example, it ranges from 20 to 330mg/l in Europe and from 30to 490mg/l in the United States (8, 10, 11). It is as low as 12mg/l in populationsexperiencing severe iodine deficiency (8, 10). On this basis, an average human-milk intake of 750ml/day would give an intake of iodine of about 60mg/dayin Europe and 120mg/day in the United States. The upper United States value(490mg/l) would provide 368mg/day or 68mg/kg/day for a 5-kg infant.
Positive iodine balance in the young infant, which is required for increas-ing the iodine stores of the thyroid, is achieved only when the iodine intakeis at least 15mg/kg/day in term infants and 30mg/kg/day in pre-term infants(12). The iodine requirement of pre-term infants is twice that of term infantsbecause of a much lower retention of iodine by pre-term infants (8, 12). Basedon the assumption of an average body weight of 6kg for a child of 6 months, 15mg/kg/day corresponds approximately to an iodine intake and requirementof 90mg/day. This value is twofold higher than the present United States recommendations.
On the basis of these considerations, The World Health Organization(WHO) in 2001 updated its 1996 recommendations (13) and proposed,together with the United Nations Children’s Fund (UNICEF) and the Inter-national Council for Control of Iodine Deficiency Disorders (ICCIDD), aniodine intake of 90mg/day from birth onwards (14). To reach this objective,and based on an intake of milk of about 150ml/kg/day, it was further pro-posed that the iodine content of formula milk be increased from 50mg/l, theformer recommendation, to 100mg/l for term infants and to 200mg/l for pre-term infants.
For a urine volume of about 4–6dl/day, the urinary concentration of iodine indicating iodine repletion should be in the range of 150–220mg/l
P303-317 3/12/05 17:11 Page 307
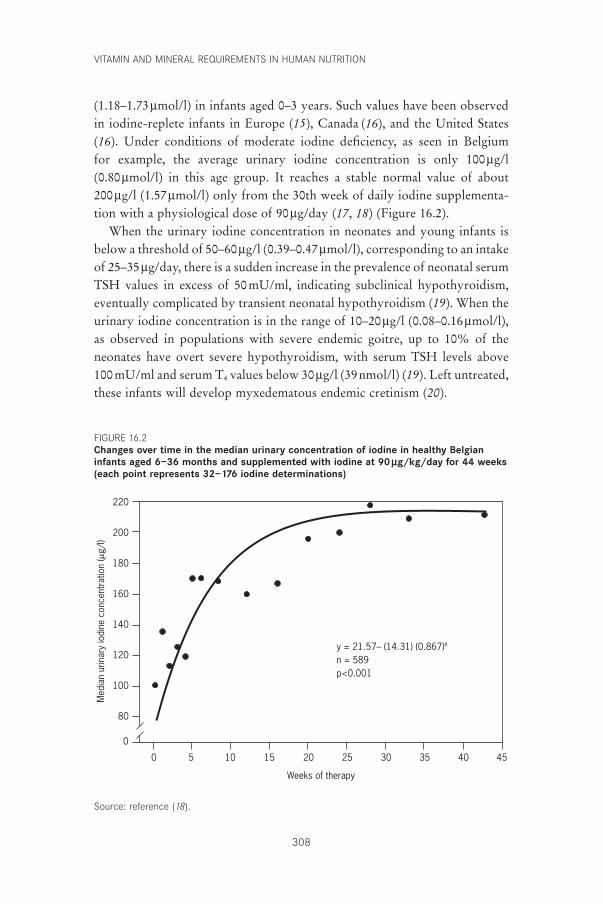
VITAMIN AND MINERAL REQUIREMENTS IN HUMAN NUTRITION
308
(1.18–1.73mmol/l) in infants aged 0–3 years. Such values have been observedin iodine-replete infants in Europe (15), Canada (16), and the United States(16). Under conditions of moderate iodine deficiency, as seen in Belgium for example, the average urinary iodine concentration is only 100mg/l (0.80mmol/l) in this age group. It reaches a stable normal value of about 200mg/l (1.57mmol/l) only from the 30th week of daily iodine supplementa-tion with a physiological dose of 90mg/day (17, 18) (Figure 16.2).
When the urinary iodine concentration in neonates and young infants isbelow a threshold of 50–60mg/l (0.39–0.47mmol/l), corresponding to an intakeof 25–35mg/day, there is a sudden increase in the prevalence of neonatal serumTSH values in excess of 50mU/ml, indicating subclinical hypothyroidism,eventually complicated by transient neonatal hypothyroidism (19). When theurinary iodine concentration is in the range of 10–20mg/l (0.08–0.16mmol/l),as observed in populations with severe endemic goitre, up to 10% of theneonates have overt severe hypothyroidism, with serum TSH levels above 100mU/ml and serum T4 values below 30mg/l (39nmol/l) (19). Left untreated,these infants will develop myxedematous endemic cretinism (20).
220
200
180
160
140
120
100
80
0
Weeks of therapy
0 5 10 15 20 25 30 35 40 45
y = 21.57– (14.31) (0.867)x
n = 589p<0.001
Med
ian
urin
ary
iodi
ne c
once
ntra
tion
(µg/
l)
Source: reference (18).
FIGURE 16.2Changes over time in the median urinary concentration of iodine in healthy Belgianinfants aged 6–36 months and supplemented with iodine at 90 mg/kg/day for 44 weeks(each point represents 32–176 iodine determinations)
P303-317 3/12/05 17:11 Page 308
Overall, existing data point to an iodine requirement of the young infantof 15mg/kg/day (30mg/kg/day in pre-term infants). Hyperthyrotropinaemia(high levels of serum TSH), indicating subclinical hypothyroidism with therisk of brain damage, occurs when the iodine intake is about one third of thisvalue, and dramatic neonatal hypothyroidism, resulting in endemic cretinism,occurs when the intake is about one tenth of this value.
16.4.2 ChildrenThe daily iodine requirement on a body weight basis decreases progressivelywith age. A study by Tovar and colleagues (21) correlating 24-hour thyroidradioiodine uptake and urinary iodine excretion in 9–13-year-old school-children in rural Mexico suggested that an iodine intake in excess of 60mg/dayis associated with a 24-hour thyroidal radioiodine uptake below 30%. Lowerexcretion values are associated with higher uptake values. An iodine intake of60mg/day is equivalent to 3mg/kg/day in an average size 10-year-old child(approximate body weight of 20kg). An intake of 60–100mg/day for a childof 1–10 years thus seems appropriate. These requirements are based on thebody weight of Mexican children who participated in this study. The Foodand Agriculture Organization of the United Nations calculates the averagebody weight of a 10-year-old child as being 25kg. Using the higher averagebody weight, the iodine requirement for a 1–10-year-old child would be 90–120mg/day.
16.4.3 AdultsA requirement for iodine of 150mg/day for adolescents and adults is justifiedby the fact that it corresponds to the daily urinary excretion of iodine and tothe iodine content of food in non-endemic areas (i.e. in areas where iodineintake is adequate) (22, 23). It also provides the iodine intake necessary tomaintain the plasma iodide level above the critical limit of 0.10mg/dl, whichis the average level likely to be associated with the onset of goitre (24). More-over, this level of iodine intake is required to maintain the iodine stores of thethyroid above the critical threshold of 10mg, below which an insufficient levelof iodination of thyroglobulin leads to disorders in thyroid hormone synthesis (23).
Data reflecting either iodine balance or its effect on thyroid physiology canhelp to define optimal iodine intake. In adults and adolescents who consumeadequate amounts of iodine, most dietary iodine eventually appears in theurine; thus, the urinary iodine concentration is a useful measure for assessingiodine intake (1, 23). For this, casual samples are sufficient if enough are col-lected and if they accurately represent a community (14, 25). A urinary iodine
16. IODINE
309
P303-317 3/12/05 17:11 Page 309
VITAMIN AND MINERAL REQUIREMENTS IN HUMAN NUTRITION
310
concentration of 100mg/l corresponds to an intake of about 150mg/day in theadult. Median urinary iodine concentrations below 100mg/l in a populationare associated with increases in median thyroid size and possibly in increasesin serum TSH and thyroglobulin values. Correction of the iodine deficiencywill bring all these measures back into the normal range. Recent data fromthe Thyro-Mobil project in Europe have confirmed these relationships byshowing that the largest thyroid sizes are associated with the lowest urinaryiodine concentrations (26). Once a median urinary iodine excretion of about100mg/l is reached, the ratio of thyroid size to body size remains fairly con-stant. Moulopoulos et al. (27) reported that a urinary iodine excretion between151 and 200mg/g creatinine (1.18–1.57mmol/g creatinine), corresponding to aconcentration of about 200mg/l (1.57mmol/l), correlated with the lowestvalues for serum TSH in a non-goitrous population. Similarly, recent datafrom Australia show that the lowest serum TSH and thyroglobulin valueswere associated with urine containing 200–300mg iodine/g creatinine(1.57–2.36mmol iodine/g creatinine) (28).
Other investigations followed serum TSH levels in adult subjects withoutthyroid glands who were given graded doses of T4 and found that an averagedaily dose of 100mg T4 would require at least 65mg of iodine to be used withmaximal efficiency by the thyroid in order to establish euthyroidism. In prac-tice, such maximal efficiency is never obtained and therefore considerablymore iodine is necessary. Data from controlled observations associated a lowurinary iodine concentration with a high goitre prevalence, high radioiodineuptake, and low thyroidal organic iodine content (12). Each of these meas-ures reached a steady state once the urinary iodine excretion was 100mg/l (0.78mmol/l) or greater.
16.4.4 Pregnant womenThe iodine requirement during pregnancy is increased to provide for the needsof the fetus and to compensate for the increased loss of iodine in the urineresulting from an increased renal clearance of iodine during pregnancy (29).Previously, requirements have been derived from studies of thyroid functionduring pregnancy and in the neonate under conditions of moderate iodinedeficiency. For example, in Belgium, where the iodine intake is estimated tobe 50–70mg/day (30), thyroid function during pregnancy is characterized bya progressive decrease in the serum concentrations of free-thyroid hormonesand an increase in serum TSH and thyroglobulin. Thyroid volume progres-sively increases and is above the upper limit of normal in 10% of the womenby the end of pregnancy. Serum TSH and thyroglobulin are higher in theneonates than in the mothers (31). These abnormalities are prevented only
P303-317 3/12/05 17:11 Page 310
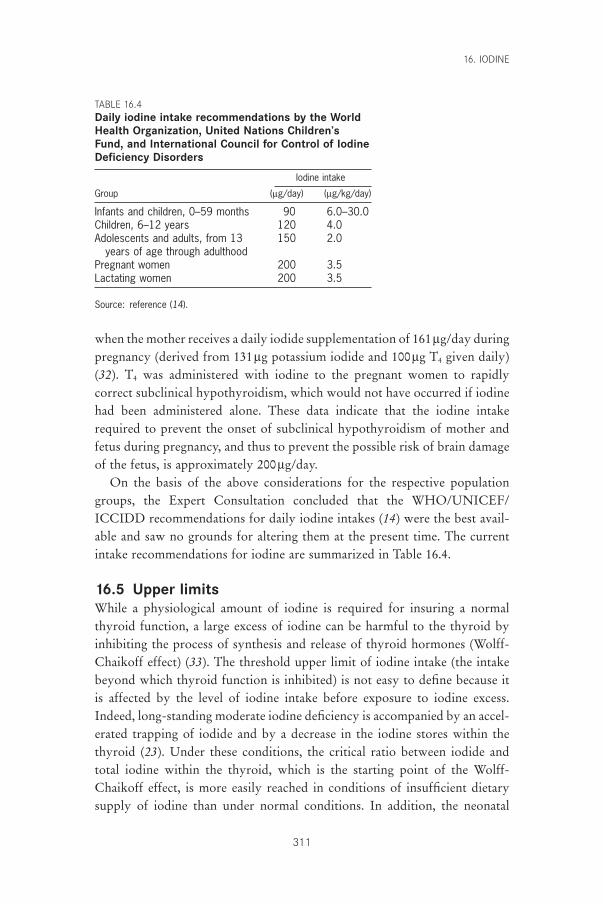
16. IODINE
311
when the mother receives a daily iodide supplementation of 161mg/day duringpregnancy (derived from 131mg potassium iodide and 100mg T4 given daily)(32). T4 was administered with iodine to the pregnant women to rapidlycorrect subclinical hypothyroidism, which would not have occurred if iodinehad been administered alone. These data indicate that the iodine intakerequired to prevent the onset of subclinical hypothyroidism of mother andfetus during pregnancy, and thus to prevent the possible risk of brain damageof the fetus, is approximately 200mg/day.
On the basis of the above considerations for the respective populationgroups, the Expert Consultation concluded that the WHO/UNICEF/ICCIDD recommendations for daily iodine intakes (14) were the best avail-able and saw no grounds for altering them at the present time. The currentintake recommendations for iodine are summarized in Table 16.4.
16.5 Upper limitsWhile a physiological amount of iodine is required for insuring a normalthyroid function, a large excess of iodine can be harmful to the thyroid byinhibiting the process of synthesis and release of thyroid hormones (Wolff-Chaikoff effect) (33). The threshold upper limit of iodine intake (the intakebeyond which thyroid function is inhibited) is not easy to define because itis affected by the level of iodine intake before exposure to iodine excess.Indeed, long-standing moderate iodine deficiency is accompanied by an accel-erated trapping of iodide and by a decrease in the iodine stores within thethyroid (23). Under these conditions, the critical ratio between iodide andtotal iodine within the thyroid, which is the starting point of the Wolff-Chaikoff effect, is more easily reached in conditions of insufficient dietarysupply of iodine than under normal conditions. In addition, the neonatal
TABLE 16.4Daily iodine intake recommendations by the WorldHealth Organization, United Nations Children’sFund, and International Council for Control of IodineDeficiency Disorders
Iodine intake
Group (mg/day) (mg/kg/day)
Infants and children, 0–59 months 90 6.0–30.0Children, 6–12 years 120 4.0Adolescents and adults, from 13 150 2.0
years of age through adulthoodPregnant women 200 3.5Lactating women 200 3.5
Source: reference (14).
P303-317 3/12/05 17:11 Page 311
VITAMIN AND MINERAL REQUIREMENTS IN HUMAN NUTRITION
312
thyroid is particularly sensitive to the Wolff-Chaikoff effect because theimmature thyroid gland is unable to reduce the uptake of iodine from the plasma to compensate for increased iodine ingestion (34). Consequently,the upper limit of iodine intake will depend on both basal status of iodineintake and age.
16.5.1 Iodine intake in areas of moderate iodine deficiencyIn a study in Belgium, iodine overload of mothers (caused by use of cuta-neous povidone iodine for epidural anaesthesia or caesarean section) increasedthe milk iodine concentration of women and increased urinary iodine excre-tion in their term newborn infants (mean weight about 3kg) (35). In theabsence of iodine overload, the mean iodine content of breast milk was 9mg/dl(0.63mmol/l) and the urinary iodine of the infant at 5 days of life was 12mg/dl(0.94mmol/l). After the use of povidone iodine in the mother for epiduralanaesthesia or for caesarean section, the mean milk iodine concentrations were18 and 128mg/dl, and were associated with average infant urinary iodineexcretion levels of 280 and 1840mg/l (2.20–14.48mmol/l), respectively (35).Based on an intake of some 6.5dl of breast milk per day, the estimated averageiodine intakes in the babies of iodine overload mothers were 117 and 832mg/day, or 39 and 277mg/kg/day, respectively. The lower dose significantlyincreased the peak TSH response to exogenous thyroid-releasing hormonebut did not increase the (secretory) area under the TSH response curve. Thehigher dose increased the peak response and secretory area as well as the base-line TSH concentration. Serum T4 concentrations were not altered, however(35). Thus, these infants had a mild and transient, compensated hypothyroidstate. More generally, the use of povidone iodine in mothers at the time ofdelivery increased neonatal TSH and the recall rate at the time of screeningfor congenital hypothyroidism (36). These data indicate that modest iodineoverloading of term infants in the neonatal period in an area of relative dietaryiodine deficiency (Belgium) can impair thyroid hormone formation.
Similarly, studies in France and Germany indicated that premature infantsexposed to cutaneous povidone iodine or fluorescinated alcohol-iodine solu-tions, and excreting iodine in urine in excess of 100mg/day, manifesteddecreased T4 and increased TSH concentrations in serum (37, 38). The extentof these changes was more marked in premature infants with less than 34weeks gestation than in those with 35–37 weeks gestation. The term infantswere not affected.
These studies suggest that in Europe, the upper limit of iodine intake whichpredisposes to blockage of thyroid secretion in neonates and especially in pre-
P303-317 3/12/05 17:11 Page 312
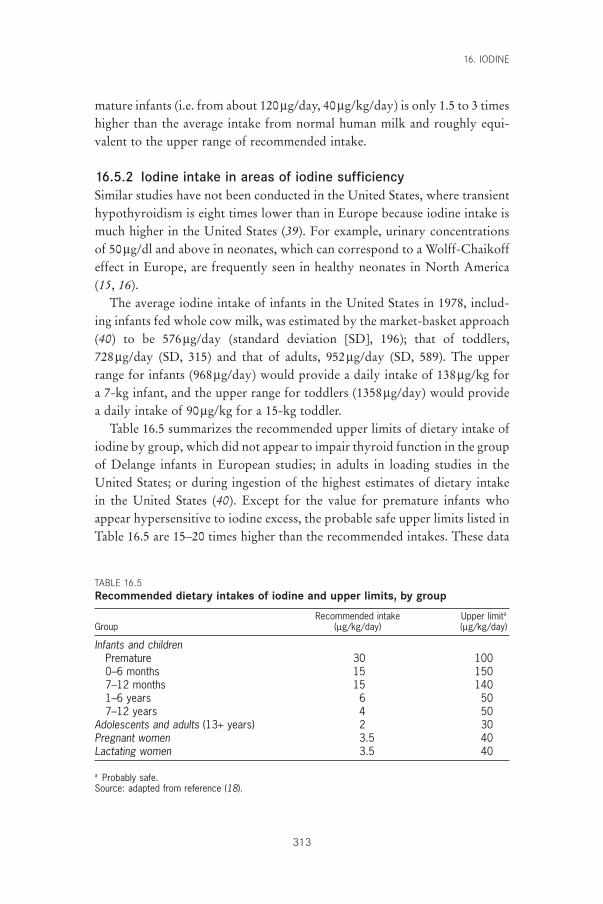
16. IODINE
313
mature infants (i.e. from about 120mg/day, 40mg/kg/day) is only 1.5 to 3 timeshigher than the average intake from normal human milk and roughly equi-valent to the upper range of recommended intake.
16.5.2 Iodine intake in areas of iodine sufficiencySimilar studies have not been conducted in the United States, where transienthypothyroidism is eight times lower than in Europe because iodine intake ismuch higher in the United States (39). For example, urinary concentrationsof 50mg/dl and above in neonates, which can correspond to a Wolff-Chaikoffeffect in Europe, are frequently seen in healthy neonates in North America(15, 16).
The average iodine intake of infants in the United States in 1978, includ-ing infants fed whole cow milk, was estimated by the market-basket approach(40) to be 576mg/day (standard deviation [SD], 196); that of toddlers, 728mg/day (SD, 315) and that of adults, 952mg/day (SD, 589). The upperrange for infants (968mg/day) would provide a daily intake of 138mg/kg fora 7-kg infant, and the upper range for toddlers (1358mg/day) would providea daily intake of 90mg/kg for a 15-kg toddler.
Table 16.5 summarizes the recommended upper limits of dietary intake ofiodine by group, which did not appear to impair thyroid function in the groupof Delange infants in European studies; in adults in loading studies in theUnited States; or during ingestion of the highest estimates of dietary intakein the United States (40). Except for the value for premature infants whoappear hypersensitive to iodine excess, the probable safe upper limits listed inTable 16.5 are 15–20 times higher than the recommended intakes. These data
TABLE 16.5Recommended dietary intakes of iodine and upper limits, by group
Recommended intake Upper limita
Group (mg/kg/day) (mg/kg/day)
Infants and childrenPremature 30 1000–6 months 15 1507–12 months 15 1401–6 years 6 507–12 years 4 50
Adolescents and adults (13+ years) 2 30Pregnant women 3.5 40Lactating women 3.5 40
a Probably safe.Source: adapted from reference (18).
P303-317 3/12/05 17:11 Page 313
VITAMIN AND MINERAL REQUIREMENTS IN HUMAN NUTRITION
314
refer to all sources of iodine intake. The average iodine content of infant for-mulas is approximately 5mg/dl. The upper limit probably should be one thatprovides a daily iodine intake of no more than 100mg/kg. For this limit—withthe assumption that the total intake is from infant formula—and with a dailymilk intake of 150ml/kg (100kcal/kg), the upper limit of the iodine contentof infant formula would be about 65mg/dl. The current suggested upper limitof iodine in infant formula of 75mg/100kcal (89mg/500kJ or 50mg/dl), there-fore, seems reasonable.
16.5.3 Excess iodine intakeExcess iodine intake in healthy adults in iodine-replete areas is difficult todefine. Many people are regularly exposed to huge amounts of iodine—in therange 10–200mg/day—without apparent adverse effects. Common sourcesare medicines (e.g. amiodarone contains 75mg iodine per 200-mg capsule),foods (particularly dairy products), kelp (eaten in large amounts in Japan),and iodine-containing dyes (for radiologic procedures). Occasionally, each ofthese may have significant thyroid effects, but generally, they are toleratedwithout difficulty. Braverman et al. (41) showed that people without evidenceof underlying thyroid disease almost always remain euthyroid in the face of large amounts of excess iodine and escape the acute inhibitory effects ofexcess intrathyroidal iodide on the organification (i.e. attachment of oxidized iodine species to tyrosil residues in the thyroid gland for the syn-thesis of thyroid hormones) of iodide and on subsequent hormone synthesis(escape from, or adaptation to, the acute Wolff-Chaikoff effect). This adapta-tion most likely involves a decrease in thyroid iodide trapping, perhaps cor-responding to a decrease in the thyroid sodium-iodide transporter recentlycloned (42).
This tolerance to huge doses of iodine in healthy iodine-replete adults isthe reason why WHO stated in 1994 that, “Daily iodine intakes of up to 1mg, i.e. 1000mg, appear to be entirely safe” (43). This statement, of course,does not include neonates and young infants (due to factors previously dis-cussed). In addition, it has to be considered that iodine excess can inducehypothyroidism in patients affected by thyroiditis (44) and can induce hyper-thyroidism in cases of a sudden and excessive increment of iodine supply inpatients with autonomous thyroid nodules (3, 4, 45). Finally, iodine excesscan trigger thyroid autoimmunity in genetically susceptible animals and indi-viduals and may modify the pattern of thyroid cancer by increasing the ratioof papillary–follicular thyroid cancers (46).
In conclusion, it clearly appears that the benefits of correcting iodine defi-ciency far outweigh the risks of iodine supplementation (46, 47).
P303-317 3/12/05 17:11 Page 314
16. IODINE
315
References1. Stanbury JB. Physiology of endemic goitre. In: Endemic goitre. Geneva, World
Health Organization, 1960:261–262.2. Hetzel BS. Iodine deficiency disorders (IDD) and their eradication. Lancet,
1983, 2:1126–1129.3. Stanbury JB et al. Iodine-induced hyperthyroidism: occurrence and epidemi-
ology. Thyroid, 1998, 8:83–100.4. Delange F et al. Risks of iodine-induced hyperthyroidism following correc-
tion of iodine deficiency by iodized salt. Thyroid, 1999, 9:545–556.5. Dunn JT. The use of iodized oil and other alternatives for the elimination of
iodine deficiency disorders. In: Hetzel BS, Pandav CS, eds. SOS for a billion.The conquest of iodine deficiency disorders. New Delhi, Oxford UniversityPress, 1996:119–128.
6. Koutras DA, Matovinovic J, Vought R. The ecology of iodine. In: StanburyJB, Hetzel BS, eds. Endemic goitre and endemic cretinism. Iodine nutrition inhealth and disease. New Delhi, Wiley Eastern Limited, 1985:185–195.
7. Subcommittee on the Tenth Edition of the Recommended DietaryAllowances, Food and Nutrition Board. Recommended dietary allowances,10th ed. Washington, DC, National Academy Press, 1989.
8. Delange F et al. Physiopathology of iodine nutrition during pregnancy, lactation and early postnatal life. In: Berger H, ed. Vitamins and minerals inpregnancy and lactation. New York, NY, Raven Press, 1988:205–214 (NestléNutrition Workshop Series, No. 16).
9. Gushurst CA et al. Breast milk iodide: reassessment in the 1980s. Pediatrics,1984, 73:354–357.
10. Semba RD, Delange F. Iodine in human milk: perspectives for human health.Nutrition Reviews, 2001, 59:269–278.
11. Bruhn JA, Franke AA. Iodine in human milk. Journal of Dairy Sciences, 1983,66:1396–1398.
12. Delange F. Requirements of iodine in humans. In: Delange F, Dunn JT, GlinoerD, eds. Iodine deficiency in Europe. A continuing concern. New York, NY,Plenum Press, 1993:5–16.
13. Trace elements in human nutrition and health. Geneva, World Health Organization, 1996.
14. Assessment of the iodine deficiency disorders and monitoring their elimination.Geneva, World Health Organization, 2001 (WHO/NHD/01.1).
15. Delange F et al. Regional variations of iodine nutrition and thyroid functionduring the neonatal period in Europe. Biology of the Neonate, 1986,49:322–330.
16. Delange F et al. Increased risk of primary hypothyroidism in preterm infants.Journal of Pediatrics, 1984, 105:462–469.
17. Delange F et al. Iodine deficiency during infancy and early childhood inBelgium: does it pose a risk to brain development? European Journal of Pedi-atrics, 2001, 160:251–254.
18. Fisher DA, Delange F. Thyroid hormone and iodine requirements in manduring brain development. In: Stanbury JB et al., eds. Iodine in pregnancy.New Delhi, Oxford University Press, 1998:1–33.
19. Delange F. Iodine nutrition and congenital hypothyroidism. In: Delange F,Fisher DA, Glinoer D, eds. Research in congenital hypothyroidism. New York,NY, Plenum Press, 1989:173–185.
20. Delange F. Endemic cretinism. In: Braverman LE, Utiger RD, eds. The
P303-317 3/12/05 17:11 Page 315
VITAMIN AND MINERAL REQUIREMENTS IN HUMAN NUTRITION
316
thyroid. A fundamental and clinical text, 8th ed. Philadelphia, PA, Lippincott,2000:743–754.
21. Tovar E, Maisterrena JA, Chavez A. Iodine nutrition levels of school childrenin rural Mexico. In: Stanbury JB, ed. Endemic goitre. Washington, DC, PanAmerican Health Organization, 1969:411–415 (PAHO Scientific Publication,No. 193).
22. Bottazzo GF et al. Thyroid growth-blocking antibodies in autoimmune (AI)atrophic thyroiditis. Annales d’Endocrinologie (Paris), 1981, 42:13A.
23. Delange F. The disorders induced by iodine deficiency. Thyroid, 1994,4:107–128.
24. Wayne EJ, Koutras DA, Alexander WD. Clinical aspects of iodine metabolism.Oxford, Blackwell, 1964:1–303.
25. Bourdoux P et al. A new look at old concepts in laboratory evaluation of endemic goitre. In: Dunn JT et al., eds. Towards the eradication of endemic goitre, cretinism, and iodine deficiency. Washington, DC, Pan American Health Organization, 1986:115–129 (PAHO Scientific Publication,No. 502).
26. Delange F et al. Thyroid volume and urinary iodine in European school-children. Standardization of values for assessment of iodine deficiency. Euro-pean Journal of Endocrinology, 1997, 136:180–187.
27. Moulopoulos DS et al. The relation of serum T4 and TSH with the urinaryiodine excretion. Journal of Endocrinological Investigation, 1988, 11:437–439.
28. Buchinger W et al. Thyrotropin and thyroglobulin as an index of the optimaliodine intake: correlation with iodine excretion of 39913 euthyroid patients.Thyroid, 1997, 7:593–597.
29. Aboul-Khair SA et al. The physiological changes in thyroid function duringpregnancy. Clinical Sciences, 1964, 27:195–207.
30. Glinoer D et al. Regulation of maternal thyroid during pregnancy. Journal ofClinical Endocrinology and Metabolism, 1990, 71:276–287.
31. Glinoer D et al. Maternal and neonatal thyroid function at birth in an area ofmarginally low iodine intake. Journal of Clinical Endocrinology and Metabo-lism, 1992, 75:800–805.
32. Glinoer D et al. A randomized trial for the treatment of excessive thyroidalstimulation in pregnancy: maternal and neonatal effects. Journal of ClinicalEndocrinology and Metabolism, 1995, 80:258–269.
33. Roti E, Vagenakis G. Effect of excess iodide: clinical aspects. In: BravermanLE, Utiger RD, eds. The thyroid. A fundamental and clinical text, 8th ed.Philadelphia, PA, Lippincott, 2000:316–329.
34. Sherwin J. Development of the regulatory mechanisms in the thyroid: failureof iodide to suppress iodide transport activity. Proceedings of the Society forExperimental Biology and Medicine, 1982, 169:458–462.
35. Chanoine JP et al. Increased recall rate at screening for congenital hypothy-roidism in breast fed infants born to iodine overloaded mothers. Archives ofDiseases in Childhood, 1988, 63:1207–1210.
36. Chanoine JP et al. Iodinated skin disinfectants in mothers at delivery andimpairment of thyroid function in their breast-fed infants. In: Medeiros-Neto GA, Gaitan E, eds. Frontier of thyroidology. New York, NY, PlenumPress, 1986:1055–1060.
37. Castaing H et al. Thyroïde du nouveau-né et surcharge en iode après la naissance. [The thyroid gland of the newborn infant and postnatal iodine overload]. Archives Francaises de Pédiatrie, 1979, 36:356–368.
P303-317 3/12/05 17:11 Page 316
38. Gruters A et al. Incidence of iodine contamination in neonatal transient hyper-thyrotropinemia. European Journal of Pediatrics, 1983, 140:299–300.
39. Burrow GN, Dussault JH. Neonatal thyroid screening. New York, NY, RavenPress, 1980.
40. Park YK et al. Estimation of dietary iodine intake of Americans in recent years.Journal of the American Dietetic Association, 1981, 79:17–24.
41. Braverman LE. Iodine and the thyroid—33 years of study. Thyroid, 1994,4:351–356.
42. Dai G, Levy O, Carraco N. Cloning and characterisation of the thyroid iodidetransporter. Nature, 1996, 379:458–460.
43. Iodine and health. Eliminating iodine deficiency disorders safely through saltiodization. Geneva, World Health Organization, 1994.
44. Paris J et al. The effect of iodide on Hashimoto’s thyroiditis. Journal of Clinical Endocrinology, 1961, 21:1037–1043.
45. Todd CH et al. Increase in thyrotoxicosis associated with iodine supplementsin Zimbabwe. Lancet, 1995, 346:1563–1564.
46. Delange F, Lecomte P. Iodine supplementation: benefits outweigh risks. DrugSafety, 2000, 22:89–95.
47. Braverman LE. Adequate iodine intake—the good far outweighs the bad. European Journal of Endocrinology, 1998, 139:14–15.
16. IODINE
317
P303-317 3/12/05 17:11 Page 317
318
17. Food as a source of nutrients
17.1 Importance of defining food-based recommendationsDietary patterns have varied over time. Changes in these patterns are dependent on such things as agricultural practices and climatic, ecologic, cul-tural, and socioeconomic factors, which in turn, determine which foods areavailable. At present, virtually all dietary patterns show that the nutritionalneeds of population groups are adequately satisfied or even exceeded. This istrue except where socioeconomic conditions limit the capacity to produce andpurchase food or aberrant cultural practices restrict the choice of foods. It isthought that if people have access to a sufficient quantity and variety of foods,they will meet, in large part, their nutritional needs. However, for certaingroups of people because of economic restrictions, levels of certain micronu-trients may not be met from food alone. Thus, micronutrient adequacy mustbe included in evaluating the nutritive value of diets alongside energy andprotein adequacy.
A healthful diet can be attained through the intake of multiple combina-tions of a variety of foods. Given this, it is difficult to define the ranges ofintake for a specific food, which should be included in a given combinationwith other foods to comply with nutritional adequacy. In practice, the set offood combinations which provide nutritional adequacy are limited by thelevel of food production sustainable in a given ecological setting. In addition,there are economic constraints that limit food supply at the household level.The development of food-based dietary guidelines (FBDGs) (1) recognizesthis and focuses on how a combination of foods can meet nutrient require-ments rather than on how each specific nutrient is provided in adequateamounts.
The first step in the process of setting dietary guidelines is defining the sig-nificant diet-related public health problems in a community. Once these aredefined, the adequacy of the diet is evaluated by comparing the informationavailable on dietary intake with the established recommended nutrient intakes(RNIs). Nutrient intake goals are specific for a given setting, and their purposeis to promote overall health, control specific nutritional diseases (whether
P318-342 3/12/05 17:12 Page 318
17. FOOD AS A SOURCE OF NUTRIENTS
319
they are induced by an excess or deficiency of nutrient intake), and reducethe risk of diet-related multifactorial diseases. Dietary guidelines represent thepractical way to reach the nutritional goals for a given population. They takeinto account customary dietary patterns and indicate what aspects of eachshould be modified. They consider the ecological setting in which the popu-lation lives, as well as the socioeconomic and cultural factors that affect nutri-tional adequacy.
The alternative approach to defining nutritional adequacy of diets relies on the biochemical and physiological basis of human nutritional requirementsin health and disease. The quantitative definition of nutrient needs and itsexpression as RNIs have been important instruments of food and nutritionpolicy in many countries and have focused the attention of internationalbodies on this critical issue. This nutrient-based approach has served manypurposes but has not always fostered the establishment of nutritional anddietary priorities consistent with the broad public health priorities at thenational and international levels. It has permitted a more precise definition ofrequirements for essential nutrients but unfortunately has often been too nar-rowly focused, concentrating on the precise nutrient requirement amount,and not on solving the nutritional problems of the world.
In contrast to RNIs, FBDGs are based on the fact that people eat food, notnutrients. Defining nutrient intakes alone is only part of the task of dealingwith nutritional adequacy. As will be illustrated in this chapter, the notion ofnutrient density is helpful for defining FBDGs and evaluating the adequacyof diets. However, unlike RNIs, FBDGs can be used to educate the publicthrough the mass media and provide a practical guide to selecting foods bydefining dietary adequacy (1).
Advice for a healthful diet should provide both a quantitative and qualitative description of the diet for it to be understood by individuals, who should be given information on both size and number of servings per day. The quantitative aspects include the estimation of the amount ofnutrients in foods and their bioavailability in the form they are actually consumed. Unfortunately, available food composition data for most foods currently consumed in the world are incomplete, outdated, or insufficient for evaluating true bioavailability. The qualitative aspects relate to the biological utilization of nutrients in the food as consumed byhumans and explore the potential for interaction among nutrients. Such aninteraction may enhance or inhibit the bioavailability of a nutrient from agiven food source.
The inclusion of foods in the diet which have high micronutrient density—such as pulses or legumes, vegetables (including green leafy vegetables), and
P318-342 3/12/05 17:12 Page 319
VITAMIN AND MINERAL REQUIREMENTS IN HUMAN NUTRITION
320
fruits—is the preferred way of ensuring optimal nutrition, including micronu-trient adequacy, for most population groups. Most population groups whoare deficient in micronutrients subsist largely on refined cereal grain- or tuber-based diets, which provide energy and protein (with an improper amino acidbalance) but insufficient levels of critical micronutrients. There is a need fora broadening of the food base and a diversification of diets. Figures 17.1–17.4illustrate how addition of a variety of foods to four basic diets (i.e. a whiterice-based diet; a corn-tortilla-based diet; a refined couscous-based diet; and a potato-based diet) can increase the nutrient density of a cereal- or tuber-based diet. Adding reasonable amounts of these foods will addmicronutrient density to the staple diet and in doing so could reduce theprevalence of diseases resulting from a micronutrient deficiency across pop-ulations groups.
The recent interest in the role of phytochemicals and antioxidants onhealth, and their presence in plant foods, lends further support to the recom-mendation for increasing the consumption of vegetables and fruit in the diet.The need for dietary diversification is supported by the knowledge of theinterrelationships of food components, which may enhance the nutritionalvalue of foods and prevent undesirable imbalances which may limit the utilization of some nutrients. For example, fruits rich in ascorbic acid willenhance the absorption of non-haem iron.
If energy intake is low (<8.368MJ/day), for example, in the case of youngchildren, sedentary women, or the elderly, the diet may not provide sufficientamounts of vitamins and minerals to meet RNIs. This situation may be ofspecial relevance to the elderly, who are inactive, have decreased lean bodymass, and typically decrease their energy intake. Young children, pregnantwomen, and lactating women who have greater micronutrient needs relative to their energy needs will also require an increased micronutrientdensity.
The household is the basic unit in which food is consumed in most set-tings. If there is sufficient food, individual members of the household canconsume a diet with the recommended nutrient densities (RNDs) and meettheir specific RNIs. However, appropriate food distribution within the familymust be considered to ensure that children and women receive adequate foodwith high micronutrient density. Household food distribution must be con-sidered when establishing general dietary guidelines and addressing the needsof vulnerable groups in the community. In addition, education detailing theappropriate storage and processing of foods to reduce micronutrient losses atthe household level is important.
P318-342 3/12/05 17:12 Page 320
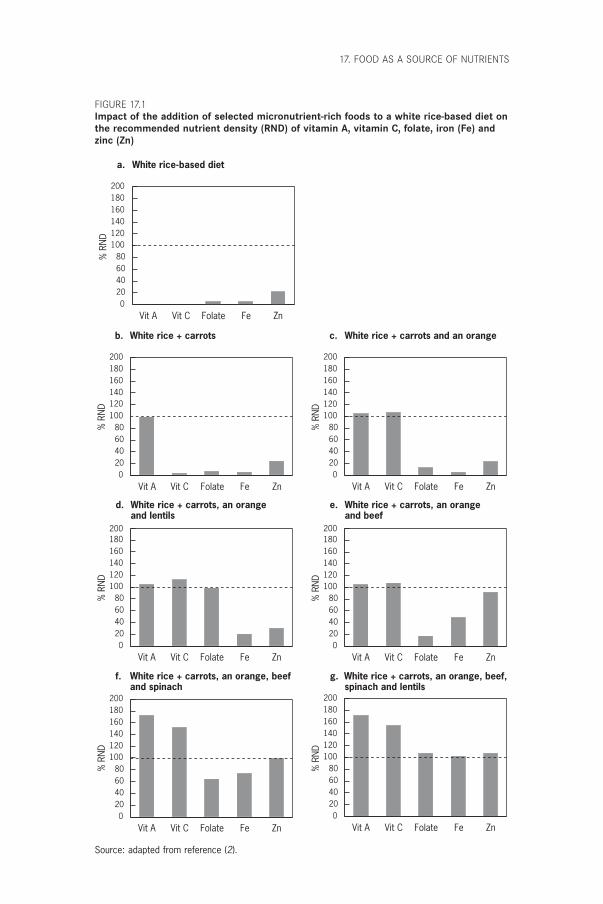
17. FOOD AS A SOURCE OF NUTRIENTS
Vit A Vit C Folate Fe Zn0
20406080
100120140160180200
b. White rice + carrots
% R
ND
c. White rice + carrots and an orange
Vit A Vit C Folate Fe Zn0
20406080
100120140160180200
% R
ND
d. White rice + carrots, an orangeand lentils
e. White rice + carrots, an orangeand beef
Vit A Vit C Folate Fe Zn0
20406080
100120140160180200
Vit A Vit C Folate Fe Zn0
20406080
100120140160180200
% R
ND
% R
ND
f. White rice + carrots, an orange, beefand spinach
g. White rice + carrots, an orange, beef,spinach and lentils
Vit A Vit C Folate Fe Zn0
20406080
100120140160180200
Vit A Vit C Folate Fe Zn0
20406080
100120140160180200
% R
ND
% R
ND
a. White rice-based diet
Vit A Vit C Folate Fe Zn0
20406080
100120140160180200
% R
ND
FIGURE 17.1Impact of the addition of selected micronutrient-rich foods to a white rice-based diet onthe recommended nutrient density (RND) of vitamin A, vitamin C, folate, iron (Fe) andzinc (Zn)
Source: adapted from reference (2).
P318-342 3/12/05 17:12 Page 321
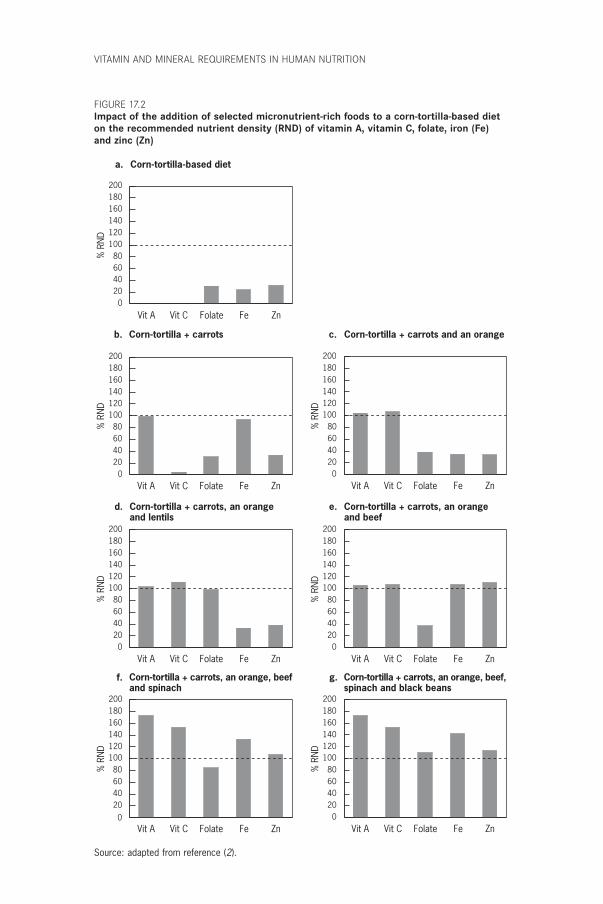
VITAMIN AND MINERAL REQUIREMENTS IN HUMAN NUTRITION
b. Corn-tortilla + carrots c. Corn-tortilla + carrots and an orange
d. Corn-tortilla + carrots, an orangeand lentils
e. Corn-tortilla + carrots, an orangeand beef
Corn-tortilla + carrots, an orange, beefand spinach
g. Corn-tortilla + carrots, an orange, beef,spinach and black beans
Vit A Vit C Folate Fe Zn0
20406080
100120140160180200
% R
ND
Vit A Vit C Folate Fe Zn0
20406080
100120140160180200
% R
ND
Vit A Vit C Folate Fe Zn0
20406080
100120140160180200
% R
ND
Vit A Vit C Folate Fe Zn0
20406080
100120140160180200
% R
ND
Vit A Vit C Folate Fe Zn0
20406080
100120140160180200
% R
ND
Vit A Vit C Folate Fe Zn0
20406080
100120140160180200
% R
ND
a. Corn-tortilla-based diet
Vit A Vit C Folate Fe Zn0
20406080
100120140160180200
% R
ND
f.
FIGURE 17.2Impact of the addition of selected micronutrient-rich foods to a corn-tortilla-based dieton the recommended nutrient density (RND) of vitamin A, vitamin C, folate, iron (Fe)and zinc (Zn)
Source: adapted from reference (2).
P318-342 3/12/05 17:12 Page 322
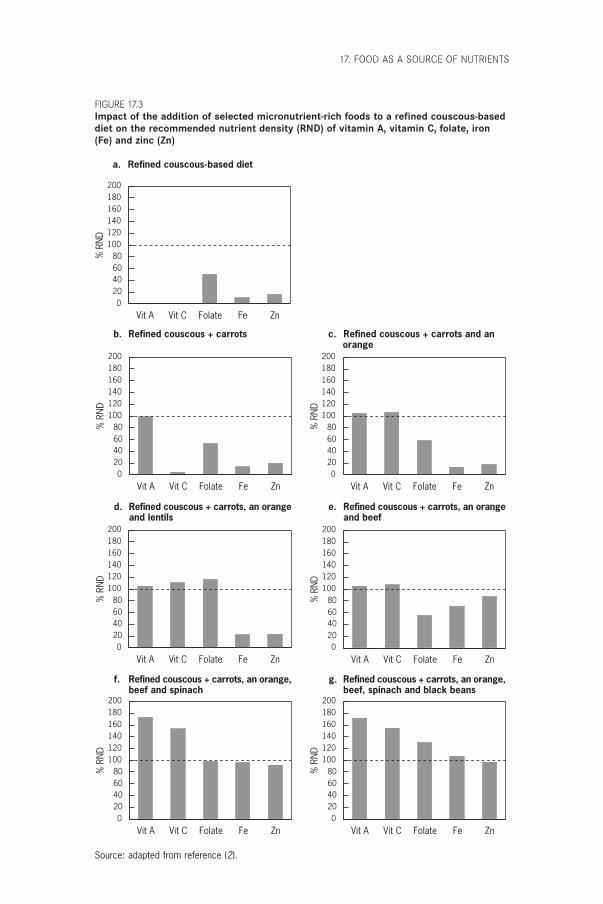
17. FOOD AS A SOURCE OF NUTRIENTS
b. Refined couscous + carrots c. Refined couscous + carrots and an orange
d. Refined couscous + carrots, an orangeand lentils
e. Refined couscous + carrots, an orangeand beef
f. Refined couscous + carrots, an orange,beef and spinach
g. Refined couscous + carrots, an orange,beef, spinach and black beans
Vit A Vit C Folate Fe Zn0
20406080
100120140160180200
% R
ND
Vit A Vit C Folate Fe Zn0
20406080
100120140160180200
% R
ND
Vit A Vit C Folate Fe Zn0
20406080
100120140160180200
% R
ND
Vit A Vit C Folate Fe Zn0
20406080
100120140160180200
% R
ND
Vit A Vit C Folate Fe Zn0
20406080
100120140160180200
% R
ND
Vit A Vit C Folate Fe Zn0
20406080
100120140160180200
% R
ND
a. Refined couscous-based diet
Vit A Vit C Folate Fe Zn0
20406080
100120140160180200
% R
ND
FIGURE 17.3Impact of the addition of selected micronutrient-rich foods to a refined couscous-baseddiet on the recommended nutrient density (RND) of vitamin A, vitamin C, folate, iron(Fe) and zinc (Zn)
Source: adapted from reference (2).
P318-342 3/12/05 17:12 Page 323
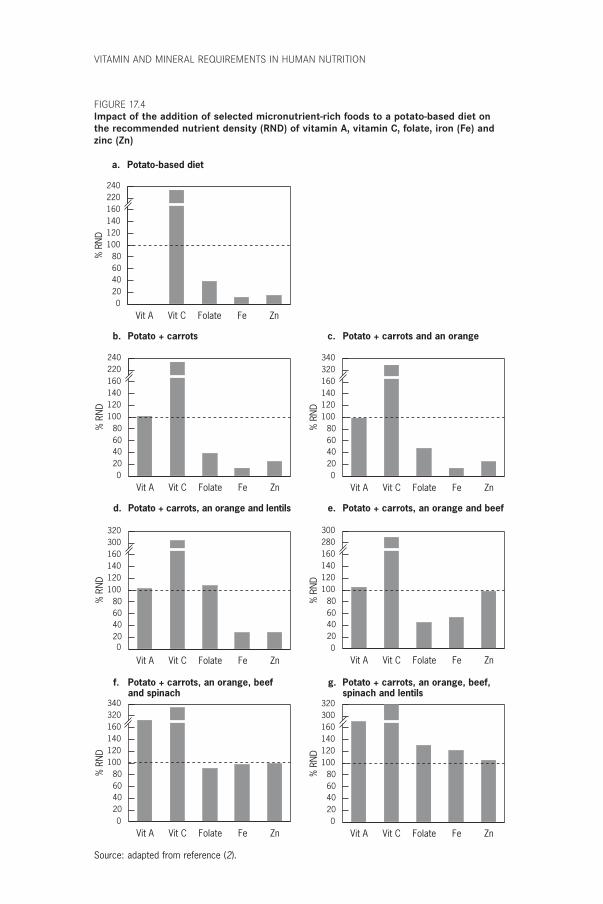
VITAMIN AND MINERAL REQUIREMENTS IN HUMAN NUTRITION
b. Potato + carrots c. Potato + carrots and an orange
d. Potato + carrots, an orange and lentils e. Potato + carrots, an orange and beef
f. Potato + carrots, an orange, beefand spinach
g. Potato + carrots, an orange, beef,spinach and lentils
Vit A Vit C Folate Fe Zn0
20406080
100120140160220240
% R
ND
Vit A Vit C Folate Fe Zn0
20406080
100120140160320340
% R
ND
Vit A Vit C Folate Fe Zn0
20406080
100120140160300320
% R
ND
Vit A Vit C Folate Fe Zn0
20406080
100120140160280300
% R
ND
Vit A Vit C Folate Fe Zn0
20406080
100120140160320340
% R
ND
Vit A Vit C Folate Fe Zn0
20406080
100120140160300320
% R
ND
a. Potato-based diet
Vit A Vit C Folate Fe Zn0
20406080
100120140160220240
% R
ND
FIGURE 17.4Impact of the addition of selected micronutrient-rich foods to a potato-based diet onthe recommended nutrient density (RND) of vitamin A, vitamin C, folate, iron (Fe) andzinc (Zn)
Source: adapted from reference (2).
P318-342 3/12/05 17:12 Page 324
17.2 Dietary diversification when consuming cereal- and tuber-based diets
Dietary diversification is important to improve the intake of critical nutrients.How this can be achieved is illustrated below with reference to five micro-nutrients, which are considered to be of public health relevance or serve as markers for overall micronutrient intake. The nutrients selected for discussion include those that are among the most difficult to obtain in cereal- and tuber-based diets (i.e. diets based on rice, corn, wheat, potato or cassava). Moreover, nutrient deficiencies of vitamin A, iron, and zinc arewidespread.
17.2.1 Vitamin AThe vitamin A content of most staple diets can be significantly improved withthe addition of a relatively small portion of plant foods rich in carotenoids,the precursors of vitamin A. For example, a typical portion of cooked carrots(50g) added to a daily diet, or 21g of carrots per 4.184MJ, provides 500mgretinol equivalents, which is the recommended nutrient density for thisvitamin. The biological activity of provitamin A varies among different plantsources; fruits and vegetables such as carrots, mango, papaya, and meloncontain large amounts of nutritionally active carotenoids (3, 4). Green leafyvegetables such as ivy gourd have been successfully used in Thailand as asource of vitamin A, and carotenoid-rich red palm oil serves as an easily avail-able and excellent source of vitamin A in other countries. Consequently, aregular portion of these foods included in an individual’s diet may provide100% or more of the daily requirement for retinol equivalents (Figures17.1–17.4b). Vitamin A is also present in animal food sources in a highlybioavailable form. Therefore, it is important to consider the possibility ofmeeting vitamin A needs by including animal foods in the diet. For example,providing minor amounts of fish or chicken liver (20–25g) in the diet pro-vides more than the recommended vitamin A nutrient density for virtually allpopulation groups.
17.2.2 Vitamin CAn increased vitamin C intake can be achieved by including citrus fruit orother foods rich in ascorbic acid in the diet. For example, an orange or a smallamount of other vitamin C-rich fruit (60g of edible portion) provides the recommended ascorbic acid density (Figures 17.1–17.3c). Adding an orangeper day to a potato-based diet increases the level of vitamin C threefold(Figure 17.4c). Other good vitamin C food sources are guava, amla, kiwi, cran-berries, strawberries, papaya, mango, melon, cantaloupe, spinach, Swiss chard,
17. FOOD AS A SOURCE OF NUTRIENTS
325
P318-342 3/12/05 17:12 Page 325
VITAMIN AND MINERAL REQUIREMENTS IN HUMAN NUTRITION
326
tomato, asparagus, and Brussels sprouts. All these foods, when added to a dietor meal in regular portion sizes, will significantly improve the vitamin Cdensity. Because ascorbic acid is heat labile, minimal cooking (steaming or stir-frying) is recommended to maximize the bioavailable nutrient. The signifi-cance of consuming vitamin C with meals is discussed relative to ironabsorption below (see also Chapter 13).
17.2.3 FolateFolate is now considered significant not only for the prevention of macro-cytic anaemia, but also for normal fetal development. Recently, this vitaminwas implicated in the maintenance of cardiovascular health and cognitivefunction in the elderly. Staple diets consisting largely of cereal grains andtubers are very low in folate but can be improved by the addition of legumesor green leafy vegetables. For example, a regular portion of cooked lentils (95g) added to a rice-based diet can provide an amount of folate sufficient tomeet the desirable nutrient density for this vitamin (Figure 17.1d). Otherlegumes such as beans and peas are also good sources of this vitamin, butlarger portions are needed for folate sufficiency (100g beans and 170g peas).Cluster bean and colacasia leaves are excellent folate sources used in the Indiandiet. Another good source of folate is chicken liver; only one portion (20–25g) is sufficient to meet the desirable nutrient density for folate and vitaminA simultaneously. The best sources of folate are organ meats, green leafy veg-etables, and Brussels sprouts. However, 50% or more of food folate isdestroyed during cooking. Prolonged heating in large volumes of watershould be avoided, and it is advisable to consume the water used in thecooking of vegetables.
17.2.4 Iron and zincMinerals such as iron and zinc are found in low amounts in cereal- and tuber-based diets. The addition of legumes slightly improves the iron content ofsuch diets. However, the bioavailability of this non-haem iron source is low.Therefore, it is not possible to meet the recommended levels of iron in thestaple-based diets through a food-based approach unless some meat or fish isincluded. For example, adding a small portion (50g) of flesh food will increasethe total iron content of the diet as well as the amount of bioavailable iron.For zinc, the presence of a small portion (50g) of flesh food will secure dietarysufficiency of most staple diets (Figures 17.1–17.4e).
The consumption of ascorbic acid along with food rich in iron will enhanceiron’s absorption. There is a critical balance between enhancers and inhibitors
P318-342 3/12/05 17:12 Page 326
of iron absorption. Nutritional status can be improved significantly by edu-cating households about food preparation practices that minimize the con-sumption of inhibitors of iron absorption; for example, the fermentation of phytate-containing grains before the baking of breads to enhance ironabsorption.
17.3 How to accomplish dietary diversity in practiceIt is essential to create strategies which promote and facilitate dietary diver-sification in order to achieve complementarity of cereal- or tuber-based dietswith foods rich in micronutrients in populations with limited financialresources or access to food. A recent FAO/International Life Sciences Insti-tute publication (5) proposed strategies to promote dietary diversification aspart of food-based approaches to preventing micronutrient malnutrition.These strategies, which are listed below, have been further adapted or modi-fied by the present Expert Consultation:
• Community or home vegetable and fruit gardens. Support for small-scalevegetable and fruit growing should lead to increased production and con-sumption of micronutrient-rich foods (e.g. legumes, green leafy vegetables,and fruits) at the household level. The success of such projects depends ona good knowledge and understanding of local conditions as well as theinvolvement of women and the community in general. These are key ele-ments for supporting, achieving, and sustaining beneficial nutritionalchange at the household level. Land availability and water supply are oftenconstraints, and may require local government support before they areovercome. The educational effort should be directed towards securingappropriate within-family distribution, which considers the needs of themost vulnerable members of the family, especially infants and young children.
• Raising of fish, poultry, and small animals (rabbits, goats, and guinea pigs).Flesh foods are excellent sources of highly bioavailable essential micronu-trients such as vitamin A, iron, and zinc. Raising animals at the local levelmay permit communities to access foods which otherwise would not beavailable because of their high costs. These types of projects also need somesupport from local governments or nongovernmental organizations toovercome cost constraints of programme implementation, including edu-cation and training on how to raise animals.
• Implementation of large-scale commercial vegetable and fruit production.The objective of such initiatives is to provide micronutrient-rich foods at
17. FOOD AS A SOURCE OF NUTRIENTS
327
P318-342 3/12/05 17:12 Page 327
VITAMIN AND MINERAL REQUIREMENTS IN HUMAN NUTRITION
328
reasonable prices through effective and competitive markets which lowerconsumer prices without reducing producer prices. This will serve pre-dominantly the urban and non-food-producing rural areas.
• Reduction of post-harvest losses of the nutritional value of micronutrient-rich foods, such as fruits and vegetables. Improvement of storage and food-preservation facilities significantly reduces post-harvest losses. At the household level, the promotion of effective cooking methods andpractical ways of preserving foods (e.g. solar drying of seasonal micronu-trient-rich foods such as papaya, grapes, mangoes, peaches, tomatoes, and apricots) may preserve significant amounts of micronutrients in foods, which in turn will lead to an increase of these nutrients in the diet.At the commercial level, appropriate grading, packing, transport, and mar-keting practices can reduce losses, stimulate economic growth, and opti-mize income generation.
• Improvement of micronutrient levels in soils and plants, which will improvethe composition of plant foods and enhance yields. Current agriculturalpractices can improve the micronutrient content of foods by correcting soilquality and pH and by increasing soil mineral content where it has beendepleted by erosion and poor soil conservation practices. Long-term food-based solutions to micronutrient deficiencies will require improvement ofagricultural practices, seed quality, and plant breeding (by means of a clas-sical selection process or genetic modification).
The green revolution made important contributions to cereal supplies, and itis time to address the need for improvements in the production of legumes,vegetables, fruits, and other micronutrient-rich foods. FBDGs can serve tore-emphasize the need for these crops.
It is well recognized that the proposed strategies for promoting dietarydiversity need a strong community-level commitment. For example, theincrease in the price of legumes associated with decreased production andlower demand needs to be corrected. The support of local authorities and gov-ernment may facilitate the implementation of such projects because theseactions require economic resources, which are sometimes beyond the reachof those most in need of dietary diversity.
17.4 Practices which will enhance the success of food-based approaches
To achieve dietary adequacy of vitamin A, vitamin C, folate, iron, and zincby using food-based approaches, food preparation and dietary practices mustbe considered. For example, it is important to recommend that vegetables rich
P318-342 3/12/05 17:12 Page 328
in vitamin C, folate, and other water-soluble or heat-labile vitamins are min-imally cooked in small amounts of water. In the case of iron, it is essential toreduce the intake of inhibitors of iron absorption and to increase the intakeof enhancers of absorption in a given meal. Following this strategy, it is rec-ommended to increase the intake of germinated seeds; fermented cereals; heat-processed cereals; meats; and fruits and vegetables rich in vitamin C. Inaddition, the consumption of tea, coffee, chocolate, or herbal infusions shouldbe encouraged at times other than with meals (see Chapter 13). Consumptionof flesh foods improves zinc absorption whereas it is inhibited by consump-tion of diets high in phytate, such as diets based on unrefined cereals. Zincavailability can be estimated according to the phytate–zinc molar ratio of themeal (6) (see Chapter 12).
This advice is particularly important for people who consume cereal-based and tuber-based diets. These foods constitute the main staples for mostpopulations of the world, populations which are also most at risk formicronutrient deficiencies. Other alternatives—fortification and supple-mentation—have been proposed as stopgap measures when food-basedapproaches are not feasible or are still under development. There is a definiterole for fortification in meeting iron, folate, iodine, and zinc needs. Fortifica-tion and supplementation should be seen as complementary to food-basedstrategies and not as a replacement. Combined implementation of these strate-gies can lead to substantial improvements in normalizing the micronutrientstatus of populations at risk. Food-based approaches usually take longer toimplement than supplementation programmes, but once established they aretruly sustainable.
17.5 Delineating the role of supplementation and foodfortification for micronutrients which cannot besupplied by food
Under ideal conditions of food access and availability, food diversity shouldsatisfy micronutrient and energy needs of the general population. Unfortu-nately, for many people in the world, the access to a variety of micronutrient-rich foods is not possible. As demonstrated in the analysis of cereal- andtuber-based diets (see Figures 17.1–17.4), micronutrient-rich foods, includingsmall amounts of flesh foods and a variety of plant foods (vegetables andfruits), are needed daily. This may not be realistic at present for many com-munities living under conditions of poverty. Food fortification and food sup-plementation are important alternatives which complement food-basedapproaches to satisfy the nutritional needs of people in developing and devel-oped countries.
17. FOOD AS A SOURCE OF NUTRIENTS
329
P318-342 3/12/05 17:12 Page 329
VITAMIN AND MINERAL REQUIREMENTS IN HUMAN NUTRITION
330
17.5.1 FortificationFortification refers to the addition of nutrients to a commonly eaten food (thevehicle). It is possible for a single nutrient or group of micronutrients (thefortificant) to be added to the vehicle, which has been identified through aprocess in which all stakeholders have participated. This approach is acceptedas sustainable under most conditions and is often cost effective on a large scalewhen successfully implemented. Both iron fortification of wheat flour andiodine fortification of salt are examples of fortification strategies that haveproduced excellent results (7).
There are at least three essential conditions which must be met in any for-tification programme (7, 8): the fortificant should be effective, bioavailable,acceptable, and affordable; the selected food vehicle should be easily accessi-ble and a specified amount of it should be regularly consumed in the localdiet; and detailed production instructions and monitoring procedures shouldbe in place and enforced by law.
Iron fortificationFood fortification with iron is recommended when dietary iron is in-sufficient or the dietary iron is of poor bioavailability, which is the reality for most people in the developing world and for vulnerable population groupsin the developed world. Moreover, the prevalence of iron deficiency and anaemia in vegetarians and in populations of the developing world whichrely on cereal or tuber foods is significantly higher than in omnivorous populations.
Iron is present in foods in two forms, as haem iron, which is derived from flesh foods (meats and fish), and as non-haem iron, which is the inorganic form present in plant foods such as legumes, grains, nuts, and vegetables (9, 10). Haem iron is the more readily absorbed (20–30%) and its bioavailability is relatively unaffected by dietary factors. Non-haem iron has a lower rate of absorption (2–10%), depending on the balance between iron absorption inhibitors (e.g. phytates, polyphenols, calcium, and phosphate) and iron absorption enhancers (e.g. ascorbic and citric acids, cysteine-containing peptides, ethanol, and fermentation products) present in the diet (9, 10). Because staple foods around the world provide pre-dominantly non-haem iron sources of low bioavailability, the tradi-tionally eaten staple foods represent an excellent vehicle for iron fortification.Examples of foods that have been fortified are wheat flour, corn (maize) flour, rice, salt, sugar, cookies, curry powder, fish sauce, and soy sauce (9). Nevertheless, the beneficial effects of consumption of iron absorption enhancers have been extensively proven and should always be
P318-342 3/12/05 17:12 Page 330
promoted (i.e. consumption of a vitamin C-rich food together with the non-haem iron source).
Iodine fortificationIodine is sparsely distributed in the Earth’s surface and foods grown in soils with little or no iodine lack an adequate amount of this micronutrient.This situation had made iodine deficiency disorders exceedingly common inmost of the world and highly prevalent in many countries before the introduction of salt iodination (11). Only foods of marine origin are naturallyrich sources of iodine. Salt is a common food used by most people worldwide, and the establishment of a well-implemented permanent salt-iodination programme has been proven to eradicate iodine deficiency disorders. Universal salt iodination is the best way to virtually eliminateiodine deficiency disorders (5).
However, salt iodination is not simply a matter of legislating the manda-tory iodination of salt. It is important to determine the best fortification tech-nique, coordinate the implementation at all salt production sites, establisheffective monitoring and quality control programmes, and measure the iodinefortification level periodically. The difficulties in implementing salt iodinationprogrammes arise primarily when the salt industry is widely dispersed amongmany small producers. The level of iodine fortification usually lies between25 and 50mg/kg salt. The actual amount should be specified according to thelevel of salt intake and the magnitude of the deficit at the country level,because iodine must be added within safe and effective ranges. Thus, it is veryimportant to implement a monitoring plan to control the amount of iodinein the salt at the consumer’s table (11, 12). Additionally, United Nations agen-cies responsible for assisting governments in establishing iodination pro-grammes should provide technical support for programme implementation,monitoring, and evaluation to ensure sustainability.
Zinc fortificationThe body depends on a regular zinc supply provided by the daily diet becausestores are quite limited. Food diversity analysis demonstrates that it is virtu-ally impossible to achieve zinc adequacy in the absence of a flesh food source(see Figures 17.1–17.4). Among flesh foods, beef is the best source of zinc,followed by poultry and then fish. Zinc fortification programmes are beingstudied, especially for populations that consume predominately plant foods.Fortification of cereal staple foods is a potentially attractive interventionwhich could benefit the whole population as well as target the vulnerable pop-ulation groups, namely children and pregnant women. Such addition of zinc
17. FOOD AS A SOURCE OF NUTRIENTS
331
P318-342 3/12/05 17:12 Page 331
VITAMIN AND MINERAL REQUIREMENTS IN HUMAN NUTRITION
332
to the diet would decrease the prevalence of stunting in many developingcountries with low-zinc diets, because linear growth is affected by zinc supplyin the body.
Folic acid fortificationThe recommended nutrient density for folic acid is 200mg/4.184MJ (1).Although this value is higher than other standards of reference, the increasein folic acid consumption by women of childbearing age is very important: itmay improve birth weight and reduce the prevalence of neural tube defects(see Chapter 15). Elevated plasma homocysteine levels are considered to bean independent risk factor for heart disease; a higher intake of folic acid mayalso benefit the rest of the population because it may lower homocysteinelevels in adults (see Chapter 15). In addition, folate may improve the mentalcondition of the elderly population (13, 14).
Although the desirable folic acid density may be achieved through dietarydiversity, it requires the daily presence of organ meats, green leafy vegetables,pulses, legumes, or nuts in the diet (15). Most population groups may noteasily reach the appropriate level of folic acid consumption; therefore, folicacid fortification has been recommended. The United States initiated manda-tory folic acid fortification of cereal-grain products in January 1998. The for-tification level approved in the United States is 140mg/100g of product, whichwill increase the average woman’s intake by 100mg/day. This amount is con-sidered safe (a dose that will not mask pernicious anaemia, which results fromvitamin B12 deficiency) and though not optimal in most settings, should con-tribute to the prevention of neural tube defects (16).
17.5.2 SupplementationSupplementation refers to periodic administration of pharmacologic prepara-tions of nutrients as capsules or tablets, or by injection when substantial orimmediate benefits are necessary for the group at risk. As established at theInternational Conference on Nutrition (17), nutritional supplementationshould be restricted to vulnerable groups which cannot meet their nutrientneeds through food (e.g. women of childbearing age, infants and young chil-dren, elderly people, low socioeconomic groups, displaced people, refugees,and populations experiencing other emergency situations). For example, ironsupplementation is recognized as the only effective option to control orprevent iron deficiency anaemia in pregnant women. Supplementation withfolic acid must be considered for women of childbearing age who have had achild with a neural tube defect to prevent recurrence.
P318-342 3/12/05 17:12 Page 332
17.6 Food-based dietary guidelinesFBDGs are an instrument and an expression of food and nutrition policy andshould be based directly on diet and disease relationships of particular rele-vance to an individual country and/or group, such as pregnant and lactatingwomen, children, and the elderly. Their primary purpose is to educate health-care professionals and consumers about health promotion and disease pre-vention. In this way, priorities in establishing dietary guidelines can addressthe relevant public health concerns whether they are related to dietary insuf-ficiency or excess. In this context, meeting the nutritional needs of popula-tions takes its place as one of the components of food and nutrition policygoals along with the priorities included in the FBDGs for improved healthand nutrition for a given population.
The world nutrition and health situation demonstrates that the majorcauses of death and disability have been traditionally related to malnutritionin developing countries and to the imbalance between energy intake andexpenditure (which lead to obesity and other chronic diseases—diabetes, car-diovascular disease, hypertension, and stroke) in industrialized countries. Thetragedy is that many suffer from too little food while others have diseasesresulting from too much food; both, however, would benefit from a more bal-anced distribution of food and other resources. Although the nature of thehealth and nutrition problems in these two contrasting groups is very differ-ent, the dietary guidelines required to improve both situations are not. Mostcountries presently have the combined burden of malnutrition from deficitand increasing prevalence of obesity and other chronic diseases from over-consumption. The approaches to address the problems, however, should becountry and population specific.
Although two thirds of the world’s population depends on cereal-based ortuber-based diets, the other one third consumes significant amounts of animalfood products. The latter group places an undue demand on land, water, andother resources required for intensive food production, which makes thetypical Western diet not only undesirable from the standpoint of health butalso environmentally unsustainable. If energy intake is balanced with theexpenditure required for basal metabolism, physical activity, growth, and cel-lular repair, the dietary quality required for health is essentially the sameacross population groups.
Efforts in nutrition education and health promotion should include astrong encouragement for active lifestyles. Improving energy balance for ruralpopulations in developing countries may mean increasing energy intake tonormalize low body mass index (BMI, weight/height2, calculated as kg/m2),
17. FOOD AS A SOURCE OF NUTRIENTS
333
P318-342 3/12/05 17:12 Page 333
VITAMIN AND MINERAL REQUIREMENTS IN HUMAN NUTRITION
334
ensuring adequate energy stores for daily living. In sedentary urban popula-tions, improving energy balance will mean increasing physical activity todecrease energy stores (body fat mass) and thus normalize BMI. Thus, theapparent conflicting goals—eradicating malnutrition while preventing over-nutrition—are resolved by promoting an appropriate energy balance, whichwill lead to a normal BMI. Moreover, given that FBDGs should be ecologi-cally sustainable, the types and amounts of foods included in a balanced dietare not very different for promoting adequate nutrition in the impoverishedand preventing overnutrition in the affluent.
This is well exemplified by the similarities in the FBDGs across countries,whether represented by pyramids, rainbows, dishes or pots. It is obvious thatconsumption of excess energy will induce an increase in energy stores, whichmay lead to obesity and related health complications. Populations shouldconsume nutritionally adequate and varied diets, based primarily on foods ofplant origin with small amounts of added flesh foods. Households across allregions should select predominantly plant-based diets rich in a variety of vegetables and fruits, pulses or legumes, and minimally processed starchystaple foods. The evidence that such diets will prevent or delay a significantproportion of noncommunicable chronic diseases is consistent. A predomi-nantly plant-based diet has a low energy density, which may protect againstobesity. This should not exclude small amounts of animal foods, which make an important nutritional contribution to plant-food-based diets, as illustrated in the examples presented earlier (Figures 17.1–17.4). Inadequatediets occur when food is scarce or when food traditions change rapidly, as is seen in societies undergoing demographic transitions or rapid urbaniza-tion. Traditional diets, when adequate and varied, are likely to be generallyhealthful and more protective against chronic noncommunicable diseases thanthe typical Western diet, consumed predominantly in industrialized societies(18).
Reorienting food production, agricultural research, and commercializationpolicies needs to take into consideration FBDGs, which increase the demandfor a variety of micronutrient-rich foods and thus stimulate production tomeet consumption needs. Prevailing agricultural policies encourage researchon production and importation of foods, which do not necessarily meet therequirements of FBDG implementation. For example, great emphasis isplaced on cereals, horticultural crops for export, legumes for export, non-foodcash crops, and large livestock. Necessary policy reorientation is required toensure increased availability of micronutrient-rich foods within the local foodsystem. Norway has successfully implemented agricultural and food produc-tion policies based on a national nutrition plan of action, providing economic
P318-342 3/12/05 17:12 Page 334
incentives for the producer and consumer in support of healthful diets. Theresults speak for themselves, as Norway has experienced a sustained improve-ment in life expectancy and a reduction in deaths from cardiovascular diseaseand other chronic noncommunicable conditions.
17.7 Recommendations for the futureThe Consultation acknowledged the limitations in its knowledge of theimportant factors which affect nutrient utilization, and recommended that theInternational Food Data System (INFoods) effort, led by FAO and theUnited Nations University (UNU), be strengthened. Special emphasis shouldbe placed on the micronutrient composition of local diets as affected by theecological setting by including an analysis of food components (nutrients orbioactive components), which may affect the bioavailability and utilization ofcritical micronutrients, and an analysis of cooked foods and typical food com-binations as actually consumed by population groups. In addition, the development of FBDGs at the country level should be supported by UnitedNations agencies.
17.8 Future research needsTo facilitate the implementation of a food-based approach in the pre-vention of micronutrient deficiencies the following research needs were identified:
• food data system development, which includes development of a method-ology for micronutrient composition of foods, organizing data retrieval,and reporting and dissemination through electronic means; this effortshould include phytochemicals, antioxidants, and other components whichmay affect health and nutrition, with special emphasis on local foods whichmay be important for given cultures;
• identification and evaluation of optimal methods for cooking foods to pre-serve the nutrient value and enhance the bioavailability of micronutrients;
• development of better methods to preserve foods, especially micronutrient-rich foods, at the household and community levels;
• identification and propagation of agricultural methods which will enhancethe yield, content, and biological value of micronutrient-rich foods;
• identification of optimal food combinations and serving size which will bemost effective in preventing micronutrient deficits and methods of pro-motion for these food combinations at the community level;
• development of agricultural research to support the implementation ofFBDGs;
17. FOOD AS A SOURCE OF NUTRIENTS
335
P318-342 3/12/05 17:12 Page 335
VITAMIN AND MINERAL REQUIREMENTS IN HUMAN NUTRITION
336
• evaluation of the nutritional impact and cost–benefit of food-basedapproaches in combating micronutrient deficiencies.
References1. Preparation and use of food-based dietary guidelines. Report of a Joint
FAO/WHO Consultation. Geneva, World Health Organization, 1996 (WHOTechnical Report Series, No. 880).
2. Oyarzun MT, Uauy R, Olivares S. Food-based approaches to improve vitaminand mineral nutrition adequacy. Archivos Latinoamericanos de Nutricion(Guatemala), 2001, 51:7–18.
3. Requirements of vitamin A, iron, folate and vitamin B12. Report of a JointFAO/WHO Expert Consultation. Rome, Food and Agriculture Organizationof the United Nations, 1988 (FAO Food and Nutrition Series, No. 23).
4. Olson JA. Needs and sources of carotenoids and vitamin A. NutritionReviews, 1994, 52(Suppl. 2):S67–S73.
5. Preventing micronutrient malnutrition: a guide to food-based approaches.Washington, DC, International Life Sciences Institute Press, 1997.
6. Trace elements in human nutrition. Geneva, World Health Organization, 1996.
7. Lotfi M et al. Micronutrient fortification of foods. Current practices, research,and opportunities. Ottawa, The Micronutrient Initiative, and Wageningen,International Development Research Center/International AgriculturalCenter, 1996.
8. Viteri FE. Prevention of iron deficiency. In: Howson CP, Kennedy ET,Horwitz A, eds. Prevention of micronutrient deficiencies. Tools for policy-makers and public health workers. Washington, DC, National Academy Press,1998, 3:45–102.
9. Hallberg L, Hulthén L, Gramatkovski E. Iron absorption from the whole dietin men: how effective is the regulation of iron absorption? American Journalof Clinical Nutrition, 1997, 66:347–356.
10. Allen LH, Ahluwalia N. Improving iron status through diet. The applicationof knowledge concerning dietary iron bioavailability in human populations.Arlington, VA, John Snow, and Opportunities for Micronutrient Interven-tions Project, 1997.
11. Stanbury JB. Prevention of iodine deficiency. In: Howson CP, Kennedy ET,Horwitz A, eds. Prevention of micronutrient deficiencies. Tools for policy-makers and public health workers. Washington, DC, National Academy Press,1998, 5:167–201.
12. Sullivan KM et al., eds. Monitoring universal salt iodization programs. Ottawa,The Micronutrient Initiative, 1995.
13. Tucker KL et al. Folic acid fortification of the food supply. Potential benefitsand risk for the elderly population. Journal of the American Medical Associa-tion, 1996, 2776:1879–1885.
14. Oakley GP, Adams MJ, Dickinson CM. More folic acid for everyone, now.Journal of Nutrition, 1996, 126(Suppl.):S751–S755.
15. Bower C. Folate and neural tube defects. Nutrition Reviews, 1995, 53(Suppl.2):S33–S38.
16. Daly S et al. Minimum effective dose of folic acid for food fortification toprevent neural-tube defects. Lancet, 1997, 350:1666–1669.
P318-342 3/12/05 17:12 Page 336

17. International Conference on Nutrition. World Declaration and Plan of Actionfor Nutrition, 1992. Rome, Food and Agriculture Organization of the UnitedNations, 1992.
18. Diet, nutrition, and the prevention of chronic diseases. Report of a WHO StudyGroup. Geneva, World Health Organization, 1990 (WHO Technical ReportSeries, No. 797).
17. FOOD AS A SOURCE OF NUTRIENTS
337
P318-342 3/12/05 17:12 Page 337
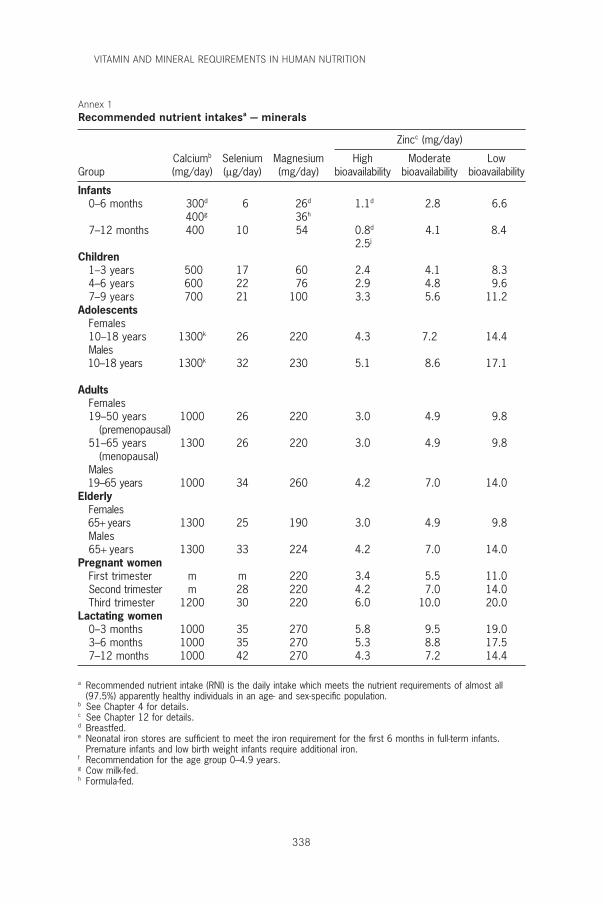
VITAMIN AND MINERAL REQUIREMENTS IN HUMAN NUTRITION
338
a Recommended nutrient intake (RNI) is the daily intake which meets the nutrient requirements of almost all(97.5%) apparently healthy individuals in an age- and sex-specific population.
b See Chapter 4 for details.c See Chapter 12 for details.d Breastfed.e Neonatal iron stores are sufficient to meet the iron requirement for the first 6 months in full-term infants.
Premature infants and low birth weight infants require additional iron.f Recommendation for the age group 0–4.9 years.g Cow milk-fed.h Formula-fed.
Annex 1Recommended nutrient intakesa — minerals
Zincc (mg/day)
Calciumb Selenium Magnesium High Moderate LowGroup (mg/day) (mg/day) (mg/day) bioavailability bioavailability bioavailability
Infants0–6 months 300d 6 26d 1.1d 2.8 6.6
400g 36h
7–12 months 400 10 54 0.8d 4.1 8.42.5j
Children1–3 years 500 17 60 2.4 4.1 8.34–6 years 600 22 76 2.9 4.8 9.67–9 years 700 21 100 3.3 5.6 11.2
AdolescentsFemales10–18 years 1300k 26 220 4.3 7.2 14.4Males10–18 years 1300k 32 230 5.1 8.6 17.1
AdultsFemales19–50 years 1000 26 220 3.0 4.9 9.8
(premenopausal)51–65 years 1300 26 220 3.0 4.9 9.8
(menopausal)Males19–65 years 1000 34 260 4.2 7.0 14.0
ElderlyFemales65+ years 1300 25 190 3.0 4.9 9.8Males65+ years 1300 33 224 4.2 7.0 14.0
Pregnant womenFirst trimester m m 220 3.4 5.5 11.0Second trimester m 28 220 4.2 7.0 14.0Third trimester 1200 30 220 6.0 10.0 20.0
Lactating women0–3 months 1000 35 270 5.8 9.5 19.03–6 months 1000 35 270 5.3 8.8 17.57–12 months 1000 42 270 4.3 7.2 14.4
P318-342 3/12/05 17:12 Page 338
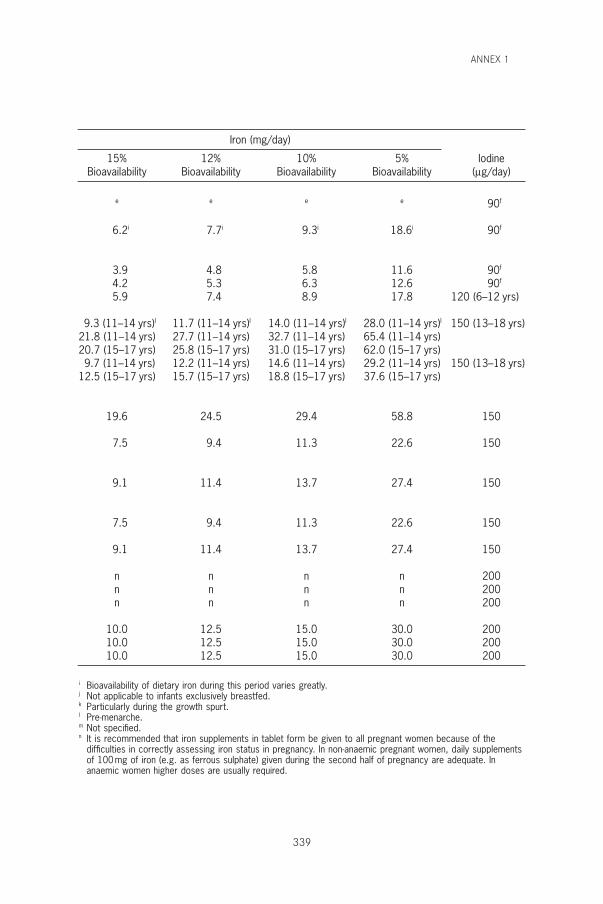
ANNEX 1
339
Iron (mg/day)
15% 12% 10% 5% IodineBioavailability Bioavailability Bioavailability Bioavailability (mg/day)
e e e e 90f
6.2i 7.7i 9.3i 18.6i 90f
3.9 4.8 5.8 11.6 90f
4.2 5.3 6.3 12.6 90f
5.9 7.4 8.9 17.8 120 (6–12 yrs)
9.3 (11–14 yrs)l 11.7 (11–14 yrs)l 14.0 (11–14 yrs)l 28.0 (11–14 yrs)l 150 (13–18 yrs)21.8 (11–14 yrs) 27.7 (11–14 yrs) 32.7 (11–14 yrs) 65.4 (11–14 yrs)20.7 (15–17 yrs) 25.8 (15–17 yrs) 31.0 (15–17 yrs) 62.0 (15–17 yrs)9.7 (11–14 yrs) 12.2 (11–14 yrs) 14.6 (11–14 yrs) 29.2 (11–14 yrs) 150 (13–18 yrs)
12.5 (15–17 yrs) 15.7 (15–17 yrs) 18.8 (15–17 yrs) 37.6 (15–17 yrs)
19.6 24.5 29.4 58.8 150
7.5 9.4 11.3 22.6 150
9.1 11.4 13.7 27.4 150
7.5 9.4 11.3 22.6 150
9.1 11.4 13.7 27.4 150
n n n n 200n n n n 200n n n n 200
10.0 12.5 15.0 30.0 20010.0 12.5 15.0 30.0 20010.0 12.5 15.0 30.0 200
i Bioavailability of dietary iron during this period varies greatly.j Not applicable to infants exclusively breastfed.k Particularly during the growth spurt.l Pre-menarche.m Not specified.n It is recommended that iron supplements in tablet form be given to all pregnant women because of the
difficulties in correctly assessing iron status in pregnancy. In non-anaemic pregnant women, daily supplementsof 100mg of iron (e.g. as ferrous sulphate) given during the second half of pregnancy are adequate. Inanaemic women higher doses are usually required.
P318-342 3/12/05 17:12 Page 339
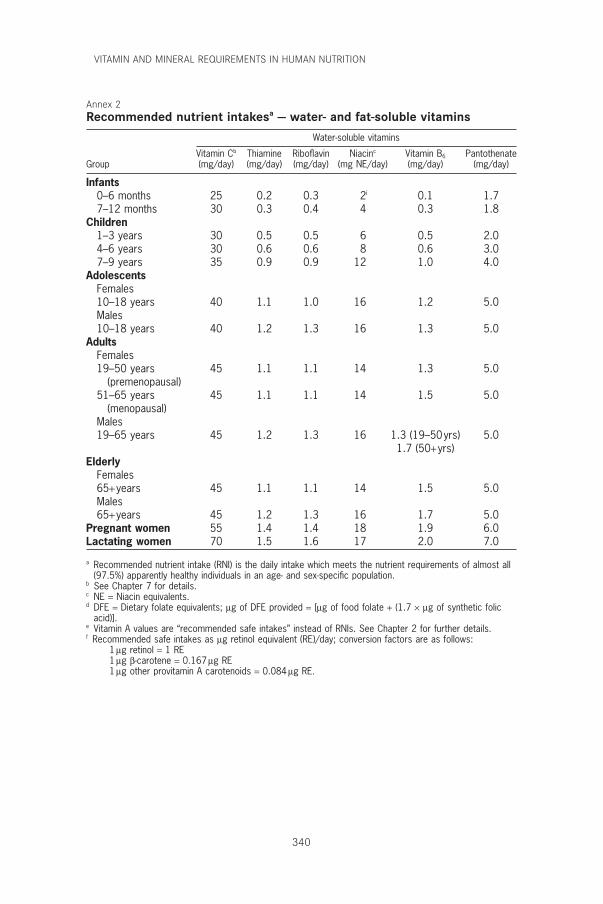
VITAMIN AND MINERAL REQUIREMENTS IN HUMAN NUTRITION
340
Annex 2Recommended nutrient intakesa — water- and fat-soluble vitamins
Water-soluble vitamins
Vitamin Cb Thiamine Riboflavin Niacinc Vitamin B6 PantothenateGroup (mg/day) (mg/day) (mg/day) (mg NE/day) (mg/day) (mg/day)
Infants0–6 months 25 0.2 0.3 2i 0.1 1.77–12 months 30 0.3 0.4 4 0.3 1.8
Children1–3 years 30 0.5 0.5 6 0.5 2.04–6 years 30 0.6 0.6 8 0.6 3.07–9 years 35 0.9 0.9 12 1.0 4.0
AdolescentsFemales10–18 years 40 1.1 1.0 16 1.2 5.0Males10–18 years 40 1.2 1.3 16 1.3 5.0
AdultsFemales19–50 years 45 1.1 1.1 14 1.3 5.0
(premenopausal)51–65 years 45 1.1 1.1 14 1.5 5.0
(menopausal)Males19–65 years 45 1.2 1.3 16 1.3 (19–50yrs) 5.0
1.7 (50+yrs)Elderly
Females65+years 45 1.1 1.1 14 1.5 5.0Males65+years 45 1.2 1.3 16 1.7 5.0
Pregnant women 55 1.4 1.4 18 1.9 6.0Lactating women 70 1.5 1.6 17 2.0 7.0
a Recommended nutrient intake (RNI) is the daily intake which meets the nutrient requirements of almost all(97.5%) apparently healthy individuals in an age- and sex-specific population.
b See Chapter 7 for details.c NE = Niacin equivalents.d DFE = Dietary folate equivalents; mg of DFE provided = [mg of food folate + (1.7 ¥ mg of synthetic folic
acid)].e Vitamin A values are “recommended safe intakes” instead of RNIs. See Chapter 2 for further details.f Recommended safe intakes as mg retinol equivalent (RE)/day; conversion factors are as follows:
1 mg retinol = 1 RE1 mg b-carotene = 0.167 mg RE1 mg other provitamin A carotenoids = 0.084 mg RE.
P318-342 3/12/05 17:12 Page 340
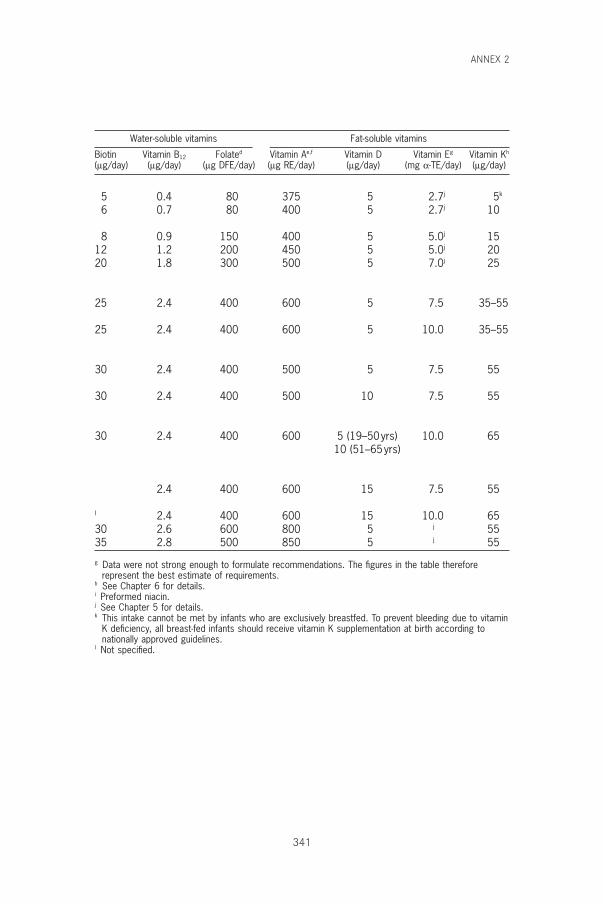
ANNEX 2
341
Water-soluble vitamins Fat-soluble vitamins
Biotin Vitamin B12 Folated Vitamin Ae,f Vitamin D Vitamin Eg Vitamin Kh
(mg/day) (mg/day) (mg DFE/day) (mg RE/day) (mg/day) (mg a-TE/day) (mg/day)
5 0.4 80 375 5 2.7j 5k
6 0.7 80 400 5 2.7j 10
8 0.9 150 400 5 5.0j 1512 1.2 200 450 5 5.0j 2020 1.8 300 500 5 7.0j 25
25 2.4 400 600 5 7.5 35–55
25 2.4 400 600 5 10.0 35–55
30 2.4 400 500 5 7.5 55
30 2.4 400 500 10 7.5 55
30 2.4 400 600 5 (19–50yrs) 10.0 6510 (51–65yrs)
2.4 400 600 15 7.5 55
l 2.4 400 600 15 10.0 6530 2.6 600 800 5 j 5535 2.8 500 850 5 j 55
g Data were not strong enough to formulate recommendations. The figures in the table thereforerepresent the best estimate of requirements.
h See Chapter 6 for details.i Preformed niacin.j See Chapter 5 for details.k This intake cannot be met by infants who are exclusively breastfed. To prevent bleeding due to vitamin
K deficiency, all breast-fed infants should receive vitamin K supplementation at birth according tonationally approved guidelines.
l Not specified.
P318-342 3/12/05 17:12 Page 341

P318-342 3/12/05 17:12 Page 342
Related Documents