Procedia Technology 9 (2013) 189 – 199 2212-0173 © 2013 The Authors Published by Elsevier Ltd. Selection and/or peer-review under responsibility of SCIKA – Association for Promotion and Dissemination of Scientific Knowledge doi:10.1016/j.protcy.2013.12.021 ScienceDirect CENTERIS 2013 - Conference on ENTERprise Information Systems / ProjMAN 2013 - International Conference on Project MANagement / HCIST 2013 - International Conference on Health and Social Care Information Systems and Technologies Visualizing Variability Management in Requirements Engineering through Formal Concept Analysis Tom Huysegoms a * , Monique Snoeck a , Guido Dedene a , Antoon Goderis b , Fra nk Stumpe b a Faculty of Business and Economics, KU Leuven, Naamesestraat 69, B a - 3000 Leuven, Belgium b KBC b Global Services, Havenlaan 2, B - 1080 Brussels, Belgium Abstract While research on the visualization and documentation of variability in software artefacts by means of e.g. feature diagrams is well established, most of these documentation methods in th e field of variability management assume the presence of variability a s a given fact. The decision whether variability within the requirements should actually give rise to variability in the envisaged software artefact is often taken unconsciously and as a result techniques to visualize and document the amount, the structure and the impact of requirements evolution on variability are scarce . This paper provides a real life proof of concept that formal concept analysis (FCA) can be used for th e visualization and documentation of variability r e- lated decisions during (early) requi rements engineering . FCA is used in a real - life case study to check the usabi lity of FCA as a visualization method to support variability management during requirements engineering . The real - life case study also provides initial proof that useful documentation can be obtained by representing the requirements in a FCA concept lattice. Keywords: Requirements management; variabilit y management; formal concept an a l ysis; harmonization; variabilization * Corresponding author. Tel.: +3216326892; fax: +3216326624. E - mail address: t[email protected]. Available online at www.sciencedirect.com © 2013 The Authors Published by Elsevier Ltd. Selection and/or peer-review under responsibility of SCIKA – Association for Promotion and Dissemination of Scientific Knowledge

Welcome message from author
This document is posted to help you gain knowledge. Please leave a comment to let me know what you think about it! Share it to your friends and learn new things together.
Transcript
Procedia Technology 9 ( 2013 ) 189 – 199
2212-0173 © 2013 The Authors Published by Elsevier Ltd.Selection and/or peer-review under responsibility of SCIKA – Association for Promotion and Dissemination of Scientific Knowledgedoi: 10.1016/j.protcy.2013.12.021
ScienceDirect
CENTERIS 2013 - Conference on ENTERprise Information Systems / ProjMAN 2013 - International Conference on Project MANagement / HCIST 2013 - International Conference on Health and Social
Care Information Systems and Technologies
Visualizing Variability Management in RequirementsEngineering through Formal Concept Analysis
Tom Huysegomsa*, Monique Snoecka, Guido Dedenea, Antoon Goderisb, FrankStumpeb
aFaculty of Business and Economics, KU Leuven, Naamesestraat 69, Ba -3000 Leuven, BelgiumbKBC b Global Services, Havenlaan 2, B-1080 Brussels, Belgium
Abstract
While research on the visualization and documentation of variability in software artefacts by means of e.g. feature diagrams is well established, most of these documentation methods in the field of variability management assume the presence of variability as a given fact. The decision whether variability within the requirements should actually give rise to variability in the envisaged software artefact is often taken unconsciously and as a result techniques to visualize and document the amount, the structure and the impact of requirements evolution on variability are scarce. This paper provides a real lifeproof of concept that formal concept analysis (FCA) can be used for the visualization and documentation of variability re-lated decisions during (early) requirements engineering. FCA is used in a real-life case study to check the usability of FCAas a visualization method to support variability management during requirements engineering. The real-life case study alsoprovides initial proof that useful documentation can be obtained by representing the requirements in a FCA concept lattice.
© 2013 Published by Elsevier Ltd. Selection and/or peer-review under responsibility of CENTER-IS/ProjMAN/HCIST.
Keywords: Requirements management; variability management; formal concept analysis; harmonization; variabilization
* Corresponding author. Tel.: +3216326892; fax: +3216326624.E-mail address: [email protected].
Available online at www.sciencedirect.com
© 2013 The Authors Published by Elsevier Ltd.Selection and/or peer-review under responsibility of SCIKA – Association for Promotion and Dissemination of Scientifi c Knowledge

190 Tom Huysegoms et al. / Procedia Technology 9 ( 2013 ) 189 – 199
1. Introduction
Life is simple for a requirements engineer gathering requirements for a new software system when everyone involved has the exact same wishes, ideas and opinions. When the involved stakeholders all have different wishes, ideas or opinions, the story quickly becomes much more complicated for the requirements engineer as (s)he has to somehow manage and integrate these different viewpoints. Combining the different needs of all the stakeholders during requirements engineering (RE) is a form of variability management, where the variability originates from these different needs. Variability in the context of RE is thus defined here as the differences in stakeholders’ needs (and requirements) for a particular software system. This definition is in line with the defi-nition of variability proposed by Kim, Her and Chang [1]. Variability management can be defined, as stated by Schmid and John [2], as “encompassing the activities of explicitly representing variability in software artefacts throughout the lifecycle, managing dependences among different variabilities, and supporting the instantiation of the variabilities”.
The importance of variability management has already been clear in literature since it has been studied in multiple different software development paradigms. A good example can be found in the seminal work of Kang, Cohen, Hess, Novak and Peterson [3]. This seminal work concerning variability frameworks dates from 1990 and is called the Feature-Oriented Domain Analysis (FODA) specification. Multiple variability manage-ment approaches and variability frameworks have been developed since then. Central is the concept of a feature diagram, which according to Schobbens, Heymans and Trigaux [4] can be defined as a family of popular mod-elling languages used for engineering requirements. The central idea of feature diagrams is to visualize the de-composition of the root feature, which represents the main function of the to-be-created software system, into more detailed features. Feature diagrams are used in the whole process of software engineering, and quite often in RE to model common and variable aspects of the to-be-created software system.
Languages like feature diagrams may represent variability formally, but they don’t provide information on the necessity of the inclusion of the variability they represent as they don’t visualize the origin of the variabil-ity. This paper focuses on the origin of the variability before it is decided to be a necessary part of the to-be-created software system. More exactly, it focuses on the possible visualization of the impact of variability deci-sions, the decisions whether or not to include variability in the to-be-created software system requirements, in order to somewhat facilitate the job of the requirements engineer. The second section looks at existing research in the field of variability management and states the research question. The third section defines the variability-related decisions that need to be taken and positions these decisions against the general RE process. Section four proposes an approach to visualize and document the variability-related decisions as they are taken during RE through the use of formal concept analysis. Section five empirically shows the added value that formal con-cept analysis can provide by means of application on a real-life project. Section six gives a conclusion as well as directions for future research.
2. The Research Question
The importance of variability management specifically within the field of RE is acknowledged as an im-portant contemporary research topic. The research on variability management in RE can be positioned in the "Agreement" dimension, one of the dimensions of RE identified by Pohl [5]. The objective related to this di-mension is increasing what Pohl calls the common system specification. This common system specification is that part of the requirements where the different stakeholder’s views have been unified into one agreed upon specification. However, at the same time Pohl acknowledges that some requirements will remain on which none or only partial agreement can be reached between stakeholders. How to manage this absence of agree-ment, and thus variability, is exactly what will be studied in this paper.

191 Tom Huysegoms et al. / Procedia Technology 9 ( 2013 ) 189 – 199
In the field of research on variability management during RE there are several frameworks available to man-age and visualize the variability. Probably the most popular one is feature modelling, with visualization through feature diagrams, as mentioned before [4]. Another research effort on managing variability is known as view-point-oriented RE and leans more closely to the ideas of Pohl. Viewpoint-oriented RE is based on the fact that stakeholders can have different views. In order to handle requirements which are identical between stakehold-ers, also called crosscutting requirements, the concept of aspects is used [6]. Resolving crosscutting require-ments is called viewpoint resolution [7], this resolution of variability is focused however on implementation time and not on design time. The same issue is present in the research on decision modelling, which is a framework for capturing the kind of decisions that need to be made in order to arrive at a specific product in the product line [8].
A limitation of this strand of research is that although these frameworks focus on providing an overview of the variability in the requirements, they always start from the assumption that the decisions concerning what variability to keep and what variablity to put out of scope are already taken. These frameworks do not provide a form of systematic documentation of these variability decisions taken. The central question in this research therefore revolves around the visualization on the variability decisions between the different stakeholders dur-ing RE. More specifically the research question addressed is: “How can variability be visualized to make the impact of variability decisions more clear to all stakeholders?” If the impact of variability decisions can be vis-ualized, this visualization also serves as a form of documentation.
3. Harmonization and Variabilization
Looking at the RE process, many possible ways of identifying phases in this process can be found. The most common way to describe RE is seeing it as an iterative cycle of requirements elicitation, requirements analysis, requirements specification and requirements validation [9]. This is by far the most common view on RE. An-other possible division of RE, one more useful in this context, is to split it up into two big concerns. This divi-sion is based on the concept of the RE problem as defined by Zave and Jackson [10], and later refined by Ju-reta, Mylopoulos and Faulkner [11]. The RE problem can be described as the need to obtain specifications that fulfil the requirements of a to-be-created software system within a particular domain context. These two steps will lead to two concerns of RE.
The first concern, (forming the RE problem) is the central focus during requirements analysis when all the statements from the involved stakeholders are gathered and brought together. Activities like requirements gath-ering and requirements elicitation can also typically be linked to this first concern. Once all statements are col-lected, the requirements engineer has a complete overview of how the specific project’s RE problem looks like for the to-be-created software system. The second concern then comes into play. This concern (solving the RE problem) is central during requirements specification when the requirements engineer develops a set of specifi-cations to which the to-be-created software system should adhere to. The objective at this point in time is to take into account as much as possible the statements issued by the stakeholders. Requirements validation can also typically be linked to this second RE concern. The remark can be made that there are RE activities which cannot be clearly be linked to one of the two concerns described here. Requirements management for instance typically encompasses both RE concerns. Nevertheless, a focus on these key concerns is important in variabil-ity management, since RE becomes complex when variability is introduced. Variability management boils down to taking two decisions. These decisions are called harmonization and variabilization and are explained in more detail in [12].
Harmonization starts after gathering the requirements of the to-be-created software system from the demand side stakeholders, the stakeholders who utter requirements, with the identification of common requirements in order to obtain a view on the amount and areas of variability in the requirements. It should be more than just a passive process of comparing requirements by the requirements engineer alone. When the demand side stake-
192 Tom Huysegoms et al. / Procedia Technology 9 ( 2013 ) 189 – 199
holders and the requirements engineer engage actively in discussions on the requirements, these requirements (and the underlying variability) are put to the test. As such it is more than just an observation as harmonization also involves negotiation with the demand side stakeholders in order to obtain more common requirements. Harmonization as such impacts Pohl’s “Agreement” dimension [5]. This is beneficial to the demand side stake-holders in a sense that requirements shared by more stakeholders typically have a higher chance to be retained and implemented in the to-be-created software system. The systematic discussions will also have impact the supply side stakeholders, the stakeholders who will be providing the to-be-created software system. The bene-fits of a systematic approach for the supply side are known to be: opportunities for rapid new development due to reuse, decreased development costs and decreased effort that needed to implement instances of the to-be-created software system [13].
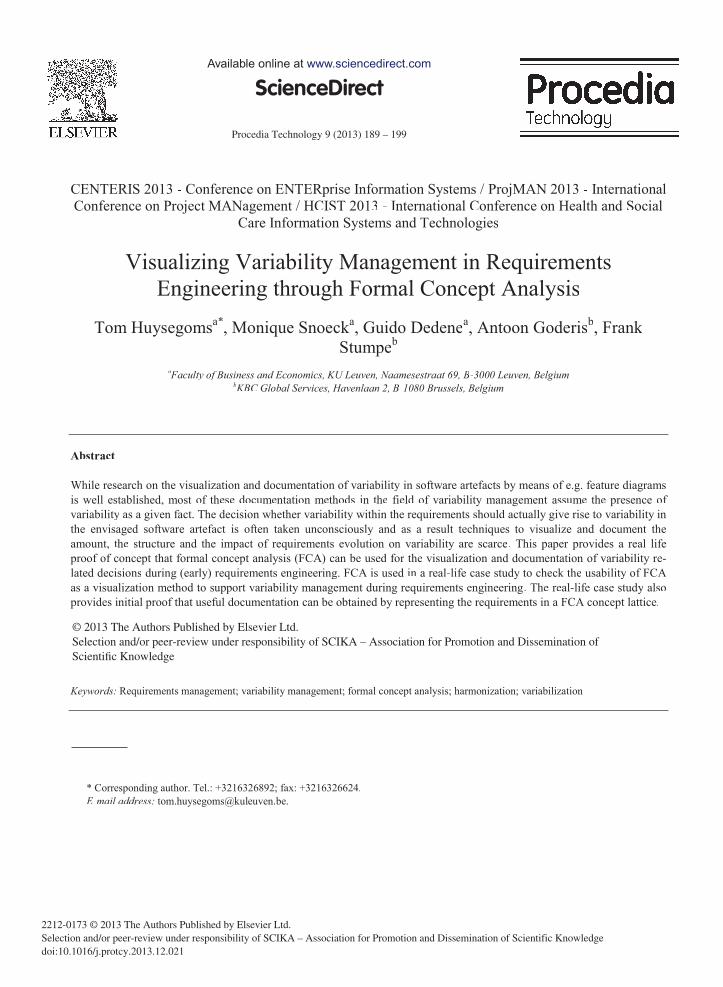
Fig. 1. Harmoniation (1) and Variabilization (2)
Variabilization is the second decision concerning the variability, which can be taken after the harmonization is done. Variabilization is a negotiation on which requirements not common for all demand side stakeholders should be retained within the RE problem of the to-be-created software system during further development. Indeed, not all collected requirements will also be effectively incorporated into the to-be-created software sys-tem. Some requirements are not entirely common to all stakeholders, but still shared among some of them. Such shared variability can be retained, while other, more specific, requirements will be considered out of scope for the to-be-created software system. Once again, like the harmonization, the variabilization decision can better be taken consciously by the requirements engineer with all possible input of the stakeholders, since they are not only paying for the to-be-created software, but they will also have to cope themselves with the var-iability they deem important but is not retained to be supported by the to-be-created software. Fig. 1 represents both harmonization (1) and variabilization (2) decisions.
Now that both variability decisions are known, one can try to link them within the RE concerns defined ear-lier. The variability decisions do not link to the concern of ‘forming the RE problem’ since the overview of the totality of the requirements is only obtained after the RE problem is formed. Without an overview of the re-quirements, and the variability herein, it would be impossible to decide anything in terms of harmonization or variabilization. The concern of ‘solving the RE problem’ on the other hand may seem a good candidate to link the variability decisions to at first sight. However for this concern the set of requirements that needs to be satis-fied is considered fixed, albeit that some can be mandatory and some can be optional. The problem is that dur-ing harmonization requirements can still shift due to the discussions between the requirements engineer and the stakeholders. These shifts make it very difficult to solve the RE problem optimally a priori. It can thus be said that the variability decisions don’t fit well to either of the RE concerns. This could explain why contemporary research rooted in the research of Zave and Jackson [10] has difficulties providing explicit visualization support for the variability decisions. The solution is to add some kind of third step located in between defining and solving the requirements problem.
193 Tom Huysegoms et al. / Procedia Technology 9 ( 2013 ) 189 – 199
The requirements engineer should be the one responsible for the ‘harmonization and variabilization’ con-cern. He or she will need to communicate with all the other stakeholders on the variability in the requirements so that conscious decisions on the variability can be made. Prior research [14] has shown that the absence of conscious decisions and communication about variability, may lead to failed software projects. Visualization is often an effective way to support communication as it provides support for increasing the focus on the appro-priate issues. At the same time the visualization can be used later on as a form of documentation on the varia-bility decisions. The use of the visualization technique to solve the complete traceability problem [15] in RE is however out of scope in this paper.
4. Formal Concept Analysis for Requirements Engineering
Formal concept analysis (FCA) was created as mathematical theory with the purpose to identify concepts and to create a mathematical order among these concepts. A good way to state the aim of FCA can be found in the work of Wille [16]: “The aim and meaning of FCA is to support the rational communication of humans by mathematically developing appropriate conceptual structures which can be logically activated.” This clearly states that FCA can be used to support the rational communication by humans, which is the objective of this research on variability. While originally mostly used in mathematical theory, the visualization aspects of FCA became more and more popular over the years due to the fact that they are easily readable. More on the ease of readability and communication capabilities of FCA can be found in the work of Eklund, Ducrou and Brawn [17]. Nowadays the visualization capacities of FCA are used not only to purely visualize data, but also to mine knowledge out of data. An overview on all the uses of FCA can be found in the work of Poelmans, Elzinga, Viaene and Dedene [18]. Within this work it can be seen that FCA has not much been used in the field of RE, which strengthens the choice for FCA as a novel approach to visualize the variability decisions in RE. In order to comprehensibly explain the technique of FCA a small example is given below.
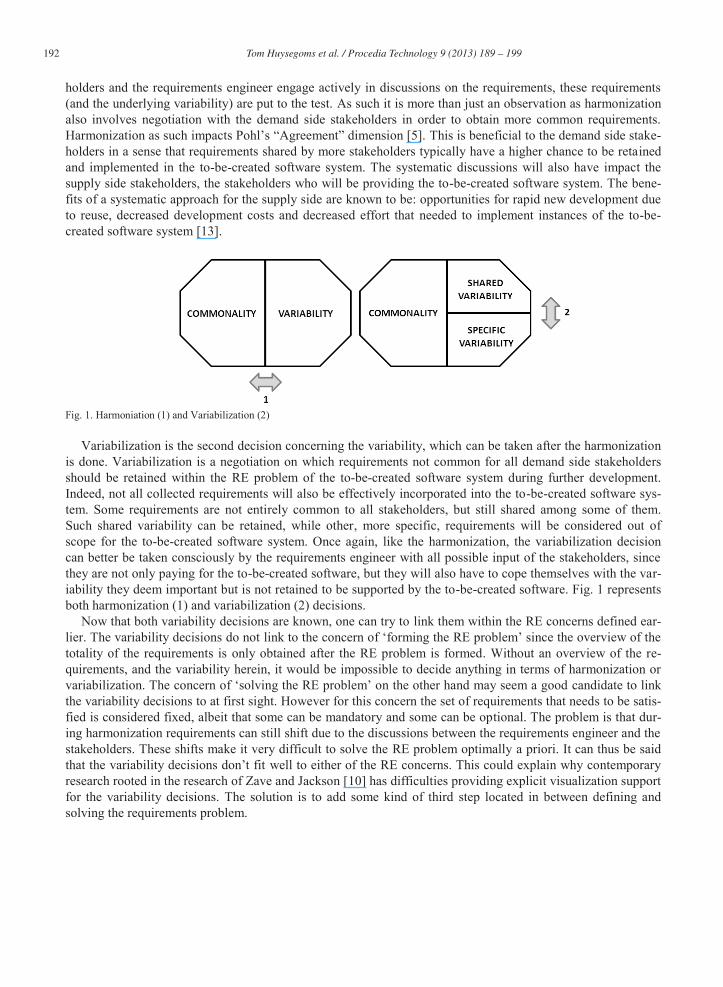
Fig. 2. The formal context of fruit both in table and lattice format
The table on the left of Fig. 2 lists certain types of fruits with their colour and flavour. The types of fruit are the objects O = {apple, banana, cherry, lemon}. The colour and the flavour of the fruit are called the properties A = {red, green, yellow, sweet, sour}. Objects and their properties are related as indicated by the X’s in the table. The whole of objects (O), properties (A) and their one-to-one pair wise relations (I) is called the formal context (O, A, I). An example of such a relation is the pair {apple, red}. This formal context (O, A, I) will be
194 Tom Huysegoms et al. / Procedia Technology 9 ( 2013 ) 189 – 199
mathematically transformed into a structure called a concept lattice. The transformation of the formal context into a concept lattice is one where no information is lost. The concept lattice obtained after transformation can be represented visually to facilitate communication on the formal context. The graph representing the concept lattice belonging to the formal context on the fruit can be seen on the right side of Fig. 2.
A set of objects X and a set of properties Y together form a formal concept (X, Y) of the formal context (O, A, I) if and only if each object of X has all the properties of Y, and if each object which does not belong to X has at least one property which is not in Y. In the case the above is true, X will be called the extent of the for-mal concept, and Y will be called the intent of the formal concept. An example of a formal concept (X, Y) for the formal context on fruit is the one where X = {apple, cherry} is the extent and Y = {red, sweet} is the intent. Once all formal concepts are identified, they can be partially ordered. If there are e.g. two formal concepts (X, Y) and (V, W) one can order them as (X, Y) ≤ (V, W) when the set objects X is a subset of the set of objects V. Alternatively, they can also be ordered as (X, Y) ≤ (V, W) when the set of properties W is a subset of the set of properties Y. In the formal context on the fruit, it can be seen that e.g. the formal concept (X, Y) with extent X = {apple, cherry} and intent Y = {red, sweet}; and the formal concept (V, W) with extent V = {apple, banana, cherry} and intent W = {sweet} can be partially ordered in the way that (X, Y) ≤ (V, W) since {apple, cherry} is a subset of {apple, banana, cherry} and {sweet} is a subset of {red, sweet}.
This partial ordering of the formal concepts is exactly what is visualized in the graph of the concept lattice. In Fig. 2 the formal concept (X, Y) = ({apple, cherry}, {red, sweet}) is the represented by the second node on the third row, while the formal concept (V, W) = ({apple, banana, cherry}, {sweet}) is represented by the node on the second row. The formal concept (V, W) is located higher than the formal concept (X, Y) which is the logical representation of the partial ordering (X, Y) ≤ (V, W). The advantage of creating a concept lattice is this visualization of that partial ordering and the resulting visualisation of the level to which properties are shared by objects. The latter is exactly what is usable in the context of variability management to communicate more clearly about requirements and the variability in requirements. In order to be able to represent the requirements in a lattice the stakeholders which utter the requirements will be the concepts, and the requirements themselves will be the properties.
5. QBS, a Real Life Formal Context
In order to test the visualization capabilities of FCA for variability a case study was conducted. This case study focused on QBS, a customer relationship management system within the context of a major national in-surance company which works with local insurance agencies. All the insurance agencies work semi-independently with their own business vision and strategy and can vary both in size and types of customers they wish to address. In total there are over 300 local agencies which, although they work semi-independently, still are dependent on the central headquarters’ IT department for their software systems. Since the current ver-sion of QBS became outdated a newer version was to be made.
Table 1. Overview of QBS requirements
# of requirements (# requirements represented from total amount requirements)
Total amount of requirements 233 Total amount of unified requirements 66 (233 of 233) Unified requirements shared ≥ 50% 16 (82 of 233) Unified requirements shared <50% 50 (151 of 233) Unified requirements shared 100% 1 (12 of 233)

195 Tom Huysegoms et al. / Procedia Technology 9 ( 2013 ) 189 – 199
This provided an opportunity to execute the RE phase with an appropriate focus on the variability decisions. The requirements gathering was done through individual interviews with a representative set of insurance agents used by the company for all IT projects. A list of 233 uttered requirements originating from 8 different insurance agents was extracted. The issue was that some requirements within the requirements list were actual-ly duplicates of each other since some of the requirements were stated by multiple agents in different wordings, like mentioned by Pohl [5]. Therefore a normalization step was performed during which duplicate requirements were identified and a ‘normalized’ formulation of these requirements was defined.
After this normalization only 66 unified requirements remained, which were shared by one or more agents, like mentioned in Table 1. These 66 unified requirements represent the 233 ‘original’ requirements, as men-tioned between brackets. Out of these 66 unified requirements 16 were shared by 50% or more of the agents. These 16 unified requirements represent 82 out of the 233 original requirements. The remaining 50 unified requirements were shared by less than 50% of the agents and represented 151 of the original requirements.
Fig. 3. The QBS unified requirements concept lattice
196 Tom Huysegoms et al. / Procedia Technology 9 ( 2013 ) 189 – 199
As it is not possible to disclose the exact content of all the requirements themselves due to legal reasons, the requirements received a number as a unique identifier by which they can be identified and they will be also referenced through this number in the remainder of the paper. The interviewed agents will be denoted by letters of the Greek alphabet. The resulting concept lattice graph shown in Fig. 3 provides a clear overview of the re-quirements and the amount and structure of the variability present in the requirements.
While the concept lattice graph may seem quite complex at first, it is fairly easy to extract some interesting observations straight away. Some of the more interesting figures mentioned in Table 1 can be deducted from the concept lattice graph. There is one requirement (req 14) shared by all agents as can be seen on row 1 in Fig. 3. There are 22 requirements not shared at all; these are uttered by only a single agent as can be seen on row 7. The 16 requirements linked to nodes on rows 1-4 are shared by at least 50% of the stakeholders.
Besides the information present in Table 1, some additional information on the variability within the re-quirements can easily be read from the concept lattice graph. Agent Gamma did not state any requirements which were unique for him, which makes him a ‘good’ stakeholder in a sense that he generates less variability compared to agent Zeta, who has no less than 6 unique requirements. When harmonization is started it would thus be more beneficial to try to persuade agent Zeta to drop some of his own specific requirements, than it would be to persuade agent Delta or Epsilon, since agent Zeta is more likely to be a bigger source of specific variability in the end. The concept lattice graph hence offers interesting clues to the requirements engineering on what to focus on during the harmonization efforts.
It is also quite easy to perform additional analysis by drawing additional concept lattice graphs on subsets of concepts and/or attributes which you want to study more in depth. A good way to devise subsets of require-ments is to delineate categories with in the set of requirements. In the QBS case study several sub-lattices were drawn, based on delineating categories of requirements. The formal contexts for these categories consisted of all the concepts (agents) from the original lattice, but only a subset of the properties (requirements). Here con-cept lattice graphs are given for both the ‘ease of use’ type of requirements and the ‘data feeds’ type of re-quirements. These two specific categories of requirements are chosen as illustrative examples, since the ‘ease of use’ requirements contains much variability (the requirements are almost not shared at all) while the ‘data feeds’ requirements contains much less variability (the requirements are shared by almost everyone). This amount of variability is reflected in the shape of the concept lattice graphs. The ‘data feeds’ concept lattice graph on the left in Fig. 4 has a slimmer shape (less formal concepts at the same level in the concept lattice graph) compared to the ‘ease of use’ concept lattice graph on the right in Fig. 4. The ‘data feeds’ lattice is three concepts wide at most (the level shared by 2/8) while the ‘ease of use’ lattice is at most six concepts wide (the level shared by 1/8).
The advantage of analyzing subsets of requirements according to their category, besides the higher clarity of the graphs themselves, makes it possible for the requirements engineer to quickly focus on the requirement types which contain more variability or are considered of higher priority, and thus demand more attention dur-ing the variability decisions sub-phase. Once the lattices representing subsets of requirements are drawn, the same information can be gathered as described for Fig. 3 earlier on. For instance, from Fig. 4 it can easily be deduced that the ease of use requirements of agent Gamma are a subset of those of agent Theta and that those of agent Epsilon are a subset of those of agent Beta. Agent Gamma and Epsilon are thus more ‘harmonized’ agents than agents Theta and Beta respectively. Another example in Fig. 4 is that agent Epsilon and Theta are completely ‘harmonized’ with each other concerning the data feeds since they are linked to the same node in the data feeds concept lattice graph. It must be noted that by only analyzing subsets of requirements some of the information on the variability is lost, since the interactions between the subsets are not be represented in the graphs of the subsets. Therefore the general graph cannot be left aside in favour of the subset graphs.

197 Tom Huysegoms et al. / Procedia Technology 9 ( 2013 ) 189 – 199
Fig. 4. The ‘data feeds’ lattice (left) and the ‘ease of use’ lattice (right)
Besides the pure visual representation of variability, the effect of harmonization and variabilization deci-sions can also be easily visualized, and thus documented, through FCA lattice graphs. Harmonization can be seen as trying to bring the requirements higher in the lattice graph through negotiation with the stakeholders, or to make stakeholders dropping requirements if they are too low on the graph. An example is given based on the ‘data feeds’ concept lattice graph depicted Fig. 4. After analyzing this graph, requirements 51 and 52 were identified as good candidates to be dropped, by Gamma and Zeta; and by Delta and Eta respectively. Visually this can be easily identified as requirements 51 and 52 are located to the ‘side’ of the lattice graph compared to the main body of requirements. This resulted in the lattices shown in Fig. 5. As can be seen in both of these concept lattice graphs, the removal of one requirement immediately leads to an even more harmonized set of requirements, as the lattice becomes even more slender with a maximum width of only two concepts.
Fig. 5. The ‘data feeds’ lattice without req 51 (left) or without req 52 (right) with variabilization line drawn
198 Tom Huysegoms et al. / Procedia Technology 9 ( 2013 ) 189 – 199
Variabilization can be visualized on the lattices as well. It is essentially positioning some imaginary bounda-ry line within the lattice at a certain level to divide the requirements which will be supported and the require-ments which will be left aside. Typically the ‘variabilization boundary line’ divides the graph into an upper, supported part (shared variability) and a lower unsupported part (specific variability). Assuming that shared variability is variability shared by at least half of the QBS agents, this variabilization boundary would run were the dotted lines are marked on Fig. 5.
6. Conclusion and Future Research
A previous case study [13] already demonstrated the importance of good and clear communication during RE. Variability management, which is a substantial part in RE from the moment several stakeholders are in-volved, is one aspect of requirements management for which the communication is even more key if the varia-bility decisions (as a part of the RE problem) are to be taken in a traceable and objective way. In order to achieve this, a way of visualizing the impact of variability decisions is studied. The technique of formal con-cept analysis is identified as a good, yet unexplored, potential candidate visualization method, since no mention is made of its use in this particular context in existing surveys on formal concept analysis [18].
With the aid of a real-life case study within the insurance sector called QBS the value of formal concept analysis is tested. This pilot study resulted in the indication that visualization through formal concept analysis can create value as it is a way to visually identify the points of attention that need to be focused upon when making the variability decisions. The QBS case study however revealed that using formal concept analysis only on the total set of requirements in real life is insufficient, since the lattice can become quite complex. In order to have a better visualization additional lattices can be created based on subsets of requirements divided by their type, which is context depended. It is not good however to only focus on the subset lattices as some in-formation on the interaction between the types of requirements can only be observed in the lattice on all the requirements.
Whereas in the pilot-study the researchers were taking the role of requirements engineers, future research will focus on providing a validation cycle with the actual requirements engineers of the QBS project. Based on the case study the added value of visualizing variability through concept lattices can be shown to practitioners in order to generate feedback from them. Next, the utility of the FCA visualization for the stakeholders will also be tested, by investigating how the FCA-graph might influence their willingness to negotiate. Besides val-idation future research will also look into adding even more information in the visualization. Right now there is no way to visualize conflicting requirements or requirement dependencies. Adding this would improve the val-ue of the variability concept lattices.
Acknowledgements
We gratefully acknowledge KBC Global Services NV (member of the KBC Group) for funding this re-search. We also gratefully acknowledge all participants of the case study for their invested time and effort.
References
[1] Kim, S.D., Her, J.S., Chang, S.H., 2005. A theoretical foundation of variability in component-based development, Information and Software Technology 47, p. 663-673.
[2] Schmid, K., John, I., 2004. A customizable approach to full lifecycle variability management, Science of Computer Programming 53, p. 259-284.
[3] Kang, K.C., Cohen, S.G., Hess, J.A., Novak, W.E., Peterson, A.S., Feature-Oriented Domain Analysis (FODA) feasibility study,
199 Tom Huysegoms et al. / Procedia Technology 9 ( 2013 ) 189 – 199
Software Engineering Institute, Carnegie Mellon University, 1990. [4] Schobbens, P., Heymans, P., Trigaux, J.-C., 2006. “Feature Diagrams: A Survey and a Formal Semantics," 14th IEEE International
Requirements Engineering Conference. Minneapolis, USA. [5] Pohl, K., 1993. The three dimensions of requirements engineering, Lecture Notes in Computer Science 685, p. 275-292. [6] Pu, Y.N., Liu, Q., 2009. "A Viewpoint-Oriented Requirements Elicitation Integrated with Aspects," WRI World Congress on Computer
Science and Information Engineering, Beijing, China. [7] Sampaio do Prado Leite, J.C., Freeman, P.A., 1991. Requirements validation through viewpoint resolution. IEEE Transactions on
Software Engineering 17, p. 1253-1269. [8] Schmid, K., Rabiser, R., Grünbacher, P., 2011. “A comparison of decision modeling approaches in product lines,” 5th Workshop on
Variability Modeling of Software-Intensive Systems. New York, USA. [9] Nuseibeh, B., Easterbrook, S., 2000. “Requirements engineering: a roadmap,” Conference on The Future of Software Engineering. New
York, USA. [10] Zave P., Jackson, M., 1997. Four dark corners of requirements engineering. ACM Transactions on Software Engineering Methodology
6, p. 1-30 [11] Jureta, I., Mylopoulos, J., Faulkner, S., 2008. “Revisiting the Core Ontology and Problem in Requirements Engineering,” 16th IEEE
International Requirements Engineering Conference. Barcelona, Spain. [12] Huysegoms, T., Snoeck, M., Dedene, G., Goderis, A., Stumpe, F., 2013. A case study on variability management in software product
lines: identifying why real-life projects fail. International Journal of Information Systems and Project Management 1, p. 31-42. [13] Coplien, J.,Hoffman, D., Weiss, D., 1998. Commonality and variability in software engineering. IEEE Software 15, p.37-45. [14] Huysegoms, T., Snoeck, M., Dedene, G., Goderis, A., 2011. Requirements for Successful Software Development with Variability: A
Case Study. Communications in Computer and Information Science 219, p. 238-247. [15] Gotel, O.C.Z. , Finkelstein, A.C.W., 1994. "An analysis of the requirements traceability problem," 1st IEEE International
Requirements Engineering Conference. Colorado Springs, USA. [16] Wille, R., 2005. Formal concept analysis as mathematical theory of concepts and concept hierarchies. Lecture Notes in Computer
Science 3626, p. 1-33. [17] Eklund, P., Ducrou, J., Brawn, P., 2004. Concept Lattices for Information Visualization: Can Novice Read Line Diagrams? Lecture
Notes in Computer Science 2961, p. 57-73. [18] Poelmans, J., Elzinga, P., Viaene, S., Dedene, G., 2010. Formal concept analysis in knowledge discovery: A survey. Lecture Notes in
Computer Science 6208, p. 139-153.
Related Documents


