Visualizing Open Access building a scalable infrastructure to showcase the reach of MIT research

Welcome message from author
This document is posted to help you gain knowledge. Please leave a comment to let me know what you think about it! Share it to your friends and learn new things together.
Transcript

Visualizing Open Accessbuilding a scalable infrastructure to
showcase the reach of MIT research

Background
Background
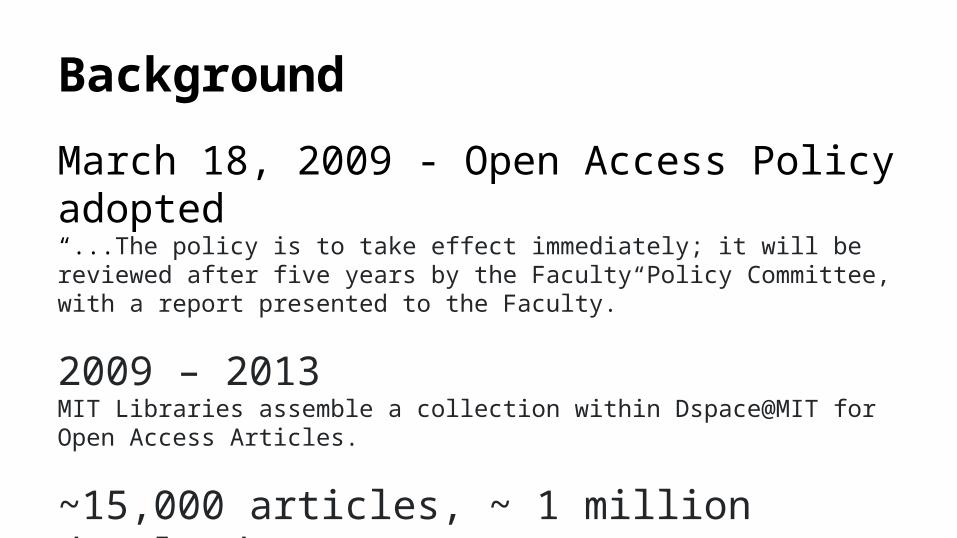
March 18, 2009 - Open Access Policy adopted“...The policy is to take effect immediately; it will be reviewed after five years by the Faculty Policy Committee, with a report presented to the Faculty.”
Background
March 18, 2009 - Open Access Policy adopted“...The policy is to take effect immediately; it will be reviewed after five years by the Faculty Policy Committee, with a report presented to the Faculty.”
2009 – 2013 MIT Libraries assemble a collection within Dspace@MIT for Open Access Articles.
~15,000 articles, ~ 1 million downloads

Background
~15,000 articles, ~ 1 million downloads, but…
Author-level information?Department-level information?

Background
March 18, 2009 - Open Access Policy adopted“[P]olicy … will be reviewed after five years…”
August 2013 - Project begins“Implement author-level, article-level, and aggregated article download usage statistics for articles in the Open Access Articles Collection in DSpace@MIT to incentivize deposits and provide useful assessment information for the MIT Faculty Open Access Policy.”

Prior Work
Prior Work
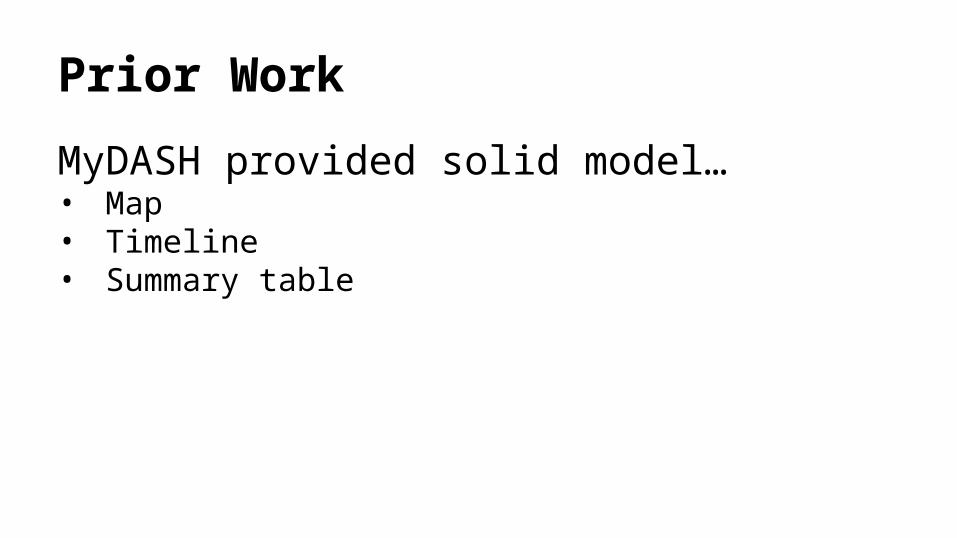
MyDASH provided solid model…• Map• Timeline• Summary table

Prior Work
MyDASH provided solid model…• Map• Timeline• Summary table
… but couldn’t be directly implemented.• Repository versus One Collection• Multiple department affiliations
Project Goals
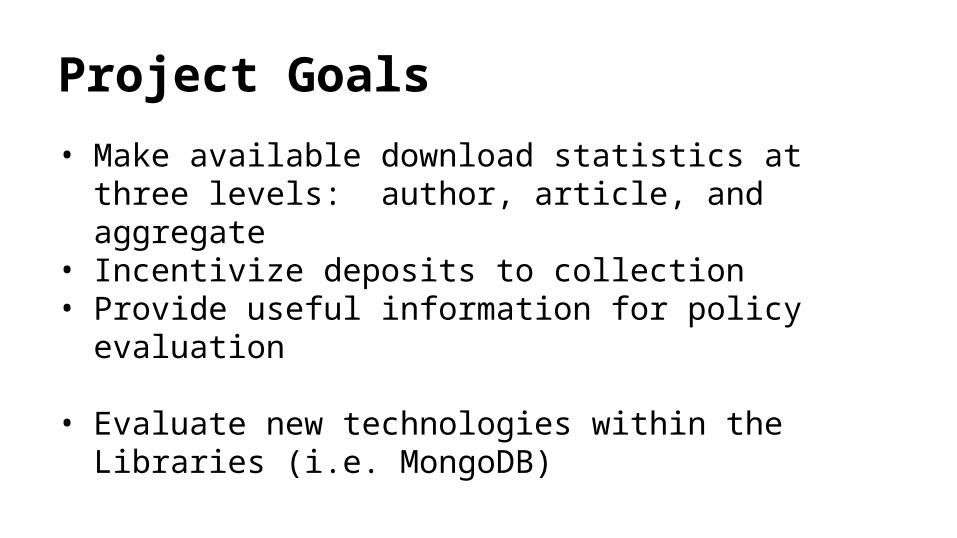
• Make available download statistics at three levels: author, article, and aggregate
• Incentivize deposits to collection• Provide useful information for policy evaluation
• Evaluate new technologies within the Libraries (i.e. MongoDB)

Pipeline

Two-part project
Data processing pipelinehttps://github.com/MITLibraries/oastats-backend
Visualization interfacehttps://github.com/MITLibraries/oastats-ui

Pipeline
https://github.com/MITLibraries/oastats-backend
• Apache logs• Python• DSpace• GeoIP• SOLR

Pipeline
Start from Apache server logs
● Filter the qualifying downloads● Look up the downloaded paper● Augment with additional information● Store in MongoDB● Use SOLR to build summary collection
UI queries summary collection

Pipeline

Pipeline challenges

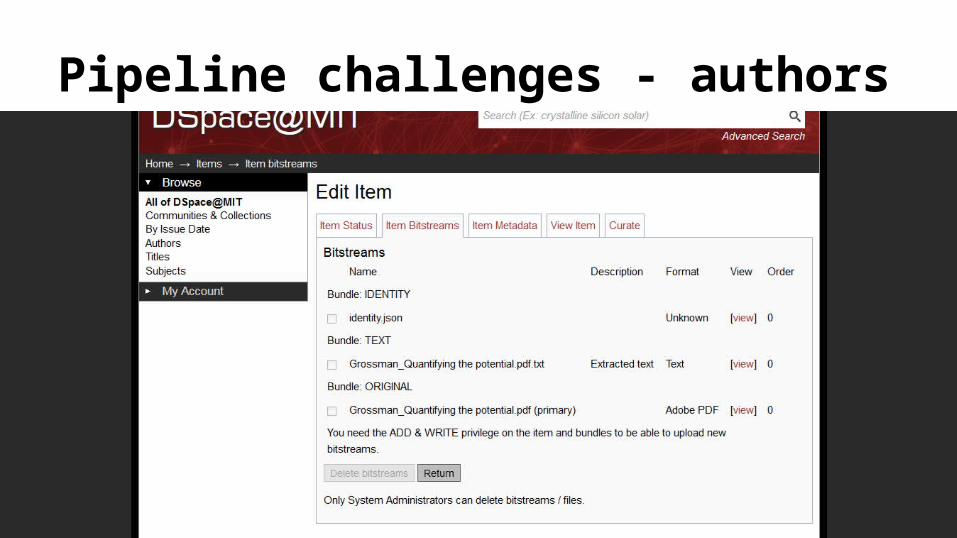
Pipeline challenges - authors
Author identities● Field-specific naming conventions
o “Abelson, Hal”o “Abelson, H”o “Hal Abelson”
● Common names
Pipeline challenges - authors

[ { "mitid": “3.1415926537", "name": "Cohen-Tanugi, David" }, { "mitid": “2.7182818", "name": "Dave, Shreya H." }, { "mitid": “6.02x10^23", "name": "Grossman, Jeffrey C." }, { "mitid": “1123581322", "name": "Lienhard, John H." }, { "mitid": “1234567890", "name": "McGovern, Ronan Killian" }]
Pipeline challenges - authors

Pipeline challenges - departments
Department names● Inconsistent program / department affiliations
o “Media Laboratory”o “Center for Bits and Atoms”
● Spelling Variationso “MIT Department of Physics”o “Massachusetts Institute of Technology, Department of Physics”o “Dept. of Physics”o “Physics”

Pipeline challenges - departments
Standardized department names
Whitelist of recognized names

{ "_id" : ObjectId("5449127895b0c25083f29352"), "status" : "200", "handle" : "http://hdl.handle.net/1721.1/52491", "title" : "A basal ganglia-forebrain circuit in the songbird biases motor output to avoid vocal errors", "country" : "USA", "authors" : [ { "mitid" : "3.1415926537", "name" : "Fee, Michale S." }, { "mitid" : "6.02x10^23", "name" : "Andalman, Aaron S." } ], "request" : "/openaccess-disseminate/1721.1/52491", "referer" : "http://www.google.com/search?q=head+mounted+microphone+zebra+finch&ie=utf-8&oe=utf-8&aq=t&rls=org.mozilla:en-US:official&client=firefox-a", "user_agent" : "Mozilla/5.0 (X11; U; Linux i686 (x86_64); en-US; rv:1.9.2.8) Gecko/20100722 Firefox/3.6.8", "time" : ISODate("2010-08-10T17:14:03Z"), "ip_address" : "128.218.64.242", "dlcs" : [ { "display" : "McGovern Institute for Brain Research at MIT", "canonical" : "McGovern Institute for Brain Research at MIT" }, { "display" : "Brain and Cognitive Sciences", "canonical" : "Massachusetts Institute of Technology. Department of Brain and Cognitive Sciences" } ], "filesize" : "1661848"}

{ "_id" : "Overall", "countries" : [ { "country" : "862", "downloads" : 35 } … ], "dates" : [ { "date" : "2014-01-07", "downloads" : 3 } … ], "downloads" : 10000, "size" : 101, "type" : "overall"}

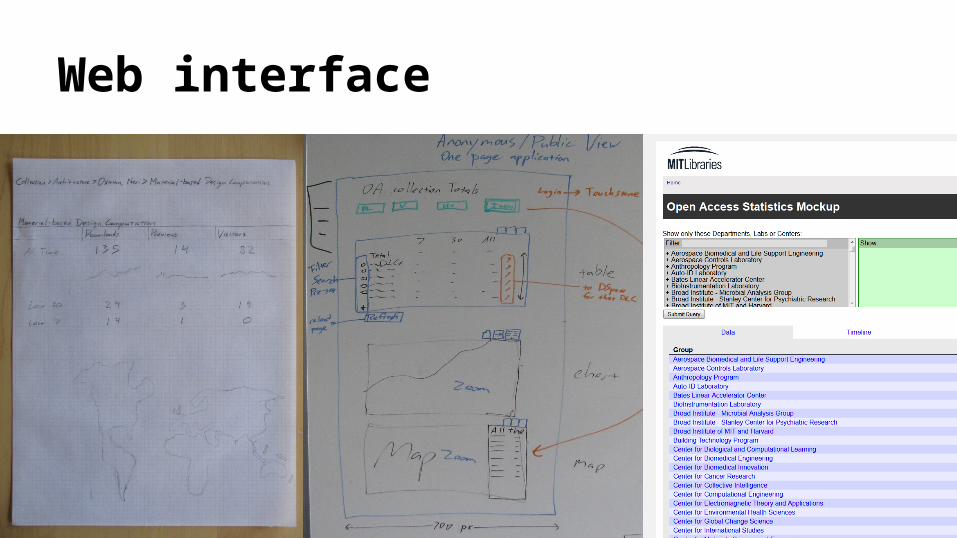
Web interface

Web interface
https://github.com/MITLibraries/oastats-ui
● Mongo-backed● PHP● DataTables● D3.js● DataMaps

Web interface
Web interface
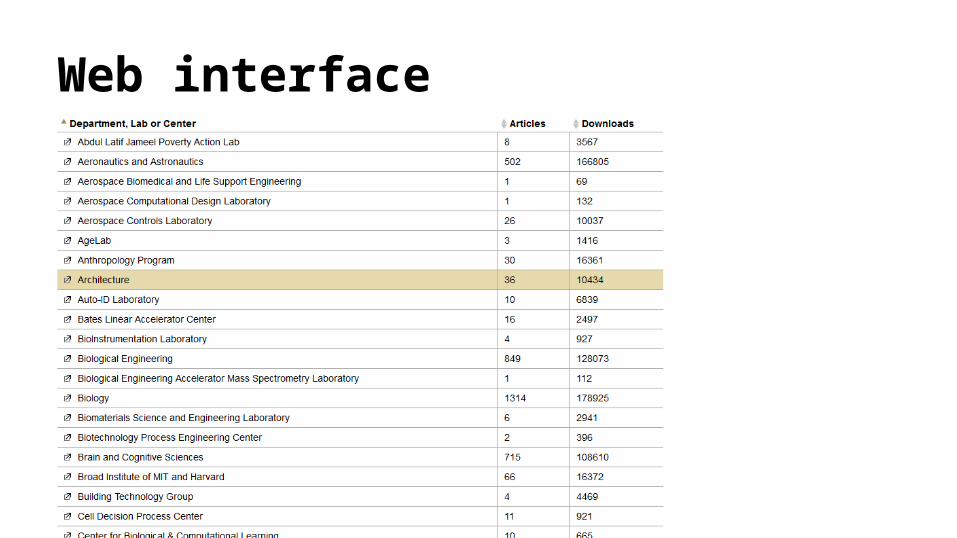
Web interface
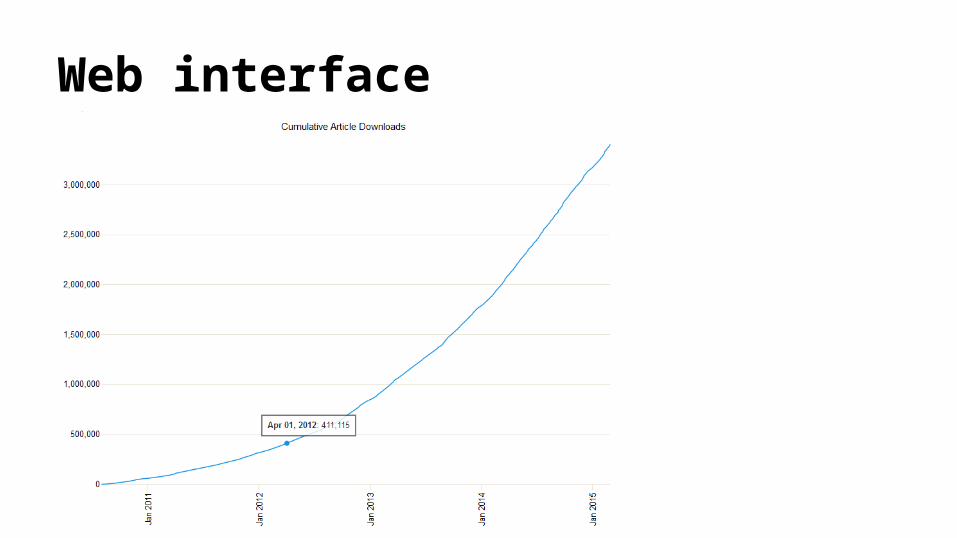
Web interface

Web interface
Email to authors

Email to authorsDear {name}, Thank you for sharing your scholarly articles through the open repository DSpace@MIT <https://dspace.mit.edu/handle/1721.1/49433/>, in association with the MIT Faculty Open Access Policy <https://libraries.mit.edu/oapolicy>. Our newly implemented OA Stats Service provides data about the use and reach of our open access collection. Since August 2010, 15,184 articles have been downloaded from 227 different countries. This service also provides information at the author and article level: Your 3 articles have been downloaded 168 times since they were deposited, from 28 different countries. You can access more detailed download information about your articles, including per-article and per-country downloads at <https://oastats.mit.edu>. Initially, we plan to provide this information to all authors via email in the Fall and Spring semesters. As we seek to improve the service, we'll consider expanding options to interact with it and the underlying data. We are anxious to hear your feedback on how this service can be most useful to you, so please send your suggestions to [email protected]. --From the MIT Libraries

Email to authors

Email to authors

Faculty reception
Excitement● “Thank you for the update, this is a fantastic tool!!”● “Thanks so much for doing this - it's really cool and awesome!”
Why not more?● “Hi, I like your feedback. But I am puzzled that only one of my articles is in
your database.”● Department heads using this as leverage to encourage further
contributions
Project goals revisited
• Make available download statistics at three levels: author, article, and aggregate
• Incentivize deposits to collection• Provide useful information for policy evaluation
• Evaluate new technologies within the Libraries (i.e. MongoDB)

Future work
● Automate the pipeline● Run pipeline more frequently● Ditch Mongo for something relational● Talk to faculty about making more detailed information
public● Add functionality to UI (additional format exports, move
to SPA)● Improve cataloging in DSpace@MIT with lookup
services

Thanks!
Matt [email protected]@morphosis7
https://github.com/MITLibraries/oastats-backend
https://github.com/MITLibraries/oastats-ui
http://oastats.mit.edu
Related Documents