Visualization with ParaView Arizona State University 2014

Welcome message from author
This document is posted to help you gain knowledge. Please leave a comment to let me know what you think about it! Share it to your friends and learn new things together.
Transcript
Visualization with ParaView
Arizona State University 2014
Before we begin… • Make sure you have ParaView 4.1.0 installed so you
can follow along in the lab section – http://paraview.org/paraview/resources/software.php

Background • http://www.paraview.org/ • Open-source, multi-platform parallel data analysis
and visualization application • Mature, feature-rich interface • Good for general-purpose, rapid visualization • Built upon the Visualization ToolKit (VTK) library • Primary contributors:
– Kitware, Inc. – Sandia National Laboratory – Los Alamos National Laboratory – Army Research Laboratory

Data Types • Supports a wide variety of data types
– Structured grids • uniform rectilinear, non-uniform rectilinear, and
curvilinear – Unstructured grids – Polygonal data – Images – Multi-block – AMR
• Time series support
*http://www.paraview.org/Wiki/images/c/c6/ParaViewTutorial312.pdf
*

Visualization Algorithms • Supports a wide variety of visualization
algorithms -> Filters – Isosurfaces – Cutting planes – Streamlines – Glyphs – Volume rendering – Clipping – Height maps – …

Special Features
• Supports derived variables – New scalar / vector variables that are
functions of existing variables in your data set • Scriptable via Python • Saves animations • Can run in parallel / distributed mode for
large data visualization

Data Formats • Supports a wide variety of data formats
– VTK (http://www.vtk.org/VTK/img/file-formats.pdf) – EnSight – Plot3D – Various polygonal formats
• Users can write data readers to extend support to other formats
• Conversion to the VTK format is straightforward

Data Formats
• VTK Simple Legacy Format • ASCII or binary • Supports all VTK grid
types • Easiest for data
conversion
• Note: use VTK XML format for parallel I/O
VTK simple legacy format (http://www.vtk.org/VTK/img/file-formats.pdf)

Data Formatting Example • Data set: 4x4x4 rectilinear grid
with one scalar variable
ParaView Visualization Pipeline
• All processing operations (filters) produce data sets
• Can further process the result of every operation to build complex visualizations – e.g. can extract a cutting plane, and apply
glyphs (i.e. vector arrows) to the result • Gives a plane of glyphs through your 3D volume

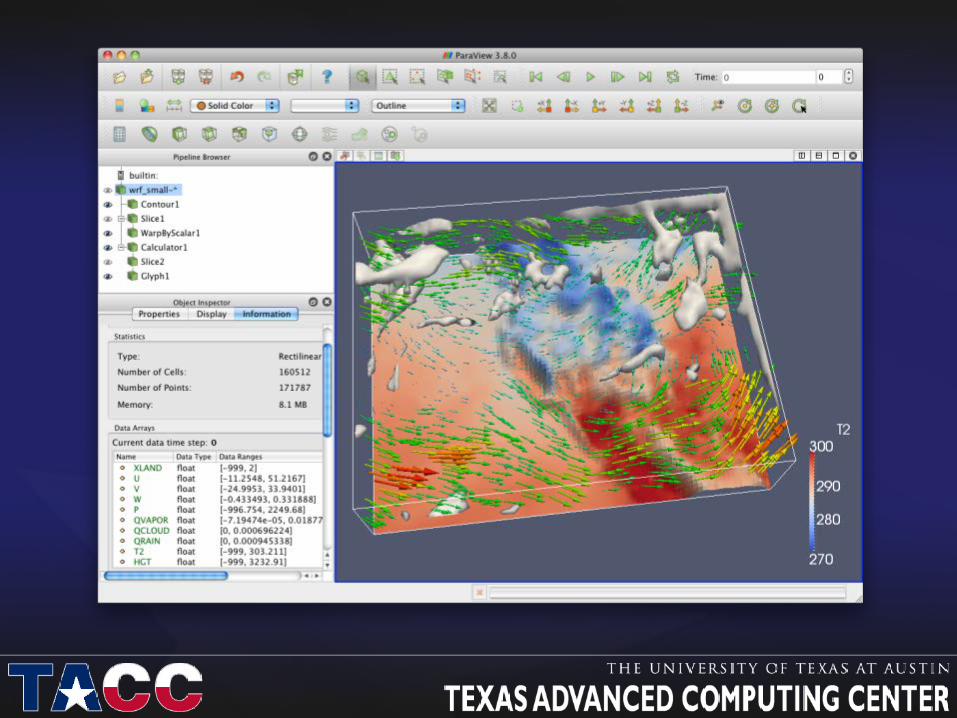
Demonstration • WRF weather forecast data set
– Rectilinear grid – Multiple scalar and vector variables – Time series
• Can show:
– Clouds – Wind – Temperature – …

ParaView Test-Drive
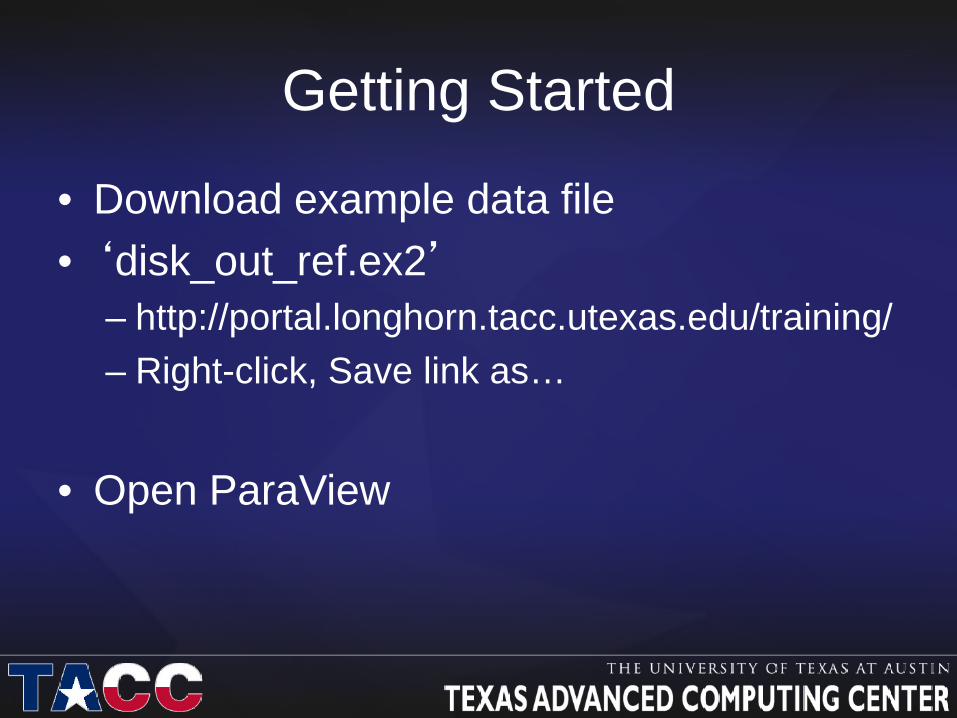
Getting Started
• Download example data file • ‘disk_out_ref.ex2’
– http://portal.longhorn.tacc.utexas.edu/training/ – Right-click, Save link as…
• Open ParaView
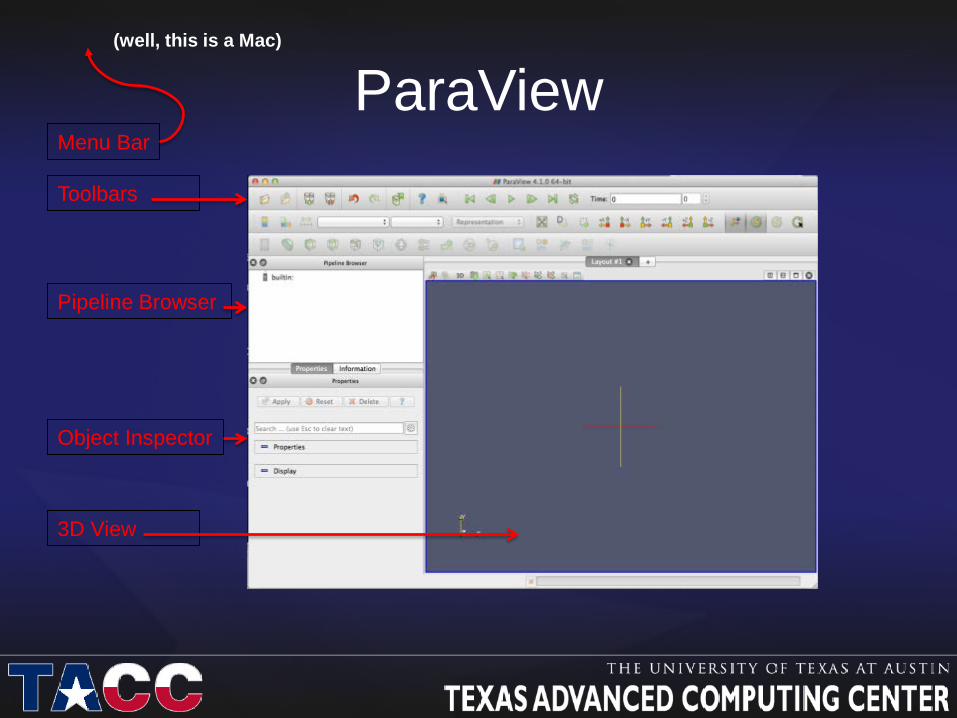
ParaView Menu Bar
Toolbars
Pipeline Browser
Object Inspector
3D View
(well, this is a Mac)
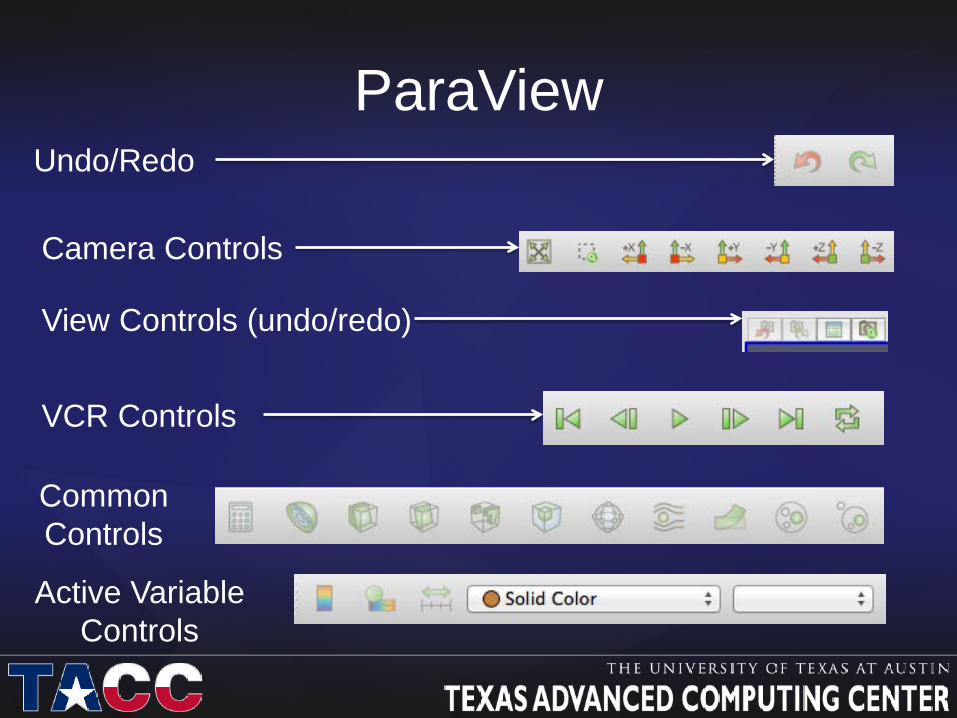
ParaView Undo/Redo
Camera Controls
View Controls (undo/redo)
VCR Controls
Common Controls
Active Variable Controls

ParaView Today we will: • Create isosurfaces for a scalar
variable • Clip and slice the surfaces • Use glyphs to display a vector
field • Use streamlines to show flow
through a vector field • Edit color maps • Add slices to show variable
values over a plane • Add color legends • Create volume rendering • Create a plot over a line

ParaView
Open the file disk_out_ref.ex2
• Click File -> Open • Select
disk_out_ref.ex2 • Click OK • Select ALL variables • Click blue Apply • Cylinder outline of
dataset extent displayed

ParaView
Open the file disk_out_ref.ex2
• Click File -> Open • Select
disk_out_ref.ex2 and click OK

ParaView
Open the file disk_out_ref.ex2
• Click File -> Open • Select
disk_out_ref.ex2 and click OK
• Select ALL variables

ParaView
Open the file disk_out_ref.ex2
• Click File -> Open • Select
disk_out_ref.ex2 • Click OK • Select ALL variables • Click blue Apply

ParaView
Open the file disk_out_ref.ex2
• Click File -> Open • Select
disk_out_ref.ex2 • Click OK • Select ALL variables • Click blue Apply
Cylinder outline of
dataset extent displayed

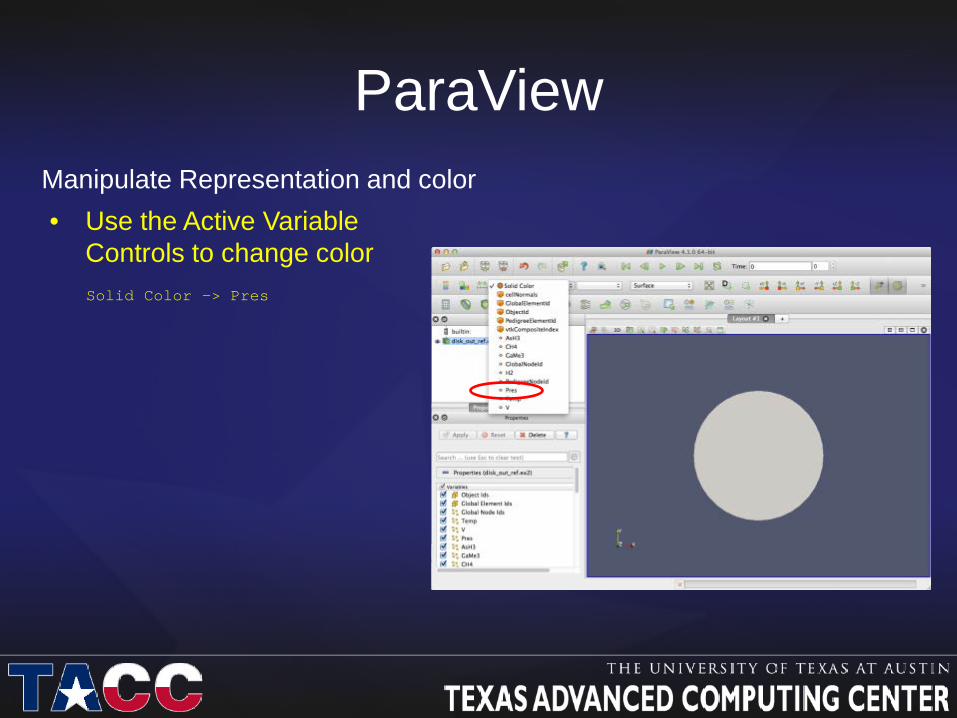
ParaView Manipulate Representation and color • Use the Active Variable
Controls to change color Solid Color -> Pres
ParaView Manipulate Representation and color • Use the Active Variable
Controls to change color Solid Color -> Pres

ParaView Manipulate Representation and color • Use the Active Variable
Controls to change color Solid Color -> Pres
• Use Representation toolbar to change representation
Surface -> Surface With Edges
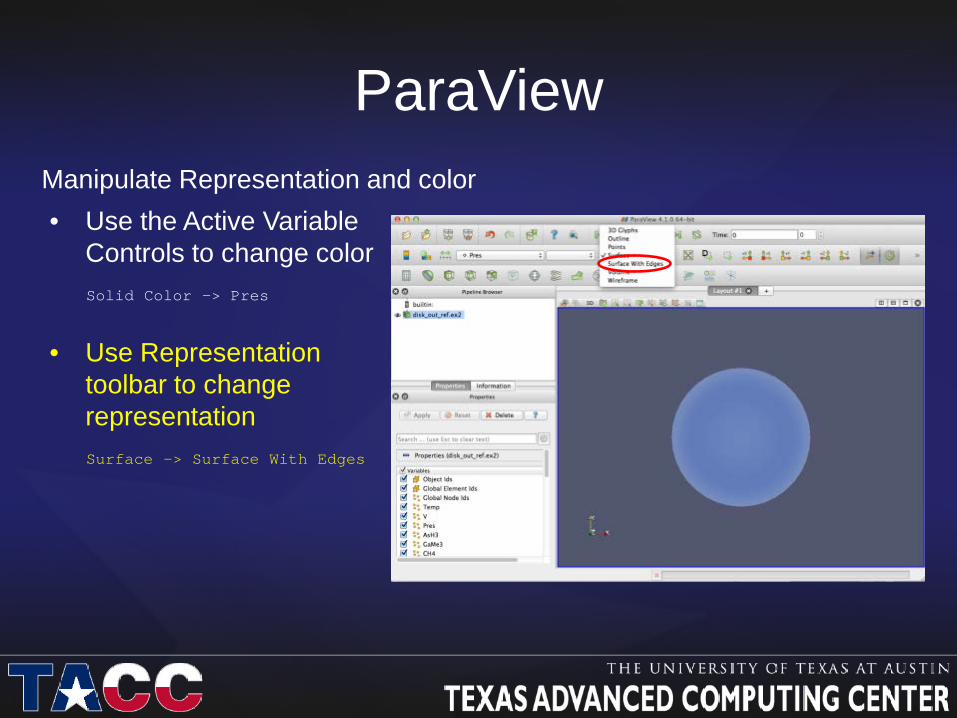
ParaView Manipulate Representation and color • Use the Active Variable
Controls to change color Solid Color -> Pres
• Use Representation toolbar to change representation
Surface -> Surface With Edges

ParaView Manipulate Representation and color • Use the Active Variable
Controls to change color Solid Color -> Pres
• Use Representation toolbar to change representation
Surface -> Surface With Edges
• Show Colorbar annotation

ParaView Manipulate Representation and color • Use the Active Variable
Controls to change color Solid Color -> Pres
• Use Representation toolbar to change representation
Surface -> Surface With Edges
• Show Colorbar annotation

• Explore dataset with mouse
ParaView
• Click +Z view button
• Explore dataset with mouse
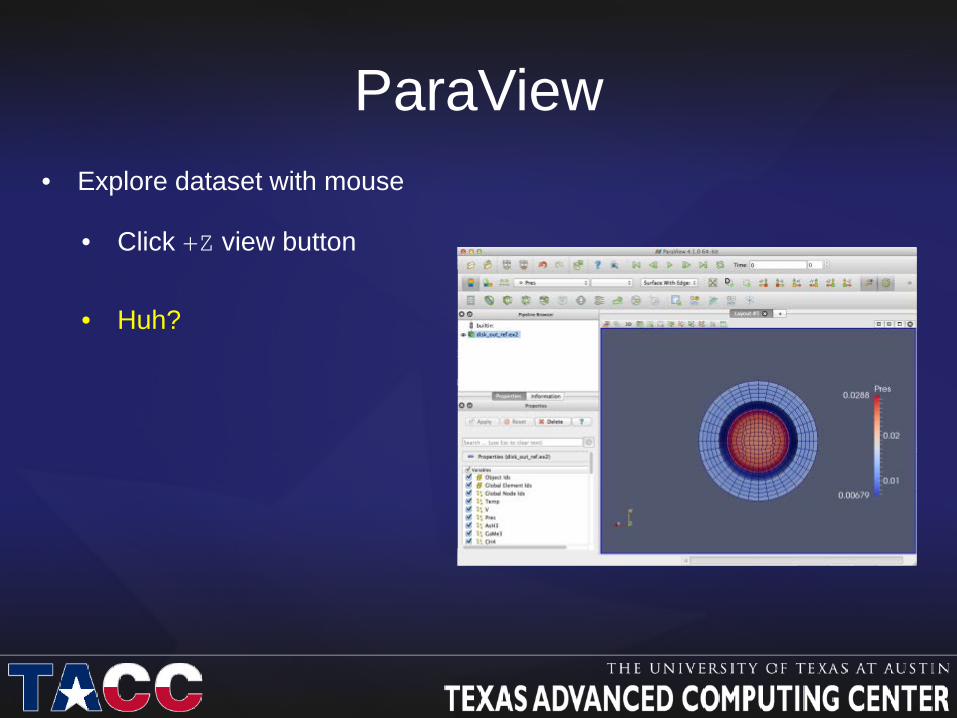
ParaView
• Click +Z view button • Huh?

• Explore dataset with mouse
ParaView
• Click +Z view button • Huh?
• Move it around

• Explore dataset with mouse
ParaView
• Click +Z view button • Huh?
• Move it around
• Change Representation

ParaView
Filters • Click Filters on
menu bar and find Contour
– Alphabetical – Common
(Or on toolbar)

ParaView
Filters • Click Filters on
menu bar and find Contour
– Alphabetical – Common
(Or on toolbar)
• Contour by AsH3

ParaView
Filters • Click Filters on
menu bar and find Contour
– Alphabetical – Common
(Or on toolbar)
Filters • Click Filters on
menu bar and find Contour
– Alphabetical – Common
(Or on toolbar)
• Contour by AsH3
• Hit Apply

ParaView
Filters • With Contour1
selected, use Active Variable Control to color by CH4
• And drag one of the colorbars elsewhere

ParaView
Filters • With Contour1
selected, use Active Variable Control to color by CH4
• And drag one of the colorbars elsewhere
ParaView
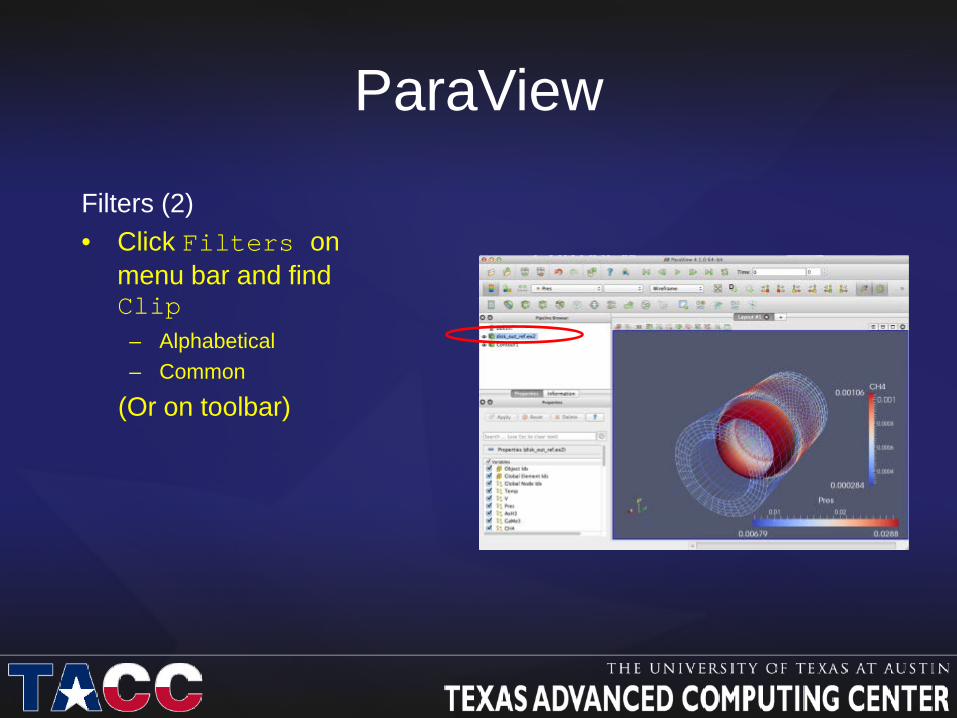
Filters (2) • Click Filters on
menu bar and find Clip
– Alphabetical – Common
(Or on toolbar)

ParaView
Filters (2) • Choose orientation
axes

ParaView
Filters (2) • Hit Apply
• Note: all three
objects are visible – Wireframe of
dataset – Contour surface – Surface of clipped
dataset

ParaView
Color Mapping • Select Clip1
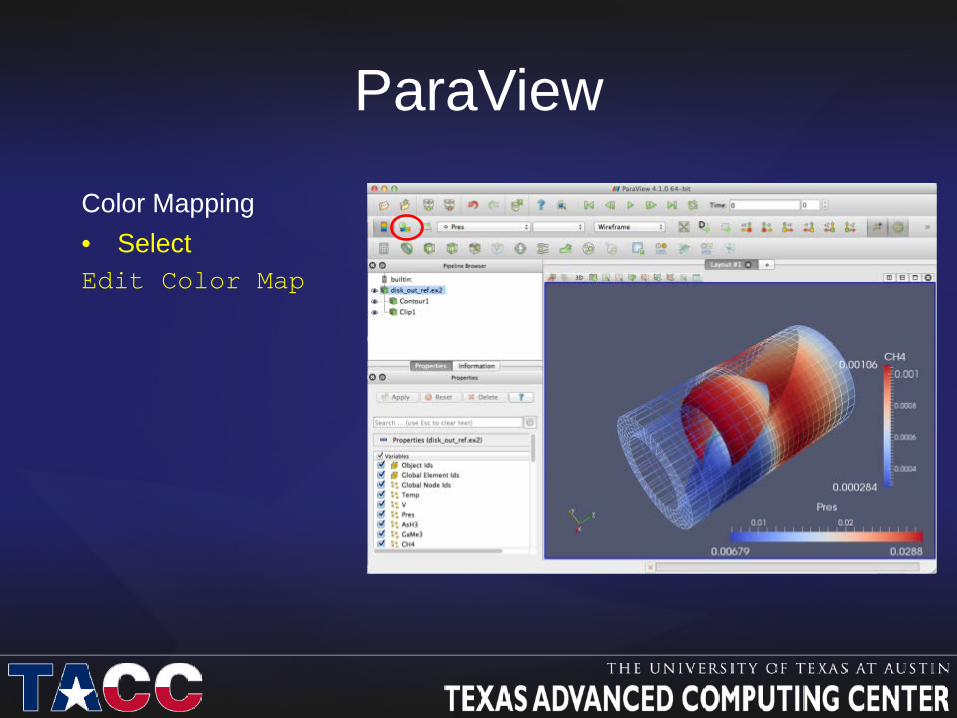
ParaView
Color Mapping • Select Edit Color Map

ParaView
Color Mapping • Select Edit Color Map

ParaView
Color Mapping • Select Choose Preset

ParaView
Color Mapping • Select Choose Preset

ParaView
Color Mapping • Select Black-Body R…
and Update

ParaView
Color Mapping • Select Black-Body R…
and Close

ParaView
Color Mapping • Close Colormap
window

ParaView
Filters (3) • Select original
dataset
• Click Filters on menu bar and find Stream Tracer
– Alphabetical – Common
(Or on toolbar)

ParaView
Filters (3) • Scroll down on
Properties pane until you see seeds sub-pane
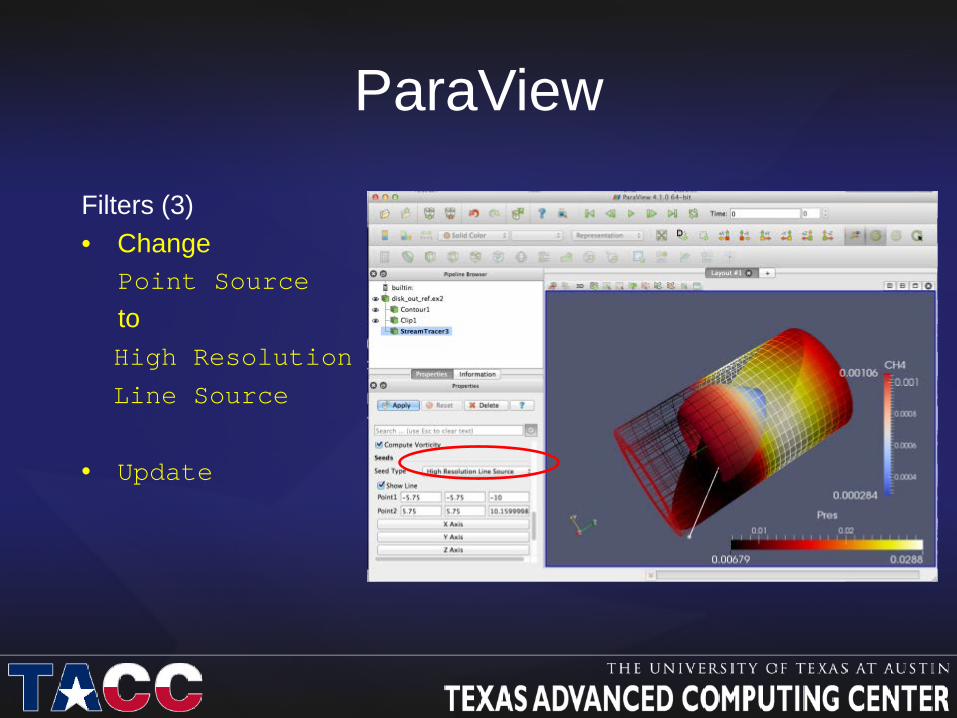
ParaView
Filters (3) • Change Point Source to High Resolution
Line Source
• Update
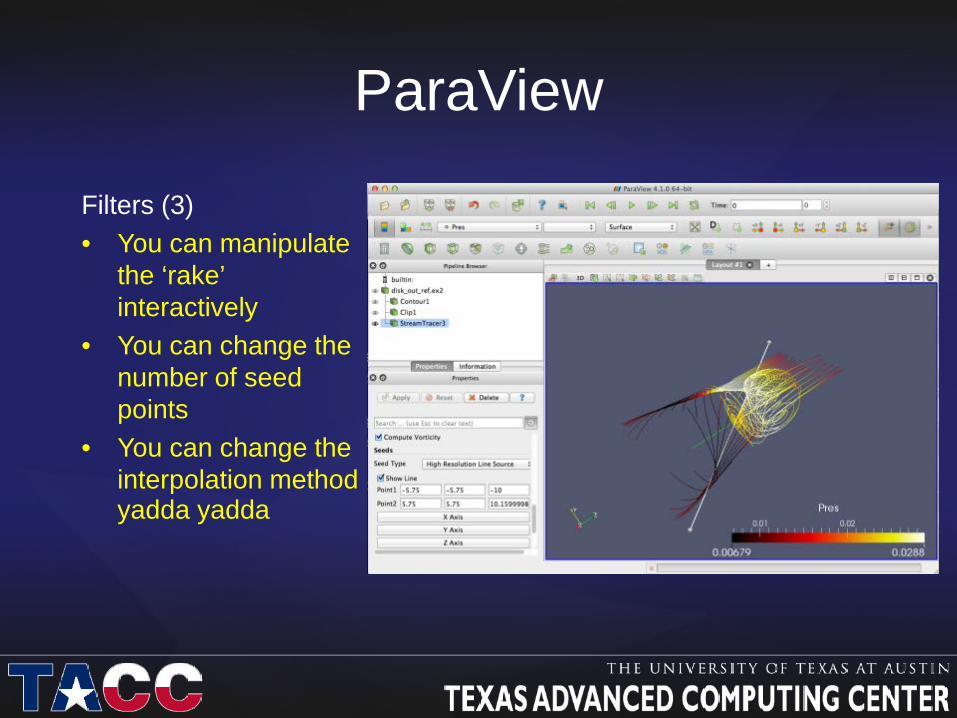
ParaView
Filters (3) • You can manipulate
the ‘rake’ interactively
• You can change the number of seed points
• You can change the interpolation method yadda yadda

ParaView
Filters (3) • With
StreamTracer1 selected,
• Click Filters on menu bar and find Tube
– Alphabetical – ?
• Update
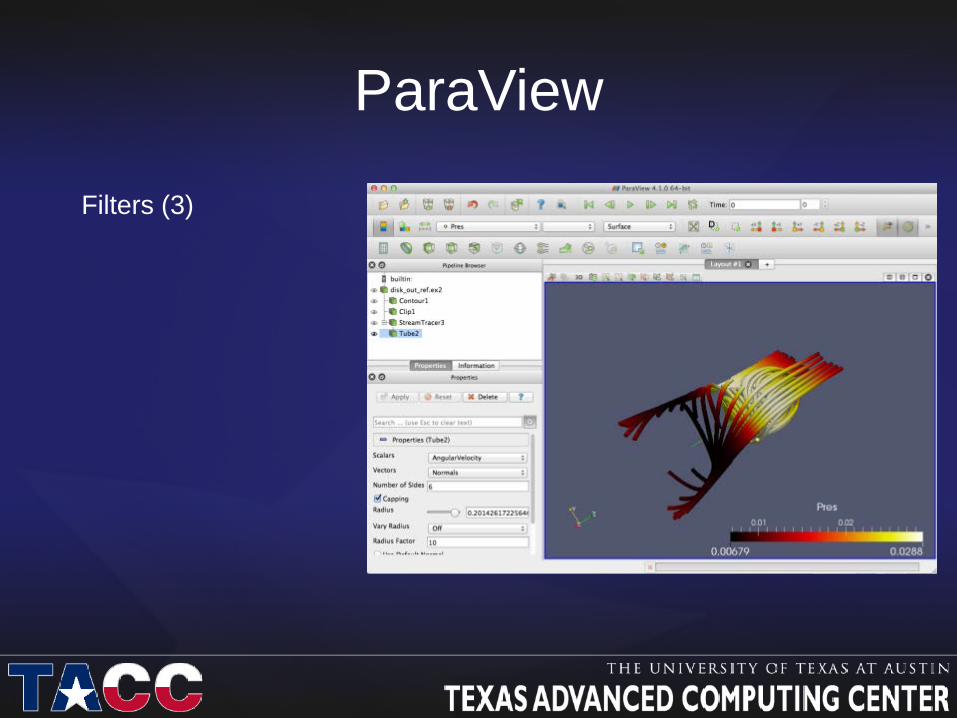
ParaView
Filters (3)

ParaView
Filters (3) • Turn on Wire Frame
of original dataset • Hide Tube’d
Stream lines

ParaView
Glyphs • With original dataset
selected…
• Click Filters on menu bar and find Glyph
– Alphabetical – Common
(Or on toolbar) • Apply

ParaView
Glyphs • A bunch of points
are selected, sampled from the dataset and an Arrow glyph is applied
• Note V vectors and Arrow glyph type;
Scalars option is not enabled

ParaView
Glyphs • Scroll down in
properties window and change Scale Mode to scalar
• Scroll back …
• Set Glyph Type to sphere
• Choose any variable and Apply

ParaView
Glyphs Spheres radii are
proportional to value or magnitude

ParaView
Glyphs • With the Glyphs
selected…
• Edit->Change Input…
ParaView
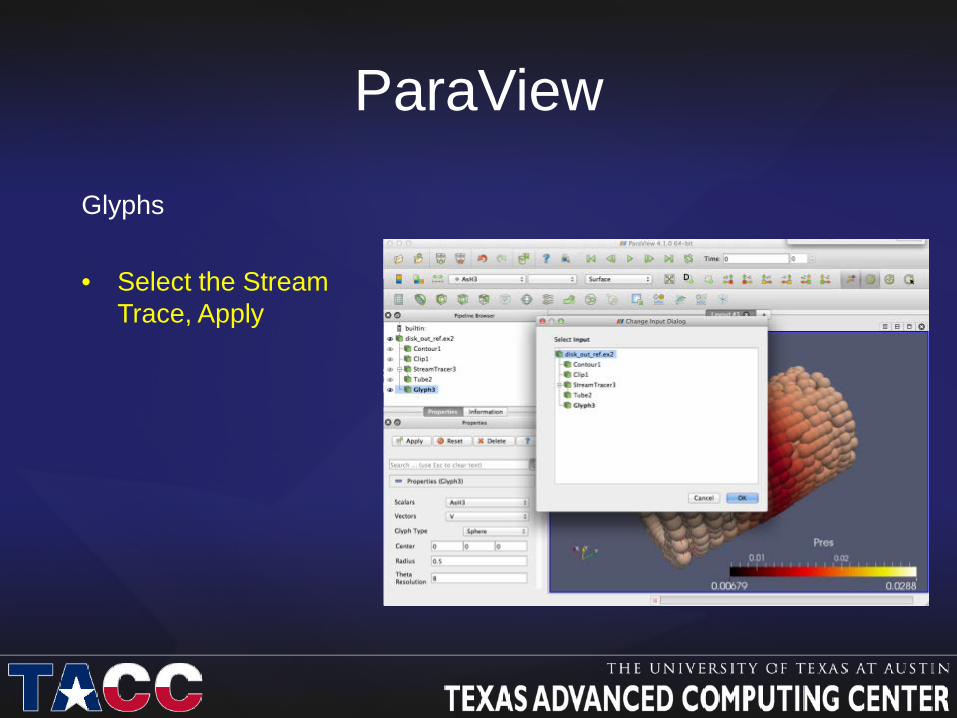
Glyphs • Select the Stream
Trace, Apply

ParaView
Glyphs Note dependency
tree
• With the Glyph selected, change Scale Mode to Vector, Glyph Type to Arrow, and choose variable v
• Apply

ParaView
Glyphs Glyphs are now
tangential arrows
ParaView
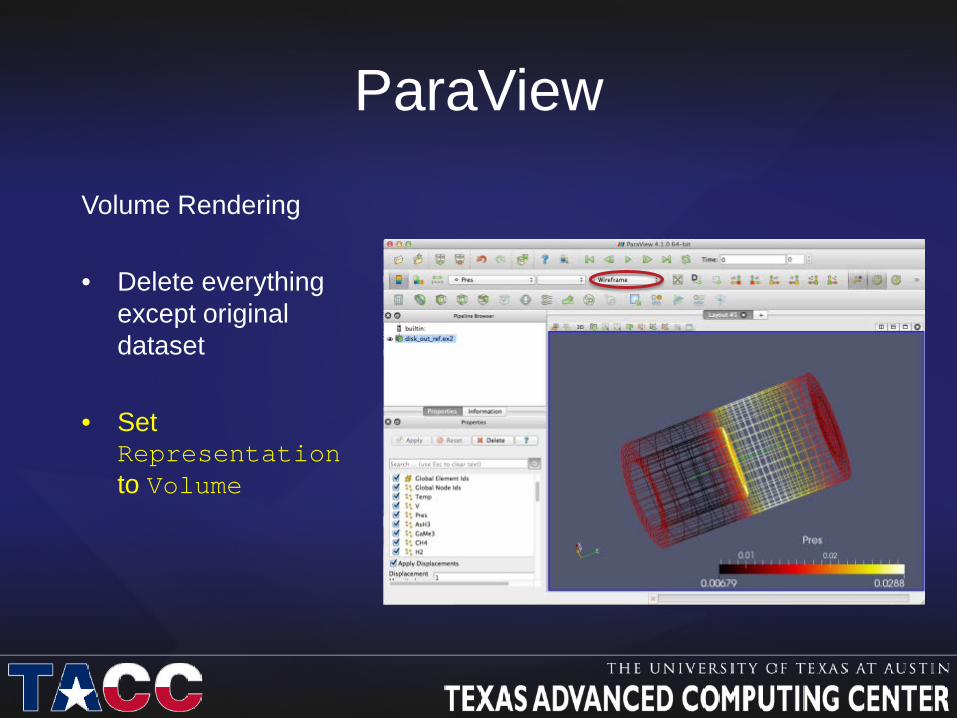
Volume Rendering • Delete everything
except original dataset
• Set Representation to Volume
ParaView
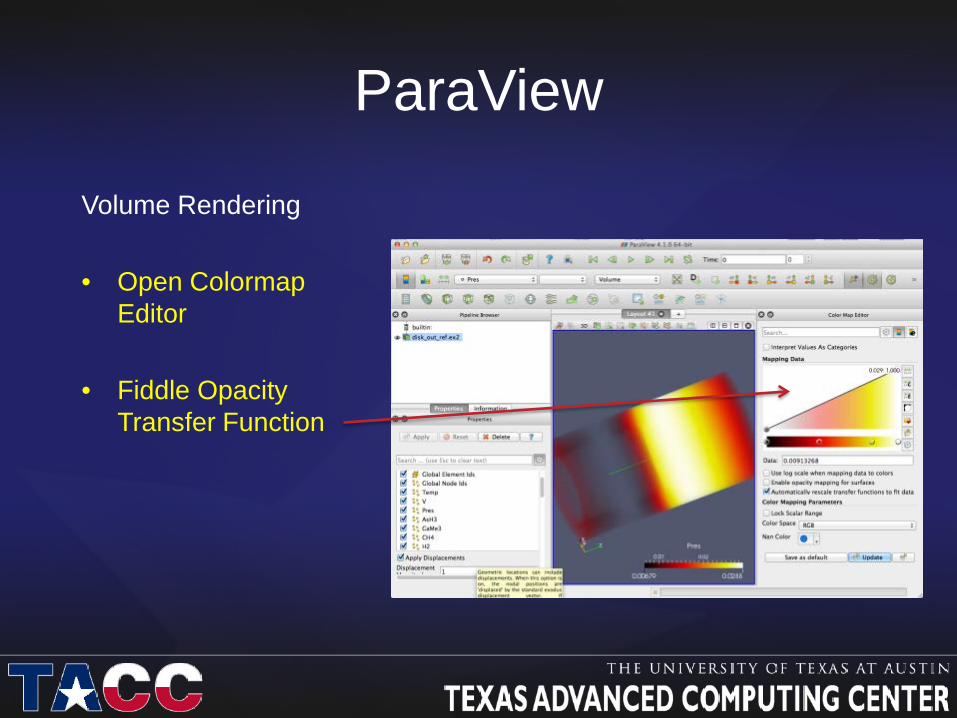
Volume Rendering • Open Colormap
Editor
• Fiddle Opacity Transfer Function

ParaView
Volume Rendering • … to look like this
• Close Colormap
Editor

ParaView
Volume Rendering
• And we can then
add a new contour, streamlines, yadda yadda
ParaView
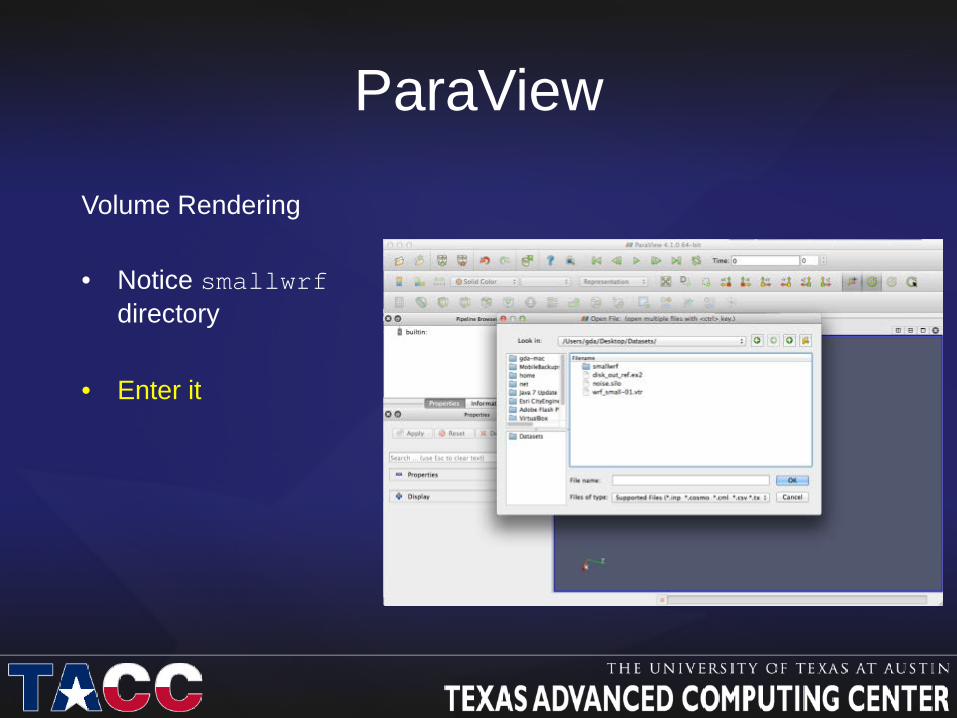
Volume Rendering • Notice smallwrf
directory
• Enter it

ParaView
Animation • Notice wrf_small-….vtr • Expand it and see
that it consists of a number of sequentially ordered files
• Select it and Apply

ParaView
Animation • Notice wrf_small-….vtr • Expand it and see
that it consists of a number of sequentially ordered files
• Select it and Apply

ParaView
Animation • Select Contour
• Contour By: QRAIN
• Set Value Range 0.0001 • Apply
• Hit Play

ParaView
Saving Animation • File->Save Animation…
• Set output resolution • Hit Save Animation

ParaView
Saving Animation • Create Directory
• e.g. movie1
• Enter that directory

ParaView
Saving Animation • Set File Name
• e.g. ‘frame’
• Set Files to Type
• I use ‘avi’
• OK

Questions?
• More tutorials available: – http://www.paraview.org/Wiki/The_ParaView_Tutorial
Related Documents