WOLFGANG AiGNER visualization of time-oriented data 1 Wolfgang Aigner [email protected] http://ieg.ifs.tuwien.ac.at/~aigner/ [email protected] http://ike.donau-uni.ac.at/~aigner/ Version 2.3 14.12.2009 visualization of time-oriented data visualization techniques

Welcome message from author
This document is posted to help you gain knowledge. Please leave a comment to let me know what you think about it! Share it to your friends and learn new things together.
Transcript

WOLFGANG AiGNER visualization of time-oriented data 1
Wolfgang Aigner
[email protected]://ieg.ifs.tuwien.ac.at/~aigner/
[email protected]://ike.donau-uni.ac.at/~aigner/
Version 2.314.12.2009
visualization oftime-oriented data
visualization techniques

WOLFGANG AiGNER visualization of time-oriented data 2
Section A:
questions &application areas
WOLFGANG AiGNER visualization of time-oriented data 3
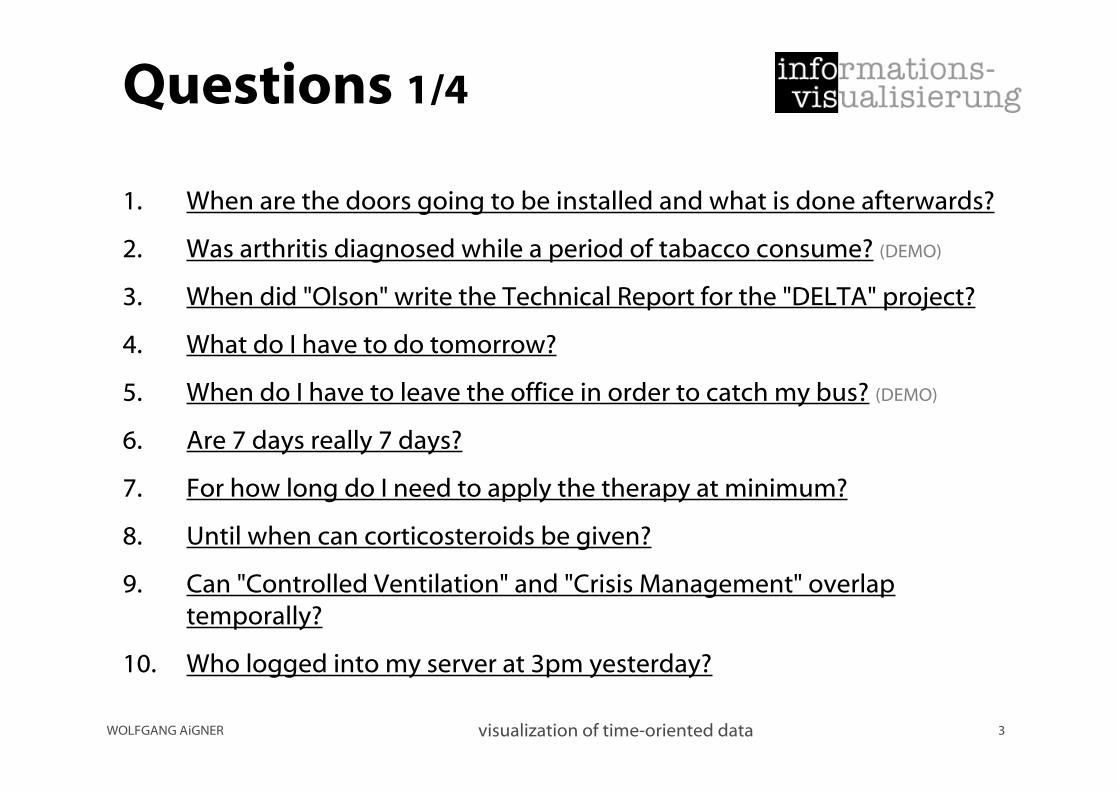
Questions 1/4
1. When are the doors going to be installed and what is done afterwards?
2. Was arthritis diagnosed while a period of tabacco consume? (DEMO)
3. When did "Olson" write the Technical Report for the "DELTA" project?
4. What do I have to do tomorrow?
5. When do I have to leave the office in order to catch my bus? (DEMO)
6. Are 7 days really 7 days?
7. For how long do I need to apply the therapy at minimum?
8. Until when can corticosteroids be given?
9. Can "Controlled Ventilation" and "Crisis Management" overlaptemporally?
10. Who logged into my server at 3pm yesterday?

WOLFGANG AiGNER visualization of time-oriented data 4
Questions 2/4
11. At what time did Fidel Castro talk most about "oil"? (MOVIE)
12. What kind of food do chimpanzees prefer in winter?
13. Do the stocks of "Microsoft" and "Sun Microsystems" have a similarprice history?
14. Is the my software project likely to fail?
15. What parts of my software project are stable?
16. How does Beethoven's "Bagatelle" sound and look like? (MOVIE)
17. Which stocks increased in a similar way during the year? (DEMO)
18. Who are the main contributors in an online environment?
19. Which meeting is going to happen on August, 17?
20. How did the prices of various MP3 players change over the lastmonths?

WOLFGANG AiGNER visualization of time-oriented data 5
Questions 3/421. How is time represented in paintings?
22. How did the ozone concentration in Los Angeles change over the lastdecade?
23. Can the same pattern of value increase be found in other sessions ofdialysis? (MOVIE)
24. How did various authors conribute to the wikipedia entry on "Islam"over time?
25. How did the blood pressure of Jane Doe evolve over the last hours?(MOVIE)
26. What did Isaac Newton do in 1667 and where did he do it?
27. How do the top 100 news topics during the last day look like?
28. What were the main events in my life so far? (MOVIE)
29. How does an hour worth of "Simpsons" look like in one picture? (MOVIE)
30. Which parts of my website were visited during the last hours? (MOVIE)

WOLFGANG AiGNER visualization of time-oriented data 6
Questions 4/431. When did Philipp Glass write his fastest songs? (Online-DEMO)
32. Who are my main e-mail communication partners?
33. How does the history of photography look like?
34. Are there any critical portions in my project plan? (DEMO)
35. How is Mary’s course of therapy? (DEMO)
36. What treatment step should be performed next?
37. Are there differences in the trends of sold items on differentweekdays?
38. What are the patterns of deployed police forces in a city?

WOLFGANG AiGNER visualization of time-oriented data 7
Applications 1/3
1. project plans (2 (DEMO))
2. juvenile justice records, patient records (DEMO)
3. document/file collections
4. personal and/or corporate time management (2)
5. time management (DEMO)
6. events on different granularities
7. medical treatment planning ( 2, 3, 4 )
8. network intrusion detection
WOLFGANG AiGNER visualization of time-oriented data 8
Applications 2/3
9. document collections (MOVIE)
10. chimpanzees food consumption
11. internet movie database
12. stock prices
13. software evolution (2 )
14. music visualization (MOVIE)
15. stock prices (DEMO)
16. microarray data (DEMO)
17. discussion group activity
18. visual arts
WOLFGANG AiGNER visualization of time-oriented data 9
Applications 3/319. ozone concentration in Los Angeles
20. medical data (MOVIE) (2 (MOVIE), 3 (DEMO), 4)
21. Wikipedia document evolution
22. historical events (2)
23. news
24. personal history (MOVIE)
25. webpage hit evolution (MOVIE)
26. music collection (Online-DEMO)
31. e-mail history
32. retail (sold items)
33. police unit deployment
WOLFGANG AiGNER visualization of time-oriented data 10
Section B:
time & arts
WOLFGANG AiGNER visualization of time-oriented data 11
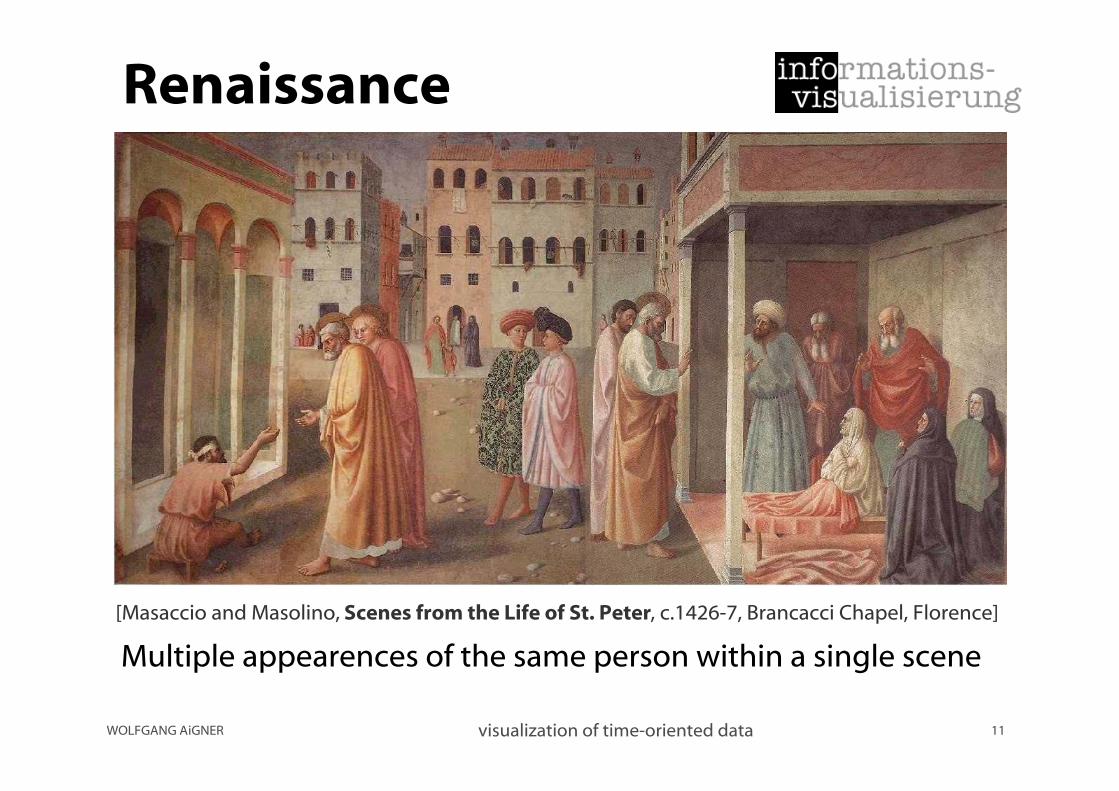
Renaissance
[Masaccio and Masolino, Scenes from the Life of St. Peter, c.1426-7, Brancacci Chapel, Florence]
Multiple appearences of the same person within a single scene

WOLFGANG AiGNER visualization of time-oriented data 12
CubismThe first documented occurrenceof the fourth dimension beingused in art appeared in 1910 inParis.
Origin: mathematics + physics(n-dimensional spaces)
At this point, the fourthdimension was thought as time.
Person walking down stairs -->
Fourth dimension in the paintingby picturing different stages ofthe person’s descent
[Marcel Duchamp, Nude Descending a Staircase, 1912]

WOLFGANG AiGNER visualization of time-oriented data 13
CubismNew ideas about the fourthdimension into the staticdomain of pictures.
Overlays many differentobservations.
Emphasizes process oflooking and recording overtime.
[Picasso, Portrait of Vollard, 1910]

WOLFGANG AiGNER visualization of time-oriented data 14
Comics
Visual story tellingover time.
Many interestingtechniques /paradigms.
If you want to knowmore, start here:[Scott McCloud,UnderstandingComics, 1994]

WOLFGANG AiGNER visualization of time-oriented data 15
Section C:
visualizationtechniques

WOLFGANG AiGNER visualization of time-oriented data 16
TimeSearcher
visualization tool for time-series data
timebox query modelrectangular regions that specifyconstraints over time series datasetsx-axis extent: time period ofinteresty-axis extent: constraint on therange of values
combinations of multipletimeboxes
data + query envelope
[Hochheiser, 2002; Hochheiser and Shneiderman, 2002]
DEMO
http://www.cs.umd.edu/hcil/timesearcher/

WOLFGANG AiGNER visualization of time-oriented data 17
Interactive Parallel BarCharts (IPBC)basic vis technique: bar charts
bar charts only suitable for 1 time series; more --> 3D
analysis of medical data
occlusions can be removed byflattening occluding elements--> matrix visualization
tide mode (highlighting areas)
smooth transitions
[Chittaro et al., 2002]

WOLFGANG AiGNER visualization of time-oriented data 18
Midgaard 1/2
visualization of medical intensive care dataqualitative scales
quantitative scales
qualitative / quantitativehybrids
semantic zoomsmoothly integrated
[Bade et al., 2004]

WOLFGANG AiGNER visualization of time-oriented data 19
Midgaard 2/2
different granularities
vis of measurement deviation,trustability of data points,and missing data

WOLFGANG AiGNER visualization of time-oriented data 20
TimeWheel / Zeitrad 1/2
Time axis in the center
Variable axis arranged circularly
Lines connecting time andfeature values
Similar to parallel coordinates
Variables parallel to time axis (upper and lower) canbe explored most effectively
Focus + Context by shortening of rotated axis andcolor fading
[Tominski et al., 2003]

WOLFGANG AiGNER visualization of time-oriented data 21
TimeWheel / Zeitrad 2/2
User interaction:Rotation of variable axes(moving axes of interest into a position parallel to the time axis)

WOLFGANG AiGNER visualization of time-oriented data 22
MultiCombs
Axis based technique
Multiple parameters on multiple time axis, circularly arranged
Outward from the center of star-shaped
Aggregated view of “past” values in the center
[Müller and Schumann, 2003]
WOLFGANG AiGNER visualization of time-oriented data 23
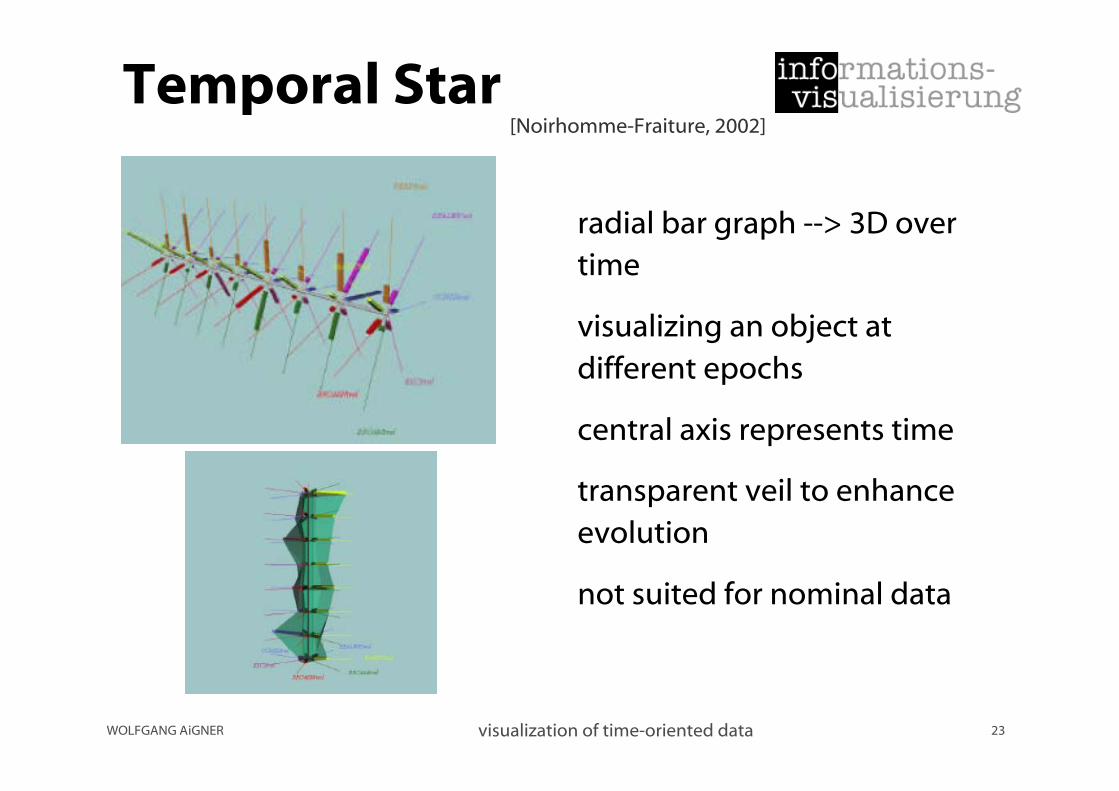
Temporal Star
radial bar graph --> 3D overtime
visualizing an object atdifferent epochs
central axis represents time
transparent veil to enhanceevolution
not suited for nominal data
[Noirhomme-Fraiture, 2002]

WOLFGANG AiGNER visualization of time-oriented data 24
Serial Periodic Data 1/6
Visualize both, serial + periodicproperties to reveal certain patterns
Time continues serially, but weeks,month, and years are periods thatreoccur
Map time onto a spiral + spokes fororientation
Data values are mapped to blots onspiral
Area of blot proportional to value
[Carlis and Konstan, 1998]

WOLFGANG AiGNER visualization of time-oriented data 25
Serial Periodic Data 2/6
Pureserial periodic data
Periods with constantdurations
Event-anchoredserial periodic data
Periods with differentdurations
Start of a new period isindicated by an event
Examples:Multi day racing dataProject based timetracking

WOLFGANG AiGNER visualization of time-oriented data 26
Serial Periodic Data 3/6Extension to 3D:
Z-axis for different sets of dataNo quantitative meaning of z-axis
Color coding of data sets
Lidless, hollow “cans”Instead of blotsPrevent occlusion
Volume of can is proportional to data value
Pro: good overview
Cons:OcclusionClutterZ-position meaninglessDouble mapping (z-pos + color)
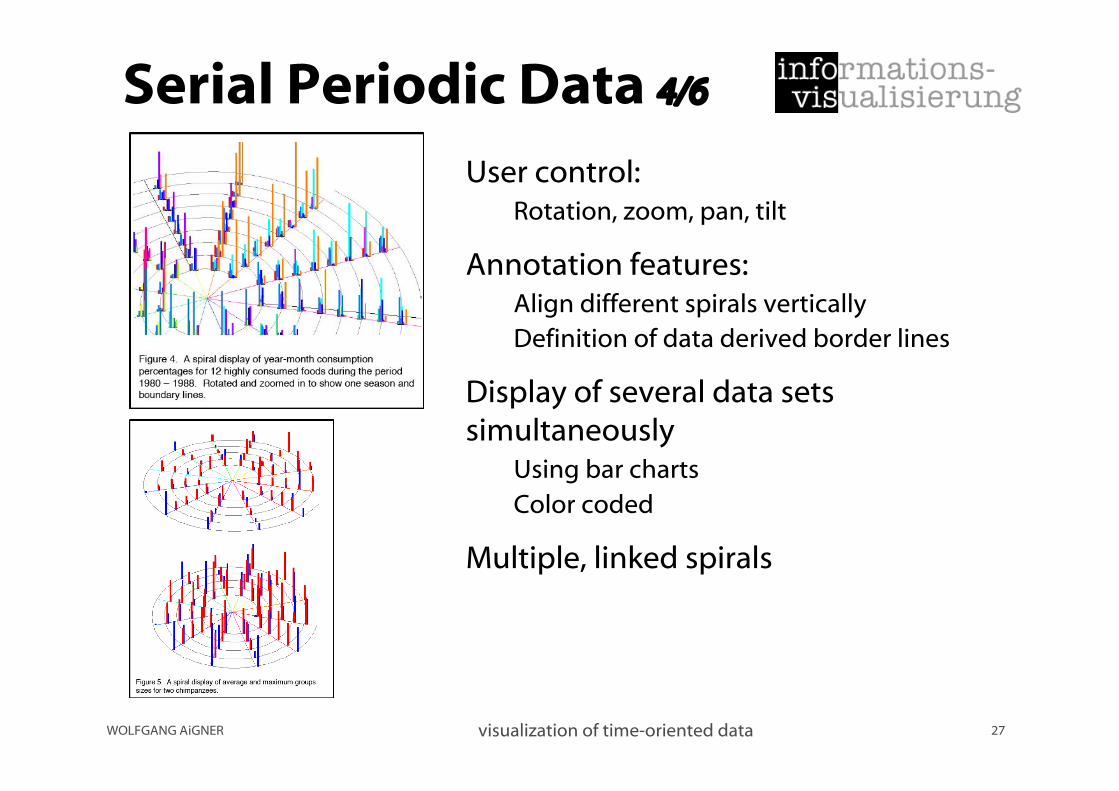
WOLFGANG AiGNER visualization of time-oriented data 27
User control:Rotation, zoom, pan, tilt
Annotation features:Align different spirals verticallyDefinition of data derived border lines
Display of several data setssimultaneously
Using bar chartsColor coded
Multiple, linked spirals
Serial Periodic Data 4/6

WOLFGANG AiGNER visualization of time-oriented data 28
Serial Periodic Data 5/6
Interval dataOnly duration of element
Periodicity unknownAnimation

WOLFGANG AiGNER visualization of time-oriented data 29
Serial Periodic Data 6/6
User experience findings:+ Users quickly accept the notion of serial periodic
data on a spiral+ Users react to the spiral displays
When they saw patterns, they tried to explain them by
telling stories
+ Users want more
Visualization sparked interest for further investigation
- Tool not self explanatory
Trained operator needed

WOLFGANG AiGNER visualization of time-oriented data 30
Spiral Graph 1/3
Main intension: detection ofperiodic behavior
Mapping data onto a spiralMapping of data values to
– color and
– thickness of line
Nominal + ordinal +quantitative data
1 cycle =period length
[Weber et al., 2001]

WOLFGANG AiGNER visualization of time-oriented data 31
Spiral Graph 2/3
Two possibilities to detect periodic behavior:
1. Computational:Compute frequencies with higher amplitudes via Fourier Transformation
2. Visually:Utilize the visual system of a human observer to discover structures
Spiral is animated by continously changing the cycle length
Periodic behavior becomes immediately apparent(changing from unstructured to structured)
User can stop animation when period is spotted

WOLFGANG AiGNER visualization of time-oriented data 32
Spiral Graph 3/3
Extensions:
Multi SpiralsCompare a data set with cyclic patternsin other data.Rendering intertwined Spiral Graphs.
3D extensionProblem: space mapping onto a helix.Brushing integrated.Selected region is displayed in 2Dspiral.3D helix best used for navigation only.
WOLFGANG AiGNER visualization of time-oriented data 33
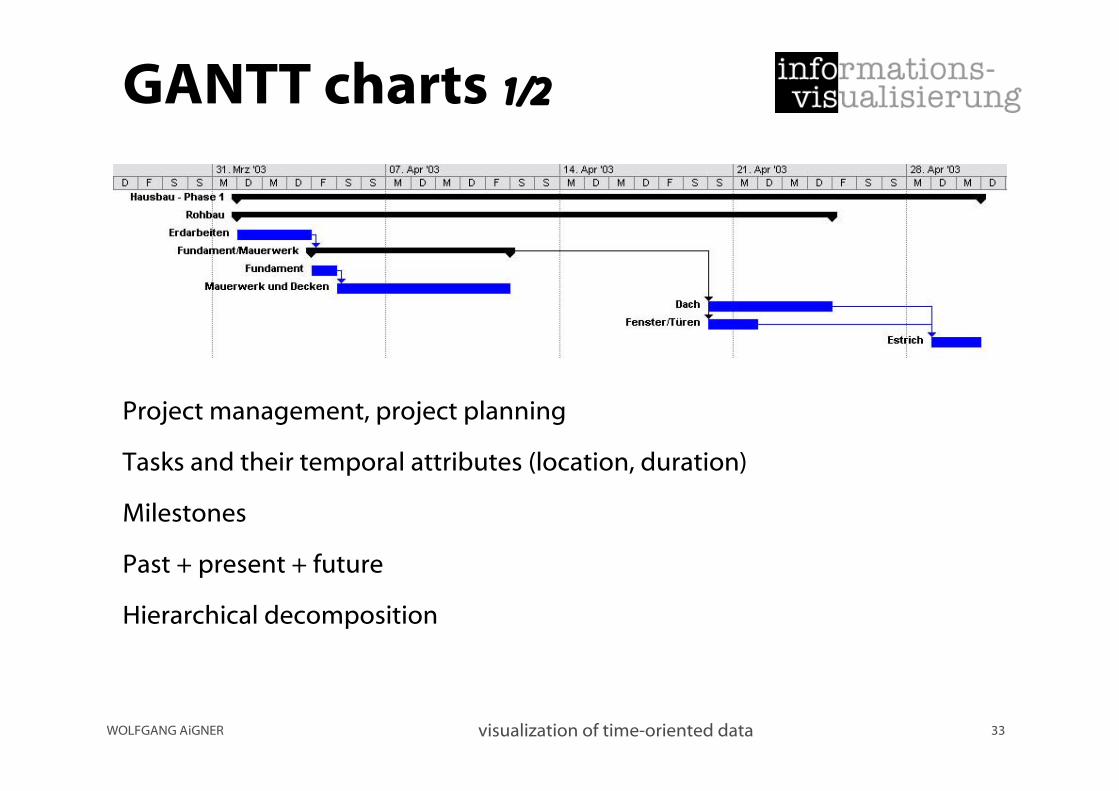
GANTT charts 1/2
Project management, project planning
Tasks and their temporal attributes (location, duration)
Milestones
Past + present + future
Hierarchical decomposition
WOLFGANG AiGNER visualization of time-oriented data 34
GANTT charts 2/2
Pros:Well known representation
Collapsable hierarchical decompostion
Easy to comprehend
Hundreds of tools available (i.e. MS Project)
Cons:No uncertainty
Space consumption (diagonal layout)

WOLFGANG AiGNER visualization of time-oriented data 35
LifeLines 1/2
Based on Time Lines
Facets
Visualizing personalhistories and patientinformation
Horizontal bars showingtemporal location andduration of data elements
Past + Present
[Plaisant et al., 1996, Plaisant et al., 1998]
http://www.cs.umd.edu/hcil/lifelines/latestdemo/kaiser.html DEMO
WOLFGANG AiGNER visualization of time-oriented data 36
LifeLines 2/2
Pros:Simple and easy to comprehend
Better layout than GANTT
Use of vertical dimension
Interactive time scale (zoom, pan)
Cons:No hierarchical decomposition (only Facets)
(Just past and present)
[Plaisant et al., 1996] Plaisant, C., Milash, B., Rose, A., Wido , S., and Shneiderman,
B. (1996). LifeLines: Visualizing Personal Histories. In Proceedings CHI'96
ACM Conference on Human Factors in Computing Systems, pages 221{227, New
York. ACM Press.
[Plaisant et al., 1998] Plaisant, C., Mushlin, R., Snyder, A., Li, J., Heller, D., and
Shneiderman, B. (1998). LifeLines: Using Visualization to Enhance Navigation
and Analysis of Patient Records. In Proceedings of the 1998 American Medical
Informatic Association Annual Fall Symposium, pages 76-80.

WOLFGANG AiGNER visualization of time-oriented data 37
Perspective Wall
Large collections of documents
Focus + Context of elements over time
Intuitive 3D metaphor for distorting 2D layout
Color coding
Smooth transitions, 3D interactive animation
[Mackinlay et al., 1991]

WOLFGANG AiGNER visualization of time-oriented data 38
Dynamic Timelines
3D presentation of historical informationhistory of photography
seamless micro and macro readingssemantic zoomtranslucencyanimated visual transition
F+C by selective transparency (queries)
[Kullberg, 1995; Kullberg, 1996]

WOLFGANG AiGNER visualization of time-oriented data 39
Timeline CinematicTemporal Ride
3D representation
timelines are createdfrom date, image and textdata
subjective reshapingand repositioning
animation / ride along anindividual timeline
[Elise Co, 1997]
http://acg.media.mit.edu/projects/timelines/

WOLFGANG AiGNER visualization of time-oriented data 40
The Historical Event Markupand Linking Project (HEML)
marking up web documents
different representationstabletimelinemapanimated map
XML-Schema for historicalevents
participants, dates, location,keywords, evidence (ref)
web serviceuse of open technologiesXSLT, SVG, Servlets, ...
http://www.heml.org/
WOLFGANG AiGNER visualization of time-oriented data 41
Temporal Objects 1/2
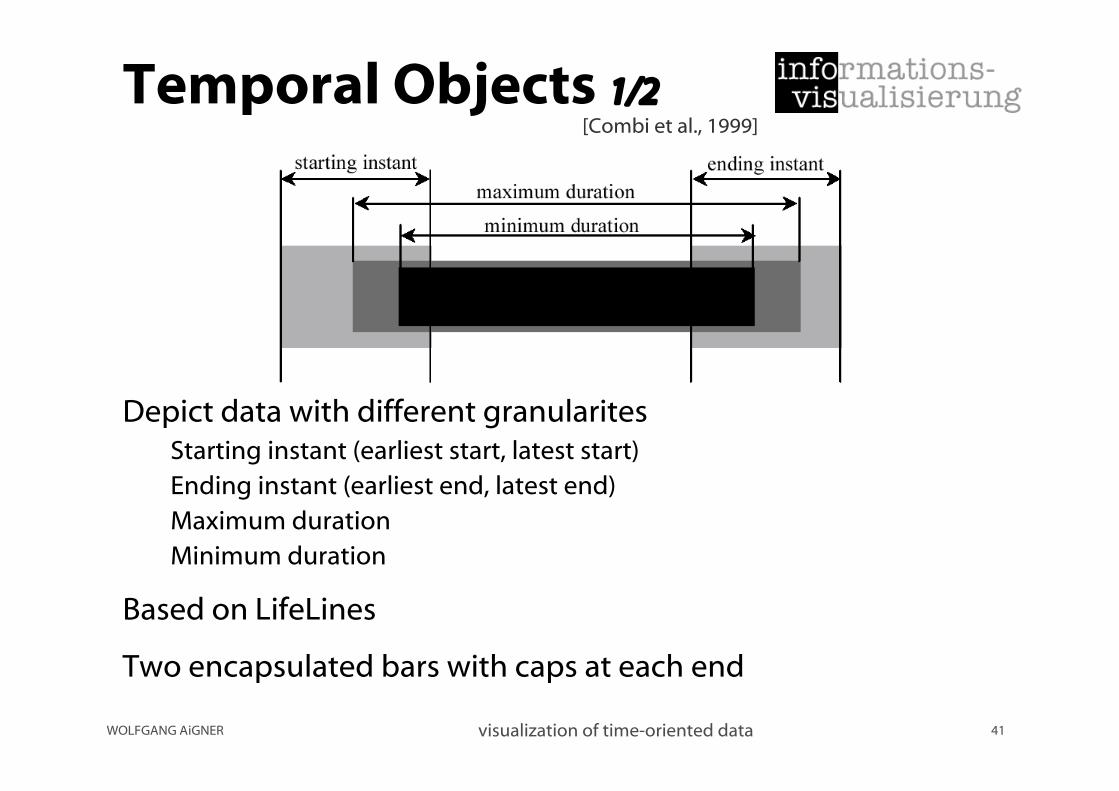
Depict data with different granularitesStarting instant (earliest start, latest start)Ending instant (earliest end, latest end)Maximum durationMinimum duration
Based on LifeLines
Two encapsulated bars with caps at each end
[Combi et al., 1999]
WOLFGANG AiGNER visualization of time-oriented data 42
Temporal Objects 2/2
Pros:Simple representation for complex time attributesDifferent granularitiesEasy to comprehend
Cons:Only presentation, no interactionNo direct manipulation

WOLFGANG AiGNER visualization of time-oriented data 43
Time AnnotationGlyph 1/2
For representation of future planning data (uncertainty / indeterminacy)
Characteristics:Time points are relative (Reference point)Notion for temporal granularityNotion for missing values / incomplete specificationsMetaphor of bar lying on diamonds (preventing invalid constellations)User interaction / can be manipulated
[Kosara and Miksch, 1999]

WOLFGANG AiGNER visualization of time-oriented data 44
Time AnnotationGlyph 2/2

WOLFGANG AiGNER visualization of time-oriented data 45
Paint Strips
Metaphor of paint rollers
Paint roller at the end of a line = line can expand
Wall = expansion limit
Smaller set of temporal attributes as “Temporal Objects” and“Time Glyph”
Combination of strips (rope)
Starting and finishing interval can’t be defined independentlyfrom duration
[Chittaro and Combi, 2001]
WOLFGANG AiGNER visualization of time-oriented data 46
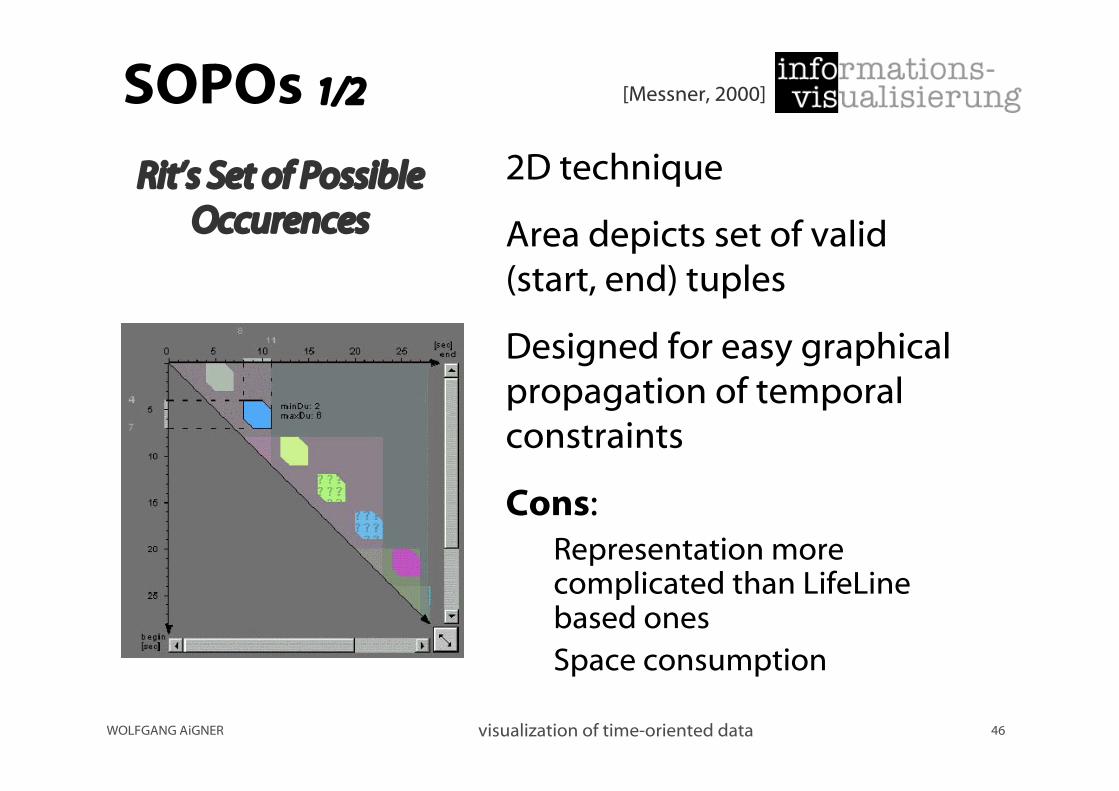
SOPOs 1/2
2D technique
Area depicts set of valid(start, end) tuples
Designed for easy graphicalpropagation of temporalconstraints
Cons:Representation morecomplicated than LifeLinebased onesSpace consumption
[Messner, 2000]
Rit’s Set of PossibleOccurences

WOLFGANG AiGNER visualization of time-oriented data 47
SOPOs 2/2
Start interval: x-axis
End interval: y-axis
Minimum duration,maximum duration:constraining bordersparallel to 45° time flowaxis

WOLFGANG AiGNER visualization of time-oriented data 48
Intrusion Detection
Visualization of user access tomachines over time.
Mapping:Time: circumference
User: cylinder slice
Machines: cubes on top
Access: connection lines
Annotations via tool tips(mouse hovering)
[Muniandy, 2001]

WOLFGANG AiGNER visualization of time-oriented data 49
ThemeRiverTM 1/3
Visualize thematic variations over time.
Across a large collection of documents.
River Metaphor: the “river” flows through time.
Changing width to depict changes.
Themes or topics are colored “currents”.
[Havre et al., 2000]

WOLFGANG AiGNER visualization of time-oriented data 50
ThemeRiverTM 2/3
Continuous flow
Interpolation, approximation
Easy to follow a single current(curving continous lines)
Discrete values
Exact values
Hard to follow a singlecurrent
Histogram vs. ThemeRiverTM:

WOLFGANG AiGNER visualization of time-oriented data 51
ThemeRiverTM 3/3
User interaction:Hide or display
topic + event labelstime + event grid linesraw data points
Choose alternate algorithms for line drawingPan + Zoom
Color relationsRelated themes are associated to the same color family
Improvements:Parallel riversDisplay of numeric values (on demand)Total number of documentsAccess documents directlyUser defined ordering

WOLFGANG AiGNER visualization of time-oriented data 52
Lexis Pencil
Pencil-like geometricobjects
Mapping time-dependent variablesonto faces of the pencil
Heterogeneous data
[Francis and Pritchard, 1997]
Can be located in 3D space toshow the spatial context
Tip allows exact positioningProblem: Occlusion
Focus + ContextOn pencil: by radial arrangementIn 3D space: enlarging pencil infocus
WOLFGANG AiGNER visualization of time-oriented data 53
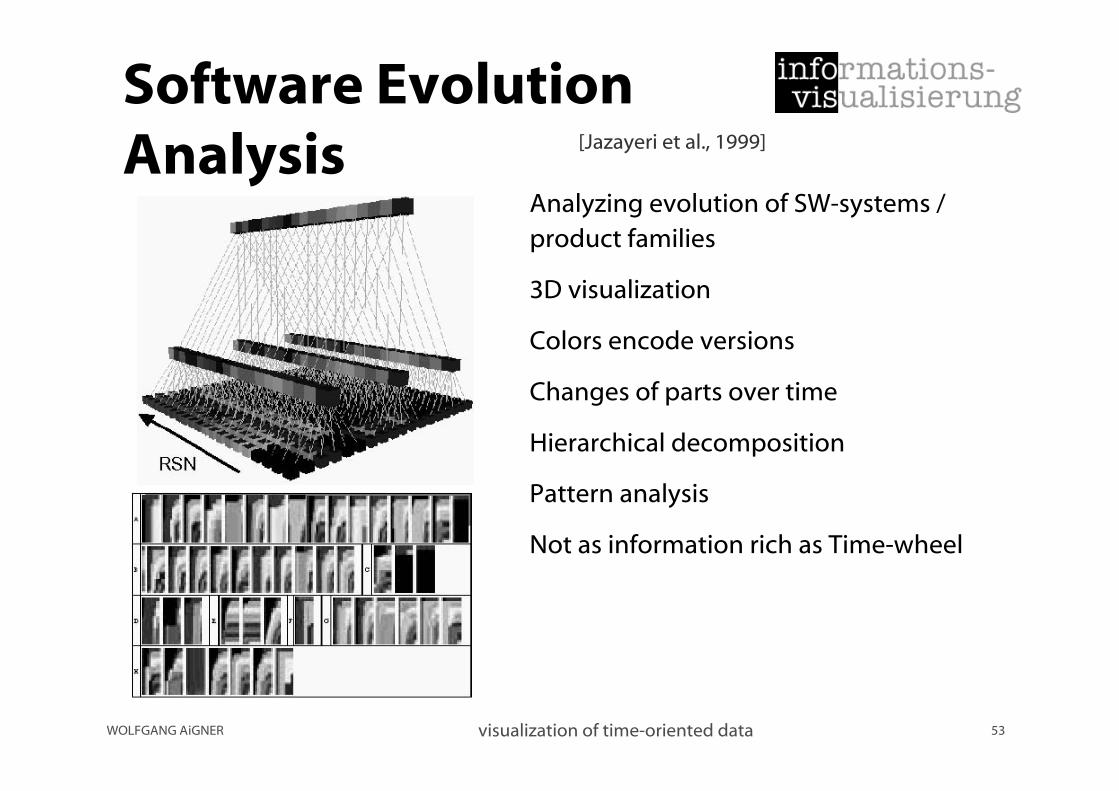
Software EvolutionAnalysis
Analyzing evolution of SW-systems /product families
3D visualization
Colors encode versions
Changes of parts over time
Hierarchical decomposition
Pattern analysis
Not as information rich as Time-wheel
[Jazayeri et al., 1999]
WOLFGANG AiGNER visualization of time-oriented data 54
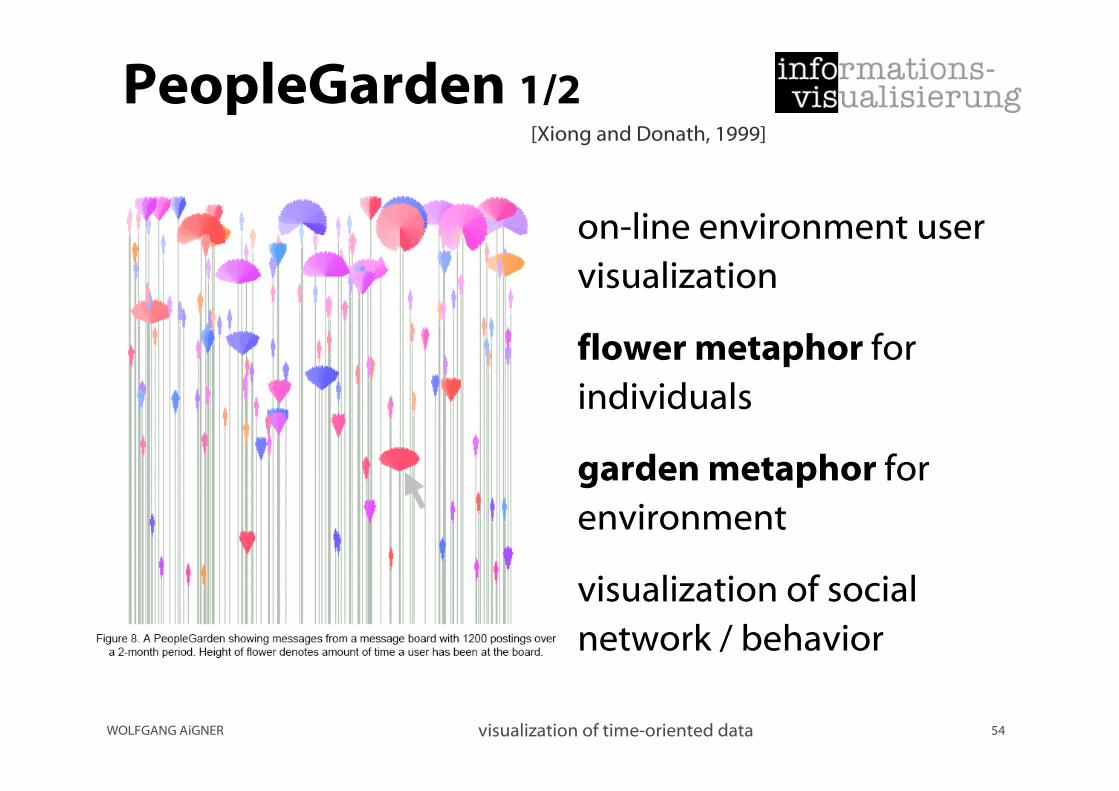
PeopleGarden 1/2
on-line environment uservisualization
flower metaphor forindividuals
garden metaphor forenvironment
visualization of socialnetwork / behavior
[Xiong and Donath, 1999]

WOLFGANG AiGNER visualization of time-oriented data 55
PeopleGarden 2/2
time of posting --> ordering, saturation
amount of response --> circles on top of petals
whether a post starts a new conversation --> color
how long a user is on the board --> flower height
[Xiong and Donath, 1999]
WOLFGANG AiGNER visualization of time-oriented data 56
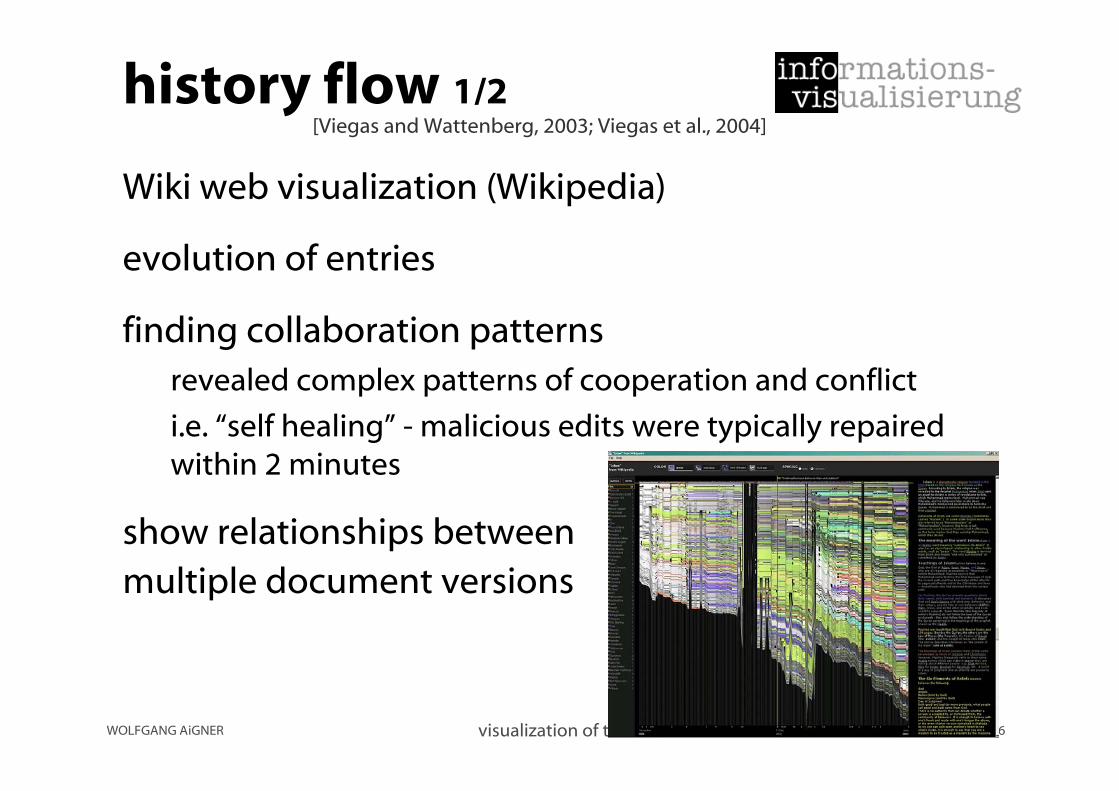
history flow 1/2
Wiki web visualization (Wikipedia)
evolution of entries
finding collaboration patternsrevealed complex patterns of cooperation and conflict
i.e. “self healing” - malicious edits were typically repairedwithin 2 minutes
show relationships betweenmultiple document versions
[Viegas and Wattenberg, 2003; Viegas et al., 2004]

WOLFGANG AiGNER visualization of time-oriented data 57
history flow 2/2
vertical revision lineslength is proportional to text length
different colors for authors (original author)
gaps in connections clearly highlightdeletions and insertions
“space by occurence” vs. “space by date”
WOLFGANG AiGNER visualization of time-oriented data 58
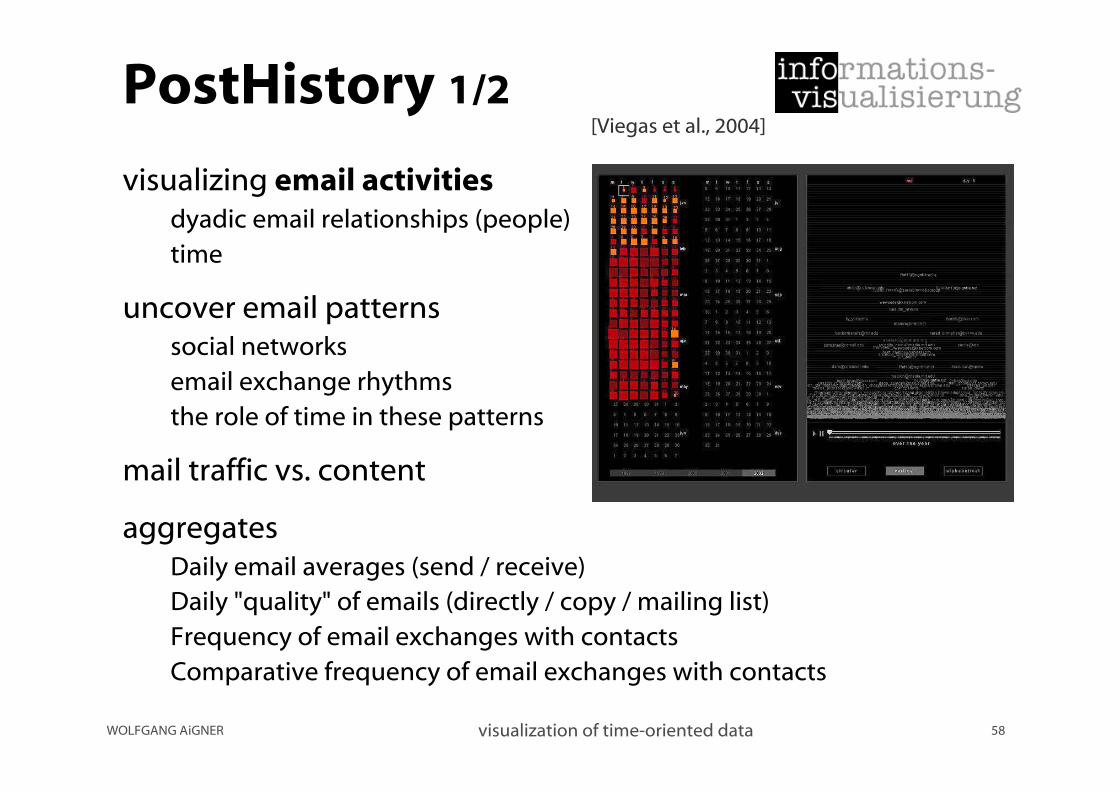
PostHistory 1/2
visualizing email activitiesdyadic email relationships (people)time
uncover email patternssocial networksemail exchange rhythmsthe role of time in these patterns
mail traffic vs. content
aggregatesDaily email averages (send / receive)Daily "quality" of emails (directly / copy / mailing list)Frequency of email exchanges with contactsComparative frequency of email exchanges with contacts
[Viegas et al., 2004]

WOLFGANG AiGNER visualization of time-oriented data 59
PostHistory 2/2
calendar panelintensity of email exchanges over time
each square represents a single day
row --> week; one year at a time
amount of received emails --> size of square
personal or directed (mailing-list) --> color(average is calculated)
contacts panelnames of the people who havesent messages to the user
different layouts
interaction by highlighting andanimation through time
WOLFGANG AiGNER visualization of time-oriented data 60
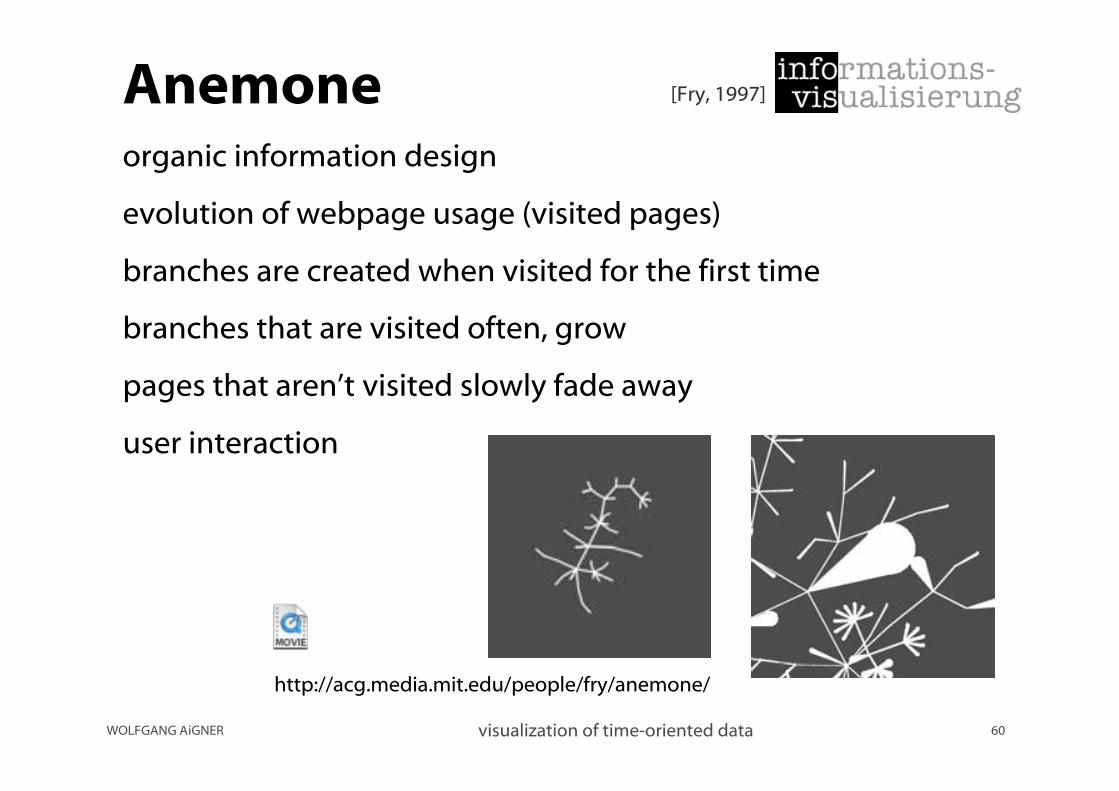
Anemoneorganic information design
evolution of webpage usage (visited pages)
branches are created when visited for the first time
branches that are visited often, grow
pages that aren’t visited slowly fade away
user interaction
[Fry, 1997]
http://acg.media.mit.edu/people/fry/anemone/
WOLFGANG AiGNER visualization of time-oriented data 61
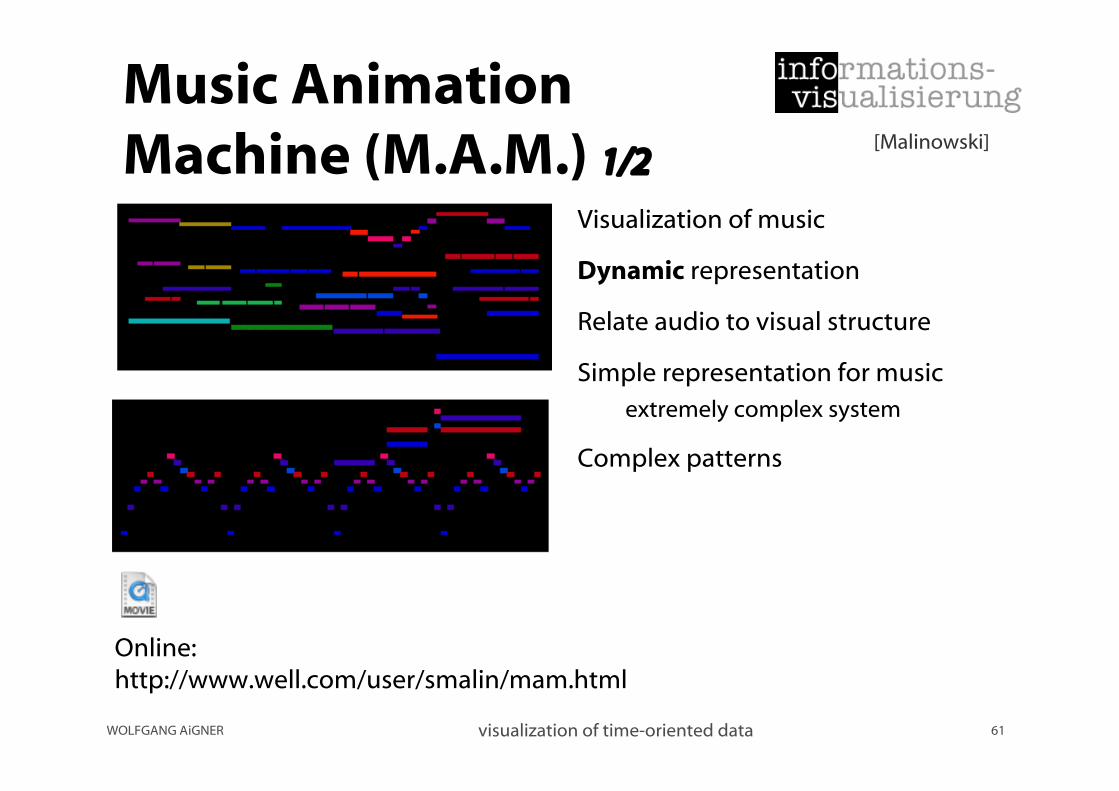
Music AnimationMachine (M.A.M.) 1/2
Visualization of music
Dynamic representation
Relate audio to visual structure
Simple representation for musicextremely complex system
Complex patterns
Online:http://www.well.com/user/smalin/mam.html
[Malinowski]

WOLFGANG AiGNER visualization of time-oriented data 62
Music AnimationMachine (M.A.M.) 2/2
Each note is representedby a colored bar
Each bar lights up as itsnote sounds
The length of each barcorresponds exactly to theduration of its note as performed
The vertical position of the bar corresponds to the pitch
The horizontal position indicates the note's timing
WOLFGANG AiGNER visualization of time-oriented data 63
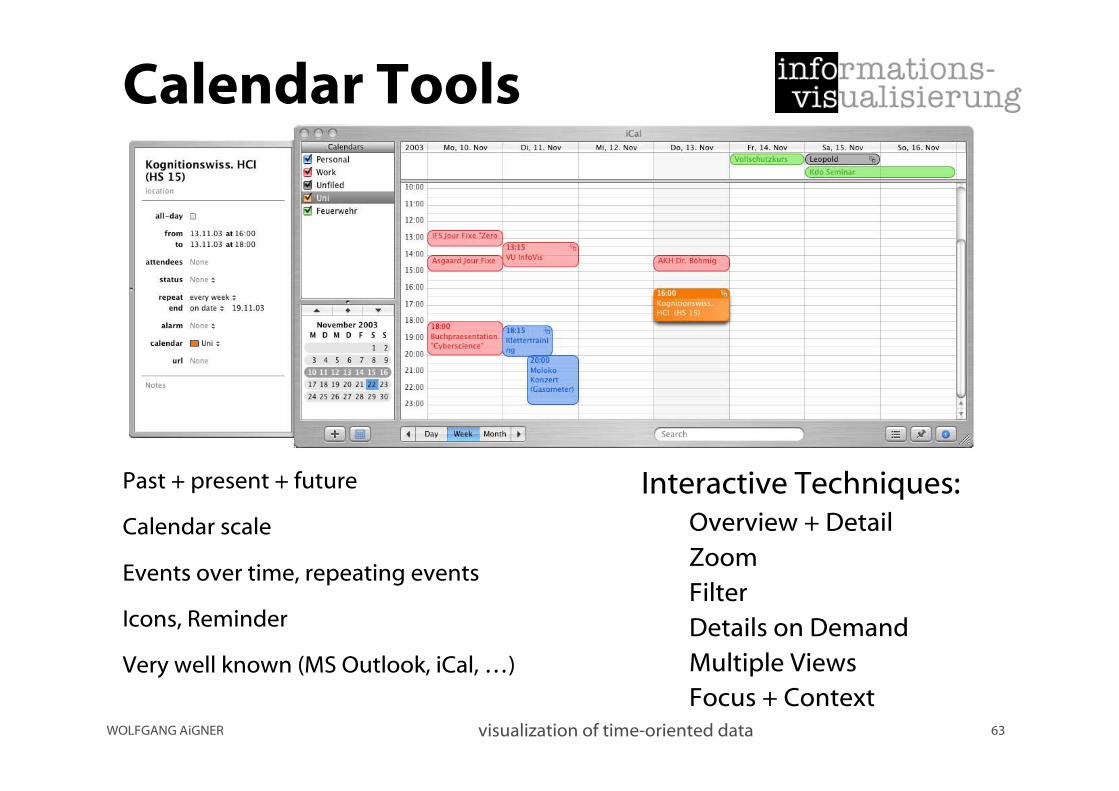
Calendar Tools
Past + present + future
Calendar scale
Events over time, repeating events
Icons, Reminder
Very well known (MS Outlook, iCal, …)
Interactive Techniques:Overview + DetailZoomFilterDetails on DemandMultiple ViewsFocus + Context

WOLFGANG AiGNER visualization of time-oriented data 64
SpiraClock 1/2
Visualization technique for nearby events.
Intention: fill gap between static calendar and pop-upreminders.
Continuous and non-intrusive feedback.
Analog clock with white spiralinside representing near future.
[Dragicevic and Huot, 2002]

WOLFGANG AiGNER visualization of time-oriented data 65
SpiraClock 2/2
Interaction:Change time by moving hands.Adjust number of spiral revolutions
(visibility of future events)
Range: 1 hour - several days
Not suited for all kinds of eventsi.e. conference, 20. - 25. October
Java applets and applications:http://www.emn.fr/spiraclock
Bus schedule, MS Outlook and vCal import
DEMO

WOLFGANG AiGNER visualization of time-oriented data 66
Spiral Calendar
individual schedule
3D spiral layout
behaviour: clicking, animation
animated transitions
[Mackinlay et al., 1994]
WOLFGANG AiGNER visualization of time-oriented data 67
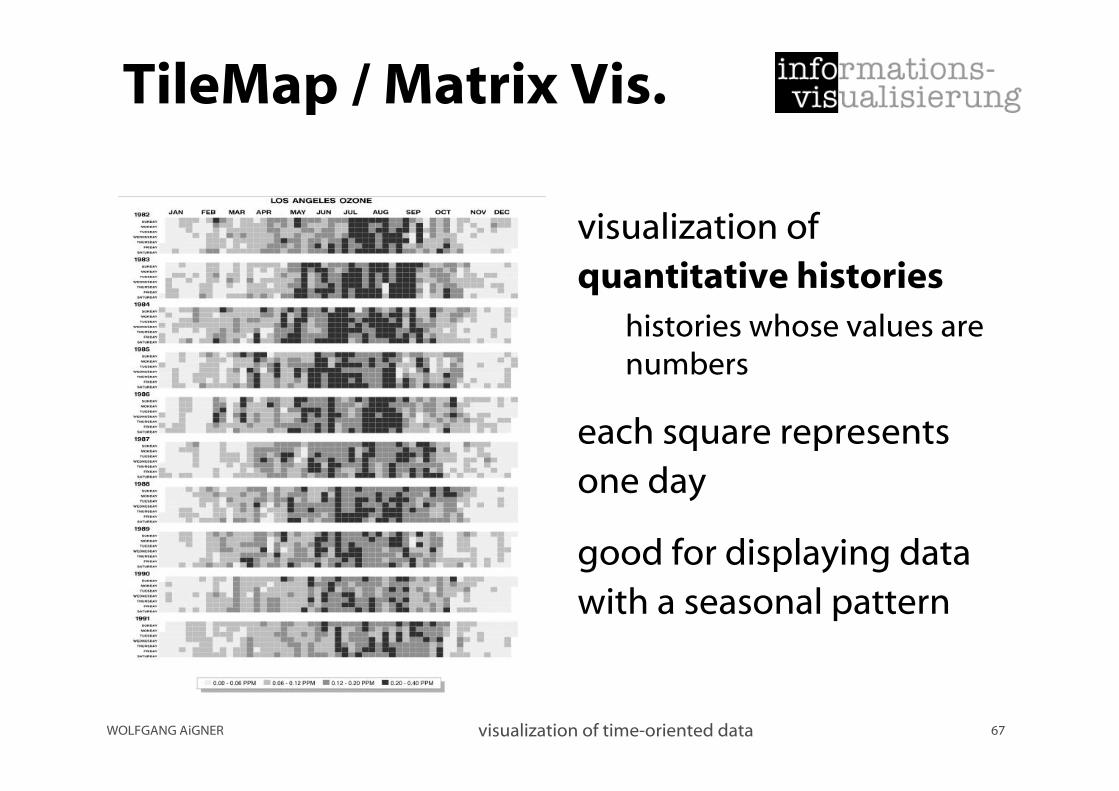
TileMap / Matrix Vis.
visualization ofquantitative histories
histories whose values arenumbers
each square representsone day
good for displaying datawith a seasonal pattern

WOLFGANG AiGNER visualization of time-oriented data 68
Time-wheel 1/3
Visualization of software projects overtime
Multiple time-series placed in a circle
Data attributes are color coded
Global trends
Helps to examine different trendswithin one object
Easy recognition of two trends:Increasing trend
Tapering trend
[Chuah and Eick, 1997]
WOLFGANG AiGNER visualization of time-oriented data 69
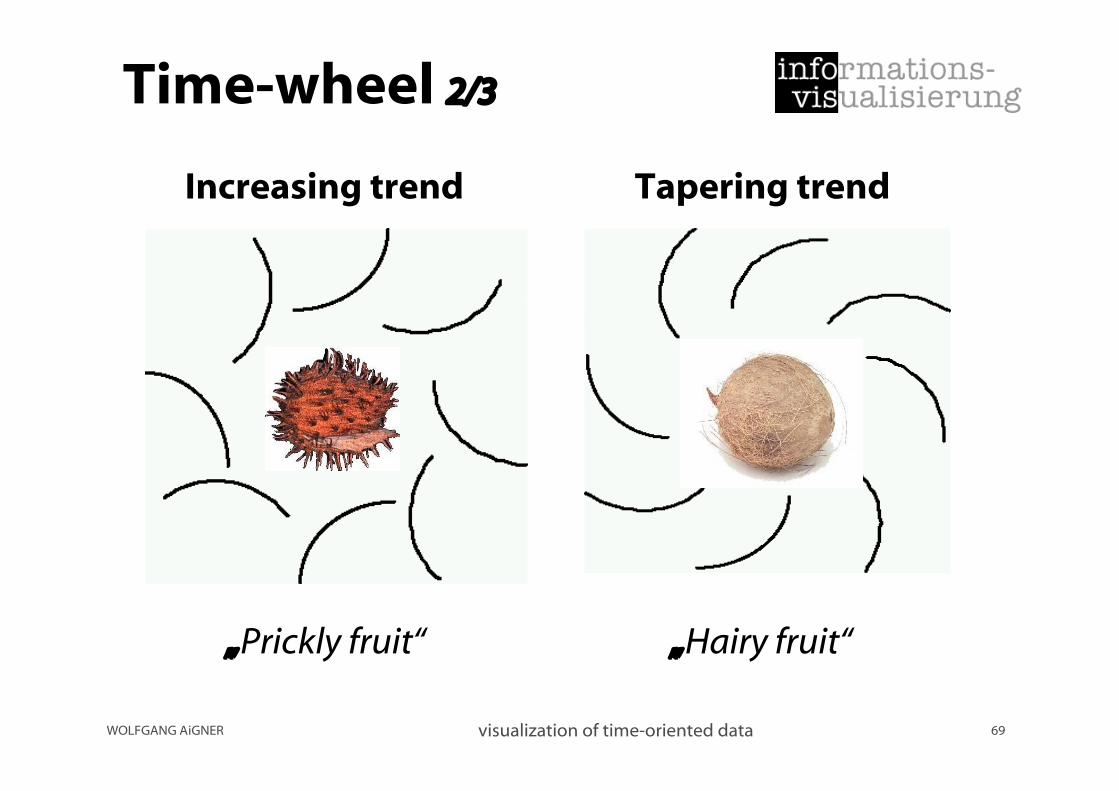
Time-wheel 2/3
Increasing trend Tapering trend
„Prickly fruit“ „Hairy fruit“

WOLFGANG AiGNER visualization of time-oriented data 70
Time-wheel 3/3
Extension to 3D:
Encodes the same attributes as the Time-wheel
Uses height dimension to encode time
Variables are encoded as slices of a base circle
Pro: Easier to identify overall trends
Cons:Occlusion
Perspective

WOLFGANG AiGNER visualization of time-oriented data 71
10x10
100 words and pictures that define the time
RSS news feeds are scanned + linguistic analysis --> top 100words
fisheye menu for selecting words
[J. Harris, 2004]
http://www.tenbyten.org/10x10.html
WOLFGANG AiGNER visualization of time-oriented data 72
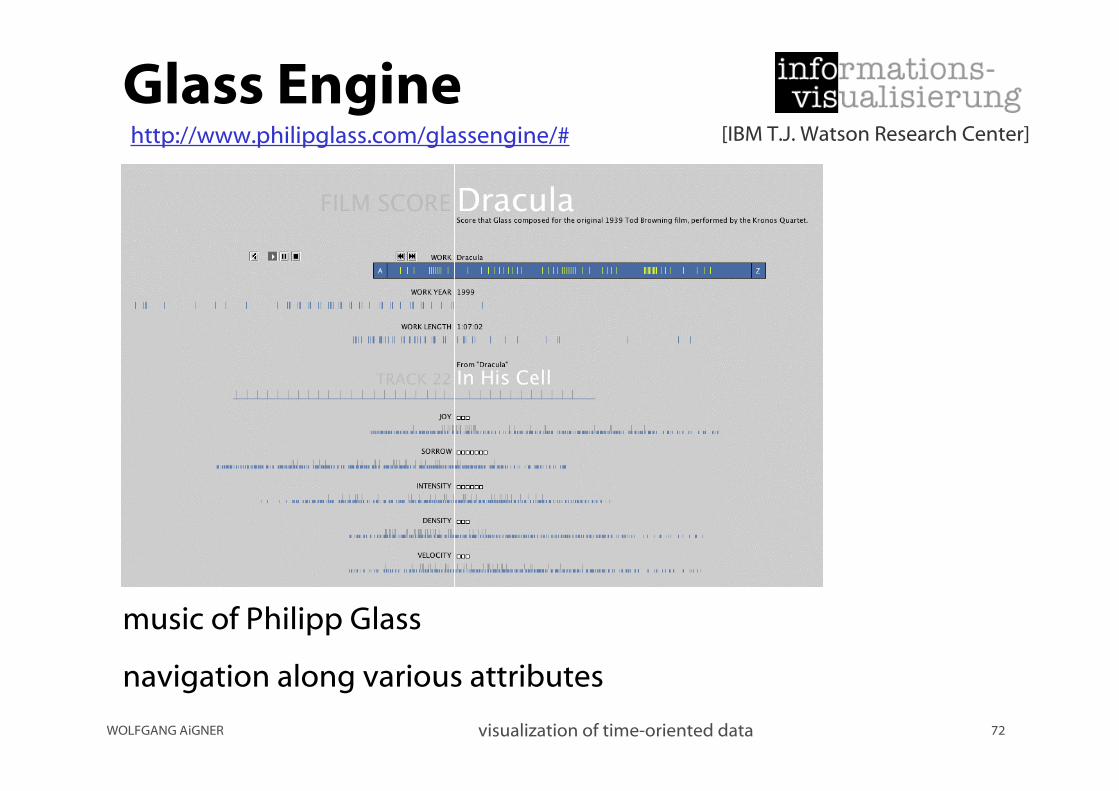
Glass Engine
music of Philipp Glass
navigation along various attributes
http://www.philipglass.com/glassengine/# [IBM T.J. Watson Research Center]
WOLFGANG AiGNER visualization of time-oriented data 73
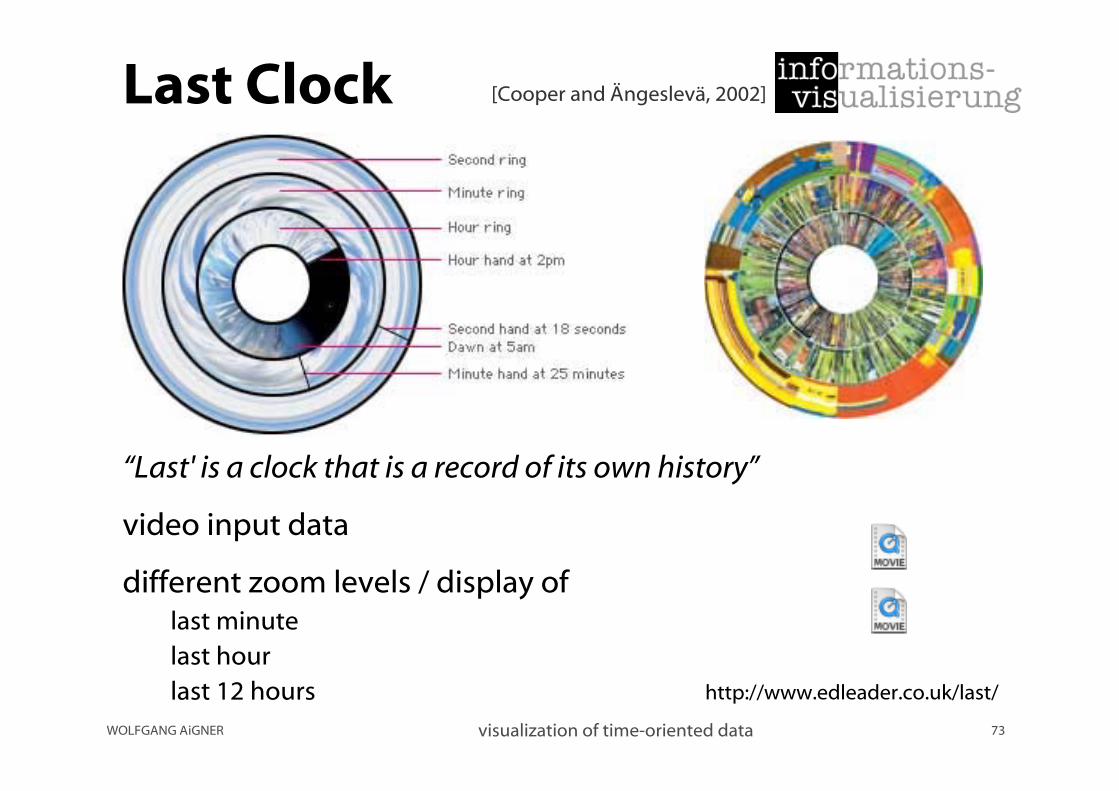
Last Clock
“Last' is a clock that is a record of its own history”
video input data
different zoom levels / display oflast minutelast hourlast 12 hours
[Cooper and Ängeslevä, 2002]
http://www.edleader.co.uk/last/
WOLFGANG AiGNER visualization of time-oriented data 74
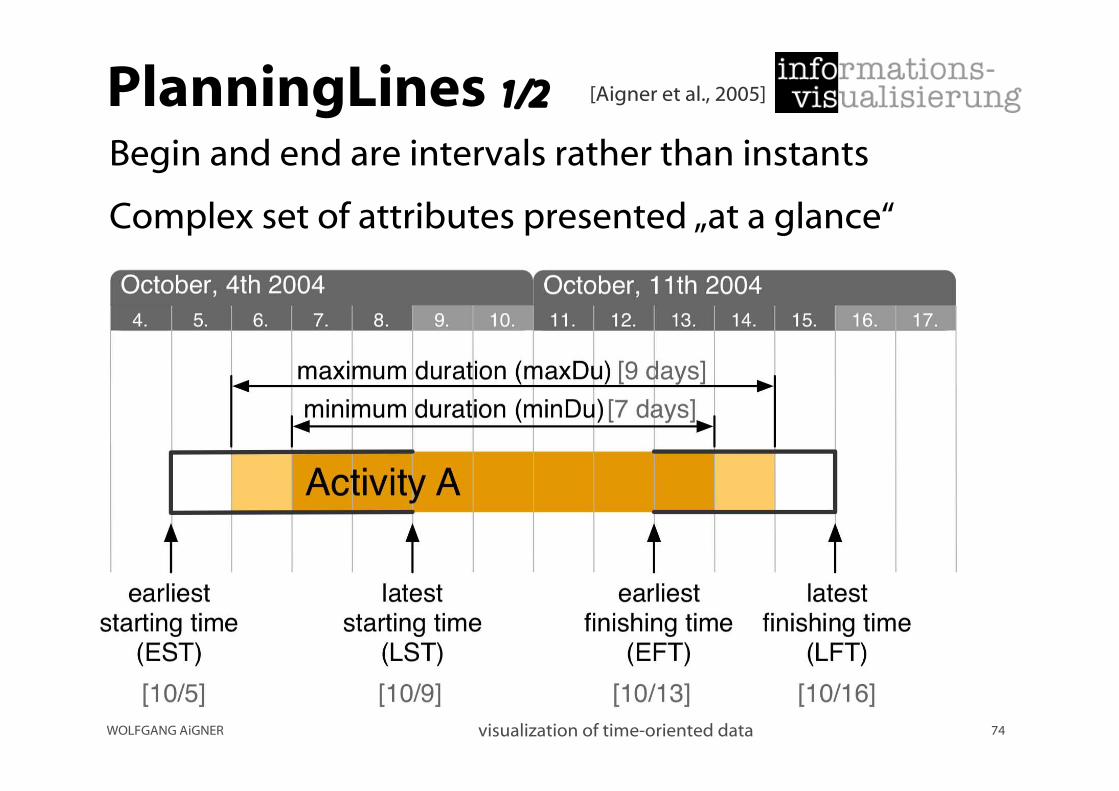
PlanningLines 1/2
Begin and end are intervals rather than instants
Complex set of attributes presented „at a glance“
[Aigner et al., 2005]

WOLFGANG AiGNER visualization of time-oriented data 75
PlanningLines 2/2
DEMO

WOLFGANG AiGNER visualization of time-oriented data 76
GRAVI++
spring-based
questions/questionnairespatients
attraction fieldstar glyph
time steps
traces
[Hinum et al., 2005]
DEMO

WOLFGANG AiGNER visualization of time-oriented data 77
CareVis
integrated visualization of computerized protocols andtemporal patient data
QuickView Panel
Logical
ViewTemporal View
[Aigner et al., 2004]
WOLFGANG AiGNER visualization of time-oriented data 78
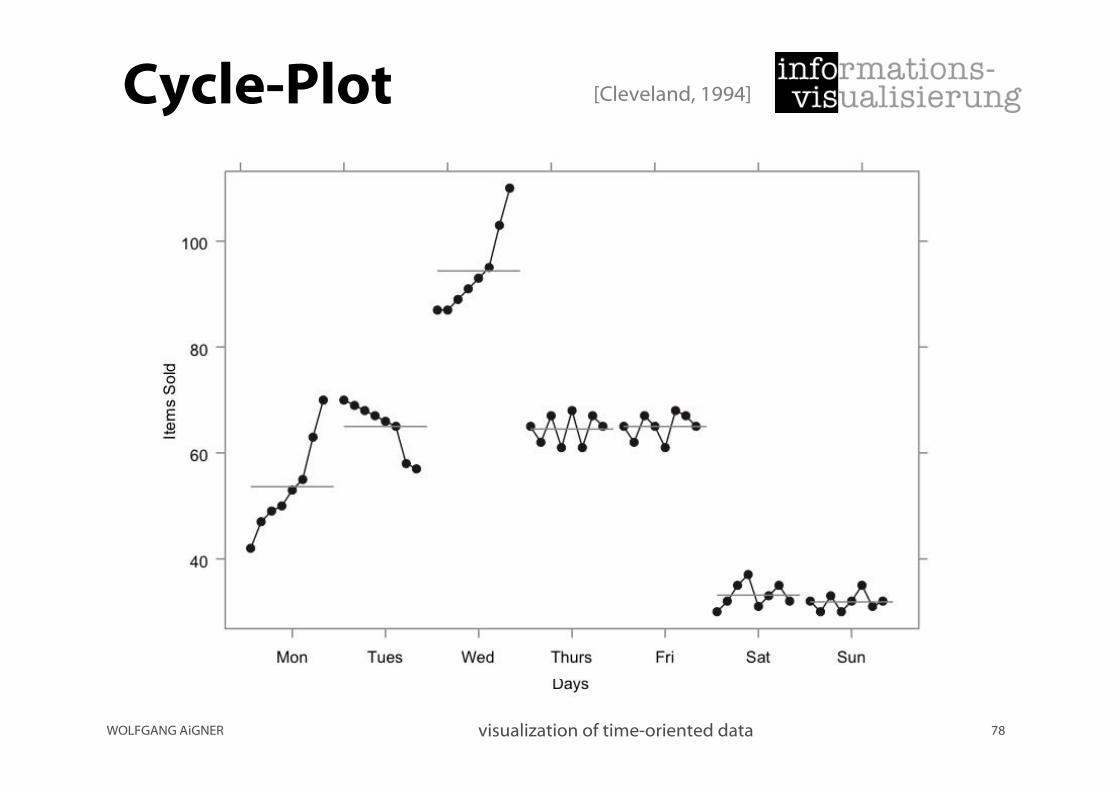
Cycle-Plot [Cleveland, 1994]

WOLFGANG AiGNER visualization of time-oriented data 79
Multi Scale 1/3 [Lammarsch, 2008]

WOLFGANG AiGNER visualization of time-oriented data 80
Multi-Scale 2/3
80
[Lammarsch, 2008]

WOLFGANG AiGNER visualization of time-oriented data 81
Multi-Scale 3/3 [Lammarsch, 2008]
Related Documents