Visualization of HPC simulation data – overview and tutorial – Markus Rampp Max Planck Computing and Data Facility (MPCDF) Topics ● data handling strategies ● visualization methods and tools ● example applications Acknowledgements K. Reuter, E. Erastova (MPCDF viz team), J. Skala (MPI f. Solar System Research)

Welcome message from author
This document is posted to help you gain knowledge. Please leave a comment to let me know what you think about it! Share it to your friends and learn new things together.
Transcript

Visualization of HPC simulation data– overview and tutorial –
Markus Rampp
Max Planck Computing and Data Facility (MPCDF)
Topics
● data handling strategies
● visualization methods and tools
● example applications
Acknowledgements
K. Reuter, E. Erastova (MPCDF viz team), J. Skala (MPI f. Solar System Research)

ISSS-12, Prague, Jul 6, 2015
M. Rampp, MPCDF
Outline
Part I: overview (M. Rampp)
● introduction
● data handling strategies
● Basics on tools: VisIT (main focus) and Paraview (basics)
● HPC Visualization infrastructure & workflows
● example projects:
→ practical hints (general)
→ impression on VisIT's and Paraview's capabilities from practical experience
Part II: hands-on (M. Rampp & J. Skala)
● VisIT (and Paraview) in action
→aims: get familiar with look and feel, basic commands
→limitations: workstation hardware may limit interactive experience

ISSS-12, Prague, Jul 6, 2015
M. Rampp, MPCDF
Introduction
Background: scientific visualization at the MPCDF
a central visualization infrastructure and project support for the Max-Planck Society (since 2008)
main targets: interactive, remote data exploration & analysis, presentation, publishing
● support for adaptation and instrumentation of simulation codes
● guidance for selection, adoption and usage of analysis & visualization software
● dedicated support for individual (particularly demanding) visualization projects
challenges:
● broad range of disciplines: plasmaphysics, astrophysics, . . . , comp. Biology
● variety of simulation codes: ”home-grown”, commercial, open-source, third-party, . . .
● non-standardized, heterogeneous data structures and formats
● ”legacy” analysis pipelines, . . .
● massive datasets from HPC simulations:
● massive: amount of raw data, memory requirements, complexity
● multidimensional (3D + time), multi-variate data
● ”unusual” grids: mesh-free data, special curvilinear coordinates, . . .
ISSS-12, Prague, Jul 6, 2015
M. Rampp, MPCDF
Data handling
Starting point (code developer's point of view)
code developer's point of view:
1) select data format and I/O library: POSIX, MPI-I/O, HDF5, NETCDF, ...
2) instrument code (or implement for data-conversion: glue code, post processing, plugin)
3) select visualization tools and workflows
4) … go back to 1)
Observation
largest barrier-to-entry into interactive data analysis & visualization is data formats/conversion:
● steps 1) and 2) are boring, tedious and time-consuming
● step 3) can be fun but is time-consuming
● step 4) can be extremely frustrating
… let's try to avoid trial and error by learning from practical experience
… you start at 3) if you are a user of an HPC code (not a developer)
ISSS-12, Prague, Jul 6, 2015
M. Rampp, MPCDF
Data handling
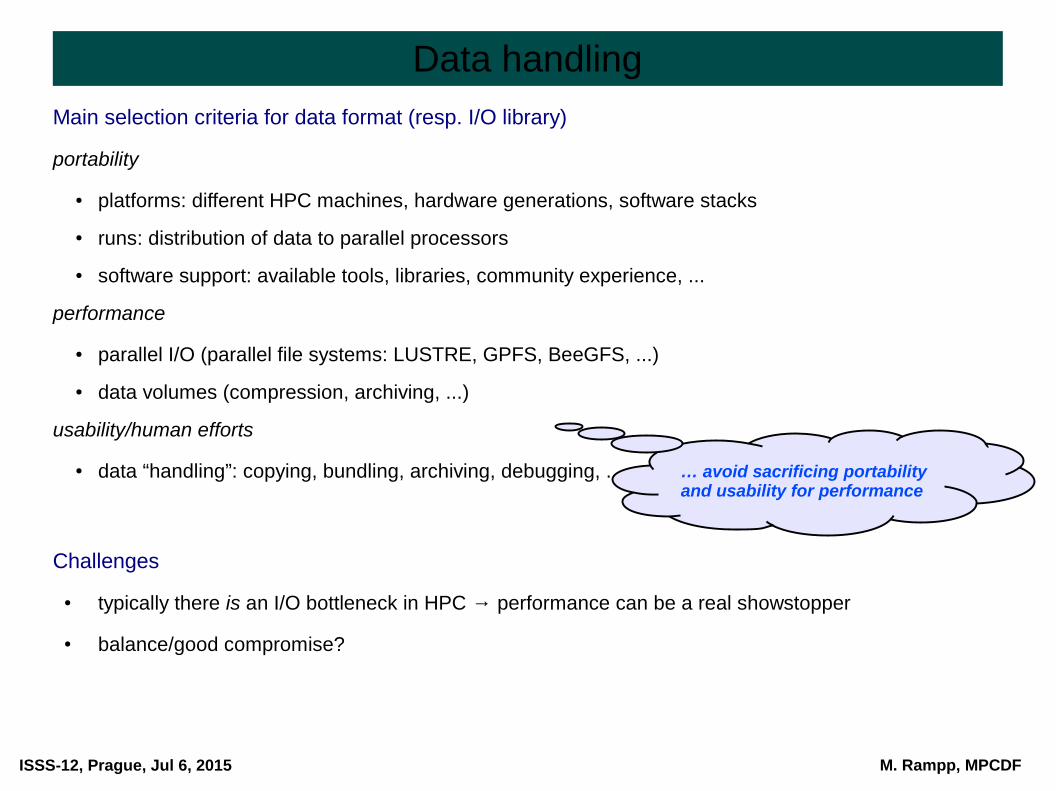
Main selection criteria for data format (resp. I/O library)
portability
● platforms: different HPC machines, hardware generations, software stacks
● runs: distribution of data to parallel processors
● software support: available tools, libraries, community experience, ...
performance
● parallel I/O (parallel file systems: LUSTRE, GPFS, BeeGFS, ...)
● data volumes (compression, archiving, ...)
usability/human efforts
● data “handling”: copying, bundling, archiving, debugging, ...
Challenges
● typically there is an I/O bottleneck in HPC → performance can be a real showstopper
● balance/good compromise?
… avoid sacrificing portability and usability for performance

ISSS-12, Prague, Jul 6, 2015
M. Rampp, MPCDF
Data handling
General recommendations
● design and implement a clear hierarchy for output data (dimensionality, frequency of dumps)
● control variables (scalars, 1D vectors) → usability, negligible I/O (stdout or alike)
● data to be routinely analyzed/visualized (2D, 3D, 4D, …) → optimize for usability keep an eye on performance
● checkpoint/restart: full precision, usually never analyzed → optimize for performance
● in-situ visualization (?): full precision, full time resolution
● if usability vs. performance does not work out → think of a post-processing pipeline
caveat: memory requirements → an HPC job in its own right => gains?
Software solutions for HPC
● MPI-IO (low-level), HDF5 (ecosystem of specifications, APIs, tools), NETCDF, ADIOS, …
● popular strategy: HDF5 for data to be visualized, raw MPI-IO or HDF5 for checkpoints
● HDF5: open source, widespread use (blame your local computing center!), integrates with parallel applications and file systems, high-performance I/O (implemented on top of MPI-IO), many utilities and tools, …
● supported by many visualization tools (VisIt, Paraview ,...)
ISSS-12, Prague, Jul 6, 2015
M. Rampp, MPCDF
HDF5
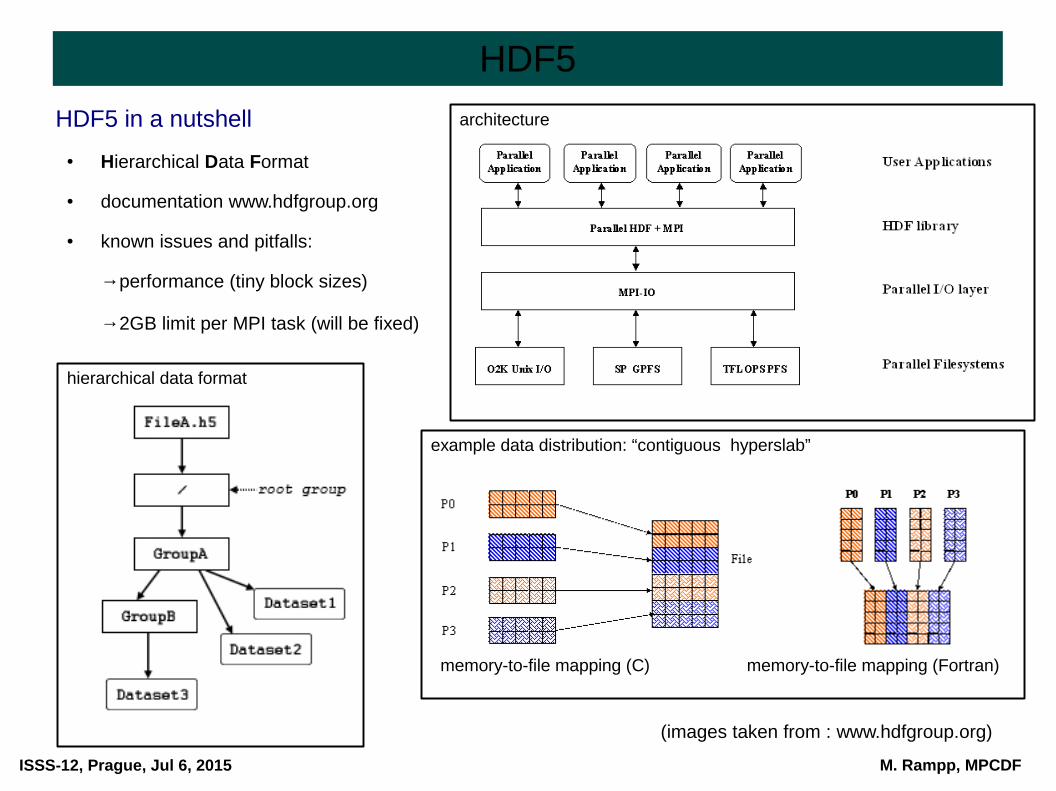
HDF5 in a nutshell
● Hierarchical Data Format
● documentation www.hdfgroup.org
● known issues and pitfalls:
→performance (tiny block sizes)
→2GB limit per MPI task (will be fixed)
hierarchical data format
architecture
(images taken from : www.hdfgroup.org)
memory-to-file mapping (C) memory-to-file mapping (Fortran)
example data distribution: “contiguous hyperslab”

ISSS-12, Prague, Jul 6, 2015
M. Rampp, MPCDF
Data handling: workflows
Explicit data conversion
allows some basic post-processing and/or data reduction of simulation output
quick (& dirty) programming: copy/paste from I/O statements in simulation code
duplication of data
→ which format? Silo (VisIt's "proprietary" data format), HDF5, VTK, ...
Development of a plugin (VisIT, Paraview)
no data duplication, no additional pre-processing step
plugin is dynamically loaded (code can reside under $HOME)
development requires C programming and compilation against a VisIt installation
not portable to other tools
Adaptation of I/O in simulation code
no data duplication, no additional preprocessing step
can promote interoperability with other tools (depending on chosen format, e.g. HDFVIEW)
implications for software management (code policies, access to source code, …)
→ which format? HDF5 (requires XDMF or alike for metadata), VTK, ...
ISSS-12, Prague, Jul 6, 2015
M. Rampp, MPCDF
Basic visualization methods
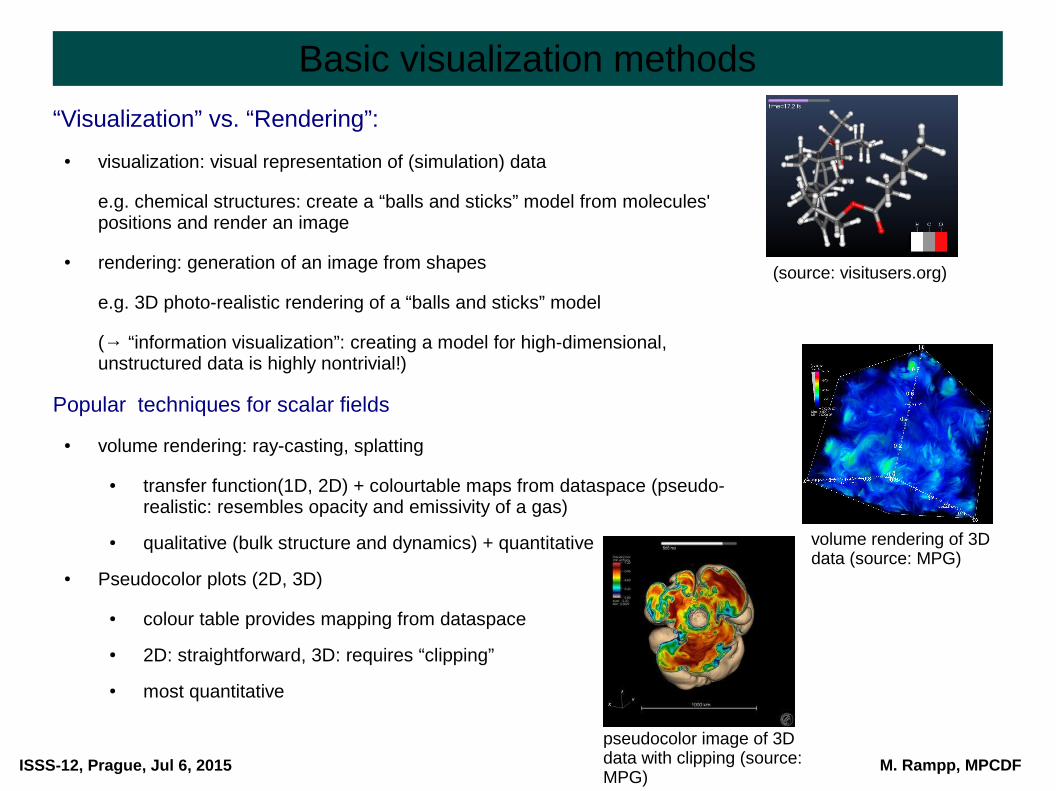
“Visualization” vs. “Rendering”:
● visualization: visual representation of (simulation) data
e.g. chemical structures: create a “balls and sticks” model from molecules' positions and render an image
● rendering: generation of an image from shapes
e.g. 3D photo-realistic rendering of a “balls and sticks” model
(→ “information visualization”: creating a model for high-dimensional, unstructured data is highly nontrivial!)
Popular techniques for scalar fields
● volume rendering: ray-casting, splatting
● transfer function(1D, 2D) + colourtable maps from dataspace (pseudo-realistic: resembles opacity and emissivity of a gas)
● qualitative (bulk structure and dynamics) + quantitative
● Pseudocolor plots (2D, 3D)
● colour table provides mapping from dataspace
● 2D: straightforward, 3D: requires “clipping”
● most quantitative
pseudocolor image of 3D data with clipping (source: MPG)
volume rendering of 3D data (source: MPG)
(source: visitusers.org)

ISSS-12, Prague, Jul 6, 2015
M. Rampp, MPCDF
Basic visualization methods
Popular techniques for vector fields
● arrow plots
● streamlines, streaklines, ...
● “contraction” to scalar field:
● absolute magnitude
● projected vorticity
● ...
streamlines of 3D data(source: visitusers.org)
3D vector field(source: visitusers.org)
streamwise vorticity(source: MPG)
velocity magnitude(source: MPG)
by courtesy of V. Avsarkisov (TU Darmstadt)

ISSS-12, Prague, Jul 6, 2015
M. Rampp, MPCDF
Visualization tools
Overview of software tools
● IDL, Matlab, octave, python/matplotlib, … for 1D and 2D plots (+time)
→ automated, quantitative analysis with lots of data processing (powerful languages)
● VisIT, Paraview for >2D data (+time)
→ interactive exploration
→ quantitative analysis
→ publication-quality plots, movies
● VisIT or Paraview ?
● primarily a matter of taste: very similar functionality, free software, well supported, ...
● Paraview may look and feel more “natural” (coming from the world of AVIZO/AMIRA)
● VisIT has its roots in astrophysics (and some built-in strengths in this area)
– → VisIT used as an example here (personal bias, this audience, ...)
– → astrophysicists do use Paraview!
● Others?
● VAPOR, VOREEN (optimized for special purposes), …, +commercial tools (AVIZO)
VisIT, Paraview provide complementary functionality, not a replacement for IDL, Matlab, python/matplotlib, ...

ISSS-12, Prague, Jul 6, 2015
M. Rampp, MPCDF
Visualization tools
Overview of software tools
● IDL, Matlab, octave, python/matplotlib, … for 1D and 2D plots (+time)
→ automated, quantitative analysis with lots of data processing (powerful languages)
● VisIT, Paraview for >2D data (+time)
→ interactive exploration
→ quantitative analysis
→ publication-quality plots, movies
● VisIT or Paraview ?
● primarily a matter of taste: very similar functionality, free software, well supported, ...
● Paraview may look and feel more “natural” (coming from the world of AVIZO/AMIRA)
● VisIT has its roots in astrophysics (and some built-in strengths in this area)
→ VisIT used as an example here (personal bias, this audience, ...)
→ astrophysicists do use Paraview!
● Others?
● VAPOR, VOREEN (optimized for special purposes), …, +commercial tools (AVIZO)
non-authoritative survey by P. Messmer (Nvidia)

ISSS-12, Prague, Jul 6, 2015
M. Rampp, MPCDF
Visualization tools
VisIT and Paraview (according to our own experience in the MPG) are:
● comprehensive visualization tools
● well documented: web pages, manuals, WiKi
● well supported: responsive mailing lists, feedback from developers, user community: www.visitusers.org, www.paraview.org
● extensible: e.g. data-reader plugins
● widely used in the scientific community, installed at many computing centres
● easy to install (executables for Linux x86_32/x86_64, Windows XP/Vista/7, Mac OS X)
● mature but also still under active development:
● VisIt 2.9.1 (May 2015) ... VisIt 2.5 (May, 2012) …VisIt 2.0 (May, 2010) … VisIt 1.10 (Aug, 2008) ...
● Paraview 4.3 (Jan 2015) … Paraview 4.1 (Jan 2014) ... Paraview 3.2 (Nov 2007) … Paraview 0.6 (Oct 2002)
VisIT or Paraview is not ...
● necessary (sufficient?) for analyzing low-dimensional data (< 3D) → python, idl, matlab, . . .
● a complete replacement for comprehensive quantitative analysis → python, idl, matlab, …
● a world-wide community effort for developing comprehensive repositories → python, GNU-R, ...

ISSS-12, Prague, Jul 6, 2015
M. Rampp, MPCDF
HPC Visualization infrastructure
Remote visualization
why centralizing visualization ?
● huge amounts of output data produced by HPC simulations
● transfer of raw data for local analysis & visualisation no more possible
● even dumping the RAM is becoming prohibitive due to I/O constraints
– in-situ visualisation (not covered here)
● visualisation requires HPC-like resources (specialized hardware, housing, . . . )
● requires substantial expertise on methods, software, . . . sustainability
→a necessity for a HPC centre rather than an optional service
enabling technology
● “server-side” rendering ← naïve approach (“ssh+X”) does not work!
● efficient and transparent remote rendering solution via WAN: VirtualGL/TurboVNC
● issues: trans-continental latency

ISSS-12, Prague, Jul 6, 2015
M. Rampp, MPCDF
Visualization infrastructure
Traditional (“X forwarding over ssh”)
● 3D geometry is transferred over network● fails to deliver interactive frame rates● uses X-server/graphics card of the client● not suited for 3D applications
Server-side rendering (“VNC”-like)
● only (compressed) images are transferred● interactive frame rates with moderate WAN
bandwidth● uses X-server/graphics card(s) of the server● generic and transparent solution (OpenGL)● mature software solutions/products:
● VirtualGL/TurboVNC (Open Source, ex SUN)
(illustrations by L. Scheck, with permission by LRZ)

ISSS-12, Prague, Jul 6, 2015
M. Rampp, MPCDF
Visualization infrastructure
● user's experience (example MPCDF viz service, linux desktop): remote desktop with optimization options: network bandwidth, latency, quality of rendering
● transparent use of visualization resources and applications (look-and-feel like local desktop):~>vglrun <executable>
ISSS-12, Prague, Jul 6, 2015
M. Rampp, MPCDF
Example projects
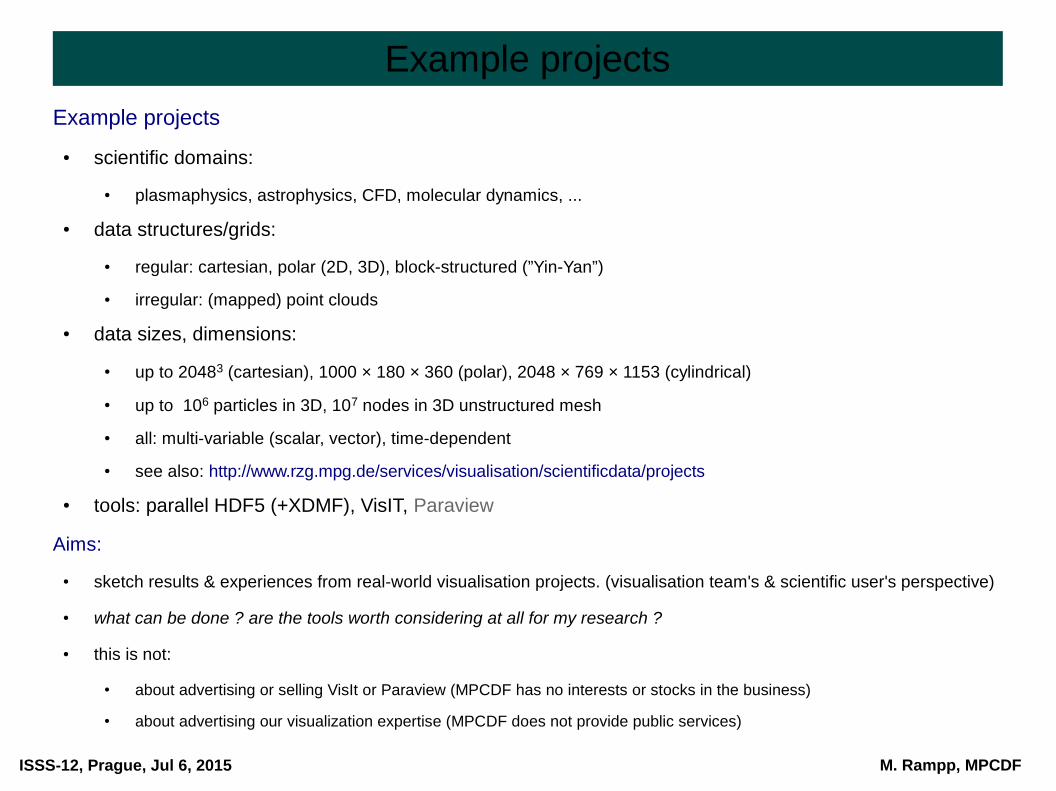
Example projects
● scientific domains:
● plasmaphysics, astrophysics, CFD, molecular dynamics, ...
● data structures/grids:
● regular: cartesian, polar (2D, 3D), block-structured (”Yin-Yan”)
● irregular: (mapped) point clouds
● data sizes, dimensions:
● up to 20483 (cartesian), 1000 × 180 × 360 (polar), 2048 × 769 × 1153 (cylindrical)
● up to 106 particles in 3D, 107 nodes in 3D unstructured mesh
● all: multi-variable (scalar, vector), time-dependent
● see also: http://www.rzg.mpg.de/services/visualisation/scientificdata/projects
● tools: parallel HDF5 (+XDMF), VisIT, Paraview
Aims:
● sketch results & experiences from real-world visualisation projects. (visualisation team's & scientific user's perspective)
● what can be done ? are the tools worth considering at all for my research ?
● this is not:
● about advertising or selling VisIt or Paraview (MPCDF has no interests or stocks in the business)
● about advertising our visualization expertise (MPCDF does not provide public services)
ISSS-12, Prague, Jul 6, 2015
M. Rampp, MPCDF
Core-collapse supernova
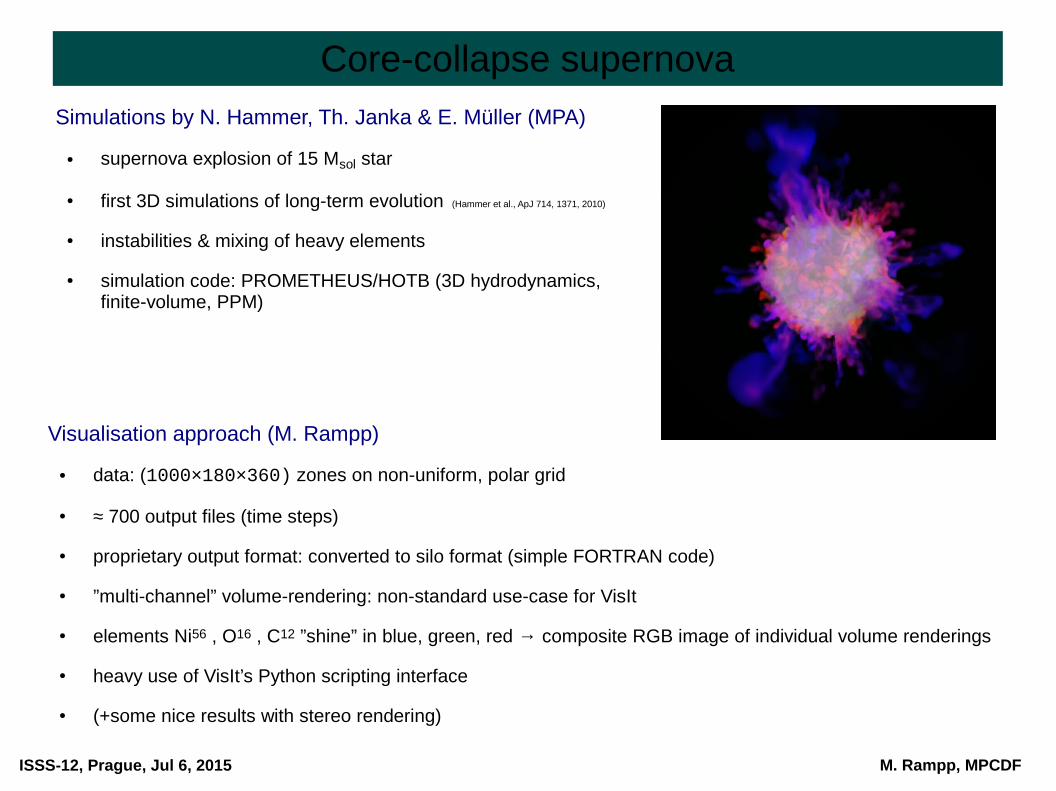
Visualisation approach (M. Rampp)
● data: (1000×180×360) zones on non-uniform, polar grid
● ≈ 700 output files (time steps)
● proprietary output format: converted to silo format (simple FORTRAN code)
● ”multi-channel” volume-rendering: non-standard use-case for VisIt
● elements Ni56 , O16 , C12 ”shine” in blue, green, red → composite RGB image of individual volume renderings
● heavy use of VisIt’s Python scripting interface
● (+some nice results with stereo rendering)
Simulations by N. Hammer, Th. Janka & E. Müller (MPA)
● supernova explosion of 15 Msol star
● first 3D simulations of long-term evolution (Hammer et al., ApJ 714, 1371, 2010)
● instabilities & mixing of heavy elements
● simulation code: PROMETHEUS/HOTB (3D hydrodynamics, finite-volume, PPM)

ISSS-12, Prague, Jul 6, 2015
M. Rampp, MPCDF
Core-collapse supernova
Visualization techniques (VisIT)
3D Volume rendering
● operators: box, transform (”spherical to cartesian”)
● plots: splatting (cheap, for quick exploration), ”compositing” (HQ ray casting)
● individual image (file) for each of the 3 scalar variables
● RGB image composition (external: ImageMagick)
Quantitative analysis
● plots: pseudocolor
● operators: box, transform (”spherical to cartesian”), isosurface, slice (2D projection)

ISSS-12, Prague, Jul 6, 2015
M. Rampp, MPCDF
Core-collapse supernova
● multiple isosurfaces (morphology)
● select slice planes
● analyze different scalar fields in selected slice planes (chem. composition mapped to RGB)
● stretches VisIt to its limits
Quantitative analysis
● plots taken directly from Hammer et al., ApJ 714, 1371, 2010

ISSS-12, Prague, Jul 6, 2015
M. Rampp, MPCDF
Core-collapse supernova
Visualisation approach (E. Erastova, M. Rampp)
● data: (1000×180×360) zones on non-uniform, polar grid
● ≈ 1000 output files (time steps)
● pseudo-color plots for data exploration and quantitative analysis
● combined volume renderings for HQ movies
● alternative technique: multiple, semi-transparent iso-surfaces
Simulations by Th. Janka et al. (MPA)
● neutrino-driven explosions of massive stars from first principles
● simulation code: VERTEX (3D, time-dependent radiation hydrodynamics with detailed microphysics)-first 3D simulations of long-term evolution
● code writes HDF5 and XDMF
● spiral mode discovered
with the help of 3D visualization
(Melson et al. arXiv:1504.07631)

ISSS-12, Prague, Jul 6, 2015
M. Rampp, MPCDF
Interactive graphics
Interactive graphics with X3DOM
● supplements publishing of simulation results, e.g., by APJ (http://iopscience.iop.org/0004-637X/793/2/127/media)
● 3D data format and object model (http://www.x3dom.org/)
● X3D(OM) file export supported by Paraview, VisIT (2.10)
● controls: mouse, zoom, +custom interaction
● HTML5, no browser plugin required .x3d file export
.x3d file reference
by E. Erastova (MPCDF)Simulations by H.-Th. Janka et al. (MPA)
ISSS-12, Prague, Jul 6, 2015
M. Rampp, MPCDF
DNS of turbulence
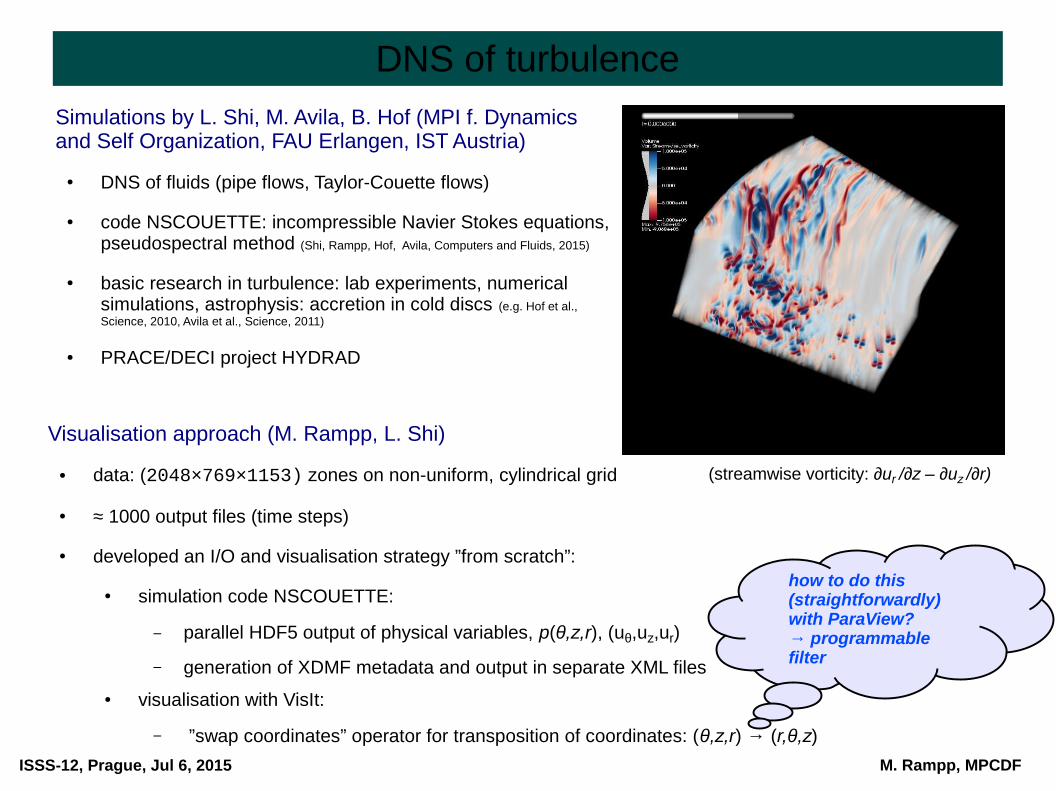
Visualisation approach (M. Rampp, L. Shi)
● data: (2048×769×1153) zones on non-uniform, cylindrical grid
● ≈ 1000 output files (time steps)
● developed an I/O and visualisation strategy ”from scratch”:
● simulation code NSCOUETTE:
– parallel HDF5 output of physical variables, p(θ,z,r), (uθ,uz,ur)
– generation of XDMF metadata and output in separate XML files
● visualisation with VisIt:
– ”swap coordinates” operator for transposition of coordinates: (θ,z,r) → (r,θ,z)
Simulations by L. Shi, M. Avila, B. Hof (MPI f. Dynamics and Self Organization, FAU Erlangen, IST Austria)
● DNS of fluids (pipe flows, Taylor-Couette flows)
● code NSCOUETTE: incompressible Navier Stokes equations, pseudospectral method (Shi, Rampp, Hof, Avila, Computers and Fluids, 2015)
● basic research in turbulence: lab experiments, numerical simulations, astrophysis: accretion in cold discs (e.g. Hof et al., Science, 2010, Avila et al., Science, 2011)
● PRACE/DECI project HYDRAD
(streamwise vorticity: ∂ur /∂z – ∂uz /∂r)
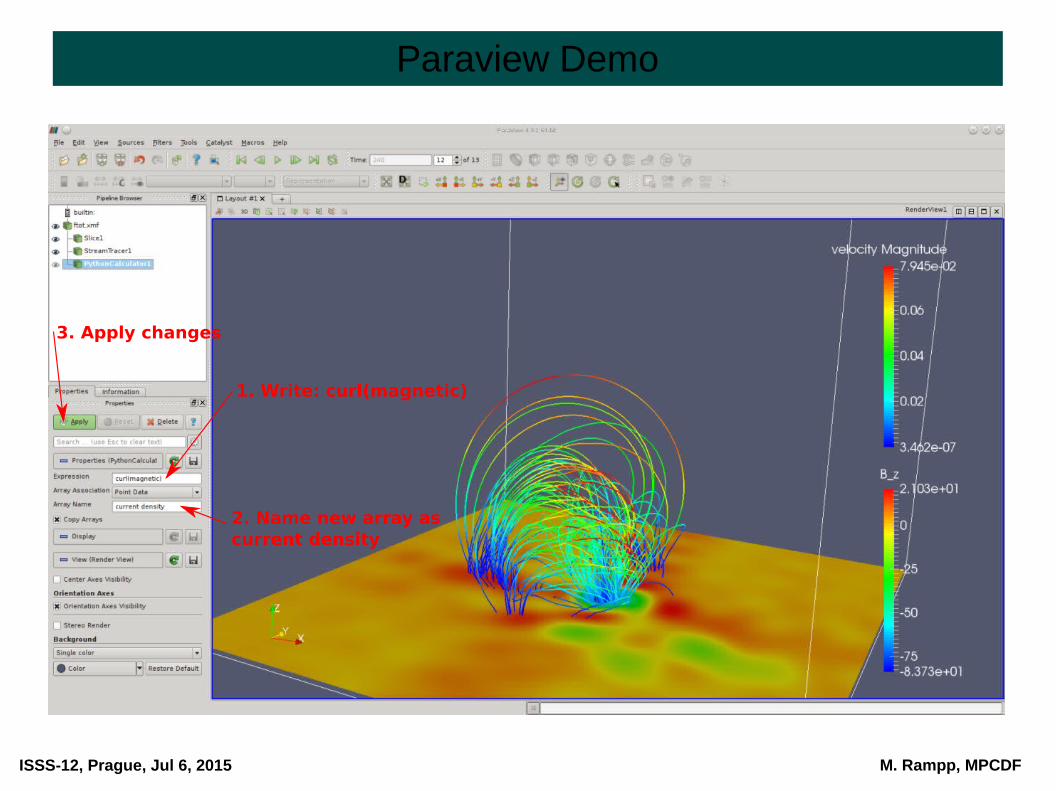
how to do this (straightforwardly) with ParaView?→ programmable filter

ISSS-12, Prague, Jul 6, 2015
M. Rampp, MPCDF
DNS of turbulence
Visualization techniques applied (VisIT)
● expressions: vorticity(ur,uθ,uz)= ∂ur /∂z – ∂uz /∂r
● operator ”swap coordinates”: (θ,z,r) → (r,θ,z)
● operator ”transform coordinates”: (r,θ,z)→(x,y,z)
● plots: pseudocolor, volume, (+vector, ...)
● Python scripting

ISSS-12, Prague, Jul 6, 2015
M. Rampp, MPCDF
SPH visualization
Simulations by S. Kochfahr et al. (MPE)
● SPH simulations produce point clouds with – strongly – varying particle density (SPH's “adaptive resolution”)
● background: SPH "particles" sample scalar fields, particles carry size information (smoothing kernel)
● very limited support by standard software, special-purpose software (Splotch, Splash) does not cover full spectrum of features: interactivity, slicing, ...
?
visualization as discrete particles(Paraview)
visualization as a smooth density field (Paraview)

ISSS-12, Prague, Jul 6, 2015
M. Rampp, MPCDF
SPH visualization
Visualisation approach (C. Simion, MPE & K. Reuter, MPCDF)
● mapping to unstructured(!) grids which can be handled by VisIt, Paraview
● approach: Delaunay triangulation
● preserves resolution, avoids interpolation
to regular grid
● but: inefficient VTK library implementation
(employed by VisIt 2.0.0)
– CPU time scales as N2
– huge memory requirements
● custom implementation with Qhull
visualization as a smooth density field (VisIT)

ISSS-12, Prague, Jul 6, 2015
M. Rampp, MPCDF
Geospatial data & bird migration
Visualisation approach (K. Reuter, MPCDF & K. Safi, MPI-Orn.)
● visualization with ParaView (support for importing geo data)
● tedious generation and adaptation of camera movement (→ Blender ?)
Data by M. Wikelski (MPI f. Ornithology)
● observational data
● a bird’s (gull) track correlated with wind data
● + topography, earth's magnetic field, …
● time-dependent data
adapted for wall-projection in the “hennhouse” (visitors and media center in Radolfzell at lake Bodensee)
movie presented by M. Wikelski at general assembly of the MPG, 2012
ISSS-12, Prague, Jul 6, 2015
M. Rampp, MPCDF
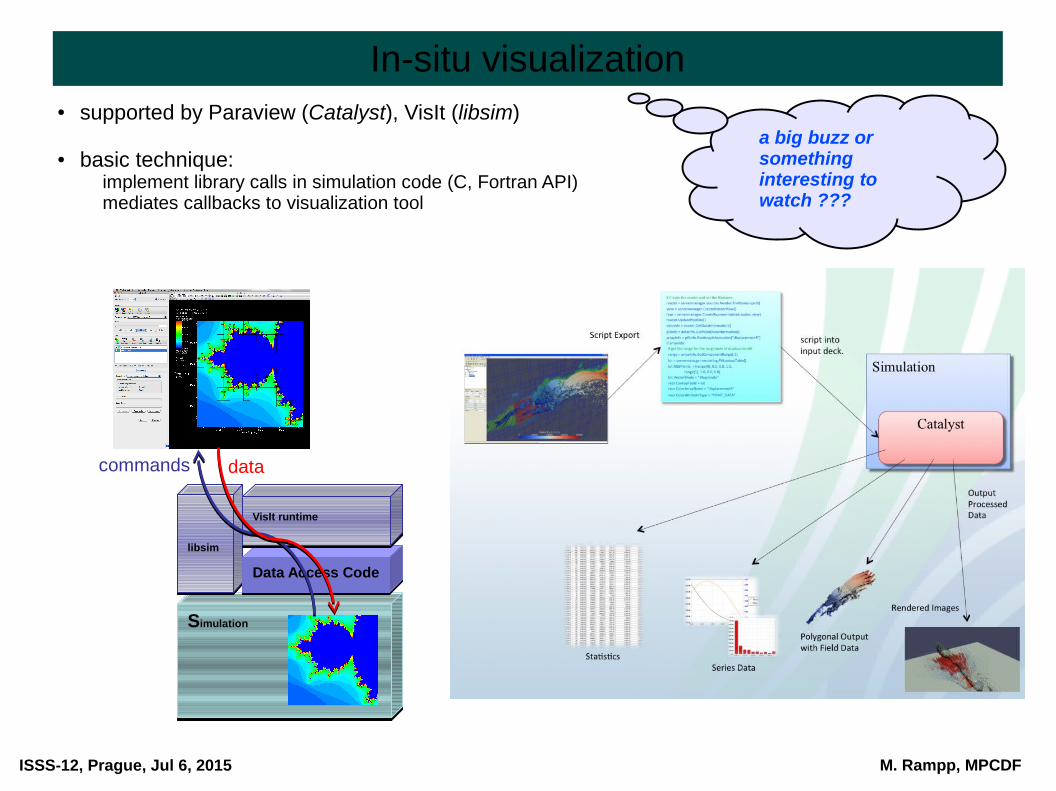
In-situ visualization● supported by Paraview (Catalyst), VisIt (libsim)
● basic technique: implement library calls in simulation code (C, Fortran API)mediates callbacks to visualization tool
SimulationSimulation
libsimlibsim
Data Access CodeData Access Code
VisIt runtimeVisIt runtime
datacommands
a big buzz or something interesting to watch ???

ISSS-12, Prague, Jul 6, 2015
M. Rampp, MPCDF
In-situ visualization
Motivation
● GPUs of a supercomputer can do graphics (sic!)
● watch the simulation running, reduce latency to first results ? … Hmmm, well, …
● enable real-time/interactive simulations (exploration)?
● avoid large-scale postprocessing runs
● reduce I/O traffic and volume
● write “data products” (e.g. iso-surfaces in vtk format) on the fly rather than full scale dumps
→ for later postprocessing
● flexible “instrumentation” of the code:
Catalyst: python script decides at runtime about the data to be dumped
(vs. implementation of data-reduction in the I/O section of the code → x-plane, y-plane, or z-plane, … ?)
→ for later postprocessing

ISSS-12, Prague, Jul 6, 2015
M. Rampp, MPCDF

ISSS-12, Prague, Jul 6, 2015
M. Rampp, MPCDF
Outline
Part I: overview (M. Rampp)
● Introduction
● Data handling strategies
● Basics on tools: VisIT (main focus) and Paraview (basics)
● HPC Visualization infrastructure & workflows
● Example projects:
→ practical hints (general)
→ impression on VisIT's and Paraview's capabilities from practical experience
Part II: hands-on (M. Rampp & J. Skala)
● some hints on HDF5 tools
● practical introduction to VisIt (and some Paraview basics)
● VisIT (and optionally Paraview) in action
→aims: get familiar with look and feel, basic commands
→limitations: workstation hardware may limit interactive experience

ISSS-12, Prague, Jul 6, 2015
M. Rampp, MPCDF
Hands-on: Schedule and Tasks
Exercises (rough schedule)
1) practical introduction to HDF5 and basic VisIt usage (20 min)
2) visualization with VisIt or Paraview (45 min)
● load data in VisIt, Paraview
● check validity → file info, mesh plot, … (grid resolution etc.)
● create a “pseudocolour” plot (entropy)
● cut out (“clip”) octant and/or isovolume (hint: use min=12, max='max')
● … experiment with other visualization methods: threeslice, slice, lineout, ...
3) basic scripting with VisIT (25 min)
● create a python script for the visualization → record
● create a script for rotating the scene → use recorded script and your favourite text editor(solution provided in solutions/ directory)

ISSS-12, Prague, Jul 6, 2015
M. Rampp, MPCDF
Hands-on: Schedule and Tasks● material (*.h5, *.xmf):
~/ISSS12/Rampp_Skala/HDF5/
~/ISSS12/Rampp_Skala/VIZ/
● expected insights and results:
● learn how to use basic hdf5 command line tools
● explore data structure of a “real-world” hdf5 file
● explore xdmf format and contents, relate to hdf5 data layout
● learn basic usage of the VisIT GUI
→ follow demo
→ optional: give it a first, quick try using data from ~/ISSS12/Rampp_Skala/VIZ/

ISSS-12, Prague, Jul 6, 2015
M. Rampp, MPCDF
HDF5 tools
~>h5dump –-contents timestep_0010.h5
HDF5 "timestep_0010.h5" {
FILE_CONTENTS {
group /
group /fields
dataset /fields/pressure
group /fields/velocity
dataset /fields/velocity/u_r
dataset /fields/velocity/u_th
dataset /fields/velocity/u_z
group /grid
dataset /grid/r
dataset /grid/th
dataset /grid/z
group /setup
}
}
~>h5diff –-relative=0.00001 \
file1.h5 file2.h5...
~>hdfview

ISSS-12, Prague, Jul 6, 2015
M. Rampp, MPCDF
HDF5 tools
~>h5dump --onlyattr timestep_0010.h5
HDF5 "timestep_0010.h5" {
GROUP "/" {
GROUP "fields" {
DATASET "pressure" {
DATATYPE H5T_IEEE_F32LE
DATASPACE SIMPLE { ( 32, 960, 1152 ) / ( 32, 960, 1152 ) }
}
GROUP "velocity" {
DATASET "u_r" {
DATATYPE H5T_IEEE_F32LE
DATASPACE SIMPLE { ( 32, 960, 1152 ) / ( 32, 960, 1152 ) }
}
}
}
[...]
GROUP "setup" {
ATTRIBUTE "code:svn-id" {
DATATYPE H5T_STRING {
STRSIZE 6;
STRPAD H5T_STR_SPACEPAD;
CSET H5T_CSET_ASCII;
CTYPE H5T_C_S1;
}
DATASPACE SCALAR
DATA {
(0): "49:51M"
}
}
}
}
}

ISSS-12, Prague, Jul 6, 2015
M. Rampp, MPCDF
XDMF: metadata for HDF5
XMDF (eXtensible Data Model and Format) in a nutshell
Purpose: meta data description for HDF5 → required to read (non-trivial) HDF5 data into VisIT, Paraview
(why? → there is, no concept of, e.g., a “grid” in a hdf5 file)
concept: ● XML file with “light” meta data● references to “heavy” data stored
in hdf5 file
● APIs for FORTRAN, C++, …, but can easily be generated a-posteriori (→ no installation required)
documentation: www.xdmf.org(poor)
grid metadata
links to data in hdf5 file

ISSS-12, Prague, Jul 6, 2015
M. Rampp, MPCDF
VisIT Basics
VisIT is … not easy to google:
● homepage: http://visit.llnl.gov/
● do not confound with VISIT - a Visualisation Toolkit (FZ Jülich)
VisIT, (according to the VisIt homepage) is ...
● a free [and open-source], interactive parallel visualization and graphical analysis tool for viewing scientific data on Unix and PC platforms [Windows, Mac OS].
● users can quickly generate visualizations from their data, animate them through time, manipulate them, and save the resulting images for presentations
● VisIt can be used to visualize scalar and vector fields defined on two- and three-dimensional (2D and 3D) structured and unstructured meshes.
● VisIt was designed to handle very large data set sizes in the terascale range and yet can also handle small data sets in the kilobyte range
● originated from Lawrence Livermore National Laboratory (ASC/DOE)
● distributed project, developed by several groups: VACET (SciDAC), ASC, GNEP

ISSS-12, Prague, Jul 6, 2015
M. Rampp, MPCDF
VisIT Basics
Why VisIT ? – experiences in the MPG
● Computing Centre’s point of view:
● 2007: survey of freely available tools: VisIt, (ParaView)
● VisIt produced good results in short time
● flexible client-server architecture: allows running GUI, and rendering, data access on different machines
● continuing positive feedback from a (experienced and critical) scientific users from different domains
● a main workhorse employed by the MPCDF visualisation team
● Scientific user’s point of view:
● steep (i.e. efficient) learning curve (knowledge transfer: visualisation team → users)
● promotes gradual transition from GUI-based, interactive work to Python scripting
● comprehensive set of standard functionalities
● data handling: many supported formats
● allows to produce publication-quality plots along the way

ISSS-12, Prague, Jul 6, 2015
M. Rampp, MPCDF
VisIT Overview
Basic concepts
● plots (ways to render data): > 20
● pseudocolor, volume-rendering, contour, vector, scatter, ...
● operators (ways to manipulate data, ”filters”): > 40
● isosurface, isovolume, clip, slice, project, (coordinate-)transforms, …
● file format readers (ways to import data): > 80
● queries (ways to extract quantitative information): > 50
● HDF5/XDMF, NetCDF, (common CFD fmts), VTK, BOV, PDB, ...
● expressions (ways to create derived quantities)
● simple expression syntax: math, logical, relational, mesh, …
● Python syntax
● other features/utilities (not fully covered here)
● movie generation: simple, keyframing
● session management: save/restore status of interactive session
● it-situ visualisation: instrumentation of simulation codes
plots
operators
ISSS-12, Prague, Jul 6, 2015
M. Rampp, MPCDF
VisIT Overview
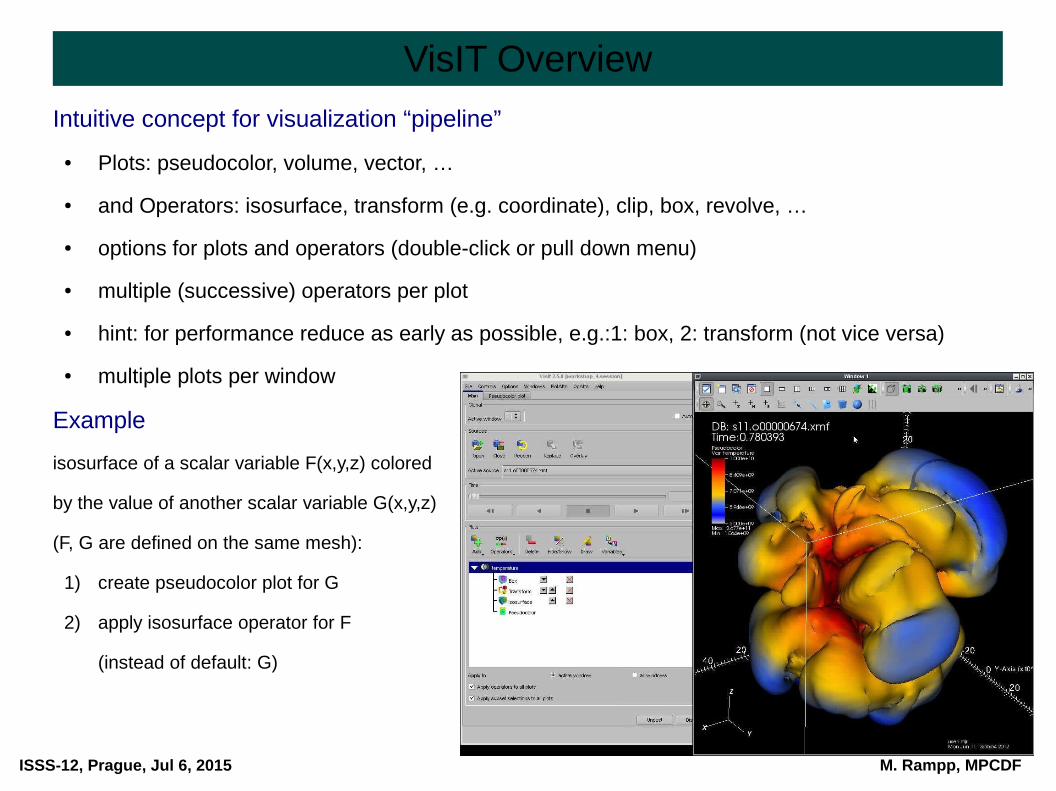
Intuitive concept for visualization “pipeline”
● Plots: pseudocolor, volume, vector, …
● and Operators: isosurface, transform (e.g. coordinate), clip, box, revolve, …
● options for plots and operators (double-click or pull down menu)
● multiple (successive) operators per plot
● hint: for performance reduce as early as possible, e.g.:1: box, 2: transform (not vice versa)
● multiple plots per window
Example
isosurface of a scalar variable F(x,y,z) colored
by the value of another scalar variable G(x,y,z)
(F, G are defined on the same mesh):
1) create pseudocolor plot for G
2) apply isosurface operator for F
(instead of default: G)

ISSS-12, Prague, Jul 6, 2015
M. Rampp, MPCDF
VisIT GUI
file controls
animation controls
plot controls
pipeline
Main menu
multiple visualization windowssingle main window

ISSS-12, Prague, Jul 6, 2015
M. Rampp, MPCDF
VisIT GUI
variable
operators
plot
mouse interaction

ISSS-12, Prague, Jul 6, 2015
M. Rampp, MPCDF
VisIT demo
The demo dataset
● example data taken from 3D supernova simulations of Hanke et al. (arXiv:1108.4355)
● data and grid
● spherical coordinates (r,Θ,Φ)
● scalar variable s(r,Θ,Φ)
● a subset (3 time steps, few variables) of the complete dataset
(400x60x120), ca. 20 variables, 1000 dumps
(→ meanwhile: 10x increase in resolution)
● Xmdf format: .xmf, .h5
● goals:
1) follow the demo
2) experiment yourself later on (Q&A w/ Jan and Markus at the workplaces)
● files:
~/ISSS12/Rampp_Skala/VIZ/visit/*.xmf

ISSS-12, Prague, Jul 6, 2015
M. Rampp, MPCDF
VisIT demo
Basic functionalities of the GUI: a brief demo covering:
● plots:
● pseudocolor
● volume: splatting, ray-casting
● operators:
● transform: coordinates
● selection: isovolume,slice,clip,box
● interaction tools
● navigate (default)
● zoom
● plane
● line
● pick (zone node )

ISSS-12, Prague, Jul 6, 2015
M. Rampp, MPCDF
Advanced VisIT: Colour tables
Notes of colour tables
● VisIt 2.5 added many new colour tables
● preview icons for choosing colour table in plot options
● VisIt allows to create/manipulate colour tables:● interactively: by manipulating existing colour tables● programmatically: via Python interface● externally: via editing colour table files
● additional colour tables can be stored in userspace and shared with others

ISSS-12, Prague, Jul 6, 2015
M. Rampp, MPCDF
Advanced VisIT: Colour tables
→ colour tables in XML format defined by control points Є [0,1] and (RGB,alpha) Є[2563,256]
→ simple XML format facilitates conversion or creation (e.g. Python script for converting Amira/Avizo tables)

ISSS-12, Prague, Jul 6, 2015
M. Rampp, MPCDF
Advanced VisIT: GUI utilities
Advanced features:
● expressions: expression language
● animation: simple movie generation
● sessions: save/restore session state
● movies: keyframing
● quantitative analysis:● spreadsheet● zone pick● queries● correlations of multivariate data

ISSS-12, Prague, Jul 6, 2015
M. Rampp, MPCDF
Advanced VisIT: expressions

ISSS-12, Prague, Jul 6, 2015
M. Rampp, MPCDF
Advanced VisIT: expressions
● allows simulation codes to dump only non-redundant quantities● basic expression syntax: math, logical, relational, mesh, ...● new: Python expression editor

ISSS-12, Prague, Jul 6, 2015
M. Rampp, MPCDF
Paraview Basics
Paraview:
● homepage: www.paraview.org
● tutorial: http://www.paraview.org/Wiki/The_ParaView_Tutorial
Paraview, (according to the Paraview homepage) is ...
● an open-source, multi-platform data analysis and visualization application. ParaView users can quickly build visualizations to analyze their data using qualitative and quantitative techniques. The data exploration can be done interactively in 3D or programmatically using ParaView’s batch processing capabilities.
● ParaView was developed to analyze extremely large datasets using distributed memory computing resources. It can be run on supercomputers to analyze datasets of petascale size as well as on laptops for smaller data, has become an integral tool in many national laboratories, universities and industry, and has won several awards related to high performance computation.
● developed by Kitware Inc. and academic/US government agency partners (LANL, Sandia)
Paraview, (according to my personal bias) is …
● certainly a great tool !
● slightly less tailored towards typical (astrophysics) visualization tasks than VisIt
● slightly less intuitive than VisIt (due to my practical experience with VisIt and maybe my ignorance)
=> I feel less competent in Paraview
~1h left => let's focus on VisIt, basic exercises can be optionally done with Paraview (→ J. Skala)
ISSS-12, Prague, Jul 6, 2015
M. Rampp, MPCDF
Paraview Overview
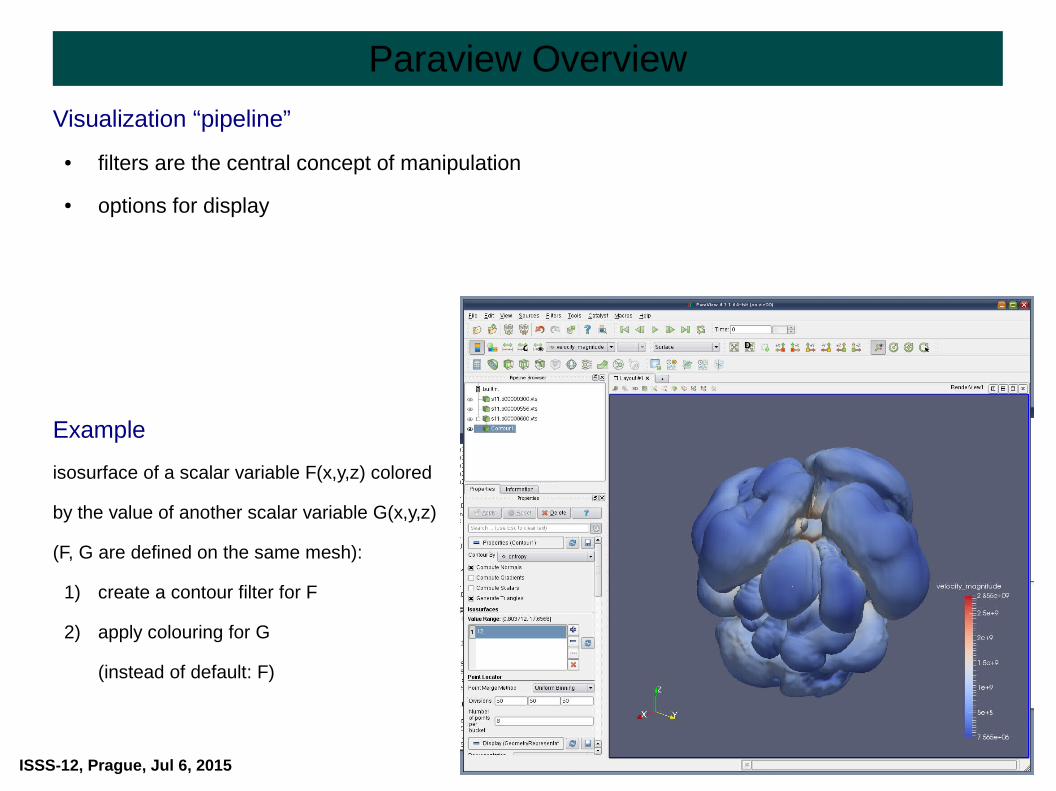
Visualization “pipeline”
● filters are the central concept of manipulation
● options for display
Example
isosurface of a scalar variable F(x,y,z) colored
by the value of another scalar variable G(x,y,z)
(F, G are defined on the same mesh):
1) create a contour filter for F
2) apply colouring for G
(instead of default: F)

ISSS-12, Prague, Jul 6, 2015
M. Rampp, MPCDF
Paraview GUI
main menufile and animation controls
pipeline
common filters
options
common options

ISSS-12, Prague, Jul 6, 2015
M. Rampp, MPCDF
Paraview demo
The demo dataset
● example data taken from 3D supernova simulations of Hanke et al. (arXiv:1108.4355)
● data and grid:
● spherical coordinates (r,Θ,Φ)
● scalar variable s(r,Θ,Φ)
● a subset (3 time steps, few variables) of the complete dataset
(400x60x120), ca. 20 variables, 1000 dumps
(→ meanwhile: 10x increase in resolution)
● Xmdf format: .xmf, .h5
● goals:
1) follow the demo
2) experiment yourself later on (Q&A w/ Jan and Markus at the workplaces)
● files:~/ISSS12/Rampp_Skala/VIZ/visit/*.xmf~/ISSS12/Rampp_Skala/VIZ/paraview/SphericalToCartesianTransform.cpd(special thanks to E. Erastova for developing this “programmable filter” - prototype, a generic solution will be contributed)

ISSS-12, Prague, Jul 6, 2015
M. Rampp, MPCDF
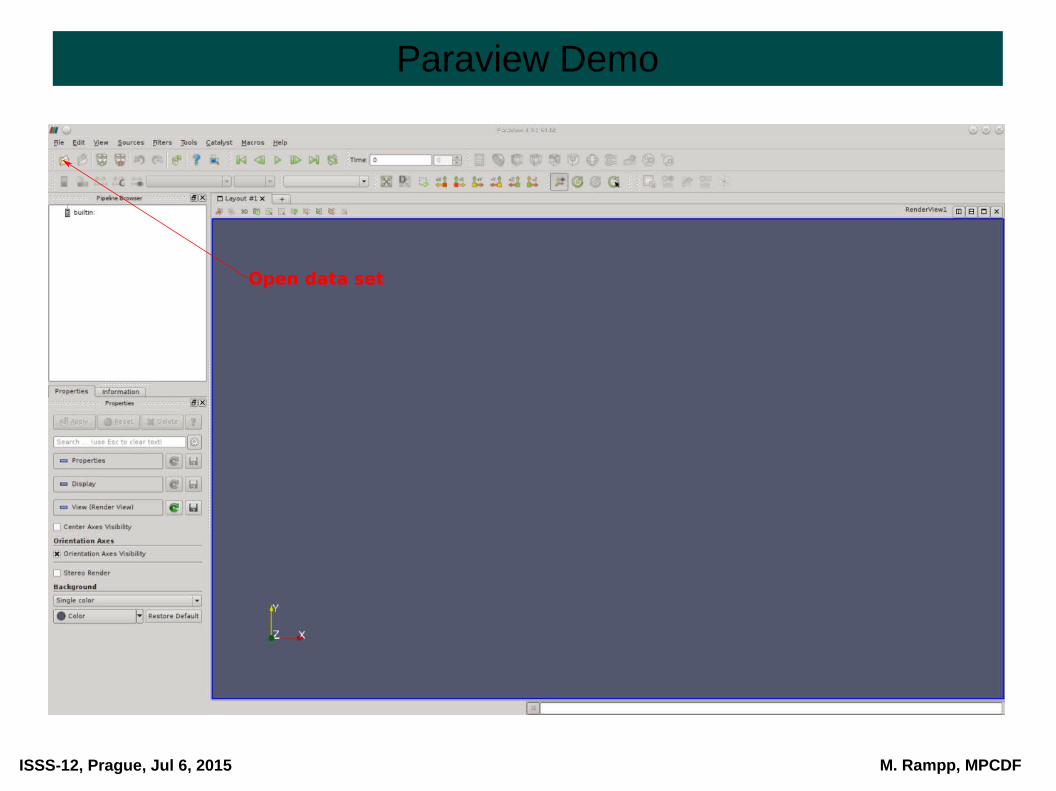
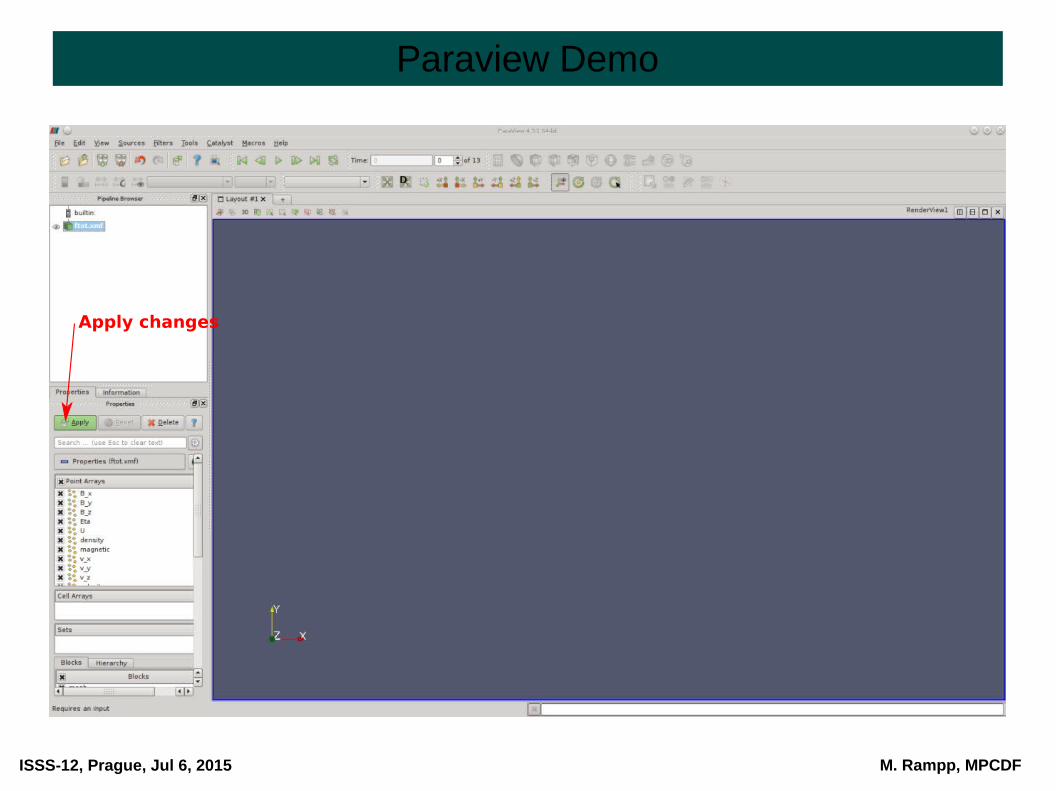
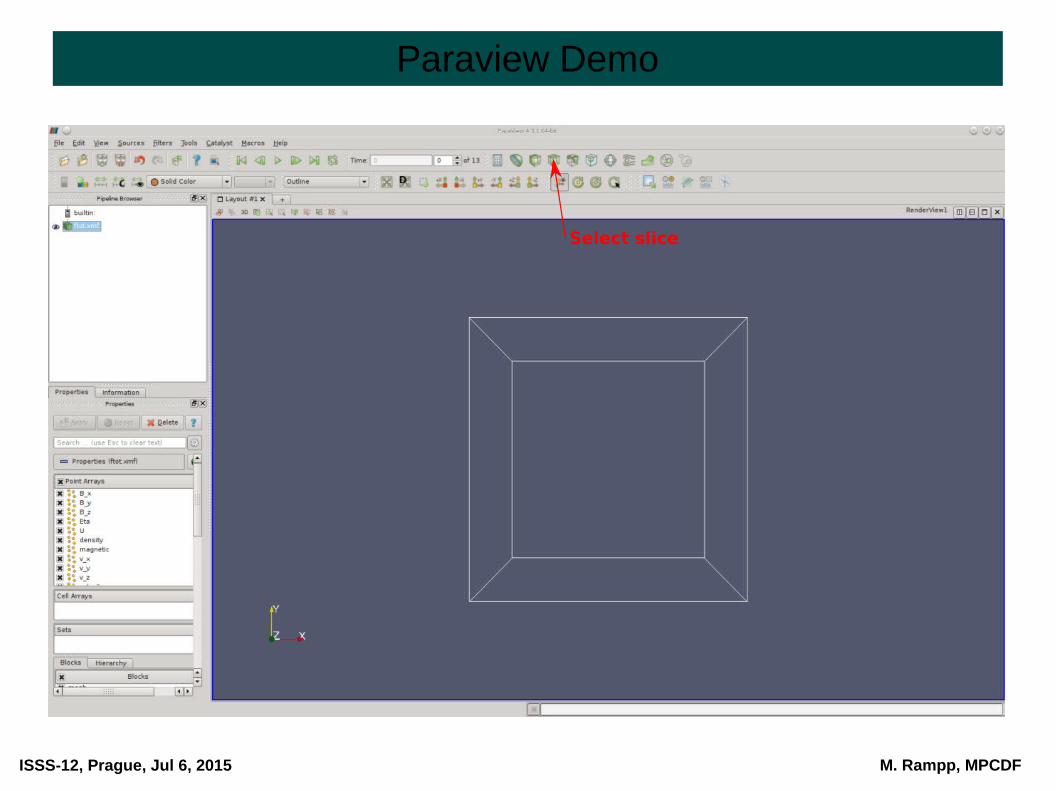
Paraview Demo
The demo dataset
● example data taken from J. Skala et al.
● data and grid
● cartesian (x,y,z)
● scalar variables f(x,y,z)
● a subset (10 time steps) of the complete dataset
(66x66x66), ca. 10 variables, 1000 dumps
● Xmdf format: .xmf, .h5
● goals:
1) follow the demo
2) experiment yourself later on (Q&A w/ Jan and Markus at the workplaces)
● files:
~/ISSS12/Rampp_Skala/HDF5/3DEvol/*.xmf
ISSS-12, Prague, Jul 6, 2015
M. Rampp, MPCDF
Paraview Demo

ISSS-12, Prague, Jul 6, 2015
M. Rampp, MPCDF
Paraview Demo
ISSS-12, Prague, Jul 6, 2015
M. Rampp, MPCDF
Paraview Demo
ISSS-12, Prague, Jul 6, 2015
M. Rampp, MPCDF
Paraview Demo

ISSS-12, Prague, Jul 6, 2015
M. Rampp, MPCDF
Paraview Demo

ISSS-12, Prague, Jul 6, 2015
M. Rampp, MPCDF
Paraview Demo

ISSS-12, Prague, Jul 6, 2015
M. Rampp, MPCDF
Paraview Demo
ISSS-12, Prague, Jul 6, 2015
M. Rampp, MPCDF
Paraview Demo

ISSS-12, Prague, Jul 6, 2015
M. Rampp, MPCDF
Paraview Demo

ISSS-12, Prague, Jul 6, 2015
M. Rampp, MPCDF
Paraview Demo

ISSS-12, Prague, Jul 6, 2015
M. Rampp, MPCDF
Hands-on: Schedule and Tasks
Exercises (rough schedule)
1) practical introduction to HDF5 and basic VisIt usage (20 min)
2) visualization with VisIt or Paraview (45 min)
● load data in VisIt, Paraview
● check validity → file info, mesh plot, … (grid resolution etc.)
● create a “pseudocolour” plot
● cut out (“clip”) octant and/or isovolume for entropy variable (hint: use min=12, max='max')
● … experiment with other visualization methods: threeslice, slice, lineout, ...
3) basic scripting with VisIT (25 min)
● create a python script for the visualization → record
● create a script for rotating the scene → use recorded script and your favourite text editor(solution provided in solutions/ directory)

ISSS-12, Prague, Jul 6, 2015
M. Rampp, MPCDF
Hands-on: visualization with VisIt● material (*.xmf, *.vts):
~/ISSS12/Rampp_Skala/VIZ/
● expected insights and results:
● learn basic usage of the VisIT GUI
→ use basic knowledge and hints from the demo
→ give it a try using data from:
~/ISSS12/Rampp_Skala/VIZ/visit/*.xmf
→ try other visualization methods: e.g. three-slice, ...
→ optional: try Paraview on the same data set using data from:
~/ISSS12/Rampp_Skala/VIZ/visit/*.xmf
(requires programmable filter: ~/ISSS12/Rampp_Skala/VIZ/paraview/SphericalToCartesianTransform.cpd
or use pre-transformed data in vtk format:
~/ISSS12/Rampp_Skala/VIZ/paraview/*.vts

ISSS-12, Prague, Jul 6, 2015
M. Rampp, MPCDF
Hands-on: visualization with Paraview● material (*.xmf, *.vts):
~/ISSS12/Rampp_Skala/VIZ/
● expected insights and results:
● learn basic usage of the Paraview GUI
→ use basic knowledge and hints from the demo
→ give it a try using data from:
~/ISSS12/Rampp_Skala/VIZ/visit/*.xmf
→ try other visualization methods

ISSS-12, Prague, Jul 6, 2015
M. Rampp, MPCDF
Advanced VisIT: Python scripting
startup:
query/modify visit objects with accessor methods :GetXXX(), SetXXX()
list available functions:

ISSS-12, Prague, Jul 6, 2015
M. Rampp, MPCDF
Advanced VisIT: Python scripting
prototypical example: “flyaround”
Python fragment for rotating an object
see also examples at http://visitusers.org/index.php?title=Category:Scripting→ Visit-tutorial-python-fly→ fly through

ISSS-12, Prague, Jul 6, 2015
M. Rampp, MPCDF
Advanced VisIT: Python scripting
getting started with Python scripting
1) use the dialog Controls → Command to automatically create Python code2) paste code into your favourite editor and save as a python script3) polish and extend Python code4) consult the “VisIT Python Interface Manual”

ISSS-12, Prague, Jul 6, 2015
M. Rampp, MPCDF
Hands-on: Schedule and Tasks
Exercises (rough schedule)
1) practical introduction to HDF5 and basic VisIt usage (20 min)
2) visualization with VisIt or Paraview (45 min)
● load data in VisIt, Paraview
● check validity → file info, mesh plot, … (grid resolution etc.)
● create a “pseudocolour” plot (entropy)
● cut out (“clip”) octant and/or isovolume (hint: use min=12, max='max')
● … experiment with other visualization methods: threeslice, slice, lineout, ...
3) basic scripting with VisIT (25 min)
● create a python script for the visualization → record
● create a script for rotating the scene → use recorded script and your favourite text editor(solution provided in solutions/ directory)

ISSS-12, Prague, Jul 6, 2015
M. Rampp, MPCDF
Hands-on: python scripting with VisIt● material (*.xmf, *.py):
~/ISSS12/Rampp_Skala/VIZ/visit
~/ISSS12/Rampp_Skala/VIZ/solutions
● expected insights and results:
● learn Python scripting with VisIT
→ try scripts, explore content, modify, ...
→ explore structure of VisIt python classes
→ produce a “movie” (sequence of jpeg files)
Related Documents