Visualization of Bitcoin Transactions for Forensic and Security Analysis DIPLOMARBEIT zur Erlangung des akademischen Grades Diplom-Ingenieurin im Rahmen des Studiums Visual Computing eingereicht von Alexandra Mai, BSc Matrikelnummer 01125691 an der Fakultät für Informatik der Technischen Universität Wien Betreuung: Priv.Doz. Dr. Edgar Weippl Wien, 30. September 2017 Alexandra Mai Edgar Weippl Technische Universität Wien A-1040 Wien Karlsplatz 13 Tel. +43-1-58801-0 www.tuwien.ac.at

Welcome message from author
This document is posted to help you gain knowledge. Please leave a comment to let me know what you think about it! Share it to your friends and learn new things together.
Transcript
Visualization of BitcoinTransactions for Forensic and
Security Analysis
DIPLOMARBEIT
zur Erlangung des akademischen Grades
Diplom-Ingenieurin
im Rahmen des Studiums
Visual Computing
eingereicht von
Alexandra Mai, BScMatrikelnummer 01125691
an der Fakultät für Informatik
der Technischen Universität Wien
Betreuung: Priv.Doz. Dr. Edgar Weippl
Wien, 30. September 2017Alexandra Mai Edgar Weippl
Technische Universität WienA-1040 Wien Karlsplatz 13 Tel. +43-1-58801-0 www.tuwien.ac.at

Visualization of BitcoinTransactions for Forensic and
Security Analysis
DIPLOMA THESIS
submitted in partial fulfillment of the requirements for the degree of
Diplom-Ingenieurin
in
Visual Computing
by
Alexandra Mai, BScRegistration Number 01125691
to the Faculty of Informatics
at the TU Wien
Advisor: Priv.Doz. Dr. Edgar Weippl
Vienna, 30th September, 2017Alexandra Mai Edgar Weippl
Technische Universität WienA-1040 Wien Karlsplatz 13 Tel. +43-1-58801-0 www.tuwien.ac.at

Erklärung zur Verfassung derArbeit
Alexandra Mai, BScLehmanngasse 25/4/13
Hiermit erkläre ich, dass ich diese Arbeit selbständig verfasst habe, dass ich die verwen-deten Quellen und Hilfsmittel vollständig angegeben habe und dass ich die Stellen derArbeit – einschließlich Tabellen, Karten und Abbildungen –, die anderen Werken oderdem Internet im Wortlaut oder dem Sinn nach entnommen sind, auf jeden Fall unterAngabe der Quelle als Entlehnung kenntlich gemacht habe.
Wien, 30. September 2017Alexandra Mai
v

Acknowledgements
I want to express my thankfulness to Dr. Katharina Krombholz. She continuouslyprovided input and comments to make this thesis possible. My gratitude also goes to myadvisor Privatdoz. Dipl.-Ing. Mag. Dr. Edgar Weippl.
Furthermore, I want to thank my colleague Matthias for the collaboration on the prototype.I also want to thank my boyfriend Thomas for moral support.
My sincere thanks go to SBA Research, my employer. They gave me the opportunity towork on this topic during my internship, allowing me to continue with it as an employeeand supported my work.
Last but not least I want to thank my parents Verena and Günther and my sister Astritfor supporting me throughout my studies.
vii

Kurzfassung
„Zeit für PlanB“ – Aufgrund der steigenden Unzufriedenheit mit zentralgesteuerten Wäh-rungen und der enormen Wertsteigerung ihres Kurses gewinnt die Kryptowährung Bitcoinimmer mehr an Bedeutung. Bitcoin basiert auf einem Peer-to-Peer System welches diedurchgeführten Transaktionen in einer dezentralen Datenbank, der sogenannten enquo-teBlockchain, für jeden online zugänglich speichert. Das Ziel dieser Arbeit ist es, einenneuartigen Weg zu finden, die Transaktionen des Bitcoinsystems visuell und interaktivdarzustellen. Mit Hilfe der Visualisierung wird es Analytikern und Forensikern ermöglicht,einen Einblick in aktuelle und vergangene Transaktionen zu bekommen. Hierbei liegt einbesonderes Augenmerk auf der Zeitkomponente, um zeitliche Zusammenhänge schnellererfassen zu können.
Der in dieser Arbeit vorgestellte Prototyp (PlanB) kombiniert Visualisierungs undClusteringtechniken sowie statistische Wahrscheinlichkeiten, um dem Benutzer ein breitesSpektrum an Informationen bieten zu können. PlanB ist eine webbasierte Applikation,um sicherheitsbezogene Fragen durch visuelles Feedback genauer beantworten zu können(z.B.: Pseudoanonymität, Diebstahl etc). Um eine reibungslose Interaktion mit denDaten zu ermöglichen wird eine GPGPU Methode eingesetzt welche die Informationenkontinuierlich lädt, diese wurde von Matthias Gusenbauer implementiert. Des Weiterenwird in dieser Arbeit auch eine Evaluierung der Applikation vorgenommen und auf dieStärken und Schwächen dieser eingegangen. Abschliesend werden die weiteren Pläne fürdie Nutzung und Weiterentwicklung des Prototypen erläutert.
ix

Abstract
“Time for PlanB” – the increasing dissatisfaction with centralized currencies and theenormous increase in value caused the cryptocurrency Bitcoin to gain in importance overthe last few years. Bitcoin is a peer-to-peer system with a publicly available decentralizeddatabase, the so-called “Blockchain”, where all transactions are stored. The main goal ofthis thesis is to explore a new way to visualize this transaction information in an interactiveform. Our visualization gives a better understanding of the (pseudo-)anonymity andsecurity of Bitcoin and enables analysts to get insight into past and current transactions.A special emphasis is placed on the time component to better understand chronologicalcorrelations. This helps forensic and security analysts to understand cash flows.
The prototype presented in this thesis (PlanB) combines visualization techniques, clus-tering algorithms and statistical probabilities to provide exact information. PlanB is aweb-based application to extract security-related visual feedback of the Blockchain. Toensure a smooth interaction with the data, a GPGPU method implemented by MatthiasGusenbauer is used to load the information constantly in the background. Further, thisthesis evaluates the prototype, highlights strengths and weaknesses and describes futurework.
xi

Contents
Kurzfassung ix
Abstract xi
Contents xiii
1 Introduction 11.1 Problem Statement . . . . . . . . . . . . . . . . . . . . . . . . . . . . . . 11.2 Aim of this Work . . . . . . . . . . . . . . . . . . . . . . . . . . . . . . 21.3 Structure of this Work . . . . . . . . . . . . . . . . . . . . . . . . . . . 3
2 Bitcoin and Blockchain 52.1 History . . . . . . . . . . . . . . . . . . . . . . . . . . . . . . . . . . . 52.2 Blockchain . . . . . . . . . . . . . . . . . . . . . . . . . . . . . . . . . . 82.3 Proof of Work . . . . . . . . . . . . . . . . . . . . . . . . . . . . . . . . 102.4 Consensus Rules . . . . . . . . . . . . . . . . . . . . . . . . . . . . . . 102.5 Transactions . . . . . . . . . . . . . . . . . . . . . . . . . . . . . . . . 122.6 Mining . . . . . . . . . . . . . . . . . . . . . . . . . . . . . . . . . . . . 142.7 Wallets . . . . . . . . . . . . . . . . . . . . . . . . . . . . . . . . . . . 152.8 Mixing Services . . . . . . . . . . . . . . . . . . . . . . . . . . . . . . . 16
3 Related Work 193.1 Cryptocurrencies . . . . . . . . . . . . . . . . . . . . . . . . . . . . . . 193.2 Security . . . . . . . . . . . . . . . . . . . . . . . . . . . . . . . . . . . 203.3 Visualization . . . . . . . . . . . . . . . . . . . . . . . . . . . . . . . . . 21
4 Methodology 294.1 Visualization . . . . . . . . . . . . . . . . . . . . . . . . . . . . . . . . 304.2 Application Walkthroughs . . . . . . . . . . . . . . . . . . . . . . . . . . 314.3 Design . . . . . . . . . . . . . . . . . . . . . . . . . . . . . . . . . . . . 384.4 Prototyping . . . . . . . . . . . . . . . . . . . . . . . . . . . . . . . . . 38
5 Implementation Details and Technologies 415.1 Platform and Architecture . . . . . . . . . . . . . . . . . . . . . . . . . . 41
xiii
5.2 Data Format and Structure . . . . . . . . . . . . . . . . . . . . . . . . 425.3 Communication . . . . . . . . . . . . . . . . . . . . . . . . . . . . . . . 455.4 Web Integration . . . . . . . . . . . . . . . . . . . . . . . . . . . . . . 465.5 D3.js . . . . . . . . . . . . . . . . . . . . . . . . . . . . . . . . . . . . . 465.6 Graphical Output . . . . . . . . . . . . . . . . . . . . . . . . . . . . . . 47
6 Results 536.1 Testing . . . . . . . . . . . . . . . . . . . . . . . . . . . . . . . . . . . 536.2 Prototype Walkthrough . . . . . . . . . . . . . . . . . . . . . . . . . . 55
7 Discussion and Conclusion 617.1 Critical Reflection . . . . . . . . . . . . . . . . . . . . . . . . . . . . . . 617.2 Limitations . . . . . . . . . . . . . . . . . . . . . . . . . . . . . . . . . 627.3 Future Work . . . . . . . . . . . . . . . . . . . . . . . . . . . . . . . . 627.4 Conclusion . . . . . . . . . . . . . . . . . . . . . . . . . . . . . . . . . 63
Acronyms 65
Bibliography 67
CHAPTER 1Introduction
The Blockchain of Bitcoin currently contains over 150 GB (February 2018 [15]) oftransaction data and is publicly accessible to everyone. It is getting larger every minute,as payments with bitcoins have become more and more popular. The popularity ofBitcoin can be also seen in the tremendously increase of market value during 2017, whichis directly related to the demand. The value increased by over 800% to a value of 8,241USD for 1 BTC on the 8th of Februar 2018. According to Khairuddin et al. [55] theincreasing usage of bitcoins can be ascribed to three main causes:
First, Bitcoin is assumed to have a huge societal and future financial impact as it is seenas the money revolution of this century. The second motivation is the empowerment ofusers and the circumvention of traditional banks, which is an important factor for peopleusing bitcoins. This empowerment is achieved by the network structure of Bitcoin whichis decentralized, open source and (pseudo-)anonymous. The last factor mentioned byKhairuddin et al. is the perceived real value, which participants claim to be like that ofgold.
1.1 Problem StatementAlthough many users think that Bitcoin is per se anonymous [57], all transactions arepublicly stored in the Blockchain, and with different methods it is possible to connect(at least some) Bitcoin addresses with real persons/companies as proven by variousresearchers in recent years (for example Hirshman et al. [52], Reid et al. [66] andAndroulaki et al. [34]). However, it is still hard for investigators to track anonymizedcash flows due to mixing services, multiple wallets and other anonymization mechanismsused for Bitcoin transactions.
One important goal for the forensic and security analysis is to reveal correlations betweentransactions and filter (suspicious) activities through a time-based overview. As there
1
1. Introduction
is a huge variety of information hidden in the Blockchain, it is an important goal toprovide security experts with insights into transactions over time with respect to specificaddresses and to furthermore provide details of these transactions (amount of bitcoinstransferred, hash values, etc.) and their further connections to other wallets/addresses.
A useful analysis tool for security and forensic experts, therefore, has to fulfill two majoraspects: On the one hand, the interactivity is important, and on the other hand, theavailability of the complete data of the Blockchain, which enables the user to see therelations between the transactions without any short-cuts. Currently there are differenttools available which deal with either of the two aspects (see for example chapter 3).
1.2 Aim of this Work
Our main motivation is to propose a novel way to analyse transaction data of theBitcoin ecosystem and implement an application prototype (PlanB), which combinesthe interactivity and the availability of the data and gives the user the possibility toget a visual insight into the complex world of bitcoins. Our tool will enable forensicand security analysts to track masked cash flows and search for specific patterns andaddresses to see their positions in the overall network. Furthermore it is possible tosearch for specific connections between two different Bitcoin adresses to see if there areany connections.
Bitcoin is pseudonymous, as the transactions are secured with public key cryptography.As mentioned above, Bitcoin addresses are hard to link to a specific user by name asmany Bitcoin users employ more than one Bitcoin address or other masking techniques.Caused by the (pseudo-)anonymous nature of Bitcoin, it is prone to be used for criminalor fraudulent purposes [13]. We want to focus on the visualization of different Bitcoinaddresses (to filter over time) as well as their correspondence to specific transactions.Especially reoccurring payments and extremely high and very low amounts are of specialinterest, if they both arrive at one specific address in the end.
The display of relations between different addresses and transactions gives the analystsinsight in transaction habits as for example recurring payments. Furthermore, the user isprovided with additional information as the direction of the cash flow and the involvedparties in case mixing services or other anonymization tools were used. Thanks tothe visualized information, it should be easier to keep track of certain suspicious users,transaction behaviours and the probability that anonymity tools were used (e.g. mixingservices, multiple wallets).
Our prototype is a web-based application providing multiple views for the user to getan optimal insight into the world of Bitcoin transactions. On the one hand, the user isenabled to search for specific addresses and their relations within the network, and onthe other hand, he/she is provided with a time-based search function. To ensure theusability, an expert for usable security and an expert for information visualization were
2
1.3. Structure of this Work
involved to provide feedback regarding the prototype. The source code of the prototypeis open source to give analysts the chance to use it or to expand it further.
1.3 Structure of this WorkIn chapter 2 an overview of Bitcoin and its network, the Blockchain, is provided. In thischapter the basic systematics of this cryptocurrency and the most important transactiontypes are discussed.
Chapter 3 describes related cryptocurrencies and alternatives to Bitcoin. Furthermore,visualization tools which have the same or similar goals are discussed and compared.
The abstract as well as used technology is described in chapter 4, highlighting the mainmethods which are used in developing the prototype PlanB.
In chapter 5 the implementation of the web-based prototype is presented. It explains theusage of existing viusalization techniques and how they are integrated in the framework.
The final chapter 6 highlights the advantages and flaws of the prototype and compares itto existing visualization frameworks. Furthermore, the chapter provides an outlook tofuture work and some concluding thoughts.
3

CHAPTER 2Bitcoin and Blockchain
New payment systems gained a lot of attention in recent years and many differentinnovative systems for exchanging money have been released [45]. Those paymentsystems are mostly built upon digital platforms enabling users to access their moneyflexible in time and from all over the world in a very fast way. There are many factorsaffecting the success of a digital payment system, as Van der Heijden [73] stated.
Two important factors influencing a wide consumer acceptance for cryptocurrencies aresecurity and trustworthiness. As many systems relate on one single trust unit a trendtowards decentralized systems can be observed, explaining the major interest in Bitcoinand similar virtual currencies. Cryptocurrencies in general are a monetary unit usingencryption to control, verify and transfer financial means. They have no intrinsic valueas the (market) value depends on the users demand. Furthermore they have no physicalform as their existence is only in the digital network. The last major characteristic is thedecentralization as no central bank system controls the transactions, but the networkattendees do.
Bitcoin was the worldwide first known and used decentralized cryptocurrency on themarket [32]. The background as well as well as the most important technologies of Bitcoinand its subjacent network, the Blockchain, are described in the following sections. Theyprovide the reader with basic knowledge for the further chapters, especially the detailedexplanation of the prototype.
2.1 History
The name and the cryptocurrency payment system of “Bitcoin” was first mentioned in thepaper “Bitcoin: A peer-to-peer electronic cash system”, published under the pseudonymSatoshi Nakamoto in 2008 [63]. It is a peer-to-peer system, which makes Bitcoin thefirst decentralized digital currency. The basis of this cryptocurrency is the Blockchain, a
5
2. Bitcoin and Blockchain
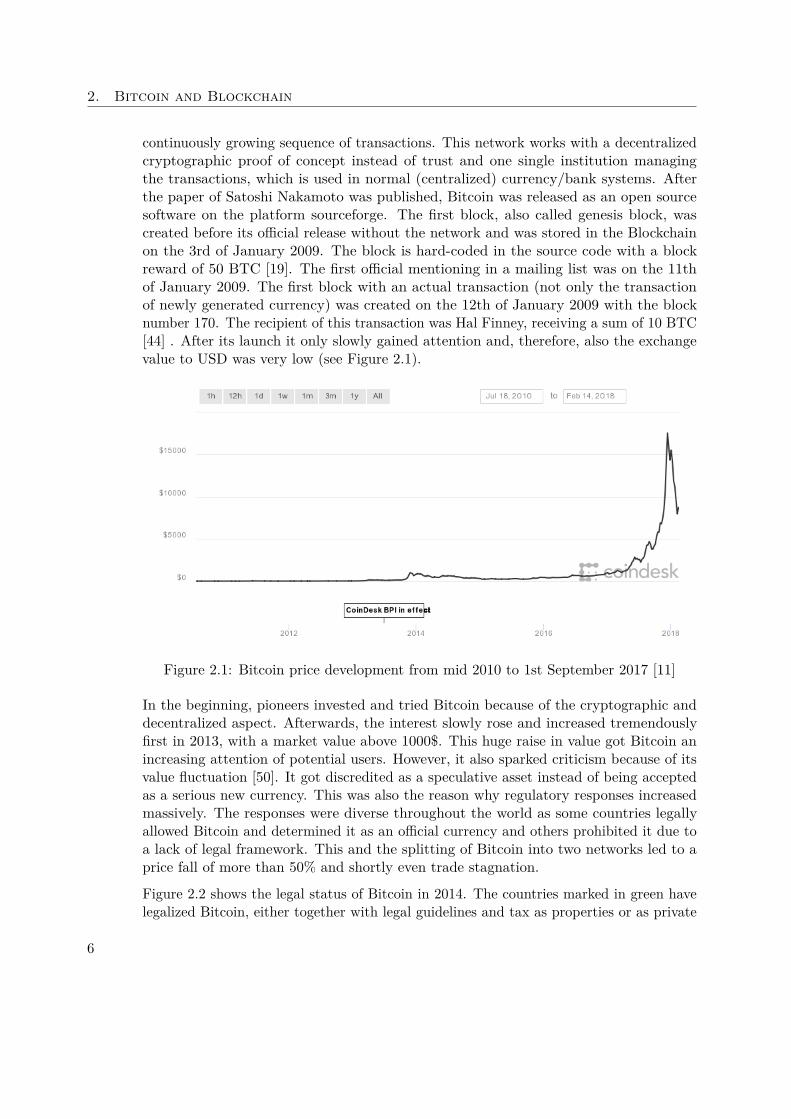
continuously growing sequence of transactions. This network works with a decentralizedcryptographic proof of concept instead of trust and one single institution managingthe transactions, which is used in normal (centralized) currency/bank systems. Afterthe paper of Satoshi Nakamoto was published, Bitcoin was released as an open sourcesoftware on the platform sourceforge. The first block, also called genesis block, wascreated before its official release without the network and was stored in the Blockchainon the 3rd of January 2009. The block is hard-coded in the source code with a blockreward of 50 BTC [19]. The first official mentioning in a mailing list was on the 11thof January 2009. The first block with an actual transaction (not only the transactionof newly generated currency) was created on the 12th of January 2009 with the blocknumber 170. The recipient of this transaction was Hal Finney, receiving a sum of 10 BTC[44] . After its launch it only slowly gained attention and, therefore, also the exchangevalue to USD was very low (see Figure 2.1).
Figure 2.1: Bitcoin price development from mid 2010 to 1st September 2017 [11]
In the beginning, pioneers invested and tried Bitcoin because of the cryptographic anddecentralized aspect. Afterwards, the interest slowly rose and increased tremendouslyfirst in 2013, with a market value above 1000$. This huge raise in value got Bitcoin anincreasing attention of potential users. However, it also sparked criticism because of itsvalue fluctuation [50]. It got discredited as a speculative asset instead of being acceptedas a serious new currency. This was also the reason why regulatory responses increasedmassively. The responses were diverse throughout the world as some countries legallyallowed Bitcoin and determined it as an official currency and others prohibited it due toa lack of legal framework. This and the splitting of Bitcoin into two networks led to aprice fall of more than 50% and shortly even trade stagnation.
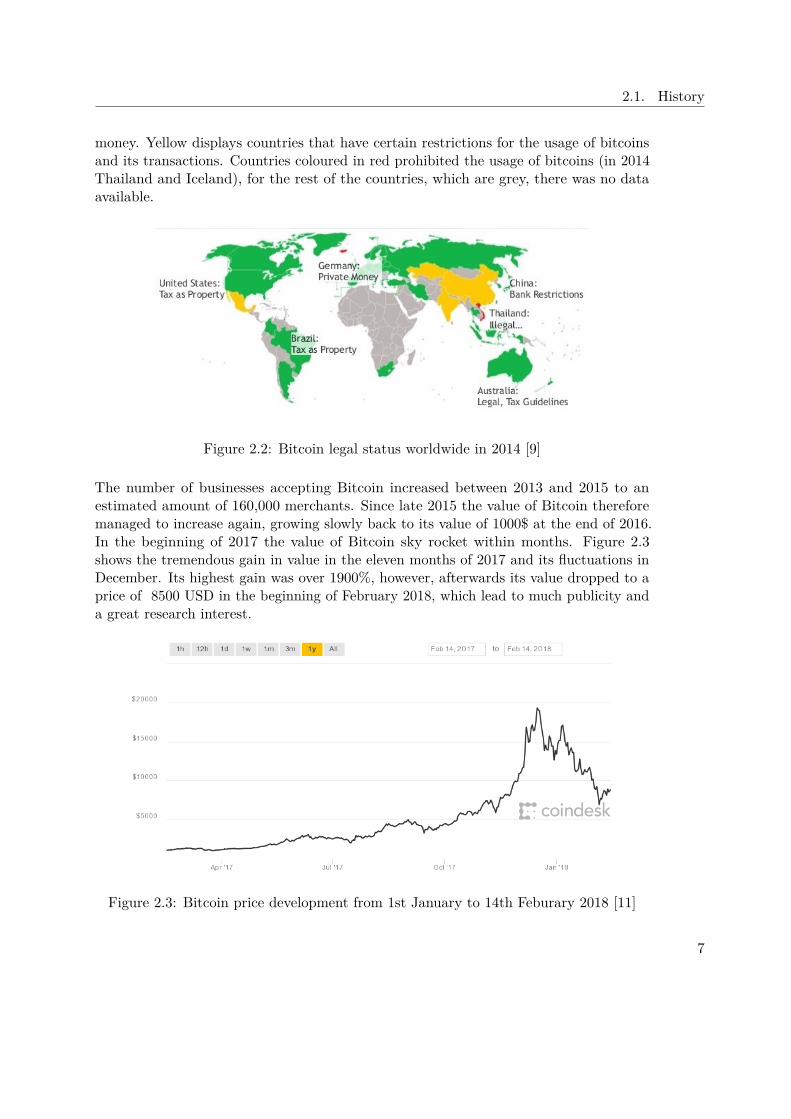
Figure 2.2 shows the legal status of Bitcoin in 2014. The countries marked in green havelegalized Bitcoin, either together with legal guidelines and tax as properties or as private
6
2.1. History
money. Yellow displays countries that have certain restrictions for the usage of bitcoinsand its transactions. Countries coloured in red prohibited the usage of bitcoins (in 2014Thailand and Iceland), for the rest of the countries, which are grey, there was no dataavailable.
Figure 2.2: Bitcoin legal status worldwide in 2014 [9]
The number of businesses accepting Bitcoin increased between 2013 and 2015 to anestimated amount of 160,000 merchants. Since late 2015 the value of Bitcoin thereforemanaged to increase again, growing slowly back to its value of 1000$ at the end of 2016.In the beginning of 2017 the value of Bitcoin sky rocket within months. Figure 2.3shows the tremendous gain in value in the eleven months of 2017 and its fluctuations inDecember. Its highest gain was over 1900%, however, afterwards its value dropped to aprice of 8500 USD in the beginning of February 2018, which lead to much publicity anda great research interest.
Figure 2.3: Bitcoin price development from 1st January to 14th Feburary 2018 [11]
7
2. Bitcoin and Blockchain
2.2 Blockchain
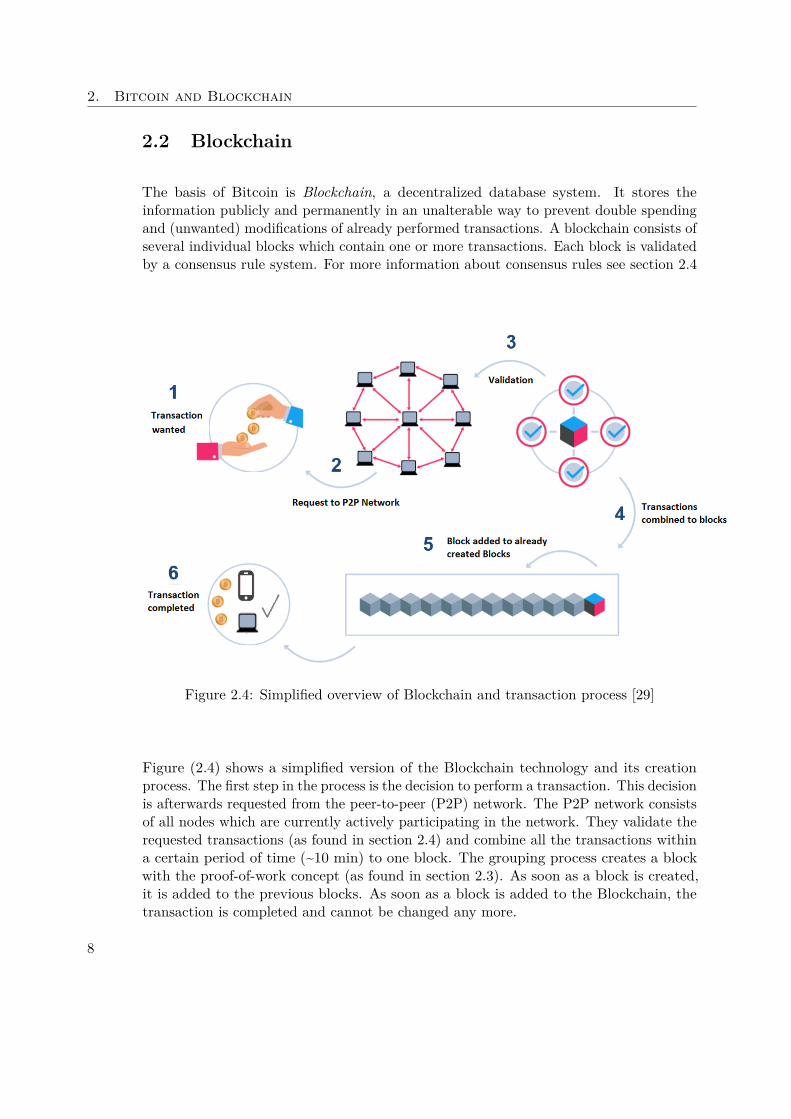
The basis of Bitcoin is Blockchain, a decentralized database system. It stores theinformation publicly and permanently in an unalterable way to prevent double spendingand (unwanted) modifications of already performed transactions. A blockchain consists ofseveral individual blocks which contain one or more transactions. Each block is validatedby a consensus rule system. For more information about consensus rules see section 2.4
Figure 2.4: Simplified overview of Blockchain and transaction process [29]
Figure (2.4) shows a simplified version of the Blockchain technology and its creationprocess. The first step in the process is the decision to perform a transaction. This decisionis afterwards requested from the peer-to-peer (P2P) network. The P2P network consistsof all nodes which are currently actively participating in the network. They validate therequested transactions (as found in section 2.4) and combine all the transactions withina certain period of time (~10 min) to one block. The grouping process creates a blockwith the proof-of-work concept (as found in section 2.3). As soon as a block is created,it is added to the previous blocks. As soon as a block is added to the Blockchain, thetransaction is completed and cannot be changed any more.
8
2.2. Blockchain
Figure 2.5: Structure of one block [7]
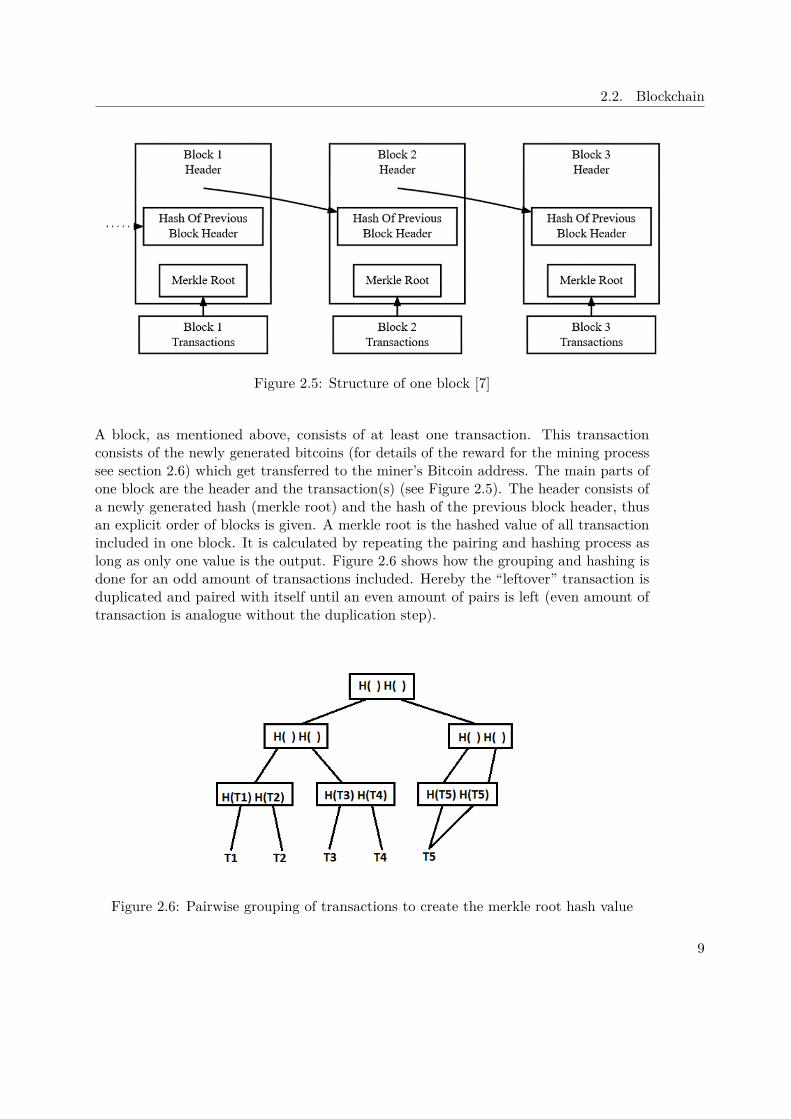
A block, as mentioned above, consists of at least one transaction. This transactionconsists of the newly generated bitcoins (for details of the reward for the mining processsee section 2.6) which get transferred to the miner’s Bitcoin address. The main parts ofone block are the header and the transaction(s) (see Figure 2.5). The header consists ofa newly generated hash (merkle root) and the hash of the previous block header, thusan explicit order of blocks is given. A merkle root is the hashed value of all transactionincluded in one block. It is calculated by repeating the pairing and hashing process aslong as only one value is the output. Figure 2.6 shows how the grouping and hashing isdone for an odd amount of transactions included. Hereby the “leftover” transaction isduplicated and paired with itself until an even amount of pairs is left (even amount oftransaction is analogue without the duplication step).
Figure 2.6: Pairwise grouping of transactions to create the merkle root hash value
9
2. Bitcoin and Blockchain
2.3 Proof of WorkThe main characteristics of Blockchain are the distributed trustless census and the preven-tion of double spending. Therefore, for each block must be checked if a specific amount ofeffort was put into its creation, ensuring that double spending and a modification of pastblocks is (nearly) impossible. A modification would include modifying all following blocksand convincing more than half of the network peers that this new blocks are trustworthywhich would require enormous computation power.Cryptographic hashes have a seemingly random nature and even small changes lead toa completely different hash value. A peer can prove the amount of work put into thefinding of a good hash, by making sure that it is below a certain difficulty thresholdvalue.
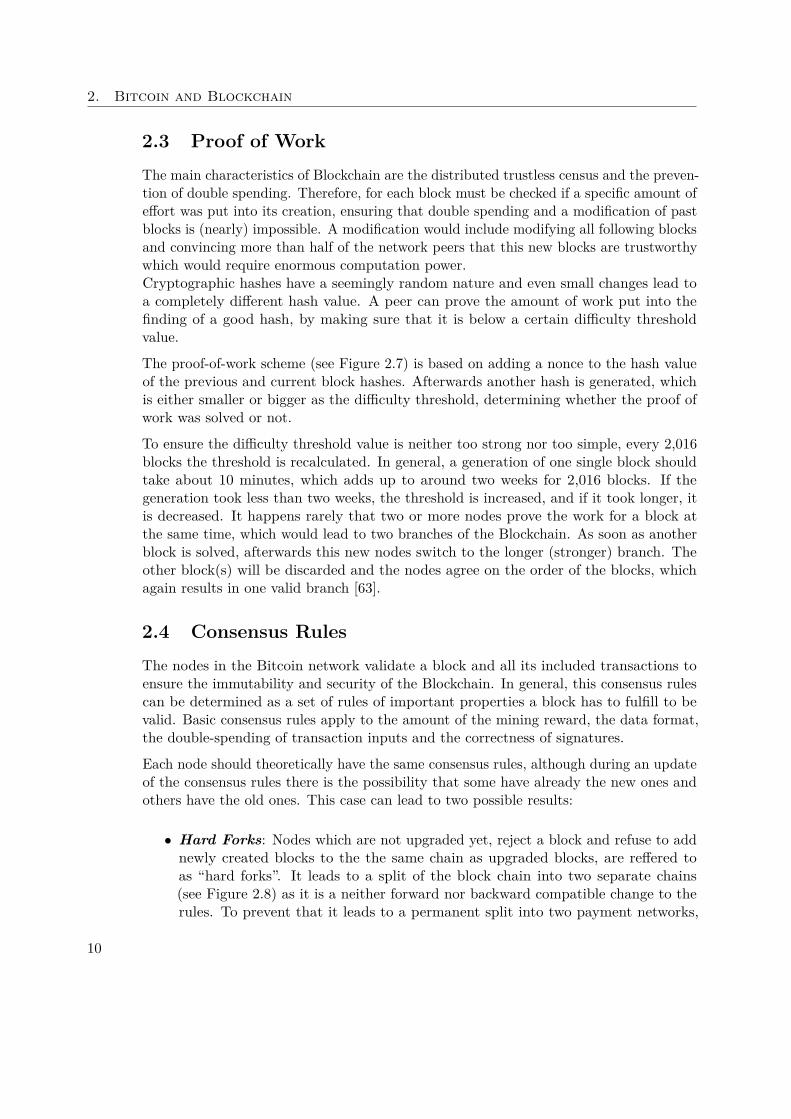
The proof-of-work scheme (see Figure 2.7) is based on adding a nonce to the hash valueof the previous and current block hashes. Afterwards another hash is generated, whichis either smaller or bigger as the difficulty threshold, determining whether the proof ofwork was solved or not.
To ensure the difficulty threshold value is neither too strong nor too simple, every 2,016blocks the threshold is recalculated. In general, a generation of one single block shouldtake about 10 minutes, which adds up to around two weeks for 2,016 blocks. If thegeneration took less than two weeks, the threshold is increased, and if it took longer, itis decreased. It happens rarely that two or more nodes prove the work for a block atthe same time, which would lead to two branches of the Blockchain. As soon as anotherblock is solved, afterwards this new nodes switch to the longer (stronger) branch. Theother block(s) will be discarded and the nodes agree on the order of the blocks, whichagain results in one valid branch [63].
2.4 Consensus RulesThe nodes in the Bitcoin network validate a block and all its included transactions toensure the immutability and security of the Blockchain. In general, this consensus rulescan be determined as a set of rules of important properties a block has to fulfill to bevalid. Basic consensus rules apply to the amount of the mining reward, the data format,the double-spending of transaction inputs and the correctness of signatures.
Each node should theoretically have the same consensus rules, although during an updateof the consensus rules there is the possibility that some have already the new ones andothers have the old ones. This case can lead to two possible results:
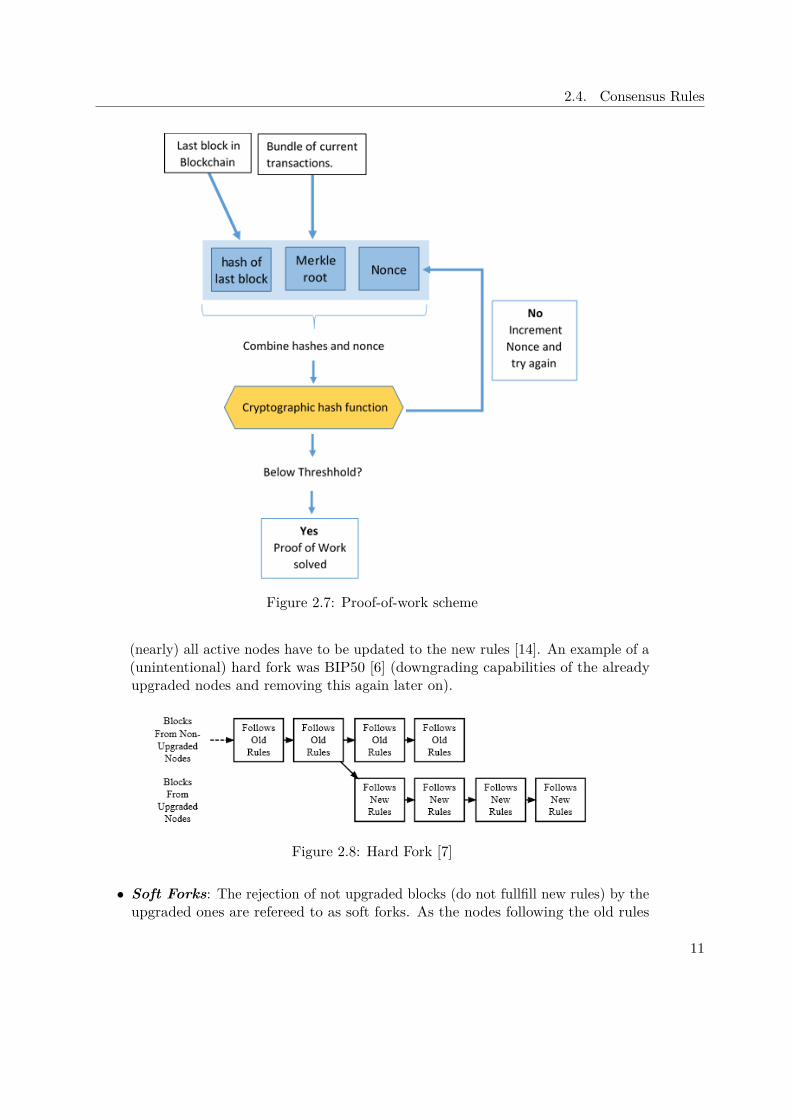
• Hard Forks: Nodes which are not upgraded yet, reject a block and refuse to addnewly created blocks to the the same chain as upgraded blocks, are reffered toas “hard forks”. It leads to a split of the block chain into two separate chains(see Figure 2.8) as it is a neither forward nor backward compatible change to therules. To prevent that it leads to a permanent split into two payment networks,
10
2.4. Consensus Rules
Figure 2.7: Proof-of-work scheme
(nearly) all active nodes have to be updated to the new rules [14]. An example of a(unintentional) hard fork was BIP50 [6] (downgrading capabilities of the alreadyupgraded nodes and removing this again later on).
Figure 2.8: Hard Fork [7]
• Soft Forks: The rejection of not upgraded blocks (do not fullfill new rules) by theupgraded ones are refereed to as soft forks. As the nodes following the old rules
11
2. Bitcoin and Blockchain
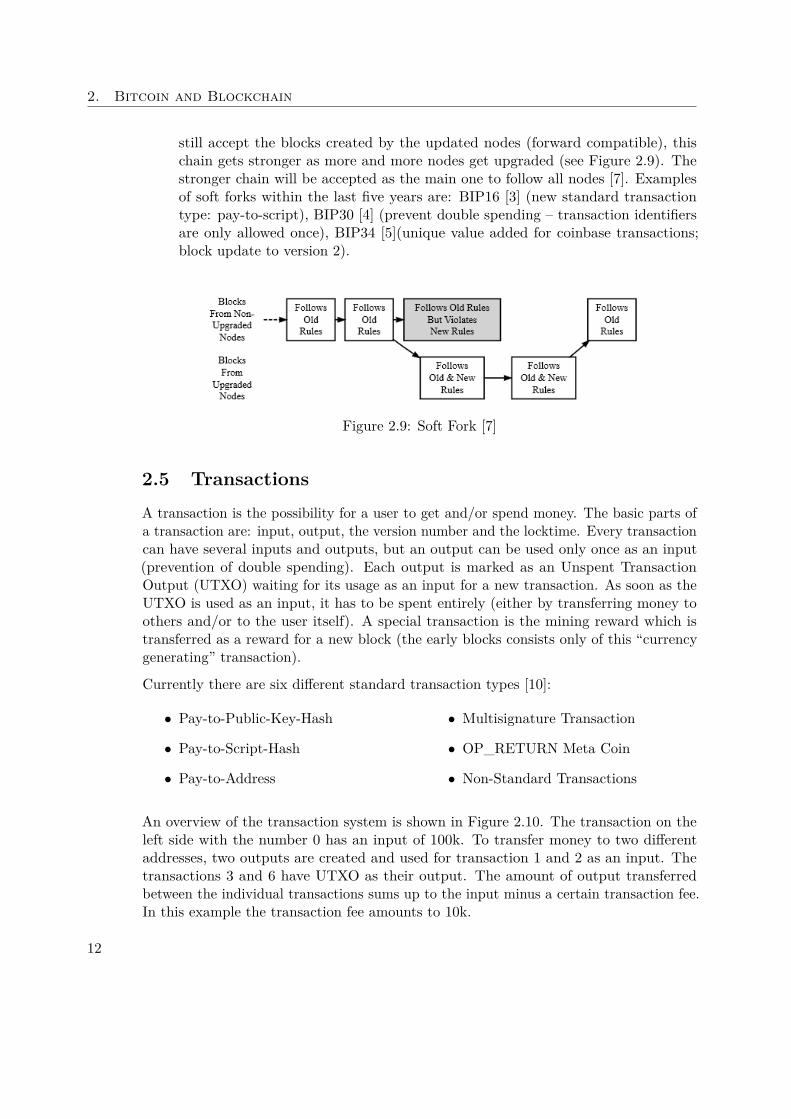
still accept the blocks created by the updated nodes (forward compatible), thischain gets stronger as more and more nodes get upgraded (see Figure 2.9). Thestronger chain will be accepted as the main one to follow all nodes [7]. Examplesof soft forks within the last five years are: BIP16 [3] (new standard transactiontype: pay-to-script), BIP30 [4] (prevent double spending – transaction identifiersare only allowed once), BIP34 [5](unique value added for coinbase transactions;block update to version 2).
Figure 2.9: Soft Fork [7]
2.5 TransactionsA transaction is the possibility for a user to get and/or spend money. The basic parts ofa transaction are: input, output, the version number and the locktime. Every transactioncan have several inputs and outputs, but an output can be used only once as an input(prevention of double spending). Each output is marked as an Unspent TransactionOutput (UTXO) waiting for its usage as an input for a new transaction. As soon as theUTXO is used as an input, it has to be spent entirely (either by transferring money toothers and/or to the user itself). A special transaction is the mining reward which istransferred as a reward for a new block (the early blocks consists only of this “currencygenerating” transaction).
Currently there are six different standard transaction types [10]:
• Pay-to-Public-Key-Hash
• Pay-to-Script-Hash
• Pay-to-Address
• Multisignature Transaction
• OP_RETURN Meta Coin
• Non-Standard Transactions
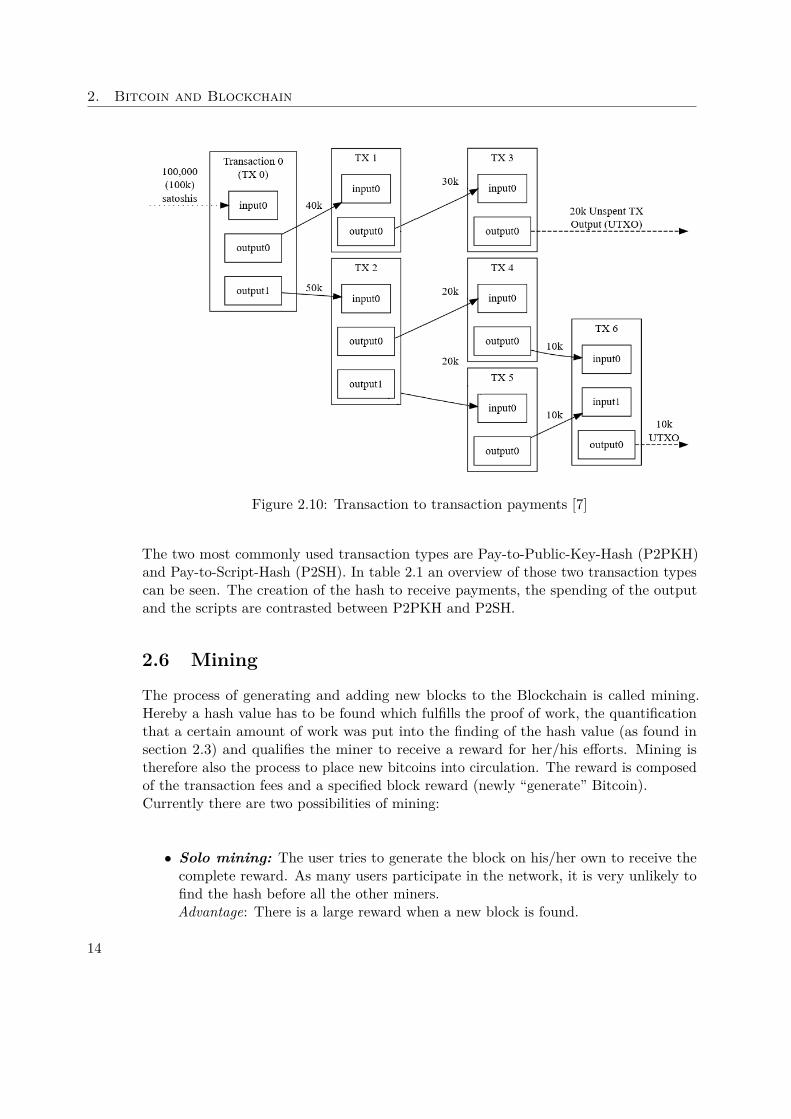
An overview of the transaction system is shown in Figure 2.10. The transaction on theleft side with the number 0 has an input of 100k. To transfer money to two differentaddresses, two outputs are created and used for transaction 1 and 2 as an input. Thetransactions 3 and 6 have UTXO as their output. The amount of output transferredbetween the individual transactions sums up to the input minus a certain transaction fee.In this example the transaction fee amounts to 10k.
12
2.5. TransactionsTa
ble2.1:
Overview
ofTr
ansactionTyp
es
13
2. Bitcoin and Blockchain
Figure 2.10: Transaction to transaction payments [7]
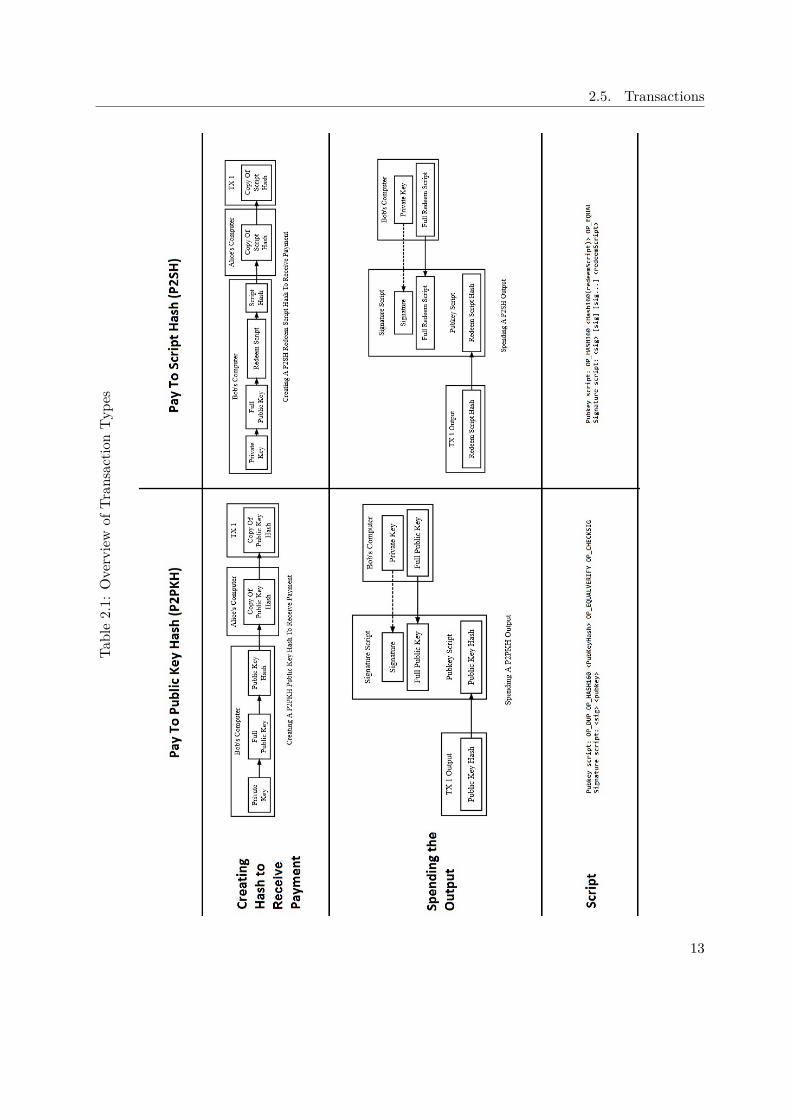
The two most commonly used transaction types are Pay-to-Public-Key-Hash (P2PKH)and Pay-to-Script-Hash (P2SH). In table 2.1 an overview of those two transaction typescan be seen. The creation of the hash to receive payments, the spending of the outputand the scripts are contrasted between P2PKH and P2SH.
2.6 Mining
The process of generating and adding new blocks to the Blockchain is called mining.Hereby a hash value has to be found which fulfills the proof of work, the quantificationthat a certain amount of work was put into the finding of the hash value (as found insection 2.3) and qualifies the miner to receive a reward for her/his efforts. Mining istherefore also the process to place new bitcoins into circulation. The reward is composedof the transaction fees and a specified block reward (newly “generate” Bitcoin).Currently there are two possibilities of mining:
• Solo mining: The user tries to generate the block on his/her own to receive thecomplete reward. As many users participate in the network, it is very unlikely tofind the hash before all the other miners.Advantage: There is a large reward when a new block is found.
14
2.7. Wallets
Disadvantage: The probability of finding a new block is quite low. It takes a longtime to find one .
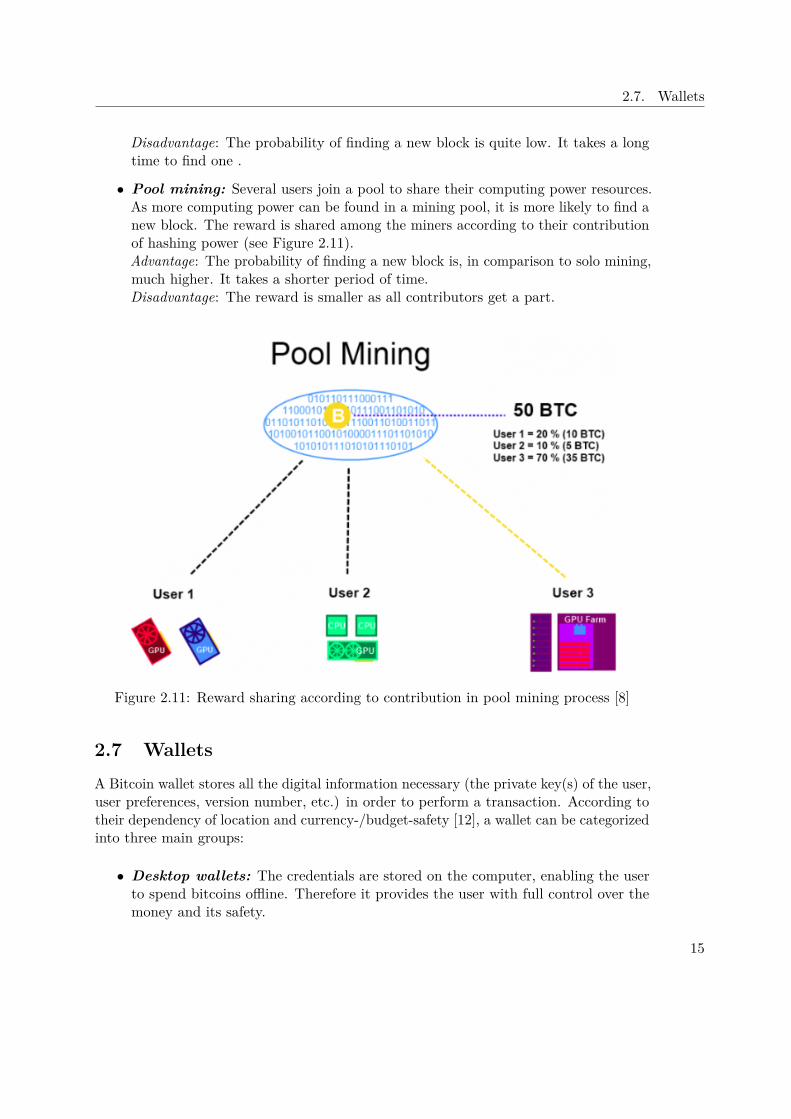
• Pool mining: Several users join a pool to share their computing power resources.As more computing power can be found in a mining pool, it is more likely to find anew block. The reward is shared among the miners according to their contributionof hashing power (see Figure 2.11).Advantage: The probability of finding a new block is, in comparison to solo mining,much higher. It takes a shorter period of time.Disadvantage: The reward is smaller as all contributors get a part.
Figure 2.11: Reward sharing according to contribution in pool mining process [8]
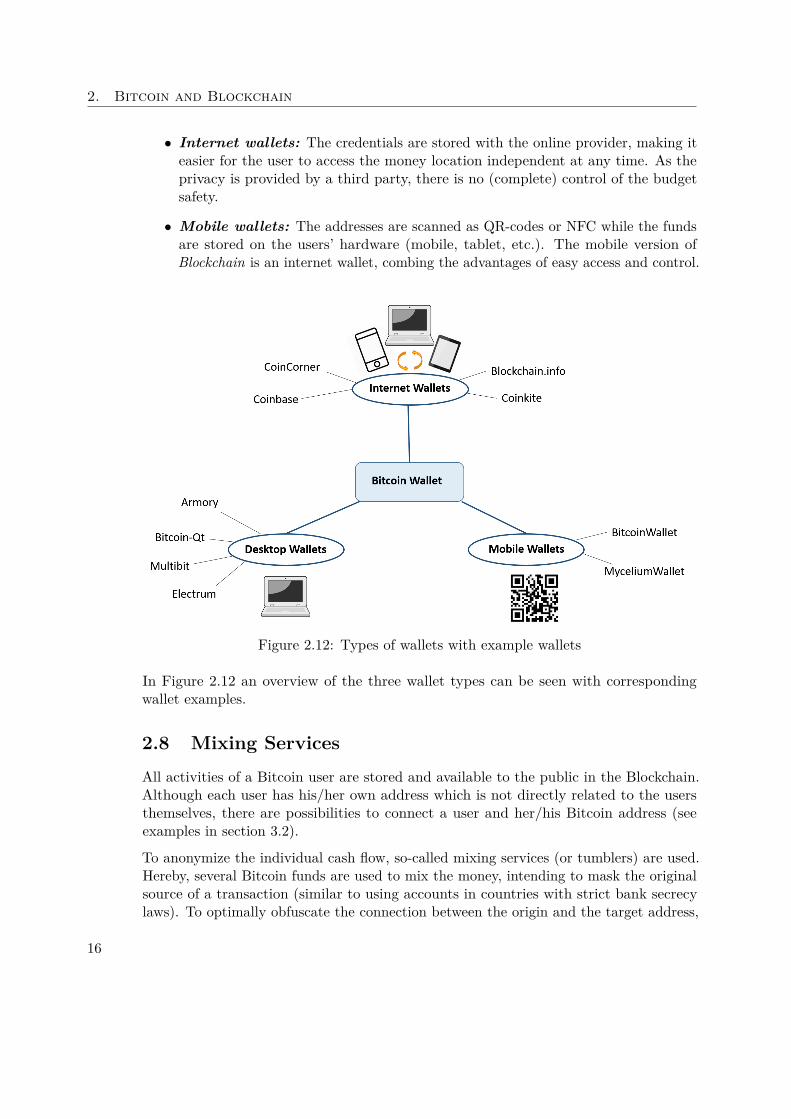
2.7 WalletsA Bitcoin wallet stores all the digital information necessary (the private key(s) of the user,user preferences, version number, etc.) in order to perform a transaction. According totheir dependency of location and currency-/budget-safety [12], a wallet can be categorizedinto three main groups:
• Desktop wallets: The credentials are stored on the computer, enabling the userto spend bitcoins offline. Therefore it provides the user with full control over themoney and its safety.
15
2. Bitcoin and Blockchain
• Internet wallets: The credentials are stored with the online provider, making iteasier for the user to access the money location independent at any time. As theprivacy is provided by a third party, there is no (complete) control of the budgetsafety.
• Mobile wallets: The addresses are scanned as QR-codes or NFC while the fundsare stored on the users’ hardware (mobile, tablet, etc.). The mobile version ofBlockchain is an internet wallet, combing the advantages of easy access and control.
Figure 2.12: Types of wallets with example wallets
In Figure 2.12 an overview of the three wallet types can be seen with correspondingwallet examples.
2.8 Mixing ServicesAll activities of a Bitcoin user are stored and available to the public in the Blockchain.Although each user has his/her own address which is not directly related to the usersthemselves, there are possibilities to connect a user and her/his Bitcoin address (seeexamples in section 3.2).
To anonymize the individual cash flow, so-called mixing services (or tumblers) are used.Hereby, several Bitcoin funds are used to mix the money, intending to mask the originalsource of a transaction (similar to using accounts in countries with strict bank secrecylaws). To optimally obfuscate the connection between the origin and the target address,
16
2.8. Mixing Services
it is advised to use trustworthy mixing services with many users and split the paymentsinto smaller transactions. There are two types of mixing currently available:
• Centralized mixing services: A third-party service where users send theirmoney, and receive for a small fee different bitcoins than they had sent in.
• Peer-based mixers: Services which provide a space where users meet and ex-change (mix) without a third-party their money.
The importance of trustworthy mixing services is emphasized by diverse incidents thathappend in the last years. Thereby fake mixing services (scams) stole the transferredbitcoins from the users (e.g. Onion Wallet, Easy Coin, and Bitcoinwallet.in [1]).
New laws concerning the illegality of mixing bitcoins increase the pressure on thoseservices. In summer 2017, one of the biggest mixing services shut down [25] and thereare still speculations whether they were forced by political and legislative pressure orchanged their mind about the right of privacy for criminals.
17

CHAPTER 3Related Work
In recent years, extensive research was conducted on cryptocurrencies as they gaineda lot of attention due to the uprise of Bitcoin. Major fields of interest concerningcryptocurrencies, for both the industry and the research community, are anonymityand privacy, as well as the used concepts (e.g. proof of work, consensus rules, etc).Another aspect which got attention, especially over the last years, is the possible usageof the Blockchain system beyond cryptocurrencies (e.g. decentralized governance [35],anti-counterfeits in the postal supply system [72], medical data records [36], etc.).
3.1 Cryptocurrencies
In this section, important work is highlighted in the context of cryptocurrencies in generaland with a special focus on systems alternative to Bitcoin. In 2015, Bonneau et al. [40]highlighted the general perspectives and challenges of different cryptocurrencies. Thetechnological background of cryptocurrencies and the dezentralization by the consensussystem are described by Serapaglia et al. [68] and Narayanan et al. [64].
In 2014, an alternative cryptocurrency was proposed by Wood called Ethereum[74]. Itoperates through a message-passing framework with multiple resources in comparison tothe transactional singleton machine with shared-state which Bitcoin is using.A cryptocurrency based on Bitcoin, called Darkcoin, was proposed 2014 by Duffield etal. [48]. In comparison to Bitcoin, however, the main focus of this currency lies on theprivacy-centric cryptography instead of the dezentralization part. The anonymisationof a block transaction is incorporated directly into the client. Furthermore, the SHA256 algorithm is replaced by a chain of hashing algorithms (X11 [30]) for an additionalsecurity effect as an improvement to the proof-of-work concept performed by Bitcoin.This technology replaces and advances the anonymity of the user in a more effective waythan Bitcoin.
19
3. Related Work
Another alternative was proposed in 2017 by Jaag et al. [53], called Postcoin. It uses theBlockchain technologies for postal financial services, with exchange rates that are notas volatile as those of bitcoins. To date, there are more than 900 different alternativebitcoins (altcoins) [17] with a total market cap as high as Bitcoin on its own.
3.2 SecurityThere are many strategies to manage bitcoins and ensure privacy. Caused by the varietyof possibilities to ensure the anonymity when using Bitcoin, many users have significantmisconceptions of their management tools, as the first large-scale user survey conductedby Krombholz et al. [57] shows. The results of the study point out that the usability ofthe security mechanisms have potential for improvements to ensure better privacy andusable security. Another cause of the misconceptions is the gap between the theoreticalunderstanding of this new cryptocurrency and the practice. Judmayer et al. [54] presenteda book in 2017 which aims to bridge this gap, providing detailed descriptions of the innerworkings of the bitcoins protocol.
A guide for the most common Bitcoin transaction patterns was introduced by Ferrin in2015 [49]. The guide describes on the basis of (real) Bitcoin transactions with the helpof generic parameters specific patterns (e.g. peel transactions – simple spend of money,distribution transactions – payout, etc.) for a better understanding of the mechanismsbehind them.
Androulaki et al. [34] proposed an evaluation which determines the privacy and anonymityof bitcoins. They evaluated the privacy implications provided by Bitcoin, finding thatthose are not enough to protect the privacy of the users. As bitcoins are not per-se anonymous it is important to emphasize this circumstance to achieve awareness.Andoulaki et al. [34] and Brugere et al. [52] for example highlighted the pseudo-anonymity by introducing different ideas as unsupervised learning and heuristics aboutmulti-input transactions and “shadow” addresses to associate Bitcoin addresses to thecontrolling entity/user.
Reid et al. [66] analyzed the Bitcoin system based on its anonymity. They demonstratethe possibility to associate the public keys to a specific user by combining the publicavailable structure of the Bitcoin system with external informations. Another survey wasdone by Maurer et al.[60], comparing privacy solutions for the Bitcoin system. Accordingto their study, CoinJoin [16] can be considered a good approach for anonymizing thetransactions.
In 2013, Meiklejohn et al. [62] proposed another method to connect users and theirBitcoin addresses with the main focus on identifying big institutions and their transactions.This method uses (manual) labelling of the input or change addresses combined withclustering, which exploits a current idiom of use in the network.
One year later, another approach which determines a connection between a bitcoin addressand a real person or company was proposed by Baumann et al. [37]. It uses recent
20
3.3. Visualization
data provided by the Blockchain, which is explored with a combination of statistics andnetwork analysis tools to get an insight in the past transactions. The overall analysis isdone by graph mining showing the different connections. In comparison to our prototypethis approach focuses only on recent data stored in the Blockchain and does not provideany interactive exploration possibility of the graphs.
3.3 VisualizationThe Blockchain technology became famous together with the Bitcoin ecosystem. Itprovides the unique opportunity to record the history of digital transactions and eventsbased on a consensus system which is publicly available to everyone. The public availabletransaction data stored in the Blockchain gives the research community the possibility toanalyze the current and past cash flows.
The great price boom [23] of bitcoins in the last four years led to an increasing in-terest among laypeople and academia. Consequently, the fields of visualization, privacyand usable security became of great importance for the analysis and exploration of thisvirtual cryptocurrency under different aspects and circumstances. The great importanceof visual output for the discovery and analysis of digital data was presented by Nordbo[65] who conducted a literature study on the challenges and possibilities of differentvisualization tools and methods.
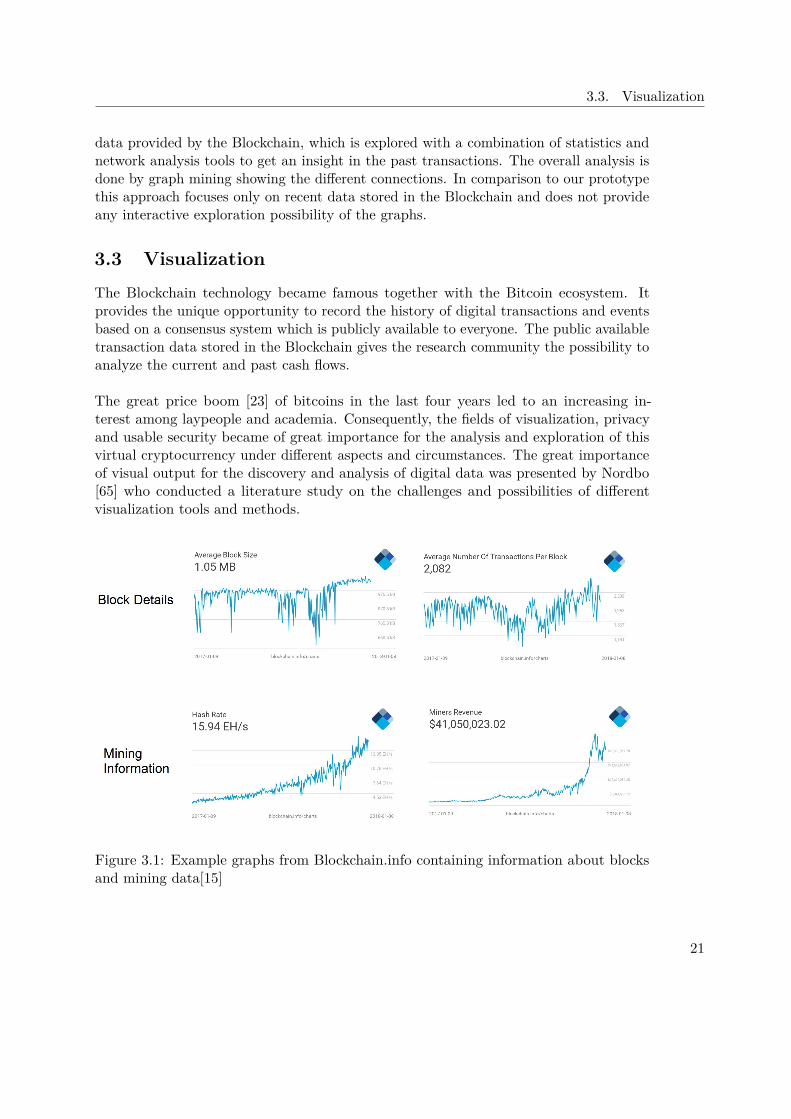
Figure 3.1: Example graphs from Blockchain.info containing information about blocksand mining data[15]
21
3. Related Work
The website Blockchain.info [15] gives an insight into the available information providedby the Blockchain. Individual blocks can be inspected including the correspondingtransactions in textual form. Furthermore, currency statistics, block details (see exampleof block size average in Figure 3.1), mining information, network activity and walletactivities can be inspected in different line or circle charts. Blockchain.info providesthe user with all information available in the Blockchain, which is also the goal ofour approach; however, the information is not connected and scattered all over thewebsite. Furthermore, the transactions and its connections are provided only via textualinformation, which must be clicked through by the user by hand. PlanB enables the userto search for specific Bitcoin addresses and display their surrounding (neighbourhood) orsearch for a connection to another address.
The different visualization applications can be categorized into three groups accordingto their usage and goals: Economic visualizations, real-time (transaction) visualizationsand security and analytic-related visualizations. In the following influential visualizationapproaches in those categories are described.
3.3.1 Economic
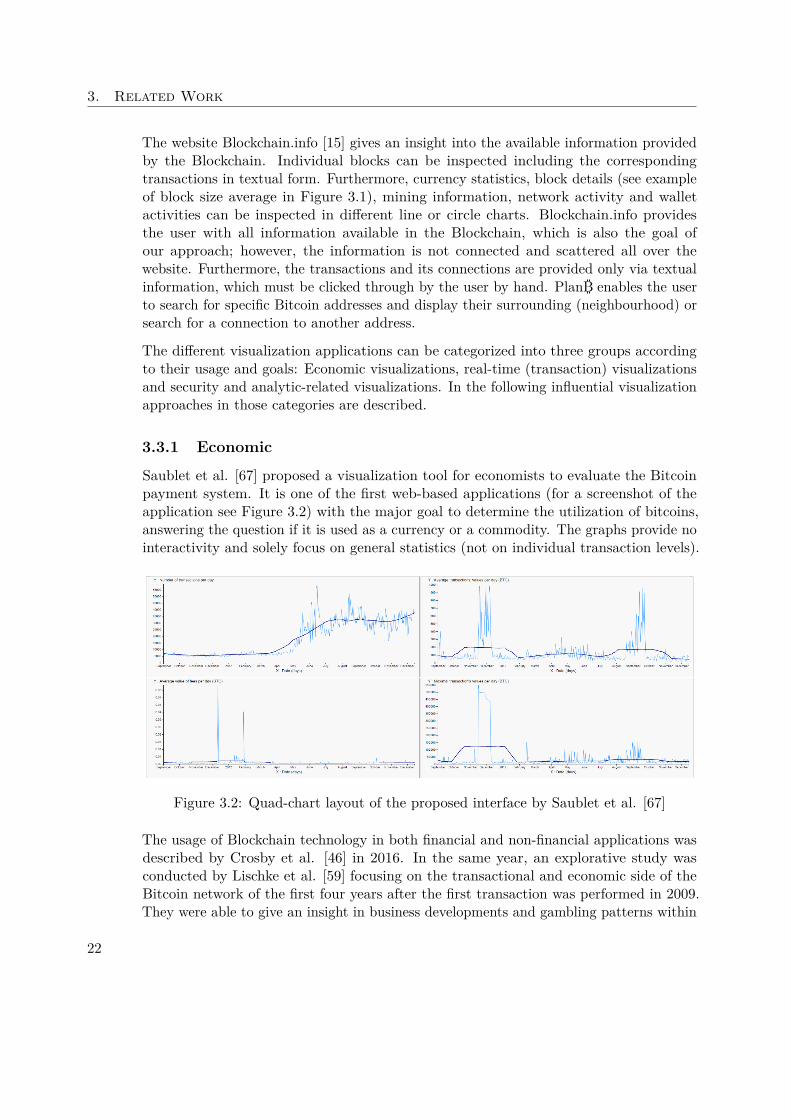
Saublet et al. [67] proposed a visualization tool for economists to evaluate the Bitcoinpayment system. It is one of the first web-based applications (for a screenshot of theapplication see Figure 3.2) with the major goal to determine the utilization of bitcoins,answering the question if it is used as a currency or a commodity. The graphs provide nointeractivity and solely focus on general statistics (not on individual transaction levels).
Figure 3.2: Quad-chart layout of the proposed interface by Saublet et al. [67]
The usage of Blockchain technology in both financial and non-financial applications wasdescribed by Crosby et al. [46] in 2016. In the same year, an explorative study wasconducted by Lischke et al. [59] focusing on the transactional and economic side of theBitcoin network of the first four years after the first transaction was performed in 2009.They were able to give an insight in business developments and gambling patterns within
22
3.3. Visualization
the Bitcoin usage.Alvarez-Pereira et al. [33] introduced a new way to explore the economic effects, forexample economic bubbles. According to network and conversation analysis, they areable to relate those effects to Bitcoin. Due to their visual representation they were able todetermine a correlation between discussion sentiment and the current price of the Bitcoin.Their visualizations in relation to our prototype, however, focused only on economicstates and price relationships and not on transaction and time-based effects.
3.3.2 Real Time
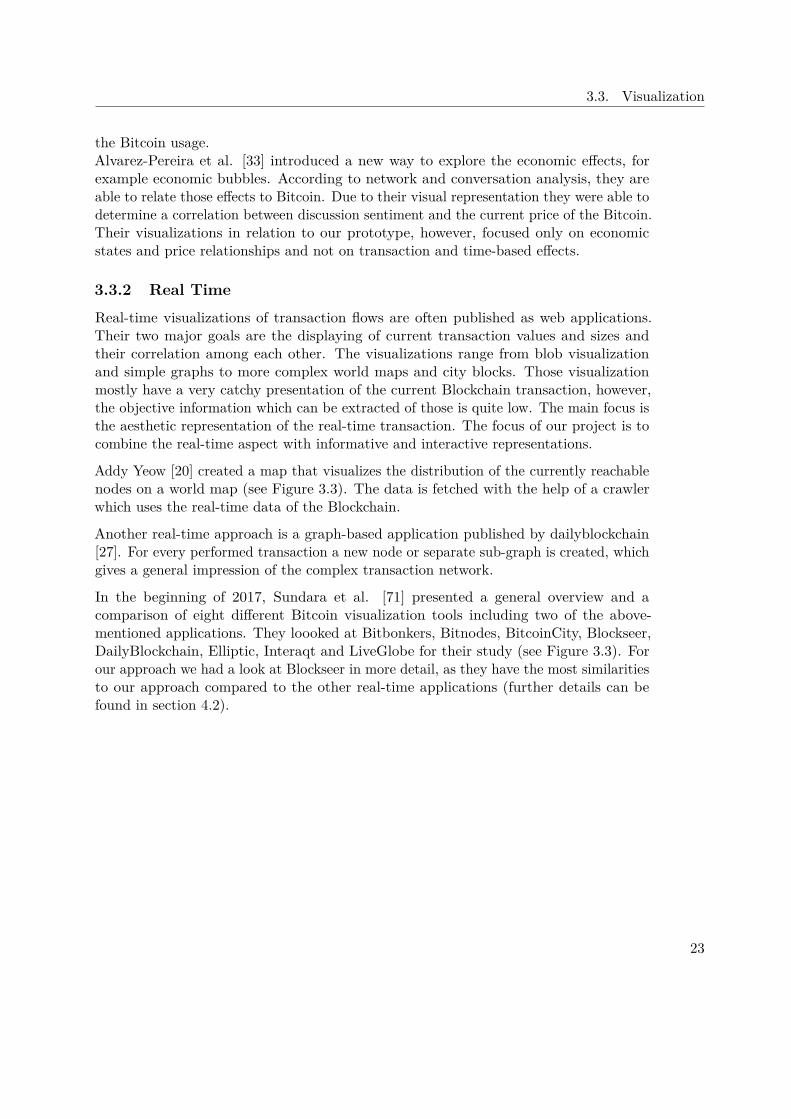
Real-time visualizations of transaction flows are often published as web applications.Their two major goals are the displaying of current transaction values and sizes andtheir correlation among each other. The visualizations range from blob visualizationand simple graphs to more complex world maps and city blocks. Those visualizationmostly have a very catchy presentation of the current Blockchain transaction, however,the objective information which can be extracted of those is quite low. The main focus isthe aesthetic representation of the real-time transaction. The focus of our project is tocombine the real-time aspect with informative and interactive representations.
Addy Yeow [20] created a map that visualizes the distribution of the currently reachablenodes on a world map (see Figure 3.3). The data is fetched with the help of a crawlerwhich uses the real-time data of the Blockchain.
Another real-time approach is a graph-based application published by dailyblockchain[27]. For every performed transaction a new node or separate sub-graph is created, whichgives a general impression of the complex transaction network.
In the beginning of 2017, Sundara et al. [71] presented a general overview and acomparison of eight different Bitcoin visualization tools including two of the above-mentioned applications. They loooked at Bitbonkers, Bitnodes, BitcoinCity, Blockseer,DailyBlockchain, Elliptic, Interaqt and LiveGlobe for their study (see Figure 3.3). Forour approach we had a look at Blockseer in more detail, as they have the most similaritiesto our approach compared to the other real-time applications (further details can befound in section 4.2).
23
3. Related Work
Figure 3.3: Overview of different real-time visualization applications
24
3.3. Visualization
3.3.3 Analytics and Privacy
Visualizations should on the one hand emphasize the pseudo-anonymity of Bitcoin, andon the other hand help forensic and security experts to backtrack cashflows and filterpatterns (mining pools, mixing services, etc.).
Kurzuno et al. [58] introduced a system which is useful for investigating and filteringcriminal actions done via the Bitcoin network, including past transaction data. Theirsystem’s main features are showing some statistics of the used addresses, a graphicaltransaction relation model and the visualization of transaction paths.
Spanguolo [69] finished his thesis about a semi-automatic system, called BitIodine,which labels active users and provides information about their actions for forensicanalysis. Shortly afterwards, in 2014, Spagnuolo et al. [70] published their findings at theInternational Conference on Financial Cryptography and Data Security. They releasedtheir prototype as a library, which provides a baseline for further analysis tools.
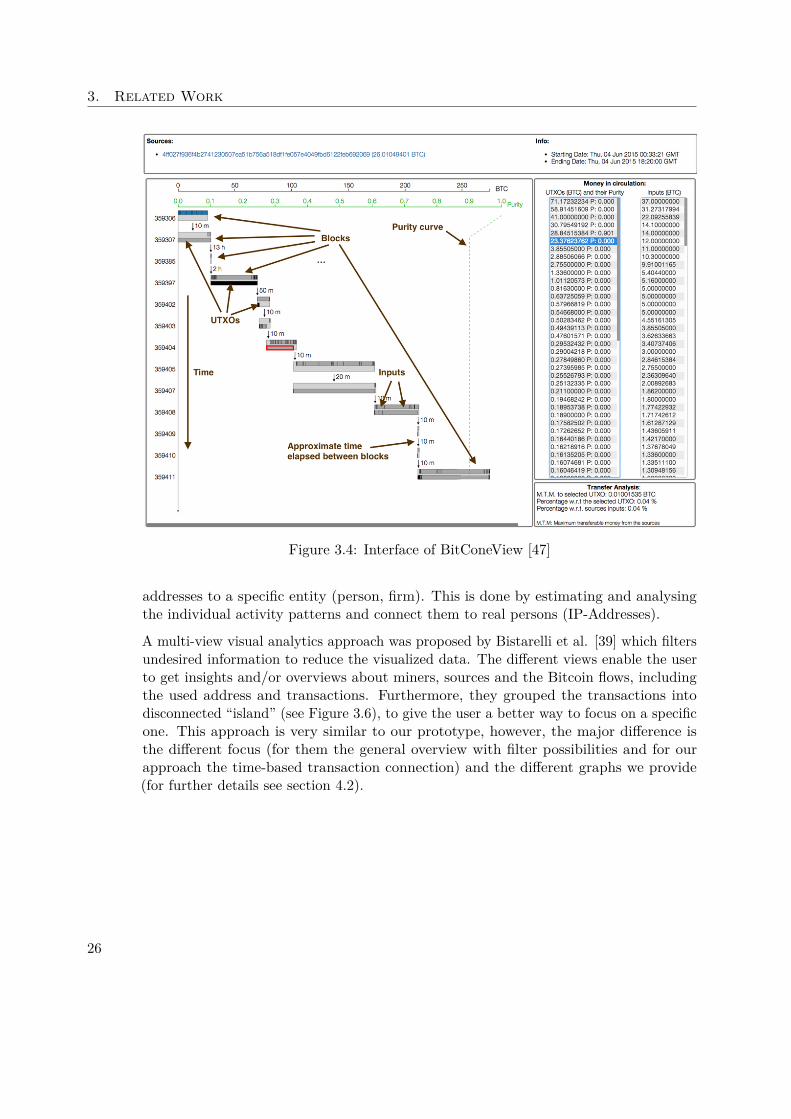
A visual analysis system, called BitConeView, was introduced by Battista et al. in 2015[47] for the evaluation of Bitcoin flows in the Blockchain. The focus of this application wasthe detection of flow patterns within the transaction graph for gaining a fast understandingof suspicious activities (see Figure 3.4). The general idea to detect suspicious patternsand determine connections between two addresses is similar to our approach, however,the implementation is very different. In comparison to our approach it has (nearly) nointeractive component and the computation for larger information requests takes a longtime, without a visual output. Furthermore, the BitConeView only uses bar charts todisplay the information.
In 2015 Greaves et al. [51] performed an analysis on the Bitoin network and its correlationand predictability to the Bitcoin price. Their findings are based on transaction graphsand enable them to predict the prices (with a 55% accuracy, as they state). 2015 BeriniSarrias [38] proposed different metrics which help to assess the security of the Bitcoinnetwork with the help of simulator models. His main goal was to extract information ofthe network for a better understanding and give a visual output of the findings.
McGinn et al. [61] introduced a top-down visualization giving the users the possibility tocollaboratively discover high frequency transaction patterns. Especially, they managedto show the evolution of denial-of-service attacks and laundering operations, which gavea great insight in the security aspects of the Bitcoin network. The most importantdifference to PlanB is the lack of transaction correlation over time.
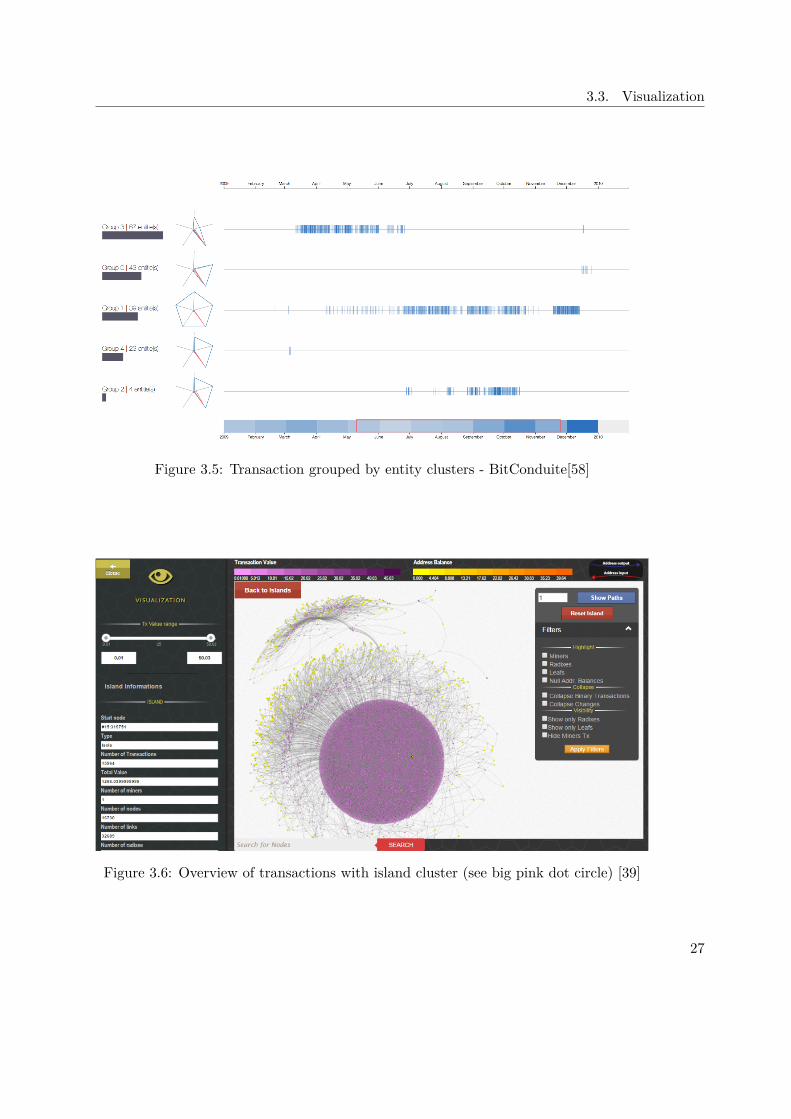
2017 the BitConduite tool was introduced by Kinkeldey et al. [56]. This application isbased on a MongoDB document database combined with a MonetDB database to getfast access to the different data which is displayed afterwards. The visualization consistsof several groups which are clustered by k-Means (see Figure 3.5) to get an overall feelingfor the different clusters within the Blockchain. The difference to our approach is the lackof interactivity and the missing of different views of the transactions. Furthermore, thefocus is different as the major goal of BitConduit is the deanonymization by connecting
25
3. Related Work
Figure 3.4: Interface of BitConeView [47]
addresses to a specific entity (person, firm). This is done by estimating and analysingthe individual activity patterns and connect them to real persons (IP-Addresses).
A multi-view visual analytics approach was proposed by Bistarelli et al. [39] which filtersundesired information to reduce the visualized data. The different views enable the userto get insights and/or overviews about miners, sources and the Bitcoin flows, includingthe used address and transactions. Furthermore, they grouped the transactions intodisconnected “island” (see Figure 3.6), to give the user a better way to focus on a specificone. This approach is very similar to our prototype, however, the major difference isthe different focus (for them the general overview with filter possibilities and for ourapproach the time-based transaction connection) and the different graphs we provide(for further details see section 4.2).
26
3.3. Visualization
Figure 3.5: Transaction grouped by entity clusters - BitConduite[58]
Figure 3.6: Overview of transactions with island cluster (see big pink dot circle) [39]
27

CHAPTER 4Methodology
The methodology and design used for the prototype PlanB is based on qualitative andquantitative design methods of information visualization (as found in section 4.1.1) andvisual analytics (as found in section 4.1.2).
PlanB is a web-based application and was developed based on the phases of the SystemDevelopment Life Cycle (SDLC). The number of phases used in the SDLC vary betweenfive to more than ten, depending on the project and its breakdown granularity. Weconsidered the following five phases for this thesis:
1. Planning: We set up a project development plan. Hereby, the basic requirementswere set and an overall goal was formulated. The goal to design and developwas: an application which gives the user the possibility to interactivelyexplore the Blockchain and determine corresponding transactions.
2. Analysis: To get a better feeling of currently available applications we conductedan extensive literature research (as found in chapter 3). The related approacheswere analyzed and compared among each other. During the literature researchwalkthroughs through three applications were performed (as found in section 4.2).Hereby, the main focus was to identify the flaws and improvement opportunities ofthose applications and to formulate (further) specifications for our prototype.
3. Design: After the specifications and requirements were formulated the designprocess started. Hereby the first sketches of our application were made and thename was retained (as found in section 4.3).
4. Implementation: The implementation phase started as soon as the basic designwas finished. As the prototype consists of two major parts, the front- and thebackend, the communication between those two was established. Details on thefrontend can be found in chapter 5, including screenshots of the final prototype
29
4. Methodology
version. During the implementation phase several feedback loops were performedto improve the layout and its usability.
5. Operation: The last phase of this work includes the source code publication as itis our goal to provide a basic framework for further visual research on the Bitcointransaction system. Furthermore, the resulting prototype was evaluated, reviewedand future work was discussed.
4.1 VisualizationVarious encyclopedies define visualization as “The act or process of visualizing” [18]. Forthis thesis the term visualization covers not solely the act of visualizing but also includesthe communication of a message shown by images, diagrams or animations within a tool.This way of communication can be used effectively on the one hand for very abstractideas and elements, and on the other hand for very concrete data to enable the user toform a mental vision, image or picture [Oxford Engl. Dict. 1989].
Visualization is an important area which is used in various fields of computer sciences(medicine, security, graphics, etc.) to provide users with visual information. It can beclassified into the following three areas: Scientific Visualizations (Volume Visualization,Flow Visualization), Information Visualizations, and Visual Analytics. The three majorgoals of visualization are to explore (when nothing is known beforehand), to analyze(verify or falsify the hypotheses), and to present (to communicate the already knownaspects). For this thesis the two main aspects of visualization used to design the prototypePlanB are information visualization and visual analytics, which will be discussed in thefollowing two sections.
4.1.1 Information Visualization
The main goal of information visualization is to enable the user to explore a large amountof (abstract) data. The Blockchain currently has more than 155 GB (February 2018) ofdata stored. A simple comparison and look through this tremendous amount of datais undoable for a human being. Therefore, a visual representation is necessary to get afeeling of the structure and the transaction mechanisms which are publicly stored in theBlockchain.
4.1.2 Visual Analytics
The field of visual analytics can be determined as an enhancement of scientific andinformation visualization. It supports the analytical reasoning with a visual systemwhich is interactively explorable. Hereby, especially human strengths like creativity,flexibility and further background knowledge are facilitated with the processing powersof a computer based application and its storage capabilities. The interactive part ofthe prototype presented in this thesis is very important, as it gives the user an optimalpossibility to explore the data and draw novel conclusions from them.
30
4.2. Application Walkthroughs
4.2 Application Walkthroughs
During our literature research about visualization applications for Bitoin transactions,we found several approaches (as described in chapter 3). However, most of them had nogreat similarity with our planned prototype. On the one hand, many of the applicationsonly focused on one aspect (either real-time or only a limited period of time) which wedefined as essential for our prototype PlanB; on the other hand, many applications werenot publicly available and only provided a very limited amount of screenshots/graphicsof the framework. Based on the two constraints of availability and similarity, we decidedto take two web-based applications into account for our walkthrough, which we describein the following two sections.
4.2.1 Blockseer
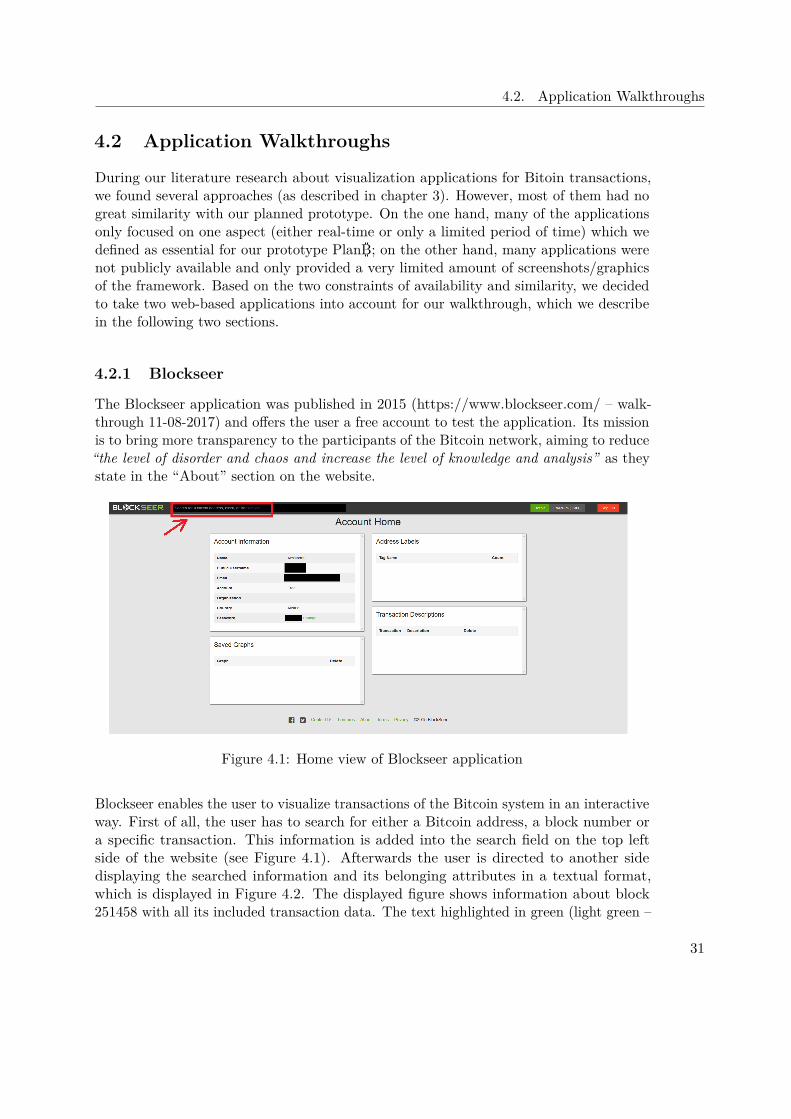
The Blockseer application was published in 2015 (https://www.blockseer.com/ – walk-through 11-08-2017) and offers the user a free account to test the application. Its missionis to bring more transparency to the participants of the Bitcoin network, aiming to reduce“the level of disorder and chaos and increase the level of knowledge and analysis” as theystate in the “About” section on the website.
Figure 4.1: Home view of Blockseer application
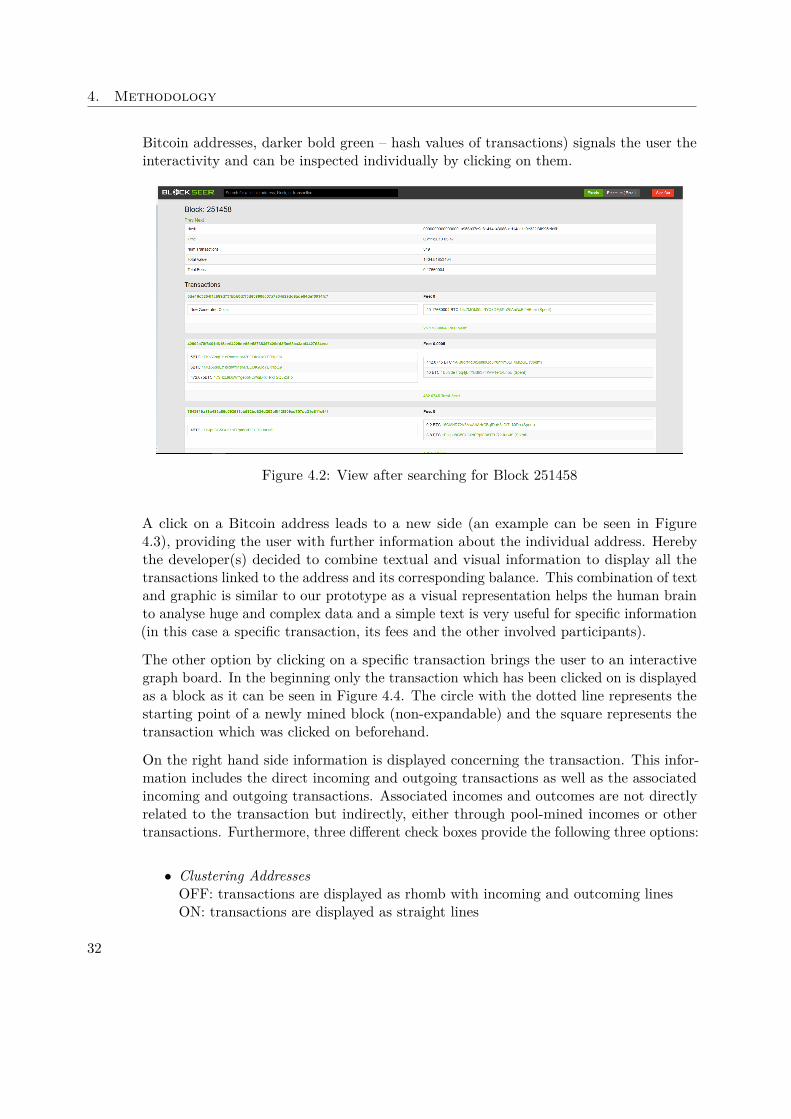
Blockseer enables the user to visualize transactions of the Bitcoin system in an interactiveway. First of all, the user has to search for either a Bitcoin address, a block number ora specific transaction. This information is added into the search field on the top leftside of the website (see Figure 4.1). Afterwards the user is directed to another sidedisplaying the searched information and its belonging attributes in a textual format,which is displayed in Figure 4.2. The displayed figure shows information about block251458 with all its included transaction data. The text highlighted in green (light green –
31
4. Methodology
Bitcoin addresses, darker bold green – hash values of transactions) signals the user theinteractivity and can be inspected individually by clicking on them.
Figure 4.2: View after searching for Block 251458
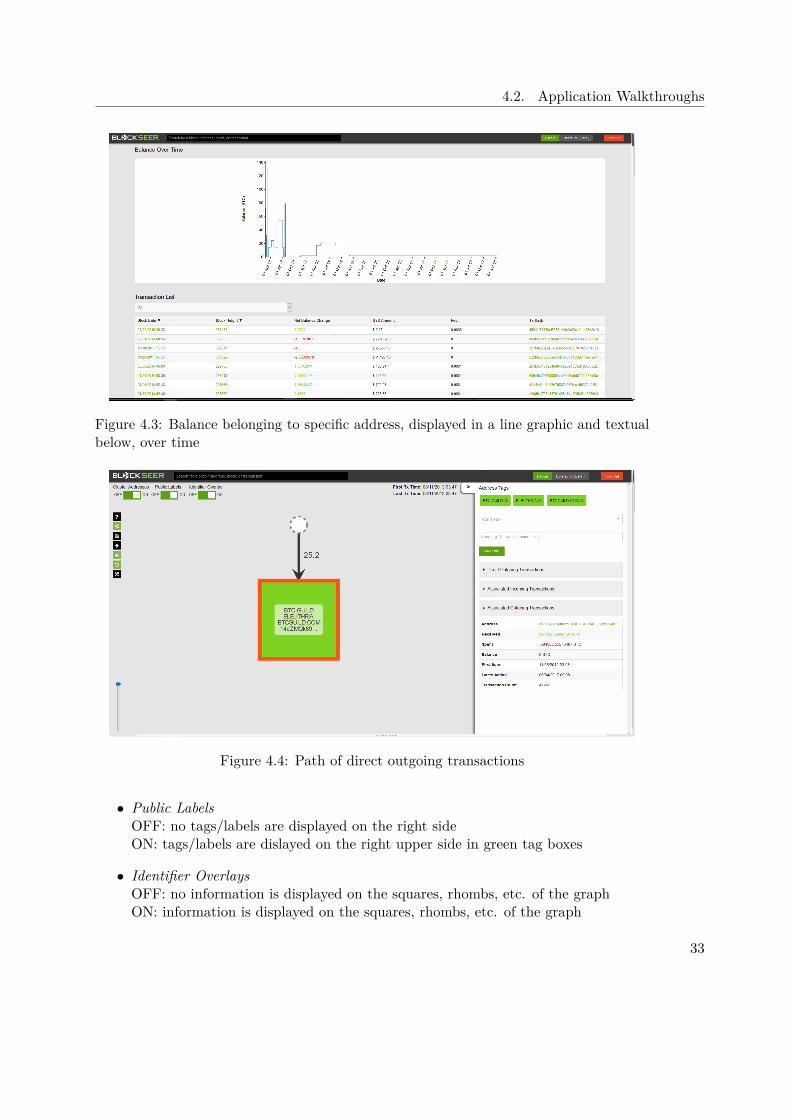
A click on a Bitcoin address leads to a new side (an example can be seen in Figure4.3), providing the user with further information about the individual address. Herebythe developer(s) decided to combine textual and visual information to display all thetransactions linked to the address and its corresponding balance. This combination of textand graphic is similar to our prototype as a visual representation helps the human brainto analyse huge and complex data and a simple text is very useful for specific information(in this case a specific transaction, its fees and the other involved participants).
The other option by clicking on a specific transaction brings the user to an interactivegraph board. In the beginning only the transaction which has been clicked on is displayedas a block as it can be seen in Figure 4.4. The circle with the dotted line represents thestarting point of a newly mined block (non-expandable) and the square represents thetransaction which was clicked on beforehand.
On the right hand side information is displayed concerning the transaction. This infor-mation includes the direct incoming and outgoing transactions as well as the associatedincoming and outgoing transactions. Associated incomes and outcomes are not directlyrelated to the transaction but indirectly, either through pool-mined incomes or othertransactions. Furthermore, three different check boxes provide the following three options:
• Clustering AddressesOFF: transactions are displayed as rhomb with incoming and outcoming linesON: transactions are displayed as straight lines
32
4.2. Application Walkthroughs
Figure 4.3: Balance belonging to specific address, displayed in a line graphic and textualbelow, over time
Figure 4.4: Path of direct outgoing transactions
• Public LabelsOFF: no tags/labels are displayed on the right sideON: tags/labels are dislayed on the right upper side in green tag boxes
• Identifier OverlaysOFF: no information is displayed on the squares, rhombs, etc. of the graphON: information is displayed on the squares, rhombs, etc. of the graph
33
4. Methodology
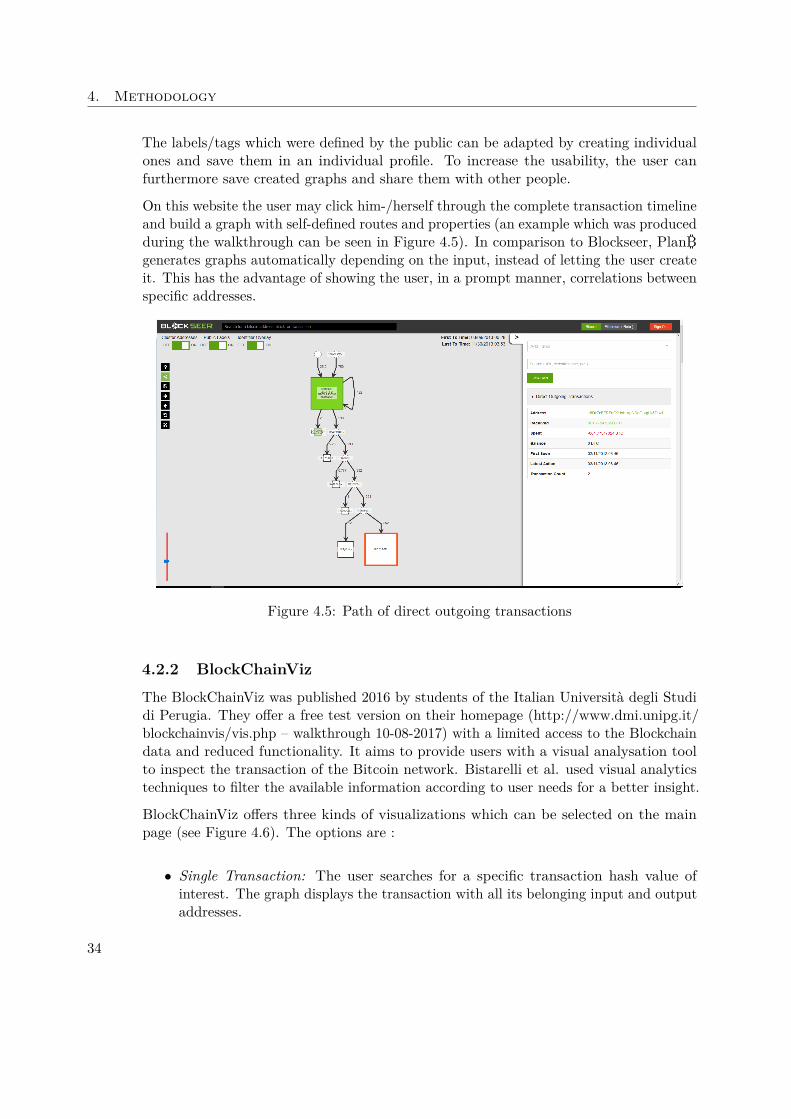
The labels/tags which were defined by the public can be adapted by creating individualones and save them in an individual profile. To increase the usability, the user canfurthermore save created graphs and share them with other people.
On this website the user may click him-/herself through the complete transaction timelineand build a graph with self-defined routes and properties (an example which was producedduring the walkthrough can be seen in Figure 4.5). In comparison to Blockseer, PlanBgenerates graphs automatically depending on the input, instead of letting the user createit. This has the advantage of showing the user, in a prompt manner, correlations betweenspecific addresses.
Figure 4.5: Path of direct outgoing transactions
4.2.2 BlockChainViz
The BlockChainViz was published 2016 by students of the Italian Università degli Studidi Perugia. They offer a free test version on their homepage (http://www.dmi.unipg.it/blockchainvis/vis.php – walkthrough 10-08-2017) with a limited access to the Blockchaindata and reduced functionality. It aims to provide users with a visual analysation toolto inspect the transaction of the Bitcoin network. Bistarelli et al. used visual analyticstechniques to filter the available information according to user needs for a better insight.
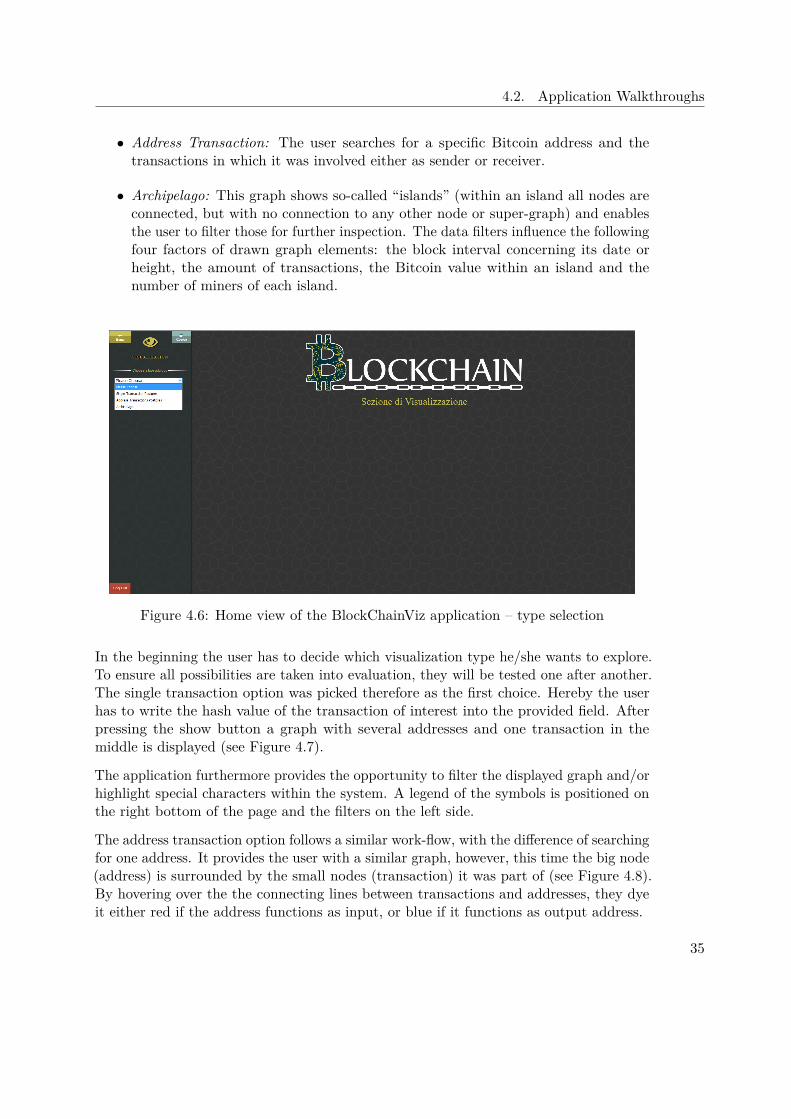
BlockChainViz offers three kinds of visualizations which can be selected on the mainpage (see Figure 4.6). The options are :
• Single Transaction: The user searches for a specific transaction hash value ofinterest. The graph displays the transaction with all its belonging input and outputaddresses.
34
4.2. Application Walkthroughs
• Address Transaction: The user searches for a specific Bitcoin address and thetransactions in which it was involved either as sender or receiver.
• Archipelago: This graph shows so-called “islands” (within an island all nodes areconnected, but with no connection to any other node or super-graph) and enablesthe user to filter those for further inspection. The data filters influence the followingfour factors of drawn graph elements: the block interval concerning its date orheight, the amount of transactions, the Bitcoin value within an island and thenumber of miners of each island.
Figure 4.6: Home view of the BlockChainViz application – type selection
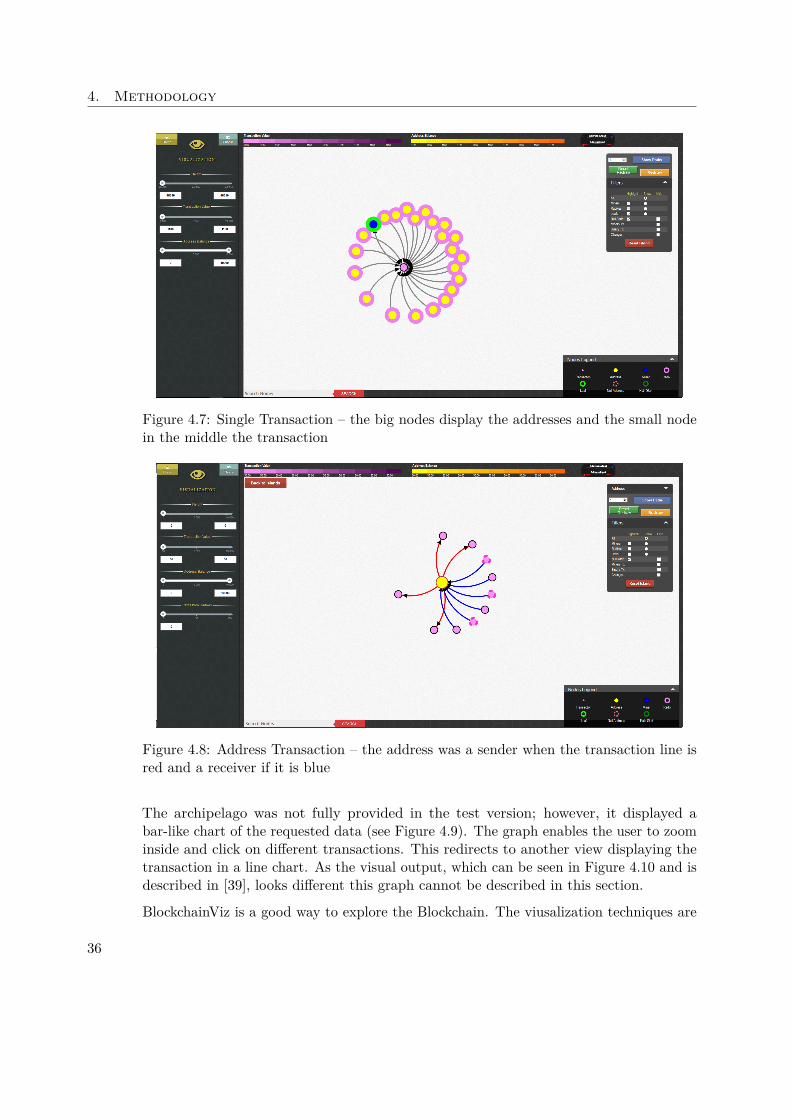
In the beginning the user has to decide which visualization type he/she wants to explore.To ensure all possibilities are taken into evaluation, they will be tested one after another.The single transaction option was picked therefore as the first choice. Hereby the userhas to write the hash value of the transaction of interest into the provided field. Afterpressing the show button a graph with several addresses and one transaction in themiddle is displayed (see Figure 4.7).
The application furthermore provides the opportunity to filter the displayed graph and/orhighlight special characters within the system. A legend of the symbols is positioned onthe right bottom of the page and the filters on the left side.
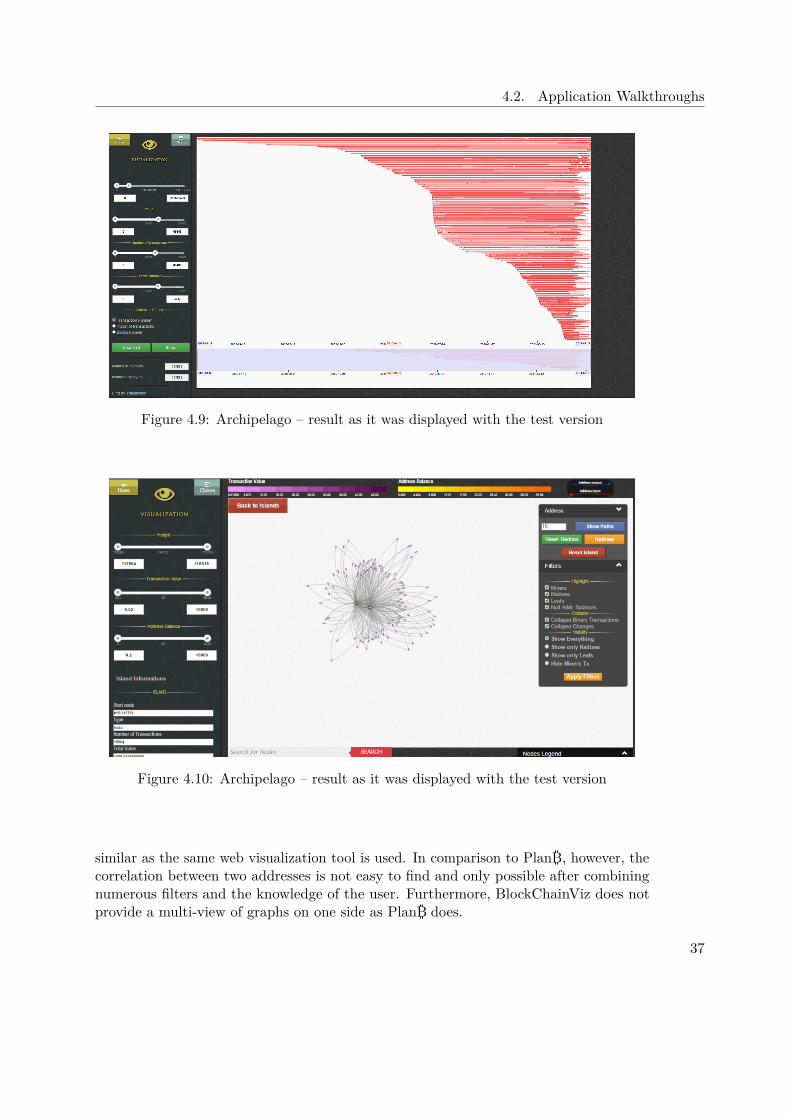
The address transaction option follows a similar work-flow, with the difference of searchingfor one address. It provides the user with a similar graph, however, this time the big node(address) is surrounded by the small nodes (transaction) it was part of (see Figure 4.8).By hovering over the the connecting lines between transactions and addresses, they dyeit either red if the address functions as input, or blue if it functions as output address.
35
4. Methodology
Figure 4.7: Single Transaction – the big nodes display the addresses and the small nodein the middle the transaction
Figure 4.8: Address Transaction – the address was a sender when the transaction line isred and a receiver if it is blue
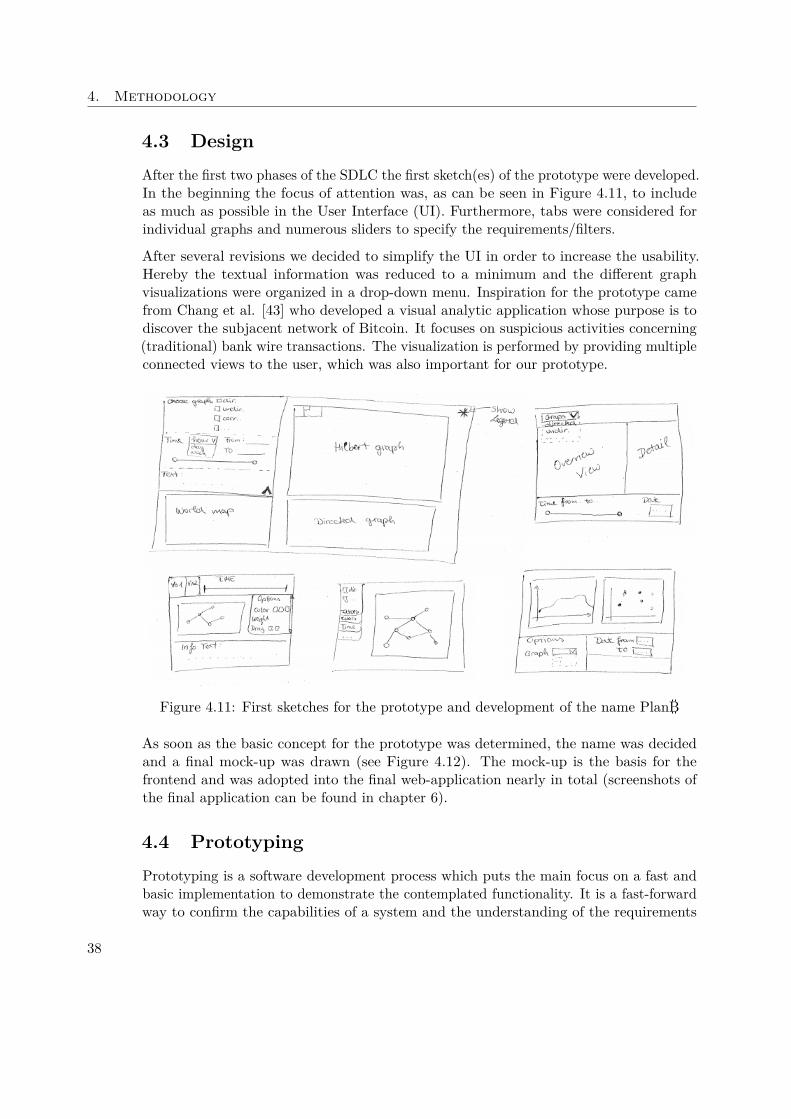
The archipelago was not fully provided in the test version; however, it displayed abar-like chart of the requested data (see Figure 4.9). The graph enables the user to zoominside and click on different transactions. This redirects to another view displaying thetransaction in a line chart. As the visual output, which can be seen in Figure 4.10 and isdescribed in [39], looks different this graph cannot be described in this section.
BlockchainViz is a good way to explore the Blockchain. The viusalization techniques are
36
4.2. Application Walkthroughs
Figure 4.9: Archipelago – result as it was displayed with the test version
Figure 4.10: Archipelago – result as it was displayed with the test version
similar as the same web visualization tool is used. In comparison to PlanB, however, thecorrelation between two addresses is not easy to find and only possible after combiningnumerous filters and the knowledge of the user. Furthermore, BlockChainViz does notprovide a multi-view of graphs on one side as PlanB does.
37
4. Methodology
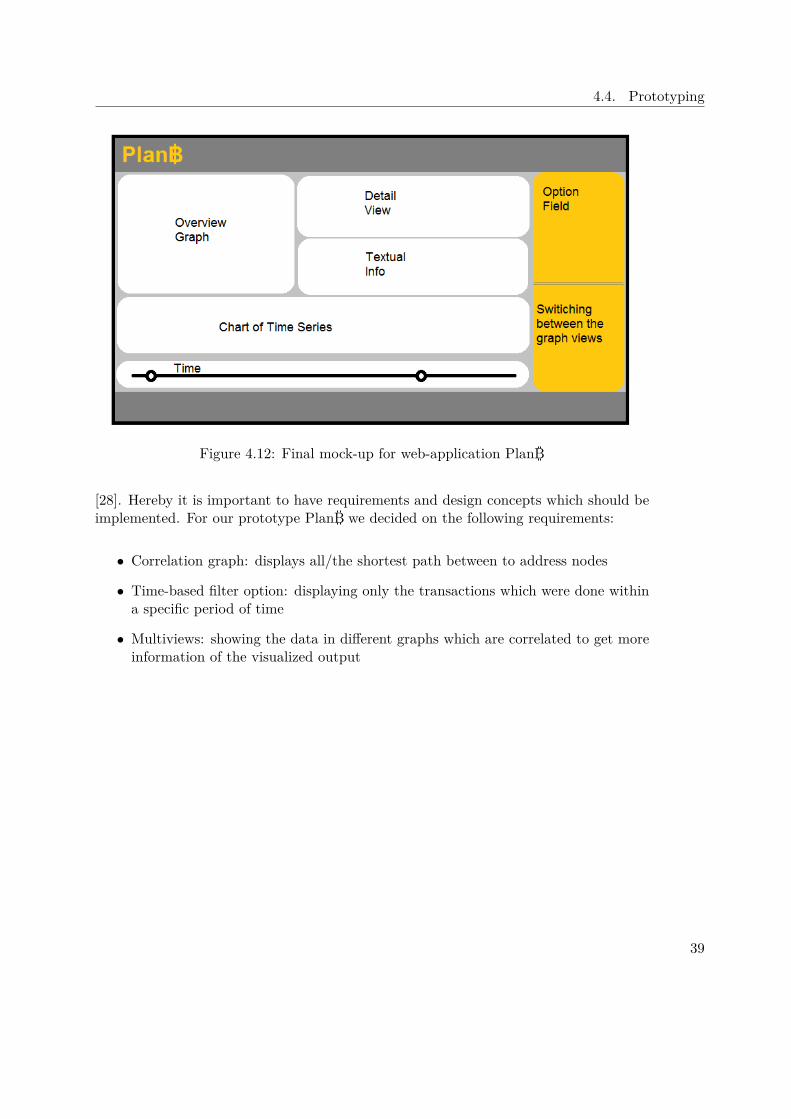
4.3 DesignAfter the first two phases of the SDLC the first sketch(es) of the prototype were developed.In the beginning the focus of attention was, as can be seen in Figure 4.11, to includeas much as possible in the User Interface (UI). Furthermore, tabs were considered forindividual graphs and numerous sliders to specify the requirements/filters.
After several revisions we decided to simplify the UI in order to increase the usability.Hereby the textual information was reduced to a minimum and the different graphvisualizations were organized in a drop-down menu. Inspiration for the prototype camefrom Chang et al. [43] who developed a visual analytic application whose purpose is todiscover the subjacent network of Bitcoin. It focuses on suspicious activities concerning(traditional) bank wire transactions. The visualization is performed by providing multipleconnected views to the user, which was also important for our prototype.
Figure 4.11: First sketches for the prototype and development of the name PlanB
As soon as the basic concept for the prototype was determined, the name was decidedand a final mock-up was drawn (see Figure 4.12). The mock-up is the basis for thefrontend and was adopted into the final web-application nearly in total (screenshots ofthe final application can be found in chapter 6).
4.4 PrototypingPrototyping is a software development process which puts the main focus on a fast andbasic implementation to demonstrate the contemplated functionality. It is a fast-forwardway to confirm the capabilities of a system and the understanding of the requirements
38
4.4. Prototyping
Figure 4.12: Final mock-up for web-application PlanB
[28]. Hereby it is important to have requirements and design concepts which should beimplemented. For our prototype PlanB we decided on the following requirements:
• Correlation graph: displays all/the shortest path between to address nodes
• Time-based filter option: displaying only the transactions which were done withina specific period of time
• Multiviews: showing the data in different graphs which are correlated to get moreinformation of the visualized output
39

CHAPTER 5Implementation Details and
Technologies
A prototype was implemented based on the mock-up and the requirements defined insection 4.4. The prototype provides visualization capabilities for the Bitcoin transactionnetwork. This chapter gives a summary about the implementation and technologicaldetails of PlanB.
5.1 Platform and Architecture
The prototype is implemented on the one hand in Python and on the other hand inwebbased languages such as JavaScript. It is split into two parts: a backend and afrontend. The backend was implemented by Matthias Gusenbauer and will be onlydiscussed very shortly to give a better understanding of the main structure (for furtherdetails see the master thesis of Matthias Gusenbauer, soon to appear). The databaseused to store the complete transaction data available in the Blockchain is the graphbasedsystem Neo4J [21]. For the internal temporary storage and processing of the data (e.g.:path queries and aggregation) the Python based Graph-Tool [22] module is used. Thecommand and data channel is implemented via a websocket by Autobahn [2], whichprovides an open-source implementation of the Web Application Messaging Protocol(WAMP). The connecting link between the backend and the frontend is the Twisted[26] webserver, which is an event-driven networking engine simplifying custom networkapplications.
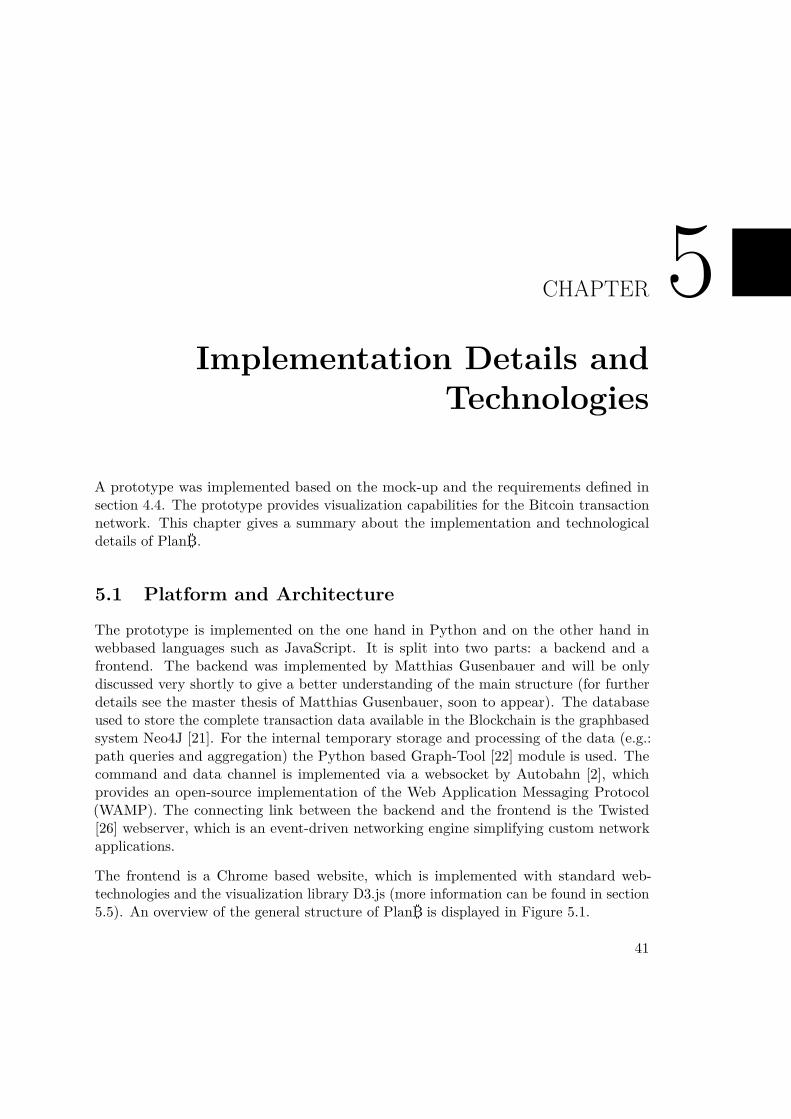
The frontend is a Chrome based website, which is implemented with standard web-technologies and the visualization library D3.js (more information can be found in section5.5). An overview of the general structure of PlanB is displayed in Figure 5.1.
41
5. Implementation Details and Technologies
Figure 5.1: Architecture of PlanB
5.2 Data Format and Structure
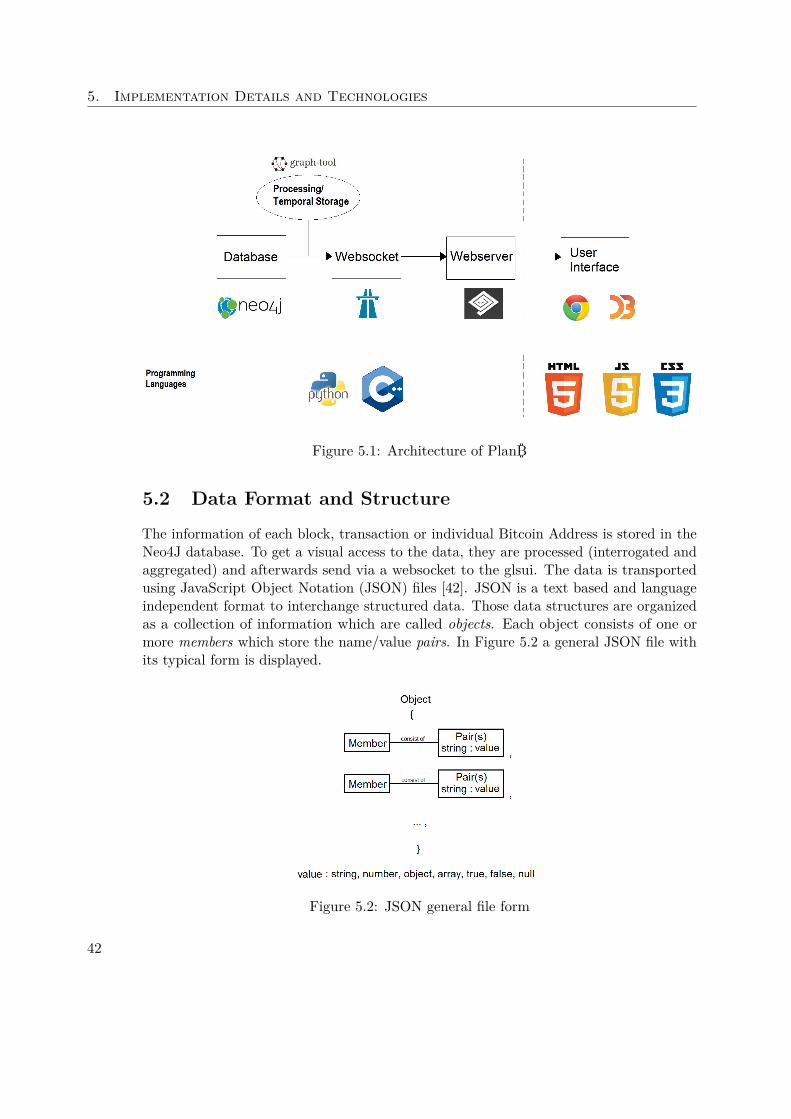
The information of each block, transaction or individual Bitcoin Address is stored in theNeo4J database. To get a visual access to the data, they are processed (interrogated andaggregated) and afterwards send via a websocket to the glsui. The data is transportedusing JavaScript Object Notation (JSON) files [42]. JSON is a text based and languageindependent format to interchange structured data. Those data structures are organizedas a collection of information which are called objects. Each object consists of one ormore members which store the name/value pairs. In Figure 5.2 a general JSON file withits typical form is displayed.
Figure 5.2: JSON general file form
42
5.2. Data Format and Structure
The advantage of JSON in comparisson to XML is a much higher parsing efficiency[31] and its broad usage for web applications. Furthermore it is language independent,however it uses conventions which are familiar to C languages (e.g.: C, C++, C#, Java,Python,...). By using this data format, the frontend and backend are modular and canbe exchanged without having to change the whole structure as JSON is supported by allmodern programming languages [24]. For future implementations it furthermore givesthe user the possibility to store the graph data and simply reload them later on if needed.
PlanB has the following two different JSON file structures:
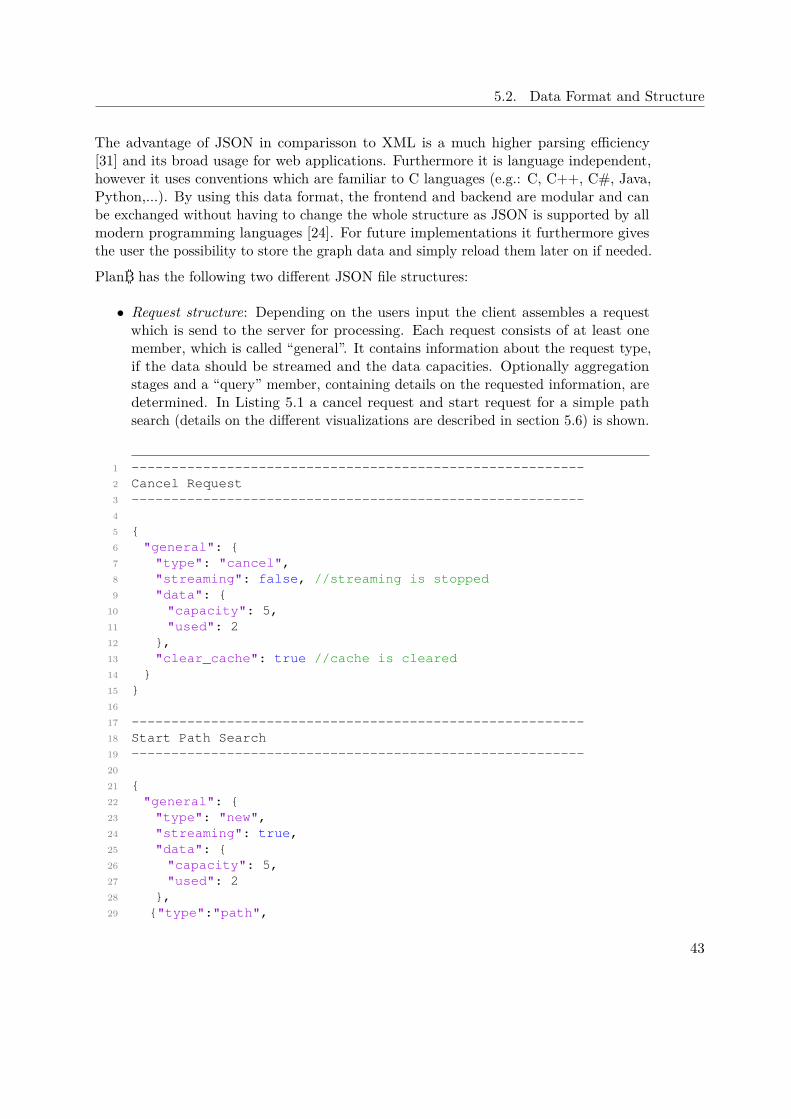
• Request structure: Depending on the users input the client assembles a requestwhich is send to the server for processing. Each request consists of at least onemember, which is called “general”. It contains information about the request type,if the data should be streamed and the data capacities. Optionally aggregationstages and a “query” member, containing details on the requested information, aredetermined. In Listing 5.1 a cancel request and start request for a simple pathsearch (details on the different visualizations are described in section 5.6) is shown.
1 ---------------------------------------------------------2 Cancel Request3 ---------------------------------------------------------45 {6 "general": {7 "type": "cancel",8 "streaming": false, //streaming is stopped9 "data": {
10 "capacity": 5,11 "used": 212 },13 "clear_cache": true //cache is cleared14 }15 }1617 ---------------------------------------------------------18 Start Path Search19 ---------------------------------------------------------2021 {22 "general": {23 "type": "new",24 "streaming": true,25 "data": {26 "capacity": 5,27 "used": 228 },29 {"type":"path",
43
5. Implementation Details and Technologies
30 "truncate":1000,31 "subgraph_labels":["Address","Transaction"],32 "path_type":"all_shortest",33 "start":{34 "label":"Address",35 "params":36 {"hash"://Fill in hash value37 }38 },39 },40 "node":{41 "var":null,42 "label":"Address",43 "params":{"hash"://Fill in hash value44 }45 },46 "coi":null}47 }
Listing 5.1: Example of a cancellation and a path finding request
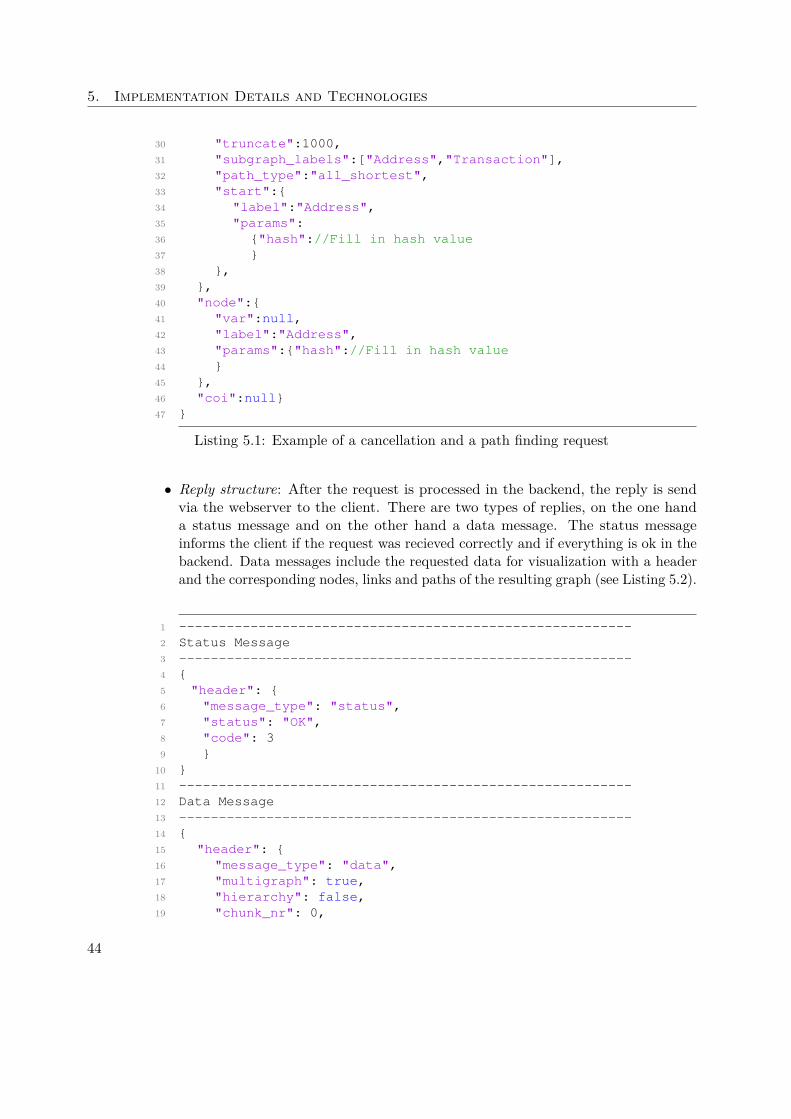
• Reply structure: After the request is processed in the backend, the reply is sendvia the webserver to the client. There are two types of replies, on the one handa status message and on the other hand a data message. The status messageinforms the client if the request was recieved correctly and if everything is ok in thebackend. Data messages include the requested data for visualization with a headerand the corresponding nodes, links and paths of the resulting graph (see Listing 5.2).
1 ---------------------------------------------------------2 Status Message3 ---------------------------------------------------------4 {5 "header": {6 "message_type": "status",7 "status": "OK",8 "code": 39 }
10 }11 ---------------------------------------------------------12 Data Message13 ---------------------------------------------------------14 {15 "header": {16 "message_type": "data",17 "multigraph": true,18 "hierarchy": false,19 "chunk_nr": 0,
44
5.3. Communication
20 "node_types": ["block", "transaction", "address"]21 },22 "nodes": [{"Node information: id, hash, processed, delete,
special-type and type"}],23 "links": [{"Link information of source, target, label and
delete flag"}],24 "paths": [{"Paths which are found"}]25 }
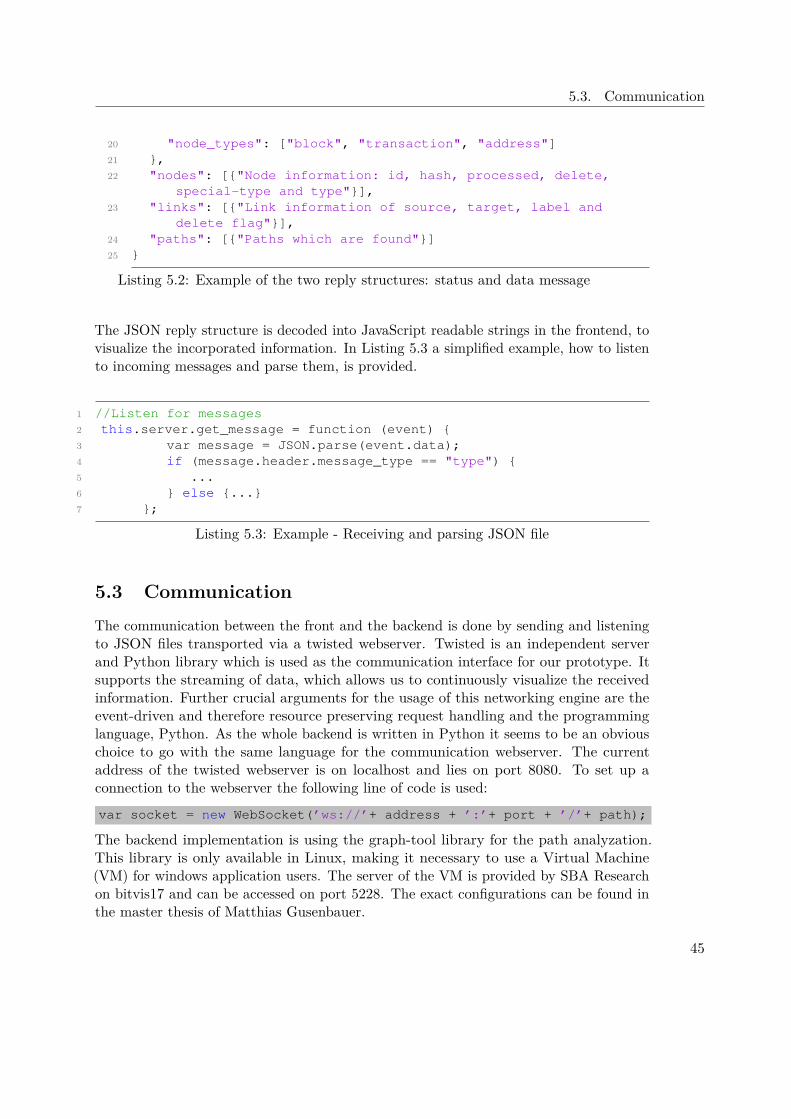
Listing 5.2: Example of the two reply structures: status and data message
The JSON reply structure is decoded into JavaScript readable strings in the frontend, tovisualize the incorporated information. In Listing 5.3 a simplified example, how to listento incoming messages and parse them, is provided.
1 //Listen for messages2 this.server.get_message = function (event) {3 var message = JSON.parse(event.data);4 if (message.header.message_type == "type") {5 ...6 } else {...}7 };
Listing 5.3: Example - Receiving and parsing JSON file
5.3 CommunicationThe communication between the front and the backend is done by sending and listeningto JSON files transported via a twisted webserver. Twisted is an independent serverand Python library which is used as the communication interface for our prototype. Itsupports the streaming of data, which allows us to continuously visualize the receivedinformation. Further crucial arguments for the usage of this networking engine are theevent-driven and therefore resource preserving request handling and the programminglanguage, Python. As the whole backend is written in Python it seems to be an obviouschoice to go with the same language for the communication webserver. The currentaddress of the twisted webserver is on localhost and lies on port 8080. To set up aconnection to the webserver the following line of code is used:
var socket = new WebSocket(’ws://’+ address + ’:’+ port + ’/’+ path);
The backend implementation is using the graph-tool library for the path analyzation.This library is only available in Linux, making it necessary to use a Virtual Machine(VM) for windows application users. The server of the VM is provided by SBA Researchon bitvis17 and can be accessed on port 5228. The exact configurations can be found inthe master thesis of Matthias Gusenbauer.
45
5. Implementation Details and Technologies
5.4 Web IntegrationThe prototype PlanB is implemented as a web-based application in Google Chrome.Although it is possible to access the application from other browsers as well, not allfunctionality can be guaranteed in them.
PlanB references the D3.js library to gain the complete functionality of current visu-alization technologies within the Google Chrome webbrowser. The web integration incombination with D3.js provides the user with the possibility to access the Blockchaindata interactively without being affected by installing further plug-ins as Flash or JavaApplets. The integration to the web browser was intuitively performed by the usage ofhtml, javascript and Cascading Style Sheets (CSS) files.
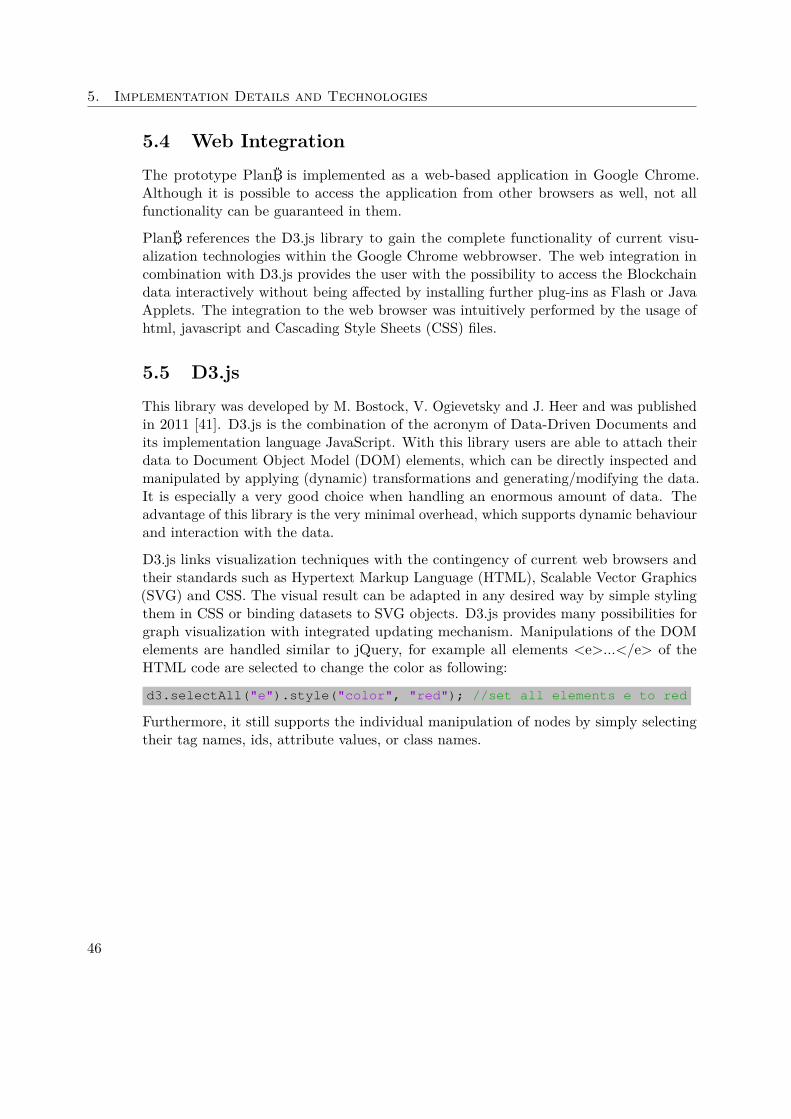
5.5 D3.jsThis library was developed by M. Bostock, V. Ogievetsky and J. Heer and was publishedin 2011 [41]. D3.js is the combination of the acronym of Data-Driven Documents andits implementation language JavaScript. With this library users are able to attach theirdata to Document Object Model (DOM) elements, which can be directly inspected andmanipulated by applying (dynamic) transformations and generating/modifying the data.It is especially a very good choice when handling an enormous amount of data. Theadvantage of this library is the very minimal overhead, which supports dynamic behaviourand interaction with the data.
D3.js links visualization techniques with the contingency of current web browsers andtheir standards such as Hypertext Markup Language (HTML), Scalable Vector Graphics(SVG) and CSS. The visual result can be adapted in any desired way by simple stylingthem in CSS or binding datasets to SVG objects. D3.js provides many possibilities forgraph visualization with integrated updating mechanism. Manipulations of the DOMelements are handled similar to jQuery, for example all elements <e>...</e> of theHTML code are selected to change the color as following:
d3.selectAll("e").style("color", "red"); //set all elements e to red
Furthermore, it still supports the individual manipulation of nodes by simply selectingtheir tag names, ids, attribute values, or class names.
46
5.6. Graphical Output
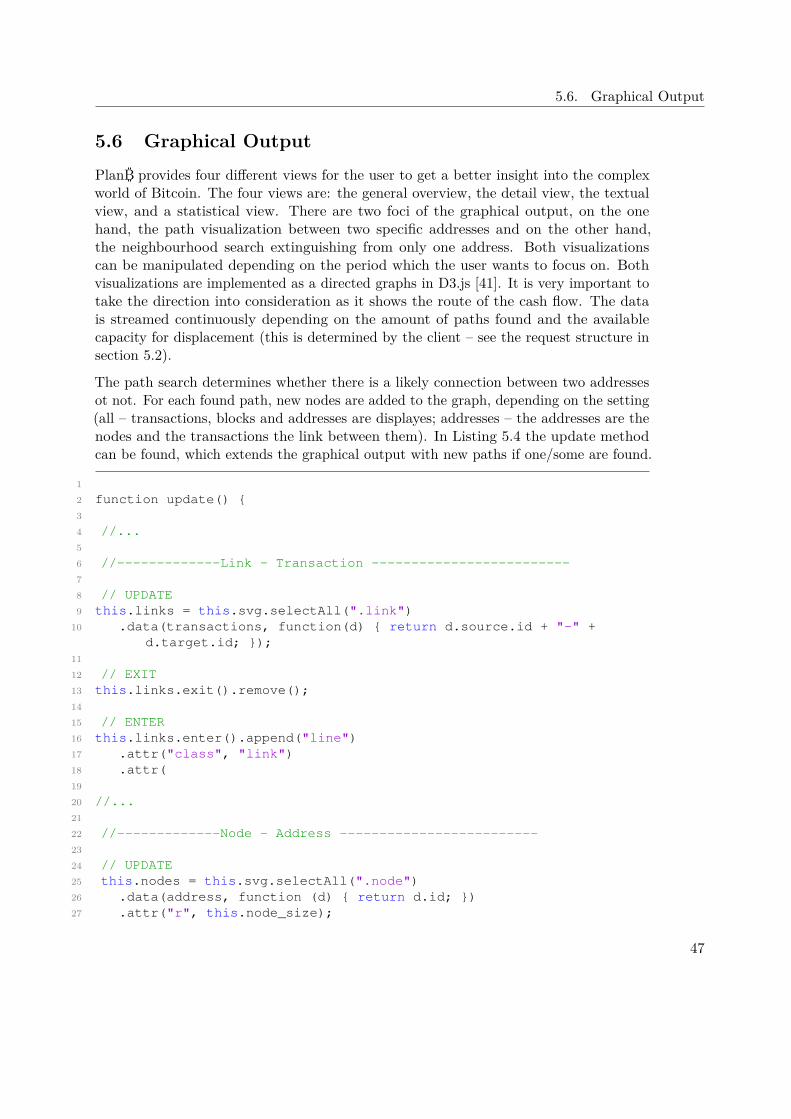
5.6 Graphical OutputPlanB provides four different views for the user to get a better insight into the complexworld of Bitcoin. The four views are: the general overview, the detail view, the textualview, and a statistical view. There are two foci of the graphical output, on the onehand, the path visualization between two specific addresses and on the other hand,the neighbourhood search extinguishing from only one address. Both visualizationscan be manipulated depending on the period which the user wants to focus on. Bothvisualizations are implemented as a directed graphs in D3.js [41]. It is very important totake the direction into consideration as it shows the route of the cash flow. The datais streamed continuously depending on the amount of paths found and the availablecapacity for displacement (this is determined by the client – see the request structure insection 5.2).
The path search determines whether there is a likely connection between two addressesot not. For each found path, new nodes are added to the graph, depending on the setting(all – transactions, blocks and addresses are displayes; addresses – the addresses are thenodes and the transactions the link between them). In Listing 5.4 the update methodcan be found, which extends the graphical output with new paths if one/some are found.
12 function update() {34 //...56 //-------------Link - Transaction -------------------------78 // UPDATE9 this.links = this.svg.selectAll(".link")
10 .data(transactions, function(d) { return d.source.id + "-" +d.target.id; });
1112 // EXIT13 this.links.exit().remove();1415 // ENTER16 this.links.enter().append("line")17 .attr("class", "link")18 .attr(1920 //...2122 //-------------Node - Address -------------------------2324 // UPDATE25 this.nodes = this.svg.selectAll(".node")26 .data(address, function (d) { return d.id; })27 .attr("r", this.node_size);
47
5. Implementation Details and Technologies
2829 // EXIT30 this.nodes.exit().remove();3132 // ENTER33 this.nodes = nodes.enter().append("g")34 .attr("class", "node")35 .attr("stroke", this.address_type)36 .attr("stroke", this.address_type)37 .attr("fill", this.address_color)38 .on("mouseover", mouseover)39 .on("mouseout", mouseout)40 .call(force.drag);4142 //...4344 };
Listing 5.4: Directed graph visualization - simplified version of update method
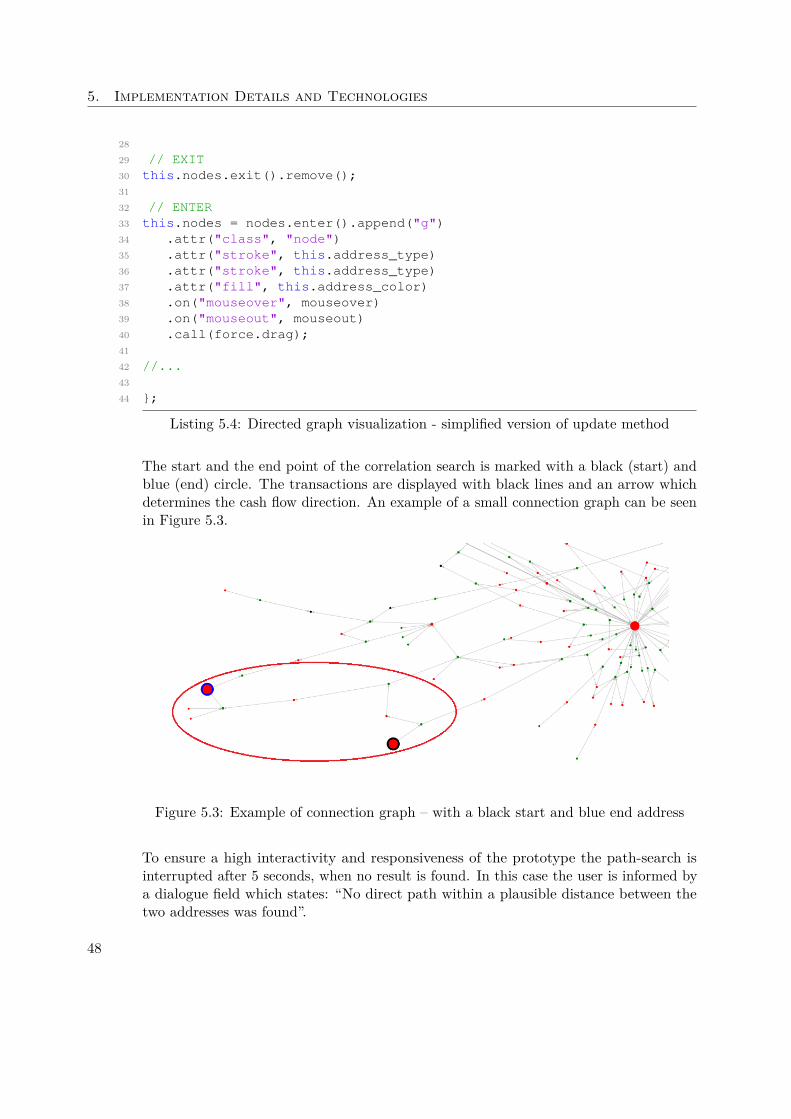
The start and the end point of the correlation search is marked with a black (start) andblue (end) circle. The transactions are displayed with black lines and an arrow whichdetermines the cash flow direction. An example of a small connection graph can be seenin Figure 5.3.
Figure 5.3: Example of connection graph – with a black start and blue end address
To ensure a high interactivity and responsiveness of the prototype the path-search isinterrupted after 5 seconds, when no result is found. In this case the user is informed bya dialogue field which states: “No direct path within a plausible distance between thetwo addresses was found”.
48
5.6. Graphical Output
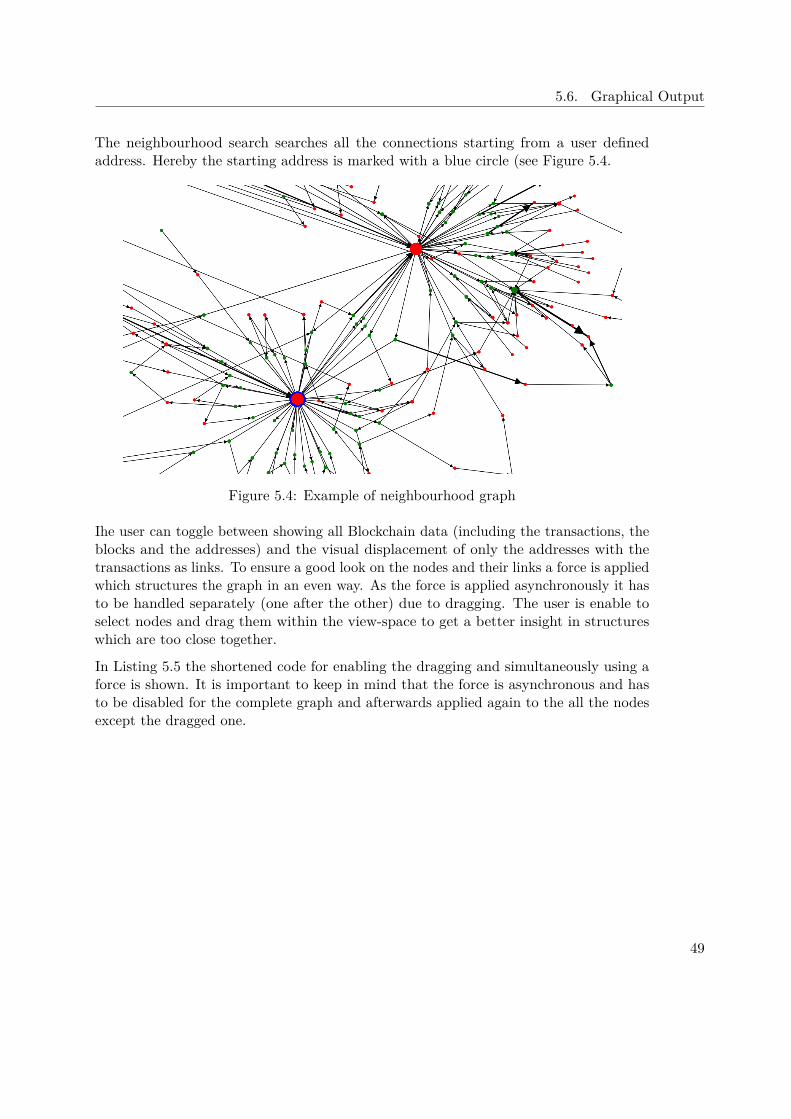
The neighbourhood search searches all the connections starting from a user definedaddress. Hereby the starting address is marked with a blue circle (see Figure 5.4.
Figure 5.4: Example of neighbourhood graph
Ihe user can toggle between showing all Blockchain data (including the transactions, theblocks and the addresses) and the visual displacement of only the addresses with thetransactions as links. To ensure a good look on the nodes and their links a force is appliedwhich structures the graph in an even way. As the force is applied asynchronously it hasto be handled separately (one after the other) due to dragging. The user is enable toselect nodes and drag them within the view-space to get a better insight in structureswhich are too close together.
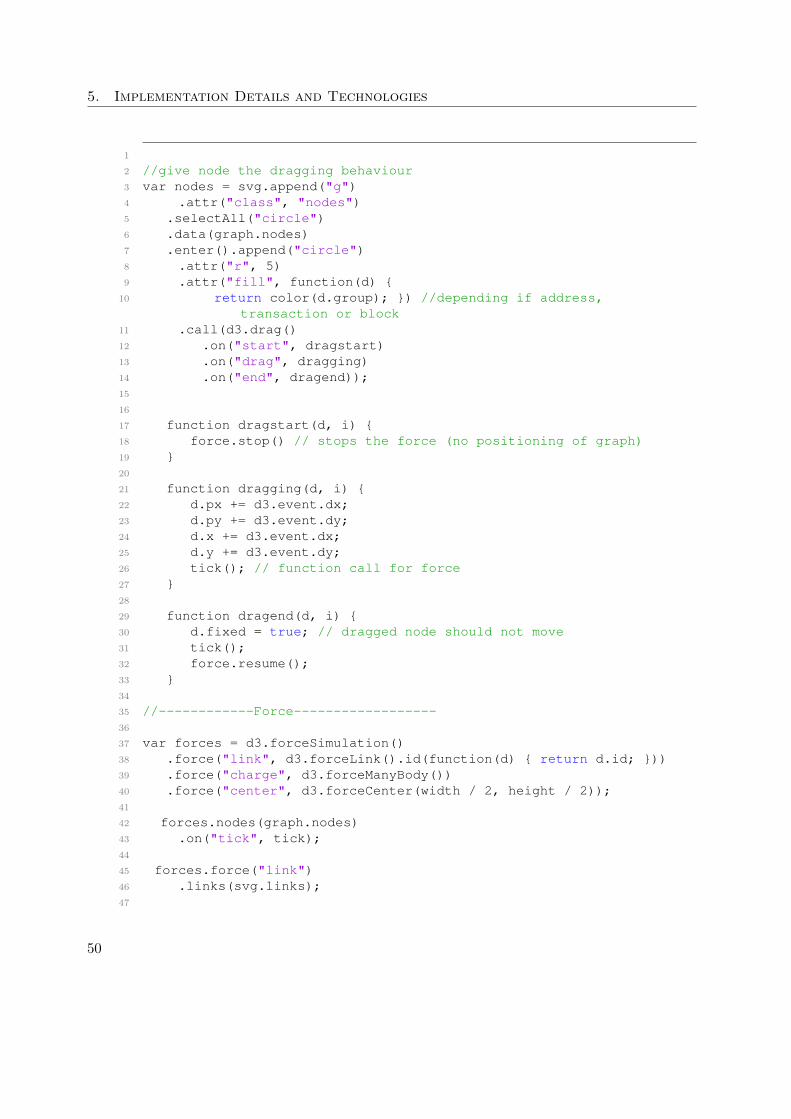
In Listing 5.5 the shortened code for enabling the dragging and simultaneously using aforce is shown. It is important to keep in mind that the force is asynchronous and hasto be disabled for the complete graph and afterwards applied again to the all the nodesexcept the dragged one.
49
5. Implementation Details and Technologies
12 //give node the dragging behaviour3 var nodes = svg.append("g")4 .attr("class", "nodes")5 .selectAll("circle")6 .data(graph.nodes)7 .enter().append("circle")8 .attr("r", 5)9 .attr("fill", function(d) {
10 return color(d.group); }) //depending if address,transaction or block
11 .call(d3.drag()12 .on("start", dragstart)13 .on("drag", dragging)14 .on("end", dragend));151617 function dragstart(d, i) {18 force.stop() // stops the force (no positioning of graph)19 }2021 function dragging(d, i) {22 d.px += d3.event.dx;23 d.py += d3.event.dy;24 d.x += d3.event.dx;25 d.y += d3.event.dy;26 tick(); // function call for force27 }2829 function dragend(d, i) {30 d.fixed = true; // dragged node should not move31 tick();32 force.resume();33 }3435 //------------Force------------------3637 var forces = d3.forceSimulation()38 .force("link", d3.forceLink().id(function(d) { return d.id; }))39 .force("charge", d3.forceManyBody())40 .force("center", d3.forceCenter(width / 2, height / 2));4142 forces.nodes(graph.nodes)43 .on("tick", tick);4445 forces.force("link")46 .links(svg.links);47
50
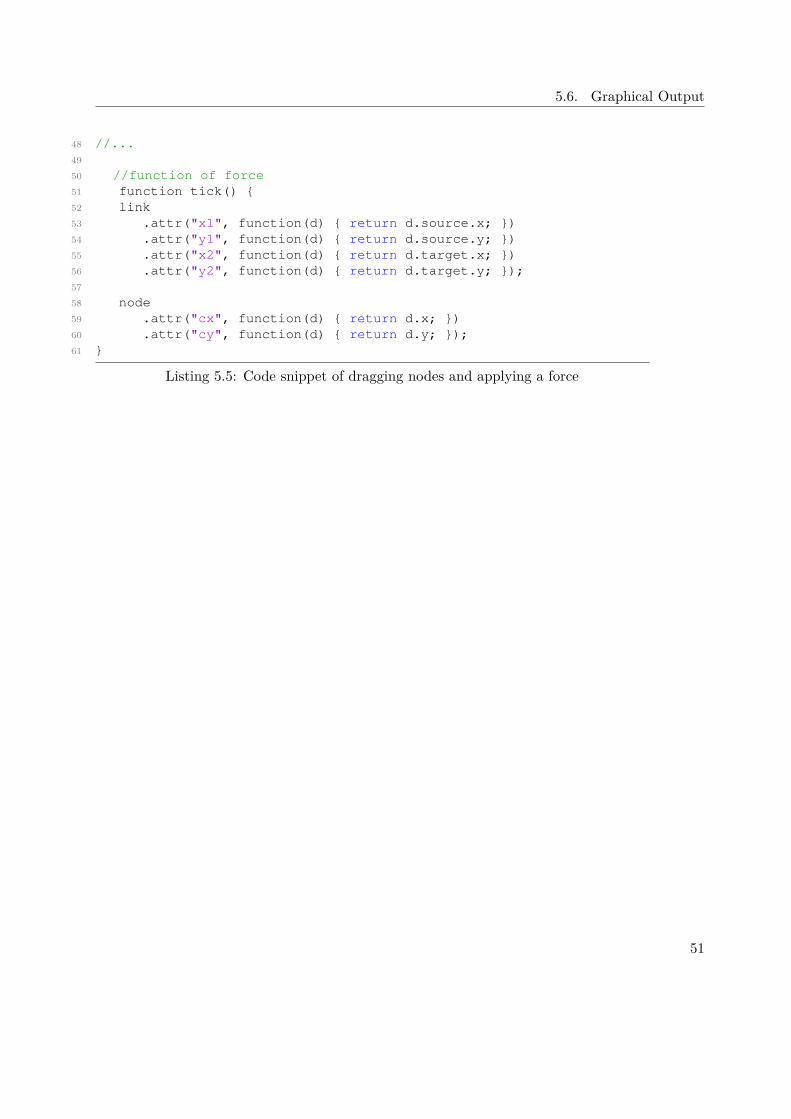
5.6. Graphical Output
48 //...4950 //function of force51 function tick() {52 link53 .attr("x1", function(d) { return d.source.x; })54 .attr("y1", function(d) { return d.source.y; })55 .attr("x2", function(d) { return d.target.x; })56 .attr("y2", function(d) { return d.target.y; });5758 node59 .attr("cx", function(d) { return d.x; })60 .attr("cy", function(d) { return d.y; });61 }
Listing 5.5: Code snippet of dragging nodes and applying a force
51

CHAPTER 6Results
The visualization approaches (section 5.6), as mentioned before, were implemented as aweb-based prototype using D3.js [41]. In order to provide the user with meaningful andeasy to interpret results, detail views and different visualization techniques were testedand added/replaced during the development process. This iterative process helped toimprove the prototype continuously. To proof the visual outputs, small test scenarioswere set up too.
In the beginning the test scenarios were set up according to information which can befound on Blockchain.info [15]. Next those scenarios were tested with our prototype toproof the functioning work-flow and the correctness of the results. Afterwards multi-viewswere set up to provide a closer look into specific details of the result(s). The last featureof PlanB is the time-based parallel coordinate plot to get a completely novel view of theBitcoin block data. The following sections describe how the prototype was tested and itsfinal appearance with a prototype walkthrough.
6.1 TestingThe test scenarios were set up to provide feedback of the correct functionality of PlanB.Several small tests were performed which could be verified manually. Following a shortdescription of one test scenario is provided to give a insight in the testing process.
To get a meaningful path test the start address was selected radomly and the end addresswas determined by research. The research was performed on Blockchain.info [15], byfollowing a short path manually, with a predefined length (between two to 5 nodes inbetween), leading to the test end address.
53
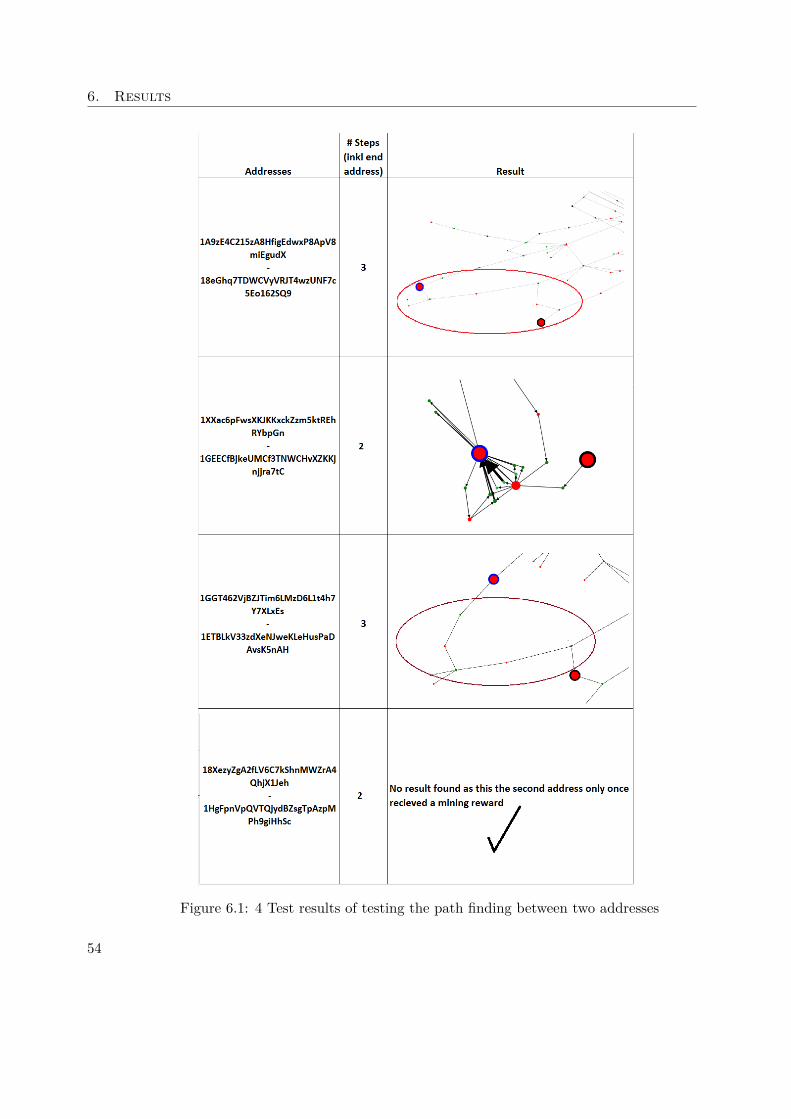
6. Results
Figure 6.1: 4 Test results of testing the path finding between two addresses
54
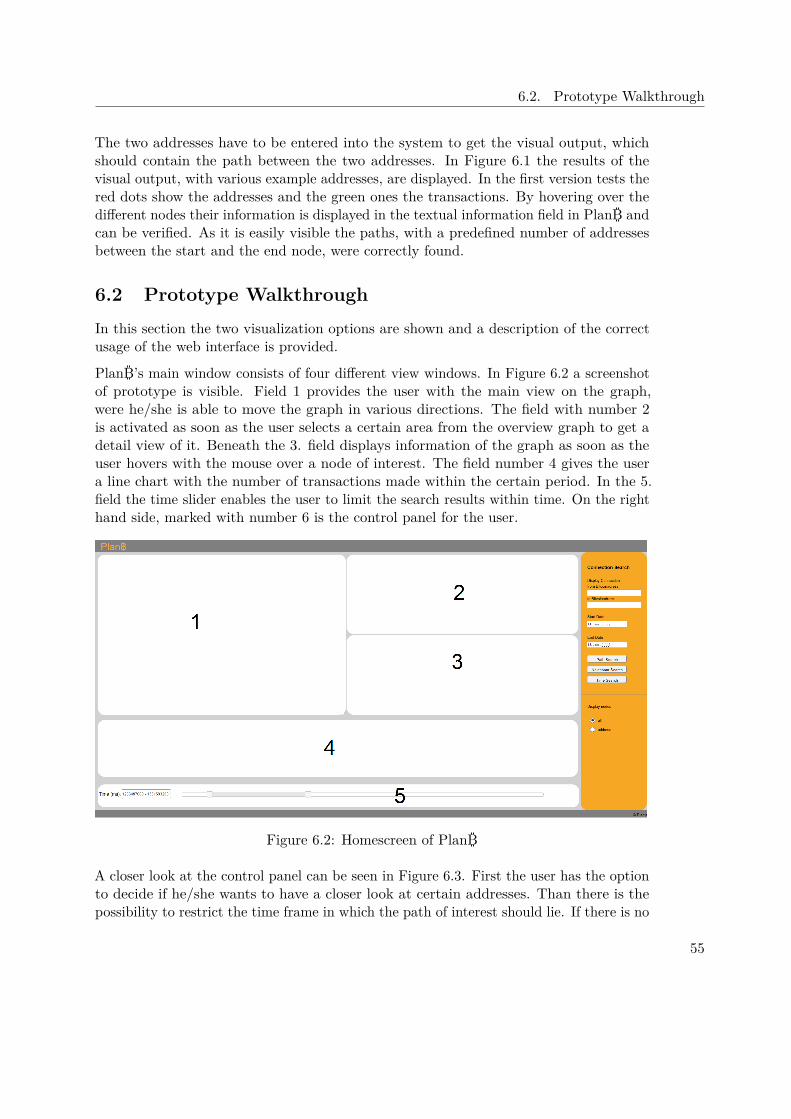
6.2. Prototype Walkthrough
The two addresses have to be entered into the system to get the visual output, whichshould contain the path between the two addresses. In Figure 6.1 the results of thevisual output, with various example addresses, are displayed. In the first version tests thered dots show the addresses and the green ones the transactions. By hovering over thedifferent nodes their information is displayed in the textual information field in PlanB andcan be verified. As it is easily visible the paths, with a predefined number of addressesbetween the start and the end node, were correctly found.
6.2 Prototype WalkthroughIn this section the two visualization options are shown and a description of the correctusage of the web interface is provided.
PlanB’s main window consists of four different view windows. In Figure 6.2 a screenshotof prototype is visible. Field 1 provides the user with the main view on the graph,were he/she is able to move the graph in various directions. The field with number 2is activated as soon as the user selects a certain area from the overview graph to get adetail view of it. Beneath the 3. field displays information of the graph as soon as theuser hovers with the mouse over a node of interest. The field number 4 gives the usera line chart with the number of transactions made within the certain period. In the 5.field the time slider enables the user to limit the search results within time. On the righthand side, marked with number 6 is the control panel for the user.
Figure 6.2: Homescreen of PlanB
A closer look at the control panel can be seen in Figure 6.3. First the user has the optionto decide if he/she wants to have a closer look at certain addresses. Than there is thepossibility to restrict the time frame in which the path of interest should lie. If there is no
55
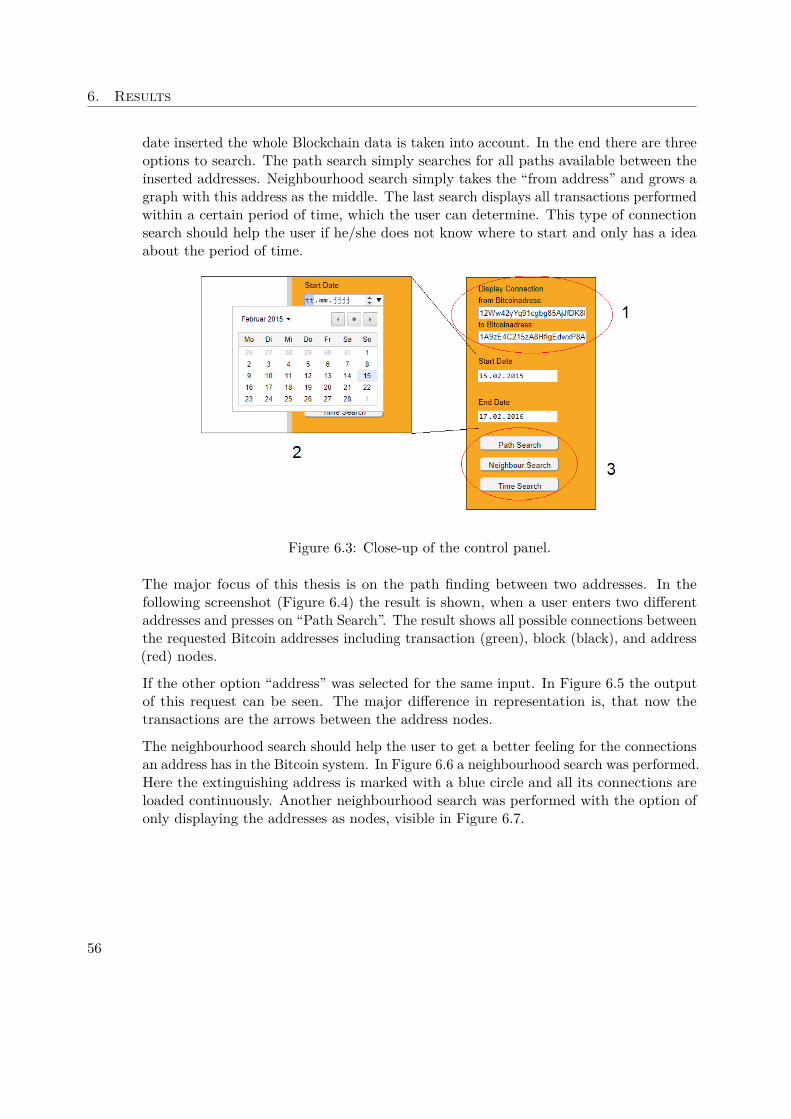
6. Results
date inserted the whole Blockchain data is taken into account. In the end there are threeoptions to search. The path search simply searches for all paths available between theinserted addresses. Neighbourhood search simply takes the “from address” and grows agraph with this address as the middle. The last search displays all transactions performedwithin a certain period of time, which the user can determine. This type of connectionsearch should help the user if he/she does not know where to start and only has a ideaabout the period of time.
Figure 6.3: Close-up of the control panel.
The major focus of this thesis is on the path finding between two addresses. In thefollowing screenshot (Figure 6.4) the result is shown, when a user enters two differentaddresses and presses on “Path Search”. The result shows all possible connections betweenthe requested Bitcoin addresses including transaction (green), block (black), and address(red) nodes.
If the other option “address” was selected for the same input. In Figure 6.5 the outputof this request can be seen. The major difference in representation is, that now thetransactions are the arrows between the address nodes.
The neighbourhood search should help the user to get a better feeling for the connectionsan address has in the Bitcoin system. In Figure 6.6 a neighbourhood search was performed.Here the extinguishing address is marked with a blue circle and all its connections areloaded continuously. Another neighbourhood search was performed with the option ofonly displaying the addresses as nodes, visible in Figure 6.7.
56
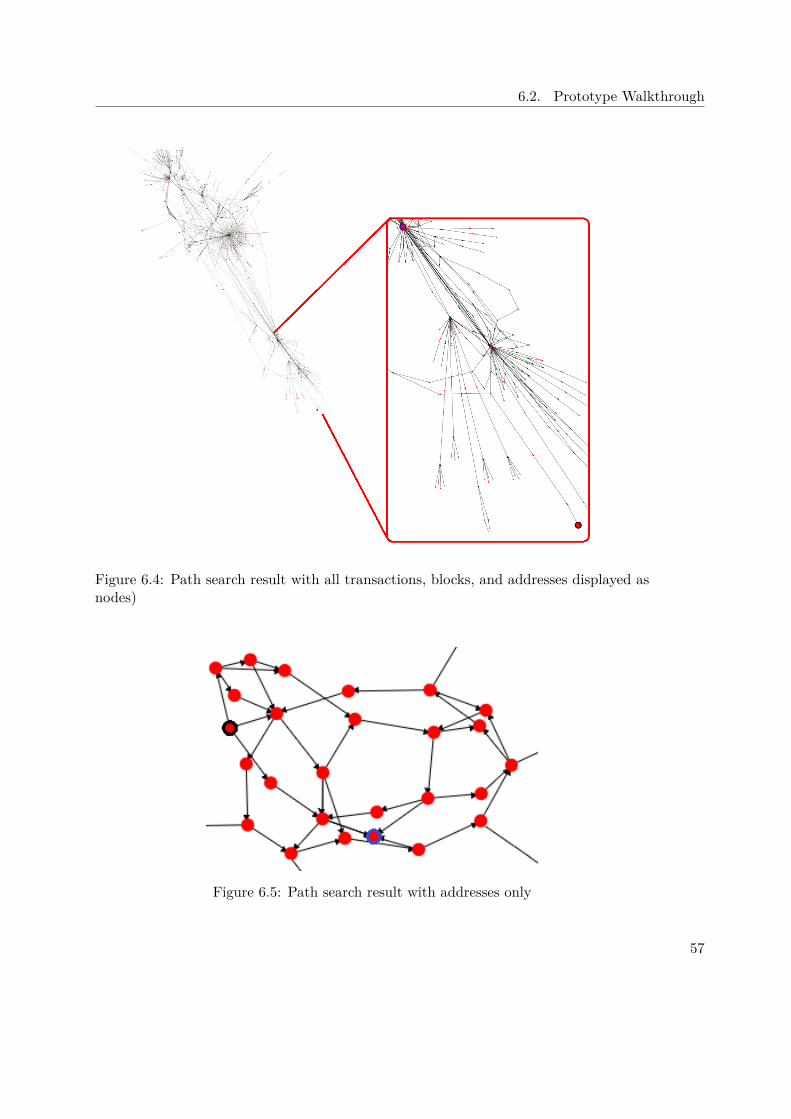
6.2. Prototype Walkthrough
Figure 6.4: Path search result with all transactions, blocks, and addresses displayed asnodes)
Figure 6.5: Path search result with addresses only
57
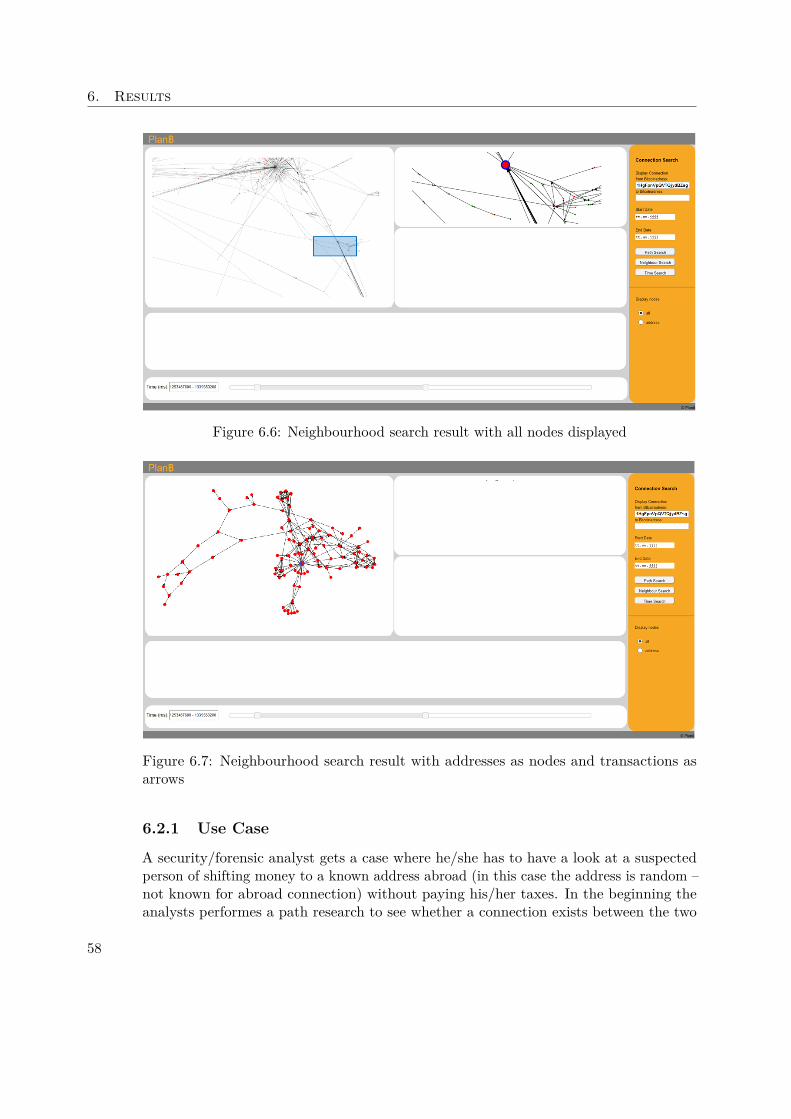
6. Results
Figure 6.6: Neighbourhood search result with all nodes displayed
Figure 6.7: Neighbourhood search result with addresses as nodes and transactions asarrows
6.2.1 Use Case
A security/forensic analyst gets a case where he/she has to have a look at a suspectedperson of shifting money to a known address abroad (in this case the address is random –not known for abroad connection) without paying his/her taxes. In the beginning theanalysts performes a path research to see whether a connection exists between the two
58
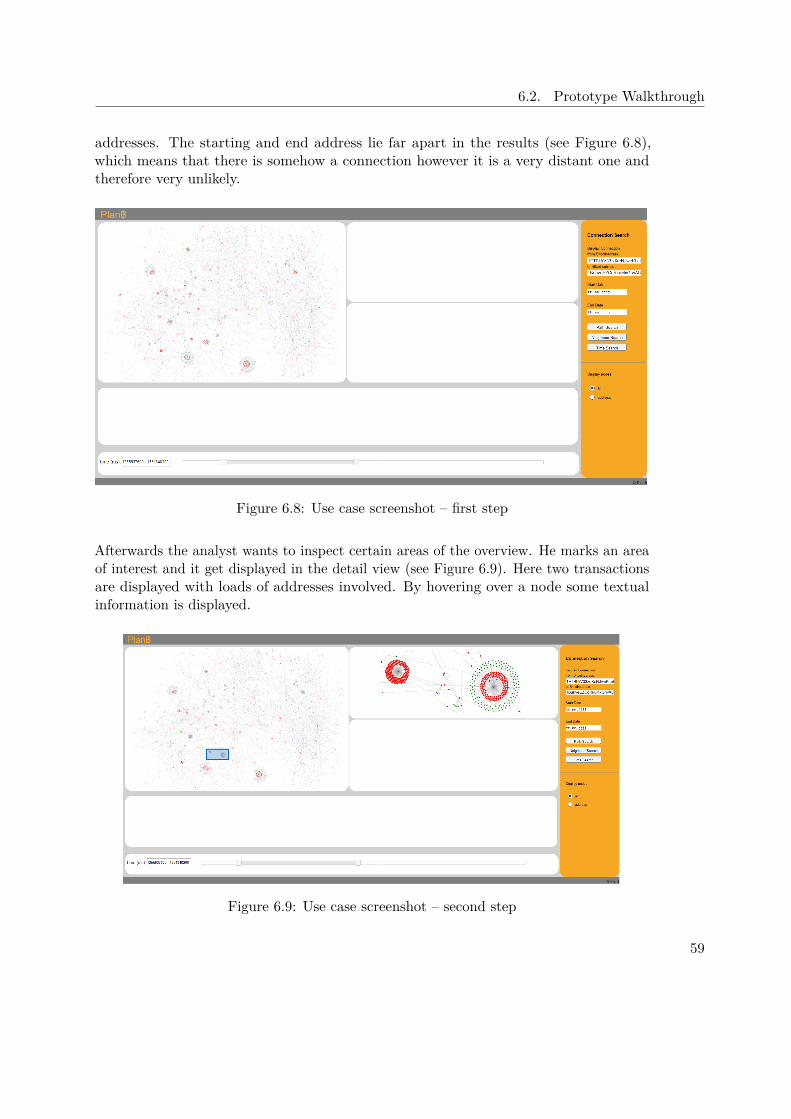
6.2. Prototype Walkthrough
addresses. The starting and end address lie far apart in the results (see Figure 6.8),which means that there is somehow a connection however it is a very distant one andtherefore very unlikely.
Figure 6.8: Use case screenshot – first step
Afterwards the analyst wants to inspect certain areas of the overview. He marks an areaof interest and it get displayed in the detail view (see Figure 6.9). Here two transactionsare displayed with loads of addresses involved. By hovering over a node some textualinformation is displayed.
Figure 6.9: Use case screenshot – second step
59
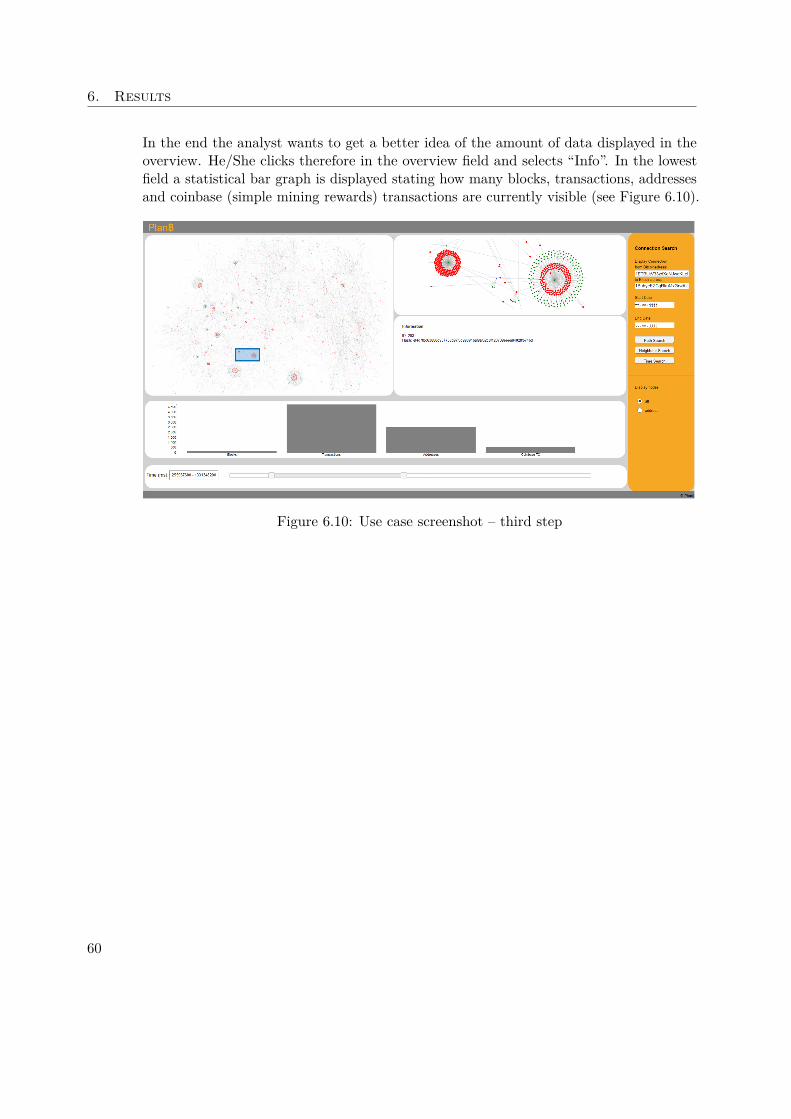
6. Results
In the end the analyst wants to get a better idea of the amount of data displayed in theoverview. He/She clicks therefore in the overview field and selects “Info”. In the lowestfield a statistical bar graph is displayed stating how many blocks, transactions, addressesand coinbase (simple mining rewards) transactions are currently visible (see Figure 6.10).
Figure 6.10: Use case screenshot – third step
60
CHAPTER 7Discussion and Conclusion
The following chapter summarizes the results of our approach. It critically reflects theoutcome and discusses the limitations. Some final thoughts and planned future extensionsof the prototype are provided at the end of this chapter.
7.1 Critical Reflection
The introduced prototype is a novel approach for visualizing the connection of transactionswithin the network of Bitcoin. PlanB is a web-based prototype (Google Chrome), makingit easy to access and to extend for further usages. Its interactivity enables the userto take a closer look at regions of interest and get statistical outputs on the displayedgraph. To guarantee an optimal graphical output for the user the prototype gives theuser the opportunity to drag the nodes of the graphs. Furthermore, textual informationis provided when hovering over the nodes.
The advantage of continuously streaming the data, is the avoidance of long waitingperiods for the user. The streamed data is immediately shown in the user interface and isupdated continuously. On the opposite site, however is the time which has to be waiteduntil all the data is loaded. Furthermore there is no visual output, how much informationis already loaded and how much is left, as it is hard to determine.
The backend is corrently unfinished leading to some method lacks (sometimes). As it iscontinuously updated and expanded (request, aggregation and unfinished Blockchain data-loading) the frontend often also needs to be updated for the new features. The completebackend is implemented in a Linux environment making it necessary to connect to it viaa virtual machine. A stable version of the prototype will be released approximately inthe beginning of summer as an open source project on github.
61
7. Discussion and Conclusion
7.2 LimitationsAlthough PlanB provides a good basis to get an insight of the connections betweenaddresses, it has some limitations. The graph representation of the path search providesthe user with multiple arrows, displaying the cash flow. Multiple transactions betweentwo nodes are represented as one path arrow (overlaying each other). Therefore, it is hardto determine how many transaction have been made between two addresses, however infavour of a better (not too crowded) visual output we merged them.
Another shortage of the prototype is the textual output in address display mode, it onlyprovides information about the node (address). The transaction information is neglected,however in the view displaying all nodes the information is accessible. In general thetextual output is under inspection, to determine better ways for the representation.
The path search has two major limitations, on the one hand the limited time and on theother hand the “likeliest” path is not determined. As we fixed a time limit for the pathsearch it can happen that no path is shown although there would be a connection. Thelikelihood of a found path is not determined and therefore only the cash flow is takeninto consideration if a path is displayed or not.
7.3 Future WorkThere are still many possibilities to utilize the Blockchain network in new ways. Thereforewe plan to further improve and expand the prototype PlanB.
The first feature extension we plan to implement is a likelihood analysis with moreparameters. Hereby, the transaction amounts, the transaction fees and the distanceshould be taken into account. Ongoing we plan to implement a machine learning algorithmfor pattern detection which semi-automatically detects mixing services and/or suspiciousactivities.
As mentioned above a stable release version of the complete prototype is planned tobe published by the beginning of summer as an open source project. This open sourceversion should give Bitcoin users the opportunity to see the pseudo-anonymity of theircryptocurrency usage. In the best case it can be used from security experts as well asnon-expert users to inspect the Bitcoin system and take it as a basis for further research.
62
7.4. Conclusion
7.4 ConclusionCryptocurrencies became very popular within the recent years, especially because of thetremendous ups and downs of Bitcoin. The increase in Many people still believe in theanonymity of this cryptocurrency [57]. Although there are many concepts and prototypesfor visualizing the Bitcoin network, none of them focuses on the automatic path findingand the connections of addresses.
With our prototype PlanB we want to show that Bitcoin is only pseudo-anonymous andcan be tracked back until the first transaction. It combines visual and textual informationabout the data stored in the Blockchain. The data can be visualized and restrictedto a period of interest from the user. The goal of this prototype is to provide a basisfor further investigations of the paths and suspicious activities within the transactionnetwork of Bitcoin.
63

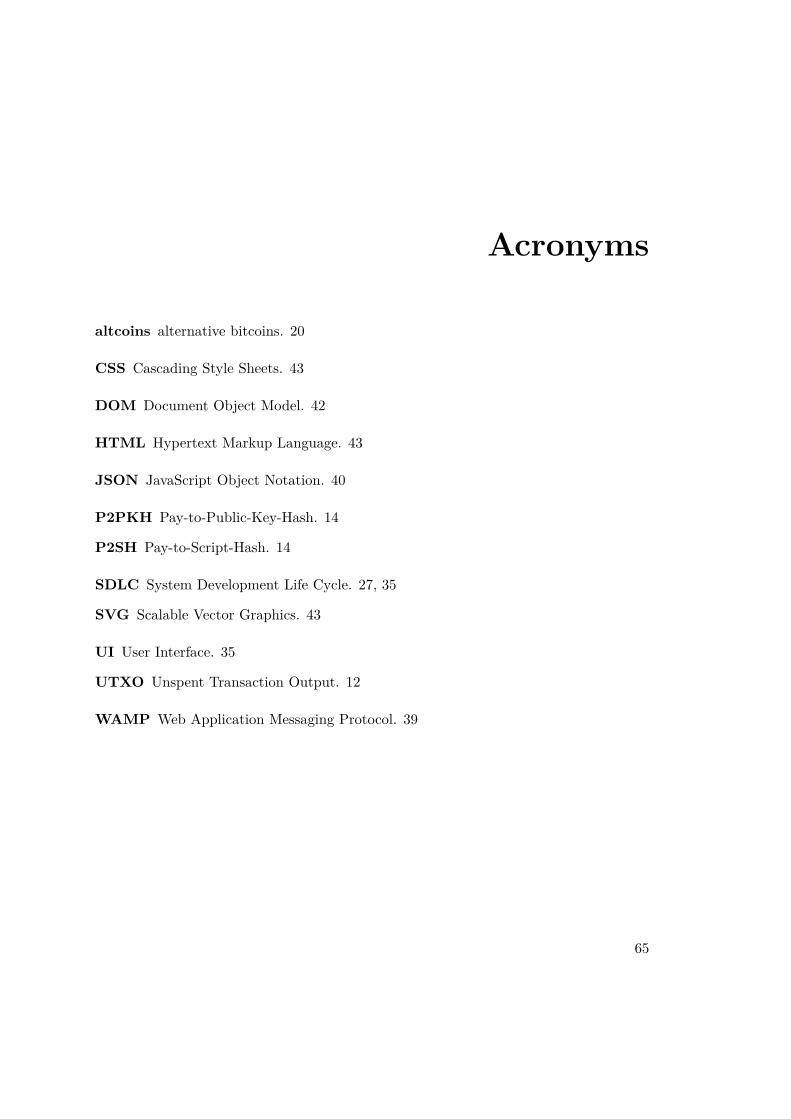
Acronyms
altcoins alternative bitcoins. 20
CSS Cascading Style Sheets. 43
DOM Document Object Model. 42
HTML Hypertext Markup Language. 43
JSON JavaScript Object Notation. 40
P2PKH Pay-to-Public-Key-Hash. 14
P2SH Pay-to-Script-Hash. 14
SDLC System Development Life Cycle. 27, 35
SVG Scalable Vector Graphics. 43
UI User Interface. 35
UTXO Unspent Transaction Output. 12
WAMP Web Application Messaging Protocol. 39
65

Bibliography
[1] 7 bitcoin scams you need to be aware of. https://btcmanager.com/7-bitcoin-scams-you-need-to-be-aware-of/. Accessed: 2017-12-14.
[2] Autobahn. https://crossbar.io/autobahn/. Accessed: 2017-12-09.
[3] Bip16. https://github.com/bitcoin/bips/blob/master/bip-0016.mediawiki. Accessed: 2017-10-15.
[4] Bip30. https://github.com/bitcoin/bips/blob/master/bip-0030.mediawiki. Accessed: 2017-10-15.
[5] Bip34. https://github.com/bitcoin/bips/blob/master/bip-0034.mediawiki. Accessed: 2017-10-15.
[6] Bip50. https://github.com/bitcoin/bips/blob/master/bip-0050.mediawiki. Accessed: 2017-10-15.
[7] Bitcoin - developer guide. https://bitcoin.org/en/developer-guide. Ac-cessed: 2017-10-21.
[8] Bitcoin currency and gpu mining performance compari-son. https://www.pcper.com/reviews/Graphics-Cards/Bitcoin-Currency-and-GPU-Mining-Performance-Comparison/Bitcoin-Mining. Accessed: 2017-10-24.
[9] Bitcoin legal status. https://www.slideshare.net/earthsite/bitcoin-101-the-currency-the-network-the-community. Accessed:2017-11-08.
[10] Bitcoin transaction types. https://www.cryptocompare.com/coins/guides/what-are-the-bitcoin-transaction-types/. Accessed: 2017-10-15.
[11] Bitcoin (usd) price. https://www.coindesk.com/price/. Accessed: 2017-09-02.
67
[12] Bitcoin wallet. https://en.bitcoinwiki.org/wiki/Bitcoin_wallet?mobileaction=toggle_view_desktop. Accessed: 2017-10-29.
[13] Bitcoin: Why is it prone to criminal activity? https://lawstreetmedia.com/news/bitcoin-why-is-it-prone-to-criminal-activity/. Accessed:2017-12-14.
[14] Block size limit controversy. https://en.bitcoin.it/wiki/Block_size_limit_controversy. Accessed: 2017-10-15.
[15] Blockchain.info. https://blockchain.info/. Accessed: 2017-10-24.
[16] Coinjoin. https://en.bitcoin.it/wiki/CoinJoin. Accessed: 2017-28-08.
[17] Cryptocurrency market capitalizations. https://coinmarketcap.com/coins/views/all/. Accessed: 2017-12-18.
[18] The free dictionary - visualization. https://www.thefreedictionary.com/visualization. Accessed: 2017-12-10.
[19] Genesis block. https://de.bitcoin.it/wiki/Genesis_Block. Accessed:2017-11-08.
[20] Global bitcoin nodes distribution. https://bitnodes.21.co/?__hstc=210446858.27ba77eb7687b824ac934c5ce03566ce.1485428753060.1485428753060.1485428753060.1&__hssc=210446858.2.1485428753060&__hsfp=2180031853 and https://bitnodes.21.co/nodes/live-map/visited10th. Accessed: 2017-08-07.
[21] Graph database. https://neo4j.com/. Accessed: 2017-11-09.
[22] Graph-tool. https://graph-tool.skewed.de/. Accessed: 2017-12-09.
[23] Historical price data bitoin. https://www.coindesk.com/price/. Accessed:2017-22-08.
[24] Introducing json. https://json.org/. Accessed: 2017-12-09.
[25] One of the largest bitcoin mixing services closes its doors. https://news.bitcoin.com/one-of-the-largest-bitcoin-mixing-services-closes-its-doors/.Accessed: 2017-12-14.
[26] Twisted. https://twistedmatrix.com/trac/. Accessed: 2017-12-09.
[27] Visualization of bitcoin transactions. http://dailyblockchain.github.io/?__hstc=210446858.27ba77eb7687b824ac934c5ce03566ce.1485428753060.1485428753060.1485428753060.1&__hssc=210446858.2.1485428753060&__hsfp=2180031853. Accessed: 2017-08-07.
68
[28] What is a prototyping methodology? http://www.information-management-architect.com/prototyping-methodology.html. Accessed: 2017-11-09.
[29] What is blockchain technology. https://blockgeeks.com/guides/what-is-blockchain-technology/. Accessed: 2017-10-21.
[30] X11. https://dashpay.atlassian.net/wiki/spaces/DOC/pages/1146918/X11. Accessed: 2017-28-08.
[31] Kereshmeh Afsari, Charles M Eastman, and Daniel Castro-Lacouture. Javascriptobject notation (json) data serialization for ifc schema in web-based bim dataexchange. Automation in Construction, 77:24–51, 2017.
[32] ShaikShakeel Ahamad, Madhusoodhnan Nair, and Biju Varghese. A survey oncrypto currencies. In 4th International Conference on Advances in Computer Science,AETACS, pages 42–48, 2013.
[33] Brais Alvarez-Pereira, Matthew Ayres, Ana María Gomez Lopez, Shai Gorsky, SeanHayes, Zhi Qiao, and Jessica Santana. Network and conversation analyses of bitcoin.
[34] Elli Androulaki, Ghassan O Karame, Marc Roeschlin, Tobias Scherer, and SrdjanCapkun. Evaluating user privacy in bitcoin. In International Conference on FinancialCryptography and Data Security, pages 34–51. Springer, 2013.
[35] Marcella Atzori. Blockchain technology and decentralized governance: Is the statestill necessary? 2015.
[36] Asaph Azaria, Ariel Ekblaw, Thiago Vieira, and Andrew Lippman. Medrec: Usingblockchain for medical data access and permission management. In Open and BigData (OBD), International Conference on, pages 25–30. IEEE, 2016.
[37] Annika Baumann, Benjamin Fabian, and Matthias Lischke. Exploring the bitcoinnetwork. In WEBIST (1), pages 369–374, 2014.
[38] Martí Berini Sarrias. Bitcoin network simulator data explotation. Master’s thesis,Universitat Oberta de Catalunya, 2015.
[39] Stefano Bistarelli and Francesco Santini. Go with the-bitcoin-flow, with visualanalytics. In Proceedings of the 12th International Conference on Availability,Reliability and Security, page 38. ACM, 2017.
[40] Joseph Bonneau, Andrew Miller, Jeremy Clark, Arvind Narayanan, Joshua A Kroll,and Edward W Felten. Sok: Research perspectives and challenges for bitcoin andcryptocurrencies. In Security and Privacy (SP), 2015 IEEE Symposium on, pages104–121. IEEE, 2015.
69
[41] Michael Bostock, Vadim Ogievetsky, and Jeffrey Heer. D3: Data-driven documents.IEEE Trans. Visualization & Comp. Graphics (Proc. InfoVis), 2011.
[42] Tim Bray. The javascript object notation (json) data interchange format. 2017.
[43] Remco Chang, Mohammad Ghoniem, Robert Kosara, William Ribarsky, Jing Yang,Evan Suma, Caroline Ziemkiewicz, Daniel Kern, and Agus Sudjianto. Wirevis:Visualization of categorical, time-varying data from financial transactions. In VisualAnalytics Science and Technology, 2007. VAST 2007. IEEE Symposium on, pages155–162. IEEE, 2007.
[44] Usman W Chohan. A history of bitcoin. 2017.
[45] David Lee Kuo Chuen. Handbook of digital currency: Bitcoin, innovation, financialinstruments, and big data. Academic Press, 2015.
[46] Michael Crosby, Pradan Pattanayak, Sanjeev Verma, and Vignesh Kalyanaraman.Blockchain technology: Beyond bitcoin. Applied Innovation, 2:6–10, 2016.
[47] Giuseppe Di Battista, Valentino Di Donato, Maurizio Patrignani, Maurizio Pizzonia,Vincenzo Roselli, and Roberto Tamassia. Bitconeview: visualization of flows in thebitcoin transaction graph. In Visualization for Cyber Security (VizSec), 2015 IEEESymposium on, pages 1–8. IEEE, 2015.
[48] Evan Duffield and Kyle Hagan. Darkcoin: Peertopeer cryptocurrencywith anonymous blockchain transactions and an improved proofofwork sys-tem. Mar-2014 [Online]. Available: https://www. dash. org/wpcontent/u-ploads/2014/09/DarkcoinWhitepaper. pdf.[Accessed: 21-Sep-2016], 2014.
[49] Danno Ferrin. A preliminary field guide for bitcoin transaction patterns. In Proc.Texas Bitcoin Conf, 2015.
[50] Florian Glaser, Kai Zimmermann, Martin Haferkorn, Moritz Christian Weber, andMichael Siering. Bitcoin-asset or currency? revealing users’ hidden intentions. 2014.
[51] Alex Greaves and Benjamin Au. Using the bitcoin transaction graph to predict theprice of bitcoin. 2015.
[52] Jason Hirshman, Yifei Huang, and Stephen Macke. Unsupervised approaches todetecting anomalous behavior in the bitcoin transaction network. Technical report,Technical report, Stanford University, 2013.
[53] Christian Jaag and Christian Bach. Blockchain technology and cryptocurrencies:Opportunities for postal financial services. In The Changing Postal and DeliverySector, pages 205–221. Springer, 2017.
70
[54] Aljosha Judmayer, Nicholas Stifter, Katharina Krombholz, and Edgar Weippl.Blocks and chains: Introduction to bitcoin, cryptocurrencies, and their consensusmechanisms. Synthesis Lectures on Information Security, Privacy, & Trust, 9(1):1–123, 2017.
[55] Irni Eliana Khairuddin, Corina Sas, Sarah Clinch, and Nigel Davies. Exploringmotivations for bitcoin technology usage. In Proceedings of the 2016 CHI ConferenceExtended Abstracts on Human Factors in Computing Systems, pages 2872–2878.ACM, 2016.
[56] Christoph Kinkeldey, Jean-Daniel Fekete, and Petra Isenberg. Bitconduite: Visualiz-ing and analyzing activity on the bitcoin network. In EuroVis 2017-EurographicsConference on Visualization, Posters Track, page 3, 2017.
[57] Katharina Krombholz, Aljosha Judmayer, Matthias Gusenbauer, and Edgar Weippl.The other side of the coin: User experiences with bitcoin security and privacy.In International Conference on Financial Cryptography and Data Security, pages555–580. Springer, 2016.
[58] Hiroki Kuzuno and Christian Karam. Blockchain explorer: An analytical processand investigation environment for bitcoin.
[59] Matthias Lischke and Benjamin Fabian. Analyzing the bitcoin network: The firstfour years. Future Internet, 8(1):7, 2016.
[60] Felix Konstantin Maurer. A survey on approaches to anonymity in bitcoin and othercryptocurrencies. In GI-Jahrestagung, pages 2145–2150, 2016.
[61] Dan McGinn, David Birch, David Akroyd, Miguel Molina-Solana, Yike Guo, andWilliam J Knottenbelt. Visualizing dynamic bitcoin transaction patterns. Big data,4(2):109–119, 2016.
[62] Sarah Meiklejohn, Marjori Pomarole, Grant Jordan, Kirill Levchenko, DamonMcCoy, Geoffrey M Voelker, and Stefan Savage. A fistful of bitcoins: characterizingpayments among men with no names. In Proceedings of the 2013 conference onInternet measurement conference, pages 127–140. ACM, 2013.
[63] Satoshi Nakamoto. Bitcoin: A peer-to-peer electronic cash system, 2008.
[64] Arvind Narayanan, Joseph Bonneau, Edward Felten, Andrew Miller, and StevenGoldfeder. Bitcoin and Cryptocurrency Technologies: A Comprehensive Introduction.Princeton University Press, 2016.
[65] ANDRÉ NORDBØ. Data visualization for discovery, analysis and presentation ofdigital evidence. Project report in digital forensics II, 2013.
[66] Fergal Reid and Martin Harrigan. An analysis of anonymity in the bitcoin system.In Security and privacy in social networks, pages 197–223. Springer, 2013.
71
[67] Loıs Saublet, Petra Isenberg, and Tobias Isenberg. Bitcoin visualization. 2015.
[68] Anthony Serapiglia, Constance P Serapiglia, and Joshua McIntyre. Crypto currencies:core information technology and information system fundamentals enabling currencywithout borders. Information Systems Education Journal, 13(3):43, 2015.
[69] Michele Spagnuolo. Bitiodine: extracting intelligence from the bitcoin network.2013.
[70] Michele Spagnuolo, Federico Maggi, and Stefano Zanero. Bitiodine: Extractingintelligence from the bitcoin network. In International Conference on FinancialCryptography and Data Security, pages 457–468. Springer, 2014.
[71] Tri Sundara. Study on blockchain visualization. JOIV: International Journal onInformatics Visualization, 1(3):76–82, 2017.
[72] Kentaroh Toyoda, P Takis Mathiopoulos, Iwao Sasase, and Tomoaki Ohtsuki. A novelblockchain-based product ownership management system (poms) for anti-counterfeitsin the post supply chain. IEEE Access, 2017.
[73] Hans Van der Heijden. Factors affecting the successful introduction of mobilepayment systems. BLED 2002 proceedings, page 20, 2002.
[74] Gavin Wood. Ethereum: A secure decentralised generalised transaction ledger.Ethereum Project Yellow Paper, 151, 2014.
72
Related Documents