Current Advances in Environmental Science CAES CAES Volume 2 Issue 1, Feb. 2014 PP. 1-10 www.vkingpub.com © American V-King Scientific Publishing 1 Visualising the Relationship between Energy Use and Climate Change Muhammad Isma’il *1 , Ibrahim Jaro Musa 2 , Abubakar Salisu 3 , Sule Muhammad Zubairu 4 , Idoma Kim 5 , Inusa Musa 6 , Idris Dabo Ibrahim 7 , Zainab Dalhatu Muhammed 8 1 Department of Geography, Ahmadu Bello University, Zaria, Nigeria 2 Department of Geography, Ahmadu Bello University, Zaria, Nigeria 3 Department of Geography, Ahmadu Bello University, Zaria, Nigeria 4 Department of Geography, Ahmadu Bello University, Zaria, Nigeria 5 Department of Geography, Ahmadu Bello University, Zaria, Nigeria 6 Department of Geography, Federal College of Education, Zaria, Nigeria 7 Department of General Studies, Nuhu Bamalli Polytechnic, Zaria, Nigeria 8 Department of Urban and Regional Planning, Nuhu Bamalli Polytechnic, Zaria, Nigeria [email protected] Abstract-The relationship between energy use and climate change is strong and dynamic, but the two are often treated separately and as static phenomena. This affects people’s perception and understanding of climate change. There is therefore the need to show clearly the causal relationship between energy use and climate change. This study developed choropleth maps and bivariate maps in a Geographic Information System (GIS) environment as a new way of visualising the dynamic relationship between energy use and climate change. We observed that the relationship between them is more easily perceived through GIS maps than the customary graphs used in energy and climate change visualisations. This has a role to play in influencing public and stakeholders’ perception and understanding of the relationship between energy use and climate change. Keywords- Energy Use; Climate change; GIS; Visualisations I. INTRODUCTION The United Nations Framework Convention on Climate Change (UNFCCC: 1992), defined climate change in its Article 1 as “a change of climate which is attributed directly or indirectly to human activity that alters the composition of the global atmosphere and which is in addition to natural climate variability observed over comparable time periods”. Therefore, climate change implies a change in any of the climatic variables such as temperature, atmospheric pressure, humidity and rainfall which is caused by natural or anthropogenic factors. Climate change is principally attributed to the emission of greenhouse gases into the atmosphere. The greenhouse gases include Carbon dioxide (CO 2 ), methane, halocarbons (a group of gases containing fluorine, chlorine or bromine), nitrous oxide, ozone, and water vapour. Carbon dioxide (CO 2 ) has been established by scientists as presently the most significant of all the greenhouse gases causing climate change. Greenhouse gases evolve from a broad range of human activities such as agriculture, changes in land use, as well energy use. But the energy sector is responsible for 84% of global CO 2 emissions and 64% of the world’s greenhouse-gas emissions (International Energy Agency, 2009). Moreover, the IEA also predicts a sustained rise in energy-related CO 2 emissions resulting from continued increase in global demand for fossil fuels which presently account for 80.9% of primary energy supply and will still account for 80% of fuels by 2030. These studies suggest that the relationship between energy use and climate change is continuous. Since the mid-eighteenth century, fossil fuel use and cement productions have released billions of tons of CO 2 to the atmosphere. Carbon dioxide levels in the atmosphere before the Industrial Revolution were some 280 parts per million (ppm), and by 2007, levels had reached 384 ppm—a 37% increase (McKeown and Gardner, 2009). Besides, it is reported that the global average growth rate of CO 2 emissions between 1970 and 2004 was 1.9% per year and this was as a result of the annual increase in population, GDP per capita, energy-intensity and carbon-intensity (Rogner et al (2007). The trend in greenhouse gas emissions will certainly continue with increasing influence of these factors. The greenhouse gases by their nature trap heat from the sun in Earth’s atmosphere causing climate change. Increasing greenhouse gases in the atmosphere results into continuous trapping of heat within the Earth's atmosphere leading to unprecedented rising Earth’s surface temperatures referred to as global warming. Therefore, global warming is one of the manifestations of climate change. It is reported that average global temperature increased by 0.74 degrees Celsius between 1906 and 2005(McKeown and Gardner, 2009). Moreover, the Intergovernmental Panel on Climate Change (IPCC) predicted in its 2007 Assessment, an additional rise in temperature of 1.8–4.0 degrees Celsius this century, depending on how much and how soon greenhouse gas emissions are curbed. The assessment concludes that “most of the observed increase in globally averaged temperatures since the mid- twentieth century is very likely

Welcome message from author
This document is posted to help you gain knowledge. Please leave a comment to let me know what you think about it! Share it to your friends and learn new things together.
Transcript
Current Advances in Environmental Science CAES
CAES Volume 2 Issue 1, Feb. 2014 PP. 1-10 www.vkingpub.com © American V-King Scientific Publishing 1
Visualising the Relationship between Energy Use and Climate Change
Muhammad Isma’il*1, Ibrahim Jaro Musa2, Abubakar Salisu3, Sule Muhammad Zubairu4, Idoma Kim5, Inusa Musa6, Idris Dabo Ibrahim7, Zainab Dalhatu Muhammed8
1Department of Geography, Ahmadu Bello University, Zaria, Nigeria 2Department of Geography, Ahmadu Bello University, Zaria, Nigeria 3Department of Geography, Ahmadu Bello University, Zaria, Nigeria 4Department of Geography, Ahmadu Bello University, Zaria, Nigeria 5Department of Geography, Ahmadu Bello University, Zaria, Nigeria
6Department of Geography, Federal College of Education, Zaria, Nigeria 7Department of General Studies, Nuhu Bamalli Polytechnic, Zaria, Nigeria
8Department of Urban and Regional Planning, Nuhu Bamalli Polytechnic, Zaria, Nigeria [email protected]
Abstract-The relationship between energy use and climate change is strong and dynamic, but the two are often treated separately and as static phenomena. This affects people’s perception and understanding of climate change. There is therefore the need to show clearly the causal relationship between energy use and climate change. This study developed choropleth maps and bivariate maps in a Geographic Information System (GIS) environment as a new way of visualising the dynamic relationship between energy use and climate change. We observed that the relationship between them is more easily perceived through GIS maps than the customary graphs used in energy and climate change visualisations. This has a role to play in influencing public and stakeholders’ perception and understanding of the relationship between energy use and climate change.
Keywords- Energy Use; Climate change; GIS; Visualisations
I. INTRODUCTION
The United Nations Framework Convention on Climate Change (UNFCCC: 1992), defined climate change in its Article 1 as “a change of climate which is attributed directly or indirectly to human activity that alters the composition of the global atmosphere and which is in addition to natural climate variability observed over comparable time periods”. Therefore, climate change implies a change in any of the climatic variables such as temperature, atmospheric pressure, humidity and rainfall which is caused by natural or anthropogenic factors.
Climate change is principally attributed to the emission of greenhouse gases into the atmosphere. The greenhouse gases include Carbon dioxide (CO2), methane, halocarbons (a group of gases containing fluorine, chlorine or bromine), nitrous oxide, ozone, and water vapour. Carbon dioxide (CO2) has been established by scientists as presently the most significant of all the greenhouse gases causing climate change. Greenhouse gases evolve from a broad range of human activities such as agriculture, changes in land use, as well energy use. But the energy sector is responsible for 84% of global CO2 emissions and 64% of the world’s
greenhouse-gas emissions (International Energy Agency, 2009). Moreover, the IEA also predicts a sustained rise in energy-related CO2 emissions resulting from continued increase in global demand for fossil fuels which presently account for 80.9% of primary energy supply and will still account for 80% of fuels by 2030. These studies suggest that the relationship between energy use and climate change is continuous.
Since the mid-eighteenth century, fossil fuel use and cement productions have released billions of tons of CO2 to the atmosphere. Carbon dioxide levels in the atmosphere before the Industrial Revolution were some 280 parts per million (ppm), and by 2007, levels had reached 384 ppm—a 37% increase (McKeown and Gardner, 2009). Besides, it is reported that the global average growth rate of CO2 emissions between 1970 and 2004 was 1.9% per year and this was as a result of the annual increase in population, GDP per capita, energy-intensity and carbon-intensity (Rogner et al (2007). The trend in greenhouse gas emissions will certainly continue with increasing influence of these factors.
The greenhouse gases by their nature trap heat from the sun in Earth’s atmosphere causing climate change. Increasing greenhouse gases in the atmosphere results into continuous trapping of heat within the Earth's atmosphere leading to unprecedented rising Earth’s surface temperatures referred to as global warming. Therefore, global warming is one of the manifestations of climate change. It is reported that average global temperature increased by 0.74 degrees Celsius between 1906 and 2005(McKeown and Gardner, 2009).
Moreover, the Intergovernmental Panel on Climate Change (IPCC) predicted in its 2007 Assessment, an additional rise in temperature of 1.8–4.0 degrees Celsius this century, depending on how much and how soon greenhouse gas emissions are curbed. The assessment concludes that “most of the observed increase in globally averaged temperatures since the mid- twentieth century is very likely
Current Advances in Environmental Science CAES
CAES Volume 2 Issue 1, Feb. 2014 PP. 1-10 www.vkingpub.com © American V-King Scientific Publishing 2
due to the observed increase in anthropogenic greenhouse gas concentrations” (IPCC, 2007: 10). This is in line with the assertion of Dow and Downing (2007) that the emission of greenhouse gases released from energy use is among the immediate causes of climate change. It is obvious that although natural factors are significant in climate change, human factors such as energy production and consumption are also significant.
There is a general consensus among the Intergovernmental Panel on Climate Change (IPCC), the United Nations Framework Convention on Climate Change (UNFCCC) and many of the environmental scientists on the fact that the emission of anthropogenic greenhouse gases into the atmosphere is primarily responsible for climate change.
Climate change is a direct consequence of the current hydro-carbon based system of energy use. Energy is required for economic and social activities. The amount of energy used by a nation depends on the interplay of such factors as demographic change, economic growth and technological development. The global energy demand depends mainly on the supply of fossil fuels responsible for the emissions of carbon dioxide and other greenhouse gases causing climate change. The supply of the fossil fuels required to meet the global energy demand depends on the available proved reserves of energy resource located in specific geographies of the world. Economic globalisation which implies the interconnection and interdependence of economic activities allows the flow of energy from producers to consumers.
Energy production and consumption result into emission of CO2 and other greenhouse gases responsible for climate change. Energy use being the principal driver of climate change is a dynamic process. The developed nations ranked the biggest consumers of energy owing to their level of development, but a global shift is in progress where the developing nations such as China and India account for most of the increase in global energy demand until 2030. This global shift has implication on greenhouse gas emissions and climate change. Statistics suggest that China became the largest national source of CO2 emissions during 2006 (Energy Information Administration, 2010) and the most important contributor to global climate change in that year. The amount of CO2 emissions from Nigeria is very significant considering her population size of over 160 million, increasing energy demand and deforestation. Therefore, the developing nations account for all of the projected growth in energy-related CO2 emissions to 2030 (IEA, 2007a; IEA, 2009). Moreover, the World Development Indicators (2010) acknowledge demographic change, economic growth and industrialisation as the factors responsible for increasing demand for energy services leading to rapid and sustained rise in CO2 emissions causing climate change.
Understanding the relationships between global energy production and consumption, economic globalisation and CO2 emissions are critical to any study on climate change. Also, understanding the relationship between energy use and climate change is critical to researches on climate change mitigation and adaptation policies. In this study,
maps produced in a Geographic Information System (GIS) environment were used instead of customary graphs to visualise the relationship between energy use and climate change.
A. Definition of Concepts
Primary Energy consists of oil, natural gas, coal/peat, nuclear, hydro and others (IEA, 2007a).
Energy consumption means Total Primary Energy Supply (TPES) which “is made up of production + imports – exports – international marine bunkers – international aviation bunkers ± stock changes. For the world total, international marine bunkers and international aviation bunkers are not subtracted from TPES” (IEA, 2007b).
TPES is measured in Mtoe (million tonnes of energy)
CO2 is measured in mtCO2 (metric tons of CO2)
CO2 intensity measures emissions per unit of gross domestic product.
CO2 per capita measures emissions per person.
Kaya Identity
The level of human impact on climate in the form of carbon dioxide emissions is expressed in a formula (Kaya identity) put together by Professor Yoichi Kaya at Tokyo University and a team of carbon experts (Pielke, 2010). The Kaya identity expresses the level of energy related CO2 emissions as the product of four factors. These factors that influence trends in carbon dioxide emissions are: (1) carbon intensity of energy (the amount of energy-related carbon dioxide emissions emitted per unit of energy produced), (2) energy intensity of the economy (energy consumed per dollar of GDP), (3) GDP per capita, and (4) population. The formula is given by:
Carbon Emission (gigatons of carbon) = Population (billions of people) x GDP ($/person) x Energy Intensity (terawatts/$) x Carbon Efficiency (gigaton of carbon / terawatt).
The Kaya Identity provides an intuitive approach to the interpretation of historical trends and future projections of carbon dioxide emissions (EIA: IEO, 2010). It forms the basis for most of the future projections of carbon dioxide emissions.
OECD: Organisation for Economic Cooperation and Development. It includes OECD Europe, OECD North America and OECD Pacific regional groupings.
B. Literature Review
Stamm et al (2000) discovered that although people are aware of climate change in a general sense, they have limited understanding of particular causes, possible consequences, and solutions of the problem. This is in line with the findings of a national survey conducted in America from November 2002 to February 2003 as reported by Lorenzoni et al (2007), Bostrom and Lashof (2007). This is simply because many people are oblivious of the fact that climate change is primarily caused by the emissions of
Current Advances in Environmental Science CAES
CAES Volume 2 Issue 1, Feb. 2014 PP. 1-10 www.vkingpub.com © American V-King Scientific Publishing 3
greenhouse gases from energy production and consumption. Therefore, providing information on the causes of climate change will give the public relevant affective images of climate change and also clear the misconceptions of those who still view it as completely natural. Moreover, studies have shown that understanding the correct causes of global warming is central in influencing peoples’ attitude and winning their support to address global warming (Bord et al, 2000; Bostrom and Lashof, 2007). However, for people to understand and be motivated to engage with climate change and take action, they need to be informed about the causes of climate change as well as their responsibilities. One way of articulating these responsibilities is through visualising the relationship between energy use and climate change.
The effectiveness of visualising climate change in a GIS environment has been shown by Sheppard et al (2008), Neset and Glad (2009) and recommended by Dangermond and Artz (2010) . In addition, attempts have been made to visualise the relationship between energy and climate change. For example, most of the maps showing the drivers of climate change as produced by Chefurka (2007), Dangermond and Artz (2010), Dow and Downing (2007), Oda and Maksyutov (2009), Earth (2010); and those visualising the impact of climate change on the environment as shown on Global Warming Map by National Geographic (2010) are static because they only represent the present situation and do not reflect future scenarios. There is the need to represent the dynamic elements of these trends because the relationship between energy use and climate change is dynamic. Whereas the dynamic maps of energy and climate change such as Index Mundi map (2008), The Oil World Map (2007), UN and Google Greenhouse Gas map (2010), as well as the IEA map (2009) neither emphasises the relationship between them nor display their future scenarios. In reality, there is strong and dynamic relationship between energy use and climate change. Hence, the two should be linked together and that is the focus of this research. This study created choropleth and bivariate maps in a GIS environment to display the present and future scenarios of the relationship between energy use and climate change.
II. METHODOLOGY
A. Data Types
The research utilises data on past, present and future projections of
1. Energy (oil, gas and coal) consumption at national, regional and global scales
2. Emissions of Greenhouse gases at national, regional and global scales
3. CO2 emissions per capita and GDP per capita
B. Data Sources
A comprehensive data on the past, current and future projections are provided by the following sources:
1. BP Statistical year book, 2010, 2011 (plus historical dataset)
2. Energy Information Administration (EIA) Report, 2010, 2011; International Energy Outlook (IEO) 2010, 2011
3. International Energy Agency (IEA) World Energy Outlook, 2009, 2010, 2011; Key World Energy Statistics, 2009, 2010, 2011
4. World Development Indicators (WDI), 2009, 2010, 2011
5. International Panel on Climate Change (IPCC) Report, 2007, 2008, 2010, 2011
C. Visualisation Approach
Landscape visualisation is the most commonly used method of representing climate change. Examples of the use of landscape visualisation to show the local effects of climate change are found in studies by Sheppard Salter (2004), Sheppard (2005), Sheppard and Shaw (2007), Sheppard et al (2008), as well as Sheppard (2008). Although, studies have shown landscape method to be effective, it is limited by the fact that it is mostly applied in visualising the local effects of climate change. However, energy use and climate change are global as their implications. Therefore, understanding them requires a more pragmatic approach which would represent the present relationship between energy and climate change at national, regional and global scales, as well as depict future scenarios. This study employed the use of Choropleth map and bivariate mapping in visualising the relationship between energy and climate change. Considering the fact that the data used in this study were acquired from different sources, they were registered to the same coordinate system before importing into ArcGIS environment. The base map used in this study is a shapefile of all the countries of the world available in ESRIDATA on Arcview. The shapefile was imported into ArcGIS, and then georeferenced based on WGS 1984 projections. Then, fields were added to the attribute table of the shapefile, and data on energy use and CO2 emissions were imputed into the attribute table. Using symbology tool in ArcGIS, the data was applied to the world shapefile to create the choropleth maps. In addition, the bivariate map was produced using cartographic technique to display the relationship between energy use and CO2 emissions simultaneously.
III. ANALYTICAL DISCUSSION
A. Visualising the Relationship between Energy Consumption and CO2 Emission at National Scale
It is an established fact that energy consumption results into emission of greenhouse gases which are principally responsible for altering the global climatic balance. The most influential of these gases is the Carbon dioxide (CO2). Therefore the amount of CO2 emitted by a nation is a function of the amount of energy consumed. This is visualised in the figures below:
Current Advances in Environmental Science CAES
CAES Volume 2 Issue 1, Feb. 2014 PP. 1-10 www.vkingpub.com © American V-King Scientific Publishing 4
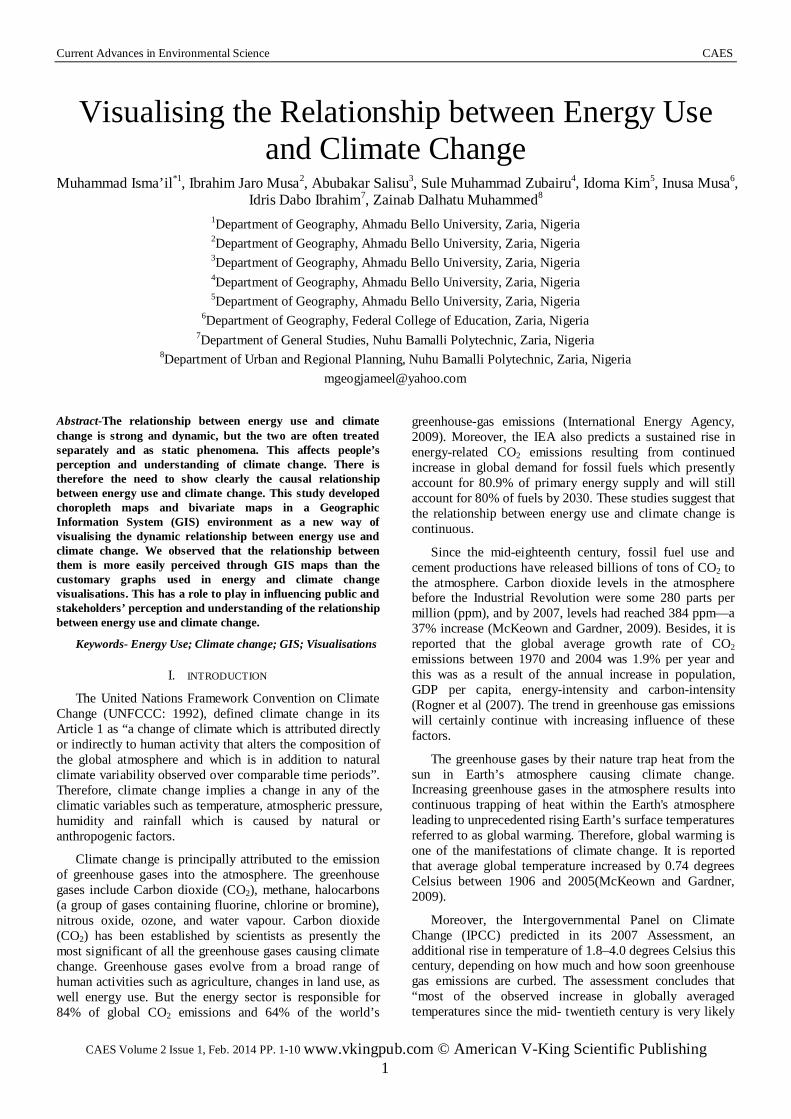
Fig. 1a Energy consumption in 2007
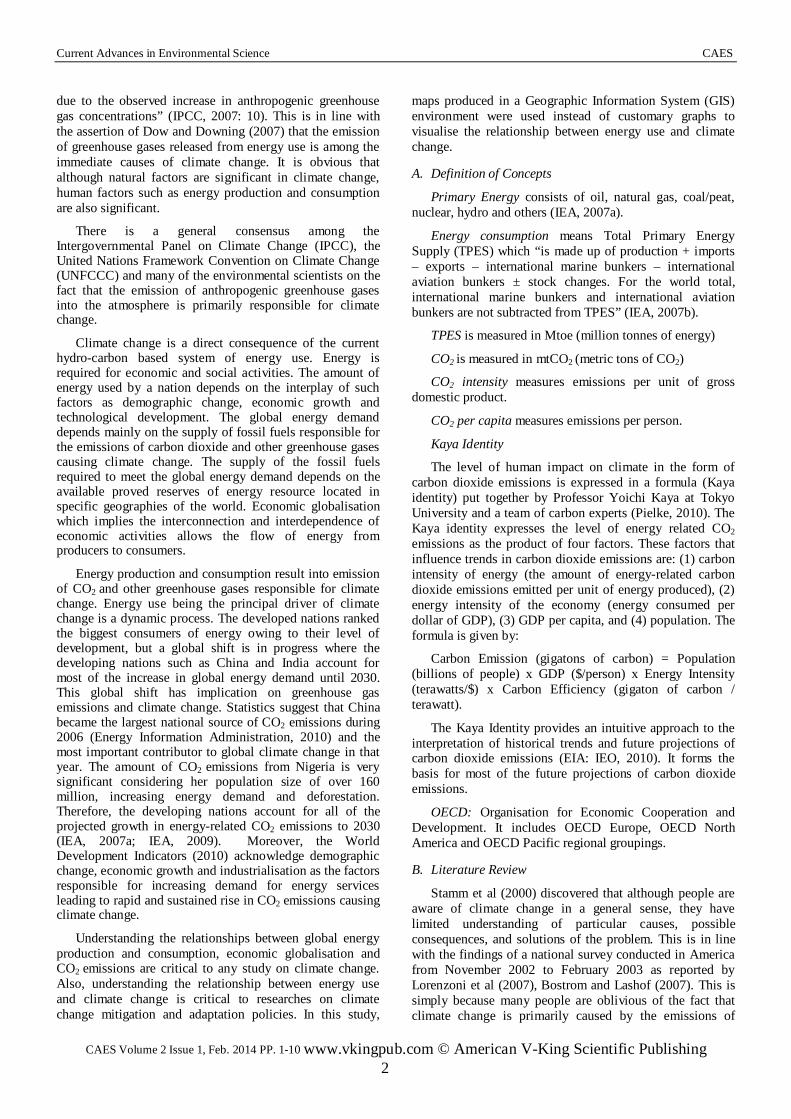
Fig. 1b CO2 emissions in 2007
Fig. 1a shows that United States, China, Russia, India, Japan and Germany have the highest primary energy supply in 2007 (IEA, 2009), which is an indication that these countries have strong economies. With the exception of Russia, these countries rank among the biggest net importers of crude oil in 2007 according to the IEA, and therefore the major contributors to climate change because consumption of crude oil leads to emission of CO2 and other greenhouse gases. This is buttressed by Fig. 1b which shows that in 2007, China, United States, Russia, India, Japan, Germany, Canada, United Kingdom, South Korea and Iran constitute the biggest emitters of CO2 and this corresponds to the major consumers of primary energy (fossil fuels) in 2007 as shown in fig. 1a. This suggests that energy consumption leads to CO2 emissions responsible for climate change.
B. Visualising the Relationship between Per capita Energy Consumption and CO2 Emission Per capita at National Scale
Statistical evidences suggest a strong relationship
between energy consumption, population change, economic growth and CO2 emissions. Countries with strong gross domestic product require large amount of energy for their socioeconomic activities. Population is vital in determining per capita GDP and energy use per capita. It is among the Kaya Identity indicators which derive climate change. Others are carbon intensity (CO2 emissions per unit of total primary energy supply (TPES)), energy intensity (TPES per unit of GDP), and gross domestic product per capita (GDP/capita). The Kaya indicators are vital in understanding CO2 intensity and CO2 per capita. Both CO2 intensity and CO2 per capita measures can be used to look at emission differences between nations or regions (McKeown and Gardner, 2009).
The need to consider per capita carbon dioxide (CO2) emissions in international climate change negotiations arise from the fact that absolute CO2 emissions of a country or region could be offset by the population density of the area. For instance, while China has recently taken the lead in total greenhouse gas emissions, its per capita emissions level is far lower than that in most developed countries (McKeown and
Current Advances in Environmental Science CAES
CAES Volume 2 Issue 1, Feb. 2014 PP. 1-10 www.vkingpub.com © American V-King Scientific Publishing 5
Gardner). It is observed that figures 1a and 1b differ from figures 2a and 2b and this is influenced by varying
population densities and economic growth of the countries or regions.
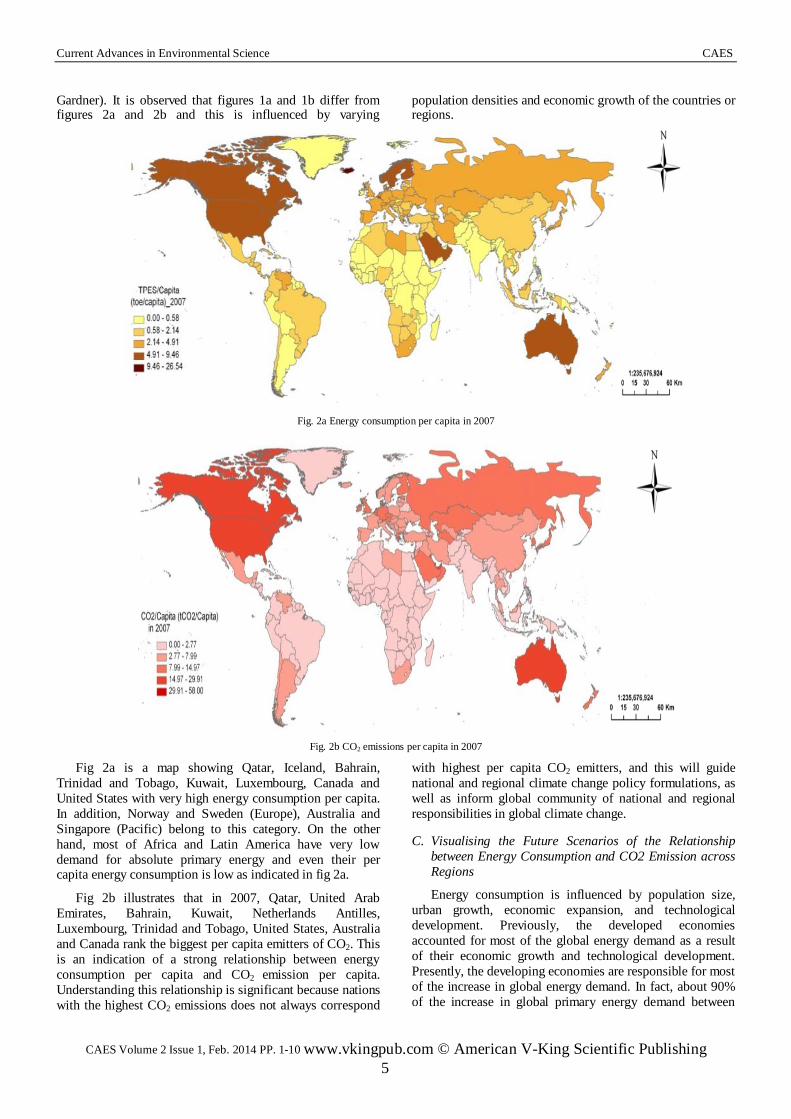
Fig. 2a Energy consumption per capita in 2007
Fig. 2b CO2 emissions per capita in 2007
Fig 2a is a map showing Qatar, Iceland, Bahrain, Trinidad and Tobago, Kuwait, Luxembourg, Canada and United States with very high energy consumption per capita. In addition, Norway and Sweden (Europe), Australia and Singapore (Pacific) belong to this category. On the other hand, most of Africa and Latin America have very low demand for absolute primary energy and even their per capita energy consumption is low as indicated in fig 2a.
Fig 2b illustrates that in 2007, Qatar, United Arab Emirates, Bahrain, Kuwait, Netherlands Antilles, Luxembourg, Trinidad and Tobago, United States, Australia and Canada rank the biggest per capita emitters of CO2. This is an indication of a strong relationship between energy consumption per capita and CO2 emission per capita. Understanding this relationship is significant because nations with the highest CO2 emissions does not always correspond
with highest per capita CO2 emitters, and this will guide national and regional climate change policy formulations, as well as inform global community of national and regional responsibilities in global climate change.
C. Visualising the Future Scenarios of the Relationship between Energy Consumption and CO2 Emission across Regions
Energy consumption is influenced by population size, urban growth, economic expansion, and technological development. Previously, the developed economies accounted for most of the global energy demand as a result of their economic growth and technological development. Presently, the developing economies are responsible for most of the increase in global energy demand. In fact, about 90% of the increase in global primary energy demand between
Current Advances in Environmental Science CAES
CAES Volume 2 Issue 1, Feb. 2014 PP. 1-10 www.vkingpub.com © American V-King Scientific Publishing 6
2007 and 2030 is projected to come from developing economies (IEA, 2009, EIA, 2010) as a result of demographic change and economic growth. This global shift
in energy demand has implication on global CO2 and other greenhouse gas emissions and eventually climate change. This is displayed in the figures below:
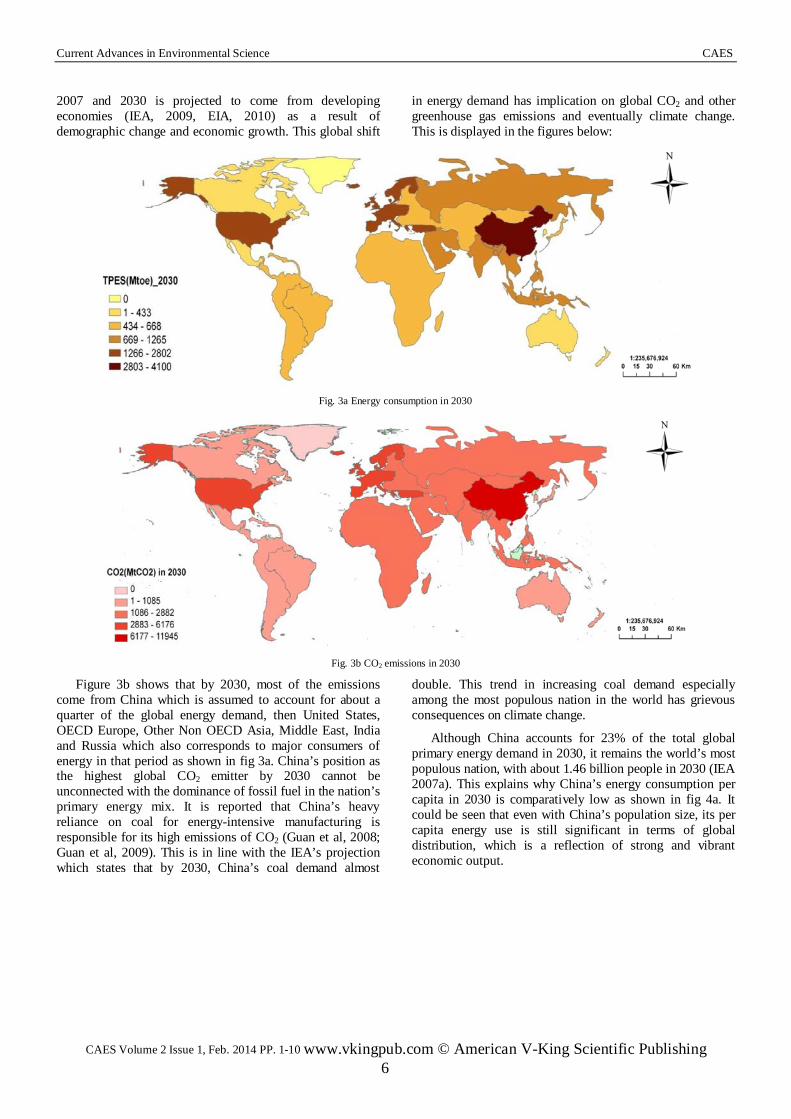
Fig. 3a Energy consumption in 2030
Fig. 3b CO2 emissions in 2030
Figure 3b shows that by 2030, most of the emissions come from China which is assumed to account for about a quarter of the global energy demand, then United States, OECD Europe, Other Non OECD Asia, Middle East, India and Russia which also corresponds to major consumers of energy in that period as shown in fig 3a. China’s position as the highest global CO2 emitter by 2030 cannot be unconnected with the dominance of fossil fuel in the nation’s primary energy mix. It is reported that China’s heavy reliance on coal for energy-intensive manufacturing is responsible for its high emissions of CO2 (Guan et al, 2008; Guan et al, 2009). This is in line with the IEA’s projection which states that by 2030, China’s coal demand almost
double. This trend in increasing coal demand especially among the most populous nation in the world has grievous consequences on climate change.
Although China accounts for 23% of the total global primary energy demand in 2030, it remains the world’s most populous nation, with about 1.46 billion people in 2030 (IEA 2007a). This explains why China’s energy consumption per capita in 2030 is comparatively low as shown in fig 4a. It could be seen that even with China’s population size, its per capita energy use is still significant in terms of global distribution, which is a reflection of strong and vibrant economic output.
Current Advances in Environmental Science CAES
CAES Volume 2 Issue 1, Feb. 2014 PP. 1-10 www.vkingpub.com © American V-King Scientific Publishing 7
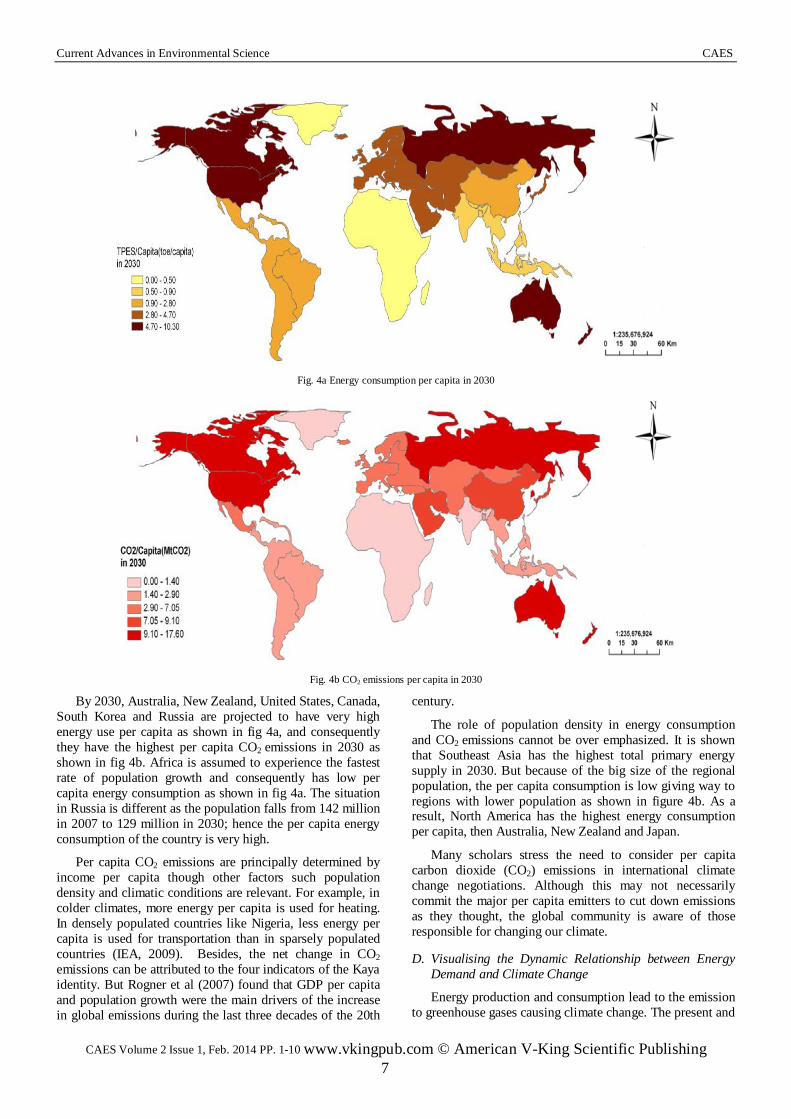
Fig. 4a Energy consumption per capita in 2030
Fig. 4b CO2 emissions per capita in 2030
By 2030, Australia, New Zealand, United States, Canada, South Korea and Russia are projected to have very high energy use per capita as shown in fig 4a, and consequently they have the highest per capita CO2 emissions in 2030 as shown in fig 4b. Africa is assumed to experience the fastest rate of population growth and consequently has low per capita energy consumption as shown in fig 4a. The situation in Russia is different as the population falls from 142 million in 2007 to 129 million in 2030; hence the per capita energy consumption of the country is very high.
Per capita CO2 emissions are principally determined by income per capita though other factors such population density and climatic conditions are relevant. For example, in colder climates, more energy per capita is used for heating. In densely populated countries like Nigeria, less energy per capita is used for transportation than in sparsely populated countries (IEA, 2009). Besides, the net change in CO2 emissions can be attributed to the four indicators of the Kaya identity. But Rogner et al (2007) found that GDP per capita and population growth were the main drivers of the increase in global emissions during the last three decades of the 20th
century.
The role of population density in energy consumption and CO2 emissions cannot be over emphasized. It is shown that Southeast Asia has the highest total primary energy supply in 2030. But because of the big size of the regional population, the per capita consumption is low giving way to regions with lower population as shown in figure 4b. As a result, North America has the highest energy consumption per capita, then Australia, New Zealand and Japan.
Many scholars stress the need to consider per capita carbon dioxide (CO2) emissions in international climate change negotiations. Although this may not necessarily commit the major per capita emitters to cut down emissions as they thought, the global community is aware of those responsible for changing our climate.
D. Visualising the Dynamic Relationship between Energy Demand and Climate Change
Energy production and consumption lead to the emission to greenhouse gases causing climate change. The present and
Current Advances in Environmental Science CAES
CAES Volume 2 Issue 1, Feb. 2014 PP. 1-10 www.vkingpub.com © American V-King Scientific Publishing 8
nearest future of global energy demand depends mainly on the supply from fossil fuels responsible for the emissions of greenhouse gases. Energy is essential for socioeconomic activities such as hating, lighting, cooking, and transportation. The demand for energy increases with increase in population, economic viability and urbanisation. These processes are dynamic; hence the relationship between energy consumption and climate change is dynamic. Therefore, scenarios are used in order to represent this dynamism.
Scenarios are useful scientific tools which provide alternative futures. They enhance our understanding of
complex systems behaviour and help in climate change analysis (IPCC, 2009). The scenarios provide projections which are crucial for visualising and analysing the dynamics as well as the future trends of global energy security and climate change. The projections in each scenario are based on assumptions about such factors as population growth, macroeconomic trends, energy prices, technological developments and government policies.
In this section, the relationship between energy consumption and CO2 is expressed using bivariate mapping.
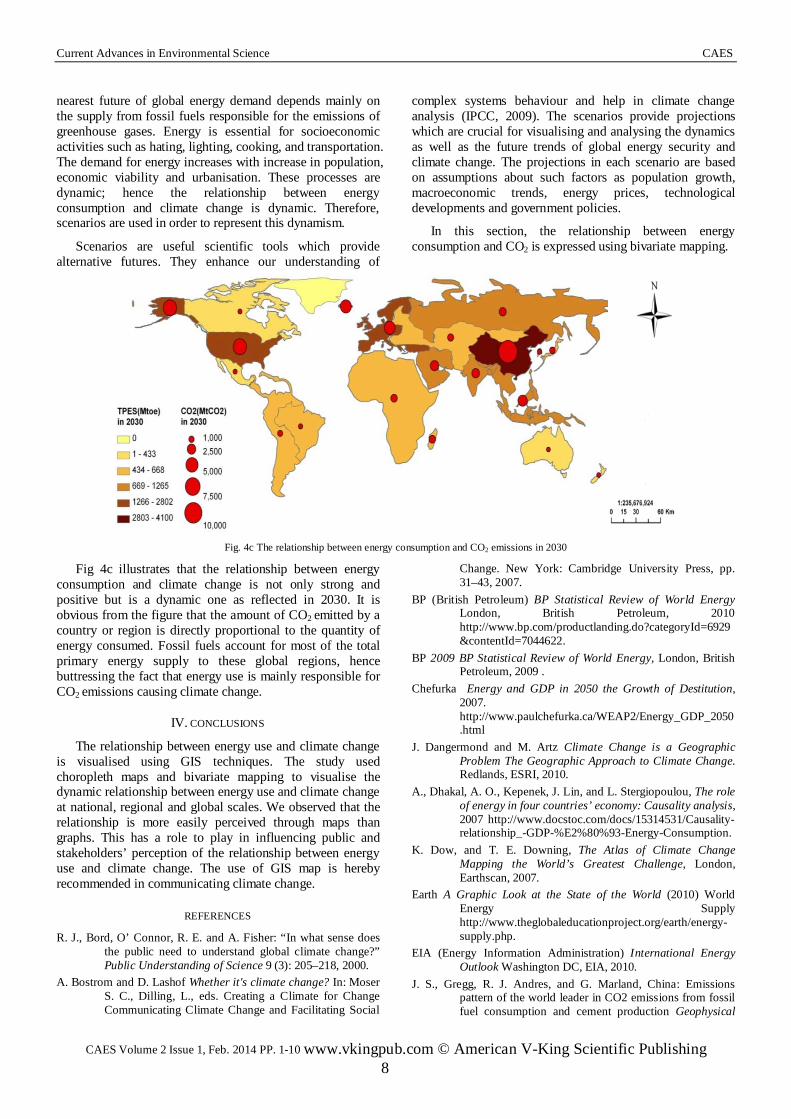
Fig. 4c The relationship between energy consumption and CO2 emissions in 2030
Fig 4c illustrates that the relationship between energy consumption and climate change is not only strong and positive but is a dynamic one as reflected in 2030. It is obvious from the figure that the amount of CO2 emitted by a country or region is directly proportional to the quantity of energy consumed. Fossil fuels account for most of the total primary energy supply to these global regions, hence buttressing the fact that energy use is mainly responsible for CO2 emissions causing climate change.
IV. CONCLUSIONS
The relationship between energy use and climate change is visualised using GIS techniques. The study used choropleth maps and bivariate mapping to visualise the dynamic relationship between energy use and climate change at national, regional and global scales. We observed that the relationship is more easily perceived through maps than graphs. This has a role to play in influencing public and stakeholders’ perception of the relationship between energy use and climate change. The use of GIS map is hereby recommended in communicating climate change.
REFERENCES
R. J., Bord, O’ Connor, R. E. and A. Fisher: “In what sense does the public need to understand global climate change?” Public Understanding of Science 9 (3): 205–218, 2000.
A. Bostrom and D. Lashof Whether it's climate change? In: Moser S. C., Dilling, L., eds. Creating a Climate for Change Communicating Climate Change and Facilitating Social
Change. New York: Cambridge University Press, pp. 31–43, 2007.
BP (British Petroleum) BP Statistical Review of World Energy London, British Petroleum, 2010 http://www.bp.com/productlanding.do?categoryId=6929&contentId=7044622.
BP 2009 BP Statistical Review of World Energy, London, British Petroleum, 2009 .
Chefurka Energy and GDP in 2050 the Growth of Destitution, 2007. http://www.paulchefurka.ca/WEAP2/Energy_GDP_2050.html
J. Dangermond and M. Artz Climate Change is a Geographic Problem The Geographic Approach to Climate Change. Redlands, ESRI, 2010.
A., Dhakal, A. O., Kepenek, J. Lin, and L. Stergiopoulou, The role of energy in four countries’ economy: Causality analysis, 2007 http://www.docstoc.com/docs/15314531/Causality-relationship_-GDP-%E2%80%93-Energy-Consumption.
K. Dow, and T. E. Downing, The Atlas of Climate Change Mapping the World’s Greatest Challenge, London, Earthscan, 2007.
Earth A Graphic Look at the State of the World (2010) World Energy Supply http://www.theglobaleducationproject.org/earth/energy-supply.php.
EIA (Energy Information Administration) International Energy Outlook Washington DC, EIA, 2010.
J. S., Gregg, R. J. Andres, and G. Marland, China: Emissions pattern of the world leader in CO2 emissions from fossil fuel consumption and cement production Geophysical
Current Advances in Environmental Science CAES
CAES Volume 2 Issue 1, Feb. 2014 PP. 1-10 www.vkingpub.com © American V-King Scientific Publishing 9
Research Letters, Vol. 35, 2008. D., Guan, K., Hubacek, C. L., Weber, G. P. Peters, and D. M.
Reiner, The drivers of Chinese CO2 emissions from 1980 to 2030. Global Environmental Change 18(4): 626-634, 2008 http://dx.doi.org/10.1016/j.gloenvcha.2008.08.001 Accessed 30 August 2010.
D., Guan, G. P., Peters, C. L. Weber, and K. Hubacek, Journey to world top emitter: an analysis of the driving forces of China’s recent CO2 emissions surge. Geophysical Research Letters 36, L04709, 2009.
IEA (International Energy Agency) 2009 World Energy Outlook, Paris, 2009.
IEA 2007a World Energy Outlook Paris, 2007. IEA 2007b Key World Energy Statistics Paris2007. Index Mundi (2008)
http://www.indexmundi.com/map.aspx?v=Oil+-+production(bbl%2fday).
Intergovernmental Panel on Climate Change (IPCC) Fourth Assessment Report, Working Group I The Physical Science Basis. Summary for Policymakers, IPCC, 2007 www.ipcc.ch.
IPCC Special Report on Emissions Scenarios 2009. IPCC, Summary for Policymakers. In: Climate Change 2007: The
Physical Science Basis. Contribution of Working Group I to the Fourth Assessment Report of the Intergovernmental Panel on Climate Change [Solomon, S., D. Qin, M. Manning, Z. Chen, M. Marquis, K.B. Averyt, M. Tignor and H.L. Miller (Eds.)]. Cambridge University Press: Cambridge, United Kingdom and New York, NY, USA, 2007 http://www.ipcc.ch/pdf/assessment-report/ar4/wg1/ar4-wg1-spm.pdf Accessed on 02/07/10.
IPCC Fourth Assessment Report, Working Group I The Physical Science Basis. Summary for Policymakers, IPCC, 2007 www.ipcc.ch.
International Energy Agency statistics (2009) Edition CO2 Emissions from Fuel Combustion Highlights.
A., Leiserowitz “Communicating the risks of global warming: American risk perceptions, affective images and interpretive communities”. In: Moser S. C. and Dilling, L., eds. Creating a Climate for Change Communicating Climate Change and Facilitating Social Change. New York: Cambridge University Press, pp 44–63, 2007.
I., Lorenzoni, S. Nicholson-Cole, and L. Whitmarsh, Barriers perceived to engaging with climate change among the UK public and their policy implications Global Environmental Change 17, 445–459, 2007.
International Energy Agency (IEA) Map Energy Indicators (2010) http://www.iea.org/country/maps.asp.
A. McKeown, and G. Gardner, (2009) Climate Change Reference Guide Worldwatch Institute Washington DC .
National Geographic (2010) Global Warming Effects Map http://environment.nationalgeographic.com/environment/global-warming/gw-impacts-interactive.html.
T. S. S. Neset, and W. Glad, (2009) “Energy Visualization – Why, What & How?” Available in Neset, T-S S., Johansson, J. and Linnér, B-O. (eds.) (2009) State of Climate Visualization, CSPR Report No 09:04, Centre for Climate Science and Policy Research, Norrköping, Sweden.
T. Oda, and S. Maksyutov, (2009) Two global maps of anthropogenic CO2 emissions derived using database of
large point source http://www.epa.gov/ttn/chief/conference/ei18/session7/oda.pdf .
R. Jr. Pielke (2010) Science, Policy, Politics and Occasionally Some Other Stuff http://rogerpielkejr.blogspot.com/2010/06/wired-on-kaya-identity.html Accessed 16/07/2010.
H.-H., Rogner, D., Zhou, R., Bradley, P., Crabbé, O. Edenhofer, and B. Hare, (Australia), L., Kuijpers, Yamaguchi, M. (2007): “Introduction”. In Climate Change 2007: Mitigation. Contribution of Working Group III to the Fourth Assessment Report of the Intergovernmental Panel on Climate Change [B. Metz, O.R. Davidson, P.R. Bosch, R. Dave, L.A. Meyer (eds)], Cambridge University Press, Cambridge, United Kingdom and New York, NY, USA.
S. R. J. Sheppard, and J. Salter (2004): “The role of visualization in forest planning”. In: Encyclopedia of Forest Sciences, Academic Press/Elsevier, Oxford, UK, pp. 486–498.
S. R.J. Sheppard, (2005) Landscape visualisation and climate change: the potential for influencing perceptions and behaviour Environmental Science & Policy (8) 637–654.
S. R.J. Sheppard, and A. Shaw, (2007) Future Visioning of Local Climate Change Scenarios: Connecting the Dots and Painting Pictures to Aid Earth System Governance Paper presented at the 2007 Amsterdam Conference on the Human Dimensions of Global Environmental Change “Earth System Governance: Theories and Strategies for Sustainability”, 24-26th May 2007, Vrije Universiteit, Amsterdam.
S. R. J., Sheppard, A., Shaw, D. Flanders and S. Burch, (2008): Can visualization save the world? Lessons for landscape architects from visualizing local climate change. Digital Design in Landscape Architecture 2008: 9th International Conference on IT in Landscape Architecture. Anhalt University of Applied Sciences, Dessau/Bernburg, Germany.
S. R. J. Sheppard, (2008) Local climate change visioning: A new process for community planning & outreach using visualization tools. Plan Canada: Canadian Institute of Planners. vol. 48, no. 1, pp. 36-40. http://www.cipicu.ca/web/la/en/pa/4AA5AFC2C29F4C008AE215BC19F7CFB2/template.asp.
United Nations Framework Convention on Climate Change (UNFCCC), Article 1 http://unfccc.int/essential_background/convention/background/items/2536.php Accessed on 02/07/10.
K. R., Stamm, F., Clark, and P. R. Eblacas, (2000): Mass Communication and Public Understanding of Environmental Problems: the Case of Global Warming Public Understanding Science (9) 219–237.
The Oil World Map (2007): The World at Your Door http://watd.wuthering-heights.co.uk/mainpages/oilworldmap.html.
United Nations UN and Google Greenhouse Gas 2010 http://maps.unfccc.int/di/map/.
World Bank 2010 World Development Indicators 2010 http://www.workinfo.com/Workforce/20997_devindicators.pdf.
World Resources Institute’s (WRI) Climate Analysis Indicators Tool (CAIT) http://cait.wri.org/.
1Muhammad Isma’il is with the GIS Unit of Department of Geography, Ahmadu Bello University, Zaria. He is concerned with

Current Advances in Environmental Science CAES
CAES Volume 2 Issue 1, Feb. 2014 PP. 1-10 www.vkingpub.com © American V-King Scientific Publishing 10
theoretical and methodological issues relating to the application of Geographic Information Systems (GIS) in environmental studies. He is also interested in Energy Resource and Critical Resource Geographies. 2Ibrahim Jaro Musa is a Reader with the Department of Geography, Ahmadu Bello University, Zaria. His areas of expertise include Transport and Economic Geography. 3Abubakar Salisu is with Department of Geography, Ahmadu Bello University, Zaria. His area of interest is Economic Geography and Spatial inequality. 4Sule Muhammad Zubairu is with Department of Geography, Ahmadu Bello University, Zaria. His research interest covers hydrology, hydroinformatics and energy resource management.
5Idoma Kim is a researcher with Department of Geography,
Ahmadu Bello University, Zaria. He is interested in Climate change and Rural Development. 6Inusa Musa is a lecturer with Department of Geography, Federal
College of Education, Zaria.
7Idris Dabo Ibrahim is a lecturer with Department of General Studies, Nuhu Bamalli Polytechnic, Zaria.
8Zainab Dalhatu Muhammed is a lecturer with Department of
Urban and Regional Planning, Nuhu Bamalli Polytechnic, Zaria.
Related Documents