Visual Tracing for the Eclipse Java Debugger Bilal Alsallakh, Peter Bodesinsky 1 , Alexander Gruber 2 , Silvia Miksch Centre of Visual Analytics Science and Technology (CVAST) Institute of Software Technology and Interactive Systems Vienna University of Technology Vienna, Austria Email: {alsallakh, miksch}@cvast.tuwien.ac.at, { 1 e0304343, 2 e0625633}@student.tuwien.ac.at Abstract—In contrast to stepping, tracing is a debugging technique that does not suspend the execution. This technique is more suitable for debugging programs whose correctness is compromised by the suspension of execution. In this work we present a tool for visually tracing Java programs in Eclipse. Tracepoint hits are collected on a per-instance basis. This enables finding out which tracepoints were hit for which objects at which time. The interactive visualization provides detailed information about the hits such as thread, stack trace, and assigned values. We implemented the tool as an Eclipse plugin that integrates with other features of Eclipse Java debugger. In an informal evaluation, developers appreciated the utility of our method as a solution in the middle between full tracing and stop-and-go debugging. They suggested scenarios in which our tool can help them in debugging and understanding their programs. I. I NTRODUCTION Eclipse has emerged as a mainstream IDE for the Java programming language. The Eclipse Java debugger allows the developer to perform program animation (also referred to as stepping) by setting several types of breakpoints. Breakpoints enable pausing the execution when a specific location in the code is reached, when a specific condition is met, or when a specific variable is being accessed. In some applications, it is not feasible for the debugger to interrupt the program’s execution long enough for the developer to learn anything helpful about its behavior [1]. If the program’s correctness depends on its real-time behavior, delays introduced by the debugger might cause the program to change its behavior, or perhaps fail, even when the code itself is correct. Examples of that arise when debugging application interfaces that involve user interaction. When a breakpoint defined in a method or on a variable that is involved in painting is hit, the program stops to respond to user interaction. Moreover, once the execution is resumed, the GUI needs to be repainted, which causes the breakpoint to be hit again. If the first hit does not reveal the bug, it would be difficult for the developer to reach the state that would reveal it. Two features of the Eclipse debugger can be used to avoid unwanted suspension of execution. One feature is to add conditions to breakpoints. Another feature is to set the hit count for a breakpoint: the breakpoint will stop the execution only if it has been (silently) hit a specific number of times. To choose the appropriate hit count or condition, the developer should have considerable knowledge about the logic behind the source-code being debugged. Another way to avoid unwanted suspension is to avoid using breakpoints at first. Instead, the developer can manually insert code snippets at the desired locations in the source code. These snippets print out the values that need to be checked to the console. After the code is executed, the developer can check the console to spot unexpected values. This mimics a debugging aid offered by some debuggers called tracepoints. In this work we propose a visual method for tracing Java programs in Eclipse. Our method fills a place in the middle between traditional stop-and-go debugging and full tracing. II. RELATED WORK The use of tracing as debugging aid dates back to the 1970s with several debuggers offering the possibility to add tracepoints in programs [2]. When a tracepoint is hit during execution, information about the current program state as well as the values of user-defined expressions are printed out. Fig. 1 shows traces generated by GNU Debugger [1]. Table I lists keywords that can be used to specify the information in these traces. Tracepoints are useful in performing post-mortem debugging, i.e. debugging a program after it has already crashed. However, the textual output makes it cumbersome to relate the traces especially with multiple tracepoints. Fig. 1. A trace in GNU Debugger [1]. Each line shows available information about a tracepoint hit (such as source location and parameter values). Keyword Evaluates to $ADDRESS The address of the instruction $CALLER The name of the function that called this function $CALLSTACK The state of the call stack $FUNCTION The name of the current function $PID The ID of the process $PNAME The name of the process $TID The ID of the thread $TNAME The name of the thread TABLE I TRACEPOINT KEYWORDS IN GNU DEBUGGER [3].

Welcome message from author
This document is posted to help you gain knowledge. Please leave a comment to let me know what you think about it! Share it to your friends and learn new things together.
Transcript
Visual Tracing for the Eclipse Java DebuggerBilal Alsallakh, Peter Bodesinsky1, Alexander Gruber2, Silvia Miksch
Centre of Visual Analytics Science and Technology (CVAST)Institute of Software Technology and Interactive Systems
Vienna University of TechnologyVienna, Austria
Email: {alsallakh, miksch}@cvast.tuwien.ac.at, {1e0304343, 2e0625633}@student.tuwien.ac.at
Abstract—In contrast to stepping, tracing is a debuggingtechnique that does not suspend the execution. This techniqueis more suitable for debugging programs whose correctness iscompromised by the suspension of execution. In this work wepresent a tool for visually tracing Java programs in Eclipse.Tracepoint hits are collected on a per-instance basis. This enablesfinding out which tracepoints were hit for which objects at whichtime. The interactive visualization provides detailed informationabout the hits such as thread, stack trace, and assigned values.We implemented the tool as an Eclipse plugin that integrateswith other features of Eclipse Java debugger. In an informalevaluation, developers appreciated the utility of our method asa solution in the middle between full tracing and stop-and-godebugging. They suggested scenarios in which our tool can helpthem in debugging and understanding their programs.
I. INTRODUCTION
Eclipse has emerged as a mainstream IDE for the Javaprogramming language. The Eclipse Java debugger allows thedeveloper to perform program animation (also referred to asstepping) by setting several types of breakpoints. Breakpointsenable pausing the execution when a specific location in thecode is reached, when a specific condition is met, or whena specific variable is being accessed. In some applications,it is not feasible for the debugger to interrupt the program’sexecution long enough for the developer to learn anythinghelpful about its behavior [1]. If the program’s correctnessdepends on its real-time behavior, delays introduced by thedebugger might cause the program to change its behavior, orperhaps fail, even when the code itself is correct. Examples ofthat arise when debugging application interfaces that involveuser interaction. When a breakpoint defined in a method or ona variable that is involved in painting is hit, the program stopsto respond to user interaction. Moreover, once the executionis resumed, the GUI needs to be repainted, which causes thebreakpoint to be hit again. If the first hit does not reveal thebug, it would be difficult for the developer to reach the statethat would reveal it.
Two features of the Eclipse debugger can be used to avoidunwanted suspension of execution. One feature is to addconditions to breakpoints. Another feature is to set the hitcount for a breakpoint: the breakpoint will stop the executiononly if it has been (silently) hit a specific number of times. Tochoose the appropriate hit count or condition, the developershould have considerable knowledge about the logic behindthe source-code being debugged.
Another way to avoid unwanted suspension is to avoid usingbreakpoints at first. Instead, the developer can manually insertcode snippets at the desired locations in the source code.These snippets print out the values that need to be checkedto the console. After the code is executed, the developer cancheck the console to spot unexpected values. This mimics adebugging aid offered by some debuggers called tracepoints.In this work we propose a visual method for tracing Javaprograms in Eclipse. Our method fills a place in the middlebetween traditional stop-and-go debugging and full tracing.
II. RELATED WORK
The use of tracing as debugging aid dates back to the1970s with several debuggers offering the possibility to addtracepoints in programs [2]. When a tracepoint is hit duringexecution, information about the current program state as wellas the values of user-defined expressions are printed out. Fig.1 shows traces generated by GNU Debugger [1]. Table Ilists keywords that can be used to specify the information inthese traces. Tracepoints are useful in performing post-mortemdebugging, i.e. debugging a program after it has alreadycrashed. However, the textual output makes it cumbersometo relate the traces especially with multiple tracepoints.
Fig. 1. A trace in GNU Debugger [1]. Each line shows available informationabout a tracepoint hit (such as source location and parameter values).
Keyword Evaluates to$ADDRESS The address of the instruction$CALLER The name of the function that called this function
$CALLSTACK The state of the call stack$FUNCTION The name of the current function
$PID The ID of the process$PNAME The name of the process
$TID The ID of the thread$TNAME The name of the thread
TABLE ITRACEPOINT KEYWORDS IN GNU DEBUGGER [3].
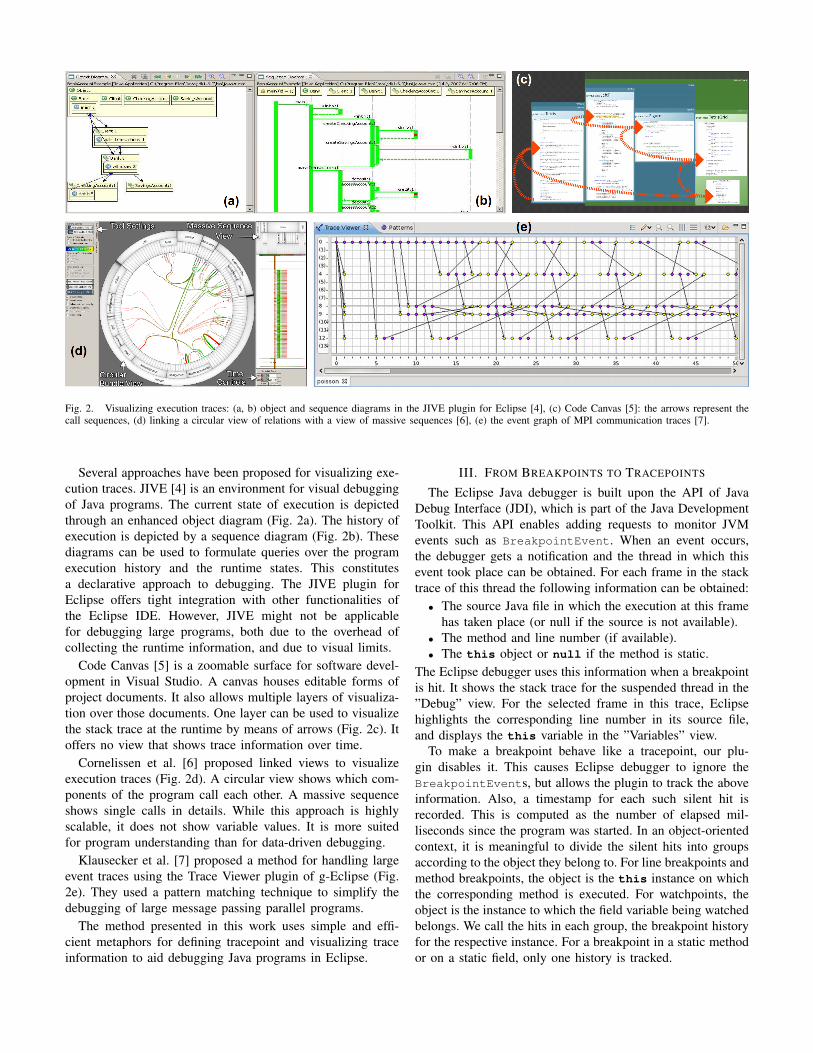
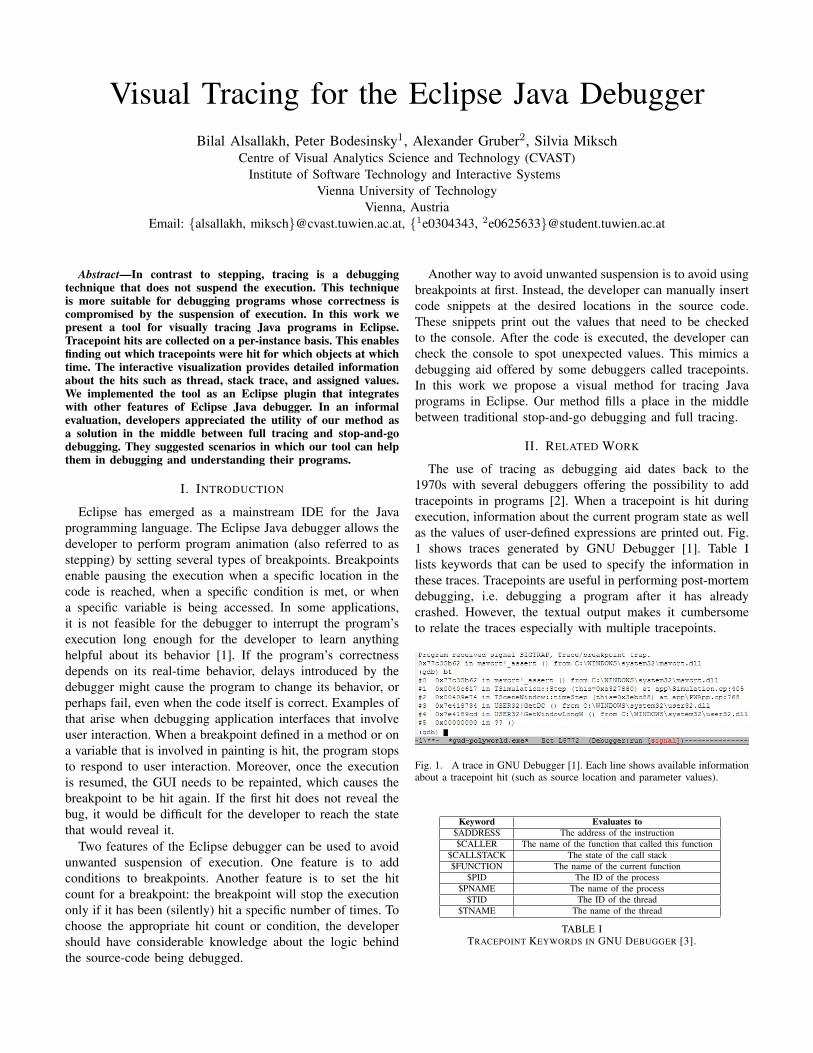
Fig. 2. Visualizing execution traces: (a, b) object and sequence diagrams in the JIVE plugin for Eclipse [4], (c) Code Canvas [5]: the arrows represent thecall sequences, (d) linking a circular view of relations with a view of massive sequences [6], (e) the event graph of MPI communication traces [7].
Several approaches have been proposed for visualizing exe-cution traces. JIVE [4] is an environment for visual debuggingof Java programs. The current state of execution is depictedthrough an enhanced object diagram (Fig. 2a). The history ofexecution is depicted by a sequence diagram (Fig. 2b). Thesediagrams can be used to formulate queries over the programexecution history and the runtime states. This constitutesa declarative approach to debugging. The JIVE plugin forEclipse offers tight integration with other functionalities ofthe Eclipse IDE. However, JIVE might not be applicablefor debugging large programs, both due to the overhead ofcollecting the runtime information, and due to visual limits.
Code Canvas [5] is a zoomable surface for software devel-opment in Visual Studio. A canvas houses editable forms ofproject documents. It also allows multiple layers of visualiza-tion over those documents. One layer can be used to visualizethe stack trace at the runtime by means of arrows (Fig. 2c). Itoffers no view that shows trace information over time.
Cornelissen et al. [6] proposed linked views to visualizeexecution traces (Fig. 2d). A circular view shows which com-ponents of the program call each other. A massive sequenceshows single calls in details. While this approach is highlyscalable, it does not show variable values. It is more suitedfor program understanding than for data-driven debugging.
Klausecker et al. [7] proposed a method for handling largeevent traces using the Trace Viewer plugin of g-Eclipse (Fig.2e). They used a pattern matching technique to simplify thedebugging of large message passing parallel programs.
The method presented in this work uses simple and effi-cient metaphors for defining tracepoint and visualizing traceinformation to aid debugging Java programs in Eclipse.
III. FROM BREAKPOINTS TO TRACEPOINTS
The Eclipse Java debugger is built upon the API of JavaDebug Interface (JDI), which is part of the Java DevelopmentToolkit. This API enables adding requests to monitor JVMevents such as BreakpointEvent. When an event occurs,the debugger gets a notification and the thread in which thisevent took place can be obtained. For each frame in the stacktrace of this thread the following information can be obtained:
• The source Java file in which the execution at this framehas taken place (or null if the source is not available).
• The method and line number (if available).• The this object or null if the method is static.
The Eclipse debugger uses this information when a breakpointis hit. It shows the stack trace for the suspended thread in the”Debug” view. For the selected frame in this trace, Eclipsehighlights the corresponding line number in its source file,and displays the this variable in the ”Variables” view.
To make a breakpoint behave like a tracepoint, our plu-gin disables it. This causes Eclipse debugger to ignore theBreakpointEvents, but allows the plugin to track the aboveinformation. Also, a timestamp for each such silent hit isrecorded. This is computed as the number of elapsed mil-liseconds since the program was started. In an object-orientedcontext, it is meaningful to divide the silent hits into groupsaccording to the object they belong to. For line breakpoints andmethod breakpoints, the object is the this instance on whichthe corresponding method is executed. For watchpoints, theobject is the instance to which the field variable being watchedbelongs. We call the hits in each group, the breakpoint historyfor the respective instance. For a breakpoint in a static methodor on a static field, only one history is tracked.
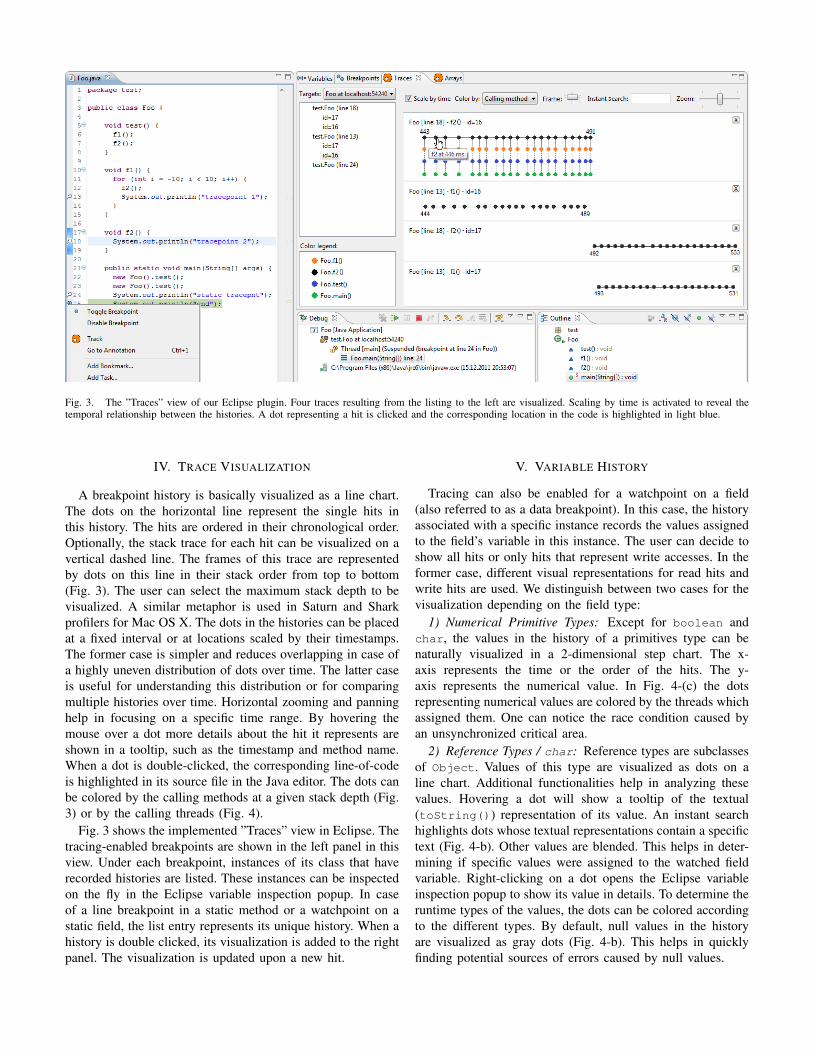
Fig. 3. The ”Traces” view of our Eclipse plugin. Four traces resulting from the listing to the left are visualized. Scaling by time is activated to reveal thetemporal relationship between the histories. A dot representing a hit is clicked and the corresponding location in the code is highlighted in light blue.
IV. TRACE VISUALIZATION
A breakpoint history is basically visualized as a line chart.The dots on the horizontal line represent the single hits inthis history. The hits are ordered in their chronological order.Optionally, the stack trace for each hit can be visualized on avertical dashed line. The frames of this trace are representedby dots on this line in their stack order from top to bottom(Fig. 3). The user can select the maximum stack depth to bevisualized. A similar metaphor is used in Saturn and Sharkprofilers for Mac OS X. The dots in the histories can be placedat a fixed interval or at locations scaled by their timestamps.The former case is simpler and reduces overlapping in case ofa highly uneven distribution of dots over time. The latter caseis useful for understanding this distribution or for comparingmultiple histories over time. Horizontal zooming and panninghelp in focusing on a specific time range. By hovering themouse over a dot more details about the hit it represents areshown in a tooltip, such as the timestamp and method name.When a dot is double-clicked, the corresponding line-of-codeis highlighted in its source file in the Java editor. The dots canbe colored by the calling methods at a given stack depth (Fig.3) or by the calling threads (Fig. 4).
Fig. 3 shows the implemented ”Traces” view in Eclipse. Thetracing-enabled breakpoints are shown in the left panel in thisview. Under each breakpoint, instances of its class that haverecorded histories are listed. These instances can be inspectedon the fly in the Eclipse variable inspection popup. In caseof a line breakpoint in a static method or a watchpoint on astatic field, the list entry represents its unique history. When ahistory is double clicked, its visualization is added to the rightpanel. The visualization is updated upon a new hit.
V. VARIABLE HISTORY
Tracing can also be enabled for a watchpoint on a field(also referred to as a data breakpoint). In this case, the historyassociated with a specific instance records the values assignedto the field’s variable in this instance. The user can decide toshow all hits or only hits that represent write accesses. In theformer case, different visual representations for read hits andwrite hits are used. We distinguish between two cases for thevisualization depending on the field type:
1) Numerical Primitive Types: Except for boolean andchar, the values in the history of a primitives type can benaturally visualized in a 2-dimensional step chart. The x-axis represents the time or the order of the hits. The y-axis represents the numerical value. In Fig. 4-(c) the dotsrepresenting numerical values are colored by the threads whichassigned them. One can notice the race condition caused byan unsynchronized critical area.
2) Reference Types / char: Reference types are subclassesof Object. Values of this type are visualized as dots on aline chart. Additional functionalities help in analyzing thesevalues. Hovering a dot will show a tooltip of the textual(toString()) representation of its value. An instant searchhighlights dots whose textual representations contain a specifictext (Fig. 4-b). Other values are blended. This helps in deter-mining if specific values were assigned to the watched fieldvariable. Right-clicking on a dot opens the Eclipse variableinspection popup to show its value in details. To determine theruntime types of the values, the dots can be colored accordingto the different types. By default, null values in the historyare visualized as gray dots (Fig. 4-b). This helps in quicklyfinding potential sources of errors caused by null values.
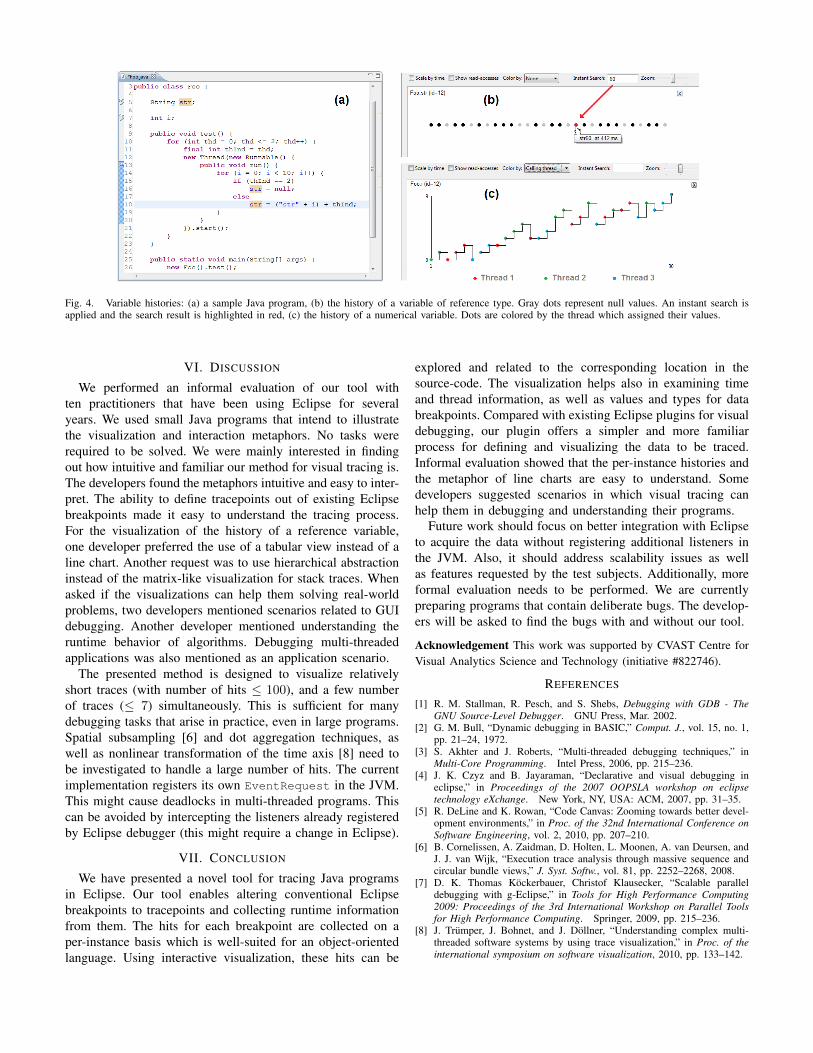
Fig. 4. Variable histories: (a) a sample Java program, (b) the history of a variable of reference type. Gray dots represent null values. An instant search isapplied and the search result is highlighted in red, (c) the history of a numerical variable. Dots are colored by the thread which assigned their values.
VI. DISCUSSION
We performed an informal evaluation of our tool withten practitioners that have been using Eclipse for severalyears. We used small Java programs that intend to illustratethe visualization and interaction metaphors. No tasks wererequired to be solved. We were mainly interested in findingout how intuitive and familiar our method for visual tracing is.The developers found the metaphors intuitive and easy to inter-pret. The ability to define tracepoints out of existing Eclipsebreakpoints made it easy to understand the tracing process.For the visualization of the history of a reference variable,one developer preferred the use of a tabular view instead of aline chart. Another request was to use hierarchical abstractioninstead of the matrix-like visualization for stack traces. Whenasked if the visualizations can help them solving real-worldproblems, two developers mentioned scenarios related to GUIdebugging. Another developer mentioned understanding theruntime behavior of algorithms. Debugging multi-threadedapplications was also mentioned as an application scenario.
The presented method is designed to visualize relativelyshort traces (with number of hits ≤ 100), and a few numberof traces (≤ 7) simultaneously. This is sufficient for manydebugging tasks that arise in practice, even in large programs.Spatial subsampling [6] and dot aggregation techniques, aswell as nonlinear transformation of the time axis [8] need tobe investigated to handle a large number of hits. The currentimplementation registers its own EventRequest in the JVM.This might cause deadlocks in multi-threaded programs. Thiscan be avoided by intercepting the listeners already registeredby Eclipse debugger (this might require a change in Eclipse).
VII. CONCLUSION
We have presented a novel tool for tracing Java programsin Eclipse. Our tool enables altering conventional Eclipsebreakpoints to tracepoints and collecting runtime informationfrom them. The hits for each breakpoint are collected on aper-instance basis which is well-suited for an object-orientedlanguage. Using interactive visualization, these hits can be
explored and related to the corresponding location in thesource-code. The visualization helps also in examining timeand thread information, as well as values and types for databreakpoints. Compared with existing Eclipse plugins for visualdebugging, our plugin offers a simpler and more familiarprocess for defining and visualizing the data to be traced.Informal evaluation showed that the per-instance histories andthe metaphor of line charts are easy to understand. Somedevelopers suggested scenarios in which visual tracing canhelp them in debugging and understanding their programs.
Future work should focus on better integration with Eclipseto acquire the data without registering additional listeners inthe JVM. Also, it should address scalability issues as wellas features requested by the test subjects. Additionally, moreformal evaluation needs to be performed. We are currentlypreparing programs that contain deliberate bugs. The develop-ers will be asked to find the bugs with and without our tool.
Acknowledgement This work was supported by CVAST Centre forVisual Analytics Science and Technology (initiative #822746).
REFERENCES
[1] R. M. Stallman, R. Pesch, and S. Shebs, Debugging with GDB - TheGNU Source-Level Debugger. GNU Press, Mar. 2002.
[2] G. M. Bull, “Dynamic debugging in BASIC,” Comput. J., vol. 15, no. 1,pp. 21–24, 1972.
[3] S. Akhter and J. Roberts, “Multi-threaded debugging techniques,” inMulti-Core Programming. Intel Press, 2006, pp. 215–236.
[4] J. K. Czyz and B. Jayaraman, “Declarative and visual debugging ineclipse,” in Proceedings of the 2007 OOPSLA workshop on eclipsetechnology eXchange. New York, NY, USA: ACM, 2007, pp. 31–35.
[5] R. DeLine and K. Rowan, “Code Canvas: Zooming towards better devel-opment environments,” in Proc. of the 32nd International Conference onSoftware Engineering, vol. 2, 2010, pp. 207–210.
[6] B. Cornelissen, A. Zaidman, D. Holten, L. Moonen, A. van Deursen, andJ. J. van Wijk, “Execution trace analysis through massive sequence andcircular bundle views,” J. Syst. Softw., vol. 81, pp. 2252–2268, 2008.
[7] D. K. Thomas Kockerbauer, Christof Klausecker, “Scalable paralleldebugging with g-Eclipse,” in Tools for High Performance Computing2009: Proceedings of the 3rd International Workshop on Parallel Toolsfor High Performance Computing. Springer, 2009, pp. 215–236.
[8] J. Trumper, J. Bohnet, and J. Dollner, “Understanding complex multi-threaded software systems by using trace visualization,” in Proc. of theinternational symposium on software visualization, 2010, pp. 133–142.
Related Documents