A Work Project, presented as part of the requirements for the Award of a Master Degree in Management from the NOVA – School of Business and Economics Visual Merchandising Influence on Fashion Brands’ Equity – Consumer Perspective Vera Lúcia Madeira da Piedade, #2508 A Project carried out on the Master in Management Program, under the supervision of: Luis Manuel da Silva Rodrigues January 2017

Welcome message from author
This document is posted to help you gain knowledge. Please leave a comment to let me know what you think about it! Share it to your friends and learn new things together.
Transcript
A Work Project, presented as part of the requirements for the Award of a Master Degree in
Management from the NOVA – School of Business and Economics
Visual Merchandising Influence on Fashion Brands’ Equity –
Consumer Perspective
Vera Lúcia Madeira da Piedade, #2508
A Project carried out on the Master in Management Program, under the supervision of:
Luis Manuel da Silva Rodrigues
January 2017

1
Abstract
Nowadays brands are spending a lot of money creating its brand image, still, many times
they neglect the visual aspects of stores while it reflects the face of brands. Using a descriptive
method with Factor Analyses and multiple regressions, the present research suggests that visual
merchandising dimensions can influence the value customers attribute to brands. Two main
dimensions of visual merchandising and three constructs of consumer-based brand equity were
found and their relationships recommend fashion retailers should consider interior and layout
aspects in consumers’ favourable and strength of associations of their brands, and the exterior
window displays in terms of awareness.
Keywords: Visual Merchandising, Consumer-based brand equity, brand image, fashion retail
brands, Factor Analysis

2
Table of Contents
Abstract ..................................................................................................................................... 1
Table of Contents ..................................................................................................................... 2
1. Introduction .................................................................................................................. 3
2. Literature Review ......................................................................................................... 4
2.1. Visual Merchandising ........................................................................................ 4
2.1.1. Interior ................................................................................................... 5
2.1.2. Exterior .................................................................................................. 7
2.2. Brand Equity – A Consumer Perspective ........................................................... 8
2.3. CBBE and Visual Merchandising ...................................................................... 9
3. Methodology ............................................................................................................... 11
3.1. Data Collection ................................................................................................. 12
3.2. Procedures for Data Analysis ........................................................................... 14
4. Data Analysis .............................................................................................................. 15
4.1. EFA for Visual Merchandising ........................................................................ 16
4.2. EFA for CBBE ................................................................................................. 17
4.3. Hypothesis Testing ........................................................................................... 19
5. Results ......................................................................................................................... 22
5.1. Visual Merchandising effects on Brand Favourability .................................... 22
5.2. Visual Merchandising effects on Brand Awareness and Strength ................... 22
5.3. Visual Merchandising effects on Brand Uniqueness ....................................... 22
5.4. Discussion of Results – Can Visual Merchandising influence CBBE? ........... 23
6. Conclusions and Recommendations ......................................................................... 24
7. Limitations and Directions for Future Research .................................................... 25
8. References ................................................................................................................... 26
9. Appendix ..................................................................................................................... 29

3
1. Introduction
It is easy to sell anything, difficult is to develop a brand. In modern times, stores are
becoming a place where people go to enjoy a different experience that will make them feel good
(Hefer & Cant, 2013). Visual merchandising has an essential role in inferring different
customers’ perceptions and add value to brands. Its main objective is no longer just making
products attractive to sell them fast; it is about standing out, building the right brand image and
provide the best customer experience possible. In their study on hedonic shopping motivations,
Arnold and Reynolds (2003) have an interest view on this by calling it “entertailing”, the
entertainment facet of retailing (Arnold & Reynolds, 2003). As retail brands strive to succeed
in the already saturated market, visual merchandising becomes an important factor of
differentiation from retailers in the same category. Consumers make their purchase decisions
at the actual point of sale up to 80 percent of the time (Ebster & Garaus, 2011), and it’s time
for companies to take advantage of that and consider visual merchandising in its retail strategy.
It is recognized that many benefits can come from this technique - it communicates directly
with the target customers, change their behaviour and hopefully lead to a purchase. If properly
used, visual merchandising elements can enter the buyer’s consciousness and instigate them to
form a positive evaluation of the store, and thus, leverage its brand image (Nistorescu & Barbu,
2008).
Regardless of the strong use of this technique in other sectors, visual merchandising
cues are mostly associated with fashion retailing (Ebster & Garaus, 2011). The complexity of
fashion branding strategies imposes a need to consider many issues when developing a brand,
including the physicality of the store (Davies & Ward, 2005). However, researchers have been
studying visual merchandising with an emphasis on sales and purchase behaviour and put little
focus on how it may affect the overall brand value. Also, there’s a lack of research on customer-
based brand equity relating to visual merchandising.
4
As Portuguese consumers’ habits are changing and stimulating the overall retailing
environment in Portugal, the consumption of indulgence products is increasing rapidly. Those
clearly include fashion products (Euromonitor, 2016). In addition, over 62% of Portuguese
young adults are highly involved in fashion (Cardoso, Costa, & Novais, 2010). Still, visual
merchandising is a concept that is not very familiar in Portugal. This creates an opportunity to
explore the Portuguese fashion consumer in what concerns to visual merchandising dimensions
and perceptions of brands.
This research will complement the already existing literature while dealing with brand
image and brand awareness as in the point of view of the consumer-based brand equity model,
i.e. brand equity seen in a consumer perspective rather than a financial one (Ailawadi & Keller,
2004). Thus, the primary objective is to find out how visual merchandising techniques in-store
can influence consumer’s perspectives and feelings towards the brand itself.
2. Literature Review
2.1. Visual Merchandising
With modern brand strategies, the concept of visual merchandising has been discussed
a lot over the last 10 years. As most purchase decisions are made inside the stores, it makes an
ideal marketing tool for brands.
Authors have been defining visual merchandising in numerous ways. It can be seen as
an art, a process, and a marketing strategy (Bhatti & Latif, 2014; Ebster & Garaus, 2011;
Morgan, 2008) with the purpose of presenting products at the point of sale in the most efficient
and attractive way possible, and ultimately lead the costumers to make a purchase. It includes
everything the customer sees, feels, and percept of the stimulus around them.
With similar products on the market, there’s an increasing competition among clothing
and apparel companies and the need to differentiate becomes a top priority for those brands.
5
Visual merchandising can provide that product distinction, improve its desirability and maintain
competitors away (Mehta & Chugan, 2013). However, each store is different, and while grocery
stores focus on functionality, apparel stores will put an effort on creating the right atmosphere
(Morgan, 2008). With the efficient use of visual merchandising techniques, the products almost
sell themselves (Ebster & Garaus, 2011). Fashion retail remains the strongest sector using visual
merchandising techniques as a tool in its marketing mix, due to its higher complexity in
displaying when compared with other sector’s companies (Kerfoot, Davies, & Ward, 2003)
with the exception of some airlines, restaurants, and department stores (Kotler, 1974).
Turley and Milliman (2000) divided visual merchandising into five categories: exterior,
interior, store layout and design, point-of-purchase and decoration, and human variables
(Turley & Milliman, 2000). Other authors identified other aspects such as Window Display
(Morgan, 2008; Seock & Lee, 2013). Essentially, the two major areas covered in visual
merchandising are the store interior and exterior in which a variety of issues can be addressed
to create a favourable shopping atmosphere (Law, Wong, & Yip, 2012).
2.1.1. Interior
When customers walk across the store, they look for brand meanings that can emerge
through the interior style and design (Nistorescu & Barbu, 2008). It is the point of impact, the
deliverance of expectation. These can be translated from store aesthetics such like the materials
used, the walls, lighting, colours, music, signage to layout aspects and overall functionality of
the store (Matthews, Hancock, & Gu, 2014; Mehta & Chugan, 2013; Nistorescu & Barbu,
2008). Ralph Lauren’s store in New York is a great example on how using themes and props in
the interior displays instead of the conventional mannequins can create a narrative that wonders
anyone who steps into the store (Matthews et al., 2014).
Some authors highlight the importance of “store atmosphere” or “atmospherics” in this
matter (Ebster & Garaus, 2011; Kotler, 1974; Kumar & Kim, 2014). Kotler (1974) defines it as
6
“the effort to design buying environments to produce specific emotional effects in the buyer
that enhance his purchase probability” (Kotler, 1974). Unlike other practices of marketing
communication, interior atmosphere appeals to the customers’ five senses (Park, Jeon, &
Sullivan, 2015). Of the five senses, several authors emphasize the olfactory sense as the
strongest one to have an effect on customers’ mood (Ebster & Garaus, 2011); and visual aspects
of the store which can regulate the buyer’s arousal level. There’s some incongruence among
authors in what concerns to lighting, while some argue that soft lighting creates a better mood
(Meer, 1985), others believe that bright stores lead to a higher excitement level on shoppers,
causing more impulse purchases (Ebster & Garaus, 2011). The first visual stimuli a customer
sees in a store is colour, which can be an effective tool to attract attention to any point of the
store. Colour needs to tell a story, comfort or calm customers, and build brand recognition. A
successful example of colour use as a brand identity is Zara, with its monochrome stores and
displays, which are very popular in Europe (Opriş & Brătucu, 2013). Ultimately, it is important
to suit the music style to the store’s ambiance and type of customer (Morgan, 2008) as it have
the power to connect the customer to the store and influence its perceptions of quality, price
and service (Ebster & Garaus, 2011).
There’s no such thing as the perfect atmosphere for each store/brand. But in order to
craft the effective one, retailers need to be taking into account the cultural trends, company
history, product category and target customer’s needs when creating the adequate scent, music
and light present in its stores (Ebster & Garaus, 2011; Kotler, 1974; Turley & Milliman, 2000).
As an example, let’s take the international retail brand Abercrombie & Fitch. Their stores,
including layout and staff, are visually manipulated to target millennials and American “cool
kids” in an effective way.
With the increasing number of stores in the industry with similar prices, atmospherics
becomes crucial to retailers as it instantly influences customers’ choice between stores in the

7
same category (Baker, Grewal, & Levy, 1992; Kotler, 1974). So, it is important that customers
perceive the connection between the overall ambience, the products sold and the brand.
The functional aspect of the store must be very well planned as well so customers can
feel comfortable while exploring it. It relates to organization and layout of the store and the
goal is to provide convenience for the customers’ so they can quickly find the product they’re
looking for, or even get in and out of the store with ease (Baker, Grewal, & Voss, 2002).
Equipment, furniture, division of departments, they all have a role in visual merchandising. The
use of signage is one of the least costly instruments used to improve customer orientation. Other
instruments include props and mannequins which can attract customers over a long distance
and clarify the function of the merchandise (Ebster & Garaus, 2011). Eventually, it should be a
top priority for brands to incorporate the best store layout possible with the space they have.
2.1.2. Exterior
The store’s exterior represents the brand. This is the visual merchandising element that
have the power to catch customers’ attention and persuade them inside the store. Exterior
elements refer to the overall store front: the façade, building architectural style, exterior signs
and last but not least, window displays (Nistorescu & Barbu, 2008). This study will be focusing
mostly on window displays as they are an exterior technique that has been broadly recognized
as a marketing tool over major companies in the fashion industry and often used as brand
identification (Guimaraes, 2011). Nowadays, it represents brand image (Morgan, 2008; Opriş
& Brătucu, 2013) and convince people to visit the store by using appealing windows. Many
retailers often use them to cause a reaction rather than focusing on products to create impact on
peoples’ minds.
Mannequins are a popular trademark of window displays, and several techniques can be
used so people can aspire to look like them (Morgan, 2008). According to Ebster and Garaus
(2011), there are three characteristics that draw customers’ attention to a display: contrast
8
(colour and movement), novelty (surprise) and position (Ebster & Garaus, 2011). A good
example is the use of unusual fixtures and props or use politics, social statements or other
trending themes to get the passers-by attention (Morgan, 2008). This helps a brand to
differentiate from the competition and create a sense of uniqueness.
2.2. Brand Equity – A Consumer Perspective
Many researches have been addressing brand equity as an important success factor and
a way of differentiating companies in the market (Aaker, 1991; Farjam & Hongyi, 2015; Keller,
2013). Both Aaker (1991) and Keller (1993) defined brand equity from a customer perspective
rather than a financial one, still, each concept of brand equity is different.
Aaker (1991) defined brand equity as “a set of brand assets and liabilities linked to a
brand, its name and symbol, that add to or subtract from the value provided by a product or
service to a firm and/or to that firm’s customers”. The author’s model consists of five different
assets representing the source of the value creation: brand loyalty, name awareness, perceived
quality, brand associations in addition to perceived quality, and other proprietary brand assets
(Aaker, 1991).
In his consumer-based brand equity (CBBE) model, Keller the real power and value a
brand has is placed in consumer’s minds. What the consumer have seen, felt, heard, and thought
about the brand can help to develop strong, unique and favourable brand associations, which
can be represented by the consumers’ brand knowledge. CBBE lies then, in consumers’ more
favourable reactions to a brand’s marketing strategies, when compared to other similar brands
or fictitious brand (Keller, 2013).
Keller’s (1993) conceptual framework explains how brand knowledge can be portrayed
through brand awareness and brand image. Brand awareness refers to the consumers’ ability to
identify the brand among other brands and recall it in the most varied situations. It is then

9
composed by brand recognition and brand recall, thus, it also include how the brand name, logo
and symbol is connected to a certain association in customers’ memory (Farjam & Hongyi,
2015). This is important for brands since highly aware brands are the most considerable in
customers’ purchase decision cycle even when there’s no other brand associations (Rajh, 2002).
Brand image is defined here as the consumers’ perceptions translated into brand associations in
consumers’ memory. These can be further composed by the strength, uniqueness and
favourability of brand associations (Ailawadi & Keller, 2004). Strength of associations relates
to how easily a person can access brand associations held in the memory (Hartman & Spiro,
2005). It depends on how the information enters the consumer’s memory and how it is
maintained as part of the brand image. The favourability of brand associations is important to
understand if consumers believe that the brand has attributes that satisfy their needs and wants
(Rajh, 2002). Uniqueness of brand associations refers to associations a brand may or may not
share with other competing brands. Furthermore, Silverman, Sprott, and Pascal (1999) provided
evidence that CBBE measures assessed through strength, favourability, and uniqueness of
brand associations are potential indicators of brand performance (Silverman, Sprott, & Pascal,
1999).
Consequently, and according to CBBE model, brand equity occurs when the customer
has a high brand awareness (familiarity) and hold strong, favourable and unique brand
associations (Farjam & Hongyi, 2015).
2.3. CBBE and Visual Merchandising
With all the advertisements, magazines and online information readily available,
customers get constantly exposed to information about brands. More and more, fashion
companies try to communicate and provide the best experience to customers through their
stores. This is why sometimes stores are designed not to sell the products, but to inspire, so it
10
can infer some feelings and opinions about the brand (Morgan, 2008). This in-store experience
may improve brand image and eventually have an effect on brand equity (Takahashi, 2014).
When faced with stimulus in the store, customers will process it and form an initial mental
image that ultimately gets translated into emotions and impact their behaviours toward the store
(Mazursky & Jacoby, 1986). Former works added that social, design, and ambient aspects of a
store influence cognitive evaluations and eventually approach behaviour toward retailers
(Kumar & Kim, 2014). So, with the proper use of visual merchandising elements, store image
can contribute to the development of brand image (Nistorescu & Barbu, 2008).
Communication becomes an essential tool here as stores are the place where a direct
two-way interaction between customers and the brand occurs, and modern companies need to
take in consideration visual merchandising at their point-of-sale (Niazi, 2015). Still, all
marketing communication efforts should present the same language and show a consistent
image throughout all marketing channels (Guedes & Soares, 2005). Many visual merchandisers
use displays to pass a message and enhance certain features of the products of its brand and,
consequently, of its consumers (Guimaraes, 2011). The consumer, in the receiver side, is then
seduced by the stimulus around him. More than to inform the customers about the products,
visual merchandising undoubtedly connects the customer to the brand.
Moreover, different studies concluded that cues on visual merchandising can catch
customer’s attention inside the stores and create a brand node in their minds. Nistorescu and
Barbu discovered that signs, symbols, organization and functionality of the store contribute to
brand recognition (Nistorescu & Barbu, 2008); while other researchers emphasize how further
elements of visual merchandising can contribute to a more salient brand that then consumers
will retrieve faster than other brands (brand recall). Park et al.’s investigation suggests that in-
fashion and attractiveness of visual merchandising have a positive effect on brand aesthetic
11
attributes; and functionality has a significant positive effect on brand utilitarian attributes (Park
et al., 2015).
All CBBE drivers’ have then, a relationship with visual merchandising constructs as the
latest can provide brand uniqueness and distinction from competition, enhance brand recall and
recognition, and infer strong favourable feelings associated with the brand. As an important
vehicle of fashion branding (Matthews et al., 2014), visual merchandising can, then, become a
complex process.
3. Methodology
This dissertation will use a descriptive method, as the objective is to test hypotheses and
study how visual merchandising is relevant for the construction of a consumer-based brand
equity. It also seeks to understand consumer behaviours and preferences when it comes to store
atmosphere and layout. To confirm findings, brand performance assessments will be done as
well. Moreover, this study will have a focus on fashion brands and how these constructs affect
Portuguese consumers. Visual merchandising will be treated as a “silent sales person” (Hefer
& Cant, 2013; Kotler, 1974), and supported by the literature review, it will emphasize the
internality (store atmosphere and store layout) and externality of the store (including window
display). Aaker’s (1991) model does not have clear quantitative measurement estimators and
brand image is not distinguished as an element of the brand equity (Bivainiene & Sliburyte,
2008). Instead, Keller’s model offers brand equity components that can be easily adapted to
any study (Jara & Cliquet, 2007) and thus, it seems to be a more appropriate approach for this
research. Data was analysed using the Statistical Package for Social Science (SPSS) software
to conduct t-tests, ANOVA’s, Factor Analyses (FA), Pearson correlations and Multiple
regressions.
12
3.1. Data Collection
An online survey was created using “Qualtrics” and distributed through Facebook and
e-mail to respondents. The study used a convenience sampling, a non-probability
sampling technique in which respondents are selected because they are in the right place at the
right time (Malhotra & Birks, 1999).
The main purpose of the survey is to understand how visual merchandising dimensions
and consumer-based brand equity are linked. The survey was also used to obtain respondents
demographics and evaluate consumer attitude towards visual merchandising and preferences as
a buyer (see Appendix 1).
To measure each concept, a 5-point Likert-type scale (1-Strongly Disagree to 5-Strongly
Agree) was adopted. Out of the other itemized rating scales, the Likert scale seems to be the
most adequate to apply in this study considering its suitability for Internet surveys, as well as
its ease in understanding how to use. As for disadvantages, it takes longer to complete than
other scales since the respondent need to fully read all items and reflect on its answer (Malhotra
& Birks, 1999). The questionnaire was kept small and simple, focusing on the main research
questions so respondents don’t spend too many time answering it. An odd number of categories
for the scale was used because it was considered that some items required a neutral option.
The first two questions were made so the respondents could choose the brand he/she
would like to answer the questions about, and to understand how familiar these brands are to
them. Respondents had to choose between Zara, Bershka and Primark. These brands were
chosen due to its popularity amongst Portuguese consumers. A study by Leal (2006) found that
Zara is the most well-known and preferred brand in Portugal (Leal, 2006). This brand has a
large distribution in Portugal, with stores in every city, which makes it a very popular brand.
Bershka was the second brand referred in the study, and since it is a brand with very specific
characteristics, it was considered for this questionnaire. Lastly, Primark was chosen due to its
13
increasing popularity in Portugal. According to Pereira (2013), trendy low-cost brands have
been conquering the Portuguese public, and Primark is the major one (Pereira, 2013).
In the third question was asked the frequency of visits to the store in question, so it can
give us an insight into how recent people’s thoughts are towards the store they selected. The
second part of the questionnaire, refers to the main information needed for this research. A
group of statements were presented so interviewees could rate their agreement-disagreement
level using the Likert scale from 1 to 5, being 1 “totally disagree” and 5 “totally agree”. Each
item measured visual merchandising and brand equity dimensions. Some of the items for visual
merchandising were adapted from previous research by Park, Jeon and Sullivan (2014), and
certain items for brand equity were developed using measures created by Rajh (2002). The scale
created by Rajh was developed after three studies so it provides a good measure of brand equity
(Rajh, 2002). In Park et al. (2014) research, visual merchandising variables were
operationalized differently, hence, the items were adapted according to this dissertation
objectives. We expect to find three visual merchandising dimensions: exterior (including
Window Displays), interior (store atmosphere) and store layout. Brand equity is expected to be
composed by brand awareness, strength, favourability and uniqueness of brand associations.
An additional construct will be developed, as it is connected to brand equity, which are
associations of brand performance.
The third group of questions was composed by two questions with the purpose to
identify what might affect consumers’ decision to enter or exit the store. These questions will
help understanding whether visual merchandising is consciously or subconsciously considered
when deciding which store to shop. The last part of the questionnaire was used to classify
respondents and complied classification information such as socio-economic and demographic
characteristics.
14
3.2. Procedures for Data Analysis
After collected all the data necessary, there were 209 valid answers ready for analysis.
The most selected brand was Zara (59%), next to Primark (26%) and Bershka (15%) (Appendix
2). After executed a t-test, we can conclude that people who were surveyed had a significant
familiarity with the brands selected (t(207)=20.093, p=0.000) with a mean of 4.32 (Familiar),
which means the brands were appropriately selected for this study. Also, respondents were
significantly updated with the current aspect of the stores selected (t(208)=14.569, p=0.000)
with a mean of at least one visit per month over the last year. To check for further suitability of
data collection, opinions on visual merchandising were tested via ANOVA to make sure the
brand chosen by the respondents would give the same results as any other brand. For this test,
the variable used to represent visual merchandising was the question INT_1 (“Store image
influences my opinion about a brand”) (see Appendix 4). The test is not significant
(F(2,206)=2.633, p=0.074>0.05), hence, the opinion about the store environment overall didn’t
change depending on the brand choice.
Visual Merchandising and Brand Equity variables were analysed through a Factor
Analysis (FA), more specifically, two Exploratory Factor Analysis (EFA) were conducted.
When items are used to represent a single concept, factor analysis can confirm it by its
identification as a factor (Walker & Maddan, 2013). This statistical technique essentially
reduces the number of items and combine them into a single factor without losing information,
while redundant information induced by sampling/measurement errors, are removed. EFA is
then, a tool that determines if the measures used in the questionnaire have in fact measured
what they are supposed to measure (Matsunaga, 2010). Many researchers mix up Principal
Components Analysis (PCA) for EFA, though, PCA does not distinguish between shared and
unique variance, and EFA focus on common variance among variables (Walker & Maddan,
2013).
15
Before running an EFA, we need to make sure the variables are measured at an interval
level and that an adequate sample size was used (Reinhard, 2006; Walker & Maddan, 2013).
All variables studied were measured using a Likert-scale, which is an interval measurement.
Our sample size is N=209, which is superior to the minimum criteria of 100 for FA’s (Gorsuch,
1974) and the ratio of the sample size to the number of items is over 10 for both analyses
(Everitt, 1975), which means the sample is big enough for the analysis. Also, correlations
between items were examined and low correlation items were discarded (INT_1 and INT_8)
(see Appendix 4). To avoid extreme multicollinearity, the determinant in the correlation matrix
was checked and showed values of 0.00001323 and 0.0000134 for visual merchandising and
CBBE variables respectively. Both are greater than 0.00001, hence multicollinearity is not a
problem (Reinhard, 2006).
The method used for both analyses was Principal Axis Factoring, since it gives the best
results for non-normally distributed data and is less likely to produce improper solutions than
maximum likelihood methods; and since we expect variables to be correlated, an oblique
rotation (promax) was used (Fabrigar, Wegener, MacCallum, & Strahan, 1999).
4. Data Analysis
The sample used is formed by 66 (32%) males and 143 (68%) females with ages evenly
dispersed. Most of respondents had a Bachelor degree (45%), and 64% were employed, while
23% were students, 5% unemployed and 6% retired. Annual household income was mostly
between 7.000€ and 20.000€ (45%) (see Appendix 2). The last group of questions of the survey
asked for a direct opinion on visual merchandising elements, and was not directed to the specific
brands provided. We can further confirm the importance of these elements, since respondents
expressed the need to leave the store when loud music is played (66%), the store has
inappropriate temperature (60%) and when products are disorganized (81%); while buying
intentions increase when the overall presentation of the store is adequate (54%) (Appendix 3).
16
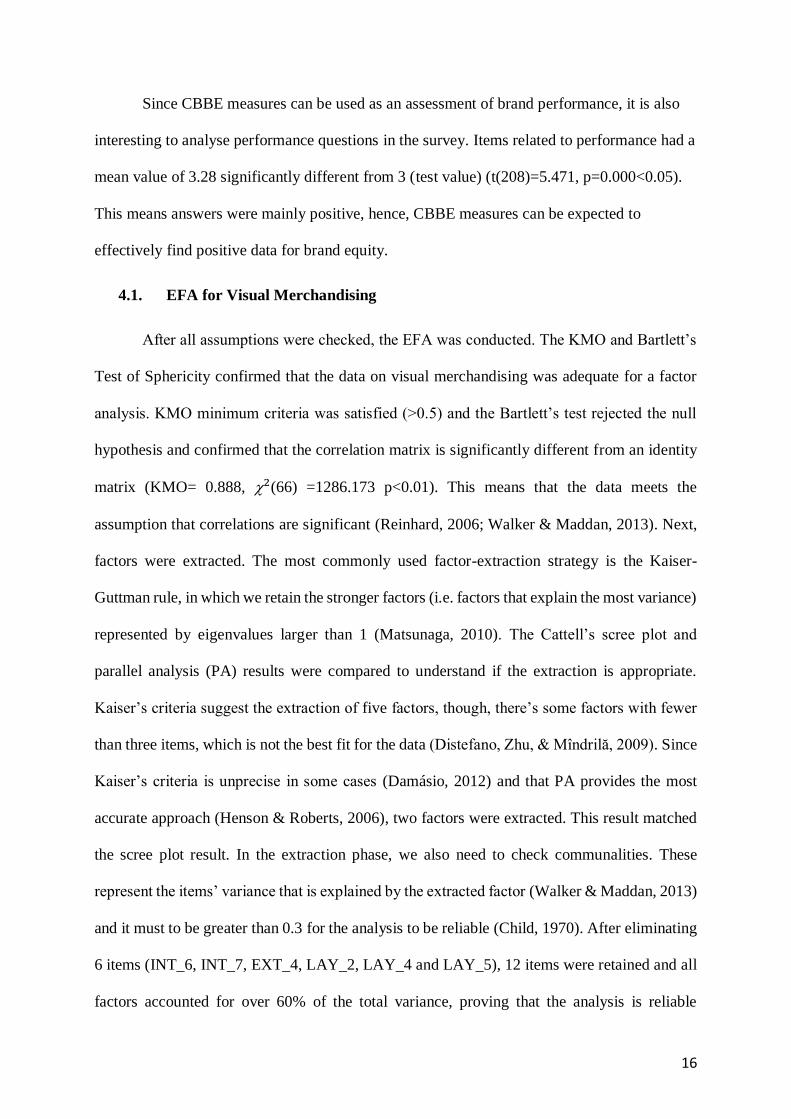
Since CBBE measures can be used as an assessment of brand performance, it is also
interesting to analyse performance questions in the survey. Items related to performance had a
mean value of 3.28 significantly different from 3 (test value) (t(208)=5.471, p=0.000<0.05).
This means answers were mainly positive, hence, CBBE measures can be expected to
effectively find positive data for brand equity.
4.1. EFA for Visual Merchandising
After all assumptions were checked, the EFA was conducted. The KMO and Bartlett’s
Test of Sphericity confirmed that the data on visual merchandising was adequate for a factor
analysis. KMO minimum criteria was satisfied (>0.5) and the Bartlett’s test rejected the null
hypothesis and confirmed that the correlation matrix is significantly different from an identity
matrix (KMO= 0.888, 2(66) =1286.173 p<0.01). This means that the data meets the
assumption that correlations are significant (Reinhard, 2006; Walker & Maddan, 2013). Next,
factors were extracted. The most commonly used factor-extraction strategy is the Kaiser-
Guttman rule, in which we retain the stronger factors (i.e. factors that explain the most variance)
represented by eigenvalues larger than 1 (Matsunaga, 2010). The Cattell’s scree plot and
parallel analysis (PA) results were compared to understand if the extraction is appropriate.
Kaiser’s criteria suggest the extraction of five factors, though, there’s some factors with fewer
than three items, which is not the best fit for the data (Distefano, Zhu, & Mîndrilă, 2009). Since
Kaiser’s criteria is unprecise in some cases (Damásio, 2012) and that PA provides the most
accurate approach (Henson & Roberts, 2006), two factors were extracted. This result matched
the scree plot result. In the extraction phase, we also need to check communalities. These
represent the items’ variance that is explained by the extracted factor (Walker & Maddan, 2013)
and it must to be greater than 0.3 for the analysis to be reliable (Child, 1970). After eliminating
6 items (INT_6, INT_7, EXT_4, LAY_2, LAY_4 and LAY_5), 12 items were retained and all
factors accounted for over 60% of the total variance, proving that the analysis is reliable

17
(Appendix 4). Next, loadings told us which variables can be combined. Here, rotation made the
interpretation easier as some variables loaded on more than one factor (crossloading items)
(Walker & Maddan, 2013). The pattern matrix reveals strong loadings (greater than 0.32)
(Tabachnick & Fidell, 2012), which indicate solid factors. Although the objective was to find
three factors (Interior, Exterior and Layout), FA analysis combined Interior and Layout items
in the first factor, which we will call Interior and Store Layout; and Exterior items correctly
loaded together, hence, Factor 2 represents Exterior and Window Display (see Table 1).
Reliability was checked and the extracted factors revealed Cronbach’s alphas greater than 0.7
(0.871 and 0.874 for Factor 1 and 2, respectively), which means the items loaded on the correct
factors and the analysis was considered to have produced the correct factor structure (Distefano
et al., 2009).
Construct Cronbach’s Alpha Item Loading Eigenvalue Variance Explained
Total 0.881 62%
Interior
& Store
Layout
0.871
INT_3 .846
5.333 44%
INT_5 .843
LAY_6 .817
INT_4 .780
INT_2 .583
LAY_3 .559
LAY_1 .498
Exterior
& WD 0.874
EXT_2 .878
2.155 18%
EXT_6 .792
EXT_3 .746
EXT_5 .744
EXT_1 .591
Table 1 – Factor Analysis (FA) for visual merchandising variables
4.2. EFA for CBBE
The EFA for consumer-based brand equity variables, revealed great values for
suitability (KMO= 0.919, 2(153) =2256.632 p<0.01), therefore, data meets the assumptions
required to run a FA. All three factor-extraction strategies’ results (Kaiser rule, scree plot and
PA), suggested the extraction of three factors. Communalities are all greater than 0.3 and all 18
items were retained by the factors and accounted for 65% of the total variance explained by
18
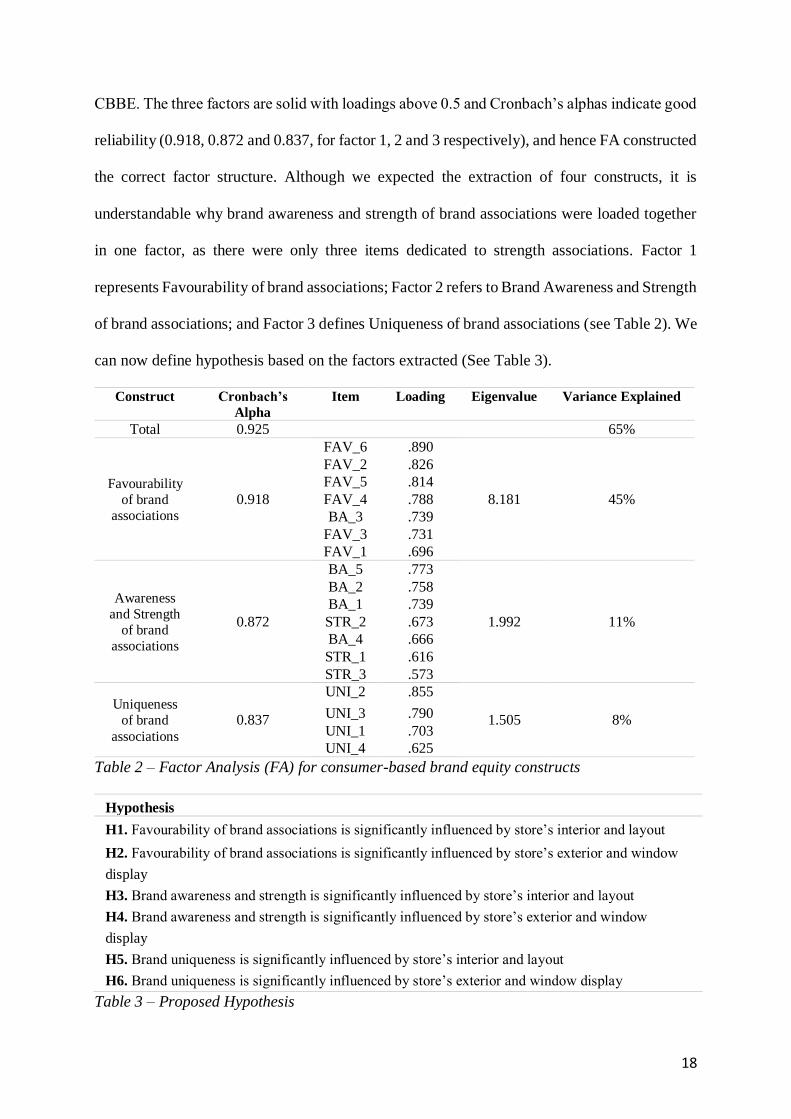
CBBE. The three factors are solid with loadings above 0.5 and Cronbach’s alphas indicate good
reliability (0.918, 0.872 and 0.837, for factor 1, 2 and 3 respectively), and hence FA constructed
the correct factor structure. Although we expected the extraction of four constructs, it is
understandable why brand awareness and strength of brand associations were loaded together
in one factor, as there were only three items dedicated to strength associations. Factor 1
represents Favourability of brand associations; Factor 2 refers to Brand Awareness and Strength
of brand associations; and Factor 3 defines Uniqueness of brand associations (see Table 2). We
can now define hypothesis based on the factors extracted (See Table 3).
Construct Cronbach’s
Alpha
Item Loading Eigenvalue Variance Explained
Total 0.925 65%
Favourability
of brand
associations
0.918
FAV_6 .890
8.181 45%
FAV_2 .826
FAV_5 .814
FAV_4 .788
BA_3 .739
FAV_3 .731
FAV_1 .696
Awareness
and Strength
of brand
associations
0.872
BA_5 .773
1.992 11%
BA_2 .758
BA_1 .739
STR_2 .673
BA_4 .666
STR_1 .616
STR_3 .573
Uniqueness
of brand
associations
0.837
UNI_2 .855
1.505 8% UNI_3 .790
UNI_1 .703
UNI_4 .625
Table 2 – Factor Analysis (FA) for consumer-based brand equity constructs
Hypothesis
H1. Favourability of brand associations is significantly influenced by store’s interior and layout
H2. Favourability of brand associations is significantly influenced by store’s exterior and window
display
H3. Brand awareness and strength is significantly influenced by store’s interior and layout
H4. Brand awareness and strength is significantly influenced by store’s exterior and window
display
H5. Brand uniqueness is significantly influenced by store’s interior and layout
H6. Brand uniqueness is significantly influenced by store’s exterior and window display
Table 3 – Proposed Hypothesis
19
4.3. Hypothesis Testing
To test the hypothesis proposed, Pearson’s correlation and regression tests were
assessed to confirm the relationships between the two factors of visual merchandising and three
dimensions of CBBE found. Additionally, three multiple linear regressions were conducted to
confirm the findings of Pearson’s correlations and understand how each independent variable
(visual merchandising) influences the dependent variable (CCBE). However, there’s several
problems when performing regression analyses on factor scores. Zuccaro (2010) describes three
reasons for this: First, linear regression assumes that both independent and dependent variables
have a normal distribution. FA transforms a set of variables into factor scores and it doesn’t
always produce a normal distribution. Second, linear regressions standardize both independent
and dependent variables. Factor scores are standardized by nature, using it as an independent
variable will standardise the variable twice. Third, FA assumes that factors possess
measurement errors, while linear regression models are based on the assumption that variables
are free of measurement error (Zuccaro, 2010). This means that performing this type of analysis
on factors will produce results that have no statistical meaning. Consequently, and as a solution,
specific items will be selected to represent each factor, which means surrogate variables will be
used in regression analysis. These are the variables of each factor with the highest loading
(Malhotra & Birks, 1999). For the variable Interior and Store Layout, item INT_3 is the variable
with the highest loading (.846); EXT_2 (loading of .878) is the selected variable to represent
Exterior and Window Display; For CBBE variables, FAV_6, BA_5 and UNI_2 are the items
with higher loadings for Favourability (.890), Awareness and Strength (.773) and Uniqueness
(.855) respectively (see Table 1 and 2).
SPSS software considers the sample size when stating that a correlation coefficient is
statistically significant. Since the sample size is bigger than 200, all correlations show an
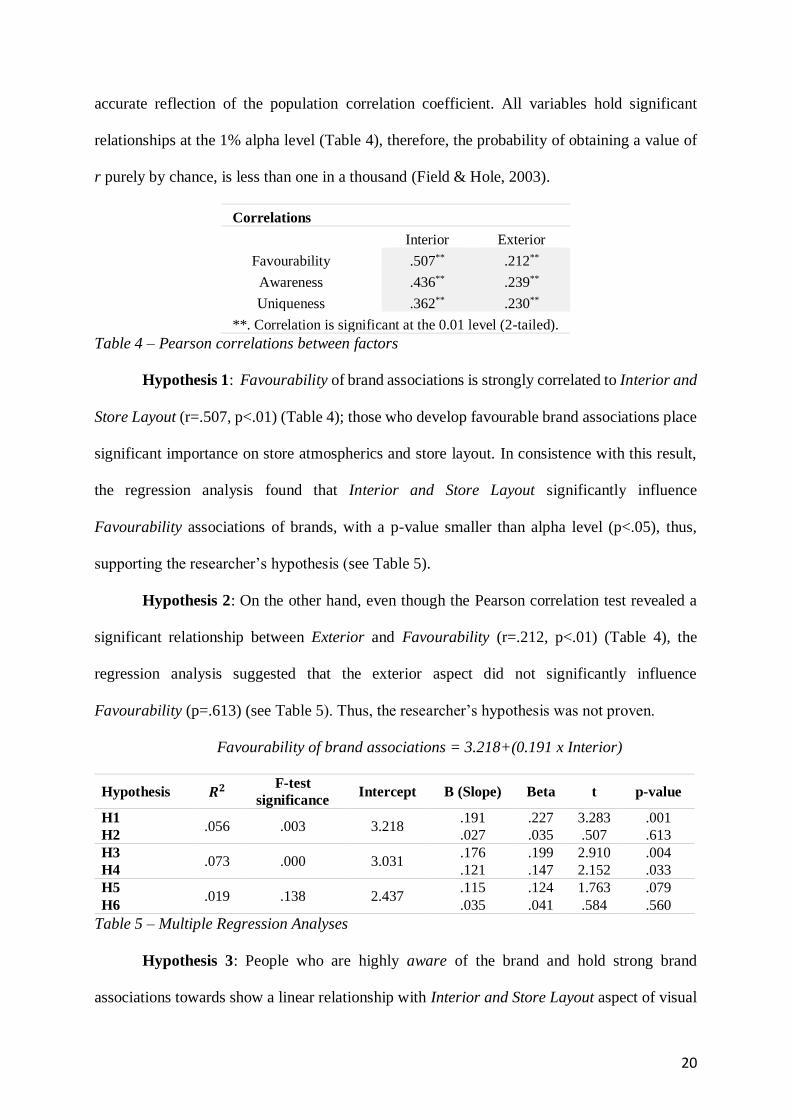
20
accurate reflection of the population correlation coefficient. All variables hold significant
relationships at the 1% alpha level (Table 4), therefore, the probability of obtaining a value of
r purely by chance, is less than one in a thousand (Field & Hole, 2003).
Correlations
Interior Exterior
Favourability .507** .212**
Awareness .436** .239**
Uniqueness .362** .230**
**. Correlation is significant at the 0.01 level (2-tailed).
Table 4 – Pearson correlations between factors
Hypothesis 1: Favourability of brand associations is strongly correlated to Interior and
Store Layout (r=.507, p<.01) (Table 4); those who develop favourable brand associations place
significant importance on store atmospherics and store layout. In consistence with this result,
the regression analysis found that Interior and Store Layout significantly influence
Favourability associations of brands, with a p-value smaller than alpha level (p<.05), thus,
supporting the researcher’s hypothesis (see Table 5).
Hypothesis 2: On the other hand, even though the Pearson correlation test revealed a
significant relationship between Exterior and Favourability (r=.212, p<.01) (Table 4), the
regression analysis suggested that the exterior aspect did not significantly influence
Favourability (p=.613) (see Table 5). Thus, the researcher’s hypothesis was not proven.
Favourability of brand associations = 3.218+(0.191 x Interior)
Hypothesis 𝑹𝟐 F-test
significance Intercept B (Slope) Beta t p-value
H1 .056 .003 3.218
.191 .227 3.283 .001
H2 .027 .035 .507 .613
H3 .073 .000 3.031
.176 .199 2.910 .004
H4 .121 .147 2.152 .033
H5 .019 .138 2.437
.115 .124 1.763 .079
H6 .035 .041 .584 .560
Table 5 – Multiple Regression Analyses
Hypothesis 3: People who are highly aware of the brand and hold strong brand
associations towards show a linear relationship with Interior and Store Layout aspect of visual
21
merchandising (r=.436, p<.01) (Table 4). Regression analysis supports these results with a p-
value of 0.004 (see Table 5), hence, the interior aspect of the store significantly influences brand
awareness and overall strength of associations, supporting H3.
Hypothesis 4: As for Exterior and Window Display, the relationship is weaker (r=.239,
p<.01) (Table 4), but still valid. According to the regression results, there’s sufficient evidence
to affirm that there’s a significant directional relationship between Interior and Exterior aspects
of visual merchandising and brand awareness (p-value=.033), therefore, the null hypothesis is
rejected (Table 5).
Brand Awareness and Strength of brand associations = 3.031 + (0.176 x Interior) +
(0.121 x Exterior)
To better understand this issue, the beta coefficient can be used to find out which of the
independent variables have a greater effect on this CBBE dimension. The beta coefficient
shows that the Interior contributed the most in explaining brand awareness and strength of
associations, followed by the exterior aspect (Beta=0.199; 0.147 respectively) (see Table 5).
Hypothesis 5: Uniqueness of brand associations show a significant correlation with
Interior (r=.362, p<.01)(Table 4). However, the p-value of this construct in the regression
analysis is greater than the alpha level (p-value =.079>0.05), hence, the null hypothesis was not
rejected (Table 5).
Hypothesis 6: Pearson’s correlation test confirms a significant correlation between
uniqueness of brand associations and the exterior dimension of visual merchandising (r=.230,
p<.01) (Table 4). Although there’s a significant relationship between the constructs, no
directional relationship was found in the regression analysis (p=.560>0.05), consequently, we
cannot reject the null hypothesis (Table 5).
This would mean that the effective use of visual merchandising dimensions tends to a
higher sense of brand uniqueness, however, the significance of the overall regression equation

22
suggests that none of the visual merchandising aspects significantly influence brand
associations of uniqueness.
5. Results
5.1. Visual Merchandising effects on Brand Favourability
Previous literature validates H1 results, stating that interior design cues increase
consumers’ perceptions of favourable and convenient shopping in stores (Mazursky & Jacoby,
1986). Also, several studies provide sufficient evidence to support that visual merchandising
can affect desirability and help customers to build favourable attitudes (Kim, 2003; Moayery,
Zamani, & Vazifehdoost, 2014). Though, the same didn’t happen for exterior aspects, since H2
was rejected. This may be happening because, as correlation tests indicate, consumers inferred
more importance on the overall experience inside the store, where the actual two-way
communication occurs, which can have a higher impact on favourable associations.
5.2. Visual Merchandising effects on Brand Awareness and Strength
H3 and H4 results are supported by previous research that mention signage,
organization and functionality of the store are great contributors to brand recognition; and how
the exterior aspect of visual merchandising contributes to the construction and strengthening of
the feelings towards a specific brand (Nistorescu & Barbu, 2008). Park et al. findings also
confirms this. Their results revealed that visual merchandising can contribute to brand salience
and brand recall (Park et al., 2015). This is reasonable since even if a passer-by doesn’t have
any buying intentions, attention catching displays and overall exterior façade holding a strong
logo, for instance, can help them to remember it later when having actual shopping decisions.
5.3. Visual Merchandising effects on Brand Uniqueness
Researchers’ findings state that visual merchandising can provide product distinction
and maintain competitors away (Mehta & Chugan, 2013). Accordingly, Niazi’s study
23
concluded that, among other perks, visual merchandising elements are crucial to gain the
competitive advantage against competitors (Niazi, 2015). Surprisingly, H5 and H6 were
rejected, which means the current investigation's results do not comply with past literature. This
may be happening because this sampling focused on Portuguese consumers, which is a different
cultural context than the samples in other researches. Maybe Portuguese consumers’
associations of uniqueness are influenced by other external variables. Still, visual
merchandising should not be neglected as findings, although do not show a directional influence
on uniqueness, suggests that there’s a positive relationship with both visual merchandising cues.
5.4. Discussion of Results – Can Visual Merchandising influence CBBE?
Results indicated that although all three constructs of CCBE showed good relationships
with both aspects of visual merchandising, greater importance was placed in the interior aspect,
as correlations were stronger (above .3) than exterior aspects.
We should keep in mind that this may be happening because several cues are associated
to store’s interior. It combines store atmospherics, overall ambience and layout planning. And
as was previously mentioned, a substantial percentage of respondents valued all different
interior details. Respondents gave weight to interior with 90% of respondents considering that
the presentation of the products are important to them when deciding where to shop and 87%
feeling the need to leave the store when the store layout is confusing (Appendix 3).
However, exterior elements deserve special attention as results revealed that exterior
displays can contribute to the creation of awareness and strength of associations with a brand.
It generates the first impression about a store or brand and if these elements are not managed
well, the overall interior may not matter (Turley & Milliman, 2000).

24
This research found several relationships between visual merchandising elements and
brand equity factors. Thus, we can assume that visual merchandising can lead to some strong,
favourable and unique feelings towards retail brands.
6. Conclusions and Recommendations
This research explored how visual merchandising dimensions can influence the value
customers attribute to brands. After finding the best variables to represent each concept, results
provided sufficient evidence to say that customers’ brand associations are influenced by visual
merchandising. Although exterior displays did not significantly influence favourability of brand
associations, the study still suggested that these variables are correlated. The same happens with
both visual merchandising variables and uniqueness of brand associations. Additionally, the
relationships found recommend fashion retailers should consider interior and layout aspects in
consumers’ favourable and strength of associations of their brands, and the exterior displays in
terms of awareness. Essentially, atmospherics can provide a pleasant experience inside the
store; layout guides the customer across the store from product to product in the most efficient
manner; and on the other hand, the exterior is one of the most important dimensions as it is the
first impression customers’ get of the store and this is crucial for entry-decision. When
consumers are exposed to these visual stimulations, they are more likely to hold strong,
favourable and unique brand associations, that they will recall faster than other brands.
Therefore, fashion brands need to make an effort to connect visual merchandising and retail
branding.
This research differentiates from previous researches in many ways. Visual
merchandising cues have been studied independently. Though, consumers see visual
merchandising as a whole, and this study considers the influence of those dimensions as related
to each other. Also, previous studies fail to study how visual merchandising elements can help
to build brand equity, as it focuses mostly on buying behaviours effects. Finally, literature on

25
fashion branding is highly concentrated on advertisements and no data related to visual
merchandising on the Portuguese context was found.
Adapting to change is the biggest challenge fashion retail brands face nowadays. This
dissertation can help both national and international multi-chain fashion brands operating in the
Portuguese market understand how consumers react to this kind of stimulus, and adapt
accordingly. Moreover, these results can be useful to marketers in the creation and development
of brand strategies and in the improvement of marketing and communication strategies.
7. Limitations and Directions for Future Research
The present research has some limitations to be considered when analysing the results.
First, even though factor analysis has the objective of diminishing the number of factors, only
two variables of visual merchandising – Interior and Store Layout and Exterior and Window
Display - were studied, different from what was expected in the beginning of the report. Future
research should take in consideration a wider range of items when accessing visual
merchandising cues, so more conclusions and more accurate results will be given. Next, the
survey used a convenience sampling, which means that the sample may not be representative
of the entire Portuguese population. Furthermore, the survey was only distributed over
Portuguese consumers. Future research should employ this study in other markets as there
might be differences between consumers in different cultural contexts. Also, this research
focused on fashion retail brands and only three fashion brands were provided to respondents as
an option to answer the survey. More detailed research on which brands to use on this specific
investigation should be addressed in the future. The present study focused on the consumer
perspective, and neglected retailers’ thoughts and opinions on how visual merchandising
influence their brand equity. It would be interesting to consider this in future conduction of
researches for a more complete assessment on the efficiency of implementing these techniques.
Nonetheless, the current dissertation is believed to have achieved the goals it has set itself.

26
8. References
Aaker, D. A. (1991). Managing Brand Equity: Capitalizing on the Value of a Brand Name.
New York: The Free Press.
Ailawadi, K. L., & Keller, K. L. (2004). Understanding retail branding: Conceptual insights
and research priorities. Journal of Retailing, 80(4), 331–342.
https://doi.org/10.1016/j.jretai.2004.10.008
Arnold, M. J., & Reynolds, K. E. (2003). Hedonic shopping motivations. Journal of Retailing,
79(2), 77–95. https://doi.org/10.1016/S0022-4359(03)00007-1
Baker, J., Grewal, D., & Levy, M. (1992). An Experimental Approach to Making Retail Store
Environmental Decisions. Journal of Retailing, 68(4), 445–460.
Baker, J., Grewal, D., & Voss, G. B. (2002). The Influence of Multiple Store Environment
Cues on Perceived Merchandise Value and Patronage Intentions. Journal of Marketing,
66(2), 120–141. https://doi.org/10.1509/jmkg.66.2.120.18470
Bhatti, K. L., & Latif, S. (2014). The Impact Of Visual Merchandising On Consumer Impulse
Buying Behavior. Eurasian Journal of Business and Management, 2(1), 24–35.
Bivainiene, L., & Sliburyte, L. (2008). The Brand Image as an Element of Brand Equity.
Social Research, 12(2), 22–31.
Cardoso, P. R., Costa, H. S., & Novais, L. A. (2010). Fashion consumer profiles in the
Portuguese market: involvement, innovativeness, self-expression and impulsiveness as
segmentation criteria. International Journal of Consumer Studies, 34(6), 638–647.
https://doi.org/10.1111/j.1470-6431.2010.00891.x
Child, D. (1970). The Essentials of Factor Analysis. Holt, Rinchart & Winston Ltd.
Damásio, B. F. (2012). Uso da Análise Fatorial Exploratória em Psicologia. Avaliação
Psicológica, 11(2), 213–228.
Davies, B. J., & Ward, P. (2005). Exploring the connections between visual merchandising
and retail branding: An application of facet theory. International Journal of Retail &
Distribution Management, 33(7), 505–513. https://doi.org/10.1108/09590550510605578
Distefano, C., Zhu, M., & Mîndrilă, D. (2009). Understanding and using factor scores:
Considerations for the applied researcher. Practical Assessment, Research & Evaluation,
14(20), 1–11. https://doi.org/10.1.1.460.8553
Ebster, C., & Garaus, M. (2011). Store Design and Visual Merchandising: Creating Store
Space That Encourages Buying.
Euromonitor. (2016). Retailing in Portugal. Retrieved September 20, 2016, from
http://www.euromonitor.com/retailing-in-portugal/report
Everitt, B. S. (1975). Multivariate analysis: the need for data, and other problems. British
Journal of Psychiatry, 126(3), 237–240. https://doi.org/10.1192/bjp.126.3.237
Fabrigar, L. R., Wegener, D. T., MacCallum, R. C., & Strahan, E. J. (1999). Evaluating the
use of exploratory factor analysis in psychological research. Psychological Methods,
4(3), 272–299. https://doi.org/10.1037/1082-989X.4.3.272
Farjam, S., & Hongyi, X. (2015). Reviewing the Concept of Brand Equity and Evaluating
Consumer- Based Brand Equity (CBBE) Models. ISSN International Journal of
Management Science And Business Administration International Journal of
Management Science and Business Administration, 1(8), 14–29.
Field, A. P., & Hole, G. (2003). How to design and report experiments. Control.
https://doi.org/10.1016/B978-0-12-384727-0.00002-1
Gorsuch, R. L. (1974). Factor Analysis. W,’B, Saunders-Company.
Guedes, G., & Soares, P. da C. (2005). Branding of Fashion Products : a Communication
Process, a Marketing Approach. In Association for Business Communication 7th
European Convention (pp. 1–9).

27
Guimaraes, I. (2011). Window Display as Communication. Research into Design -
Supporting Sustainable Product Development, 749–757.
Hartman, K. B., & Spiro, R. L. (2005). Recapturing store image in customer-based store
equity: A construct conceptualization. Journal of Business Research, 58(8), 1112–1120.
https://doi.org/10.1016/j.jbusres.2004.01.008
Hefer, Y., & Cant, M. C. (2013). Visual Merchandising Displays’ Effect On Consumers: A
Valuable Asset Or An Unnecessary Burden For Apparel Retailers. International
Business & Economics Research Journal, 12(10), 1217–1224.
Henson, R. K., & Roberts, J. K. (2006). Use of Exploratory Factor Analysis in Published
Research: Common Errors and Some Comment on Improved Practice. Educational and
Psychological Measurement, 66(3), 393–416.
https://doi.org/10.1177/0013164405282485
Jara, M., & Cliquet, G. (2007). Retail brand equity: a conceptual and differentiated approach.
In European Association of Education and Research in Commercial Distribution.
Keller, K. L. (2013). Strategic Brand Management: Building, Measuring, and Managing
Brand Equity. Brand (Global Edi, Vol. 58). Pearson Education Limited.
https://doi.org/10.2307/1252315
Kerfoot, S., Davies, B., & Ward, P. (2003). Visual merchandising and the creation of
discernible retail brands. International Journal of Retail & Distribution Management,
31(3), 143–152. https://doi.org/10.1108/09590550310465521
Kim, J. (2003). College Students’ Apparel Impulse Buying Behaviors in Relation to Visual
Merchandising. The University of Georgia.
Kotler, P. (1974). Atmospherics as a Marketing Tool. Journal of Retailing, 49(4), 48–65.
https://doi.org/10.1016/j.obhdp.2011.03.002
Kumar, A., & Kim, Y. K. (2014). The store-as-a-brand strategy: The effect of store
environment on customer responses. Journal of Retailing and Consumer Services, 21(5),
685–695. https://doi.org/10.1016/j.jretconser.2014.04.008
Law, D., Wong, C., & Yip, J. (2012). How does visual merchandising affect consumer
affective response?: An intimate apparel experience. European Journal of Marketing,
46(1/2), 112–133. https://doi.org/10.1108/03090561211189266
Leal, A. R. S. (2006). A atitude dos jovens portugueses face às marcas de vestuário
portuguesas e galegas. Universidade Fernando Pessoa.
Malhotra, N. K., & Birks, D. F. (1999). Marketing Research: An Applied Approach (Second
Eur). Pearson Education Lim.
Matsunaga, M. (2010). How to Factor-Analyze Your Data Right: Do’s, Don’ts, and How-
To’s. International Journal of Psychological Research, 3(1), 97–110.
https://doi.org/10.4090/juee.2008.v2n2.033040
Matthews, K., Hancock, J. H., & Gu, Z. (2014). Rebranding American men’s heritage
fashions through the use of visual merchandising, symbolic props and masculine iconic
memes historically found in popular culture. Critical Studies in Men’s Fashion, 1(1), 39–
58.
Mazursky, D., & Jacoby, J. (1986). Exploring the Development of Store Images. Journal of
Retailing, 62(2), 145–166. https://doi.org/10.1016/j.jbusres.2006.09.027
Meer, J. (1985). The Light Touch. Psychology Today, (September), 60–67.
Mehta, N. P., & Chugan, P. K. (2013). The Impact of Visual Merchandising on Impulse
Buying Behavior of Consumer : A Case from Central Mall of Ahmedabad India.
Universal Journal of Management, 1(2), 76–82.
https://doi.org/10.13189/ujm.2013.010206
Moayery, M., Zamani, S., & Vazifehdoost, H. (2014). Effect of Visual Merchandising on
Apparel Impulse Buying Behaviors among Iranian Young Adult Females. Indian

28
Journal of Science and Technology, 7(3), 360–366.
Morgan, T. (2008). Visual Merchandising: Window and in-store displays for retail. Laurence
King Publishing.
Niazi, U. (2015). Visual Merchandising : Does it Matter for Your Brands ?, 18, 80–85.
Nistorescu, T., & Barbu, C. (2008). Retail Store Design and Environment as Branding
Support in the Services Marketing.
Opriş, M., & Brătucu, G. (2013). Visual merchandising window display. Bulletin of the
Transilvania University of Braşov• Vol, 6(55), 51–56.
Park, H. H., Jeon, J. O., & Sullivan, P. (2015). How does visual merchandising in fashion
retail stores affect consumers’ brand attitude and purchase intention? The International
Review of Retail, Distribution and Consumer Research, 25(1), 87–104.
https://doi.org/10.1080/09593969.2014.918048
Pereira, A. D. A. da C. (2013). A Influência do Valor da Marca na Satisfação do
Consumidor: O Caso da Primark em Portugal. Universidade Fernando Pessoa.
Rajh, E. (2002). Development of a Scale or Measuring Customer-Based Brand Equity, 53(7–
8), 770–781. https://doi.org/10.1016/j.annals.2006.10.005
Reinhard, J. C. (2006). Exploratory Factor Analysis: Theory and Application. Communication
Research Statistics, 1904(Darlington), 404–428.
https://doi.org/10.1017/CBO9781107415324.004
Seock, Y.-K., & Lee, Y. E. (2013). Understanding the Importance of Visual Merchandising
on Store Image and Shopper Behaviours in Home Furnishings Retail Setting. European
Journal of Business and Management, 5(4), 174–187.
Silverman, S. N., Sprott, D. E., & Pascal, V. J. (1999). Relating Consumer-Based Sources of
Brand Equity to Market Outcomes. Advances in Consumer Research, 26, 352–358.
Tabachnick, B. G., & Fidell, L. S. (2012). Using Multivariate Statistics. New York: Harper
and Row (Sixth Edit). Pearson Education Limited. https://doi.org/10.1037/022267
Takahashi, H. (2014). Customer-based Retail Brand Equity ― Prototype Model Based on
Equity Driver and Equity Components of Japanese Supermarkets ―, 75–95.
Turley, L. W., & Milliman, R. E. (2000). Atmospheric Effects on Shopping Behavior: A
Review of the Experimental Evidence. Journal of Business Research, 49(2), 193–211.
https://doi.org/10.1016/S0148-2963(99)00010-7
Walker, J., & Maddan, S. (2013). Factor Analysis, Path Analysis, and Structural Equation
Modeling. In Statistics in Criminology and Criminal Justice: Analysis and Interpretation
(Fourth Edi, pp. 457–486). Jones and Bartlett Learning.
Zuccaro, C. (2010). Statistical alchemy: The misuse of factor scores in linear regression.
International Journal of Market Research, 52(4), 511–531.
https://doi.org/10.2501/S1470785309201429
Related Documents