Edith Cowan University Research Online ECU Publications 2009 Visualisation of Honeypot Data Using Graphviz and Afterglow Craig Valli Edith Cowan University This article was originally published as: Valli, C. (2009). Visualisation of Honeypot Data Using Graphviz and Afterglow. Journal of Digital Forensics, Security and Law, 4(2), 27-38. Original article available here This Journal Article is posted at Research Online. http://ro.ecu.edu.au/ecuworks/534

Welcome message from author
This document is posted to help you gain knowledge. Please leave a comment to let me know what you think about it! Share it to your friends and learn new things together.
Transcript
8/6/2019 Visual is at Ion of Honeypot Data Using Graphviz and Afterglow
http://slidepdf.com/reader/full/visual-is-at-ion-of-honeypot-data-using-graphviz-and-afterglow 1/13
Edith Cowan University
Research Online
ECU Publications
2009
Visualisation of Honeypot Data Using Graphvizand Afterglow
Craig Valli Edith Cowan University
This article was originally published as: Valli, C. (2009). Visualisation of Honeypot Data UsingGraphviz and Afterglow. Journal of Digital Forensics, Security and Law, 4(2), 27-38. Original articleavailable here
This Journal Article is posted at Research Online.
http://ro.ecu.edu.au/ecuworks/534

8/6/2019 Visual is at Ion of Honeypot Data Using Graphviz and Afterglow
http://slidepdf.com/reader/full/visual-is-at-ion-of-honeypot-data-using-graphviz-and-afterglow 2/13
Journal of Digital Forensics, Security and Law, Vol. 4(2)
27
Visualisation of Honeypot Data Using Graphviz
and Afterglow
Craig Valli
secau – Security Research Centre
Edith Cowan University
ABSTRACT
This research in progress paper explores the use of Graphviz and Afterglow for
the analysis of data emanating from a honeypot system. Honeypot systems gather
a wide range of data that is often difficult to readily search for patterns and trendsusing conventional log file analysis techniques. The data from the honeypots has
been statically extracted and processed through Afterglow scripts to produce
inputs suitable for use by the DOT graph based tools contained within Graphviz.
This paper explores some of the benefits and drawbacks of currently using this
type of approach.
Keywords: honeypot, network forensics, visualization, Graphviz, Afterglow
1. INTRODUCTION
Honeypots generate a large amount of raw data for analysis and investigation
by network security professionals. This raw data is typically rich in content
and volume due to the modus operandi of network honeypots. This captured
data can include but not be limited to system log files, network intrusion
detection system log files, binary capture files and also malware candidate
files.
On a relatively low interaction honeypot this data can run to several megabytes
of textual and binary data per day. The analysis and trapping of malfeasance
for which a honeypot system is designed is not an ideal match to traditionallogfile analysis tools and techniques. Standard log file processors can only
achieve so much in their ability to interpret the textual data that is captured by
a honeypot into its log files. While log file processors have traditionally rich
analysis algorithms they tend to display the top 10 or 100 in any selected
investigated category or activity enabled by a suitable configuration of the
underlying engine to ascertain this. While this modus operandi maybe a viable
method for log file analysis based from a per use perspective such as world
wide web access monitoring by business users it is typically not suited to
analysis of malicious activity. This lack of viability is because often malicious
activity by individuals and even the malicious code (malcode) they produce to

8/6/2019 Visual is at Ion of Honeypot Data Using Graphviz and Afterglow
http://slidepdf.com/reader/full/visual-is-at-ion-of-honeypot-data-using-graphviz-and-afterglow 3/13
Journal of Digital Forensics, Security and Law, Vol. 4(2)
28
enable an attack is performed or developed so as not to be detected. This
posture of low detection is deleterious to how conventional log file analysis
works.
Even dedicated intrusion detection query engines such as ACID, BASE or
Surfnet IDS can have trouble locating relevant data within the mass of data that
a honeypot will produce on a daily basis. The modus operandi of some attacks
for instance may only utilize a single bot or compromised host for 1 or 2
interactions on a target. Some of the malcode will use the same attack vector
typically the same port or initializing data stream but control 1000s of bots to
cause a denial of service or overwhelm a host. Textually this is often hard for
the human to see the associations and due to sometimes the high level of traffic
this generates significant text is also generated.
The use of customized text scripts while a potentially optimal outcome for a
particular scenario typically does not scale well in a live analysis scenario or is
often not suitable for reuse. The exploration of alternative methods for
interpreting and responding to honeypot data is necessary to progress the state
of network security. Firewalls and other perimeter countermeasures are starting
to show their age in the same way as the bastilles and castles of the middle
ages similarly became in effective against new attacks. This paper is one such
exploration of using Graphviz and associated log file processing scripts based
around the AfterGlow suite to map certain types of honeypot data for
interpretation by an investigator or researcher.
2. WHAT IS GRAPHVIZ AND AFTERGLOW?
Graphviz is an open source visualization utility developed to generate a variety of
graph layouts (Ellson and Gansner 2008). There are several base utilities neato
which makes “spring model” layouts, twopi which generates radial layouts and
circo which generates circular layouts. They all interpret files that have been
described using the DOT language. Afterglow is a series of PERLscripts designed
to be used with Graphviz to generate link graphs from Comma Separated Values
(CSV) formatted files (Marty 2007). The Afterglow conversion scripts provided
take a raw input file (tcpdump, Snort, iptables and Argus logfiles), analyze it and
output a comma separated list of records for each of the particular formats. The
resulting records are based on the data present in the file and what the investigator
would like represented from the complete record via configuration. Essentially the
process is one of normalisation of the data into meaningful sets for analysis and
subsequent graphical representation.
These customized scripts are not the only method of extraction of the records.
Extraction can be accomplished manually using a spreadsheet program a slow and
somewhat cumbersome event and also limited to processing 65535 or the rowlimit of the spreadsheet package in use. The use of spreadsheets is not suited to

8/6/2019 Visual is at Ion of Honeypot Data Using Graphviz and Afterglow
http://slidepdf.com/reader/full/visual-is-at-ion-of-honeypot-data-using-graphviz-and-afterglow 4/13
Journal of Digital Forensics, Security and Law, Vol. 4(2)
29
automatic generation of the graphs direct from the network interface or log file
stream which is a long term aim of this research. The use of scripts could also
process these interactions live into a database structure in similar fashion that
occurs already with Surfnet IDS.After being processed by the conversion scripts or processes the extracted CSV
files are then fed through scripts that produce one of two formats. Either it
generates a DOT attributed graph language file - the input required by the
graphviz library - or it can generate input for the large graphing library (LGL) that
is used extensively in bioinformatics. This experimentation was focused around
the production of DOT attributed graphics for processing via Graphviz.
Afterglow accepts either 2 or 3 columns of raw input data to map. For network
forensics the 3 column format is the most useful as it can be used to map
interaction/events between two entities or attributes within a networked exchange.This operation is particularly useful in tracking or visualizing behaviors that are
hard to interpret from text files or represent readily by other graphical or statistical
methods.
3. THE HONEYPOT SYSTEM
A nepenthes honeypot system was used as the source data for this research
(Baecher, Koetter et al. 2009). A nepenthes based honeypots purpose is to pose
deceptively as a vulnerable target platform for malcode to interact with. It
achieves this by the emulation of known vulnerability for example MS03-26
(Microsoft 2003) and other known security exploits that allow for upload of malcode or the execution of arbitrary code on the victim computer. Nepenthes via
subsequent selective emulation of the known exploit to the malfeasant agent
attempts to enable the successful download or transmission of malcode payload
for subsequent capture and post incident analysis. Post incident analysis is
normally the static and dynamic analysis of the malcode using specialized tools
such as disassemblers.
Nepenthes logs and traps a wide range of data types and can store it in a wide
range of formats for use by analysts. Nepenthes systems are also typically
hardened and use firewalling to redirect or deny connections of interest to thehoneypot system. The utilization of a system such as the Surfnet IDS system also
extends the dataset that is available to the network forensics researcher. Surfnet
not only logs data in a variety of formats but also processes captured malcode and
runs it against virus scanners and sandboxes. It also allows aggregation of
nepenthes data and external data from sandbox outputs from Anubis and
CWSandbox for further analysis.
Table 1 is some example raw logged data from a nepenthes honeypot. The
following data is extracted from the logged_downloads file that records when a
piece of malware has been downloaded by nepenthes.
8/6/2019 Visual is at Ion of Honeypot Data Using Graphviz and Afterglow
http://slidepdf.com/reader/full/visual-is-at-ion-of-honeypot-data-using-graphviz-and-afterglow 5/13
Journal of Digital Forensics, Security and Law, Vol. 4(2)
30
[2007-05-15T23:45:58] 203.129.220.98 -> 203.161.117.122
link://203.129.220.98:39770/RhhlQg==
[2007-05-15T23:45:58] 203.129.220.98 -> 203.161.117.122
link://203.129.220.98:39770/RhhlQg==
[2007-05-16T03:51:22] 203.136.73.89 -> 203.161.117.122link://203.136.73.89:40058/+Hcs+A==
[2007-05-16T04:31:52] 203.161.114.141 -> 203.161.117.122
tftp://0.0.0.0/WinEUM.exe
[2007-05-16T04:46:29] 203.145.168.45 -> 203.161.117.122
tftp://0.0.0.0/wbemstest.exe
[2007-05-16T06:34:38] 203.161.114.141 -> 203.161.117.122
tftp://0.0.0.0/WinEUM.exe
[2007-05-16T07:42:32] 203.88.202.98 -> 203.161.117.122
link://203.88.202.98:50004/OOci+A==
[2007-05-16T12:52:57] 203.124.171.18 -> 203.161.117.122
link://203.124.171.18:18907/OMkq+A==
Table 1 – Raw data from nepenthes
Its basic format is Date & Time expressed as YYYY-MM-DD (T) HH:MM:SS,
Source IP, Destination IP, Protocol (Serving IP:Port)/PayloadName. This richness
of record enables a wide amount of alternate lenses for analyzing data using the
Graphviz engine for analysis. Table 2 is a partial representation of combinations
as there are 24 possible combinations from this log file format excluding dates,
inclusive of dates there would be 120.
Source IP Destination IP Payload
203.161.114.141 203.161.117.122 WinEUM.exe
Source IP Destination IP Protocol
203.161.114.141 203.161.117.122 Tftp
Source IP Destination IP PayloadIP
203.161.114.141 203.161.117.122 0.0.0.0
Source IP PayloadIP Destination IP
203.161.114.141 0.0.0.0 203.161.117.122
Payload Source IP Destination IP
WinEUM.exe 203.161.114.141 203.161.117.122Protocol Source IP PayloadIP
Tftp 203.161.114.141 0.0.0.0Table 2 – Some combinations from logfile data
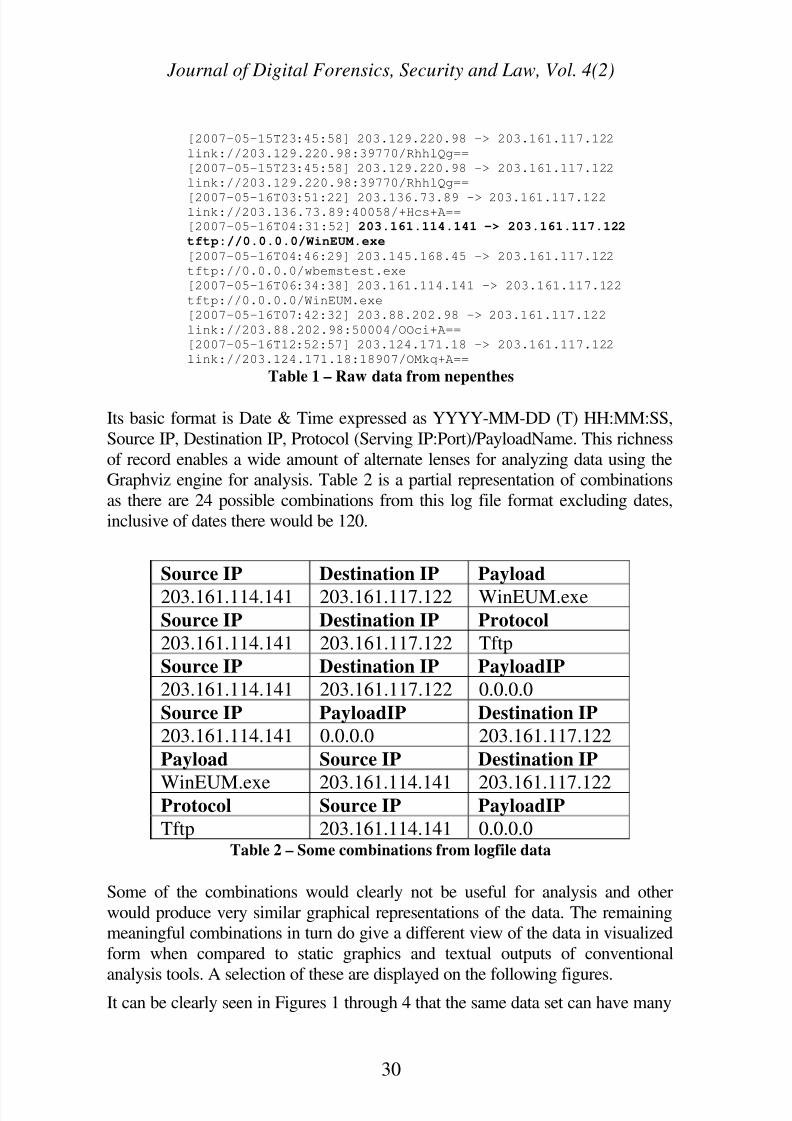
Some of the combinations would clearly not be useful for analysis and other
would produce very similar graphical representations of the data. The remaining
meaningful combinations in turn do give a different view of the data in visualized
form when compared to static graphics and textual outputs of conventional
analysis tools. A selection of these are displayed on the following figures.It can be clearly seen in Figures 1 through 4 that the same data set can have many

8/6/2019 Visual is at Ion of Honeypot Data Using Graphviz and Afterglow
http://slidepdf.com/reader/full/visual-is-at-ion-of-honeypot-data-using-graphviz-and-afterglow 6/13
Journal of Digital Forensics, Security and Law, Vol. 4(2)
31
different visualizations or lenses for analysis of the dataset. Each of the
visualizations tells a slightly different story by the lense or representation that it
provides the investigator into the raw data set. The ability to use different lenses
allows an investigator to view data rapidly and from different viewpoints that cansignificantly aid in interpretation, detection and potential amelioration of issues or
events. This potential for rapid interpretation that a graphical data view provides
is simply not readily achievable through text based analysis. It is easy to see
different holistic patterns in the presented data even though in each figure they are
drawn from the same dataset, they just have a different articulation or causal
linkage when they have been interpreted and represented by the Graphviz utilities.
Figure 1. SIP PIP Payload

8/6/2019 Visual is at Ion of Honeypot Data Using Graphviz and Afterglow
http://slidepdf.com/reader/full/visual-is-at-ion-of-honeypot-data-using-graphviz-and-afterglow 7/13
Journal of Digital Forensics, Security and Law, Vol. 4(2)
32
Figure 2. SIP PIP DIP

8/6/2019 Visual is at Ion of Honeypot Data Using Graphviz and Afterglow
http://slidepdf.com/reader/full/visual-is-at-ion-of-honeypot-data-using-graphviz-and-afterglow 8/13
Journal of Digital Forensics, Security and Law, Vol. 4(2)
33
Figure 3. Payload SIP DIP
8/6/2019 Visual is at Ion of Honeypot Data Using Graphviz and Afterglow
http://slidepdf.com/reader/full/visual-is-at-ion-of-honeypot-data-using-graphviz-and-afterglow 9/13
Journal of Digital Forensics, Security and Law, Vol. 4(2)
34
Figure 4. SIP PIP Payload

8/6/2019 Visual is at Ion of Honeypot Data Using Graphviz and Afterglow
http://slidepdf.com/reader/full/visual-is-at-ion-of-honeypot-data-using-graphviz-and-afterglow 10/13
Journal of Digital Forensics, Security and Law, Vol. 4(2)
35
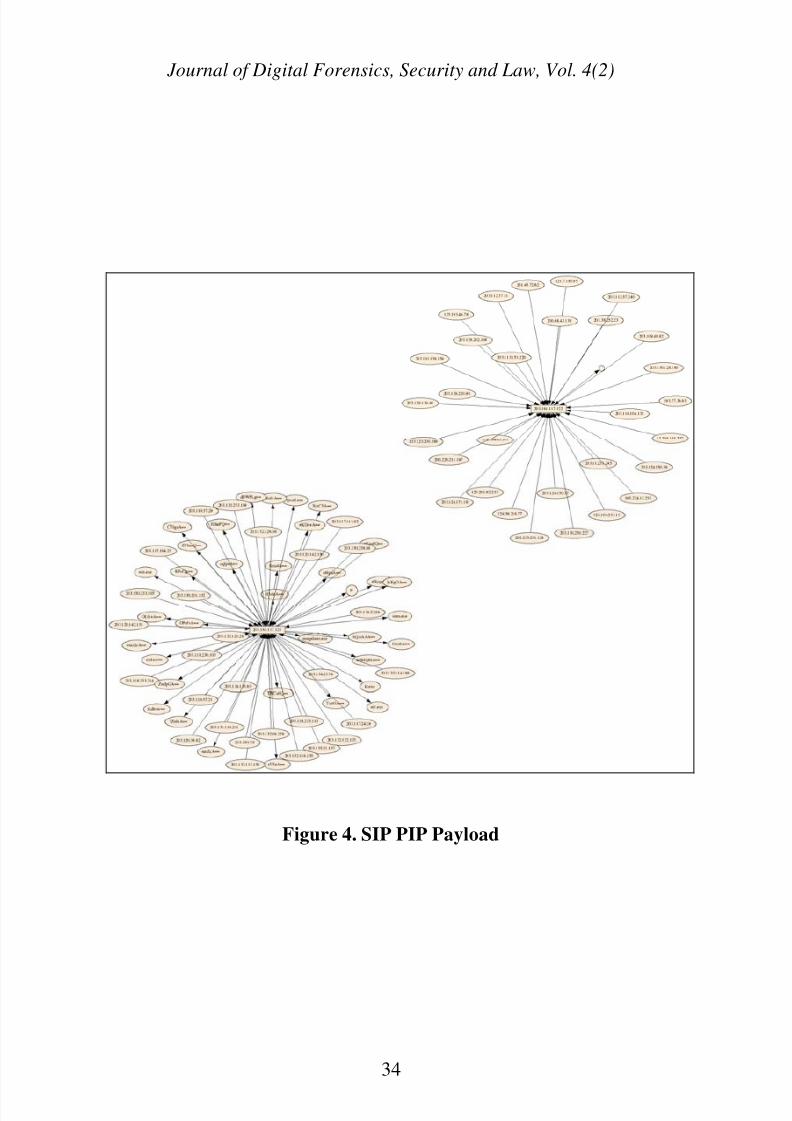
The graphs represented here are by no means the largest generated in this initial
research. One graph that used the complete set of data generated a 35000 x 33000
pixel bitmap file. Even with this large file it was clear to see from a holistic
perspective the epicenters or areas of high network activity. Figure 5 is a veryreduced snapshot of that file.
The graphical nature of the method as clearly demonstrated in Figure 5
demonstrates it is relatively easy to pick out areas of concentration of attack. This
method elucidates how also this type of graphical representation performs
clustering and subsequent visualization of like events experienced on honeypot
systems. These groupings unlike conventional methods of interpretation do not
suffer from the same temporal separation that other log file analysis tools can
have for instance if these attacks were perpetrated across a range of weeks. The
focus for the generation of the graphics is the entity, with the size of the ring or
circle in this case indicating magnitude and depth of attack. It is far easier to track
extended attacks using these methods of analysis and presentation than
conventional log file analysis techniques due to the visual clustering of the data
representations.
The graphical nature of these types of outputs provides a medium for the rapid
interpretation of patterns and emergent trends. The use of DOT graphs generated
from Graphviz provides a method for making a particular entity or entities the
focal point of the analysis in a consistent visual manner for the human analyst.
8/6/2019 Visual is at Ion of Honeypot Data Using Graphviz and Afterglow
http://slidepdf.com/reader/full/visual-is-at-ion-of-honeypot-data-using-graphviz-and-afterglow 11/13
Journal of Digital Forensics, Security and Law, Vol. 4(2)
36
Figure 5. Reduced snapshot of large visualisation

8/6/2019 Visual is at Ion of Honeypot Data Using Graphviz and Afterglow
http://slidepdf.com/reader/full/visual-is-at-ion-of-honeypot-data-using-graphviz-and-afterglow 12/13
Journal of Digital Forensics, Security and Law, Vol. 4(2)
37
4. CURRENT DRAWBACKS AND LIMITATIONS
Currently the generation of bitmap Graphviz dot graphs is a processor intensive
task. The author used a 64 bit Debian based Dual Core – Dual Opteron 2.8 GHzmachine with 6GB of memory with a U320 SCSI hard disk subsystem during the
development of graphs for this research. To generate even the relatively simple
sample graphs contained in Figures 1 to 4, considerable runtime at 100% of CPU
was experienced for several minutes on the experimental computer.
This current use of computing resource has significant impact on the ability to use
this type of technology currently for generation of near real time graphical data
from a honeypot, IDS, firewall or similar traditional network countermeasure. The
amount of data processed in the initial trials was comparatively small compared to
the level of incident that would need to be rendered on a larger network pipe ordataset.
These particular problems of computational shortfall maybe overcome by
utilization of current GPU technology to render and also compute the graphics
(Ellson and Gansner 2008). Similar use of GPUs has been recently successfully
exploited for rapid visualization of graphical data where combining 4 high end
GPU cards has produced graphical computational performance equivalent to 320
2.4Ghz CPU cores (ASTRA 2008). The application of GPU technology to certain
mathematical functions and graphical rendering tasks delivers teraflops of
performance at a relatively low cost. This type of power yield is dependent on thetypes of mathematical functions involved in the processing, however it would
appear that Graphviz and its utilities may significantly benefit from the utilization
of this technology.
The incorporation of a SQL system to store and process data extracted from
honeypot data streams and instead of reprocessing log files will be a significant
leap forward in analysis turnaround. Interfacing with the Surfnet IDS system that
incorporates nepenthes data into an existing SQL structure is an easy candidate
system for supporting SQL capabilities with a Graphviz/afterglow engine for
generation of graphics. This extension of Surfnet would enable not only near realtime generation of graphical data but also provide a method for longitudinal
analysis of patterns and trends relating to honeypot activity. As mentioned
previously this type of system reduces some of the temporal and spatial issues that
are found in conventional textual query and analysis engines. The system will also
allow replaying of items of interest by extracting it from the database. Temporary
storage within a database structure would also allow for some buffering and load
balancing to occur, by smoothing out spikes in the transmissions received.
5. CONCLUSIONThis is research in progress, however, there are clear benefits for the analyst in

8/6/2019 Visual is at Ion of Honeypot Data Using Graphviz and Afterglow
http://slidepdf.com/reader/full/visual-is-at-ion-of-honeypot-data-using-graphviz-and-afterglow 13/13
Journal of Digital Forensics, Security and Law, Vol. 4(2)
38
using graphical approaches to perform analysis of honeypot data. Particularly as
virus scanners, firewalls and intrusion detection systems are starting to fail as a
response and countermeasure and honeypots are now trapping malcodes that
bypass these with relative impunity.Currently there is a bottleneck with regards to fast processing of data that would
be arriving on a network interface in a honeypot system. The use of modern GPU
technology and high-speed storage technologies may see many of these
impediments removed. Also there are methods of the vector based rendering of
the images which maybe better suited to interpretation of live data. These will be
explored in the next phase of this research.
The ability to use graphical representations to view data from a variety of
viewpoints and lenses for near real-time forensics of network incidents is a
compelling reason for furthering this type of research and investigation. Thegraphical methods utilized in this exploratory work demonstrate an ability to
represent magnitude and intensity of attack not afforded to text based analysis of
data. By using graphical techniques such as these it may yield significant benefit
in detecting and ameliorating threats that are now posed by network borne
malcodes which are increasingly becoming a problem in the network security
arena.
REFERENCES
ASTRA. (2008). "Belgian researchers develop desktop supercomputer.", from
http://fastra.ua.ac.be/en/index.html.
Baecher, P., M. Koetter, et al. (2009). "nepenthes." from
http://nepenthes.carnivore.it/ .
Ellson, J. and E. Gansner (2008). Graphviz - Graph Visualization Software,
AT&T.
Marty, R. (2007). "Afterglow." from http://afterglow.sourceforge.net.
Microsoft. (2003). "Microsoft Security Bulletin MS03-026 - Buffer Overrun InRPC Interface Could Allow Code Execution (823980)." Retrieved 6th Feb,
2006, from
http://www.microsoft.com/technet/security/bulletin/MS03-026.mspx.
Related Documents