VISUAL HELMET-MOUNTED DISPLAYS Clarence E. Rash Michael M. Bayer Thomas H. Harding William E. McLean The first helmet-mounted displays (HMDs) were purely visual systems. This includes the original (but not fielded) Pratt gun sight (Pratt, 1916) (Figure 4-1, top, left) and the first image intensification (I 2 ) devices, Night Vision Goggles (NVGs). All NVG systems, even the most current design, the Aviator’s Night Vision Imaging System (ANVIS) (Figure 4-1, top, right), are add-on devices, in the sense that they are not integrated into their helmet platform but are attached to the helmet. All currently fielded HMDs provide visual input. Integrated HMDs, such as the 1970’s Honeywell, Inc., Integrated Helmet and Display Sighting System (IHADSS) (Figure 4-1, bottom), used on the U.S. Army’s AH-64 Apache helicopter incorporate both visual and audio inputs within the helmet platform. Integrated HMD designs attempt to optimize optical and acoustical performance while maintaining the protective function of the helmet. In addition, the helmet must serve as the mounting platform for the optical and acoustical elements. This chapter introduces the fundamental concepts of HMDs from the perspective of optical design and image quality as they affect the Warfighter’s visual performance. The auditory concepts of HMD designs are presented and discussed in Chapter 5, Audio Helmet-Mounted Displays. A discussion of visual HMDs begins with an overview of the different approaches used in the optical design of HMDs. The most important components are the image sources and the optics that deliver the image generated by the source to the user’s eye(s). Probably the most important element within the relay optics is the final reflecting surface. For see-through HMDs, this element serves as a beamsplitter. User acceptance of and performance with are the critical measures of the success of any HMD. Acceptance depends on many factors from the fields of ergonomics and human factors. HMD parameters that impact acceptance include head-supported weight, center-of-mass (CM) offsets, fitting method, exit pupil size and physical eye relief. User performance also is strongly correlated with the quality of the display imagery presented to the eye. Image quality is determined by a number of factors, which include luminance, contrast, resolution, ambient illuminance, and uniformity. Such factors, referred to as figures of merit (FOMs), used to indicate image quality, depend on the type of image source, e.g., cathode-ray-tube (CRT), plasma, and liquid crystal display (LCD). The level of image quality in an HMD will determine the user’s ability to recognize and interpret the information content in the presented image. Optical Designs The optical design for any HMD has as its primary purpose the generation of a final image(s) that is then viewed by the eye(s). In all HMD designs, the image source is located some distance away from the eye(s). If this initial image at the image source is sufficiently far away it must be relayed up to the eyepiece optics, which form the final image(s) for the eye(s). In performing this task, the optical system must provide a specific field-of-view (FOV) to the viewer with sufficient eye clearance to accommodate spectacles, protective masks, and other 4

Welcome message from author
This document is posted to help you gain knowledge. Please leave a comment to let me know what you think about it! Share it to your friends and learn new things together.
Transcript

VISUAL HELMET-MOUNTED DISPLAYS
Clarence E. Rash Michael M. Bayer Thomas H. Harding William E. McLean The first helmet-mounted displays (HMDs) were purely visual systems. This includes the original (but not fielded) Pratt gun sight (Pratt, 1916) (Figure 4-1, top, left) and the first image intensification (I2) devices, Night Vision Goggles (NVGs). All NVG systems, even the most current design, the Aviator’s Night Vision Imaging System (ANVIS) (Figure 4-1, top, right), are add-on devices, in the sense that they are not integrated into their helmet platform but are attached to the helmet. All currently fielded HMDs provide visual input. Integrated HMDs, such as the 1970’s Honeywell, Inc., Integrated Helmet and Display Sighting System (IHADSS) (Figure 4-1, bottom), used on the U.S. Army’s AH-64 Apache helicopter incorporate both visual and audio inputs within the helmet platform. Integrated HMD designs attempt to optimize optical and acoustical performance while maintaining the protective function of the helmet. In addition, the helmet must serve as the mounting platform for the optical and acoustical elements. This chapter introduces the fundamental concepts of HMDs from the perspective of optical design and image quality as they affect the Warfighter’s visual performance. The auditory concepts of HMD designs are presented and discussed in Chapter 5, Audio Helmet-Mounted Displays. A discussion of visual HMDs begins with an overview of the different approaches used in the optical design of HMDs. The most important components are the image sources and the optics that deliver the image generated by the source to the user’s eye(s). Probably the most important element within the relay optics is the final reflecting surface. For see-through HMDs, this element serves as a beamsplitter. User acceptance of and performance with are the critical measures of the success of any HMD. Acceptance depends on many factors from the fields of ergonomics and human factors. HMD parameters that impact acceptance include head-supported weight, center-of-mass (CM) offsets, fitting method, exit pupil size and physical eye relief. User performance also is strongly correlated with the quality of the display imagery presented to the eye. Image quality is determined by a number of factors, which include luminance, contrast, resolution, ambient illuminance, and uniformity. Such factors, referred to as figures of merit (FOMs), used to indicate image quality, depend on the type of image source, e.g., cathode-ray-tube (CRT), plasma, and liquid crystal display (LCD). The level of image quality in an HMD will determine the user’s ability to recognize and interpret the information content in the presented image. Optical Designs The optical design for any HMD has as its primary purpose the generation of a final image(s) that is then viewed by the eye(s). In all HMD designs, the image source is located some distance away from the eye(s). If this initial image at the image source is sufficiently far away it must be relayed up to the eyepiece optics, which form the final image(s) for the eye(s). In performing this task, the optical system must provide a specific field-of-view (FOV) to the viewer with sufficient eye clearance to accommodate spectacles, protective masks, and other
4

Chapter 4 110
Figure 4-1. The Pratt gun sight (top, left); the Aviator’s Night Vision Imaging System (ANVIS) (top, right); and Integrated Helmet and Display Sighting System (IHADSS) (bottom).
possible required add-on devices. The optical design must create a sufficiently sized eye box (a volume in space where the viewer’s eye must be placed) to compensate for pupil displacements due to eye movement, vibration, and head/helmet slippage. For optical systems that use relay optics this eye box is called the exit pupil. Optical systems that do not use relay optics also have a designed eye position location, or eye box, that is often erroneously called an exit pupil. For optical systems that produce a real exit pupil eye movement outside of the exit pupil will result in an inability to see any part of the FOV, whereas for non-real exit pupil systems (those without relay optics) movement outside of the eye box may result in losing part of the FOV and/or in reduced image quality (blur). Optical design parameters There are a number of important descriptive parameters in an HMD optical design. These include:
• Field-of-view (FOV) • Exit pupil (eye box) size and shape • Optical eye relief • Physical eye relief • Transmission (optical throughput) • Beamsplitter transmission/reflection coefficients (for see-through HMDs) • Modulation transfer function (MTF) • Chromatic aberration • Distortion

Visual Helmet-Mounted Displays
111
• Field curvature • Magnification • Ghosting • Weight (Mass) • Center-of-mass (CM) • Volume (Space required)
While it is tempting to identify a select few of these parameters as being universally most important, the intended use of the HMD is, in fact, the deciding factor in which parameters should drive the optical design. As an example, an HMD that has targeting as its sole purpose would require a very small FOV (e.g., 1 to 3 degrees), making FOV less of a design driver. This is in contrast to an HMD that has pilotage imagery as it primary use. In this case, a large FOV is desired, making it an important design parameter for its purpose. Nonetheless, there are a few optical system parameters that are fundamentally important to the vast majority of designs and deserve brief discussions. These include weight (mass), FOV, MTF, exit pupil size, and eye relief. The weight (mass) of the optics includes contributions from the optical elements themselves (e.g., lenses, beamsplitter, mirrors, prisms), the housing for these optical elements, and in most cases, the image source. The choice of the material used for the optical elements can impact the optics weight significantly. Although considerable advancement has been made in optical materials, the best image quality currently available is still obtained with optical elements composed of glass. Unfortunately, glass is the heaviest optical medium. Nonetheless, compromises via the use of plastic optical elements, which are both lighter in weight and lower in cost, have been made. Holographic elements offer even more weight savings. The use of holographic beamsplitters (combiners) in refractive optics HMD optical designs makes use of their wavelength-selective characteristics and has the added advantage of not introducing additional optical power (Wood, 1992). The weight (mass) associated with the optics is important from both ergonomic and safety perspectives. The additional head-supported weight (mass) of the HMD can produce neck muscle fatigue, which can degrade performance, and increase the potential of injury due to dynamic loading during crashes. It is desirable to minimize head-supported weight (mass) in HMD designs. The optics and image source make up a significant portion of this weight (mass). By the very design of current HMDs, some of the optical components (and hence the additional weight) are located in front of the face. This results in the CM of the system being forward and often above the CM of the human head/neck combination (i.e., the tragion notch). In monocular HMDs, the system CM also will be offset further, laterally. This resulting torque increases neck muscle fatigue. The issues associated with head-supported weight (mass) and CM are fully discussed in Chapter 17, Guidelines for HMD Designs. Another fundamental optical parameter is FOV, defined as the maximum angle of view that can be seen through an optical device. An alternative definition is the horizontal and vertical angles the display image subtends with respect to the eye. This definition is the result of most HMD FOVs being rectangular and described as a combination of the vertical angle and the horizontal angle (e.g., the IHADSS FOV is cited as 30º vertical X 40º horizontal). FOV is affected by magnification and the image source size, with greater magnification and/or image source size resulting in a larger field of view. Typically, HMDs present a FOV to the viewer that matches one-to-one (conformally) with the FOV of the sensor that is used to capture the original image of the outside world. In principle, the larger the FOV, the greater the amount of information made available (assuming the image source and sensor have the resolution to properly support the increased FOV). Consequently, HMDs designed for pilotage attempt to maximize FOV, ideally matching that of the human visual system. The human eye has an instantaneous FOV that is roughly oval and typically measures 120º vertically by 150º horizontally. Considering both eyes together, the overall binocular FOV measures approximately 120º (V) by 200º (H) (Zuckerman, 1954) (Figure 4-2).

Chapter 4 112
Designs fielded so far all provide restricted FOV sizes compared to human vision. The size of the FOV that an HMD is capable of providing is constrained by several sensor and display parameters, which include size, weight, placement, and resolution. In ANVIS, the FOV of a single image tube is nominally a circular 40º. The two tubes have a 100 percent overlap; hence, the total FOV is also 40º. This FOV size seems small in comparison to that of the unobstructed eye. But, the reduction must be judged in the context of all of the obstructions associated with a cockpit, e.g., armor, glare shield, and support structures. The monocular IHADSS used on the AH-64 Apache helicopter has a rectangular FOV, 30º vertical X 40º horizontal. Biocular HMD designs, such as the U.S. Army’s Comanche program that is no longer in development, had a 35º vertical X 52º horizontal FOV. The design parameter most affected by the choice of material for the optical elements is the MTF. The MTF is a metric that defines how well an optical system transfers modulation contrast from its input to its output as a function of spatial frequency.1 A plot of such a transfer is called an MTF curve (Figure 4-3). Since any scene theoretically can be resolved into a set of sinusoidal spatial frequencies, it is possible to use a system’s MTF to determine image degradation through the system.
Figure 4-2. Human visual system’s binocular field-of-view (FOV).
Figure 4-3. Typical modulation transfer (MTF) curve.
1 Spatial frequency is a measure of detail in a scene, usually defined by how rapidly luminance changes within a region. A single spatial frequency is commonly represented by a series of vertical bars where the luminance varies according to a sinusoidal function. In this simple case the spatial frequency of the stimulus is just the frequency of the sinusoid used to generate the pattern. In general, the part of a scene with fine detail including sharp edges has high spatial frequencies and the part where the luminance over a region changes more slowly has low spatial frequencies.

Visual Helmet-Mounted Displays
113
Within an HMD system, every major component (e.g. sensor, image source, optics) has its own MTF. If the system is linear, its total MTF can be obtained by multiplying the MTFs of the system’s individual components. The illustrative MTF curve provided in Figure 4-3 presents a relatively good contrast transfer for low and medium spatial frequencies (the curve is high on the vertical axis) but falls rather abruptly at higher frequencies. A system’s inability to faithfully reproduce contrast at the higher spatial frequencies would indicate a loss of a user’s ability to see detailed features in the environment. To accurately predict the image quality of an HMD system, it is necessary to determine how the overall system will affect resolution and contrast. The MTF performs this function. The MTF of an optical system is perhaps the most widely-accepted metric for the quality of the imagery seen through the optical system (Velger, 1998). It defines the fidelity to which an outside scene is reproduced in the final viewed image. A perfect system would have an MTF of unity across all spatial frequencies (Shott, 1997). The degradation that is present in a practical HMD optical system’s MTF is a result of the residual (uncorrected) aberrations in the system and is ultimately limited by diffraction effects, which is beyond the scope of this section. The remaining two design parameters needing some explanation, exit pupil and eye relief, are closely related. The exit pupil is the volume in space where the eye must be placed in order to be able to see the full image. An exit pupil has three characteristics: size, shape, and location. Within the limitation of other design constraints, e.g., size, weight, complexity, and cost, the exit pupil should be as large as possible. The 1970s IHADSS has a circular 10-mm diameter exit pupil. The planned HIDSS exit pupil was specified also to be circular but with a larger, 15-mm, diameter. While systems with exit pupils having diameters as large as 20 mm have been built, 10 to 15 mm has been the typical value (Task, Kocian, and Brindle, 1980). Tsou (1993) suggests that the minimum exit pupil size should include the eye pupil (~ 3 mm), an allowance for eye movements that scan across the FOV (~ 5 mm), and an allowance for helmet slippage (± 3 mm). This would set a minimum exit pupil diameter of 14 mm. Since the real exit pupil is the image of an aperture stop2 in the optical system, the shape of the exit pupil is generally circular (assuming the aperture stop is circular) and, therefore, its size is expressed as a diameter. The exit pupil is located at a distance called the optical eye relief, which is defined as the distance from the last optical element to the exit pupil (Figure 4-4). Over the years, this term has caused some confusion within the HMD community (Rash et al., 2002). What is of critical importance in HMDs is the actual physical distance from the plane of the last physical element to the exit pupil, a distance called the physical eye relief or eye clearance distance (Figure 4-4). This distance should be sufficient to allow use of corrective spectacles, nuclear, biological and chemical (NBC) protective masks, and oxygen mask, as well as, to accommodate the wide variations in head and facial anthropometry. This ability to accommodate intervening visual devices has been a continuous problem with the IHADSS, where the optical eye relief value (10 mm) is greater than the actual eye clearance distance. This is due to the required diameter of the relay optics’ objective lens and the bulk of the barrel housing. To overcome the incompatibility of spectacles with the small physical eye relief of the IHADSS, the U.S. Army investigated the use of contact lenses as an approach to provide refractive correction (Bachman, 1988; Lattimore, 1990; Lattimore and Cornum, 1992). While citing a number of physiological, biochemical and clinical issues associated with contact wear and the lack of reliable bifocal capability, the studies did conclude that contact lenses may provide a partial solution to HMD eye relief problems. Contacts have indeed provided and continue to provide the capability of vision correction for AH-64 Apache pilots. More recently, following the lead of the U.S. Air Force, the U.S. Army conducted a study that investigated refractive surgery techniques as an alternative solution (van de Pol et al., 2007). As a result of this study, a policy has been issued allowing the surgical procedure of Laser-Assisted in Situ Keratomileusis (LASIK).
2 In optics, an aperture in an optical system is a structure or opening that limits the light rays that pass through the system. An optical system usually has several such apertures. In general, these structures are called stops, and the aperture stop is the stop that determines the ray cone angle, and equivalently the brightness, at an image point.

Chapter 4 114
Figure 4-4. Optical eye relief (left) is defined as the distance from the last optical element to the exit pupil, where the eye would be placed. Physical eye relief (right) can be less than optical eye relief if additional structures are present (Rash et al., 2002). HMD designs The range of HMD design types run from a simple projection of symbolic and/or alpha/numeric information overlaying a direct-view real image for day time use, to a head slaved virtual imaging device that could be linked to remote sensors and/or computer generated imagery for day or night use, and of course, anything in between. As the design type increases in complexity, so does the optical design. Simplest HMD design In the Vietnam Era, a Bell Cobra helicopter (AH-1) was developed with a simple monocular helmet sight (known as the Cobra sight) that could translate an external mounted machinegun using a mechanical head tracker that attached to the top of the helmet (Braybrook, 1998). In front of the right eye was a small semi-transparent window that projected a red dot that was similar to simple commercial red dot reflex sights on some pistols and rifles. The 17-millimeter (mm) diameter combiner was located outside the helmet visor about 50 mm from the eye and could be adjusted in vertical and horizontal positions to properly align with the right eye. The size of the projected red dot was only a few milliradians (mr) in diameter, and was focused at infinity. The see-through visible transmission of the combining glass (beamsplitter) was very high, and the brightness of the aiming reticule was sufficient to be visible at the sky horizon. Complex modern HMD designs In contrast to the simple design of the Cobra sight is a limited-fielded visor-projection HMD currently being offered by a leading aerospace company having the following characteristics:
• Visor projection optical design • Focused and aligned at infinity • Binocular/biocular viewing • Magnetic or electro-optical head tracked • See-through vision • FOV – >40° • Can accommodate a wide range of eye separations
EyepieceExitpupil
Optical eye relief
Physical eye relief
EyepieceExitpupil
Optical eye relief

Visual Helmet-Mounted Displays
115
• Sufficient brightness and contrast for both day and night operations • Incorporates direct-view image intensifiers on the side of the helmet and video links to external
sensors reflected from the visor • Flight and/or systems symbology can be projected, with unaided daytime see-through vision or at
night, overlaying the image intensified or thermal image The optical design of such a visor-projection HMD has always been challenging in obtaining a wide FOV with low-distortion, high-quality imagery and with an acceptable head supported weight. The reflective component of the visor design may be a hologram or a dichroic filter imbedded in the visor that focuses and aligns the incident rays from the relay optics. This example HMD is binocular in its optical design for thermal imagery, but since there is a single infrared sensor, the thermal image is repeated to both eyes, which results in a biocular HMD system. For the I2 imagery, with the I2 tubes located on the side of the helmet and further apart than the normal separation between the eyes, intensified image is truly binocular. However, this binocularity produces the visual state of hyperstereopsis, which is fully discussed in Chapter 12, Visual Perceptual Conflicts and Illusions. Because the near-infrared image intensifiers are located on the head, and the infrared thermal sensors are located on the outside of the aircraft, the operator can only use one or the other, since the two images can not be fused. This requires the operator to mentally move their visual location for proper perspective cues. Another challenging characteristic will be switching from the biocular thermal sensor, with no stereopsis, to a hyperstereo I2 scene. See-through vision of the visor would intuitively seem to be desirable. For day flight with the HMD providing flight and aircraft/weapon information (symbology), undistorted, high transmission see-through vision greatly increases the pilot’s situation awareness and effectiveness. Symbology for helicopter and near-earth day-viewing must be monocular to prevent double images. Binocular symbology can only be seen single, and the outside images appear single as well, when objects are located beyond 60 meters (197 feet) (McLean and Smith, 1987). In addition, the right and left images have to be aligned both vertically and horizontally at infinity to within 1 mr. When viewing closer than 60 meters (197 feet), the difference in the eye convergence between the symbol and the outside image will exceed 1 mr and induce diplopia (double vision). An exception to using only monocular symbology could be an aiming reticle or test pattern to check the HMD for proper alignment between the right and left eye images before flight, and then switching to monocular symbology for the day mode. At what distance should the symbology and projected image be focused? For head-up displays (HUDs), commonly used in fixed-wing fighter aircraft and are viewed binocularly, the focus and alignment would be expected to be set within 1 mr of infinity to correspond to distant outside objects. However, with thick curved canopies, such as the F-16, the alignment of the actual object and viewed symbology or image through the canopy can be slightly different, and the HUD focus and convergence are adjusted to coincide to the image shift caused by the canopy. When the HUD was initially set at infinity alignment, the symbology appeared double when viewed by an observer focusing on a distant object. In other words, the viewed image through the canopy may not be optically aligned but may appear to be at a distance other than its actual physical distance (Martin et al., 1983). However, when viewing a sensor image, whether with image intensifiers or a binocular/biocular HMD, the eyepiece infinity focus and alignment may induce slightly blurred images for many of the pilots that are very slightly myopic and not therefore required to wear corrective lenses. If an HMD (such as the visor projection type) has a final, beamsplitter reflective element, it may induce ghost images or optical artifacts that are not desirable, compared to a standard helmet visor. One would think that having simultaneous, overlaid, unaided vision and sensor images would provide the best of both perceptions, but in almost all cases, the users are aware the two separate images (unaided and aided) never exactly align within the 1 mr tolerance, and the two images create a conflict. It’s similar to the Sunday paper where the three colors do not align in a picture. The see-through vision for night imagery is easily blocked with an added opaque visor that only covers the FOV equal to the size of the sensor image. When pilots were given the option of blocking the outside see through image at night with the opaque visor, almost all preferred the non-see-through format.

Chapter 4 116
Design types There are a number of HMD optical design types that have been deployed over the decades of HMD development. Most HMD optical design types require an eyepiece to allow the user to see the HMD imagery. Figures 4-5 and 4-6 show the ray trace differences between various simplified eyepiece designs. For comparison purposes, the drawings of each eyepiece type design presented are equally scaled. The full-scaled drawings used 30-mm eye clearances and 5-mm exit pupils to obtain a vertical FOV of 40º. The following descriptions encompass the more fundamental optical HMD optical design approaches and are only representative of the many varied designs that have been implemented. A number of extensive reviews of HMD optical designs are suggested for the more interested reader (e.g., Cakmakci, O. and Rolland, J., 2006; Melzer, J., and Moffitt, K., 1997; Velger, M., 1998). Refractive The simplest NVG, HUD, and HMD systems use refractive, on-axis eyepiece optics. Examples include the ANVIS (Figure 4-5, top) with no see-through vision and a reflex HUD (Figure 4-5, bottom) with a 45º angle combiner and see-through vision. The see-through vision is provided with a partial reflective beam splitter or plano combiner. IHADSS helmet display unit (HDU) (Figure 4-6, top), which is an HMD with see-through vision in the AH-64 aircraft for night pilotage, tilts the combiner to 38º from the last optical lens to improve eye relief. Refractive optical designs use lenses for imaging. The IHADSS HDU provides imagery and symbology from remote sensors, where the two night imaging sensors (I2 tubes) are contained in the ANVIS. The primary advantage of the refractive design with a plano combiner is the high percent luminance transfer from the display to the eye. The primary disadvantages for refractive HMDs with see-through vision are excessive weight with limited fields of view and eye clearance. The ANVIS eyepiece is a simple, well-corrected, magnifier with no see-through vision. Other NVG designs such as the Eagle EyeTM or the Cat’s EyesTM use prism combiners for see-through vision with I2, but the see-through combiners with intensifier tubes have been used primarily by fixed-wing fighter type aircraft with HUDs. These see-through plano combiners are enclosed or sandwiched between two prisms which, when combined, form a plano refractive media with minimal prismatic deviation. The purpose of the prism combiners is to increase the combiner stability and increase the eye clearances for a given FOV and eyepiece diameter. Figure 4-6 (bottom) shows a prism combiner using the IHADSS design. The prism combiners can also be used with power reflective combiners. Figure 4-7 (top) shows a catadioptric eyepiece design without the prism combiner and Figure 4-7 (bottom) with a prism combiner. Catadioptric optical designs use curved reflective mirrors with or without lenses for imaging (Figure 4-7). The primary advantage of catadioptric designs is larger diameter optics with less weight and without induced chromatic aberrations. By coating transmissive curved surfaces with partial reflective materials to provide see-through vision, the beam splitter is referred to as a power combiner. Figure 4-7 (top) shows the catadioptric design with a prism combiner to increase the eye clearance for a given FOV. The primary disadvantages are reduced luminance transfer with prism combiner from the display for a given percent see-through vision compared to refractive systems. Extraneous reflections have also been a problem area. The catadioptric designs can obtain slightly larger fields of view for a given eye clearance compared to refractive systems. Catadioptric designs have not been used in significant numbers for production HMDs at present, but have been used in a few HUDs (example OH-58D pilot display unit (PDU) for Stinger missiles). Figure 4-8 shows comparison plots of the eyepiece diameters versus FOV for the refractive nonsee-through versus the various see-through HMD designs without prism combiners. The differences between the refractive and IHADSS HMDs are only in the angle of the combiner to the eyepiece and central ray to the eye. The refractive see-through HMD (Figure 4-5, bottom) uses a constant 45º combiner angle for all FOVs, where the IHADSS HMD (Figure 4-6, top) adjusts the lower FOV limit ray to run parallel with the eyepiece to minimize its

Visual Helmet-Mounted Displays
117
Figure 4-5. HMD eyepieces: Direct-view, no see-through, NVG type eyepiece (top) and HUD refractive see-through combiner at 45º (bottom) (Rash, 2001).
diameter. The estimated 60-mm diameter eyepiece limit is based on mechanical considerations for the smaller IPD ranges and overlapped HMD FOVs. Catadioptric Figure 4-9 graphs and compares the effects on the eyepiece diameter with and without prism combiners for the IHADSS and catadioptric designs. A high index of refraction (n = 1.58) plastic material (polycarbonate) was selected for the prism combiners for calculation purposes to obtain the maximum effect. Other materials could be selected for the prism combiners for the particular properties of the material such as lower weight and manufacturing qualities. Note that the surfaces closest and farthest from the eye of the prism combiners are parallel surfaces for the see-through vision. Without parallel surfaces, unwanted prismatic deviations or refractive powers would be induced. The prism combiner is actually more like a cube beam splitter, except the alignment of the beamsplitter does not have to be 45º to the central ray. On- and off-axis designs On-axis optical designs align the optical centers of each optical element, or slightly displace one of the elements, which can be rotated to achieve vertical and horizontal alignment for binocular designs such as

Chapter 4 118
Figure 4-6. HMD eyepieces: Refractive (IHADSS) (top) and refractive prism combiner (bottom) (Rash, 2001).
binoculars. The IHADSS and the ANVIS refractive designs use on-axis alignment. The on-axis, see-through catadioptric designs include power and plano combiners. Off-axis catadioptric systems are usually referred to as reflective off-axis systems and may or may not require plano combiners. As the off-axis angle to the power combiner increases, the induced distortions and aberrations increase rapidly (Buchroeder, 1987). An example of a modest off-axis catadioptric design with a plano combiner is shown in Figure 4-10 (Droessler and Rotier, 1989; Rotier, 1989). This catadioptric design achieves a 50º x 60º FOV with a 10-mm exit pupil and 30-mm eye relief (measured from plano combiner intercept to apex of eye along primary line of sight). However, note the optical complexity with 11 refractive elements and 3 reflective surfaces with very complex coatings for both eyepiece reflective surfaces to maximize see-through and display transmissions. The modest trapezoidal distortion of 7.5% (Figure 4-11) will be aligned with the power combiner. Another promising HMD is the Monolithic Afocal Relay Combiner (MONARC), which is an off-axis, rotationally symmetrical lens system with modest FOV potential, but excellent see-through approach (Figure 4-12). However, for any of the off-axis binocular systems, the distortions will have to be corrected to achieve point for point image alignment throughout the FOV.

Visual Helmet-Mounted Displays
119
Figure 4-7. HMD eyepieces: Catadioptric (top) and catadioptric with prism combiner (bottom) (Rash, 2001).
The primary advantage of the off-axis reflective HMD design is that it provides the highest potential percent luminance transfer from the display with the most see-through vision and increased eye clearances for a given FOV. The primary disadvantages are very complex optical designs, shape distortions, and low structural integrity and stability of the reflective surface. Figure 4-13 shows the conceptual drawings (top and side view) of an off-axis HMD using the visor as the eyepiece. Note the locations of the aerial images, which are shown for the left eye. The location of the relay optics will be either on top of the helmet, or below and to the sides, where both locations have undesirable characteristics such as a high center of mass, or produce lower obstructions to unaided vision. Also, note that the head seems to get in the way of the optics or relay image. Where there are no provisions for electronic distortion correction, such as found with NVGs, the off-axis designs become unacceptable from the keystone or trapezoidal type distortions.

Chapter 4 120
Figure 4-8. FOV versus eyepiece diameter for different designs.
Figure 4-9. Comparisons between refractive and catadioptric HMDs with and without prism combiners.

Visual Helmet-Mounted Displays
121
Figure 4-10. Ray trace of 50º x 60º tilted cat ocular (Droessler and Rotier,1989).
Figure 4-11. Optically induced distortion from tilted catadioptric, off-axis HMD design.
Figure 4-12. MONARC with rotationally symmetrical lens system (folded catadioptric).

Chapter 4 122
Figure 4-13. Reflective visor HMD: a) side view (top) and b) top view (bottom) (Shenker, 1987).
Pupil and nonpupil forming A nonpupil forming virtual display uses a simple eyepiece to collimate or create a virtual image of a physical image source. An example is the ANVIS NVG where eyepieces produce virtual images of the 18-mm phosphor screens resulting in a 40º FOV. The display size, eyepiece focal length, eye clearance, exit pupil diameter, and f/# define the FOV relationships similar to viewing through a knot hole (Figure 4-5, top). A method to increase the apparent size of a display up to approximately 2X is with a coherent fiber-optic taper placed on the display. This approach based on a 1.5X taper was used with the Advanced I2 program to obtain a 60º NVG FOV from the 18-
Visual Helmet-Mounted Displays
123
mm diameter intensifier tubes. The disadvantages of the expanding taper are a slightly increased weight compared to the 40º FOV ANVIS and reduced light transmission. However, without the taper, the increased tube diameter (from 18 mm to 27 mm) needed to obtain the same 60º FOV would weigh much more than the 18-mm tube with the 1.5X taper, but would not have a reduction in light transmission. A pupil forming system has the same basic optical design as a compound microscope or telescope. Other common examples are rifle scopes, periscopes, and binoculars. For the pupil forming system, the eyepieces collimate real (aerial) images that are formed using relay optics. One purpose of the relay optics is to magnify the physical image source with the eyepiece providing additional magnification. Relay optics can also transport and invert the image as in the case of a periscope. The pupil forming system forms a real exit pupil that can be imaged with a translucent screen. Unlike the knothole analogy for the nonpupil-forming device, the pupil forming system requires the pupil of the eye to be positioned within a specific area to see the full FOV unvignetted. If the eye is moved closer than the exit pupil, the FOV will actually decrease. Also, if the eye is moved laterally outside the exit pupil, the complete display disappears where the nonpupil forming system merely vignettes the FOV in the opposite direction of lateral movement outside the exit pupil. The exit pupil for a pupil forming system is defined by the optical ray trace and is shown in Figure 4-14 (top) for the center of the FOV and Figure 4-14 (bottom) for the edge of the FOV. Note also the field lens, which is used to channel the aerial image to the eyepiece and adjust the eye clearance. The relay optics of pupil forming devices usually are determined after the type eyepiece design, FOV, optical length, exit pupil diameter, and eye clearance values have been defined. To minimize the size and weight of the relay optics, the designer will attempt to use the shortest optical path possible within mechanical constraints. Image Quality For all of the sensor and display technology that goes into the final imagery presented to the Warfighter by an HMD, it is the quality of the imagery that determines its success. HMDs are used to present various types of information. These types include text, symbols, graphics, and video. Many factors affect the Warfighter’s ability to perceive and use this displayed information. If the information is a simple reproduction of computer generated text, symbols, or graphics, then the major factor affecting the fidelity of the information is the capacity of the HMD to faithfully reproduce the original image information. However, if the information is a representation of some external view of the world, as from an imaging system, then, in addition to the HMD’s capacity to faithfully reproduce the image, a number of additional factors will affect the user’s perception of the information. These include sensor parameters associated with the imaging system, transform functions associated with conversions of the scene from one domain to another (e.g., spatial, luminance, temporal), attenuation and filtering due to processing and signal transmission, noise, etc. However, ultimately, visual performance is limited by the quality of the final image. What defines "acceptable" image quality varies from application to application and depends on the amount of information needed for the task(s) at hand; adequate image quality for one task may be insufficient in another. As previously stated, image quality is typically defined by a set of FOMs. Task (1979) described an extensive set of FOMs for defining image quality with CRTs. These FOMs are categorized as geometric, electronic and photometric in nature. Geometric FOMs include display source size, viewing distance, and aspect ratio. Electronic FOMs include bandwidth, dynamic range, and signal-to-noise ratio. For our discussion herein of visual HMDs, photometric FOMs are more important and include luminance, gray shades, contrast ratio, resolution, luminance uniformity, and MTF. As flat panel displays replaced CRTs as the display technology of choice in the last two decades, the classification of image quality FOMs changed (Klymenko et al., 1997). For flat panel displays, FOMs have been categorized into four domains: spatial, spectral, luminance, and temporal (Table 4-1). These image domains parallel analogous human visual performance domains. The spatial domain includes those display parameters that are associated with angular view (subtense) of the observer and coincide with observer visual acuity and spatial

Chapter 4 124
sensitivity. The spectral domain consists of those parameters that are associated with the observer’s visual sensitivity to color (wavelength). The luminance domain encompasses those display parameters identified with the overall sensitivity of the observer to levels of light intensity. The temporal domain addresses display parameters associated with the observer’s sensitivity to changing levels of light intensity.
Figure 4-14. Ray trace of exit pupil formed by the center rays (top) and the marginal rays for a pupil forming optical device (bottom).
Table 4-1.
Flat panel display parameters (FOMs) (Klymenko et al., 1997).
Spatial Spectral Luminance Temporal Pixel resolution (H x V) Pixel size Pixel shape Pixel pitch Subpixel configuration Number of defective (sub)pixels
Spectral distribution Color gamut Chromaticity
Peak luminance Luminance range Gray levels Contrast (ratio) Uniformity Viewing angle Reflectance ratio Halation
Refresh rate Update rate Pixel on/off response rates
Visual Helmet-Mounted Displays
125
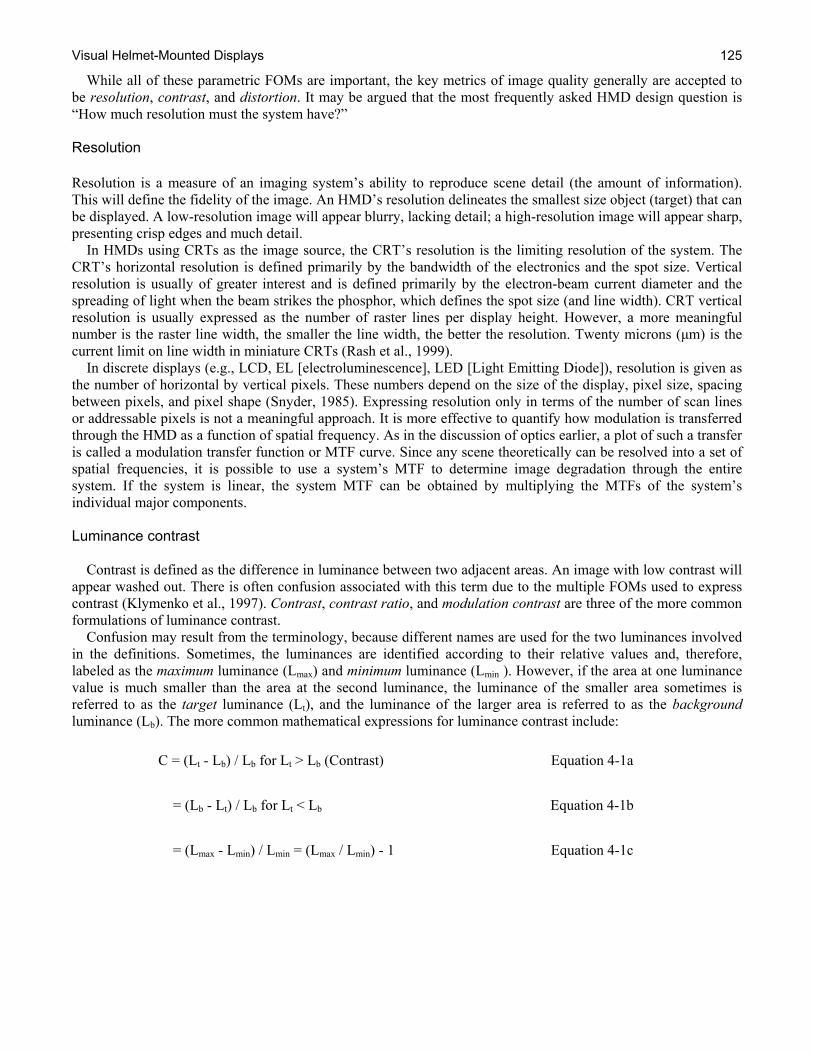
While all of these parametric FOMs are important, the key metrics of image quality generally are accepted to be resolution, contrast, and distortion. It may be argued that the most frequently asked HMD design question is “How much resolution must the system have?” Resolution Resolution is a measure of an imaging system’s ability to reproduce scene detail (the amount of information). This will define the fidelity of the image. An HMD’s resolution delineates the smallest size object (target) that can be displayed. A low-resolution image will appear blurry, lacking detail; a high-resolution image will appear sharp, presenting crisp edges and much detail. In HMDs using CRTs as the image source, the CRT’s resolution is the limiting resolution of the system. The CRT’s horizontal resolution is defined primarily by the bandwidth of the electronics and the spot size. Vertical resolution is usually of greater interest and is defined primarily by the electron-beam current diameter and the spreading of light when the beam strikes the phosphor, which defines the spot size (and line width). CRT vertical resolution is usually expressed as the number of raster lines per display height. However, a more meaningful number is the raster line width, the smaller the line width, the better the resolution. Twenty microns (μm) is the current limit on line width in miniature CRTs (Rash et al., 1999). In discrete displays (e.g., LCD, EL [electroluminescence], LED [Light Emitting Diode]), resolution is given as the number of horizontal by vertical pixels. These numbers depend on the size of the display, pixel size, spacing between pixels, and pixel shape (Snyder, 1985). Expressing resolution only in terms of the number of scan lines or addressable pixels is not a meaningful approach. It is more effective to quantify how modulation is transferred through the HMD as a function of spatial frequency. As in the discussion of optics earlier, a plot of such a transfer is called a modulation transfer function or MTF curve. Since any scene theoretically can be resolved into a set of spatial frequencies, it is possible to use a system’s MTF to determine image degradation through the entire system. If the system is linear, the system MTF can be obtained by multiplying the MTFs of the system’s individual major components. Luminance contrast Contrast is defined as the difference in luminance between two adjacent areas. An image with low contrast will appear washed out. There is often confusion associated with this term due to the multiple FOMs used to express contrast (Klymenko et al., 1997). Contrast, contrast ratio, and modulation contrast are three of the more common formulations of luminance contrast. Confusion may result from the terminology, because different names are used for the two luminances involved in the definitions. Sometimes, the luminances are identified according to their relative values and, therefore, labeled as the maximum luminance (Lmax) and minimum luminance (Lmin ). However, if the area at one luminance value is much smaller than the area at the second luminance, the luminance of the smaller area sometimes is referred to as the target luminance (Lt), and the luminance of the larger area is referred to as the background luminance (Lb). The more common mathematical expressions for luminance contrast include:
C = (Lt - Lb) / Lb for Lt > Lb (Contrast) Equation 4-1a = (Lb - Lt) / Lb for Lt < Lb Equation 4-1b = (Lmax - Lmin) / Lmin = (Lmax / Lmin) - 1 Equation 4-1c
Chapter 4 126
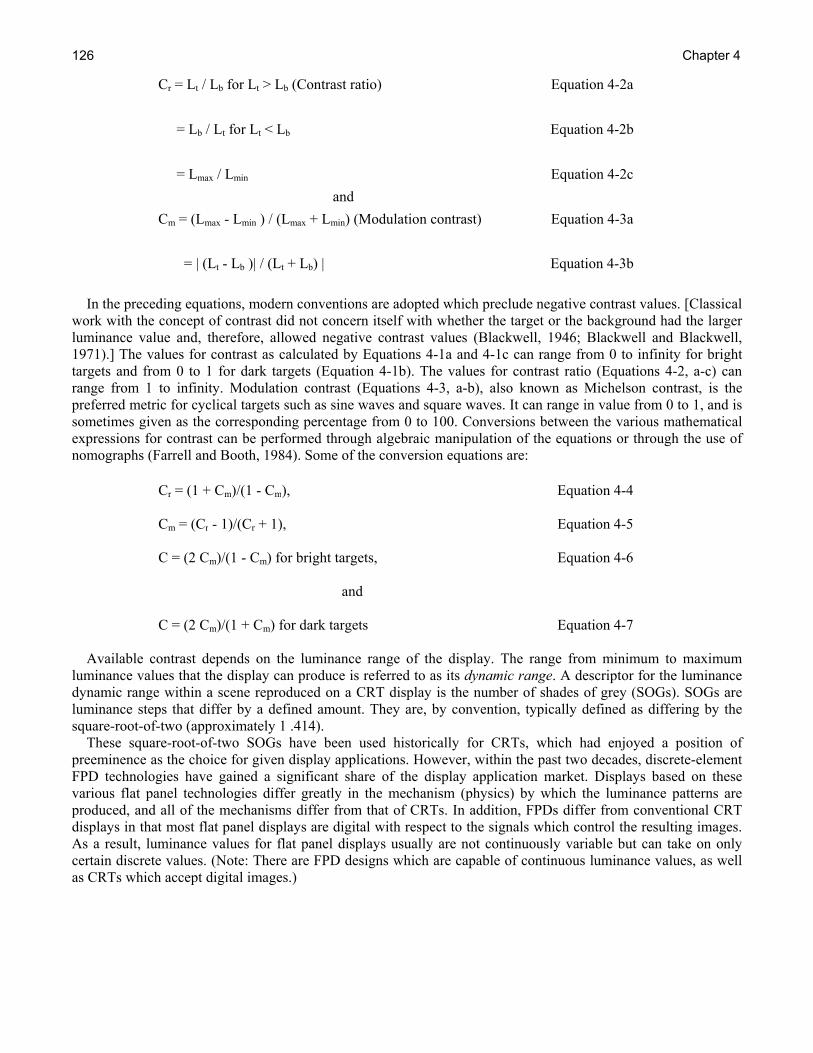
Cr = Lt / Lb for Lt > Lb (Contrast ratio) Equation 4-2a = Lb / Lt for Lt < Lb Equation 4-2b = Lmax / Lmin Equation 4-2c
and Cm = (Lmax - Lmin ) / (Lmax + Lmin) (Modulation contrast) Equation 4-3a = | (Lt - Lb )| / (Lt + Lb) | Equation 4-3b
In the preceding equations, modern conventions are adopted which preclude negative contrast values. [Classical work with the concept of contrast did not concern itself with whether the target or the background had the larger luminance value and, therefore, allowed negative contrast values (Blackwell, 1946; Blackwell and Blackwell, 1971).] The values for contrast as calculated by Equations 4-1a and 4-1c can range from 0 to infinity for bright targets and from 0 to 1 for dark targets (Equation 4-1b). The values for contrast ratio (Equations 4-2, a-c) can range from 1 to infinity. Modulation contrast (Equations 4-3, a-b), also known as Michelson contrast, is the preferred metric for cyclical targets such as sine waves and square waves. It can range in value from 0 to 1, and is sometimes given as the corresponding percentage from 0 to 100. Conversions between the various mathematical expressions for contrast can be performed through algebraic manipulation of the equations or through the use of nomographs (Farrell and Booth, 1984). Some of the conversion equations are:
Cr = (1 + Cm)/(1 - Cm), Equation 4-4 Cm = (Cr - 1)/(Cr + 1), Equation 4-5 C = (2 Cm)/(1 - Cm) for bright targets, Equation 4-6
and
C = (2 Cm)/(1 + Cm) for dark targets Equation 4-7 Available contrast depends on the luminance range of the display. The range from minimum to maximum luminance values that the display can produce is referred to as its dynamic range. A descriptor for the luminance dynamic range within a scene reproduced on a CRT display is the number of shades of grey (SOGs). SOGs are luminance steps that differ by a defined amount. They are, by convention, typically defined as differing by the square-root-of-two (approximately 1 .414). These square-root-of-two SOGs have been used historically for CRTs, which had enjoyed a position of preeminence as the choice for given display applications. However, within the past two decades, discrete-element FPD technologies have gained a significant share of the display application market. Displays based on these various flat panel technologies differ greatly in the mechanism (physics) by which the luminance patterns are produced, and all of the mechanisms differ from that of CRTs. In addition, FPDs differ from conventional CRT displays in that most flat panel displays are digital with respect to the signals which control the resulting images. As a result, luminance values for flat panel displays usually are not continuously variable but can take on only certain discrete values. (Note: There are FPD designs which are capable of continuous luminance values, as well as CRTs which accept digital images.)

Visual Helmet-Mounted Displays
127
Confusion can occur when the concept of SOGs is applied to digital FPDs. Since these displays, in most cases, can produce only certain discrete luminance values, it is reasonable to count the total number of possible luminance steps and use this number as a FOM. However, this number should be referred to as “grey steps” or “grey levels,” not “grey shades.” For example, a given LCD may be specified by its manufacturer as having 64 grey levels. The uninitiated may misinterpret this as 64 shades of grey, which is incorrect. Its true meaning is that the display is capable of producing 64 different electronic signal levels between, and including, the minimum and maximum values, which generally implies 64 luminance levels. If one insisted on using a SOG FOM for discrete displays, it would appropriately depend on the value of the 1st and 64th levels. To avoid confusion, designers should limit some FOMs to either discrete or analog displays. Contrast ratio, computed from maximum and minimum luminance, is applicable to both. The concept of SOG is most appropriate for analog displays and can be computed from contrast ratio. The number of grey levels is most appropriate for displays with discrete luminance steps, but additional information on how these grey levels sample the luminance range needs to be specified. Other contrast FOMs may still be applicable to FPDs. However, in some cases they have to be adapted to conform to the unique characteristics of these displays. For example, because of the discrete nature of FPDs, where the image is formed by the collective turning on or off of an array of pixels, the concept of contrast ratio is redefined to indicate the difference in luminance between a pixel that is fully "on" and one that is "off" (Castellano, 1992). The equation for pixel contrast ratio is:
Cr = (Luminance of ON pixel)/(Luminance of OFF pixel) Equation 4-8 It can be argued that this pixel contrast ratio is a more important FOM for discrete displays. Unfortunately, the value of this FOM as cited by manufacturers is intrinsic in nature, that is, it is the contrast value in the absence of ambient lighting effects. The value of this FOM that is of real importance is the value that the user will actually encounter. This value depends not only on the ambient lighting level, but also on the reflective and diffusive properties of the display surface (Karim, 1992). Additional factors may need to be taken into consideration. An example is the dependence of luminance on the viewing angle where a liquid crystal display’s luminance output given by a manufacturer may only be reliable for a very limited viewing cone. Here the luminance and contrast need to be further specified as a function of viewing angle. On the other hand, the propensity of manufacturers sometimes to define "additional" FOMs that put their products in the best light must always be kept in mind. The term grey scale is used to refer to the luminance values available on a display. (The term as used usually includes available color as well as luminance per se.) Grey scales can be analog or digital. The display may produce a continuous range of luminances, described by the shades of grey concept; or, it may only produce discrete luminance values referred to as grey steps or grey levels. The analog case is well specified by the SOG FOM and more compactly by the maximum contrast ratio of the dynamic range. Also the gamma function succinctly describes the transformation from luminance data (signal voltage) to displayed image luminance. (The MTF additionally describes the display’s operating performance in transferring contrast data to transient voltage beam differences over different spatial scales.) In an analog image, easily applicable image processing techniques, such as contrast enhancement algorithms, are available to reassign the grey levels to improve the visibility of the image information when the displayed image is poorly suited to human vision. (The techniques are easily applicable because they often simply transform one continuous function into another, where computer control over 256 levels is considered as approximating a continuous function for all practical purposes.) Poor images in need of image processing often occur in unnatural images, such as thermal images, and artificial images, such as computer generated magnetic resonance medical images. Since only certain discrete luminance levels are available in the digital case, the description of the grey scale and its effect on perception is not as simple and straightforward as in the analog case. One would like to know if there is a simple function that can describe the luminance scale; but one would also like to know how the function is sampled. A problem is that image enhancement techniques may not be as effective if the discrete sampling of the dynamic range is poor. For

Chapter 4 128
example, consider an infrared sensor generated image presented on an LCD with a small number of discrete grey levels. A contrast enhancement algorithm in reassigning pixel luminances must pick the nearest available discrete grey level and so could inadvertently camouflage targets by making them indistinguishable from adjacent background. Also, the original image might contain spurious edges because neighboring pixel luminance values, which would normally be close and appear as a smooth spatial luminance gradient become widely separated in luminance due to the available discrete levels, thus producing quantization noise (Rash, 2001). Color contrast Luminance differences are important in the ability to discriminate between two luminance values. However, even where the background and target have the same luminances, images can still be discerned by color differences (chromatic contrast). These equal luminance chromatic contrasts are less distinct in terms of visual acuity than luminance contrasts, but can be very visible under certain conditions (Kaiser, Herzberg, and Boynton, 1971). The sensation of color is dependent not only on the spectral characteristics of the target being viewed, but also on the target’s context and the ambient illumination (Godfrey, 1982). The sensation of color can be decomposed into three dimensions: hue, saturation, and brightness. Hue refers to what is normally meant by color, the subjective "blue, green, or red" appearance. Saturation refers to color purity and is related to the amount of neutral white light that is mixed with the color. Brightness refers to the perceived intensity of the light. The appearance of color can be affected greatly by the color of adjacent areas, especially if one area is surrounded by the other. A color area will appear brighter, or less grey, if surrounded by a sufficiently large and relatively darker area, but will appear dimmer, or “more”grey, if surrounded by a relatively lighter area (Illuminating Engineering Society [IES], 1984). To further complicate matters, hues, saturations, and brightnesses all may undergo shifts in their values. The use of color in displays increases the information capacity of displays and the natural appearance of the images. CRTs can be monochrome (usually black and white) or color. Color CRTs use three electron beams to individually excite red, blue, and green phosphors on the face of the CRT. By using the three primary colors and the continuous control of the intensity of each beam, a CRT display can provide "full-color" images. Likewise, FPDs can be monochrome or color. Many flat panel displays that produce color images are still classified as monochrome because these displays provide one color for the characters or symbols and the second color is reserved for the background, (i.e., all of the information is limited to a single color). An example is the classic orange-on-black plasma discharge display, where the images are orange plasma characters against a background colored by a green electroluminescent backlight (Castellano, 1992). Full-color capability has been achieved within the last several years in most all of the flat panel technologies, including LC, EL, LED, field emission, and plasma displays. Even some of the lesser technologies, such as vacuum fluorescence, can provide multicolor capability. Research and development on improving color quality in flat panels is ongoing. FOMs describing the contrast and color generating capacities of displays are an ongoing area of development. FOMs defining color contrast are more complicated than those presented previously where the contrast refers only to differences in luminance. Color contrast metrics must include differences in chromaticities as well as luminance. And, it is not as straightforward to transform chromatic differences into just-noticeable-differences (jnds) in a perceived color space. This is due to a number of reasons. One, color is perceptually a multidimensional variable. The chromatic aspect, or hue, is qualitative and two dimensional, consisting of a blue-yellow axis and a red-green axis. Additionally, the dimensions of saturation and brightness, as well as other factors such as the size and shape of a stimulus, affect the perceived color and perceived color differences. The nature of the stimulus, whether it is a surface color, reflected off a surface, or a self-luminous color, as present in a display, will affect the perceived color space in complex ways. Delineating the nature of perceived color space has been an active area of research with a vast literature (Widdel and Post, 1992).

Visual Helmet-Mounted Displays
129
As a consequence, there is no universally accepted formulation for color contrast. One FOM combining contrast due to both luminance and color, known as the discrimination index (ID), was developed by Calves and Brun (1978). The ID is defined as the linear distance between two points (representing the two stimuli) in a photo-colorimetric space. In such a space, each stimulus is represented by three coordinates (U, V, log L). The U and V coordinates are color coordinates defined by the CIE 1960 chromaticity diagram. The third coordinate, log L, is the base ten logarithm of the stimulus luminance. [A concise discussion of the discrimination index is presented in Rash, Monroe and Verona (1981).] The distance between two points (stimuli) is the ID and is expressed as:
Equation 4-9
where L1 and L2 refer to the luminances of the two stimuli, and (ΔU) and (ΔV) refer to the distances between the colors of the two stimuli in the 1960 CIE two dimensional color coordinate space. A more recent FOM, ΔE (Lippert, 1986; Post, 1983), combining luminance and color differences into a single overall metric for contrast, has been provisionally recommended for colors which present only an impression of light, unrelated to context, only recently by the International Organization for Standardization (ISO, 1987) for colored symbols on a colored background. It is defined as follows:
Equation 4-10 where the differential values (Δ) refer to the luminance (L) and chromaticity (u’, v’) differences between symbol and background and Lmax refers to the maximum luminance of either symbol or background. Developing the appropriate FOM to describe the color contrast capacities of displays is an ongoing area of development (Widdel and Post, 1992). Contrast and HMDs This discussion has been general in nature. It is applicable to panel-mounted as well as HMDs. However, HMDs introduce additional contrast issues. For example, in IHADSS, the sensor imagery is superimposed over the see-through view of the real world. Although see-through HMD designs are effective and have proven successful, they are subject to contrast attenuation from the ambient illumination. The image contrast as seen through the display optics is degraded by the superimposed outside image from the see-through component, which transmits the ambient background luminance. This effect is very significant during daytime flight when ambient illumination is highest. A typical HMD optical design in a simulated cockpit scenario is shown in Figure 4-15. The eyepiece optics consists of two combiners, one plano and one spherical. Light from the ambient scene passes through the aircraft canopy, helmet visor, both combiners, and then enters the eye. Simultaneously, light from an image source such as a CRT partially reflects first off of the plano combiner and then off of the spherical combiner, and then is transmitted back through the plano combiner into the eyes. If the characteristics of the various optical media are: 70% canopy transmittance; 85% and 18% transmittance for a clear and shaded visor, respectively; 70% transmittance (ambient towards the eye); 70% reflectance (CRT luminance back towards the eye) for the spherical combiner, 60% transmittance (ambient towards the eye) and 40% reflectance (CRT luminance) for the plano combiner, then one can analyze the light levels getting to the eye. An analysis of this design shows that approximately 17% of the luminance from the CRT image (and CRT optics) and approximately 25% of the ambient scene luminance reaches the eye for the clear visor (5% for the tinted visor).

Chapter 4 130
Figure 4-15. Typical catadioptric HMD optical design (Rash, 2001).
Distortion Distortion usually is defined as a difference in the apparent geometry of the outside scene as viewed on or through the display. Sources of distortion in the display image include the image source and display optics (with combiner). For see-through designs, the combiner introduces distortion into the image of the outside scene. Distortion can exist outside the display itself, such as that caused by the aircraft windscreen. In current I2 designs, e.g., ANVIS, the fiberoptic inverter is the primary source of distortion. Wells and Haas (1992) suggest that additional distortion can be induced in HMDs using CRTs as image sources. This distortion is perceptual and relates to a change in the shape of a raster-scanned picture on the retina during rapid eye movements (Crookes, 1957), such as those inherent in head-coupled systems. Distortion in CRTs is rather easily minimized through the use of external correction circuitry. The CRT image also can be predistorted to allow for distortion induced in the display optics. FP image sources generally are considered to be distortion free, with the display optics being the source of any distortion present in HMDs using these sources. FP images also can be predistorted to correct for the display optics. However, this will require at least one additional frame of latency (Nelson, 1994). In ANVIS, the optical system can produce barrel or pincushion distortion and the fiber-optic inverter can cause shear and gross (or "S") distortion. Shear distortion in fiber optic bundles causes discrete lateral displacements and is known also as incoherency. "S" distortion is due to the residual effect of the twist used to invert the image, which causes a straight line input to produce an "S" shape (Task, Hartman, and Zobel, 1993). Distortion requirements for ANVIS are cited in MIL-A-49425 (CR) and limit total distortion to 4%. Distortion for ANVIS typically is given as a function of angular position across the tube. Sample data from a single tube are presented in Figure 4-16 (Harding et al., 1996). In Crowley’s (1991) investigation of visual illusions with night vision devices, he cites examples of where aviators reported having the illusion of landing in a hole or depression when approaching a flat landing sight. Aviators also reported that normal scanning head movement with some pairs of ANVIS caused the illusion of trees bending.

Visual Helmet-Mounted Displays
131
Figure 4-16. Percent ANVIS distortion as a function of angular position. In general, for monocular, as well as for biocular/binocular, optical systems with fully overlapped fields of view, an overall 4% distortion value has usually been considered acceptable. That is, a deviation in image mapping towards the periphery of the display could be off by 4%, providing the deviation is gradual with no noticeable irregular waviness of vertical or horizontal lines. For a projected display with a 40-degree circular FOV and 4% distortion, this would mean an object at the edge of the visible FOV could appear at 40 x 1.04 (41.6º pincushion distortion) or 40/1.04 (38.5º barrel distortion). For binocular displays, differences in distortion between the images presented to the two eyes are more serious than the amount of distortion (Farrell and Booth, 1984.) Distortion is better tolerated in static images than in moving images, and therefore is of increased concern in HMDs. Biocular/binocular HMDs having overlapping symbology will have to meet head-up display specifications of 1 mr or less difference between the right and left image channels for symbology within the binocular overlapped area if the symbology is seen by both eyes. Otherwise, diplopia and/or eye strain will be induced. However, with see-through vision, this criterion cannot be met when viewing at less than 60 meters due to eye convergence (McLean and Smith, 1987). When imagery is used with a minimum see-through requirement, the maximum displacement between the right and left image points within the biocular/binocular region should not exceed 3 mr (0.3 prism diopter) for vertical (dipvergence), 1 mr (0.1 prism diopter) for divergence, and 5 mr (0.5 prism diopter) for convergence. Distortion can be particularly important in aviation. For example, the apparent velocity of a target having a relative motion will change in proportion to the magnitude of the distortion (Fischer, 1997). As an historical note, in 1988, when AN/PVS-5's were still the most common I2 system, a number of reports from National Guard units surfaced regarding "depression" and "hump" illusions during approaches and landings (Markey, 1988). Suspect goggles were obtained and tested. The final conclusion was that the distortion criteria were not sufficiently stringent. Based on testing, a recommendation was made to tighten both shear and "S" distortion specifications. Distortion requirements generally apply to single tubes. However, distortion differences between tubes in a pair of NVGs are more important. In fact, care should be taken to match tubes in pairs based on other characteristics; e.g., luminance, as well as distortion. Display Technologies While each component in an HMD design is important and plays a vital role in the design’s success or failure, it is easily argued that the image source component deserves special consideration. The selection of the image source has the largest impact on the quality of the image presented to the user.

Chapter 4 132
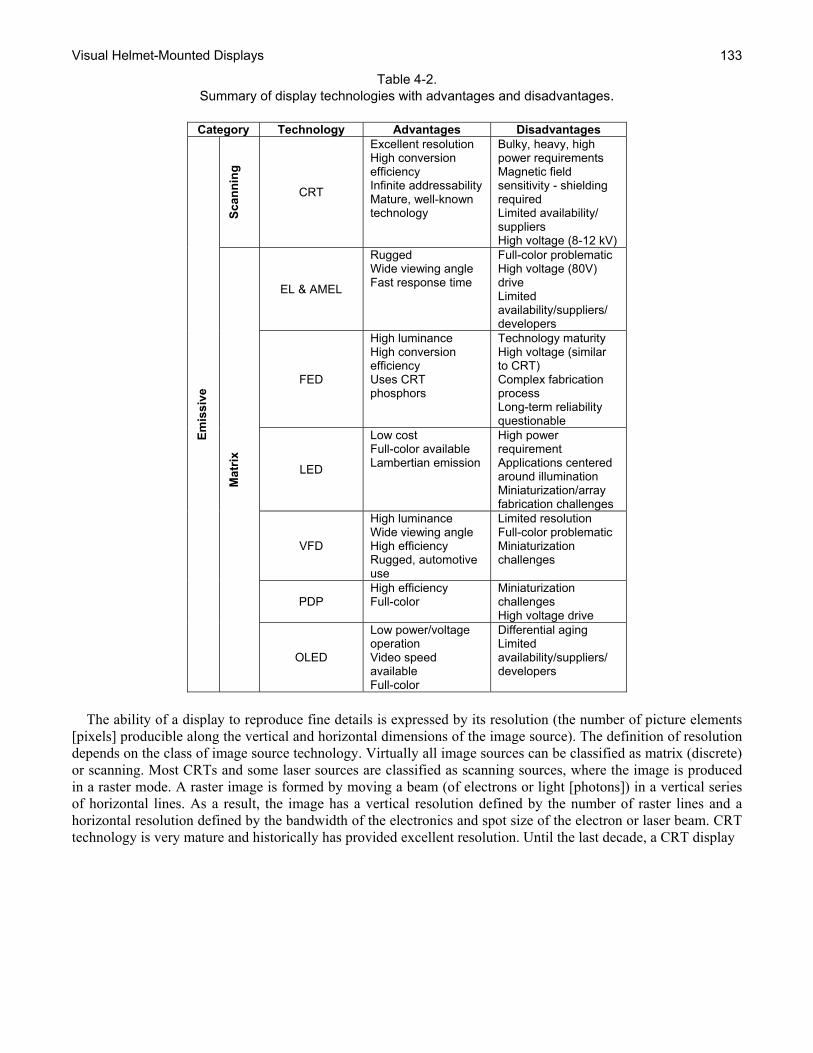
The past several years have witnessed rapid emergence of a number of new candidate display technologies, each vying to replace the venerable CRT. Each of these new technologies has unique advantages and limitations (Table 4-2). In 1991, in order to address the need for miniature displays based on these new technologies, the Defense Advanced Research Projects Agency (DARPA) established a head-mounted display initiative as part of their High Definition Systems Program (Girolamo, 2001). The goals were to investigate and develop new display technologies that would overcome the limitations of CRTs and satisfy Department of Defense (DoD) needs for improved HMDs. At that time, the technologies selected were Active-Matrix Electro-Luminescent (AMEL) and Active-Matrix Liquid Crystal Display (AMLCD) as the most promising candidates. AMEL and AMLCD are two examples of a larger group of display technologies often referred to as Flat Panel Display (FPD) technologies. This label is somewhat inaccurately used to refer to the relatively thin profile, flat-face characteristics of displays employing these technologies. With the additional attributes of low-heat output, low-weight, and low-power consumption, this class of displays is especially attractive to HMD designers, as well as to users, such as the military, who operate in highly constrained physical environments. Critical parameters The role of the image source is usually two-fold. In most HMD applications, it is called upon to reproduce the picture of the outside scene for viewing by the user. In addition, the image source is used to display a range of symbology sets that represents such information as vehicle status, targeting reticules, fire-control (weapons) status, and map overlays. To perform these functions in a helmet-mounted configuration, the image source must meet a number of essential requirements that include:
• Sufficiently small physical dimensions • Minimum weight • Adequate image resolution • Sufficient luminance • Low power consumption
Size and weight The physical dimensions of the image source need to be of appropriate size for head mounting; the optimal image plane diameter (or larger linear dimension) is 1 inch. This small size is required because in most HMD designs, the image source is collocated on the helmet and contributes to the head-supported weight (mass). In the earliest HMD systems, the only production-available image source was the CRT. CRTs were notorious for their size, weight and power consumption, directly in opposition to virtually all of the requirements cited above for use in an HMD. This factor was a major driver in the development of miniature CRTs with diameters in the ¼- to 1-inch range. Resolution In any system, there is a weakest link (limiting factor). In imaging optical systems that are intended to reproduce details (resolution) of an outside scene and where this reproduced image is to be viewed by humans, it is desirable that the limiting factor be the human eye. Such a system design is said to be eye-limited. The reason for this viewpoint is that the human eye is the only component that cannot be improved. While this may no longer be rigorously true due to the development of wave front-guided laser surgery techniques, it remains an acceptable rule-of-thumb.
Visual Helmet-Mounted Displays
133
Table 4-2. Summary of display technologies with advantages and disadvantages.
Category Technology Advantages Disadvantages
Emis
sive
Scan
ning
CRT
Excellent resolution High conversion efficiency Infinite addressability Mature, well-known technology
Bulky, heavy, high power requirements Magnetic field sensitivity - shielding required Limited availability/ suppliers High voltage (8-12 kV)
Mat
rix
EL & AMEL
Rugged Wide viewing angle Fast response time
Full-color problematic High voltage (80V) drive Limited availability/suppliers/ developers
FED
High luminance High conversion efficiency Uses CRT phosphors
Technology maturity High voltage (similar to CRT) Complex fabrication process Long-term reliability questionable
LED
Low cost Full-color available Lambertian emission
High power requirement Applications centered around illumination Miniaturization/array fabrication challenges
VFD
High luminance Wide viewing angle High efficiency Rugged, automotive use
Limited resolution Full-color problematic Miniaturization challenges
PDP High efficiency Full-color
Miniaturization challenges High voltage drive
OLED
Low power/voltage operation Video speed available Full-color
Differential aging Limited availability/suppliers/ developers
The ability of a display to reproduce fine details is expressed by its resolution (the number of picture elements [pixels] producible along the vertical and horizontal dimensions of the image source). The definition of resolution depends on the class of image source technology. Virtually all image sources can be classified as matrix (discrete) or scanning. Most CRTs and some laser sources are classified as scanning sources, where the image is produced in a raster mode. A raster image is formed by moving a beam (of electrons or light [photons]) in a vertical series of horizontal lines. As a result, the image has a vertical resolution defined by the number of raster lines and a horizontal resolution defined by the bandwidth of the electronics and spot size of the electron or laser beam. CRT technology is very mature and historically has provided excellent resolution. Until the last decade, a CRT display

Chapter 4 134
Table 4-2 (continued). Summary of display technologies with advantages and disadvantages.
Non
Em
issi
ve
Tran
smis
sive
AMLCD
Full-color Good image quality Video speed available Well established display technology
Limited temperature range – heater required Contrast drop at high temperature Low transmission efficiency
Passive LCD
Low cost Simple design
Low resolution Slow response – causes smear Low multiplex capability
Ref
lect
ive
LCOS
High illumination efficiency
Response time in single panel configuration may cause smear
FLC
Fast switching, no smear High illumination efficiency Potential for lower system cost
Limited availability/suppliers/ developers Limited temperature range
DLP/DMD
Volume production High luminance for projection Good image quality (High contrast ratio) All-digital interface
High altitude (low air pressure) operation is problematic
Scan
ning
RSD
High luminance Wide color gamut Infinite addressability
Costly Challenging packaging and ruggedization
had a preset fixed resolution. Most modern CRT displays are capable of adjusting the electron beam so as to provide multiple resolutions. Miniature CRTs are very specialized, have limited applications and limited availability. Military applications were a primary driver for miniature CRTs that were developed in ½-, ¾-, and 1-inch diameter sizes. A comparison of the characteristics of the various size tubes showed that the 1-inch tube offers the best raster imagery resolution and luminance (Levinsohn and Mason, 1997). A representative resolution of 1-inch tubes is of the order of 800 x 600. The IHADSS used on the AH-64 Apache uses a 1-inch CRT. The development of the miniature CRT was an engineering achievement. However, even in its reduced format, the miniature CRT still has a weight, volume and power consumption footprint that challenges its choice as an image source for HMDs. Fortunately, the 1980s brought a new class of image sources: discrete image sources. There are a number of matrix display technologies, collectively referred to as FPDs. These technologies include liquid crystal (LC), electroluminescent (EL), and light-emitting diodes (LEDs). Regardless of technology, a unique property of this class of displays is that they have individual pixels arranged in a matrix. Resolution for matrix-type or pixelated displays usually is given as the number of columns (horizontal pixels) by the number of rows (vertical pixels). As an example, a display with a stated resolution of 480 x 234 has 112,320 pixels arranged in 480 columns and 234 rows. The electronic industry has established specifications for specific standard resolutions. These include Super

Visual Helmet-Mounted Displays
135
Extended Graphics Array (SXGA) and Ultra Extended Graphics Array (UXGA). The SXGA specification has a 1280 x 1024 resolution; UXGA refers to a resolution of 1600 by 1200. Older, and lower, specifications of Video Graphics Array (VGA) and Super Video Graphics Array (SVGA) are most often used as a reference resolution. However, QVGA, having the lowest resolution of 320 by 240, is a popular display most often seen in mobile phones, Personal Digital Assistants (PDAs), and some handheld game consoles. Table 4-3 presents the resolution (in pixels horizontally by pixels vertically) for the more conventional specifications. Ideally, for an optical system such as an HMD not to be display-limited, the image source should be capable of a resolution that meets or exceeds that of the human eye. For the normal human eye with a visual acuity of between 1-1.5 arc minutes and for an optimistic FOV as large as 120° (comparable with the horizontal extent of human vision), the resolution required is of the order of 4,800 horizontal pixels per display width; this exceeds by far the capability of current technologies. A more realistic FOV is 40°, requiring a resolution of 1600 pixels along the axis of the image source; this is equivalent to the UXGA specification.
Table 4-3. Standard resolution specifications for matrix displays.
Specification Resolution (H x V)
QVGA 320 x 240 VGA 640 x 480
SVGA 800 x 600 XGA 1024 x 728
SXGA 1280 x 1024 UXGA 1600 x 1200 HDTV 1920 x 1080
Figure 4-17 shows the required FOV of a display for a given number of pixels and at a pre-determined angular subtense of an individual pixel. For example, the very common SXGA resolution display at 1.5 arc minutes per pixel will only cover a FOV of the order of 30°, much lower than the unaided FOV of human vision.
Figure 4-17. Resolution as a function of number of pixels and FOV (Melzer, 1997). When using this graph for imagery and it is assumed that the sensor has as many or more lines/pixels than the display, the resolution will be affected by the Kell factor of approximately 0.7. This means the effect number of lines of resolution is reduced by a factor of 0.7, e.g., a 1000-line or pixel display has an effective resolution of 700 lines or pixels.

Chapter 4 136
Luminance Until lasers could be packaged in a form making them useable in HMDs, image source luminance rivals resolution as the most important parameter. The image produced on the face of the image source has to successfully overcome the transmission losses incurred as the image’s light rays traveled through the optics into the eye. More challenging are see-thorough HMD applications where the image luminance is required to be effectively viewed against the ambient light level of the outside world; the luminance needed for see-through HMD configurations is a strong function of the background luminance (up to 10,000 foot-Lamberts (fL) for white clouds). See-through HMDs intended for day use, require the addition of a tinted visor to reduce the level of the background luminance at the eye. The concept of attaching a luminance value to a display image source is misleading. Melzer and Moffitt (1997) describe two luminance values that may be used to specify needed image source luminance: peak luminance and average luminance. Peak luminance is the maximum luminance that can be achieved (given maximum input). This can be defined as on-axis or off-axis for a given display source. A specification for peak luminance is recommended when symbology only is displayed (i.e., no imagery). In applications that do present scene imagery, an average luminance across the image source is recommended. Average luminance will be less than any peak luminance present in the scene and its value will depend on the content of the scene. To allow comparison between several image sources, the average luminance should be based on a universal test pattern, preferably one with both high and low spatial frequencies. Power consumption In vehicular HMD applications or other applications where on-site power is available, power requirements are less of an issue than for ground applications where the Warfighter must carry his power requirements with him in the form of batteries. However, even when on-site power is available, the HMD designer cannot be given carte blanche not to optimize power consumption for the image source or other HMD components. Fortunately, the FPD technologies have greatly reduced the image source power requirements. Nonetheless, with regard to image source power consumption, two main factors still place constraints on the amount of power that can be made available in an HMD design:
• The more power consumed by an image source, the greater the heat generation. Because of the great need to reduce head-supported weight, standard mechanisms for effective heat removal – addition of a heat sink and/or a fan – are not viable options.
• In self-contained ground applications, battery power availability for man-wearable systems is limited. Display technology classification All display technologies are generally classified as emissive (light generators) or non-emissive (light modulator) based on their capability to either create their own light or the need to operate by modulating the transmission and/or reflection of an independent external light source. This classification and the subcategories of displays are presented in Figure 4-18. Both emissive and non-emissive displays can be further categorized as discrete (matrix) or scanning displays (Table 4-2). Emissive displays The underlying mechanism of emissive displays is that they emit visible light in response to some excitation action. Most emissive display technologies employ a phosphor material as the source of the visible light. These include CRTs, vacuum fluorescent displays (VFDs), electroluminescent (EL) displays, and white light-emitting
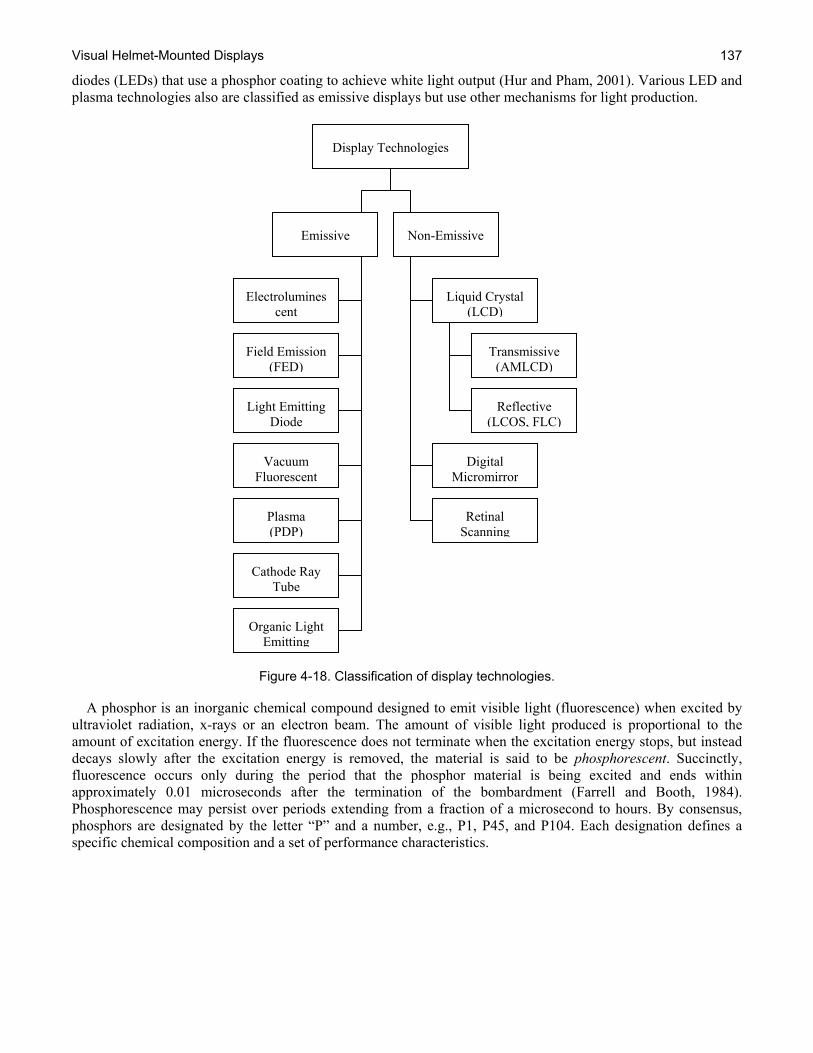
Visual Helmet-Mounted Displays
137
diodes (LEDs) that use a phosphor coating to achieve white light output (Hur and Pham, 2001). Various LED and plasma technologies also are classified as emissive displays but use other mechanisms for light production.
Figure 4-18. Classification of display technologies. A phosphor is an inorganic chemical compound designed to emit visible light (fluorescence) when excited by ultraviolet radiation, x-rays or an electron beam. The amount of visible light produced is proportional to the amount of excitation energy. If the fluorescence does not terminate when the excitation energy stops, but instead decays slowly after the excitation energy is removed, the material is said to be phosphorescent. Succinctly, fluorescence occurs only during the period that the phosphor material is being excited and ends within approximately 0.01 microseconds after the termination of the bombardment (Farrell and Booth, 1984). Phosphorescence may persist over periods extending from a fraction of a microsecond to hours. By consensus, phosphors are designated by the letter “P” and a number, e.g., P1, P45, and P104. Each designation defines a specific chemical composition and a set of performance characteristics.
Electroluminescent
Field Emission (FED)
Light Emitting Diode
Vacuum Fluorescent
Plasma (PDP)
Cathode Ray Tube
Display Technologies
Emissive Non-Emissive
Liquid Crystal (LCD)
Digital Micromirror
Retinal Scanning
Organic Light Emitting
Transmissive (AMLCD)
Reflective (LCOS, FLC)
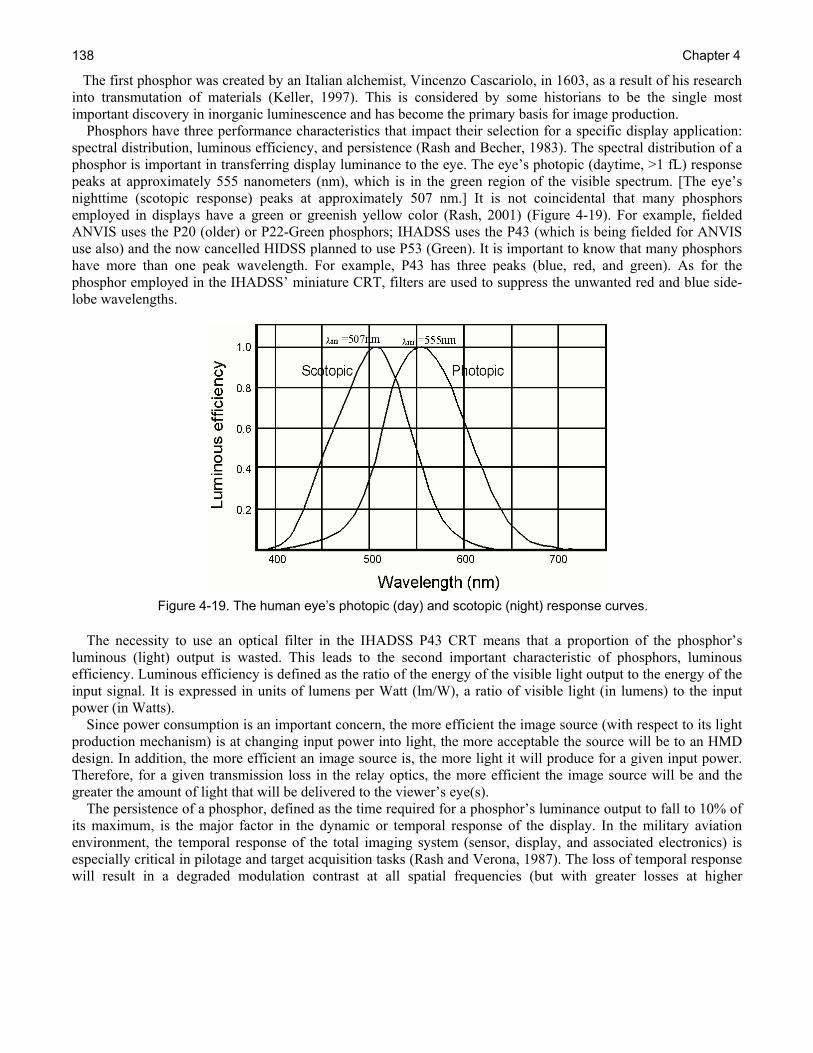
Chapter 4 138
The first phosphor was created by an Italian alchemist, Vincenzo Cascariolo, in 1603, as a result of his research into transmutation of materials (Keller, 1997). This is considered by some historians to be the single most important discovery in inorganic luminescence and has become the primary basis for image production. Phosphors have three performance characteristics that impact their selection for a specific display application: spectral distribution, luminous efficiency, and persistence (Rash and Becher, 1983). The spectral distribution of a phosphor is important in transferring display luminance to the eye. The eye’s photopic (daytime, >1 fL) response peaks at approximately 555 nanometers (nm), which is in the green region of the visible spectrum. [The eye’s nighttime (scotopic response) peaks at approximately 507 nm.] It is not coincidental that many phosphors employed in displays have a green or greenish yellow color (Rash, 2001) (Figure 4-19). For example, fielded ANVIS uses the P20 (older) or P22-Green phosphors; IHADSS uses the P43 (which is being fielded for ANVIS use also) and the now cancelled HIDSS planned to use P53 (Green). It is important to know that many phosphors have more than one peak wavelength. For example, P43 has three peaks (blue, red, and green). As for the phosphor employed in the IHADSS’ miniature CRT, filters are used to suppress the unwanted red and blue side-lobe wavelengths.
Figure 4-19. The human eye’s photopic (day) and scotopic (night) response curves.
The necessity to use an optical filter in the IHADSS P43 CRT means that a proportion of the phosphor’s luminous (light) output is wasted. This leads to the second important characteristic of phosphors, luminous efficiency. Luminous efficiency is defined as the ratio of the energy of the visible light output to the energy of the input signal. It is expressed in units of lumens per Watt (lm/W), a ratio of visible light (in lumens) to the input power (in Watts). Since power consumption is an important concern, the more efficient the image source (with respect to its light production mechanism) is at changing input power into light, the more acceptable the source will be to an HMD design. In addition, the more efficient an image source is, the more light it will produce for a given input power. Therefore, for a given transmission loss in the relay optics, the more efficient the image source will be and the greater the amount of light that will be delivered to the viewer’s eye(s). The persistence of a phosphor, defined as the time required for a phosphor’s luminance output to fall to 10% of its maximum, is the major factor in the dynamic or temporal response of the display. In the military aviation environment, the temporal response of the total imaging system (sensor, display, and associated electronics) is especially critical in pilotage and target acquisition tasks (Rash and Verona, 1987). The loss of temporal response will result in a degraded modulation contrast at all spatial frequencies (but with greater losses at higher

Visual Helmet-Mounted Displays
139
frequencies) (Rash and Becher, 1982). The consequence of the loss of contrast at the higher frequencies is that fine details (e.g., wires, tree branches) in the scene will not be present in the image viewed by the pilot or by any user in other applications. Non-emissive displays As the name implies, non-emissive displays do not generate light by themselves, but rather act as a light valve for an external light source. They may be reflective, in which case the light source is located on the front side of the display, or transmissive, in which case the light source is placed behind the display, or a combination of both (transflective). In each case, the display pixels act as individual (discrete) light switches. For a reflective display, the switch behaves as a mirror, directing the light toward the observer during the ON time and away from the observer during OFF time; for a transmissive display, the light switch becomes a shutter, open (transparent) during the ON time and closed (opaque) during the OFF time. Examples of reflective displays include liquid crystal on silicon (LCOS) and digital micro-mirror displays (DMD). The optical design for reflective displays is more demanding. This is because during pixel-off-time, light is either scattered, or absorbed, or redirected away from the light path to the eye. Consequently, greater care must be taken in the design in order to prevent stray light from reducing contrast. In terms of advantages, this category of displays presents:
• Increased pixel aperture fill factor - results in smaller pixels and higher density (each pixel drive can be hidden under the pixel itself, behind the reflective layer).
• Increased luminance - reflection coefficient of the order >70%.
Transmissive displays require rear illumination but potentially can provide higher luminance. Their disadvantages are mostly related to their need for a backlight; these include greater power consumption, increased weight and volume, and heat generation. The best known example of this category is the AMLCD. The example display technologies cited above are just a few of the many available to the HMD designer. All of which will be discussed fully in the following sections. Pixel method of classification An alternative method for classifying FPDs is by the number of pixels generated simultaneously (Figure 4-20) (Powell, 1999). Using this approach, the following classifications are used:
• Matrix display – All pixels are generated independently and are directly addressable. These displays usually have a large number of pixels, from several thousand to more than a million. See Figures 4-21 and 4-22 for illustrations of various display designs having a matrix structure.
• Line display – All pixels of one display line (x-dimension) are generated independently and are directly addressable; the line is scanned in the y-dimension. Some position feedback mechanism is required by the display generator to update the display drive according to the instantaneous location in y-direction of the display.
• Single pixel display – Only one pixel (a beam) is generated. Two-dimensional (2-D) scanning mechanisms position the beam in both the x-, and y- dimensions. As in the line display case, positional feedback mechanism is required by the display generator in order to update the drive according to the instantaneous location of the beam. See Figure 4-23 for illustrations of single pixel structures. A typical CRT display is an example.

Chapter 4 140
Figure 4-20. Pixel method of display classification (Urey, 1999). The matrix and the scanning implementation will be discussed in greater detail in following sections. Technologies based on scanning in one dimension use a linear array of about 103 pixels and can provide high resolution and good image quality. However, a correlation of pixel variations in the scan direction leads to more stringent luminance matching conditions than for the matrix approach. Successful applications such as fax machines, document scanners, and cameras demonstrate that these problems can be overcome but at the cost of speed and complexity. Consequently, the speed of the transport mechanism and the size of the pixels limit this approach for HMDs.

Visual Helmet-Mounted Displays
141
Light generation method of classification It is useful and interesting to further investigate the mechanisms used by the various display technologies to generate light. Such an investigation provides a third possible classification approach, effectively a combination of the first two (Ferrin, 1997). For the emissive (self-contained) displays, the mechanisms include phosphorescence (CRT), electroluminescence (AM and AMEL), field emission (FED), fluorescence (VFD), or gas discharge (Plasma). Both the reflective and transmissive displays depend on an external light source that is selected based on system performance requirements. These mechanisms of light generation are summarized in Table 4-4 and more fully discussed in subsequent sections. Major display technologies In the following sections, each of the major display technologies is briefly reviewed. The information presented is intended to provide the reader with an overview of the most dominant display technologies available for HMDs. Those described are not all inclusive. Even within each major category, it is difficult to accomplish more than to provide a snapshot of the individual technologies as their development is still in flux. For more in-depth discussions of these technologies, readers are encouraged to consult more dedicated resources (e.g., Castellano, 1992; Keller, 1991; Kalinowski, 2004; Sherr, 1993; Tannas, 1985; Wu, 2001; Wu and Yang, 2006; Yeh, 1999). Cathode-ray-tubes (CRTs) The cathode-ray-tube (CRT) was invented by German physicist Karl Ferdinand Braun in 1897. In its simplest form, a CRT is an electron vacuum tube with an electron source (cathode) at one end and a phosphor screen at the other, usually with internal or external means to accelerate and deflect the electrons (Keller, 1991) (Figure 4-24). Figure 4-25 presents a typical CRT electron source, referred to as an electron gun. The CRT ranks near the top for luminance, resolution, flexibility in addressability. It ranks at the bottom on size (primarily depth), weight, high anode voltage, power requirements and heat generation. High performance miniature (≤ 1 inch diameter) monochrome CRTs have been developed for HMD applications. Some of the requirements and design trade-offs for an HMD-designed CRT are summarized in Sauerborn, 1995. Cathodes Thermionic cathodes use heat to generate electrons from a solid material and come in two main categories: • Oxide (film) cathodes of the traditional “RCA-design,” consisting of a thick (25 μm to 50 μm) film
layer of mostly a mixture of barium, calcium and strontium oxide on nickel, operating at 750ºC to 800ºC, or
• Barium oxide (BaO) cathodes deposited on tungsten that operate at slightly higher temperature (900ºC to 1000ºC). The major limitation of oxide cathodes is that average current density is limited to about 1 Ampere per square-centimeter (Amp/cm2). The anticipated lifetime of a standard oxide cathode when loading increases to 2 Amp/cm2 drops to less than 10,000 hours (Falce, 1992).

Chapter 4 142

Visual Helmet-Mounted Displays
143
Figure 4-21. Illustrations of various matrix structure displays: Emissive Display: Matrix Structure (OLED, LED Array, VFD, EL, AMEL) (top) and Transmissive Display: Matrix Structure (Nematic LCD, AMLCD) (bottom).
Volumetric cathodes are used when higher average current density emission is needed. Originally developed by Philips in 1940’s, the emission mechanism differs significantly from that of oxide cathodes. In this latter case, the extraction mechanism of electrons from the outer orbit of an atom is brute force heat. In the case of a barium-activated metal surface, the positively charged barium and the negatively charged oxygen create an electric dipole acting as an extracting grid assisting with electron extraction (Falce, 1992). Volumetric cathodes come in two designs: dispenser and reservoir. • Dispenser cathodes employ a porous tungsten matrix and come in two varieties: impregnated and
reservoir. Impregnated dispenser cathodes have a barium compound in the pores of the matrix. When the cathode is heated, this barium compound interacts with the tungsten and releases free barium that coats the surface. Typical average current density from an osmium-coated impregnated cathode operating at 980ºC may reach 4-5 Amps/cm2. For comparison purpose, the anticipated lifetime of a dispenser cathode under 2 Amp/cm2 load exceeds 50,000 hours (Falce, 1992).
• Reservoir cathodes are more difficult to build, but they last longer and can be pushed to higher emission currents. Current densities of 100 Amps/cm2 have been achieved in the laboratory. A reservoir cathode has a “reservoir” of barium emission material behind the tungsten matrix. When heated, the barium comes out of the reservoir, infiltrates through the matrix and coats the forward surface.

Chapter 4 144
Figure 4-22. Illustrations of various matrix structure displays: Reflective Display: Matrix Structure (DMD, FLCD) (top) and Reflective Display: Matrix Structure (LCOS) (bottom).
The majority of the CRTs used in HMDs employ the dispenser cathode type. Phosphors After emission from the cathode, the electron beam is accelerated towards the phosphor screen. The beam is deflected to strike on the desired position on the phosphor screen by a magnetic field. This field is generated by a deflection yoke that has separate sets of coils for horizontal and vertical deflection. The beam deflection amplitude is controlled by the intensity of the magnetic field, which is in turn controlled by the current injected in the coils. When the beam electrons impinge upon the phosphor screen, the phosphors grain (particle) at that particular location emits light by converting the kinetic energy of the electron to photons, i.e., the photoelectric effect.

Visual Helmet-Mounted Displays
145
Figure 4-23. Illustrations of various single pixel structure displays: Emissive Display: Single Pixel Structure (Scanning) CRT (top) and Emissive Display: Single Pixel.Structure (Scanning) VR (bottom).
Figure 4-24. Diagram of a typical CRT (Fujioka, 2001).

Chapter 4 146
Figure 4-25. Photograph of a CRT Electron Gun. ( Source: Wikipedia) In general the phosphor is an inorganic crystal with grains (particles) of around 7 to 10 μm in size. Characteristics of the major phosphors used for CRTs employed in HMDs are listed in Table 4-5. Phosphor persistence classification is based on the time required to decay to 10% of peak luminance (Figure 4-26):
Very long: 1 sec and longer Long: 100 ms to 1 sec Medium: 1 ms to 100 ms Medium short: 10 μsec to 1 ms Short: 1 μsec to 10 μsec Very short: less than 1 μsec
Figure 4-26. Typical decay curves for short, medium, and long persistence phosphors.
Spectral distribution Spectral distribution refers to the wavelengths for which the phosphor emits energy. Knowledge of this distribution is essential in order to optimize the HMD display for good day-time performance. The photopic response of the human eye peaks at about 555 nm (Figure 4-19). For a phosphor such as P43 and P53 (Figure 4-27) that have the majority (>70%) of their energy concentrated in a narrow band, a matched notch optical filter is needed to allow most of the phosphor light to pass but reject the rest of the visible spectrum thus producing an improvement in the display contrast ratio.
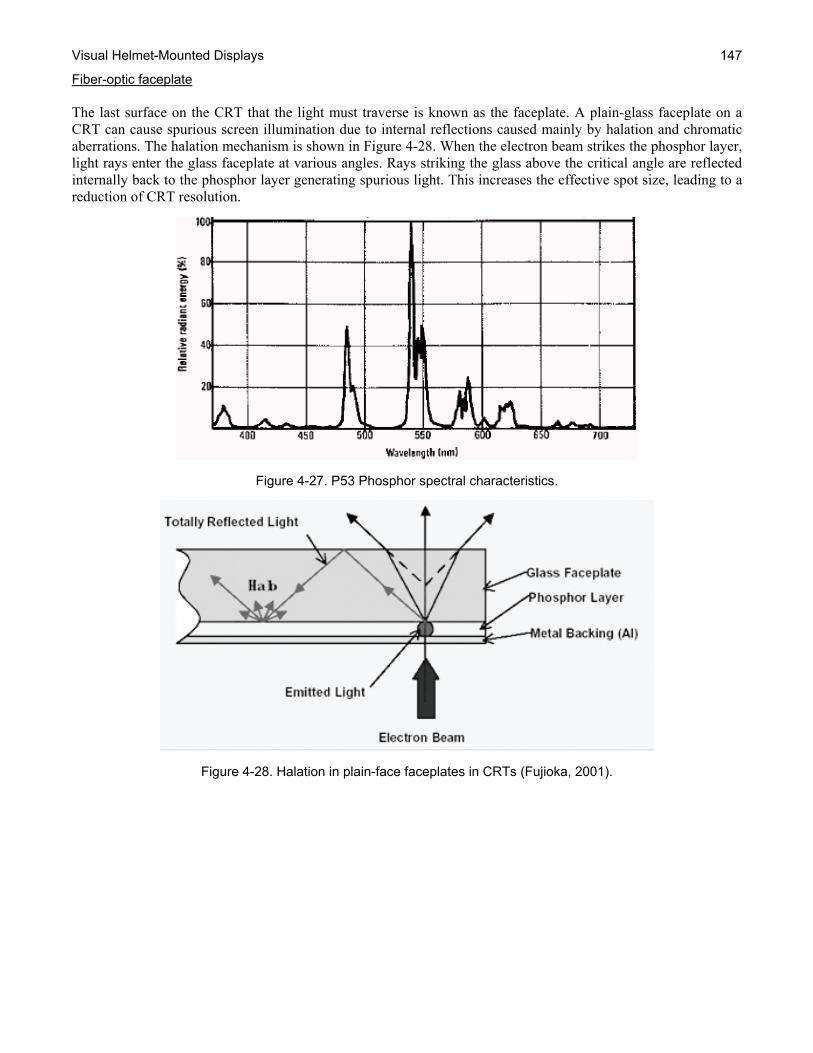
Visual Helmet-Mounted Displays
147
Fiber-optic faceplate The last surface on the CRT that the light must traverse is known as the faceplate. A plain-glass faceplate on a CRT can cause spurious screen illumination due to internal reflections caused mainly by halation and chromatic aberrations. The halation mechanism is shown in Figure 4-28. When the electron beam strikes the phosphor layer, light rays enter the glass faceplate at various angles. Rays striking the glass above the critical angle are reflected internally back to the phosphor layer generating spurious light. This increases the effective spot size, leading to a reduction of CRT resolution.
Figure 4-27. P53 Phosphor spectral characteristics.
Figure 4-28. Halation in plain-face faceplates in CRTs (Fujioka, 2001).
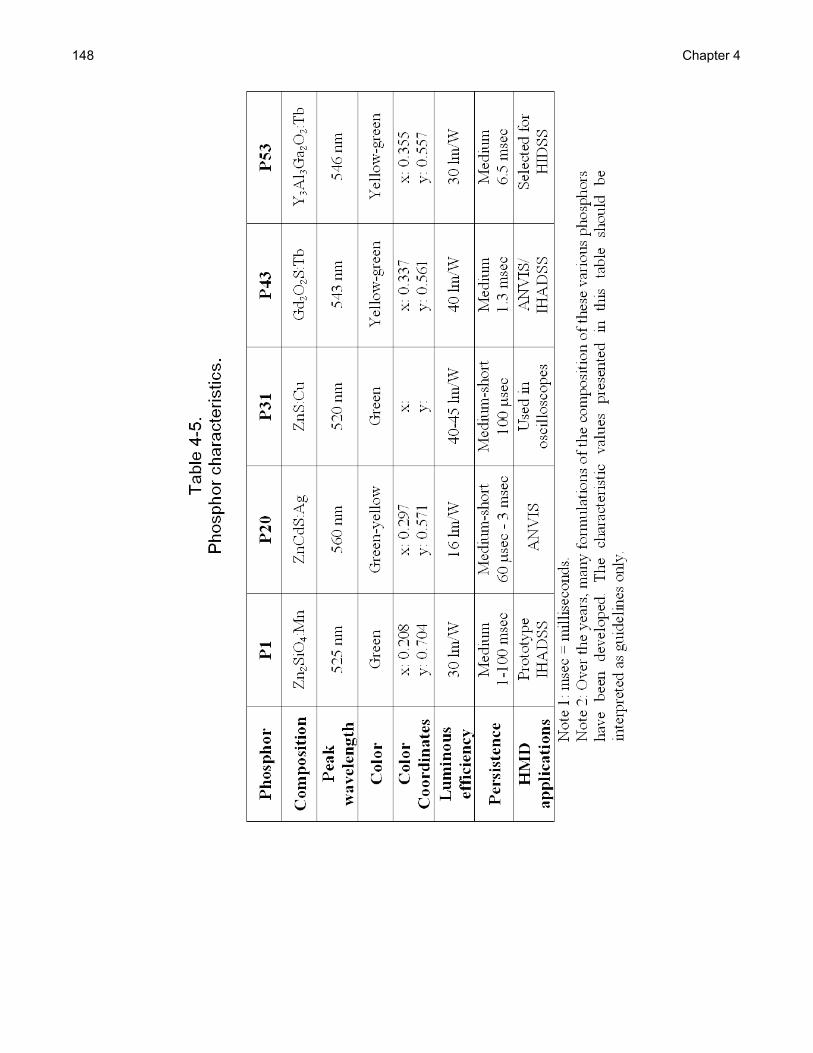
Chapter 4 148
Visual Helmet-Mounted Displays
149
Replacing the solid glass faceplate with a fiber-optic faceplate eliminates both the halation and any chromatic aberrations. A fiber-optic faceplate is a coherent array of millions of optical-fiber waveguides per square inch, each having a diameter of 3 to 10 μm. It acts as an image plane transfer device – an image entering one surface exits as an undistorted digitized image regardless of the shape of the optics itself (Cook and Patterson, 1991). Typically the fiber-optics used have the same coefficient of thermal expansion as the CRT glass, which allows them to be fused directly to the CRT. They are curved on the inside to match the deflection angle of the tube and are flat on the outside. This eliminates the need for dynamic focusing of the electron beam. Fiber-optic faceplates were originally introduced in night vision goggles as the substrate for the phosphor screen at the viewer’s end. Color CRT The quest for color is fundamental for any display technology. Large-size CRTs achieved full-color capability early during the technology development process using a shadow-mask located in front of the phosphor deposited in a red (R), green (G), and blue (B) pattern, splitting each individual pixel into three subpixels placed so closely that the eye cannot distinguish among them. The shadow mask is a metal plate (e.g., invar [a nickel steel alloy]) that effectively ties each of the three electron guns (beams) to one phosphor spot (consisting of three color subpixels) only (Figure 4-29). Driving each color gun with video information pertaining to that particular color for each phosphor spot produces three color pictures in the fundamental colors. The eye spatially integrates the three pictures into one full-color picture. Currently, the shadow mask technology though is limited to above-medium-size CRTs; also the packaging of the three electron guns and the convergence of three electron beams is difficult to achieve in a CRT smaller than 5 inches (12.7 cm) diagonal (Sherman, 1995). Field-Sequential Color (FSC) bridges the gap between the capabilities of monochrome CRT and the need for color. Compared to the shadow mask approach, which creates color spatially, FSC produces color temporally. The video information is generated on a frame-by-frame basis, each frame successively of R, G, B colors, that are displayed in time sequence. If the fields are refreshed fast enough, above the critical flicker frequency of the human visual system (>30 Hz), the viewer integrates the individual fields into a full-color picture. This is the same principle used by the movie industry to create motion from blending a rapid sequence of still images. Practical implementation consists of a monochrome, white-phosphor CRT with a broad emission spectrum and an electronic-controlled switched color filter on the faceplate. It is interesting to note that earlier color TV designs of the 1940’s briefly toyed with a mechanical color-filter wheel rotated in front of the tube – however the commercial implementation was challenging, and eventually the shadow mask won the competition for the large, direct-view color CRTs. Unfortunately the shadow mask approach is unsuitable for miniature CRTs, so that need was not properly addressed. One solution was provided by Tektronix in the 1980’s. Tektronix developed a Liquid Crystal Shutter (LCS) based on pi-cells that make use of a nematic LC wave plate (polarization retarder) (Bo, 1984). This provides a totally solid-state solution to the color shutter. Unfortunately the LC Shutter transmittance efficiency is quite low (less than 10%) is typical, which limits the LCS use to low-ambient luminance level. A second major limiting factor of shutter technology in FSC displays is the presence of visual artifacts. Among these artifacts is flicker sensitivity creating a color break effect associated with rapid head and/or eye movement, which is universally present in military aviation applications. The flicker sensitivity is associated with eye movement. Actual eye movement can be divided into smooth pursuit, with the maximum velocity of 20 to 40 degrees/second, and saccade movements, with the velocity of 300 to 500 degrees/second. Flicker sensitivity was also shown to have a color dependency, with green areas being most sensitive to flicker (at around 150 Hz) and with lower sensitivity for red (around 30 Hz) and blue (around 35 Hz) (Yamada, 2000). A comprehensive overview of flicker sensitivity and other FSC display visual artifacts can be found in Mikoshiba (2000).

Chapter 4 150
Figure 4-29. Diagram of shadow mask operation (Fujioka, 2001).
Plasma Plasma display panels (PDPs) are emissive, producing light when an electric field is applied across an envelope of gas. Initially, plasma displays were monochrome, limited to only a few colors. However, in recent years, full-color plasma displays have become rather commonplace. Color PDPs have a simple construction, basically consisting of two thin sheets of glass separated by a few hundred microns. The space between the sheets of glass is filled with cells containing rare gases (e.g., xenon or neon). Each cell is coated on the bottom in red, green or blue phosphor. Electrodes can be found at the top and bottom of each sheet of glass, or "substratum" (Figure 4-30). Plasma generates light when an electric field is applied to selected cells (depending on the image) across the gas-filled sachet. Gas atoms are ionized and emit photons when returning to the unexcited state. Plasma technology is most effective for large-area, direct-view displays. It is unlikely that plasma technology will find its way in the HMD application in the near future. Vacuum fluorescent Vacuum fluorescent displays (VFDs) (Figure 4-31) are flat vacuum tube devices that use a filament wire, control grid structure and a phosphor-coated anode. They are emissive displays. The monochrome zinc oxide and zinc (ZnO:Zn) phosphor of the vacuum fluorescent displays is very efficient and well proven in automotive applications for both text and graphics. VFDs use a wire filament and a phosphor-coated anode. Active matrix addressing has been demonstrated experimentally.

Visual Helmet-Mounted Displays
151
Figure 4-30. Operation of a plasma display (Fujioka, 2001).
Figure 4-31. Operation of a vacuum fluorescent display (Source: Futaba)
VFD main advantages are:
• Wide temperature range: -40°C to +85°C • Wide viewing angle with uniform luminance across the display (no hot spots) • High multiplexing is possible without viewing angle reduction • Long lifetime and reliability.
However, this technology is mostly applicable to direct-view panels and to date has shown little potential for HMD applications. Field emission The emissive Field Emission Display (FED) uses a matrix of point emitters (electron sources) that can be individually addressed (Spindt et al., 1976). Field emission refers to the emission of electrons from the surface of a conductive substrate in a vacuum under the influence of a strong electric field. Light is generated when the electrons strike a phosphor screen. In a sense each pixel acts as a miniature electron gun for its own phosphor dot (Figure 4-32).

Chapter 4 152
Figure 4-32. Operation of a Field Emission Display (Pixtech, Inc.).
However, high luminance is achieved only with an anode voltage in the order of 10kV to allow the use of traditional CRT phosphors; this is one of the remaining fundamental system problems. Both full-gray scale monochrome and full-color FEDs have been developed. In the late 1990s, this technology seemed destined to succeed big in the marketplace; the thrust on this technology has returned to the research laboratories and is mostly focused on a) improvements in low-voltage, high-efficiency phosphors (Kim, 2000) and b) reliability of the field emission sources, whether from randomly orientated carbon nanotubes (Wang, 1998) or other technology. Another major hurdle for FEDs is the continuing drop in cost of competitive LCDs. For further information and in-depth research results on phosphors, readers are encouraged to visit the Phosphor Technology Center of Excellence (PTCOE), operating under the Advanced Technology Development Center of Georgia Institute of Technology at the web address: http://www.ptcoe.gatech.edu. Electroluminescence (EL) The mechanism of electroluminescence (EL) is the non-thermal conversion of electrical energy (electric current) into luminous energy (light). In EL devices light is generated by impact excitation of a light emitting center (activator) by high energy electrons in materials like ZnS:Mn (Figure 4-33).
Figure 4-33. Diagram of electroluminescence operation (Source: Planar Systems, 1998).
Due to their compact, self-emissive, low power and weight, and rugged characteristics, EL displays are well suited for HMD applications, in particular for wearable applications. However, the luminance output of these displays is insufficient for avionic applications. To generate higher resolution in a small package the driver electronics was integrated onto the wafer that forms the substrate for the display, with the light-emitting structure on top. The Active Matrix EL (AMEL) thus created overcomes size limitations of the traditional technology. AMEL displays with up to 1000 lines-per-inch (LPI) of resolution have been demonstrated (Khormaei, 1994;
Visual Helmet-Mounted Displays
153
1995). Using silicon on insulator (SOI) wafers to improve driver isolation (80 VAC is required for pixel drive) had enabled fabrication of 2000 LPI test devices (Arbuthnot, 1996). One of the most challenging tasks for the EL technology is achieving full-color. The blue phosphor in particular has low efficiency; this is still work in progress. EL displays also have been employed as backlights for non-emissive displays, e.g., liquid crystal displays. A comprehensive history of evolution of the EL technology is presented in Krasnov (2003). Light-emitting diode (LED) LEDs have been around since the 1950’s. Their operation is based upon semiconductors of two types: p-type or n-type, depending upon whether dopants pull electrons out of the crystal, forming "holes", or add electrons, respectively. An LED is formed by p-type and n-type joining the two materials. When a voltage is applied to the junction, electrons flow through the structure into the p-type material, and holes appear to “flow” into the n-type material. An electron-hole combination forms, releasing energy in the form of light. This is a very efficient electricity-to-light conversion mechanism. LED displays can range from a single status indicator lamp to large-area x-y addressable monolithic arrays. Fabrication of high-density arrays as required for high resolution HMD display panels is challenging; they suffer from optical cross-coupling, mechanical complexity and heat transfer limitations. However, the high light generating efficiency of LEDs makes them very effective as backlights for other non-emissive displays. Organic light-emitting diode (OLED) One emissive FP technology that has made great progress in the past decade is the organic light-emitting diode (OLED). This technology uses a wide class of organic compounds, called conjugated organics that have many of the characteristics of semiconductors. They have energy gaps of about the same magnitude, they are poor conductors without dopants, and they can be doped to conduct either by electrons (n-type) or holes (p-type). Initially, these materials were used as photoconductors, to replace inorganic semiconductor photoconductors, such as selenium, in copiers. In the 1980’s, it was discovered that, just as with crystalline semiconductors, p-type and n-type organic materials can be combined to make LEDs when an electric current passes through a simple layered structure. OLEDs are devices that sandwich carbon-based films between two charged electrodes (usually glass), one a metallic cathode and one a transparent anode. When voltage is applied to the OLED cell, the injected positive and negative charges recombine in the emissive layer and generate electroluminescent light. A typical OLED of the Eastman Kodak Company variety (and practically all OLED manufacturers have licensed Eastman Kodak patents for the technology) is formed by starting with a transparent electrode, which also happens to be a good emitter of holes, e.g., indium-tin oxide (ITO). The ITO electrode is covered with a thin layer of copper phthalocyanine, which passivates the ITO and provides greater stability (Figure 4-34. Then, the p-type material, e.g., naphthaphenylene benzidine (NPB), is deposited, followed by the n-type material, e.g., aluminum hydroxyquinoline (Alq). Finally, a cathode of a magnesium-silver alloy is deposited. All of the films can be applied via evaporation, making fabrication very simple. Electrons and holes recombine at the interface of the n-type and p-type materials and emit, in this example, green light. One manufacturer committed to the development of active matrix OLED-on-silicon microdisplays is eMagin Corporation, Hopewell, NY (eMagin, 2007). Based on its own patent portfolio as well as licenses from Eastman Kodak, eMagin offers the advantages of integrated silicon chip technology over thin-film transistors – lower weight, higher efficiency, more compact display modules.

Chapter 4 154
Figure 4-34. Diagram for a typical organic light-emitting diode (Howard, no date). OLEDs are emissive devices, creating their own light rather than directing light from a second source like liquid crystal-based displays. As a result, OLED devices require less power and can lead to more compact device designs. OLEDs emit light in a Lambertian pattern, appearing equally bright from most forward directions. So moderate pupil movement does not affect brightness or color, and the eye can maintain focus more comfortably, even for extended periods of time. OLEDs have wide acceptable viewing angles (160° is typical) and are thinner than LCDs (about 1.8 mm [0.07 inches] compared with 6 to 7 mm [0.236 to 0.276 inches] for the LCD). In addition they are low voltage devices; 5-10 Volts is sufficient to cause a very bright emission. This characteristic drives manufacturing costs down, as low voltage circuits are easier and less expensive to fabricate. With no need for backlights and extra heaters or coolers, OLEDs consume less power than other near-eye displays of similar size and resolution. Other advantages of the technology are:
• High-speed refresh rates – OLEDs are many times faster than LCDs; even faster than CRTs; and can support refresh rates to 85 Hz.
• OLEDs do not require use of polarizers which makes for simpler and more light-efficient optical design.
• Wide operating temperature range – OLEDs turn on instantly and can operate between –55ºC and 130ºC. This is an especially important characteristic for military applications.
The eMagin’s OLED display was selected by Rockwell Collins for the initial version of the U.S. Army’s Land Warrior HMD program. Liquid crystal (LC) Despite the recent “novelty” of LCD products in the market, liquid crystal materials have a long history, dating back as early as the 1880’s. Numerous excellent volumes dedicated to LCD’s are available to the interested reader (e.g., Kelker, 1988; Tannas, 1985; Wu, 2001). The following is a short list of milestones in the development of LCD:
• 1880’s - Liquid crystal phase discovered o 1888 Reinitzer, R. o 1889 Lehmann, O.

Visual Helmet-Mounted Displays
155
• 1904 - Term “liquid crystals” coined by Otto Lehmann (Sluckin, Dunmur, and Stegemeyer, 2004) • 1960’s - Electro-optic effect explored • Early 1970’s - Stable LC materials developed; LC operation modes developed • Late 1970’s - Ferroelectric effect explored; thin-film transistor (TFT) invented • 1980’s – Super twisted nematic (STN), ferroelectric liquid crystal (FLC), TFT-LCD demonstrated • Mid 1980’s - manufacturing infrastructure being built • 1990’s - Dramatic performance improvements. Dual scan STN. Viable manufacturing yields, LCD
monitors overtake CRTs in desktop PC’s. Laptop PCs start the mobile computing era • 2000’s - Consumer market penetration: High Definition Television (HDTV), mobile communications;
plethora of new applications Liquid crystal is a state of matter intermediate between solid and amorphous liquid. LC molecules are rod-shaped organic compounds with orientation order (like crystals), but lacking positional order (like liquids). LC materials exist in three main classes and are differently arranged in these different phases as defined by the internal molecular structure: Nematic, smectic and cholesteric. Each have well defined and very different properties (Figure 4-35) (Wu, 2003):
Figure 4-35. LC Diagram of Internal Molecular Structure (Wu, 2003)
• Smectic C (Ferroelectric) LCs (Figure 4-35, left)
o Layered structure with positional order in one dimension o Bistable characteristic, with fast response time (a few µs) o Limited gray scale; Thin (<1-µm) cell gap o Sensitive to DC voltages
Note: LC materials with smectic A and B structure are too symmetric to allow any vector order, such as ferroelectricity and have not found a display application at this time.
• Nematic LCs (Figure 4-35, middle) o Molecules tend to be parallel, but their positions are random o Uniaxial; Simple alignment (buffing); Good gray scale; o Low drive voltage; Slow (tens to hundreds of ms) response time o Mainstream liquid crystal display material
• Cholesteric LCs (Figure 4-35, right) o Distorted form of nematic phase in which the orientation undergoes helical rotation o Helical structure o Bistable memory; very low power displays o High luminance efficiency as do not require use of polarizers o High driving voltage 20-40V is common

Chapter 4 156
Note: Cholesteric LCs have slow response time and are not usable for real-time video displays. Their market niche is signage, large panel indicators and similar (Figure 4-36).
Figure 4-36. Display using cholesteric LC (Source: Kent Display, Inc.)
Properties of LCs are generally anisotropic because of their ordered molecular structure, and ordering leads to anisotropy of mechanical, electrical, magnetic properties, and optical properties (e.g., birefringence). LCD addressing methods Display performance is strongly dependent on the addressing method employed (i.e., method of activating individual pixels). The following main options are available for addressing a LC matrix of X columns and Y rows (Figure 4-37):
Figure 4-37. An XY matrix display, consisting of X columns and Y rows. Direct drive Direct addressing requires X ×Y electrical connections, and each display segment (or cell) is addressed independently. Also each segment requires continuous application of voltage or current to the display element. The approach is simple, low cost, but is limited to low resolution applications, not exceeding approximately 50 pixels/inch. Its use remains largely restricted to segment displays, of the type shown in Figure 4-38.
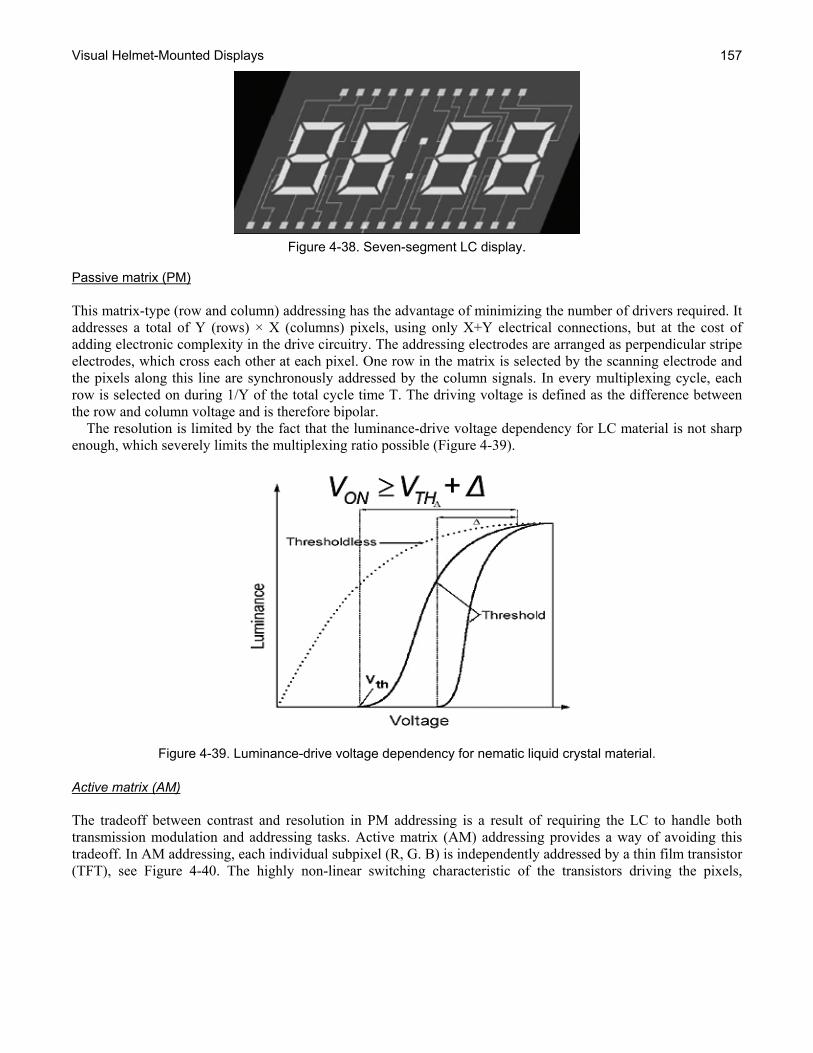
Visual Helmet-Mounted Displays
157
Figure 4-38. Seven-segment LC display.
Passive matrix (PM) This matrix-type (row and column) addressing has the advantage of minimizing the number of drivers required. It addresses a total of Y (rows) × X (columns) pixels, using only X+Y electrical connections, but at the cost of adding electronic complexity in the drive circuitry. The addressing electrodes are arranged as perpendicular stripe electrodes, which cross each other at each pixel. One row in the matrix is selected by the scanning electrode and the pixels along this line are synchronously addressed by the column signals. In every multiplexing cycle, each row is selected on during 1/Y of the total cycle time T. The driving voltage is defined as the difference between the row and column voltage and is therefore bipolar. The resolution is limited by the fact that the luminance-drive voltage dependency for LC material is not sharp enough, which severely limits the multiplexing ratio possible (Figure 4-39).
Figure 4-39. Luminance-drive voltage dependency for nematic liquid crystal material.
Active matrix (AM) The tradeoff between contrast and resolution in PM addressing is a result of requiring the LC to handle both transmission modulation and addressing tasks. Active matrix (AM) addressing provides a way of avoiding this tradeoff. In AM addressing, each individual subpixel (R, G. B) is independently addressed by a thin film transistor (TFT), see Figure 4-40. The highly non-linear switching characteristic of the transistors driving the pixels,

Chapter 4 158
eliminates the problems of ghosting and slow response speed. The result is response times of the order of 10-15 ms, minimizing the smear. By controlling the transmission of each individual pixel and doing it independently of all other pixels, AM addressing effectively eliminates pixel crosstalk from limiting the multiplex ratio, enabling large, high-resolution displays. The complete matrix of transistors is produced on a single silicon wafer.
Figure 4-40. Active matrix addressing (Wu, 2003) In the last decade and a half, as FP technologies have come of age, LCDs have emerged as a major rival to CRTs as the display technology of choice. AMLCDs have become the preferred approach for see-through military HMD applications. LCDs overcome a host of CRT weaknesses. While LCD technology is not without its own disadvantages, its impact on display applications cannot be underestimated In its most simplistic form, an LCD consists of two substrates that form a "flat bottle" containing the liquid crystal mixture (Wu, 2001). The inside surfaces of the bottle or cell are coated with a polymer that is buffed to align the molecules of liquid crystal. The liquid crystal molecules align on the surfaces in the direction of the buffing. LCDs exist in a variety of configurations, differing primarily by the electro-optical effect the crystal exhibits. For twisted nematic (TN) LCDs, the two surfaces are buffed orthogonal to one another, forming a 90° twist from one surface to the other. The LCD glass has transparent electrical conductors plated onto each side of the glass in contact with the liquid crystal fluid and they are used as electrodes. These electrodes are made of ITO. When an appropriate drive signal is applied to the cell electrodes, an electric field is set up across the cell. The liquid crystal molecules will rotate in the direction of the electric field (Figure 4-41, top). The incoming linearly polarized light passes through the cell unaffected and is absorbed by the rear analyzer. The observer sees a black character on a sliver gray background. When the electric field is turned off, the molecules relax back to their 90° twist structure (Figure 4-41, bottom). This is referred to as a positive image, reflective viewing mode. LCDs are non-emissive displays. They produce images by modulating ambient light, which can be either reflected light or transmitted light from a secondary, external source (e.g., a backlight). One of the latest advances in LCD technology is ferroelectric LCDs (FLCDs). The existence of ferroelectric liquid crystals was first suggested by Meyer in the mid 1970’s (Meyer, 1977). A further refinement of the principle came a few years later (Clark, 1980). FLCDs utilize the intrinsic polarization inherently exhibited by the chiral tilted smectic LC, which is the defining characteristic of ferroelectric materials. These liquid crystal molecules are endowed with a positive or negative polarity in their natural state, even without the application of an electric field. When an electric field is applied, the optical axis assumes a uniform direction throughout the

Visual Helmet-Mounted Displays
159
Figure 4-41. Diagram of LCD operation during the application (right) and removal (left) of an electric field (Hel-Or, 2007).
crystal layer. When the polarity of the electric field is reversed, the optic axis rotates 45°. This gives the cell two stable states that are determined by the polarity of the applied electric field. By selecting the appropriate thickness of the FLC layer, it will function as an electrically switchable half-wave plate. This makes FLCs ideally suited to electro-optic applications (Surguy, 1998). Interest has focused on FLCDs because they offer a number of characteristics that differ from conventional LCDs:
• Memory - Ferroelectric display images are not lost when the power is cut; the image remains intact. Since the arrangement the liquid crystal molecules had when voltage was last applied is retained, the number of scanning lines can be increased without sacrificing contrast quality.
• High response rate - Very high-speed displays are possible. Ferroelectric LC materials show very fast switching time, of the order of 20 to 50 μsec. These speeds are more than 3,000 times faster than TN LCDs.
• Wide viewing angles - Viewing angle limitations are greatly reduced. Since contrast does not change depending on the viewing angle, high resolution, large-scale LCDs are possible.
• Lower cost - Ferroelectric LCDs do not require expensive switching elements like AM drive systems (as TFT LCDs do), making large-scale high-resolution displays with large information capacity possible using simple passive matrix addressing.
Color in FLCDs is achieved using FSC. Using this technique the panel illumination is continuously cycled from red to green to blue rapidly enough so the human eye integrates the three colors sequentially to see full-color on each individual pixel. In contrast, nematic LCD displays achieve color on each pixel by spatially dividing it into 3 subpixels with each subpixel being entirely covered by a red, green, or blue filter. These subpixels are spaced very close together so the human eye integrates the three colors spatially to see full-color.

Chapter 4 160
By using FSC to generate color in the temporal, rather than the spatial domain, FLC displays do not require three color filters for each pixel. This results in improved resolution, light efficiency and reduced costs. One disadvantage of FLCDs is that the chiral smectic part of the LC is both temperature and mechanical shock sensitive. FLCs tend to revert to their natural helical structure when subjected to mechanical shocks. This problem, although still a concern especially for military applications, has been largely solved for miniature displays. In addition, their temperature operational range is very narrow, 10°C to 40°C, which may restrict their applicability in the military environment. These displays are still in the research and development stage, but expectations are high that this technology will reveal a dramatic new LCD potential. Future challenges lie in correcting manufacturing difficulties related to improving ruggedization and more effectively controlling spacing between the two substrates. This spacing should not exceed 2 µm maximum in order to remove the helical structure that will otherwise cancel the intrinsic polarization effects, and product development (Mosley, 1994). The shift from CRT displays to LCD displays greatly changes the nature in which display images are evaluated. One change is in how image defects impact image quality. This is a result of the pixilated nature of LCDs and other FP technologies. Whereas CRTs have one control structure – modulation control in the horizontal scan, but fixed vertical positions of the scans, the LCD has independent control structure for each individual pixel –total control over vertical and horizontal positions. The CRT functionally time-shares its electron gun control but in the process introduces a whole array of geometric and focusing errors as a consequence of its deflection scanning mechanism. For matrix displays, which eliminate geometrical errors, sufficient gray scale and color rendition are challenges. For LCD the display process is inherently non-linear, involving at its simplest E2 (square of the local electric field in the LC medium). Actual results also depend on the optical structure, the illumination and viewing angle. The human eye is quite forgiving to full field changes in brightness, color and even contrast – it quickly adapts to the "average" conditions present. But, even minor gray scale and color errors may be objectionable. As they occur possibly closely adjacent in the same image, and the eye does not compensate for them. Response time is still an LCD problem, which is aggravated at reduced temperatures in field applications. The slower temporal response causes image contrast under dynamic conditions to be lower than corresponding values recorded with static photometric measurements. Rabin (1995) assessed display response time effect on visual acuity by comparing two HMDs: one CRT-based, the second AMLCD. The main conclusion was that at low to moderate rates of visual stimuli presentation, there was no significant difference in dynamic visual performance between the two technologies. However, at higher presentation rates, dynamic visual performance was significantly reduced when the AMLCD was used. Quantitatively the results were expressed as:
• Contrast sensitivity function (defined as 1/ contrast threshold) is the same for temporal frequencies of up to 2 Hz. Beyond 2 Hz, the fall-off rate of the AMLCD is significantly faster - a 2X difference in CRT favor was recorded at 8 Hz and a 3X difference at 16 Hz.
• Target recognition as function of target duration was the same up to 200 ms; below this the AMLCD performance drops almost linearly with target presentation time - reaching 4X in CRT favor, at a target duration of 30 ms.
• For fast moving targets, the AMLCD HMD is even worse – 5X for target velocity of 20° per second in favor of the CRT HMD.
One other major disadvantage for the AMLCDs is their low optical transmission; typically in the range of 8% to 15% for monochrome and only 3% to 5% for color devices. This increases luminance requirements for the backlighting and the optical design, with corresponding increase in electrical power requirements and heat load. The development of miniature AMLCDs for use in HMDs has been challenging. Seeded by military funding, success has been driven by commercial applications. A major manufacturer of miniature AMLCD displays for both the HMD and commercial communities is Kopin Corporation, (Westborough, MA). Since their development

Visual Helmet-Mounted Displays
161
of a class of transmissive LCDs, advertised as CyberDisplay® products, in 1997, Kopin Corporation has shipped more than 20 million displays. These displays have been used in consumer electronics (camcorders, digital cameras) and for advanced night vision goggles and thermal weapon sights programs for the U.S. Army. Kopin Corporation’s CyberDisplay® uses single-crystal silicon transistors that enable pixels typically 15 µm square and of a pixel density exceeding 1600 LPI (Figure 4-42). To construct the transmissive display from opaque silicon, Kopin Corporation uses a patented lift-off process to transfer a very thin IC layer onto a glass plate (Werner, 1993). The success of miniature AMLCD development has depended on thin-film technology that removes the active circuit from the silicon wafer and transfers it to the display glass substrate. One approach has been one pioneered by the Massachusetts Institute of Technology (Cambridge, MA) and commercialized by Kopin Corporation under the trade name Isolated Silicon Epitaxy™ (ISE). This process relies on forming a release layer on the silicon wafer and epitaxially growing the active silicon layer on top of the release layer. The CyberDisplay® SXGA low-voltage ruggedized (LVR) (Kopin Corporation, 2007) is a full-color SXGA display in a 0.97-inch (24.6-mm) diagonal package for use in targeting, multi-spectral, image fusion, simulation and training, and medical head-mounted systems The LVR's low-voltage architecture results in power consumption of less than 200 mW, which will extend battery life in man-portable applications. Power requirements for display, backlight, application-specific integrated circuit (ASIC) drive electronics and backlight are less that 1W. Another version is the CyberDisplay® 1280MR, a monochrome SXGA display for thermal imaging applications. This display is available in two versions: the standard twisted nematic (TN) AMLCD and the multi-domain vertical alignment (MVA) display. The MVA display offers a normally black image with high contrast ratio (greater than 300:1) for I2 and thermal night vision applications. Digital light processing (DLP®) The digital light processing (DLP®) display concept, originally known as the Digital Micromirror Display (DMD), was invented in 1987 by Dr. Larry Hornbeck of Texas Instruments, Dallas, TX. The heart of the display is an electronic chip that contains a rectangular array of approximately 2 million hinge-mounted microscopic mirrors; each of these “micromirrors” measures less than one-fifth the width of a human hair (Texas Instruments, 2007). Each mirror corresponds to a single pixel. The display modulates incident light by movement of the individual micromirrors. With an appropriate light source and a projection lens, the display’s mirrors reflect the desired image onto a screen or other surface. Figure 4-43 illustrates the architecture of a single pixel, showing the mirror as semitransparent so that the structure underneath can be observed. The mirrors are held in place on two corners and are free to twist around one axis by ± 10°. When the mirror rotates to its on state (+10°), light from a projection source is directed into the pupil of a projection lens, and the pixel appears bright on a projection screen. When the mirror rotates to its off state (-10°), light is directed out of the pupil of the projection lens, and the pixel appears dark. Thus, the optical switching function is simply the rapid directing of light into or out of the pupil of the projection lens. Both grayscale and color are possible with DLP®. Up to 1024 shades of gray can be generated. Color is achieved via a color wheel that filters white light from a lamp source as it travels to the surface of the DLP® chip; converting the white light into red, green, or blue. Specifications for the DLP® chip claim that at least 16.7 million colors can be produced. It is the human eye’s temporal integration time that allows this large color gamut. For example, to produce a purple hue, a mirror would only reflect red and blue light to the projection surface. DLP/DMDs offer several advantages over other technologies: small volume and weight, high luminance and contrast ratio, and a less visible pixel grid (as compared to LCDs). Based on these advantages, several HMD applications have been suggested (Preston, 2002).

Chapter 4 162
Figure 4-42. Diagram for Kopin Corporation’s CyberDisplay® transmissive LCD (Kopin Corporation, 2006).
Figure 4-43. Depiction of a single micromirror pixel (Texas Instruments, 1997).
Laser The highest luminance image source available is the laser. Making use of the persistence of vision characteristic of the eye, lasers are used in a scanning mode to produce an image in the manner of CRTs. Rather than an electron beam, a laser beam is scanned in two dimensions, with the beam intensity modulated at every pixel (Rash, 2001). When scanned at frequencies greater than 60 Hz, a flicker-free image is produced. In addition to high luminance, laser-based displays are capable of a wide color gamut with excellent color saturation. One of the original versions of these displays is known as a virtual retinal display (VRD). The VRD modulates the scanning laser beam with video information, producing a raster image placed directly onto the retina of the user's eye. The VRD may also include a depth accommodation cue to vary the focus of scanned photons rapidly so as to control the depth perceived by a user for each individual picture element of the virtual image. Further, an eye tracking system may be utilized to sense the position of an entrance pupil of the user's eye, with the detected pupil position being used to move the beam so as to be approximately coincident with the entrance pupil of the eye (Furness and Kollin, 1995). Also known as the Retinal Scanning Display (RSD), the VRD concept originated at the Human Interface Technology Laboratory at the University of Washington (Furness and Kollin, 1995) and is now being developed and commercialized at Microvision, Inc., Redmond, Washington. The RSD (or VRD) offers high spatial and color resolution and high luminance, fundamentally limited only by eye safety considerations. It does not require the use of a display screen. Color imagery is achieved by the use of low-power red, green, and blue lasers. Due to optical constraints imposed by inherent design characteristics, the final image in HMDs that use laser sources is not scanned directly onto the viewer’s retina. Instead, an intermediate image must be formed and viewed using an eyepiece. This configuration is no longer a true VRD and is better described as a scanning laser display. A functional block diagram of Microvision, Inc., scanning laser HMD developed for the U.S. Army’s Aircrew Integrated Helmet System program (AIHS) is presented in Figure 4-44 (Rash and Harding, 2002). While this diagram is useful for the understanding of the operation of the Microvision, Inc., AIHS scanning laser HMD, it may be more interesting to look at the system from the perspective of how the laser light (energy) traverses the optical path from laser source to the eye (Figure 4-45). This diagram is applicable to both channels. The percentage values reflect the transmission at each functional block. As can be seen, this theoretical power analysis predicts that only 0.48% of each laser’s initial power reaches each eye. This is an important prediction, because historically Warfighters have assigned a negative connotation with lasers in the battlespace. Warfighters have

Visual Helmet-Mounted Displays
163
been taught to look away from potential laser sources due to their ability to harm the eye. With this HMD, laser energy purposefully is being directed into the eye.
Figure 4-44. Functional block diagram of scanning laser HMD system (Rash and Harding, 2002).
Figure 4-45. Flow diagram for optical path of laser energy (Rash and Harding, 2002). A 2000s version of this display is presented in Figure 4-46 (top). The predicted high luminance symbology capability of scanning laser source is represented in Figure 4-46 (bottom).

Chapter 4 164
Figure 4-46. Laser scanning HMD (top) and artist’s conception depicting the ability of these HMDs to present symbology of sufficient luminance to be seen against daytime backgrounds (bottom) (Source: Microvision, Inc.).
Laser-based systems typically suffer from coherence artifacts. The RSD generates pixels serially, which makes the pixels mutually incoherent; any remaining coherence (e.g., speckle) is typically at subpixel level, hence at high spatial resolution that is beyond the human eye’s discerning capability. The major advantages of using laser sources are high luminance and wide color gamut. The RSD also has the advantage of being an infinitely addressable device, just like the CRT. This allows the option of implementing electronic “imaging warping” to compensate the inherent distortions introduced by the optics for an additional degree of freedom. Flexible display technologies Rather than a group of stand-alone technologies, flexible display technologies are new manufacturing approaches to existing FPD technologies (e.g., LCD, OLED). Nonetheless, they are unique enough to warrant their own discussion. Flexible FPD technologies offer many potential advantages including light-weight and robust thin profiles; the ability to flex curve, conform, roll and fold for extreme portability, the ability to be integrated into garments and textiles. Flexible display allow more freedom to design, promise smaller and more rugged devices, and eventually (conceivably) can replace paper (Rash, Harris, and McGilberry, 2005) An all-encompassing definition of flexible displays is difficult to propose but has been poetically described as “they’re like modern art difficult to define but they know one when they see one” (Slikkerver, 2003). Four different categories have been defined each with its own specific set of requirements for performance and mechanical characteristics. What they all have in common is the replacement of rigid glass substrate by flexible organic or inorganic substrates.
• Flat thin displays: They have the configuration of current FPDs but the thinner substrate will make them
thinner and lighter. They are attractive for mobile applications: laptops, cell phones, and Personal Data Assistants (PDAs).
• Curved displays: Curved only once when they are built into a module or device and will maintain the same curvature through their lifetime. They will offer new design freedom – automotive dashboard for instance.
• Displays on flexible devices: They should be at least as flexible as the devices where they will be incorporated - smart cards, or textiles - and should allow frequent bending (Figure 4-47).
• Roll up displays: the quintessential flexible display; requires repeated rolling and unrolling of the display, preferably to a small diameter to allow smaller package.
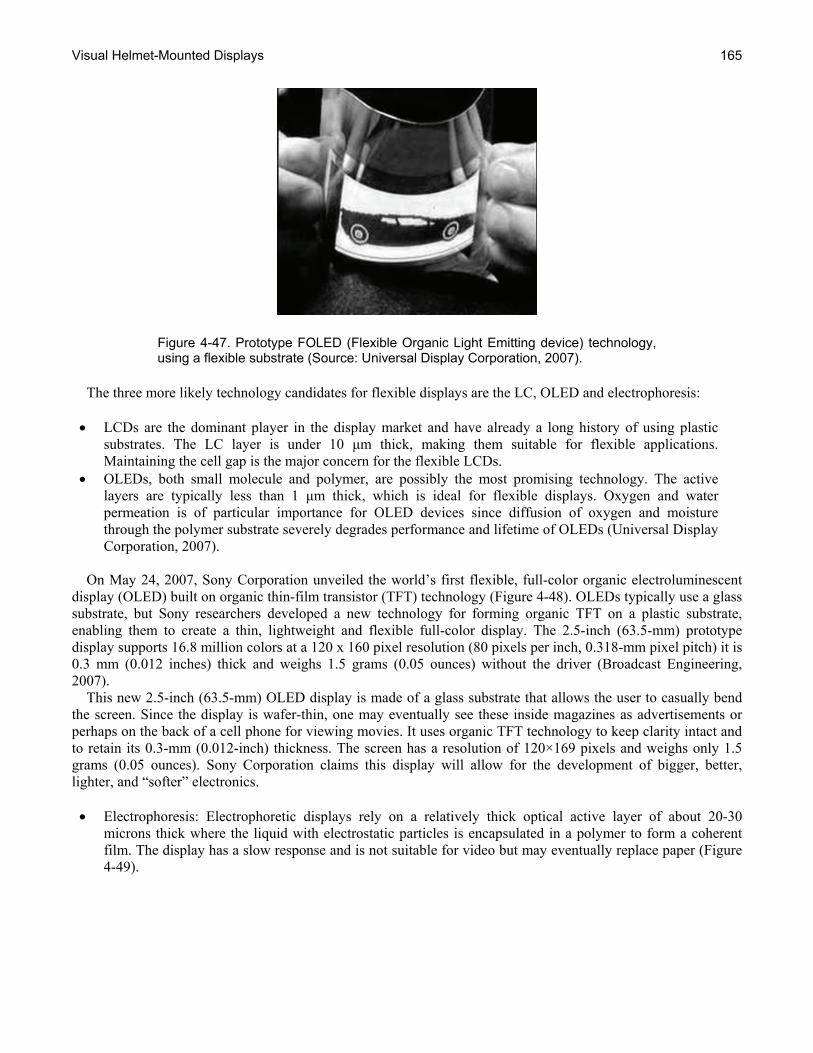
Visual Helmet-Mounted Displays
165
Figure 4-47. Prototype FOLED (Flexible Organic Light Emitting device) technology, using a flexible substrate (Source: Universal Display Corporation, 2007).
The three more likely technology candidates for flexible displays are the LC, OLED and electrophoresis: • LCDs are the dominant player in the display market and have already a long history of using plastic
substrates. The LC layer is under 10 μm thick, making them suitable for flexible applications. Maintaining the cell gap is the major concern for the flexible LCDs.
• OLEDs, both small molecule and polymer, are possibly the most promising technology. The active layers are typically less than 1 μm thick, which is ideal for flexible displays. Oxygen and water permeation is of particular importance for OLED devices since diffusion of oxygen and moisture through the polymer substrate severely degrades performance and lifetime of OLEDs (Universal Display Corporation, 2007).
On May 24, 2007, Sony Corporation unveiled the world’s first flexible, full-color organic electroluminescent display (OLED) built on organic thin-film transistor (TFT) technology (Figure 4-48). OLEDs typically use a glass substrate, but Sony researchers developed a new technology for forming organic TFT on a plastic substrate, enabling them to create a thin, lightweight and flexible full-color display. The 2.5-inch (63.5-mm) prototype display supports 16.8 million colors at a 120 x 160 pixel resolution (80 pixels per inch, 0.318-mm pixel pitch) it is 0.3 mm (0.012 inches) thick and weighs 1.5 grams (0.05 ounces) without the driver (Broadcast Engineering, 2007). This new 2.5-inch (63.5-mm) OLED display is made of a glass substrate that allows the user to casually bend the screen. Since the display is wafer-thin, one may eventually see these inside magazines as advertisements or perhaps on the back of a cell phone for viewing movies. It uses organic TFT technology to keep clarity intact and to retain its 0.3-mm (0.012-inch) thickness. The screen has a resolution of 120×169 pixels and weighs only 1.5 grams (0.05 ounces). Sony Corporation claims this display will allow for the development of bigger, better, lighter, and “softer” electronics. • Electrophoresis: Electrophoretic displays rely on a relatively thick optical active layer of about 20-30
microns thick where the liquid with electrostatic particles is encapsulated in a polymer to form a coherent film. The display has a slow response and is not suitable for video but may eventually replace paper (Figure 4-49).

Chapter 4 166
Figure 4-48. OLED flexible display (Source: Sony Corporation).
Figure 4-49. Example of an electrophoretic display (Source: E-Ink Corporation).
Electrophoresis is a phenomenon based on the migration of charged particles when placed under the influence of an electrical field. An electrophoretic display would generally consist of a lower electrode (with protection layers), a layer of charged particles within a medium such as a dielectric fluid, and an upper electrode with protection layers (Rash, Harris, and McGilberry., 2005). In February 2004, the U.S. Army teamed up with Arizona State University (ASU) to establish the Flexible Display Center (FDC) – a five-year, $43.6 million manufacturing R&D center designed to speed the commercialization of emissive and reflective display and TFT backplane technologies on polymer and metal-foil substrates (http://flexdisplay.asu.edu, 2007). The types of flexible displays the U.S. Army is interested in must be more rugged than those currently demonstrated on glass substrates and require less power. Such displays will be attractive for lightweight, wearable computer applications for use on the battlefield for communication and tactical information access. Working within the FDC are researchers from a strategically formed team of military, industry and academic partners. Army partners include the U.S. Army Research Laboratory and the Natick Soldier Center. Industry partners include EV Group, Honeywell, Universal Display Corporation, Kent Displays, E Ink, Ito America, General Dynamics, Rockwell Collins, Abbie Gregg Inc. and the U.S. Display Consortium. University collaborators include Cornell University, the University of Texas, and Waterloo University. Additional partners will be added as the center matures. The agreement has an option for supplementing funding of up to $50 million over a five-year period. The goal of the Army investment in critical issues for flexible displays is to move the timeline for commercial introduction forward and secure flexible technology availability for the Objective Force Warrior. Dr. John Pellegrino, Chairman DOD Technology Panel on Electron Devices, Director US Army Research Laboratory Sensors and Electron Devices Directorate summarized (USDC Flexible Display Conference, 2003), the technology opportunities FDC is looking to fund:
• Electro-optic materials, emissive/ reflective o OLEDs: Full-color, stable materials with low differential color aging o OLEDs: Improved Blue emitters o OLEDs: Improved thermal stability, operating temperature o Electrophoretics: video rates, full-color, stability
• Backplane electronics, Poly-Si, a-Si (n-type only) o Deposition, full-color, patterning flexible substrates o Roll-to-roll processing - Tools o Registration and dimensional control
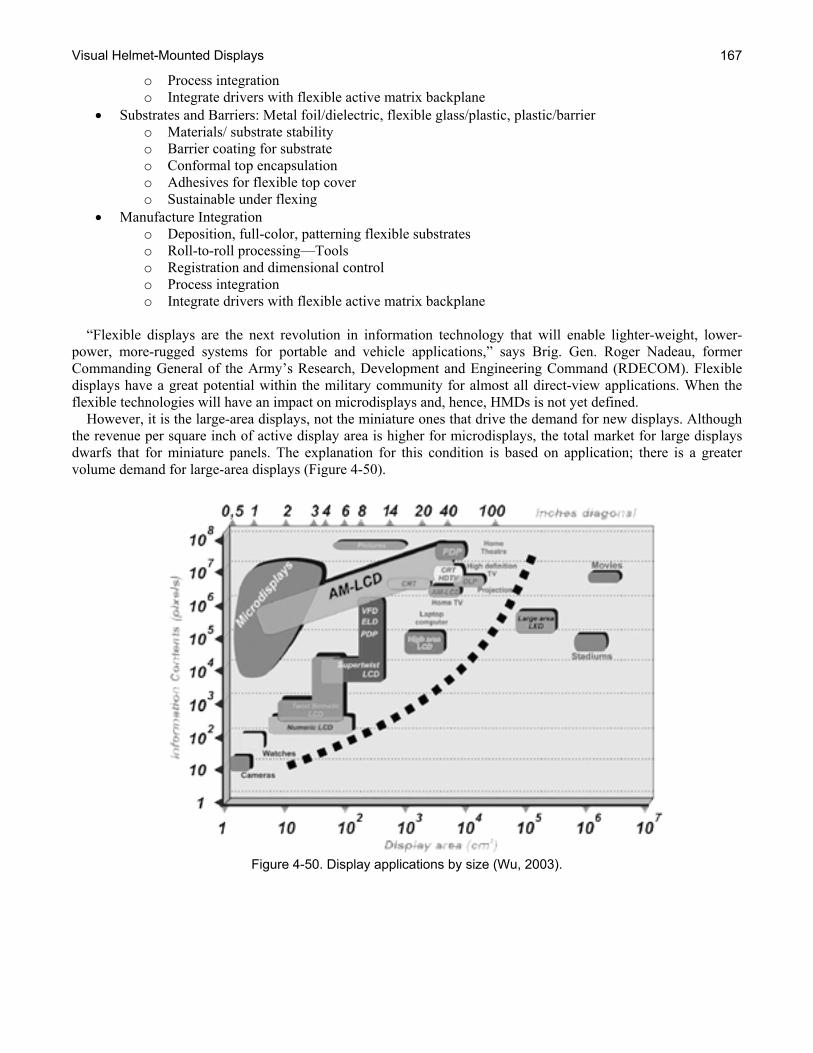
Visual Helmet-Mounted Displays
167
o Process integration o Integrate drivers with flexible active matrix backplane
• Substrates and Barriers: Metal foil/dielectric, flexible glass/plastic, plastic/barrier o Materials/ substrate stability o Barrier coating for substrate o Conformal top encapsulation o Adhesives for flexible top cover o Sustainable under flexing
• Manufacture Integration o Deposition, full-color, patterning flexible substrates o Roll-to-roll processing—Tools o Registration and dimensional control o Process integration o Integrate drivers with flexible active matrix backplane
“Flexible displays are the next revolution in information technology that will enable lighter-weight, lower-power, more-rugged systems for portable and vehicle applications,” says Brig. Gen. Roger Nadeau, former Commanding General of the Army’s Research, Development and Engineering Command (RDECOM). Flexible displays have a great potential within the military community for almost all direct-view applications. When the flexible technologies will have an impact on microdisplays and, hence, HMDs is not yet defined. However, it is the large-area displays, not the miniature ones that drive the demand for new displays. Although the revenue per square inch of active display area is higher for microdisplays, the total market for large displays dwarfs that for miniature panels. The explanation for this condition is based on application; there is a greater volume demand for large-area displays (Figure 4-50).
Figure 4-50. Display applications by size (Wu, 2003).

Chapter 4 168
Unique Issues The integration of image sources into the various optical designs during the development of HMDs has posed a number of unique issues. Two of the most interesting problems, both associated with scanning laser HMD designs, are that of exit pupil expansion and pinch correction. Exit pupil expander (EPE) With scanning laser image sources, a 2-D scanning motion generates an image at an intermediate image plane. In this case, the focusing numerical aperture (NA), formed by the light converging to form the flying spot within the raster, is typically defined by the NA required to form a near-diffraction-limited spot size. As pixel size is typically similar to spot size, the NA exiting from a pixel in the intermediate image plane will have a NA similar to that coming into the intermediate image plane. It is this limited exit NA that results in an exit pupil of approximately 1 to 3 mm. Without the EPE located at the image plane, the beam angles before and after the EPE are equal (θo= θi), hence the exit pupil size (ExP) can be computed using the optical invariant of the system (Figure 4-51): ExP tan (FOV/2) = D tan (θTOSA/2) Equation 4-11
where, N = resolution, p = pixel size, and L= image length
Figure 4-51. Ray trace for use of exit pupil expander. To enlarge the NA of the incoming laser beam to the required exit pupil size (15 mm is standard), an EPE acting as an NA expander is placed at the intermediate image plane between the scanner and the exit pupil. Effectively the EPE divides the optical system into two parts. The function of the EPE is to overcome the limitation imposed by the optical invariant (Melzer, 1998). For HMD systems, once the number of pixels (N), FOV, and exit pupil size requirements are specified, the intermediate image size (L) and the output cone angle (θo) parameters can be computed. The optical invariant can be written separately on either side of the EPE. [Note that the optical invariant before and after the EPE plane does not remain constant in the EPE presence (Urey, 2000a).] A number of EPE approaches were investigated during the Microvision, Inc. development for a scanning laser HMD for the AIHS program. These include a diffractive (holographic) element and Micro Lens Arrays (MLAs). Figure 4-52 (left) shows a photographic setup for observing the exit pupil for a holographic EPE. The exit pupil appears as a set of beamletts (Figure 4-52, right). Each beamlett contains the entire image (Rash and Harding, 2002). In the AIHS design, a dual MLA approach eventually was employed. Pinch correction The adopted scanner architecture is crucial in defining a scanning laser HMD. Scanners for display applications demand high operating frequencies and a large mirror-size x scan-angle product. In addition, the mirror has to remain optically flat during operation under high strain, high acceleration forces, and high thermal loads. The
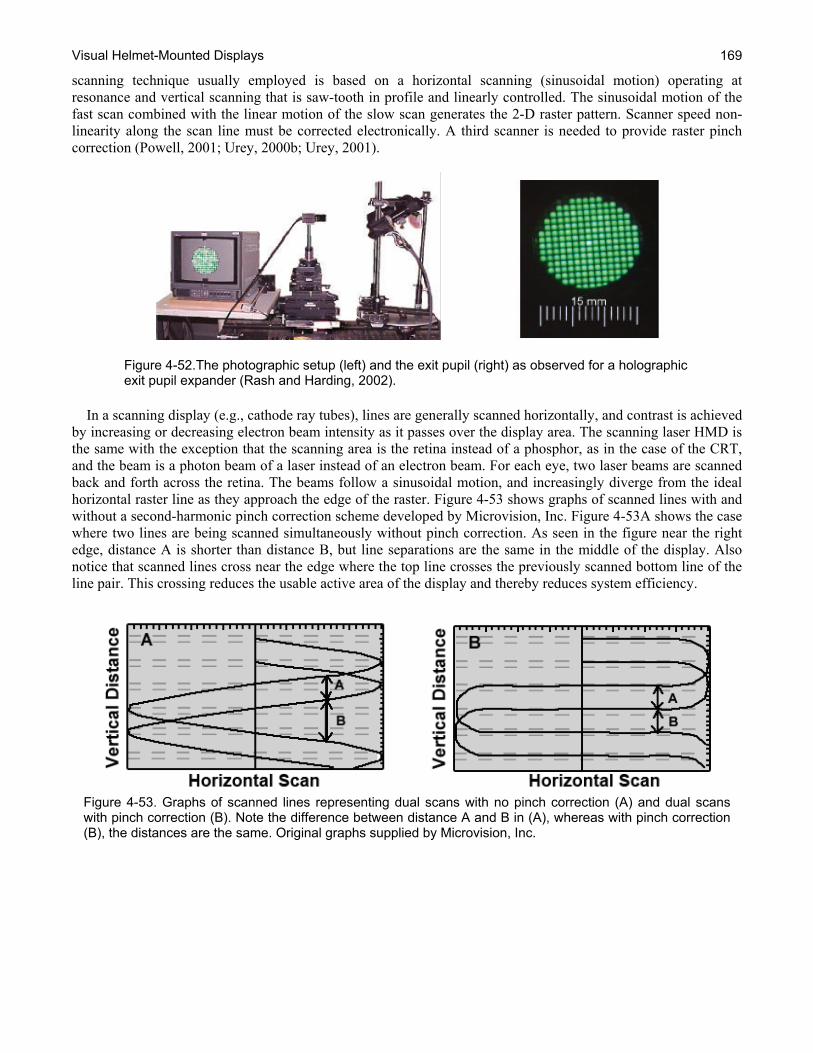
Visual Helmet-Mounted Displays
169
scanning technique usually employed is based on a horizontal scanning (sinusoidal motion) operating at resonance and vertical scanning that is saw-tooth in profile and linearly controlled. The sinusoidal motion of the fast scan combined with the linear motion of the slow scan generates the 2-D raster pattern. Scanner speed non-linearity along the scan line must be corrected electronically. A third scanner is needed to provide raster pinch correction (Powell, 2001; Urey, 2000b; Urey, 2001).
Figure 4-52.The photographic setup (left) and the exit pupil (right) as observed for a holographic exit pupil expander (Rash and Harding, 2002).
In a scanning display (e.g., cathode ray tubes), lines are generally scanned horizontally, and contrast is achieved by increasing or decreasing electron beam intensity as it passes over the display area. The scanning laser HMD is the same with the exception that the scanning area is the retina instead of a phosphor, as in the case of the CRT, and the beam is a photon beam of a laser instead of an electron beam. For each eye, two laser beams are scanned back and forth across the retina. The beams follow a sinusoidal motion, and increasingly diverge from the ideal horizontal raster line as they approach the edge of the raster. Figure 4-53 shows graphs of scanned lines with and without a second-harmonic pinch correction scheme developed by Microvision, Inc. Figure 4-53A shows the case where two lines are being scanned simultaneously without pinch correction. As seen in the figure near the right edge, distance A is shorter than distance B, but line separations are the same in the middle of the display. Also notice that scanned lines cross near the edge where the top line crosses the previously scanned bottom line of the line pair. This crossing reduces the usable active area of the display and thereby reduces system efficiency.
Figure 4-53. Graphs of scanned lines representing dual scans with no pinch correction (A) and dual scans with pinch correction (B). Note the difference between distance A and B in (A), whereas with pinch correction (B), the distances are the same. Original graphs supplied by Microvision, Inc.
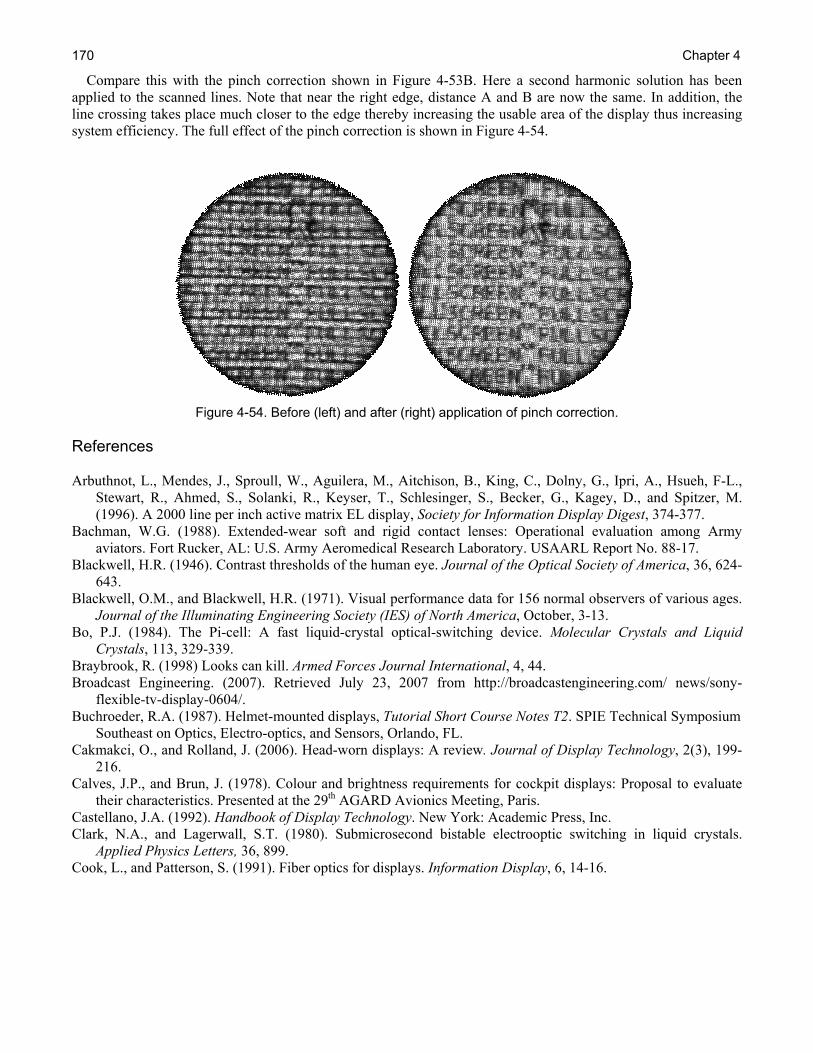
Chapter 4 170
Compare this with the pinch correction shown in Figure 4-53B. Here a second harmonic solution has been applied to the scanned lines. Note that near the right edge, distance A and B are now the same. In addition, the line crossing takes place much closer to the edge thereby increasing the usable area of the display thus increasing system efficiency. The full effect of the pinch correction is shown in Figure 4-54.
Figure 4-54. Before (left) and after (right) application of pinch correction.
References Arbuthnot, L., Mendes, J., Sproull, W., Aguilera, M., Aitchison, B., King, C., Dolny, G., Ipri, A., Hsueh, F-L.,
Stewart, R., Ahmed, S., Solanki, R., Keyser, T., Schlesinger, S., Becker, G., Kagey, D., and Spitzer, M. (1996). A 2000 line per inch active matrix EL display, Society for Information Display Digest, 374-377.
Bachman, W.G. (1988). Extended-wear soft and rigid contact lenses: Operational evaluation among Army aviators. Fort Rucker, AL: U.S. Army Aeromedical Research Laboratory. USAARL Report No. 88-17.
Blackwell, H.R. (1946). Contrast thresholds of the human eye. Journal of the Optical Society of America, 36, 624-643.
Blackwell, O.M., and Blackwell, H.R. (1971). Visual performance data for 156 normal observers of various ages. Journal of the Illuminating Engineering Society (IES) of North America, October, 3-13.
Bo, P.J. (1984). The Pi-cell: A fast liquid-crystal optical-switching device. Molecular Crystals and Liquid Crystals, 113, 329-339.
Braybrook, R. (1998) Looks can kill. Armed Forces Journal International, 4, 44. Broadcast Engineering. (2007). Retrieved July 23, 2007 from http://broadcastengineering.com/ news/sony-
flexible-tv-display-0604/. Buchroeder, R.A. (1987). Helmet-mounted displays, Tutorial Short Course Notes T2. SPIE Technical Symposium
Southeast on Optics, Electro-optics, and Sensors, Orlando, FL. Cakmakci, O., and Rolland, J. (2006). Head-worn displays: A review. Journal of Display Technology, 2(3), 199-
216. Calves, J.P., and Brun, J. (1978). Colour and brightness requirements for cockpit displays: Proposal to evaluate
their characteristics. Presented at the 29th AGARD Avionics Meeting, Paris. Castellano, J.A. (1992). Handbook of Display Technology. New York: Academic Press, Inc. Clark, N.A., and Lagerwall, S.T. (1980). Submicrosecond bistable electrooptic switching in liquid crystals.
Applied Physics Letters, 36, 899. Cook, L., and Patterson, S. (1991). Fiber optics for displays. Information Display, 6, 14-16.

Visual Helmet-Mounted Displays
171
Crookes, T.G. (1957). Television images. Nature, 179, 1014-1025. Crowley, J.S. (1991). Human factors of night vision devices: Anecdotes from the field concerning visual illusions
and other effects. Fort Rucker, AL: U.S. Army Aeromedical Research Laboratory. USAARL Report No. 91-15.
Droessler, J.G., and Rotier, D.J. (1989). Tilted Cat helmet mounted display. Head-Mounted Displays, Proceedings of SPIE, 1116, 19-26.
eMagin. (2007). Retrieved June 12, 2007 from www.emagin.com Falce, L. (1992). Dispenser cathodes for CRT’s. Information Display, 1, 11-14. Farrell, R.J., and Booth, J.M. (1984). Design handbook for imagery interpretation equipment. Seattle, WA:
Boeing Aerospace Company. Ferrin, F. (1997). Selecting new miniature display technologies for head mounted applications. Proceedings of
SPIE, Helmet-Mounted Displays II, 3058, 115-121. Fischer, R.E. (1997). Fundamentals of HMD optics. Head mounted displays: Designing for the user. New York:
McGraw-Hill, 83-116. Flexible Display Center at Arizona State University. (2007). Retrieved July 1, 2007 from
http://flexdisplay.asu.edu/. Fujioka, T. (2001). Monitor innovation of the future, Presentation October 3, courtesy of Totoku Electric Co., Ltd. Furness, III, T.A., and Kollin, J.S. (1995). Virtual Retinal Display. US Patent #5,467,104 issued November 14,
1995. Futaba, (2007). Retrieved July 23, 2007 from http://www.futaba1.de/ index.php?option=com_content&task
=view&id=21&Itemid=47 Girolamo, H. (2001). A decade of progress 1991-2001: HMD technology ready for platform integration.
Proceedings of SPIE, 4361, 43-70. Godfrey, G.W. (1982). Principles of display illumination techniques for aerospace vehicle crew stations.
Aerospace Lighting Institute: Tampa, FL. Harding, T.H., Martin, J.S., Beasley, H.H., and Rash, C.E. (1996). Figures of merit and performance
specifications for the IHADSS and ANVIS. Fort Rucker, AL: U.S. Army Aeromedical Research Laboratory. USAARL Report No. 96-13.
Hel-Or, H. (2007). Lecture notes: Display technologies. Retrieved June 1,2008 from http://cs.haifa.ac.il/ hagit/courses/ist/Lectures/IST08_Displaysx4.pdf
Howard, E.W. (No date). “Organic Light Emitting Diodes (OLED)” authored by Webster E. Howard Vice-President of Technology of eMagin.
Hur, R., and Pham, T. (2001). White LED. Retrieved June 21, 2007 from http://www.mse.berkeley.edu/classes/matsci102/ F01reports/whiteled.pdf
Illuminating Engineering Society (IES) of North America. (1984). IES Lighting Handbook. New York: Illuminating Engineering Society of North America.
International Organization for Standardization (ISO). (1987). Ergonomics of office VDUs: Visual requirements. Geneva: International Organization for Standardization. Draft DP 9241, Part 3.
Kopin Corporation. (2006). About CyberDisplay. Retrieved June 12, 2007 from http://www.kopin.com Kaiser, P.K., Herzberg, P.A., and Boynton, R.M. (1971). Chromatic border distinctness and its relation to
saturation. Vision Research, 11, 953. Kalinowski, J. (2004). Organic Light-Emitting Diodes: Principles, Characteristics and Processes (Optical
Engineering). New York: Marcel Dekker. Karim, M.A. (1992). Electro-optical displays. New York: Marcel Dekker. Kelker, H. (1988). Survey of the early history of liquid crystals. Molecular Crystals and Liquid Crystals, 165(1),
1-43. Keller, P. (1991). The Cathode Ray Tube Technology: History and Applications. New York: Palisades Press. Khormaei, R., (1995). A 1280x1024 active matrix EL display. Society for Information Display Digest, 891-895.

Chapter 4 172
Khormaei, R. (1994). High resolution active matrix electroluminescent display. Society for Information Display Digest, 137-140.
Kim, J.Y., Jeon, D.Y., Yu, I., and Hong-Gun, Y. (2000). A study on correlation of low voltage cathodoluminescent properties with electrical conductivity of In2O3-coated ZnGa2O4:Mn phosphors. Journal of the Electrochemical Society, 147(9), 3559-3563.
Klymenko, V., Harding, T.H., Martin, J.S., Beasley, H.H., and Rash, C.E. (1997). Image quality figures of merit for contrast in CRT and flat panel displays. Fort Rucker, AL: U.S. Army Aeromedical Research Laboratory. USAARL Report No. 97-17.
Klymenko, V., Harding, T.H., Martin, J.S., Beasley, H.H, Rash, C.E., and Rabin, J.C. (1997). Image quality figures of merit for contrast in CRT and flat panel displays. Fort Rucker, AL: U.S. Army Aeromedical Research Laboratory. USAARL Report No. 97-17.
Krasnov, A.N. (2003). Electroluminescent displays: History and lessons learned. Displays, 24, 73-79. Lattimore, M.R. (1990). Military aviation: A contact lens review. Aviation, Space, and Environmental Medicine,
59(2), 125-128. Lattimore, M.R., and Cornum, R.L. (1992). The use of extended wear contact lenses in the aviation environment.
Fort Rucker, AL: U.S. Army Aeromedical Research Laboratory. USAARL Report No. 92-35. Lehmann, O. (1889). Über fliessende Krystalle, Zeitschrift für Physikalische Chemie, 4, 462-72. Levinsohn, R., and Mason, R. (1997). Advances in helmet mounted display technology. Head-Mounted Displays
II, Proceedings of SPIE, 3058, 219-230. Lippert, T.M. (1986). Color-diffe rence predictions of legibility performance for CRT raster imagery. Society of
Information Display Digest, 86-89. Markey, W.P. (1988). Preliminary findings - Night vision goggle distortion measurements and specifications. Fort
Belvior, VA: Center for Night Vision and Electro-Optics. Memorandum for record. Martin, W.L., Lee, R.D., Ginsburg, A.P, Genco, L.V., and Task, H.L. (1983). Optical and Human Performance
Evaluation of HUD (Head-Up Display) Systems Design. Air Force Aerospace Medical Research Laboratory, Wright-Patterson AFB, OH.
McLean, W.E., and Smith, S. (1987). Developing a wide field of view HMD for simulators. Display System Optics, Proceedings of SPIE, 778, 79-82.
Melzer, J.E. (1998). Overcoming the field of view: resolution invariant in Head Mounted Displays. Head and Helmet Mounted Displays III, Proceedings of SPIE, 3362, 284-293.
Melzer, J.E., and Moffitt, K. (1997). Head mounted displays: Designing for the user. New York: McGraw-Hill. Meyer, R. (1977). Ferroelectric liquid crystals: A review. Molecular Crystals and Liquid Crystals, 40(1), 33-48. Mikoshiba, S. (2000). Visual artifacts generated in frame-sequential display devices: An overview. Society of
Information Display Digest, 384-387. Mosley, A. (1994). Ferroelectric LCD’s: The way to the marketplace. Information Display, 2, 7-11. Nelson, S.A. (1994). CVC HMD – next generation high-resolution head-mounted display. Helmet- and Head-
Mounted Displays and Symbology Design Requirements, Proceedings of SPIE, 2218, 7-16. Planar Systems. (1998). Electroluminescent Displays, statement by Christopher N. King Executive Vice President
/ Chief Technical Officer Post, D.L. (1983). Color contrast metrics for complex images. Doctoral dissertation, Virginia Polytechnic Institute
and State University, Blacksburg, VA. Powell, K. (2001). Multi-beam bi-directional raster scanning in retinal scanning display. Proceedings of SPIE,
4361, 77-88. Powell, K., Urey, H., and Bayer, M. (2001). Multibeam bidirectional raster scanning in Retinal Scanning
Displays. Helmet and Head-Mounted Display VI. Proceedings of SPIE, 4361, 77-88. Pratt, A.B. (1916). Weapons Delivery System for a Marksman. US Patent #1,183,492 issued on May 16, 1916.

Visual Helmet-Mounted Displays
173
Preston, A.R. (2002). Holgraphic display with switchable aspect ratio. US Patent #6377369 issued on April 23, 2002.
Rabin, J. (1995). Dynamic visual performance: Comparison between helmet-mounted CRTs and LCDs. Journal of Society of Information Display, 3(3), 97-100.
Rash, C.E. (Editor). (2001) Helmet-Mounted Displays: Design Issues for Rotary-Wing Aircraft. Bellingham, WA: SPIE Press.
Rash, C.E., and Becher, J. (1983). Analysis of image smear in CRT displays due to scan rate and phosphor persistence. Fort Rucker, AL: U.S. Army Aeromedical Research Laboratory. USAARL Report No. 83-5.
Rash, C.E., and Harding, T.H. (2002). A proposed laser safety evaluation for the Microvision, Inc., scanning laser helmet-mounted display system. Fort Rucker, AL: U.S. Army Aeromedical Research Laboratory. USAARL Report No. 2003-01.
Rash, C.E., Harris, E.S, and McGilberry, W.H. (2005). Flexible display technologies…Do they have a role in the cockpit? Fort Rucker, AL: US Army Aeromedical Research Laboratory. USAARL Report No. 2005-07.
Rash, C.E., Kalich, M.E., van de Pol, C., and Reynolds, B.S. (2002). The issue of visual correction compatibility with helmet-mounted displays. Fort Rucker, AL: U.S. Army Aeromedical Research Laboratory. USAARL Report No. 2003-04.
Rash, C.E., McLean, W.E., Mozo, B.T., Licina, J.R., and McEntire, B.J. (1999). Human factors and performance concerns for the design of helmet-mounted displays. Fort Rucker, AL: U.S. Army Aeromedical Research Laboratory. USAARL Report No. 99-08.
Rash, C.E., Monroe, D.R., and Verona, R.W. (1981). Computer model for the evaluation of symbology contrast in the Integrated Helmet and Display Sighting System. Fort Rucker, AL: U.S. Army Aeromedical Research Laboratory. USAARL Report No. 81-6.
Rash, C.E., and Verona, R.W. (1987). Temporal aspects of electro-optical imaging systems. Imaging Sensors and Displays II, Proceedings of SPIE, 765, 22-25.
Reinitzer, F., (1888). Beiträge zur Kenntniss des Cholesterins, Monatshefte für Chemie (Wien). Vol. 9, 421-441. Rotier, D.J. (1989). Optical approaches to the helmet mounted displays. Head-Mounted Displays, Proceedings of
SPIE, 1116, 14-18. Sauerborn, J. (1995). Helmet-mounted tubes for displays. Information Display, 6, 10-13. Schott, J. (1997). Remote Sensing. New York: Oxford University Press. Shenker, M. (1987). Optical design criteria for binocular helmet-mounted displays. Display System Optics,
Proceedings of SPIE, 778, 70-78. Sherman, C. (1995). Field-sequential color takes another step, Information Display, 3, 12-15. Sherr, S. (1993). Electronic Displays. New York: John Wiley and Sons. Slikkerver, P. (2003). Bending the Rules, Information Display, 3, 20-24. Snyder, H.L. (1985). Image quality: Measures and visual performance. Flat-Panel displays and CRTs. New York:
Van Nostrand Reinhold. Sluckin, T.J., Dunmur, D.A., and Stegemeyer, H. (2004). Crystals that flow. Classic papers from the history of
liquid crystals. Liquid Crystals Book Series, In: Gray, G.W., Goodby, J.W. and Fukuda, A. (Eds.). London: Taylor and Francis.
Spindt, C.A., Brodie, I., Humphrey, L., and Westerberg, E.R. (1976). Physical properties of thin-film field emission cathodes with molybdenum cones, Journal of Applied Physics, 47(12), 5248-5263.
Surguy, P. (1998). How ferroelectric liquid crystal work.” Information Display, 2, 24-27. Tannas, L.T. (Editor). (1985). Flat panels and CRTs. New York: Van Nostrand Reinhold. Task, H.T. (1979). An evaluation and comparison of several measures of image quality for television displays.
Wright-Patterson AFB, OH: Aerospace Medical Research Laboratory. AMRL-TR-79-7. Task, H.T., Hartman, R.T., and Zobel, A.R. (1993). New methods for night vision goggle test and evaluation.
Wright-Patterson AFB, OH: Armstrong Laboratory. AL/CF-TR-1993-0177.

Chapter 4 174
Task, H.L., Kocian, D.F., and Brindle, J.H. (1980). Helmet mounted displays: Design considerations, Advancement on Visualization Techniques, AGARD, No. 255.
Texas Instruments. (2007). How DLP technology works. Retrieved July 11, 2007 from http://www.dlp.com/tech/ Texas Instruments, (1997). Why is the Texas Instruments Digital Micromirror Device™ (DMD™) so reliable?
Retrieved May 11, 2008 from www.dlp.com/downloads/default.aspx?&ref=/downloads/white_papers/ 135_Myth.pdf
Tsou, B.H. (1993). System design considerations for a visually coupled system. Emerging Systems and Technologies, The Infrared and Electro-Optics Systems Handbook, 8, 515-540.
Universal Display Corporation. (2007). Retrieved July 3, 2007 from http://www.universaldisplay.com Urey, H. (1999). Scanner design and resolution trade-offs for miniature scanning displays, Proceedings SPIE,
3636, 60-68. Urey, H. (2000a). Optical advantages of retinal scanning displays, Proceedings SPIE, 4021, 20-26. Urey, H. (2000b). Scanned Display with Pinch Timing and Distortion Correction. US Patent # 6,140,979, issued
on October 31, 2000. US Display Consortium (USDC) Flexible Display Conference. (2003). February 3-4, Phoenix, AZ. van de Pol, C. Greig, J.L., Estrada, A., Bissette, G.M., and Bower, K.S. (2007). Visual and flight performance
recovery after PRK or LASIK in helicopter pilots. Aviation, space, and Environmental Medicine. 78(6), 547-553.
Velger, M. (1998). Helmet-Mounted Displays and Sights. Boston: Artech House. Wang, Q.H., Setlur, A.A., Lauerhaas, J.M., Dai, J.Y., Seelig, E.W., and Chang, R.P.H. (1998). A nanotube-based
field-emission flat panel display, Applied Physics Letters, 72(22), 2912-2913. Wells, M.H., and Haas, M. (1992). The human factors of helmet-mounted displays and sights. In: Karim, M.
(Ed.), Electro-optical displays, New York: Marcel Dekker. Werner, K. (1993). Transferred-silicon AMLCDs, Information Display, 10, 21-23. Widdel, H., and Post, D.L. (1992). Color in electronic displays. New York: Plenum Press. Wikipedia (2007). Electron gun photo. Retrieved July 23, 2007 from http://en.wikipedia.org/
wiki/Image:Egun.jpg Wood, R.B. (1992). Holographic head-up displays. In: Karim, M. (Ed.), Electro-Optical Displays, New York:
Dekker. Wu, S. (2003). Liquid crystal materials and devices, School of Optics/CREOL, University of Central Florida,
Retrieved from http://lcd.creol.ucf.edu/ Wu, S. and Yang, D. (2001). Reflective Liquid Crystal Displays, New York: John Wiley and Sons. Wu, S. and Yang, D. (2006). Fundamentals of Liquid Crystal Displays. New York: John Wiley and Sons. Yamada, F. (2000). Color sequential LCD based on OCB with an LED backlight, Society for Information Display
Digest, 1180-1183. Yeh, P., and Gu, C. (1999). Optics of Liquid Crystal Displays. New York: John Wiley and Sons. Zuckerman, J. (1954). Perimetry. Philadelphia: Loppincott.
Related Documents