1 Visual enhancement of digital ultrasound images: Wavelet versus Gauss-Laplace contrast pyramid Ali S. Saad, King Saud University College of applied medical sciences- Dept. of Biomedical Technology, P.O. Box 10219, Riyadh 11433, Kingdom of Saudi Arabia Phone:966-1-4355010 (307), mobile: 966508975969. Emails: [email protected] , [email protected] .sa Abstract words count : 205 Ms words count : 4,750 Number of references : 43

Welcome message from author
This document is posted to help you gain knowledge. Please leave a comment to let me know what you think about it! Share it to your friends and learn new things together.
Transcript
1
Visual enhancement of digital ultrasound images: Wavelet versus Gauss-Laplace contrast pyramid
Ali S. Saad,
King Saud University
College of applied medical sciences-
Dept. of Biomedical Technology,
P.O. Box 10219, Riyadh 11433,
Kingdom of Saudi Arabia
Phone:966-1-4355010 (307), mobile: 966508975969.
Emails: [email protected], [email protected]
Abstract words count : 205
Ms words count : 4,750
Number of references : 43

2
Abstract:
Purpose
Noise is the principal factor which hampers the visual quality of ultrasound images, sometimes leading to
misdiagnosis. Speckle noise in ultrasound images can be modeled as a random multiplicative process.
Speckle reduction techniques were applied to digital ultrasound images to suppress noise and improve
visual quality.
Rationale
Previous reports indicate that wavelet filtering performs best for speckle reduction in digital ultrasound
images. Reportes on x-ray images compared wavelet filtering with Laplace-Gauss contrast enhancement
(LGCE) showed that the LCGE performed better. As LGCE was never been applied to Ultrasound
images, this study compared two filtering approaches for speckle reduction on digital ultrasound images.
Methods
Two methods were implemented and compared. The first method uses the wavelet soft threshold (WST)
approach for enhancement. The second method is based on multi-scale Laplacian-Gaussian contrast
enhancement (LGCE).
LGCE is derived from the combination of a Gaussian pyramid and a
Laplacian one. Contrast enhancement is applied on local scale by using
varying sizes of median filter.
Results
The two methods were applied to synthetic and real ultrasound images. A comparison between WST and
LGCE methods was performed based on noise level, artifacts and subjective image quality.
Conclusion
WST visual enhancement provided better results than LGCE for selected ultrasound images.
Keywords: Speckle reduction, wavelet filtering, Laplacian pyramid, ultrasound images
and contrast enhancement.
I. Introduction
Ultrasound imaging techniques are widely used in medical diagnosis. Its noninvasive
nature, low cost, portability, and real-time image formation make ultrasound imaging
an attractive means for medical diagnosis. One of the limitations of ultrasound images
is poor image quality affected by speckle noise. Speckle reduction remains a difficult
problem due to the lack of reliable models to estimate noise.
Ultrasound images are very difficult to diagnose because of the existence of speckle
which hampers the perception and the extraction of fine details from the image. The
speckle is a characteristic phenomenon in different fields such as in Laser, Synthetic
Aperture Radar (SAR) images or in ultrasound images. Its effect is a granular aspect in
the image. Speckle is caused by interference between coherent waves which are

3
backscattered by targeted surfaces and arrive out of phase at the sensor [1]. Speckle can
be modeled as random multiplicative noise [1,2]. Filtering (visual enhancement)
techniques are used for enhancing the visual quality of the image. Furthermore, they are
used as preliminary treatment before segmentation and classification. Several filtering
methods have been proposed for speckle reduction. They can be divided roughly into
two categories. The first category improves the image by summing several observations
of the same object, the assumption that no change or motion of the object occurred
during the reception. The second category enhances the image using statistical models
for both noise and signal. Some techniques are applied in the spectral domain [3]. Other
techniques, such as the Kalman recursive filter (2D Bayesian estimation), are applied in
real domain. In reality, it is very difficult to represent a natural area by a simple
statistical model; moreover, these techniques are costly from a computational
viewpoint. Within this second category, several methods have been developed in order
to reduce speckle in a variety of imaging areas, with some using adaptive techniques
[4]. In [5] a review of wavelet applications in biomedical signals is summarized. In [6]
a multi-scale speckle reduction method was compared to a large number of filtering
methods for multiplicative noise reduction on SAR images which use the same
multiplicative noise as ultrasound [7]. The methods used include the Frost method [8] –
which is based on a multiplicative model of noise and gamma distribution for signal
and χ2 for the noise – and a modified version of the Frost method [9]. Other methods
used include Lee's speckle reduction method which is based on local statistics [10,11],
Lee's non-biased sigma filtering[12], adaptive local ranking filter (based on first and
second order local statistics[13]), mean filter, median filter, multi-resolution filtering by
contrast modification using the median filter and an adaptive ranking method with
entropy calculation for local disorder[6]. The study in [6] shows that multi-resolution
filtering by contrast modification using the median filter gives the best compromise
between edge preservation and multiplicative noise reduction.
Another iterative algorithm which uses wavelet maxima [14], was employed for
contrast enhancement of mammograms [15]. This algorithm is especially suitable for
compression. In this method the positions and the magnitudes of the edges in the details
images of the wavelet decomposition are retained, it is a very good tool for noise
reduction but has the drawback that the algorithm is an iterative process. In addition,
the convergence speed of the algorithm is quite slow. Wavelet filtering was used for X-
ray images and mammogram contrast enhancement [16]. A Fast Wavelet Transform
(FWT) for radiography enhancement versus Lapalcian pyramid is proposed in [17]
which deal only with x-ray images and mammography. This study concluded that
contrast enhancement using the LGCE method gave better results than with the wavelet
method. However, the study did not deal with ultrasound images. The result of [17]
motivated the study on ultrasound images, which is similar to X-ray if a log-transform
on the ultrasound data was performed.
Wavelet speckle reduction in ultrasound was tackled in [18,19]. Speckle reduction and
contrast enhancement using multi-scale non linear processing of echocardiograms was
proposed in [20]. These methods used statistical models which though costly (from a
computational and modeling estimation viewpoint) produced excellent results.
In [21] a comparative study of speckle filtering in ultrasound imaging of the carotid
artery found that, in this specific type of image, filtering using local statistics and
geometric filtering showed better results than other filters including WST. Manual
estimation of standard deviations (STDV) of noise was performed from different
4
selected regions and threshold estimation was performed as in [22]. The multi-scale
contrast enhancement method was omitted from the study as were other interesting
filtering methods such as the Frost method.
In [23] multi-resolution filtering by contrast modification using the median filter was
applied on ultrasound images and proved to give a very good visual improvement.
Recently in [7] a study of speckle filtering of medical ultrasound images suggested that
WST and modified WST speckle reduction method perform the best.
In [17] the study shows that contrast enhancement using the LGCE method gives better
results than wavelet filtering for x-ray images. In [6] the LGCE pyramidal method
yielded better results than large filtering methods with the sole exception of WST
filtering. In [7,19,20] WST proved to be among the best for despeckling in ultrasound
images. From the above studies we can see that the LGCE filter and the WST filter
have not been compared to each other on ultrasound images. For the above reasons
these methods were chosen in this paper to be compared to each other on ultrasound
images. The purpose of this paper is to apply these methods and compare them to each
other. The first method is based on wavelet filtering using soft-thresholding [22] of the
wavelet details components. The second method is based on enhancing of the image
contrast on a Laplace-Gauss pyramidal multi-scale scheme [6, 23]. Contrast is modified
at each level in the pyramid using an adaptive filter. The filtered image is in fact the
one reconstructed from the modified contrast process. Results of these techniques are
presented and compared to each other, using synthetic and real ultrasound images.
In [24] some generalized criteria of image quality measurement are introduced. In a
recent publication [25] several criteria of image assessment were used, 3 groups of
criteria of assessment were used. The first group is used in texture analysis, the second
group is a general quantitative assessment such as the SNR, MSE, RMSE, and other
types of error using Minkowski distance. The second group also includes the so called
universal criteria of [24]. The third group is an interesting one, using visual inspection
of the images by two experts. The problem of these types of assessment using so many
criteria on the whole image is so confusing and difficult to analyze without any
weighting among those parameters and focus the analysis to a certain areas of interest.
In this study, three criteria for speckle reduction assessment are used for ultrasound
images, three quantitative criteria SNR and MSE were used for synthetic images and
standard deviations in homogenous regions (selected regions of interest) were used for
real images. Two qualitative assessments – one is realized by an expert in ultrasound
diagnosis and other showing the general pattern of error images between filtered
ultrasound image and unfiltered one for both real and synthetic images.
The structure of the paper is as follows. Section 2, presents the methodology used here
including the wavelets decomposition, wavelet Basis selection for ultrasound images,
soft-thresholding method and the pyramidal Laplace-Gauss contrast enhancement. In
section 3, a comparison of the effects of contrast enhancement in the frame work of
these different decomposition methods is presented. In section 4, a discussion of the
merits and problems of these methods follows the influence of multi-resolution
properties on the perception of the ultrasonic images. Finally a conclusion will be
drawn from this study.

5
II. Methods
II.1. Model of Speckled Ultrasound Image
A universally agreed upon definition of a model still seems to be lacking. Nevertheless,
a number of possible formulations, whose feasibility was verified via their practical
use, exist. A generalized model of the speckle imaging as proposed in [26] and used in
[27], [28] is given by:
g(x,y) = f(x,y) u(x,y) + α(x,y), (1)
where g, f, u, and α stand for the observed envelope image, original image,
multiplicative and additive components of the speckle noise, respectively. Here the
indices x and y denote the axial and lateral indices of the image samples. Despite its
possible theoretical shortcomings [2], the model (1) has been successfully used both in
ultrasound and SAR imaging. Moreover, evidence exists that, when applied to
ultrasound images, only the multiplicative component u of the noise is considered,
hence, (1) can be considerably simplified by disregarding the additive noise term. This
leads to the following simplified model:
g(x,y) = f(x,y)u(x,y) (2)
This model was developed in [1,2,9] and used in [6,7,20,23], the wave reaching any
point of the ultrasound sensor is the sum of several waves which are reflected from the
target surface. Waves arrive at a sensor point out of phase and interference among these
waves causes the granular aspect termed speckle. The mathematical expression for a
signal observed at point p, whose coordinates are x,y in the image, is as follows :
∑∑ −−= ),(),(),( jiji yyxxhyxeyxo (3)
Where e(x , y) : is the signal scattered from tissue and contributing to O(x,y), h is the
impulse response of the acquisition system. The intensity I(x ,y) at this point can be
stated in a multiplicative form as :
2 2( , ) ( , ) ( , ) ( , )I x y O x y e x y u x y= = (4)
Where u(x,y) is noise, independent from the useful signal. Within homogenous regions
this model offers a good approximation for ultrasound images.
Note that there exists an alternative model, as proposed in [29] and used in [30,31],
describing the speckle noise as an additive noise, with its amplitude proportional to
square root of the true image. However, this model was proposed to account for the
speckle pattern after a sequence of standard processing steps performed by a typical
ultrasound scanner.

6
II.2 Filtering Based Wavelet
II.2.1 Choice of wavelet Base
The choice of wavelet filter bases depends on the signal. Signals coming from different
sources have different characteristics.
For audio, speech, image and video signals the best choices of wavelet bases are
known. The best choice for ultrasound images is not clear. The problem is to represent
typical signals with a small number of convenient computable functions.
An investigation to choose the best wavelet bases for ultrasound images was performed
on a simulated ultrasound image (image accessible at http://telin.rug.ac.be/~sanja). The
majority of the wavelet bases which exist in the Matlab-7 software [32- 36] were tested.
In [37] a study about wavelet bases choice for image denoising was proposed using
PSNR (peak signal to noise ratio) as criterion for discrimination between bases. In [38]
a best wavelet bases selection for MRI (magnetic resonance imaging) was studied using
PSNR.
The criterion used to determine the best wavelet basis was the one which optimized the
PSNR in homogenous areas and preserved edges at the boundaries. The bi-orthogonal
wavelets basis [39-41] especially the 3.5 basis in Matlab-7 yielded the best average
PSNR among others. This base was chosen in this paper to be applied to ultrasound
image.
II.2.2 Wavelet decomposition
The principle of the wavelet decomposition is to transform the original raw particle
image into several components: one low-resolution component called “approximation”,
and the other components called “details” (Fig.1).
The approximation component is obtained after applying a bi-orthogonal low-pass
wavelet filter in each direction (horizontal and vertical) followed by a sub-sampling of
each image by a factor of 2 for each dimension. The details are obtained with the
application of a low-pass filter in one direction and a high-pass filter in the other, or a
high-pass filter in both directions. The noise is mainly present in the details
components. A higher level of decomposition is obtained by repeating the same
filtering operations on the approximation. D1i, (i varies from 1 to 6) are the details
(Fig. 1). This type of wavelet is a Fast Wavelet Transform (FWT) [36]. The FWT is not
the only type of wavelet transform used in the filtering process. Some used both a
redundant wavelet and reconstruction from wavelet maxima [33,16]. In the redundant
wavelet the scaling is not achieved by sub-sampling of the image in each step as in the
method presented above, but rather by a scaling of the filter.
II.2.3. Wavelet denoising by Soft-Thresholding
In [22], a simple thresholding procedure for the recovery of functions from noisy data
was proposed. It consists of three steps: the signal is transformed into an orthogonal
domain, using a discrete wavelet transform producing empirical wavelet coefficients.
The empirical wavelet coefficients are subjected to nonlinear soft-thresholding
ηt(y) = sign(y) (|y| − t), (5)

7
with a threshold
t = (2 log(n)).5σ, (6)
where σ is the standard deviation of the white noise and n is the data length. This
method is known as wavelet denoising, with uniform soft thresholding.
The processed wavelet coefficients are inversely transformed, supplying an estimation
of the actual image. As a result, denoised images generally are much less over-
smoothed, in comparison with the images denoised by, e.g., linear filtering. Note that
uniform soft thresholding is not the only way to suppress the wavelet coefficients of the
noise, and a multitude of methods have been proposed based, for example, on
principles of Bayesian estimation and detection theory [42]. In [22] another threshold
selection based on a decreasing factor for each level and noise STDV was used in
[20,21].
In this paper the first step in the processing was a log-transformation applied to the
original ultrasound image in order to transform the multiplicative noise to an additive
one. The method used in this paper differs slightly from the methods cited above in the
way of estimating the noise standard deviation. And the threshold chosen in this paper
is as follows:
Ts,l=(2/l)σs,l (7)
Where Ts,l is the threshold and σs,l is the standard deviation of the noise at the level l
and for the sub-band s.
The noise variance needed for definition of the threshold was estimated by assuming,
that most empirical wavelet coefficients at each detail level of the decomposition are
induced by the noise, and, thus, the median absolute deviation of wavelet coefficients at
this level accurately reflects the noise size [22]. In this paper the noise is chosen from
the detail components of the wavelet transformation, and also from each level. The
histogram of the wavelet coefficients plays an important role in estimating the noise
characteristics, because it is known from wavelet theory that this histogram is
composed of two parts details information (mainly edges and noise which is mainly
grouped around the center of the histogram because of their low gray value which is
due to their random distribution in the image). If the tails of the histogram are removed
which represent the useful details the remaining information in the histogram are
mostly noise and the calculation of the standard deviation from this remaining data are
a good approximation of the existing noise in each sub-band. In this paper the details
and outlier pixels which represent 30% of the total image pixels were removed, and the
standard deviation of the remaining data estimates the one of the noise. This estimation
is much easier and more robust than manually choosing few regions from the image
and calculates σ, also less dependent of the ultrasound scanner and the type of image
treated.
II.3 Filtering Based on Laplace-Gauss pyramid
The method described here for speckle reduction is based on multi-resolution contrast
enhancement. This method enables an adaptive approach regardless of the shape and
size of the homogenous area in the image. At low resolutions the homogenous area is
strongly smoothed (loss of small details). As the resolution increases, this method adds
8
meaningful details to the resulting image. Contrast enhancement can be applied on a
local scale. The pyramidal representation of an image enables different levels of
resolution to be obtained. A multi-scale representation of contrast is called a contrast
pyramid. This pyramid is built by using the Gaussian pyramid and the Laplacian one. A
detailed description of the construction of the contrast pyramid is presented in the next
paragraph.
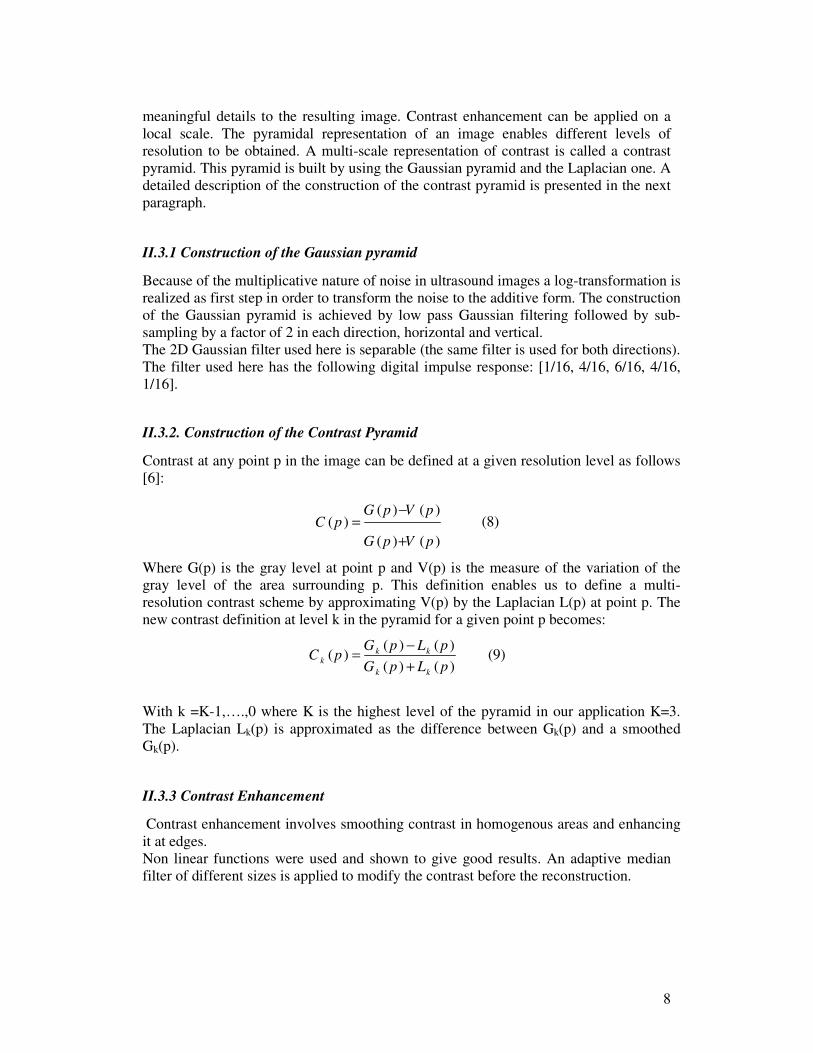
II.3.1 Construction of the Gaussian pyramid
Because of the multiplicative nature of noise in ultrasound images a log-transformation is
realized as first step in order to transform the noise to the additive form. The construction
of the Gaussian pyramid is achieved by low pass Gaussian filtering followed by sub-
sampling by a factor of 2 in each direction, horizontal and vertical.
The 2D Gaussian filter used here is separable (the same filter is used for both directions).
The filter used here has the following digital impulse response: [1/16, 4/16, 6/16, 4/16,
1/16].
II.3.2. Construction of the Contrast Pyramid
Contrast at any point p in the image can be defined at a given resolution level as follows
[6]:
( ) ( )( )
( ) ( )
G p V pC p
G p V p
−=
+
(8)
Where G(p) is the gray level at point p and V(p) is the measure of the variation of the
gray level of the area surrounding p. This definition enables us to define a multi-
resolution contrast scheme by approximating V(p) by the Laplacian L(p) at point p. The
new contrast definition at level k in the pyramid for a given point p becomes:
( ) ( )( )
( ) ( )
k kk
k k
G p L pC p
G p L p
−=
+ (9)
With k =K-1,….,0 where K is the highest level of the pyramid in our application K=3.
The Laplacian Lk(p) is approximated as the difference between Gk(p) and a smoothed
Gk(p).
II.3.3 Contrast Enhancement
Contrast enhancement involves smoothing contrast in homogenous areas and enhancing
it at edges.
Non linear functions were used and shown to give good results. An adaptive median
filter of different sizes is applied to modify the contrast before the reconstruction.
9
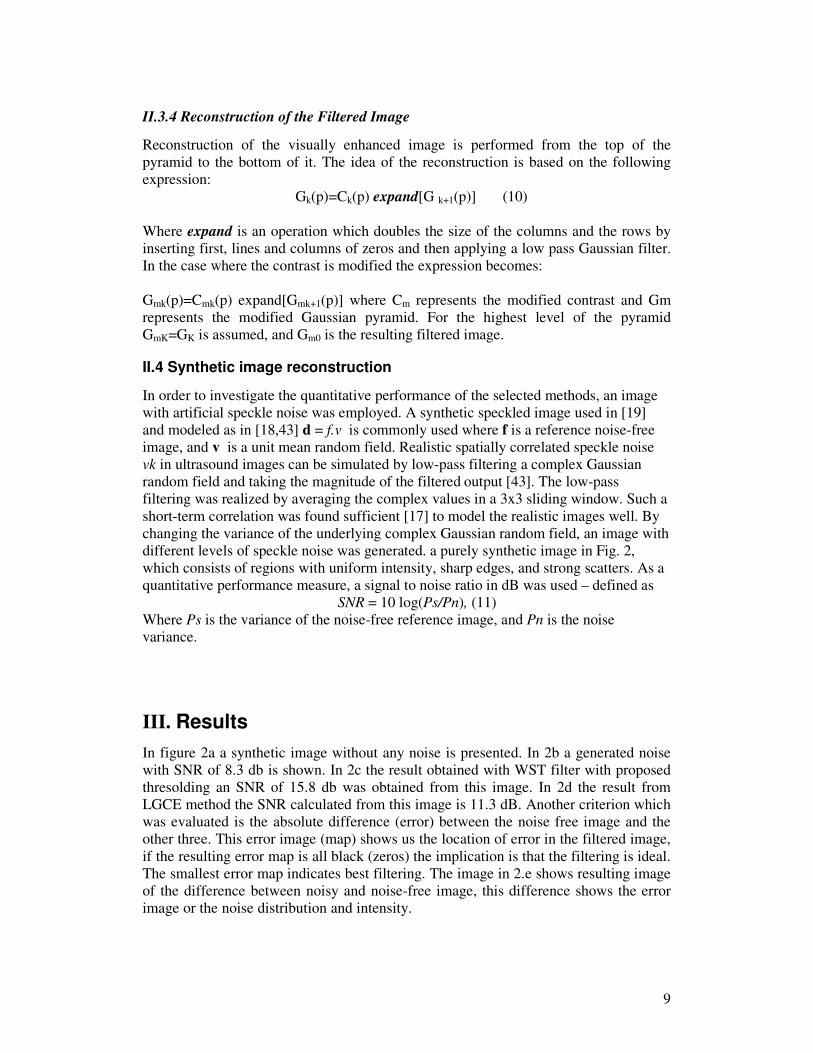
II.3.4 Reconstruction of the Filtered Image
Reconstruction of the visually enhanced image is performed from the top of the
pyramid to the bottom of it. The idea of the reconstruction is based on the following
expression:
Gk(p)=Ck(p) expand[G k+1(p)] (10)
Where expand is an operation which doubles the size of the columns and the rows by
inserting first, lines and columns of zeros and then applying a low pass Gaussian filter.
In the case where the contrast is modified the expression becomes:
Gmk(p)=Cmk(p) expand[Gmk+1(p)] where Cm represents the modified contrast and Gm
represents the modified Gaussian pyramid. For the highest level of the pyramid
GmK=GK is assumed, and Gm0 is the resulting filtered image.
II.4 Synthetic image reconstruction
In order to investigate the quantitative performance of the selected methods, an image
with artificial speckle noise was employed. A synthetic speckled image used in [19]
and modeled as in [18,43] d = f.v is commonly used where f is a reference noise-free
image, and v is a unit mean random field. Realistic spatially correlated speckle noise
vk in ultrasound images can be simulated by low-pass filtering a complex Gaussian
random field and taking the magnitude of the filtered output [43]. The low-pass
filtering was realized by averaging the complex values in a 3x3 sliding window. Such a
short-term correlation was found sufficient [17] to model the realistic images well. By
changing the variance of the underlying complex Gaussian random field, an image with
different levels of speckle noise was generated. a purely synthetic image in Fig. 2,
which consists of regions with uniform intensity, sharp edges, and strong scatters. As a
quantitative performance measure, a signal to noise ratio in dB was used – defined as
SNR = 10 log(Ps/Pn), (11)
Where Ps is the variance of the noise-free reference image, and Pn is the noise
variance.
III. Results
In figure 2a a synthetic image without any noise is presented. In 2b a generated noise
with SNR of 8.3 db is shown. In 2c the result obtained with WST filter with proposed
thresolding an SNR of 15.8 db was obtained from this image. In 2d the result from
LGCE method the SNR calculated from this image is 11.3 dB. Another criterion which
was evaluated is the absolute difference (error) between the noise free image and the
other three. This error image (map) shows us the location of error in the filtered image,
if the resulting error map is all black (zeros) the implication is that the filtering is ideal.
The smallest error map indicates best filtering. The image in 2.e shows resulting image
of the difference between noisy and noise-free image, this difference shows the error
image or the noise distribution and intensity.
10
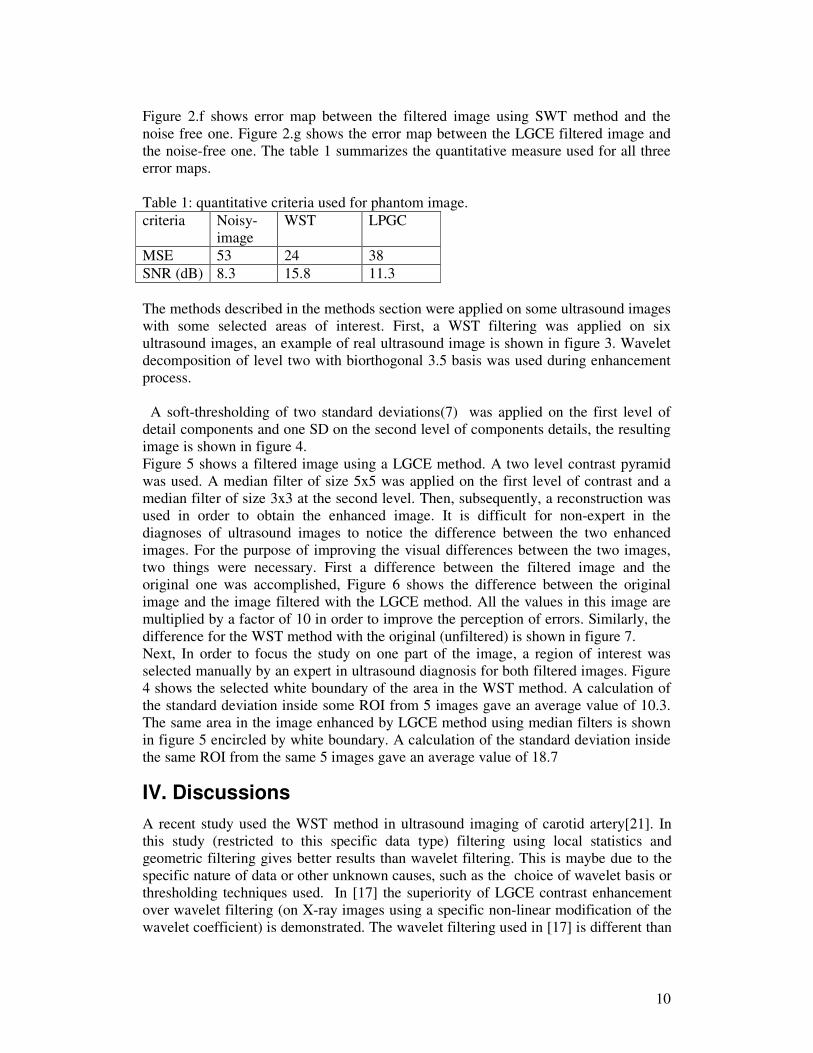
Figure 2.f shows error map between the filtered image using SWT method and the
noise free one. Figure 2.g shows the error map between the LGCE filtered image and
the noise-free one. The table 1 summarizes the quantitative measure used for all three
error maps.
Table 1: quantitative criteria used for phantom image.
criteria Noisy-
image
WST LPGC
MSE 53 24 38
SNR (dB) 8.3 15.8 11.3
The methods described in the methods section were applied on some ultrasound images
with some selected areas of interest. First, a WST filtering was applied on six
ultrasound images, an example of real ultrasound image is shown in figure 3. Wavelet
decomposition of level two with biorthogonal 3.5 basis was used during enhancement
process.
A soft-thresholding of two standard deviations(7) was applied on the first level of
detail components and one SD on the second level of components details, the resulting
image is shown in figure 4.
Figure 5 shows a filtered image using a LGCE method. A two level contrast pyramid
was used. A median filter of size 5x5 was applied on the first level of contrast and a
median filter of size 3x3 at the second level. Then, subsequently, a reconstruction was
used in order to obtain the enhanced image. It is difficult for non-expert in the
diagnoses of ultrasound images to notice the difference between the two enhanced
images. For the purpose of improving the visual differences between the two images,
two things were necessary. First a difference between the filtered image and the
original one was accomplished, Figure 6 shows the difference between the original
image and the image filtered with the LGCE method. All the values in this image are
multiplied by a factor of 10 in order to improve the perception of errors. Similarly, the
difference for the WST method with the original (unfiltered) is shown in figure 7.
Next, In order to focus the study on one part of the image, a region of interest was
selected manually by an expert in ultrasound diagnosis for both filtered images. Figure
4 shows the selected white boundary of the area in the WST method. A calculation of
the standard deviation inside some ROI from 5 images gave an average value of 10.3.
The same area in the image enhanced by LGCE method using median filters is shown
in figure 5 encircled by white boundary. A calculation of the standard deviation inside
the same ROI from the same 5 images gave an average value of 18.7
IV. Discussions
A recent study used the WST method in ultrasound imaging of carotid artery[21]. In
this study (restricted to this specific data type) filtering using local statistics and
geometric filtering gives better results than wavelet filtering. This is maybe due to the
specific nature of data or other unknown causes, such as the choice of wavelet basis or
thresholding techniques used. In [17] the superiority of LGCE contrast enhancement
over wavelet filtering (on X-ray images using a specific non-linear modification of the
wavelet coefficient) is demonstrated. The wavelet filtering used in [17] is different than

11
soft-thresholding techniques this may explain the result. A large amount of work in
despeckling ultrasound images [7,19,20] show the superiority of wavelet techniques
over others methods except the LGCE method which was not compared to WST
filtering on ultrasound images. Recently in [7] a study on ultrasound images confirmed
the superiority of WST over some other well known multiplicative noise filtering
methods. Here in this paper the study focus on comparing SWT and LGCE on
ultrasound images. It is very difficult to compare two methods for removing speckle
from real ultrasound images, because it dependent of what we need from such an
image. For small details it is not obvious to a non-expert in the diagnoses of ultrasound
images to know what we need to eliminate or to preserve and enhance. Some of the
statistical measurements such as SNR or RMSE (root mean square error) are not very
significant in the case of real ultrasound images if they are applied to the whole image
without a prior knowledge of the image. Such measurements could be efficient in the
case of simulated images.
In this paper a region of interest was chosen inside the real image in order to aid in the
assessment of filtering for the purpose of visual quality assessment. The best filtering
should give the best homogeneity inside the region; the internal variation should be the
minimum, while preserving the boundary. Another way to analyze the effect of filters is
to study the error image between the original image and the filtered one. The error
image is calculated here by the absolute difference between the two images. The
distribution of information inside the error image provides a qualitative indication about
the filtering method. If the information is randomly distributed, generally similar to
speckle distribution, this indicates that the extracted information from the original
image is non-structured and may be considered to be mainly noise. If there is some
structured information present in the error image, this indicates that some structured
information (boundaries or edges) is higher in one image than other. If the difference
between the original image and the filtered one proves that edges in the original are
higher in amplitude than the filtered one, this indicates that a smoothing of the edges
was obtained. If the opposite case happens, the indication is that a boosting of the edges
is present.
The error image concerning WST in figure 7, shows clearly that a random distribution
of information is present in this image, which is very similar to speckle distribution.
This error image presents a map distribution on every pixel in the image which much
better representation than mean square error or other, generally calculated on the whole
image, which is of quite small interest in this type of highly noisy data. This type of
error representation proves visually that the edges neither amplified nor damped and the
random distribution of noise shows that the filtering reduces mainly the speckle.
The error image in figure 6, concerning the LGCE, shows that some structures (edges)
and non-structures (mainly noise) information are amplified in this image. This is due
to the boosting of local strong variation without taking into account the directionality as
in wavelets. This qualitative assessment shows that WST is better adapted to ultrasound
images.
Another criterion used in order to assess the quality of enhancement is the standard
deviation inside the selected ROI. This criterion shows that the variation inside the ROI
is lower in the WST enhanced image than the variation in the LGCE enhanced image.
Furthermore, the quality of contours is better in the wavelet method as experts notice.
The results show that enhancement based on wavelets are superior to those based on the
LGCE.

12
V. Conclusions In this paper two multi-scale methods were tested and compared for enhancing visual
quality of ultrasound images. Those methods were proven to be very efficient to treat
multiplicative noise and reduce speckle in ultrasound and in SAR images. Several
studies prove that WST was among the best methods for ultrasound images. The LGCE
method using median filtering was applied recently on ultrasound images and proves to
give very good results. To date, WST and LGCE have not been compared to each other
using ultrasound images where a lot of variation exists in the background. The overall
quantitative assessment in terms of homogeneity inside the ROI, contour preservation
and error distribution indicated that WST provided a better overall improvement for
visual display.
A qualitative assessment of few ultrasound images performed by a diagnosis expert
(using some areas of interest) confirms that the WST method shows a much better
visual enhancement than LGCE one. This conclusion demonstrates that results
obtained in ultrasound images are not valid for X-ray and vice versa.
This study proves that wavelet filtering using soft-thresholding is an excellent tool for
visual enhancement of digital ultrasound images, which certainly helps for better
diagnosis. Further work is needed to evaluate the suggested method as a preprocessing
step to unsupervised segmentation of ultrasound images.
References
1.Godman J.W. (1976) Some fundamental properties of speckle, JOSA, 66, 11.
2. Tur and al. (1982) When Speckle is multiplicative, Applied Optics vol. 21, No. 7.
3a. Hillery D. et al. (1991) Iterative wiener filters for images restoration. IEEE Transaction on Signal
Processing, 39, pp.1892-1899.
4. Frost VS et al. (1982) A model for radar images and its application to adaptive digital filtering of
multiplicative noise. IEEE Transaction Pattern Analysis and Machine Intelligence, 4-2. pp. 157-166.
5.Unser M and Aldroubi (1996) A review of wavelets in biomedical applications. Proceeding IEEE, 84,
pp. 626-638.
6. Saad A , Elassad S. Barba D. (1996) Speckle filtering in SAR images by contrast modification,
comparison with a large class of filters. Annals de telecommunication, 51, 5, pp. 233-244.
7. Michailovich O., Tannenbaum A., (2006) Despeckling of ultrasound images, IEEE Trans.
Ultrasounics Ferroelectrics and Frequency Control, Vol. 53, no. 1 pp. 64-78.
8. Frost V.S, (1982) A model for radar images and its application to adaptive digital filtering of
multiplicative noise, IEEE Trans. On PAMI Vol. 4, No. 2.
9.Touzi R. , Analyse d'image radar en teledetection: Amelioration radiometriques filtrage de speckle et
detections des contours, Ph.D Thesis University Paul Sabatier Toulouse France Mars 1988.
10. J. S. Lee (1981) Speckle analysis and filtering smoothing of synthetic aperture radar image",
computer Graphics and image processing, No. 17, pp24-32,
11. J. S. Lee, (1980), Digital image enhancement and noise filtering by use of local statistics, IEEE
Trans. On PAMI Vol. 2, No 2,pp 165-168 .
12. J. S. Lee, (1983), A simple smoothing algorithm for SAR images, IEEE Trans. On Systems, Man
Cybernetics, Vol. SMC-13, No. 1. pp. 85-89.
13. P. Zamperoni, (1993), An adaptive rank order filter for image enhancement depending on a measure
of local spatial order, GRETSI , France, pp. 543-547.
14 . Mallat S and Zhang S. (1992) Characterization of signals from multiscale edges. IEEE Transaction
on Pattern Analysis Machine Intelligence, 14, 710-732.
13
15. Vuylsteke P and Schoeters E (1994) Multiscale image contrast amplification (MUSICATM).
Proceeding SPIE image processing, vol. 2167, pp.551-560.
16. Laine A, Fan J. and Yang W. (1995) Wavelets for contrast enhancement of digital mammography.
IEEE Engineering on Medical Biology and Magnetism, 14, pp.536-574.
17. Dippel S, Stahl M, Wiemker R, Blaffert T. (2002) Multiscale contrast Enhancement for
radiographies: Lapacian pyramid versus Fast wavelet Transform. IEEE Transaction on Medical Imaging
21, 4, pp: 343-353.
18. Achim A, Bezerianos A, and Tsakalides P. (2001) Novel Bayesian Multiscale Method for Speckle
Removal in Medical Ultrasound Images. IEEE Transaction on Medical Imaging, 20, 8.
19. Pizurica A, Philips W, Lemahieu I, and Acheroy M (2003) A Versatile Wavelet Domain Noise
Filtration Technique for Medical Imaging. IEEE Transaction on Medical Imaging, 22, 3, pp.323–331.
20. Zong X., Laine A., and Geiser E. (1998) Speckle Reduction and Contrast Enhancement of
echocardiograms via Multiscale Nonlinear Processing, Transaction on Medical Imaging.,17, 4, pp.532-
540.
21. Loizou CP, Pattichis CS, Christodoulou CI, Istepanian RSH, Pantziaris M, Nicolaides A (2005)
Comparative evaluation of despeckle filtering in ultrasound imaging of the carotid artery. IEEE Trans
Ultras Ferroel Freq Control 52(10):653–669.
22a. Donoho D. (1995) De-noising by soft thresholding. IEEE Transcation on Information Theory, 41,
pp. 613-621.
23. Saad A, Zaart A. and Al-Mejrad A., (2004) Speckle Reduction in Digital Ultrasound Images by
Multi-Resolution Contrast Enhancement. International Conference on Biomedical Engineering 2004,
IFMBE, BioMed, Kuala Lumpur, Malaysia.
24. Wang Z, Bovik A, Sheikh H, Simoncelli E (2004) Image quality assessment: from error measurement
to structural similarity. IEEE Trans Imag Process 13(4):600–612.
25. C.P. Loizou, C.S. Pattichis, M. Pantziaris, T. Tyllis, A. Nicolaides, (2006) Quantitative quality
evaluation of ultrasound imaging in the carotid artery," Med. Biol. Eng.& Comput., vol. 44, no. 5, pp.
414-426.
26. Jain A. K., (1989) Fundamental of Digital Image Processing. Englewood Cliffs, NJ: Prentice-Hall.
27. Zong X., A. F. Laine, and E. A. Geiser, (1998)Speckle reduction and contrast enhancement of
echocardiograms via multiscale nonlinear processing,” IEEE Trans. Med. Imag., vol. 17, pp. 532–540.
28. Achim A., Bezerianos A., and Tsakalides P., (2001) Novel Bayesian multiscale method for speckle
removal in medical ultrasound images,” IEEE Trans. Med. Imag., vol. 20, pp. 772–783.
29. Loupas T, McDicken WN, Allan PL (1989) An adaptive weighted median filter for speckle
suppression in medical ultrasonic images. IEEE Trans Circuits Syst 36:129–135.
30. Hao X., Gao S., and Gao X., (1999) A novel multiscale nonlinear thresholding method for ultrasound
speckle suppressing,” IEEE Trans. Med. Imag., vol. 18, pp. 787–794.
31. A. Rakotomamonjy, P. Deforge, and P. Marche, (2000) Wavelet-based speckle noise reduction in
ultrasound B-scan images,” Ultrason. Imag., vol. 22, pp. 73–94.
32. Strang G, Nguyen T (1997) Wavelets and Filter Banks. Wellesley - Cambridge Press, UK.
33.Meyer Y (1993) Wavelets and operators. Cambridge press, UK.
34. Daubechies I. (1992), Ten lectures on wavelets: SIAM,.
35.Vetterli M. and Herely C., (1992) Wavelets and filter banks: theory and design, Transactions on
signal processing, vol. 40, pp. 2207-2232.
36. Beylkin G., Coifman R., and Rokhlin V. (1991) Fast Wavelet transforms and numerical algorithms,
Communication of Pure Application. Math., vol. 44, pp. 141-183.
37. F. Luisiera, T. Blua, B. Forsterb and M, Unser, (2005) Which wavelet bases are the best for image
denoising ?, Proceedings of the SPIE Optics and Photonics, Conference on Mathematical Methods:
Wavelet XI, San Diego CA, USA, July 31-August 3, , vol. 5914, pp. 1-12.
38. Abu-Rezq A.N, Tolba A. S, Khuwaja G A, S.G. Foda (1999) Best Parameters selection for Wavelet-
packet-Based compression of Magnetic Resonance Images , Computer and biomedical research 32, pp:
449-469.
39. Cohen A, Daubechies I, Feauveau JC (1992) Bi-orthogonal Bases of Compactly supported Wavelets.
Communication on Pure Application Mathematic, 45, pp. 485-560.
40. Phoong S-M, Kim CW, Vaidyanathan PP and Ansari R. (1997) A new class of two-channel bi-
orthogonal filter banks and wavelets bases. IEEE Trans. on Signal Processing, 43, pp. 649-665.
41. Turcajova J. and Kautsky R. (1995) Discrete Biorthogonal Wavelet transform as block circulant
matrices, Linear Algebra and its Application, vol. 223, pp. 393-413.

14
42. Muller P.and Vidakovic B., (1999) Eds. Bayesian Inference in Wavelet Based Models, Lecture
Notes in Statistics. vol. 141, New York: Springer-Verlag,.
43. F. Sattar, L. Floreby, G. Salomonsson and B. Lovstrom, (1997) Image enhancement based on a
nonlinear multiscale method,” IEEE Trans. Image Proc., vol. 6, no. 6, pp. 888–895.
Figure 1. An example showing wavelet decomposition of level 2 using bi-orthogonal bases.
Figure 2. Synthetic image used to show the quality of filters used in this study.
2a. a noise free synthetic image.
2b. synthetic image after noise multiplication.
2c. filtering of 2b by WST method.
2d. filtering of 2b by LGCE method.
2e. error map between the noisy image and the noise free one.
2f. shows the error map between 2a and 2c.
2g. shows the error map between 2a and 2d.
Figure 3. Example of real ultrasound image used for processing.
Figure 4. Result of the wavelet soft thresholding method applied to a
Real ultrasound image.
Figure 5. Result of the multi-resolution contrast enhancement method applied to a real ultrasound image.
Figure 6. This figure shows the image difference between Laplace-Gauss contrast image and the
original.
Figure 7. This figure shows the image difference between the wavelet
filtered image and the original.
Related Documents