PLATTSVILLE RELO CT 5151 PARK AVENUE FAIRFIELD, CT 06825 Prepared in April 2020 by: All-Points Technology Corporation, P.C. 567 Vauxhall Street Extension – Suite 311 Waterford, CT 06385 Prepared for Verizon Wireless Visual Assessment & Photo-Simulations

Welcome message from author
This document is posted to help you gain knowledge. Please leave a comment to let me know what you think about it! Share it to your friends and learn new things together.
Transcript

PLA
TTSV
ILLE
REL
O C
T51
51 P
ARK
AV
ENUE
FAIR
FIEL
D, C
T 06
825
Prep
ared
in A
pril 2
020
by:
All-
Poin
ts T
echn
olog
y C
orpo
ratio
n, P
.C.
567
Vau
xhal
l Stre
et E
xten
sion
– Su
ite 3
11W
ater
ford
, CT
0638
5
Prep
ared
for V
erizo
n W
irele
ssVisu
al A
sses
smen
t &
Phot
o-Si
mul
atio
ns
1
VISUAL ASSESSMENT & PHOTO-SIMULATIONS
Cellco Partnership, d/b/a Verizon Wireless is seeking approval for the development of a new wireless
communications facility (the “Facility”) at 5151 Park Avenue in Fairfield, Connecticut on the campus of
Sacred Heart University (“SHU” or the “University) (the “Host Property”). The Facility is being developed
to relocate existing Verizon Wireless equipment from a building located at 175 Jefferson Street on the
main campus of SHU. At the request of Verizon Wireless, All-Points Technology Corporation, P.C.
(“APT”) completed this assessment to evaluate the potential visual effects of the proposed Facility from
within a two-mile radius (the “Study Area”). The Study Area includes portions of the neighboring
municipalities of Easton (to the north and west), Trumbull (to the northeast), and Bridgeport (to the east
and southeast).
Project Undertaking
Verizon Wireless plans to construct the Facility in the northern portion of the Host Property (the “Site”),
west of a newly constructed SHU maintenance building. The Facility would include a 130-foot tall steel
monopole within an approximate 50-foot by 50-foot fenced equipment compound. The base of the Facility
would be constructed at an approximate elevation of 230 feet above mean sea level (“AMSL”). The
highest antenna platform would be installed so that the tops of the proposed panel antennas would
extend to a height of approximately 134 feet above ground level (“AGL”). Access would be provided over
an existing paved driveway that extends southward onto the Host Property from Jefferson Street and
terminates adjacent to the Site. Please refer to the design drawings prepared by Hudson Design Group,
LLC, Revision 0 dated February 11, 2020, provided under separate cover, for details regarding the
proposed installation.
Project Setting
The Host Property is located west of Park Avenue and south of Jefferson Street in the northeastern
portion of Fairfield. Fairchild Wheeler Golf Course borders the Host Property to the west and south. Notre
Dame Catholic High School is located across Jefferson Street north of the Site. The Merritt Parkway
(Connecticut State Route 15 or the “Parkway”), a National Scenic Byway listed on the National Register
of Historic Places, runs approximately 1,200 feet north of the Site. Exit 46 (egressed from the northbound
side) of the Parkway and an adjacent commuter lot are approximately 1,300 feet west of the Site. Land
use in the immediate vicinity also includes high density residentially-developed properties.
The topography within the majority of the Study Area consists of generally gently rolling terrain. Ground
elevations range from approximately 68 feet AMSL in the southwestern portion of the Study Area to
approximately 516 feet AMSL in the northwestern portion of the Study Area. Tree cover within the Study
Area (consisting of mixed deciduous hardwoods and conifers) occupies approximately 2,312 acres
(±28.75%) of the 8,042-acre Study Area.

2
Methodology
APT used the combination of a predictive computer model, in-field analysis, and a review of various data
sources to evaluate the visibility associated with the proposed Facility on both a quantitative and
qualitative basis. The predictive model provides a measurable assessment of visibility throughout the
entire Study Area, including private properties and other areas inaccessible for direct observations. The
in-field analyses consisted of raising a brightly-colored flag with a crane to the proposed monopole height
and field reconnaissance of the Study Area to record existing conditions, verify results of the model,
inventory seasonal and year-round view locations, and provide photographic documentation from publicly
accessible areas. A description of the procedures used in the analysis is provided below.
Preliminary Computer Modeling
To conduct this assessment, a predictive computer model was developed specifically for this project
using ESRI’s ArcMap GIS1 software and available GIS data. The predictive model incorporates Project
and Study Area-specific data, including the site location, its ground elevation and the proposed Facility
height, as well as the surrounding topography, existing vegetation, and structures (the primary features
that can block direct lines of sight).
A digital surface model (“DSM”), capturing both the natural and built features on the Earth’s surface, was
generated for the extent of the Study Area utilizing State of Connecticut 2016 LiDAR2 LAS3 data points.
LiDAR is a remote-sensing technology that develops elevation data by measuring the time it takes for
laser light to return from the surface to the instrument’s sensors. The varying reflectivity of objects also
means that the “returns” can be classified based on the characteristics of the reflected light, normally into
categories such as “bare earth,” “vegetation,” “road,” or “building.” Derived from the 2016 LiDAR data, the
LAS datasets contain the corresponding elevation point data and return classification values. The Study
Area DSM incorporates the first return LAS dataset values that are associated with the highest feature in
the landscape, typically a treetop, top of a building, and/or the highest point of other tall structures.
Once the DSM was generated, ESRI’s Viewshed Tool was utilized to identify locations within the Study
Area where the proposed Facility may be visible. ESRI’s Viewshed Tool predicts visibility by identifying
those cells4 within the DSM that can be seen from an observer location. Cells where visibility was
indicated were extracted and converted from a raster dataset to a polygon feature which was then
overlaid onto an aerial photograph and topographic base map. Since the DSM includes the highest
relative feature in the landscape, isolated “visible” cells are often indicated within heavily forested areas
(e.g., from the top of the highest tree) or on building rooftops during the initial processing. It is recognized
that these areas do not represent typical viewer locations and overstate visibility. As such, the resulting
polygon feature is further refined by extracting those areas. The viewshed results are also cross-checked
against the most current aerial photographs to assess whether significant changes (a new housing
development, for example) have occurred since the time the LiDAR-based LAS datasets were captured.
1 ArcMap is a Geographic Information System desktop application developed by the Environmental Systems Research Institute for
creating maps, performing spatial analysis, and managing geographic data. 2 Light Detection and Ranging
3 An LAS file is an industry-standard binary format for storing airborne LiDAR data. 4 Each DSM cell size is 1 square meter.
3
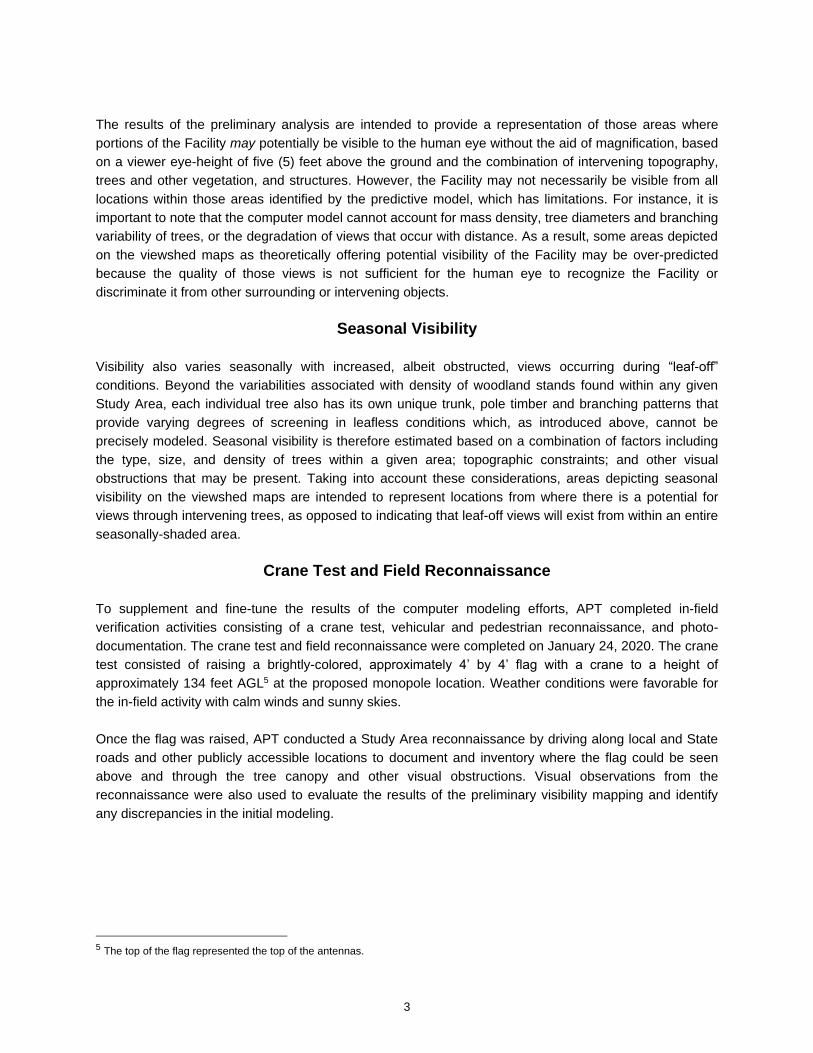
The results of the preliminary analysis are intended to provide a representation of those areas where
portions of the Facility may potentially be visible to the human eye without the aid of magnification, based
on a viewer eye-height of five (5) feet above the ground and the combination of intervening topography,
trees and other vegetation, and structures. However, the Facility may not necessarily be visible from all
locations within those areas identified by the predictive model, which has limitations. For instance, it is
important to note that the computer model cannot account for mass density, tree diameters and branching
variability of trees, or the degradation of views that occur with distance. As a result, some areas depicted
on the viewshed maps as theoretically offering potential visibility of the Facility may be over-predicted
because the quality of those views is not sufficient for the human eye to recognize the Facility or
discriminate it from other surrounding or intervening objects.
Seasonal Visibility
Visibility also varies seasonally with increased, albeit obstructed, views occurring during “leaf-off”
conditions. Beyond the variabilities associated with density of woodland stands found within any given
Study Area, each individual tree also has its own unique trunk, pole timber and branching patterns that
provide varying degrees of screening in leafless conditions which, as introduced above, cannot be
precisely modeled. Seasonal visibility is therefore estimated based on a combination of factors including
the type, size, and density of trees within a given area; topographic constraints; and other visual
obstructions that may be present. Taking into account these considerations, areas depicting seasonal
visibility on the viewshed maps are intended to represent locations from where there is a potential for
views through intervening trees, as opposed to indicating that leaf-off views will exist from within an entire
seasonally-shaded area.
Crane Test and Field Reconnaissance
To supplement and fine-tune the results of the computer modeling efforts, APT completed in-field
verification activities consisting of a crane test, vehicular and pedestrian reconnaissance, and photo-
documentation. The crane test and field reconnaissance were completed on January 24, 2020. The crane
test consisted of raising a brightly-colored, approximately 4’ by 4’ flag with a crane to a height of
approximately 134 feet AGL5 at the proposed monopole location. Weather conditions were favorable for
the in-field activity with calm winds and sunny skies.
Once the flag was raised, APT conducted a Study Area reconnaissance by driving along local and State
roads and other publicly accessible locations to document and inventory where the flag could be seen
above and through the tree canopy and other visual obstructions. Visual observations from the
reconnaissance were also used to evaluate the results of the preliminary visibility mapping and identify
any discrepancies in the initial modeling.
5 The top of the flag represented the top of the antennas.

4
Photographic Documentation and Simulations
During the Study Area reconnaissance, APT obtained photo-documentation of representative locations
where the flag was visible. At each photo location, the geographic coordinates of the camera’s position
were logged using global positioning system (“GPS”) technology. Photographs were taken with a Canon
EOS 6D digital camera body6 and Canon EF 24 to 105 millimeter (“mm”) zoom lens. APT typically uses a
standard focal length of 50mm to present a consistent field of view. On occasion, photos are taken at
lower focal lengths to provide a greater depth of field and to provide context to the scene by including
surrounding features within the photograph. During this evaluation, two (2) photographs were taken at a
24mm focal length and two (2) photographs were taken at a 35mm focal length as noted in the table
(Table 1 – Photo Locations) on the following pages.
Photographic simulations were generated to portray scaled renderings of the proposed Facility from
eighteen (18) locations presented herein where the Facility may be recognizable above or through the
trees.7 Using field data, site plan information and 3-dimensional (3D) modeling software, spatially
referenced models of the site and Facility were generated and merged. The geographic coordinates
obtained in the field for the photograph locations were incorporated into the model to produce virtual
camera positions within the spatial 3D model. Photo-simulations were then created using a combination
of renderings generated in the 3D model and photo-rendering software programs, which were ultimately
composited and merged with the existing conditions photographs (using Photoshop image editing
software). The scale of the subjects in the photograph (the flag) and the corresponding simulation (the
Facility) is proportional to their surroundings.
For presentation purposes in this report, the photographs were produced in an approximate 7-inch by
10.5-inch format. When reproducing the images in this format size, we believe it is important to present
the largest view while providing key contextual landscape elements (existing developments, street signs,
utility poles, etc.) so that the viewer can determine the proportionate scale of each object within the
scene. Photo-documentation of the field reconnaissance and photo-simulations of the proposed Facility
are presented in the attachment at the end of this report. The field reconnaissance photos that include the
flag in the view provide visual reference points for the approximate height and location of the proposed
Facility relative to the scene. All simulations were created to represent the proposed top antenna height of
134’ AGL. The photo-simulations are intended to provide the reader with a general understanding of the
different view characteristics associated with the Facility from various locations. Photographs were taken
from publicly-accessible areas and unobstructed view lines were chosen wherever possible.
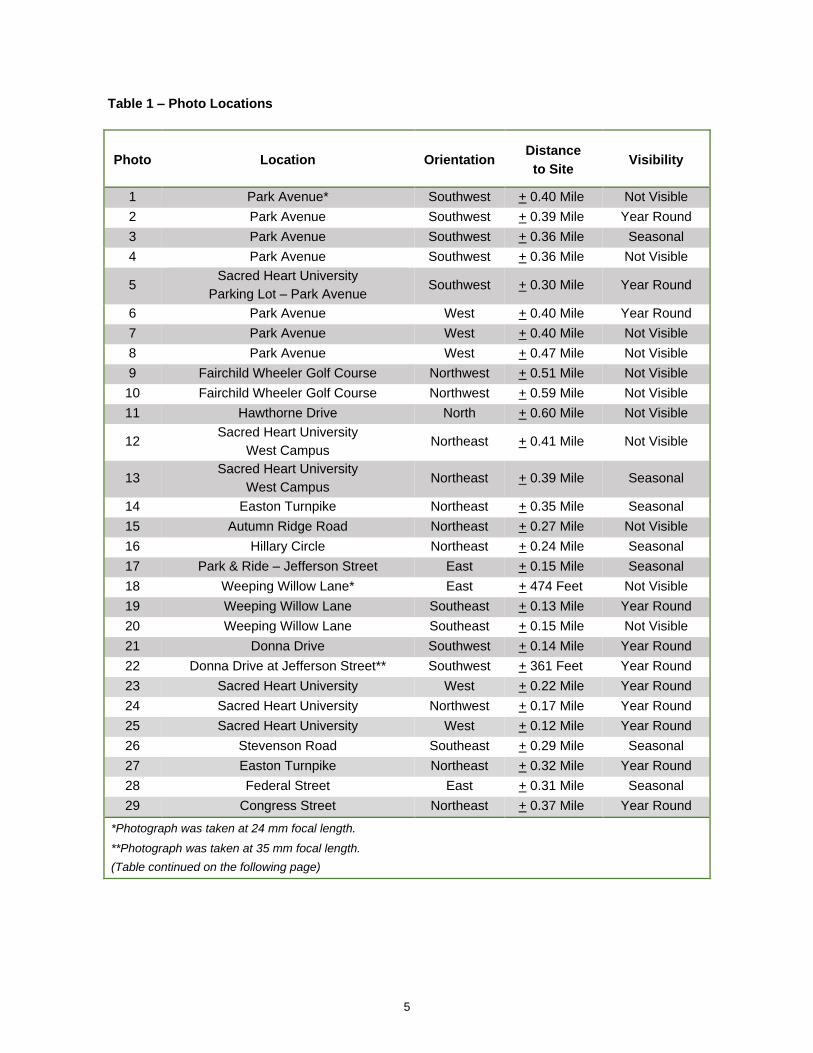
The following table summarizes the photographs and simulations presented in the attachment to this
report, and includes a description of each location, view orientation, distance from where the photo was
taken relative to the proposed Facility, and the general characteristics of the view. The photo locations
are depicted on the photolog and viewshed maps provided as attachments to this report.
6 The Canon EOS 6D is a full-framed camera which includes a lens receptor of the same size as the film used in 35mm cameras. As
such, the images produced are comparable to those taken with a conventional 35mm camera. 7 Photo-simulations were not created for all locations where seasonal views may be experienced due to the difficulty of accurately
representing the proposed Facility due to the nature of the tree cover between those locations and the proposed Facility.
5
Table 1 – Photo Locations
Photo Location Orientation Distance
to Site Visibility
1 Park Avenue* Southwest + 0.40 Mile Not Visible
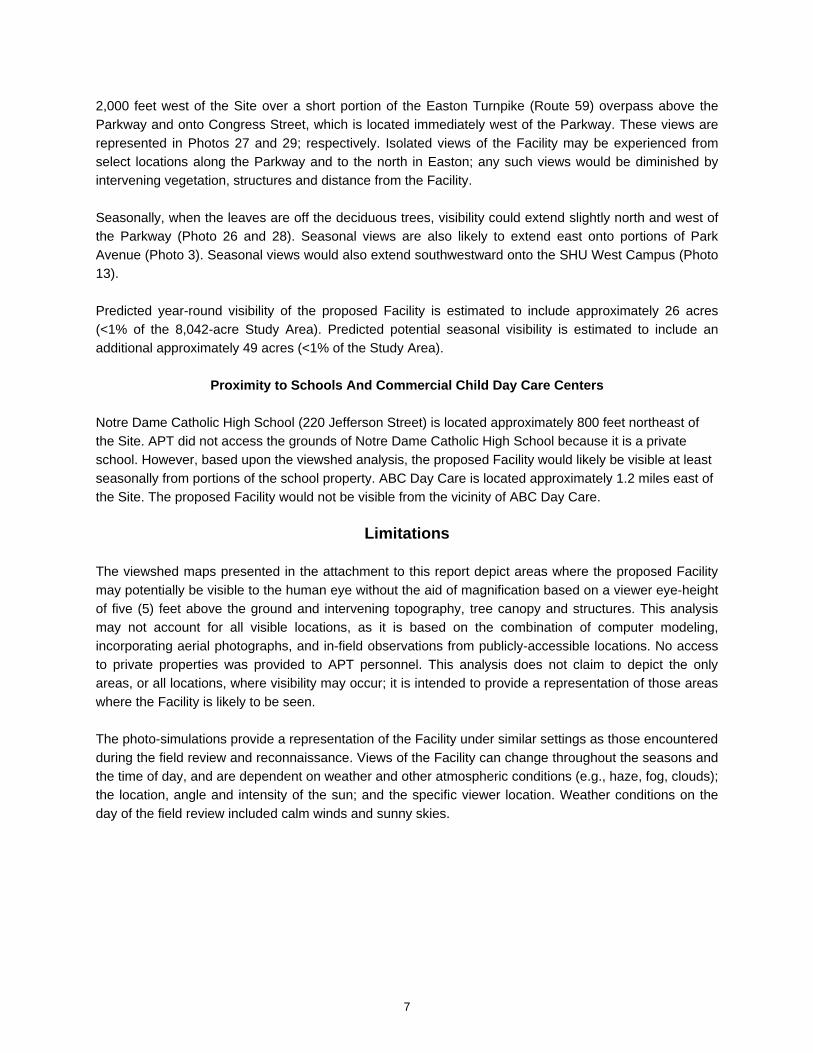
2 Park Avenue Southwest + 0.39 Mile Year Round
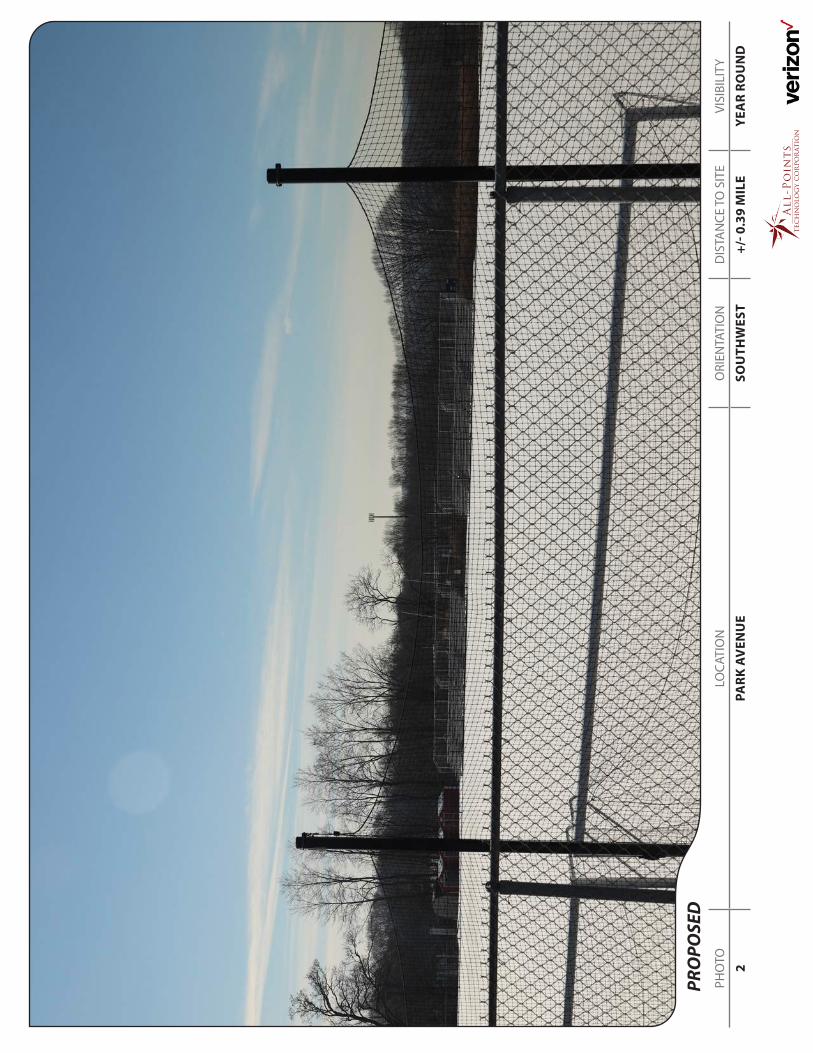
3 Park Avenue Southwest + 0.36 Mile Seasonal
4 Park Avenue Southwest + 0.36 Mile Not Visible
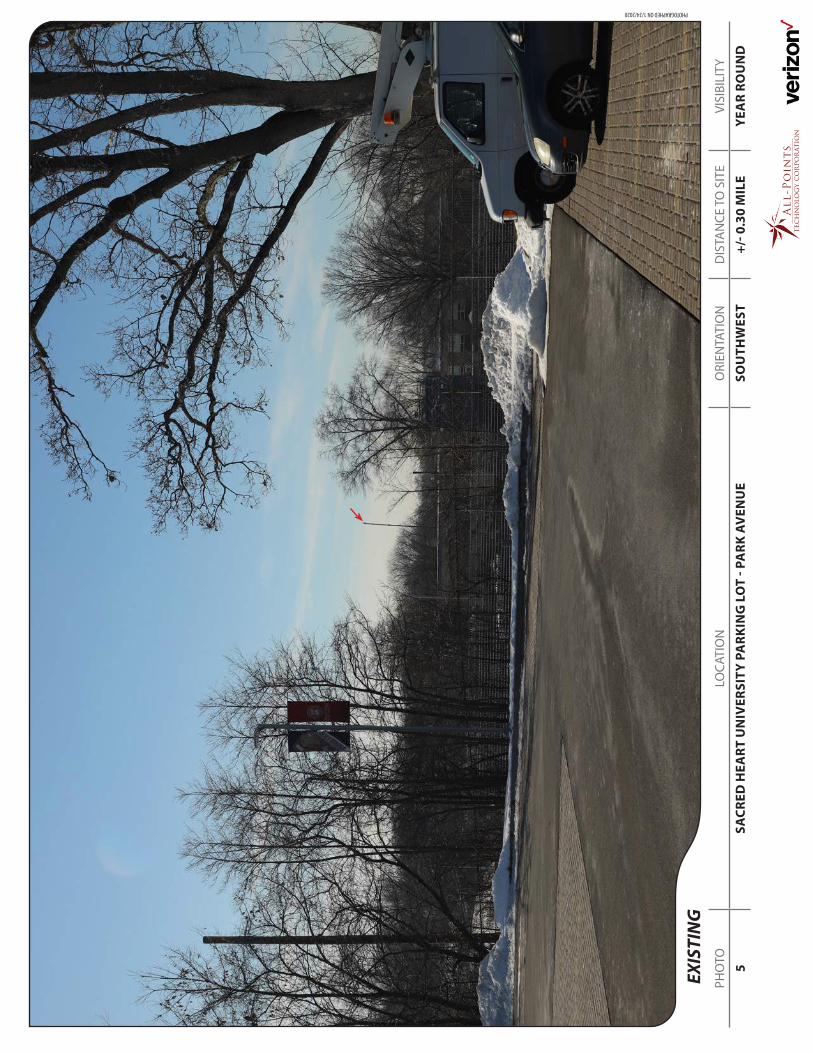
5 Sacred Heart University
Parking Lot – Park Avenue Southwest + 0.30 Mile Year Round
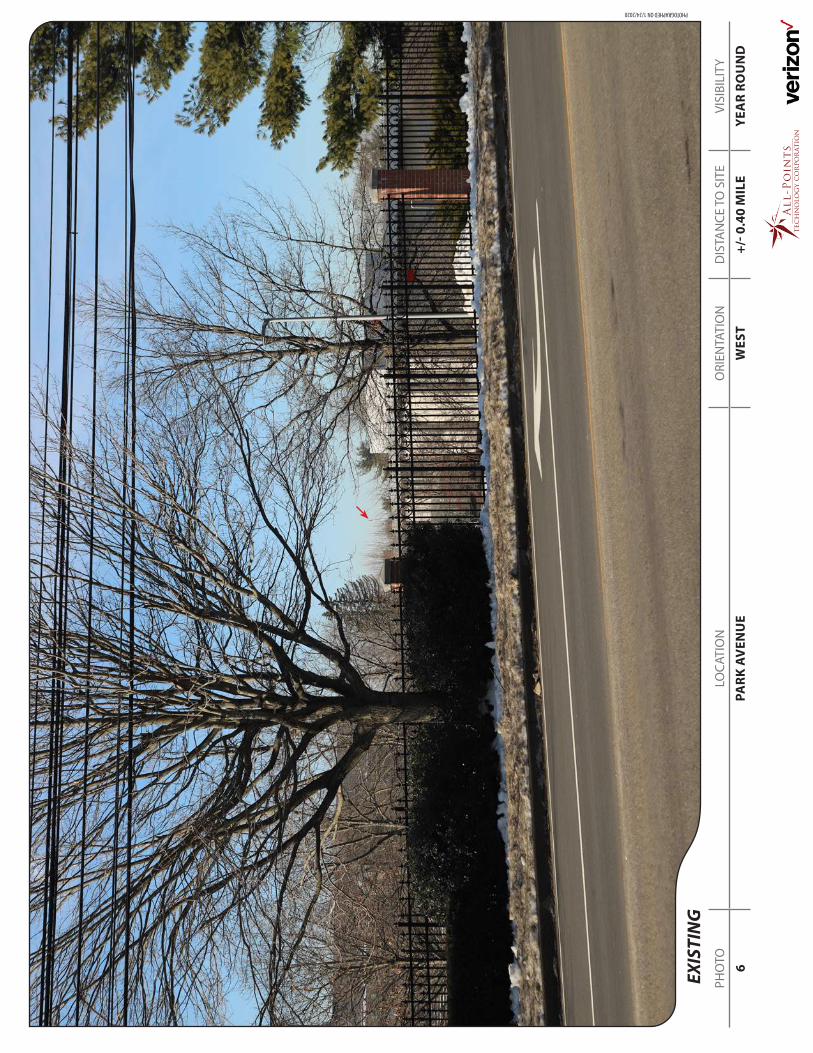
6 Park Avenue West + 0.40 Mile Year Round
7 Park Avenue West + 0.40 Mile Not Visible
8 Park Avenue West + 0.47 Mile Not Visible
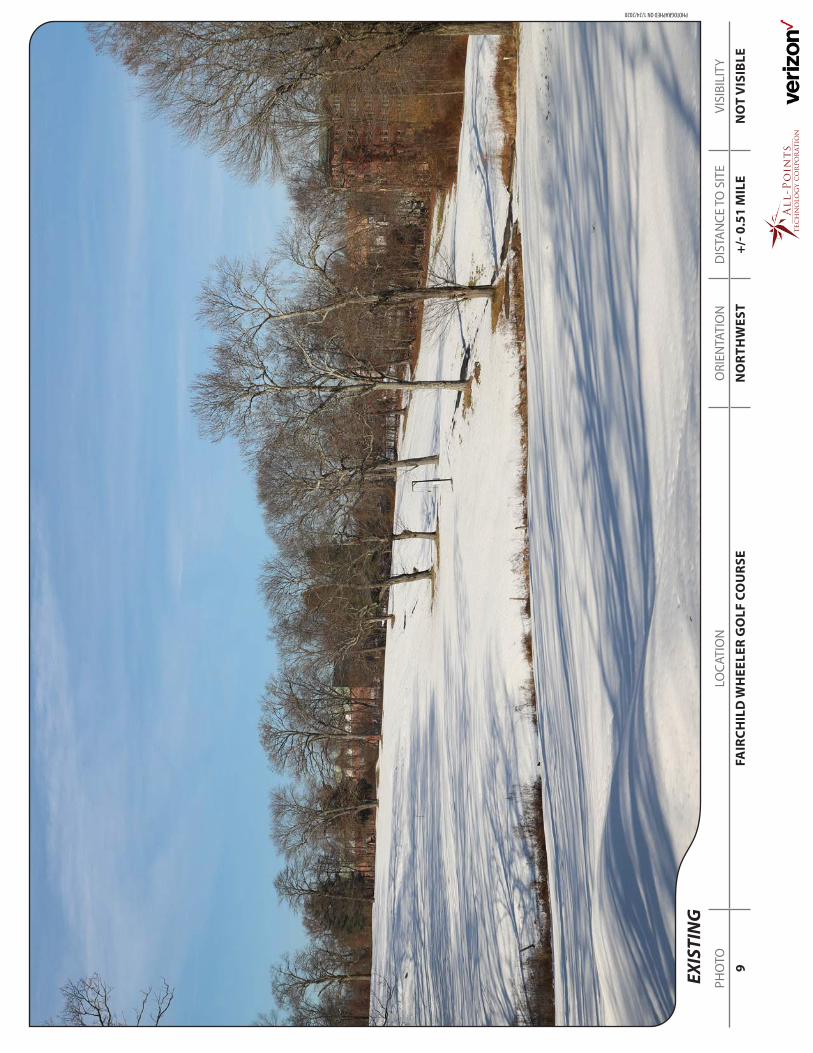
9 Fairchild Wheeler Golf Course Northwest + 0.51 Mile Not Visible
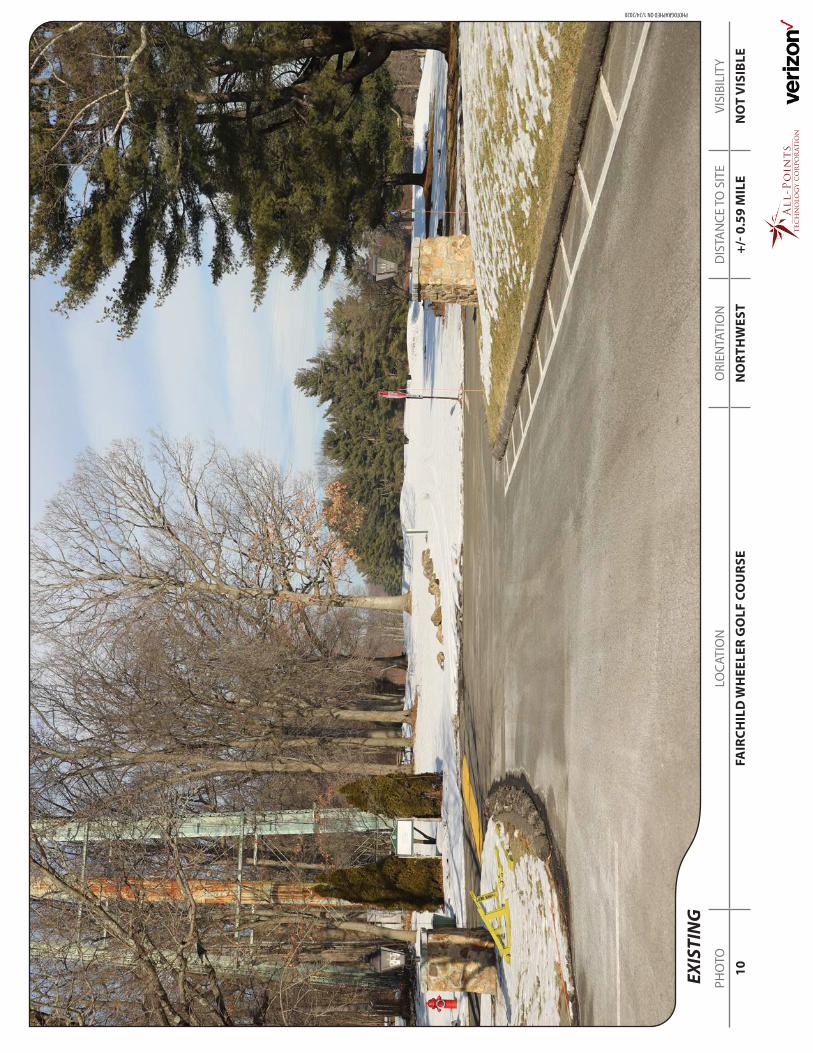
10 Fairchild Wheeler Golf Course Northwest + 0.59 Mile Not Visible
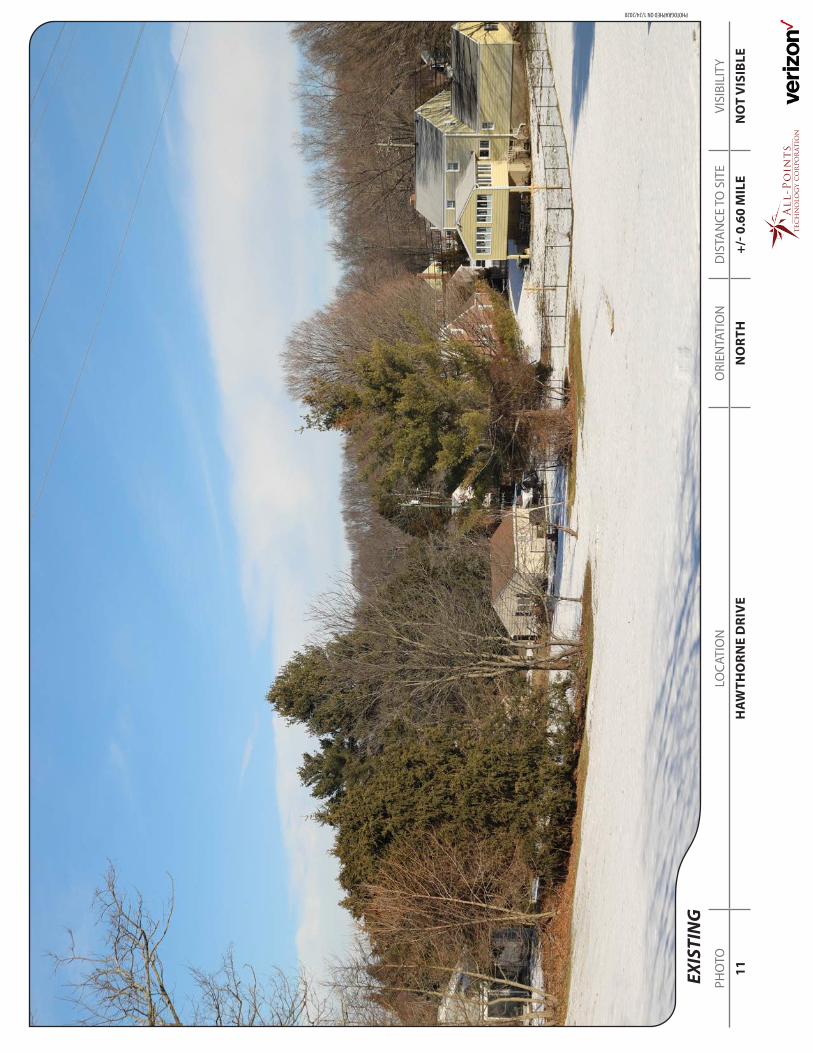
11 Hawthorne Drive North + 0.60 Mile Not Visible
12 Sacred Heart University
West Campus Northeast + 0.41 Mile Not Visible
13 Sacred Heart University
West Campus Northeast + 0.39 Mile Seasonal
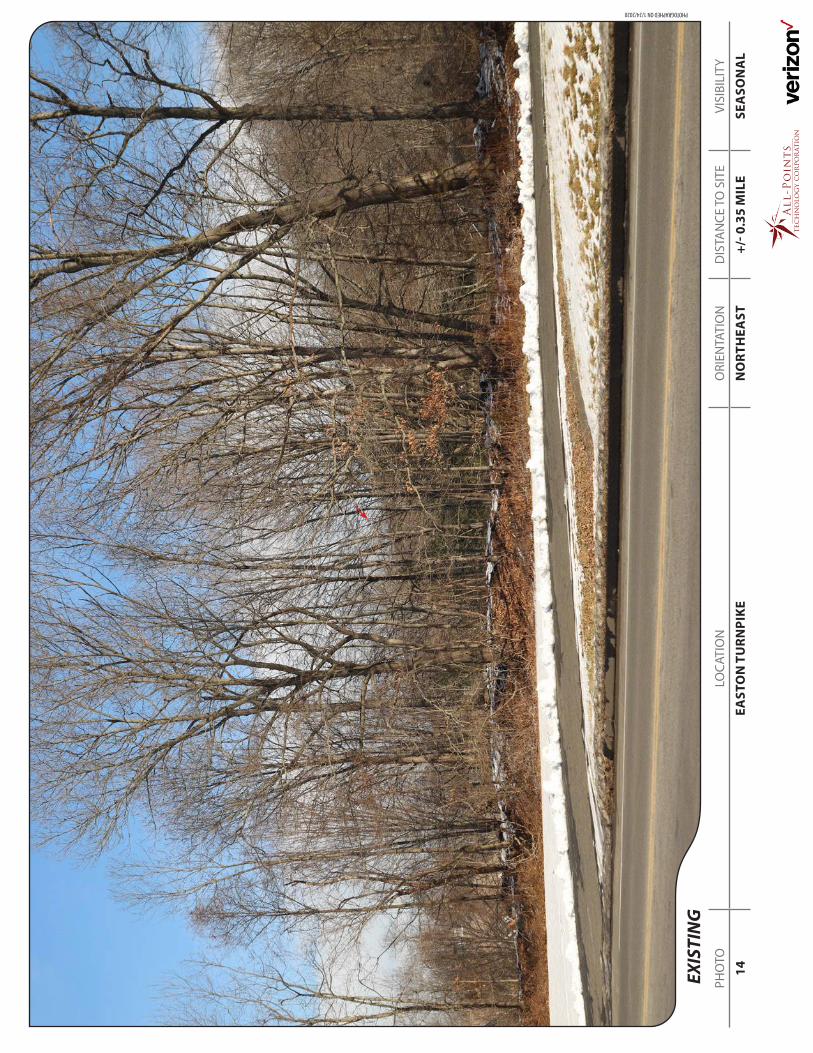
14 Easton Turnpike Northeast + 0.35 Mile Seasonal
15 Autumn Ridge Road Northeast + 0.27 Mile Not Visible
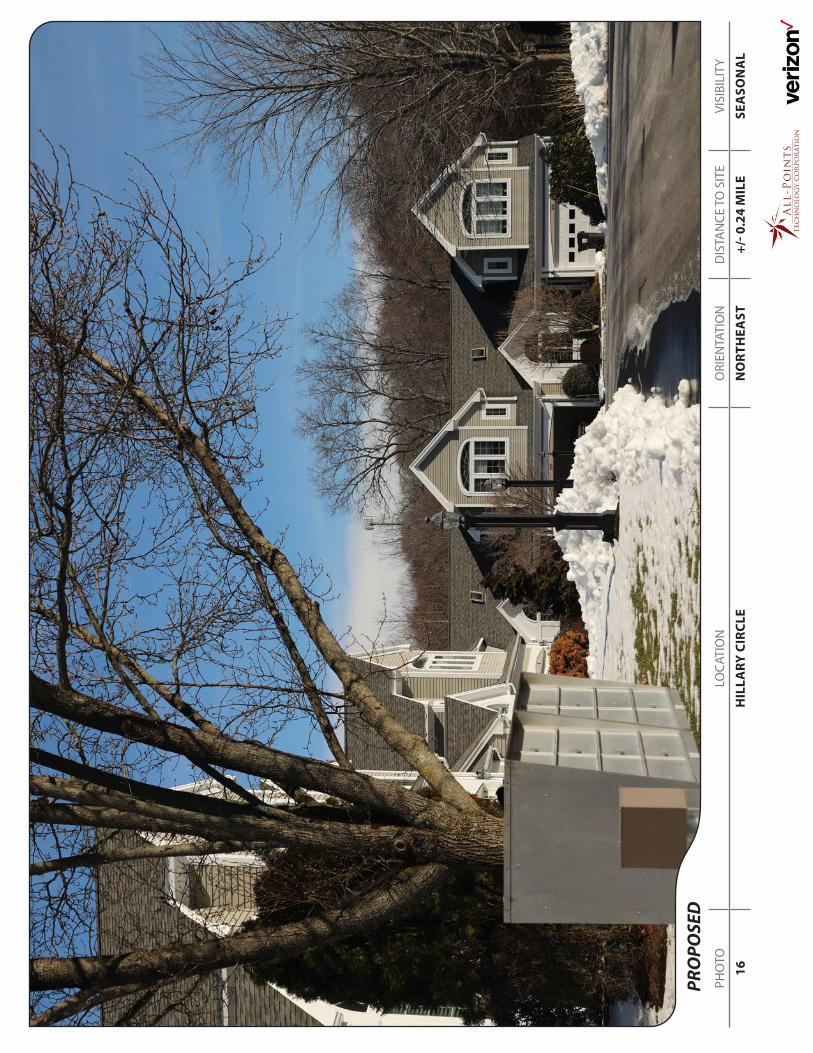
16 Hillary Circle Northeast + 0.24 Mile Seasonal
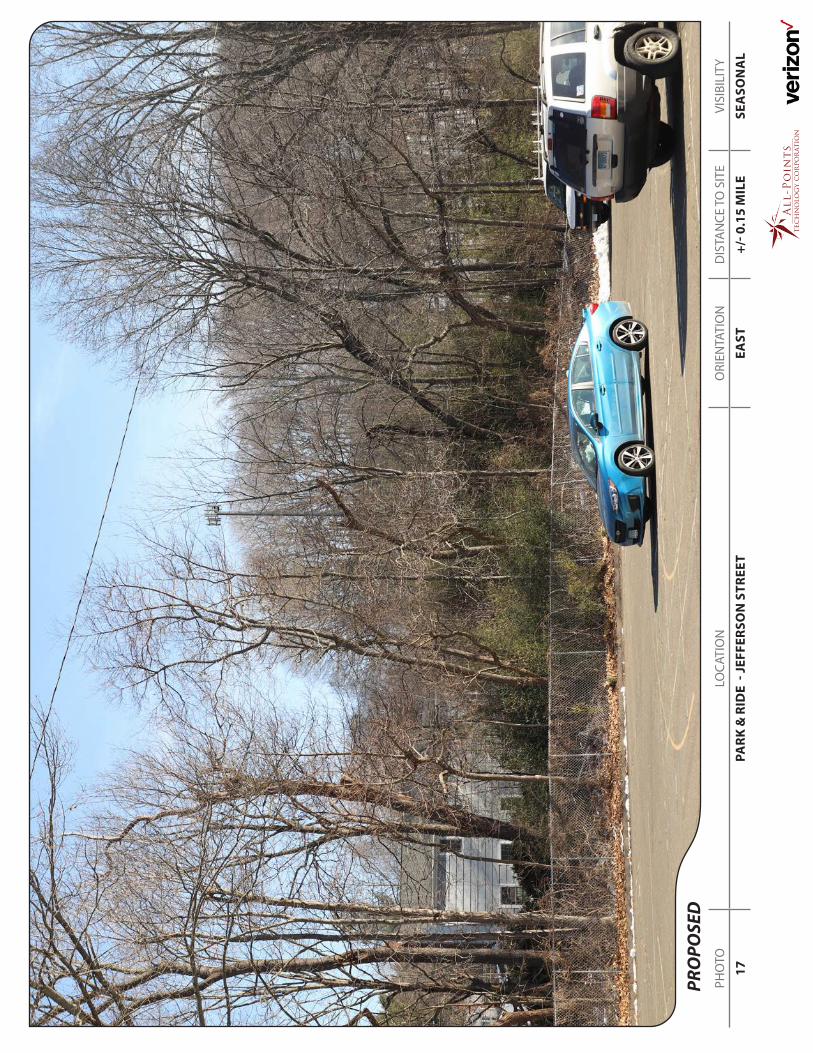
17 Park & Ride – Jefferson Street East + 0.15 Mile Seasonal
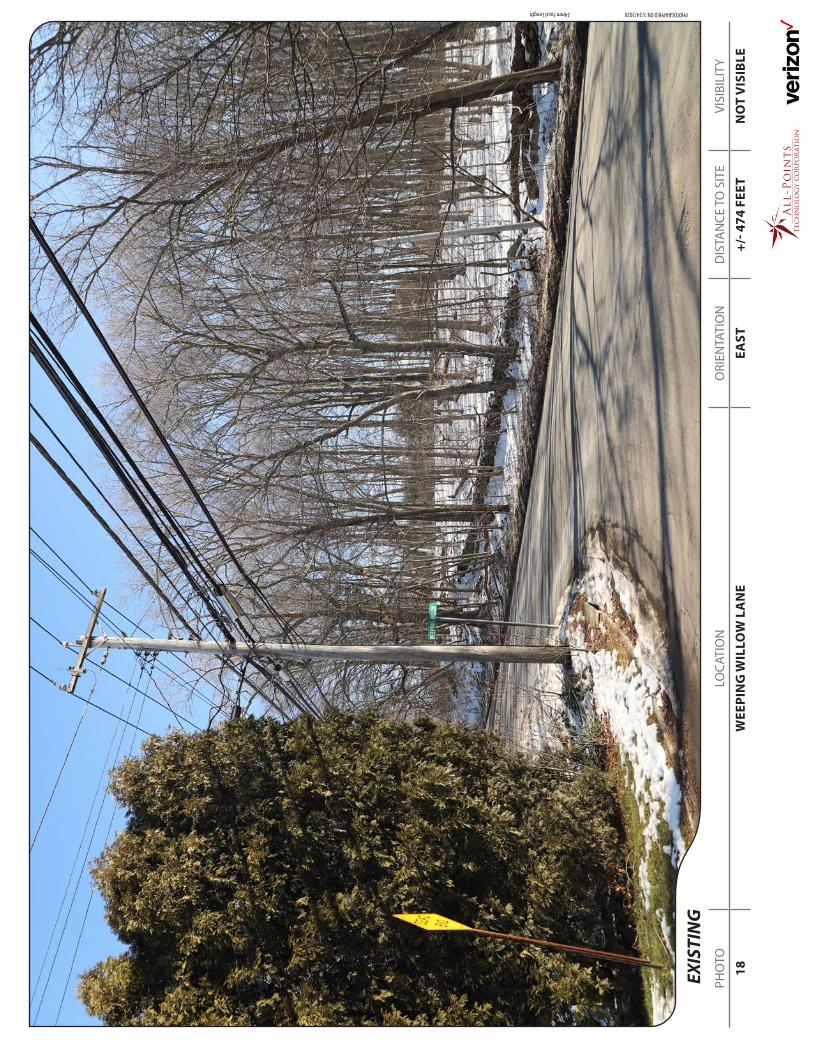
18 Weeping Willow Lane* East + 474 Feet Not Visible
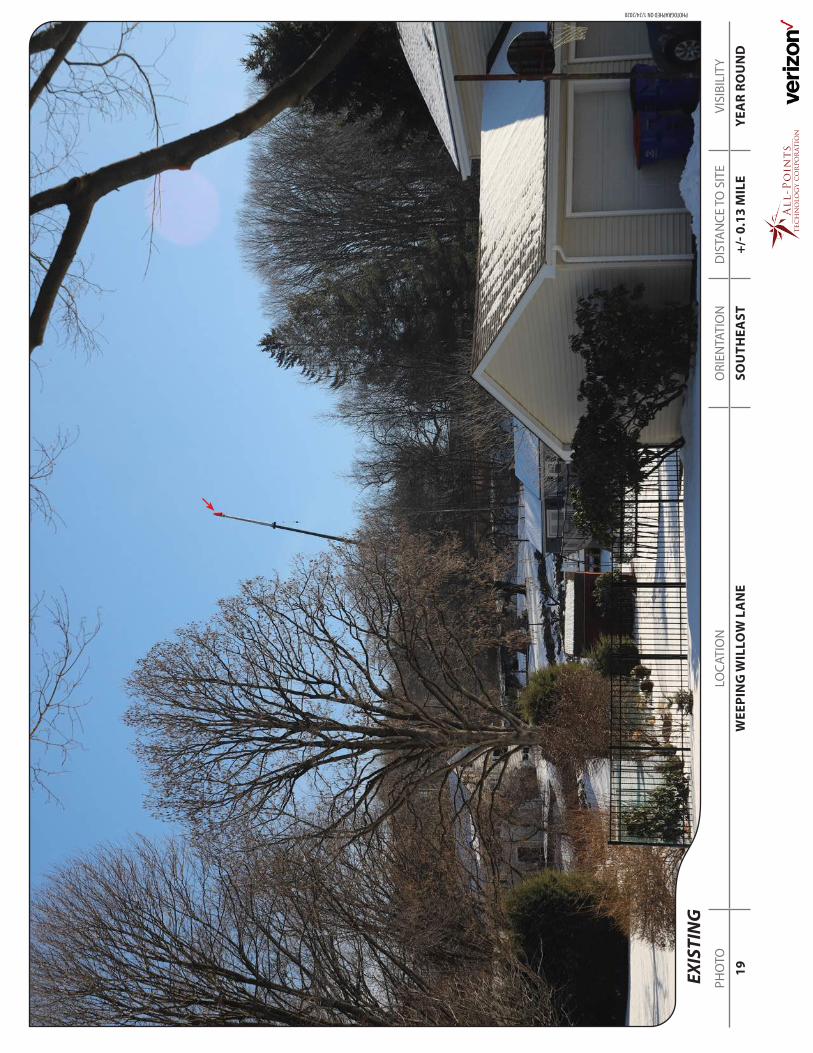
19 Weeping Willow Lane Southeast + 0.13 Mile Year Round
20 Weeping Willow Lane Southeast + 0.15 Mile Not Visible
21 Donna Drive Southwest + 0.14 Mile Year Round
22 Donna Drive at Jefferson Street** Southwest + 361 Feet Year Round
23 Sacred Heart University West + 0.22 Mile Year Round
24 Sacred Heart University Northwest + 0.17 Mile Year Round
25 Sacred Heart University West + 0.12 Mile Year Round
26 Stevenson Road Southeast + 0.29 Mile Seasonal
27 Easton Turnpike Northeast + 0.32 Mile Year Round
28 Federal Street East + 0.31 Mile Seasonal
29 Congress Street Northeast + 0.37 Mile Year Round
*Photograph was taken at 24 mm focal length.
**Photograph was taken at 35 mm focal length.
(Table continued on the following page)
6
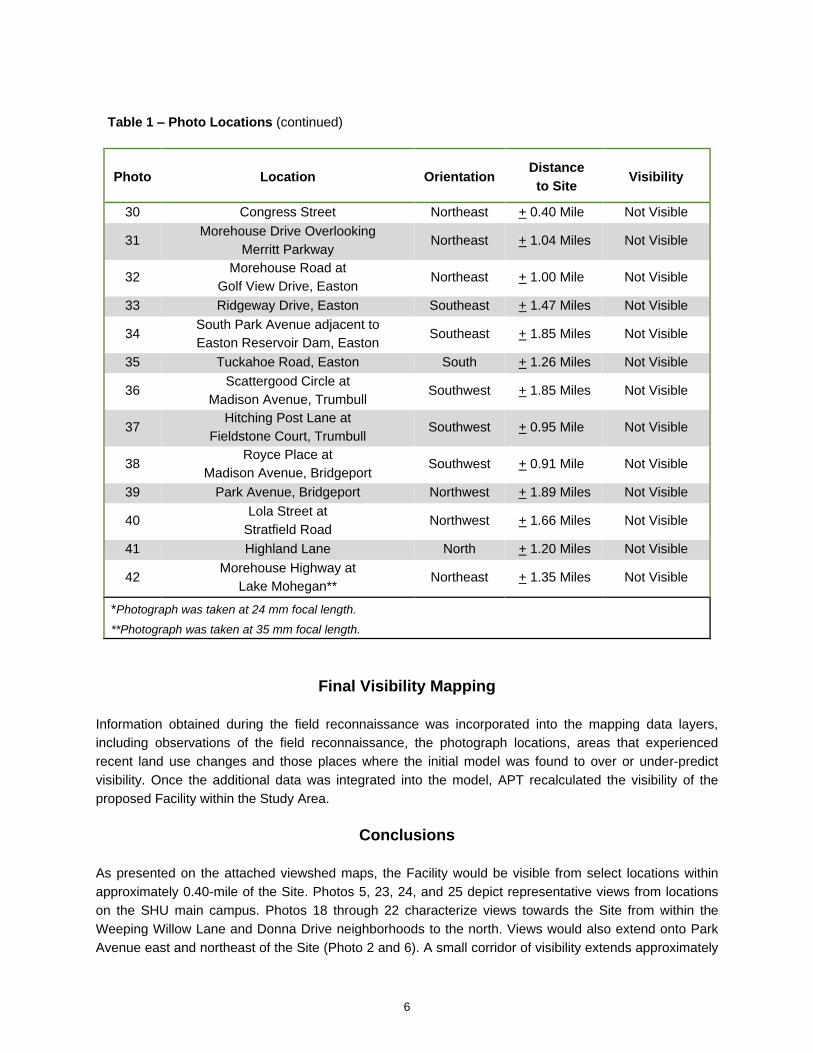
Table 1 – Photo Locations (continued)
Photo Location Orientation Distance
to Site Visibility
30 Congress Street Northeast + 0.40 Mile Not Visible
31 Morehouse Drive Overlooking
Merritt Parkway Northeast + 1.04 Miles Not Visible
32 Morehouse Road at
Golf View Drive, Easton Northeast + 1.00 Mile Not Visible
33 Ridgeway Drive, Easton Southeast + 1.47 Miles Not Visible
34 South Park Avenue adjacent to
Easton Reservoir Dam, Easton Southeast + 1.85 Miles Not Visible
35 Tuckahoe Road, Easton South + 1.26 Miles Not Visible
36 Scattergood Circle at
Madison Avenue, Trumbull Southwest + 1.85 Miles Not Visible
37 Hitching Post Lane at
Fieldstone Court, Trumbull Southwest + 0.95 Mile Not Visible
38 Royce Place at
Madison Avenue, Bridgeport Southwest + 0.91 Mile Not Visible
39 Park Avenue, Bridgeport Northwest + 1.89 Miles Not Visible
40 Lola Street at
Stratfield Road Northwest + 1.66 Miles Not Visible
41 Highland Lane North + 1.20 Miles Not Visible
42 Morehouse Highway at
Lake Mohegan** Northeast + 1.35 Miles Not Visible
*Photograph was taken at 24 mm focal length.
**Photograph was taken at 35 mm focal length.
Final Visibility Mapping
Information obtained during the field reconnaissance was incorporated into the mapping data layers,
including observations of the field reconnaissance, the photograph locations, areas that experienced
recent land use changes and those places where the initial model was found to over or under-predict
visibility. Once the additional data was integrated into the model, APT recalculated the visibility of the
proposed Facility within the Study Area.
Conclusions
As presented on the attached viewshed maps, the Facility would be visible from select locations within
approximately 0.40-mile of the Site. Photos 5, 23, 24, and 25 depict representative views from locations
on the SHU main campus. Photos 18 through 22 characterize views towards the Site from within the
Weeping Willow Lane and Donna Drive neighborhoods to the north. Views would also extend onto Park
Avenue east and northeast of the Site (Photo 2 and 6). A small corridor of visibility extends approximately
7
2,000 feet west of the Site over a short portion of the Easton Turnpike (Route 59) overpass above the
Parkway and onto Congress Street, which is located immediately west of the Parkway. These views are
represented in Photos 27 and 29; respectively. Isolated views of the Facility may be experienced from
select locations along the Parkway and to the north in Easton; any such views would be diminished by
intervening vegetation, structures and distance from the Facility.
Seasonally, when the leaves are off the deciduous trees, visibility could extend slightly north and west of
the Parkway (Photo 26 and 28). Seasonal views are also likely to extend east onto portions of Park
Avenue (Photo 3). Seasonal views would also extend southwestward onto the SHU West Campus (Photo
13).
Predicted year-round visibility of the proposed Facility is estimated to include approximately 26 acres
(<1% of the 8,042-acre Study Area). Predicted potential seasonal visibility is estimated to include an
additional approximately 49 acres (<1% of the Study Area).
Proximity to Schools And Commercial Child Day Care Centers
Notre Dame Catholic High School (220 Jefferson Street) is located approximately 800 feet northeast of
the Site. APT did not access the grounds of Notre Dame Catholic High School because it is a private
school. However, based upon the viewshed analysis, the proposed Facility would likely be visible at least
seasonally from portions of the school property. ABC Day Care is located approximately 1.2 miles east of
the Site. The proposed Facility would not be visible from the vicinity of ABC Day Care.
Limitations
The viewshed maps presented in the attachment to this report depict areas where the proposed Facility
may potentially be visible to the human eye without the aid of magnification based on a viewer eye-height
of five (5) feet above the ground and intervening topography, tree canopy and structures. This analysis
may not account for all visible locations, as it is based on the combination of computer modeling,
incorporating aerial photographs, and in-field observations from publicly-accessible locations. No access
to private properties was provided to APT personnel. This analysis does not claim to depict the only
areas, or all locations, where visibility may occur; it is intended to provide a representation of those areas
where the Facility is likely to be seen.
The photo-simulations provide a representation of the Facility under similar settings as those encountered
during the field review and reconnaissance. Views of the Facility can change throughout the seasons and
the time of day, and are dependent on weather and other atmospheric conditions (e.g., haze, fog, clouds);
the location, angle and intensity of the sun; and the specific viewer location. Weather conditions on the
day of the field review included calm winds and sunny skies.

ATTACHMENTS

!
!
!
!
!
!
!
!
!
!!
!
!
!
!
!
!
!!
!
! !
!
!
(
(
(
(
(
(
(
(
(
((
(
(
(
(
(
(
((
(
( (
(
(!
!
!! !
!
!(
(
(( (
(
(
!!
!!
! !
! !
!
!!
((
((
( (
( (
(
(("/
28
26
1921
2
5 24
23
226
2527
1416
13
17
3
33
34
35
36
37
38
39
40
10
98
7
32
31
41
3029
1115
12
18
1
4
20
42
East
onTr
umbu
ll
Fairf
ield
Brid
gepo
rt
Sour
ces:
Esr
i, H
ERE,
Gar
min
, Int
erm
ap, i
ncre
men
t P C
orp.
, GEB
CO
, USG
S, F
AO, N
PS,
NR
CAN
,G
eoB
ase,
IGN
, Kad
aste
r NL,
Ord
nanc
e Su
rvey
, Esr
i Jap
an, M
ETI,
Esri
Chi
na (H
ong
Kong
), (c
)O
penS
treet
Map
con
tribu
tors
, and
the
GIS
Use
r Com
mun
ity
Lege
nd
"/Si
te!(
Year
-Rou
nd!(
Seas
onal
!(N
ot V
isib
leM
unic
ipal
Bou
ndar
y
PHOT
O LO
G
2,70
00
2,70
01,
350
Feet
51
inch
= 2
,700
feet
Site

EXISTING
PHO
TOLO
CATI
ON
ORI
ENTA
TIO
ND
ISTA
NCE
TO
SIT
EVI
SIBI
LITY
1PA
RK A
VEN
UE
SOU
THW
EST
+/- 0
.40
MIL
EN
OT
VIS
IBLE
PHOTOGRAPHED ON 1/24/202024mm Focal Length

EXISTING
PHO
TOLO
CATI
ON
ORI
ENTA
TIO
ND
ISTA
NCE
TO
SIT
EVI
SIBI
LITY
2PA
RK A
VEN
UE
SOU
THW
EST
+/- 0
.39
MIL
EYE
AR
ROU
ND
PHOTOGRAPHED ON 1/24/2020
PROPO
SED
PHO
TOLO
CATI
ON
ORI
ENTA
TIO
ND
ISTA
NCE
TO
SIT
EVI
SIBI
LITY
2PA
RK A
VEN
UE
SOU
THW
EST
+/- 0
.39
MIL
EYE
AR
ROU
ND
EXISTING
PHO
TOLO
CATI
ON
ORI
ENTA
TIO
ND
ISTA
NCE
TO
SIT
EVI
SIBI
LITY
3PA
RK A
VEN
UE
SOU
THW
EST
+/- 0
.36
MIL
ESE
ASO
NA
L
PHOTOGRAPHED ON 1/24/2020

PROPO
SED
PHO
TOLO
CATI
ON
ORI
ENTA
TIO
ND
ISTA
NCE
TO
SIT
EVI
SIBI
LITY
3PA
RK A
VEN
UE
SOU
THW
EST
+/- 0
.36
MIL
ESE
ASO
NA
L

EXISTING
PHO
TOLO
CATI
ON
ORI
ENTA
TIO
ND
ISTA
NCE
TO
SIT
EVI
SIBI
LITY
4PA
RK A
VEN
UE
SOU
THW
EST
+/- 0
.36
MIL
EN
OT
VIS
IBLE
PHOTOGRAPHED ON 1/24/2020
EXISTING
PHO
TOLO
CATI
ON
ORI
ENTA
TIO
ND
ISTA
NCE
TO
SIT
EVI
SIBI
LITY
5SA
CRED
HEA
RT U
NIV
ERSI
TY P
ARK
ING
LO
T - P
ARK
AV
ENU
ESO
UTH
WES
T+/
- 0.3
0 M
ILE
YEA
R RO
UN
D
PHOTOGRAPHED ON 1/24/2020

PROPO
SED
PHO
TOLO
CATI
ON
ORI
ENTA
TIO
ND
ISTA
NCE
TO
SIT
EVI
SIBI
LITY
5SA
CRED
HEA
RT U
NIV
ERSI
TY P
ARK
ING
LO
T - P
ARK
AV
ENU
ESO
UTH
WES
T+/
- 0.3
0 M
ILE
YEA
R RO
UN
D
EXISTING
PHO
TOLO
CATI
ON
ORI
ENTA
TIO
ND
ISTA
NCE
TO
SIT
EVI
SIBI
LITY
6PA
RK A
VEN
UE
WES
T+/
- 0.4
0 M
ILE
YEA
R RO
UN
D
PHOTOGRAPHED ON 1/24/2020

PROPO
SED
PHO
TOLO
CATI
ON
ORI
ENTA
TIO
ND
ISTA
NCE
TO
SIT
EVI
SIBI
LITY
6PA
RK A
VEN
UE
WES
T+/
- 0.4
0 M
ILE
YEA
R RO
UN
D

EXISTING
PHO
TOLO
CATI
ON
ORI
ENTA
TIO
ND
ISTA
NCE
TO
SIT
EVI
SIBI
LITY
7PA
RK A
VEN
UE
WES
T+/
- 0.4
0 M
ILE
NO
T V
ISIB
LE
PHOTOGRAPHED ON 1/24/2020

EXISTING
PHO
TOLO
CATI
ON
ORI
ENTA
TIO
ND
ISTA
NCE
TO
SIT
EVI
SIBI
LITY
8PA
RK A
VEN
UE
WES
T+/
- 0.4
7 M
ILE
NO
T V
ISIB
LE
PHOTOGRAPHED ON 1/24/2020
EXISTING
PHO
TOLO
CATI
ON
ORI
ENTA
TIO
ND
ISTA
NCE
TO
SIT
EVI
SIBI
LITY
9FA
IRCH
ILD
WH
EELE
R G
OLF
CO
URS
EN
ORT
HW
EST
+/- 0
.51
MIL
EN
OT
VIS
IBLE
PHOTOGRAPHED ON 1/24/2020
EXISTING
PHO
TOLO
CATI
ON
ORI
ENTA
TIO
ND
ISTA
NCE
TO
SIT
EVI
SIBI
LITY
10FA
IRCH
ILD
WH
EELE
R G
OLF
CO
URS
EN
ORT
HW
EST
+/- 0
.59
MIL
EN
OT
VIS
IBLE
PHOTOGRAPHED ON 1/24/2020
EXISTING
PHO
TOLO
CATI
ON
ORI
ENTA
TIO
ND
ISTA
NCE
TO
SIT
EVI
SIBI
LITY
11H
AWTH
ORN
E D
RIV
EN
ORT
H+/
- 0.6
0 M
ILE
NO
T V
ISIB
LE
PHOTOGRAPHED ON 1/24/2020

EXISTING
PHO
TOLO
CATI
ON
ORI
ENTA
TIO
ND
ISTA
NCE
TO
SIT
EVI
SIBI
LITY
12SA
CRED
HEA
RT U
NIV
ERSI
TY W
EST
CA
MPU
SN
ORT
HEA
ST+/
- 0.4
1 M
ILE
NO
T V
ISIB
LE
PHOTOGRAPHED ON 1/24/2020

EXISTING
PHO
TOLO
CATI
ON
ORI
ENTA
TIO
ND
ISTA
NCE
TO
SIT
EVI
SIBI
LITY
13SA
CRED
HEA
RT U
NIV
ERSI
TY W
EST
CA
MPU
SN
ORT
HEA
ST+/
- 0.3
9 M
ILE
SEA
SON
AL
PHOTOGRAPHED ON 1/24/2020

PROPO
SED
PHO
TOLO
CATI
ON
ORI
ENTA
TIO
ND
ISTA
NCE
TO
SIT
EVI
SIBI
LITY
13SA
CRED
HEA
RT U
NIV
ERSI
TY W
EST
CA
MPU
SN
ORT
HEA
ST+/
- 0.3
9 M
ILE
SEA
SON
AL
EXISTING
PHO
TOLO
CATI
ON
ORI
ENTA
TIO
ND
ISTA
NCE
TO
SIT
EVI
SIBI
LITY
14EA
STO
N T
URN
PIK
EN
ORT
HEA
ST+/
- 0.3
5 M
ILE
SEA
SON
AL
PHOTOGRAPHED ON 1/24/2020

PROPO
SED
PHO
TOLO
CATI
ON
ORI
ENTA
TIO
ND
ISTA
NCE
TO
SIT
EVI
SIBI
LITY
14EA
STO
N T
URN
PIK
EN
ORT
HEA
ST+/
- 0.3
5 M
ILE
SEA
SON
AL

EXISTING
PHO
TOLO
CATI
ON
ORI
ENTA
TIO
ND
ISTA
NCE
TO
SIT
EVI
SIBI
LITY
15A
UTU
MN
RID
GE
ROA
DN
ORT
HEA
ST+/
- 0.2
7 M
ILE
NO
T V
ISIB
LE
PHOTOGRAPHED ON 1/24/2020

EXISTING
PHO
TOLO
CATI
ON
ORI
ENTA
TIO
ND
ISTA
NCE
TO
SIT
EVI
SIBI
LITY
16H
ILLA
RY C
IRCL
EN
ORT
HEA
ST+/
- 0.2
4 M
ILE
SEA
SON
AL
PHOTOGRAPHED ON 1/24/2020
PROPO
SED
PHO
TOLO
CATI
ON
ORI
ENTA
TIO
ND
ISTA
NCE
TO
SIT
EVI
SIBI
LITY
16H
ILLA
RY C
IRCL
EN
ORT
HEA
ST+/
- 0.2
4 M
ILE
SEA
SON
AL

EXISTING
PHO
TOLO
CATI
ON
ORI
ENTA
TIO
ND
ISTA
NCE
TO
SIT
EVI
SIBI
LITY
17PA
RK &
RID
E -
JEFF
ERSO
N S
TREE
TEA
ST+/
- 0.1
5 M
ILE
SEA
SON
AL
PHOTOGRAPHED ON 1/24/2020
PROPO
SED
PHO
TOLO
CATI
ON
ORI
ENTA
TIO
ND
ISTA
NCE
TO
SIT
EVI
SIBI
LITY
17PA
RK &
RID
E -
JEFF
ERSO
N S
TREE
TEA
ST+/
- 0.1
5 M
ILE
SEA
SON
AL
EXISTING
PHO
TOLO
CATI
ON
ORI
ENTA
TIO
ND
ISTA
NCE
TO
SIT
EVI
SIBI
LITY
18W
EEPI
NG
WIL
LOW
LA
NE
EAST
+/- 4
74 F
EET
NO
T V
ISIB
LE
PHOTOGRAPHED ON 1/24/202024mm Focal Length
EXISTING
PHO
TOLO
CATI
ON
ORI
ENTA
TIO
ND
ISTA
NCE
TO
SIT
EVI
SIBI
LITY
19W
EEPI
NG
WIL
LOW
LA
NE
SOU
THEA
ST+/
- 0.1
3 M
ILE
YEA
R RO
UN
D
PHOTOGRAPHED ON 1/24/2020

PROPO
SED
PHO
TOLO
CATI
ON
ORI
ENTA
TIO
ND
ISTA
NCE
TO
SIT
EVI
SIBI
LITY
19W
EEPI
NG
WIL
LOW
LA
NE
SOU
THEA
ST+/
- 0.1
3 M
ILE
YEA
R RO
UN
D
Related Documents