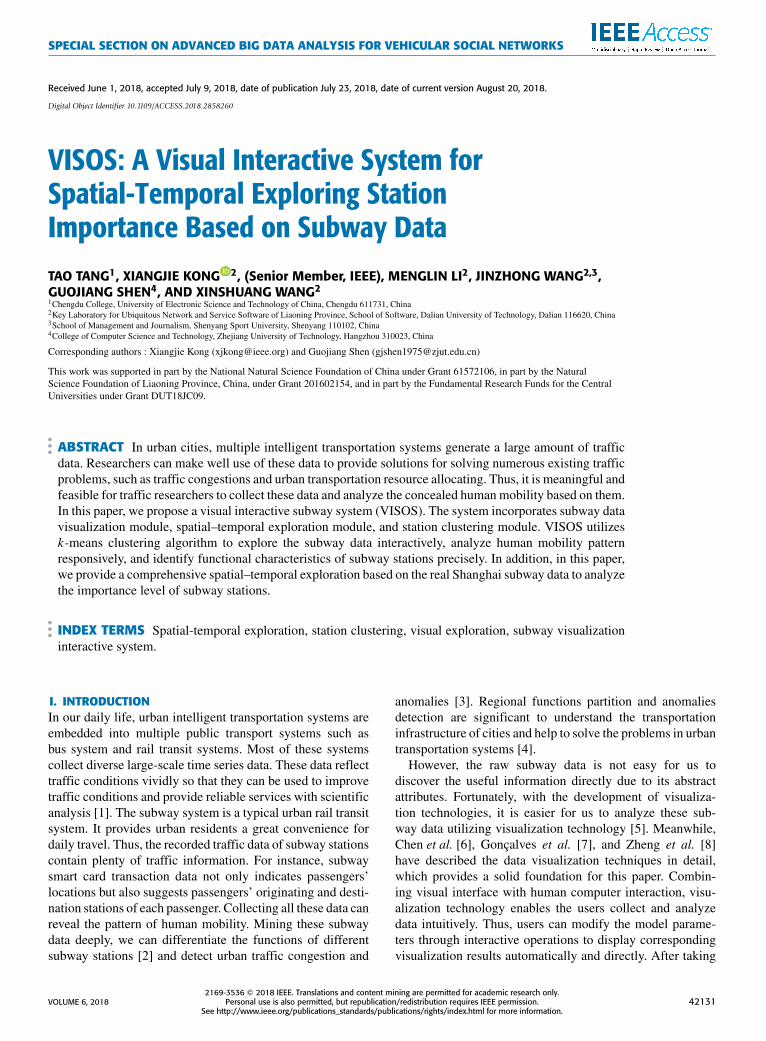
SPECIAL SECTION ON ADVANCED BIG DATA ANALYSIS FOR VEHICULAR SOCIAL NETWORKS Received June 1, 2018, accepted July 9, 2018, date of publication July 23, 2018, date of current version August 20, 2018. Digital Object Identifier 10.1109/ACCESS.2018.2858260 VISOS: A Visual Interactive System for Spatial-Temporal Exploring Station Importance Based on Subway Data TAO TANG 1 , XIANGJIE KONG 2 , (Senior Member, IEEE), MENGLIN LI 2 , JINZHONG WANG 2,3 , GUOJIANG SHEN 4 , AND XINSHUANG WANG 2 1 Chengdu College, University of Electronic Science and Technology of China, Chengdu 611731, China 2 Key Laboratory for Ubiquitous Network and Service Software of Liaoning Province, School of Software, Dalian University of Technology, Dalian 116620, China 3 School of Management and Journalism, Shenyang Sport University, Shenyang 110102, China 4 College of Computer Science and Technology, Zhejiang University of Technology, Hangzhou 310023, China Corresponding authors : Xiangjie Kong ([email protected]) and Guojiang Shen ([email protected]) This work was supported in part by the National Natural Science Foundation of China under Grant 61572106, in part by the Natural Science Foundation of Liaoning Province, China, under Grant 201602154, and in part by the Fundamental Research Funds for the Central Universities under Grant DUT18JC09. ABSTRACT In urban cities, multiple intelligent transportation systems generate a large amount of traffic data. Researchers can make well use of these data to provide solutions for solving numerous existing traffic problems, such as traffic congestions and urban transportation resource allocating. Thus, it is meaningful and feasible for traffic researchers to collect these data and analyze the concealed human mobility based on them. In this paper, we propose a visual interactive subway system (VISOS). The system incorporates subway data visualization module, spatial–temporal exploration module, and station clustering module. VISOS utilizes k -means clustering algorithm to explore the subway data interactively, analyze human mobility pattern responsively, and identify functional characteristics of subway stations precisely. In addition, in this paper, we provide a comprehensive spatial–temporal exploration based on the real Shanghai subway data to analyze the importance level of subway stations. INDEX TERMS Spatial-temporal exploration, station clustering, visual exploration, subway visualization interactive system. I. INTRODUCTION In our daily life, urban intelligent transportation systems are embedded into multiple public transport systems such as bus system and rail transit systems. Most of these systems collect diverse large-scale time series data. These data reflect traffic conditions vividly so that they can be used to improve traffic conditions and provide reliable services with scientific analysis [1]. The subway system is a typical urban rail transit system. It provides urban residents a great convenience for daily travel. Thus, the recorded traffic data of subway stations contain plenty of traffic information. For instance, subway smart card transaction data not only indicates passengers’ locations but also suggests passengers’ originating and desti- nation stations of each passenger. Collecting all these data can reveal the pattern of human mobility. Mining these subway data deeply, we can differentiate the functions of different subway stations [2] and detect urban traffic congestion and anomalies [3]. Regional functions partition and anomalies detection are significant to understand the transportation infrastructure of cities and help to solve the problems in urban transportation systems [4]. However, the raw subway data is not easy for us to discover the useful information directly due to its abstract attributes. Fortunately, with the development of visualiza- tion technologies, it is easier for us to analyze these sub- way data utilizing visualization technology [5]. Meanwhile, Chen et al. [6], Gonçalves et al. [7], and Zheng et al. [8] have described the data visualization techniques in detail, which provides a solid foundation for this paper. Combin- ing visual interface with human computer interaction, visu- alization technology enables the users collect and analyze data intuitively. Thus, users can modify the model parame- ters through interactive operations to display corresponding visualization results automatically and directly. After taking VOLUME 6, 2018 2169-3536 2018 IEEE. Translations and content mining are permitted for academic research only. Personal use is also permitted, but republication/redistribution requires IEEE permission. See http://www.ieee.org/publications_standards/publications/rights/index.html for more information. 42131

Welcome message from author
This document is posted to help you gain knowledge. Please leave a comment to let me know what you think about it! Share it to your friends and learn new things together.
Transcript
SPECIAL SECTION ON ADVANCED BIG DATA ANALYSIS FOR VEHICULAR SOCIAL NETWORKS
Received June 1, 2018, accepted July 9, 2018, date of publication July 23, 2018, date of current version August 20, 2018.
Digital Object Identifier 10.1109/ACCESS.2018.2858260
VISOS: A Visual Interactive System forSpatial-Temporal Exploring StationImportance Based on Subway DataTAO TANG1, XIANGJIE KONG 2, (Senior Member, IEEE), MENGLIN LI2, JINZHONG WANG2,3,GUOJIANG SHEN4, AND XINSHUANG WANG21Chengdu College, University of Electronic Science and Technology of China, Chengdu 611731, China2Key Laboratory for Ubiquitous Network and Service Software of Liaoning Province, School of Software, Dalian University of Technology, Dalian 116620, China3School of Management and Journalism, Shenyang Sport University, Shenyang 110102, China4College of Computer Science and Technology, Zhejiang University of Technology, Hangzhou 310023, China
Corresponding authors : Xiangjie Kong ([email protected]) and Guojiang Shen ([email protected])
This work was supported in part by the National Natural Science Foundation of China under Grant 61572106, in part by the NaturalScience Foundation of Liaoning Province, China, under Grant 201602154, and in part by the Fundamental Research Funds for the CentralUniversities under Grant DUT18JC09.
ABSTRACT In urban cities, multiple intelligent transportation systems generate a large amount of trafficdata. Researchers can make well use of these data to provide solutions for solving numerous existing trafficproblems, such as traffic congestions and urban transportation resource allocating. Thus, it is meaningful andfeasible for traffic researchers to collect these data and analyze the concealed humanmobility based on them.In this paper, we propose a visual interactive subway system (VISOS). The system incorporates subway datavisualization module, spatial–temporal exploration module, and station clustering module. VISOS utilizesk-means clustering algorithm to explore the subway data interactively, analyze human mobility patternresponsively, and identify functional characteristics of subway stations precisely. In addition, in this paper,we provide a comprehensive spatial–temporal exploration based on the real Shanghai subway data to analyzethe importance level of subway stations.
INDEX TERMS Spatial-temporal exploration, station clustering, visual exploration, subway visualizationinteractive system.
I. INTRODUCTIONIn our daily life, urban intelligent transportation systems areembedded into multiple public transport systems such asbus system and rail transit systems. Most of these systemscollect diverse large-scale time series data. These data reflecttraffic conditions vividly so that they can be used to improvetraffic conditions and provide reliable services with scientificanalysis [1]. The subway system is a typical urban rail transitsystem. It provides urban residents a great convenience fordaily travel. Thus, the recorded traffic data of subway stationscontain plenty of traffic information. For instance, subwaysmart card transaction data not only indicates passengers’locations but also suggests passengers’ originating and desti-nation stations of each passenger. Collecting all these data canreveal the pattern of human mobility. Mining these subwaydata deeply, we can differentiate the functions of differentsubway stations [2] and detect urban traffic congestion and
anomalies [3]. Regional functions partition and anomaliesdetection are significant to understand the transportationinfrastructure of cities and help to solve the problems in urbantransportation systems [4].
However, the raw subway data is not easy for us todiscover the useful information directly due to its abstractattributes. Fortunately, with the development of visualiza-tion technologies, it is easier for us to analyze these sub-way data utilizing visualization technology [5]. Meanwhile,Chen et al. [6], Gonçalves et al. [7], and Zheng et al. [8]have described the data visualization techniques in detail,which provides a solid foundation for this paper. Combin-ing visual interface with human computer interaction, visu-alization technology enables the users collect and analyzedata intuitively. Thus, users can modify the model parame-ters through interactive operations to display correspondingvisualization results automatically and directly. After taking
VOLUME 6, 20182169-3536 2018 IEEE. Translations and content mining are permitted for academic research only.
Personal use is also permitted, but republication/redistribution requires IEEE permission.See http://www.ieee.org/publications_standards/publications/rights/index.html for more information.
42131
T. Tang et al.: Visual Interactive System for Spatial-Temporal Exploring Station Importance
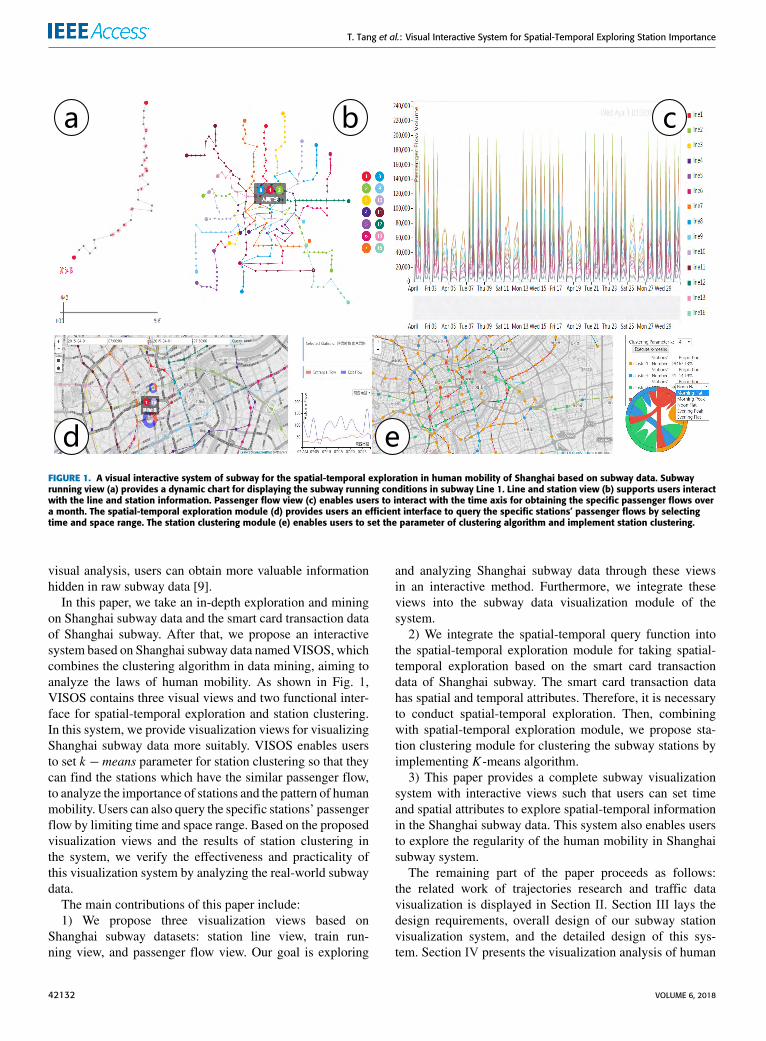
FIGURE 1. A visual interactive system of subway for the spatial-temporal exploration in human mobility of Shanghai based on subway data. Subwayrunning view (a) provides a dynamic chart for displaying the subway running conditions in subway Line 1. Line and station view (b) supports users interactwith the line and station information. Passenger flow view (c) enables users to interact with the time axis for obtaining the specific passenger flows overa month. The spatial-temporal exploration module (d) provides users an efficient interface to query the specific stations’ passenger flows by selectingtime and space range. The station clustering module (e) enables users to set the parameter of clustering algorithm and implement station clustering.
visual analysis, users can obtain more valuable informationhidden in raw subway data [9].
In this paper, we take an in-depth exploration and miningon Shanghai subway data and the smart card transaction dataof Shanghai subway. After that, we propose an interactivesystem based on Shanghai subway data namedVISOS, whichcombines the clustering algorithm in data mining, aiming toanalyze the laws of human mobility. As shown in Fig. 1,VISOS contains three visual views and two functional inter-face for spatial-temporal exploration and station clustering.In this system, we provide visualization views for visualizingShanghai subway data more suitably. VISOS enables usersto set k −means parameter for station clustering so that theycan find the stations which have the similar passenger flow,to analyze the importance of stations and the pattern of humanmobility. Users can also query the specific stations’ passengerflow by limiting time and space range. Based on the proposedvisualization views and the results of station clustering inthe system, we verify the effectiveness and practicality ofthis visualization system by analyzing the real-world subwaydata.
The main contributions of this paper include:1) We propose three visualization views based on
Shanghai subway datasets: station line view, train run-ning view, and passenger flow view. Our goal is exploring
and analyzing Shanghai subway data through these viewsin an interactive method. Furthermore, we integrate theseviews into the subway data visualization module of thesystem.
2) We integrate the spatial-temporal query function intothe spatial-temporal exploration module for taking spatial-temporal exploration based on the smart card transactiondata of Shanghai subway. The smart card transaction datahas spatial and temporal attributes. Therefore, it is necessaryto conduct spatial-temporal exploration. Then, combiningwith spatial-temporal exploration module, we propose sta-tion clustering module for clustering the subway stations byimplementing K -means algorithm.3) This paper provides a complete subway visualization
system with interactive views such that users can set timeand spatial attributes to explore spatial-temporal informationin the Shanghai subway data. This system also enables usersto explore the regularity of the human mobility in Shanghaisubway system.
The remaining part of the paper proceeds as follows:the related work of trajectories research and traffic datavisualization is displayed in Section II. Section III lays thedesign requirements, overall design of our subway stationvisualization system, and the detailed design of this sys-tem. Section IV presents the visualization analysis of human
42132 VOLUME 6, 2018
T. Tang et al.: Visual Interactive System for Spatial-Temporal Exploring Station Importance
mobility, spatial-temporal exploration, and station clusteringresults. Finally, this paper concludes in Section V.
II. RELATED WORKWe introduce the relevant work about human mobility explo-ration and spatial-temporal analysis based on traffic-relateddata in this section.
A. HUMAN MOBILITY EXPLORATIONWith the development of sensor technologies and the spreadof multiple mobile devices, a large amount of spatial tra-jectory data can be generated, these data often containthe records of multitudinous moving objects, such as peo-ple, animals, and vehicles. Therefore, it is meaningful forresearchers to find the mobility patterns of these movingobjects [10]. Rahim et al. [11] investigate the future imple-mentation of Vehicular Social Networks and presents a lit-erature review on socially-aware applications of Vehicu-lar Social Networks and mobility modeling. They give anoverview of the recommendation systems and route planningprotocols. Li et al. [12] propose an augmented MapReduceframework on visualization of traffic data, which improvesthe accuracy within different time scale. Chen et al. [13]propose an interactive visual analytics system for explor-ing the movement patterns based on the sparsely sampledsocial media data with Geotagging information. This sys-tem enables users to use uncertainty model to filter andselect reliable data and take spatial-temporal analysis basedon these preprocessed data. With the help of this system,users can explore the movement patterns from social mediadata with Geotagging information. Kong et al. [14] proposea novel approach for chronically detecting traffic anoma-lies based on crowdsourced bus trajectory data. First, theymodel the traffic conditions by partitioning the raw datainto two segments with spatial and temporal attributes. Thenthey use the anomalous segments to detect the anomalousregions, to further make suggestions for the traffic planning.Wu et al. [15] propose an interactive visual analytics systemnamed TelCoVis to help users to take co-occurrence explo-ration in urban humanmobility based telco data by integratingseveral biclustering techniques. Xia et al. [16] extract essen-tial features of human mobility and model the large-scalegreen urban mobility by mining the big urban traffic data,aiming at evaluating the perception applications for greentransportation systems. Besides, they perform simulations forfinding the factors which can influence the vehicular mobil-ity. Ning et al. [17] propose an efficient and novel heuristicscheme for controling the power of User Equipments andselecting relay, aiming at allocating Resource Blocks follow-ing an in-band NB-IoT solution. Al-Dohuki et al. [18] pro-pose a semantic-based analysis scheme named SemanticTrajto process the massive taxi trajectory data and integratethe processed results with a set of visualization techniques.This approach not only enables users to query the key-words based on the terms, but also let the users explore
the trajectory data interactively through the visualizationinterface of SemanticTraj. Kong et al. [19] present a detailedapproach for generating social vehicular mobility datasetfrom the raw taxi data. After modeling and analyzing the taxidataset, they further combine official traffic data to describethe road network conditions. Finally, they conduct simulationbased on the raw taxi data and the urban functional regionsfor reproducing the scene by producing the mobility dataset.
B. SPATIAL-TEMPORAL ANALYSISHuman mobility analysis based on traffic data is a pop-ular topic [20]. Cui et al. [21] design a geometry-basededge-clustering framework which is able to cluster edgesinto bundles and decrease the overall edge crossings.Tominski et al. [22] present a novel spatiotemporal approachto visualizing trajectory attribute data and achieve good per-formance. Ferreira et al. [23] propose a visual model withorigin-destination query functions based the New York Citytaxi data that allow users to conduct taxi trips visual queryusing spatial and temporal attributes. Based on this model,they also integrate a visual system for rendering the queryresults more efficiently such that users can obtain the hiddendetails from the raw traffic data. Zeng et al. [9] propose twovisualization modules named isotime flow map view and theOD-pair journey view for displaying the smart card trans-action data and the basic data of Singapore subway and thesmart card transaction data of Singapore bus lines, assistingin the analysis of passenger travel patterns. Huang et al. [24]propose a visual analytics method named TrahGraph, whichuses the road network structure based on Shenzhen taxitrajectory data, aiming at revealing the importance of citystreets. TrajGraph simplifies the map model at the regionallevel by utilizing the graph segmentation algorithm for theroad networks. After graph centralization process, users canobtain city traffic patterns by examining the importance ofstreets in an interactive way. Kristian Kloeckl et al.1 visual-ize French high-speed rail data using the isochronal chartsof the high-speed rail network and high-speed real-timeoperational maps. This visualization scheme provides a newperspective for displaying the high-speed rail network oper-ation. Yang et al. [25] propose a hybrid visualization methodnamed MapTrix, combining the OD matrix and flow mappresentations, aiming at displaying regional many-to-manyflows. Miranda et al. [26] define the concept of the dynamicspatial-temporal activities in a city across multiple temporalresolutions as the ‘‘urban pulse’’. They also propose an visualexploration framework so that users can explore the pulseswithin and across plenty cities under different scenarios.
III. DESIGN REQUIREMENTS AND OVERALL DESIGNIn this section, the design requirements and overall design ofthe subway visualization system are described as followingsubsections, separately.
1Trains of data, http://senseable.mit.edu/trainsofdata/
VOLUME 6, 2018 42133
T. Tang et al.: Visual Interactive System for Spatial-Temporal Exploring Station Importance
A. SHANGHAI SUBWAY DATA1) DATA DESCRIPTIONThe datasets used in this system include the following threecategories: Shanghai subway line and station data, Shanghaisubway running data, and the smart card transaction data ofShanghai subway. In addition, the latitude and longitude ofShanghai subway stations we used in this system are fromBaidu map. As of April 2015, Shanghai subway line has617.53 kilometers and over 9 million passengers per day.The above datasets we used are multi-sourced information.Thus we can take more exploration and analysis on them. Thedetailed information of above three types of data is introducedas follows:
• Shanghai subway line and station data. This datasetcontains 14 lines (including 289 stations) basic infor-mation of Shanghai subway in April 2015. All thesedata are stored in .CSV files, including multiple fields,such as the line number, line length of Shanghaisubway.
• Shanghai subway running data. This dataset containsthe train operations of Shanghai Subway Line 1 fromJuly 2014 to April 2015. It records the number oftrain, the arrival and departure stations of the corre-sponding trains, the arrival and departure time of thecorresponding trains, the time deviation of each trainand other information. A total volume of this dataset is800M.
• The smart card transaction data of Shanghai sub-way. This dataset includes Shanghai subway ferry dataand part of the smart card transaction data of bus systemfrom April 1, 2015, to April 30, 2015. The raw data arebetween 800M to 900M for each recorded day and with.CSV files. A total volume of this dataset is with 22 GB,more than 400 million pieces of data, including passen-ger’s smart card number, passenger’s transaction stationsand the corresponding time, sum of consumption andother information.
2) DATA PREPROCESSINGThe procedure of subway data preprocessing includes datacleaning, data merging and extraction of OD data. The datacleaning process includes processing missing data, incon-sistent data and duplicated data. Before we visualize thesubway data, we first clean the raw data to make sure thedata we used are as percise as possible. Then, we mergethe thirty days smart card transaction data (April 1, 2015 toApril 30, 2015) into a collection for conducting the follow-upspatial-temporal explorations. In our system, we extract theOD data [27] from the smart card transaction data for stationclustering module.
B. DESIGN REQUIREMENTSFor visualizing the subway data more efficiently and plainly,we decide to design a interactive system so that userscan easily obtain the main subway information from the
visualization charts and further analyze the laws of humanmobility. Therefore, the demand of our system mainly con-tains four parts: 1) Provide the line and station data visual-ization schemes. 2) Enable users to conduct spatial-temporalexploration based on the smart card transaction data. 3) Pro-vide station function exploration and analysis such that userscan explore the function of different stations and the linksamong the different areas around these stations to furtheranalyze the importance of different stations.We list the detailsof the above requirements as follows:
1) PROVIDE VISUALIZATION VIEWS BASED ON SUBWAYLINE AND STATION DATAFirst of all, we consider the main problems such as how toshow the time-varying law of subway data? How to identifythe relation of subway lines? In order to solve such problems,we need to visualize the Shanghai subway basic data in anappropriate way. Therefore, we decided to visualize thesesubway data using three views: station line view, subwayrunning view, and passenger flow view. The station line viewshows the spatial distribution of the subway stations andline numbers. Besides, this view also can show the transferstations. The subway running view shows each train’s run-ning visualization of Shanghai subway within one day suchthat users can have a macro perspective observation to theSubway Line 1. The passenger flow view shows the volumeof passenger among different subway lines such that userscan adjust the time range to observe the dynamic changes ofpassenger flow.
2) PROVIDE SPATIAL-TEMPORAL EXPLORATION BASED ONTHE SMART CARD TRANSACTION DATASpatial and temporal attributes are the two basic charac-teristics of the smart card transaction data. In our system,the transaction data we used are abstract, with large-scalevolume. Therefore, it is difficult for us to find the useful infor-mation from raw data without processing it. Thus, we proposean interactive interface which enables users to have both tem-poral and spatial exploration. On the basis of the above visualviews of the subway basic data, it is necessary to providethe selection function (both spatial and temporal selection)in our visual system such that users can select the location,start time and end time to query the smart card transactiondata interactively.
3) PROVIDE STATION FUNCTION EXPLORATIONAND ANALYSISBased on the above subway data, we can build the time-dependent passenger flow model of subway stations byimplementing clustering algorithm. Shanghai subway lineshave 289 stations, which can be divided into several cat-egories with different functions according to the similaritybetween passenger flow of these stations. Depending on theobtained categories, subway stations can be marked withdifferent colors on the map. Finally, we display differentpassenger flows on charts.
42134 VOLUME 6, 2018
T. Tang et al.: Visual Interactive System for Spatial-Temporal Exploring Station Importance
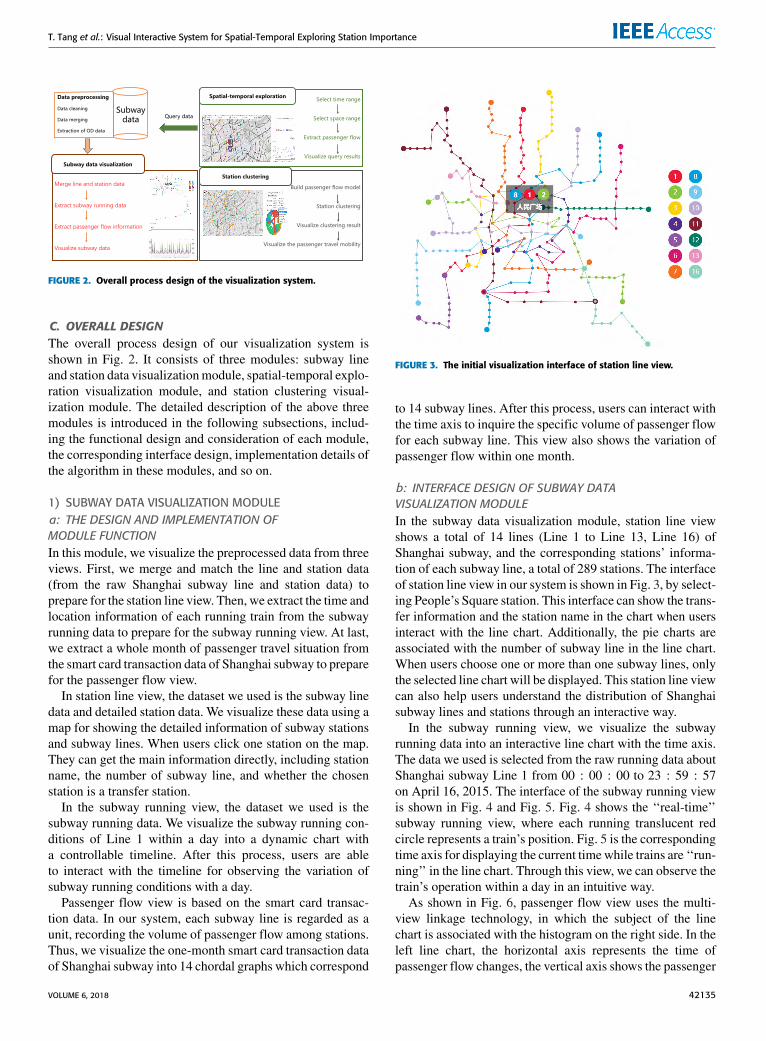
FIGURE 2. Overall process design of the visualization system.
C. OVERALL DESIGNThe overall process design of our visualization system isshown in Fig. 2. It consists of three modules: subway lineand station data visualizationmodule, spatial-temporal explo-ration visualization module, and station clustering visual-ization module. The detailed description of the above threemodules is introduced in the following subsections, includ-ing the functional design and consideration of each module,the corresponding interface design, implementation details ofthe algorithm in these modules, and so on.
1) SUBWAY DATA VISUALIZATION MODULEa: THE DESIGN AND IMPLEMENTATION OFMODULE FUNCTIONIn this module, we visualize the preprocessed data from threeviews. First, we merge and match the line and station data(from the raw Shanghai subway line and station data) toprepare for the station line view. Then, we extract the time andlocation information of each running train from the subwayrunning data to prepare for the subway running view. At last,we extract a whole month of passenger travel situation fromthe smart card transaction data of Shanghai subway to preparefor the passenger flow view.
In station line view, the dataset we used is the subway linedata and detailed station data. We visualize these data using amap for showing the detailed information of subway stationsand subway lines. When users click one station on the map.They can get the main information directly, including stationname, the number of subway line, and whether the chosenstation is a transfer station.
In the subway running view, the dataset we used is thesubway running data. We visualize the subway running con-ditions of Line 1 within a day into a dynamic chart witha controllable timeline. After this process, users are ableto interact with the timeline for observing the variation ofsubway running conditions with a day.
Passenger flow view is based on the smart card transac-tion data. In our system, each subway line is regarded as aunit, recording the volume of passenger flow among stations.Thus, we visualize the one-month smart card transaction dataof Shanghai subway into 14 chordal graphs which correspond
FIGURE 3. The initial visualization interface of station line view.
to 14 subway lines. After this process, users can interact withthe time axis to inquire the specific volume of passenger flowfor each subway line. This view also shows the variation ofpassenger flow within one month.
b: INTERFACE DESIGN OF SUBWAY DATAVISUALIZATION MODULEIn the subway data visualization module, station line viewshows a total of 14 lines (Line 1 to Line 13, Line 16) ofShanghai subway, and the corresponding stations’ informa-tion of each subway line, a total of 289 stations. The interfaceof station line view in our system is shown in Fig. 3, by select-ing People’s Square station. This interface can show the trans-fer information and the station name in the chart when usersinteract with the line chart. Additionally, the pie charts areassociated with the number of subway line in the line chart.When users choose one or more than one subway lines, onlythe selected line chart will be displayed. This station line viewcan also help users understand the distribution of Shanghaisubway lines and stations through an interactive way.
In the subway running view, we visualize the subwayrunning data into an interactive line chart with the time axis.The data we used is selected from the raw running data aboutShanghai subway Line 1 from 00 : 00 : 00 to 23 : 59 : 57on April 16, 2015. The interface of the subway running viewis shown in Fig. 4 and Fig. 5. Fig. 4 shows the ‘‘real-time’’subway running view, where each running translucent redcircle represents a train’s position. Fig. 5 is the correspondingtime axis for displaying the current timewhile trains are ‘‘run-ning’’ in the line chart. Through this view, we can observe thetrain’s operation within a day in an intuitive way.
As shown in Fig. 6, passenger flow view uses the multi-view linkage technology, in which the subject of the linechart is associated with the histogram on the right side. In theleft line chart, the horizontal axis represents the time ofpassenger flow changes, the vertical axis shows the passenger
VOLUME 6, 2018 42135
T. Tang et al.: Visual Interactive System for Spatial-Temporal Exploring Station Importance
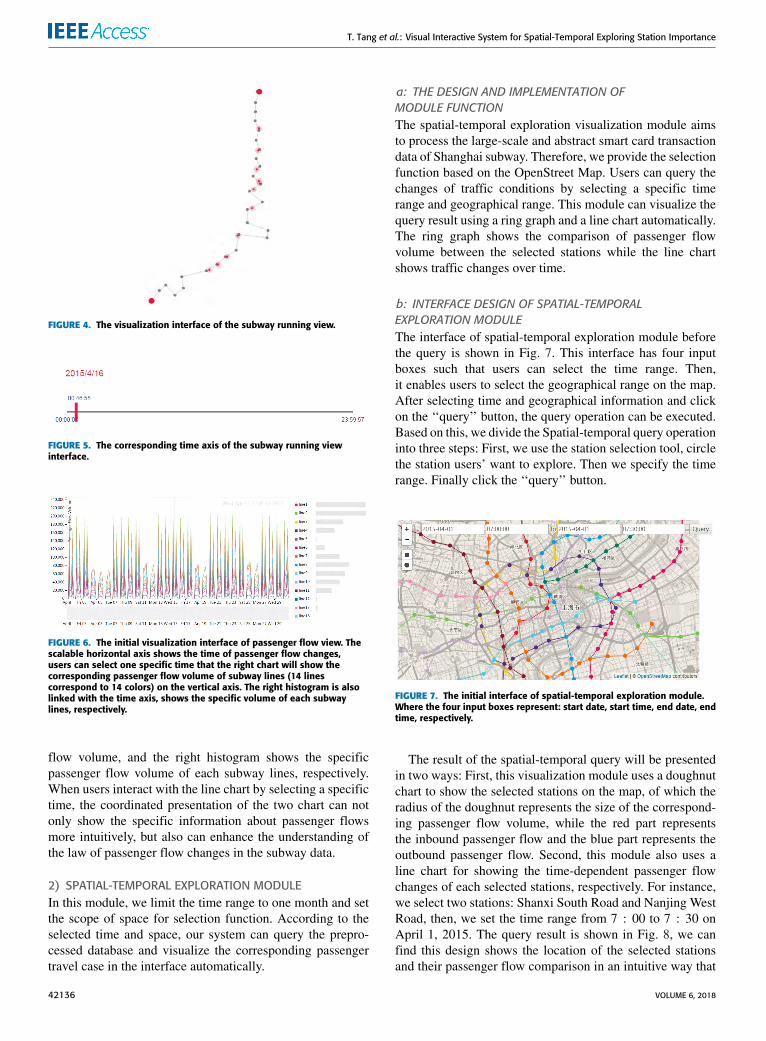
FIGURE 4. The visualization interface of the subway running view.
FIGURE 5. The corresponding time axis of the subway running viewinterface.
FIGURE 6. The initial visualization interface of passenger flow view. Thescalable horizontal axis shows the time of passenger flow changes,users can select one specific time that the right chart will show thecorresponding passenger flow volume of subway lines (14 linescorrespond to 14 colors) on the vertical axis. The right histogram is alsolinked with the time axis, shows the specific volume of each subwaylines, respectively.
flow volume, and the right histogram shows the specificpassenger flow volume of each subway lines, respectively.When users interact with the line chart by selecting a specifictime, the coordinated presentation of the two chart can notonly show the specific information about passenger flowsmore intuitively, but also can enhance the understanding ofthe law of passenger flow changes in the subway data.
2) SPATIAL-TEMPORAL EXPLORATION MODULEIn this module, we limit the time range to one month and setthe scope of space for selection function. According to theselected time and space, our system can query the prepro-cessed database and visualize the corresponding passengertravel case in the interface automatically.
a: THE DESIGN AND IMPLEMENTATION OFMODULE FUNCTIONThe spatial-temporal exploration visualization module aimsto process the large-scale and abstract smart card transactiondata of Shanghai subway. Therefore, we provide the selectionfunction based on the OpenStreet Map. Users can query thechanges of traffic conditions by selecting a specific timerange and geographical range. This module can visualize thequery result using a ring graph and a line chart automatically.The ring graph shows the comparison of passenger flowvolume between the selected stations while the line chartshows traffic changes over time.
b: INTERFACE DESIGN OF SPATIAL-TEMPORALEXPLORATION MODULEThe interface of spatial-temporal exploration module beforethe query is shown in Fig. 7. This interface has four inputboxes such that users can select the time range. Then,it enables users to select the geographical range on the map.After selecting time and geographical information and clickon the ‘‘query’’ button, the query operation can be executed.Based on this, we divide the Spatial-temporal query operationinto three steps: First, we use the station selection tool, circlethe station users’ want to explore. Then we specify the timerange. Finally click the ‘‘query’’ button.
FIGURE 7. The initial interface of spatial-temporal exploration module.Where the four input boxes represent: start date, start time, end date, endtime, respectively.
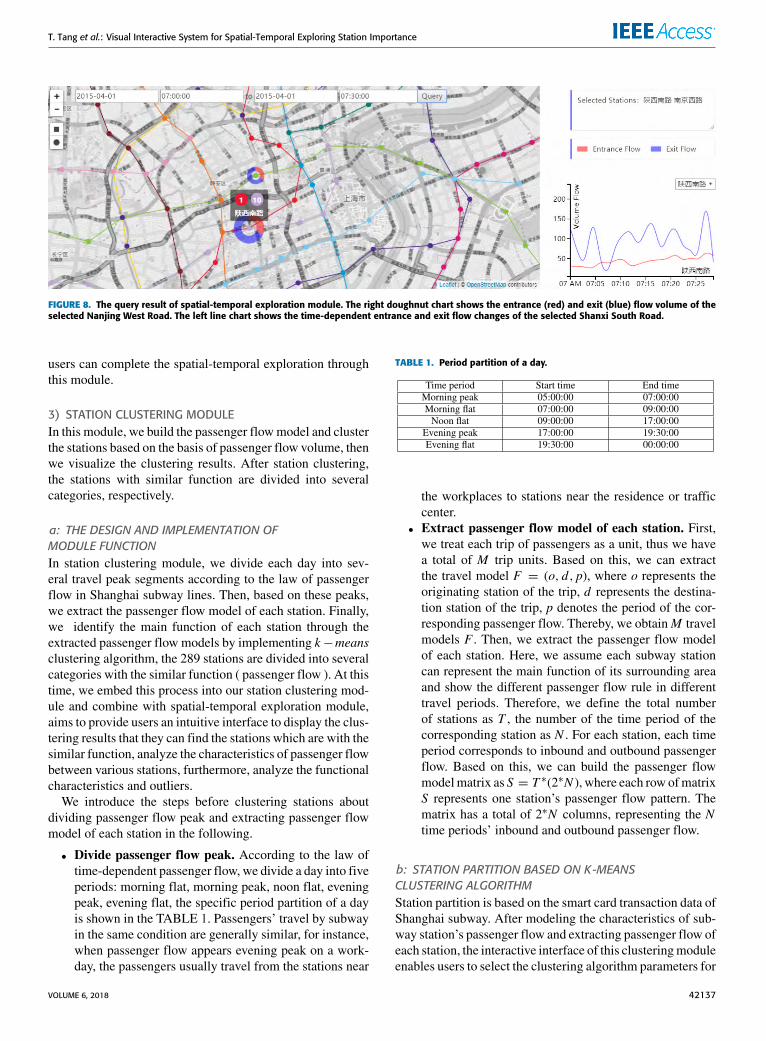
The result of the spatial-temporal query will be presentedin two ways: First, this visualization module uses a doughnutchart to show the selected stations on the map, of which theradius of the doughnut represents the size of the correspond-ing passenger flow volume, while the red part representsthe inbound passenger flow and the blue part represents theoutbound passenger flow. Second, this module also uses aline chart for showing the time-dependent passenger flowchanges of each selected stations, respectively. For instance,we select two stations: Shanxi South Road and Nanjing WestRoad, then, we set the time range from 7 : 00 to 7 : 30 onApril 1, 2015. The query result is shown in Fig. 8, we canfind this design shows the location of the selected stationsand their passenger flow comparison in an intuitive way that
42136 VOLUME 6, 2018
T. Tang et al.: Visual Interactive System for Spatial-Temporal Exploring Station Importance
FIGURE 8. The query result of spatial-temporal exploration module. The right doughnut chart shows the entrance (red) and exit (blue) flow volume of theselected Nanjing West Road. The left line chart shows the time-dependent entrance and exit flow changes of the selected Shanxi South Road.
users can complete the spatial-temporal exploration throughthis module.
3) STATION CLUSTERING MODULEIn this module, we build the passenger flowmodel and clusterthe stations based on the basis of passenger flow volume, thenwe visualize the clustering results. After station clustering,the stations with similar function are divided into severalcategories, respectively.
a: THE DESIGN AND IMPLEMENTATION OFMODULE FUNCTIONIn station clustering module, we divide each day into sev-eral travel peak segments according to the law of passengerflow in Shanghai subway lines. Then, based on these peaks,we extract the passenger flow model of each station. Finally,we identify the main function of each station through theextracted passenger flow models by implementing k−meansclustering algorithm, the 289 stations are divided into severalcategories with the similar function ( passenger flow ). At thistime, we embed this process into our station clustering mod-ule and combine with spatial-temporal exploration module,aims to provide users an intuitive interface to display the clus-tering results that they can find the stations which are with thesimilar function, analyze the characteristics of passenger flowbetween various stations, furthermore, analyze the functionalcharacteristics and outliers.
We introduce the steps before clustering stations aboutdividing passenger flow peak and extracting passenger flowmodel of each station in the following.
• Divide passenger flow peak. According to the law oftime-dependent passenger flow, we divide a day into fiveperiods: morning flat, morning peak, noon flat, eveningpeak, evening flat, the specific period partition of a dayis shown in the TABLE 1. Passengers’ travel by subwayin the same condition are generally similar, for instance,when passenger flow appears evening peak on a work-day, the passengers usually travel from the stations near
TABLE 1. Period partition of a day.
the workplaces to stations near the residence or trafficcenter.
• Extract passenger flow model of each station. First,we treat each trip of passengers as a unit, thus we havea total of M trip units. Based on this, we can extractthe travel model F = (o, d, p), where o represents theoriginating station of the trip, d represents the destina-tion station of the trip, p denotes the period of the cor-responding passenger flow. Thereby, we obtainM travelmodels F . Then, we extract the passenger flow modelof each station. Here, we assume each subway stationcan represent the main function of its surrounding areaand show the different passenger flow rule in differenttravel periods. Therefore, we define the total numberof stations as T , the number of the time period of thecorresponding station as N . For each station, each timeperiod corresponds to inbound and outbound passengerflow. Based on this, we can build the passenger flowmodelmatrix as S = T ∗(2∗N ), where each row ofmatrixS represents one station’s passenger flow pattern. Thematrix has a total of 2∗N columns, representing the Ntime periods’ inbound and outbound passenger flow.
b: STATION PARTITION BASED ON K-MEANSCLUSTERING ALGORITHMStation partition is based on the smart card transaction data ofShanghai subway. After modeling the characteristics of sub-way station’s passenger flow and extracting passenger flow ofeach station, the interactive interface of this clusteringmoduleenables users to select the clustering algorithm parameters for
VOLUME 6, 2018 42137
T. Tang et al.: Visual Interactive System for Spatial-Temporal Exploring Station Importance
clustering the subway stations. The procedures are introducedas follows:
• The division of time dimension. According to the opera-tion time of Shanghai subway and the pattern of passen-ger travel regularity, the passenger flow of each stationis divided into five periods within a day. The specificpartition is shown in Table 1.
• The division of spatial dimension. According to theShanghai subway basic data described above, we takeeach station as a unit. Therefore, all stations are dividedinto 289 spatial units.
• For each spatial unit, we count the passenger’s inboundand outbound number in the five period segmentsrespectively, then, a 289∗8 passenger characteristicmatrix D is formed. This matrix D is obtained from thestations’ passenger flow model.
• Receive the input parameter k(k ≤ n) dynamically andtake this parameter as the cluster number of k-meansclustering algorithm.
• We randomly select k objects from the matrix D as thecenters of the k clusters. The centers of the k clustersafter initialization are denoted in Equ. 1.
µ(0)= µ
(0)1 , . . . , µ
(0)k (1)
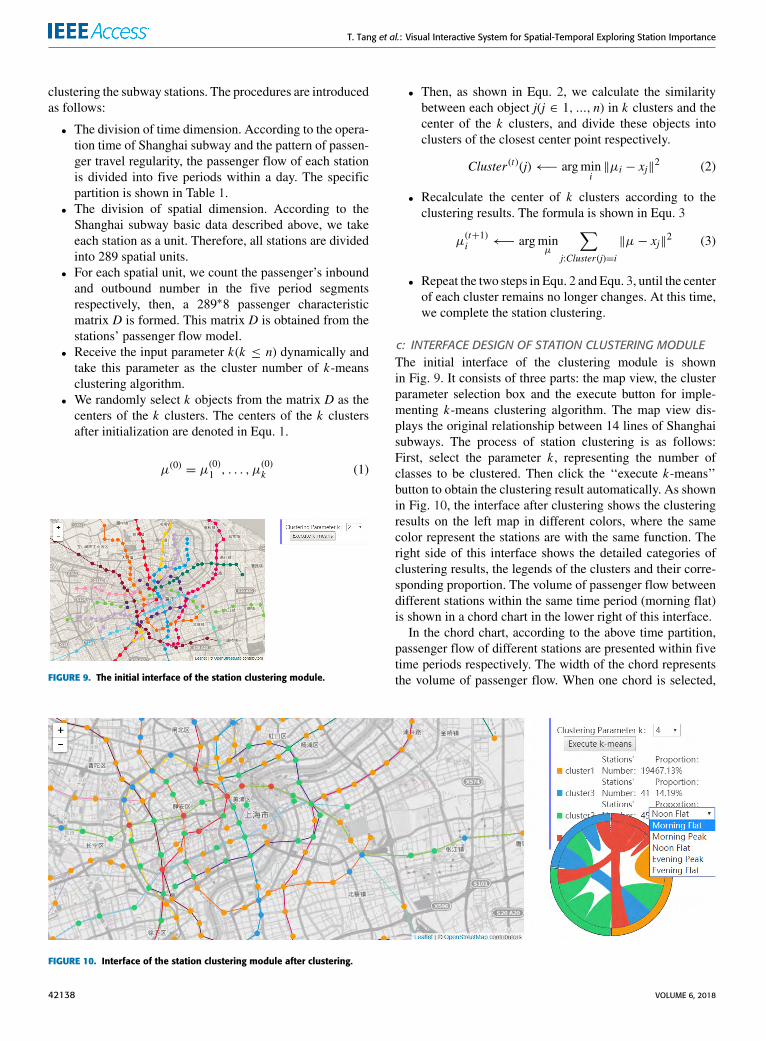
FIGURE 9. The initial interface of the station clustering module.
• Then, as shown in Equ. 2, we calculate the similaritybetween each object j(j ∈ 1, ..., n) in k clusters and thecenter of the k clusters, and divide these objects intoclusters of the closest center point respectively.
Cluster (t)(j)←− argmini‖µi − xj‖2 (2)
• Recalculate the center of k clusters according to theclustering results. The formula is shown in Equ. 3
µ(t+1)i ←− argmin
µ
∑j:Cluster(j)=i
‖µ− xj‖2 (3)
• Repeat the two steps in Equ. 2 and Equ. 3, until the centerof each cluster remains no longer changes. At this time,we complete the station clustering.
c: INTERFACE DESIGN OF STATION CLUSTERING MODULEThe initial interface of the clustering module is shownin Fig. 9. It consists of three parts: the map view, the clusterparameter selection box and the execute button for imple-menting k-means clustering algorithm. The map view dis-plays the original relationship between 14 lines of Shanghaisubways. The process of station clustering is as follows:First, select the parameter k , representing the number ofclasses to be clustered. Then click the ‘‘execute k-means’’button to obtain the clustering result automatically. As shownin Fig. 10, the interface after clustering shows the clusteringresults on the left map in different colors, where the samecolor represent the stations are with the same function. Theright side of this interface shows the detailed categories ofclustering results, the legends of the clusters and their corre-sponding proportion. The volume of passenger flow betweendifferent stations within the same time period (morning flat)is shown in a chord chart in the lower right of this interface.
In the chord chart, according to the above time partition,passenger flow of different stations are presented within fivetime periods respectively. The width of the chord representsthe volume of passenger flow. When one chord is selected,
FIGURE 10. Interface of the station clustering module after clustering.
42138 VOLUME 6, 2018
T. Tang et al.: Visual Interactive System for Spatial-Temporal Exploring Station Importance
the specific passenger flow of the two clusters will bedisplayed.
IV. VISUAL ANALYSIS BASED ON VISOSIn this section, we take the visualization analysis in threeaspects, including visualization analysis of human mobil-ity, visualization analysis of spatial-temporal exploration andvisualization analysis of station clustering results.
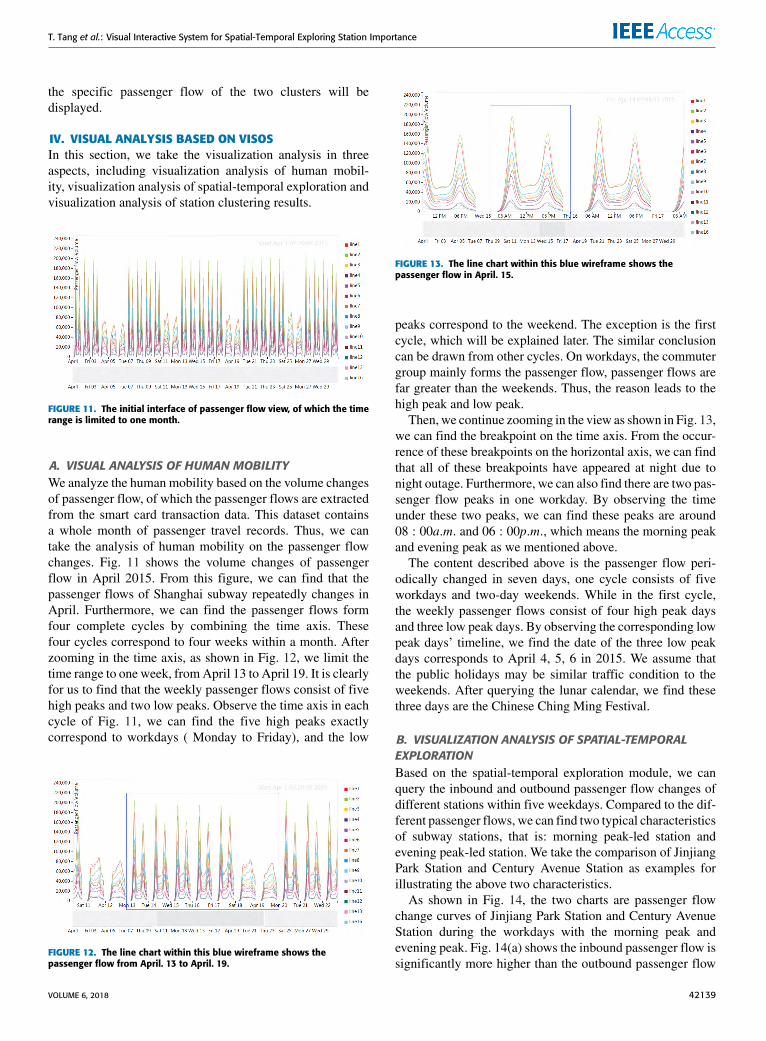
FIGURE 11. The initial interface of passenger flow view, of which the timerange is limited to one month.
A. VISUAL ANALYSIS OF HUMAN MOBILITYWe analyze the human mobility based on the volume changesof passenger flow, of which the passenger flows are extractedfrom the smart card transaction data. This dataset containsa whole month of passenger travel records. Thus, we cantake the analysis of human mobility on the passenger flowchanges. Fig. 11 shows the volume changes of passengerflow in April 2015. From this figure, we can find that thepassenger flows of Shanghai subway repeatedly changes inApril. Furthermore, we can find the passenger flows formfour complete cycles by combining the time axis. Thesefour cycles correspond to four weeks within a month. Afterzooming in the time axis, as shown in Fig. 12, we limit thetime range to one week, fromApril 13 to April 19. It is clearlyfor us to find that the weekly passenger flows consist of fivehigh peaks and two low peaks. Observe the time axis in eachcycle of Fig. 11, we can find the five high peaks exactlycorrespond to workdays ( Monday to Friday), and the low
FIGURE 12. The line chart within this blue wireframe shows thepassenger flow from April. 13 to April. 19.
FIGURE 13. The line chart within this blue wireframe shows thepassenger flow in April. 15.
peaks correspond to the weekend. The exception is the firstcycle, which will be explained later. The similar conclusioncan be drawn from other cycles. On workdays, the commutergroup mainly forms the passenger flow, passenger flows arefar greater than the weekends. Thus, the reason leads to thehigh peak and low peak.
Then, we continue zooming in the view as shown in Fig. 13,we can find the breakpoint on the time axis. From the occur-rence of these breakpoints on the horizontal axis, we can findthat all of these breakpoints have appeared at night due tonight outage. Furthermore, we can also find there are two pas-senger flow peaks in one workday. By observing the timeunder these two peaks, we can find these peaks are around08 : 00a.m. and 06 : 00p.m., which means the morning peakand evening peak as we mentioned above.
The content described above is the passenger flow peri-odically changed in seven days, one cycle consists of fiveworkdays and two-day weekends. While in the first cycle,the weekly passenger flows consist of four high peak daysand three low peak days. By observing the corresponding lowpeak days’ timeline, we find the date of the three low peakdays corresponds to April 4, 5, 6 in 2015. We assume thatthe public holidays may be similar traffic condition to theweekends. After querying the lunar calendar, we find thesethree days are the Chinese Ching Ming Festival.
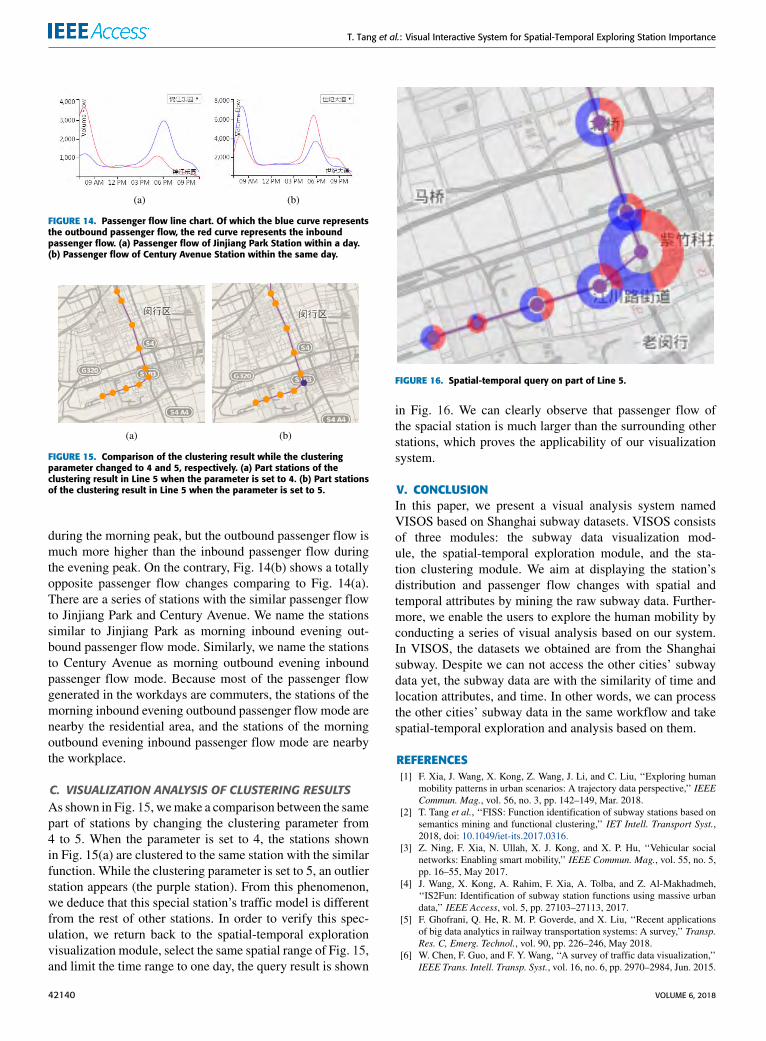
B. VISUALIZATION ANALYSIS OF SPATIAL-TEMPORALEXPLORATIONBased on the spatial-temporal exploration module, we canquery the inbound and outbound passenger flow changes ofdifferent stations within five weekdays. Compared to the dif-ferent passenger flows, we can find two typical characteristicsof subway stations, that is: morning peak-led station andevening peak-led station. We take the comparison of JinjiangPark Station and Century Avenue Station as examples forillustrating the above two characteristics.
As shown in Fig. 14, the two charts are passenger flowchange curves of Jinjiang Park Station and Century AvenueStation during the workdays with the morning peak andevening peak. Fig. 14(a) shows the inbound passenger flow issignificantly more higher than the outbound passenger flow
VOLUME 6, 2018 42139
T. Tang et al.: Visual Interactive System for Spatial-Temporal Exploring Station Importance
FIGURE 14. Passenger flow line chart. Of which the blue curve representsthe outbound passenger flow, the red curve represents the inboundpassenger flow. (a) Passenger flow of Jinjiang Park Station within a day.(b) Passenger flow of Century Avenue Station within the same day.
FIGURE 15. Comparison of the clustering result while the clusteringparameter changed to 4 and 5, respectively. (a) Part stations of theclustering result in Line 5 when the parameter is set to 4. (b) Part stationsof the clustering result in Line 5 when the parameter is set to 5.
during the morning peak, but the outbound passenger flow ismuch more higher than the inbound passenger flow duringthe evening peak. On the contrary, Fig. 14(b) shows a totallyopposite passenger flow changes comparing to Fig. 14(a).There are a series of stations with the similar passenger flowto Jinjiang Park and Century Avenue. We name the stationssimilar to Jinjiang Park as morning inbound evening out-bound passenger flow mode. Similarly, we name the stationsto Century Avenue as morning outbound evening inboundpassenger flow mode. Because most of the passenger flowgenerated in the workdays are commuters, the stations of themorning inbound evening outbound passenger flowmode arenearby the residential area, and the stations of the morningoutbound evening inbound passenger flow mode are nearbythe workplace.
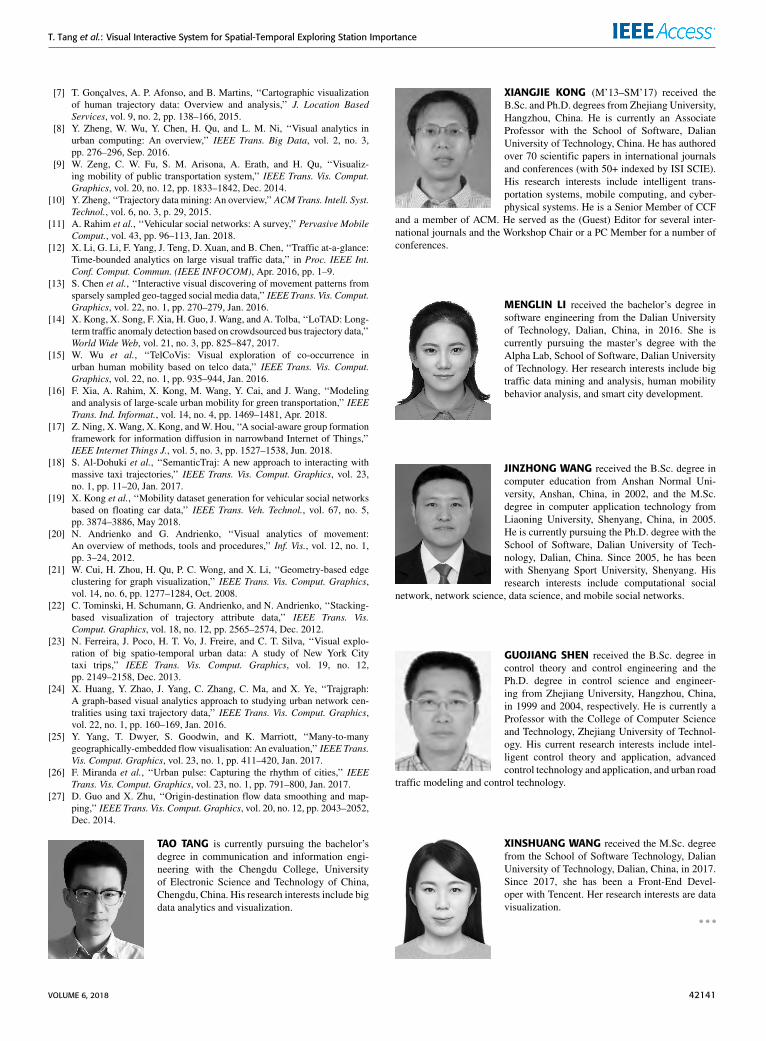
C. VISUALIZATION ANALYSIS OF CLUSTERING RESULTSAs shown in Fig. 15, wemake a comparison between the samepart of stations by changing the clustering parameter from4 to 5. When the parameter is set to 4, the stations shownin Fig. 15(a) are clustered to the same station with the similarfunction. While the clustering parameter is set to 5, an outlierstation appears (the purple station). From this phenomenon,we deduce that this special station’s traffic model is differentfrom the rest of other stations. In order to verify this spec-ulation, we return back to the spatial-temporal explorationvisualization module, select the same spatial range of Fig. 15,and limit the time range to one day, the query result is shown
FIGURE 16. Spatial-temporal query on part of Line 5.
in Fig. 16. We can clearly observe that passenger flow ofthe spacial station is much larger than the surrounding otherstations, which proves the applicability of our visualizationsystem.
V. CONCLUSIONIn this paper, we present a visual analysis system namedVISOS based on Shanghai subway datasets. VISOS consistsof three modules: the subway data visualization mod-ule, the spatial-temporal exploration module, and the sta-tion clustering module. We aim at displaying the station’sdistribution and passenger flow changes with spatial andtemporal attributes by mining the raw subway data. Further-more, we enable the users to explore the human mobility byconducting a series of visual analysis based on our system.In VISOS, the datasets we obtained are from the Shanghaisubway. Despite we can not access the other cities’ subwaydata yet, the subway data are with the similarity of time andlocation attributes, and time. In other words, we can processthe other cities’ subway data in the same workflow and takespatial-temporal exploration and analysis based on them.
REFERENCES[1] F. Xia, J. Wang, X. Kong, Z. Wang, J. Li, and C. Liu, ‘‘Exploring human
mobility patterns in urban scenarios: A trajectory data perspective,’’ IEEECommun. Mag., vol. 56, no. 3, pp. 142–149, Mar. 2018.
[2] T. Tang et al., ‘‘FISS: Function identification of subway stations based onsemantics mining and functional clustering,’’ IET Intell. Transport Syst.,2018, doi: 10.1049/iet-its.2017.0316.
[3] Z. Ning, F. Xia, N. Ullah, X. J. Kong, and X. P. Hu, ‘‘Vehicular socialnetworks: Enabling smart mobility,’’ IEEE Commun. Mag., vol. 55, no. 5,pp. 16–55, May 2017.
[4] J. Wang, X. Kong, A. Rahim, F. Xia, A. Tolba, and Z. Al-Makhadmeh,‘‘IS2Fun: Identification of subway station functions using massive urbandata,’’ IEEE Access, vol. 5, pp. 27103–27113, 2017.
[5] F. Ghofrani, Q. He, R. M. P. Goverde, and X. Liu, ‘‘Recent applicationsof big data analytics in railway transportation systems: A survey,’’ Transp.Res. C, Emerg. Technol., vol. 90, pp. 226–246, May 2018.
[6] W. Chen, F. Guo, and F. Y. Wang, ‘‘A survey of traffic data visualization,’’IEEE Trans. Intell. Transp. Syst., vol. 16, no. 6, pp. 2970–2984, Jun. 2015.
42140 VOLUME 6, 2018
T. Tang et al.: Visual Interactive System for Spatial-Temporal Exploring Station Importance
[7] T. Gonçalves, A. P. Afonso, and B. Martins, ‘‘Cartographic visualizationof human trajectory data: Overview and analysis,’’ J. Location BasedServices, vol. 9, no. 2, pp. 138–166, 2015.
[8] Y. Zheng, W. Wu, Y. Chen, H. Qu, and L. M. Ni, ‘‘Visual analytics inurban computing: An overview,’’ IEEE Trans. Big Data, vol. 2, no. 3,pp. 276–296, Sep. 2016.
[9] W. Zeng, C. W. Fu, S. M. Arisona, A. Erath, and H. Qu, ‘‘Visualiz-ing mobility of public transportation system,’’ IEEE Trans. Vis. Comput.Graphics, vol. 20, no. 12, pp. 1833–1842, Dec. 2014.
[10] Y. Zheng, ‘‘Trajectory data mining: An overview,’’ ACMTrans. Intell. Syst.Technol., vol. 6, no. 3, p. 29, 2015.
[11] A. Rahim et al., ‘‘Vehicular social networks: A survey,’’ Pervasive MobileComput., vol. 43, pp. 96–113, Jan. 2018.
[12] X. Li, G. Li, F. Yang, J. Teng, D. Xuan, and B. Chen, ‘‘Traffic at-a-glance:Time-bounded analytics on large visual traffic data,’’ in Proc. IEEE Int.Conf. Comput. Commun. (IEEE INFOCOM), Apr. 2016, pp. 1–9.
[13] S. Chen et al., ‘‘Interactive visual discovering of movement patterns fromsparsely sampled geo-tagged social media data,’’ IEEE Trans. Vis. Comput.Graphics, vol. 22, no. 1, pp. 270–279, Jan. 2016.
[14] X. Kong, X. Song, F. Xia, H. Guo, J. Wang, and A. Tolba, ‘‘LoTAD: Long-term traffic anomaly detection based on crowdsourced bus trajectory data,’’World Wide Web, vol. 21, no. 3, pp. 825–847, 2017.
[15] W. Wu et al., ‘‘TelCoVis: Visual exploration of co-occurrence inurban human mobility based on telco data,’’ IEEE Trans. Vis. Comput.Graphics, vol. 22, no. 1, pp. 935–944, Jan. 2016.
[16] F. Xia, A. Rahim, X. Kong, M. Wang, Y. Cai, and J. Wang, ‘‘Modelingand analysis of large-scale urban mobility for green transportation,’’ IEEETrans. Ind. Informat., vol. 14, no. 4, pp. 1469–1481, Apr. 2018.
[17] Z. Ning, X.Wang, X. Kong, andW. Hou, ‘‘A social-aware group formationframework for information diffusion in narrowband Internet of Things,’’IEEE Internet Things J., vol. 5, no. 3, pp. 1527–1538, Jun. 2018.
[18] S. Al-Dohuki et al., ‘‘SemanticTraj: A new approach to interacting withmassive taxi trajectories,’’ IEEE Trans. Vis. Comput. Graphics, vol. 23,no. 1, pp. 11–20, Jan. 2017.
[19] X. Kong et al., ‘‘Mobility dataset generation for vehicular social networksbased on floating car data,’’ IEEE Trans. Veh. Technol., vol. 67, no. 5,pp. 3874–3886, May 2018.
[20] N. Andrienko and G. Andrienko, ‘‘Visual analytics of movement:An overview of methods, tools and procedures,’’ Inf. Vis., vol. 12, no. 1,pp. 3–24, 2012.
[21] W. Cui, H. Zhou, H. Qu, P. C. Wong, and X. Li, ‘‘Geometry-based edgeclustering for graph visualization,’’ IEEE Trans. Vis. Comput. Graphics,vol. 14, no. 6, pp. 1277–1284, Oct. 2008.
[22] C. Tominski, H. Schumann, G. Andrienko, and N. Andrienko, ‘‘Stacking-based visualization of trajectory attribute data,’’ IEEE Trans. Vis.Comput. Graphics, vol. 18, no. 12, pp. 2565–2574, Dec. 2012.
[23] N. Ferreira, J. Poco, H. T. Vo, J. Freire, and C. T. Silva, ‘‘Visual explo-ration of big spatio-temporal urban data: A study of New York Citytaxi trips,’’ IEEE Trans. Vis. Comput. Graphics, vol. 19, no. 12,pp. 2149–2158, Dec. 2013.
[24] X. Huang, Y. Zhao, J. Yang, C. Zhang, C. Ma, and X. Ye, ‘‘Trajgraph:A graph-based visual analytics approach to studying urban network cen-tralities using taxi trajectory data,’’ IEEE Trans. Vis. Comput. Graphics,vol. 22, no. 1, pp. 160–169, Jan. 2016.
[25] Y. Yang, T. Dwyer, S. Goodwin, and K. Marriott, ‘‘Many-to-manygeographically-embedded flow visualisation: An evaluation,’’ IEEE Trans.Vis. Comput. Graphics, vol. 23, no. 1, pp. 411–420, Jan. 2017.
[26] F. Miranda et al., ‘‘Urban pulse: Capturing the rhythm of cities,’’ IEEETrans. Vis. Comput. Graphics, vol. 23, no. 1, pp. 791–800, Jan. 2017.
[27] D. Guo and X. Zhu, ‘‘Origin-destination flow data smoothing and map-ping,’’ IEEE Trans. Vis. Comput. Graphics, vol. 20, no. 12, pp. 2043–2052,Dec. 2014.
TAO TANG is currently pursuing the bachelor’sdegree in communication and information engi-neering with the Chengdu College, Universityof Electronic Science and Technology of China,Chengdu, China. His research interests include bigdata analytics and visualization.
XIANGJIE KONG (M’13–SM’17) received theB.Sc. and Ph.D. degrees from Zhejiang University,Hangzhou, China. He is currently an AssociateProfessor with the School of Software, DalianUniversity of Technology, China. He has authoredover 70 scientific papers in international journalsand conferences (with 50+ indexed by ISI SCIE).His research interests include intelligent trans-portation systems, mobile computing, and cyber-physical systems. He is a Senior Member of CCF
and a member of ACM. He served as the (Guest) Editor for several inter-national journals and the Workshop Chair or a PC Member for a number ofconferences.
MENGLIN LI received the bachelor’s degree insoftware engineering from the Dalian Universityof Technology, Dalian, China, in 2016. She iscurrently pursuing the master’s degree with theAlpha Lab, School of Software, Dalian Universityof Technology. Her research interests include bigtraffic data mining and analysis, human mobilitybehavior analysis, and smart city development.
JINZHONG WANG received the B.Sc. degree incomputer education from Anshan Normal Uni-versity, Anshan, China, in 2002, and the M.Sc.degree in computer application technology fromLiaoning University, Shenyang, China, in 2005.He is currently pursuing the Ph.D. degree with theSchool of Software, Dalian University of Tech-nology, Dalian, China. Since 2005, he has beenwith Shenyang Sport University, Shenyang. Hisresearch interests include computational social
network, network science, data science, and mobile social networks.
GUOJIANG SHEN received the B.Sc. degree incontrol theory and control engineering and thePh.D. degree in control science and engineer-ing from Zhejiang University, Hangzhou, China,in 1999 and 2004, respectively. He is currently aProfessor with the College of Computer Scienceand Technology, Zhejiang University of Technol-ogy. His current research interests include intel-ligent control theory and application, advancedcontrol technology and application, and urban road
traffic modeling and control technology.
XINSHUANG WANG received the M.Sc. degreefrom the School of Software Technology, DalianUniversity of Technology, Dalian, China, in 2017.Since 2017, she has been a Front-End Devel-oper with Tencent. Her research interests are datavisualization.
VOLUME 6, 2018 42141
Related Documents