This is the author’s version of a work that was submitted/accepted for pub- lication in the following source: Pike, Steven D., Murdy, Samantha,& Lings, Ian (2011) Visitor relation- ship orientation of destination marketing organisations. Journal of Travel Research, 50 (4), pp. 443-453. This file was downloaded from: c Copyright 2011 Sage Publications Notice: Changes introduced as a result of publishing processes such as copy-editing and formatting may not be reflected in this document. For a definitive version of this work, please refer to the published source: http://dx.doi.org/10.1177/0047287510368163

Welcome message from author
This document is posted to help you gain knowledge. Please leave a comment to let me know what you think about it! Share it to your friends and learn new things together.
Transcript

This is the author’s version of a work that was submitted/accepted for pub-lication in the following source:
Pike, Steven D., Murdy, Samantha, & Lings, Ian (2011) Visitor relation-ship orientation of destination marketing organisations. Journal of TravelResearch, 50(4), pp. 443-453.
This file was downloaded from: http://eprints.qut.edu.au/42213/
c© Copyright 2011 Sage Publications
Notice: Changes introduced as a result of publishing processes such ascopy-editing and formatting may not be reflected in this document. For adefinitive version of this work, please refer to the published source:
http://dx.doi.org/10.1177/0047287510368163

1
Visitor relationship orientation of destination marketing organisations
Pike, S., Murdy, S. & Lings, I. (2011). Visitor relationship orientation of destination marketing organisations. Journal of Travel Research. 50(4): 443-453.
Abstract
The proposition underpinning this study is engaging in meaningful dialogue with
previous visitors represents an efficient and effective use of resources for a
destination marketing organization (DMO), compared to above the line advertising in
broadcast media. However there has been a lack of attention in the tourism literature
relating to destination switching, loyalty and customer relationship management
(CRM) to test such a proposition. This paper reports an investigation of visitor
relationship marketing (VRM) orientation among DMOs. A model of CRM
orientation, which was developed from the wider marketing literature and a prior
qualitative study, was used to develop a scale to operationalise DMO visitor
relationship orientation. Due to a small sample, the Partial Least Squares (PLS)
method of structural equation modelling was used to analyse the data. Although the
sample limits the ability to generalise, the results indicated the DMOs’ visitor
orientation is generally responsive and reactive rather than proactive.
Key words
Tourism marketing, CRM, destination marketing, repeat visitors, destination loyalty,
visitor relationship marketing (VRM)

2
Introduction
In today’s competitive tourism markets the consumer-traveller is spoilt by choice of
available destinations, and so it is likely many places are substitutable in decision
making (Pike, 2008). In response to increasing competition, destinations have
progressively become involved in place branding development since the 1990s
(Morgan, Pritchard & Pride, 2002). Successfully differentiating a destination brand in
markets crowded with places offering the same benefits, at consumer decision time, is
arguably the greatest challenge now faced by destination marketing organisations
(DMOs). Since the emergence of the destination branding literature in the late 1990s
(see Dosen, Vransevic & Prebezac 1998, Pritchard & Morgan 1998), there has been
little reported about issues related to visitor loyalty and destination switching.
Customer relationship management (CRM) has emerged as an important branding
tool and strategy within the marketing field (Gronroos, 1994). There are two types of
consumer-traveller of interest to DMOs; those who have not previously visited the
destination, and those who have. Arguably, most above the line destination
advertising appears to fail to distinguish between the two groups. The proposition
guiding this paper is that establishing dialogue with selected visitors, in the pursuit of
repeat visitation and destination loyalty, is a more efficient and effective use of
resources than traditional above the line advertising that targets new customers. CRM
is underpinned by the philosophy that stimulating long term relationships with certain
customers will be more profitable over time than a never ending series of one-off
sales transactions. The cost of reaching new customers by far outweighs the cost of
maintaining contact with existing clientele (Kincaid, 2003).

3
A recent exploratory study undertaken by one of the authors found there was a general
recognition of the potential for visitor relationship management (VRM) by regional
tourism organisations in Queensland, Australia (Pike, 2007a). However, none of the
RTOs had been able to develop a formal approach towards engagement with previous
visitors. The study concluded more research was needed to guide destination
marketers about how to initiate meaningful dialogue, at the right time, with the
hundreds of thousands of potential repeat visitors to their destination, with whom
they do not come into direct contact. Four themes emerged, with the first being the
inability of RTOs to track repeat visitation. Following this point it was not surprising
therefore that little if any direct communication was undertaken with previous
visitors. With the exception of the development of an opt-in online consumer
database, RTOs were not explicitly attempting to stay in touch with previous visitors.
Third, there was a general assumption that some accommodation operators would be
engaging in VRM, even though participants acknowledged VRM had not been topic
of discussion in meetings with local industry. Additionally, in a separate survey of
consumers in Queensland (Pike, 2006) only 13% of participants could recall receiving
promotional material in the previous year from short break destinations they had
previously visited. A significant barrier for the RTOs is that visitors’ contact details
are only captured by accommodation operators. Thus, there are distinct and
substantial differences between the application of CRM by individual businesses and
by DMOs, which usually have no direct contact with the visitors they assist in
attracting to their destination. It is for this reason the term visitor relationship
management (VRM) is considered a more appropriate term for destination marketers
than CRM. The aim of the current project was to develop a scale to operationalise
visitor relationship orientation of DMOs.

4
Literature review
The relatively recent shift in thinking towards destinations as brands, particularly
since the 1990s, requires a brand management approach focusing on developing
relationships with visitors rather than simply focusing on generating sales. The
purpose of branding is to evoke emotions and prompt repeat consumer behaviour by
way of a promise to the consumer. Recognition of this has led to the development of
the concept of consumer-based brand equity (CBBE) as a brand performance measure
since the early 1990s (see Aaker 1991, Keller 2003), which offers the potential to
provide a link between past marketing efforts and future performance. CBBE has
been conceptualised as comprising brand awareness, perceived quality, brand
associations and brand loyalty. While there have been many studies of destination
awareness, quality and associations in the literature (see for example reviews of the
destination image literature by Chon 1990, Echtner and Ritchie 1991, Pike 2002,
2007b, Gallarza, Saura & Garcia 2002), there has been a lack of attention towards
destination loyalty (Oppermann 2000, Ritchie & Crouch 2003), which is at the
pinnacle of the CBBE hierarchy.
Every successful brand strategy requires effective communication. Not long after the
arrival of Aaker’s (1991) seminal branding text was the first integrated marketing
communication (IMC) text (see Schultz, Tannenbaum, & Lauterborn, 1993). While
there has been little published on the topic in the destination marketing literature IMC
has been incorporated in tourism marketing texts (see for example Morrison 2002,
Kotler, Bowen & Makens 1999). IMC has been defined as:

5
…a cross functional process from creating and nourishing profitable
relationships with customers and other stakeholders by strategically
controlling or influencing all messages sent to these groups and
encouraging data-driven, purposeful dialogue with them (Duncan,
2002).
There are five key fundamentals in this definition, all of which are likely to present
significant challenges for destinations. The first is stimulating profitable customer
relationships. The second is strengthening stakeholder relationships to enhance
understanding of the destination’s brand objectives. The third is creating a cross-
functional process between stakeholders, to ensure brand communication buy-in. The
fourth is generating message synergy across different types of media. The fifth is
stimulating purposeful dialogue with customers. ‘Purposeful dialogue’ is also at the
heart of CRM, about which the first texts also appeared in the early 1990s (see
McKenna 1991, Sheth & Parvatiyar 1993).
It is proposed there are two main reasons for DMOs to engage in VRM. The first is
the increasing potential for repeat visitation in some market segments. For example,
the state tourism organisation for Victoria in Australia reported strong repeat
visitation from some of the state’s key markets (see Harris, Jago & King, 2005), such
as New Zealand (over 90% repeaters), Singapore (60%) and Japan (10%). Likewise,
Tourism Queensland (2006) reported that 93% of New Zealand arrivals were repeat
visitors. There are differences in perceptions of destinations between people who have
visited a destination before and those who have not visited (Fakeye & Crompton
1991, Milman & Pizam 1995). While many travellers seek new places and new
6
experiences, there is evidence to suggest in domestic short break markets, travellers
take multiple trips each year and do have favourite destinations (Pike, 2006). The
second reason is the extent to which destinations are likely to be substitutable in the
face of the sheer number of competing places, particularly for low involvement
decisions.
Oppermann (1996, 1997) claimed little had been reported in the tourism literature
about repeat visitation. However, in the time since, there has been increasing interest
by tourism academics in examining the differences between repeat and first time
visitors, particularly relating to: re-visit intentions (see Yuksel 2000, Chen & Gursoy
2001, Niinen, Szivas & Riley 2004, Yoon & Uysal 2005, Alegre & Clader 2006,
Huang & Chiu, 2006, Um, Chon & Ro 2006), spending patterns (Alegre & Juaneda,
2006), and trip characteristics (Gitelson & Crompton 1984, Gyte & Phelps 1989, Pyo,
Song & Chang 1998, Oppermann 1996, 2000, Lau & McKercher 2004, McKercher &
Wong 2004). Research suggests destinations ought to determine whether repeat
visitors offer advantages in terms of increased satisfaction, loyalty and therefore yield.
Positive indicators would lead to the recognition of the need to engage in dialogue
with these visitors.
CRM has been given many different definitions, (see for example Nicholls 2000,
Binggelt et al. 2002, Bose 2002, Chang et al. 2002, Chen & Popovich 2003, Boulding
et al. 2005, Kamakura et al. 2005, Sigala 2005, Ozgener & Iraz 2006, Stockdale
2007), which generally fit into three distinct categories: i) a business strategy to
understand and anticipate consumer needs and wants, ii) a tool to gather customer
data over a period of time, and iii) a software program. One of the most commonly

7
cited definitions is that proposed by Gronroos (1994, p.9), who suggested the purpose
is to “identify and establish, maintain and enhance… relationships with customers…at
a profit…by mutual exchange and fulfilment of promises”. It is important to note that
in marketing the term ‘relationship’ is a metaphor that is literally false but offers
creative possibilities (O’Malley & Tynan, 1999). Marketing relationships are built on
knowledge, and when a customer shares information, the marketer should customise
the offer (Peppers & Rogers, 2000). CRM is concerned with using customer
information and technology to enhance quality experiences in order to maximise
loyalty (Kincaid, 2003). It is proposed a VRM orientation involves explicit efforts to
develop a long term bond with selected visitors to the destination, in order to
stimulate repeat visitation. The aim of this research was to test the development of a
scale to operationalize visitor relationship orientation of DMOs.

8
Method
Since no DMO VRM orientation scale has been developed, a model of CRM
orientation was developed from an extensive review of the wider marketing literature,
as well as interpretation of a previous qualitative investigation. Initially a total of 42
CRM critical success factors were identified from nine studies (see Bose 2002,
Wilson, Daniel & McDonald 2002, Bielski 2003, Beaujean, Davidson & Madge 2006,
King & Burgess 2006, Lin, Lin, Huang & Kuo 2006, Ozgener & Iraz 2006, Marchand
2006, Raman, Wittmann & Rauseo 2006). These were then compared to a scale
developed to measure CRM orientation in the financial sector (see Sin et al., 2005),
which along with a review of the interpretation of a prior qualitative investigation
(Pike, 2007a), resulted in the development of a proposed model of DMO VRM
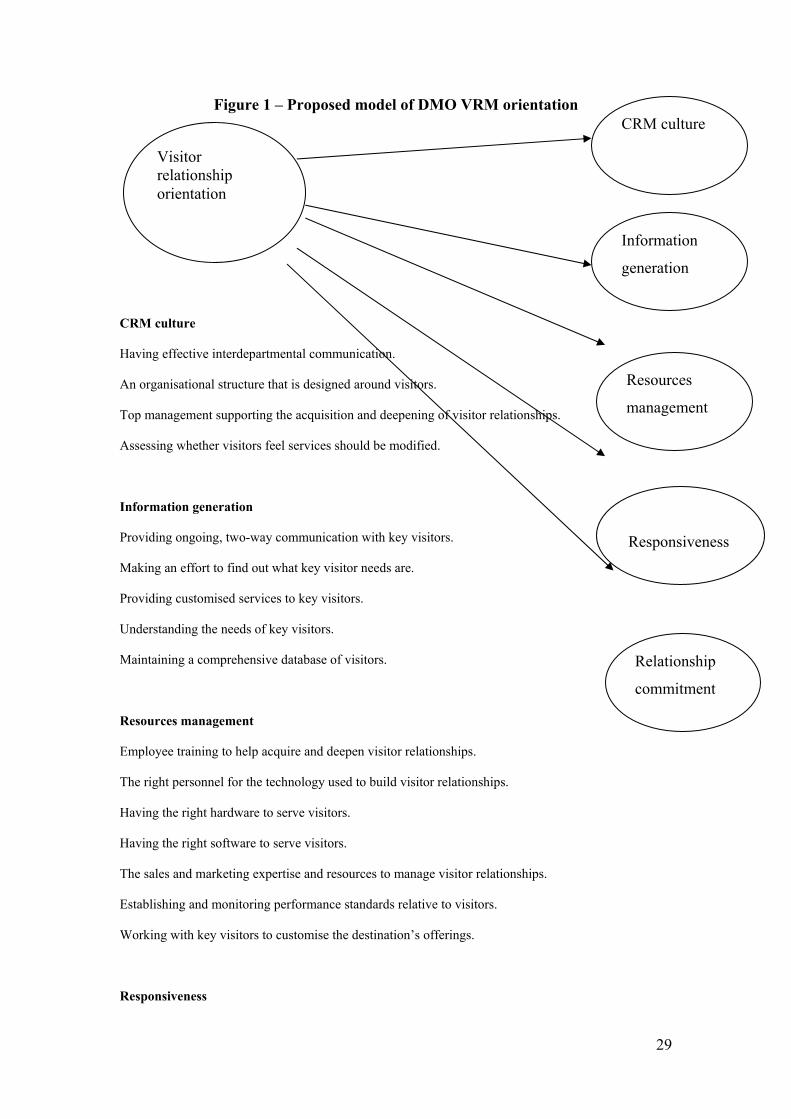
orientation. As shown in Figure 1, the model contains 23 items in five dimensions.
(FIGURE 1 ABOUT HERE)
A database of 1435 DMOs was developed as the sample frame. The DMOs comprised
CVBs, RTOs, RTBs and STOs in Australia, New Zealand, North America and the
United Kingdom, as well as NTOs from around the world. Where possible, specific e-
mail contacts were obtained for the marketing/ tourism/ communication management,
or chief executive officer/ director positions, otherwise a general enquiries e-mail was
obtained. Unfortunately many DMOs provide only general enquiry forms with no
contact e-mail addresses, which necessitated the request to participate had to be
inserted in this form.
9
During August 2008 an invitation to participate in an online survey, hosted by the
faculty, was emailed to the 1435 DMOs. One follow-up e-mail was sent in an attempt
to increase the response rate, following Sue and Ritter (2007, p. 90). The
questionnaire contained two sections. The first asked participants to rate the
importance of the 23 CRM items, using a seven point scale anchored at ‘not
important’ (1) and ‘very important’ (7). To test the scale properties, the second
section asked participants to rate their organisation’s performance across the same 23
items, using a seven point scale. Other questions related to issues of location,
structure, and legal entity. An incentive prize draw of 10 copies of a destination
marketing text was offered to participants.

10
Results
A total of 65 completed questionnaires were received, while a further 174 e-mails
(12.1%) were returned without reaching the intended participant, for a variety of
reasons, such as out of date e-mail addresses and SPAM filters (see Sue & Ritter,
2007). Although the 5.2% usable response rate is considered low, surveys targeting
businesses tend to have a lower response than consumer surveys (Sheehan &
McMillan, 1999, p. 46, Frazer and Lawley, 2000, p. 74). For example, Boo, Busser
and Baloglu’s (2008) online survey of consumers’ perceptions of gambling
destinations attracted a 5% response. Additionally, e-mail response rates are typically
lower than that for mail surveys due to an increasingly high rate of undeliverable e-
mails (Schaefer & Dillman, 1998, Weible & Wallace, 1998, p. 21). The literature
review highlighted the problematic nature of generating large samples of DMOs. For
example, Blain, Levy and Ritchie (2005) achieved a sample of 99 DMOs from around
the world. Park and Petrick (2006) received only eight responses. They suggested the
reasons that DMOs chose not to participate, included nondisclosure policies and
uncertainties about how their organisation would progress with the topic being
surveyed. These suggestions may help explain the low response rate for this type of
study.
Another potential reason for non-response identified in this study was a perception of
VRM within DMOs as something not conducted by them, but by visitor centres. For
example, a non-participating DMO voiced this concern about the study:

11
I have had a look at your survey. In Western Australia it is not the role of
DMOs to deal with visitors – it is the role of LTOs local tourist organisations ie
visitor centres. In WA no DMOs run VCs so the questionnaire is largely irrelevant.
Another opinion was based around the funding of one New Zealand RTO and the
concerns that they faced building and maintaining visitor relationships:
…it impossible to respond to the questions on the basis that as a Regional
Marketing Organisation we have neither the mandate nor the funding to be able to
even consider undertaking the kind of activities in your questionnaire… The fact is
that as an RTO we struggle to maintain our existing funding let alone to secure any
increase in funding (we have had the same funding levels for 11 years). Our funders
are one Regional Council Community Trust and three District Councils and as we
have 3 new Mayors at District Council level none of them really understands why they
fund tourism at all. This means that aside from talking to and lobbying Councils, our
marketing efforts must be targeted to achieve the best result we possibly can with very
limited funds - and the bottom line is visitor nights.
I understand there may be some argument for an RTO to endeavor to maintain visitor
relationships; however we have to see this as the responsibility of the tourism
operator who is in fact better placed to do so.Perhaps your survey will be easier for a
larger and better funded RTO to respond to (our funding is currently around
$520,000 pa).

12
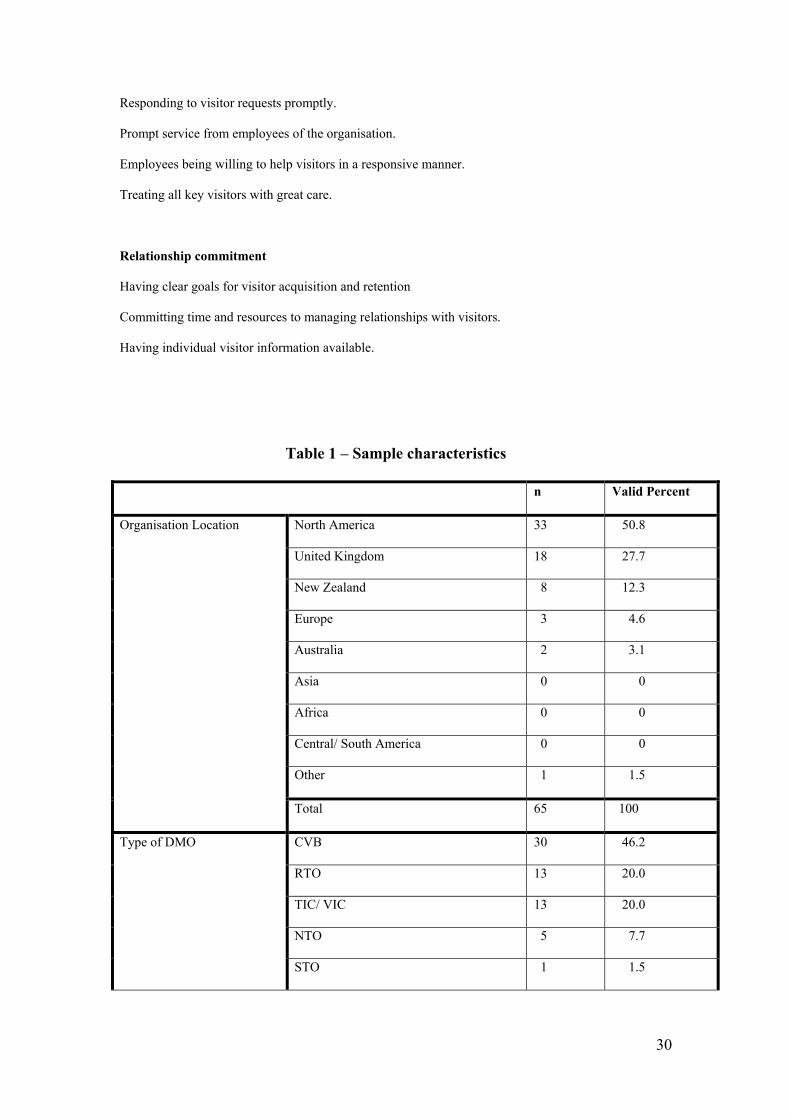
The sample characteristics are shown in Table 1, where it can be seen that the
majority of participants were from North America (51%) and the United Kingdom
(28%). Unfortunately, Asia, Africa and South America yielded no responses. In terms
of the type of DMO, CVBs were the largest group (46%), followed by RTOs (20%)
and TIC/ VICs (20%). Almost half of the participants represented DMOs with staff
numbers of 10 employees of less (48%). Only three DMOs had more than 150 staff.
TABLE 1 HERE
A cross-tabulation of employment of a CRM specialist, DMO hierarchy and the
number of staff employed, as shown in Table 2 highlights the majority of participants
(74%), which were not either an NTO or STO, did not hire a CRM specialist. In
comparison, only one of the six NTOs and STOs did not hire a CRM specialist. The
grand mean for the importance attribute items is 5.95, which indicates the validity of
the items from the perspective of these practitioners. The Cronbach alpha for 23
attribute importance items was .94, which indicates strong reliability for the scale.
As shown in Table 3, the means for the 23 attribute performance items range from 6.3
to 4.0. The performance results of the top four attributes indicate the DMOs have a
strong visitor orientation. However, the two lowest performance items suggest DMOs
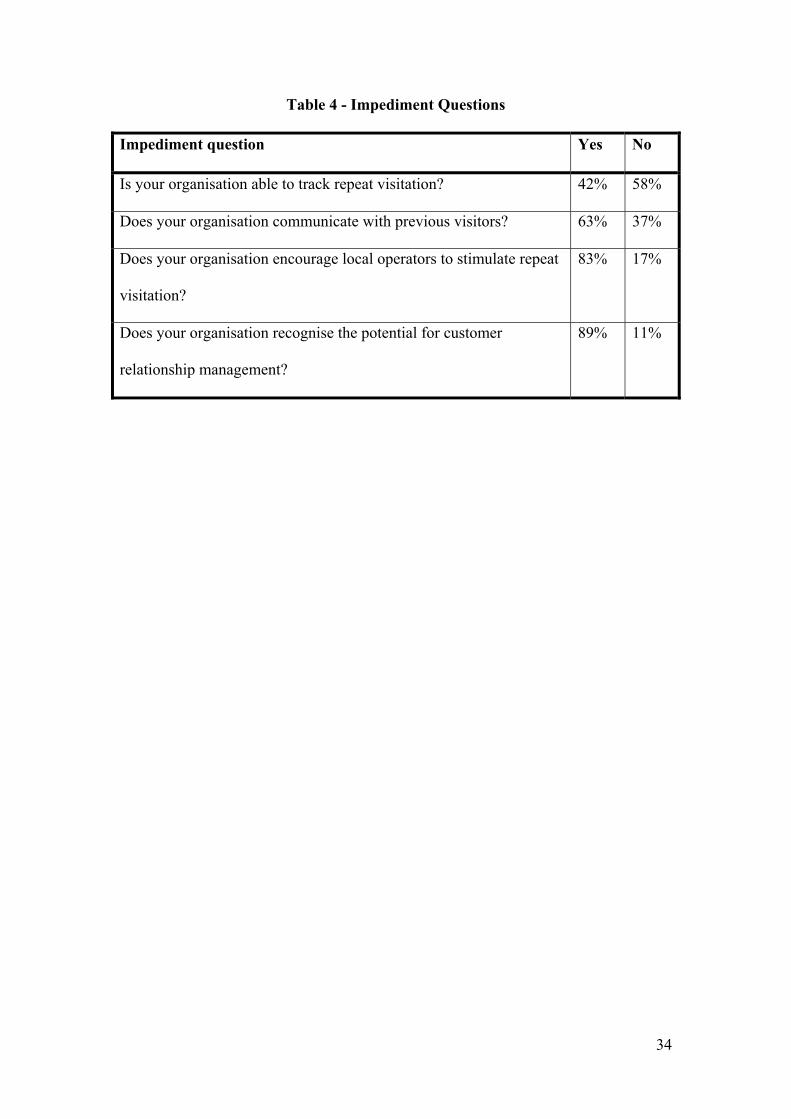
struggle to engage in dialogue with previous visitors. As shown in Table 4, the
majority (89%) recognised the potential for CRM within their organisation, while
almost two thirds indicate communicating with previous visitors. However, less than
half are able to track repeat visitation. These results indicate the DMOs’ visitor
orientation is generally responsive and reactive rather than proactive.
13
(TABLE 2 ABOUT HERE)
(TABLE 3 ABOUT HERE)
(TABLE 4 ABOUT HERE)
Partial least squares (PLS) was used to analyse the data and to test a measurement
model of relationship orientation as a second order construct. PLS optimises the
explained variance of relationship orientation and supports variance analysis ( R 2 )
and prediction. This is useful for exploratory studies characterised by relatively weak
a priori theory and where the primary focus is theory development. Another
advantage of PLS is that it supports model types with both reflective and formative
constructs and can be used with small samples as is the case with this study (Chin,
1998a, b; 2000; Chin and Gopal, 1995). For PLS analysis, the recommended sample
size should be equal ten times either the number of indicators of the most complex
formative latent variable or the largest number of independent variables impacting a
dependent variable; whichever is greater (Barclay et al. , 1995). Relationship
Orientation has five first-order reflective dimensions (i.e. Relationship Commitment,
Resources management/allocation, CRM culture, Information generation,
Responsiveness) with the most complex dimension, Resources
management/allocation, being reflected by seven items. Thus, the dependent variable
with the largest number of independent variables impacting it is CRM Organisation.
Accordingly, the recommended sample size is would be 70. At 65, the sample size
available to us approaches the minimum recommended for PLS analysis.
A two stage approach to developing a measure of relationship orientation as a higher
order construct was adopted. First, a lower order measurement model of the five
dimensions of relationship orientation was estimated. This was followed by the
14
estimation of a higher order model of relationship orientation, using aggregated data
for each of the first order constructs (factor scores). The reliability and validity of the
measures at both levels of abstraction were assessed using a variety of heuristics
(factor loadings, average variance extracted, composite reliability).
First order model
The average variance extracted, composite reliability, R2 and Cronbach’s α for the
five subscales of relationship orientation are reported in Table 5. All of these values
exceed their generally accepted recommended minima, and with moderately high R2
values, this suggest that the items reflect the underlying constructs well.
Several tests of discriminant validity were undertaken, these are discussed next and
evidence to support discriminant validity is presented. Following this, evidence from
three approaches to support the convergent validity of the scale is presented.
(TABLE 5 ABOUT HERE)
Discriminant validity
Evidence of discriminant validity is provided by a low to moderate correlation among
measures that are designed to measure conceptually different but related constructs.
For example, a phi coefficient significantly less than one offers support for
discriminant validity between constructs (Anderson & Gerbing, 1988). The inter-

15
factor correlations (φ) are reported in Table 6 and indicate that the scale items
discriminate between the dimensions of relationship orientation that they represent.
Additional evidence of discriminant validity is provided if the average variance
explained by a construct's items is greater than the construct's shared variance with
every other construct (i.e. the square of the inter-factor correlations between any two
constructs (φ2), Fornell and Larcker 1981). Analysis of the data provides strong
evidence of discriminant validity, with the average variance of each Relationship
Orientation dimension being greater than its shared variance with any other
dimension. It is therefore reasonable to assume all of the first order dimensions of the
Relationship Orientation scale to be unidimensional. The inter-factor correlations (φ),
squares of the inter-factor correlations (φ2), and average variances extracted are
reported in Table 6 also.
(TABLE 6 ABOUT HERE)
Composite reliability
Having established that each of the sub-scales measuring various dimensions of
relationship orientation do indeed discriminate between these factors, the next stage in
the analysis was to examine composite reliabilities of each of the sub-scales (Gerbing
& Anderson 1988, Hair et al. 1998, p. 611) exceed the recommended standards of
both Bagozzi and Yi (1991) and Hair et al. (1998), and provide evidence of the
internal consistency of the construct indicators. This suggests that the scale items do
indeed measure the latent constructs that they purport to.

16
Convergent validity
Fornell and Larcker (1981) suggest that variance extracted is a stringent test of
internal stability and convergent validity. Anderson and Gerbing (1988) offer an
alternative heuristic; that significant t-values support the convergent validity of scale
items. Both approaches were used to test the convergent validity of the relationship
orientation scales. Examining the variances extracted for each of the relationship
orientation dimensions, indicates that the scales explain more than 50% of the
variance in the data for each of the dimensions and so meet the stringent test of
convergent validity set by Fornell and Larcker (1981).
Finally, all 23 items load well onto the underlying dimension that they reflect (λ) and
have significant t-values >1.96 (Table 7) exceeding Anderson’s and Gerbing’s (1988)
heuristic, and suggesting that the scale items adequately represent the dimension that
they purport to measure. Overall these tests indicate that the scales measuring the
relationship orientation dimensions possess sufficient internal stability and convergent
validity to be considered for aggregation to test a higher order model of relationship
orientation.
(TABLE 7 ABOUT HERE)
Second order model
In order to measure the more abstract construct of relationship orientation, the data
from each of the scales measuring the dimensions of relationship orientation were
aggregated by calculating their factor scores. These aggregate measures were
modelled as items reflecting the higher order ‘relationship orientation’ construct.

17
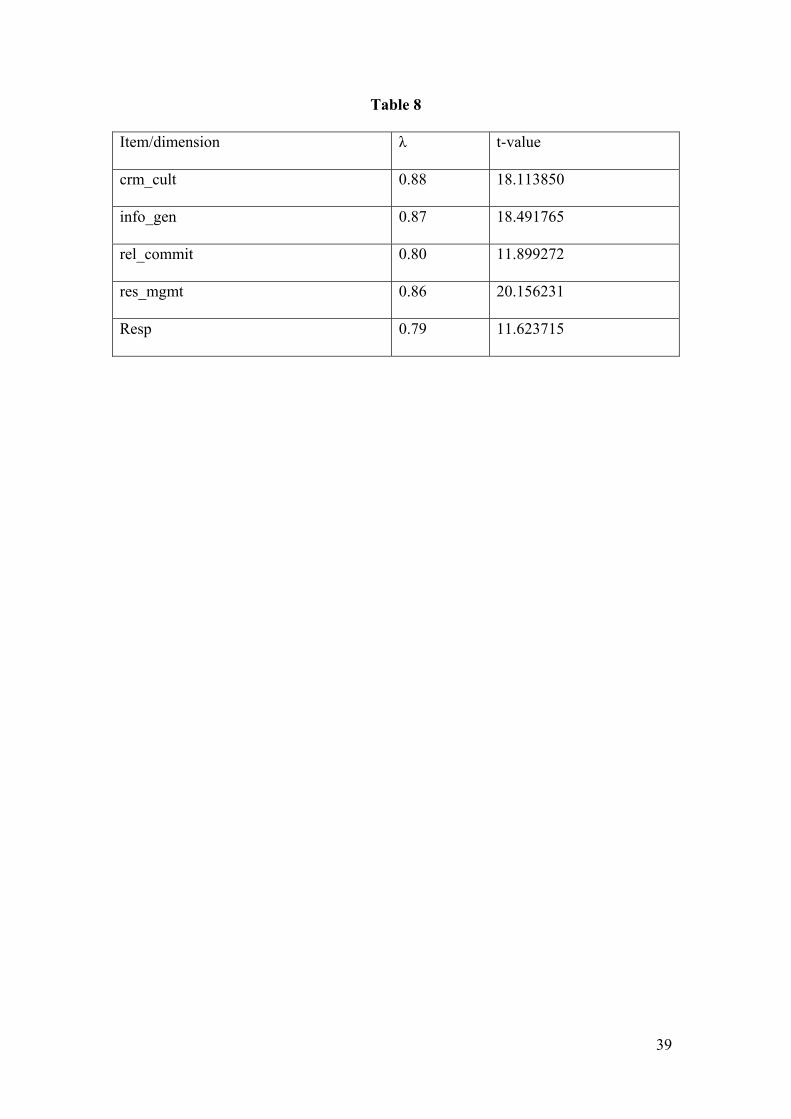
In order to test the adequacy of the higher order measurement model a variety of
heuristics were examined: item loadings (λ), average variance extracted, composite
reliability. The item loadings are reported in Table 8 and, as can be seen in the table,
all are high and significant. Other fit statistics also exceed the recommended minima
(AVE = 0.71, Composite Reliability = 0.92 and Coefficient α = 0.90) suggesting that
aggregating the data to measure the higher order construct is appropriate.
(TABLE 8 ABOUT HERE)

18
Conclusion
Customer relationship management (CRM) is a business strategy used by
organisations to enhance relationships with customers, increase brand loyalty and
stimulate repeat purchases. The rationale for CRM is that engaging in dialogue with
existing customers can represent a more efficient use of resources than above the line
advertising to attract a continual stream of non-customers. This study examines the
CRM orientation of destination marketing organisations (DMOs), since there has been
a lack of published research in this area. Motivating this research was an exploratory
study of 11 Queensland RTOs , which found that while management recognised the
potential of CRM, implementation was problematic. The aim of the study was to test a
scale to operationalise visitor relationship orientation of DMOs.
A model of visitor relationship orientation, comprising 23 items in five dimensions
was developed through a literature review as well as interpretation of a prior
qualitative investigation. The items were similar to a model of CRM orientation in the
financial sector developed by Sin, Tse and Yim (2005). An online questionnaire was
sent to a sample frame of 1,435 DMOs around the world, consisting of national
tourism organisations, state tourism organisations and regional tourism organisations.
A usable response rate of 5.2% (65 participants) was obtained. Due to the small
sample size the PLS method of structural equation modelling was used to examine the
data. The data fit the proposed model well.
One of the key issues to emerge from the study was the small response rate from a
sample frame of 1435 DMOs. Even though incentives were offered, and a follow up
request to participate was made, the study failed to attract a large and representative

19
sample. As discussed the problem is not unique to this project, with previous studies
also failing to attract a sample of DMOs that would enable generalisation of findings.
Given that i) the majority of tourism activities take place at destinations, ii)
destinations are the biggest brands in tourism, and iii) there is a lack of published
research about visitor relationship management by DMOs, there is clearly a need for a
different approach to sampling. At a global level, perhaps the solution lies with a
coordinated approach in conjunction with the UNWTO, and at national and state
levels through NTOs and STOs.
While the sample characteristics do not permit generalising, the findings did support
the interpretation of a previous qualitative investigation of visitor relationship
orientation of RTOs in Queensland, Australia. The results of this study indicate the
DMOs’ visitor orientation is generally responsive and reactive rather than proactive.
That is, DMOs are in general able to respond to visitor enquiries in an efficient and
effective manner, but fail to be able to proactively engage in dialogue with previous
visitors. Comments from a New Zealand RTO suggest that DMOs remain focussed on
attracting visitors rather than encouraging repeat visits. The RTO stated: our
marketing efforts must be targeted to achieve the best result we possibly can with very
limited funds - and the bottom line is visitor nights. This appears to suggest that the
lack of funding and the focus on recruiting new visitors hinders the development of a
relationship orientation and that tactics remain focused on a more transactional
approach to marketing. DMOs rarely come into direct contact with the visitors they
have been successful in attracting to their destination. The DMO doesn’t therefore
have access to the contact details of these consumers, who stay in commercial
accommodation or with friends and relatives. Without access to such contact details,

20
the development of a database is problematic for the DMO. Such a database underpins
any form of continued contact with previous visitors. Therefore more research is
required to identify i) how DMOs are able to develop a database of previous visitors,
and then ii) how DMOs can engage in meaningful dialogue. The latter involves
engaging with previous visitors at an individual or segment level, where offers are
tailored to specific needs at relevant times. This is clearly more than an e-newsletter
emailed to all database contacts.

21
References
Aaker, D. A. (1991). Managing Brand Equity. New York: Free Press.
Alegre, J. & Cladera, M. (2006). Repeat Visitation in Mature Sun and Sand Holiday
Destinations. Journal of Travel Research, 44(1) 288.
Anderson, James. C. and Gerbing, David. W. (1988), “Structural Equation Modelling
in Practice: A Review and Recommended Two-Step Approach”,
Psychological Bulletin, Vol. 103, No. 3, pp. 411-423.
Anton,. & Petouhoff. (2001). Customer Relationship Management. Sydney: Pearson
Education Australia.
Bagozzi, R. P., Yi, Y. and Phillips, L. W., (1991), “Assessing construct validity in
organizational research”, Administrative Science Quarterly, 36, 421-458
Barclay, D., C. Higgins and R. Thompson, 1995. The partial least squares (PLS)
approach to causal modeling: Personal computer adoption and use as an
illustration. Technology Studies, 2 (2): 285–309.
Beaujean, M., Davidson, J., & Madge, S. (2006). The 'moment of truth' in customer
service. McKinsey Quarterly, 2006(1).
Blain, C., Levy, S. & Ritchie, J. (2005). Destination Branding: Insights and Practices
from Destination Management Organizations. Journal of Travel Research,
43(4) 328-338.
Binggelt, U., Gupta, S. and de Pommes, C. (2002). CRM in the air. McKinsey
Quarterly, 36(2).
Bose, R. (2002). Customer relationship management: key components for IT success.
Industrial Management + Data Systems, 102(1/2) 89-97.

22
Boulding, W., Staelin, R., Ehret, M. & Johnston, W. (2005). A Customer Relationship
Management Roadmap: What is known, Potential Pitfalls, and Where to Go.
Journal of Marketing, 69(2005) 155-166.
Chang, J., Yen, D., Ku, C.-Y., & Young, D. (2002). Critical issues in CRM adoption
and implementation. International Journal of Services and Technology
Management, 3(3), 311-324.
Chen, J.S., & Gursoy, D. (2001). An investigation of tourists’ destination loyalty and
preferences. International Journal of Contemporary Hospitality Management.
13(2): 79-85.
Chen, I., & Popovich, K. (2003). Understanding customer relationship management
(CRM): People, process and technology. Process Management Journal, 9(5),
672-688.
Chin Wynne. W (1998), “Issues and Opinion on Structural Equation Modeling”, MIS
Quarterly, Vol. 22, No. 1, pp. vii-xvi.
Chin, W. W. (1998), "The partial least squares approach for structural equation
modeling", in Marcoulides, G. A. (Ed.), Modern Methods for Business
Research, Lawrence Erlbaum Associates, Mawah, NJ, pp. 295-336).
Chin W.W and Gopal A (1995) Adoption Intentions in GSS: Relative Importance of
Beliefs, Database for Advanced Information Systems 26(2 & 3) 42-64
Chon, K. (1990). The role of destination image in tourism: a review and discussion.
The Tourist Review. 45(2):2-9.
Dosen, D.O., Vranesevic, T., Prebezac, D. (1998). The importance of branding in the
development of marketing strategy of Croatia as tourist destination. Acta
Turistica. 10(2): 93-182.
23
Duncan, T. (2002).IMC: Using Advertising and Promotion to Build Brands.
McGraw-Hill.
Echtner, C.M. and Ritchie, J.R.B. (1991). The meaning and measurement of
destination image. The Journal of Tourism Studies. 2(2): 2-12.
Fakeye, P. C., & Crompton, J. L. (1991). Image differences between prospective, first
time, and repeat visitors to the Lower Rio Grande Valley. Journal of Travel
Research. 30: 10-16.
Fornell, Claes and Larcker, David (1981), “Structural Equation Models with
Unobservable Variables and Measurement Error: Algebra and Statistics”,
Journal Of Marketing Research, Vol. 18, No. 3, pp. 382-388
Frazer, L. & Lawley, M. (2000). Questionnaire design & administration: a practical
guide. Brisbane: John Wiley & Sons Australia, Ltd.
Gallarza, M. G., Saura, I. G., & Garcia, H. C. (2002). Destination image: toward a
conceptual framework. Annals of Tourism Research. 29(1): 56-78.
Gardner, B. B., & Levy, S. J. (1955). The product and the brand. Harvard Business
Review. March-April: 33-39.
Gerbing, David W. and Anderson, James. C. (1988), “An Updated Paradigm for Scale
Development Incorporating Unidimensionality and its Assessment’, Journal of
Marketing Research, Vol. 25, No. 2, pp. 361-370.
Gitelson, R., & Crompton, J. (1984). Insights into the Repeat Vacation Phenomenon.
Annals of Tourism Research, 11(1) 199-217.
Grönroos, C. (1994). From marketing mix to relationship marketing: towards a
paradigm shift in marketing. Management Decision. 32(2): 4-20.
Gyte, D.M., & Phelps, A. (1989). Patterns of destination repeat business: British
24
tourists in Mallorca, Spain. Journal of Travel Research. Summer: 24-28.
Hair, Joesph. F. Jr., Anderson, Ronald. E., Tatham, Rolph. L. and Black, William. C.
(1998), Multivariate Data Analysis, 5th edition, Prentice Hall, New Jersey,
USA.
Harris, R., Jago, L., & King, B. (2005). Case Studies in Tourism & Hospitality
Marketing. Frenchs Forest, NSW: Pearson.
Huang, H.H., & Chiu, C.K. (2006). Exploring customer satisfaction, trust and
destination loyalty in tourism. Journal of American Academy of Business.
10(1): 156-159.
Kamakura, W., Mela, C., Ansari, A., Bodapati, A., Fader, P., Iyengar, R., et al.
(2005). Choice Models and Customer Relationship Management. Marketing
Letters, 16(3/4), 279-291.
Keller, K.L. (2003). Strategic Brand Management. Upper Saddle River, NJ: Prentice
Hall.
Kincaid, J.W. (2003). Customer Relationship Management – Getting it Right. Upper
Saddle River, NJ: Prentice Hall PTR.
King, S., & Burgess, T. (2006). Beyond critical success factors: A dynamic model of
enterprise system innovation. International Journal of Information
Management, 26(1), 59-69.
Kotler, P., Bowen, J., & Makens, J. (1999). Marketing for Hospitality and Tourism.
(2nd Ed). Upper Saddle River, N.J: Prentice-Hall.
Lau, A.L.S., & McKercher, B. (2004). Exploration versus acquisition: a comparison
of first-time and repeat visitors. Journal of Travel Research. 42(February):
279-285.

25
Marchand, D. (2006). Customer Relationship Management Challenging the Myth:
Focus on People not the Technology. Perspectives for Managers, 131(1), 1.
McKercher, B., & Wong, Y.Y. (2004). Understanding tourism behaviour: examining
the combined effects of prior visitation history and destination status. Journal
of Travel Research. 43(November): 171-179.
Milman, A., & Pizam, A. (1995). The role of awareness and familiarity with a
destination: The central Florida case. Journal of Travel Research. 33 (3): 21-
27.
Morgan, N., Pritchard, A., & Pride, R. (2002). Destination Branding – Creating the
Unique Destination Proposition. Oxford: Butterworth-Heinemann.
Morrison, A. (2002). Hospitality and Travel Marketing. (3rd Ed). Albany, NY:
Delmar.
Nicholls, C. (2000). CRM systems provide excellent source for research. Marketing
News, 34(19), 28-29.
Niininen, O., Szivas, E., & Riley, M. (2004). Destination loyalty and repeat
behaviour: an application of optimum stimulation measurement. International
Journal of Tourism Research. 6: 439-447.
O’Malley, L., & Tynan, C. (1999). The utility of the relationship metaphor in
consumer markets: a critical evaluation. Journal of Marketing Management.
15: 587-602.
Oppermann, M. (1996). Visitation of tourism attractions and tourist expenditure
patterns - repeat versus first-time visitors. Asia Pacific Journal of Tourism
Research. 1 (1): 61-68.
Oppermann, M. (1997). First-time and repeat visitors to New Zealand. Tourism
Management. 18(3): 177-181.
26
Oppermann, M. (1999). Where psychology and geography interface in tourism
research and theory. In Woodside, A. G., Crouch, G.I, Mazanec, J. A.,
Oppermann., & Sakai, M. Y. (Eds). ConsumerPsychology of Tourism,
Hospitality and Leisure. Wallingford: CABI.
Oppermann, M. (2000). Tourism destination loyalty. Journal of Travel Research.
39(August): 78-84.
Ozgener, S., & Iraz, R. (2006). Customer relationship management in small-medium
enterprises: The case of Turkish tourism industry. Tourism Management,
27(6), 1356-1363.
Peppers, D., & Rogers, M. (2000). Build a one-to-one learning relationship with your
customers. Interactive Marketing. 1(3): 243-250.
Park, S. & Petrick, J. (2006). Destinations’ Perspectiveas of Branding. Annals of
Tourism Research, 33(1) 262-265.
Pike, S. (2002). Destination Image Analysis: A Review of 142 Papers from 1973-
2000. Tourism Management. 23(5): 541-549.
Pike, S. (2006). Destination decision sets: A longitudinal comparison of stated
Destination preferences and actual travel. Journal of Vacation Marketing.
12(4): 319-328.
Pike, S. (2007a). Repeat visitors – an exploratory investigation of RTO responses.
Journal of Travel & Tourism Research. Spring: 1-13.
Pike, S. (2007b). Destination image literature: 2001 – 2007. Acta Turistica. 19(2):
107-125.
Pike, S. (2008). Destination Marketing. Burlington, MA: Butterworth-Heinemann.
Pritchard, A., & Morgan, N. (1998). Mood marketing - the new destination branding
strategy: a case of Wales the brand. Journal of Vacation Marketing. 4(3): 215-
27
29.
Pyo, S., Song, J., & Chang, H. (1998). Implications of repeat visitor patterns: the
Cheju Island case. Tourism Analysis. 3: 181-187.
Raman, P., Wittmann, C., & Rauseo, N. (2006). Leveraging CRM for sales: the role
of organizational capabilities in successful CRM implementation. Journal of
Personal Selling and Sales Management, 26(1), 39-53.
Ritchie, J.R.B., & Crouch, G. (2003). The Competitive Destination – A Sustainable
Tourism Perspective. Oxon: CABI Publishing.
Schaefer, D. & Dillman, D. (1998). Development of a standard e-mail methodology.
Public Opinion Quarterly, 62(3), 378-397.
Schultz, D., Tannenbaum, S., & Lauterborn, R. (1993). Integrated Marketing
Communications. Lincolnwood, IL: NTC Publishing.
Sigala, M. (2005). Integrating customer relationship management in hotel operations:
managerial and operational implications. Hospitality Management, 24(2005),
391-413.
Sin, L., Tse, A., & Yim, F. (2005). CRM: conceptualization and scale development.
European Journal of Marketing, 39(11/12), 1264-1392.
Sheehan, K. & McMillan, S. (1999). Response variation in E-mail surveys: an
exploration. Journal of Advertising Research, 1999(July/ August).
Stockdale, R. (2007). Managing customer relationships in the self-service
environment of e-tourism. Journal of Vacation Marketing, 13(3), 205-219.
Sue, V. & Ritter, L. (2007). Conducting Online Surveys. Sage Publications: London.
Weible, R. & Wallace, J. (1998). Cyber research: the impact of the internet on data
collection. Marketing Research, 1998(Fall), 19-31.

28
Wilson, H., Daniel, E., & McDonald. (2002). Factors for Success in Customer
Relationship Management (CRM) Systems. Journal of Marketing
Management, 18(1/2), 193-219.
Yuksel, A. (2000). Managing customer retention: a case of tourism destinations,
Turkey. In Robinson, M., Evans, N., Long., Sharpley, R., & Swarbrooke, J.
(Eds). Management, Marketing and the Political Economy of Travel and
Tourism. Sunderland: Business Education Publishers.
29
Figure 1 – Proposed model of DMO VRM orientation
CRM culture
Having effective interdepartmental communication.
An organisational structure that is designed around visitors.
Top management supporting the acquisition and deepening of visitor relationships.
Assessing whether visitors feel services should be modified.
Information generation
Providing ongoing, two-way communication with key visitors.
Making an effort to find out what key visitor needs are.
Providing customised services to key visitors.
Understanding the needs of key visitors.
Maintaining a comprehensive database of visitors.
Resources management
Employee training to help acquire and deepen visitor relationships.
The right personnel for the technology used to build visitor relationships.
Having the right hardware to serve visitors.
Having the right software to serve visitors.
The sales and marketing expertise and resources to manage visitor relationships.
Establishing and monitoring performance standards relative to visitors.
Working with key visitors to customise the destination’s offerings.
Responsiveness
Visitor relationship orientation
CRM culture
Information
generation
Relationship
commitment
Resources
management
Responsiveness
30
Responding to visitor requests promptly.
Prompt service from employees of the organisation.
Employees being willing to help visitors in a responsive manner.
Treating all key visitors with great care.
Relationship commitment
Having clear goals for visitor acquisition and retention
Committing time and resources to managing relationships with visitors.
Having individual visitor information available.
Table 1 – Sample characteristics
n Valid Percent
Organisation Location North America 33 50.8
United Kingdom 18 27.7
New Zealand 8 12.3
Europe 3 4.6
Australia 2 3.1
Asia 0 0
Africa 0 0
Central/ South America 0 0
Other 1 1.5
Total 65 100
Type of DMO CVB 30 46.2
RTO 13 20.0
TIC/ VIC 13 20.0
NTO 5 7.7
STO 1 1.5

31
Other 3 4.6
Total 65 100
Number of Staff Less than 10 31 48.4
11-20 16 25.0
21-30 6 9.4
31-40 4 6.2
51-100 2 3.1
41-50 1 1.6
101-150 1 1.6
More than 150 3 4.7
Total (One missing) 64 100
CRM Specialist No CRM specialist 48 23.1
Full-time CRM specialist 15 3.1
Part-time CRM specialist 2 73.8
Total 65 100

32
Table 2 - Cross Tabulation of DMO characteristics
Hierarchy
(NTOs/STOs)
Hierarchy
(All others)
No. of Staff
(<10)
No. of
Staff (10
or more)
CRM Specialist
(Employed)
5 11 8 8
CRM Specialist
(Not Employed)
1 48 23 25
Missing Values 1

33
Table 3 – Attribute performance
Attribute Mean
Employees being willing to help visitors in a responsive manner. 6.3
Responding to visitor requests promptly. 6.1
Prompt service from employees of the organisation. 6.0
Treating all key visitors with great care. 5.9
Making an effort to find out what key visitor needs are. 5.7
Providing customised services to key visitors. 5.4
Having individual visitor information available. 5.3
Understanding the needs of key visitors. 5.2
Committing time and resources to managing relationships with visitors. 5.2
Top management supporting the acquisition and deepening of visitor
relationships.
5.1
Having effective interdepartmental communication. 5.0
Providing ongoing, two-way communication with key visitors. 4.9
The sales and marketing expertise and resources to manage visitor
relationships.
4.9
Assessing whether visitors feel services should be modified. 4.8
The right personnel for the technology used to build visitor relationships. 4.8
Working with key visitors to customise the destination’s offerings. 4.8
Establishing and monitoring performance standards relative to visitors. 4.8
Employee training to help acquire and deepen visitor relationships. 4.7
Having the right software to serve visitors. 4.5
Having the right hardware to serve visitors. 4.5
An organisation structure that is designed around visitors. 4.4
Maintaining a comprehensive database of visitors. 4.3
Having clear goals for visitor acquisition and retention. 4.0
Grand Mean 5.1
34
Table 4 - Impediment Questions
Impediment question Yes No
Is your organisation able to track repeat visitation? 42% 58%
Does your organisation communicate with previous visitors? 63% 37%
Does your organisation encourage local operators to stimulate repeat
visitation?
83% 17%
Does your organisation recognise the potential for customer
relationship management?
89% 11%

35
Table 5 – First order model reliability
AVE CR R2 Cronbach’s α
CRM culture 0.70 0.91 0.78 0.86
Information generation 0.69 0.92 0.77 0.89
Resources management/allocation 0.63 0.92 0.79 0.90
Responsiveness 0.80 0.94 0.64 0.91
Relationship Commitment 0.68 0.86 0.60 0.76

36
Table 6 – Inter factor correlations
CRM
culture
Information
generation
Resources
management/allocationResponsiveness
Relationship
Commitment
CRM culture
Information generation φ=0.69
(φ2=0.48)
Resources
management/allocation
φ=0.79
(φ2=0.62)
φ=0.67
(φ2=0.45)
Responsiveness φ=0.59
(φ2=0.35)
φ=0.72
(φ2=0.52)
φ=0.56
(φ2=0.31)
Relationship
Commitment
φ=0.65
(φ2=0.42)
φ=0.62
(φ2=0.38)
φ=0.63
(φ2=0.40)
φ=0.54
(φ2=0.29)

37
Table 7
Item Dimension λ T Statistics
IdentifyingCustomisationP_1
CULTURE
0.868296 29.538292
InterdepartmentalP_1 0.798969 14.306140
StructureP_1 0.857201 16.994713
TopManagementP_1 0.831785 13.788277
DatabaseP_1
INFO GEN
0.628830 6.063308
EffortNeedsP_1 0.886565 28.789880
ProvidingCustomisationP_1 0.911894 46.633826
TwoWayP_1 0.835680 15.763912
UnderstandingP_1 0.868585 16.386037
ExpertiseP_1
RES MGMT
0.766922 12.611620
HardwareP_1 0.830284 14.770839
ModificationP_1 0.784923 11.392503
PerformanceP_1 0.715042 8.737552
PersonnelP_1 0.801086 15.602162
SoftwareP_1 0.821619 14.142469
TrainingP_1 0.838968 21.424484
PromptP_1
RESPONSIVENESS
0.865471 10.875748
RequestsP_1 0.909945 33.475255
ResponsiveP_1 0.917187 30.256512
VisitorCareP_1 0.873758 12.457790
TimeP_1 rel commit 0.897235 33.090193

38
IndividualP_1 0.776374 8.333310
GoalsP_1 0.793348 8.644823
39
Table 8
Item/dimension λ t-value
crm_cult 0.88 18.113850
info_gen 0.87 18.491765
rel_commit 0.80 11.899272
res_mgmt 0.86 20.156231
Resp 0.79 11.623715
Related Documents