Visible Light Induced Photocatalytic Degradation of Rhodamine B on One-Dimensional Iron Oxide Particles † Xuemei Zhou, ‡ Hongchao Yang, § Chenxuan Wang, ‡ Xiaobo Mao, ‡ Yinshu Wang, § Yanlian Yang, ‡ and Gang Liu* ,‡ National Center for Nanoscience and Technology, Beijing, 100190, China, and Department of Physics, Beijing Normal UniVersity, Beijing, 100875, China ReceiVed: April 9, 2010; ReVised Manuscript ReceiVed: August 16, 2010 Visible light (λ > 420 nm) induced photocatalytic degradation of rhodamine B (RhB) in the presence of H 2 O 2 by one-dimensional (1D) nanorods of goethite (R-FeOOH) and hematite (R-Fe 2 O 3 ) has been investigated, and results were compared to those of micrometer-sized rods. R-FeOOH nanorods were self-assembled by oriented attachment of R-FeOOH primary nanoparticles, while porous R-Fe 2 O 3 rods were prepared by thermal dehydration of respective R-FeOOH precursors via a topotactic transformation. The as-prepared samples were characterized by powder X-ray diffraction, micro-Raman spectroscopy, diffuse reflectance UV-visible spectroscopy, X-ray photoelectron spectroscopy, nitrogen adsorption-desorption, high-angle annular dark- field scanning transmission electron microscopy, transmission electron microscopy, and high-resolution transmission electron microscopy. Nanosized R-FeOOH and R-Fe 2 O 3 particles appeared to be more active than microsized ones in terms of surface area normalized reaction rate, suggesting intrinsic photocatalytic properties of nanorods as compared to microrods in both R-FeOOH and R-Fe 2 O 3 . In addition, R-Fe 2 O 3 nanorods exhibited the greatest activity among the as-prepared samples. The observed photocatalytic performance by iron oxide particles was attributed to the synergetic effects of the particle composition, size, porosity, and the variations of local structure. The results from current study will be potentially applicable to a range of naturally abundant semiconducting minerals and compounds (e.g., metal oxyhydroxides and metal oxides). 1. Introduction Nanomaterials are currently receiving much attention due to their unique size-, shape-, and crystallinity-dependent optical, electronic, magnetic, and chemical properties. 1 Nanomaterials possess physical and chemical properties that may benefit electronic device development, medicine, renewable energy, and environmental remediation. A significant amount of research has focused on understanding the unique and useful properties of nanomaterials. In nanocatalysis, one prototypical example is gold. 2,3 Unlike bulk gold that is the most catalytically inert metal, gold nanoparticles supported on a range of oxides (e.g., TiO 2 , MgO) were found to exhibit enhanced catalytic activity for CO oxidation at room temperature and below 4,5 and shows prominent reactivity in many other reactions such as desulfurization (DeSO x ) 6,7 and the water-gas shift (WGS). 8 Among nanomaterials, metal oxides represent one of the most diverse classes of materials with both fundamental and tech- nological importance. One of metal oxides which occur ubiquitously in the environment is iron oxides. 9-12 In particular, goethite (R-FeOOH) and hematite (R-Fe 2 O 3 ) are extremely common in soils and sediments at and near the Earth’s surface. Apart from its traditional use as a pigment, 9 R-FeOOH has found other technological applications as well, such as magnetic recording media precursor, 13 mineral liquid crystal colloid, 14 and environmental contaminant scavenger for wastewater treat- ment. 12,15,16 Compared to other iron oxides, under ambient conditions R-Fe 2 O 3 is most stable. R-Fe 2 O 3 has many applica- tions such as light-induced water splitting, 17 catalysis, 18 gas sensors, 19 solar cells, 20 field emission devices, 21 and magnetic materials. 22-27 Both R-FeOOH and R-Fe 2 O 3 nanocrystallites exhibit unique reactivity at the nanoscale. For example, the rate of reductive dissolution of 64 nm (length) × 5 nm (width) R-FeOOH nanorods (NRs) by hydroquinone is two times faster than that of 367 nm (length) × 22 nm (width) ones. 15 In the catalytic oxidation of aqueous Mn 2+ , the rate exhibited by 7 nm R-Fe 2 O 3 nanocrystals is 1 to 2 orders of magnitude faster than that of 37 nm R-Fe 2 O 3 nanocrystals. 28 In recent years, significant attention has been directed toward abatement of noxious species in air and aqueous media. 29-32 Organic dyes are often used in printing, textile, and photographic industries. A sizable fraction of dyes is lost in the dying process and released into the effluent water streams. In many situations, the degradation rate of dyes is slow by sunlight without catalytic assistance. Therefore, it is necessary to employ appropriate catalysts to degrade dyes in aqueous solution. Dye degradation by semiconductor-based photocatalysts, e.g., TiO 2 , has been investigated extensively. 31,33 Nevertheless, TiO 2 with an inherent band gap of 3.0-3.3 eV can only adsorb ultraviolet light (UV, with wavelength λ < 400 nm), which accounts for a small fraction of the solar spectrum. Driven by global energy and environmental challenge, considerable effort has been made to modify existing TiO 2 photocatalysts or developing alternative ones, with a goal to extend the range of light absorption into the visible region. 31,32,34 Narrower band gap semiconductors, such as CdS, 35 Fe 2 O 3 , 36-43 WO 3 , 44-46 CaIn 2 O 4 , 47 BaBiO 3 , 48 and Bi 2 SbVO 7 , 49 have been addressed. In particular, nanosized semiconductor particles with large surface areas and a variety † Part of the “D. Wayne Goodman Festschrift”. * To whom all correspondence should be addressed: e-mail, liug@ nanoctr.cn; fax, (+86) 10-62656765. ‡ National Center for Nanoscience and Technology. § Department of Physics, Beijing Normal University. J. Phys. Chem. C 2010, 114, 17051–17061 17051 10.1021/jp103816e 2010 American Chemical Society Published on Web 09/07/2010

Welcome message from author
This document is posted to help you gain knowledge. Please leave a comment to let me know what you think about it! Share it to your friends and learn new things together.
Transcript

Visible Light Induced Photocatalytic Degradation of Rhodamine B on One-DimensionalIron Oxide Particles†
Xuemei Zhou,‡ Hongchao Yang,§ Chenxuan Wang,‡ Xiaobo Mao,‡ Yinshu Wang,§
Yanlian Yang,‡ and Gang Liu*,‡
National Center for Nanoscience and Technology, Beijing, 100190, China, and Department of Physics, BeijingNormal UniVersity, Beijing, 100875, China
ReceiVed: April 9, 2010; ReVised Manuscript ReceiVed: August 16, 2010
Visible light (λ > 420 nm) induced photocatalytic degradation of rhodamine B (RhB) in the presence ofH2O2 by one-dimensional (1D) nanorods of goethite (R-FeOOH) and hematite (R-Fe2O3) has been investigated,and results were compared to those of micrometer-sized rods. R-FeOOH nanorods were self-assembled byoriented attachment of R-FeOOH primary nanoparticles, while porous R-Fe2O3 rods were prepared by thermaldehydration of respective R-FeOOH precursors via a topotactic transformation. The as-prepared samples werecharacterized by powder X-ray diffraction, micro-Raman spectroscopy, diffuse reflectance UV-visiblespectroscopy, X-ray photoelectron spectroscopy, nitrogen adsorption-desorption, high-angle annular dark-field scanning transmission electron microscopy, transmission electron microscopy, and high-resolutiontransmission electron microscopy. Nanosized R-FeOOH and R-Fe2O3 particles appeared to be more activethan microsized ones in terms of surface area normalized reaction rate, suggesting intrinsic photocatalyticproperties of nanorods as compared to microrods in both R-FeOOH and R-Fe2O3. In addition, R-Fe2O3 nanorodsexhibited the greatest activity among the as-prepared samples. The observed photocatalytic performance byiron oxide particles was attributed to the synergetic effects of the particle composition, size, porosity, and thevariations of local structure. The results from current study will be potentially applicable to a range of naturallyabundant semiconducting minerals and compounds (e.g., metal oxyhydroxides and metal oxides).
1. Introduction
Nanomaterials are currently receiving much attention due totheir unique size-, shape-, and crystallinity-dependent optical,electronic, magnetic, and chemical properties.1 Nanomaterialspossess physical and chemical properties that may benefitelectronic device development, medicine, renewable energy, andenvironmental remediation. A significant amount of researchhas focused on understanding the unique and useful propertiesof nanomaterials. In nanocatalysis, one prototypical example isgold.2,3 Unlike bulk gold that is the most catalytically inert metal,gold nanoparticles supported on a range of oxides (e.g., TiO2,MgO) were found to exhibit enhanced catalytic activity for COoxidation at room temperature and below4,5 and shows prominentreactivity in many other reactions such as desulfurization(DeSOx)6,7 and the water-gas shift (WGS).8
Among nanomaterials, metal oxides represent one of the mostdiverse classes of materials with both fundamental and tech-nological importance. One of metal oxides which occurubiquitously in the environment is iron oxides.9-12 In particular,goethite (R-FeOOH) and hematite (R-Fe2O3) are extremelycommon in soils and sediments at and near the Earth’s surface.Apart from its traditional use as a pigment,9 R-FeOOH has foundother technological applications as well, such as magneticrecording media precursor,13 mineral liquid crystal colloid,14 andenvironmental contaminant scavenger for wastewater treat-ment.12,15,16 Compared to other iron oxides, under ambient
conditions R-Fe2O3 is most stable. R-Fe2O3 has many applica-tions such as light-induced water splitting,17 catalysis,18 gassensors,19 solar cells,20 field emission devices,21 and magneticmaterials.22-27 Both R-FeOOH and R-Fe2O3 nanocrystallitesexhibit unique reactivity at the nanoscale. For example, the rateof reductive dissolution of 64 nm (length) × 5 nm (width)R-FeOOH nanorods (NRs) by hydroquinone is two times fasterthan that of 367 nm (length) × 22 nm (width) ones.15 In thecatalytic oxidation of aqueous Mn2+, the rate exhibited by 7nm R-Fe2O3 nanocrystals is 1 to 2 orders of magnitude fasterthan that of 37 nm R-Fe2O3 nanocrystals.28
In recent years, significant attention has been directed towardabatement of noxious species in air and aqueous media.29-32
Organic dyes are often used in printing, textile, and photographicindustries. A sizable fraction of dyes is lost in the dying processand released into the effluent water streams. In many situations,the degradation rate of dyes is slow by sunlight without catalyticassistance. Therefore, it is necessary to employ appropriatecatalysts to degrade dyes in aqueous solution. Dye degradationby semiconductor-based photocatalysts, e.g., TiO2, has beeninvestigated extensively.31,33 Nevertheless, TiO2 with an inherentband gap of 3.0-3.3 eV can only adsorb ultraviolet light (UV,with wavelength λ < 400 nm), which accounts for a smallfraction of the solar spectrum. Driven by global energy andenvironmental challenge, considerable effort has been made tomodify existing TiO2 photocatalysts or developing alternativeones, with a goal to extend the range of light absorption intothe visible region.31,32,34 Narrower band gap semiconductors,such as CdS,35 Fe2O3,36-43 WO3,44-46 CaIn2O4,47 BaBiO3,48 andBi2SbVO7,49 have been addressed. In particular, nanosizedsemiconductor particles with large surface areas and a variety
† Part of the “D. Wayne Goodman Festschrift”.* To whom all correspondence should be addressed: e-mail, liug@
nanoctr.cn; fax, (+86) 10-62656765.‡ National Center for Nanoscience and Technology.§ Department of Physics, Beijing Normal University.
J. Phys. Chem. C 2010, 114, 17051–17061 17051
10.1021/jp103816e 2010 American Chemical SocietyPublished on Web 09/07/2010
of morphologies offer great opportunity. Compared to otherpotential photocatalysts, iron oxides are plentiful in nature andenvironmentally benign. Furthermore, iron oxides are semicon-ductors (2.150 and 2.2 eV51 for R-FeOOH and R-Fe2O3,respectively) that can adsorb light up to 600 nm. Zhou and Wonget al.20 reported that R-Fe2O3 nanotubes with length of 6 ( 3µm and width of 260 ( 60 nm show better performance in thephotodegradation of 4-chlorophenol than their bulk analogues.Du and Xu et al.40 studied degradation of Orange II on variousiron-containing compounds, such as R-Fe2O3, γ-Fe2O3, Fe3O4,R-FeOOH, γ-FeOOH, and δ-FeOOH, in aqueous suspensionby UV light, and found that anhydrous iron oxides are moreactive than hydrated iron oxides. In contrast, Feng and Hu etal.39 studied degradation of Orange II by iron-containingcatalysts and suggested that both amorphous FeOOH andcalcinated FeOOH display superior performance to R-Fe2O3.To date, systematic studies of the impact of particle size andshape on photocatalytic property by iron oxides are still lacking.Over the past decade, shape control of nanomaterials using self-and directed-assembly as a “bottom-up” route has seen rapidgrowth.52-61 Of particular interest is to assemble unique anduseful nanomaterials with novel optical, electrical, magnetic,and catalytic properties. For example, tuning the direction andpath of charge carriers through quantum confinement in 1Danisotropic nanostructures is possible and could be useful inphotocatalysis.62-64 Our recent work65,66 demonstrated thatthrough oriented attachment (OA), anisotropic R-FeOOH nano-crystallites could be synthesized at high pH without theassistance of organic additives, and R-Fe2O3 was obtainedthrough thermal dehydration of a corresponding R-FeOOHprecursor via a topotacic transformation, thus opening a routeto tailor size and shape of R-FeOOH and R-Fe2O3 nanomaterials.Insights into the dye degradation on iron oxides not only are offundamental importance for our understanding of photocatalysisbut allow extending its general applicability to a range ofnaturally abundant semiconducting minerals and compoundssuch as metal oxides and metal oxyhydroxides.
In the current study, visible light induced photocatalytic activitytoward rhodamine B (RhB, a xanthene dye) by nano- andmicrosized iron oxides, including oxyhydroxide (R-FeOOH) andanhydrous ferric oxide (R-Fe2O3), has been investigated. RhB isone of major cationic dyes and not biodegradable in wastewater.We are aware that studies on the comparison of photocatalyticactivity between nanosized photocatalysts and their microsizedcounterparts are very limited.67 Anisotropic shapes, such as 1Drods, offer tunable exposed crystallographic surfaces and/orstructures, which play an indispensable role in photocatalysis. Ourresults shed new light on composition-, size-, porosity-, and localstructure-dependent photocatalysis by iron oxide particles.
2. Experimental Section
2.1. Synthesis. The synthesis of ferrihydrite nanoparticlesand goethite NRs has been published elsewhere.15,68-71 R-FeOOHmicrorods (MRs) were synthesized using a method developedby Cornell and Schwertmann.9 R-Fe2O3 MRs and NRs wereobtained by heating corresponding R-FeOOH precursors at 300°C in air for 1 h.
2.2. Characterization. The Brunauer-Emmett-Teller (BET)specific surface area and the Barrett-Joyner-Halenda (BJH)pore size distribution were measured using a MicromeriticsASAP 2020 apparatus. Powder X-ray diffraction (XRD) datawere collected using a Shimadzu X-ray diffractometer (XRD-6000) with Cu KR radiation (λ ) 0.154178 nm). Measurementwas in the 2θ range of 15-85° with a scanning step of 0.68
(deg/min). The diffraction patterns were compared to thereference powder diffraction files (PDF) for goethite (81-0463)and hematite (84-0307). Transmission electron microscopy(TEM) images were obtained using a Tecnai G2 20 S-Twinmicroscope operating at 200 kV. High-angle annular dark-fieldscanning transmission electron microscopy (HAADF-STEM)measurements were performed on a Tecnai G2 F20 U-Twinmicroscope operating at 200 kV. Goethite and hematite as drypowders were dissolved into Milli-Q water and sonicated in acool water bath until a homogeneous suspension was formed.Second, a drop of sample suspension was spread onto anamorphous holey-carbon film supported by a standard TEM grid(Beijing XinXingBaiRui Technology Co., Ltd.). Finally, allTEM samples were allowed to dry under ambient conditions.No sample damage was observed during high-resolution TEMstudies. Micro-Raman spectroscopy measurement was conductedusing a Renishaw Micro-Raman spectroscopy system (Renishawin Via plus). A Renishaw red laser at 785 nm was employed asthe excitation source. Diffuse reflectance ultraviolet and visible(DRUV-vis) spectra were obtained using a PerkinElmer Lambda950 UV-vis spectrometer. Fine BaSO4 powder was used as astandard, and the spectra were recorded in a range of 200-800nm. X-ray photoelectron spectroscopy (XPS) data were obtainedusing an ESCALab 250 electron spectrometer from ThermoScientific Corp. For high-resolution spectra, monochromatic 150W Al KR radiation was utilized and the pass energy is 30 eV.Low-energy electrons were used for charge compensation toneutralize the samples. The binding energies were referenced tothe adventitious C 1s line at 284.8 eV. A Shirley-type backgroundwas subtracted from each spectrum and Avantage 4.15 softwarewas used to process the data. Particle size distributions insuspensions prior to reaction were evaluated using a Zetasizer(model Nano ZS, Malvern Instruments) operating with a He-Nelaser at a wavelength of 633 nm. Suspensions with a completeadsorption-desorption equilibrium were analyzed.
2.3. Photocatalytic Evaluation. The photocatalytic activityof the as-prepared samples for the degradation of RhB (AlfaAesar, CAS# 81-88-9) in aqueous solution was evaluated bymeasuring the adsorbance of the irradiated solution. Prior toirradiation, 10 mg of photocatalyst was mixed with RhB (50mL, with a concentration of 0.02 mM) in a 100-mL round-bottom flask and then sonicated in a cool water bath for 10min. Afterward, the suspension was magnetically stirred in thedark overnight to reach a complete adsorption-desorptionequilibrium, followed by the addition of 0.255 mL of hydrogenperoxide solution (H2O2, 30 wt %). Then the beaker was exposedto visible light irradiation with maximum illumination time upto 180 min. During the irradiation, the suspension was magneti-cally stirred by using a magnetic stirrer and the reactiontemperature was kept at room temperature by using a coolingfan. The suspension was subsequently illuminated by a 300 Wxenon lamp at a ca. 40 cm distance. A wave filter plate (λ >420 nm) was utilized to allow visible light to transmit. Atdifferent time intervals, about 4 mL aliquots were sampled,centrifuged, and filtered through a membrane (0.22 µm indiameter, Agela Technologies). The dye concentration in thefiltrate was analyzed by measuring the absorption intensity ofRhB at 554 nm.
3. Results and Discussion
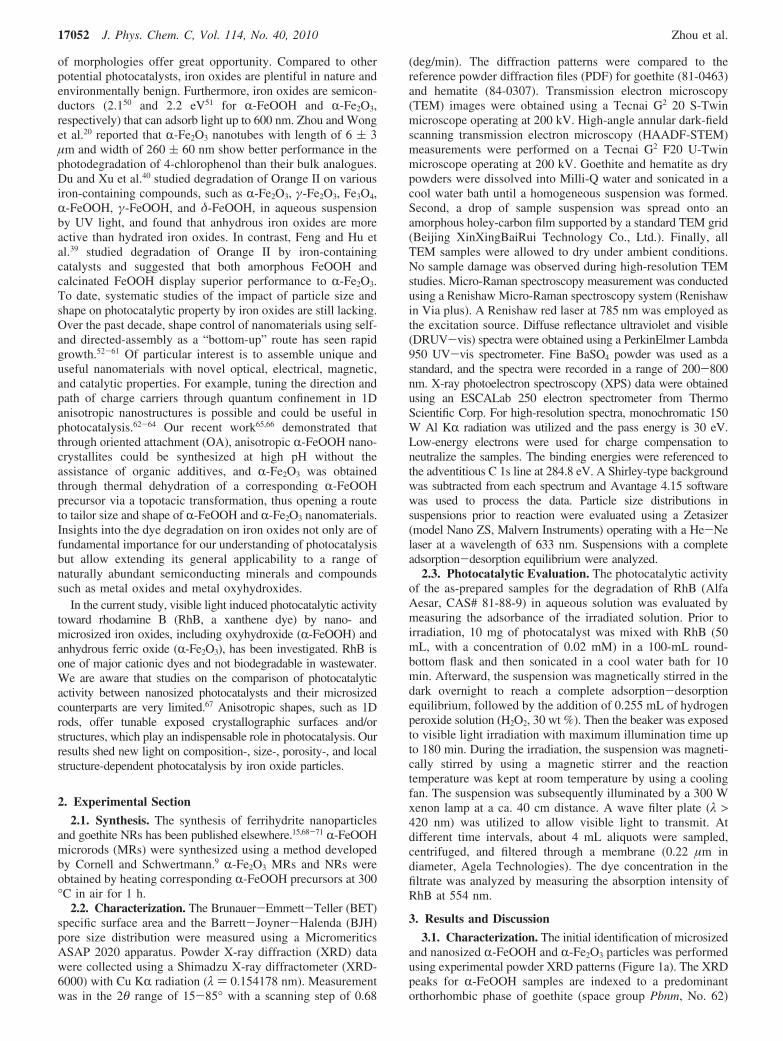
3.1. Characterization. The initial identification of microsizedand nanosized R-FeOOH and R-Fe2O3 particles was performedusing experimental powder XRD patterns (Figure 1a). The XRDpeaks for R-FeOOH samples are indexed to a predominantorthorhombic phase of goethite (space group Pbnm, No. 62)
17052 J. Phys. Chem. C, Vol. 114, No. 40, 2010 Zhou et al.
with lattice constants of a ) 0.4596, b ) 0.9957, and c ) 0.3021nm. For R-Fe2O3 samples, the XRD peaks can be indexed to arhombohedral hexagonal phase (space group R3jc) with latticeconstants a ) 0.5035 and c ) 1.3740 nm. A possible cause ofpeak broadening in a powder diffractogram as seen in R-FeOOHNRs and R-Fe2O3 NRs compared to the microsized counterpartsmay be due to smaller crystalline sizes. The correspondingmicro-Raman spectra of the as-prepared samples are displayedin panel b of Figure 1. The positions of major bands (240, 295,384, 476, 546 cm-1) for two types of R-FeOOH particles lookidentical and are similar to the Raman signature of R-FeOOHreported in the literature.72 As to R-Fe2O3 MRs, the bands at217 and 487 cm-1 and 237, 288, 402, and 604 cm-1 are ascribedto the A1 g and Eg modes of R-Fe2O3, respectively.73 The bandat 1322 cm-1 (not shown) is the characteristic band assigned toa two-magnon scattering resulting from the interaction of twomagnons created on antiparallel close spin sites.74 Nevertheless,major bands of nanosized R-Fe2O3 shift to higher wavenumbers(red-shifted) relative to microsized R-Fe2O3. For instance, theFe-O (Eg) symmetric bending mode occurs at 402 and 406cm-1 for R-Fe2O3 MRs and NRs, respectively. In addition, theFe-O (A1g) symmetric stretching mode locates at 217 cm-1,487 cm-1 and 220 cm-1, 492 cm-1 for R-Fe2O3 MRs and NRs,respectively. Compared to XRD, Raman spectroscopy is moresensitive to the slight change of metal-O bond lengths as well
as lattice perturbations in the local structure. It has been reportedthat a metal-O bond length can be correlated to its Ramanstretching frequency, with higher stretching frequencies corre-sponding to the shorter metal-O bond lengths.75,76 The varia-tions of local structure could be critical to the photocatalyticperformance, as discussed in section 3.2.
The optical properties of the as-prepared samples wereinvestigated by DRUV-vis. Parts c and d of Figure 1 are theabsorption and reflectance spectra for R-Fe2O3 and R-FeOOHMRs and NRs, respectively. Lian et al.77 reported that opticalproperties are shape- and size-dependent. Figure 1c,d shows thatR-Fe2O3 MRs and NRs almost share the same features ofabsorption, and R-FeOOH MRs and NRs almost share the sameabsorption bands. The absorption features for R-Fe2O3 MRs andNRs are different from R-FeOOH MRs and NRs. For instance,R-Fe2O3 dispalys a broad band located at ca. 533 nm, whileR-FeOOH exhibits a broad band around 490 nm. He et al.78
reported that three types of electronic transitions are present inthe optical absorption for Fe3+ substances, such as the Fe3+
ligand field transition or the d-d transitions, the ligand to metalcharge-transfer transitions, and the pair excitations resulting fromthe simultaneous excitations of two neighboring Fe3+ cationsthat are magnetically coupled. The variations in the electronic
Figure 1. Characterization of R-FeOOH and R-Fe2O3 NRs and MRs, while R-Fe2O3 NRs and MRs were obtained by calcinating R-FeOOH precursorsat 300 °C in air for 1 h. (a) Powder XRD patterns. (b) Micro-Raman spectra excited by a red-line laser (785 nm). (c) Absorption and (d) reflectancespectra of R-FeOOH and R-Fe2O3 NRs and MRs.
Photocatalytic Degradation of Rhodamine B J. Phys. Chem. C, Vol. 114, No. 40, 2010 17053
structures could lead to enhanced delocalization of photoge-nerated electron and hole pairs and the mobility of holes inparticular.75
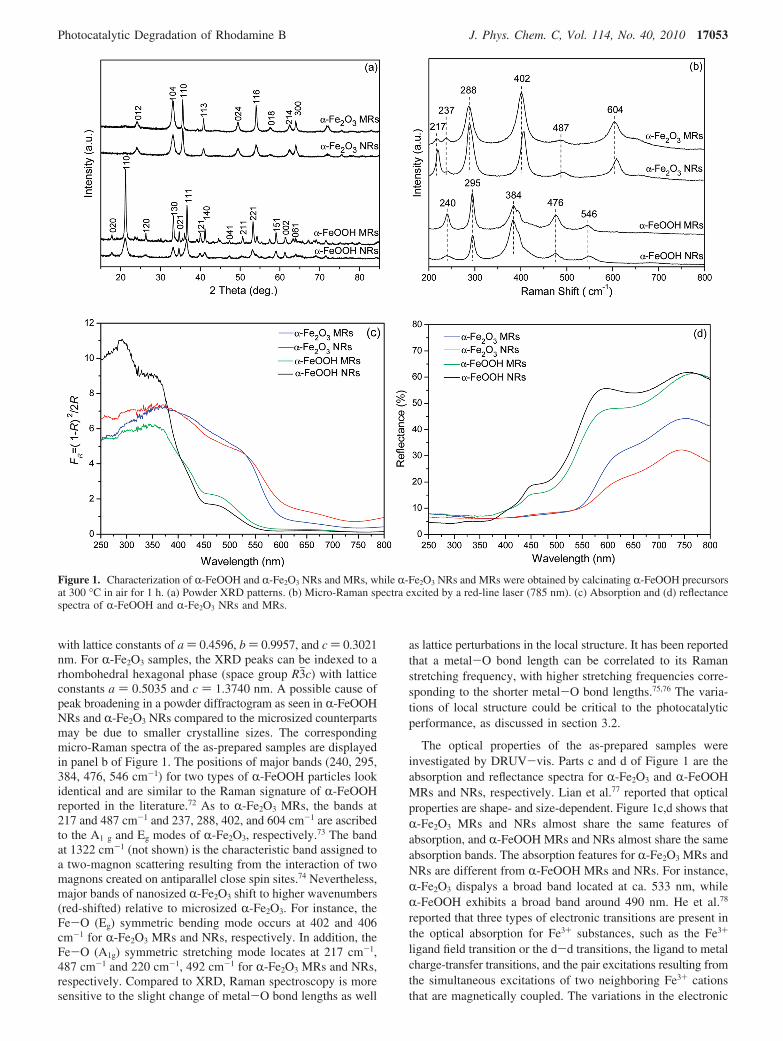
The oxidation states of the as-prepared samples are revealedin high-resolution XPS (Figure 2). Figure 2a shows the Fe 2pcore level spectra. The nature of Fe 2p peak broading is verycomplicated, resulting from electrostatic interactions betweenphotoionized Fe 2p core hole and unpaired Fe 3d electrons,spin-orbit coupling, and crystal field interactions.79 Additional
satellite peaks are attributed to charge transfer and/or to shakeupprocesses.79 For MRs and NRs, Fe 2p XPS spectra are verysimilar, independent of particle sizes and samples. The centroidsof Fe 2p3/2 peaks are located at 710.8 (R-Fe2O3) and 711.2 eV(R-FeOOH), respectively, and the centroids of Fe 2p1/2 peaksare located at 724.4 (R-Fe2O3) and 724.8 eV (R-FeOOH),respectively. The binding energies for Fe 2p core levels agreewell with the values reported in the literature.79,80 The line shapefor O 1s is dramatically different among R-Fe2O3 and R-FeOOHparticles. As shown in Figure 2b,c, at least four peaks are seenin the O 1s region. For R-Fe2O3 particles, the peak at 530.0 eVis ascribed to the lattice oxygen binding with Fe (denoted asFe-O). The other three O 1s peaks located at higher bindingenergies can be assigned as lattice hydroxyl (Fe-OHlattice),adsorbed hydroxyl (Fe-OHad), and water (H2O). For R-FeOOHparticles, these four peaks in the O 1s region are located at 530.1,531.3, 532.2, and 533.4 eV, respectively. The binding energiesfor O 1s core levels for both R-Fe2O3 and R-FeOOH particlesagree well with the values previously published elsewhere.79,80
The analyses from XRD, Raman, and XPS demonstrate thatR-FeOOH was completely transformed to R-Fe2O3. No otheriron oxides, such as magnetite or maghemite, were present.
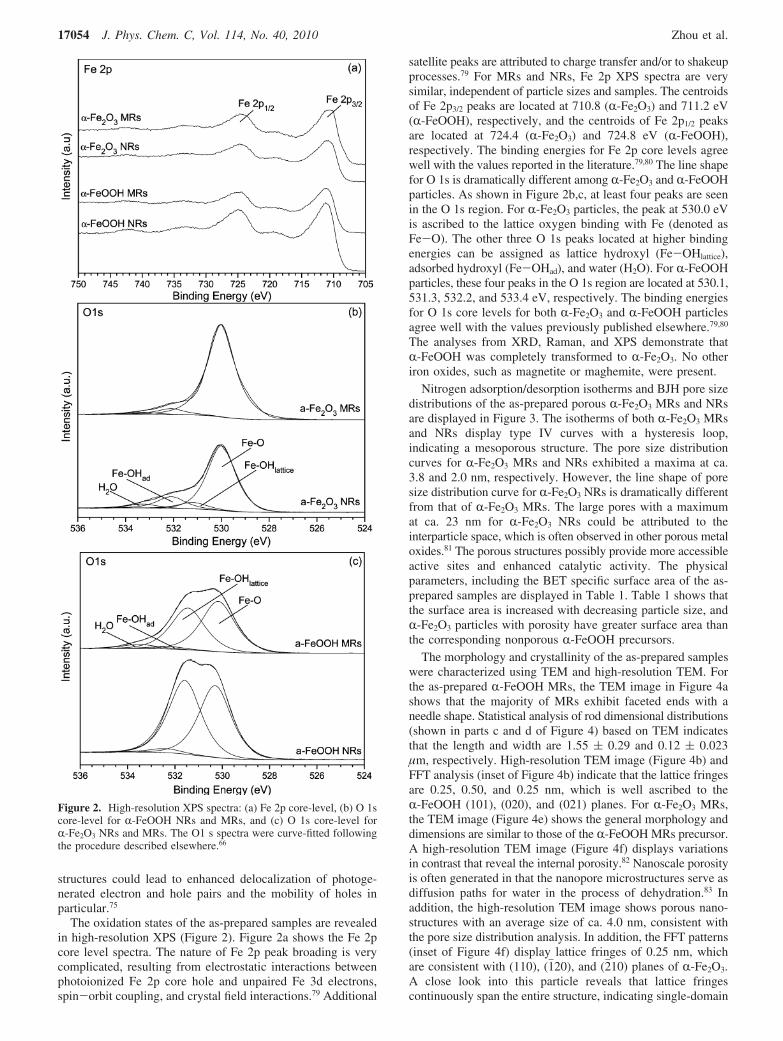
Nitrogen adsorption/desorption isotherms and BJH pore sizedistributions of the as-prepared porous R-Fe2O3 MRs and NRsare displayed in Figure 3. The isotherms of both R-Fe2O3 MRsand NRs display type IV curves with a hysteresis loop,indicating a mesoporous structure. The pore size distributioncurves for R-Fe2O3 MRs and NRs exhibited a maxima at ca.3.8 and 2.0 nm, respectively. However, the line shape of poresize distribution curve for R-Fe2O3 NRs is dramatically differentfrom that of R-Fe2O3 MRs. The large pores with a maximumat ca. 23 nm for R-Fe2O3 NRs could be attributed to theinterparticle space, which is often observed in other porous metaloxides.81 The porous structures possibly provide more accessibleactive sites and enhanced catalytic activity. The physicalparameters, including the BET specific surface area of the as-prepared samples are displayed in Table 1. Table 1 shows thatthe surface area is increased with decreasing particle size, andR-Fe2O3 particles with porosity have greater surface area thanthe corresponding nonporous R-FeOOH precursors.
The morphology and crystallinity of the as-prepared sampleswere characterized using TEM and high-resolution TEM. Forthe as-prepared R-FeOOH MRs, the TEM image in Figure 4ashows that the majority of MRs exhibit faceted ends with aneedle shape. Statistical analysis of rod dimensional distributions(shown in parts c and d of Figure 4) based on TEM indicatesthat the length and width are 1.55 ( 0.29 and 0.12 ( 0.023µm, respectively. High-resolution TEM image (Figure 4b) andFFT analysis (inset of Figure 4b) indicate that the lattice fringesare 0.25, 0.50, and 0.25 nm, which is well ascribed to theR-FeOOH (101), (020), and (021) planes. For R-Fe2O3 MRs,the TEM image (Figure 4e) shows the general morphology anddimensions are similar to those of the R-FeOOH MRs precursor.A high-resolution TEM image (Figure 4f) displays variationsin contrast that reveal the internal porosity.82 Nanoscale porosityis often generated in that the nanopore microstructures serve asdiffusion paths for water in the process of dehydration.83 Inaddition, the high-resolution TEM image shows porous nano-structures with an average size of ca. 4.0 nm, consistent withthe pore size distribution analysis. In addition, the FFT patterns(inset of Figure 4f) display lattice fringes of 0.25 nm, whichare consistent with (110), (1j20), and (2j10) planes of R-Fe2O3.A close look into this particle reveals that lattice fringescontinuously span the entire structure, indicating single-domain
Figure 2. High-resolution XPS spectra: (a) Fe 2p core-level, (b) O 1score-level for R-FeOOH NRs and MRs, and (c) O 1s core-level forR-Fe2O3 NRs and MRs. The O1 s spectra were curve-fitted followingthe procedure described elsewhere.66
17054 J. Phys. Chem. C, Vol. 114, No. 40, 2010 Zhou et al.
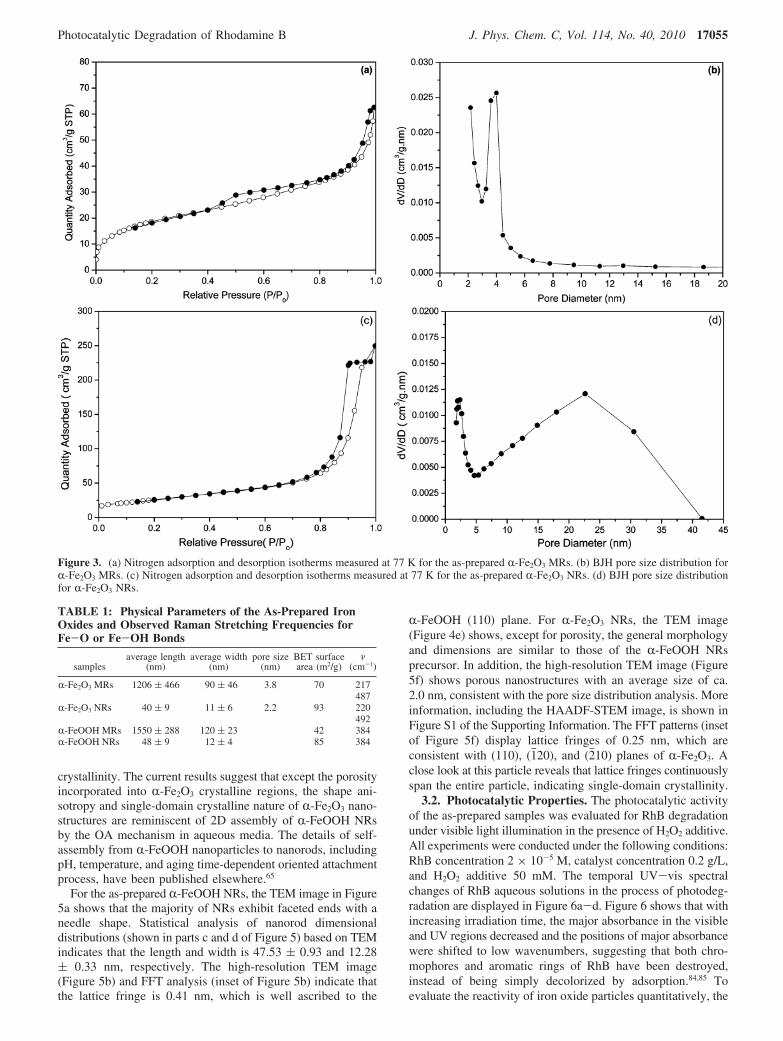
crystallinity. The current results suggest that except the porosityincorporated into R-Fe2O3 crystalline regions, the shape ani-sotropy and single-domain crystalline nature of R-Fe2O3 nano-structures are reminiscent of 2D assembly of R-FeOOH NRsby the OA mechanism in aqueous media. The details of self-assembly from R-FeOOH nanoparticles to nanorods, includingpH, temperature, and aging time-dependent oriented attachmentprocess, have been published elsewhere.65
For the as-prepared R-FeOOH NRs, the TEM image in Figure5a shows that the majority of NRs exhibit faceted ends with aneedle shape. Statistical analysis of nanorod dimensionaldistributions (shown in parts c and d of Figure 5) based on TEMindicates that the length and width is 47.53 ( 0.93 and 12.28( 0.33 nm, respectively. The high-resolution TEM image(Figure 5b) and FFT analysis (inset of Figure 5b) indicate thatthe lattice fringe is 0.41 nm, which is well ascribed to the
R-FeOOH (110) plane. For R-Fe2O3 NRs, the TEM image(Figure 4e) shows, except for porosity, the general morphologyand dimensions are similar to those of the R-FeOOH NRsprecursor. In addition, the high-resolution TEM image (Figure5f) shows porous nanostructures with an average size of ca.2.0 nm, consistent with the pore size distribution analysis. Moreinformation, including the HAADF-STEM image, is shown inFigure S1 of the Supporting Information. The FFT patterns (insetof Figure 5f) display lattice fringes of 0.25 nm, which areconsistent with (110), (1j20), and (2j10) planes of R-Fe2O3. Aclose look at this particle reveals that lattice fringes continuouslyspan the entire particle, indicating single-domain crystallinity.
3.2. Photocatalytic Properties. The photocatalytic activityof the as-prepared samples was evaluated for RhB degradationunder visible light illumination in the presence of H2O2 additive.All experiments were conducted under the following conditions:RhB concentration 2 × 10⁻⁵ M, catalyst concentration 0.2 g/L,and H2O2 additive 50 mM. The temporal UV-vis spectralchanges of RhB aqueous solutions in the process of photodeg-radation are displayed in Figure 6a-d. Figure 6 shows that withincreasing irradiation time, the major absorbance in the visibleand UV regions decreased and the positions of major absorbancewere shifted to low wavenumbers, suggesting that both chro-mophores and aromatic rings of RhB have been destroyed,instead of being simply decolorized by adsorption.84,85 Toevaluate the reactivity of iron oxide particles quantitatively, the
Figure 3. (a) Nitrogen adsorption and desorption isotherms measured at 77 K for the as-prepared R-Fe2O3 MRs. (b) BJH pore size distribution forR-Fe2O3 MRs. (c) Nitrogen adsorption and desorption isotherms measured at 77 K for the as-prepared R-Fe2O3 NRs. (d) BJH pore size distributionfor R-Fe2O3 NRs.
TABLE 1: Physical Parameters of the As-Prepared IronOxides and Observed Raman Stretching Frequencies forFe-O or Fe-OH Bonds
samplesaverage length
(nm)average width
(nm)pore size
(nm)BET surfacearea (m2/g)
ν(cm-1)
R-Fe2O3 MRs 1206 ( 466 90 ( 46 3.8 70 217487
R-Fe2O3 NRs 40 ( 9 11 ( 6 2.2 93 220492
R-FeOOH MRs 1550 ( 288 120 ( 23 42 384R-FeOOH NRs 48 ( 9 12 ( 4 85 384
Photocatalytic Degradation of Rhodamine B J. Phys. Chem. C, Vol. 114, No. 40, 2010 17055
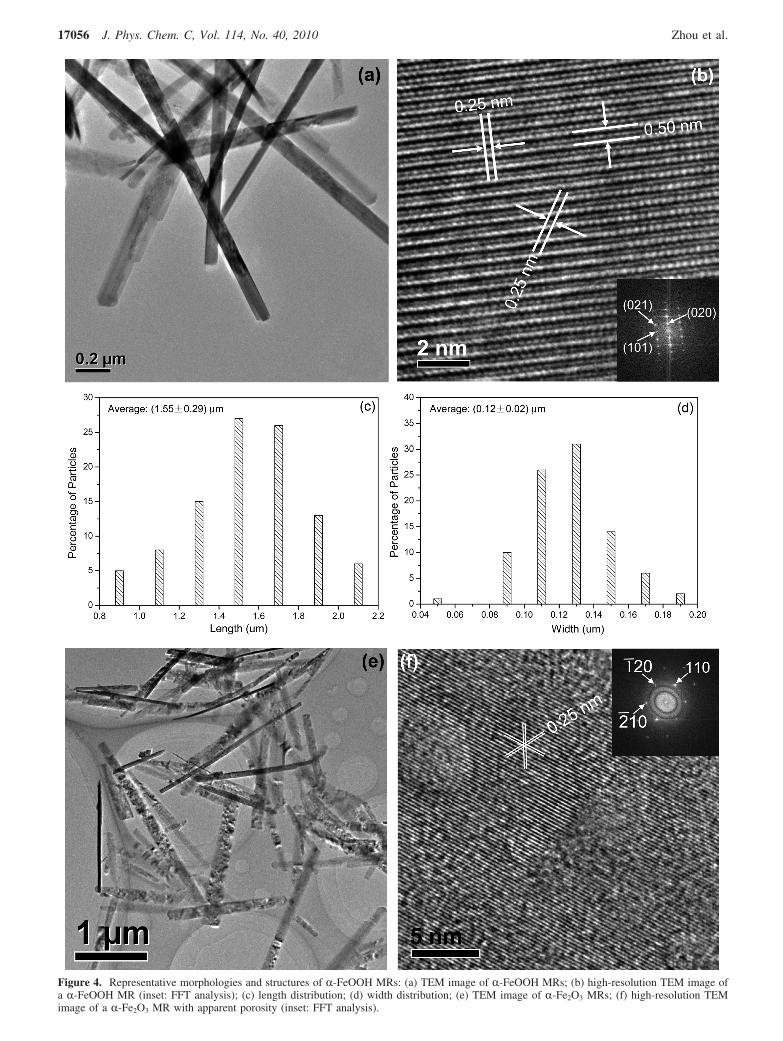
Figure 4. Representative morphologies and structures of R-FeOOH MRs: (a) TEM image of R-FeOOH MRs; (b) high-resolution TEM image ofa R-FeOOH MR (inset: FFT analysis); (c) length distribution; (d) width distribution; (e) TEM image of R-Fe2O3 MRs; (f) high-resolution TEMimage of a R-Fe2O3 MR with apparent porosity (inset: FFT analysis).
17056 J. Phys. Chem. C, Vol. 114, No. 40, 2010 Zhou et al.
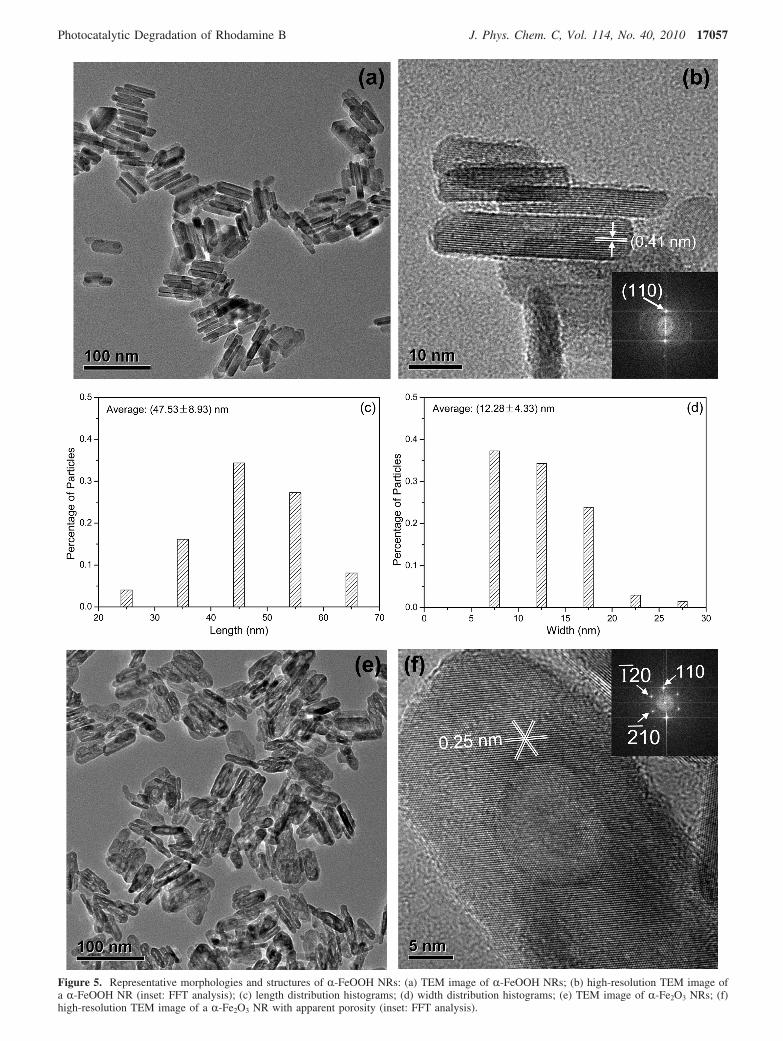
Figure 5. Representative morphologies and structures of R-FeOOH NRs: (a) TEM image of R-FeOOH NRs; (b) high-resolution TEM image ofa R-FeOOH NR (inset: FFT analysis); (c) length distribution histograms; (d) width distribution histograms; (e) TEM image of R-Fe2O3 NRs; (f)high-resolution TEM image of a R-Fe2O3 NR with apparent porosity (inset: FFT analysis).
Photocatalytic Degradation of Rhodamine B J. Phys. Chem. C, Vol. 114, No. 40, 2010 17057
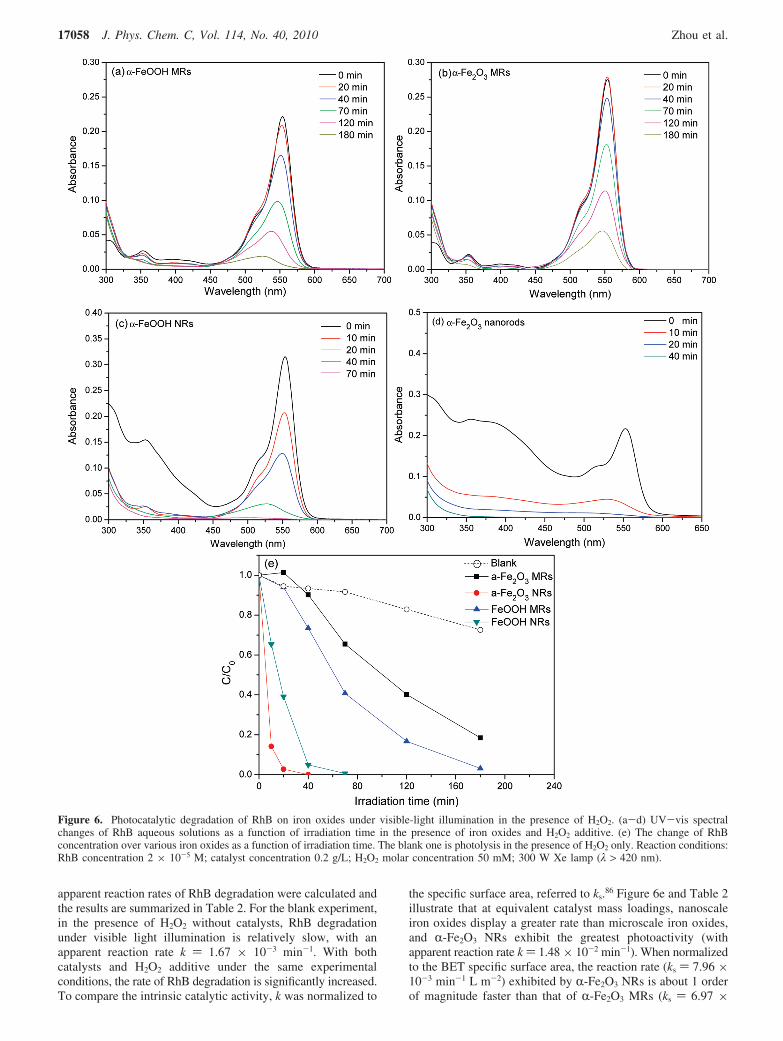
apparent reaction rates of RhB degradation were calculated andthe results are summarized in Table 2. For the blank experiment,in the presence of H2O2 without catalysts, RhB degradationunder visible light illumination is relatively slow, with anapparent reaction rate k ) 1.67 × 10⁻³ min-1. With bothcatalysts and H2O2 additive under the same experimentalconditions, the rate of RhB degradation is significantly increased.To compare the intrinsic catalytic activity, k was normalized to
the specific surface area, referred to ks.86 Figure 6e and Table 2illustrate that at equivalent catalyst mass loadings, nanoscaleiron oxides display a greater rate than microscale iron oxides,and R-Fe2O3 NRs exhibit the greatest photoactivity (withapparent reaction rate k ) 1.48 × 10⁻² min-1). When normalizedto the BET specific surface area, the reaction rate (ks ) 7.96 ×10⁻³ min-1 L m-2) exhibited by R-Fe2O3 NRs is about 1 orderof magnitude faster than that of R-Fe2O3 MRs (ks ) 6.97 ×
Figure 6. Photocatalytic degradation of RhB on iron oxides under visible-light illumination in the presence of H2O2. (a-d) UV-vis spectralchanges of RhB aqueous solutions as a function of irradiation time in the presence of iron oxides and H2O2 additive. (e) The change of RhBconcentration over various iron oxides as a function of irradiation time. The blank one is photolysis in the presence of H2O2 only. Reaction conditions:RhB concentration 2 × 10⁻⁵ M; catalyst concentration 0.2 g/L; H2O2 molar concentration 50 mM; 300 W Xe lamp (λ > 420 nm).
17058 J. Phys. Chem. C, Vol. 114, No. 40, 2010 Zhou et al.

10-4 min-1 L m-2), implying the difference in reactivity farexceeds that expected from simple consideration of surface area,as reported in other systems.87 The structural stability of theas-prepared iron oxide photocatalysts before and after photo-catalysis reaction was examined by micro-Raman spectroscopy(data shown in Figure S2 in the Supporting Information). FigureS2 shows that the structures of catalysts used in the currentstudy are stable upon irradiation.
It has been suggested that dye degradation by H2O2 promotionmainly occurs on the surface of iron oxide photocatalysts ratherthan in solution bulk.40,41 The dual effects by H2O2 in enhancingthe photocatalytic performance of catalysts is ascribed to eitherconduction electron scavenging or the Fenton-like reaction.40
In general, minority charge carriers such as electrons and holesare generated upon visible light illumination. There exist twopathways for the annihilation of electrons involving variouselectron transfer processes. First, electrons are directly trappedby H2O2 to form OH• radicals
Alternatively, the electrons can be trapped by Fe3+ on thecatalyst surface
As a result, OH• radicals resulting from the above twopathways lead to the photocatalytic reaction. Bahnemann88
proposed that physical properties of a photocatalyst such ascrystal structure, surface area, size distribution, porosity, andband gap determine its reactivity. As to our current experimentalresults for the enhanced reactivity toward RhB by NRs relativeto MRs in both R-FeOOH and R-Fe2O3, a number of explana-tions can be envisioned. First, differences in the photocatalyticperformance are not primarily caused by differences in intrinsicband gaps, given the fact that the intrinsic band gaps forR-FeOOH and R-Fe2O3 are essentially very close. Also asevidenced by Figure 1c,d, for both R-FeOOH and R-Fe2O3, NRsand MRs share almost identical optical absorption bands. Asshown in Figure 1b and Table 1, major Raman bands ofnanosized R-Fe2O3 shift to higher frequencies (red shifts)compared to microsized R-Fe2O3, including Raman stretching
frequencies that sensitively reflect the metal-O bond lengths,with the higher stretching frequencies corresponding to theshorter metal-O bond lengths.75 The variations of local structurecould influence the photocatalytic performance of iron oxideparticles. Yu and Kudo75 studied the photocatalytic propertiesof BiVO3 for oxygen evolution from aqueous AgNO3 solutionunder visible light irradiation and found that the initial rate ofO2 evolution is proportional to the Raman V-O bond stretchingfrequencies. On the basis of an empirical correlation developedby Hardcastle and Wachs,76 Yu and Kudo correlated higherV-O bond stretching frequencies with shorter V-O bondlengths and proposed that shorter V-O bond lengths lead togreater mobility of photogenerated holes as well as greaterphotocatalytic activity.75 Analogously, the observed Ramanhigher Fe-O stretching frequencies for R-Fe2O3 NRs relativeto R-Fe2O3 MRs are in part responsible for the greaterphotocatalytic performance on R-Fe2O3 NRs. It is well-knownthat the metal-O vibrations could be influenced by many otherfactors, including the confinement of optical phonons. Thephonon confinement can cause the shift of the Raman peaks.For instance, for CuO nanocrystals at room temperature, as thegrain size decreases from 100 to 10 nm, the Raman peaks shiftto lower frequencies (blue shifts).89 In the current study, todetermine Raman peak shifts by the phonon confinement and/or bond length changes quantitatively, further theoretical workis needed.
Another aspect in different photocatalytic activity can beascribed to the differences in the relative amount of crystal facespresent on NRs and MRs. This is the inherent size effect foranisotropically shaped 1D rods. For example, high index planessuch as {021} often are apex facets of needle-shaped R-FeOOHrods (Figure S3 in the Supporting Information).65 The relativeproportions of high index facets vs low index facets vary fromR-FeOOH NRs to MRs, with NRs presenting more high index{021} facets than MRs. Using atomic force microscopy,Gaboriaud et al.90 showed that the relative area of R-FeOOHcrystal surfaces can change substantially as a result of decreasingparticle size. Molecular simulations by Rustad et al.91 suggestedthat the degree of protonation of the {021} facets is influencedby R-FeOOH particle size. Thus, it is reasonable to hypothesizethat for R-FeOOH, {021} facets play a key role in thephotodegradation of RhB under visible light illumination. Inthis work, R-Fe2O3 rods were prepared by thermal dehydrationof respective R-FeOOH precursors via a topotactic transforma-tion.66 Except for porosity incorporated into R-Fe2O3 crystallineregion, the shape anisotropy of R-Fe2O3 is reminiscent ofR-FeOOH precursors. Variations of relative proportions of highindex facets vs low index facets between R-FeOOH NRs andMRs inherently lead to differences in the relative amount ofcrystal faces present on R-Fe2O3 NRs and MRs and, conse-quently, result in different photocatalytic properties betweenR-Fe2O3 NRs and MRs. Moreover, the line shape of pore sizedistributions shown in parts b and d of Figure 3 is significantlydifferent between R-Fe2O3 MRs and NRs and, in turn, couldlead to different photoactivity. Ideal pore size distributionsfacilitate transport of catalytic reactants and products from thesurface, and promote photocatalytic performance. In summary,the observed catalytic performance from the current studydemonstrates the synergetic effects of particle composition, size,porosity, and local structure.81,92
It is well-known that in aqueous nanoparticulate suspensions,particle aggregates could influence the surface chemistry and/or surface reactivity, and the specific surface area determinedfrom dry samples could not exactly represent the real reactive
TABLE 2: Rate Constants of RhB Degradation on IronOxides Based on Pseudo-First-Order Kinetic Model andCorresponding Regression Coefficients r2 and RateConstants Normalized to BET Specific Surface Area (SSA)
samplesreaction rate k
(min-1)km
(min-1 L g-1)ks
(min-1 L m-2)
photolysis withoutcatalyst
0.00167 (0.99)
R-Fe2O3 MRs 0.00977 (0.98) 0.0488 6.97 × 10⁻⁴
R-Fe2O3 NRs 0.148 (0.98) 0.740 7.96 × 10⁻³
R-FeOOH MRs 0.0195 (0.98) 0.0975 2.32 × 10⁻³
R-FeOOH NRs 0.0761 (0.99) 0.380 4.47 × 10⁻³
a ks ) km/SSA, where km ) k/catalyst concentration.
R-Fe2O3 f R-Fe2O3(e-, h+); R-FeOOH f R-FeOOH(e-, h+)
(1)
H2O2 + e- f OH- + OH• (2)
Fe3+ + e- f Fe2+ (3)
Fe2+ + H2O2 f Fe3+ + OH- + OH• (4)
Photocatalytic Degradation of Rhodamine B J. Phys. Chem. C, Vol. 114, No. 40, 2010 17059
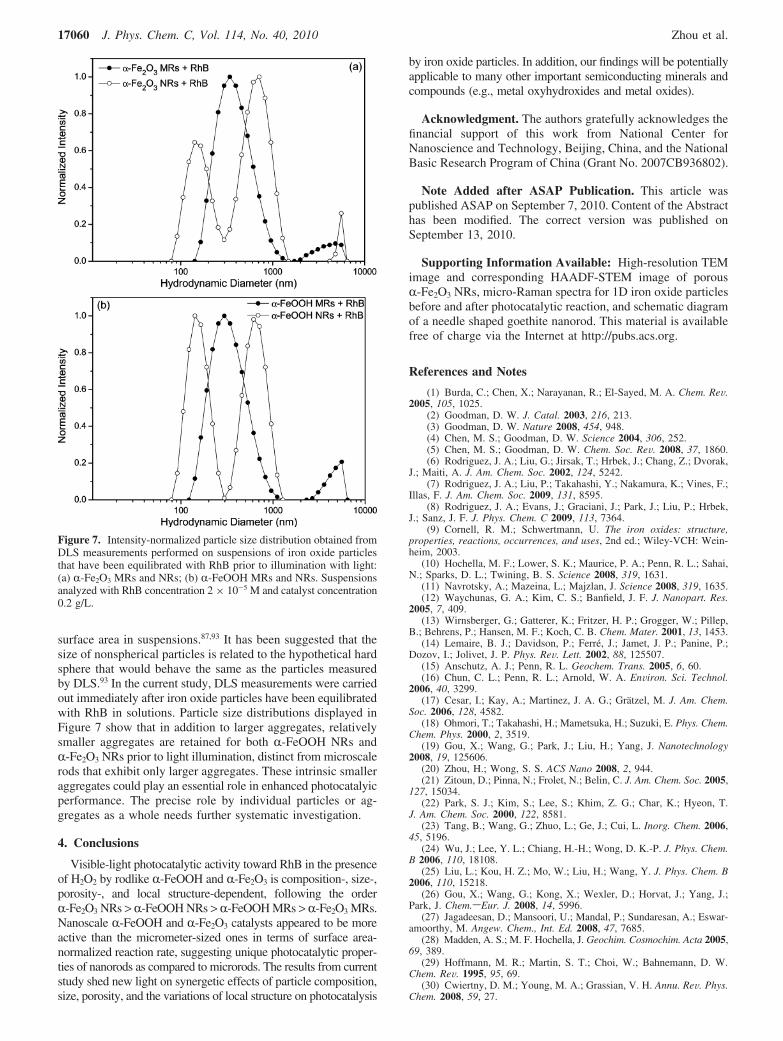
surface area in suspensions.87,93 It has been suggested that thesize of nonspherical particles is related to the hypothetical hardsphere that would behave the same as the particles measuredby DLS.93 In the current study, DLS measurements were carriedout immediately after iron oxide particles have been equilibratedwith RhB in solutions. Particle size distributions displayed inFigure 7 show that in addition to larger aggregates, relativelysmaller aggregates are retained for both R-FeOOH NRs andR-Fe2O3 NRs prior to light illumination, distinct from microscalerods that exhibit only larger aggregates. These intrinsic smalleraggregates could play an essential role in enhanced photocatalyicperformance. The precise role by individual particles or ag-gregates as a whole needs further systematic investigation.
4. Conclusions
Visible-light photocatalytic activity toward RhB in the presenceof H2O2 by rodlike R-FeOOH and R-Fe2O3 is composition-, size-,porosity-, and local structure-dependent, following the orderR-Fe2O3 NRs > R-FeOOH NRs > R-FeOOH MRs > R-Fe2O3 MRs.Nanoscale R-FeOOH and R-Fe2O3 catalysts appeared to be moreactive than the micrometer-sized ones in terms of surface area-normalized reaction rate, suggesting unique photocatalytic proper-ties of nanorods as compared to microrods. The results from currentstudy shed new light on synergetic effects of particle composition,size, porosity, and the variations of local structure on photocatalysis
by iron oxide particles. In addition, our findings will be potentiallyapplicable to many other important semiconducting minerals andcompounds (e.g., metal oxyhydroxides and metal oxides).
Acknowledgment. The authors gratefully acknowledges thefinancial support of this work from National Center forNanoscience and Technology, Beijing, China, and the NationalBasic Research Program of China (Grant No. 2007CB936802).
Note Added after ASAP Publication. This article waspublished ASAP on September 7, 2010. Content of the Abstracthas been modified. The correct version was published onSeptember 13, 2010.
Supporting Information Available: High-resolution TEMimage and corresponding HAADF-STEM image of porousR-Fe2O3 NRs, micro-Raman spectra for 1D iron oxide particlesbefore and after photocatalytic reaction, and schematic diagramof a needle shaped goethite nanorod. This material is availablefree of charge via the Internet at http://pubs.acs.org.
References and Notes
(1) Burda, C.; Chen, X.; Narayanan, R.; El-Sayed, M. A. Chem. ReV.2005, 105, 1025.
(2) Goodman, D. W. J. Catal. 2003, 216, 213.(3) Goodman, D. W. Nature 2008, 454, 948.(4) Chen, M. S.; Goodman, D. W. Science 2004, 306, 252.(5) Chen, M. S.; Goodman, D. W. Chem. Soc. ReV. 2008, 37, 1860.(6) Rodriguez, J. A.; Liu, G.; Jirsak, T.; Hrbek, J.; Chang, Z.; Dvorak,
J.; Maiti, A. J. Am. Chem. Soc. 2002, 124, 5242.(7) Rodriguez, J. A.; Liu, P.; Takahashi, Y.; Nakamura, K.; Vines, F.;
Illas, F. J. Am. Chem. Soc. 2009, 131, 8595.(8) Rodriguez, J. A.; Evans, J.; Graciani, J.; Park, J.; Liu, P.; Hrbek,
J.; Sanz, J. F. J. Phys. Chem. C 2009, 113, 7364.(9) Cornell, R. M.; Schwertmann, U. The iron oxides: structure,
properties, reactions, occurrences, and uses, 2nd ed.; Wiley-VCH: Wein-heim, 2003.
(10) Hochella, M. F.; Lower, S. K.; Maurice, P. A.; Penn, R. L.; Sahai,N.; Sparks, D. L.; Twining, B. S. Science 2008, 319, 1631.
(11) Navrotsky, A.; Mazeina, L.; Majzlan, J. Science 2008, 319, 1635.(12) Waychunas, G. A.; Kim, C. S.; Banfield, J. F. J. Nanopart. Res.
2005, 7, 409.(13) Wirnsberger, G.; Gatterer, K.; Fritzer, H. P.; Grogger, W.; Pillep,
B.; Behrens, P.; Hansen, M. F.; Koch, C. B. Chem. Mater. 2001, 13, 1453.(14) Lemaire, B. J.; Davidson, P.; Ferre, J.; Jamet, J. P.; Panine, P.;
Dozov, I.; Jolivet, J. P. Phys. ReV. Lett. 2002, 88, 125507.(15) Anschutz, A. J.; Penn, R. L. Geochem. Trans. 2005, 6, 60.(16) Chun, C. L.; Penn, R. L.; Arnold, W. A. EnViron. Sci. Technol.
2006, 40, 3299.(17) Cesar, I.; Kay, A.; Martinez, J. A. G.; Gratzel, M. J. Am. Chem.
Soc. 2006, 128, 4582.(18) Ohmori, T.; Takahashi, H.; Mametsuka, H.; Suzuki, E. Phys. Chem.
Chem. Phys. 2000, 2, 3519.(19) Gou, X.; Wang, G.; Park, J.; Liu, H.; Yang, J. Nanotechnology
2008, 19, 125606.(20) Zhou, H.; Wong, S. S. ACS Nano 2008, 2, 944.(21) Zitoun, D.; Pinna, N.; Frolet, N.; Belin, C. J. Am. Chem. Soc. 2005,
127, 15034.(22) Park, S. J.; Kim, S.; Lee, S.; Khim, Z. G.; Char, K.; Hyeon, T.
J. Am. Chem. Soc. 2000, 122, 8581.(23) Tang, B.; Wang, G.; Zhuo, L.; Ge, J.; Cui, L. Inorg. Chem. 2006,
45, 5196.(24) Wu, J.; Lee, Y. L.; Chiang, H.-H.; Wong, D. K.-P. J. Phys. Chem.
B 2006, 110, 18108.(25) Liu, L.; Kou, H. Z.; Mo, W.; Liu, H.; Wang, Y. J. Phys. Chem. B
2006, 110, 15218.(26) Gou, X.; Wang, G.; Kong, X.; Wexler, D.; Horvat, J.; Yang, J.;
Park, J. Chem.sEur. J. 2008, 14, 5996.(27) Jagadeesan, D.; Mansoori, U.; Mandal, P.; Sundaresan, A.; Eswar-
amoorthy, M. Angew. Chem., Int. Ed. 2008, 47, 7685.(28) Madden, A. S.; M. F. Hochella, J. Geochim. Cosmochim. Acta 2005,
69, 389.(29) Hoffmann, M. R.; Martin, S. T.; Choi, W.; Bahnemann, D. W.
Chem. ReV. 1995, 95, 69.(30) Cwiertny, D. M.; Young, M. A.; Grassian, V. H. Annu. ReV. Phys.
Chem. 2008, 59, 27.
Figure 7. Intensity-normalized particle size distribution obtained fromDLS measurements performed on suspensions of iron oxide particlesthat have been equilibrated with RhB prior to illumination with light:(a) R-Fe2O3 MRs and NRs; (b) R-FeOOH MRs and NRs. Suspensionsanalyzed with RhB concentration 2 × 10⁻⁵ M and catalyst concentration0.2 g/L.
17060 J. Phys. Chem. C, Vol. 114, No. 40, 2010 Zhou et al.

(31) Rajeshwar, K.; Osugi, M. E.; Chanmanee, W.; Chenthamarakshan,C. R.; Zanoni, M. V. B.; Kajitvichyanukul, P.; Krishnan-Ayer, R. J.Photochem. Photobiol., C 2008, 9, 171.
(32) Zhang, H.; Chen, G.; Bahnemann, D. W. J. Mater. Chem. 2009,19, 5089.
(33) Fujishima, A.; Honda, K. Nature 1972, 238, 37.(34) Rajeshwar, K.; Tacconi, N. R. d. Chem. Soc. ReV. 2009, 38, 1984.(35) Wang, L.; Wei, H.; Fan, Y.; Gu, X.; Zhan, J. J. Phys. Chem. C
2009, 113, 14119.(36) Liu, C.; Li, F.; Li, X.; Zhang, G.; Kuang, Y. J. Mol. Catal. A:
Chem. 2006, 252, 40.(37) Bandara, J.; Mielczarski, J. A.; Kiwi, J. Langmuir 1999, 15, 7670.(38) Bandara, J.; Mielczarski, J. A.; Kiwi, J. Langmuir 1999, 15, 7680.(39) Feng, J.; Hu, X.; Yue, P. L. EnViron. Sci. Technol. 2004, 38, 5773.(40) Du, W.; Xu, Y.; Wang, Y. Langmuir 2008, 24, 175.(41) Wang, Y.; Du, W.; Xu, Y. Langmuir 2009, 25, 2895.(42) Kontos, A. I.; Likodimos, V.; Stergiopoulos, T.; Tsoukleris, D. S.;
Falaras, P.; Rabias, I.; Papavassiliou, G.; Kim, D.; Kunze, J.; Schmuki, P.Chem. Mater. 2009, 21, 662.
(43) Buonsanti, R.; Grillo, V.; Carlino, E.; Giannini, C.; Gozzo, F.;Garcia-Hernandez, M.; Garcia, M. A.; Cingolani, R.; Cozzoli, P. D. J. Am.Chem. Soc. 2010, 132, 2437.
(44) Morales, W.; Cason, M.; Aina, O.; Tacconi, N. R. d.; Rajeshwar,K. J. Am. Chem. Soc. 2008, 130, 6318.
(45) Chen, D.; Ye, J. AdV. Funct. Mater. 2008, 18, 1922.(46) Watcharenwong, A.; Chanmanee, W.; Tacconi, N. R. d.; Chenthama-
rakshan, C. R.; Kajitvichyanukul, P.; Rajeshwar, K. J. Electrochem. Soc.2008, 612, 112.
(47) Tang, J.; Zou, Z.; Ye, J. Chem. Mater. 2004, 16, 1644.(48) Tang, J.; Zou, Z.; Ye, J. J. Phys. Chem. C 2007, 111, 12779.(49) Luan, J.; Pan, B.; Paz, Y.; Li, Y.; Wu, X.; Zou, Z. Phys. Chem.
Chem. Phys. 2009, 11, 6289.(50) Leland, J. K.; Bard, A. J. J. Phys. Chem. 1987, 91, 5076.(51) Dieckmann, R. Philos. Mag. A 1993, 68, 725.(52) Glotzer, S. C.; Solomon, M. J. Nat. Mater. 2007, 6, 557.(53) Yin, Y.; Alivisatos, A. P. Nature 2005, 437, 664.(54) Xia, Y.; Yang, P.; Sun, Y.; Wu, Y.; Mayers, B.; Gates, B.; Yin,
Y.; Kim, F.; Yan, H. AdV. Mater. 2003, 15, 353.(55) Niederberger, M.; Colfen, H. Phys. Chem. Chem. Phys. 2006, 8,
3271.(56) Ribeiro, C.; Lee, E. J. H.; Longo, E.; Leite, E. R. ChemPhysChem
2006, 7, 664.(57) Jun, Y.-W.; Choi, J.-S.; Cheon, J. Angew. Chem., Int. Ed. 2006,
45, 3414.(58) Cozzoli, P. D.; Pellegrino, T.; Manna, L. Chem. Soc. ReV. 2006,
35, 1195.(59) Kumar, S.; Nann, T. Small 2006, 3, 316.(60) Meldrum, F. C.; Colfen, H. Chem. ReV. 2008, 108, 4332.(61) Zhang, Q.; Liu, S.-J.; Yu, S.-H. J. Mater. Chem. 2009, 19, 191.(62) Vayssieres, L.; Sathe, C.; Butorin, S. M.; Shuh, D. K.; Nordgren,
J.; Guo, J. AdV. Mater. 2007, 17, 2320.(63) Mohapatra, S. K.; Banerjee, S.; Misra, M. Nanotechnology 2008,
19 (7), 315601.(64) Mohapatra, S. K.; John, S. E.; Banerjee, S.; Misra, M. Chem. Mater.
2009, 21, 3048.(65) Mao, X. B.; Yang, H. C.; Zhou, X. M.; Wang, C. X.; Wang, Y. S.;
Yang, Y. L.; Wang, C.; Liu, G. Cryst. Growth Des. 2010, 10, 504.
(66) Yang, H. C.; Mao, X. B.; Guo, Y. J.; Wang, D. W.; Ge, G.; Yang,R.; Qiu, X.; Yang, Y. L.; Wang, C.; Wang, Y. S.; Liu, G. CrystEngComm2010, 12, 1842.
(67) Ke, T. Y.; Peng, C. W.; Lee, C. Y.; Chiu, H. T.; Sheu, H. S.CrystEngComm 2009, 11, 1691.
(68) Burleson, D. J.; Penn, R. L. Langmuir 2006, 22, 402.(69) Michel, F. M.; Ehm, L.; Antao, S. M.; Lee, P. L.; Chupas, P. J.;
Liu, G.; Strongin, D. R.; Schoonen, M. A. A.; Phiillips, B. L.; Parise, J. B.Science 2007, 316, 1726.
(70) Michel, F. M.; Ehm, L.; Liu, G.; Han, W. Q.; Antao, S. M.; Chupas,P. J.; Lee, P. L.; Knorr, K.; Eulert, H.; Kim, J.; Grey, C. P.; Celestian,A. J.; Gillow, J.; Schoonen, M. A. A.; Strongin, D. R.; Parise, J. B. Chem.Mater. 2007, 19, 1489.
(71) Liu, G.; Debnath, S.; Paul, K. W.; Han, W.; Hausner, D. B.; Hosein,H.-A.; Michel, F. M.; Parise, J. B.; Sparks, D. L.; Strongin, D. R. Langmuir2006, 22, 9313.
(72) Froment, F.; Tournie, A.; Colomban, P. J. Raman Spectrosc. 2008,39, 560.
(73) Bersani, D.; Lottici, P. P.; Montenero, A. J. Raman Spectrosc. 1999,30, 355.
(74) Parras-Guijarro, D.; Montejo-Gamez, M.; Ramos-Martos, N.;Sanchez, A. Spectrochim. Acta, Part A 2006, 64, 1133.
(75) Yu, J. Q.; Kudo, A. AdV. Funct. Mater. 2006, 16, 2163.(76) Hardcastle, F. D.; Wachs, I. E. J. Phys. Chem. 1991, 95, 5031.(77) Lian, J.; Duan, X.; Ma, J.; Peng, P.; Kim, T.; Zheng, W. ACS Nano
2009, 3, 3749.(78) He, Y. P.; Miao, Y. M.; Li, C. R.; Wang, S. Q.; Cao, L.; Xie,
S. S.; Yang, G. Z.; Zou, B. S. Phys. ReV. B 2005, 71 (9), 125411.(79) Baltrusaitis, J.; Cwiertny, D. M.; Grassian, V. H. Phys. Chem. Chem.
Phys. 2007, 9, 5542.(80) Hsu, L. C.; Li, Y. Y.; Lo, C. G.; Huang, C. W.; Chern, G. J. Phys.
D: Appl. Phys. 2008, 41, 185003.(81) Yue, W.; Randorn, C.; Attidekou, P. S.; Su, Z.; Irvine, J. T. S.;
Zhou, W. AdV. Funct. Mater. 2009, 19, 1.(82) Penn, R. L.; Oskam, G.; Strathmann, T. J.; Searson, P. C.; Stone,
A. T.; Veblen, D. R. J. Phys. Chem. B 2001, 105, 2177.(83) Loffler, L.; Mader, W. J. Eur. Ceram. Soc. 2006, 26, 131.(84) Li, X.; Kikugawa, N.; Ye, J. Chem.sEur. J. 2009, 15, 3538.(85) Li, X.; Kikugawa, N.; Ye, J. AdV. Mater. 2008, 20, 3816.(86) Hanna, K.; Kone, T.; Medjahdi, G. Catal. Commun. 2008, 9, 955.(87) Cwiertny, D. M.; Hunter, G. J.; Pettibone, J. M.; Scherer, M. M.;
Grassian, V. H. J. Phys. Chem. C 2009, 113, 2175.(88) Bahnemann, D. W. In Photochemical ConVersion and Storage of
Solar Energy; Pelizzetti, E., Schiavello, M., Eds.; Kluwer AcademicPublishers: Dordrecht, 1991; p 251.
(89) Xu, J. F.; Ji, W.; Shen, Z. X.; Li, W. S.; Tang, S. H.; Ye, X. R.;Jia, D. Z.; Xin, X. Q. J. Raman Spectrosc. 1999, 30, 413.
(90) Gaboriaud, F.; Ehrhardt, J.-J. Geochim. Cosmochim. Acta 2003,67, 967.
(91) Rustad, J. R.; Felmy, A. R. Geochim. Cosmochim. Acta 2005, 69,1405.
(92) Zhang, D.; Yang, D.; Zhang, H.; Lu, C.; Qi, L. Chem. Mater. 2006,18, 3477.
(93) Grassian, V. H. J. Phys. Chem. C 2008, 112, 18303.
JP103816E
Photocatalytic Degradation of Rhodamine B J. Phys. Chem. C, Vol. 114, No. 40, 2010 17061
Related Documents