Postharvest Biology and Technology 44 (2007) 165–174 Visible and near-infrared spectroscopy for nondestructive quality assessment of pickling cucumbers I. Kavdir a,∗ , R. Lu b , D. Ariana b , M. Ngouajio c a Department of Agricultural Machinery, College of Agriculture, Canakkale Onsekiz Mart University, 17020 Canakkale, Turkey b USDA Agricultural Research Service, 224 Farrall Hall, Michigan State University, East Lansing, MI 48824, USA c Department of Horticulture, A428 Plant and Soil Sciences Michigan State University, East Lansing, MI 48824, USA Received 23 March 2006; accepted 3 September 2006 Abstract This study was aimed at developing a nondestructive method for measuring the firmness, skin and flesh color, and dry matter content of pickling cucumbers by means of visible and near-infrared (Vis/NIR) spectroscopy. ‘Journey’ and ‘Vlaspik’ pickling cucumbers were hand harvested and then stored at 10 ◦ C and 95% relative humidity for various periods up to 18 days. Spectroscopic measurements were made from each intact cucumber in interactance mode with a low-cost CCD-based Vis/NIR spectrometer over 550–1100 nm and an InGaAs-based NIR spectrometer over 800–1650 nm. Standard methods were used to measure skin and flesh color, firmness, and dry matter content of the pickling cucumbers. Calibration models were developed using the partial least squares method for predicting firmness, skin and flesh chroma and hue, and dry matter content. NIR measurements correlated well with Magness–Taylor slope or area, with values for the coefficient of determination (R 2 ) of 0.70–0.73 for calibration and 0.67–0.70 for validation, better than those obtained with the Vis/NIR spectrometer. Vis/NIR measurements had good correlations with skin chroma (R 2 = 0.89 and 0.83 for calibration and validation, respectively) and hue (R 2 = 0.76 for calibration and validation). Promising results were obtained in predicting dry matter content of the cucumbers with R 2 = 0.65 in validation for ‘Journey’ cucumbers. Visible and NIR spectroscopy is potentially useful for sorting and grading pickling cucumbers. © 2007 Elsevier B.V. All rights reserved. Keywords: Near-infrared spectroscopy; Pickling cucumber; Firmness; Color; Dry matter content 1. Introduction Nondestructive quality measurement of fruit and vegeta- bles has been becoming more important with the increasing demands for better food quality and faster and more efficient postharvest quality evaluation. These demands force the food producers to assess their products more vigorously. Near- infrared (NIR) spectroscopy has good potential in assessing the high moisture crops as it is accurate, fast, economical and, most importantly, nondestructive (Kays, 2000). Pickling cucumbers received at the processing plant usually come from different growing, storage or handling ∗ Corresponding author. Tel.: +90 286 2180018x1273; fax: +90 286 2180545. E-mail address: [email protected] (I. Kavdir). backgrounds. Therefore, a rapid and effective quality evaluation of pickling cucumbers before processing would be valuable for controlling and assuring the quality and con- sistency of final products. Firmness, skin and flesh color, and dry matter content are important quality parameters for pick- ling cucumbers (Dan et al., 2003). A pickling cucumber is expected to be firm in all its transversely cut sections includ- ing mesocarp (fruit wall) and carpel (seed cavity). Firmness values of fresh cucumbers are highly correlated with those of cucumbers in salt stock (Sneed and Bowers, 1970). Cucum- bers with superior textural qualities are preferred for both pickling and fresh consumption (Goffinet, 1977). Hence, measuring the firmness of fresh cucumbers before brining for pickling or before fresh consumption would help to produce quality fresh cucumbers or pickles. Kang et al. (2002) mea- sured the firmness change in cucumbers stored at different 0925-5214/$ – see front matter © 2007 Elsevier B.V. All rights reserved. doi:10.1016/j.postharvbio.2006.09.002

Welcome message from author
This document is posted to help you gain knowledge. Please leave a comment to let me know what you think about it! Share it to your friends and learn new things together.
Transcript
A
phfNpa
cwrs©
K
1
bdppitm
u
f
0d
Postharvest Biology and Technology 44 (2007) 165–174
Visible and near-infrared spectroscopy for nondestructive qualityassessment of pickling cucumbers
I. Kavdir a,∗, R. Lu b, D. Ariana b, M. Ngouajio c
a Department of Agricultural Machinery, College of Agriculture, Canakkale Onsekiz Mart University, 17020 Canakkale, Turkeyb USDA Agricultural Research Service, 224 Farrall Hall, Michigan State University, East Lansing, MI 48824, USA
c Department of Horticulture, A428 Plant and Soil Sciences Michigan State University, East Lansing, MI 48824, USA
Received 23 March 2006; accepted 3 September 2006
bstract
This study was aimed at developing a nondestructive method for measuring the firmness, skin and flesh color, and dry matter content ofickling cucumbers by means of visible and near-infrared (Vis/NIR) spectroscopy. ‘Journey’ and ‘Vlaspik’ pickling cucumbers were handarvested and then stored at 10 ◦C and 95% relative humidity for various periods up to 18 days. Spectroscopic measurements were maderom each intact cucumber in interactance mode with a low-cost CCD-based Vis/NIR spectrometer over 550–1100 nm and an InGaAs-basedIR spectrometer over 800–1650 nm. Standard methods were used to measure skin and flesh color, firmness, and dry matter content of theickling cucumbers. Calibration models were developed using the partial least squares method for predicting firmness, skin and flesh chromand hue, and dry matter content.
NIR measurements correlated well with Magness–Taylor slope or area, with values for the coefficient of determination (R2) of 0.70–0.73 foralibration and 0.67–0.70 for validation, better than those obtained with the Vis/NIR spectrometer. Vis/NIR measurements had good correlations
2 2
ith skin chroma (R = 0.89 and 0.83 for calibration and validation, respectively) and hue (R = 0.76 for calibration and validation). Promisingesults were obtained in predicting dry matter content of the cucumbers with R2 = 0.65 in validation for ‘Journey’ cucumbers. Visible and NIRpectroscopy is potentially useful for sorting and grading pickling cucumbers.2007 Elsevier B.V. All rights reserved.
r; Dry m
bebsdleiv
eywords: Near-infrared spectroscopy; Pickling cucumber; Firmness; Colo
. Introduction
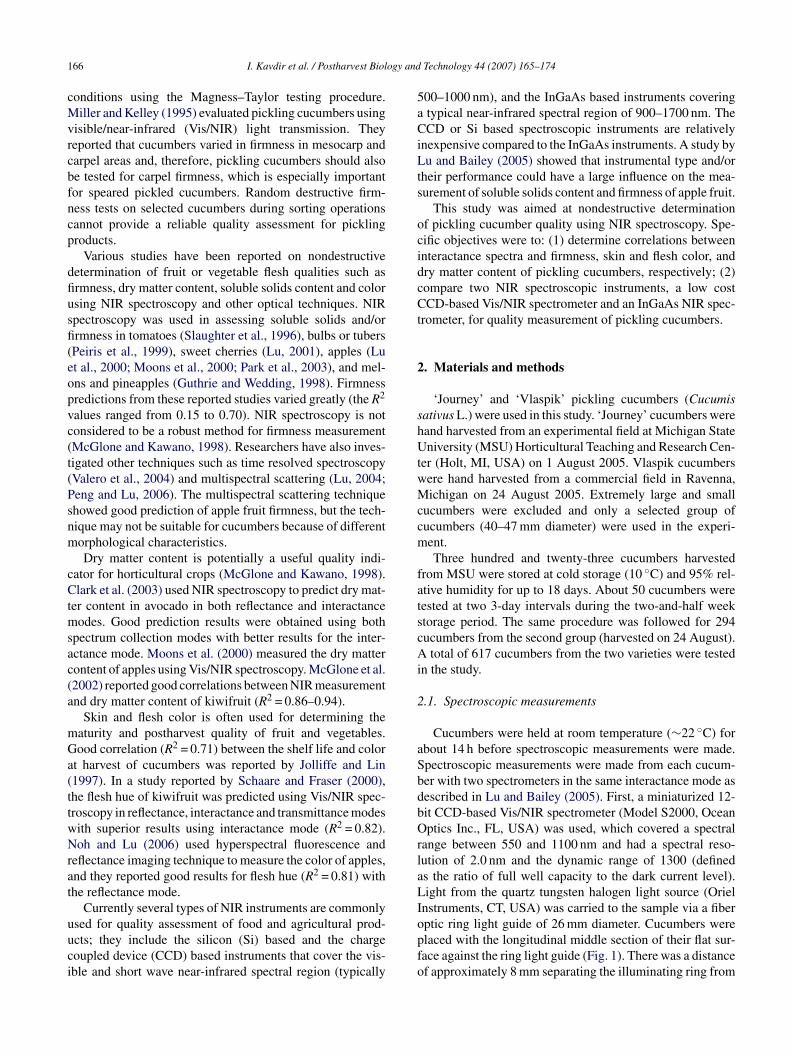
Nondestructive quality measurement of fruit and vegeta-les has been becoming more important with the increasingemands for better food quality and faster and more efficientostharvest quality evaluation. These demands force the foodroducers to assess their products more vigorously. Near-nfrared (NIR) spectroscopy has good potential in assessinghe high moisture crops as it is accurate, fast, economical and,
ost importantly, nondestructive (Kays, 2000).Pickling cucumbers received at the processing plant
sually come from different growing, storage or handling
∗ Corresponding author. Tel.: +90 286 2180018x1273;ax: +90 286 2180545.
E-mail address: [email protected] (I. Kavdir).
cbpmpqs
925-5214/$ – see front matter © 2007 Elsevier B.V. All rights reserved.oi:10.1016/j.postharvbio.2006.09.002
atter content
ackgrounds. Therefore, a rapid and effective qualityvaluation of pickling cucumbers before processing woulde valuable for controlling and assuring the quality and con-istency of final products. Firmness, skin and flesh color, andry matter content are important quality parameters for pick-ing cucumbers (Dan et al., 2003). A pickling cucumber isxpected to be firm in all its transversely cut sections includ-ng mesocarp (fruit wall) and carpel (seed cavity). Firmnessalues of fresh cucumbers are highly correlated with those ofucumbers in salt stock (Sneed and Bowers, 1970). Cucum-ers with superior textural qualities are preferred for bothickling and fresh consumption (Goffinet, 1977). Hence,
easuring the firmness of fresh cucumbers before brining forickling or before fresh consumption would help to produceuality fresh cucumbers or pickles. Kang et al. (2002) mea-ured the firmness change in cucumbers stored at different
1 ogy and
cMvrcbfncp
dfiusfi(eopvc(t(Psnm
cCtmsac(a
mGa(ttwNrat
uuci
5aCiLts
ocidcCt
2
shUtwMccm
fatscAi
2
aSbdbOrlaLI
66 I. Kavdir et al. / Postharvest Biol
onditions using the Magness–Taylor testing procedure.iller and Kelley (1995) evaluated pickling cucumbers using
isible/near-infrared (Vis/NIR) light transmission. Theyeported that cucumbers varied in firmness in mesocarp andarpel areas and, therefore, pickling cucumbers should alsoe tested for carpel firmness, which is especially importantor speared pickled cucumbers. Random destructive firm-ess tests on selected cucumbers during sorting operationsannot provide a reliable quality assessment for picklingroducts.
Various studies have been reported on nondestructiveetermination of fruit or vegetable flesh qualities such asrmness, dry matter content, soluble solids content and colorsing NIR spectroscopy and other optical techniques. NIRpectroscopy was used in assessing soluble solids and/orrmness in tomatoes (Slaughter et al., 1996), bulbs or tubersPeiris et al., 1999), sweet cherries (Lu, 2001), apples (Lut al., 2000; Moons et al., 2000; Park et al., 2003), and mel-ns and pineapples (Guthrie and Wedding, 1998). Firmnessredictions from these reported studies varied greatly (the R2
alues ranged from 0.15 to 0.70). NIR spectroscopy is notonsidered to be a robust method for firmness measurementMcGlone and Kawano, 1998). Researchers have also inves-igated other techniques such as time resolved spectroscopyValero et al., 2004) and multispectral scattering (Lu, 2004;eng and Lu, 2006). The multispectral scattering techniquehowed good prediction of apple fruit firmness, but the tech-ique may not be suitable for cucumbers because of differentorphological characteristics.Dry matter content is potentially a useful quality indi-
ator for horticultural crops (McGlone and Kawano, 1998).lark et al. (2003) used NIR spectroscopy to predict dry mat-
er content in avocado in both reflectance and interactanceodes. Good prediction results were obtained using both
pectrum collection modes with better results for the inter-ctance mode. Moons et al. (2000) measured the dry matterontent of apples using Vis/NIR spectroscopy. McGlone et al.2002) reported good correlations between NIR measurementnd dry matter content of kiwifruit (R2 = 0.86–0.94).
Skin and flesh color is often used for determining theaturity and postharvest quality of fruit and vegetables.ood correlation (R2 = 0.71) between the shelf life and color
t harvest of cucumbers was reported by Jolliffe and Lin1997). In a study reported by Schaare and Fraser (2000),he flesh hue of kiwifruit was predicted using Vis/NIR spec-roscopy in reflectance, interactance and transmittance modesith superior results using interactance mode (R2 = 0.82).oh and Lu (2006) used hyperspectral fluorescence and
eflectance imaging technique to measure the color of apples,nd they reported good results for flesh hue (R2 = 0.81) withhe reflectance mode.
Currently several types of NIR instruments are commonly
sed for quality assessment of food and agricultural prod-cts; they include the silicon (Si) based and the chargeoupled device (CCD) based instruments that cover the vis-ble and short wave near-infrared spectral region (typicallyopfo
Technology 44 (2007) 165–174
00–1000 nm), and the InGaAs based instruments coveringtypical near-infrared spectral region of 900–1700 nm. TheCD or Si based spectroscopic instruments are relatively
nexpensive compared to the InGaAs instruments. A study byu and Bailey (2005) showed that instrumental type and/or
heir performance could have a large influence on the mea-urement of soluble solids content and firmness of apple fruit.
This study was aimed at nondestructive determinationf pickling cucumber quality using NIR spectroscopy. Spe-ific objectives were to: (1) determine correlations betweennteractance spectra and firmness, skin and flesh color, andry matter content of pickling cucumbers, respectively; (2)ompare two NIR spectroscopic instruments, a low costCD-based Vis/NIR spectrometer and an InGaAs NIR spec-
rometer, for quality measurement of pickling cucumbers.
. Materials and methods
‘Journey’ and ‘Vlaspik’ pickling cucumbers (Cucumisativus L.) were used in this study. ‘Journey’ cucumbers wereand harvested from an experimental field at Michigan Stateniversity (MSU) Horticultural Teaching and Research Cen-
er (Holt, MI, USA) on 1 August 2005. Vlaspik cucumbersere hand harvested from a commercial field in Ravenna,ichigan on 24 August 2005. Extremely large and small
ucumbers were excluded and only a selected group ofucumbers (40–47 mm diameter) were used in the experi-ent.Three hundred and twenty-three cucumbers harvested
rom MSU were stored at cold storage (10 ◦C) and 95% rel-tive humidity for up to 18 days. About 50 cucumbers wereested at two 3-day intervals during the two-and-half weektorage period. The same procedure was followed for 294ucumbers from the second group (harvested on 24 August).
total of 617 cucumbers from the two varieties were testedn the study.
.1. Spectroscopic measurements
Cucumbers were held at room temperature (∼22 ◦C) forbout 14 h before spectroscopic measurements were made.pectroscopic measurements were made from each cucum-er with two spectrometers in the same interactance mode asescribed in Lu and Bailey (2005). First, a miniaturized 12-it CCD-based Vis/NIR spectrometer (Model S2000, Oceanptics Inc., FL, USA) was used, which covered a spectral
ange between 550 and 1100 nm and had a spectral reso-ution of 2.0 nm and the dynamic range of 1300 (defineds the ratio of full well capacity to the dark current level).ight from the quartz tungsten halogen light source (Oriel
nstruments, CT, USA) was carried to the sample via a fiber
ptic ring light guide of 26 mm diameter. Cucumbers werelaced with the longitudinal middle section of their flat sur-ace against the ring light guide (Fig. 1). There was a distancef approximately 8 mm separating the illuminating ring from
I. Kavdir et al. / Postharvest Biology and
F
tpdw
NUrsaissotfatsbwfl
2
fpuSi1((c
Twppibt9sefm(Sppreas a measure of apple fruit firmness.
Ff
ig. 1. Spectral measurement of cucumber fruit in interactance mode.
he detecting area so that only light that has entered the sam-le flesh and then impacted onto the detecting area would beetected. The integration time for the Vis/NIR spectrometeras 0.5 s.The second spectrometer used was a 16-bit InGaAs-based
IR spectrometer (Model Triax 300, JY Horiba, New Jersey,SA) which was equipped with a liquid N2 cooling unit to
educe signal noise during the spectral acquisition. The NIRpectrometer covered the spectral range of 800–1650 nm withspectral resolution of 0.2 nm for the grating installed and
ts dynamic range (13,000) was 10 times that for the Vis/NIRpectrometer. NIR spectra were acquired in two scanningteps, one from 800 to 1100 nm with the integration timef 0.5 s and the other from 1100 to 1650 nm with the integra-ion time of 5 s. The two separate integration times were usedor each sub-region because cucumbers had much strongerbsorption in the longer NIR wavelengths 1100–1650 nmhan in the shorter NIR wavelengths. Dark and referencepectra were collected and saved for every 10 samples foroth spectrometers. A white Teflon disk of 25 mm high
as used as a reference. Spectral measurements were per-ormed in a closed chamber painted black to exclude ambientight.
te
ig. 2. Extracting maximum force, slope (on the force/deformation curve) and strainorce/deformation curve for a cucumber sample.
Technology 44 (2007) 165–174 167
.2. Cucumber quality measurements
Skin color was first measured from the intact cucumbersollowed by flesh color measurements after a 2–3 mm thickeel was removed from the same spectral measurement area,sing a digital colorimeter (Model CR-400, Minolta-Konicaensing Inc., Osaka, Japan). Color readings were recorded
n the format of CIE XYZ color space (also known as CIE931 color space). It was then converted into Lab color spaceCIE L*a*b*) which is an absolute color space. Chroma√
a∗2 + b∗2) and hue (arctan [b*/a*]) were derived from Labolor space.
Fruit firmness was tested using a texture analyzer (ModelA.XT2, Stable Micro Systems, Goldalming, Surrey, UK)ith a 6-mm diameter probe for 10 mm of penetration into theeeled section of each fruit at a loading speed of 2 mm/s. Therobe first passed through the mesocarp (fruit wall) and thennto the endocarp (seed cavity) of the fruit. For the cucum-er data set (in the diameter range of 40–47 mm) studied,he mesocarp thickness was approximately between 6.5 and.5 mm (before skin removal). Endocarp, which contains theubsections of carpel, placenta and locular tissue, had a diam-ter around 24–28 mm. Strain energy (i.e., the area under theorce/deformation curve from 0 to 6 mm), slope and maxi-um force were extracted from the force/deformation curves
Fig. 2) and were considered to be measures of fruit firmness.lope values were calculated from the line connecting the twooints at 0 and 2 mm on the MT force/deformation curve. Thisortion of MT force/deformation curve was highly linear,eflecting the elastic response of the cucumbers. Lammertynt al. (1998) used the slope of the MT force/deformation curve
A cucumber slice of 0.7–1.0 cm thick was taken adjacento the firmness measurement area on the side of the blossomnd. Cucumber slices were dried in a convection oven at 80 ◦C
energy (area under the force/deformation curve) from the Magness–Taylor
1 ogy and
fdt
2
s
r
usfaapwwsV1ibtspslWshuav
a(
o(c
3
firmbspslgplt
3
cDbn
taodas
TSc
V
J
V
P
68 I. Kavdir et al. / Postharvest Biol
or 24 h. Dry matter content, expressed on a wet basis, wasetermined by taking the difference between the weights ofhe slice before and after the oven drying.
.3. Spectra analysis
Relative spectra were calculated from the raw interactancepectra of cucumber samples using the following equation:
elative interactance = |sample–dark||reference–dark|
The relative interactance spectra were then preprocessedsing the Savitzky–Golay smoothing method (with the gapize of 19 data points and a second-order polynomial fittingunction) and mean centering. Logarithm (base 10) and firstnd second derivatives of the relative spectra data were takenfter the preprocessing. Spectra corrections, such as multi-licative scatter corrections, were not applied since spectraere acquired in interactance mode and such correctionsere found neither helpful nor necessary. After inspecting
pectral data, the region between 550 and 1000 nm for theis/NIR spectrometer and the region between 825 nm and390 nm for the NIR spectrometer were selected for develop-ng calibration models as the signals beyond these two regionsecame noisy. While no effort was made in this study to findhe optimal spectral regions, our previous work (unpublished)howed that the selected spectral regions were most appro-riate for the interactance sensing configuration used in thistudy. Calibration models were developed using the partialeast squares method (PLS Toolbox, Matlab 6.1, The Math-
orks Inc., Natick, MA) from two-thirds of the cucumberamples for predicting firmness, skin and flesh chroma andue, and dry matter content. Leave-one cross validation wassed for determining the number of factors (or latent vari-bles) for each calibration model. The models were finally
alidated with the remaining samples.Data for the two cucumber varieties were evaluated sep-rately for each variety and also together as one data grouppooled). Relative spectra and their log and first and sec-
fmcf
able 1ummary of the means and standard deviations (S.D.) of Magness–Taylor (MT) aolor values and dry matter content for two varieties of cucumbers
ariety (number of samples) MT firmness
Areaa Slopeb Maximum force
ourney (323)Mean 67.02 4.29 23.31S.D. 13.94 1.24 4.73
laspik (294)Mean 101.09 6.75 31.36S.D. 15.15 1.26 4.36
ooled (617)Mean 83.20 5.46 27.37S.D. 22.38 1.75 6.25
a Area (N mm) under the MT force/deformation curve (from 0 to 6 mm of deformb Slope (N/mm) was obtained from the line connecting the two points at 0 and 2
Technology 44 (2007) 165–174
nd derivative were applied to each of the three data groupsJourney, Vlaspik and pooled) in order to find the optimalalibration models.
. Results and discussion
For the four data treatments (i.e., relative spectra and log,rst and second derivative of the relative spectra), the bestesults, as measured by the correlation relations betweenodel predictions and the quality parameters, were obtained
y using either relative spectra or the logarithm of relativepectra for both spectrometers. The results for all qualityarameters from the first and second derivative were con-istently worse than those from the relative spectra or theogarithmic form. Also, results for Journey cucumbers wereenerally better than those for Vlaspik. For these reasons, thisaper mainly reports on results from relative spectra and theogarithmic form for the pooled data and selected results forhe ‘Journey’ variety.
.1. Measurements of cucumber quality
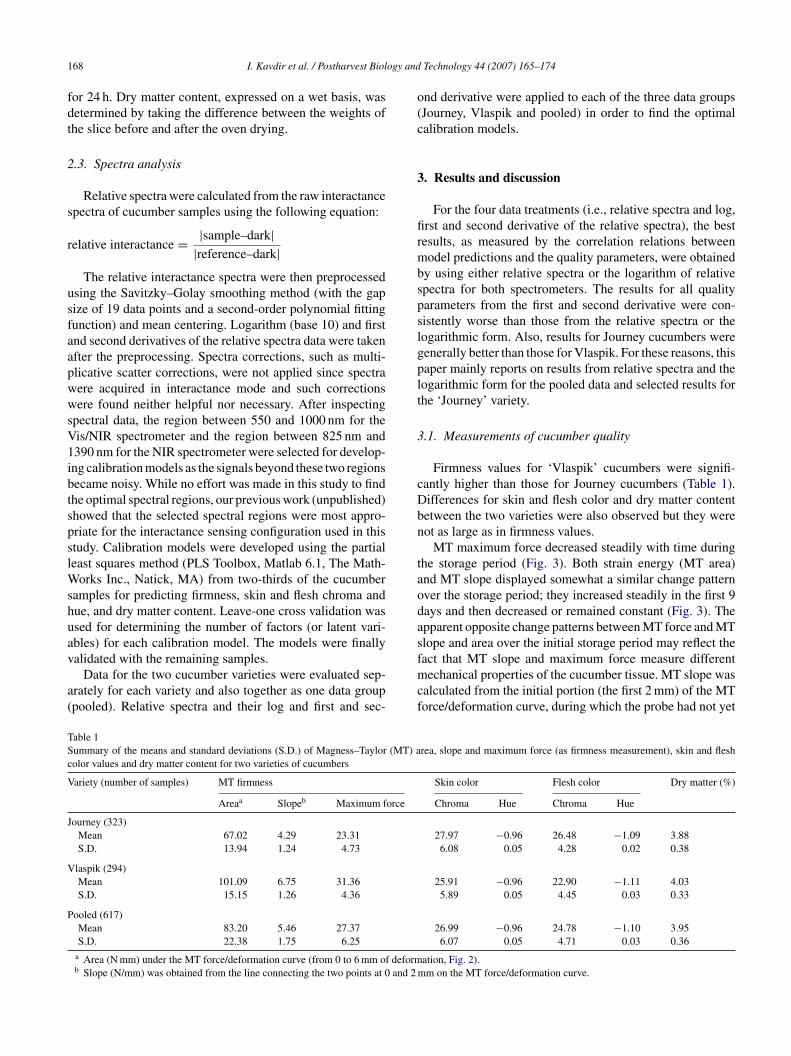
Firmness values for ‘Vlaspik’ cucumbers were signifi-antly higher than those for Journey cucumbers (Table 1).ifferences for skin and flesh color and dry matter contentetween the two varieties were also observed but they wereot as large as in firmness values.
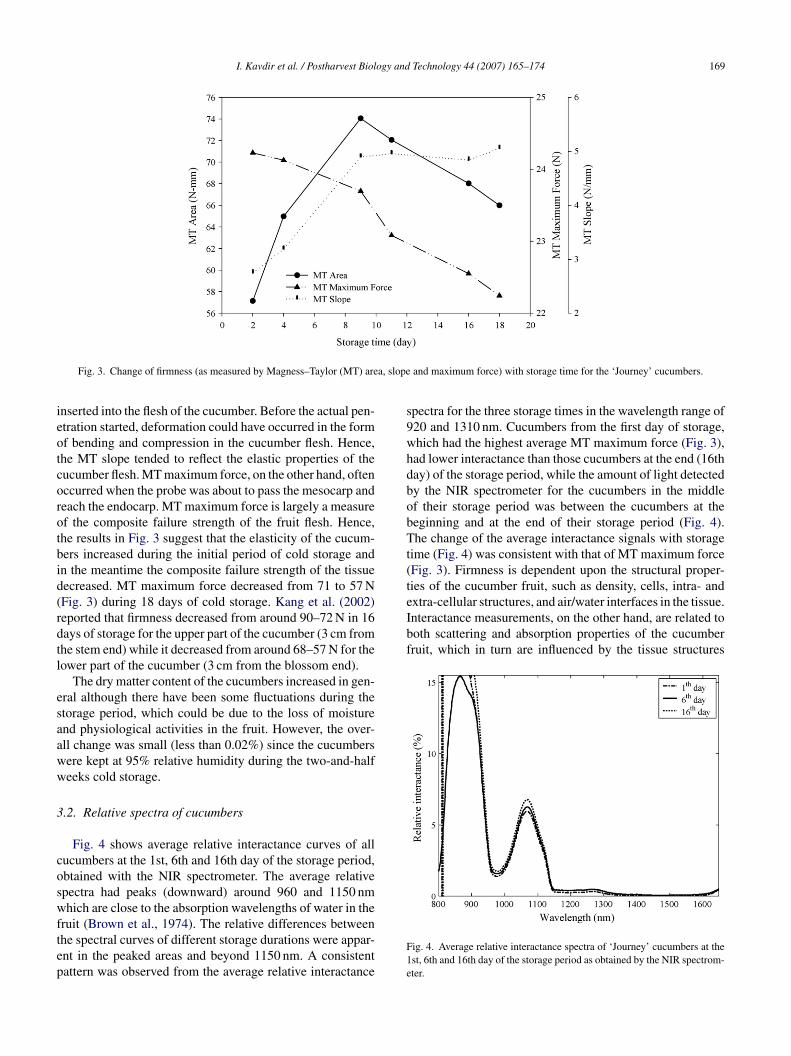
MT maximum force decreased steadily with time duringhe storage period (Fig. 3). Both strain energy (MT area)nd MT slope displayed somewhat a similar change patternver the storage period; they increased steadily in the first 9ays and then decreased or remained constant (Fig. 3). Thepparent opposite change patterns between MT force and MTlope and area over the initial storage period may reflect the
act that MT slope and maximum force measure differentechanical properties of the cucumber tissue. MT slope wasalculated from the initial portion (the first 2 mm) of the MTorce/deformation curve, during which the probe had not yet
rea, slope and maximum force (as firmness measurement), skin and flesh
Skin color Flesh color Dry matter (%)
Chroma Hue Chroma Hue
27.97 −0.96 26.48 −1.09 3.886.08 0.05 4.28 0.02 0.38
25.91 −0.96 22.90 −1.11 4.035.89 0.05 4.45 0.03 0.33
26.99 −0.96 24.78 −1.10 3.956.07 0.05 4.71 0.03 0.36
ation, Fig. 2).mm on the MT force/deformation curve.
I. Kavdir et al. / Postharvest Biology and Technology 44 (2007) 165–174 169
a, slope
ieotcorotbid(rdtl
esaaww
3
coswftep
s9whdbobTt(textra-cellular structures, and air/water interfaces in the tissue.Interactance measurements, on the other hand, are related toboth scattering and absorption properties of the cucumberfruit, which in turn are influenced by the tissue structures
Fig. 3. Change of firmness (as measured by Magness–Taylor (MT) are
nserted into the flesh of the cucumber. Before the actual pen-tration started, deformation could have occurred in the formf bending and compression in the cucumber flesh. Hence,he MT slope tended to reflect the elastic properties of theucumber flesh. MT maximum force, on the other hand, oftenccurred when the probe was about to pass the mesocarp andeach the endocarp. MT maximum force is largely a measuref the composite failure strength of the fruit flesh. Hence,he results in Fig. 3 suggest that the elasticity of the cucum-ers increased during the initial period of cold storage andn the meantime the composite failure strength of the tissueecreased. MT maximum force decreased from 71 to 57 NFig. 3) during 18 days of cold storage. Kang et al. (2002)eported that firmness decreased from around 90–72 N in 16ays of storage for the upper part of the cucumber (3 cm fromhe stem end) while it decreased from around 68–57 N for theower part of the cucumber (3 cm from the blossom end).
The dry matter content of the cucumbers increased in gen-ral although there have been some fluctuations during thetorage period, which could be due to the loss of moisturend physiological activities in the fruit. However, the over-ll change was small (less than 0.02%) since the cucumbersere kept at 95% relative humidity during the two-and-halfeeks cold storage.
.2. Relative spectra of cucumbers
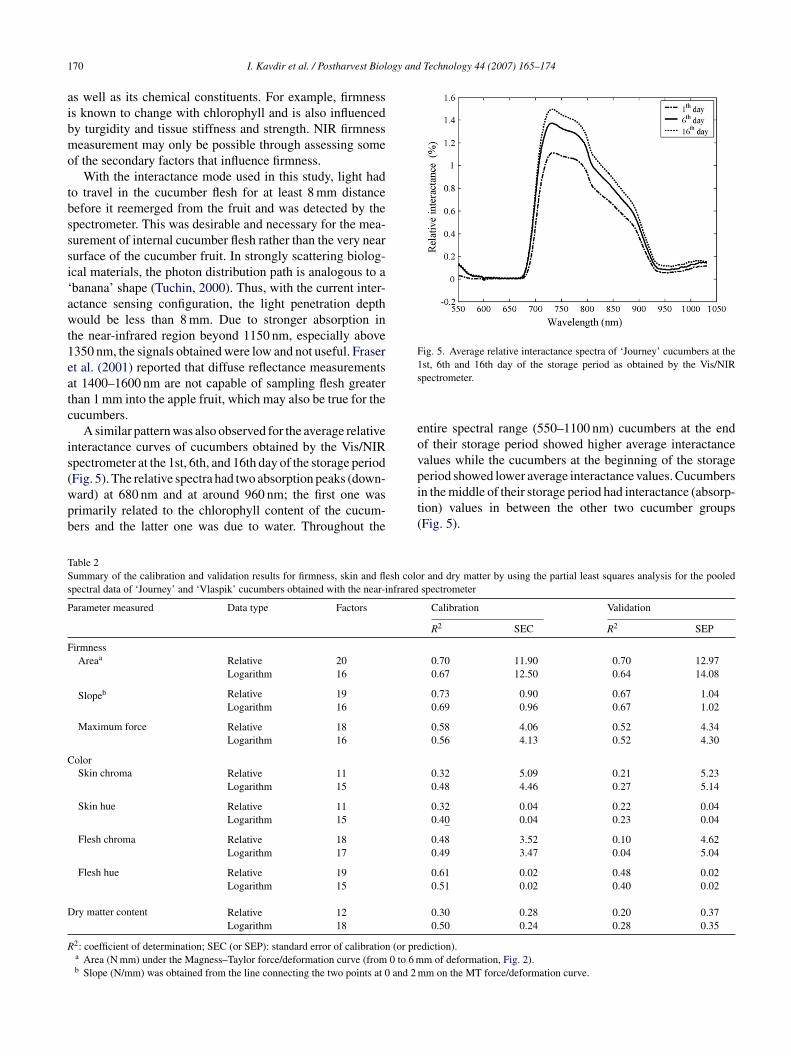
Fig. 4 shows average relative interactance curves of allucumbers at the 1st, 6th and 16th day of the storage period,btained with the NIR spectrometer. The average relativepectra had peaks (downward) around 960 and 1150 nmhich are close to the absorption wavelengths of water in the
ruit (Brown et al., 1974). The relative differences betweenhe spectral curves of different storage durations were appar-nt in the peaked areas and beyond 1150 nm. A consistentattern was observed from the average relative interactance
F1e
and maximum force) with storage time for the ‘Journey’ cucumbers.
pectra for the three storage times in the wavelength range of20 and 1310 nm. Cucumbers from the first day of storage,hich had the highest average MT maximum force (Fig. 3),ad lower interactance than those cucumbers at the end (16thay) of the storage period, while the amount of light detectedy the NIR spectrometer for the cucumbers in the middlef their storage period was between the cucumbers at theeginning and at the end of their storage period (Fig. 4).he change of the average interactance signals with storage
ime (Fig. 4) was consistent with that of MT maximum forceFig. 3). Firmness is dependent upon the structural proper-ies of the cucumber fruit, such as density, cells, intra- and
ig. 4. Average relative interactance spectra of ‘Journey’ cucumbers at thest, 6th and 16th day of the storage period as obtained by the NIR spectrom-ter.
1 ogy and Technology 44 (2007) 165–174
aibmo
tbsssi‘awt1eatc
is(wpb
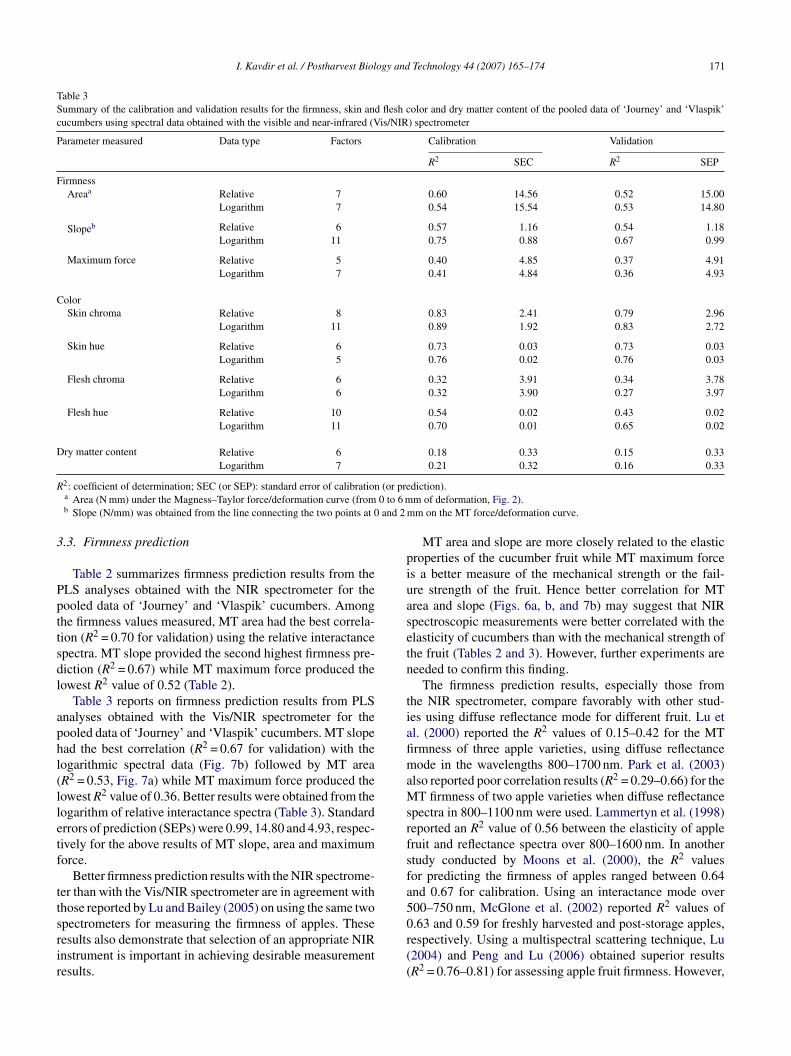
Fig. 5. Average relative interactance spectra of ‘Journey’ cucumbers at the1s
eov
TSs
P
F
C
D
R
70 I. Kavdir et al. / Postharvest Biol
s well as its chemical constituents. For example, firmnesss known to change with chlorophyll and is also influencedy turgidity and tissue stiffness and strength. NIR firmnesseasurement may only be possible through assessing some
f the secondary factors that influence firmness.With the interactance mode used in this study, light had
o travel in the cucumber flesh for at least 8 mm distanceefore it reemerged from the fruit and was detected by thepectrometer. This was desirable and necessary for the mea-urement of internal cucumber flesh rather than the very nearurface of the cucumber fruit. In strongly scattering biolog-cal materials, the photon distribution path is analogous to abanana’ shape (Tuchin, 2000). Thus, with the current inter-ctance sensing configuration, the light penetration depthould be less than 8 mm. Due to stronger absorption in
he near-infrared region beyond 1150 nm, especially above350 nm, the signals obtained were low and not useful. Frasert al. (2001) reported that diffuse reflectance measurementst 1400–1600 nm are not capable of sampling flesh greaterhan 1 mm into the apple fruit, which may also be true for theucumbers.
A similar pattern was also observed for the average relativenteractance curves of cucumbers obtained by the Vis/NIRpectrometer at the 1st, 6th, and 16th day of the storage period
Fig. 5). The relative spectra had two absorption peaks (down-ard) at 680 nm and at around 960 nm; the first one wasrimarily related to the chlorophyll content of the cucum-ers and the latter one was due to water. Throughout thepit(
able 2ummary of the calibration and validation results for firmness, skin and flesh colopectral data of ‘Journey’ and ‘Vlaspik’ cucumbers obtained with the near-infrared
arameter measured Data type Factors
irmnessAreaa Relative 20
Logarithm 16
Slopeb Relative 19Logarithm 16
Maximum force Relative 18Logarithm 16
olorSkin chroma Relative 11
Logarithm 15
Skin hue Relative 11Logarithm 15
Flesh chroma Relative 18Logarithm 17
Flesh hue Relative 19Logarithm 15
ry matter content Relative 12Logarithm 18
2: coefficient of determination; SEC (or SEP): standard error of calibration (or prea Area (N mm) under the Magness–Taylor force/deformation curve (from 0 to 6 mb Slope (N/mm) was obtained from the line connecting the two points at 0 and 2
st, 6th and 16th day of the storage period as obtained by the Vis/NIRpectrometer.
ntire spectral range (550–1100 nm) cucumbers at the endf their storage period showed higher average interactancealues while the cucumbers at the beginning of the storageeriod showed lower average interactance values. Cucumbers
n the middle of their storage period had interactance (absorp-ion) values in between the other two cucumber groupsFig. 5).r and dry matter by using the partial least squares analysis for the pooledspectrometer
Calibration Validation
R2 SEC R2 SEP
0.70 11.90 0.70 12.970.67 12.50 0.64 14.08
0.73 0.90 0.67 1.040.69 0.96 0.67 1.02
0.58 4.06 0.52 4.340.56 4.13 0.52 4.30
0.32 5.09 0.21 5.230.48 4.46 0.27 5.14
0.32 0.04 0.22 0.040.40 0.04 0.23 0.04
0.48 3.52 0.10 4.620.49 3.47 0.04 5.04
0.61 0.02 0.48 0.020.51 0.02 0.40 0.02
0.30 0.28 0.20 0.370.50 0.24 0.28 0.35
diction).m of deformation, Fig. 2).
mm on the MT force/deformation curve.
I. Kavdir et al. / Postharvest Biology and Technology 44 (2007) 165–174 171
Table 3Summary of the calibration and validation results for the firmness, skin and flesh color and dry matter content of the pooled data of ‘Journey’ and ‘Vlaspik’cucumbers using spectral data obtained with the visible and near-infrared (Vis/NIR) spectrometer
Parameter measured Data type Factors Calibration Validation
R2 SEC R2 SEP
FirmnessAreaa Relative 7 0.60 14.56 0.52 15.00
Logarithm 7 0.54 15.54 0.53 14.80
Slopeb Relative 6 0.57 1.16 0.54 1.18Logarithm 11 0.75 0.88 0.67 0.99
Maximum force Relative 5 0.40 4.85 0.37 4.91Logarithm 7 0.41 4.84 0.36 4.93
ColorSkin chroma Relative 8 0.83 2.41 0.79 2.96
Logarithm 11 0.89 1.92 0.83 2.72
Skin hue Relative 6 0.73 0.03 0.73 0.03Logarithm 5 0.76 0.02 0.76 0.03
Flesh chroma Relative 6 0.32 3.91 0.34 3.78Logarithm 6 0.32 3.90 0.27 3.97
Flesh hue Relative 10 0.54 0.02 0.43 0.02Logarithm 11 0.70 0.01 0.65 0.02
Dry matter content Relative 6 0.18 0.33 0.15 0.33Logarithm 7 0.21 0.32 0.16 0.33
R (or pre0 to 6 mand 2 m
3
Ppttsdl
aphl(lletf
ttsrir
piuasetn
tiafimaMsrfsfa5
2: coefficient of determination; SEC (or SEP): standard error of calibrationa Area (N mm) under the Magness–Taylor force/deformation curve (fromb Slope (N/mm) was obtained from the line connecting the two points at 0
.3. Firmness prediction
Table 2 summarizes firmness prediction results from theLS analyses obtained with the NIR spectrometer for theooled data of ‘Journey’ and ‘Vlaspik’ cucumbers. Amonghe firmness values measured, MT area had the best correla-ion (R2 = 0.70 for validation) using the relative interactancepectra. MT slope provided the second highest firmness pre-iction (R2 = 0.67) while MT maximum force produced theowest R2 value of 0.52 (Table 2).
Table 3 reports on firmness prediction results from PLSnalyses obtained with the Vis/NIR spectrometer for theooled data of ‘Journey’ and ‘Vlaspik’ cucumbers. MT slopead the best correlation (R2 = 0.67 for validation) with theogarithmic spectral data (Fig. 7b) followed by MT areaR2 = 0.53, Fig. 7a) while MT maximum force produced theowest R2 value of 0.36. Better results were obtained from theogarithm of relative interactance spectra (Table 3). Standardrrors of prediction (SEPs) were 0.99, 14.80 and 4.93, respec-ively for the above results of MT slope, area and maximumorce.
Better firmness prediction results with the NIR spectrome-er than with the Vis/NIR spectrometer are in agreement withhose reported by Lu and Bailey (2005) on using the same two
pectrometers for measuring the firmness of apples. Theseesults also demonstrate that selection of an appropriate NIRnstrument is important in achieving desirable measurementesults.0r((
diction).m of deformation, Fig. 2).m on the MT force/deformation curve.
MT area and slope are more closely related to the elasticroperties of the cucumber fruit while MT maximum forces a better measure of the mechanical strength or the fail-re strength of the fruit. Hence better correlation for MTrea and slope (Figs. 6a, b, and 7b) may suggest that NIRpectroscopic measurements were better correlated with thelasticity of cucumbers than with the mechanical strength ofhe fruit (Tables 2 and 3). However, further experiments areeeded to confirm this finding.
The firmness prediction results, especially those fromhe NIR spectrometer, compare favorably with other stud-es using diffuse reflectance mode for different fruit. Lu etl. (2000) reported the R2 values of 0.15–0.42 for the MTrmness of three apple varieties, using diffuse reflectanceode in the wavelengths 800–1700 nm. Park et al. (2003)
lso reported poor correlation results (R2 = 0.29–0.66) for theT firmness of two apple varieties when diffuse reflectance
pectra in 800–1100 nm were used. Lammertyn et al. (1998)eported an R2 value of 0.56 between the elasticity of appleruit and reflectance spectra over 800–1600 nm. In anothertudy conducted by Moons et al. (2000), the R2 valuesor predicting the firmness of apples ranged between 0.64nd 0.67 for calibration. Using an interactance mode over00–750 nm, McGlone et al. (2002) reported R2 values of
.63 and 0.59 for freshly harvested and post-storage apples,espectively. Using a multispectral scattering technique, Lu2004) and Peng and Lu (2006) obtained superior resultsR2 = 0.76–0.81) for assessing apple fruit firmness. However,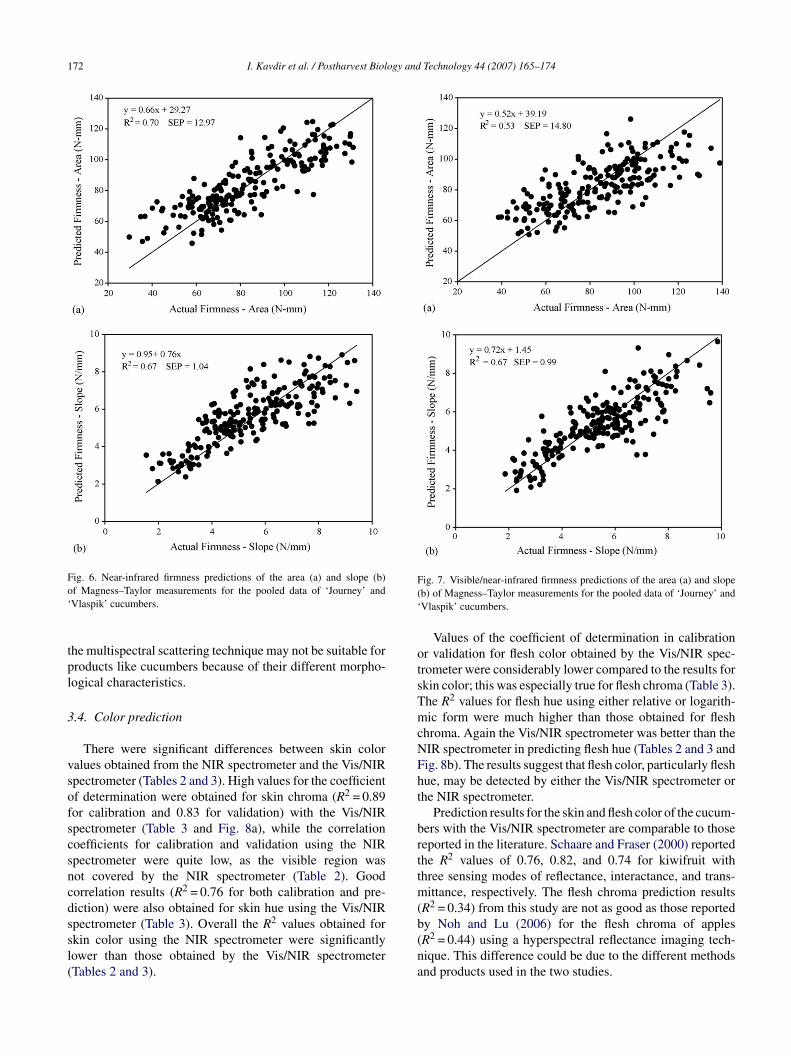
172 I. Kavdir et al. / Postharvest Biology and Technology 44 (2007) 165–174
Fig. 6. Near-infrared firmness predictions of the area (a) and slope (b)o‘
tpl
3
vsofscsncdssl(
F(‘
otsTmcNFht
brttm(
f Magness–Taylor measurements for the pooled data of ‘Journey’ andVlaspik’ cucumbers.
he multispectral scattering technique may not be suitable forroducts like cucumbers because of their different morpho-ogical characteristics.
.4. Color prediction
There were significant differences between skin coloralues obtained from the NIR spectrometer and the Vis/NIRpectrometer (Tables 2 and 3). High values for the coefficientf determination were obtained for skin chroma (R2 = 0.89or calibration and 0.83 for validation) with the Vis/NIRpectrometer (Table 3 and Fig. 8a), while the correlationoefficients for calibration and validation using the NIRpectrometer were quite low, as the visible region wasot covered by the NIR spectrometer (Table 2). Goodorrelation results (R2 = 0.76 for both calibration and pre-iction) were also obtained for skin hue using the Vis/NIR
pectrometer (Table 3). Overall the R2 values obtained forkin color using the NIR spectrometer were significantlyower than those obtained by the Vis/NIR spectrometerTables 2 and 3).b(na
ig. 7. Visible/near-infrared firmness predictions of the area (a) and slopeb) of Magness–Taylor measurements for the pooled data of ‘Journey’ andVlaspik’ cucumbers.
Values of the coefficient of determination in calibrationr validation for flesh color obtained by the Vis/NIR spec-rometer were considerably lower compared to the results forkin color; this was especially true for flesh chroma (Table 3).he R2 values for flesh hue using either relative or logarith-ic form were much higher than those obtained for flesh
hroma. Again the Vis/NIR spectrometer was better than theIR spectrometer in predicting flesh hue (Tables 2 and 3 andig. 8b). The results suggest that flesh color, particularly fleshue, may be detected by either the Vis/NIR spectrometer orhe NIR spectrometer.
Prediction results for the skin and flesh color of the cucum-ers with the Vis/NIR spectrometer are comparable to thoseeported in the literature. Schaare and Fraser (2000) reportedhe R2 values of 0.76, 0.82, and 0.74 for kiwifruit withhree sensing modes of reflectance, interactance, and trans-
ittance, respectively. The flesh chroma prediction resultsR2 = 0.34) from this study are not as good as those reported
y Noh and Lu (2006) for the flesh chroma of applesR2 = 0.44) using a hyperspectral reflectance imaging tech-ique. This difference could be due to the different methodsnd products used in the two studies.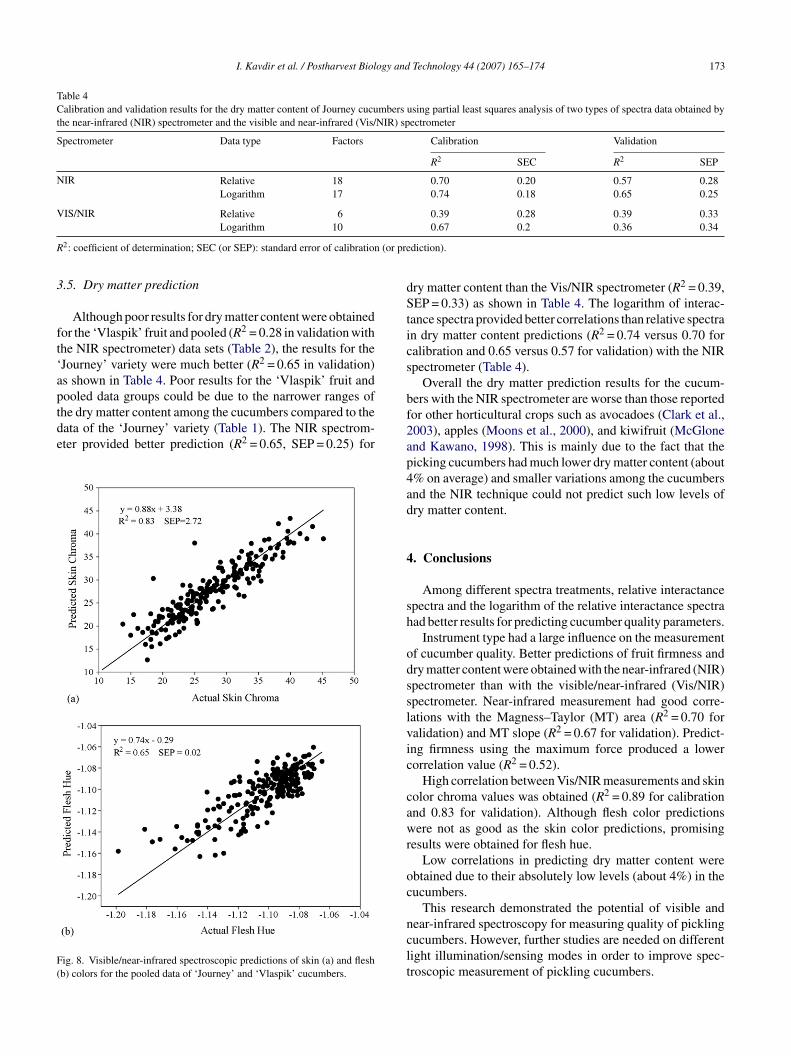
I. Kavdir et al. / Postharvest Biology and Technology 44 (2007) 165–174 173
Table 4Calibration and validation results for the dry matter content of Journey cucumbers using partial least squares analysis of two types of spectra data obtained bythe near-infrared (NIR) spectrometer and the visible and near-infrared (Vis/NIR) spectrometer
Spectrometer Data type Factors Calibration Validation
R2 SEC R2 SEP
NIR Relative 18 0.70 0.20 0.57 0.28Logarithm 17 0.74 0.18 0.65 0.25
VIS/NIR Relative 6 0.39 0.28 0.39 0.33
R (or pre
3
ft‘aptde
F(
dStics
b
Logarithm 10
2: coefficient of determination; SEC (or SEP): standard error of calibration
.5. Dry matter prediction
Although poor results for dry matter content were obtainedor the ‘Vlaspik’ fruit and pooled (R2 = 0.28 in validation withhe NIR spectrometer) data sets (Table 2), the results for theJourney’ variety were much better (R2 = 0.65 in validation)s shown in Table 4. Poor results for the ‘Vlaspik’ fruit andooled data groups could be due to the narrower ranges of
he dry matter content among the cucumbers compared to theata of the ‘Journey’ variety (Table 1). The NIR spectrom-ter provided better prediction (R2 = 0.65, SEP = 0.25) forig. 8. Visible/near-infrared spectroscopic predictions of skin (a) and fleshb) colors for the pooled data of ‘Journey’ and ‘Vlaspik’ cucumbers.
f2ap4ad
4
sh
odsslvic
cawr
oc
nclt
0.67 0.2 0.36 0.34
diction).
ry matter content than the Vis/NIR spectrometer (R2 = 0.39,EP = 0.33) as shown in Table 4. The logarithm of interac-
ance spectra provided better correlations than relative spectran dry matter content predictions (R2 = 0.74 versus 0.70 foralibration and 0.65 versus 0.57 for validation) with the NIRpectrometer (Table 4).
Overall the dry matter prediction results for the cucum-ers with the NIR spectrometer are worse than those reportedor other horticultural crops such as avocadoes (Clark et al.,003), apples (Moons et al., 2000), and kiwifruit (McGlonend Kawano, 1998). This is mainly due to the fact that theicking cucumbers had much lower dry matter content (about% on average) and smaller variations among the cucumbersnd the NIR technique could not predict such low levels ofry matter content.
. Conclusions
Among different spectra treatments, relative interactancepectra and the logarithm of the relative interactance spectraad better results for predicting cucumber quality parameters.
Instrument type had a large influence on the measurementf cucumber quality. Better predictions of fruit firmness andry matter content were obtained with the near-infrared (NIR)pectrometer than with the visible/near-infrared (Vis/NIR)pectrometer. Near-infrared measurement had good corre-ations with the Magness–Taylor (MT) area (R2 = 0.70 foralidation) and MT slope (R2 = 0.67 for validation). Predict-ng firmness using the maximum force produced a lowerorrelation value (R2 = 0.52).
High correlation between Vis/NIR measurements and skinolor chroma values was obtained (R2 = 0.89 for calibrationnd 0.83 for validation). Although flesh color predictionsere not as good as the skin color predictions, promising
esults were obtained for flesh hue.Low correlations in predicting dry matter content were
btained due to their absolutely low levels (about 4%) in theucumbers.
This research demonstrated the potential of visible and
ear-infrared spectroscopy for measuring quality of picklingucumbers. However, further studies are needed on differentight illumination/sensing modes in order to improve spec-roscopic measurement of pickling cucumbers.
1 ogy and
A
TfGEaS
R
B
C
D
F
G
G
J
K
K
L
L
L
L
L
M
M
M
M
N
P
P
P
S
S
S
T
USA.
74 I. Kavdir et al. / Postharvest Biol
cknowledgements
The authors thank Mr. Benjamin Bailey, Engineeringechnician with the USDA Agricultural Research Service,or his technical support for this research and Dr. Daniel E.uyer of the Department of Biosystems and Agriculturalngineering at Michigan State University for his supportnd help. This work was funded in part by TUBITAK (Thecientific and Technological Research Council of Turkey).
eferences
rown, G.K., Segerlind, L.J., Summitt, R., 1974. Near-infrared reflectanceof bruised apples. Trans. ASAE 17, 534–536.
lark, C.J., McGlone, V.A., Requejo, C., White, A., Woolf, A.B., 2003. Drymatter determination in Hass avocado by NIR spectroscopy. PostharvestBiol. Technol. 29, 300–307.
an, H., Okuhara, K., Kohyama, K., 2003. Discrimination of cucumbercultivars using a multiple-point sheet sensor to measure biting force. J.Sci. Food Agric. 83, 1320–1326.
raser, D.G., Kunnemeyer, R., McGlone, V.A., Jordan, R.B., 2001. Nearinfra-red (NIR) light penetration into an apple. Postharvest Biol. Technol.22, 191–195.
offinet, M.C., 1977. Some anatomical considerations in the study of cucum-ber fruit texture. J. Am. Soc. Hort. Sci. 102, 474–478.
uthrie, J., Wedding, B., 1998. Robustness of NIR calibrations for solu-ble solids in intact melon and pineapple. J. Near Infrared Spectrosc. 6,259–265.
olliffe, P.A., Lin, W.C., 1997. Predictors of shelf life in long English cucum-ber. J. Am. Soc. Hort. Sci. 122, 686–690.
ang, H.M., Park, K.W., Saltveit, M.E., 2002. Elevated growing temper-atures during the day improve the postharvest chilling tolerance ofgreenhouse-grown cucumber (Cucumis sativus) fruit. Postharvest Biol.Technol. 24, 49–57.
ays, S.J., 2000. On-line near infrared quality assessment of high mois-ture plant products. In: Florkowski, W.J., Prussia, S.E., Shewfelt, R.L.(Eds.), Integrated View of Fruit & Vegetable Quality. Technomic Pub.,Lancaster, PA, pp. 119–127.
ammertyn, J., Nicolaı, B., Ooms, K., De Smelt, V., De Baerdemaeker,J., 1998. Non-destructive measurement of acidity, soluble solids, andfirmness of Jonagold apples using NIR-spectroscopy. Trans. ASAE 41,1089–1094.
u, R., 2001. Predicting firmness and sugar content of sweet cherriesusing near-infrared diffuse reflectance spectroscopy. Trans. ASAE 44,1265–1271.
u, R., 2004. Multispectral imaging for predicting firmness and solublesolids content of apple fruit. Postharvest Biol. Technol. 31, 147–157.
V
Technology 44 (2007) 165–174
u, R., Bailey, B.B., 2005. NIR measurement of apple fruit soluble solidscontent and firmness as affected by postharvest storage. ASAE PaperNo. 056070, ASAE, St. Joseph, MI.
u, R., Guyer, D.E., Beaudry, R.M., 2000. Determination of firmness andsugar content apples using near-infrared diffuse reflectance. J. TextureStud. 31, 615–630.
cGlone, V.A., Kawano, S., 1998. Firmness, dry-matter and soluble-solidsassessment of postharvest kiwifruit by NIR spectroscopy. PostharvestBiol. Technol. 13, 131–141.
cGlone, V.A., Jordan, R.B., Seelye, R., Martinsen, P.J., 2002. Com-paring density and NIR methods for measurement of kiwifruit drymatter and soluble solids content. Postharvest Biol. Technol. 26, 191–198.
iller, A.R., Kelley, T.J., 1995. Nondestructive evaluation of picklingcucumbers using visible-infrared light transmission. J. Am. Soc. Hort.Sci. 120, 1063–1068.
oons, E., Sinnaeve, G., Dardenne, P., 2000. Nondestructive visible and NIRspectroscopy measurement for determination of apple internal quality.Acta Hort. 517, 441–448.
oh, H., Lu, R., 2006. Integration of hyperspectral reflectance and laserinduced fluorescence imaging for assessing apple maturity. ASABEPaper No. 066182, ASABE, St. Joseph, MI.
ark, B., Abbott, J.A., Lee, K.J., Choi, C.H., Choi, K.H., 2003. Near-infrareddiffuse reflectance for quantitative and qualitative measurement of sol-uble solids and firmness of Delicious and Gala apples. Trans. ASAE 46,1721–1731.
eiris, K.H.S., Dull, G.G., Leffler, R.G., Kays, S.J., 1999. Spatial variabilityof soluble solids or dry-matter content within individual fruits, bulbs, ortubers: implications for the development and use of NIR spectrometrictechniques. HortScience 34, 114–118.
eng, Y., Lu, R., 2006. Improving apple fruit firmness predictions by effec-tive correction of multispectral scattering images. Postharvest Biol.Technol. 41, 266–274.
chaare, P.N., Fraser, D.G., 2000. Comparison of reflectance, interactanceand transmission modes of visible-near infrared spectroscopy for mea-suring internal properties of kiwifruit (Actinidia chinensis). PostharvestBiol. Technol. 20, 175–184.
laughter, D.C., Barrett, D., Beorsig, M., 1996. Nondestructive determina-tion of soluble solids in tomatoes using near infrared spectroscopy. J.Food Sci. 61, 695–697.
need, F.D., Bowers, J.L., 1970. Green fruit characters of cucumber asrelated to quality factors in brine stock. J. Am. Soc. Hort. Sci. 95,489–491.
uchin, V., 2000. Tissue Optics: Light Scattering Methods andInstruments for Medical Diagnosis. SPIE Press, Bellingham, WA,
alero, C., Ruiz-Altisent, M., Cubeddu, R., Pifferi, A., Taroni, P., Torricelli,A., Valentini, A., Johnson, D., Dover, C., 2004. Selection of modelsfor internal quality of fruit, based on time domain laser reflectancespectroscopy. Biosyst. Eng. 88, 313–323.
Related Documents