RESEARCH PAPER Viscosity Analysis of High Concentration Bovine Serum Albumin Aqueous Solutions Sandeep Yadav & Steven J. Shire & Devendra S. Kalonia Received: 8 December 2010 / Accepted: 8 March 2011 / Published online: 14 April 2011 # Springer Science+Business Media, LLC 2011 ABSTRACT Purpose To understand the apparent inconsistency between the dilute and high concentration viscosity behavior of bovine serum albumin (BSA). Method Zeta potential and molecular charge on BSA were determined from Electrophoretic mobility measurements. Second virial coefficient (B 22 ) and interaction parameter (k D ) obtained from static and dynamic light scattering, respectively, quantified intermolecular interactions. Rheology studies char- acterized viscoelasticity at high concentration. The dipole moment was calculated using Takashima’s approximation for proton fluctuations over charged residues. Results The effective isoelectric point of BSA was pH 4.95. In dilute solutions (≤ 40 mg/ml), the viscosity was minimal at the pI; at high concentrations, pH 5.0 solutions were most viscous. B 22 and k D showed intermolecular attractions at pH 5.0; repulsions dominated at other pHs. The attractive interactions led to a high storage modulus (G′) at pH 5.0. Conclusion In dilute solutions, the electroviscous effect due to net charge governs the viscosity behavior; at high concen- trations, the solution viscosity cannot be justified based on a single parameter. The net interplay of all intermolecular forces dictates viscosity behavior, wherein intermolecular attraction leads to a higher solution viscosity. KEY WORDS dipole moment . high concentration viscosity . interaction parameter (k D ). . intermolecular interaction . protein charge . second virial coefficient (B 22 ) . zeta potential INTRODUCTION In 1956 Buzzel and Tanford published the viscosity of bovine serum albumin (BSA) and ribonuclease (RNAase) at various conditions of solution pH and ionic strengths (1,2). For the concentration range studied (~40–50 mg/ml) the solution viscosity showed a good correlation with the net charge-induced electroviscous effects. Due to the presence of electrical charge on the molecule, three kinds of contribution may affect the viscosity behavior. A ‘primary effect’ due to the resistance of the diffuse double layer surrounding the molecule, a ‘secondary effect’ due to the intermolecular repulsion between double layers and a ‘tertiary effect’ that may arise if the interparticle repulsion affects the shape of the macromolecule. These three are collectively known as the ‘electroviscous effects’ (3). When a charged particle moves through a medium comprising small ions, electrostatic interaction between the particle and the small ions results in a relative motion of the ions to the medium and consequently an additional viscous loss arises that contributes to the overall viscosity of the solution. For BSA and RNAase solutions the slope of the reduced viscosity (η red ), i.e. the specific increment in viscosity as a Electronic supplementary material The online version of this article (doi:10.1007/s11095-011-0424-7) contains supplementary material, which is available to authorized users. S. Yadav : D. S. Kalonia (*) Department of Pharmaceutical Sciences, University of Connecticut Storrs, CT 06269, USA e-mail: [email protected] S. J. Shire Late Stage Pharmaceutical Development Genentech, Inc. 1 DNA Way South San Francisco, CA 94080, USA Present Address: S. Yadav Late Stage Pharmaceutical Development Genentech, Inc. South San Francisco, CA 94080, USA Pharm Res (2011) 28:1973–1983 DOI 10.1007/s11095-011-0424-7

Welcome message from author
This document is posted to help you gain knowledge. Please leave a comment to let me know what you think about it! Share it to your friends and learn new things together.
Transcript
RESEARCH PAPER
Viscosity Analysis of High Concentration Bovine SerumAlbumin Aqueous Solutions
Sandeep Yadav & Steven J. Shire & Devendra S. Kalonia
Received: 8 December 2010 /Accepted: 8 March 2011 /Published online: 14 April 2011# Springer Science+Business Media, LLC 2011
ABSTRACTPurpose To understand the apparent inconsistency betweenthe dilute and high concentration viscosity behavior of bovineserum albumin (BSA).Method Zeta potential and molecular charge on BSA weredetermined from Electrophoretic mobility measurements.Second virial coefficient (B22) and interaction parameter (kD)obtained from static and dynamic light scattering, respectively,quantified intermolecular interactions. Rheology studies char-acterized viscoelasticity at high concentration. The dipolemoment was calculated using Takashima’s approximation forproton fluctuations over charged residues.Results The effective isoelectric point of BSA was pH 4.95. Indilute solutions (≤ 40 mg/ml), the viscosity was minimal at thepI; at high concentrations, pH 5.0 solutions were most viscous.B22 and kD showed intermolecular attractions at pH 5.0;repulsions dominated at other pHs. The attractive interactionsled to a high storage modulus (G′) at pH 5.0.
Conclusion In dilute solutions, the electroviscous effect due tonet charge governs the viscosity behavior; at high concen-trations, the solution viscosity cannot be justified based on asingle parameter. The net interplay of all intermolecular forcesdictates viscosity behavior, wherein intermolecular attractionleads to a higher solution viscosity.
KEY WORDS dipole moment . high concentration viscosity .interaction parameter (kD). . intermolecular interaction . proteincharge . second virial coefficient (B22) . zeta potential
INTRODUCTION
In 1956 Buzzel and Tanford published the viscosity ofbovine serum albumin (BSA) and ribonuclease (RNAase) atvarious conditions of solution pH and ionic strengths (1,2).For the concentration range studied (~40–50 mg/ml) thesolution viscosity showed a good correlation with the netcharge-induced electroviscous effects. Due to the presenceof electrical charge on the molecule, three kinds ofcontribution may affect the viscosity behavior. A ‘primaryeffect’ due to the resistance of the diffuse double layersurrounding the molecule, a ‘secondary effect’ due to theintermolecular repulsion between double layers and a‘tertiary effect’ that may arise if the interparticle repulsionaffects the shape of the macromolecule. These three arecollectively known as the ‘electroviscous effects’ (3). When acharged particle moves through a medium comprisingsmall ions, electrostatic interaction between the particleand the small ions results in a relative motion of the ions tothe medium and consequently an additional viscous lossarises that contributes to the overall viscosity of the solution.
For BSA and RNAase solutions the slope of the reducedviscosity (ηred), i.e. the specific increment in viscosity as a
Electronic supplementary material The online version of this article(doi:10.1007/s11095-011-0424-7) contains supplementary material,which is available to authorized users.
S. Yadav :D. S. Kalonia (*)Department of Pharmaceutical Sciences, University of ConnecticutStorrs, CT 06269, USAe-mail: [email protected]
S. J. ShireLate Stage Pharmaceutical DevelopmentGenentech, Inc.1 DNA WaySouth San Francisco, CA 94080, USA
Present Address:S. YadavLate Stage Pharmaceutical DevelopmentGenentech, Inc.South San Francisco, CA 94080, USA
Pharm Res (2011) 28:1973–1983DOI 10.1007/s11095-011-0424-7
function of protein concentration (c), increased with anincrease in molecular charge (1,2). An increase in solutionionic strength resulted in a decrease in the slope (ηred versus c),which finally attained a limiting value at high solution ionicstrengths. The authors attributed this to the net molecularcharge-induced primary and secondary electroviscous effects,which also correlated to some extent with Booth’s theory (4)of anticipated increase in intrinsic viscosity [η] due toelectroviscous effects (1,2).
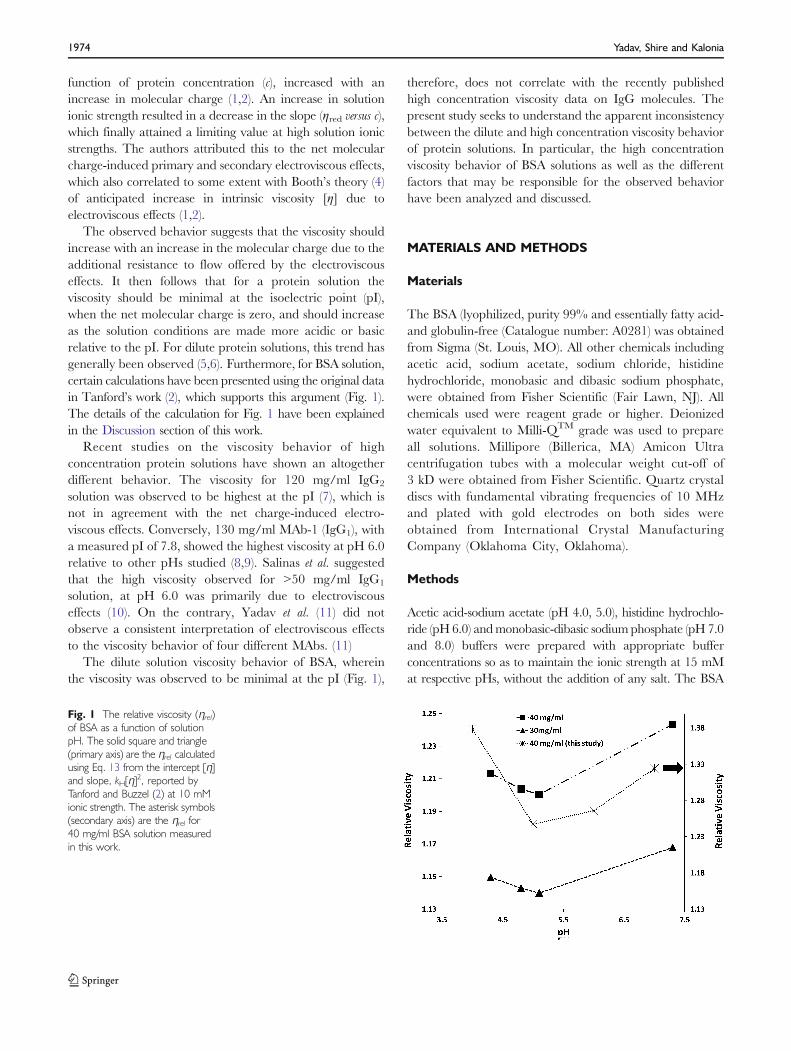
The observed behavior suggests that the viscosity shouldincrease with an increase in the molecular charge due to theadditional resistance to flow offered by the electroviscouseffects. It then follows that for a protein solution theviscosity should be minimal at the isoelectric point (pI),when the net molecular charge is zero, and should increaseas the solution conditions are made more acidic or basicrelative to the pI. For dilute protein solutions, this trend hasgenerally been observed (5,6). Furthermore, for BSA solution,certain calculations have been presented using the original datain Tanford’s work (2), which supports this argument (Fig. 1).The details of the calculation for Fig. 1 have been explainedin the Discussion section of this work.
Recent studies on the viscosity behavior of highconcentration protein solutions have shown an altogetherdifferent behavior. The viscosity for 120 mg/ml IgG2
solution was observed to be highest at the pI (7), which isnot in agreement with the net charge-induced electro-viscous effects. Conversely, 130 mg/ml MAb-1 (IgG1), witha measured pI of 7.8, showed the highest viscosity at pH 6.0relative to other pHs studied (8,9). Salinas et al. suggestedthat the high viscosity observed for >50 mg/ml IgG1
solution, at pH 6.0 was primarily due to electroviscouseffects (10). On the contrary, Yadav et al. (11) did notobserve a consistent interpretation of electroviscous effectsto the viscosity behavior of four different MAbs. (11)
The dilute solution viscosity behavior of BSA, whereinthe viscosity was observed to be minimal at the pI (Fig. 1),
therefore, does not correlate with the recently publishedhigh concentration viscosity data on IgG molecules. Thepresent study seeks to understand the apparent inconsistencybetween the dilute and high concentration viscosity behaviorof protein solutions. In particular, the high concentrationviscosity behavior of BSA solutions as well as the differentfactors that may be responsible for the observed behaviorhave been analyzed and discussed.
MATERIALS AND METHODS
Materials
The BSA (lyophilized, purity 99% and essentially fatty acid-and globulin-free (Catalogue number: A0281) was obtainedfrom Sigma (St. Louis, MO). All other chemicals includingacetic acid, sodium acetate, sodium chloride, histidinehydrochloride, monobasic and dibasic sodium phosphate,were obtained from Fisher Scientific (Fair Lawn, NJ). Allchemicals used were reagent grade or higher. Deionizedwater equivalent to Milli-QTM grade was used to prepareall solutions. Millipore (Billerica, MA) Amicon Ultracentrifugation tubes with a molecular weight cut-off of3 kD were obtained from Fisher Scientific. Quartz crystaldiscs with fundamental vibrating frequencies of 10 MHzand plated with gold electrodes on both sides wereobtained from International Crystal ManufacturingCompany (Oklahoma City, Oklahoma).
Methods
Acetic acid-sodium acetate (pH 4.0, 5.0), histidine hydrochlo-ride (pH 6.0) andmonobasic-dibasic sodium phosphate (pH 7.0and 8.0) buffers were prepared with appropriate bufferconcentrations so as to maintain the ionic strength at 15 mMat respective pHs, without the addition of any salt. The BSA
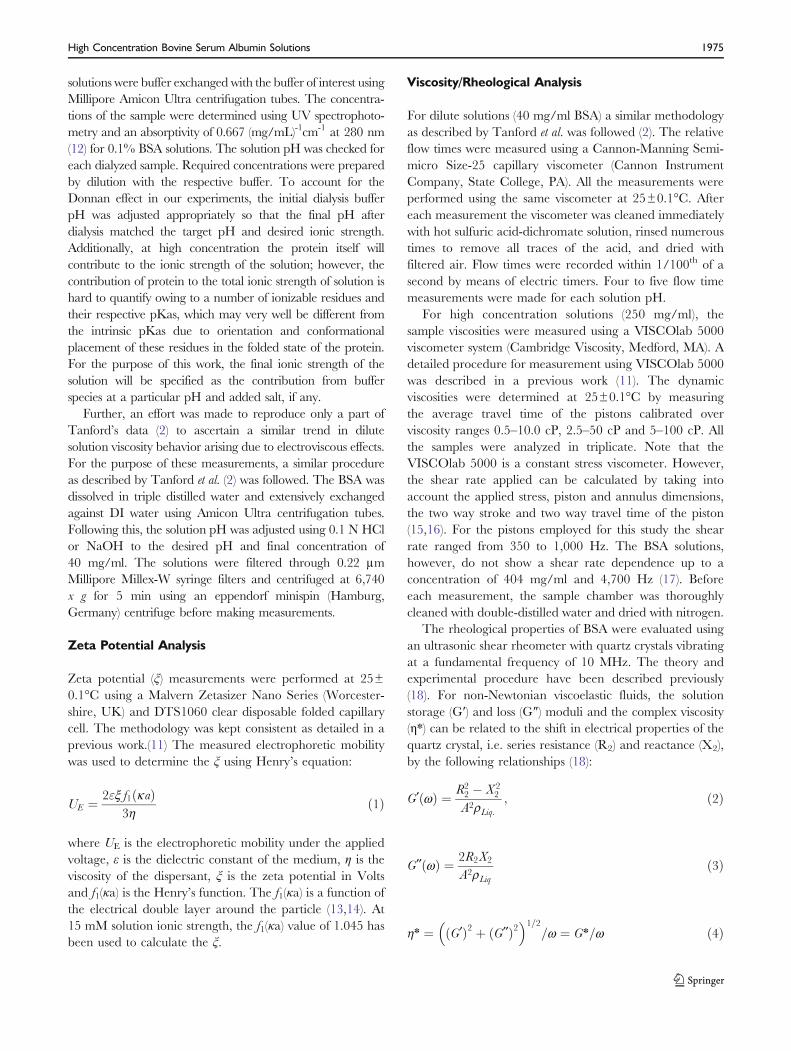
Fig. 1 The relative viscosity (ηrel)of BSA as a function of solutionpH. The solid square and triangle(primary axis) are the ηrel calculatedusing Eq. 13 from the intercept [η]and slope, kH[η]
2, reported byTanford and Buzzel (2) at 10 mMionic strength. The asterisk symbols(secondary axis) are the ηrel for40 mg/ml BSA solution measuredin this work.
1974 Yadav, Shire and Kalonia
solutions were buffer exchanged with the buffer of interest usingMillipore Amicon Ultra centrifugation tubes. The concentra-tions of the sample were determined using UV spectrophoto-metry and an absorptivity of 0.667 (mg/mL)-1cm-1 at 280 nm(12) for 0.1% BSA solutions. The solution pH was checked foreach dialyzed sample. Required concentrations were preparedby dilution with the respective buffer. To account for theDonnan effect in our experiments, the initial dialysis bufferpH was adjusted appropriately so that the final pH afterdialysis matched the target pH and desired ionic strength.Additionally, at high concentration the protein itself willcontribute to the ionic strength of the solution; however, thecontribution of protein to the total ionic strength of solution ishard to quantify owing to a number of ionizable residues andtheir respective pKas, which may very well be different fromthe intrinsic pKas due to orientation and conformationalplacement of these residues in the folded state of the protein.For the purpose of this work, the final ionic strength of thesolution will be specified as the contribution from bufferspecies at a particular pH and added salt, if any.
Further, an effort was made to reproduce only a part ofTanford’s data (2) to ascertain a similar trend in dilutesolution viscosity behavior arising due to electroviscous effects.For the purpose of these measurements, a similar procedureas described by Tanford et al. (2) was followed. The BSA wasdissolved in triple distilled water and extensively exchangedagainst DI water using Amicon Ultra centrifugation tubes.Following this, the solution pH was adjusted using 0.1 N HClor NaOH to the desired pH and final concentration of40 mg/ml. The solutions were filtered through 0.22 μmMillipore Millex-W syringe filters and centrifuged at 6,740x g for 5 min using an eppendorf minispin (Hamburg,Germany) centrifuge before making measurements.
Zeta Potential Analysis
Zeta potential (ξ) measurements were performed at 25±0.1°C using a Malvern Zetasizer Nano Series (Worcester-shire, UK) and DTS1060 clear disposable folded capillarycell. The methodology was kept consistent as detailed in aprevious work.(11) The measured electrophoretic mobilitywas used to determine the ξ using Henry’s equation:
UE ¼ 2"x f1 kað Þ3h
ð1Þ
where UE is the electrophoretic mobility under the appliedvoltage, ε is the dielectric constant of the medium, η is theviscosity of the dispersant, ξ is the zeta potential in Voltsand f1(κa) is the Henry’s function. The f1(κa) is a function ofthe electrical double layer around the particle (13,14). At15 mM solution ionic strength, the f1(κa) value of 1.045 hasbeen used to calculate the ξ.
Viscosity/Rheological Analysis
For dilute solutions (40 mg/ml BSA) a similar methodologyas described by Tanford et al. was followed (2). The relativeflow times were measured using a Cannon-Manning Semi-micro Size-25 capillary viscometer (Cannon InstrumentCompany, State College, PA). All the measurements wereperformed using the same viscometer at 25±0.1°C. Aftereach measurement the viscometer was cleaned immediatelywith hot sulfuric acid-dichromate solution, rinsed numeroustimes to remove all traces of the acid, and dried withfiltered air. Flow times were recorded within 1/100th of asecond by means of electric timers. Four to five flow timemeasurements were made for each solution pH.
For high concentration solutions (250 mg/ml), thesample viscosities were measured using a VISCOlab 5000viscometer system (Cambridge Viscosity, Medford, MA). Adetailed procedure for measurement using VISCOlab 5000was described in a previous work (11). The dynamicviscosities were determined at 25±0.1°C by measuringthe average travel time of the pistons calibrated overviscosity ranges 0.5–10.0 cP, 2.5–50 cP and 5–100 cP. Allthe samples were analyzed in triplicate. Note that theVISCOlab 5000 is a constant stress viscometer. However,the shear rate applied can be calculated by taking intoaccount the applied stress, piston and annulus dimensions,the two way stroke and two way travel time of the piston(15,16). For the pistons employed for this study the shearrate ranged from 350 to 1,000 Hz. The BSA solutions,however, do not show a shear rate dependence up to aconcentration of 404 mg/ml and 4,700 Hz (17). Beforeeach measurement, the sample chamber was thoroughlycleaned with double-distilled water and dried with nitrogen.
The rheological properties of BSA were evaluated usingan ultrasonic shear rheometer with quartz crystals vibratingat a fundamental frequency of 10 MHz. The theory andexperimental procedure have been described previously(18). For non-Newtonian viscoelastic fluids, the solutionstorage (G′) and loss (G″) moduli and the complex viscosity(η*) can be related to the shift in electrical properties of thequartz crystal, i.e. series resistance (R2) and reactance (X2),by the following relationships (18):
G ¶ðwÞ ¼ R22 � X 2
2
A2rLiq:; ð2Þ
G ¶¶ðwÞ ¼ 2R2X2
A2rLiqð3Þ
h» ¼ ðG ¶Þ2 þ ðG ¶¶Þ2� �1=2
w= ¼ G» w= ð4Þ
High Concentration Bovine Serum Albumin Solutions 1975
where A is a crystal constant, ρliq is the liquid density, and ωis the quartz crystal frequency. In this study, 35-μL samplesof the BSA solution were analyzed in triplicate.
Dynamic Light Scattering
DLS studies were conducted at 25±0.1°C using a MalvernZetasizer Nano Series (Worcestershire, UK) as describedpreviously (11). After buffer exchange, the protein solutionswere filtered through 0.22 μm Millipore Millex-W syringefilters and centrifuged at 6,740 x g for 5 min using aneppendorf minispin (Hamburg, Germany) centrifuge. TheZetasizer Nano S utilizes a 632.8 nm Helium-Neon laserand analyzes scattered light at an angle of 173° using anavalanche photodiode. The DTS software was used toanalyze the acquired correlogram (correlation functionversus time) and obtain the mutual diffusion coefficient(Dm), which can be expressed as a function of solutionconcentration using the following equation (19):
Dm ¼ Dsð1þ kDcÞ ð5Þwhere Ds, is the self-diffusion coefficient (the value of Dm atinfinite dilution as c→0) (20), kD is the interaction parameter,and c is the concentration of the protein (g/ml). The value ofDs and kD can be obtained, respectively, from the interceptand slope of a plot of Dm vs. c (Eq. 5). A positive value of thekD corresponds to intermolecular repulsions, whereas anegative kD signifies attractive interactions between mole-cules. The hydrodynamic radius (Rh) of the molecules can beestimated from the Ds using the Stokes-Einstein equation,Ds=kBT/6πηRh, where, kB is the Boltzmann constant, T isthe temperature in Kelvin, η is the solvent viscosity, i.e. c→0.
Static Light Scattering
SLS studies were conducted at 25±0.1°C using a MalvernInstruments (Worcestershire, UK) Zetasizer Nano S. Sam-ple preparation steps were similar to that used for DLS.Samples were analyzed at 12 mg/ml and then sequentiallydiluted to lower concentrations. The average scatteredintensity was obtained using the attenuation-correctedderived count rates from the Malvern Zetasizer (21). TheDebye plots were then constructed from the averagescattered intensities using the following equation:
KC
Rq¼ 1
Mwþ 2B22c where the optical constant ð6Þ
K ¼ 2pnðdn=dcÞ½ �2 NAl4o
� ð7Þ
Mw is the weight average molecular weight of the solute, c isthe concentration in g/ml, λo is the wavelength of lightused, NA is Avogadro’s number and dn/dc is the refractive
index increment brought about by the solute under a givenset of solution conditions.
Note that theMalvern Zetasizer Nano Series (Worcestershire,UK) uses an Avalanche Photodiode detector (APD) forrecording the scattering intensity signal. Using the APD,both the SLS and DLS measurements can be per-formed simultaneously where the instrument measuresthe time-averaged scattered intensity for SLS and thetime-dependent fluctuation in scattered intensity forDLS, by means of photon counting and photoncorrelation, respectively. However, the instrument usesan attenuator for recording the time-dependent fluctu-ation in scattered intensity while performing the DLSmeasurements, whereas there is no attenuation of theexcess scattered intensity signal that reaches the detectorwhile performing SLS measurements. This results inAPD saturation in SLS measurements resulting inerroneous results. The correct average scattered inten-sity can, however, be determined from the attenuation-corrected count rates from the DLS measurements. Adetailed procedure for such a correction to obtaincorrect SLS parameters using a Malvern Zetasizer isdiscussed elsewhere (21).
RESULTS
The asterisk symbol in Fig. 1 (secondary y-axis) shows therelative viscosity of a 40 mg/ml BSA solution measuredusing a capillary viscometer following a similar procedureas described by Tanford et al. (2) in his original work. At40 mg/ml BSA at pH 5.0 showed a minimal viscositycompared to other pHs. The solid square and the trianglesare 40 and 30 mg/ml, respectively, for BSA solutionviscosities calculated from Tanford’s work (2) and do notrepresent measurements made in this work. Further detailson these calculations are elaborated in the Discussionsection. Although Tanford’s data already suggested aminimal viscosity around pH 5.0, the measurements wererepeated to ensure that the trend observed in viscositybehavior, due to electroviscous effects in dilute solution,holds in general and was not an artifact of a different gradeof BSA used previously in the study of Tanford et al. (2) Therelative magnitudes of viscosity observed in the two studiesare different and may be due to differences in purity of BSAobtained from different sources; however, the change inviscosity as a function of pH is consistent in the two studies.
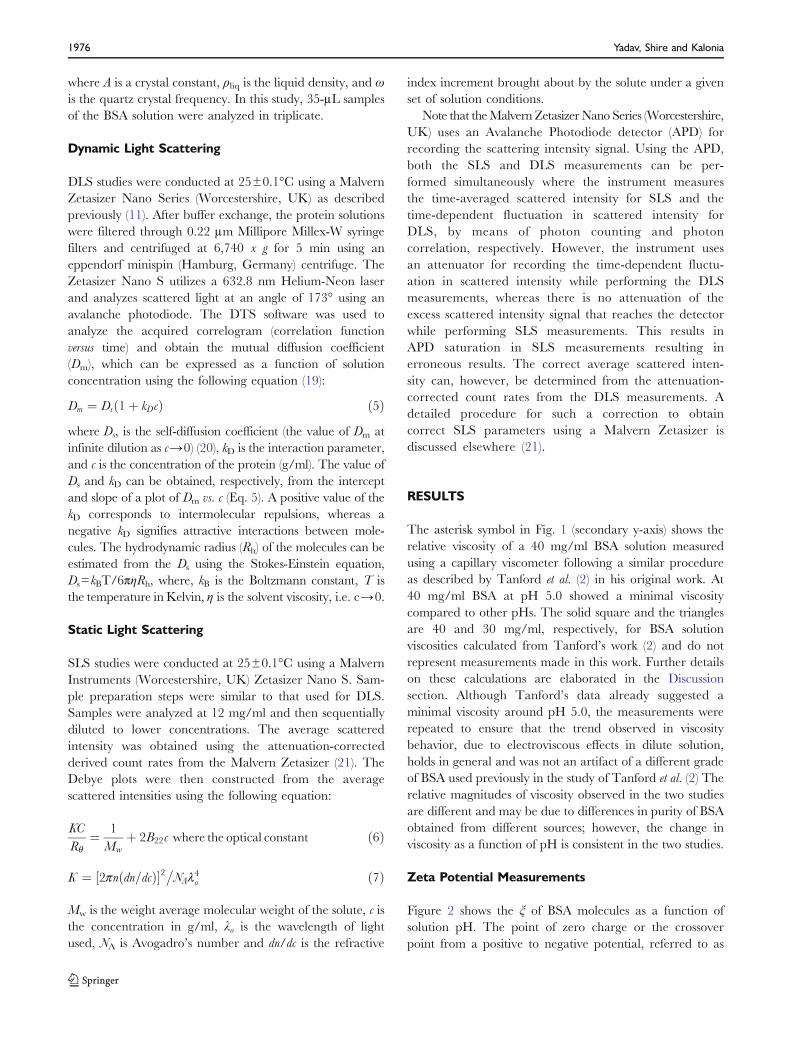
Zeta Potential Measurements
Figure 2 shows the ξ of BSA molecules as a function ofsolution pH. The point of zero charge or the crossoverpoint from a positive to negative potential, referred to as
1976 Yadav, Shire and Kalonia
the isoelectric point (pI), was observed to be~pH 4.95(using linear interpolation), which is in good agreementwith the reported values (22,23).
Since, the magnitudes of the observed ξ values are lessthan kT/e (i.e. 25.7 mV at 25°C), the net molecular charge,Z, can be obtained from a linear approximation of thePoisson-Boltzmann (PB) equation also known as the Debye-Huckel approximation (24):
z ¼ 4p"að1þ kaÞxe
ð8Þ
where e is the electronic charge, a is the particle radius andκ-1 is the Debye length (thickness of the double layer). Notethat the radius, a, in the Henry’s and PB equations isdifferent from the Stokes radius of the molecule. For thepresent charge calculations, the radius ‘a’ has beensubstituted by the hydrodynamic radius, ‘Rh’ calculatedfrom Ds using the Stokes-Einstein equation, which results inan increase in charge estimates and brings them in line withcalculated values (11,25). The ξ and Z estimated usingEq. 8 are compiled in Table I. At pH above and below pH
5.0, the BSA molecule carries a net positive or a negativecharge, respectively, whereas at the pI (~pH 4.95), the netmolecular charge is zero. The calculated net charge atdifferent pH was in good agreement with the reportedvalues of mean charge obtained from titration curves (23)(Supplementary Material Figure S1). The small variations aredue to the difference in conditions of solution pH and ionicstrength used in two studies (Supplementary Material Figure S1).
Low Shear Viscosity Measurements
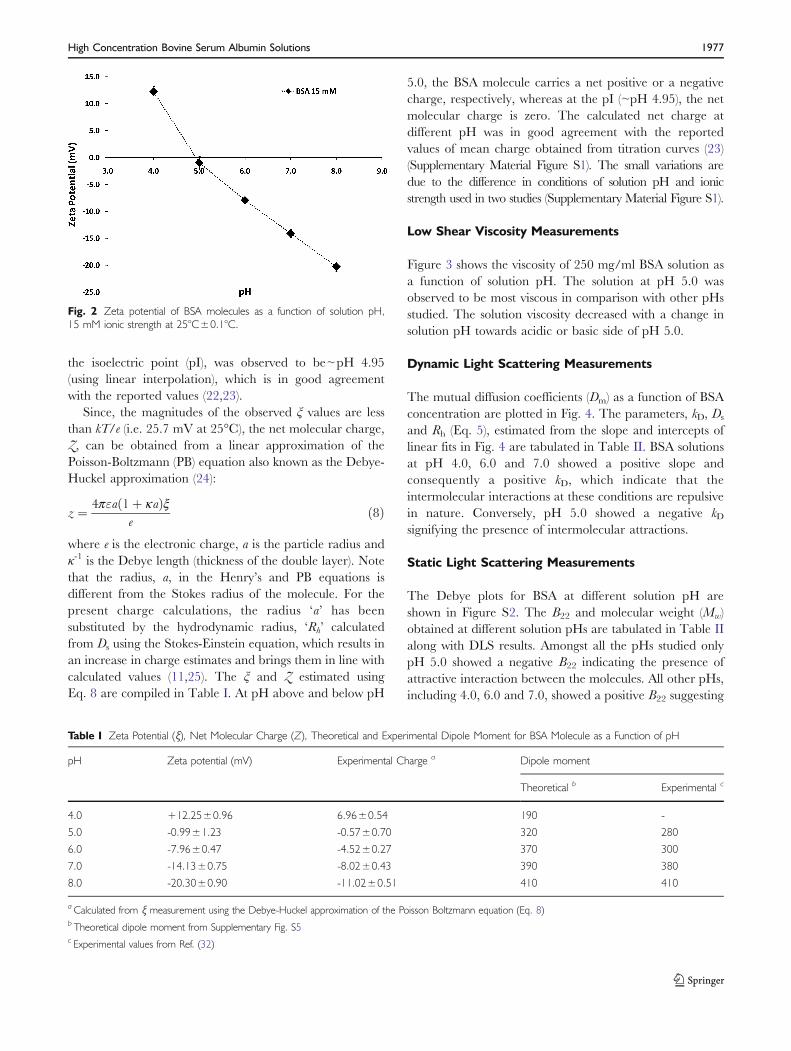
Figure 3 shows the viscosity of 250 mg/ml BSA solution asa function of solution pH. The solution at pH 5.0 wasobserved to be most viscous in comparison with other pHsstudied. The solution viscosity decreased with a change insolution pH towards acidic or basic side of pH 5.0.
Dynamic Light Scattering Measurements
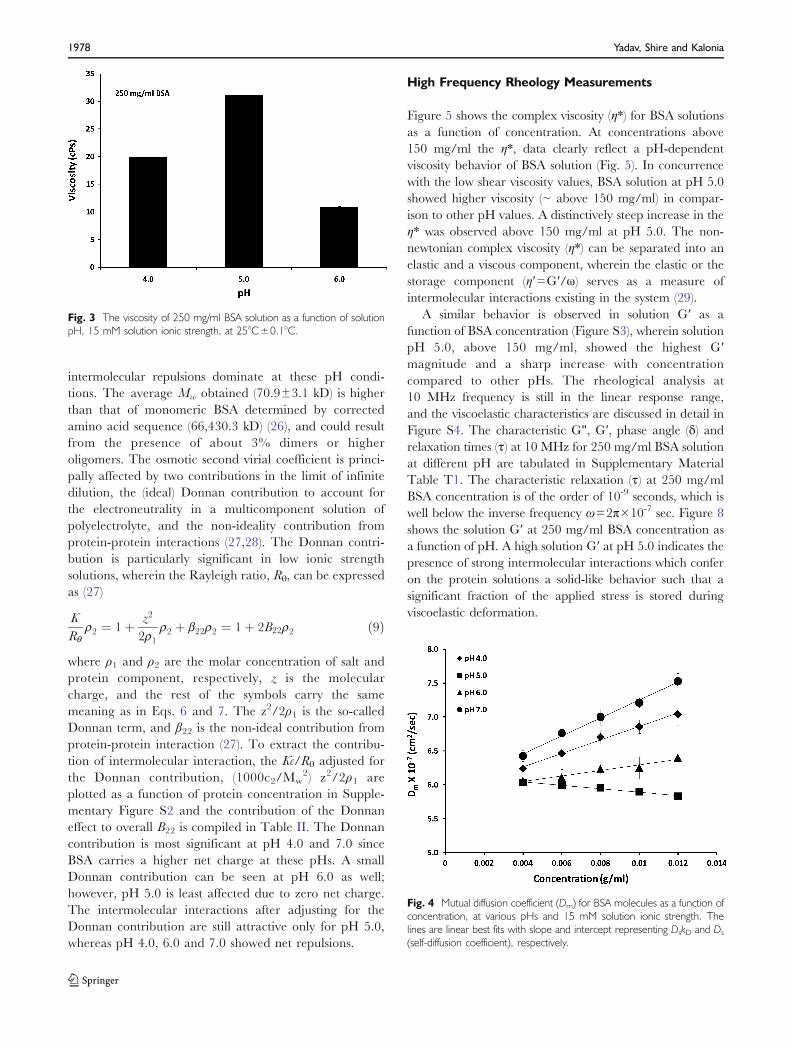
The mutual diffusion coefficients (Dm) as a function of BSAconcentration are plotted in Fig. 4. The parameters, kD, Ds
and Rh (Eq. 5), estimated from the slope and intercepts oflinear fits in Fig. 4 are tabulated in Table II. BSA solutionsat pH 4.0, 6.0 and 7.0 showed a positive slope andconsequently a positive kD, which indicate that theintermolecular interactions at these conditions are repulsivein nature. Conversely, pH 5.0 showed a negative kDsignifying the presence of intermolecular attractions.
Static Light Scattering Measurements
The Debye plots for BSA at different solution pH areshown in Figure S2. The B22 and molecular weight (Mw)obtained at different solution pHs are tabulated in Table IIalong with DLS results. Amongst all the pHs studied onlypH 5.0 showed a negative B22 indicating the presence ofattractive interaction between the molecules. All other pHs,including 4.0, 6.0 and 7.0, showed a positive B22 suggesting
Fig. 2 Zeta potential of BSA molecules as a function of solution pH,15 mM ionic strength at 25°C±0.1°C.
Table I Zeta Potential (ξ), Net Molecular Charge (Z), Theoretical and Experimental Dipole Moment for BSA Molecule as a Function of pH
pH Zeta potential (mV) Experimental Charge a Dipole moment
Theoretical b Experimental c
4.0 +12.25±0.96 6.96±0.54 190 -
5.0 -0.99±1.23 -0.57±0.70 320 280
6.0 -7.96±0.47 -4.52±0.27 370 300
7.0 -14.13±0.75 -8.02±0.43 390 380
8.0 -20.30±0.90 -11.02±0.51 410 410
aCalculated from ξ measurement using the Debye-Huckel approximation of the Poisson Boltzmann equation (Eq. 8)b Theoretical dipole moment from Supplementary Fig. S5c Experimental values from Ref. (32)
High Concentration Bovine Serum Albumin Solutions 1977
intermolecular repulsions dominate at these pH condi-tions. The average Mw obtained (70.9±3.1 kD) is higherthan that of monomeric BSA determined by correctedamino acid sequence (66,430.3 kD) (26), and could resultfrom the presence of about 3% dimers or higheroligomers. The osmotic second virial coefficient is princi-pally affected by two contributions in the limit of infinitedilution, the (ideal) Donnan contribution to account forthe electroneutrality in a multicomponent solution ofpolyelectrolyte, and the non-ideality contribution fromprotein-protein interactions (27,28). The Donnan contri-bution is particularly significant in low ionic strengthsolutions, wherein the Rayleigh ratio, Rθ, can be expressedas (27)
K
Rqr2 ¼ 1þ z2
2r1r2 þ b22r2 ¼ 1þ 2B22r2 ð9Þ
where ρ1 and ρ2 are the molar concentration of salt andprotein component, respectively, z is the molecularcharge, and the rest of the symbols carry the samemeaning as in Eqs. 6 and 7. The z2/2ρ1 is the so-calledDonnan term, and β22 is the non-ideal contribution fromprotein-protein interaction (27). To extract the contribu-tion of intermolecular interaction, the Kc/Rθ adjusted forthe Donnan contribution, (1000c2/Mw
2) z2/2ρ1 areplotted as a function of protein concentration in Supple-mentary Figure S2 and the contribution of the Donnaneffect to overall B22 is compiled in Table II. The Donnancontribution is most significant at pH 4.0 and 7.0 sinceBSA carries a higher net charge at these pHs. A smallDonnan contribution can be seen at pH 6.0 as well;however, pH 5.0 is least affected due to zero net charge.The intermolecular interactions after adjusting for theDonnan contribution are still attractive only for pH 5.0,whereas pH 4.0, 6.0 and 7.0 showed net repulsions.
High Frequency Rheology Measurements
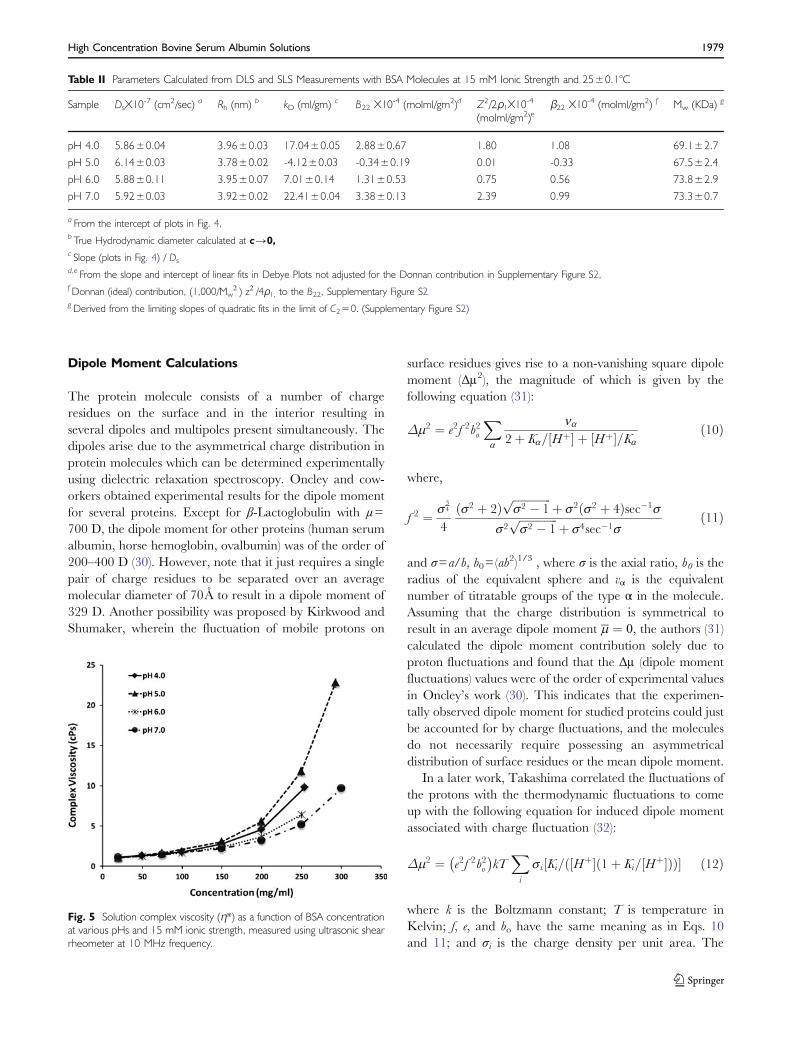
Figure 5 shows the complex viscosity (η*) for BSA solutionsas a function of concentration. At concentrations above150 mg/ml the η*, data clearly reflect a pH-dependentviscosity behavior of BSA solution (Fig. 5). In concurrencewith the low shear viscosity values, BSA solution at pH 5.0showed higher viscosity (~ above 150 mg/ml) in compar-ison to other pH values. A distinctively steep increase in theη* was observed above 150 mg/ml at pH 5.0. The non-newtonian complex viscosity (η*) can be separated into anelastic and a viscous component, wherein the elastic or thestorage component (η′=G′/ω) serves as a measure ofintermolecular interactions existing in the system (29).
A similar behavior is observed in solution G′ as afunction of BSA concentration (Figure S3), wherein solutionpH 5.0, above 150 mg/ml, showed the highest G′magnitude and a sharp increase with concentrationcompared to other pHs. The rheological analysis at10 MHz frequency is still in the linear response range,and the viscoelastic characteristics are discussed in detail inFigure S4. The characteristic G", G′, phase angle (δ) andrelaxation times (τ) at 10 MHz for 250 mg/ml BSA solutionat different pH are tabulated in Supplementary MaterialTable T1. The characteristic relaxation (τ) at 250 mg/mlBSA concentration is of the order of 10-9 seconds, which iswell below the inverse frequency ω=2π×10-7 sec. Figure 8shows the solution G′ at 250 mg/ml BSA concentration asa function of pH. A high solution G′ at pH 5.0 indicates thepresence of strong intermolecular interactions which conferon the protein solutions a solid-like behavior such that asignificant fraction of the applied stress is stored duringviscoelastic deformation.
Fig. 3 The viscosity of 250 mg/ml BSA solution as a function of solutionpH, 15 mM solution ionic strength, at 25°C±0.1°C.
Fig. 4 Mutual diffusion coefficient (Dm) for BSA molecules as a function ofconcentration, at various pHs and 15 mM solution ionic strength. Thelines are linear best fits with slope and intercept representing DskD and Ds
(self-diffusion coefficient), respectively.
1978 Yadav, Shire and Kalonia
Dipole Moment Calculations
The protein molecule consists of a number of chargeresidues on the surface and in the interior resulting inseveral dipoles and multipoles present simultaneously. Thedipoles arise due to the asymmetrical charge distribution inprotein molecules which can be determined experimentallyusing dielectric relaxation spectroscopy. Oncley and cow-orkers obtained experimental results for the dipole momentfor several proteins. Except for β-Lactoglobulin with μ=700 D, the dipole moment for other proteins (human serumalbumin, horse hemoglobin, ovalbumin) was of the order of200–400 D (30). However, note that it just requires a singlepair of charge residues to be separated over an averagemolecular diameter of 70Å to result in a dipole moment of329 D. Another possibility was proposed by Kirkwood andShumaker, wherein the fluctuation of mobile protons on
surface residues gives rise to a non-vanishing square dipolemoment (Δμ2), the magnitude of which is given by thefollowing equation (31):
Δm2 ¼ e2f 2b2o
Xa
na2þ Ka Hþ½ �= þ Hþ½ � Ka=
ð10Þ
where,
f 2 ¼ s34
4s2 þ 2ð Þ
ffiffiffiffiffiffiffiffiffiffiffiffiffiffis2 � 1
pþ s2 s2 þ 4ð Þsec�1s
s2ffiffiffiffiffiffiffiffiffiffiffiffiffiffis2 � 1
pþ s4sec�1s
ð11Þ
and σ=a/b, b0=(ab2)1/3 , where σ is the axial ratio, b0 is theradius of the equivalent sphere and να is the equivalentnumber of titratable groups of the type α in the molecule.Assuming that the charge distribution is symmetrical toresult in an average dipole moment m ¼ 0, the authors (31)calculated the dipole moment contribution solely due toproton fluctuations and found that the Δμ (dipole momentfluctuations) values were of the order of experimental valuesin Oncley’s work (30). This indicates that the experimen-tally observed dipole moment for studied proteins could justbe accounted for by charge fluctuations, and the moleculesdo not necessarily require possessing an asymmetricaldistribution of surface residues or the mean dipole moment.
In a later work, Takashima correlated the fluctuations ofthe protons with the thermodynamic fluctuations to comeup with the following equation for induced dipole momentassociated with charge fluctuation (32):
Δm2 ¼ e2f 2b2o� �
kTXi
s i Ki Hþ½ � 1þ Ki Hþ½ �=ð Þð Þ=½ � ð12Þ
where k is the Boltzmann constant; T is temperature inKelvin; f, e, and bo have the same meaning as in Eqs. 10and 11; and σi is the charge density per unit area. The
Table II Parameters Calculated from DLS and SLS Measurements with BSA Molecules at 15 mM Ionic Strength and 25±0.1°C
Sample DsX10-7 (cm2/sec) a Rh (nm) b kD (ml/gm) c B22 X10
-4 (molml/gm2)d Z2/2ρ1X10-4
(molml/gm2)eβ22 X10
-4 (molml/gm2) f Mw (KDa) g
pH 4.0 5.86±0.04 3.96±0.03 17.04±0.05 2.88±0.67 1.80 1.08 69.1±2.7
pH 5.0 6.14±0.03 3.78±0.02 -4.12±0.03 -0.34±0.19 0.01 -0.33 67.5±2.4
pH 6.0 5.88±0.11 3.95±0.07 7.01±0.14 1.31±0.53 0.75 0.56 73.8±2.9
pH 7.0 5.92±0.03 3.92±0.02 22.41±0.04 3.38±0.13 2.39 0.99 73.3±0.7
a From the intercept of plots in Fig. 4,b True Hydrodynamic diameter calculated at c→0,c Slope (plots in Fig. 4) / Dsd,e From the slope and intercept of linear fits in Debye Plots not adjusted for the Donnan contribution in Supplementary Figure S2,fDonnan (ideal) contribution, (1,000/Mw
2 ) z2 /4ρ1, to the B22, Supplementary Figure S2gDerived from the limiting slopes of quadratic fits in the limit of C2=0. (Supplementary Figure S2)
Fig. 5 Solution complex viscosity (η*) as a function of BSA concentrationat various pHs and 15 mM ionic strength, measured using ultrasonic shearrheometer at 10 MHz frequency.
High Concentration Bovine Serum Albumin Solutions 1979
theoretically calculated dipole moment using Eq. 12showed a good agreement with the experimentally mea-sured dipole moments for BSA and ovalbumin (32).
Supplementary Figure S5 shows the dipole moment forBSA as a function of pH, calculated using Eq. 12. In FigureS5, no new results are obtained, and the data only reproducethe dipole moment calculations performed by Takshimausing the updated BSA amino acid sequence reported byHirayama et al. (26). The theoretically calculated (Fig. S5) andexperimentally measured dipole moments (from Takashima’swork) (32) as a function of solution pH are tabulated alongwith the molecular charge data in Table I. The dipolemoment of BSA increased from ~190 Debye at pH 4.0 to~320 Debye at pH 5.0. However, over pH 6.0 to 8.0, themagnitude of the dipole showed a gradual increase from~370 Debye at pH 6.0 to 400 Debye at pH 8.0.
DISCUSSION
Tanford and Buzzel (2) in their original work tabulated thevalues of the extrapolated intrinsic viscosity, [η], and theslopes for reduced viscosity versus concentration plots forBSA solutions at various solution pHs and ionic strength.The concentration dependence of reduced viscosity (ηred) isoften expressed in terms of the relation (33):
hred ¼ hsp c= ¼ h½ � þ kH h½ �2c ð13Þ
where c is the concentration in g/ml, kH is the Hugginscoefficient, [η] is the intrinsic viscosity in ml/g, and ηsp is thespecific viscosity defined as hsp ¼ h� hoð Þ ho ¼ hrel � 1= ,where η and ηo are the solution and solvent viscosity,respectively. ηrel=η/ηo denotes the relative viscosity of asolution. A linear extrapolation of ηred versus c to zeroconcentration (c→0) yields [η] as the intercept and kH[η]
2 asthe slope. Given the values of intercept, [η], and slope,kH[η]
2, it is possible to calculate the relative viscosity, ηrel, orvice versa. Figure 1 shows the relative viscosity for BSAsolutions calculated using the [η] and slope values reportedat 10 mM solution ionic strength in Tanford’s work (2).Since the authors (2) reported that the isoionic pH of BSA inwater was 5.0, which increased to 5.6 at 500 mM chlorideconcentration, the pH at 10 mM chloride concentration wasassumed to be pH 5.1. The ηrel data of BSA under diluteconditions (30 and 40 mg/ml) clearly indicate that theviscosity is minimal near the pI (Fig. 1: η data at pH 4.8 orpH 5.1). This is further substantiated by the viscosity of40 mg/ml BSA solution measured in this work, whichconsistently showed a lower viscosity at solution pH 5.0. ξmeasurements showed that the net molecular charge isnearly zero (Table I) at this pH. As the BSA moleculeacquires a net positive (pH=4.3) or a net negative charge
(pH=7.3), the associated electroviscous effects led to anincrease in solution viscosity (Fig. 1).
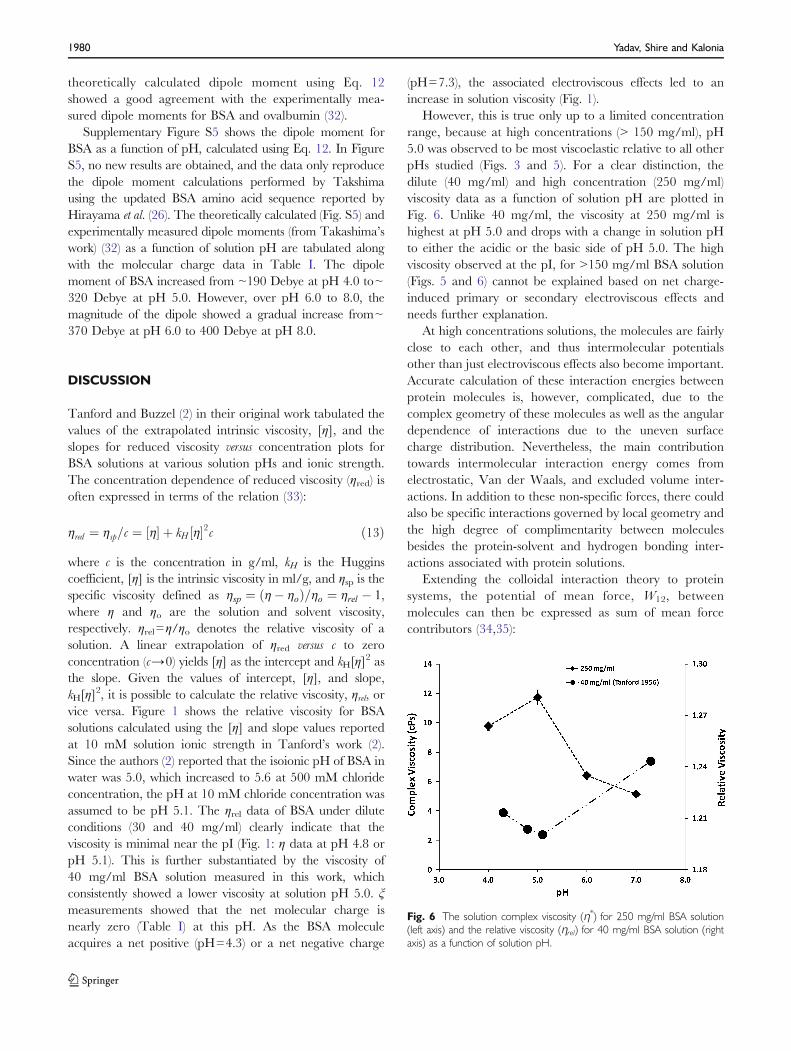
However, this is true only up to a limited concentrationrange, because at high concentrations (> 150 mg/ml), pH5.0 was observed to be most viscoelastic relative to all otherpHs studied (Figs. 3 and 5). For a clear distinction, thedilute (40 mg/ml) and high concentration (250 mg/ml)viscosity data as a function of solution pH are plotted inFig. 6. Unlike 40 mg/ml, the viscosity at 250 mg/ml ishighest at pH 5.0 and drops with a change in solution pHto either the acidic or the basic side of pH 5.0. The highviscosity observed at the pI, for >150 mg/ml BSA solution(Figs. 5 and 6) cannot be explained based on net charge-induced primary or secondary electroviscous effects andneeds further explanation.
At high concentrations solutions, the molecules are fairlyclose to each other, and thus intermolecular potentialsother than just electroviscous effects also become important.Accurate calculation of these interaction energies betweenprotein molecules is, however, complicated, due to thecomplex geometry of these molecules as well as the angulardependence of interactions due to the uneven surfacecharge distribution. Nevertheless, the main contributiontowards intermolecular interaction energy comes fromelectrostatic, Van der Waals, and excluded volume inter-actions. In addition to these non-specific forces, there couldalso be specific interactions governed by local geometry andthe high degree of complimentarity between moleculesbesides the protein-solvent and hydrogen bonding inter-actions associated with protein solutions.
Extending the colloidal interaction theory to proteinsystems, the potential of mean force, W12, betweenmolecules can then be expressed as sum of mean forcecontributors (34,35):
Fig. 6 The solution complex viscosity (η*) for 250 mg/ml BSA solution(left axis) and the relative viscosity (ηrel) for 40 mg/ml BSA solution (rightaxis) as a function of solution pH.
1980 Yadav, Shire and Kalonia
W12ðrÞ ¼ WHSðrÞ þWq�qðrÞ þWq�mðrÞ þWq�imðrÞþWm�mðrÞ þWm�imðrÞ þWdðrÞ
ð14Þ
where WHS is the excluded volume (hard sphere) contribu-tion, Wq-q is the charge-charge interaction, Wq-μ is thecharge-dipole interaction, Wμ-μ is dipole-dipole interaction,Wq-iμ is the charge-induced dipole interaction, Wμ-iμ isdipole-induced dipole interaction, and Wd is the dispersion/Van der Waals contribution to intermolecular interactionenergy. Only the first two terms in Eq. 14 constituterepulsive forces. All other terms represent attractivecontribution to the intermolecular energy, where charge-dipole and charge-induced dipole express much largerinfluence to intermolecular interactions as compared todipole-dipole and dipole-induced dipole interaction energy.The conventional measures of intermolecular interactions,such as second virial coefficient (B22) or interactionparameter (kD), essentially overlay the protein-solventinteractions and represent a measure of protein-proteininteraction over protein-solvent interactions.
The excluded volume, WHS (r), contribution depends onthe size and shape of the protein molecule. Hydrodynamicparameters such as intrinsic viscosity measurements cangive information about the effective molecular size. Theexcluded volume can then be approximated as 4 times thevolume of the molecule (36).
The charge-charge electrostatic repulsion, Wq-q(r), is theleading term when the molecules carry a high net chargeand is inversely related to the square of distance betweenmolecules (34,35,37). This contribution from charge-chargerepulsions would decrease with decrease in net molecularcharge and should become zero at the pI. Whereas at ornear the pI the contribution from electrostatic charge-dipole, dipole-dipole and long range Van der Waalsattractive interactions would increase over protein solventinteractions. The dipole moment contribution will be lowerat pH<3.0 and at pH>10.0 due to lack of negatively andpositively charged residues, respectively. The next impor-tant intermolecular force is the Van der Waals interactions(38). When dealing with macromolecules, it is often the casethat this interaction force is not significant unless theseparation distance is small as compared to the molecularradii. Thus, the Van der Waals attractions are present atboth short and long distance, but it might be too weak to besignificant over long distances (39). The force, however,may dominate electrostatic repulsion at separations of theorder of a few angstroms, where the molecules may orientto present geometrically complimentary surface (40). Theobserved viscosity behavior of BSA molecules, as well as theintermolecular interactions (B22 and kD) as a function ofsolution pH, can be explained based on the interplay ofthese forces.
The first contribution, as mentioned before, is theexcluded volume, WHS (r), arising due to the effectivemolecular volume and the solute volume fraction insolution. For concentrated non-interacting spherical par-ticles, where the primary contribution to solution viscosity isfrom the excluded volume, the viscosity behavior can beapproximated by the Ross and Minton equation (41):
h ¼ ho exp h½ �c 1� k
nh½ �c
� � �ð15Þ
where [η] is the intrinsic viscosity in ml/g, k denotes theself-crowding factor, c is the concentration in g/ml, and 3 isthe Simha shape parameter (42). Equation 15 takes intoaccount only the first-order interaction parameter, i.e.crowding effect (k) with an increase in solute concentration.Molecular crowding is essentially a consequence of theexcluded volume effect, i.e. the solution volume excluded/not available to a molecule, strictly because of stericreasons, due to the introduction/presence of anothermolecule in solution. The Ross and Minton equation(Eq. 15), therefore, enables one to assess the impact ofeffective molecular volume on solution viscosity.
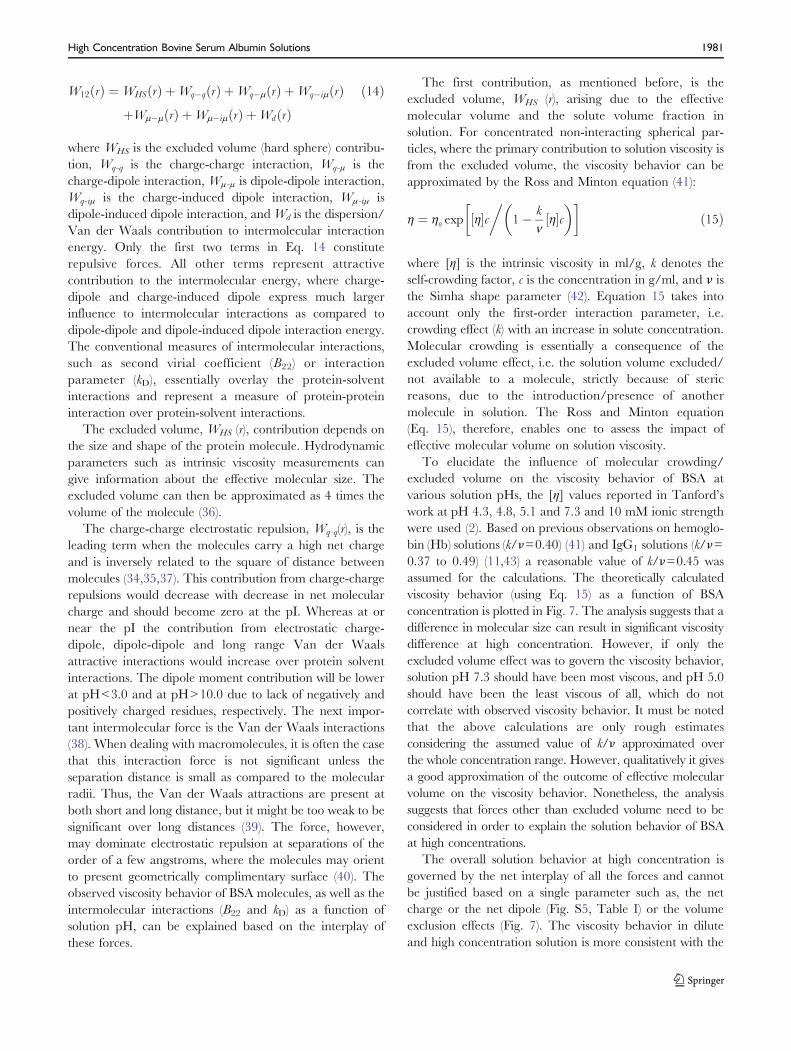
To elucidate the influence of molecular crowding/excluded volume on the viscosity behavior of BSA atvarious solution pHs, the [η] values reported in Tanford’swork at pH 4.3, 4.8, 5.1 and 7.3 and 10 mM ionic strengthwere used (2). Based on previous observations on hemoglo-bin (Hb) solutions (k/3=0.40) (41) and IgG1 solutions (k/3=0.37 to 0.49) (11,43) a reasonable value of k/3=0.45 wasassumed for the calculations. The theoretically calculatedviscosity behavior (using Eq. 15) as a function of BSAconcentration is plotted in Fig. 7. The analysis suggests that adifference in molecular size can result in significant viscositydifference at high concentration. However, if only theexcluded volume effect was to govern the viscosity behavior,solution pH 7.3 should have been most viscous, and pH 5.0should have been the least viscous of all, which do notcorrelate with observed viscosity behavior. It must be notedthat the above calculations are only rough estimatesconsidering the assumed value of k/3 approximated overthe whole concentration range. However, qualitatively it givesa good approximation of the outcome of effective molecularvolume on the viscosity behavior. Nonetheless, the analysissuggests that forces other than excluded volume need to beconsidered in order to explain the solution behavior of BSAat high concentrations.
The overall solution behavior at high concentration isgoverned by the net interplay of all the forces and cannotbe justified based on a single parameter such as, the netcharge or the net dipole (Fig. S5, Table I) or the volumeexclusion effects (Fig. 7). The viscosity behavior in diluteand high concentration solution is more consistent with the
High Concentration Bovine Serum Albumin Solutions 1981
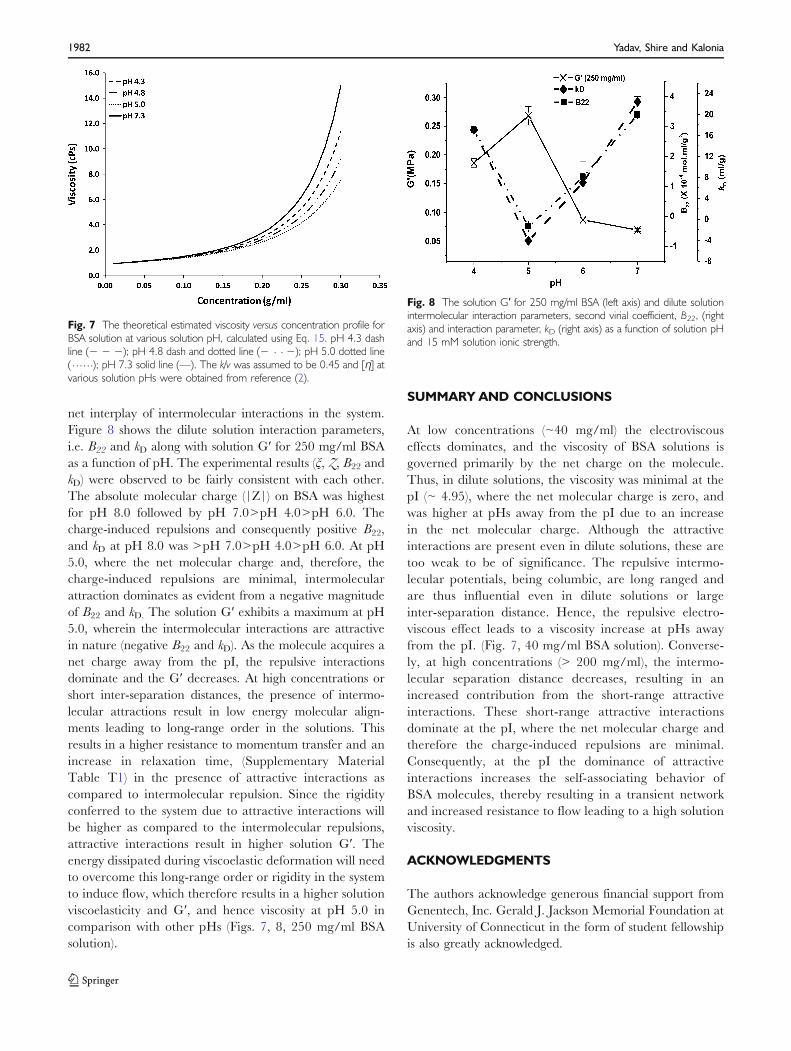
net interplay of intermolecular interactions in the system.Figure 8 shows the dilute solution interaction parameters,i.e. B22 and kD along with solution G′ for 250 mg/ml BSAas a function of pH. The experimental results (ξ, Z, B22 andkD) were observed to be fairly consistent with each other.The absolute molecular charge (|Z|) on BSA was highestfor pH 8.0 followed by pH 7.0>pH 4.0>pH 6.0. Thecharge-induced repulsions and consequently positive B22,and kD at pH 8.0 was >pH 7.0>pH 4.0>pH 6.0. At pH5.0, where the net molecular charge and, therefore, thecharge-induced repulsions are minimal, intermolecularattraction dominates as evident from a negative magnitudeof B22 and kD. The solution G′ exhibits a maximum at pH5.0, wherein the intermolecular interactions are attractivein nature (negative B22 and kD). As the molecule acquires anet charge away from the pI, the repulsive interactionsdominate and the G′ decreases. At high concentrations orshort inter-separation distances, the presence of intermo-lecular attractions result in low energy molecular align-ments leading to long-range order in the solutions. Thisresults in a higher resistance to momentum transfer and anincrease in relaxation time, (Supplementary MaterialTable T1) in the presence of attractive interactions ascompared to intermolecular repulsion. Since the rigidityconferred to the system due to attractive interactions willbe higher as compared to the intermolecular repulsions,attractive interactions result in higher solution G′. Theenergy dissipated during viscoelastic deformation will needto overcome this long-range order or rigidity in the systemto induce flow, which therefore results in a higher solutionviscoelasticity and G′, and hence viscosity at pH 5.0 incomparison with other pHs (Figs. 7, 8, 250 mg/ml BSAsolution).
SUMMARY AND CONCLUSIONS
At low concentrations (~40 mg/ml) the electroviscouseffects dominates, and the viscosity of BSA solutions isgoverned primarily by the net charge on the molecule.Thus, in dilute solutions, the viscosity was minimal at thepI (~ 4.95), where the net molecular charge is zero, andwas higher at pHs away from the pI due to an increasein the net molecular charge. Although the attractiveinteractions are present even in dilute solutions, these aretoo weak to be of significance. The repulsive intermo-lecular potentials, being columbic, are long ranged andare thus influential even in dilute solutions or largeinter-separation distance. Hence, the repulsive electro-viscous effect leads to a viscosity increase at pHs awayfrom the pI. (Fig. 7, 40 mg/ml BSA solution). Converse-ly, at high concentrations (> 200 mg/ml), the intermo-lecular separation distance decreases, resulting in anincreased contribution from the short-range attractiveinteractions. These short-range attractive interactionsdominate at the pI, where the net molecular charge andtherefore the charge-induced repulsions are minimal.Consequently, at the pI the dominance of attractiveinteractions increases the self-associating behavior ofBSA molecules, thereby resulting in a transient networkand increased resistance to flow leading to a high solutionviscosity.
ACKNOWLEDGMENTS
The authors acknowledge generous financial support fromGenentech, Inc. Gerald J. Jackson Memorial Foundation atUniversity of Connecticut in the form of student fellowshipis also greatly acknowledged.
Fig. 8 The solution G′ for 250 mg/ml BSA (left axis) and dilute solutionintermolecular interaction parameters, second virial coefficient, B22, (rightaxis) and interaction parameter, kD (right axis) as a function of solution pHand 15 mM solution ionic strength.
Fig. 7 The theoretical estimated viscosity versus concentration profile forBSA solution at various solution pH, calculated using Eq. 15. pH 4.3 dashline (− − −); pH 4.8 dash and dotted line (− ⋅ ⋅ −); pH 5.0 dotted line(⋅⋅⋅⋅⋅⋅); pH 7.3 solid line (—). The k/v was assumed to be 0.45 and [η] atvarious solution pHs were obtained from reference (2).
1982 Yadav, Shire and Kalonia
REFERENCES
1. Buzzell JG, Tanford C. The effect of charge and ionic strength onthe viscosity of ribonuclease. J Phys Chem. 1956;60:1204–7.
2. Tanford C, Buzzell JG. The viscosity of aqueous solutions ofbovine serum albumin between pH 4.3 and 10.5. J Phys Chem.1956;60:225–31.
3. Harding SE. Dilute solution viscometry of food biopolymers. In:Hill SE, Ledward DA, Mitchell JR, editors. Functional propertiesof food macromolecules. Gaithersburg: Aspen; 1998. p. 77–142.
4. Booth F. The electroviscous effect for suspensions of solidspherical particles. Proc Roy Soc (London). 1950;A203:533–51.
5. Bull HB. Electroviscous effect in egg albumin solutions. TransFaraday Soc. 1940;36:80–4.
6. Komatsubara M, Suzuki K, Nakajima H, Wada Y. Electro-viscous effect of lysozyme in aqueous solutions. Biopolymers.1973;12:1741–6.
7. Saluja A, Badkar AV, Zeng DL, Nema S, Kalonia DS.Application of high-frequency rheology measurements for analyz-ing protein-protein interactions in high protein concentrationsolutions using a model monoclonal antibody (IgG2). J Pharm Sci.2006;95:1967–83.
8. Liu J, Nguyen MDH, Andya JD, Shire SJ. Reversible self-association increases the viscosity of a concentrated monoclonalantibody in aqueous solution. J Pharm Sci. 2005;94:1928–40.
9. Yadav S, Liu J, Shire SJ, Kalonia DS. Specific interactions in highconcentration antibody solutions resulting in high viscosity. JPharm Sci. 2010;99:1152–68.
10. Salinas BA, Sathish HA, Bishop SM, Harn N, Carpenter JF,Randolph TW. Understanding and modulating opalescence andviscosity in a monoclonal antibody formulation. J Pharm Sci.2009;99:82–93.
11. Yadav S, Shire SJ, Kalonia DS. Factors affecting the viscosity inhigh concentration solutions of different monoclonal antibodies. JPharm Sci. 2010;99:4812–29.
12. Fasman GD. CRC practical handbook of biochemistry andmolecular biology: proteins. Boca Raton, FL: CRC; 1976.
13. Hunter RJ. The calculation of zeta potential. In: Ottewilland RH,Rowell RL, editors. Zeta potential in colloid science principles andapplications. New York: Academic; 1981. p. 59–124.
14. Delgado AV, Gonzalez-Caballero F, Hunter RJ, Koopal LK,Lyklema J. Measurement and interpretation of electrokineticphenomena. J Colloid Interface Sci. 2007;309:194–224.
15. High Speed, Small Sample Rheometric Screening using CambridgeViscometer. http://www.cambridgeviscosity.com/articles/RheometricFluidScreeningTechnique.pdf.
16. Estimating Shear Rate in CVI Viscometer. Technical Note: 03-002b.
17. Application Note: Viscosity measurement of a model protein solutionof BSA. http://www.rheosense.com/images/ApplicationsArticles/APP-04_Viscosity-of-BSA-in-PBS.pdf.
18. A. Saluja and D.S. Kalonia. Measurement of fluid viscosity atmicroliter volumes using quartz impedance analysis. AAPSPharmSciTech. 5:Article 47 (2004).
19. Brown W, Nicolai T. Dynamic light scattering: the method andsome applications. New York: Oxford University Press; 1993.
20. Veldkamp WB, Votano JR. Effects of intermolecular interac-tion on protein diffusion in solution. J Phys Chem.1976;80:2794–801.
21. S. Yadav, T. Scherer, M., S.J. Shire, and D.S. Kalonia. Use ofDynamic Light Scattering to determine Second Virial Coefficientin Semi-dilute Concentration Regime. Anal Biochem:doi:10.1016/j.ab.2010.1012.1014 (2010).
22. Carterand DC, Ho JX. Structure of serum albumin. Adv ProteinChem. 1994;45:153–203.
23. Tanford C, Swanson SA, Shore WS. Hydrogen-ion equilibria ofbovine serum albumin. J Am Chem Soc. 1955;77:6414–21.
24. Hunter RJ. Charge and potential distribution at interface. In:Ottewilland RH, Rowell RL, editors. Zeta potential in colloid scienceprinciples and application. New York: Academic; 1981. p. 11–58.
25. Durant JA, Chen C, Laue TM, Moody TP, Allison SA. Use of T4lysozyme charge mutants to examine electrophoretic models.Biophys Chem. 2002;101–102:593–609.
26. Hirayama K, Akashi S, Furuya M, Fukuhara K. Rapidconfirmation and revision of the primary structure of bovineserum albumin by ESIMS and Frit-FAB LC/MS. BiochemBiophys Res Commun. 1990;173:639–46.
27. Asthagiri D, Paliwal A, Abras D, Lenhoff AM, Paulaitis ME. Aconsistent experimental and modeling approach to light-scatteringstudies of protein-protein interactions in solution. Biophys J.2005;88:3300–9.
28. Paliwal A, Asthagiri D, Abras D, Lenhoff AM, Paulaitis ME.Light-scattering studies of protein solutions: Role of hydration inweak protein-protein interactions. Biophys J. 2005;89:1564–73.
29. Saluja A, Badkar AV, Zeng DL, Nema S, Kalonia DS. Ultrasonicstorage modulus as a novel parameter for analyzing protein-protein interactions in high protein concentration solutions:correlation with static and dynamic light scattering measurements.Biophys J. 2007;92:234–44.
30. Cohn EJ, Edsall JT. The Electric Moments and the RelaxationTimes of Proteins as Measured from their Influence upon theDielectric Constants of Solutions. In: Cohnand EJ, Edsall JT,editors. Proteins, amino acids and peptides as ions and dipolarions. New York: Reinhold; 1943. p. 543–68.
31. Kirkwood JG, Shumaker JB. The influence of dipole momentfluctuations on the dielectric increment of proteins in solution.Proc Natl Acad Sci. 1952;38:855–62.
32. Takashima S. Proton fluctuation in protein. Experimental study ofthe Kirkwood-Shumaker theory. J Phys Chem. 1965;69:2281–6.
33. Huggins ML. The viscosity of dilute solutions of long-chainmolecules. IV. Dependence on concentration. J Am Chem Soc.1942;64:2716–8.
34. Haynes CA, Tamura K, Korfer HR, Blanch HW, Prausnitz JM.Thermodynamic properties of aqueous.alpha.-chymotrypsin solu-tion from membrane osmometry measurements. J Phys Chem.1992;96:905–12.
35. Vilker VL, Colton CK, Smith KA. The osmotic pressure ofconcentrated protein solutions: effect of concentration and ph insaline solutions of bovine serum albumin. J Colloid Interface Sci.1981;79:548–66.
36. Hiemenz and P. C. Polymer Chemistry: The Basic Concepts,CRC Press, 1984.
37. Coen CJ, Newman J, Blanch HW, Prausnitz JM. Electrostaticprotein-protein interactions: comparison of point-dipole andfinite-length dipole potentials of mean force. J Colloid InterfaceSci. 1996;177:276–9.
38. Jacob I. Intermolecular and surface forces. San Diego: Academic;1992.
39. R.J. Hunter. Zeta Potential in Colloid Science Principles andApplication, Academic Press Inc. New York 10003, 1981.
40. Roth CM, Neal BL, Lenhoff AM. Van der Waals interactionsinvolving proteins. Biophys J. 1996;70:977–87.
41. Ross PD, Minton AP. Hard quasispherical model for the viscosityof hemoglobin solutions. Biochem Biophys Res Commun.1977;76:971–6.
42. Mehl JW, Oncley JL, Simha R. Viscosity and the shape of proteinmolecules. Science. 1940;92:132–3.
43. Kanai S, Liu J, Patapoff TW, Shire SJ. Reversible self-associationof a concentrated monoclonal antibody solution mediated by Fab-Fab interaction that impacts solution viscosity. J Pharm Sci.2008;97:4219–27.
High Concentration Bovine Serum Albumin Solutions 1983
Related Documents