VISCERAL FAT AND WEIGHT LOSS IN OBESE SUBJECTS -relationship to serum lipids, energy expenditure and sex hormones- U°f z(

Welcome message from author
This document is posted to help you gain knowledge. Please leave a comment to let me know what you think about it! Share it to your friends and learn new things together.
Transcript
VISCERAL FAT AND WEIGHT LOSS IN OBESE SUBJECTS
-relationship to serum lipids, energy expenditure and sex hormones-
U°f z(
Promotor : Dr. J.G.A.J. Hautvast, Hoogleraar in de leer van de voeding en de voedselbereiding
Co-promotoren : Dr. P. Deurenberg, Universitair hoofddocent bij de vakgroep humane voeding
Dr. ir. J.C. Seidell, Hoofd van centrum voor chronische ziekten en milieu epidemiologic van het rijksinstituut voor volksgezondheid en milieuhygiene
fJ/J08cO ' , lb lb.
VISCERAL FAT AND WEIGHT LOSS IN OBESE SUBJECTS
-relationship to serum lipids, energy expenditure and sex hormones-
Rianne Leenen
Proefschrift ter verkrijging van de graad van
doctor in de landbouw- en milieuwetenschappen op gezag van de rector magnificus,
dr. H.C. van der Plas, in het openbaar te verdedigen
op woensdag 28 april 1993 des namiddags te 14.45 uur in de Aula
van de Landbouwuniversiteit te Wageningen.
l l 579 T) t
BrBLiO I HtTKr tANDBOUWUNIVERSUEEl
3VAGENLNGEM
CIP-GEGEVENS RONINKLIJKE BIBLIOTHEEK, DEN HAAG
Leenen, Rianne
Visceral fat and wight loss in obese subjects: relationship to serum lipids, energy expenditure and sex hormones/ Rianne Leenen. -[S.l.rs.n.] Proefschrift Wageningen. -Met samenvatting in het Nederlands. ISBN 90-5485-085-X Trefw.: vetten/ vermageren.
Lay-out : Michael de Bont
Cover Design : Ernst van Cleef Printing : Grafisch Service Centrum, LUW
This study was supported by a research grant from the Netherlands Heart Foundation (No. 87.067), by Wander AG/Sandoz Nutrition Ltd. (Bern, Switzerland) and by the Wageningen Agricultural University.
Financial support by the Netherlands Heart Foundation and the Wageningen Agricultural University for the publication of this thesis is gratefully acknowledged.

Aon mijn ouders
VISCERAL FAT AND WEIGHT LOSS IN OBESE SUBJECTS
-relationship to serum lipids, energy expenditure and sex hormones-
L7u,
^ l O O ? ? © ' sl^>*
STELLINGEN
1. Ook met betrekking tot de Iichaamsvetverdeling van dikke vrouwen kan men appels (abdominale vetverdeling) niet met peren (gluteaal-femorale vetverdeling) vergelijken. Dit proefschrift
2. De aanzienlijke bijdrage van bet gewichtsverlies aan de verbetering van het serum-lipidenprofiel van dikke mensen bij een energiebeperkt dieet benadrukt het belang van afslanken. Dit proefschrift
3. Dikke mensen met een overmaat aan visceraal vet (abdominale vetverdeling) vallen niet makkelijker af dan dikke mensen met weinig visceraal vet (gluteaal-femorale vetverdeling).
-Dit proefschrift
4. De vetverdeling over het lichaam verandert door gewichtsverlies. O.a. dit proefschrift
5. Peervormige vrouwen zijn vruchtbaarder dan appelvormige vrouwen. Zaadstra BM, et at Fat and female fecundity: prospective study of effect of body fat distribution on conception rates. Br Med J 1993;306:484-487
6. Het meeste baat bij het gebruik van 'afslank'-produkten heeft niet de consument maar de producent
7. Eenvoud siert niet alleen de mens, maar ook het wetenschappelijk onderzoek.
8. Het in Pakistan bestaande 'purdah'-systeem, dat ervoor zorgt dat vrouwen letterlijk en figuurlijk slecht te bereiken zijn, bemoeilijkt het geven van voedings-voorlichting.
9. "Studies with a statistically significant result for the main outcome of interest are more likely to be submitted for publication and more likely to be published than studies with null results. Therefore, conclusions based only on a review of published data should be interpreted cautiously." Easterbrook PJ, et aL Publication bias in clinical research. Lancet 1991;337:867-872
10. "Het is niet belangrijk wat men van ons maakt, maar wat wij zelf maken van wat men van ons gemaakt heeft." ("L'important n'est pas ce qu'on fait de nous, mais ce que nous faisons nous-meme de ce qu'on a fait de nous.") Sartre J-P. Saint Genet, comidien et martyr, 1952
11. Het feit dat geld voor ontwikkelingssamenwerking niet altijd op de juiste plaats terecht komt, impliceert niet dat de kraan voor ontwikkelingssamenwerking dicht gedraaid moet worden.
12. Links rijden en rechts voorrang verlenen is veiliger dan rechts rijden en rechts voorrang verlenen.
13. "Over 100 jaar zijn jullie allemaal dood en wij ook!" Klein Orkest (Jekkers H & Smit L)
Stellingen behorend bij het proefschrift Visceral fat and weight loss in obese subjects -relationship to serum lipids, energy expenditure and sex hormones-' van Rianne Leenen. Wageningen, 28 april 1993.
CONTENTS
Abstract
Chapter 1
Chapter 2
Chapter 3
Chapter 4
Chapter 5
Chapter 6
Introduction
Visceral fat accumulation measured by magnetic resonance imaging in relation to serum lipids in obese men and women (Atherosclerosis 1992;94:171-181)
Visceral fat accumulation in obese subjects: relation to energy expenditure and response to weight loss (American Journal of Physiology: Endocrinology & Metabolism 1992;263(26):E913-E919)
Visceral fat loss measured by magnetic resonance imaging in relation to changes in serum lipid levels of obese men and women (Arteriosclerosis and Thrombosis 1993;13:487-494)
Relative effects of weight loss and dietary fat modification on serum lipid levels in the dietary treatment of obesity (Submitted for publication)
Visceral fat accumulation in relation to sex hormones in obese men and women undergoing weight loss therapy (Submitted for publication)
Chapter 7 General discussion
Appendix Nutrient composition of the diets given in the study
list of abbreviations
Summary
Samenvatting
Dankwoord/ Acknowledgements
Curriculum vitae
9
11
21
35
51
67
81
97
109
111
113
115
119
123
VISCERAL FAT AND WEIGHT LOSS IN OBESE SUBJECTS -relationship to serum lipids, energy expenditure and sex hormones-
PhD Thesis, Department of Human Nutrition, Wageningen Agricultural University, The Netherlands, 28 April 1993. Rianne Leenen
ABSTRACT
This thesis describes the relationships between visceral fat accumulation and serum lipids, energy expenditure, and sex hormone levels in healthy obese men and premenopausal women undergoing weight loss therapy. The subjects, aged 27-51 years, with an initial body mass index of 28-38 kg/m2, received a controlled diet for 13 weeks providing a 4.2 MJ/day energy deficit. Magnetic resonance imaging was used to quantify fat depots.
In women but not in men, visceral fat accumulation was associated with a less favourable serum lipid profile independent of age and body fat percentage. In addition, in women only, visceral fat predominance was positively related to resting metabolic rate (RMR) and diet-induced thermogenesis (DIT) as well as to a relatively increased androgenicity. In obese men, no relationship could be found between visceral fat accumulation and any of the sex hormone levels.
The mean weight reduction of 12.2 ± 3.5 (SD) kg due to the energy-deficit diet, resulted in larger reductions in serum levels of total cholesterol, LDL cholesterol, and triglycerides and a larger increase in the HDL cholesterol/LDL cholesterol ratio in men compared with women. Men with an initially larger visceral fat depot than women did not lose more body weight, but they lost more visceral fat than women. Comparison of these average changes between both sexes suggests a potential role of visceral fat loss in improving the serum lipid profile. While in women, a loss of visceral fat was related to an increased HDL cholesterol, a more general beneficial effect of visceral fat loss was not seen using correlation analyses within each sex. In women but not in men, visceral fat accumulation before weight loss was associated with improvement of HDL cholesterol and triglyceride levels after weight loss. In women only, a reduction in the visceral fat depot also seems to be accompanied by a relative reduction in androgenicity regardless of total body fat loss.
In this study, the effect of weight loss alone on serum lipids could be separated from the effect of dietary fat modification usually accompanying a dietary weight loss treatment. The favourable effect of weight loss per se seems to be considerable in optimizing the serum lipid profile of obese subjects and even greater than that of dietary fat modification.
It is concluded that there may be gender differences in the associations between visceral fat accumulation and serum lipids, energy expenditure (RMR and DIT), and sex hormone levels in healthy moderately obese subjects. In addition, particularly healthy moderately obese women with a visceral fat predominance benefit from a dietary weight loss treatment with respect to their serum lipid profile and sex hormone levels. In healthy moderately obese men, the critical role of the visceral fat depot could not be confirmed.
CHAPTER 1
INTRODUCTION
Human obesity, which is generally defined as an excessive storage of body fat, is a major public health problem in affluent societies. Estimates of its prevalence range from 10-50% or more in the adult population, depending entirely upon the criteria used to define obesity (1-3). It is well known that obesity is associated with a large number of metabolic complications, including coronary heart disease (CHD), cerebrovascular disease, non-insulin-dependent diabetes mellitus (NIDDM), gallbladder disease, hormone-dependent neoplasms such as carcinoma of endometrium, as well as other diseases such as gout and diseases of joints (4,5). Obese subjects are usually advised to lose body weight by means of energy intake restriction in order to reduce the increased health risks associated with obesity.
However, several studies have suggested that not just the amount of excessive fat deposited in the body, but its localisation may be responsible for some of the known health hazards of obesity (6). In particular, the adipose tissue stored in the abdominal cavity i.e. the visceral fat depot, seems to play a crucial role (7-9). Enlargement of the main peripheral fat depots, the subcutaneous femoral and gluteal fat depots, typically observed in women, has been found to increase the risk for varicose veins (10) and may be a source of concern because of aesthetic reasons (11), and might, therefore, constitute a relatively minor medical risk. There is now increasing support to recommend weight loss treatment primarily for those obese individuals with abdominal fat predominance (12,13). However, clear and consistent evidence for this recommendation is still scarce. The purpose of the research described in this thesis was, therefore, to study the relationships between visceral fat accumulation and serum lipids, energy expenditure, and sex hormones in healthy obese men and premenopausal women undergoing weight loss therapy. In contrast to most other studies, both men and women were involved.
This introduction briefly describes the associations between body fat distribution and the three mentioned aspects. An outline of this thesis and a short description of the study design are given at the end of this chapter.
Body fat distribution Jean Vague (14) was the first to postulate that the pattern of body fat distribution in humans, classified by the brachio-femoral adipo-muscular ratio, had metabolic significance. An increased localisation of body fat in the upper body is seen more frequently in men than in women and has been denoted android, centralised, abdominal
11
Chapter 1
or visceral obesity in the literature, depending on the different indices used for classification. Lower body obesity is regarded as characteristic in women and the following nomenclature has been used for this type of obesity: gynoid, peripheral or gluteal-femoral obesity. Both types of fat distribution do, however, occur in men as well as in women.
Various anthropometric indexes like skinfold thicknesses and body circumference measurements, have been used to assess body fat distribution (4). The most commonly anthropometric measurement used to describe body fat distribution has been the ratio of waist/hip circumference, which is a relatively simple indicator of fat distribution, and therefore, particularly useful for epidemiological studies. Although by using anthropometry for the classification of body fat topography, one can distinguish between upper and lower body fat predominance, one can not differentiate between the various fat depots (15,16).
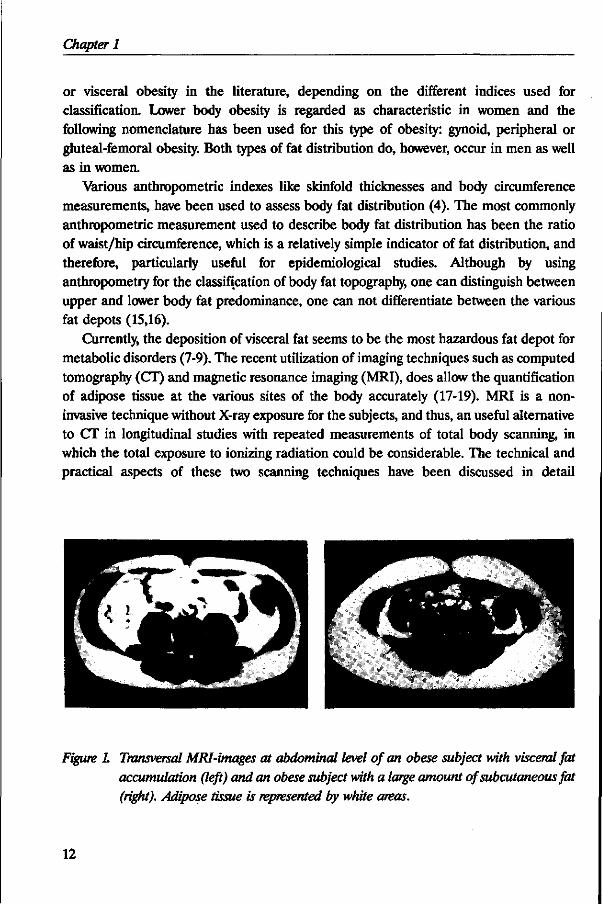
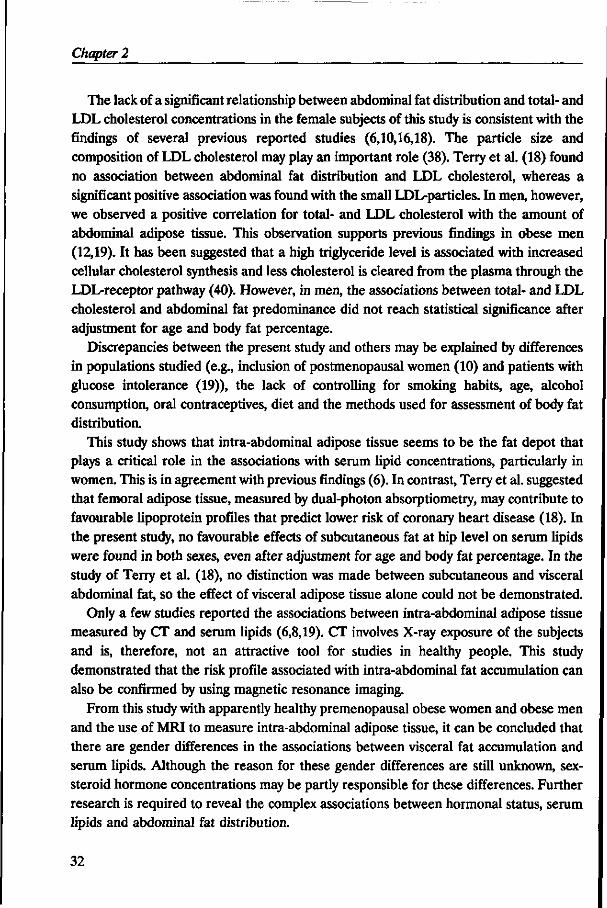
Currently, the deposition of visceral fat seems to be the most hazardous fat depot for metabolic disorders (7-9). The recent utilization of imaging techniques such as computed tomography (CT) and magnetic resonance imaging (MRI), does allow the quantification of adipose tissue at the various sites of the body accurately (17-19). MRI is a noninvasive technique without X-ray exposure for the subjects, and thus, an useful alternative to CT in longitudinal studies with repeated measurements of total body scanning, in which the total exposure to ionizing radiation could be considerable. The technical and practical aspects of these two scanning techniques have been discussed in detail
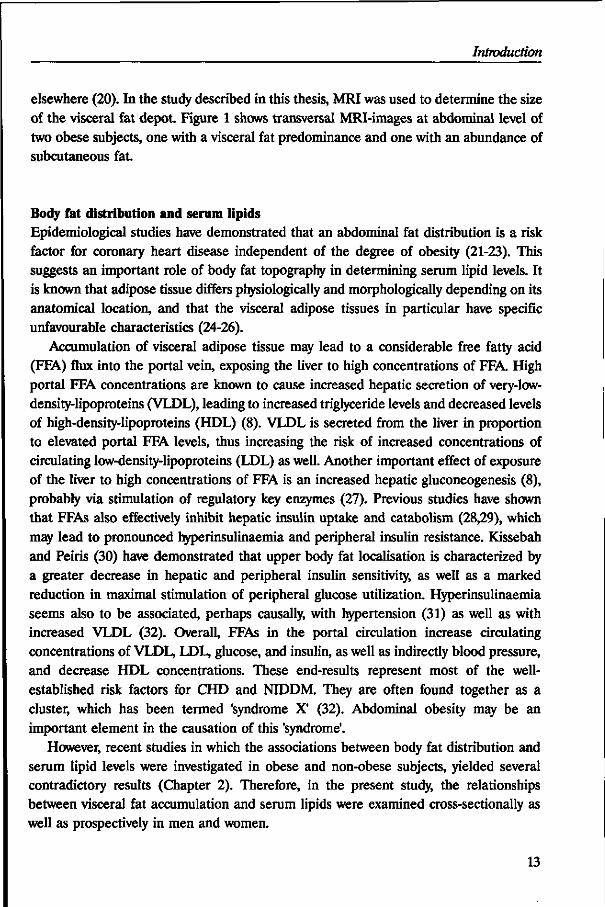
Figure 1. Transversal MRI-images at abdominal level of an obese subject with visceral fat accumulation (left) and an obese subject with a large amount of subcutaneous fat (right). Adipose tissue is represented by white areas.
12
Introduction
elsewhere (20). In the study described in this thesis, MRI was used to determine the size of the visceral fat depot. Figure 1 shows transversal MRI-images at abdominal level of two obese subjects, one with a visceral fat predominance and one with an abundance of subcutaneous fat.
Body fat distribution and serum lipids Epidemiological studies have demonstrated that an abdominal fat distribution is a risk factor for coronary heart disease independent of the degree of obesity (21-23). This suggests an important role of body fat topography in determining serum lipid levels. It is known that adipose tissue differs physiologically and morphologically depending on its anatomical location, and that the visceral adipose tissues in particular have specific unfavourable characteristics (24-26).
Accumulation of visceral adipose tissue may lead to a considerable free fatty acid (FFA) flux into the portal vein, exposing the liver to high concentrations of FFA. High portal FFA concentrations are known to cause increased hepatic secretion of very-low-density-lipoproteins (VLDL), leading to increased triglyceride levels and decreased levels of high-density-lipoproteins (HDL) (8). VLDL is secreted from the liver in proportion to elevated portal FFA levels, thus increasing the risk of increased concentrations of circulating low-density-lipoproteins (LDL) as well. Another important effect of exposure of the liver to high concentrations of FFA is an increased hepatic gluconeogenesis (8), probably via stimulation of regulatory key enzymes (27). Previous studies have shown that FFAs also effectively inhibit hepatic insulin uptake and catabolism (28,29), which may lead to pronounced hyperinsulinaemia and peripheral insulin resistance. Kissebah and Peiris (30) have demonstrated that upper body fat localisation is characterized by a greater decrease in hepatic and peripheral insulin sensitivity, as well as a marked reduction in maximal stimulation of peripheral glucose utilization. Hyperinsulinaemia seems also to be associated, perhaps causally, with hypertension (31) as well as with increased VLDL (32). Overall, FFAs in the portal circulation increase circulating concentrations of VLDL, LDL, glucose, and insulin, as well as indirectly blood pressure, and decrease HDL concentrations. These end-results represent most of the well-established risk factors for CHD and NIDDM. They are often found together as a cluster, which has been termed 'syndrome X' (32). Abdominal obesity may be an important element in the causation of this 'syndrome'.
However, recent studies in which the associations between body fat distribution and serum lipid levels were investigated in obese and non-obese subjects, yielded several contradictory results (Chapter 2). Therefore, in the present study, the relationships between visceral fat accumulation and serum lipids were examined cross-sectionally as well as prospectively in men and women.
13
Chapter 1
Body fat distribution and energy expenditure The common therapeutic approach to reduce the obesity-related risks is to reduce body weight. Several studies have previously evaluated the ability to lose body weight in relation to regional fat distribution, but the results of these studies were conflicting (33-39). Some studies have suggested that obese women with an abdominal type of fat distribution may lose body weight and fat easier than those with a gluteal-femoral fat distribution (33-35). Other investigators did not observe associations between the type of body fat distribution and the extent of weight reduction (36-39).
It has previously been proposed that an excessive accumulation of visceral fat increases energy expenditure due to its greater metabolic activity and above all, of its especially high lipolytic activity. However, several studies could not confirm the existence of a link between body fat distribution and energy expenditure (39-42). This thesis focused, in particular, on two components of total energy expenditure: resting metabolic rate (RMR) and diet-induced thermogenesis (DIT). These elements together account for 70-85 percent of total energy expenditure in the average sedentary adult individual. Detailed description of both components as well as the methodological aspects of these measurements are reported elsewhere (43).
Body fat distribution and sex hormones In view of the clear different patterns of fat deposition in men and women (14,44), it seems reasonable to postulate that upper body obesity is associated with 'masculinity' (male sex hormones) and lower body obesity with 'femininity' (female sex hormones). Thus, obese women having an upper body fat distribution may have hyperandrogenism, or higher production rates and/or blood levels of androgens, whereas lower body obesity in men may be associated with relatively increased oestrogen levels. Indeed, obese women exhibiting overt signs of hyperandrogenism such as hirsutism and poly cystic ovary syndrome, are found to have a typical male upper body fat distribution (45,46). In men with decreased androgen and elevated oestrogen production, i.e. Klinefelter's syndrome, other forms of male hypogonadism, and advanced cirrhosis, a tendency towards a lower body fat distribution has been reported (47,48). These studies, however, referred mostly to pathological situations.
It has previously been suggested that sex hormones may play an important role in the regulation of body fat distribution (49,50), due to their specific effects on adipocyte metabolism in the different regions of the body. However, comparison of the various studies in which the relationship between the distribution of adipose tissue and sex hormones were investigated, revealed many discrepancies (Chapter 6). Nevertheless, the most consistent finding was an inverse association between abdominal fat distribution
14
Introduction
and sex-hormone-binding globulin (SHBG) levels, although not all studies could confirm this finding. SHBG acts as a transport protein by reducing the metabolic clearance rate of most sex hormones and thereby prolonging their effective half-life time in peripheral blood (51). SHBG levels are determined largely by the ratio of androgens to oestrogens (52). Since the affinity of SHBG for testosterone is considerably higher than that for oestradiol (52), SHBG seems to be a sensitive indirect indicator for androgenicity. Furthermore, SHBG plays a role in the availability for biological activity of these hormones, since it has been demonstrated that the fraction not bound to SHBG is biologically available (53). Thus, changes in SHBG concentrations regulate the availability of free sex hormones in blood plasma and vice versa.
Differences in study populations, and in methods used for the assessment of sex hormone levels and body fat distribution may be explanations for the inconsistent findings, in particular with respect to androgen and oestrogen levels. All previous studies used the waist/hip ratio as a measure of body fat distribution, except for the study of Seidell and colleagues (54) in which CT was performed for measurement of the visceral fat depot in male subjects. Pasquali et al. (55) proposed that there seems to exist a gender difference in the relationship between fat distribution and androgen levels. However, up to now, there have been no studies which included both men and women. In addition, data on the effect of reductions of the visceral fat depot on sex hormones in obese subjects were also lacking. In the present study, the associations between initial body fat distribution and sex hormone levels were studied as well as between changes that occurred in response to an energy-deficit diet in men as well as in women.
Outline of the thesis The cross-sectional associations between visceral fat accumulation and the serum lipid profile of healthy obese men and women are described in Chapter 2. In Chapter 3, the relationships between visceral fat accumulation and components of energy expenditure (RMR and DIT) are reported. In this chapter, also the ability to lose body weight and body fat from the abdominal fat depots in relation to the initial type of body fat distribution was investigated. In Chapter 4, the effects of visceral fat loss due to a controlled energy-deficit diet for 13 weeks on serum lipid levels are presented. The study design enabled us to investigate the effect of weight loss alone on the serum lipid profile of obese subjects. The findings are described in Chapter 5. In Chapter 6, the relationships between visceral fat accumulation and sex hormone levels in obese subjects undergoing weight loss therapy are shown. Finally, the overall conclusions and the implications for future research are discussed in Chapter 7.
15
Chapter 1
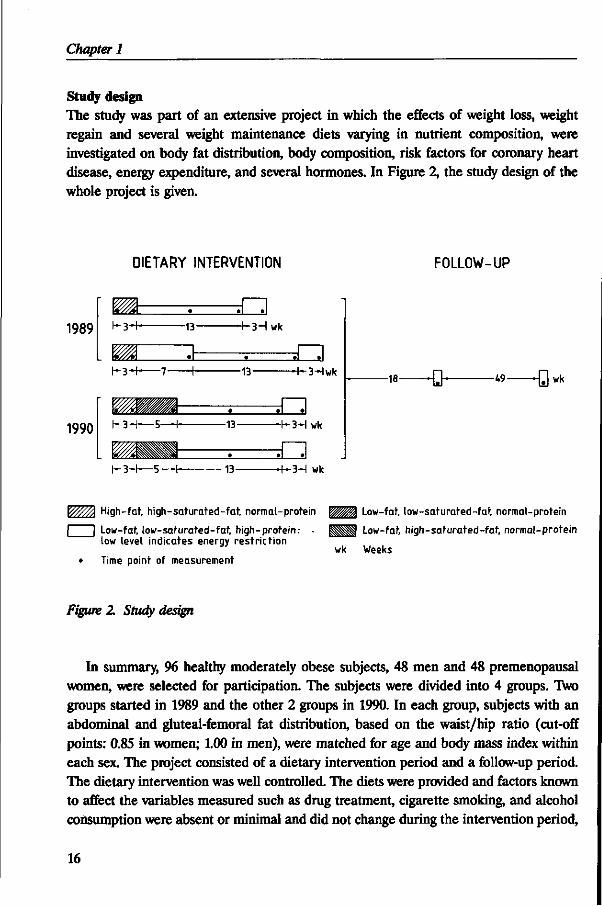
Study design The study was part of an extensive project in which the effects of weight loss, weight regain and several weight maintenance diets varying in nutrient composition, were investigated on body fat distribution, body composition, risk factors for coronary heart disease, energy expenditure, and several hormones. In Figure 2, the study design of the whole project is given.
DIETARY INTERVENTION FOLLOW-UP
1989
1990
h 3 H - -13-
K 3 - H 7 •+•
K3-H—5—H-
r-3-r— 5-
- t -3Hwk
-13-
-13-
•13-
H-3Hwk
H-3-I wk
-3-I wk
- 1 8 — - Q - -W -Q wk
High-fat, high-saturated-fat, normal-protein
| I Low-fat, low-saturated-fat, high-protein: low level indicates energy restriction
• Time point of measurement
W!M\ Low-fat, low-saturated-fat, normal-protein
HHU Low-fat, high-saturated-fat, normal-protein
wk Weeks
Figure 2. Study design
In summary, 96 healthy moderately obese subjects, 48 men and 48 premenopausal women, were selected for participation. The subjects were divided into 4 groups. Two groups started in 1989 and the other 2 groups in 1990. In each group, subjects with an abdominal and gluteal-femoral fat distribution, based on the waist/hip ratio (cut-off points: 0.85 in women; 1.00 in men), were matched for age and body mass index within each sex. The project consisted of a dietary intervention period and a follow-up period. The dietary intervention was well controlled. The diets were provided and factors known to affect the variables measured such as drug treatment, cigarette smoking, and alcohol consumption were absent or minimal and did not change during the intervention period,
16
Introduction
while physical activity was also kept as constant as possible. No diets or weight-maintenance counselling were provided in the follow-up period. During the controlled dietary intervention, all subjects received an affluent-type diet for 3 weeks, during which their body weight was kept stable. Some of the subjects stayed on a weight-stable diet for another 5-7 weeks. The weight loss intervention was identical for each subject, which consisted of a 4.2 MJ/day energy-deficit diet for 13 weeks. Afterwards, all subjects were given a weight-stabilising diet for another 3 weeks. The nutrient composition of the different diets given in this study are presented in the Appendix. The participants were subsequently studied, on average, 18 and 67 weeks after the dietary intervention period. The part of the project described in this thesis focused on the relationships between visceral fat accumulation and serum lipids, energy expenditure, and sex hormones in healthy obese men and premenopausal women undergoing weight loss therapy. Other aspects of the project dealing with the effects of weight loss and subsequent weight regain on body composition, fat distribution and resting energy expenditure, are described and discussed in detail elsewhere (56).
REFERENCES
1. Seidell JC. Obesity in Europe: prevalence and public health implications. WHO-report, Regional Office of Europe (in press).
2. Kuczmarski RJ. Prevalence of overweight and weight gain in the United States. Am J Clin Nutr 1992;55:495S-502S. 3. Blokstra A, Kromhout D. Trends in obesity in young adults in The Netherlands from 1974 to 1986. Int J Obesity 1991;15:513-
521. 4. Seidell JC, Deurenberg P, Hautvast JGAJ. Obesity and fat distribution in relation to health -current insights and
recommendations. Wld Rev Nutr Diet 1987;50:57-91.
5. Flynn MAT, Gibney MJ. Obesity and health: why slim? Proc Nutr Soc 1991;50:413-432. 6. Larsson B. Obesity, fat distribution and cardiovascular disease. Int J Obesity 1991;15:53-57. 7. Despres J-P, Moorjani S, Lupien PJ, Tremblay A, Nadeau A, Bouchard C. Regional distribution of body fat, plasma
lipoproteins, and cardiovascular disease. Arteriosclerosis 1990;10:497-511.
8. Bjomtorp P. "Portal" adipose tissue as a generator of risk factors for cardiovascular disease and diabetes. Arteriosclerosis 1990;10:493-496.
9. Despres J-P. Obesity and lipid metabolism: relevance of body fat distribution. Current opinion in Lipidology 1991;2:5-15.
10. Noord PAH van, Seidell JC, Tonkelaar I den, Baanders-van Halewijn EA, Ouwehand IJ. The relationship between fat distribution and some chronic diseases in 11825 women participating in the DOM-project. Int J Epidemiol 1990;19:564-570.
11. Radke-Sharpe N, Whitney-Saltiel D, Rodin J. Rat distribution as a risk factor for weight and eating concerns. Int J Eating Disorders 1990;9:27-36.
12. Bjomtorp P. How should obesity be defined? J Inter Med 1990;227:147-149. 13. Stunkard AJ. Changes in the indications for treatment for obesity. Int J Obesity 1992;16(Suppl l):vii-viii. 14. Vague J. The degree of masculine differentiation of obesities: a factor determining predisposition to diabetes, atherosclerosis,
gout, and uric calculous disease. Am J Clin Nutr 1956;4:20-34.
15. Baumgartner RN, Heymsfield SB, Roche AF, Bernardino M. Abdominal composition quantified by computed tomography. Am J Clin Nutr 1988;48:936-945.
16. Stallone DD, Stunkard AJ, Wadden TA, Foster GD, Boorstein J, Arger P. Weight loss and body fat distribution: a feasibility study using computed tomography. Int J Obesity 1991;15:775-780.
17. Seidell JC, Bakker GIG, Kooy K van der. Imaging techniques for measuring adipose-tissue distribution -a comparison between computed tomography and 1.5-T magnetic resonance. Am J Clin Nutr 1990;51:953-957.
17
Chapter 1
18. Ross R, Leger L, Morris D, Guise J de, Guardo R. Quantification of adipose tissue by MR]: relationship with anthropometric variables. J Appl Physiol 1992;72(2):787-795.
19. Gray DS, Fujioka K, Colletti PM, Kim H, Devine W, Cuyegkeng T, et al. Magnetic-resonance imaging used for determining fat distribution in obesity and diabetes. Am J Clin Nutr 1991;54:623-627.
20. Kooy K van der, Seidell JC. Techniques for the measurement of visceral fat: a practical guide. Int J Obesity (in press). 21. Larsson B, Svardsudd K, Welin L, Wilhelmsen L, Bjorntorp P, Tibblin G. Abdominal adipose tissue distribution, obesity, and
risk of cardiovascular disease and death: 13 year follow up of participants in the study of men born in 1913. Br Med J 1984;288:1401-1404.
22. Donahue RP, Abbott RD, Bloom E, Reed DM, Yano K. Central obesity and coronary heart disease in men. Lancet 1987;ii: 821-824.
23. Lapidus L, Bengtsson C, Larsson B, Pennert K, Rybo E, Sjdstrom L. Distribution of adipose tissue and risk of cardiovascular disease and death: a 12 year follow-up of participants in the population study of women in Gothenburg, Sweden. Br Med J 1984;289:1257-1261.
24. Marin P, Andersson B, Ottosson M, Olbe L, Chowdhury B, Kvist H, et al. The morphology and metabolism of intraabdominal adipose tissue in men. Metabolism 1992;41:1242-1248.
25. Bjorntorp P. Adipose tissue distribution and function. Int J Obesity 1991;15:67-81. 26. Rebufte-Scrivc M, Andersson B, Olbe L, Bjorntorp P. Metabolism of adipose tissue in intraabdominal depots of nonobese
men and women. Metabolism 1989;38:453-458.
27. Blumenthal SA. Stimulation of gluconeogenesis by palmitic acid in rat hepatocytes: evidence that this effect can be dissociated from the provision of reducing equivalents. Metabolism 1983;32:971-981.
28. Stromblad G, Bjorntorp P. Reduced hepatic insulin clearance in rats with dietary-induced obesity. Metabolism 1986;35:323-327. 29. Peiris AN, Mueller RA, Strove MF, Smith GA, Kissebah AH. Relationship of androgenic activity to splanchnic insulin
metabolism and peripheral glucose utilization in premenopausal women. J Clin Endocrinol Metab 1987;64:162-169. 30. Kissebah AH, Peiris AN. Biology of regional body fat distribution: relationship to non-insulin-dependent diabetes mellitus.
Diabetes Metab Rev 1989;5:83-109.
31. Reaven GM, Hoffman BB. A role for insulin in the aetiology and course of hypertension? Lancet 1987;ii:435-436. 32. Reaven GM. Role of insulin resistance in human disease. Diabetes 1988;37:1595-1607.
33. Casimirri F, Pasquali R, Cesari MP, Melchionda N, Barbara L. Interrelationships between body weight, body fat distribution and insulin in obese women before and after hypocaloric feeding and weight loss. Ann Nutr Metab 1989;33:79-87.
34. Bjorntorp P, Carlgren G, Isaksson B, Krotkiewski M, Larsson B, Sjdstrom L. Effect of an energy-reduced dietary regimen in relation to adipose tissue cellularity in obese women. Am J Clin Nutr 1975;28:445-452.
35. Krotkiewski M, Sjdstrom L, Bjorntorp P, Carlgren G, Garellick G, Smith U. Adipose tissue cellularity in relation to prognosis for weight reduction. Int J Obesity 1977;1:395-416.
36. Lanska DJ, Lanska MJ, Hartz AJ, Kalkhoff RK, Rupley D, Rimm AA. A prospective study of body fat distribution and weight loss. Int J Obesity 1985;9:241-246.
37. Vansant G, Besten C den, Weststrate J, Deurenberg P. Body fat distribution and the prognosis for weight reduction: preliminary observations. Int J Obesity 1988;12:133-140.
38. Wadden TA, Stunkard AJ, Johnston FE, Wang J, Pierson RN, Van Itallie TB, et al. Body fat deposition in adult obese women.II Changes in fat distribution accompanying weight reduction. Am J Clin Nutr 1988;47:229-234.
39. Besten C den, Vansant G, Weststrate JA, Deurenberg P. Resting metabolic rate and diet-induced thermogenesis in abdominal and ghiteal-femoral obese women before and after weight reduction. Am J Clin Nutr 1988;47:840-847.
40. Gaal LF van. Resting metabolic rate and glucose induced thermogenesis in obese men. Relationship to total body fat and body fat distribution. In: Body fat distribution: endocrine, metabolic and therapeutic aspects related to atherosclerosis. Studies in obesity and type II diabetes (PhD-thesis). Antwerpen,Belgium: University of Antwerpen, 1990:105-109.
41. Armellini F, Zamboni M, Robbi R, Todesco T, De Marchi M, Castelli S, et al. Resting metabolic rate and adipose tissue distribution in obese women. Int J Obesity 1991;15(Suppl 1):239.
42. Schutz Y, Tremblay A. Does lipid oxidation differ in gynoid and android obese women? Int J Obesity 1992;16:67-69. 43. Weststrate JA. Resting metabolic rate and diet-induced thermogenesis. Studies in humans on individual differences and on the
impact of nutritional and non-nutritional factors (PhD-thesis). Wageningen.The Netherlands: Wageningen Agricultural University, 1989.
44. Garn SM. Fat weight and fat placement in the female. Science 1957;125:1091-1092.
45. Yen SSC The polycystic ovary syndrome. Clin Endocrinol 1980;12:177-208. 46. Kirschner MA, Samojlik E, Silber D. A comparison of androgen production and clearance in hirsute and obese women. J
Steroid Biochem 1983;19:607-614.
18
Introduction
47. Sparrow D, Bosse R, Rowe JW. The influence of age, alcohol consumption, and body build on gonadal function in men. J Clin Endocrinol Metab 1980^1^08-512.
48. Conte FA, Grumbach MM. Pathogenesis, classification, diagnosis, and treatment of anomalies of sex. In: DeGroot LJ, Besser GM, Cahill GF, Marshall JC, Nelson DH, Odell WD, et al., eds. Endocrinology. Philadelphia: WB Saunders, 1989:1810-1847.
49. Rebufte-Scrive M. Steroid hormones and distribution of adipose tissue. Acta Med Scand 1988;723(Suppl):143-146. 50. Kissebah AH, Evans DJ, Peiris A, Wilson CR. Endocrine characteristics in regional obesities: role of sex steroids. In: Vague
J, Bjorntorp P, Guy-Grand B, Rebufte-Scrive M, Vague P, eds. Metabolic complications of human obesities. Amsterdam: Elsevier, 1985:115-130.
51. Pardridge WM. Transport of protein-bound hormones into tissues in vivo. Endocr Rev 1981;2:103-123.
52. Anderson DC Sex-hormone-binding globulin. Clin Endocrinol 1974;3:69-96.
53. Siiteri PK, Murai JT, Hammond GL, Nisker JA, Raymoure WJ, Kuhn RW. The serum transport of steroid hormones. Recent Prog Horm Res 1982;38:457-510.
54. Seidell JC, Bjorntorp P, Sjdstrdm L, Kvist H, Sannerstedt R. Visceral fat accumulation in men is positively associated with insulin, glucose, and C-peptide levels, but negatively with testosterone levels. Metabolism 1990;39:897-901.
55. Pasquali R, Casimirri F, Cantobelli S, Melchionda N, Labate AMM, Fabbri R, et al. Effect of obesity and body fat distribution on sex hormones and insulin in men. Metabolism 1991;40:101-104.
56. Kooy K van der. Changes in body composition and fat distribution in response to weight loss and weight regain (PhD-thesis). Wageningen,The Netherlands: Wageningen Agricultural University, 1993.
19
CHAPTER 2
VISCERAL FAT ACCUMULATION MEASURED BY MAGNETIC RESONANCE IMAGING IN RELATION TO SERUM LIPIDS IN OBESE MEN AND WOMEN*
Rianne Leenen, Karin van der Kooy, Jaap C. Seidell and Paul Deurenberg
ABSTRACT
In 91 apparently healthy obese subjects (45 premenopausal women and 46 men), the associations between specific fat depots and serum lipids were studied. Magnetic resonance imaging was used to quantify fat depots at abdominal and hip level. In women, an accumulation of visceral fat was associated with a less favourable serum lipid profile, even after adjustment for age and body fat percentage: higher triglyceride levels (p < 0.001), lower levels of HDL cholesterol (p<0.01) and a diminished HDL cholesterol/LDL cholesterol ratio (p<0.01). In men, however, the significant inverse relationship between an abundance of visceral fat and the HDL cholesterol/LDL cholesterol ratio and the significant positive correlations with total-, LDL cholesterol and triglycerides disappeared after adjustment for age and fat percentage. Within each sex, subcutaneous fat neither at abdominal level nor at hip level was significantly related to serum lipids. It is concluded that there are gender differences in the associations between visceral fat accumulation and serum lipids.
INTRODUCTION
Obesity is known to be associated with the risk of coronary heart disease, non-insulin-dependent diabetes mellitus and mortality (1). Epidemiological studies have shown that the distribution of fat rather than obesity itself may be an independent predictor for coronary heart disease and diabetes mellitus (2-4). However, the results of several investigations in which the relations between fat distribution and serum lipids were examined are inconsistent (5-20). This might be due to differences in age and degree of obesity between study populations as well as to differences in the existence of possible confounders such as smoking (21), recent weight reduction (22,23), the use of oral
' Atherosclerosis 1992;94:171-181.
21
Chapter 2
contraceptives (24), consumption of alcohol (21), and composition of the diet (25). In the majority of studies, adipose tissue distribution was measured by
anthropometrical methods such as skinfolds (5) and the ratio of the waist-to-hip circumference (6-18). Current hypotheses concerning the associations between fat distribution and serum lipids emphasise the importance of using direct methods such as computed tomography (CT) or magnetic resonance imaging (MRI) to quantify 'portal' intra-abdominal adipose tissue (26). Only in a few studies was CT used to measure the absolute and relative intra-abdominal fat distribution directly (6,8,19). Most studies have been carried out in non-obese subjects (5,7-9,11,13-17) or in obese women (6,10,12,16,19,20). There have been few reports on the relationship between adipose tissue distribution and serum lipids in healthy obese men (12,18-20). Only in the study of Fujioka et al. (19) was CT used to assess the amount of intra-abdominal adipose tissue in men. In this study, however, patients with glucose intolerance and diabetics were included.
Therefore, in the present study the relationships between serum lipids and fat distribution were measured in apparently healthy obese men and obese premenopausal women, controlling for possible confounders and including indirect and direct methods for the assessment of body fat distribution.
MATERIAL AND METHODS
Subjects Ninety-six obese subjects (48 women and 48 men) were selected for this study. All subjects were apparently healthy, as evaluated by a medical history and physical examination. Only subjects with a body mass index (BMI=weight/height2) between 28 kg/m2 and 38 kg/m2 were allowed to participate. Subjects with glycosuria and proteinuria were excluded. Their levels of serum lipids before the experiment ranged from 3.67 to 8.35 mmol/L (mean, 6.01 mmol/L) for total cholesterol and from 0.38 to 3.32 mmol/L (mean, 1.43 mmol/L) for triglycerides. Their serum glucose ranged from 4.24 to 7.10 mmol/L (mean, 5.59 mmol/L) and their systolic blood pressure from 110 to 180 mm Hg (mean, 139 mm Hg). Seventy-nine subjects did not smoke and the remaining 17 (8 women and 9 men) smoked less than 5 cigarettes per day. In addition, 17 subjects (10 women and 7 men) did not drink alcohol and the remaining group drank less than 2 alcoholic consumptions per day. None of the volunteers received medication known to affect serum lipids. All women were premenopausal and did not use oral contraceptives. Subjects with an abdominal and gluteal-femoral fat distribution, based on the waist/hip ratio (cut-off points: 0.85 in women; 1.00 in men), were matched for age and body mass index in each sex. Data of 5 subjects were excluded before the analysis of the results
22
Visceral fat and serum lipids
because 2 were diagnosed as having subclinical hypothyroidism and 2 were found to have severe fasting hyperinsulinemia (>100 jiU/mL). One subject withdrew from the study before measurements were taken.
The aim and protocol of the study, approved by the Medical Ethical Committee of the Department of Human Nutrition, were fully explained to the volunteers. All subjects gave their written informed consent.
Diets The subjects consumed a standardized Western-type diet for 3 weeks. All food was supplied and individually tailored to meet each person's energy requirement, which was estimated from resting metabolic rate and physical activity pattern as described by Weststrate et al. (27). However, the participants were allowed to choose a limited number of food items, free of fat and cholesterol, which provided a fixed amount of 5% of the total daily energy intake. The experimental diet consisted of conventional foods and menus were changed daily.
The nutrient composition of the individual diets was calculated using the 1985 edition of the Dutch computerized food table (28). The diet consisted of 12% of energy (en%) as protein, 40 en% as total fat (20 en% as saturated fatty acids, 15 en% as monounsaturated fatty acids, 5 en% as polyunsaturated fatty acids) and 48 en% as carbohydrates. Body weights were recorded twice a week and energy intakes were adjusted to counteract weight changes.
Blood sampling and analyses Venous blood was sampled in the morning after an overnight fast of 11-13 h twice in the last week of the study period with an interval of 2 days. The mean value of the 2 samples was used for statistical analyses. Serum was prepared by centrifugation at 1200 xg within 1 h after venipuncture and stored at -80 °C until analysis. Total serum cholesterol was determined by an enzymatic colorimetric method (29). Serum HDL cholesterol was measured after precipitation (30) using the same enzymatic method (29). Serum triglyceride was determined as described by Sullivan et al. (31). All samples of one subject were analyzed within one run. The within-run coefficient of variation of control sera was 1.4% for total cholesterol, 1.6% for HDL cholesterol and 1.7% for triglycerides. Accuracy for total cholesterol and triglycerides was checked by analysis of serum pools of known value provided by the U.S. Centers for Disease Control (Atlanta,GA). Accuracy for HDL cholesterol was checked by serum pools of known value produced by Solomon Park Research Laboratories (Kirkland,WA). The mean bias with regard to target values of the Centers for Disease Control was + 0.13 mmol/L for total cholesterol and -0.02 mmol/L for triglycerides. The mean bias with regard to the Solomon Park target value for HDL cholesterol was + 0.08 mmol/L. The LDL cholesterol concentration
23
Chapter 2
was calculated using the Friedewald equation (32). The ratio of HDL cholesterol to LDL cholesterol was calculated to estimate the atherogenic index.
Body composition All anthropometric measurements were made with the subjects wearing only swimming gear or underwear. Body weight was determined to the nearest 0.05 kg on a digital scale (Berkel ED-60-T, Rotterdam, The Netherlands) and body height was measured by a wall-mounted stadiometer to the nearest 0.001 m. Body mass index was calculated as weight/height2 (kg/m2). Total body density was measured by the underwater weighing method with simultaneous measurement of residual lung volume by a helium dilution technique (33). Body fat percentage was calculated from total body density using the equation of Siri (34). The fat percentage of 2 subjects, who did not undergo underwater weighing, was determined from weight and total body water (deuterium oxide dilution) assuming a hydration coefficient of the fat free mass of 0.73 (35). These women were afraid of complete immersion under water. In this study population, the deuterium dilution technique gave comparable results with the underwater weighing method (r=0.86, standard error of estimate (SEE)=2.4% in women; r=0.84, SEE=2.3% in men).
Fat distribution Circumference measurements to the nearest 0.001 m were made with the subject standing upright. Waist circumference was measured in each subject midway between the lower rib margin and the iliac crest at the end of a gentle expiration. The hip circumference was measured at the level of the widest circumference over the great trochanters.
Magnetic resonance imaging (MRI)-scans were made on a whole-body scanner (GYROSCAN S15, Philips Medical Systems, Best, The Netherlands) using a 1.5-T magnetic field (64 MHz) and a slice thickness of 10 mm. Transverse MRI-scans were taken midway between the lower rib margin and the iliac crest and for a subsample of the study population (32 women, 37 men) at trochanter level, while subjects were lying supine. The scans were performed and interpreted as described previously by Seidell et al. (36). In this obese population, the reproducibility of calculating fat areas from the same scan was 1.8%, 5.0% and 2.2% for the estimation of total-, visceral- and subcutaneous abdominal fat areas, respectively. The ratio of visceral fat to subcutaneous abdominal fat (V/S ratio) was calculated.
Statistical methods Deviations from normality of the distributions of the variables were checked within each sex. Only triglycerides and intra-abdominal fat area and the V/S ratio had a skewed distribution and natural logarithmic transformed values were used in statistical analyses.
24
Visceral fat and serum lipids
Differences between men and women were tested with the Student's Mest. Pearson's product-moment correlations and partial correlation coefficients were computed within each sex using univariate and multiple linear regression techniques with serum lipids as dependent variables and covariates as independent variables. Differences between equations of men and women were tested for differences in slopes and coincidence by the method described by Kleinbaum et al. (37). Two-sided p-values were considered statistically significant at p< 0.05. Results are expressed as means ± standard deviation (SD).
RESULTS
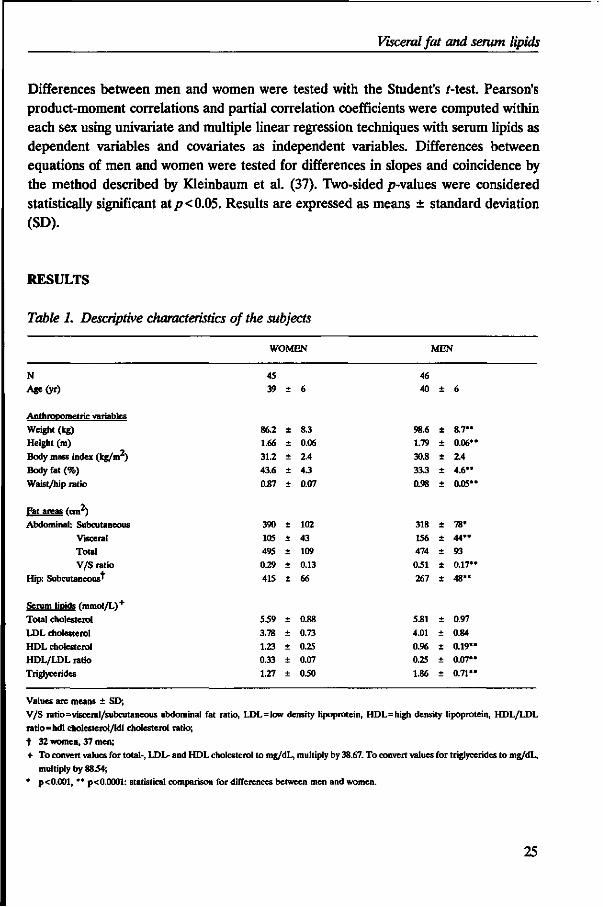
Table 1. Descriptive characteristics of the subjects
WOMEN MEN
N Age(yr)
Anthropometric variables Weight (kg) Height (m)
Body mass index (kg/nr) Body fat (%)
Waist/hip ratio
Fat areas (cm 1
Abdominal: Subcutaneous Visceral Total V/S ratio
Hip: Subcutaneous*
Serum lipids (mmol/L) +
Total cholesterol LDL cholesterol HDL cholesterol HDL/LDL ratio Triglycerides
45 39
86.2 1.66
31.2 43.6
0.87
390
105 495 0.29
415
539
3.78
1.23 0.33
1.27
*
+
+
± +
+
+
± +
+
+
+
+
+
+
+
6
8.3 0.06
2.4 4.3
0.07
102 43 109
0.13 66
0.88
0.73
0.25 0.07
030
46 40
98.6 1.79
30.8 33.3
0.98
318
156 474
031 267
5.81
4.01 0.96 0.25
1.86
+
+
±
+
+
+
+
+
+
+
+
+
+
+
+
±
6
8.7** 0.06"
2.4 4.6"
0.05"
78* 4 4 " 93 0.17"
4 8 "
0.97 0.84
0.19" 0.07"
0.71"
Values are means ± SD; V/S ratio=visceral/subcutaneous abdominal fat ratio, LDL=low density lipoprotein, HDL=high density lipoprotein, HDL/LDL ratio=hdl cholesterol/ldl cholesterol ratio;
t 32 women, 37 men; + To convert values for total-, LDL- and HDL cholesterol to mg/dL, multiply by 38.67. To convert values for triglycerides to mg/dL,
multiply by 8834; * p<0.001, ** p<0.0001: statistical comparison for differences between men and women.
25
Chapter 2
Table 1 shows some characteristics of the study population, separately for men and women. All the anthropometric variables were significantly different between men and women, except for the body mass index. In addition, there were no sex differences in total abdominal adipose tissue and age. However, men had a larger average area of visceral fat and smaller subcutaneous fat areas at abdominal and hip level than women. Consequently, the mean V/S ratio was also higher in men than in women. Men had, on average, higher concentrations of triglycerides and lower levels of HDL cholesterol than women. The concentrations of total cholesterol and LDL cholesterol did not differ between both sexes. Within each sex, no statistically significant differences were found in characteristics between smokers and non-smokers and between drinkers and non-drinkers (data not shown).
Table 2. Pearson correlation coefficients between body fat distribution variables and serum lipids in obese women and men
WOMEN
Waist/hip ratio Abdominal fat area:
Visceral fat Subcutaneous fat
V/S ratio Total fat
Hip fat area:
Subcutaneous fat'
MEN
Waist/hip ratio
Abdominal fat area:
Visceral fat Subcutaneous fat
V/S ratio Total fat
Hip fat area: Subcutaneous fat*
Total cholesterol
-0.04
0.06
0.04
0.02 0.07
0.06
0.32*
0.42" 0.03 0.30*
0.22
0.10
LDL cholesterol
-0.01
0.02 0.03
-0.01 0.03
-0.03
0.31*
0.41** 0.04
0.30*
0.22
0.12
HDL cholesterol
-0.48***
-0.33* -0.09
-0.21 -0.19
-0.01
-0.16
-0.21 0.04
-0.20 -0.07
0.07
HDL/LDL
ratio
-0.48***
-0.40**
-0.13 -0.24 -0.24
-0.01
-0.38**
-0.49*** -0.02 -0.38** -0.24
-0.05
Triglycerides
0.40**
0.49*** 0.12
0.31* 0.30*
0.34
0.32*
0.35* -0.03 0.27
0.14
-0.01
V/S ratio=visceral/subcutaneous abdominal fat ratio, LDL=low density lipoprotein, HDL=high density lipoprotein, HDL/LDL
ratio=hdl cholesterol/Idl cholesterol ratio;
t 32 women, 37 men; * p<0.05, ** p<0.01, *** p<0.001.
Correlation coefficients of serum lipids with body fat distribution variables are shown in Table 2. In women as well as in men, an abundance of visceral fat was associated with
26
Visceral fat and serum lipids
higher serum triglyceride levels and with a diminished HDL cholesterol/LDL cholesterol ratio. In women, visceral fat was inversely related to HDL cholesterol, but did not correlate with total cholesterol and LDL cholesterol. In men, however, total cholesterol and LDL cholesterol were positively correlated with visceral fat area, but no correlation with HDL cholesterol was found. Within each sex, intra-abdominal fat deposition and waist/hip ratio showed similar tendencies with serum lipids. For both sexes, the amount of total abdominal fat as well as of subcutaneous fat at abdominal and hip level were not significantly associated with serum lipids, except for a positive correlation between serum triglycerides and total abdominal fat in women. In men, the V/S ratio showed the same significant tendencies as the amount of visceral adipose tissue, although the correlation with triglycerides did not reach statistical significance. In women, only a positive significant correlation was found between the V/S ratio and serum triglycerides.
hdl/ldl ratio 0.55 r
0.45
0.35
0.25
0.15
Y=-0.08 X + 0.70 r=-0.40, p< 0.01
0 . "*****0 o • •
Y=-0.11 Xt0.78 r = -0.49, p< 0.001
I I
4.5 5.5 6.5 log [visceral fat] (cm )
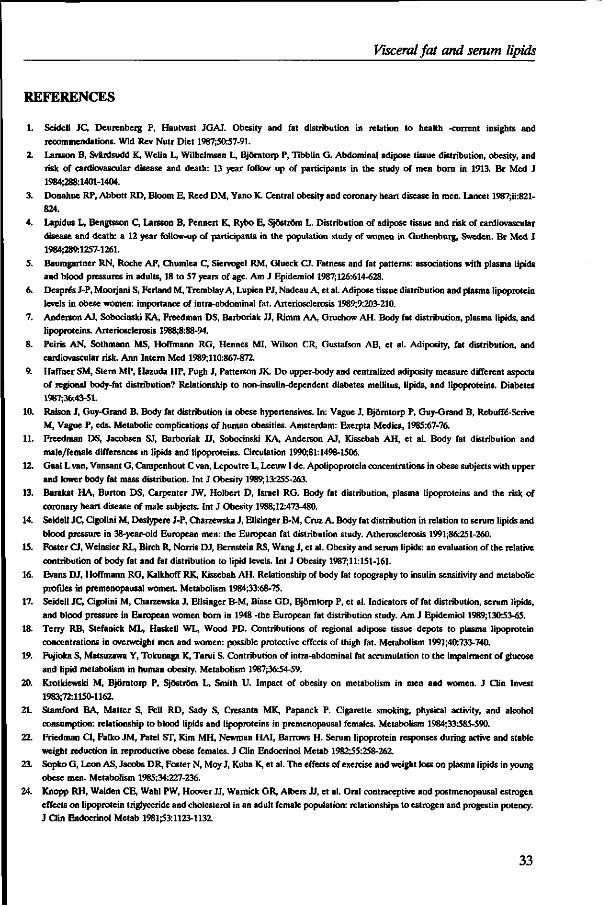
Figure 1. Relation between HDL/LDL ratio and visceral fat in women (o, — ) and men
(•"-)
Figure 1 shows the linear relationship for visceral fat and the HDL cholesterol/LDL cholesterol ratio for both sexes. The 2 regression lines were parallel, although the lines were not significantly coincident (p< 0.025). In Figure 2, the association between visceral fat and serum triglycerides is presented. The regression lines of men and women did not differ significantly in slope and were coincident.
27
Chapter 2
log [ tr iglycerides] (mmol/L) 1.5
1.2
0.9
0.6
0.3
0
0.3
0.6 <
-
-
-
L.
'0°.
o
1
• • •
o° • V . a - i ^ ^
o...°--o>o->"^. .
- < 8 o tP^ o o 0 ° ° ,
o
1 1 1
men
Y=0.43 X-1.62 r = 0.35, p<0.05
women
Y=0.51 X-2.19 r = 0.49, p< 0.001
4 4.5 5 5.5 6 6.5 log [visceral farl (cm2)
Figure 2. Relation between serum triglycerides and visceral fat in women (o, — ) and men
(•"-)
Table 3 shows the correlations of age and body fat percentage with parameters of abdominal fat distribution and serum lipids. In women, no significant associations were found, with the exception of age with visceral fat and the V/S ratio. In men, however, age was associated with a less favourable lipid profile and fat percentage was significantly negatively correlated with the HDL cholesterol/LDL cholesterol ratio. In addition, in men, age and fat percentage were positively correlated with variables of abdominal fat distribution, except for the association between body fat percentage and V/S ratio, due to the high relationship between fat percentage and the amount of subcutaneous abdominal adipose tissue (r=0.65,/><0.0001). Adjustment for the potential confounding effects of age and body fat percentage was necessary to evaluate the independent role of abdominal fat distribution on lipid profiles.
The age and body fat percentage adjusted correlations are presented in Table 4, separately for men and women. In women, the correlation coefficients of serum lipids with regional fat distribution, visceral fat area and the V/S ratio were not appreciably affected after adjustment for age and body fat percentage. In men, however, the statistically significant relationships observed in univariate regression analysis (Table 3) disappeared when the effects of age and body fat percentage on serum lipids were
28
Visceral fat and serum lipids
Table 3. Pearson correlation coefficients for age and body fat percentage with serum lipids and the explanatory variables in obese women and men
Age
Women Men
Fat percentage
Women Men
Serum lipids Total cholesterol LDL cholesterol HDL cholesterol HDL/LDL ratio Triglycerides
Fat distribution Waist/hip ratio Visceral fat area V/S ratio
0.20 0.17
0.13 -0.08
0.07
0.25
0.33* 0.33*
0.34* 0.32*
-0.26
-0.45** 0.35*
0.40**
039**** 033***
-0.05 -0.09
0.01 0.04
0.04
0.03
0.17 -0.19
0.23 0.23
-0.18 -0.34*
0.28
0.48***
0.61*** 0.04
V/S ratio=visceral/subcutaneous abdominal fat ratio, LDL=low density lipoprotein, HDL=high density lipoprotein, HDL/LDL
ratio=hdl cholesterol/ldl cholesterol ratio; * p<0.05, ** p<0.01, *** p<0.001, ***• p<0.0001.
controlled for. In men as well as in women still no significant correlations were found between serum lipids and subcutaneous fat at abdominal and hip level after adjustment for these variables (data not shown). The waist/hip ratio and visceral adipose tissue showed the same tendencies with serum lipids within each sex.
Table 4. Partial correlations (adjustment for age and body fat percentage) of body fat distribution variables with serum lipids
WOMEN
Waist/hip ratio Visceral fat area
V/S ratio
MEN Waist/hip ratio Visceral fat area
V/S ratio
Total
cholesterol
-0.09
0.01
-0.08
0.17 0.25
0.18
LDL
cholesterol
-0.06 -0.02 -0.10
0.17 0.25 0.19
HDL cholesterol
-033*** -0.40"
-0.28
-0.02
-0.01 -0.10
HDL/LDL ratio
-0.47** -0.41**
-0.22
-0.16 -0.21
-0.23
Triglycerides
0.40** 030***
0.33*
0.14 0.09
0.14
V/S ratio=visceral/subcutaneous abdominal fat ratio, LDL=low density lipoprotein, HDL=high density lipoprotein, HDL/LDL ratio=hdl cholesterol/ldl cholesterol ratio; * p<0.05, ** p<0.01, *** p<0.001.
29
Chapter 2
DISCUSSION
The findings of the present study indicate that an accumulation of visceral fat in healthy obese women is associated with an unfavourable lipid profile, even after adjustment for possible confounding effects of age and body fat percentage. In obese men, however, neither visceral fat accumulation nor age or body fat percentage are correlated to serum lipids independently of each other.
Obesity per se is associated with a less favourable lipid profile (38). In the present study, however, no significant associations were found between serum lipids and total fatness indices, such as body fat percentage or body mass index (data not shown), except for a negative correlation between fat percentage and HDL/LDL cholesterol ratio in men. The lack of these relationships could be due to the selection of the study population, since all subjects were moderately obese. Despite the fact that men had a lower body fat percentage than women, the obese men had a lipid profile that indicates a higher risk for coronary heart disease than premenopausal women with comparable age and body mass index. The men had significantly higher triglyceride levels and lower HDL cholesterol levels compared with the women. This finding is consistent with previous studies (5,12,39). High triglyceride levels are associated with diminished lipoprotein-lipase activity, resulting in a reduced VLDL catabolism, which finally results in a diminished HDL cholesterol formation (39). The levels of total- and LDL cholesterol did not differ between men and women. Krotkiewski et al. reported similar results (20).
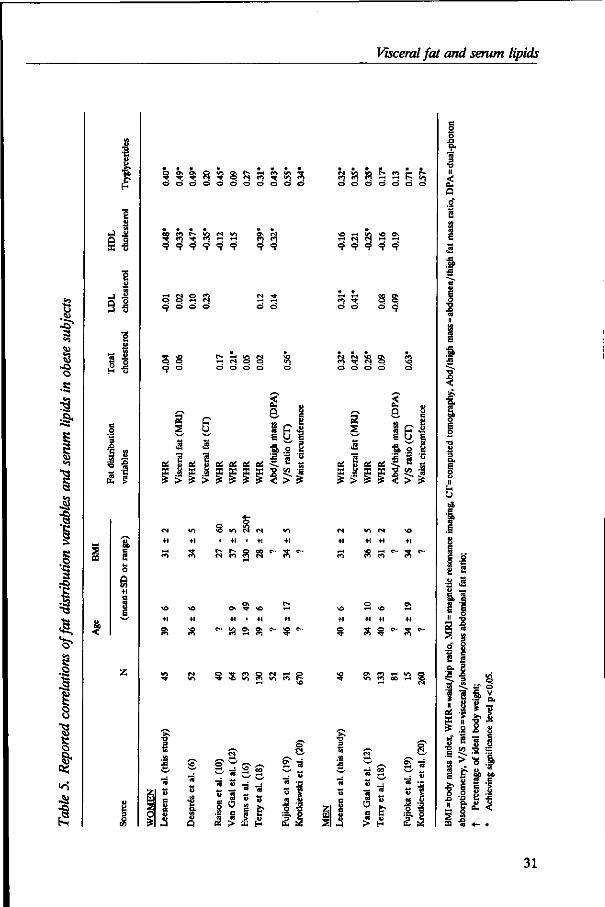
Comparison of several studies in which the relationships between abdominal fat predisposition and serum lipids were investigated in obese subjects reveals discrepancies (see Table 5). In accordance with the majority of the reported studies, the present study revealed positive correlations between an abdominal fat predominance and serum triglycerides. This finding is in agreement with the proposed high lipolytic activity of intra-abdominal adipose tissue that could stimulate triglyceride synthesis by exposing the liver to high free fatty acid concentrations (40). There is still conflicting evidence about the observed correlations between HDL cholesterol and abdominal fat predominance. The results from this study in obese women are in agreement with those of Despres et al. (6) and Terry et al. (18), who also observed a significant inverse association. The role of intra-abdominal adipose tissue on HDL cholesterol concentrations is probably mediated by the enzyme hepatic-triglyceride-lipase (40). It has been proposed that in women, increased concentrations of testosterone could produce an increase in the accumulation of visceral fat and an increase in activity of hepatic-triglyceride-lipase, both leading to reduced HDL-levels (40,41). Increased male sex steroids have been found to be associated with increased visceral fat accumulation in women (42), but not in men (43). This might explain the lack of association between the amount of visceral fat and HDL cholesterol in men in this study.
30
Visceral fat and serum lipids
E
•J I SI
2 -S SI
I
0 \ Ov O »C V * N Tf
o o o o o o o o o o o
oo e i r-» <o <s *n ** C) •* CO rH rH
9 9 9 9 9 9
S S 2 <> o o
9 9
S S 9 <=*
I*- rH V* M «-< CJ o o d d d o
I 8 " c
E C | •a .2 a
c6 &, {£ &,
3 > s
+1 +1
<3 c?i
* VI N N
• +1 • +1
r- r- g oo c* n <n e*
0\ *T O
&. Ov C>- *0 e -^aa
Q -5 CO Q n r-r O ^ *o </i <n v> en t ;
c* <o «o t - en r-< r -en en *n «-< i-t r - »/j d d d d d d o
\ o <-• <o *o o» t - t C I <N t - l <-H
9 9 9 9 9
n 5 o o d o d o
o o o o
2 S
OS Hi
a g ipl S U E
•a o § I. e '5 •9 "5 'I 5 5-1
c* wn e i \ o +1 +1 +1 +1
i-t \ 0 ,-<
§ s ?
o\ en I-* *n en i-< <o g en oo t-t 35
z UJ
S o
*M
t>
e V
"3
u
& Q
5 TJ s S"
*- — w «
<2 £ 1 ES
w 3 « $
51 si
« u c u c o
*S5
« O c
00
« &
« £
o e
E
•a
• a
« E
I « ...
1 i .a S u —.
a i If ^ 2 •§ S 3
.9- 3 8
i f d
.f S.
!i i s
E? ||
^ • =
•§ co TS i s
8 ° -I e &* & bo C O C8 C
•r § i 1
PQ n 4- «
31
Chapter 2
The lack of a significant relationship between abdominal fat distribution and total- and LDL cholesterol concentrations in the female subjects of this study is consistent with the findings of several previous reported studies (6,10,16,18). The particle size and composition of LDL cholesterol may play an important role (38). Terry et al. (18) found no association between abdominal fat distribution and LDL cholesterol, whereas a significant positive association was found with the small LDL-particles. In men, however, we observed a positive correlation for total- and LDL cholesterol with the amount of abdominal adipose tissue. This observation supports previous findings in obese men (12,19). It has been suggested that a high triglyceride level is associated with increased cellular cholesterol synthesis and less cholesterol is cleared from the plasma through the LDL-receptor pathway (40). However, in men, the associations between total- and LDL cholesterol and abdominal fat predominance did not reach statistical significance after adjustment for age and body fat percentage.
Discrepancies between the present study and others may be explained by differences in populations studied (e.g., inclusion of postmenopausal women (10) and patients with glucose intolerance (19)), the lack of controlling for smoking habits, age, alcohol consumption, oral contraceptives, diet and the methods used for assessment of body fat distribution.
This study shows that intra-abdominal adipose tissue seems to be the fat depot that plays a critical role in the associations with serum lipid concentrations, particularly in women. This is in agreement with previous findings (6). In contrast, Terry et al. suggested that femoral adipose tissue, measured by dual-photon absorptiometry, may contribute to favourable lipoprotein profiles that predict lower risk of coronary heart disease (18). In the present study, no favourable effects of subcutaneous fat at hip level on serum lipids were found in both sexes, even after adjustment for age and body fat percentage. In the study of Terry et al. (18), no distinction was made between subcutaneous and visceral abdominal fat, so the effect of visceral adipose tissue alone could not be demonstrated.
Only a few studies reported the associations between intra-abdominal adipose tissue measured by CT and serum lipids (6,8,19). CT involves X-ray exposure of the subjects and is, therefore, not an attractive tool for studies in healthy people. This study demonstrated that the risk profile associated with intra-abdominal fat accumulation can also be confirmed by using magnetic resonance imaging.
From this study with apparently healthy premenopausal obese women and obese men and the use of MRI to measure intra-abdominal adipose tissue, it can be concluded that there are gender differences in the associations between visceral fat accumulation and serum lipids. Although the reason for these gender differences are still unknown, sex-steroid hormone concentrations may be partly responsible for these differences. Further research is required to reveal the complex associations between hormonal status, serum lipids and abdominal fat distribution.
32
Visceral fat and serum lipids
REFERENCES
1. Seidell JC, Deurenberg P, Hautvast JGAJ. Obesity and fat distribution in relation to health -current insights and recommendations. Wld Rev Nutr Diet 1987;50:57-91.
2. Larsson B, Svardsudd K, Welin L, Wilhelmsen L, BjSrntorp P, Tibblin G. Abdominal adipose tissue distribution, obesity, and risk of cardiovascular disease and death: 13 year follow up of participants in the study of men born in 1913. Br Med J 1984;288:1401-1404.
3. Donahue RP, Abbott RD, Bloom E, Reed DM, Yano K. Central obesity and coronary heart disease in men. Lancet 1987;ii:821-824.
4. Lapidus L, Bengtsson C, Larsson B, Pennert K, Rybo E, Sjostrom L. Distribution of adipose tissue and risk of cardiovascular disease and death: a 12 year follow-up of participants in the population study of women in Gothenburg, Sweden. Br Med J 1984;289:1257-1261.
5. Baumgartner RN, Roche AF, Chumlea C, Siervogel RM, Glueck CJ. Fatness and fat patterns: associations with plasma lipids and blood pressures in adults, 18 to 57 years of age. Am J Epidemiol 1987;126:614-628.
6. Despres J-P, Moorjani S, Ferland M, Tremblay A, Lupien PJ, Nadeau A, et al. Adipose tissue distribution and plasma lipoprotein levels in obese women: importance of intra-abdominal fat. Arteriosclerosis 1989;9:203-210.
7. Anderson AJ, Sobocinski KA, Freedman DS, Barboriak JJ, Rimm AA, Gruchow AH. Body fat distribution, plasma lipids, and lipoproteins. Arteriosclerosis 1988;8:88-94.
8. Peiris AN, Sothmann MS, Hoffmann RG, Hennes MI, Wilson CR, Gustafson AB, et al. Adiposity, fat distribution, and cardiovascular risk. Ann Intern Med 1989;110:867-872.
9. Haffner SM, Stern MP, Hazuda HP, Pugh J, Patterson JK. Do upper-body and centralized adiposity measure different aspects of regional body-fat distribution? Relationship to non-insulin-dependent diabetes mellitus, lipids, and lipoproteins. Diabetes 1987;36:43-51.
10. Raison J, Guy-Grand B. Body fat distribution in obese hypertensives. In: Vague J, Bjorntorp P, Guy-Grand B, Rebuffl-Scrive M, Vague P, eds. Metabolic complications of human obesities. Amsterdam: Exerpla Medica, 1985:67-76.
11. Freedman DS, Jacobsen SJ, Barboriak JJ, Sobocinski KA, Anderson AJ, Kissebah AH, et al. Body fat distribution and male/female differences in lipids and lipoproteins. Circulation 1990;81:1498-1506.
12. Gaal L van, Vansant G, Campenhout C van, Lepoutre L, Leeuw I de. Apolipoprotein concentrations in obese subjects with upper and lower body fat mass distribution. Int J Obesity 1989;13:255-263.
13. Barakat HA, Burton DS, Carpenter JW, Holbert D, Israel RG. Body fat distribution, plasma lipoproteins and the risk of coronary heart disease of male subjects. Int J Obesity 1988;12:473-480.
14. Seidell JC, Cigolini M, Deslypere J-P, Charzewska J, Ellsinger B-M, Cruz A. Body fat distribution in relation to serum lipids and blood pressure in 38-year-old European men: the European fat distribution study. Atherosclerosis 1991;86:251-260.
15. Foster CJ, Weinsier RL, Birch R, Norris DJ, Bernstein RS, Wang J, et al. Obesity and serum lipids: an evaluation of the relative contribution of body fat and fat distribution to lipid levels. Int J Obesity 1987;11:151-161.
16. Evans DJ, Hoffmann RG, Kalkhoff RK, Kissebah AH. Relationship of body fat topography to insulin sensitivity and metabolic profiles in premenopausal women. Metabolism 1984;33:68-75.
17. Seidell JC, Cigolini M, Charzewska J, Ellsinger B-M, Biase GD, Bjorntorp P, et al. Indicators of fat distribution, serum lipids, and blood pressure in European women born in 1948 -the European fat distribution study. Am J Epidemiol 1989;130:53-65.
18. Terry RB, Stefanick ML, Haskell WL, Wood PD. Contributions of regional adipose tissue depots to plasma lipoprotein concentrations in overweight men and women: possible protective effects of thigh fat. Metabolism 1991;40:733-740.
19. Fujioka S, Matsuzawa Y, Tokunaga K, Tarui S. Contribution of intra-abdominal fat accumulation to the impairment of glucose and lipid metabolism in human obesity. Metabolism 1987;36:54-59.
20. Krotkiewski M, Bjorntorp P, Sjostrom L, Smith U. Impact of obesity on metabolism in men and women. J Clin Invest 1983;72:1150-1162.
21. Stamford BA, Matter S, Fell RD, Sady S, Cresanta MK, Papanek P. Cigarette smoking, physical activity, and alcohol consumption: relationship to blood lipids and lipoproteins in premenopausal females. Metabolism 1984;33:585-590.
22. Friedman CI, Falko JM, Patel ST, Kim MH, Newman HAI, Barrows H. Serum lipoprotein responses during active and stable weight reduction in reproductive obese females. J Clin Endocrinol Metab 1982;55:258-262.
23. Sopko G, Leon AS, Jacobs DR, Foster N, Moy J, Kuba K, et al. The effects of exercise and weight loss on plasma lipids in young obese men. Metabolism 1985;34:227-236.
24. Knopp RH, Walden CE, Wahl PW, Hoover JJ, Warnick GR, Albers JJ, et al. Oral contraceptive and postmenopausal estrogen effects on lipoprotein triglyceride and cholesterol in an adult female population: relationships to estrogen and progestin potency. J Clin Endocrinol Metab 1981;53:1123-1132.
33
Chapter 2
25. Seidell JC, Mensink RP, Katan MB. Measures of fat distribution as determinants of serum lipids in healthy volunteers consuming a uniform standardized diet. Eur J Clin Invest 1988;18:243-249.
26. Bjorntorp P. "Portal* adipose tissue as a generator of risk factors for cardiovascular disease and diabetes. Arteriosclerosis 1990;10:493-496.
27. Weststrate JA, Hautvast JGAJ. The effects of short-term carbohydrate overfeeding and prior exercise on resting metabolic rate and diet-induced thermogenesis. Metabolism 1990;39:1232-1239.
28. Commissie UCV. UCV tabel. The Hague/The Netherlands: Voorlichtingsbureau voor de Voeding, 1985. 29. Siedel J, Hagele EO, Ziegenhorn J, Wahlefeld AW. Reagent for the enzymatic determination of serum total cholesterol with
improved lipolytic efficiency. Clin Chem 1983;29:1075-1080.
30. Warnick GR, Benderson J, Albers JJ. Dextran sulfate-Mg^ + precipitation procedure for quantitation of high-density-lipoprotein cholesterol. Clin Chem 1982;28:1379-1388.
31. Sullivan DR, Kruijswijk Z, West CE, Kohlmeier M, Katan MB. Determination of serum triglycerides by an accurate enzymatic method not affected by free glycerol. Qin Chem 1985;31:1227-1228.
32. Friedewald WT, Levy RI, Fredrickson RS. Estimation of the concentration of low-density lipoprotein cholesterol in plasma, without use of the preparative ultracentrifuge. Clin Chem 1972;18:499-502.
33. Comroe JH, Forster RE, Dubois AB, Briscoe WA, Carlsen E, eds. The lung -clinical physiology and pulmonary function tests. Chicago: Year Book Medical Publishers, 1977.
34. Siri WE. The gross composition of the body. In: Tobias CA, Lawrence JH, eds. Advances in biological and medical physics IV. New York: The Academic Press, 1956:239-280.
35. Pace N, Rathbun EN. Studies on body composition III. The body water and chemically combined nitrogen content in relation to fat content. J Biol Chem 1945;158:685-691.
36. Seidell JC, Bakker CJG, Kooy K van der. Imaging techniques for measuring adipose-tissue distribution -a comparison between computed tomography and 1.5-T magnetic resonance. Am J Qin Nutr 1990;51:953-957.
37. Kleinbaum DG, Kupper LL, Muller KE, eds. Applied regression analysis and other multivariable methods. Boston: PWS-KENT Publishing Company, 1988.
38. Despres J-P. Obesity and lipid metabolism: relevance of body fat distribution. Current opinion in Lipidology 1991;2:5-15. 39. Despres J-P, Allard C, Tremblay A, Talbot J, Bouchard C Evidence for a regional component of body fatness in the association
with serum lipids in men and women. Metabolism 1985;34:967-973.
40. Despres J-P, Moorjani S, Lupien PJ, Tremblay A, Nadeau A, Bouchard C. Regional distribution of body fat, plasma lipoproteins, and cardiovascular disease. Arteriosclerosis 1990;10:497-511.
41. Applebaum-Bowden D, Haffner SM, Hazzard WR. The dyslipoproteinemia of anabolic steroid therapy: increase in hepatic triglyceride lipase precedes the decrease in high density lipoprote^ cholesterol. Metabolism 1987;36:949-952.
42. Evans DJ, Hoffmann RG, Kalkhoff RK, Kissebah AH. Relationship of androgenic activity to body fat topography, fat cell morphology, and metabolic aberrations in premenopausal women. J Qin Endocrinol Metab 1983;57:304-310.
43. Seidell JC, Bjorntorp P, Sjostrom L, Kvist H, Sannerstedt R. Visceral fat accumulation in men is positively associated with insulin, glucose, and C-peptide levels, but negatively with testosterone levels. Metabolism 1990;39:897-901.
34
CHAPTER 3
VISCERAL FAT ACCUMULATION IN OBESE SUBJECTS: RELATION TO ENERGY EXPENDITURE AND RESPONSE TO WEIGHT LOSS*
Rianne Leenen, Karin van der Kooy, Paul Deurenberg, Jaap C. Seidell, Jan A Weststrate, Frans J.M. Schouten and Joseph G-A.J. Hautvast
ABSTRACT
Seventy-eight healthy obese subjects, 40 premenopausal women and 38 men aged 27-51 yr received a 4.2 MJ/day energy-deficit diet for 13 wk. Resting metabolic rate (RMR) and diet-induced thermogenesis (DIT) were measured by indirect calorimetry. Abdominal subcutaneous and visceral fat areas were calculated from magnetic resonance imaging scans before and after weight loss. Before weight loss, visceral fat accumulation was positively correlated with higher levels of RMR (p<0.05) and DIT (p<0.01) in women but not in men. The mean weight reduction was 12.2 ± 3.5 kg (mean ± SD). In men but not in women, an initially large visceral fat depot was associated with a reduced loss of weight and total fat mass (p<0.05). Within each sex, an initial abundance of visceral fat was significantly related to a larger loss of visceral fat (p< 0.001) and in men to a smaller loss of subcutaneous fat (p < 0.05). These results suggest that there may be gender differences in the associations between visceral fat accumulation and components of energy expenditure (RMR and DIT) in obese subjects. Obese subjects with an initial abundance of visceral fat do not lose more body weight but more visceral fat than subjects with less visceral fat.
INTRODUCTION
Obesity is one of the most prevalent nutritional problems in affluent societies and is often treated by energy intake restriction. Obese subjects can be classified according to types of body fat distribution (1). The distribution of fat independently of the degree of obesity is related to several metabolic disorders (2). Several investigators reported that
* American Journal of Physiology: Endocrinology & Metabolism 1992;263(26):E913-E919.
35
Chapter 3
it is easier for people with abdominal obesity to lose weight when energy intake is restricted than it is for obese subjects with a gluteal-femoral type of fat distribution (3-5). These findings could have important consequences for weight reduction therapy of obesity. Other investigators did, however, not confirm this (6-9). Contradictions between the results of these studies may be explained by differences in study population or by differences in methodology and experimental design.
In addition, the results of the studies in which the relations between body fat distribution and components of energy expenditure such as resting metabolic rate (RMR) and diet-induced thermogenesis (DIT) were examined also yielded contradictory results (9-14). Adipose tissue distribution was, in most studies, measured by the waist/hip ratio, which does not allow one to distinguish between the various abdominal fat depots, something which is possible with imaging techniques (15). To our knowledge, only one cross-sectional study has been carried out in obese men (12). Currently, only in the study of den Besten et al. (9) has the relation between waist/hip ratio and energy expenditure been prospectively investigated before and after weight loss in a limited number of obese women (« = 15).
In the present study, the influence of body fat distribution on the degree of weight reduction and the components of energy expenditure (RMR and DIT) were determined before and after a standardized energy-deficit diet in 78 healthy obese men and premenopausal women. Magnetic resonance imaging was used to assess body fat distribution.
MATERIAL AND METHODS
Subjects Participants were recruited by means of advertisements in local newspapers. Ninety-six obese subjects (48 women and 48 men) were selected on the basis of their body mass index (between 28 and 38 kg/m2), age (between 25 and 51 yr), premenopausal state, smoking behavior (<5 cigarettes/day), and drinking behavior (<2 alcoholic consumptions/day). All subjects were apparently healthy, as evaluated by a medical history and physical examination. None of the volunteers received any medication known to affect the variables measured, and the women did not use oral contraceptives. None of the subjects had been on a slimming diet for several months before the study. Within each sex, abdominal and gluteal-femoral obese subjects, based on the waist/hip ratio, were matched for age and body mass index.
Fourteen subjects did not complete the dietary treatment successfully (4 due to intercurrent illness, 6 for personal reasons, and 4 were excluded because of suspicion of bad compliance). In addition, data of 4 subjects were also excluded because 2 subjects
36
Visceral fat, energy expenditure and weight loss
were later diagnosed as having subclinical hypothyroidism, and 2 were later found to have severe fasting hyperinsulinemia (> 100 jiU/mL). Results of 78 subjects (40 women and 38 men) remained for statistical analysis.
The study was carried out with the approval of the Medical Ethical Committee of the Department of Human Nutrition of the Wageningen Agricultural University. The procedures had been fully explained to the volunteers. All subjects gave their written informed consent.
Experimental design and diet After 3 wk on a weight-stable diet, baseline measurements were performed to determine body composition, body fat distribution, blood parameters, and energy expenditure. The diets were individually tailored to meet each person's energy requirement, which was estimated from RMR and physical activity pattern, as described by Weststrate and Hautvast (16). Body weights were recorded two times a week by the subjects, and energy intakes were adjusted individually, if necessary, to prevent weight changes. Some of the subjects remained on a weight-stable diet up until 7 wk before the weight loss treatment started. In these subjects, the assessment of body composition, waist/hip ratio, and energy expenditure was repeated at the end of this weight-stable period. The weight-stable period was followed by a weight reduction period of 13 wk during which the subjects received a 4.2 MJ/day energy-deficit diet. The energy-deficit diet consisted of 25 energy percent (en%) protein, 33 en% fat (11 en% saturated fatty acids, 11 en% monounsaturated fatty acids, 11 en% polyunsaturated fatty acids), and 42 en% carbohydrates. Individual energy deficits were based on estimated daily energy requirements at the end of the weight-stable period. After the energy-deficit period the subjects were given a diet for 3 wk to maintain the new achieved body weight. At the end of this period, measurements of body composition, fat distribution, and energy expenditure were repeated. Ninety-five energy percent of the food in each dietary period was supplied to the volunteers. The participants were allowed to choose a limited number of food items, free of fat and cholesterol, which provided a fixed amount of 5% of the total daily energy intake. The weight-stable diets consisted of conventional foods, whereas the energy-deficit diet was a combination of slimming products and conventional foods. The nutrient composition of the individual diets was calculated using the 1985 edition of the Dutch computerized food table (17).
The subjects were instructed to maintain their habitual physical activity pattern and smoking habits during the study period. They were asked to record any sign of illness, deviations of diet, medication used, free item choice, and changes in both smoking and activity patterns in a diary. Compliance of the diet was checked by weight control and meetings with trained dieticians every fortnight.
37
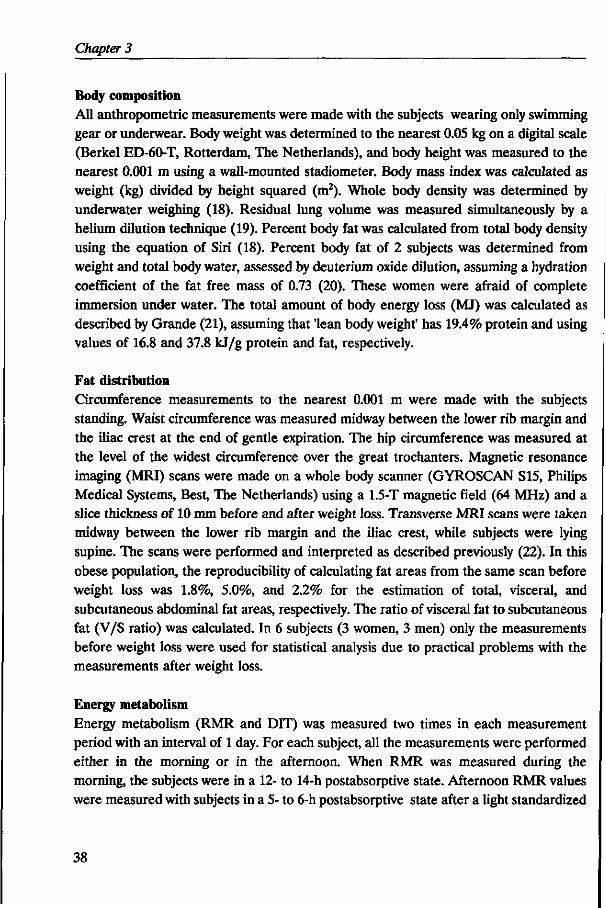
Chapter 3
Body composition All anthropometric measurements were made with the subjects wearing only swimming gear or underwear. Body weight was determined to the nearest 0.05 kg on a digital scale (Berkel ED-60-T, Rotterdam, The Netherlands), and body height was measured to the nearest 0.001 m using a wall-mounted stadiometer. Body mass index was calculated as weight (kg) divided by height squared (m2). Whole body density was determined by underwater weighing (18). Residual lung volume was measured simultaneously by a helium dilution technique (19). Percent body fat was calculated from total body density using the equation of Siri (18). Percent body fat of 2 subjects was determined from weight and total body water, assessed by deuterium oxide dilution, assuming a hydration coefficient of the fat free mass of 0.73 (20). These women were afraid of complete immersion under water. The total amount of body energy loss (MJ) was calculated as described by Grande (21), assuming that 'lean body weight' has 19.4% protein and using values of 16.8 and 37.8 kj/g protein and fat, respectively.
Fat distribution Circumference measurements to the nearest 0.001 m were made with the subjects standing. Waist circumference was measured midway between the lower rib margin and the iliac crest at the end of gentle expiration. The hip circumference was measured at the level of the widest circumference over the great trochanters. Magnetic resonance imaging (MRI) scans were made on a whole body scanner (GYROSCAN S15, Philips Medical Systems, Best, The Netherlands) using a 1.5-T magnetic field (64 MHz) and a slice thickness of 10 mm before and after weight loss. Transverse MRI scans were taken midway between the lower rib margin and the iliac crest, while subjects were lying supine. The scans were performed and interpreted as described previously (22). In this obese population, the reproducibility of calculating fat areas from the same scan before weight loss was 1.8%, 5.0%, and 2.2% for the estimation of total, visceral, and subcutaneous abdominal fat areas, respectively. The ratio of visceral fat to subcutaneous fat (V/S ratio) was calculated. In 6 subjects (3 women, 3 men) only the measurements before weight loss were used for statistical analysis due to practical problems with the measurements after weight loss.
Energy metabolism Energy metabolism (RMR and DIT) was measured two times in each measurement period with an interval of 1 day. For each subject, all the measurements were performed either in the morning or in the afternoon. When RMR was measured during the morning, the subjects were in a 12- to 14-h postabsorptive state. Afternoon RMR values were measured with subjects in a 5- to 6-h postabsorptive state after a light standardized
38
Visceral fat, energy expenditure and weight loss
breakfast of <2 MJ. The subjects were instructed to refrain from sleeping, drinking coffee, and strenuous physical activity in the morning before the afternoon tests. Previous research from our laboratory showed that there are no differences in RMR and DIT when the same subjects are measured in the morning and afternoon (23). Furthermore, in the present study there were no differences between the subjects who were measured in the morning and in the afternoon with respect to fat distribution (neither waist/hip ratio nor visceral and subcutaneous fat). On the day of each measurement the participants were taken to the laboratory by car. After voiding, they lay supine but awake and practically motionless on a hospital bed. After a rest period of 15 min, RMR was measured continuously during 45 min. After the RMR measurement the subjects ingested a standardized liquid test meal through a straw within 5 min. According to duplicate chemical analysis the test meal had an energy content of 1,520 kJ and consisted of 12.4 en% protein, 31.5 en% total fat, and 56.1 en% carbohydrates. Postprandial energy expenditure (PEE) was measured continuously for 3 hours after consuming the test meal. During the energy measurements the subjects watched video films and were asked to relax. The cumulative postprandial increase above the RMR over 3 hours was defined as the DIT (DIT=PEE-RMR). The DIT (kJ/min) is expressed in absolute terms, as a percentage of the increase over RMR, and as a percentage of the metabolizable energy content of the test meal. In this study, the within-person day-to-day coefficient of variation for the RMR measurements before weight loss was on average 4.3% for women and 4.0% for men. For the DIT measurements the within-person day-to-day variation coefficients before weight loss were 25.4% and 26.4%, respectively.
Gas exchange measurements RMR and PEE measurements were performed by use of an open-circuit ventilated hood system as previously described (24). During each measurement, a pump (Ocean SCL210, Dieren, The Netherlands) drew fresh outside air through the transparent hood. The flow rate through the hood was measured by a thermal mass flowmeter (Brooks 5812N, Veenendaal, The Netherlands) and was maintained at 40 L/min by an electrically operated control valve (Brooks 5837, Veenendaal, The Netherlands). Oxygen (02) and carbon dioxide (C02) content of the expired air were continuously analyzed by, respectively, a paramagnetic 0 2 analyzer (Servomex 1100A, Zoetermeer, The Netherlands) and an infrared COz analyzer (Servomex 1410, Zoetermeer, The Netherlands). Before each measurement, calibration was performed with calibrated dried standard gasses. Every hour during the energy measurements, 0 2 and C02 concentrations in dried filtered outside air were measured. The outputs from the gas analyzers were continuously recorded with a multipen recorder (Kipp and Zonen BD101, Delft, The Netherlands). C02 production and 0 2 consumption were subsequently calculated as mean
39
Chapter 3
values for each 2-min interval period with the Haldane correction (24). The metabolic rate was calculated according to the equation described by Weir (25). Movements of the participant during the measurement were recorded by a load cell (Tokyo Sokki Kenkyujo TKA-200A, Tokyo, Japan) under the hospital bed and were also registrated by the multipen recorder as an index value. If high 0 2 consumption and C02 production values appeared in combination with a high body movement index (corresponding to shifting the body on the bed), these values were excluded. Values were also excluded when the subjects needed to visit the lavatory. The invalid values during the DIT measurement were replaced by the mean of the 2 preceding and the 2 following values. Less than 4% of the recorded values had to be corrected per measurement session, so the impact on the RMR and DIT levels was negligible.
Blood parameters Two blood samples were taken with an interval of 2 days after an overnight fast. The mean value of the 2 samples was used for statistical analyses. Serum total cholesterol, high-density-lipoprotein (HDL) cholesterol, and triglyceride levels were measured as previously described (26). Glucose levels were determined enzymatically (Abbott b.v., Amstelveen, The Netherlands), and insulin was analyzed in one blood sample in duplicate using the enzyme-linked immunoabsorbent assay method (Boehringer Mannheim GmbH, Almere, The Netherlands). The insulin/glucose ratio was calculated as an index of insulin sensitivity.
Statistical methods The distributions of triglycerides, insulin, the insulin/glucose ratio, visceral fat, the V/S ratio and the change in visceral fat were slightly skewed. Therefore, natural logarithmic transformed values for these variables were used in statistical analyses. However, no transformation for change in visceral fat was used, because this resulted in findings principally identical to analyses based on normally distributed variables. Differences in variables before and after the dietary treatment were tested using the Student's paired r-test. Pearson's product-moment correlations and partial correlation coefficients were computed within each sex using univariate and multiple linear regression techniques. Differences between equations of men and women were tested for differences in slopes and intercepts by the method described by Kleinbaum et al. (27). Correlations were tested for equality using the Fisher's z transformation (27). Two-sided p-values were considered statistically significant at p< 0.05. Results are expressed as means ± standard deviation (SD).
40
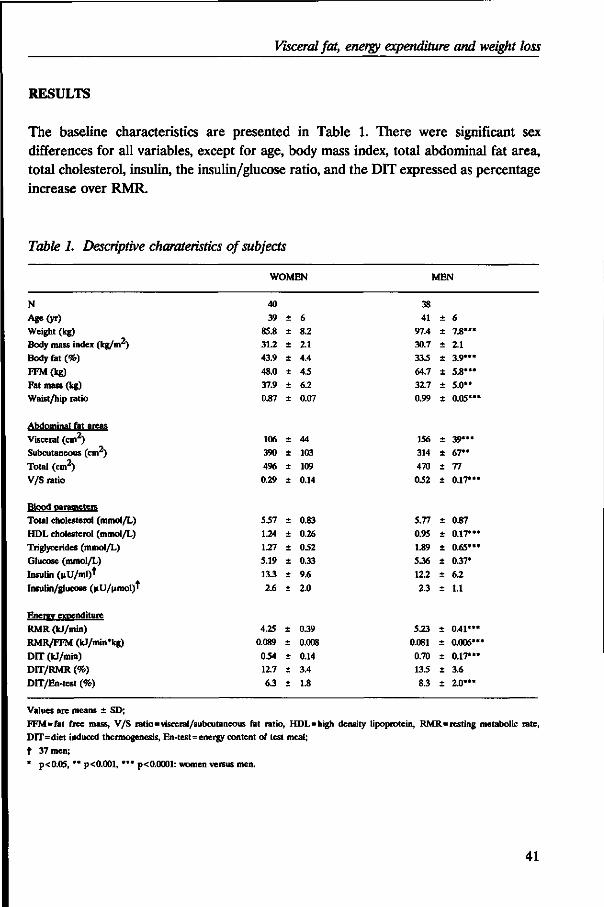
Visceral fat, energy expenditure and weight loss
RESULTS
The baseline characteristics are presented in Table 1. There were significant sex differences for all variables, except for age, body mass index, total abdominal fat area, total cholesterol, insulin, the insulin/glucose ratio, and the DIT expressed as percentage increase over RMR.
Table 1. Descriptive charateristics of subjects
WOMEN MEN
N Age(yr) Weight (kg) Body mass index (kg/m2) Body fat (%)
FFM(kg) Fat mass (kg) Waist/hip ratio
Abdominal fat areas Visceral (cm ) Subcutaneous (cm2) Total (cm2) V/S ratio
Blood parameters Total cholesterol (mmol/L) HDL cholesterol (mmol/L) Triglycerides (mmol/L) Glucose (mmol/L) Insulin (uU/ml)t Insulin/glucose (uU/umol)'
Energy expenditure RMR (kJ/min) RMR/FFM (kJ/min'kg) DIT (kJ/min) DIT/RMR (%)
DIT/En-test (%)
40 39
85.8 31.2 43.9
48.0 37.9 0.87
106 390
496 0.29
5.57
1.24
1.27 5.19 13.3
2.6
4.25 0.089
0.54 12.7
6.3
± ± +
+
+
± +
+
+
+
-
+
± +
± +
±
+
± ± ± +
6 8.2 2.1 4.4
45
6.2 0.07
44 103
109
0.14
0.83
0.26 0.52 0.33
9.6
2.0
0.39
0.008
0.14 3.4
1.8
38 41
97.4 30.7 33.5
64.7 32.7 0.99
156 314
470
0.52
5.77
0.95 1.89 5.36
12.2
2.3
5.23 0.081
0.70 13.5
8.3
+
+
± ± +
+
+
+
+
+
±
+
± +
+
+
±
^ ± ± ± +
6 7.8»«* 2.1 3.9***
5.8*** 5.0" 0.05*"
39*** 67** 77
0.17***
0.87
0.17*** 0.65*** 0.37*
6.2
1.1
0.41*** 0.006**
0.17*** 3.6
2.0***
Values are means ± SD; FFM=fat free mass, V/S ratio=visceral/subcutaneous fat ratio, HDL=high density lipoprotein, RMR=resting metabolic rate, DIT=diet induced thermogenesis, En-test=energy content of test meal;
t 37 men; * p<0.05, ** p<0.001, *** p<0.0001: women versus men.
41
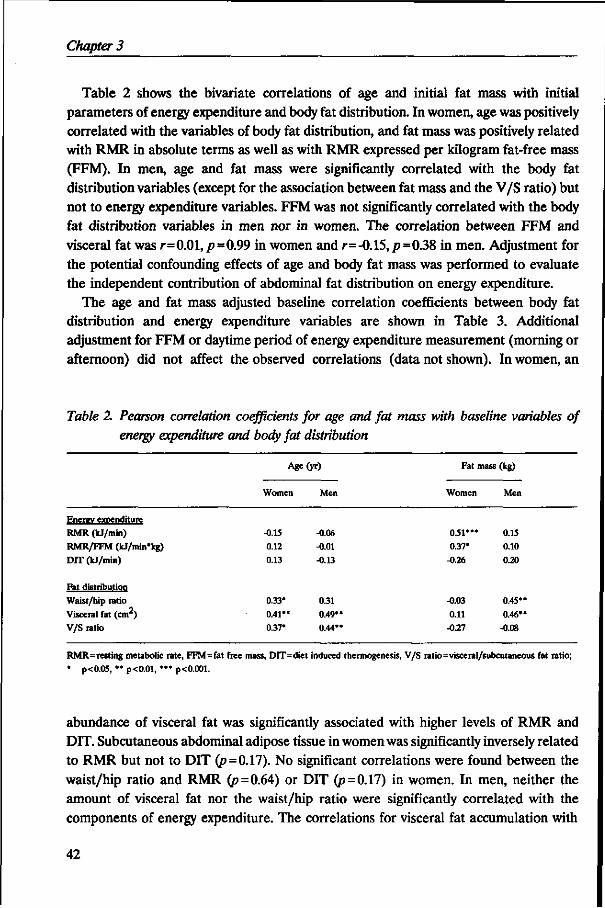
Chapter 3
Table 2 shows the bivariate correlations of age and initial fat mass with initial parameters of energy expenditure and body fat distribution. In women, age was positively correlated with the variables of body fat distribution, and fat mass was positively related with RMR in absolute terms as well as with RMR expressed per kilogram fat-free mass (FFM). In men, age and fat mass were significantly correlated with the body fat distribution variables (except for the association between fat mass and the V/S ratio) but not to energy expenditure variables. FFM was not significantly correlated with the body fat distribution variables in men nor in women. The correlation between FFM and visceral fat was r=0.01,p=0.99 in women and r=-0.15,/>=0.38 in men. Adjustment for the potential confounding effects of age and body fat mass was performed to evaluate the independent contribution of abdominal fat distribution on energy expenditure.
The age and fat mass adjusted baseline correlation coefficients between body fat distribution and energy expenditure variables are shown in Table 3. Additional adjustment for FFM or daytime period of energy expenditure measurement (morning or afternoon) did not affect the observed correlations (data not shown). In women, an
Table 2. Pearson correlation coefficients for age and fat mass with baseline variables of energy expenditure and body fat distribution
Age(yr)
Enerev expenditure RMR (kJ/min)
RMR/FFM (IcJ/min'kg) D1T (kJ/min)
Fat distribution
Waist/hip ratio
Visceral fat (cm ) V/S ratio
Women
-0.15 0.12
0.13
0.33*
0.41" 0.37*
Men
-0.06
-0.01 -0.13
0.31
0.49' 0.44*
Fat mass
Women
05V
0.37* -0.26
-0.03
0.11 -0.27
(kg)
Men
0.15 0.10
0.20
0.45*
0.46* -0.08
RMR=resting metabolic rate, FFM=fat free mass, DIT=diet induced thermogenesis, V/S ratio=visceral/subcutaneous fat ratio;
* p<0.05, ** p<0.01, •** p<0.001.
abundance of visceral fat was significantly associated with higher levels of RMR and DIT. Subcutaneous abdominal adipose tissue in women was significantly inversely related to RMR but not to DIT (p=0.17). No significant correlations were found between the waist/hip ratio and RMR (p = 0.64) or DIT (p=0.17) in women. In men, neither the amount of visceral fat nor the waist/hip ratio were significantly correlated with the components of energy expenditure. The correlations for visceral fat accumulation with
42
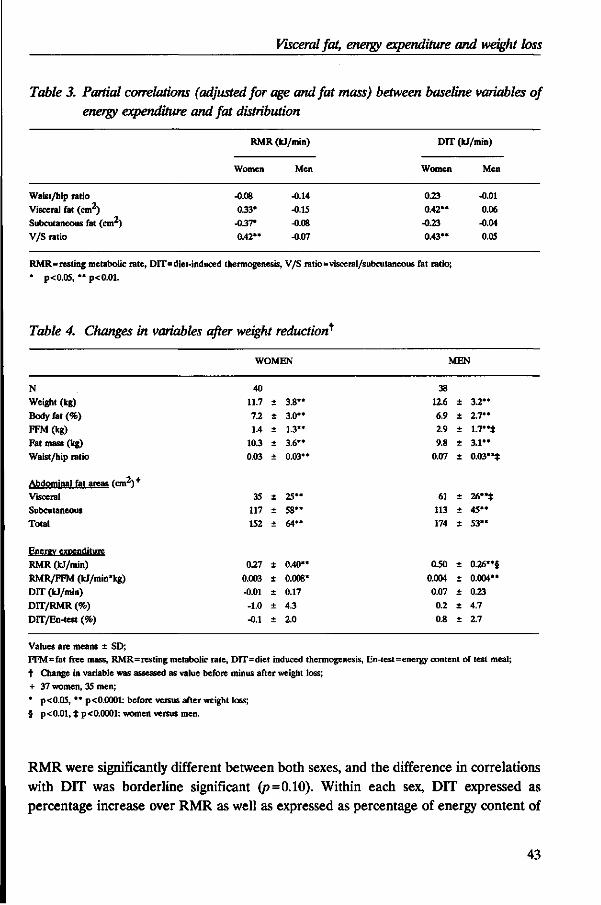
Visceral fat, energy expenditure and weight loss
Table 3. Partial correlations (adjusted for age and fat mass) between baseline variables of energy expenditure and fat distribution
RMR (kJ/min)
Women
-0.08 0.33*
-0.37*
0.42**
Men
-0.14
-0.15
-0.08 -0.07
DIT (kJ/min)
Women
0.23
0.42" -0.23
0.43"
Men
-0.01
0.06 -0.04
0.05
Waist/hip ratio Visceral fat (cm ) Subcutaneous fat (cm2) V/S ratio
RMR=resting metabolic rate, DIT=diet-induced thermogenesis, V/S ratio=visceral/subcutaneous fat ratio;
* p<0.05, " p<0.01.
Table 4. Changes in variables after weight reduction^
WOMEN MEN
N Weight (kg)
Body fat (%) FFM(kg) Fat mass (kg)
Waist/hip ratio
Abdominal fat areas (cnv*)+
Visceral Subcutaneous Total
Energy expenditure
RMR (kJ/min)
RMR/FFM (kJ/min*kg)
DIT (kJ/min)
DIT/RMR (%)
DTT/En-test (%)
11.7
7.2 1.4
10.3 0.03
35 117 152
0.27
0.003 -0.01
-1.0
-0.1
+
t
±
±
±
±
+
+
+
±
+
+
±
3.8"
3.0"
1.3" 3.6"
0.03*
25"
5 8 " 64"
0.40*
0.008 0.17
4.3
2.0
38 12.6 ± 3.2**
6.9 ± 2.7" 2.9 ± 1.7"*
9.8 ± 3 .1" 0.07 ± 0.03"*
61 ± 26"* 113 ± 4 5 " 174 ± 5 3 "
0.50 ± 0.26"§
0.004 ± 0.004"
0.07 ± 0.23
0.2 ± 4.7
0.8 ± 2.7
Values are means ± SD; FFM=fat free mass, RMR=resting metabolic rate, DIT=diet induced thermogenesis, En-test=energy content of test meal; t Change in variable was assessed as value before minus after weight loss; + 37 women, 35 men;
* p<0.05, " p< 0.0001: before versus after weight loss; § p<0.01, t p<0.0001: women versus men.
RMR were significantly different between both sexes, and the difference in correlations with DIT was borderline significant (p = 0.10). Within each sex, DIT expressed as percentage increase over RMR as well as expressed as percentage of energy content of
43
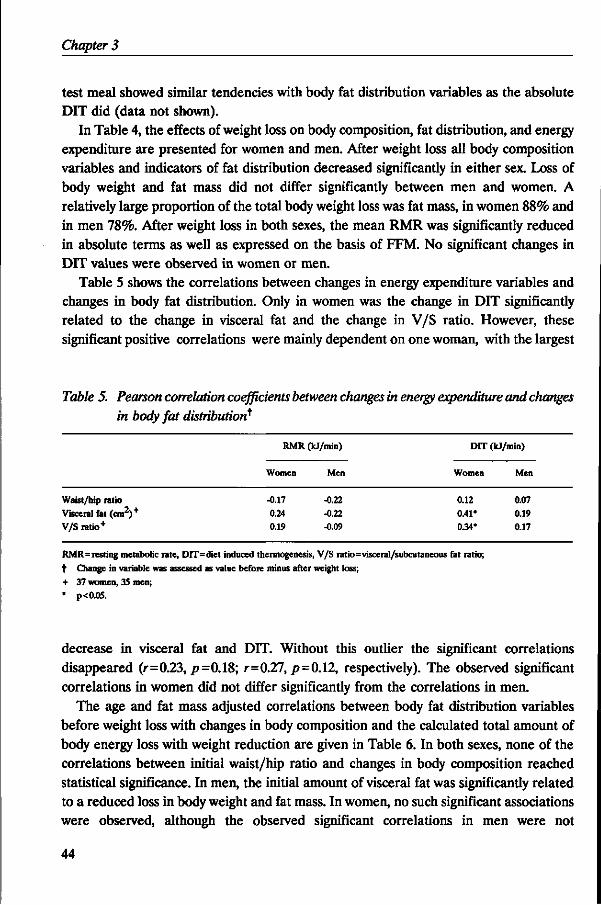
Chapter 3
test meal showed similar tendencies with body fat distribution variables as the absolute DIT did (data not shown).
In Table 4, the effects of weight loss on body composition, fat distribution, and energy expenditure are presented for women and men. After weight loss all body composition variables and indicators of fat distribution decreased significantly in either sex. Loss of body weight and fat mass did not differ significantly between men and women. A relatively large proportion of the total body weight loss was fat mass, in women 88% and in men 78%. After weight loss in both sexes, the mean RMR was significantly reduced in absolute terms as well as expressed on the basis of FFM. No significant changes in DIT values were observed in women or men.
Table 5 shows the correlations between changes in energy expenditure variables and changes in body fat distribution. Only in women was the change in DIT significantly related to the change in visceral fat and the change in V/S ratio. However, these significant positive correlations were mainly dependent on one woman, with the largest
Table 5. Pearson correlation coefficients between changes in energy expenditure and changes in body fat distribution*
Waist/hip ratio Visceral fat (cm2)+
V/S ratio+
RMR (kJ/min)
Women
-0.17 0.24 0.19
Men
-0.22 -0.22 -0.09
DIT (kJ/min)
Women Men
0.12 0.07 0.41' 0.19 0.34* 0.17
RMR=resting metabolic rate, DIT=diet induced thermogenesis, V/S ratio=visceral/subcutaneous fat ratio;
t Change in variable was assessed as value before minus after weight loss;
+ 37 women, 35 men;
• p<0.05.
decrease in visceral fat and DIT. Without this outlier the significant correlations disappeared (r=0.23, p=0.18; r=0.27, p=0.12, respectively). The observed significant correlations in women did not differ significantly from the correlations in men.
The age and fat mass adjusted correlations between body fat distribution variables before weight loss with changes in body composition and the calculated total amount of body energy loss with weight reduction are given in Table 6. In both sexes, none of the correlations between initial waist/hip ratio and changes in body composition reached statistical significance. In men, the initial amount of visceral fat was significantly related to a reduced loss in body weight and fat mass. In women, no such significant associations were observed, although the observed significant correlations in men were not
44
Visceral fat, energy expenditure and weight loss
significantly different from the correlations in women. Within each sex, the correlations between the various indicators of fat distribution with changes in body fat mass were comparable to those with the calculated amount of body energy losses due to the high relationship between loss of fat mass and the amount of body energy loss in both sexes (r=0.999, p< 0.0001).
Table 6. Partial correlations between fat distribution variables before weight loss (adjusted for age and fat mass) with changes in body composition and calculated amount of body energy loss^
Initial parameters
WOMEN
Waist/hip ratio
Visceral fat (cm2) V/S ratio
MEN
Waist/hip ratio Visceral fat (cm ) V/S ratio
Body weight (kg)
0.02
-0.10
-0.26
0.05
-0.34' -0.31
Change in
Fat mass (kg)
-0.14
-0.24
-0.36*
0.07
-0.34* -0.28
Body energy loss* (MJ)
-0.13
-022
-0.35*
0.06
-0.34* -0.28
V/S ratio=visceral/subcutaneous fat ratio; t Change in variable was assessed as value before minus after weight loss; t Body energy loss was calculated according to Grande (21); * p<0.05.
Table 7 shows the partial correlations between fat distribution variables before weight loss (adjusted for age and fat mass) with changes in abdominal fat depots. In both sexes, the initial amount of visceral fat was not significantly related to an increased or reduced loss in the total abdominal fat depot. However, an initially large visceral fat depot and a high initial V/S ratio were significantly associated with a larger loss of visceral fat compared with a smaller loss of subcutaneous abdominal fat. In women, however, the inverse association between initial amount of visceral fat and change in subcutaneous fat did not reach statistical significance (p=0.14). Within both sexes, an initial abundance of visceral fat was not significantly related to neither changes in RMR nor changes in DIT (data not shown).
The unadjusted relationships between initial visceral fat accumulation and loss of visceral fat are illustrated in Figure 1 for the whole study population. The regression lines of men and women did not differ significantly in slope and intercept.
45
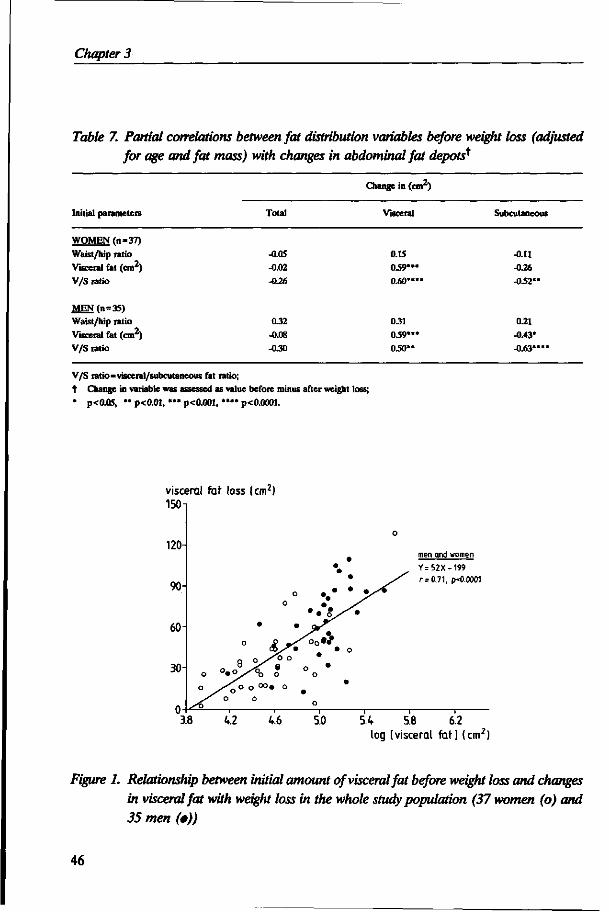
Chapter 3
Table 7. Partial correlations between fat distribution variables before weight loss (adjusted
for age and fat mass) with changes in abdominal fat depots*
Initial parameters Total
Change in (cm2)
Visceral Subcutaneous
WOMEN (n=37) Waist/hip ratio Visceral fat (cm2) V/S ratio
-0.05 -0.02 -0.26
0.15 0.59* 0.60*
-0.11 -0.26 -0.52*
MEN(n = 35) Waist/hip ratio
y
Visceral fat (cm ) V/S ratio
0.32
-0.08
-0.30
0.31 0.59* 0.50*'
0.21
-0.43*
-0.63*
V/S ratio=visceral/subcutaneous fat ratio; t Change in variable was assessed as value before minus after weight loss;
* p<0.05, ** p<0.01, *** p<0.001, **** p<0.0001.
visceral fat loss (cm2) 150
3.8 V2 4.6 5.0
men and women
Y=52X-199
r = 0.71, p-0.0001
5.4 5.8 6.2 log [visceral fat] (cm2)
Figure 1. Relationship between initial amount of visceral fat before weight loss and changes in visceral fat with weight loss in the whole study population (37 women (o) and 35 men (•))
46
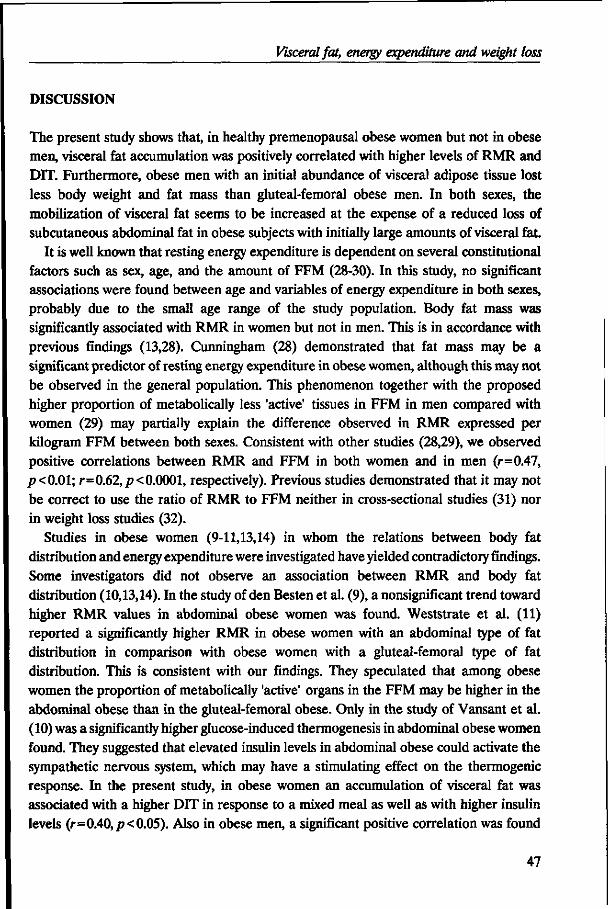
Visceral fat, energy expenditure and weight loss
DISCUSSION
The present study shows that, in healthy premenopausal obese women but not in obese men, visceral fat accumulation was positively correlated with higher levels of RMR and DIT. Furthermore, obese men with an initial abundance of visceral adipose tissue lost less body weight and fat mass than gluteal-femoral obese men. In both sexes, the mobilization of visceral fat seems to be increased at the expense of a reduced loss of subcutaneous abdominal fat in obese subjects with initially large amounts of visceral fat.
It is well known that resting energy expenditure is dependent on several constitutional factors such as sex, age, and the amount of FFM (28-30). In this study, no significant associations were found between age and variables of energy expenditure in both sexes, probably due to the small age range of the study population. Body fat mass was significantly associated with RMR in women but not in men. This is in accordance with previous findings (13,28). Cunningham (28) demonstrated that fat mass may be a significant predictor of resting energy expenditure in obese women, although this may not be observed in the general population. This phenomenon together with the proposed higher proportion of metabolically less 'active' tissues in FFM in men compared with women (29) may partially explain the difference observed in RMR expressed per kilogram FFM between both sexes. Consistent with other studies (28,29), we observed positive correlations between RMR and FFM in both women and in men (r=0.47, /><0.01; r=0.62,p<0.0001, respectively). Previous studies demonstrated that it may not be correct to use the ratio of RMR to FFM neither in cross-sectional studies (31) nor in weight loss studies (32).
Studies in obese women (9-11,13,14) in whom the relations between body fat distribution and energy expenditure were investigated have yielded contradictory findings. Some investigators did not observe an association between RMR and body fat distribution (10,13,14). In the study of den Besten et al. (9), a nonsignificant trend toward higher RMR values in abdominal obese women was found. Weststrate et al. (11) reported a significantly higher RMR in obese women with an abdominal type of fat distribution in comparison with obese women with a gluteal-femoral type of fat distribution. This is consistent with our findings. They speculated that among obese women the proportion of metabolically 'active' organs in the FFM may be higher in the abdominal obese than in the gluteal-femoral obese. Only in the study of Vansant et al. (10) was a significantly higher glucose-induced thermogenesis in abdominal obese women found. They suggested that elevated insulin levels in abdominal obese could activate the sympathetic nervous system, which may have a stimulating effect on the thermogenic response. In the present study, in obese women an accumulation of visceral fat was associated with a higher DIT in response to a mixed meal as well as with higher insulin levels (r=0.40,/?<0.05). Also in obese men, a significant positive correlation was found
47
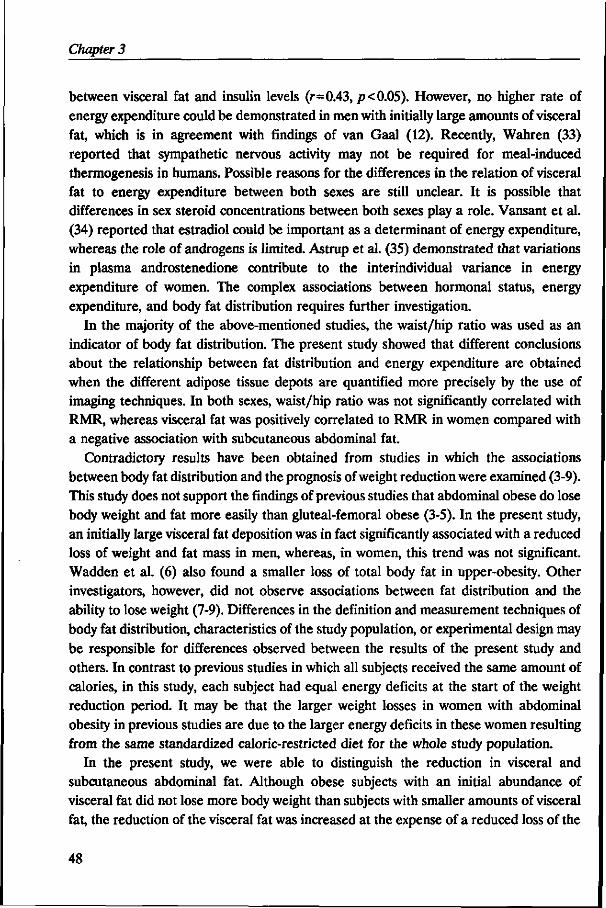
Chapter 3
between visceral fat and insulin levels (r=0.43, p< 0.05). However, no higher rate of energy expenditure could be demonstrated in men with initially large amounts of visceral fat, which is in agreement with findings of van Gaal (12). Recently, Wahren (33) reported that sympathetic nervous activity may not be required for meal-induced thermogenesis in humans. Possible reasons for the differences in the relation of visceral fat to energy expenditure between both sexes are still unclear. It is possible that differences in sex steroid concentrations between both sexes play a role. Vansant et al. (34) reported that estradiol could be important as a determinant of energy expenditure, whereas the role of androgens is limited. Astrup et al. (35) demonstrated that variations in plasma androstenedione contribute to the interindividual variance in energy expenditure of women. The complex associations between hormonal status, energy expenditure, and body fat distribution requires further investigation.
In the majority of the above-mentioned studies, the waist/hip ratio was used as an indicator of body fat distribution. The present study showed that different conclusions about the relationship between fat distribution and energy expenditure are obtained when the different adipose tissue depots are quantified more precisely by the use of imaging techniques. In both sexes, waist/hip ratio was not significantly correlated with RMR, whereas visceral fat was positively correlated to RMR in women compared with a negative association with subcutaneous abdominal fat.
Contradictory results have been obtained from studies in which the associations between body fat distribution and the prognosis of weight reduction were examined (3-9). This study does not support the findings of previous studies that abdominal obese do lose body weight and fat more easily than gluteal-femoral obese (3-5). In the present study, an initially large visceral fat deposition was in fact significantly associated with a reduced loss of weight and fat mass in men, whereas, in women, this trend was not significant. Wadden et al. (6) also found a smaller loss of total body fat in upper-obesity. Other investigators, however, did not observe associations between fat distribution and the ability to lose weight (7-9). Differences in the definition and measurement techniques of body fat distribution, characteristics of the study population, or experimental design may be responsible for differences observed between the results of the present study and others. In contrast to previous studies in which all subjects received the same amount of calories, in this study, each subject had equal energy deficits at the start of the weight reduction period. It may be that the larger weight losses in women with abdominal obesity in previous studies are due to the larger energy deficits in these women resulting from the same standardized caloric-restricted diet for the whole study population.
In the present study, we were able to distinguish the reduction in visceral and subcutaneous abdominal fat. Although obese subjects with an initial abundance of visceral fat did not lose more body weight than subjects with smaller amounts of visceral fat, the reduction of the visceral fat was increased at the expense of a reduced loss of the
48
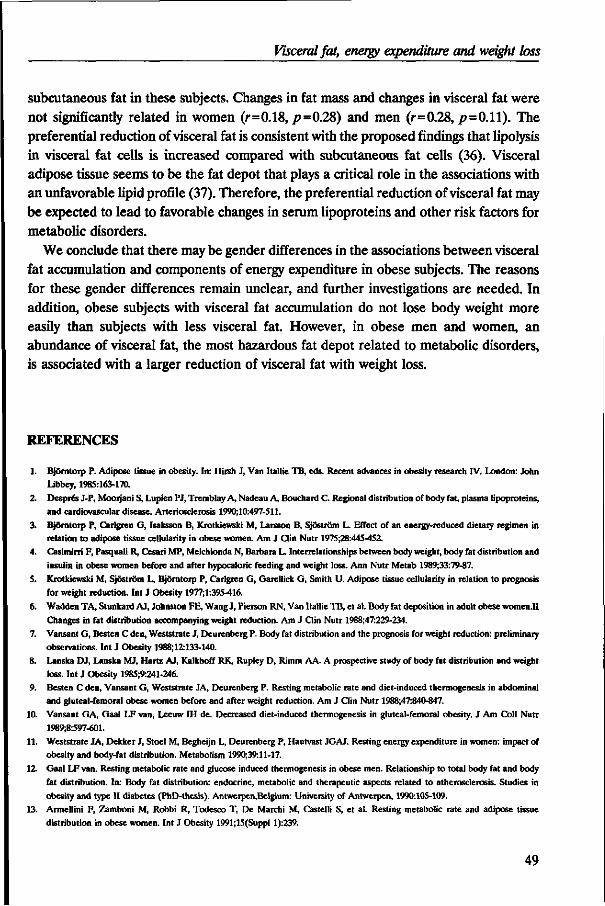
Visceral fat, energy expenditure and weight loss
subcutaneous fat in these subjects. Changes in fat mass and changes in visceral fat were not significantly related in women (r=0.18, /?=0.28) and men (r=0.28, /?=0.11). The preferential reduction of visceral fat is consistent with the proposed findings that lipolysis in visceral fat cells is increased compared with subcutaneous fat cells (36). Visceral adipose tissue seems to be the fat depot that plays a critical role in the associations with an unfavorable lipid profile (37). Therefore, the preferential reduction of visceral fat may be expected to lead to favorable changes in serum lipoproteins and other risk factors for metabolic disorders.
We conclude that there may be gender differences in the associations between visceral fat accumulation and components of energy expenditure in obese subjects. The reasons for these gender differences remain unclear, and further investigations are needed. In addition, obese subjects with visceral fat accumulation do not lose body weight more easily than subjects with less visceral fat. However, in obese men and women, an abundance of visceral fat, the most hazardous fat depot related to metabolic disorders, is associated with a larger reduction of visceral fat with weight loss.
REFERENCES
1. Bjorntorp P. Adipose tissue in obesity. In: Hirsh J, Van Itallie TB, eds. Recent advances in obesity research IV. London: John Libbey, 1985:163-170.
2. Despres J-P, Moorjani S, Lupien PJ, Tremblay A, Nadeau A, Bouchard C. Regional distribution of body fat, plasma lipoproteins, and cardiovascular disease. Arteriosclerosis 1990;10:497-511.
3. Bjdrntorp P, Carlgren G, Isaksson B, Krotkiewski M, Larsson B, Sjostrom L. Effect of an energy-reduced dietary regimen in relation to adipose tissue cellularity in obese women. Am J Clin Nutr 1975;28:445-452.
4. Casimirri F, Pasquali R, Cesari MP, Melchionda N, Barbara L. Interrelationships between body weight, body fat distribution and insulin in obese women before and after hypocaloric feeding and weight loss. Ann Nutr Metab 1989;33:79-87.
5. Krotkiewski M, Sjostrom L, Bjorntorp P, Carlgren G, Garellick G, Smith U. Adipose tissue cellularity in relation to prognosis for weight reduction. Int J Obesity 1977;1:395-416.
6. Wadden TA, Stunkard AJ, Johnston FE, Wang J, Pierson RN, Van Itallie TB, et al. Body fat deposition in adult obese women.II Changes in fat distribution accompanying weight reduction. Am J Clin Nutr 1988;47:229-234.
7. Vansant G, Besten C den, Weststrate J, Deurenberg P. Body fat distribution and the prognosis for weight reduction: preliminary observations. Int J Obesity 1988;12:133-140.
8. Lanska DJ, Lanska MJ, Hartz AJ, Kalkhoff RK, Rupley D, Rimm AA. A prospective study of body fat distribution and weight loss. Int J Obesity 1985;9:241-246.
9. Besten C den, Vansant G, Weststrate JA, Deurenberg P. Resting metabolic rate and diet-induced thermogenesis in abdominal and gluteal-femoral obese women before and after weight reduction. Am J Clin Nutr 1988;47:840-847.
10. Vansant GA, Gaal LF van, Leeuw IH de. Decreased diet-induced thermogenesis in gluteal-femoral obesity. J Am Coll Nutr 1989;8:597-601.
11. Weststrate JA, Dekker J, Stoel M, Begheijn L, Deurenberg P, Hautvast JGAJ. Resting energy expenditure in women: impact of obesity and body-fat distribution. Metabolism 1990;39:11-17.
12. Gaal LF van. Resting metabolic rate and glucose induced thermogenesis in obese men. Relationship to total body fat and body fat distribution. In: Body fat distribution: endocrine, metabolic and therapeutic aspects related to atherosclerosis. Studies in obesity and type II diabetes (PhD-thesis). Antwerpen,Belgium: University of Antwerpen, 1990:105-109.
13. Armellini F, Zamboni M, Robbi R, Todesco T, De Marchi M, Castelli S, et al. Resting metabolic rate and adipose tissue distribution in obese women. Int J Obesity 1991;15(Suppl 1):239.
49
Chapter 3
14. Schutz Y, Tremblay A. Does lipid oxidation differ in gynoid and android obese women? Int J Obesity 1992;16:67-69.
15. Despres J-P. Obesity and lipid metabolism: relevance of body fat distribution. Current opinion in Lipidology 1991;2:5-15.
16. Weststrate JA, Hautvast JGAJ. The effects of short-term carbohydrate overfeeding and prior exercise on resting metabolic rate and diet-induced thermogenesis. Metabolism 1990;39:1232-1239.
17. Commissie UCV. UCV tabel. The Hague/The Netherlands: Voorlichtingsbureau voor de Voeding, 1985. 18. Siri WE. The gross composition of the body. In: Tobias CA, Lawrence JH, eds. Advances in biological and medical physics IV.
New York: The Academic Press, 1956:239-280.
19. Comroe JH, Forster RE, Dubois AB, Briscoe WA, Carlsen E, eds. The lung-clinical physiology and pulmonary function tests. Chicago: Year Book Medical Publishers, 1977.
20. Pace N, Rathbun EN. Studies on body composition III. The body water and chemically combined nitrogen content in relation to fat content. J Biol Chem 1945;158:685-691.
21. Grande F. Energy balance and body composition changes -a critical study of three recent publications. Ann Intern Med 1968;68:467-»80.
22. Seidell JC, Bakker GIG, Kooy K van der. Imaging techniques for measuring adipose-tissue distribution -a comparison between computed tomography and 1.5-T magnetic resonance. Am J Clin Nutr 1990;51:953-957.
23. Weststrate JA, Weys PJM, Poortvliet EI, Deurenberg P, Hautvast JGAJ. Diurnal variation in postabsorptive resting metabolic rate and diet-induced thermogenesis. Am J Clin Nutr 1989;50:908-914.
24. Jequier E. Long-term measurement of energy expenditure in man: direct or indirect calorimetry? In: Bjorntorp P, Cairella M, Howard AN, eds. Recent advances in obesity research III. London: John Libbey, 1981:130-135.
25. Weir JB de V. New methods for calculating metabolic rate with special reference to protein metabolism. J Physiol 1949;109:1-9. 26. Leenen R, Kooy K van der, Seidell JC, Deurenberg P. Visceral fat accumulation measured by magnetic resonance imaging in
relation to serum lipids in obese men and women. Atherosclerosis 1992;94:171-181.
27. Kleinbaum DG, Kupper LL, Muller KE, eds. Applied regression analysis and other multivariable methods. Boston: PWS-KENT Publishing Company, 1988.
28. Cunningham JJ. Body composition as a determinant of energy expenditure: a synthetic review and a proposed general prediction equation. Am J Clin Nutr 1991;54:963-969.
29. Weststrate JA, Deurenberg P, Hautvast JGAJ. Nature and magnitude of inter-individual differences in resting metabolic rate and diet-induced thermogenesis in lean and obese individuals. In: Resting metabolic rate and diet-induced thermogenesis. Studies in humans on individual differences and on the impact of nutritional and non-nutritional factors (PhD-thesis). Wageningen,The Netherlands: Wageningen Agricultural University, 1989:140-159.
30. Fukagawa NK, Bandini LG, Young JB. Effect of age on body composition and resting metabolic rate. Am J Physiol (Endocrinol Metab) 1990;259(22):E233-E238.
31. Weinsier RL, Schutz Y, Bracco D. Reexamination of the relationship of resting metabolic rate to fat-free mass and to the metabolically active components of fat-free mass in humans. Am J Clin Nutr 1992;55:790-794.
32. Heshka S, Yang M-U, Wang J, Burt P, Pi-Sunyer FX. Weight loss and change in resting metabolic rate. Am J Clin Nutr 1990;52:981-986.
33. Wahren J. Nutrient induced thermogenesis in health and obesity. Int J Obesity 1992;16(Suppl l):ix-x.
34. Vansant G, Gaal L van, Leeuw I de. Are sex hormones involved in resting metabolic rate and glucose-induced thermogenesis? A study in obese men and women. In: Ailhaud G, Guy-Grand B, Lafontan M, Ricquier D, eds. Obesity in Europe 91. London: John Libbey & Company Ltd., 1992:337-340.
35. Astrup A, Buemann B, Christensen NJ, Madsen J, Gluud C, Bennett P, et al. The contribution of body composition, substrates, and hormones to the variability in energy expenditure and substrate utilization in premenopausal women. J Clin Endocrinol Metab 1992;74:279-286.
36. Rebufte-Scrive M, Anderson B, Olbe L, Bjorntorp P. Metabolism of adipose tissue in intraabdominal depots in severely obese men and women. Metabolism 1990;39:1021-1025.
37. Despres J-P, Moorjani S, Ferland M, Tremblay A, Lupien PJ, Nadeau A, et al. Adipose tissue distribution and plasma lipoprotein levels in obese women: importance of intra-abdominal fat. Arteriosclerosis 1989;9:203-210.
50
CHAPTER 4
VISCERAL FAT LOSS MEASURED BY MAGNETIC RESONANCE IMAGING IN RELATION TO CHANGES IN SERUM LIPID LEVELS OF OBESE MEN AND WOMEN*
Rianne Leenen, Karin van der Kooy, Anneke Droop, Jaap C. Seidell, Paul Deurenberg, Jan A. Weststrate, Joseph GAJ. Hautvast
ABSTRACT
The effect of weight reduction on serum lipids in relation to visceral fat accumulation was studied in 78 healthy obese subjects (40 premenopausal women and 38 men) aged 27-51 years and with an initial body mass index of 30.7 ± 2.2 kg/m2 (mean ± SD). The subjects received a 4.2 MJ/day energy-deficit diet for 13 weeks. Magnetic resonance imaging was used to assess abdominal fat areas before and after weight loss. Weight reductions of 12.6 ± 3.2 kg in men and 11.7 ± 3.8 kg in women resulted in larger reductions in the fasting serum levels of total cholesterol (p<0.05), LDL cholesterol (p=0.06), and triglycerides (p<0.01) and a larger increase in the HDL cholesterol/LDL cholesterol ratio (p=0.05) in men compared with women. Men also lost more visceral fat (p< 0.0001), whereas the reductions in the total and subcutaneous abdominal fat depots were similar. In women, visceral fat loss was significantly related to an increase of the HDL cholesterol level, independent of the degree of total fat loss. In men, however, no significant correlations were observed between changes in visceral fat and any of the serum lipids. Comparisons of average changes in obese men and women suggest that visceral fat loss is associated with an improvement of the serum lipid profile. However, correlation analysis does not support a critical role of visceral fat in determining serum lipid concentrations on an individual level, except for an improvement of the HDL cholesterol level with visceral fat loss in obese women.
INTRODUCTION
Previous studies have clearly shown that the occurrence of several metabolic aberrations of obesity, such as diabetes mellitus and coronary heart disease, are related to body fat
* Arteriosclerosis and Thrombosis 1993;13:487-494.
51
Chapter 4
distribution (1,2). A relative predominance of visceral fat in the abdominal region seems to be a more important predictor for these metabolic disorders than is total body fatness.
In numerous studies, the influence of weight reduction on changes in serum lipids in obesity has been examined. There have been only a few studies investigating the relations between changes in body fat distribution and changes in serum lipid levels in response to weight reduction (3-5). In two of these studies (3,4), changes in body fat distribution were measured by the waist/hip ratio, which is the commonly used anthropometric index for adipose tissue distribution. However, it has been previously demonstrated that changes in the waist/hip ratio seem to be inappropriate for the evaluation of changes in visceral fat (6,7). Only Fujioka et al. (5) have reported, in a study of obese Japanese women, relations between changes in visceral fat measured by computed tomography and changes in serum lipids. To our knowledge, no previous studies have investigated the associations between changes in serum lipid levels and changes in the visceral fat depot in obese men. Men have more visceral fat (8) and a serum lipid profile that indicates a higher risk for coronary heart disease compared with women (8,9).
Visceral adipose tissue has been proposed to be the most important fat depot related to an unfavorable lipid profile (10). Recently, we have shown that there is a larger reduction in visceral fat with weight loss in obese subjects with an initial abundance of visceral fat than in obese subjects with smaller amounts of visceral fat (11). This preferential reduction in visceral fat, which may be due to the proposed elevated lipolytic capacity of the visceral adipocytes (12), is expected to be accompanied by favorable changes in the serum lipid profiles after a period of energy restriction, particularly in obese subjects with visceral fat accumulation.
The purpose of this study was to investigate the effects of a controlled slimming diet during 13 weeks on serum lipids and on body fat distribution in obese men as well as in obese women. Particular attention was focused on whether reductions in the visceral fat depot, measured by magnetic resonance imaging, were correlated with favorable changes in the serum lipid profile in obese subjects.
METHODS
Subjects Participants were recruited by means of advertisements in local newspapers. Ninety-six obese subjects (48 women and 48 men) were selected on the basis of their body mass index (between 28 and 38 kg/m2), age (between 25 and 51 years), premenopausal state, smoking behavior (fewer than 5 cigarettes per day), and drinking behavior (fewer than 2 alcoholic consumptions per day). All subjects were apparently healthy, as judged by their medical history and a physical examination. Subjects with glycosuria and proteinuria
52
Visceral fat, serum lipids and weight loss
were excluded. Throughout the study, none of the volunteers received medication known to affect the variables measured in this study, and the women did not use oral contraceptives before or during the study. None of the subjects had been on a slimming diet for several months before the study. Subjects with an abdominal and gluteal-femoral fat distribution, based on the waist/hip ratio (cutoff points, 0.85 in women and 1.00 in men), were matched for age and body mass index by sex. Fourteen subjects did not complete the dietary treatment successfully: 4 were excluded because of intercurrent illness, 6 were excluded for personal reasons, and 4 were excluded because of suspicion of poor dietary compliance. In addition, data were excluded for 2 subjects who were later diagnosed as having subclinical hypothyroidism and 2 who were later found to have severe fasting hyperinsulinemia (> 100 jiU/mL). Data for statistical analysis remained for 78 subjects (40 women and 38 men). All subjects gave their written informed consent to participate in this study, which was approved by the Medical Ethics Committee of the Department of Human Nutrition. The procedures had been fully explained to the volunteers.
Experimental design and diet Subjects were divided into 4 groups; each group was given a different weight-maintaining diet before weight loss. The groups did not differ with respect to fat distribution (neither in the waist/hip ratio nor in abdominal fat depots). The diets were individually tailored to meet each person's energy requirement, which was estimated from resting metabolic rate and physical activity pattern as described previously (13). Body weights were recorded twice a week by the subjects, and energy intakes were adjusted to maintain individual weight stability. After this weight-stable period of 3-10 weeks, baseline measurements were performed to determine body composition, fat distribution, and serum lipids in the week preceding the weight-loss treatment. The weight-stable period was followed by a period of 13 weeks during which the subjects received a 4.2 MJ/day energy-deficit diet. Individual energy deficits were based on estimated daily energy intake at the end of the weight-stable period preceding the period of energy restriction. After the energy-deficit period, the subjects were given a diet for 3 weeks to maintain the new achieved body weight; this diet had the same nutrient composition as the weight-reduction diet (post-slimming diet). At the end of this period, all measurements were repeated.
The nutrient composition of the diets was calculated with the use of the Dutch computerized food-composition table (14). Ninety-five percent of the energy intake in each dietary period was supplied individually to the volunteers by the Department of Human Nutrition. In addition, the participants were allowed to choose a limited number of food items, free of fat and cholesterol, that provided a fixed amount of 5% of the total daily energy intake. Duplicate portions of each diet were collected, stored at -20 °C,
53
Chapter 4
pooled per diet period, and analyzed after the study. These chemically determined values were combined with the values calculated (14) for the free-choice items (Table 1).
The weight-stable diets consisted of conventional foods, whereas the energy-deficit diet was a combination of slimming products and conventional foods. The subjects were instructed to maintain their habitual physical activity pattern and smoking habits during the study period. They were asked to record any sign of illness, deviations from the diet, medication used, free-item choice, and changes in smoking and activity patterns in a diary. Compliance to the diet was checked by weight control and meetings with trained dietitians every 2 weeks.
Table 1. Nutrient composition of the diets*
Weight reduction
23.3 33.4 9.9
11.1
11.1 43.0 0.4
33.5 3.6
Type of diet
Post-slimming
21.7 33.7
11.2 11.5
10.1
44.2 0.6
28.0
2.9
Protein (% of energy) Fat (% of energy)
Saturated fatty acids
Monounsaturated fatty acids
Polyunsaturated fatty acids Carbohydrates (% of energy) Alcohol (% of energy) Cholesterol (mg/MJ)* Dietary fiber (g/MJ)*
t Nutrient composition was based on chemical analysis of duplicate diets (95% of energy) and nutrient composition of the free-choice items (5% of energy);
* To convert values for the intake of cholesterol to milligrams and dietary Tiber to grams per 1,000 kcal, multiply by 4.184.
Blood sampling and analyses Venous blood was drawn twice in the morning after an overnight fast of 11-13 hours, with an interval of 2 days. The mean concentration of the 2 samples was used for statistical analysis. Serum was prepared by low-speed centrifugation within 1 hour after venipuncture and stored at -80 °C until analysis. Total serum cholesterol was determined by an enzymatic colorimetric method (15). Serum high density lipoprotein (HDL) cholesterol was measured by the same enzymatic method (15) after precipitation by dextran sulfate-Mg2* (16). Serum triglycerides were determined as previously described (17). The within-run coefficient of variation of control sera was 1.3% for total cholesterol, 1.6% for HDL cholesterol, and 1.6% for triglycerides. The between-run coefficient of variation of control sera was 0.7% for total cholesterol, 1.1% for HDL cholesterol, and 0.9% for triglycerides. Accuracy for total cholesterol and triglycerides
54
Visceral fat, serum lipids and weight loss
was checked by analysis of serum pools of known value provided by the US Centers for Disease Control (Atlanta,GA). Accuracy for HDL cholesterol was checked by serum pools of known value produced by Solomon Park Research Laboratories (Kirkland,WA). The mean bias with regard to target values of the Centers for Disease Control was +0.11 mmol/L for total cholesterol and -0.02 mmol/L for triglycerides. The mean bias with regard to the Solomon Park target value for HDL cholesterol was +0.08 mmol/L. The low density lipoprotein (LDL) cholesterol concentration was calculated using the Friedewald equation (18). The ratio of HDL cholesterol to LDL cholesterol (HDL/LDL ratio) was calculated as an index of atherogenicity.
Body composition All anthropometric measurements were made with the subjects wearing only swimming gear or underwear. Body weight was determined to the nearest 0.05 kg on a digital scale (model ED-60-T, Berkel, Rotterdam, The Netherlands), and body height was measured to the nearest 0.001 m using a wall-mounted stadiometer. Body mass index was calculated as weight (kg) divided by height squared (m2). Whole-body density was determined by underwater weighing (19). Residual lung volume was measured simultaneously by a helium dilution technique (20). Percent body fat was calculated from total body density by the equation of Siri (19). Percent body fat of 2 subjects was determined from weight and total body water as assessed by deuterium oxide dilution, assuming a hydration coefficient of the fat free mass of 0.73 (21). These subjects were afraid of complete immersion under water.
Fat distribution Waist circumference was measured midway between the lower rib margin and the iliac crest at the end of a gentle expiration. The hip circumference was measured at the level of the widest circumference over the great trochanters. Both circumferences were measured to the nearest 0.001 m with the subjects in a standing position. Magnetic resonance imaging scans were made on a whole-body scanner (GYROSCAN S15, Philips Medical Systems, Best, The Netherlands) using a 1.5-T magnetic field (64 MHz) and a slice thickness of 10 mm. Transverse magnetic resonance imaging scans were taken midway between the lower rib margin and the iliac crest while subjects were lying supine. The scans were performed and interpreted as described previously (22). In this obese population, the reproducibility of the fat area determinations from the same scan, expressed as the coefficient of variation, before weight loss was 1.8%, 5.0%, and 2.2% for the estimation of total, visceral, and subcutaneous abdominal fat areas, respectively; after weight loss, the values were 2.3%, 5.7%, and 2.0%, respectively. In 6 subjects (3 women and 3 men), only the measurements before weight loss could be used for statistical analysis because of incorrect measurements after weight loss.
55
Chapter 4
Statistical methods Deviations from normality of the distributions of the variables were checked within each sex. The distributions of triglycerides, visceral fat, and the changes in visceral fat and triglycerides were slightly skewed. Natural logarithm-transformed values for triglycerides and visceral fat were performed in statistical analyses. No transformations for change in visceral fat and change in triglycerides were used because this resulted in findings principally identical to analyses based on normally distributed variables. Differences in variables before and after the weight loss treatment were tested by Student's paired t test. Pearson's product-moment correlations and partial correlation coefficients were computed within each sex by using univariate and multiple linear regression techniques with serum lipids as dependent variables and the covariates as independent variables. Differences between the regression lines for men and women were tested for differences in slopes and intercepts as described by Kleinbaum et al. (23). Regression analysis was also used to determine the effects of changes in visceral fat on the gender differences in changes in serum lipid levels. Two-sided probability values were considered statistically significant at/?<0.05. Results are expressed as means ± standard deviation (SD) unless otherwise indicated.
RESULTS
The characteristics of the study population before weight loss are summarized in Table 2. The differences in variables between men and women were all statistically significant, except for age, body mass index, total abdominal fat area, and total and LDL cholesterol. Although men had, on average, a smaller fat mass compared with women, men had higher triglyceride concentrations and lower values for HDL cholesterol and the HDL/LDL ratio than women. Men had larger visceral fat areas and higher waist/hip ratios, whereas women had more subcutaneous abdominal adipose tissue.
Table 3 shows the changes in body weight, body composition, and fat distribution after weight reduction for men and for women. Within each sex, all variables were significantly lower (p< 0.0001) after weight loss. Losses of body weight and fat mass induced by the energy-deficit diet did not differ significantly between men and women. Although men and women lost similar amounts of total and subcutaneous abdominal fat, men lost significantly more visceral fat than women, and the decrease in the waist/hip ratio was also significantly larger in men. In both sexes, the mean body weight remained stable from the end of the weight reduction period to the end of the post-slimming diet: +0.07 ± 0.87 kg (p=0.62) in women and -0.07 ± 1.22 kg (p=0.74) in men.
56
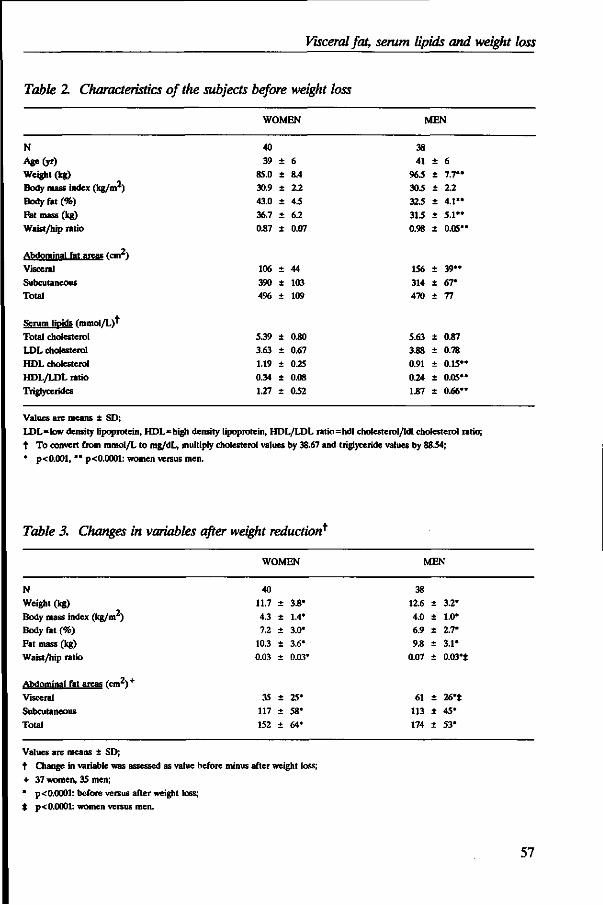
Visceral fat, serum lipids and weight loss
Table 2 Characteristics of the subjects before weight loss
WOMEN MEN
N Age(yr)
Weight (kg) Body mass index (kg/m2) Body fat (%) Fat mass (kg)
Waist/hip ratio
Abdominal fat areas fcm'1
Visceral Subcutaneous
Total
Serum lipids (mmol/L)' Total cholesterol LDL cholesterol HDL cholesterol HDL/LDL ratio Triglycerides
40 39
85.0
30.9
43.0
36.7
0.87
106 390 4%
5.39
3.63
1.19
0.34
1.27
± +
+
+
+
+
4;
± +
+
±
± +
+
6 8.4 2.2 4.5 6.2 0.07
44 103 109
0.80
0.67
0.25
0.08
0.52
38 41
96.5
30.5
32.5
31.5
0.98
156 314 470
5.63
3.88
0.91
0.24
1.87
± +
± +
±
-
+
±
-
+
± +
+
+
6 7.7"
2.2 4.1"
5.1"
0.05'
39" 67* 77
0.87
0.78
0.15*
0.05*
0.66*
Values are means i SD; LDL=low density lipoprotein, HDL=high density lipoprotein, HDL/LDL ratio=hdl cholesterol/Idl cholesterol ratio; t To convert from mmol/L to mg/dL, multiply cholesterol values by 38.67 and triglyceride values by 8834;
* p< 0.001, ** p< 0.0001: women versus men.
Table 3. Changes in variables after weight reduction*
WOMEN MEN
N Weight (kg)
Body mass index (kg/m ) Body fat (%) Fat mass (kg)
Waist/hip ratio
Abdominal fat areas (cm2)+
Visceral
Subcutaneous
Total
40 11.7
4.3 7.2
10.3
0.03
35 117
152
+
+
+
+
+
+
± +
3.8*
1.4*
3.0*
3.6*
0.03
25* 58* 64*
38 12.6
4.0 6.9 9.8
0.07
61 113 174
± +
± +
+
±
+
+
3.2*
1.0*
2.7*
3.1*
0.03**
26**
45* 53*
Values are means ± SD; t Change in variable was assessed as value before minus after weight loss;
+ 37 women, 35 men; * p< 0.0001: before versus after weight loss; * p< 0.0001: women versus men.
57
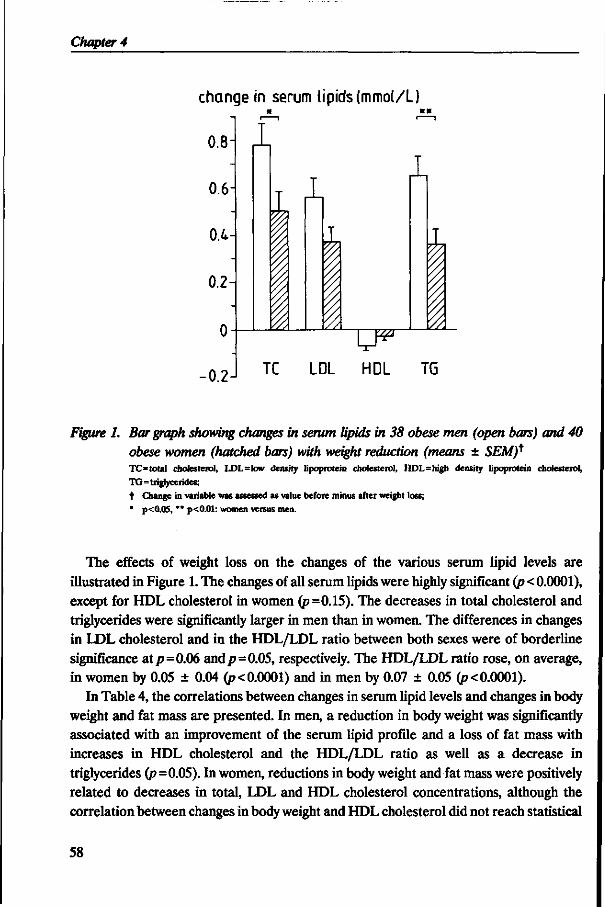
Chapter 4
change in serum lipids (mmol/L)
0.8-
0.6-
0.4-
0.2
0
•0.2
1
I
\
k I 1
W
i 1
TC LDL HDL TG
Figure 1. Bar graph showing changes in serum lipids in 38 obese men (open bars) and 40 obese women (hatched bars) with weight reduction (means ± SEM)* TC= total cholesterol, LDL=low density lipoprotein cholesterol, HDL=high density lipoprotein cholesterol,
TG=triglycerides; f Change in variable was assessed as value before minus after weight loss;
* p<0.05, ** p<0.01: women versus men.
The effects of weight loss on the changes of the various serum lipid levels are illustrated in Figure 1. The changes of all serum lipids were highly significant (p < 0.0001), except for HDL cholesterol in women (p=0.15). The decreases in total cholesterol and triglycerides were significantly larger in men than in women. The differences in changes in LDL cholesterol and in the HDL/LDL ratio between both sexes were of borderline significance at p=0.06 and p=0.05, respectively. The HDL/LDL ratio rose, on average, in women by 0.05 ± 0.04 (p< 0.0001) and in men by 0.07 ± 0.05 (p< 0.0001).
In Table 4, the correlations between changes in serum lipid levels and changes in body weight and fat mass are presented. In men, a reduction in body weight was significantly associated with an improvement of the serum lipid profile and a loss of fat mass with increases in HDL cholesterol and the HDL/LDL ratio as well as a decrease in triglycerides (p=0.05). In women, reductions in body weight and fat mass were positively related to decreases in total, LDL and HDL cholesterol concentrations, although the correlation between changes in body weight and HDL cholesterol did not reach statistical
58
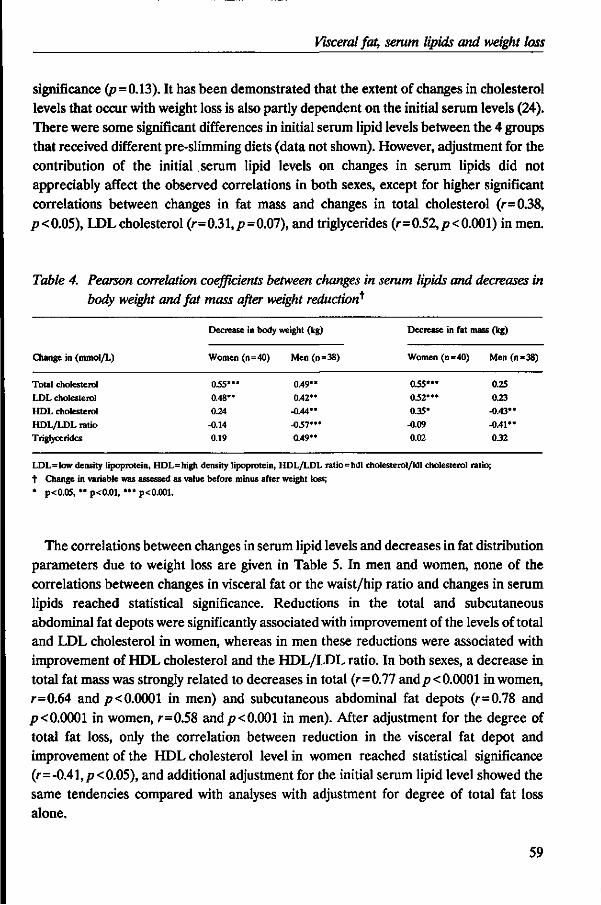
Visceral fat, serum lipids and weight loss
significance (p=0.13). It has been demonstrated that the extent of changes in cholesterol levels that occur with weight loss is also partly dependent on the initial serum levels (24). There were some significant differences in initial serum lipid levels between the 4 groups that received different pre-slimming diets (data not shown). However, adjustment for the contribution of the initial serum lipid levels on changes in serum lipids did not appreciably affect the observed correlations in both sexes, except for higher significant correlations between changes in fat mass and changes in total cholesterol (r=0.38, /?<0.05), LDLcholesterol (r=0.31,p=0.07), and triglycerides (r=0.52,p<0.001) in men.
Table 4. Pearson correlation coefficients between changes in serum lipids and decreases in body weight and fat mass after weight reduction*
Change in (mmol/L)
Total cholesterol LDL cholesterol HDL cholesterol
HDL/LDL ratio Triglycerides
Decrease in body
Women (n=40)
035*** 0.48** 0.24
-0.14 0.19
weight (kg)
Men (n =
0.49** 0.42**
-0.44** -05V"
0.49**
38)
Decrease in
Women (n =
0.55*** 052'"
0.35*
-0.09 0.02
fat mass (kg)
=40) Men (n=38)
0.25 0.23
-0.43** -0.41** 0.32
LDL=low density lipoprotein, HDL=high density lipoprotein, HDL/LDL ratio=hdl cholesterol/ldl cholesterol ratio; t Change in variable was assessed as value before minus after weight loss; * p<0.05, ** p<0.01, *** p<0.001.
The correlations between changes in serum lipid levels and decreases in fat distribution parameters due to weight loss are given in Table 5. In men and women, none of the correlations between changes in visceral fat or the waist/hip ratio and changes in serum lipids reached statistical significance. Reductions in the total and subcutaneous abdominal fat depots were significantly associated with improvement of the levels of total and LDL cholesterol in women, whereas in men these reductions were associated with improvement of HDL cholesterol and the HDL/LDL ratio. In both sexes, a decrease in total fat mass was strongly related to decreases in total (r=0.77 and/?< 0.0001 in women, r=0.64 and/7<0.0001 in men) and subcutaneous abdominal fat depots (r=0.78 and p< 0.0001 in women, r=0.58 and p< 0.001 in men). After adjustment for the degree of total fat loss, only the correlation between reduction in the visceral fat depot and improvement of the HDL cholesterol level in women reached statistical significance (r=-0.41, p< 0.05), and additional adjustment for the initial serum lipid level showed the same tendencies compared with analyses with adjustment for degree of total fat loss alone.
59
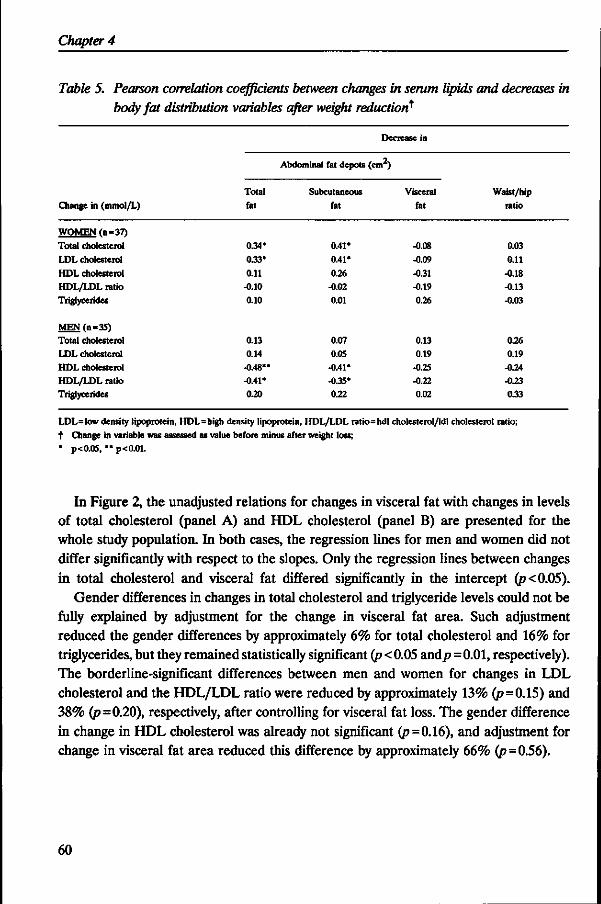
Chapter 4
Table 5. Pearson correlation coefficients between changes in serum lipids and decreases in body fat distribution variables after weight reduction*
Change in (mmol/L)
WOMEN rn=37}
Total cholesterol
LDL cholesterol
HDL cholesterol HDL/LDL ratio
Triglycerides
MEN(n=35) Total cholesterol
LDL cholesterol HDL cholesterol HDL/LDL ratio Triglycerides
Total
fat
0.34*
0.33'
0.11 -0.10 0.10
0.13 0.14
-0.48** -0.41* 0.20
Decrease in
Abdominal fat depots (cm )
Subcutaneous
fat
0.41*
0.41*
0.26 -0.02 0.01
0.07
0.0S -0.41* -0.35* 0.22
Visceral fat
-0.08
-0.09
-0.31 -0.19
0.26
0.13 0.19
-0.25 -0.22 0.02
Waist/hip ratio
0.03
0.11
-0.18
-0.13 -0.03
0.26 0.19
-0.24 -0.23 033
LDL=low density lipoprotein, HDL=high density lipoprotein, HDL/LDL ratio=hdl cholesterol/ldl cholesterol ratio; t Change in variable was assessed as value before minus after weight loss; * p<0.05, ** p<0.01.
In Figure 2, the unadjusted relations for changes in visceral fat with changes in levels of total cholesterol (panel A) and HDL cholesterol (panel B) are presented for the whole study population. In both cases, the regression lines for men and women did not differ significantly with respect to the slopes. Only the regression lines between changes in total cholesterol and visceral fat differed significantly in the intercept (p<0.05).
Gender differences in changes in total cholesterol and triglyceride levels could not be fully explained by adjustment for the change in visceral fat area. Such adjustment reduced the gender differences by approximately 6% for total cholesterol and 16% for triglycerides, but they remained statistically significant (p < 0.05 and/>=0.01, respectively). The borderline-significant differences between men and women for changes in LDL cholesterol and the HDL/LDL ratio were reduced by approximately 13% (p=0.15) and 38% (p=0.20), respectively, after controlling for visceral fat loss. The gender difference in change in HDL cholesterol was already not significant (p=0.16), and adjustment for change in visceral fat area reduced this difference by approximately 66% (p=0.56).
60
Visceral fat, serum lipids and weight loss
change in total cholesterol (mmol/L) 2.0
1.0
-1.0
o
0
0
0
0 o
o •
1 20
• •
• o # o .
°*o° ° . 0 •
" t % —
o
o
o
40
* •• •
• » 0
•
60
• •
• • \
0
80
•
• •
100
A
men and women
r=0.16 p=0.17
•
120 140 change in visceral fat (cm2)
change in HDL cholesterol (mmol/L) o
0.2-°
0 20 40 60 80 100 120 140 change in visceral fat (cm2)
Figure 2. Plots showing relations between changes in visceral fat with changes in total cholesterol levels (panel A) and changes in HDL cholesterol levels (panel B) with weight loss in 37 obese women (o) and 35 obese men (»)* t Change in variable was assessed as value before minus after weight loss.
Table 6 shows the correlations between indicators of body fat distribution before weight loss and changes in serum lipids in response to weight reduction after controlling for age and initial total fat mass. Adjustment for these 2 parameters was necessary because age in both sexes and initial fat mass in men were significantly correlated with visceral fat accumulation: r=0.49 and p< 0.01 versus age and r=0M and p< 0.01 versus initial fat mass in men, and r=0.41 and p< 0.01 versus age in women. In both sexes, no significant correlations between the initial waist/hip ratio and changes in serum lipid profile could
61
Chapter 4
be observed, although in women the correlation with HDL cholesterol was of borderline significance (p=0.05). In women, an initial abundance of visceral fat before weight loss was significantly associated with an improvement of HDL cholesterol and triglyceride levels after weight loss, whereas in men it was associated with a deterioration of the HDL cholesterol level. Additional adjustment for degree of total fat loss did not appreciably affect the observed correlations in women, although in men the significant relation disappeared.
Table 6. Partial correlations (adjusted for age and initial fat mass) between body fat distribution variables before weight loss and changes in serum lipids after weight reduction*
Change in (mmol/L)
Total
fat
0.05 -0.01 -0.07
0.01
0.20
0.12 0.11
-0.04
-0.05
0.08
Initial
Abdominal fat depots (cm )
Subcutaneous
fat
0.16 0.14
0.16
0.06 -0.03
0.12 0.08
-0.28
-0.23
0.23
parameters
Visceral
fat
-0.27
-0.30 -0.48"
-0.10
0.36'
-0.01 0.02 0.37*
0.31
-0.21
Waist/hip ratio
-0.09 -0.08
-0.32 -0.12
0.18
0.08
-0.02 0.13
0.12
0.18
WOMEN (n=40) Total cholesterol LDL cholesterol HDL cholesterol HDL/LDL ratio Triglycerides
MEN(n = 38) Total cholesterol LDL cholesterol HDL cholesterol HDL/LDL ratio Triglycerides
LDL=low density lipoprotein, HDL=high density lipoprotein, HDL/LDL ratio=hdl cholesterol/ldl cholesterol ratio; t Change in variable was assessed as value before minus after weight loss; * p<0.05, *• p<0.01.
DISCUSSION
This study in healthy, moderately obese subjects showed that, with similar reductions in body weight and fat mass, men had larger reductions in serum total cholesterol, LDL cholesterol, and triglyceride levels and a larger increase in the HDL/LDL ratio compared with women. Men also lost more visceral fat, whereas reductions in total and subcutaneous abdominal fat were similar. Although these results suggest that a larger
62
Visceral fat, serum lipids and weight loss
reduction in visceral fat is associated with a better improvement of the serum lipid profile, correlations between changes in the visceral fat depot and changes in serum lipids were not significant in either sex. Only the change in HDL cholesterol was inversely associated with a change in visceral fat in women.
The average weight reduction of approximately 12 kg caused by caloric restriction resulted in changes to more favorable serum lipid levels in both sexes, except for HDL cholesterol in women. This weight loss was accompanied by substantial changes in body fat distribution in men as well as women. The larger loss in visceral fat in men compared with women is in accordance with our previous findings that larger baseline amounts of visceral fat are associated with larger reductions in the visceral fat depot with weight loss (11).
Analysis of the data at baseline revealed that in the studied obese men the amount of visceral fat was not significantly related to serum lipid levels independent of age and percent body fat (8). In this context, it is not surprising that in these men the loss of visceral fat did not correlate with any of the changes in serum lipids levels. In contrast, the total amount of body fat lost was significantly related to improvement of all serum lipids in men. This suggests that total body fat loss seems to be more important in improving the serum lipid profile of obese men than loss of visceral fat.
In women, initial visceral fat was found to be strongly inversely associated with HDL cholesterol and positively with triglyceride levels but not with levels of total and LDL cholesterol (8). Reductions in visceral fat in women did lead to improvement of levels of HDL cholesterol but not of triglycerides, independent of the degree of total fat loss. The lack of significant correlations between changes in visceral fat and triglyceride levels may be partly due to the relatively large within-person variations in both variables (22,25).
The only other prospective study in which imaging techniques were used demonstrated a significant correlation between reduction of the visceral fat depot and improvement of triglyceride levels in obese Japanese women, whereas no significant relation was observed with improvement of total and HDL cholesterol (5). The different results in the Japanese study and the present study could perhaps be partly explained by the initial higher serum triglyceride levels of the Japanese women, the larger obtained reduction in triglycerides, and the fact that serum lipids were probably not measured at the end of a completely weight-stable period. It has been reported that it is important to measure concentrations of HDL cholesterol in a weight-maintenance state (26,27).
The relatively large measurement error of visceral fat areas, as described previously by Seidell et al. (22), might cause attenuation of the correlations. Despite these limitations, the correlation between reduction of visceral fat and improvement of the HDL cholesterol level in women was obvious in the present study. Especially obese women with an initial abundance of visceral fat may benefit from weight reduction with
63
Chapter 4
regard to their HDL cholesterol levels because they lose relatively more visceral fat than women with less visceral fat at baseline (11). The exact mechanism by which visceral fat influences HDL concentrations is not fully resolved. It has been proposed that the high hepatic triglyceride lipase activity in obese women with visceral fat accumulation could be responsible for the reduction in plasma HDL cholesterol levels, particularly HDLj cholesterol levels, whereas variations in sex steroid levels may play a potential role in the associations between visceral fat and hepatic triglyceride lipase activity (28). Therefore, gender differences in sex steroid concentrations may be partly responsible for the associations between improvement of HDL cholesterol and visceral fat reduction in women only.
It has been suggested that body fat distribution may be responsible for the gender differences in serum lipid concentrations (29). This seems to be particularly true for HDL cholesterol and triglycerides. It is less clear for total and LDL cholesterol, as indicated in a previous study (8) and in others (29,30). In the present study, average initial levels of total and LDL cholesterol were similar in men and women. The changes in total and LDL cholesterol and visceral fat loss, however, were all larger in men than in women, despite the same degree of total fat loss. These latter findings suggest that visceral adipose tissue seems to play a role in determining serum cholesterol levels. The reason for this discrepancy is still unknown.
In conclusion, the larger observed reduction in visceral fat and the better improvement of the serum lipid profile accompanying weight loss in healthy, moderately obese men compared with premenopausal, moderately obese women suggests a crucial role of the visceral fat depot in the improvement of the serum lipid levels of obese subjects. However, within each sex, no significant correlations between reductions of the visceral fat depot and improvement of the serum lipid profile could be found, with the exception of a significant association in women between visceral fat loss and an increase in HDL cholesterol. It may be that even with imaging techniques the changes in the visceral fat depots cannot be measured precisely enough because of the large within-subject variability in the estimate of visceral fat and that the present study population was too homogeneous with respect to ranges of body fatness and serum lipids. In addition, measurement of changes in total visceral fat does not allow separation of the effects of changes in the different intra-abdominal fat depots (retroperitoneal, mesenteric, and omental). Particularly, the mesenteric and omental fat depots ('portal tissues') are proposed to be associated with metabolic disorders (2). It may be that associations between these fat depots and serum lipids are diluted by looking at all intra-abdominal fat depots simultaneously. There are no techniques that make it possible to distinguish between these different intra-abdominal fat depots. With the use of the present techniques, the importance of visceral fat in prospective studies on changes in risk factors for coronary heart disease seems to be less clear than previously anticipated (1,2).
64
Visceral fat, serum lipids and weight loss
REFERENCES
1. Despres J-P, Moorjani S, Lupien PJ, Tremblay A, Nadeau A, Bouchard C. Regional distribution of body fat, plasma lipoproteins, and cardiovascular disease. Arteriosclerosis 1990;10:497-511.
2. Bjdrntorp P. 'Portal" adipose tissue as a generator of risk factors for cardiovascular disease and diabetes. Arteriosclerosis 1990;10:493-496.
3. Vansant G, Besten C den, Weststrate J, Deurenberg P. Body fat distribution and the prognosis for weight reduction: preliminary observations. Int J Obesity 1988;12:133-140.
4. Wing RR, Jeffery RW, Burton LR, Thorson C, Kuller LH, Folsom AR. Change in waist-hip ratio with weight loss and its association with change in cardiovascular risk factors. Am J Clin Nutr 1992;55:1086-1092.
5. Fujioka S, Matsuzawa Y, Tokunaga K, Kawamoto T, Kobatake T, Keno Y, et al. Improvement of glucose and lipid metabolism associated with selective reduction of intra-abdominal visceral fat in premenopausal women with visceral fat obesity. Int J Obesity 1991;15:853-859.
6. Bosello O, Armellini F, Zamboni M, Bergamo Andreiss IA, De Marchi M, et al. The problem of evaluating body fat distribution. In: Belfiore F, Jeanrenaud B, Papalia D, eds. Obesity: basic concepts and clinical aspects. Basel: Karger, 1992;11:124-133.
7. Kooy K van der, Leenen R, Seidell JC, Deurenberg P, Droop A, Bakker CJG. Waist-to-hip ratio is a poor predictor for changes in visceral fat. Am J Clin Nutr (in press).
8. Leenen R, Kooy K van der, Seidell JC, Deurenberg P. Visceral fat accumulation measured by magnetic resonance imaging in relation to serum lipids in obese men and women. Atherosclerosis 1992;94:171-181.
9. Despres J-P, Allard C, Tremblay A, Talbot J, Bouchard C. Evidence for a regional component of body fatness in the association with serum lipids in men and women. Metabolism 1985;34:967-973.
10. Despres J-P, Moorjani S, Ferland M, Tremblay A, Lupien PJ, Nadeau A, et al. Adipose tissue distribution and plasma lipoprotein levels in obese women: importance of intra-abdominal fat. Arteriosclerosis 1989;9:203-210.
11. Leenen R, Kooy K van der, Deurenberg P, Seidell JC, Weststrate JA, Schouten FJM, et al. Visceral fat accumulation in obese subjects: relation to energy expenditure and response to weight loss. Am J Physiol (Endocrinol Metab);263(26):E913-E919.
12. Rebufte-Scrive M, Anderson B, Olbe L, Bjdrntorp P. Metabolism of adipose tissue in intraabdominal depots in severely obese men and women. Metabolism 1990;39:1021-1025.
13. Weststrate JA, Hautvast JGAJ. The effects of short-term carbohydrate overfeeding and prior exercise on resting metabolic rate and diet-induced thermogenesis. Metabolism 1990;39:1232-1239.
14. Commissie UCV. UCV tabel. The Hague/The Netherlands: Voorlichtingsbureau voor de Voeding, 1985. 15. Siedel J, Hagele EO, Ziegenhorn J, Wahlefeld AW. Reagent for the enzymatic determination of serum total cholesterol with
improved lipolytic efficiency. Clin Chem 1983;29:1075-1080.
16. Warnick GR, Benderson J, Albers JJ. Dextran sulfate-Mg^ + precipitation procedure for quantitation of high-density-lipoprotein cholesterol. Clin Chem 1982;28:1379-1388.
17. Sullivan DR, Kruijswijk Z, West CE, Kohlmeier M, Katan MB. Determination of serum triglycerides by an accurate enzymatic method not affected by free glycerol. Clin Chem 1985;31:1227-1228.
18. Friedewald WT, Levy RI, Fredrickson DS. Estimation of the concentration of low-density lipoprotein cholesterol in plasma, without use of the preparative ultracentrifuge. Gin Chem 1972;18:499-502.
19. Siri WE. The gross composition of the body. In: Tobias CA, Lawrence JH, eds. Advances in biological and medical physics IV. New York: The Academic Press, 1956:239-280.
20. Comroe JH, Forster RE, Dubois AB, Briscoe WA, Carlsen E, eds. The lung-clinical physiology and pulmonary function tests. Chicago: Year Book Medical Publishers, 1977.
21. Pace N, Rathbun EN. Studies on body composition HI. The body water and chemically combined nitrogen content in relation to fat content. J Biol Chem 1945;158:685-691.
22. Seidell JC, Bakker CJG, Kooy K van der. Imaging techniques for measuring adipose-tissue distribution -a comparison between computed tomography and 1-5-T magnetic resonance. Am J Clin Nutr 1990;51:953-957.
23. Kleinbaum DG, Kupper LL, Muller KE, eds. Applied regression analysis and other multivariable methods. Boston: PWS-KENT Publishing Company, 1988.
24. Osterman J, Lin T, Nankin HR, Brown KA, Homung CA. Serum cholesterol profiles during treatment of obese outpatients with a very low calorie diet. Effect of initial cholesterol levels. Int J Obesity 1992;16:49-58.
25. Brown SA, Boerwinkle E, Kashanian FK, Swanson N, Patsch W. Variation in concentrations of lipids, lipoprotein lipids, and apolipoproteins A-I and B in plasma from healthy women. Clin Chem 1990;36:207-210.
26. Zimmerman J, Kaufmann NA, Fainaru M, Eisenberg S, Oschry Y, Friedlander Y, et al. Effect of weight loss in moderate obesity on plasma lipoprotein and apolipoprotein levels and on high density lipoprotein composition. Arteriosclerosis 1984;4:115-123.
65
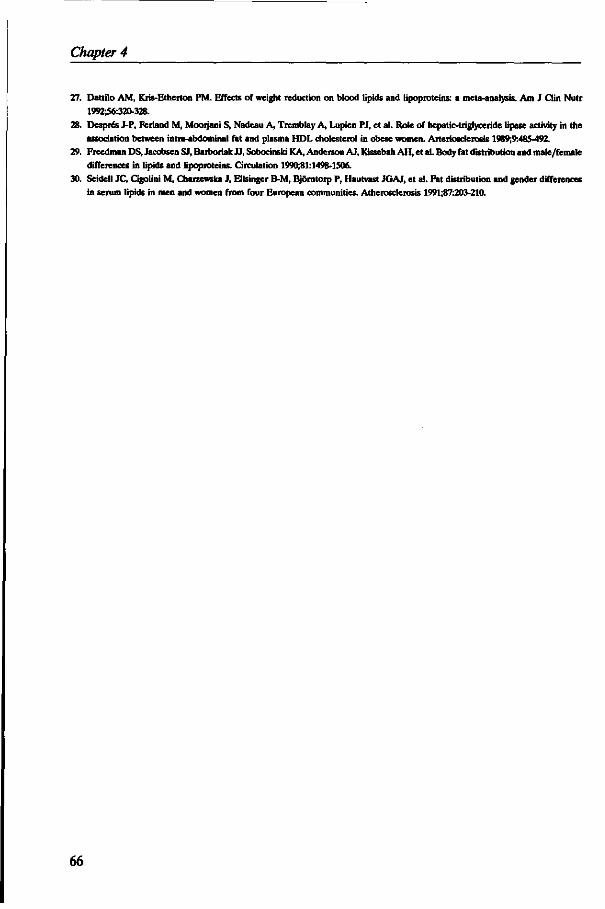
Chapter 4
27. Dattilo AM, Kris-Etheiton PM. Effects of weight reduction on blood lipids and lipoproteins: a meta-analysis. Am J Clin Nutr 1992^6:320-328.
28. Despres J-P, Ferland M, Moorjani S, Nadeau A, Tremblay A, Lupien PJ, et al. Role of hepatic-trigryceride lipase activity in the association between intra-abdominal fat and plasma HDL cholesterol in obese women. Arteriosclerosis 1989;9:485-492.
29. Freedman DS, Jacobsen SJ, Barboriak JJ, Sobocinski KA, Anderson AJ, Kissebah AH, et al. Body fat distribution and male/female differences in lipids and lipoproteins. Circulation 1990;81:1498-1506.
30. Seidell JC, Cigolini M, Charzewska J, Ellsinger B-M, BjSrntorp P, Hautvast JGAJ, et al. Fat distribution and gender differences in serum lipids in men and women from four European communities. Atherosclerosis 1991;87:203-210.
66
CHAPTERS
RELATIVE EFFECTS OF WEIGHT LOSS AND DIETARY FAT MODIFICATION ON SERUM LIPID LEVELS IN THE DIETARY TREATMENT OF OBESITY*
Rianne Leenen, Karin van der Kooy, SasMa Meyboom, Jaap C. Seidell, Paul Deurenberg, Jan A. Weststrate
ABSTRACT
The independent effects of weight loss and dietary fat modification on serum lipids were investigated in two groups of healthy moderately obese men and women, who were first fed a weight-stable high-fat,high-saturated-fat diet for 3 weeks. In one group ('sequential' group, n = 19), a weight-stable low-fat,low-saturated-fat diet (Low-Sat) was given for 7 weeks, followed by a 4.2 MJ/day deficit Low-Sat diet and a weight stabilising Low-Sat diet for 3 weeks. Another group ('simultaneous group', n=22) was subjected to the same regime, but the 7 weeks weight-stable Low-Sat diet was omitted. Both groups lost similar amounts of body weight of about 13 kg and had similar overall changes in total cholesterol, LDL cholesterol, HDL cholesterol, the HDL/LDL ratio, and triglycerides. Analysis of the separate effects of the Low-Sat diet without energy restriction and of weight loss in the 'sequential' group showed that weight loss per se was responsible for about 50% of the total reduction in total cholesterol, and for about 60% and 70% of the fall in LDL cholesterol and triglycerides, respectively. Fat modification without weight loss reduced HDL cholesterol by 11.1% and the HDL/LDL ratio by 7.7%, while weight loss per se led to increases in HDL cholesterol of 12.5% and in the HDL/LDL ratio of 24.0%. We conclude that the effects of reduction in fat and saturated fat intake and weight loss are additive. The net favourable effect of weight loss seems to be greater than that of dietary fat modification in optimizing the serum lipid profile of obese subjects.
INTRODUCTION
One of the health hazards in affluent countries is obesity, which is associated with an increased risk of coronary heart disease (1,2). Obese subjects tend to have elevated
* Submitted for publication.
67
Chapter 5
serum levels of total cholesterol, low-density-lipoprotein (LDL) cholesterol, and triglycerides, whereas their levels of high-density-lipoprotein (HDL) cholesterol tend to be reduced. Elevated total cholesterol levels as well as reduced HDL cholesterol levels are both risk factors for coronary heart disease (3,4).
Obese subjects, especially when they are hypercholesterolemic, are usually advised to lose weight in order to improve their serum lipid profile. The effects of weight loss on serum lipid levels in obese subjects have been investigated extensively. However, differences in experimental design, type of diet, heterogeneity of the subjects studied as well as lack of controlled dietary regimens in some studies, make comparison of these studies difficult. The most controversial issue in weight loss studies is whether or not there is a change in HDL cholesterol concentration after weight loss. Recently, a metaanalysis of 70 weight loss studies has been published, which revealed beneficial effects of weight reduction on all serum lipid levels, including an increase in HDL cholesterol at a stabilised reduced weight (5). However, in this meta-analysis, it was not possible to distinguish between the independent effect of dietary alterations, usually accompanied by weight loss, and of weight reduction per se. It might be that the changes in lipid concentrations could, at least partly, be explained by changes in total fat intake and fatty acid composition of the diets. The current recommendations regarding the dietary management of hypercholesterolemia include a low-fat diet with a high ratio of polyunsaturated to saturated fat (P/S-ratio) (6,7). To our knowledge, no previous studies have examined the independent effects of losing body weight on the one hand and of lowering the total fat intake and increasing the P/S-ratio of the diet as indicated by dietary guidelines on the other hand, on altering the serum lipid profile in obese subjects. The purpose of the present study was to evaluate the effects of these factors separately by introducing a change in nutrient composition either simultaneously with or preceding a period of energy restriction.
SUBJECTS AND METHODS
Subjects This study was part of a project concerning the effects of weight loss on energy metabolism, serum lipids, body composition, and several hormones in relation to visceral fat accumulation (8,9). Participants were recruited by means of advertisements in local newspapers. Fifty obese subjects (26 women and 24 men) were selected on the basis of their body mass index (between 28 and 38 kg/m2), age (between 25 and 51 years), premenopausal state, smoking behaviour (less than 5 cigarettes per day) and drinking behaviour (less than 2 alcoholic consumptions per day). The subjects selected were apparently healthy, as evaluated by a medical history, a physical examination, an urine
68
Weight loss, diet and serum lipids
test for glycosuria and proteinuria, and a blood screening for serum levels of total cholesterol, triglycerides and glucose. The levels of serum lipids of the subjects before the experiment ranged from 3.67 to 7.78 mmol/L (mean, 6.00 mmol/L) for total cholesterol and from 0.38 to 2.65 mmol/L (mean, 1.45 mmol/L) for triglycerides. Serum glucose levels ranged from 4.90 to 7.10 mmol/L (mean, 5.71 mmol/L) and systolic blood pressure from 110 to 180 mmHg (mean, 141 mmHg). Throughout the study, none of the volunteers received any medications known to affect serum lipids and the women did not use oral contraceptives. None of the subjects had been on a slimming diet for several months before the study.
Seven subjects did not complete the dietary treatment successfully: 3 subjects due to intercurrent illness, 3 subjects for personal reasons and 1 subject was excluded from the analysis, because of suspicion of poor dietary compliance. The lipid levels of this latter subject was unknown at the time of exclusion. In addition, data of 1 woman who was later diagnosed as having subclinical hypothyroidism and of 1 woman who was later found to have severe fasting hyperinsulinemia (>100 jiU/mL), were also excluded. Results of 41 subjects (20 women and 21 men) remained for statistical analysis.
The protocol for the study, which had been approved by the Medical Ethical Committee of the Department of Human Nutrition, was fully explained to the volunteers and all subjects gave their written informed consent. No monetary incentive was given except for the free food.
Diets and design Figure 1 shows the experimental design of the study. Ten subjects per week entered the study over a period of 5 weeks. All subjects consumed a standardized affluent-type high-fat,high-saturated-fat diet (High-Sat) for 3 weeks, during which their body weight was kept stable. At week 1 and 3 of this run-in period, body composition and serum lipid levels were determined. After this period, the subjects were divided into 2 groups matched for age and body mass index within each sex.
One group ('sequential' group: 8 women, 11 men) was fed a weight-stable low-fat,low-saturated-fat diet (Low-Sat) for 7 weeks. This diet consisted of a low percent of energy provided by total fat and a high P/S-ratio. At the end of week 7, all measurements were repeated. The subjects subsequently received a 4.2 MJ/day energy-deficit diet for 13 weeks with the same nutrient composition as the Low-Sat diet. The individual amount of energy provided equalled daily energy intake at the end of the weight-stable Low-Sat diet minus 4.2 MJ/day. Measurements of body composition were repeated after 7 and 13 weeks in this slimming period. After this period, the subjects were given a weight-stabilising diet for 3 weeks with the same nutrient composition as the Low-Sat diet. At the end of this stabilisation period, all measurements were repeated.
69
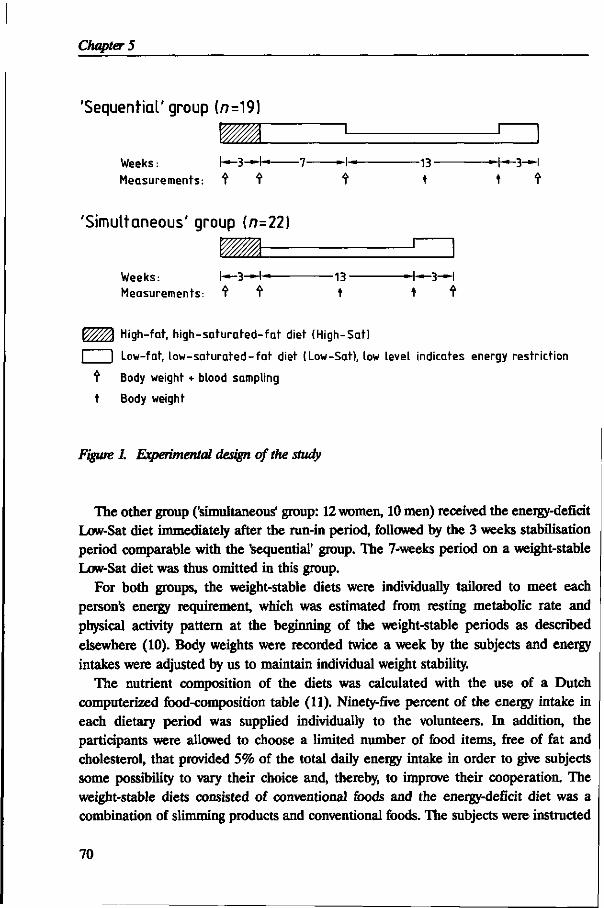
Chapter 5
'Sequential' group (/?=19)
Weeks: h—3—+—
Measurements: t t -13-
t
J"
—+—3—I
'Simultaneous' group (n=22)
Weeks: I—3—I— Measurements: t f
-13-
_T
-4—3-H
High-tat, high-saturated-tat diet (High-Sat)
I Low-fat, low-saturated-fat diet (Low-Sat), low level indicates energy restriction
t Body weight + blood sampling
t Body weight
Figure 1. Experimental design of the study
The other group ('simultaneous' group: 12 women, 10 men) received the energy-deficit Low-Sat diet immediately after the run-in period, followed by the 3 weeks stabilisation period comparable with the 'sequential' group. The 7-weeks period on a weight-stable Low-Sat diet was thus omitted in this group.
For both groups, the weight-stable diets were individually tailored to meet each person's energy requirement, which was estimated from resting metabolic rate and physical activity pattern at the beginning of the weight-stable periods as described elsewhere (10). Body weights were recorded twice a week by the subjects and energy intakes were adjusted by us to maintain individual weight stability.
The nutrient composition of the diets was calculated with the use of a Dutch computerized food-composition table (11). Ninety-five percent of the energy intake in each dietary period was supplied individually to the volunteers. In addition, the participants were allowed to choose a limited number of food items, free of fat and cholesterol, that provided 5% of the total daily energy intake in order to give subjects some possibility to vary their choice and, thereby, to improve their cooperation. The weight-stable diets consisted of conventional foods and the energy-deficit diet was a combination of slimming products and conventional foods. The subjects were instructed
70
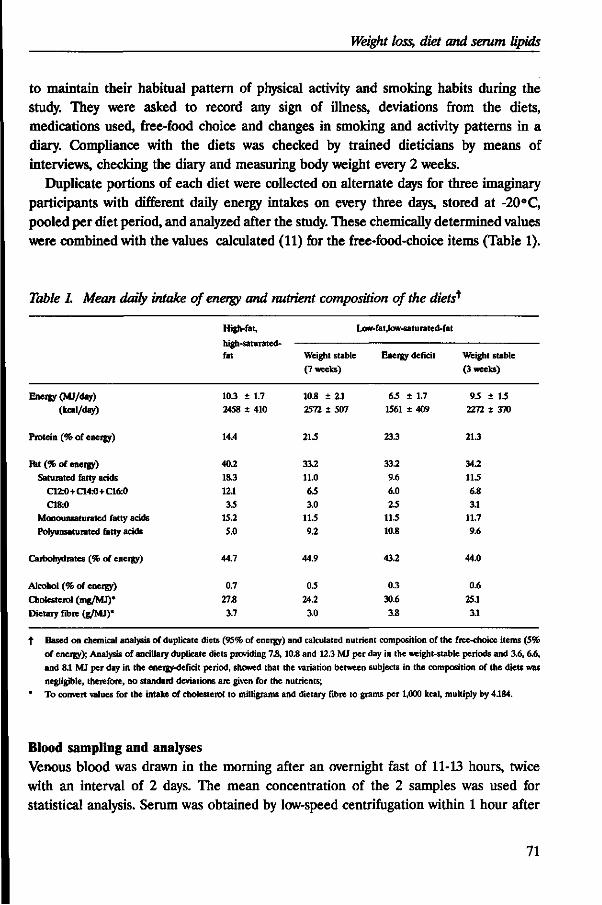
Weight loss, diet and serum lipids
to maintain their habitual pattern of physical activity and smoking habits during the study. They were asked to record any sign of illness, deviations from the diets, medications used, free-food choice and changes in smoking and activity patterns in a diary. Compliance with the diets was checked by trained dieticians by means of interviews, checking the diary and measuring body weight every 2 weeks.
Duplicate portions of each diet were collected on alternate days for three imaginary participants with different daily energy intakes on every three days, stored at -20 °C, pooled per diet period, and analyzed after the study. These chemically determined values were combined with the values calculated (11) for the free-food-choice items (Table 1).
Table 1. Mean daily intake of energy and nutrient composition of the diets*
Energy (MJ/day)
(kcal/day)
Protein (% of energy)
ftt (% of energy) Saturated fatty acids
C12:0+C14:0+C16:0
C18:0 Monounsaturated fatty acids Polyunsaturated fatty acids
Carbohydrates (% of energy)
Alcohol (% of energy)
Cholesterol (mg/MJ)*
Dietary fibre (g/MJ)*
High -fat,
iiigu-oaiuiaicu-fat
10.3 2458
14.4
40.2 18.3
12.1
3.5 15.2 5.0
44.7
0.7
27.8 3.7
± 1.7 i 410
Weight stable
(7 weeks)
10.8
2572
21.5
33.2 11.0
6.5
3.0 11.5 9.2
44.9
0.5
24.2
3.0
± 2.1 ± 507
Low-fat,low-saturated-fat
Energy
65 ±
1561 ±
23.3
33.2
9.6 6.0
2.5 11.5 10.8
43.2
0.3
30.6 3.8
deficit
1.7 409
Weight stable
(3 weeks)
9.5 ± IS 2272 ± 370
21.3
34.2 11.5
6.8 31
11.7 9.6
44.0
0.6
25.1
31
Based on chemical analysis of duplicate diets (95% of energy) and calculated nutrient composition of the free-choice items (5% of energy); Analysis of ancillary duplicate diets providing 7.8,10.8 and 12.3 MJ per day in the weight-stable periods and 3.6, 6.6, and 81 MJ per day in the energy-deficit period, showed that the variation between subjects in the composition of the diets was negligible, therefore, no standard deviations are given for the nutrients; To convert values for the intake of cholesterol to milligrams and dietary fibre to grams per 1,000 kcal, multiply by 4.184.
Blood sampling and analyses Venous blood was drawn in the morning after an overnight fast of 11-13 hours, twice with an interval of 2 days. The mean concentration of the 2 samples was used for statistical analysis. Serum was obtained by low-speed centrifugation within 1 hour after
71
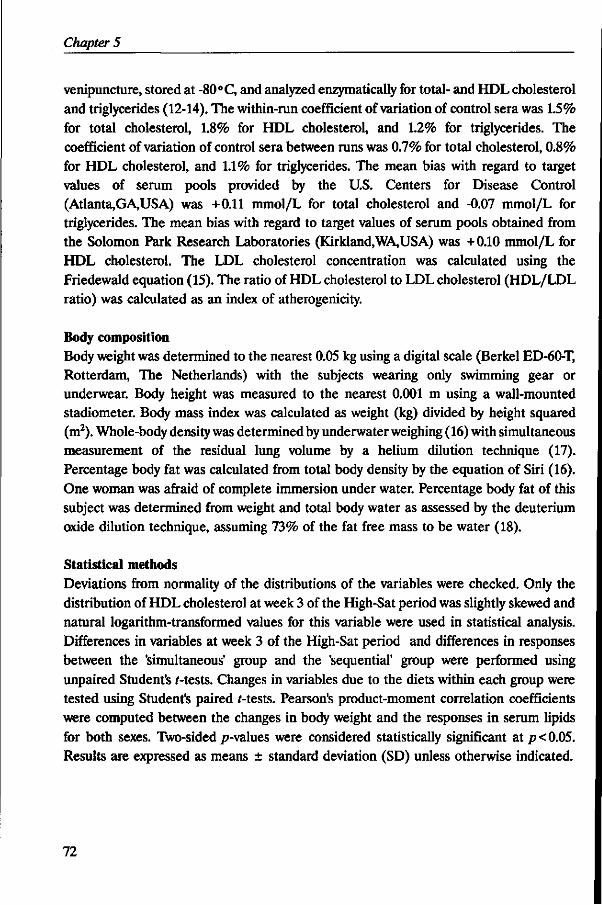
Chapter 5
venipuncture, stored at -80 °C, and analyzed enzymatically for total- and HDL cholesterol and triglycerides (12-14). The within-run coefficient of variation of control sera was 1.5% for total cholesterol, 1.8% for HDL cholesterol, and 1.2% for triglycerides. The coefficient of variation of control sera between runs was 0.7% for total cholesterol, 0.8% for HDL cholesterol, and 1.1% for triglycerides. The mean bias with regard to target values of serum pools provided by the U.S. Centers for Disease Control (Atlanta,GA,USA) was +0.11 mmol/L for total cholesterol and -0.07 mmol/L for triglycerides. The mean bias with regard to target values of serum pools obtained from the Solomon Park Research Laboratories (Kirkland,WA,USA) was +0.10 mmol/L for HDL cholesterol. The LDL cholesterol concentration was calculated using the Friedewald equation (15). The ratio of HDL cholesterol to LDL cholesterol (HDL/LDL ratio) was calculated as an index of atherogenicity.
Body composition Body weight was determined to the nearest 0.05 kg using a digital scale (Berkel ED-60-T, Rotterdam, The Netherlands) with the subjects wearing only swimming gear or underwear. Body height was measured to the nearest 0.001 m using a wall-mounted stadiometer. Body mass index was calculated as weight (kg) divided by height squared (m2). Whole-body density was determined by underwater weighing (16) with simultaneous measurement of the residual lung volume by a helium dilution technique (17). Percentage body fat was calculated from total body density by the equation of Siri (16). One woman was afraid of complete immersion under water. Percentage body fat of this subject was determined from weight and total body water as assessed by the deuterium oxide dilution technique, assuming 73% of the fat free mass to be water (18).
Statistical methods Deviations from normality of the distributions of the variables were checked. Only the distribution of HDL cholesterol at week 3 of the High-Sat period was slightly skewed and natural logarithm-transformed values for this variable were used in statistical analysis. Differences in variables at week 3 of the High-Sat period and differences in responses between the 'simultaneous' group and the 'sequential' group were performed using unpaired Student's Mests. Changes in variables due to the diets within each group were tested using Student's paired Mests. Pearson's product-moment correlation coefficients were computed between the changes in body weight and the responses in serum lipids for both sexes. Two-sided p-values were considered statistically significant at p< 0.05. Results are expressed as means ± standard deviation (SD) unless otherwise indicated.
72
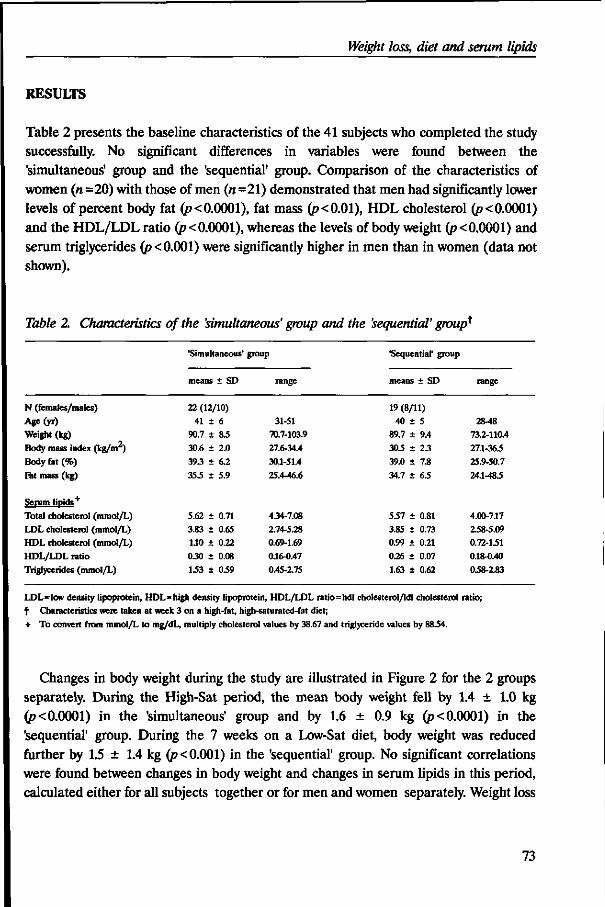
Weight loss, diet and serum lipids
RESULTS
Table 2 presents the baseline characteristics of the 41 subjects who completed the study successfully. No significant differences in variables were found between the 'simultaneous' group and the 'sequential' group. Comparison of the characteristics of women (n=20) with those of men («=21) demonstrated that men had significantly lower levels of percent body fat (p<0.0001), fat mass (p<0.01), HDL cholesterol (p<0.0001) and the HDL/LDL ratio (p < 0.0001), whereas the levels of body weight (p < 0.0001) and serum triglycerides (p< 0.001) were significantly higher in men than in women (data not shown).
Table 2. Characteristics of the 'simultaneous' group and the 'sequential' group*
N (females/males)
Age(yr)
Weight (kg)
Body mass index (kg/m )
Body fat (%)
Eat mass (kg)
Serum lipids'1'
Total cholesterol (mmol/L)
LDL cholesterol (mmol/L)
HDL cholesterol (mmol/L)
HDL/LDL ratio
Triglycerides (mmol/L)
'Simultaneous'
means ± SD
22 (12/10)
41 ±
90.7 ±
30.6 ±
39.3 ±
35.5 ±
5.62 ±
3.83 ±
1.10 ±
0.30 ±
1.53 ±
6
8.5
2.0
6.2
5.9
0.71
0.65
0.22
0.08
0.59
group
range
31-51 70.7-103.9
27.6-34.4
30.1-51.4
25.4-46.6
4.34-7.08
2.74-5.28
0.69-1.69
016-0.47
0.45-2.75
'Sequential' group
means ± SD
19 (8/11)
40 ±
89.7 ±
30.5 ±
39.0 ±
34.7 ±
5.57 ±
3.85 ±
0.99 ±
0.26 ±
1.63 ±
5
9.4
2.3
7.8
63
0.81
0.73
0.21
0.07
0.62
range
2848
73.2-110.4
27.1-363
25.9-50.7
24.1483
4.00-717
238-5.09
0.72-131
018-0.40
038-2.83
LDL=low density lipoprotein, HDL* high density lipoprotein, HDL/LDL ratio=hdl cholesterol/ldl cholesterol ratio; t Characteristics were taken at week 3 on a high-fat, high-saturated-fat diet;
+ To convert from mmol/L to mg/dL, multiply cholesterol values by 38.67 and triglyceride values by 8834.
Changes in body weight during the study are illustrated in Figure 2 for the 2 groups separately. During the High-Sat period, the mean body weight fell by 1.4 ± 1.0 kg {p< 0.0001) in the 'simultaneous' group and by 1.6 ± 0.9 kg (p< 0.0001) in the 'sequential' group. During the 7 weeks on a Low-Sat diet, body weight was reduced further by 1.5 ± 1.4 kg (p< 0.001) in the 'sequential' group. No significant correlations were found between changes in body weight and changes in serum lipids in this period, calculated either for all subjects together or for men and women separately. Weight loss
73
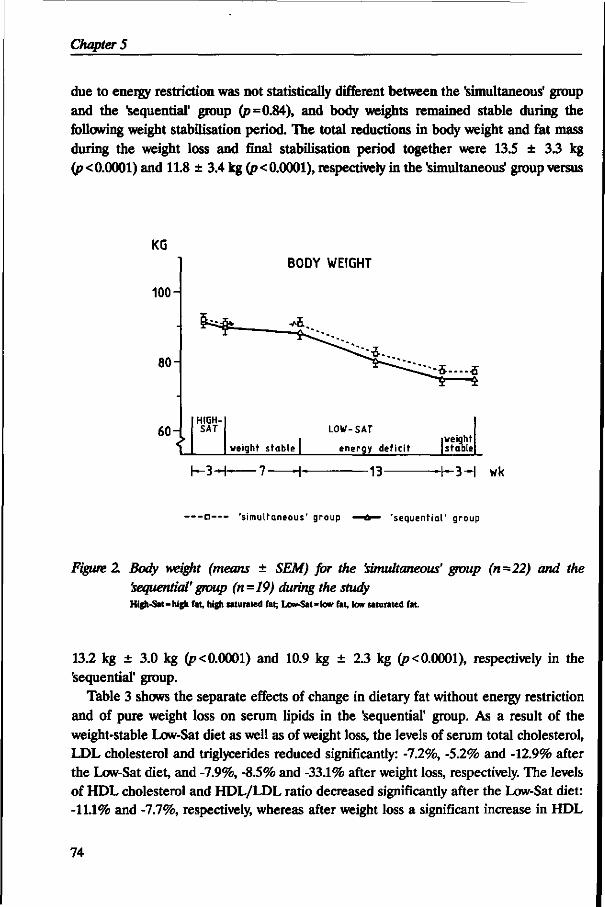
Chapter 5
due to energy restriction was not statistically different between the 'simultaneous' group and the "sequential' group (p=0.84), and body weights remained stable during the following weight stabilisation period. The total reductions in body weight and fat mass during the weight loss and final stabilisation period together were 13.5 ± 3.3 kg (p<0.0001) and 11.8 ± 3.4 kg (p<0.0001), respectively in the 'simultaneous' group versus
KG
100-
80-
60-
B0DY WEIGHT
1 HIGH-SAT LOW-SAT
weight stable | energy deficit • weight stable
K 3 - H 7- -13- -3H wk
— - • — - 'simultaneous' group 'sequential' group
Figure 2 Body weight (means ± SEM) for the 'simultaneous' group (n=22) and the 'sequential' group (n=19) during the study High-Sal=high fat, high saturated fat; Low-Sat=low fat, low saturated fat.
13.2 kg ± 3.0 kg (p< 0.0001) and 10.9 kg ± 2.3 kg (p< 0.0001), respectively in the 'sequential' group.
Table 3 shows the separate effects of change in dietary fat without energy restriction and of pure weight loss on serum lipids in the 'sequential' group. As a result of the weight-stable Low-Sat diet as well as of weight loss, the levels of serum total cholesterol, LDL cholesterol and triglycerides reduced significantly: -7.2%, -5.2% and -12.9% after the Low-Sat diet, and -7.9%, -8.5% and -33.1% after weight loss, respectively. The levels of HDL cholesterol and HDL/LDL ratio decreased significantly after the Low-Sat diet: -11.1% and -7.7%, respectively, whereas after weight loss a significant increase in HDL
74
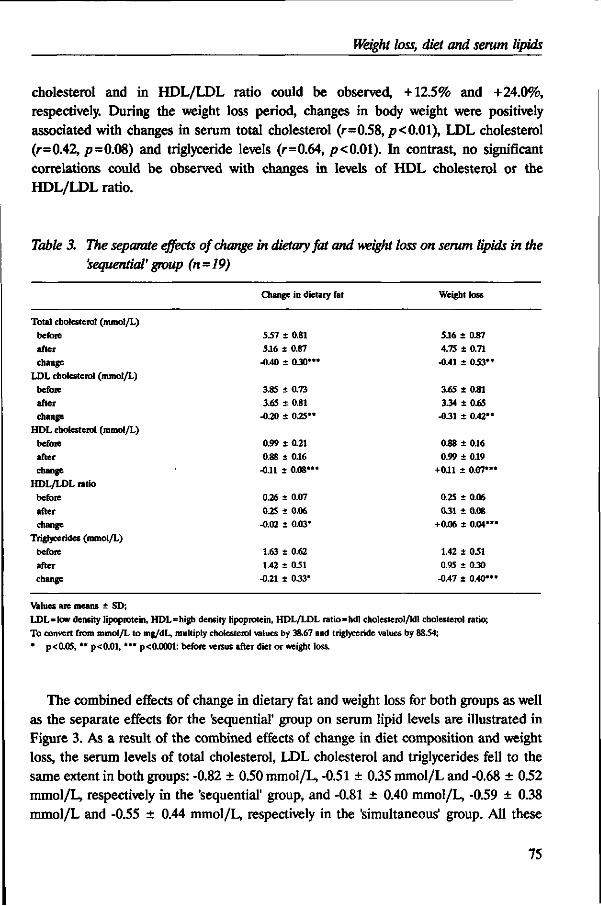
Weight loss, diet and serum lipids
cholesterol and in HDL/LDL ratio could be observed, +12.5% and +24.0%, respectively. During the weight loss period, changes in body weight were positively associated with changes in serum total cholesterol (r=0.58, p< 0.01), LDL cholesterol (r=0.42, /?=0.08) and triglyceride levels (r=0.64, p<0.01). In contrast, no significant correlations could be observed with changes in levels of HDL cholesterol or the HDL/LDL ratio.
Table 3. The separate effects of change in dietary fat and weight loss on serum lipids in the 'sequential' group (n=19)
Total cholesterol (mmol/L)
before
after change
LDL cholesterol (mmol/L) before
after change
HDL cholesterol (mmol/L) before after change
HDL/LDL ratio
before
after change
Triglycerides (mmol/L)
before
after change
Values are means ± SD; LDL=low density lipoprotein, HDL=high density lipoprotein, HDL/LDL ratio=hdl cholesterol/ldl cholesterol ratio;
To convert from mmol/L to mg/dL, multiply cholesterol values by 38.67 and triglyceride values by 8834; * p<0.05, ** p<0.01, •** p<0.0001: before versus after diet or weight loss.
The combined effects of change in dietary fat and weight loss for both groups as well as the separate effects for the 'sequential' group on serum lipid levels are illustrated in Figure 3. As a result of the combined effects of change in diet composition and weight loss, the serum levels of total cholesterol, LDL cholesterol and triglycerides fell to the same extent in both groups: -0.82 ± 0.50 mmol/L, -0.51 ± 0.35 mmol/L and -0.68 ± 0.52 mmol/L, respectively in the 'sequential' group, and -0.81 ± 0.40 mmol/L, -0.59 ± 0.38 mmol/L and -0.55 ± 0.44 mmol/L, respectively in the 'simultaneous' group. All these
75
Change in dietary fat
5.57 i 0.81 5.16 ± 0.87
-0.40 ± 0.30"*
3.85 ± 0.73 3.65 S 0.81
-0.20 ± 0.25"
0.99 ± 0.21
0.88 ± 016 -0.11 ± 0.08*"
0.26 ± 0.07
0.25 ± 0.06 -0.02 ± 0.03*
1.63 ± 0.62 1.42 ± 031
-0.21 ± 0.33*
Weight loss
5.16 ± 0.87 4.75 ± 0.71 -0.41 i OSV
3.65 ± 0.81 3.34 ± 0.65
-0.31 + 0.42'
0.88 ± 0.16 0.99 ± 0.19
+011 ± 0.07*
0.25 t 0.06
0.31 ± 0.08 +0.06 + 0.04<
1.42 ± 031 0.95 ± 0.30
-0.47 ± 0.40'
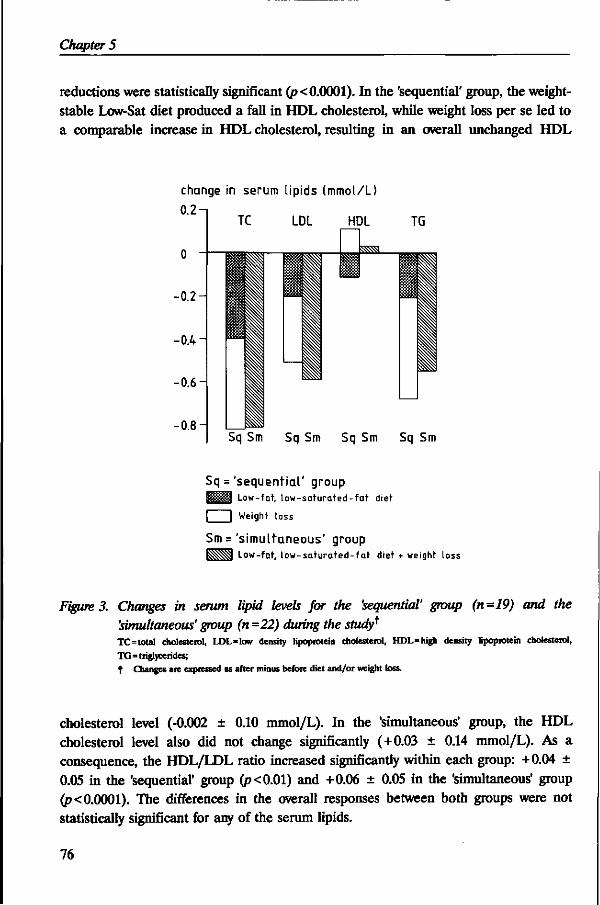
Chapter 5
reductions were statistically significant (p< 0.0001). In the 'sequential' group, the weight-stable Low-Sat diet produced a fall in HDL cholesterol, while weight loss per se led to a comparable increase in HDL cholesterol, resulting in an overall unchanged HDL
change in serum lipids (mmol/L)
0.2-
-0.2
-0.4 i
-0.6
-0.8 H
TC LDL HDL
m ssa
TG
Sq Sm Sq Sm Sq Sm Sq Sm
Sq = 'sequential ' group I J J M Low-fat, l ow-saturated- fa t diet
I | Weight loss
Sm ='simultaneous' group BSSSSi Low-fat, l ow-sa tura ted- fa t diet + weight loss
Figure 3. Changes in serum lipid levels for the 'sequential' group (n=19) and the 'simultaneous' group (n =22) during the study* TC=total cholesterol, LDL=low density lipoprotein cholesterol, HDL=high density lipoprotein cholesterol,
TG=triglycerides; t Changes are expressed as after minus before diet and/or weight loss.
cholesterol level (-0.002 ± 0.10 mmol/L). In the 'simultaneous' group, the HDL cholesterol level also did not change significantly (+0.03 ± 0.14 mmol/L). As a consequence, the HDL/LDL ratio increased significantly within each group: +0.04 ± 0.05 in the 'sequential' group (p<0.01) and +0.06 ± 0.05 in the 'simultaneous' group (p< 0.0001). The differences in the overall responses between both groups were not statistically significant for any of the serum lipids.
76
Weight loss, diet and serum lipids
DISCUSSION
The main findings of this strictly controlled study in moderately obese subjects are that the nett favourable effect of body weight loss on serum lipids as a result of energy restriction seems to be greater than that of reduction in fat intake and increase in P/S-ratio of the diet. Furthermore, the separate effects of weight loss and dietary fat modification appear to be additive. The HDL cholesterol-lowering effect of a low-fat diet with a high P/S-ratio was effectively counteracted by the effect of losing body weight.
The design of the present study makes it possible to distinguish the effects of weight loss per se from the effects of dietary fat modification. Switching from an affluent-type diet to a diet with a decreased percent of energy provided by total fat and an increased P/S-ratio without energy restriction by obese subjects, resulted in reductions of all serum lipid levels, including HDL cholesterol. Dietary guidelines recommend a decrease in intake of total fat from the current average of 40 percent of energy in most affluent societies down to about 30 percent. In particular, the intake of saturated fatty acids should be reduced (6,7). However, it has been suggested that a reduction in total fat intake may lower HDL cholesterol levels (19-21). In the present study, HDL cholesterol was significantly reduced on a weight-stable low-fat,low-saturated-fat diet both in males and in females. The reduction in women was significantly greater (p<0.05) than that in men (-0.16 ± 0.08 mmol/L (14.5%) and -0.07 ± 0.05 mmol/L (7.8%), respectively). Whether or not this is a real gender difference in response to a low-fat,low-saturated-fat diet remains to be established.
The change in serum total cholesterol as a result of the change to the low-fat diet with a high P/S-ratio in this study was less than the 0.58 mmol/L predicted from the Keys' equation (22). Cole et al. (23) also demonstrated smaller decreases than predicted by Keys' equation in obese subjects. They speculated that obesity may diminish the responsiveness to dietary change. This is in accordance with the observations of Goff and colleagues, which indicated that fatter men apparently do not benefit from a diet lower in cholesterol (24). In the present study, the subjects were highly motivated and the average weight loss was of a magnitude expected from a 4.2 MJ/day deficit diet. Distortion of the results due to lack of dietary compliance is, therefore, thought to be minimal.
It should be noted that isocaloric replacement of dietary fat by carbohydrates as advocated by the dietary guidelines instead of by protein in this study, might produce a less favourable serum lipid profile than observed in the present study. In a study with moderately hypercholesterolemic subjects, it has been demonstrated that isocaloric substitution of dietary protein for carbohydrate lowers total-, LDL cholesterol, and triglycerides and increases HDL cholesterol (25), while the findings of Lithell et al. (26) indicated that carbohydrates increase the VLDL level and slightly decrease HDL
77
Chapter 5
cholesterol compared with dietary protein. Pure weight loss of approximately 13 kg of which 83% was fat, had beneficial effects
on all serum lipid levels. During this weight loss period, changes in body weight were positively associated with changes in serum total cholesterol, LDL cholesterol and triglyceride levels, whereas no significant correlations were observed with changes in HDL cholesterol or the HDL/LDL ratio. This latter result could possibly be explained by the relatively small variation in the responses of HDL cholesterol in this study. Another explanation could be that the amount of weight loss per se might not entirely be responsible for changes in HDL cholesterol concentrations. Previous studies have reported that significant increases of serum HDL cholesterol may occur in obese subjects in response to weight loss after their body weight has been stable for some time (5,27). In agreement with these findings, Schwartz and Brunzell (28) found an enhanced activity of adipose tissue lipoprotein-lipase after weight stabilisation at a reduced body weight, resulting in increased HDL cholesterol levels, whereas during active weight loss a decreased lipoprotein-lipase activity has been observed (29).
In the present study, the average weight losses per se in men and women were similar, 12.8 ± 3.0 kg and 13.8 ± 3.1 kg, respectively. Comparing the responses of serum lipids to the weight losses of obese men with those of women clearly demonstrated no sex-specific pattern: decreases in serum levels of total cholesterol, LDL cholesterol and triglycerides were -9.2%, -9.8%, and -33.5% in men and -6.3%, -6.6%, and -33.3% in women, respectively. There were considerable increases in average HDL cholesterol and the HDL/LDL ratio in men (+13.3%, +25.0%, respectively) as well as in women (+11.7%, +19.2%, respectively).
The present study shows that the effects of weight loss and that of change to a low-fat diet with a high P/S-ratio were additive: the total effect of slimming on reducing serum levels of total-, LDL cholesterol and triglycerides could be ascribed for 50%, 61%, and 69%, respectively, to weight loss per se. The unfavourable reductions in HDL cholesterol and the HDL/LDL ratio in response to the recommended dietary fat modification without energy restriction, were compensated by weight loss. In conclusion, our findings support beneficial effects of a diet low in total fat and a high P/S-ratio on some serum lipid levels in obese subjects. The considerable additive effects of weight loss per se underscores the importance of establishing successful dietary treatment and weight maintenance programmes for obesity.
REFERENCES
1. Manson JE, Colditz GA, Stampfer MJ, Willett WC, Rosner B, Monson RR, et al. A prospective study of obesity and risk of coronary heart disease in women. N Engl J Med 1990;322:882-889.
2. Seidell JC, Deurenberg P, Hautvast JGAJ. Obesity and fat distribution in relation to health -current insights and
78
Weight loss, diet and serum lipids
recommendations. Wld Rev Nutr Diet 1987;50:57-91.
3. Gordon DJ, Rifkind BM. High-density lipoprotein -the clinical implications of recent studies. N Engl J Med 1989;321:1311-1316.
4. Stamler J, Wentworth D, Neaton JD. Is relationship between serum cholesterol and risk of premature death from coronary heart disease continuous and graded? Findings in 356 222 primary screenees of the Multiple Risk Rctor Intervention Trial (MRFIT). JAMA 1986;256:2823-2828.
5. Dattilo AM, Kris-Etherton PM. Effects of weight reduction on blood lipids and lipoproteins: a meta-analysis. Am J Clin Nutr 1992;56:320-328.
6. Consensus Conference. Lowering blood cholesterol to prevent heart disease. JAMA 1985;253:2080-2086. 7. Erkelens DW. Cholesterol consensus in the Netherlands. Eur J Clin Nutr 1989;43:89-96. 8. Kooy K van der, Leenen R, Deurenberg P, Seidell JC, Westerterp KR, Hautvast JGAJ. Changes in fat-free mass in obese subjects
after weight loss: a comparison of body composition measures. Int J Obesity 1992;16:675-683.
9. Leenen R, Kooy K van der, Seidell JC, Deurenberg P. Visceral fat accumulation measured by magnetic resonance imaging in relation to serum lipids in obese men and women. Atherosclerosis 1992;94:171-181.
10. Weststrate JA, Hautvast JGAJ. The effects of short-term carbohydrate overfeeding and prior exercise on resting metabolic rate and diet-induced thermogenesis. Metabolism 1990;39:1232-1239.
11. Commissie UCV. UCV tabel. The Hague.The Netherlands: Voorlichtingsbureau voor de Voeding, 1985. 12. Siedel J, Hagele EO, Ziegenhorn J, Wahlefeld AW. Reagent for the enzymatic determination of serum total cholesterol with
improved lipolytic efficiency. Clin Chem 1983;29:1075-1080.
13. Warnick GR, Benderson J, Albers JJ. Dextran sulfate-Mgr precipitation procedure for quantitation of high-density-lipoprotein cholesterol. Clin Chem 1982;28:1379-1388.
14. Sullivan DR, Kruijswijk Z, West CE, Kohlmeier M, Katan MB. Determination of serum triglycerides by an accurate enzymatic method not affected by free glycerol. Clin Chem 1985;31:1227-1228.
15. Friedewald WT, Levy RI, Fredrickson DS. Estimation of the concentration of low-density lipoprotein cholesterol in plasma, without use of the preparative ultracentrifuge. Clin Chem 1972;18:499-502.
16. Siri WE. The gross composition of the body. In: Tobias CA, Lawrence JH, eds. Advances in biological and medical physics IV. New York: The Academic Press, 1956:239-280.
17. Comroe JH, Forster RE, Dubois AB, Briscoe WA, Carlsen E, eds. The lung-clinical physiology and pulmonary function tests. Chicago: Year Book Medical Publishers, 1977.
18. Pace N, Rathbun EN. Studies on body composition III. The body water and chemically combined nitrogen content in relation to fat content. J Biol Chem 1945;158:685-691.
19. Mensink RP, Katan MB. Effect of monounsaturated fatty acids versus complex carbohydrates on high-density lipoproteins in healthy men and women. Lancet 1987;i: 122-125.
20. Sacks FM, Handysides GH, Marais GE, Rosner B, Kass EH. Effects of a low-fat diet on plasma lipoprotein levels. Arch Intern Med 1986;146:1573-1577.
21. Grundy SM. Comparison of monounsaturated fatty acids and carbohydrates for lowering plasma cholesterol. N Engl J Med 1986;314:748-748.
22. Keys A, Anderson JT, Grande F. Serum cholesterol response to changes in the diet. IV. Particular saturated fatty acids in the diet. Metabolism 1965;14:776-787.
23. Cole TG, Bowen PE, Schmeisser D, Prewitt TE, Aye P, Langenberg P, et al. Differential reduction of plasma cholesterol by the American Heart Association Phase 3 Diet in moderately hypercholesterolemic, premenopausal women with different body mass indexes. Am J Clin Nutr 1992;55:385-394.
24. Goff DC, Shekelle RB, Katan MB, Gotto AM, Stamler J. Does body fatness modify the association between dietary cholesterol and risk of coronary death? Results from the Chicago Western Electric study. Arteriosclerosis and Thrombosis 1992;12:755-761.
25. Wolfe BM, Giovannetti PM. Short-term effects of substituting protein for carbohydrate in the diets of moderately hypercholesterolemic human subjects. Metabolism 1991;40:338-343.
26. Lithell H, Karlstrdm B, Selinus I, Vessby B, Fellstrdm B. Is muscle lipoprotein lipase inactivated by ordinary amounts of dietary carbohydrates? Hum Nutr: Clin Nutr 198S;39C289-295.
27. Zimmerman J, Kaufmann NA, rainaru M, Eisenberg S, Oschry Y, Friedlander Y, et al. Effect of weight loss in moderate obesity on plasma lipoprotein and apolipoprotein levels and on high density lipoprotein composition. Arteriosclerosis 1984;4:115-123.
28. Schwartz RS, Brunzell JD. Increase in adipose tissue lipoprotein lipase activity with weight loss. J Clin Invest 1981;67:1425-1430.
29. Taskinen M-R, Nikkila EA. Effects of caloric restriction on lipid metabolism in man. Changes of tissue lipoprotein lipase activities and of serum lipoproteins. Atherosclerosis 1979;32:289-299.
79
CHAPTER 6
VISCERAL FAT ACCUMULATION IN RELATION TO SEX HORMONES IN OBESE MEN AND WOMEN UNDERGOING WEIGHT LOSS THERAPY*
Rianne Leenen, Karin van der Kooy, Jaap C. Seidell, Paul Deurenberg, Hans P.F. Koppeschaar
ABSTRACT
In 70 healthy obese subjects (37 men and 33 premenopausal women: age 27-51 yr, body mass index 28-38 kg/m2), associations between initial body fat distribution and sex hormone levels were studied as well as between changes that occurred in response to a 4.2 MJ/day deficit diet for 13 weeks. Visceral and subcutaneous abdominal fat areas were determined by magnetic resonance imaging. In women, visceral fat accumulation was significantly related to diminished levels of sex-hormone-binding-globulin (SHBG) and the ratio of free 176-estradiol (ly/free testosterone (T) and to elevated levels of free T, after adjustment for age and total fat mass. In men, total body fatness and subcutaneous abdominal fat, but not visceral fat, were significantly inversely associated with total T and free T levels. The mean total fat loss was 11.3 ± 3.3 (SD) kg as a result of the energy-deficit diet. In women, loss of visceral fat was significantly related to rises in SHBG level and the free E^/free T ratio independent of total body fat loss, whereas in men, only the correlation between visceral fat loss and increase in estrone level reached statistical significance. In conclusion, in obese premenopausal women, visceral fat predominance seems to be associated with a relatively increased androgenicity. In obese men, sex steroid levels appear to depend mainly on the degree of obesity. In obese women but not in obese men, visceral fat loss seems to be accompanied by a relative reduction in androgenicity regardless of total body fat loss.
INTRODUCTION
Several studies have shown that obesity (1-8) and, particularly, the distribution of body fat (9-19) are associated with various abnormalities of sex hormone metabolism.
* Submitted for publication.
81
Chapter 6
Abdominal fat distribution has been found to be an independent risk factor for metabolic disorders such as coronary heart disease and diabetes mellitus (20-21). It has been suggested that sex steroids may play an important role in the regulation of regional fat accumulation and mobilization (22,23), and they may be determinants of coronary heart disease as well (24,25).
Numerous studies have investigated the relationship between abdominal fat distribution and sex steroids in peripheral blood (7-19,26). The majority of these studies demonstrated that an abdominal type of fat distribution is accompanied by diminished levels of sex-hormone-binding-globulin (SHBG). Furthermore, it has been reported that predominance of fat in the abdomen is associated with low androgen levels in men (10), whereas in women, with increased androgenicity as reflected by elevated levels of total testosterone (T) (13,16,19), free T (16,17,19) or percentages of free T (11,12). However, not all studies could confirm these findings. The discrepancies may be explained by differences in study population and in methods used for the assessment of hormone levels and body fat distribution. In virtually all studies, the waist/hip ratio (WHR) was used as a measure of fat distribution. Imaging techniques such as computed tomography and magnetic resonance imaging, however, give more accurate information about the separate adipose tissue depots (visceral and subcutaneous) than the WHR. Only in the study of Seidell et al. (10) were fat areas included, which were determined by computed tomography.
In general, weight loss has been reported to reverse abnormal levels of sex steroids in obese subjects, suggesting that these endocrine abnormalities are a result rather than a cause of obesity (3-7,27). To our knowledge, only Pasquali et al. (27) have investigated whether changes in fat distribution due to weight reduction were associated with changes in sex steroid levels in obese hyperandrogenic amenorrheic women. However, they have measured changes in body fat distribution by the WHR, which is reported to be an inappropriate indicator for the evaluation of changes in visceral fat (28). To our knowledge, no studies have reported on the effects of reduction of the visceral fat depot on sex steroids in obese subjects.
In the present prospective study, the relationships between visceral adipose tissue, measured by magnetic resonance imaging, and sex steroids were examined in moderately obese men and premenopausal women undergoing weight loss therapy.
SUBJECTS AND METHODS
Subjects Participants were recruited by means of advertisements in local newspapers. Ninety-six obese subjects (48 women and 48 men) were selected on the basis of their age (between
82
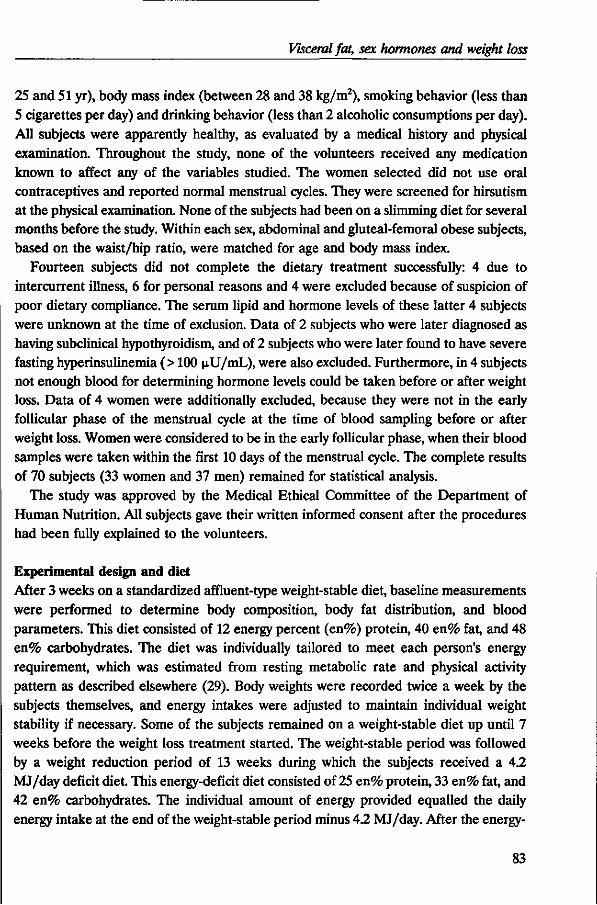
Visceral fat, sex hormones and weight loss
25 and 51 yr), body mass index (between 28 and 38 kg/m2), smoking behavior (less than 5 cigarettes per day) and drinking behavior (less than 2 alcoholic consumptions per day). All subjects were apparently healthy, as evaluated by a medical history and physical examination. Throughout the study, none of the volunteers received any medication known to affect any of the variables studied. The women selected did not use oral contraceptives and reported normal menstrual cycles. They were screened for hirsutism at the physical examination. None of the subjects had been on a slimming diet for several months before the study. Within each sex, abdominal and gluteal-femoral obese subjects, based on the waist/hip ratio, were matched for age and body mass index.
Fourteen subjects did not complete the dietary treatment successfully: 4 due to intercurrent illness, 6 for personal reasons and 4 were excluded because of suspicion of poor dietary compliance. The serum lipid and hormone levels of these latter 4 subjects were unknown at the time of exclusion. Data of 2 subjects who were later diagnosed as having subclinical hypothyroidism, and of 2 subjects who were later found to have severe fasting hyperinsulinemia (> 100 jiU/mL), were also excluded. Furthermore, in 4 subjects not enough blood for determining hormone levels could be taken before or after weight loss. Data of 4 women were additionally excluded, because they were not in the early follicular phase of the menstrual cycle at the time of blood sampling before or after weight loss. Women were considered to be in the early follicular phase, when their blood samples were taken within the first 10 days of the menstrual cycle. The complete results of 70 subjects (33 women and 37 men) remained for statistical analysis.
The study was approved by the Medical Ethical Committee of the Department of Human Nutrition. All subjects gave their written informed consent after the procedures had been fully explained to the volunteers.
Experimental design and diet After 3 weeks on a standardized affluent-type weight-stable diet, baseline measurements were performed to determine body composition, body fat distribution, and blood parameters. This diet consisted of 12 energy percent (en%) protein, 40 en% fat, and 48 en% carbohydrates. The diet was individually tailored to meet each person's energy requirement, which was estimated from resting metabolic rate and physical activity pattern as described elsewhere (29). Body weights were recorded twice a week by the subjects themselves, and energy intakes were adjusted to maintain individual weight stability if necessary. Some of the subjects remained on a weight-stable diet up until 7 weeks before the weight loss treatment started. The weight-stable period was followed by a weight reduction period of 13 weeks during which the subjects received a 4.2 MJ/day deficit diet. This energy-deficit diet consisted of 25 en% protein, 33 en% fat, and 42 en% carbohydrates. The individual amount of energy provided equalled the daily energy intake at the end of the weight-stable period minus 4.2 MJ/day. After the energy-
83
Chapter 6
deficit period, the subjects were given a weight-stabilising diet for 3 weeks; this diet had the same nutrient composition as the weight-reduction diet. At the end of this weight-stable period, all measurements were repeated.
The subjects were instructed to maintain their habitual physical activity pattern and smoking habits during the study. They were asked to record any sign of illness, deviations from the diets, the first day of menstruation, medications used, and changes in both smoking and activity patterns in a diary for the entire study period. More information about the diets and dietary compliance has been reported in detail elsewhere (30).
Hormonal analyses Venous blood samples were taken in the morning after an overnight fast of 11-13 hours. Serum was obtained by centrifugation within 1 hour after venipuncture, distributed in aliquots in small plastic cups, and stored at -80 °C until analysis. Levels of sex-hormone-binding-globulin (SHBG) were determined using the immunoradiometric assay of Farmos Diagnostica (Oulunsalo, Finland) with interassay variations of 4.9% at the level of 25 nmol/L, and 4.4% at levels of 54 nmol/L and 106 nmol/L (all levels: n = 18). Total testosterone (T) was measured by radio-immuno-assay (RIA) after extraction with diethylether as described previously (31). The interassay variations were 8.7%, 10.9%, and 12.7% at levels of 0.53 nmol/L, 2.9 nmol/L, and 7.4 nmol/L, respectively (all levels: n=24). Androstenedione (A) was also determined by RIA (31) after extraction with a hexane-toluene mixture (80:20, v/v) with an interassay variation of 9.1% at 2.3 nmol/L (n=28), 7.4% at 7.1 nmol/L («=25), and 11.0% at 12.6 nmol/L (n=25). Determinations of dehydroepiandrostenedione-sulphate (DHEAS) were done by RIA (31) directly in serum using the commercially available reagents from DPC (Los Angeles, USA, 'Coat-a-count'). The interassay variations were 9.4%, 9.7%, and 9.1% at 1.3 nmol/L, 5.4 jimol/L, and 9.7 jimol/L, respectively (all levels: «=30). Estrone (Ej) and total 176-estradiol (E2) were extracted with diethylether, purified and separated by chromatography on Sephadex LH-20 columns using toluene:methanol (92:8, v/v) as eluent and quantitated by RIA (31). Interassay variations for E, were 19.0%, 9.6%, and 7.2% at 148 pmol/L, 457 pmol/L, and 1160 pmol/L, respectively (all levels: n=25), and for E^ 23.6% and 10.0% at levels of 88 pmol/L and 411 pmol/L, respectively (all levels: n=25). The percentages free T and free Ej were calculated indirectly by the use of the equations as described by Nanjee and Wheeler (32), and Moore et al. (33), respectively, and were used to estimate the concentrations of free T and free Ej, respectively.
Body composition All anthropometric measurements were made with the subjects wearing only swimming gear or underwear. Body weight was determined to the nearest 0.05 kg on a digital scale (Berkel ED-60-T, Rotterdam, The Netherlands), and body height was measured to the
84
Visceral fat, sex hormones and weight loss
nearest 0.001 m using a wall-mounted stadiometer. Body mass index was calculated as weight (kg) divided by height squared (m2). Whole-body density was determined by underwater weighing (34). Residual lung volume was measured simultaneously by a helium dilution technique (35). Percent body fat was calculated from total body density according to Siri's formula (34). One woman was afraid of complete immersion under water. Percent body fat of this woman was determined from weight and total body water, assessed by deuterium oxide dilution assuming a hydration coefficient of the fat free mass of 0.73 (36).
Fat distribution Body fat distribution was assessed by circumference measures and by magnetic resonance imaging (MRI). Waist circumference was measured midway between the lower rib margin and the iliac crest at the end of a gentle expiration. Hip circumference was measured at the level of the widest circumference over the great trochanters. The circumferences were measured to the nearest 0.001 m with the subjects standing upright. MRI was performed with a whole-body scanner (GYROSCAN S15, Philips Medical Systems, Best, The Netherlands) using a 1.5-T magnetic field (64 MHz) and a slice thickness of 10 mm. Transverse MRI-scans were taken midway between the lower rib margin and the iliac crest while subjects were lying supine. Imaging analysis to determine the visceral and subcutaneous fat areas, was carried out as described previously (37). In this obese population, the reproducibility of calculating fat areas from the same scan expressed as the coefficient of variation, was better than 6% for visceral fat, and better than 2.5% for subcutaneous abdominal fat. In 6 subjects (3 women, 3 men), only the measurements before weight loss were used for statistical analysis due to practical problems with the measurements after weight loss.
Statistical methods The distributions of DHEAS, free T, and the free Ej/free T ratio before weight loss were slightly skewed. Natural logarithm-transformed values for these variables were used in statistical analyses. The distributions of the changes in SHBG, DHEAS and the free E^free T ratio in response to weight loss were also lightly skewed. However, no transformations for the changes in those variables were used because this resulted in findings principally identical to analyses based on normally distributed variables. Differences in baseline characteristics as well as the differences in responses due to weight loss between the sexes were tested by the Student's unpaired Mest. The effect of weight loss on variables within each sex was tested with the Student's paired /-test. Pearson's product-moment correlations and partial correlation coefficients were computed within each sex by using univariate and multiple linear regression techniques.
85
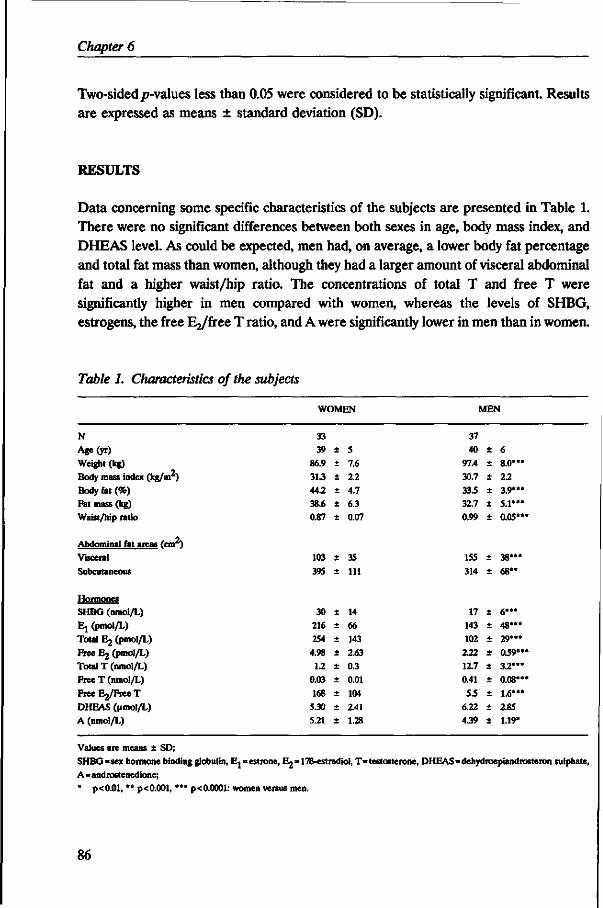
Chapter 6
Two-sided/7-values less than 0.05 were considered to be statistically significant. Results are expressed as means ± standard deviation (SD).
RESULTS
Data concerning some specific characteristics of the subjects are presented in Table 1. There were no significant differences between both sexes in age, body mass index, and DHEAS level. As could be expected, men had, on average, a lower body fat percentage and total fat mass than women, although they had a larger amount of visceral abdominal fat and a higher waist/hip ratio. The concentrations of total T and free T were significantly higher in men compared with women, whereas the levels of SHBG, estrogens, the free I^/free T ratio, and A were significantly lower in men than in women.
Table 1. Characteristics of the subjects
WOMEN MEN
N Age(yr)
Weight (kg) Body mass index (kg/m )
Body fat (%) Fat mass (kg) Waist/hip ratio
Abdominal fat areas (car)
Visceral
Subcutaneous
Hormones SHBG (nmol/L) Ej (pmol/L) Total Ej (pmol/L) Free E2 (pmol/L) Total T (nmol/L) Free T (nmol/L) FreeEj/FreeT DHEAS (umol/L) A (nmol/L)
Values are means ± SD; SHBG=sex hormone binding globulin, Ej=estrone, Ej^lTB-cstradiol, T=testosterone, DHEAS=dehydroepiandrosteron sulphate, A=androstenedione; * p<0.01, " p<0.001, **• p<0.0001: women versus men.
86
33 39
86.9
31.3
44.2
38.6
0.87
103 39S
30 216 254
4.98
1.2 0.03
168 5.30
5.21
+
+
+
±
± ±
+
+
±
+
+
+
+
+
+
±
±
5 7.6 2.2 4.7 6.3 0.07
35
111
14 66
143 2.63
0.3 0.01
104 2.41
1.28
37 40
97.4
30.7
33.5
32.7
0.99
155
314
17 143 102 232 12.7
0.41
S3
6.22
439
+
± +
+
+
+
± +
+
± +
+
+
±
± +
+
6 8.0**«
2.2 3.9***
5.1*"
0.05**
38***
68"
6"* 4 8 " '
2 9 * "
0.59"
3.2*"
0.08**
1.6***
2.85
1.19*
Visceral fat, sex hormones and weight loss
Table 2. Pearson correlation coefficients between age, fat mass and body fat distribution variables with sex hormone levels in obese women (n =33)
SHBG (nmol/L) Ej (pmol/L)
Total E2 (pmol/L) Free E2 (pmol/L)
Total T (nmol/L)
Free T (nmol/L) Free E2/Free T DHEAS (|imol/L) A (nmol/L)
Age
(yr)
-0.04
0.24 0.05 0.07
-0.26
-0.26 0.10
-0.30 -0.11
Fat mass
(kg)
-0.06
-0.03 -0.16 -0.20 0.09
0.11
-0.26 -0.30 -0.02
Abdominal fat
Subcutaneous
0.18 -0.02 -0.08 -0.18 0.04
-0.11
-0.13 -0.13 -0.11
areas (cm2)
Visceral
-0.48" -0.03 -0.26 -0.17
-0.11
0.21 -0.28 -0.15 0.13
Waist/hip ratio
-0.38* -0.17
-0.38' -0.32 -0.19
0.05
-0.31 -0.23 0.01
SHBG=sex hormone binding globulin, Ej=estrone, E2=17B-estradiol, T=testosterone, DHEAS=dehydroepiandrosteron sulphate, A=androstenedione; • p<0.05, " p<0.01.
Table 2 shows the correlations between age, fat mass, and body fat distribution variables with sex hormone levels in women. None of the correlations between age, fat mass or subcutaneous abdominal fat area with sex hormone levels reached statistical significance. Visceral fat area and the WHR were negatively associated with the SHBG
Table 3. Pearson correlation coefficients between age, fat mass and body fat distribution variables with sex hormone levels in obese men (n =37)
SHBG (nmol/L)
Ej (pmol/L) Total Ej (pmol/L)
Free Ej (pmol/L) Total T (nmol/L)
Free T (nmol/L) FreeEj/FreeT
DHEAS (umol/L)
A (nmol/L)
Age
(yr)
0.30 0.07
-0.01
-0.06 -0.06 -0.29 0.12
-0.24 -0.01
Fat mass
(kg)
-0.16
-0.06 -0.25
-0.26 -0.42"
-0.42" -0.01
-0.11 -0.23
Abdominal fat
Subcutaneous
-0.06 -0.14
-0.22
-0.23 -0.33* -0.38* -0.02 -0.24
-0.33*
areas (cm )
Visceral
0.02 -0.17 -0.07
-0.09 -0.10 -0.11 -0.03
-0.04 -0.13
Waist/hip
ratio
-0.07
-0.26 •0.17
-0.18 -0.30 -0.37* 0.05
0.14 -0.22
SHBG=sex hormone binding globulin, E j=estrone, E2=178-estradiol, T=testosterone, DHEAS=dehydroepiandrosteron sulphate, A=androstenedione; * p<0.05, " p<0.01.
87
Chapter 6
level and (not shown) positively with the percentages of free E^ and free T. In the present study, the SHBG level was highly inversely correlated with the calculated free percentages of free T and free E2 in both sexes (r>0.97). The WHR was also significantly inversely related to the total Ej level in women, whereas for visceral fat an inverse trend was observed (p=0.08).
In Table 3, the correlations between age, fat mass, abdominal fat areas, and the WHR with sex hormone levels in men are given. The fat mass and the subcutaneous abdominal fat area as well as the WHR were inversely related to levels of total T and free T. Subcutaneous abdominal fat area was also negatively associated with the A level, whereas visceral fat area was not significantly related to any of the sex hormone levels.
Table 4. Pearson correlation coefficients (adjusted for age and fat mass) between body fat distribution variables and sex hormone levels in obese women (n=33) and men (n=37)
SHBG (nmol/L) Ej (pmol/L)
Total Ej (pmol/L) Free 63 (pmol/L)
Total T (nmol/L) Free T (nmol/L) Free Ej/free T
DHEAS (nmol/L) A (nmol/L)
WOMEN
Visceral fat
(em2)
-0.51** -0.14 -0.31
-0.21 -0.01 0.35*
-0.36*
-0.01 0.19
Waist/hip ratio
-039* -0.27
-0.42* -0.37*
-0.12 0.14
-0.37* -0.14
0.05
MEN
Visceral fat (cm2)
-0.02 -0.21 0.04
0.05 0.13 0.23
-0.08
0.11 -0.04
Waist/hip
ratio
-0.10 -0.29 -0.0S -0.07
-0.14 -0.17
0.03 0.30
-0.14
SHBG=sex hormone binding globulin, E,= estrone, E2=17B-estradiol, T=testosterone, DHEAS=dehydroepiandrosteron sulphate,
A=androstenedione;
* p<0.05, ** p<0.01.
In Table 4, the age and fat mass adjusted correlations are shown between the amount of visceral fat and the WHR with sex hormone levels, separately for women and men. Adjustment for the potential confounding effects of age and fat mass was necessary, because age in both sexes and fat mass in men were positively associated with visceral adipose tissue, r=0.42, p<0.05 in women and r=0.47, p<0.01; r=0.46,/?< 0.01 in men, respectively. In women, the amount of visceral fat as well as the WHR remained negatively associated with the SHBG level. After adjustment, the visceral fat area in
88
Visceral fat, sex hormones and weight loss
women was positively related to free T concentrations and negatively to the free E2/free T ratio, and a tendency towards decreasing Ej levels with visceral fat accumulation could be observed. In men, the inverse association between WHR and free T disappeared after adjustment for age and fat mass.
The effects of weight reduction on the variables measured are given in Table 5. Within each sex, all the body composition and fat distribution variables decreased significantly after weight reduction. The reductions in WHR and visceral fat area were significantly larger in men than in women. The levels of SHBG and DHEAS increased significantly in both sexes, and Ej increased only significantly in men. The levels of total E2, free Ej, and A decreased significantly within each sex, while the total T and free T levels decreased only significantly in women. Only the changes in Ej levels were significantly different in men and women.
Table 5. Changes in variables with weight reduction^
WOMEN MEN
N
Weight (kg) Body mass index (kg/m ) Body fat (%) Fat mass (kg)
Waist/hip ratio
Abdominal fat areas (cm2)+
Visceral
Subcutaneous
Hormones SHBG (nmol/L) Ej (pmol/L) Total E2 (pmol/L) Free E2 (pmol/L) Total T (nmol/L) Free T (nmol/L) Free E ^ r e e T DHEAS (umol/L) A (nmol/L)
33 -12.4 •AS
-8.2
-113 -0.04
-33
-117
7
-1
-51 -1.18 -0.17 -0.01
6.0 1.93
-1.38
+
+
+
±
±
+
±
±
* ±
± ± ± ± ±
*
4 . 3 " " 1 .6"" 2.8**"
3.7**** 0.03****
21****
58****
12**
56
141* 2.40** 0.20****
0.01**** 108 3.26** 1.10****
37
-133 •A3 -7.9
-11.0 -0.07
-61
-114
4
28 -16
-0.38 0.64
-0.01
-OS 1.95
-0.90
+
+
± +
±
±
+
+
+
± +
± +
+
+
+
33**** 1.1**** 2.6**** 3.0****
0.03**** t
26**** t
46****
5****
4 9 " § 3 0 "
0.67** 3.33 0.10
3.1 2.40****
1.05""
Values are means ± SD; SHBG=sex hormone binding globulin, Ej = estrone, B^=17B-estradiol, T=testosterone, DHEAS=dehydroepiandrosteron sulphate,
A=androstenedione; t Changes in variables are expressed as after minus before weight loss;
+ 30 women, 34 men; * p<0.05, " p<0.01, *•* p<0.001, *"* p<0.0001: after versus before weight loss;
$ p<0.05, t p<0.0001: women versus men.
89
Chapter 6
The correlations between visceral fat and SHBG level before weight loss are illustrated in Figure 1A for each sex separately. In Figure IB, the relationship between changes in the visceral fat depot and changes in the SHBG levels due to weight loss are shown.
SHBG(nmol/L)
60-
45
3<H
15
0
SHBG (nmol/L)
women r=-0A8,p<0.01
60
45
.30-
lb
0
men r=0.02 p=0.69
•
t *** • •
0 40 80 120 160 200 240 280 0 40 80 120 160 200 240 280 visceral fa t lcm 2 ) visceral fat (cm2)
change in SHBG (nmol/L) 60 H
40
20
0 -\
-20
women r=-0A1,p<0.05
-120 -100 -80 -60 -40 -20 0 change in visceral fa t lcm 2 )
change in SHBG (nmol/L) 60 i
40
20
0 •
-20{
U
men r=0l)1 p=0.96
120 -100 -80 -60 -40 -20 0 change in visceral f a t lcm 2 )
Figure 1. Relationship between visceral fat and SHBG level before weight loss (A) and in response to weight loss (B) in women (o) and men (0)* SHBG=sex hormone binding globulin;
t Changes are expressed as after minus before weight loss.
Table 6 shows the correlations between changes in fat mass and abdominal fat areas with changes in sex hormone levels. In women, the reduction in the visceral fat depot was significantly related to increases in the SHBG level and the free E^free T ratio, whereas subcutaneous abdominal fat loss was also associated with a rise in SHBG. In men, none of the correlations between changes in fat mass and both abdominal fat areas with changes in sex hormone levels were statistically significant, except for an inverse relation between visceral fat and Ev Neither in women nor in men were the reductions in WHR
90
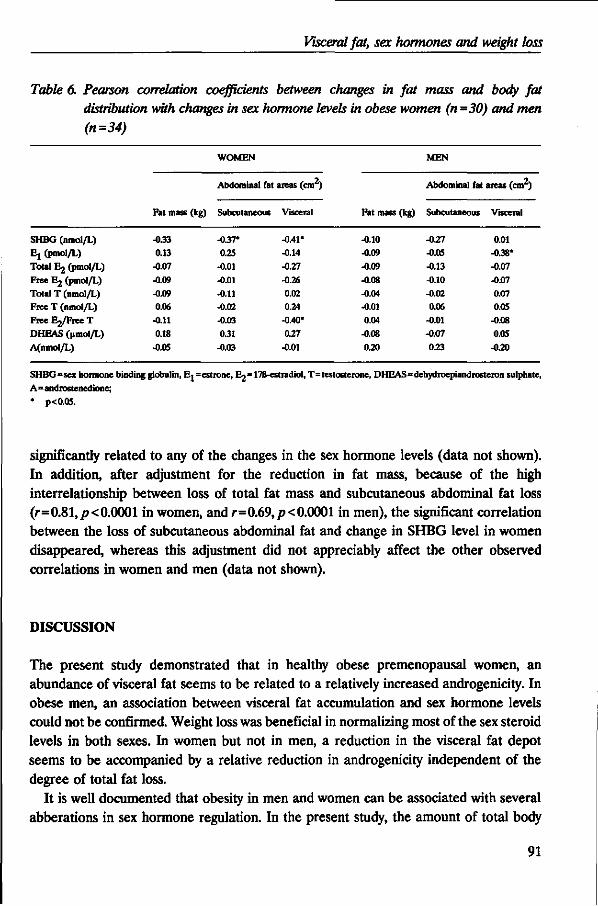
Visceral fat, sex hormones and weight loss
Table 6. Pearson correlation coefficients between changes in fat mass and body fat distribution with changes in sex hormone levels in obese women (n -30) and men (n=34)
SHBG (nmol/L) Ej (pmol/L) Total E2 (pmol/L)
Free E2 (pmol/L) Total T (nmol/L) Free T (nmol/L) F r e e E ^ r e e T DHEAS (pmol/L)
A(nmol/L)
Fat mass (kg)
-0.33 0.13
-0.07
-0.09 -0.09 0.06
-0.11 0.18
-0.05
WOMEN
Abdominal fat
Subcutaneous
-0.37' 0.25
-O.01 -0.01
-0.11 -0.02 -0.03
0.31 -0.03
areas (cm )
Visceral
-0.41* -0.14
-0.27
-0.26 0.02 0.24
-0.40*
0.27
-0.01
Fat mass (kg)
-0.10 -0.09
-0.09
-0.08 -0.04 -0.01 0.04
-0.08
0.20
MEN
Abdominal fat
Subcutaneous
-0.27 -0.05
-0.13
-0.10 -0.02 0.06
-0.01 -0.07
0.23
areas (cm )
Visceral
0.01 -0.38* -0.07
-0.07 0.07 0.05
-0.08 0.05
-0.20
SHBG=sex hormone binding globulin, Ej =estrone, E2=17B-estradiol, T=testosterone, DHEAS=dehydroepiandrosteron sulphate,
A=androstenedione;
* p<0.05.
significantly related to any of the changes in the sex hormone levels (data not shown). In addition, after adjustment for the reduction in fat mass, because of the high interrelationship between loss of total fat mass and subcutaneous abdominal fat loss (r=0.81,/?<0.0001 in women, and r=0.69,p<0.0001 in men), the significant correlation between the loss of subcutaneous abdominal fat and change in SHBG level in women disappeared, whereas this adjustment did not appreciably affect the other observed correlations in women and men (data not shown).
DISCUSSION
The present study demonstrated that in healthy obese premenopausal women, an abundance of visceral fat seems to be related to a relatively increased androgenicity. In obese men, an association between visceral fat accumulation and sex hormone levels could not be confirmed. Weight loss was beneficial in normalizing most of the sex steroid levels in both sexes. In women but not in men, a reduction in the visceral fat depot seems to be accompanied by a relative reduction in androgenicity independent of the degree of total fat loss.
It is well documented that obesity in men and women can be associated with several abberations in sex hormone regulation. In the present study, the amount of total body
91
Chapter 6
fat mass was only in men significantly related to some sex hormones. An inverse relationship was found between total body fatness and levels of total T and free T. These latter observations are similar to what has been reported previously in men (1,4,5,8-10,19). The fact that the basal hormonal concentrations in the present study were not consistently related to the degree of overweight, may be due to the relatively narrow range of body fatness of the study population. It should be noted that this study was particularly designed to study the contribution of body fat distribution rather than the degree of obesity on sex steroid levels.
Comparison of the average SHBG levels of the obese men and women studied, supports the hypothesis that body fat distribution is inversely related to SHBG binding capacity as described by previous studies (9-12,14-16,18,19). Instead of expected lower SHBG levels in women than in men as a result of the larger adiposity in women, obese women had, on average, higher SHBG levels compared with obese men as well as smaller amounts of visceral fat. This is in accordance with the observed inverse relationship between visceral fat predominance and SHBG level within the female obese population studied, regardless of the degree of obesity. This first study in women capable to distinguish the associations between the separate abdominal fat depots and sex steroid levels, clearly demonstrates that the relationship between an abdominal fat distribution and SHBG is primary attributable to the amount of visceral fat and not to subcutaneous fat. In women, SHBG levels are mainly determined by the ratio of circulating androgens to estrogens, hence, SHBG may be a sensitive indicator for androgenicity in women (38). A decline in SHBG would cause a greater change in free T than in free E2, since the affinity of SHBG for T is considerably higher than that for E2 (38) and this might result in a relative increase in androgenic activity.
The studies in women in which the relationships between regional fat distribution and androgen levels were investigated, yielded, however, contradictory results (7,11-13,16,17,19,26). In the present study, no significant associations between visceral fat accumulation and total androgen levels could be found in women. This is in agreement with some previous studies (7,11,12), although other studies in women were able to find a positive relationship between WHR and total T levels (13,16,19). Evans et al. (11) suggested that a decrease in SHBG might result in a relative increase in androgenic activity which may be too small to be reflected in changes in androgen levels. However, in this study as well as in others (16,17,19), abdominal fat distribution was positively related to the biologically active free T concentrations. In two other studies (11,12), positive associations were observed between the WHR and percentage free T, consistent with our findings. We did not focus on free percentages, because in the present study as well as in others (12), SHBG levels were extremely highly inversely correlated with the calculated free percentages of T as well as of E2. It will be clear that the different indices of androgenicity and the differences in populations studied, make it difficult to compare
92
Visceral fat, sex hormones and weight loss
the results of the above-mentioned studies. At present, the evidence for a relationship between abdominal fat distribution and
estrogen levels in women, is also far from clear-cut (7,11,12,16,19). Positive correlations between WHR and levels of total Ej and free Ej were reported by Kirschner et al. (16,19) in women, although other investigators failed to find such associations (7,11,12). The present study shows a tendency towards a negative correlation between ^ levels and visceral fat predominance in women, whereas the ratio of free Ej/free T was significantly inversely related to visceral fat accumulation. Overall, declining levels of SHBG and a diminished free Ej/free T ratio accompanied by increasing free T levels, as observed in this study, strongly suggests a relatively increased androgenicity in women with an abundance of visceral fat, although this was not reflected by changes in total androgen and estrogen levels.
The few studies in men in which the contribution of body fat distribution on sex hormones was examined, reveal also discrepancies (8-10). Similar to the findings of Pasquali et al. (8), no association could be demonstrated between SHBG level and abdominal fat distribution in our study, although in the remaining studies (9,10) inverse relationships were observed. Seidell et al. (10) were the only investigators who found a negative relation between total and free T concentrations and the amount of visceral fat, measured by CT, in a male population covering a wide range of fatness and fat distribution. This is in accordance with the results of Marin et al. (39). They found that administration of moderate doses of transdermal preparations of T in middle-aged men with abdominal obesity, resulted in a reduction of the visceral adipose tissue mass. In the present study, however, none of the sex steroids were associated with visceral fat accumulation. We previously reported that the amount of visceral fat was also not independently related to serum lipid levels in the obese men studied (40). Significant negative associations between T levels (total as well as free) and the amounts of total fat mass and subcutaneous abdominal fat were found in the present study. This is in agreement with the findings of Pasquali et al. (8) indicating that the degree of obesity rather than adipose tissue distribution may be involved in determining abnormalities of sex hormone metabolism in moderately obese men.
The weight reduction of approximately 13 kg resulted in favourable changes in most of the sex steroid levels and all body fat distribution variables. Levels of SHBG increase in both men and women after weight loss. Zumoff (5) and O'Dea et al. (3) also found a rise in SHBG in response to weight loss. On the contrary, other previous studies in women (6,7) and men (4) did not find a change in SHBG after weight loss. However, comparison of these results should be done with caution because of the differences in experimental design (e.g., duration of therapy and amount of weight loss) and in heterogeneity of the subjects studied (e.g., pre- or postmenopausal women, differences in degree of body fatness).
93
Chapter 6
The fact that the changes in sex hormones seen in the subjects studied were not significantly correlated with the reduction in body fat mass within each sex, does not necessarily mean that losses of weight and fat do not play a role in changing sex steroid levels. Correlations of changes should be interpreted with caution. There is a relatively large between- and within-subject variability in sex steroid levels, particularly with regard to estrogen levels in women. These substantial variations might have caused attenuation of correlations. Additionally, the measurement error of visceral fat areas is relatively large as described previously (37). Despite these limitations, the observed relations between changes in sex steroids and changes in the visceral fat depot do support the results obtained from the cross-sectional correlations. Within women, SHBG levels and the free Ej/free T ratio are associated with the amount of visceral fat before as well as accompanying weight loss. It is interesting to note that a significant relation could be observed between visceral fat loss and increase of the Ej level in men, suggesting a role of the visceral fat depot in determining Ej levels. Moreover, before weight loss, a negative tendency between the amount of visceral fat and Ej was shown in men. This might be an explanation for the observed difference in increase of the average Ej level between men and women in response to weight loss. However, the physiological meaning of this phenomenon is unknown and whether this is real or remained by chance needs further investigation.
In conclusion, these findings in healthy moderately obese men and women suggest that in women, visceral fat accumulation is related to a relatively increased androgenicity. In men, the degree of obesity rather than the type of regional fat distribution seems to be important in sex hormone regulation. In women but not in men, visceral fat loss seems to be accompanied by a relative reduction in androgenicity regardless of the degree of total fat loss. Thus, there seems to exist a gender difference in the relationship between sex hormone regulation and visceral fat predominance.
REFERENCES
1. Strain GW, Zumoff B, Kream J, Strain JJ, Deucher R, Rosenfeld RS, et al. Mild hypogonadotropic hypogonadism in obese men. Metabolism 1982;31:871-875.
2. Samojlik E, Kirschner MA, Silber D, Schneider G, Ertel NH. Elevated production and metabolic clearance rates of androgens in morbidly obese women. J Clin Endocrinol Metab 1984;59:949-953.
3. O'Dea JPK, Wieland RG, Hallberg MC, Llerena LA, Zorn EM, Genuth SM. Effect of dietary weight loss on sex steroid binding, sex steroids, and gonadotropins in obese postmenopausal women. J Lab Clin Med 1979;93:1004-1008.
4. Stanik S, Dornfeld LP, Maxwell MH, Viosca SP, Korenman SG. The effect of weight loss on reproductive hormones in obese men. J Clin Endocrinol Metab 1981;53:828-832.
5. Zumoff B. Hormonal abnormalities in obesity. Acta Med Scand 1988;Suppl 723:153-160.
6. Pierce DS, Bernstein RS, Wild RA, Coulson PB, Beauchene RE. The effect of a slow weight loss regimen on steroid hormone levels in morbidly obese females. J Obesity Weight Regul 1988;7:111-124.
94
Visceral fat, sex hormones and weight loss
7. Grenman S, Rdnnemaa T, Irjala K, Kaihola HL, Gronroos M. Sex steroid, gonadotropin, Cortisol, and prolactin levels in healthy, massively obese women: correlation with abdominal fat cell size and effect of weight reduction. J Gin Endocrinol Metab 1986;63:1257-1261.
8. Pasquali R, Casimirri F, Cantobelli S, Melchionda N, Labate AMM, Fabbri R, et al. Effect of obesity and body fat distribution on sex hormones and insulin in men. Metabolism 1991;40:101-104.
9. Stefanick ML, Williams FT, Krauss RM, Terry RB, Vranizan KM, Wood PD. Relationships of plasma 17B-estradiol, testosterone, and sex hormone-binding globulin with lipoproteins, apolipoproteins, and high density lipoprotein subfractions in men. J Clin Endocrinol Metab 1987;64:723-729.
10. Seidell JC, Bjorntorp P, Sjdstrom L, Kvist H, Sannerstedt R. Visceral fat accumulation in men is positively associated with insulin, glucose, and C-peptide levels, but negatively with testosterone levels. Metabolism 1990;39:897-901.
11. Evans DJ, Hoffmann RG, Kalkhoff RK, Kissebah AH. Relationship of androgenic activity to body fat topography, fat cell morphology, and metabolic aberrations in premenopausal women. J Gin Endocrinol Metab 1983;57:304-310.
12. Haffner SM, Katz MS, Stern MP, Dunn JF. Relationship of sex hormone binding globulin to overall adiposity and body fat distribution in a biethnic population. Int J Obesity 1989;13:1-9.
13. Evans DJ, Barth JH, Burke CW. Body fat topography in women with androgen excess. Int J Obesity 1988;12:157-162. 14. Soler JT, Folsom AR, Kaye SA, Prineas RJ. Associations of abdominal adiposity, fasting insulin, sex hormone binding globuline,
and estrone with lipids and lipoproteins in post-menopausal women. Atherosclerosis 1989;79:21-27.
15. Raison J, Bonithon-Kopp C, Egloff M, Ducimetiere P, Guy-Grand B. Hormonal influences on the relationships between body fatness, body fat distribution, lipids, lipoproteins, glucose and blood pressure in French working women. Atherosclerosis 1990;85:185-192.
16. Kirschner MA, Samojlik E, Drejka M, Szmal E, Schneider G, Ertel N. Androgen-estrogen metabolism in women with upper body versus lower body obesity. J Gin Endocrinol Metab 1990;70:473-479.
17. Seidell JC, Cigolini M, Charzewska J, Ellsinger B-M, Di Biase G, Bjorntorp P, et al. Androgenicity in relation to body fat distribution and metabolism in 38-year-old women -the European fat distribution study. J Clin Epidemiol 1990;43:21-34.
18. Haffner SM, Katz MS, Dunn JF. Increased upper body and overall adiposity is associated with decreased sex hormone binding globulin in postmenopausal women. Int J Obesity 1991;15:471-478.
19. Kirschner MA, Samojlik E. Sex hormone metabolism in upper and lower body obesity. Int J Obesity 1991;15:101-108. 20. Bjorntorp P. "Portal" adipose tissue as a generator of risk factors for cardiovascular disease and diabetes. Arteriosclerosis
1990:10:493^96.
21. Despres J-P, Moorjani S, Lupien PJ, Tremblay A, Nadeau A, Bouchard C. Regional distribution of body fat, plasma lipoproteins, and cardiovascular disease. Arteriosclerosis 1990;10:497-511.
22. Kissebah AH, Evans DJ, Peiris A, Wilson CR. Endocrine characteristics in regional obesities: role of sex steroids. In: Vague J, Bjorntorp P, Guy-Grand B, Rebuffe-Scrive M, Vague P, eds. Metabolic complications of human obesities. Amsterdam: Elsevier, 1985:115-130.
23. Rebuftt-Scrive M. Steroid hormones and distribution of adipose tissue. Acta Med Scand 1988;Suppl 723:143-146.
24. Haffner SM, Katz MS, Stern MP, Dunn JF. Association of decreased sex hormone binding globulin and cardiovascular risk factors. Arteriosclerosis 1989;9:136-143.
25. Haffner SM, Dunn JF, Katz MS. Relationship of sex hormone-binding globulin to lipid, lipoprotein, glucose, and insulin concentrations in postmenopausal women. Metabolism 1992;41:278-284.
26. Seidell JC, Cigolini M, Deurenberg P, Oosterlee A, Doornbos G. Fat distribution, androgens, and metabolism in nonobese women. Am J Gin Nutr 1989;50:269-273.
27. Pasquali R, Antenucci D, Casimirri F, Venturoli S, Paradisi R, Fabbri R, et al. Ginical and hormonal characteristics of obese amenorrheic hyperandrogenic women before and after weight loss. J Gin Endocrinol Metab 1989;68:173-179.
28. Kooy K van der, Leenen R, Seidell JC, Deurenberg P, Droop A, Bakker CIG. Waist-to-hip ratio is a poor predictor for changes in visceral fat. Am J Gin Nutr (in press).
29. Weststrate JA, Hautvast JGAJ. The effects of short-term carbohydrate overfeeding and prior exercise on resting metabolic rate and diet-induced thermogenesis. Metabolism 1990;39:1232-1239.
30. Leenen R, Kooy K van der, Deurenberg P, Seidell JC, Weststrate JA, Schouten FJM, et al. Visceral fat accumulation in obese subjects: relation to energy expenditure and response to weight loss. Am J Physiol (Endocrinol Metab) 1992;263 (26):E913-E919.
31. Landeghem AAJ van, Poortman J, Deshpande N, Di Martino L, Tarquini A, Thijssen JHH, et al. Plasma concentration gradient of steroid hormones across human mammary tumours in vivo. J Steroid Biochem 1981;14:741-747.
32. Nanjee MN, Wheeler MJ. Plasma free testosterone -is an index sufficient? Ann Gin Biochem 1985;22:387-390. 33. Moore JW, Gark GMG, Bulbrook RD, Hayward JL, Murai JT, Hammond GL, et al. Serum concentrations of total and non-
protein-bound oestradiol in patients with breast cancer and in normal controls. Int J Cancer 1982;29:17-21.
95

Chapter 6
34. Siri WE. The gross composition of the body. In: Tobias CA, Lawrence JH, eds. Advances in biological and medical physics IV. New York: The Academic Press, 1956:239-280.
35. Comroe JH, Forster RE, Dubois AB, Briscoe WA, Carlsen E, eds. The lung-clinical physiology and pulmonary function tests. Chicago: Year Book Medical Publishers, 1977.
36. Pace N, Rathbun EN. Studies on body composition III. The body water and chemically combined nitrogen content in relation to fat content. J Biol Chem 1945;158:685-691.
37. Seidell JC, Bakker CIG, Kooy K van der. Imaging techniques for measuring adipose-tissue distribution -a comparison between computed tomography and 1.5-T magnetic resonance. Am J Clin Nutr 1990;51:953-957.
38. Anderson DC Sex-hormone-binding globulin. Clin Endocrinol 1974;3:69-96. 39. Marin P, Holmang S, Jonsson L, Sjostrom L, Kvist H, Holm G, et al. The effects of testosterone treatment on body composition
and metabolism in middle-aged obese men. Int J Obesity 1992;16:991-997.
40. Leenen R, Kooy K van der, Seidell JC, Deurenberg P. Visceral fat accumulation measured by magnetic resonance imaging in relation to serum lipids in obese men and women. Atherosclerosis 1992;94:171-181.
96
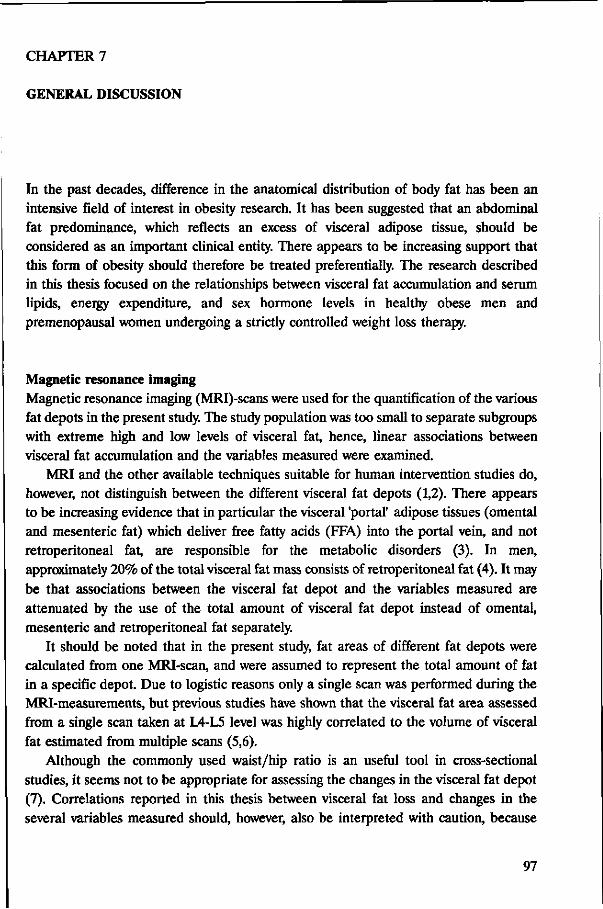
CHAPTER 7
GENERAL DISCUSSION
In the past decades, difference in the anatomical distribution of body fat has been an intensive field of interest in obesity research. It has been suggested that an abdominal fat predominance, which reflects an excess of visceral adipose tissue, should be considered as an important clinical entity. There appears to be increasing support that this form of obesity should therefore be treated preferentially. The research described in this thesis focused on the relationships between visceral fat accumulation and serum lipids, energy expenditure, and sex hormone levels in healthy obese men and premenopausal women undergoing a strictly controlled weight loss therapy.
Magnetic resonance imaging Magnetic resonance imaging (MRI)-scans were used for the quantification of the various fat depots in the present study. The study population was too small to separate subgroups with extreme high and low levels of visceral fat, hence, linear associations between visceral fat accumulation and the variables measured were examined.
MRI and the other available techniques suitable for human intervention studies do, however, not distinguish between the different visceral fat depots (1,2). There appears to be increasing evidence that in particular the visceral 'portal' adipose tissues (omental and mesenteric fat) which deliver free fatty acids (FFA) into the portal vein, and not retroperitoneal fat, are responsible for the metabolic disorders (3). In men, approximately 20% of the total visceral fat mass consists of retroperitoneal fat (4). It may be that associations between the visceral fat depot and the variables measured are attenuated by the use of the total amount of visceral fat depot instead of omental, mesenteric and retroperitoneal fat separately.
It should be noted that in the present study, fat areas of different fat depots were calculated from one MRI-scan, and were assumed to represent the total amount of fat in a specific depot. Due to logistic reasons only a single scan was performed during the MRI-measurements, but previous studies have shown that the visceral fat area assessed from a single scan taken at L4-L5 level was highly correlated to the volume of visceral fat estimated from multiple scans (5,6).
Although the commonly used waist/hip ratio is an useful tool in cross-sectional studies, it seems not to be appropriate for assessing the changes in the visceral fat depot (7). Correlations reported in this thesis between visceral fat loss and changes in the several variables measured should, however, also be interpreted with caution, because
97
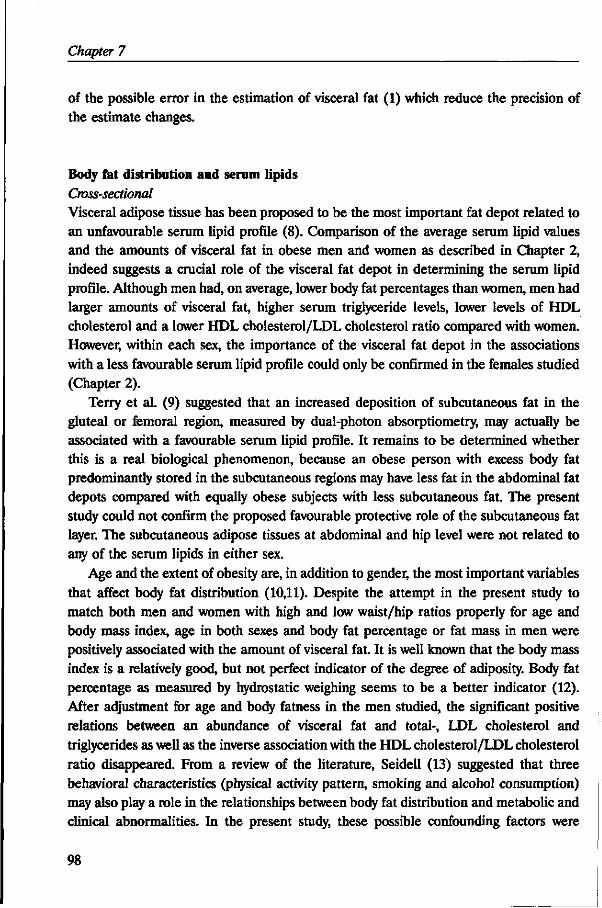
Chapter 7
of the possible error in the estimation of visceral fat (1) which reduce the precision of the estimate changes.
Body fat distribution and serum lipids Cross-sectional Visceral adipose tissue has been proposed to be the most important fat depot related to an unfavourable serum lipid profile (8). Comparison of the average serum lipid values and the amounts of visceral fat in obese men and women as described in Chapter 2, indeed suggests a crucial role of the visceral fat depot in determining the serum lipid profile. Although men had, on average, lower body fat percentages than women, men had larger amounts of visceral fat, higher serum triglyceride levels, lower levels of HDL cholesterol and a lower HDL cholesterol/LDL cholesterol ratio compared with women. However, within each sex, the importance of the visceral fat depot in the associations with a less favourable serum lipid profile could only be confirmed in the females studied (Chapter 2).
Terry et al. (9) suggested that an increased deposition of subcutaneous fat in the gluteal or femoral region, measured by dual-photon absorptiometry, may actually be associated with a favourable serum lipid profile. It remains to be determined whether this is a real biological phenomenon, because an obese person with excess body fat predominantly stored in the subcutaneous regions may have less fat in the abdominal fat depots compared with equally obese subjects with less subcutaneous fat. The present study could not confirm the proposed favourable protective role of the subcutaneous fat layer. The subcutaneous adipose tissues at abdominal and hip level were not related to any of the serum lipids in either sex.
Age and the extent of obesity are, in addition to gender, the most important variables that affect body fat distribution (10,11). Despite the attempt in the present study to match both men and women with high and low waist/hip ratios properly for age and body mass index, age in both sexes and body fat percentage or fat mass in men were positively associated with the amount of visceral fat. It is well known that the body mass index is a relatively good, but not perfect indicator of the degree of adiposity. Body fat percentage as measured by hydrostatic weighing seems to be a better indicator (12). After adjustment for age and body fatness in the men studied, the significant positive relations between an abundance of visceral fat and total-, LDL cholesterol and triglycerides as well as the inverse association with the HDL cholesterol/LDL cholesterol ratio disappeared. From a review of the literature, Seidell (13) suggested that three behavioral characteristics (physical activity pattern, smoking and alcohol consumption) may also play a role in the relationships between body fat distribution and metabolic and clinical abnormalities. In the present study, these possible confounding factors were
98
General discussion
absent or minimal and the variability in physical activity pattern in our, in general, sedentary individuals was low.
As proposed in the introduction, portal levels of FFAs derived from visceral adipose tissue may be a direct causative link between visceral fat accumulation and the generation of risk factors for metabolic disorders related to abdominal obesity. In the present study, however, in both sexes no relationship between FFA concentrations in peripheral blood and visceral fat predominance was observed (unpublished results). Explanations for this failure might be the determinations of FFAs in peripheral blood instead of portal blood and/or the large within-subject variability of FFA concentrations. It has previously been proposed that exposure of the liver to high portal FFAs may lead to increased levels of insulin by interfering with the hepatic clearance of insulin (3). Indeed, in both sexes, visceral fat accumulation was related to increased levels of insulin and to an elevated insulin/glucose ratio, even after adjustment for age and body fatness (Chapter 3). Recently, investigators suggested that a family history of diabetes may play a potential role in the relationship between body fat distribution and insulin levels (14). Unfortunately, adequate information concerning a family history of diabetes were not available in the present study. It has been proposed that hyperinsulinaemia may lead to elevated triglyceride concentrations and decreased HDL cholesterol concentrations (15), and consequently, elevated insulin levels may be partially responsible for the associations between visceral fat accumulation and an unfavourable serum lipid profile. It is clear that further research is required to reveal the complex associations between visceral fat accumulation and the risk factors for metabolic disorders associated with obesity.
Response to weight loss treatment Obese subjects with an initial abundance of visceral fat lose more visceral fat on a strictly controlled energy-deficit diet than obese subjects with smaller amounts of visceral fat (Chapter 3), which may be expected to lead to beneficial changes in the serum lipid profile particularly in obese subjects with visceral fat predominance. In obese women but not in men, visceral fat accumulation before weight loss was associated with improvement of HDL cholesterol and triglyceride levels after weight loss (Chapter 4).
Comparison of the observed larger reduction in visceral fat and the more marked improvement of the serum lipid profile in men than in women in response to the weight loss treatment, suggests a potential role of visceral fat loss in improving the serum lipid levels of obese subjects. While in women a loss of visceral fat was associated with an increased HDL cholesterol, a more general beneficial effect of visceral fat loss was not seen using correlation analyses within each sex (Chapter 4).
Only very few studies have investigated the relationships between changes in body fat distribution and changes in serum lipid profile in obese women undergoing weight loss treatment (16-18) and, to our knowledge, this is the first study carried out in obese men.
99
Chapter 7
These intervention studies revealed, however, equivocal results. Fujioka et al. (16) found that in severely obese Japanese women, visceral fat loss, measured by CT, was associated with improvement of triglyceride levels but not with total- and HDL cholesterol. From the description of their study design, it is not clear whether they measured serum lipid levels in a real weight-maintenance state, which is particularly important with regard to HDL cholesterol levels (19). The other two studies in women (17,18) used changes in waist/hip ratio as an indicator of changes in body fat distribution. Changes in waist/hip ratio, however, do not seem to reflect changes in the visceral fat depot adequately (7).
Effects of factors known to affect body fat distribution as well as serum lipid levels such as smoking, physical activity pattern and alcohol consumption, were kept to a minimum by selection of the subjects and by instructions not to change any of these behaviours during the course of the study. It should be noted that in addition to changes in body weight and the various fat depots in response to the energy-deficit diet, the nutrient composition of this diet per se might be, at least partly, attributable to the observed changes in serum lipid levels. On the basis of the analyses described in Chapter 4, it is impossible to distinguish completely the specific contributions of visceral fat loss, loss of body weight and changes in diet on improving the serum lipid profile of obese subjects. This phenomenon is inherent to dietary weight loss programs. The independent effects of weight loss and dietary fat modification on serum lipids are reported in Chapter 5.
Weight loss, dietary fat modification and serum lipids Weight loss per se without changes in the composition of the diet, had beneficial effects on all serum lipid levels. Dietary fat modification according to dietary recommendations (reductions in intake of total fat and saturated fatty acids (20,21)) without energy restriction, also had favourable effects on total-, LDL cholesterol, and triglycerides, but it led to unfavourable reductions in HDL cholesterol and HDL cholesterol/LDL cholesterol ratios. The effects of weight loss per se and dietary fat modification seem to be additive. The resultant effect of weight loss and fat modification combined on HDL cholesterol was practically nihil (Chapter 5).
In the present study, the diets were as well controlled as is possible in an outpatient setting. As mentioned before, confounding factors known to affect serum lipids were absent or were kept constant during the study. It is therefore likely that the effects observed can be attributed to the imposed dietary changes and changes in body composition.
Despite the great effort to maintain the body weights of the subjects stable preceding the weight loss period by adjustments of individual energy intakes, a small average weight loss was observed. This phenomenon has also previously been reported by other
100
General discussion
investigators (22). Taking into account this small weight loss as well as the fact that dietary fat was isocaloric replaced by carbohydrates, as actually advocated by dietary guidelines, instead of by protein (23,24), the favourable contribution of the dietary fat modification without energy restriction on the serum lipid profile may expected to be slightly less than observed in this study. Recently, some studies suggested that obesity may diminish the responsiveness to certain dietary changes (25,26). Thus, in the dietary treatment of obesity, weight loss seems to be important in optimizing the serum lipid profile of obese subjects and seems to be even greater than that of dietary fat modification, although these latter differences were not statistically tested.
Unfortunately, the groups of men and women which remained for these analyses, were too small to derive definite conclusions with respect to gender differences. Particulary, differences in body fat deposition could be an important aspect to take into consideration.
Body fat distribution and energy expenditure The impact of body fat distribution on energy expenditure has been investigated by several research groups. Research on human energy expenditure has mainly focused on studying the resting metabolic rate (RMR) and diet-induced thermogenesis (DIT), because these two components of daily energy expenditure are quantitatively important for overall energy expenditure and can be assessed relatively easy with the use of indirect calorimetry. The results in Chapter 3 showed that, in obese women but not in obese men, a relative predominance of visceral fat was positively related to RMR and DIT. The reasons for these observed gender differences are unknown, but it should be noted that relationships between visceral fat and other variables were generally stronger in the women than in the men of this study population. The proposed explanations in the literature for the increased RMR and DIT in abdominal obese in comparison to gluteal-femoral obese as described in Chapter 3, are in fact applicable to both men and women. Differences in sex hormone concentrations between both sexes might be a possible explanation, although at the moment there is only little evidence to support this possibility.
The question how to interpret the relatively higher RMR and DIT among obese females with larger amounts of visceral fat is intriguing. Obesity is clearly associated with a high absolute RMR, although the variation in the relative RMR at any given body size can be substantial (27). Controversy exists whether or not the obese are characterized by a defective DIT (27,28). In the present study, no comparison could be made with results in lean subjects. Among the studies in which the relationships between body fat distribution and energy expenditure were investigated, only Weststrate et al. (29) included an age-matched non-obese control group of women in their study. They found
101
Chapter 7
that the gluteal-femoral obese can be characterized by relatively reduced RMRs in comparison with either abdominally obese women or lean women. This might implicate that a gluteal-femoral type of obesity seems to be more closely associated with decreased energy expenditure rather than abdominal obesity with increased energy expenditure. It is obvious, however, that more research is necessary to investigate this issue more properly.
The relatively higher observed RMR and DIT in women with abdominal obesity might be an explanation why previous studies have found larger weight losses in response to a dietary weight loss treatment in these women compared with obese women with a gluteal-femoral fat distribution. If the same standardized energy restricted diet was given to obese subjects with different types of body fat distribution, which was the case in previous studies, women with abdominal obesity might have larger energy deficits which might have led to larger losses of body weight. In the present study, all obese individuals were subjected to the same 4.2 MJ/day energy-deficit diet, which theoretically would lead to similar amounts of weight loss in all subjects. Obese subjects with an initial abundance of visceral fat did not lose more body weight and body fat, but they lost more visceral than subjects with less visceral fat (Chapter 3).
Body fat distribution and sex hormones In the obese men studied, no relationship could be found between visceral fat accumulation and any of the sex hormone levels. On the contrary, in the premenopausal obese women, an abundance of visceral fat appeared to be associated with a relatively increased androgenicity, which was reflected by reduced levels of sex-hormone-binding globulin (SHBG), a diminished free 176-oestradiol/free testosterone ratio as well as by elevated levels of free testosterone, but not by differences in total androgen and oestrogen levels (Chapter 6). Diminished SHBG levels may result in increased metabolic clearance rates of testosterone and other androgens for which it has a high binding affinity, and it may lead to enhanced turnover and tissue exposure to androgens despite normal plasma levels (30). Thus, metabolic clearance and production rates reveal more about sex hormone status than peripheral concentrations of sex hormones, and therefore, more sophisticated studies are necessary in which these complicated variables can accurately be measured.
The weight loss intervention was beneficial in normalizing most of the sex hormone levels in both sexes. In women but not in men, a reduction in the visceral fat depot seems to be accompanied by a relative reduction in androgenicity regardless of the degree of total fat loss (Chapter 6). It should be noted, however, that these observed changes in sex hormone concentrations are not only attributable to changes in body composition per se but might also be the result of changes in the nutrient composition
102
General discussion
of the diets. It has been reported that dietary lipids may alter some sex hormone levels (31,32), although an other study could not support these findings (33).
Comparison of the present results with previous published studies, in which the contribution of the body fat distribution pattern on sex hormones was investigated, is rather difficult due to the different indices of androgenicity and the heterogeneity of the subjects studied. In this study, only healthy obese men and premenopausal obese women with regular menstrual cycles were included. At the selection, the women were screened for hirsutism in order to prevent inclusion of females with a poly cystic ovary (PCO) syndrome, who have increased levels of androgens. In this study, serum testosterone levels were all in the normal range, therefore, the possibility of having included women with PCO syndrome was unlikely. An underlying problem with interpreting the results of sex hormone measurements in women is the length of the menstrual cycle. An epidemiological study in 32,856 women, demonstrated that the prevalence of relatively long menstrual cycles is higher in women with a larger waist/hip ratio (34). This suggests that at the time of blood sampling, the women with an abdominal fat distribution might have been in an earlier stage of the menstrual cycle than the women with a gluteal-femoral type of fat distribution. It is noteworthy, however, that despite this confounding aspect, which potentially could mask an association, cross-sectionally as well as prospectively the same relationships between body fat distribution and sex hormone levels were obtained.
Sex hormones may play a major role in determining the risk of coronary heart disease (35,36). Several hypothetical mechanisms were proposed to explain the relationship between sex hormones and serum lipid metabolism, but any discussion of the nature of this relationship must include other metabolic variables such as hyperinsulinaemia and body fat distribution, as previously reviewed by Wild (37). Preliminary data from the present study in half of the study population indeed suggested an association between sex hormone concentrations and serum lipid levels in obese men and women (38). However, in women only, the relationship between sex hormones and serum lipids appeared to be mediated by differences in body fat distribution (38). In addition, some investigators proposed that hyperandrogenism may be, at least partly, responsible for hyperinsulinaemia and insulin resistance in abdominally obese women (39,40). Vice versa, it has been suggested that insulin may be a factor amplifying LH-dependent ovarian androgen synthesis (41). Nestler et al. (42) found it unlikely that hyperandrogenism causes insulin resistance, because normal men do not have insulin resistance despite they have high androgen levels. In previous studies in men, the associations between androgens, insulin metabolism and abdominal fat distribution as observed in women, could not be confirmed (43,44). Pasquali et al. (44) suggested that hyperinsulinaemia may be involved in the regulation of sex hormone metabolism in obese men by mechanisms that probably differ from those involved in the development
103
Chapter 7
of hyperandrogenism in obese women. The underlying mechanisms have, however, not yet been clarified. Further research is required to reveal the complex inter-relationships between sex hormones, serum lipids, insulin levels and body fat distribution.
Study population and gender differences It is noteworthy that healthy moderately obese men and premenopausal women were included in the present study in order to preclude the effects of metabolic disturbances on the observations. This selection of the participants may have some disadvantages with respect to the applicability of the results to a general obese population (e.g., including postmenopausal women, hyperlipidaemic subjects, adolescents, diabetics or morbidly obese subjects). These limitations should be kept in mind when extrapolating the results. As a consequence of the selection criteria used, the present study population was rather homogeneous with respect to the degree of body fatness and serum lipids, whereas the ranges in body fat distribution were considerable in men as well as in women.
The present findings suggests that there may be gender differences in the relationships between visceral fat accumulation and serum lipids, energy expenditure, and sex hormones (Chapter 2,3,4,6). It is surprising to note that in women, the visceral fat depot plays an important role in all these three aspects, whereas in men, the visceral fat depot seems not to be important. In both sexes, the variability in waist/hip ratio, body fatness, age and in the amounts of the different fat depots were similar. Most previous studies, in which the importance of the visceral fat depot has been established, have been carried out in obese women. It might be that the few studies performed in men did not correct for the possible confounders of age and the degree of adiposity. One should keep in mind that in samples of subjects showing large variations in levels of total body fat, any indicator of total body fatness may be related to the amount of visceral fat. Whether or not these gender differences are real or due to this specific population studied should be confirmed in future studies. In addition, the precise underlying mechanisms potentially responsible for these gender differences should be further investigated as well, because they could not be derived from the present study.
Conclusions Health authorities recommend obese subjects to lose body weight in order to reduce the risk for metabolic complications associated with obesity. It has been suggested that weight loss strategies should be aimed primarily to those individuals with abdominal obesity, due to their elevated risk for such health hazards. However, clear scientific evidence for these propositions is still scarce.
The present findings suggest that there seem to be gender differences in the
104
General discussion
associations between visceral fat accumulation and the serum lipid profile, components of energy expenditure (RMR and DIT), and sex hormone levels in healthy moderately obese subjects. In women but not in men, visceral fat predominance was related to a less favourable serum lipid levels, higher levels of RMR and DIT, as well as to a relatively increased androgenicity. In obese men, the critical role of the visceral fat depot could not be confirmed. The reasons for these gender differences remain to be elucidated.
The impact of weight loss per se appears to be substantial in optimizing the serum lipid profile of obese subjects in weight loss programmes. Dietary fat modification as advocated by dietary guidelines (reducing the intake of total fat and saturated fatty acids (20,21)) also had beneficial effects on some serum lipid levels. The considerable additive effects of weight loss per se underscores the importance of establishing successful dietary weight loss treatment for obesity. It is, however, notoriously difficult for post-obese subjects to maintain the reduced body weight (45) and, therefore, more emphasis should be paid to the improvement of the long-term prognosis of the treatment of obesity and most of all to the prevention of obesity.
In addition, it is concluded that particularly healthy moderately obese women with a visceral fat predominance benefit from a dietary weight loss treatment with respect to their serum lipid profile and sex hormone levels, whereas in healthy moderately obese men, a distinction with respect to the amount of visceral fat seems not to be relevant. Extrapolation from this selected group of obese subjects to a general obese population should be done with caution. It should be kept in mind that the present findings do not reveal whether weight loss treatment will indeed reduce the number of subjects with coronary heart disease. Therefore, in future, long-term follow-up studies are needed to evaluate the efficacy of weight loss treatment for the prevention of this hazardous disease.
REFERENCES
Seidell JC, Bakker CIG, Kooy K van der. Imaging techniques for measuring adipose-tissue distribution -a comparison between computed tomography and 1.5-T magnetic resonance. Am J Clin Nutr 1990;51:953-957.
Rdssner S, Bo WJ, Hiltbrandt E, Hinson W, Karstaedt N, Santago P, et al. Adipose tissue determinations in cadavers -a comparison between cross-sectional planimetry and computed tomography. Int J Obesity 1990;14:893-902. Bjorntorp P. "Portal" adipose tissue as a generator of risk factors for cardiovascular disease and diabetes. Arteriosclerosis 1990;10:493-496.
MSrin P, Andersson B, Ottosson M, Olbe L, Chowdhury B, Kvist H, et al. The morphology and metabolism of intraabdominal
adipose tissue in men. Metabolism 1992;41:1242-1248. Kvist H, Chowdhury B, GrangSrd U, Tyien U, Sjostrom L. Total and visceral adipose-tissue volumes derived from measurements with computed tomography in adult men and women: predictive equations. Am J Clin Nutr 1988;48:1351-1361.
Ross R, Leger L, Morris D, De Guise J, Guardo R. Quantification of adipose tissue by MRI: relationship with anthropometric
variables. J Appl Physiol 1992;72(2):787-795.
105
Chapter 7
7. Kooy K van der, Leenen R, Seidell JC, Deuienberg P, Droop A, Bakker CIG. Waist-to-hip ratio is a poor predictor for changes in visceral fat. Am J Clin Nutr (in press).
8. Despres J-P, Moorjani S, Ferland M, Tremblay A, Lupien PJ, Nadeau A, et al. Adipose tissue distribution and plasma lipoprotein levels in obese women: importance of intra-abdominal fat. Arteriosclerosis 1989;9:203-210.
9. Terry RB, Stefanick ML, Haskell WL, Wood PD. Contributions of regional adipose tissue depots to plasma lipoprotein concentrations in overweight men and women: possible protective effects of thigh fat. Metabolism 1991;40:733-740.
10. Tonkelaar I den, Seidell JC, Noon) PAH van, Baanders-van Halewijn EA, Ouwehand U. Hit distribution in relation to age, degree of obesity, smoking habits, parity and estrogen use: a cross-sectional study in 11825 Dutch women participating in the DOM-project. Int J Obesity 1990;14:753-761.
11. Shimokata H, Tobin JD, Muller DC, Elahi D, Coon PJ, Andres R. Studies in the distribution of body fat: I. Effects of age, sex, and obesity. J Gerontol 1989;44:M66-M73.
12. Seidell JC, Deurenberg P, Hautvast JGAJ. Obesity and fat distribution in relation to health -current insights and recommendations. Wld Rev Nutr Diet 1987;50:57-91.
13. Seidell JC Environmental influences on regional fat distribution. Int J Obesity 1991;15:31-35. 14. Lemieux S, Despres J-P, Nadeau A, Prud'homme D, Tremblay A, Bouchard C. Heterogeneous glycaemic and insulinaemic
responses to oral glucose in non-diabetic men: interactions between duration of obesity, body fat distribution and family history of diabetes mellitus. Diabetologia 1992;35:653-659.
15. Reaven GM. Role of insulin resistance in human disease. Diabetes 1988;37:1595-1607. 16. Fujioka S, Matsuzawa Y, Tokunaga K, Kawamoto T, Kobatake T, Keno Y, et al. Improvement of glucose and lipid metabolism
associated with selective reduction of intra-abdominal visceral fat in premenopausal women with visceral fat obesity. Int J Obesity 1991;15:853-859.
17. Vansant G, Besten C den, Weststrate J, Deurenberg P. Body fat distribution and the prognosis for weight reduction: preliminary observations. Int J Obesity 1988;12:133-140.
18. Wing RR, Jeffery RW, Burton LR, Thorson C, Kuller LH, Folsom AR. Change in waist-hip ratio with weight loss and its association with change in cardiovascular risk factors. Am J Clin Nutr 1992;55:1086-1092.
19. Dattilo AM, Kris-Etherton PM. Effects of weight reduction on blood lipids and lipoproteins: a meta-analysis. Am J Clin Nutr 1992^6:320-328.
20. Consensus Conference. Lowering blood cholesterol to prevent heart disease. JAMA 1985;253:2080-2086. 21. Erkelens DW. Cholesterol consensus in the Netherlands. Eur J Clin Nutr 1989;43:89-96.
22. Prewitt TE, Schmeisser D, Bowen PE, Aye P, Dolecek TA, Langenberg P, et al. Changes in body weight, body composition, and energy intake in women fed high- and low-fat diets. Am J Clin Nutr 1991;54:304-310.
23. Wolfe BM, Giovannetti PM. Short-term effects of substituting protein for carbohydrate in the diets of moderately hypercholesterolemic human subjects. Metabolism 1991;40:338-343.
24. Lithell H, Karlstrom B, Selinus I, Vessby B, Fellstrom B. Is muscle lipoprotein lipase inactivated by ordinary amounts of dietary carbohydrates? Hum Nutr din Nutr 1985;39C:289-295.
25. Goff DC, Shekelle RB, Katan MB, Gotto AM, Stamler J. Does body fatness modify the association between dietary cholesterol and risk of coronary death? Results from the Chicago Western Electric study. Arteriosclerosis and Thrombosis 1992;12:755-761.
26. Cole TG, Bowen PE, Schmeisser D, Prewitt TE, Aye P, Langenberg P, et al. Differential reduction of plasma cholesterol by the American Heart Association Phase 3 Diet in moderately hypercholesterolemic, premenopausal women with different body mass indexes. Am J Clin Nutr 1992;55:385-394.
27. Ravussin E, Swinburn BA. Pathophysiology of obesity. Lancet 1992;340:404-408. 28. Stock MJ. Thermogenesis and energy balance. Int J Obesity 1992:16(Suppl 2):S13-S16.
29. Weststrate JA, Dekker J, Stoel M, Begheijn L, Deurenberg P, Hautvast JGAJ. Resting energy expenditure in women: impact of obesity and body-fat distribution. Metabolism 1990;39:11-17.
30. Kirschner MA, Samojlik E. Sex hormone metabolism in upper and lower body obesity. Int J Obesity 1991;15:101-108.
31. Reed MJ, Cheng RW, Simmonds M, Richmond W, James VHT. Dietary lipids: an additional regulator of plasma levels of sex hormone binding globulin. J Clin Endocrinol Metab 1987;64:1083-1085.
32. Bhathena SJ, Berlin E, Judd J, Nair PP, Kennedy BW, Jones J, et al. Hormones regulating lipid and carbohydrate metabolism in premenopausal women: modulation by dietary lipids. Am J Clin Nutr 1989;49:752-757.
33. Ingram D, Bennett F, Wood A. Estradiol binding to plasma proteins after changing to a low-fat diet. Nutr Cancer 1989; 12:327-332.
34. Hartz AJ, Rupley DC, Rimm AA. The association of girth measurements with disease in 32,856 women. Am J Epidemiol 1984;119:71-80.
35. Haffner SM, Dunn JF, Katz MS. Relationship of sex hormone-binding globulin to lipid, lipoprotein, glucose, and insulin concentrations in postmenopausal women. Metabolism 1992;41:278-284.
106
General discussion
36. Bagatell CI, Knopp RH, Vale WW, Rivier JE, Biemner WJ. Physiologic testosterone levels in normal men suppress high-density lipoprotein cholesterol levels. Ann Intern Med 1992;116(12 pt l):967-973.
37. Wild RA. Lipid metabolism and hyperandrogenism. Clin Obstet Gynecol 1991;34:864-871.
38. Leenen R, Kooy K van der, Seidell JC, Deurenberg P, Koppeschaar HPF. Body fat distribution and sex hormones in relation to serum lipids in obese subjects. J Steroid Biochemistry 1990;36(Suppl):10S.
39. Peiris AN, Mueller RA, Strove MF, Smith GA, Kissebah AH. Relationship of androgenic activity to splanchnic insulin metabolism and peripheral glucose utilization in premenopausal women. J Qin Endocrinol Metab 1987;64:162-169.
40. Evans DJ, Hoffmann RG, Kalkhoff RK, Kissebah AH. Relationship of androgenic activity to body fat topography, fat cell morphology, and metabolic aberrations in premenopausal women. J Clin Endocrinol Metab 1983;57:304-310.
41. Pasquali R, Antenucci D, Casimirri F, Venturoli S, Paradisi R, Hibbri R, et al. Insulin as a factor of increased androgen production in women with obesity and polycystic ovaries. J Endocrinol Invest 1987;10:575-579.
42. Nestler JE, Clorc JN, Strauss JF, Blackard WG. The effects of hyperinsulinemia on serum testosterone, progesterone, dehydroepiandrosterone sulfate, and Cortisol levels in normal women and in a woman with hyperandrogenism, insulin resistance, and acanthosis nigricans. J Qin Endocrinol Metab 1987;64:180-184.
43. Seidell JC, Bjorntorp P, Sjdstrom L, Kvist H, Sannerstedt R. Visceral fat accumulation in men is positively associated with insulin, glucose, and C-peptide levels, but negatively with testosterone levels. Metabolism 1990;39:897-901.
44. Pasquali R, Casimirri F, Cantobelli S, Melchionda N, Labate AMM, Fabbri R, et al. Effect of obesity and body fat distribution on sex hormones and insulin in men. Metabolism 1991;40:101-104.
45. Garner DM, Wooley SC. Confronting the failure of behavioral and dietary treatments for obesity. Qin Psychol Rev 1991;11:729-780.
107
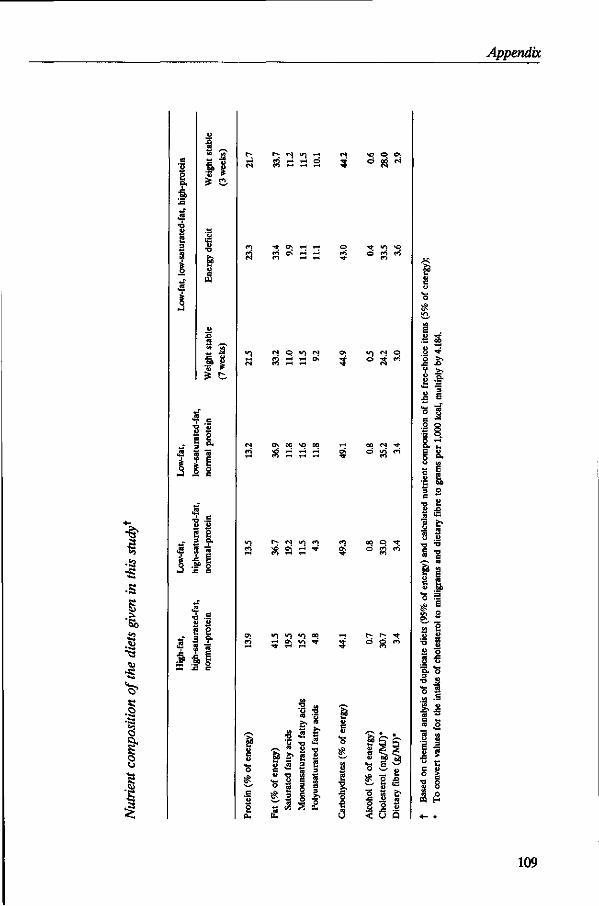
Appendix
e a. •a
2
3 1 §
•a
5 Bo
I 8
S
s
2 S «j 3 a .
•v S | . f i g
r - (N V J i-i <N
CO i-J r-1 o 5
e> i-H .-i
w © v j c-i <2 H H O <«•> * - l 1-H
i ^ N q
ON 00 VO 00 *-<
2 & i r2 i
2 e 3 a.
.f 1 **"» fO
r» IN v) n » 2 3 '
V ) V ) V I CO * - t
2 05 yS *r 3; ,-. ' T H H
« 5 f •S ^ .2
-E " a -o
S o. a <2 &
2 I o
<3
r a
< u Q
109
LIST OF ABBREVIATIONS
A ABD/TfflGH MASS BMI CHD
co2 CT DHEAS DIT DPA
Ex
E2 EN% EN-TEST FFA FFM HDL HDL/LDL fflGH-SAT H-TGL LDL LH LOW-SAT MRI NIDDM
o2 PCO PEE P/S RIA RMR SD SEE SEM SHBG SM SQ
androstenedione abdomen/thigh fat mass ratio body mass index coronary heart disease carbon dioxide computed tomography dehydroepiandrostenedione sulphate diet induced thermogenesis dual photon absorptiometry oestrone 176-oestradiol energy percent energy content of test meal free fatty acids fat free mass high density lipoprotein hdl cholesterol/ldl cholesterol ratio high fat, high saturated fat hepatic triglyceride lipase low density lipoprotein luteinizing hormone low fat, low saturated fat magnetic resonance imaging non insulin dependent diabetes mellitus oxygen poly cystic ovary postprandial energy expenditure polyunsaturated fat/saturated fat ratio radio immuno assay resting metabolic rate standard deviation standard error of estimate standard error of the mean sex hormone binding globulin simultaneous sequential
111
List of abbreviations
T testosterone TC total cholesterol TG triglycerides VLDL very low density lipoprotein V/S visceral/subcutaneous abdominal fat ratio WHR waist/hip ratio
112
SUMMARY
Obesity is a major public health problem in affluent societies, which is associated with a large number of metabolic complications. Health authorities recommend obese subjects to lose body weight in order to reduce the increased health risks associated with obesity. However, it has been suggested that particularly the distribution of body fat rather than overall body fatness may be responsible for specific health hazards of obesity. In particular, the adipose tissue stored in the abdominal cavity i.e. the visceral fat depot, seems to play an important role. At present, there appears to be increasing support that weight loss strategies should be aimed primarily to those obese individuals with visceral fat predominance. However, clear scientific evidence for these propositions is still scarce.
The purpose of the research described in this thesis was to investigate the relationships between visceral fat accumulation and serum lipids, energy expenditure, and sex hormone levels in healthy obese men and premenopausal women undergoing weight loss therapy. The subjects, aged 27-51 years, with an initial body mass index of 28-38 kg/m2, received a strictly controlled diet for 13 weeks providing a 4.2 MJ/day energy deficit. Magnetic resonance imaging was used to quantify fat depots.
In women but not in men, visceral fat accumulation was associated with a less favourable serum lipid profile independent of age and body fat percentage: higher triglyceride levels, lower levels of high-density-lipoprotein (HDL) cholesterol and a reduced HDL cholesterol/low-density-lipoprotein (LDL) cholesterol ratio. Within each sex, subcutaneous fat neither at abdominal level nor at hip level was related to serum lipid levels (Chapter 2). In addition, in women only, visceral fat predominance was positively related to resting metabolic rate (RMR) and diet-induced thermogenesis (DIT) (Chapter 3). Furthermore, in women, an abundance of visceral fat was associated with a relatively increased androgenicity as reflected by diminished levels of sex-hormone-binding-globulin (SHBG) and the ratio of free 176-oestradiol (ly/free testosterone (T), and elevated levels free T. In men, a relationship between visceral fat accumulation and sex hormone levels could not be confirmed (Chapter 6).
Obese women and men with an initial abundance of visceral fat did not lose body weight more easily than obese subjects with less visceral fat, but they lost larger amounts of visceral fat (Chapter 3). As a consequence of the initially larger visceral fat depot in men than in women, men had a larger reduction in visceral fat compared with women. The mean weight reduction of 12.2 ± 3.5 (SD) kg due to the energy-deficit diet, resulted also in larger reductions in serum levels of total cholesterol, LDL cholesterol, and triglycerides and a larger increase in the HDL cholesterol/LDL cholesterol ratio in men than in women. Comparison of these average changes between both sexes suggests a potential role of visceral fat loss in improving the serum lipid profile of obese subjects.
113
Summary
However, within each sex, no significant associations between visceral fat loss and changes in serum lipids could be found, except for a significant relationship in women between visceral fat loss and improvement of the HDL cholesterol level. In obese women but not in men, visceral fat accumulation before weight loss was associated with improvement of HDL cholesterol and triglyceride levels after weight loss (Chapter 4). In addition, in women only, a reduction in the visceral fat depot was accompanied by rises in SHBG levels and the free E2/free T ratio, and thus, by a relative reduction in androgenicity regardless of total body fat loss (Chapter 6).
In this study, the independent effect of weight loss on serum lipids could be separated from the effect of dietary fat modification usually accompanying a dietary weight loss treatment. Weight loss per se had a beneficial effect on all serum lipid levels. Dietary fat modification as advocated by dietary guidelines (reducing the intake of total fat and saturated fatty acids) without energy restriction, also had a favourable effect on total-, LDL cholesterol, and triglycerides, but it led to unfavourable reductions in HDL cholesterol and HDL cholesterol/LDL cholesterol ratios. The effects of weight loss per se and dietary fat modification seems to be additive (Chapter 5).
The considerable additive effects of weight loss per se in optimizing the serum lipid profile of obese subjects underscores the importance of establishing successful dietary weight loss treatment for obesity. It is, however, notoriously difficult for post-obese subjects to maintain the reduced body weight and, therefore, more emphasis should be paid to the improvement of the long-term prognosis of the treatment of obesity and most of all to the prevention of obesity. Furthermore, the present findings suggest that there seems to be gender differences in the associations between visceral fat accumulation and serum lipids, energy expenditure (RMR and DIT), and sex hormone levels in healthy moderately obese subjects. The reasons for these gender differences remain to be elucidated. It is concluded that particularly healthy moderately obese women with a visceral fat predominance benefit from a dietary weight loss treatment with respect to their serum lipid profile and sex hormone levels, whereas in healthy moderately obese men, a distinction with respect to the amount of visceral fat seems not to be relevant. Extrapolation from this selected group of obese subjects to a general obese population should be done with caution. It should be kept in mind that the present findings do not reveal whether weight loss treatment will indeed reduce the number of subjects with coronary heart disease. Therefore, in future, long-term follow-up studies are needed to evaluate the efficacy of weight loss treatment for the prevention of this hazardous disease.
114
SAMENVATTING
Obesitas (vetzucht) is een groot probleem voor de volksgezondheid in welvarende landen. Gezondheidsorganisaties adviseren dikke mensen af te slanken om zo de verhoogde gezondheidsrisico's die samengaan met obesitas, zoals coronaire hartziekten en niet-insuline afhankelijke diabetes, te reduceren. In diverse studies wordt echter beweerd dat vooral de vetverdeling en niet zozeer de mate van overgewicht de specifieke metabole complicaties van obesitas veroorzaakt. Met name het vet dat opgeslagen is in de buikholte (het zogenaamd visceraal vet) schijnt hierbij een belangrijke rol te spelen. Momenteel wordt in toenemende mate gesuggereerd dat vooral dikke mensen met een overmaat aan visceraal vet geadviseerd zou moeten worden om af te slanken. Duidelijke wetenschappelijke bewijzen voor deze beweringen zijn nog niet geleverd.
Dit onderzoek had als doel de relaties te bestuderen tussen de hoeveelheid visceraal vet enerzijds en de serum lipiden, het energieverbruik en de geslachtshormonen anderzijds bij gezonde, obese mannen en premenopausale vrouwen die een afslankdieet volgden. De proefpersonen varierend in leeftijd van 27 tot 51 jaar en met een queteletindex van 28 tot 38 kg/m2, ontvingen gedurende 13 weken een gecontroleerd dieet dat 4,2 MJ (1000 kcal) lager was dan hun normale energiebehoefte. De verschillende vetdepots werden gekwantificeerd met behulp van een beeldvormende techniek gebaseerd op magnetische resonantie.
In tegenstelling tot bij mannen, werd bij vrouwen geconstateerd dat een overmaat aan visceraal vet, onafhankelijk van leeftijd en vetpercentage, gerelateerd was aan een minder gunstig serum-lipidenprofiel: hogere triglyceriden spiegels, lagere concentraties hoog-densiteit-lipoproteine (HDL)-cholesterol en een lagere verhouding tussen HDLr cholesterol en laag-densiteit-lipoproteine (LDL)-cholesterol. Voor beide sexen bleek er geen relatie te bestaan tussen de hoeveelheid onderhuidsvet ter hoogte van de buik en de heupen, en het gehalte aan serum lipiden (Hoofdstuk 2). Bovendien werd alleen bij vrouwen een positief verband gevonden tussen de hoeveelheid visceraal vet enerzijds en de ruststofwisseling en de door voeding gei'nduceerde thermogenese anderzijds (Hoofdstuk 3). Vrouwen met een overmaat aan visceraal vet bleken tevens een relatief verhoogde androgeniteit te hebben, hetgeen tot uitdrukking kwam in een lagere geslachtshormoon-gebonden-globuline (SHBG) spiegel, een verhoogde vrije testosteron (T) spiegel en een lagere verhouding vrij 178-oestradiol (Ey/vrij T. Bij mannen kon echter geen relatie worden aangetoond tussen de hoeveelheid visceraal vet en geslachtshormonen concentraties (Hoofdstuk 6).
Obese vrouwen en mannen met relatief veel visceraal vet bleken niet gemakkelijker hun lichaamsgewicht te verminderen dan obese mensen met minder visceraal vet. Daarentegen verloren zij wel grotere hoeveelheden visceraal vet (Hoofdstuk 3).
115
Samenvatting
Aangezien mannen meer visceraal vet hebben dan vrouwen, verloren obese mannen dus ook meer visceraal vet. Het gemiddelde gewichtsverlies van 12,2 ± 3,5 (SD) kg als gevolg van het energiebeperkt dieet, resulteerde bij mannen in een grotere afname in het totaal cholesterol-, LDL-cholesterol- en triglyceridengehalte, en in een grotere toename van de HDL-cholesterol/LDL-cholesterol verhouding dan bij vrouwen. Vergelijking van deze gemiddelde veranderingen tussen beide sexen suggereert dat een reductie van de hoeveelheid visceraal vet van belang is bij het verbeteren van het serum-lipidenprofiel van obese mensen. Binnen beide sexen konden echter geen significante relaties worden aangetoond tussen de hoeveelheid visceraal vetverlies en veranderingen in de serum lipiden spiegels, met uitzondering van een significant verband bij vrouwen tussen een reductie van visceraal vet en een verhoging van het HDL-cholesterolgehalte. Alleen bij obese vrouwen bleek een overmaat aan visceraal vet voor afslanken gerelateerd te zijn aan een verbetering van zowel de HDL-cholesterol- als de triglyceriden spiegel na afslanken (Hoofdstuk 4). Bovendien werd bij vrouwen een verband gevonden tussen de hoeveelheid visceraal vetverlies enerzijds en een verhoging in de SHBG Spiegel en de verhouding vrij Ej/vrij T, en dus een relatieve reductie in androgeniteit, anderzijds (Hoofdstuk 6).
In deze afslankstudie was het mogelijk om het effect van het gewichtsverlies op het serum-lipidenprofiel afzonderlijk te bestuderen van het effect van veranderingen in de voedingssamenstelling. Het gewichtsverlies had een gunstig effect op alle serum lipiden spiegels. Een verandering in voedingsvet volgens de voedingsrichtlijnen (vermindering van totale vet- en verzadigde vetzurenconsumptie) zonder een beperking in de energie-inname bleek ook een gunstig effect te hebben op het totaal cholesterol-, LDL-cholesterol- en triglyceridengehalte. Het leidde echter ook tot een afname van het HDL-cholesterolgehalte en de HDL-cholesterol/LDL-cholesterol verhouding. De effecten van gewichtsverlies en de veranderingen in de voeding bleken cumulatief te zijn (Hoofdstuk 5).
De aanzienlijke bijdrage van het gewichtsverlies aan de verbetering van het serum-lipidenprofiel van obese mensen bij een energiebeperkt dieet benadrukt het belang van afslanken. Voor afgeslankte mensen is het echter moeilijk om hun gereduceerde lichaamsgewicht te behouden. Daarom zou meer aandacht moeten worden besteed aan het handhaven van een succesvolle gewichtsafname en vooral aan de preventie van obesitas. De resultaten van dit onderzoek suggereren dat er bij gezonde, matige obese mensen verschillen bestaan tussen mannen en vrouwen voor wat betreft de relaties tussen een overmaat aan visceraal vet enerzijds en de serum lipiden, het energieverbruik (de ruststofwisseling en de door voeding geinduceerde thermogenese) en de geslachtshormonen anderzijds. Een verklaring voor dit verschil tussen de sexen moet nog worden onderzocht. Concluderend kan gesteld worden dat met name gezonde, matige obese, premenopausale vrouwen met een overmaat aan visceraal vet baat hebben bij een
116
Samenvatting
afslankdieet vanwege een verbetering van het serum-lipidenprofiel en de geslachtshormoonspiegels. Bij gezonde, matige obese mannen daarentegen, lijkt een onderscheid ten aanzien van de hoeveelheid visceraal vet niet relevant te zijn. Extrapolatie van de resultaten uit dit onderzoek, uitgevoerd bij een geselecteerde groep obese mensen, naar een algemene obese populatie zou met voorzichtigheid betracht moeten worden. Verder moet men zich realiseren dat de huidige resultaten niet aangeven of afslanken inderdaad leidt tot minder gevallen met coronaire hartziekten. In de toekomst zijn daarom lange termijn follow-up studies nodig die het effect van afslanken op de preventie van deze ziekten evalueren.
117
DANKWOORD/ACKNOWLEDGEMENTS
Het onderzoek beschreven in dit proefschrift is tot stand gekomen dankzij de medewerking, inzet en het enthousiasme van vele mensen. In de wandelgangen werd vaak gekscherend gesproken over het 'Af£G/4bob'-project in plaats van het 'ME7Mbob'-project, niet alleen vanwege de omvang van het onderzoek maar ook vanwege de grote aantallen mensen die bij dit onderzoek betrokken waren. Alle betrokkenen wil ik hierbij hartelijk bedanken. Een aantal personen wil ik echter met name noemen.
In de eerste plaats wil ik mijn promotor Prof.dr. J.G.AJ. Hautvast en mijn twee co-promotoren Dr.ir. J.C. Seidell en Dr. P. Deurenberg bedanken. Professor Hautvast, bedankt voor de mij geboden mogelijkheid om dit onderzoek uit te voeren. In de afgelopen jaren heb ik veel geleerd en niet alleen op wetenschappelijk gebied. Ik hoop van harte dat onze samenwerking ook in Pakistan voortgezet gaat worden. Jaap en Paul, jullie wil ik danken voor jullie heldere onderzoeksvisie, jullie begeleiding, jullie inhoudelijke kennis en de stimulerende wetenschappelijke discussies. Ik heb jullie opbouwende kritiek op de manuscripten altijd zeer gewaardeerd.
Verder wil ik Karin van der Kooy noemen met wie ik het onderzoek heb uitgevoerd. Karin, ondanks dat we zo verschillend zijn, vormden we een geweldig team. Jouw steun heeft me vaak geholpen. Bedankt voor de plezierige samenwerking, de motiverende gesprekken en onze vruchtbare discussies. Karin, veel succes in je nieuwe baan. Ik zal je missen!
Het berekenen en het samenstellen van de voedingen, de dieet-begeleiding van de proefpersonen en de organisatie in de keuken was in handen van de dietisten Anneke Droop en Saskia Meyboom. Hartelijk dank voor jullie enthousiasme en geweldige inzet (ook buiten de officiele werktijden). Jullie 'humeur en temperament...' zorgden voor een gezellige tijd. Gedurende bepaalde perioden in het onderzoek werden Anneke en Saskia bijgestaan door 4 dietisten: Hilde van Die, Evelien Korte, Monique Muylkens, Bert Winter, en nog 23 keukenmedewerkers en chauffeurs. Iedereen bedankt!
Frans Schouten heeft in het kader van dit onderzoek heel wat bergen werk verzet, zowel beneden in de fysiologie-ruimte als boven op het laboratorium. Frans, bedankt voor al je hulp.
Daarnaast wil ik alle deelnemers aan dit onderzoek bedanken voor hun doorzettingsvermogen, enthousiasme en de conscientieuze uitvoering van het onderzoek. Ik denk met genoegen terug aan de vele autoritjes, 'knijpsessies' en de gezellige maar vaak ook serieuze gesprekken.
De huisartsen Drs. Aloys EX. Giesen en Drs. Henk G. Martijn uit Dodewaard ben ik erkentelijk voor de uitvoering van de medische keuringen en het afnemen van de vetbiopten. Ondanks jullie drukke praktijk, wisten jullie altijd op tijd te zijn om wat
119
Dankwoord
prikken te zetten. Het afnemen van de vele bloedmonsters als ook de analyses in het bloed, de urine
en de voedingen werden voornamelijk gedaan door de medewerkers van het laboratorium van de vakgroep Humane Voeding. Joke Barendse, Leslie Boogerd, Jannie Bos, Peter van de Bovenkamp, Cock Germing, Jan Harryvan, Robert Hovenier, H61ene Huppelschoten, Truus Kosmeijer, Ans Soffers en Ronald Sperber, alien hartelijk dank!
Prof.dr. J.H.H. Thijssen ben ik erkentelijk voor de geboden mogelijkheid om hormoonbepalingen te laten doen op het endocrinologisch laboratorium van het Academisch Ziekenhuis Utrecht. Mevrouw W. Veeman, bedankt voor de vele analyses. Dr. Hans P.F. Koppeschaar heeft mij meer inzicht gegeven in de uiterst ingewikkelde problematiek rondom hormonen. Hans, bedankt voor je heldere en duidelijke uitleg.
Mijn dank gaat ook uit naar Dr.ir. Jan A. Weststrate, een belangrijk initiator van het project. Jan, zelfs na je vertrek bij de vakgroep bleef je geinteresseerd en betrokken bij het wel en wee van het project. Het laboratorium van Unilever Research in Vlaardingen nam de analyses van de vrije vetzuren voor zijn rekening.
Ook een woord van dank ben ik verschuldigd aan Dr. C.J.G. Bakker van het NMR-instituut van het Academisch Ziekenhuis Utrecht, waar bijna ieder maandagavond de NMR-metingen werden uitgevoerd. Prof.dr. F. Zonneveld van Philips Medical Systems in Best wil ik danken voor de geboden mogelijkheid om de NMR-scans uit te werken.
Het kritisch commentaar van Prof.dr. M.B. Katan op het manuscript beschreven in Hoofdstuk 5 heb ik als zeer waardevol ervaren. Martijn, mijn dank hiervoor is groot. I would like to thank Prof.dr. D. Southgate for reading and correcting parts of this thesis. In addition, I am indebted to Dr. H. Schneider from Wander AG/Sandoz Nutrition Ltd., Bern, Switzerland for supplying the slimming products.
Dit onderzoek was niet mogelijk geweest zonder de medewerking van in totaal 26 doctoraalstudenten: Jolanda Boer, Sandra Borsboom, Saskia Brinkman, Clothilde Bun, Mieke Daelen, Ingeborg Deerenberg, Karin van het Hof, Karin Janssen, Ellen de Jong, Toon Joos, Marian Kamphuis, Elma Klein Kranenburg, Dianne Oldenkamp, Patty Portier, Karin Schardt, Angela Schulz, Tetta Sengkery, Monique Steijaert, Jos Veld, Petra Verhoef, Barbara Versluys, Lucy van de Vijver, Marjolein Visser, Ina Warmelink, Hanneke Wessels en Karin Weterings. Jullie wil ik alien bedanken voor de prettige samenwerking en de belangrijke bijdragen die jullie geleverd hebben aan het onderzoek. Ook de bijdragen van de diverse stagiaires van de dietetiek-opleidingen in Nijmegen en Amsterdam, de leraren opleiding in Utrecht, en de CMTS in Ede waren waardevol: Caroline Engelbrecht, Barbara de Groen, Eveline Hoedemaker, Hetty Kwak, Willem van Leeuwen, Petra Maassen, Johan van Muggen, Christiaan Oei, Tanja Timmermans en Eta van Vliert, hartelijk bedankt!
Een voordeel van dit veelzijdige project was dat ik ook van andere onderzoeksgebieden, niet beschreven in dit proefschrift, iets heb kunnen leren. Bedankt
120
Dankwoord
Kees de Graaf, Inge Huisveld en Pauline van der Veeken. Ook onmisbaar in dit onderzoek zijn geweest de hulp van de medewerkers van de
tekenkamer, de afdeling fotografie en de technische dienst van het Biotechnion. Fijn, dat jullie altijd voor ons klaar stonden.
Alle collega's van de vakgroep Humane Voeding wil ik bedanken voor hun collegialiteit en behulpzaamheid gedurende het onderzoek. In het bijzonder, dank aan de AIO's, OIO's en PHD's van de vakgroep voor de gezellige en vaak oh zo turbulente tijd. Onthoud, eendracht maakt macht!
Verder wil ik al mijn vrienden en mijn familie bedanken voor hun voortdurende belangstelling voor mijn werk. Vele vrienden hebben zelfs gedurende een korte tijd meegewerkt aan het onderzoek als inpakkers en/of als chauffeurs. Vooral in de drukke tijden van het onderzoek waren de gezellige etentjes, de stap- en spelletjesavonden een welkome afwisseling.
Pap en mam, jullie hebben mij de mogelijkheid en motivatie gegeven om te studeren. Op alle mogelijke manieren hebben jullie mij altijd geholpen. Mam, jij was bijvoorbeeld mijn eerste 'slachtoffer' voor de onderwaterweging. Bedankt voor al jullie goede zorgen!
Ten slotte wil ik Michael bedanken voor zijn steun, vriendschap, vertrouwen en bovenal voor zijn relativeringsvermogen. Mike, bedankt ook dat je in je spaarzame vrije dagen zo voortreffelijk de lay-out hebt verzorgd. Ik verheug me er nu al op om nu eindelijk samen naar Pakistan te gaan.
121
CURRICULUM VITAE
Rianne Leenen werd geboren op 16 augustus 1963 te Valkenswaard. In 1982 behaalde zij haar VWO-diploma aan het Hertog Jan College te Valkenswaard. In datzelfde jaar begon zij met de studie 'Voeding van de Mens' aan de toenmalige Landbouwhogeschool te Wageningen. Tijdens haar studie deed zij een afstudeervak Humane Voeding, uitgevoerd bij de afdeling Gastro-enterologie van het St. Radboudziekenhuis te Nijmegen (Prof.dr. M.B. Katan, Dr. F.M. Nagengast). Op grond van dit onderzoek 'Voedingsvezel en coloncarcinogenese' ontving zij in 1988 de Parke-Davis prijs. Tevens deed zij een afstudeervak Toxicologic bij de vakgroep Toxicologie van de Landbouwuniversiteit (Prof.dr. J.H. Koeman). Vanaf oktober 1987 tot april 1988 werd een stage periode doorgebracht bij het 'Dunn Clinical Nutrition Centre' te Cambridge in Engeland (Prof.dr. R. Whitehead, Dr. M. Elia). In juni 1988 behaalde zij het diploma van landbouwkundig ingenieur. Op 1 augustus 1988 trad zij als assistent-in-opleiding in dienst bij de vakgroep Humane Voeding van de Landbouwuniversiteit te Wageningen, alwaar het in dit proefschrift beschreven onderzoek werd uitgevoerd.
123
Related Documents