Virtus AllianzGI Emerging Markets Opportunities Fund Virtus AllianzGI Focused Growth Fund Virtus AllianzGI Global Small-Cap Fund Virtus AllianzGI Health Sciences Fund Virtus AllianzGI Income & Growth Fund Virtus AllianzGI Mid-Cap Growth Fund Virtus AllianzGI Small-Cap Fund Virtus AllianzGI Technology Fund Virtus NFJ Dividend Value Fund Virtus NFJ International Value Fund Virtus NFJ Large-Cap Value Fund Virtus NFJ Mid-Cap Value Fund Virtus NFJ Small-Cap Value Fund As permitted by regulations adopted by the Securities and Exchange Commission, paper copies of each Fund’s shareholder reports like this one will no longer be sent by mail, unless specifically requested from the Fund or from your financial intermediary, such as a broker-dealer or bank. Instead, the reports will be made available on a website, and you will be notified by mail each time a report is posted and provided with a website link to access the report. If you already elected to receive shareholder reports electronically, you will not be affected by this change and you need not take any action. You may elect at any time to receive not only shareholder reports but also certain other communications from the Fund electronically, or you may elect to receive paper copies of all future shareholder reports free of charge to you. If you own your shares directly with the Fund, you may make such elections by calling the Fund at 1-800-243-1574 or, with respect to requesting electronic delivery, by visiting www.virtus.com. An election made directly with the Fund will apply to all Virtus Mutual Funds in which you own shares directly. If you own your shares through a financial intermediary, please contact your financial intermediary to make your request and to determine whether your election will apply to all funds in which you own shares through that intermediary. SEMIANNUAL REPORT VIRTUS INVESTMENT TRUST December 31, 2021 Not FDIC Insured • No Bank Guarantee • May Lose Value

Welcome message from author
This document is posted to help you gain knowledge. Please leave a comment to let me know what you think about it! Share it to your friends and learn new things together.
Transcript
Virtus AllianzGI Emerging Markets Opportunities Fund
Virtus AllianzGI Focused Growth Fund
Virtus AllianzGI Global Small-Cap Fund
Virtus AllianzGI Health Sciences Fund
Virtus AllianzGI Income & Growth Fund
Virtus AllianzGI Mid-Cap Growth Fund
Virtus AllianzGI Small-Cap Fund
Virtus AllianzGI Technology Fund
Virtus NFJ Dividend Value Fund
Virtus NFJ International Value Fund
Virtus NFJ Large-Cap Value Fund
Virtus NFJ Mid-Cap Value Fund
Virtus NFJ Small-Cap Value Fund
As permitted by regulations adopted by the Securities and Exchange Commission, paper copies of each Fund’s shareholder reports like this one will no longerbe sent by mail, unless specifically requested from the Fund or from your financial intermediary, such as a broker-dealer or bank. Instead, the reports will bemade available on a website, and you will be notified by mail each time a report is posted and provided with a website link to access the report. If you alreadyelected to receive shareholder reports electronically, you will not be affected by this change and you need not take any action.
You may elect at any time to receive not only shareholder reports but also certain other communications from the Fund electronically, or you may elect toreceive paper copies of all future shareholder reports free of charge to you. If you own your shares directly with the Fund, you may make such elections bycalling the Fund at 1-800-243-1574 or, with respect to requesting electronic delivery, by visiting www.virtus.com. An election made directly with the Fundwill apply to all Virtus Mutual Funds in which you own shares directly. If you own your shares through a financial intermediary, please contact your financialintermediary to make your request and to determine whether your election will apply to all funds in which you own shares through that intermediary.
SEMIANNUAL REPORT
VIRTUS INVESTMENT TRUST
December 31, 2021
Not FDIC Insured • No Bank Guarantee • May Lose Value
Table of Contents
Message to Shareholders ........................................................................................................... 1Disclosure of Fund Expenses...................................................................................................... 2Key Investment Terms ................................................................................................................ 6Portfolio Holdings Summary Weightings ...................................................................................... 7
Fund
Scheduleof
Investments
Virtus AllianzGI Emerging Markets Opportunities Fund (“AllianzGI Emerging MarketsOpportunities Fund”)............................................................................................................
9
Virtus AllianzGI Focused Growth Fund (“AllianzGI Focused Growth Fund”).............................. 11Virtus AllianzGI Global Small-Cap Fund (“AllianzGI Global Small-Cap Fund”) .......................... 13Virtus AllianzGI Health Sciences Fund (“AllianzGI Health Sciences Fund”) .............................. 16Virtus AllianzGI Income & Growth Fund (“AllianzGI Income & Growth Fund”) ........................... 18Virtus AllianzGI Mid-Cap Growth Fund (“AllianzGI Mid-Cap Growth Fund”) .............................. 30Virtus AllianzGI Small-Cap Fund (“AllianzGI Small-Cap Fund”) ............................................... 32Virtus AllianzGI Technology Fund (“AllianzGI Technology Fund”) ............................................. 37Virtus NFJ Dividend Value Fund (“NFJ Dividend Value Fund”) ................................................ 40Virtus NFJ International Value Fund (“NFJ International Value Fund”)...................................... 42Virtus NFJ Large-Cap Value Fund (“NFJ Large-Cap Value Fund”) ........................................... 44Virtus NFJ Mid-Cap Value Fund (“NFJ Mid-Cap Value Fund”) ................................................. 46Virtus NFJ Small-Cap Value Fund (“NFJ Small-Cap Value Fund”) ........................................... 48
Statements of Assets and Liabilities............................................................................................. 50Statements of Operations ........................................................................................................... 58Statements of Changes in Net Assets .......................................................................................... 62Financial Highlights .................................................................................................................... 67Notes to Financial Statements..................................................................................................... 81
Proxy Voting Procedures and Voting Record (Form N-PX)
The subadvisers vote proxies, if any, relating to portfolio securities in accordance with procedures that have beenapproved by the Board of Trustees of the Trust (“Trustees”, or the “Board”). You may obtain a description of theseprocedures, along with information regarding how the Funds voted proxies during the most recent 12-month periodended June 30, free of charge, by calling toll-free 1-800-243-1574. This information is also available through theSecurities and Exchange Commission’s (the “SEC”) website at https://www.sec.gov.
PORTFOLIO HOLDINGS INFORMATION
The Trust files a complete schedule of portfolio holdings for each Fund with the SEC for the first and third quarters ofeach fiscal year as an exhibit to its reports on Form N-PORT-P. Form N-PORT-P is available on the SEC’s website athttps://www.sec.gov.

To Virtus Investment Trust Shareholders:
I am pleased to present this semiannual report, which reviews the performance of your Fund for the sixmonths ended December 31, 2021.
During this fiscal period, markets balanced optimism about the economic reopening with concerns aboutthe Delta and Omicron variants of COVID-19. Strong corporate profitability drove equity markets generallyhigher for much of the period, although higher inflation levels and the expected tapering of FederalReserve (Fed) support weighed on investor sentiment.
For the six months ended December 31, 2021, U.S. large-capitalization stocks returned 11.67%, asmeasured by the S&P 500® Index, while small-cap stocks were down 2.31%, as measured by the Russell 2000® Index.Within international equities, developed markets, as measured by the MSCI EAFE® Index (net), returned 2.24%, whileemerging markets, as measured by the MSCI Emerging Markets Index (net), declined 9.30%.
In fixed income markets, the yield on the 10-year Treasury rose to 1.52% on December 31, 2021, from 1.45% on June 30,2021, as fears of rising inflation persisted. The broader U.S. fixed income market, as represented by the BloombergU.S. Aggregate Bond Index, was slightly positive, with a return of 0.06% for the six-month period, but non-investment gradebonds, as measured by the Bloomberg U.S. Corporate High Yield Bond Index, were up 1.60%.
Thank you for entrusting the Virtus Funds with your assets. Please call our customer service team at 800-243-1574 if youhave questions about your account or require assistance. We appreciate your business and remain committed to yourlong-term financial success.
Sincerely,
George R. AylwardPresident, Virtus Investment Trust
February 2022
Refer to the Fund Summary section for your Fund’s performance. Performance data quoted represents past results. Pastperformance is no guarantee of future results, and current performance may be higher or lower than the performance shownabove. Investing involves risk, including the risk of loss of principal invested.
MESSAGE TO SHAREHOLDERS
1
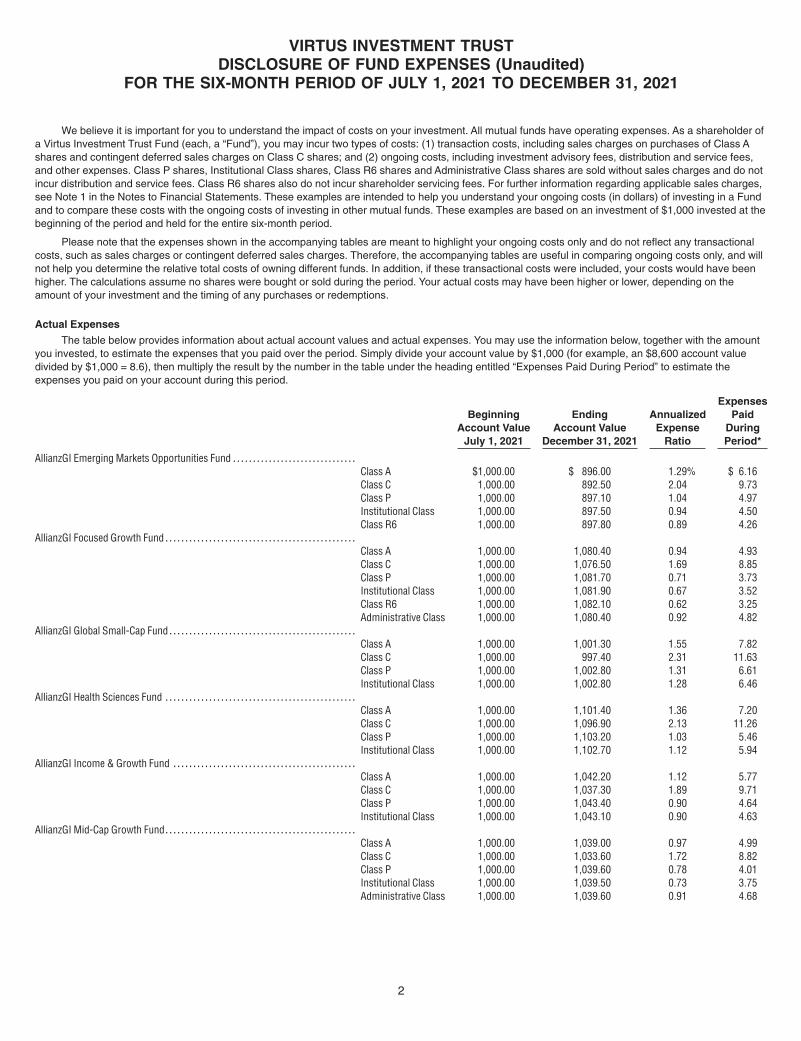
We believe it is important for you to understand the impact of costs on your investment. All mutual funds have operating expenses. As a shareholder ofa Virtus Investment Trust Fund (each, a “Fund”), you may incur two types of costs: (1) transaction costs, including sales charges on purchases of Class Ashares and contingent deferred sales charges on Class C shares; and (2) ongoing costs, including investment advisory fees, distribution and service fees,and other expenses. Class P shares, Institutional Class shares, Class R6 shares and Administrative Class shares are sold without sales charges and do notincur distribution and service fees. Class R6 shares also do not incur shareholder servicing fees. For further information regarding applicable sales charges,see Note 1 in the Notes to Financial Statements. These examples are intended to help you understand your ongoing costs (in dollars) of investing in a Fundand to compare these costs with the ongoing costs of investing in other mutual funds. These examples are based on an investment of $1,000 invested at thebeginning of the period and held for the entire six-month period.
Please note that the expenses shown in the accompanying tables are meant to highlight your ongoing costs only and do not reflect any transactionalcosts, such as sales charges or contingent deferred sales charges. Therefore, the accompanying tables are useful in comparing ongoing costs only, and willnot help you determine the relative total costs of owning different funds. In addition, if these transactional costs were included, your costs would have beenhigher. The calculations assume no shares were bought or sold during the period. Your actual costs may have been higher or lower, depending on theamount of your investment and the timing of any purchases or redemptions.
Actual Expenses
The table below provides information about actual account values and actual expenses. You may use the information below, together with the amountyou invested, to estimate the expenses that you paid over the period. Simply divide your account value by $1,000 (for example, an $8,600 account valuedivided by $1,000 = 8.6), then multiply the result by the number in the table under the heading entitled “Expenses Paid During Period” to estimate theexpenses you paid on your account during this period.
BeginningAccount Value
July 1, 2021
EndingAccount Value
December 31, 2021
AnnualizedExpense
Ratio
ExpensesPaid
DuringPeriod*
AllianzGI Emerging Markets Opportunities Fund . . . . . . . . . . . . . . . . . . . . . . . . . . . . . . .Class A $1,000.00 $ 896.00 1.29% $ 6.16Class C 1,000.00 892.50 2.04 9.73Class P 1,000.00 897.10 1.04 4.97Institutional Class 1,000.00 897.50 0.94 4.50Class R6 1,000.00 897.80 0.89 4.26
AllianzGI Focused Growth Fund . . . . . . . . . . . . . . . . . . . . . . . . . . . . . . . . . . . . . . . . . . . . . . . .Class A 1,000.00 1,080.40 0.94 4.93Class C 1,000.00 1,076.50 1.69 8.85Class P 1,000.00 1,081.70 0.71 3.73Institutional Class 1,000.00 1,081.90 0.67 3.52Class R6 1,000.00 1,082.10 0.62 3.25Administrative Class 1,000.00 1,080.40 0.92 4.82
AllianzGI Global Small-Cap Fund . . . . . . . . . . . . . . . . . . . . . . . . . . . . . . . . . . . . . . . . . . . . . . .Class A 1,000.00 1,001.30 1.55 7.82Class C 1,000.00 997.40 2.31 11.63Class P 1,000.00 1,002.80 1.31 6.61Institutional Class 1,000.00 1,002.80 1.28 6.46
AllianzGI Health Sciences Fund . . . . . . . . . . . . . . . . . . . . . . . . . . . . . . . . . . . . . . . . . . . . . . . .Class A 1,000.00 1,101.40 1.36 7.20Class C 1,000.00 1,096.90 2.13 11.26Class P 1,000.00 1,103.20 1.03 5.46Institutional Class 1,000.00 1,102.70 1.12 5.94
AllianzGI Income & Growth Fund . . . . . . . . . . . . . . . . . . . . . . . . . . . . . . . . . . . . . . . . . . . . . .Class A 1,000.00 1,042.20 1.12 5.77Class C 1,000.00 1,037.30 1.89 9.71Class P 1,000.00 1,043.40 0.90 4.64Institutional Class 1,000.00 1,043.10 0.90 4.63
AllianzGI Mid-Cap Growth Fund. . . . . . . . . . . . . . . . . . . . . . . . . . . . . . . . . . . . . . . . . . . . . . . .Class A 1,000.00 1,039.00 0.97 4.99Class C 1,000.00 1,033.60 1.72 8.82Class P 1,000.00 1,039.60 0.78 4.01Institutional Class 1,000.00 1,039.50 0.73 3.75Administrative Class 1,000.00 1,039.60 0.91 4.68
VIRTUS INVESTMENT TRUSTDISCLOSURE OF FUND EXPENSES (Unaudited)
FOR THE SIX-MONTH PERIOD OF JULY 1, 2021 TO DECEMBER 31, 2021
2

BeginningAccount Value
July 1, 2021
EndingAccount Value
December 31, 2021
AnnualizedExpense
Ratio
ExpensesPaid
DuringPeriod*
AllianzGI Small-Cap Fund . . . . . . . . . . . . . . . . . . . . . . . . . . . . . . . . . . . . . . . . . . . . . . . . . . . . . .Class A $1,000.00 $1,032.90 1.17% $ 6.00Class C 1,000.00 1,028.90 1.92 9.82Class P 1,000.00 1,034.20 0.92 4.72Institutional Class 1,000.00 1,034.30 0.82 4.20Class R6 1,000.00 1,035.10 0.77 3.95
AllianzGI Technology Fund . . . . . . . . . . . . . . . . . . . . . . . . . . . . . . . . . . . . . . . . . . . . . . . . . . . . .Class A 1,000.00 1,058.10 1.41 7.31Class C 1,000.00 1,053.90 2.17 11.23Class P 1,000.00 1,059.30 1.19 6.18Institutional Class 1,000.00 1,059.50 1.13 5.87Administrative Class 1,000.00 1,057.80 1.47 7.62
NFJ Dividend Value Fund. . . . . . . . . . . . . . . . . . . . . . . . . . . . . . . . . . . . . . . . . . . . . . . . . . . . . . .Class A 1,000.00 1,119.50 1.00 5.34Class C 1,000.00 1,114.50 1.76 9.38Class P 1,000.00 1,121.20 0.73 3.90Institutional Class 1,000.00 1,121.10 0.70 3.74Class R6 1,000.00 1,121.70 0.64 3.42Administrative Class 1,000.00 1,119.40 0.91 4.86
NFJ International Value Fund. . . . . . . . . . . . . . . . . . . . . . . . . . . . . . . . . . . . . . . . . . . . . . . . . . .Class A 1,000.00 987.00 1.30 6.51Class C 1,000.00 984.00 2.02 10.10Class P 1,000.00 988.80 1.00 5.01Institutional Class 1,000.00 988.70 0.95 4.76Class R6 1,000.00 989.40 0.89 4.46Administrative Class 1,000.00 987.40 1.20 6.01
NFJ Large-Cap Value Fund . . . . . . . . . . . . . . . . . . . . . . . . . . . . . . . . . . . . . . . . . . . . . . . . . . . . .Class A 1,000.00 1,098.30 1.01 5.34Class C 1,000.00 1,094.00 1.76 9.29Class P 1,000.00 1,099.40 0.76 4.02Institutional Class 1,000.00 1,099.50 0.76 4.02Class R6** 1,000.00 1,022.50 0.64 1.13Administrative Class 1,000.00 1,098.30 1.00 5.29
NFJ Mid-Cap Value Fund . . . . . . . . . . . . . . . . . . . . . . . . . . . . . . . . . . . . . . . . . . . . . . . . . . . . . . .Class A 1,000.00 1,087.50 1.00 5.26Class C 1,000.00 1,083.60 1.75 9.19Class P 1,000.00 1,088.80 0.75 3.95Institutional Class 1,000.00 1,089.40 0.65 3.42Class R6 1,000.00 1,089.70 0.60 3.16Administrative Class 1,000.00 1,088.10 0.90 4.74
NFJ Small-Cap Value Fund . . . . . . . . . . . . . . . . . . . . . . . . . . . . . . . . . . . . . . . . . . . . . . . . . . . . .Class A 1,000.00 1,066.30 1.17 6.09Class C 1,000.00 1,062.50 1.92 9.98Class P 1,000.00 1,068.30 0.91 4.74Institutional Class 1,000.00 1,068.90 0.82 4.28Class R6 1,000.00 1,069.00 0.77 4.02Administrative Class 1,000.00 1,067.30 1.07 5.58
* Expenses are equal to the relevant Fund’s annualized expense ratio, which is net of waived fees and reimbursed expenses, if applicable, multiplied by the averageaccount value over the period, multiplied by the number of days (184) expenses were accrued in the most recent fiscal half-year, then divided by 365 to reflect theone-half year period.
** October 29, 2021, is the date the Class started accruing expenses. Expenses are equal to the Class’s annualized expense ratio, which is net of waived fees andreimbursed expenses, if applicable, multiplied by the average account value over the period, multiplied by the number of days (64) expenses were accrued in themost recent fiscal half-year, then divided by 365 to reflect the one-half year period.
For Funds which may invest in other funds, the annualized expense ratios noted above do not reflect fees and expenses associated with any underlyingfunds. If such fees and expenses had been included, the expenses would have been higher.
VIRTUS INVESTMENT TRUSTDISCLOSURE OF FUND EXPENSES (Unaudited) (Continued)
FOR THE SIX-MONTH PERIOD OF JULY 1, 2021 TO DECEMBER 31, 2021
3

You can find more information about a Fund’s expenses in the Financial Statements section that follows. For additional information on operating expensesand other shareholder costs, refer to that Fund’s prospectus.
Hypothetical Example for Comparison Purposes
The table below provides information about hypothetical account values and hypothetical expenses based on a Fund’s actual expense ratio and anassumed rate of return of 5% per year before expenses, which is not your Fund’s actual return. The hypothetical account values and expenses may not beused to estimate the actual ending account balance or expenses you paid for the period. You may use this information to compare the ongoing costs ofinvesting in your Fund and other funds. To do so, compare these 5% hypothetical examples with the 5% hypothetical examples that appear in theshareholder reports of other mutual funds.
BeginningAccount Value
July 1, 2021
EndingAccount Value
December 31, 2021
AnnualizedExpense
Ratio
ExpensesPaid
DuringPeriod*
AllianzGI Emerging Markets Opportunities Fund . . . . . . . . . . . . . . . . . . . . . . . . . . . . . . .Class A $1,000.00 $1,018.70 1.29% $ 6.56Class C 1,000.00 1,014.92 2.04 10.36Class P 1,000.00 1,019.96 1.04 5.30Institutional Class 1,000.00 1,020.47 0.94 4.79Class R6 1,000.00 1,020.72 0.89 4.53
AllianzGI Focused Growth Fund . . . . . . . . . . . . . . . . . . . . . . . . . . . . . . . . . . . . . . . . . . . . . . . .Class A 1,000.00 1,020.47 0.94 4.79Class C 1,000.00 1,016.69 1.69 8.59Class P 1,000.00 1,021.63 0.71 3.62Institutional Class 1,000.00 1,021.83 0.67 3.41Class R6 1,000.00 1,022.08 0.62 3.16Administrative Class 1,000.00 1,020.57 0.92 4.69
AllianzGI Global Small-Cap Fund . . . . . . . . . . . . . . . . . . . . . . . . . . . . . . . . . . . . . . . . . . . . . . .Class A 1,000.00 1,017.39 1.55 7.88Class C 1,000.00 1,013.56 2.31 11.72Class P 1,000.00 1,018.60 1.31 6.67Institutional Class 1,000.00 1,018.75 1.28 6.51
AllianzGI Health Sciences Fund . . . . . . . . . . . . . . . . . . . . . . . . . . . . . . . . . . . . . . . . . . . . . . . .Class A 1,000.00 1,018.35 1.36 6.92Class C 1,000.00 1,014.47 2.13 10.82Class P 1,000.00 1,020.01 1.03 5.24Institutional Class 1,000.00 1,019.56 1.12 5.70
AllianzGI Income & Growth Fund . . . . . . . . . . . . . . . . . . . . . . . . . . . . . . . . . . . . . . . . . . . . . .Class A 1,000.00 1,019.56 1.12 5.70Class C 1,000.00 1,015.68 1.89 9.60Class P 1,000.00 1,020.67 0.90 4.58Institutional Class 1,000.00 1,020.67 0.90 4.58
AllianzGI Mid-Cap Growth Fund. . . . . . . . . . . . . . . . . . . . . . . . . . . . . . . . . . . . . . . . . . . . . . . .Class A 1,000.00 1,020.32 0.97 4.94Class C 1,000.00 1,016.53 1.72 8.74Class P 1,000.00 1,021.27 0.78 3.97Institutional Class 1,000.00 1,021.53 0.73 3.72Administrative Class 1,000.00 1,020.62 0.91 4.63
AllianzGI Small-Cap Fund . . . . . . . . . . . . . . . . . . . . . . . . . . . . . . . . . . . . . . . . . . . . . . . . . . . . . .Class A 1,000.00 1,019.31 1.17 5.96Class C 1,000.00 1,015.53 1.92 9.75Class P 1,000.00 1,020.57 0.92 4.69Institutional Class 1,000.00 1,021.07 0.82 4.18Class R6 1,000.00 1,021.32 0.77 3.92
AllianzGI Technology Fund . . . . . . . . . . . . . . . . . . . . . . . . . . . . . . . . . . . . . . . . . . . . . . . . . . . . .Class A 1,000.00 1,018.10 1.41 7.17Class C 1,000.00 1,014.27 2.17 11.02Class P 1,000.00 1,019.21 1.19 6.06Institutional Class 1,000.00 1,019.51 1.13 5.75Administrative Class 1,000.00 1,017.80 1.47 7.48
VIRTUS INVESTMENT TRUSTDISCLOSURE OF FUND EXPENSES (Unaudited) (Continued)
FOR THE SIX-MONTH PERIOD OF JULY 1, 2021 TO DECEMBER 31, 2021
4
BeginningAccount Value
July 1, 2021
EndingAccount Value
December 31, 2021
AnnualizedExpense
Ratio
ExpensesPaid
DuringPeriod*
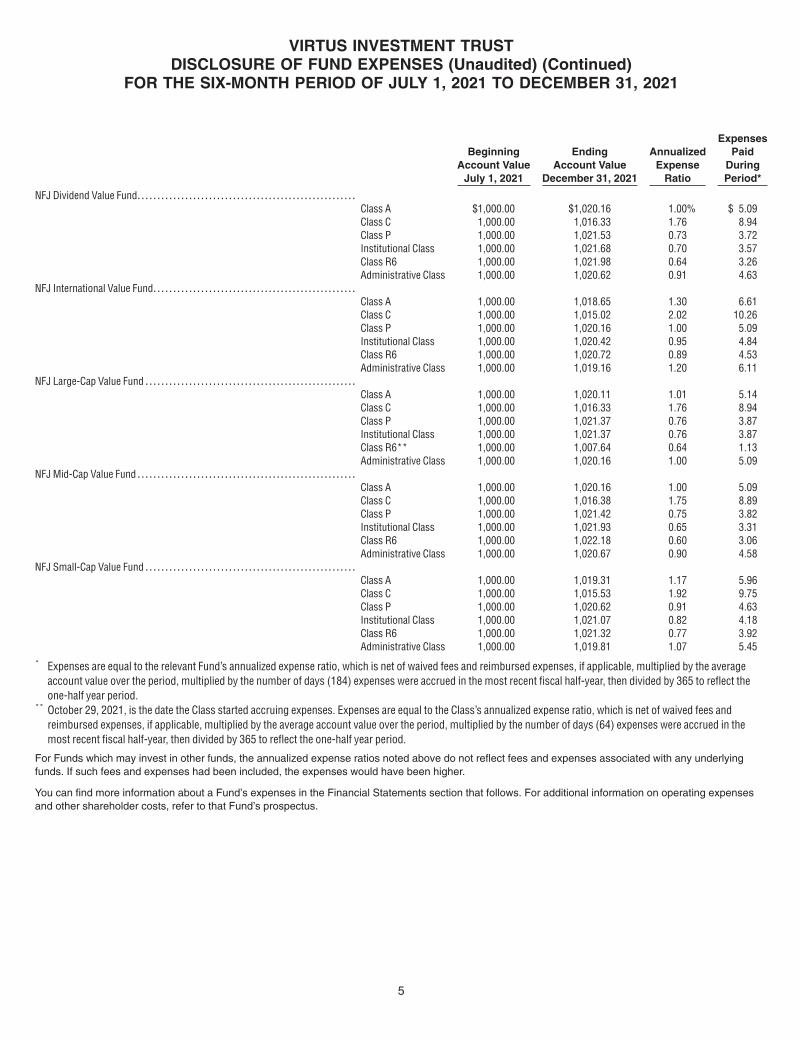
NFJ Dividend Value Fund. . . . . . . . . . . . . . . . . . . . . . . . . . . . . . . . . . . . . . . . . . . . . . . . . . . . . . .Class A $1,000.00 $1,020.16 1.00% $ 5.09Class C 1,000.00 1,016.33 1.76 8.94Class P 1,000.00 1,021.53 0.73 3.72Institutional Class 1,000.00 1,021.68 0.70 3.57Class R6 1,000.00 1,021.98 0.64 3.26Administrative Class 1,000.00 1,020.62 0.91 4.63
NFJ International Value Fund. . . . . . . . . . . . . . . . . . . . . . . . . . . . . . . . . . . . . . . . . . . . . . . . . . .Class A 1,000.00 1,018.65 1.30 6.61Class C 1,000.00 1,015.02 2.02 10.26Class P 1,000.00 1,020.16 1.00 5.09Institutional Class 1,000.00 1,020.42 0.95 4.84Class R6 1,000.00 1,020.72 0.89 4.53Administrative Class 1,000.00 1,019.16 1.20 6.11
NFJ Large-Cap Value Fund . . . . . . . . . . . . . . . . . . . . . . . . . . . . . . . . . . . . . . . . . . . . . . . . . . . . .Class A 1,000.00 1,020.11 1.01 5.14Class C 1,000.00 1,016.33 1.76 8.94Class P 1,000.00 1,021.37 0.76 3.87Institutional Class 1,000.00 1,021.37 0.76 3.87Class R6** 1,000.00 1,007.64 0.64 1.13Administrative Class 1,000.00 1,020.16 1.00 5.09
NFJ Mid-Cap Value Fund . . . . . . . . . . . . . . . . . . . . . . . . . . . . . . . . . . . . . . . . . . . . . . . . . . . . . . .Class A 1,000.00 1,020.16 1.00 5.09Class C 1,000.00 1,016.38 1.75 8.89Class P 1,000.00 1,021.42 0.75 3.82Institutional Class 1,000.00 1,021.93 0.65 3.31Class R6 1,000.00 1,022.18 0.60 3.06Administrative Class 1,000.00 1,020.67 0.90 4.58
NFJ Small-Cap Value Fund . . . . . . . . . . . . . . . . . . . . . . . . . . . . . . . . . . . . . . . . . . . . . . . . . . . . .Class A 1,000.00 1,019.31 1.17 5.96Class C 1,000.00 1,015.53 1.92 9.75Class P 1,000.00 1,020.62 0.91 4.63Institutional Class 1,000.00 1,021.07 0.82 4.18Class R6 1,000.00 1,021.32 0.77 3.92Administrative Class 1,000.00 1,019.81 1.07 5.45
* Expenses are equal to the relevant Fund’s annualized expense ratio, which is net of waived fees and reimbursed expenses, if applicable, multiplied by the averageaccount value over the period, multiplied by the number of days (184) expenses were accrued in the most recent fiscal half-year, then divided by 365 to reflect theone-half year period.
** October 29, 2021, is the date the Class started accruing expenses. Expenses are equal to the Class’s annualized expense ratio, which is net of waived fees andreimbursed expenses, if applicable, multiplied by the average account value over the period, multiplied by the number of days (64) expenses were accrued in themost recent fiscal half-year, then divided by 365 to reflect the one-half year period.
For Funds which may invest in other funds, the annualized expense ratios noted above do not reflect fees and expenses associated with any underlyingfunds. If such fees and expenses had been included, the expenses would have been higher.
You can find more information about a Fund’s expenses in the Financial Statements section that follows. For additional information on operating expensesand other shareholder costs, refer to that Fund’s prospectus.
VIRTUS INVESTMENT TRUSTDISCLOSURE OF FUND EXPENSES (Unaudited) (Continued)
FOR THE SIX-MONTH PERIOD OF JULY 1, 2021 TO DECEMBER 31, 2021
5

American Depositary Receipt (“ADR”)Represents shares of foreign companies traded in U.S. dollars on U.S. exchanges that are held by a U.S. bank or a trust. Foreigncompanies use ADRs in order to make it easier for Americans to buy their shares.
Bloomberg U.S. Aggregate Bond IndexThe Bloomberg U.S. Aggregate Bond Index measures the U.S. investment-grade fixed-rate bond market. The index is calculated on a totalreturn basis. The index is unmanaged, its returns do not reflect any fees, expenses, or sales charges, and it is not available for directinvestment.
Bloomberg U.S. Corporate High Yield Bond IndexThe Bloomberg U.S. Corporate High Yield Bond Index measures the U.S. dollar-denominated, high yield, fixed-rate corporate bond market.The index is calculated on a total return basis. The index is unmanaged, its returns do not reflect any fees, expenses, or sales charges, andit is not available for direct investment.
Federal Reserve (the “Fed”)The Central Bank of the United States, responsible for controlling the money supply, interest rates and credit with the goal of keeping theU.S. economy and currency stable. Governed by a seven-member board, the system includes 12 regional Federal Reserve Banks, 25branches and all national and state banks that are part of the system.
Gross Domestic Product (“GDP”)The GDP represents the market value of all goods and services produced by the economy during the period measured, including personalconsumption, government purchases, private inventories, paid-in construction costs, and the foreign trade balance.
Global Depositary Receipt (“GDR”)Represents shares of foreign companies traded in U.S. dollars on U.S. exchanges that are held by an international bank or a trust. Foreigncompanies use GDRs in order to make it easier for foreign investors to buy their shares.
London Interbank Offered Rate (“LIBOR”)A benchmark rate that some of the world’s leading banks charge each other for short-term loans and that serves as the first step tocalculating interest rates on various loans throughout the world.
MSCI EAFE® Index (net)The MSCI EAFE® (Europe, Australasia, Far East) Index (net) is a free float-adjusted market capitalization-weighted index that measuresdeveloped foreign market equity performance, excluding the U.S. and Canada. The index is calculated on a total return basis with netdividends reinvested. The index is unmanaged, its returns do not reflect any fees, expenses, or sales charges, and it is not available fordirect investment.
MSCI Emerging Markets Index (net)The MSCI Emerging Markets Index (net) is a free float-adjusted market capitalization-weighted index designed to measure equity marketperformance in the global emerging markets. The index is calculated on a total return basis with net dividends reinvested. The index isunmanaged, its returns do not reflect any fees, expenses, or sales charges, and it is not available for direct investment.
Real Estate Investment Trust (“REIT”)A publicly traded company that owns, develops and operates income-producing real estate such as apartments, office buildings, hotels,shopping centers and other commercial properties.
Russell 2000® IndexThe Russell 2000® is a market capitalization-weighted index of the 2,000 smallest companies in the Russell Universe, which comprises the3,000 largest U.S. companies. The index is calculated on a total return basis with dividends reinvested. The index is unmanaged, itsreturns do not reflect any fees, expenses, or sales charges, and it is not available for direct investment.
S&P 500® IndexThe S&P 500® Index is a free-float market capitalization-weighted index of 500 of the largest U.S. companies. The index is calculated on atotal return basis with dividends reinvested. The index is unmanaged, its returns do not reflect any fees, expenses, or sales charges, and itis not available for direct investment.
Unit TrustA collection of different (and usually related) shares.
VIRTUS INVESTMENT TRUSTKEY INVESTMENT TERMS (Unaudited)
DECEMBER 31, 2021
6
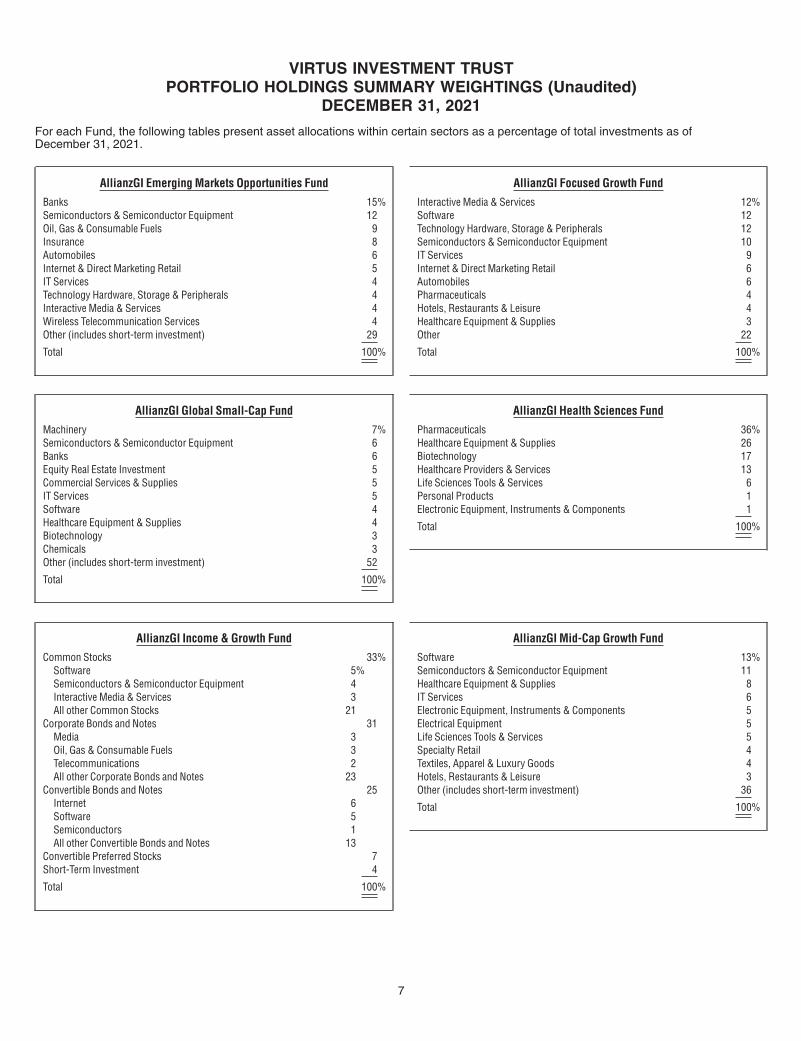
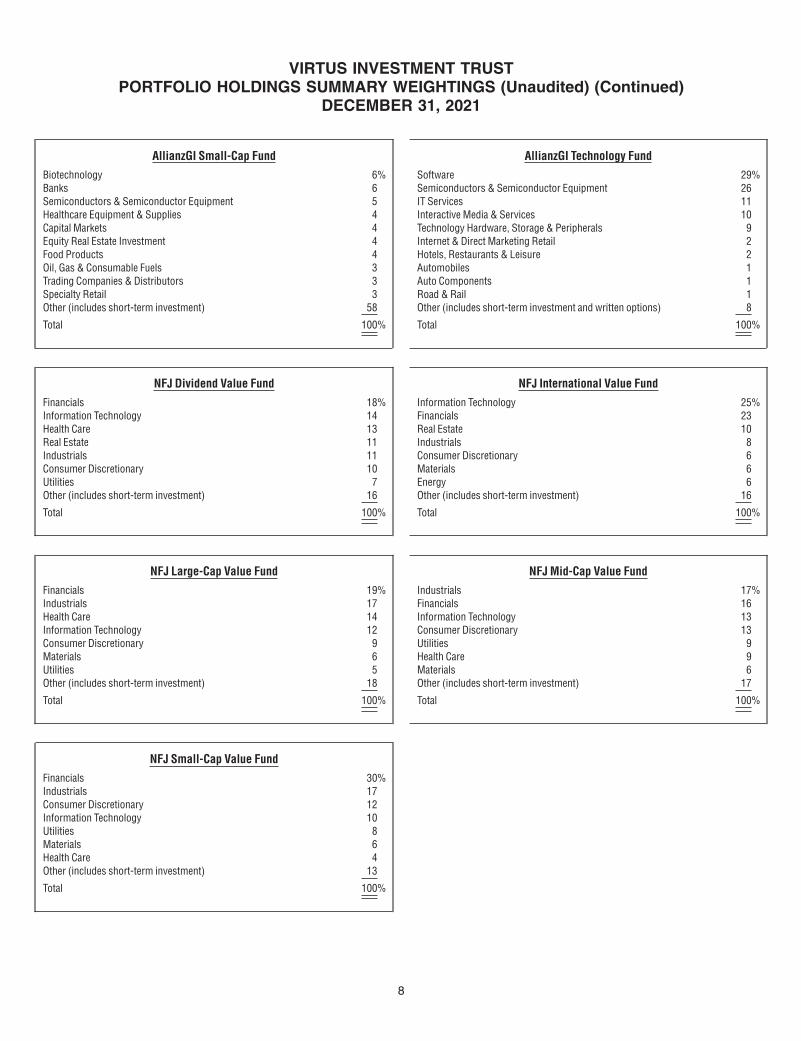
For each Fund, the following tables present asset allocations within certain sectors as a percentage of total investments as ofDecember 31, 2021.
AllianzGI Emerging Markets Opportunities Fund
Banks 15%Semiconductors & Semiconductor Equipment 12Oil, Gas & Consumable Fuels 9Insurance 8Automobiles 6Internet & Direct Marketing Retail 5IT Services 4Technology Hardware, Storage & Peripherals 4Interactive Media & Services 4Wireless Telecommunication Services 4Other (includes short-term investment) 29
Total 100%
AllianzGI Focused Growth Fund
Interactive Media & Services 12%Software 12Technology Hardware, Storage & Peripherals 12Semiconductors & Semiconductor Equipment 10IT Services 9Internet & Direct Marketing Retail 6Automobiles 6Pharmaceuticals 4Hotels, Restaurants & Leisure 4Healthcare Equipment & Supplies 3Other 22
Total 100%
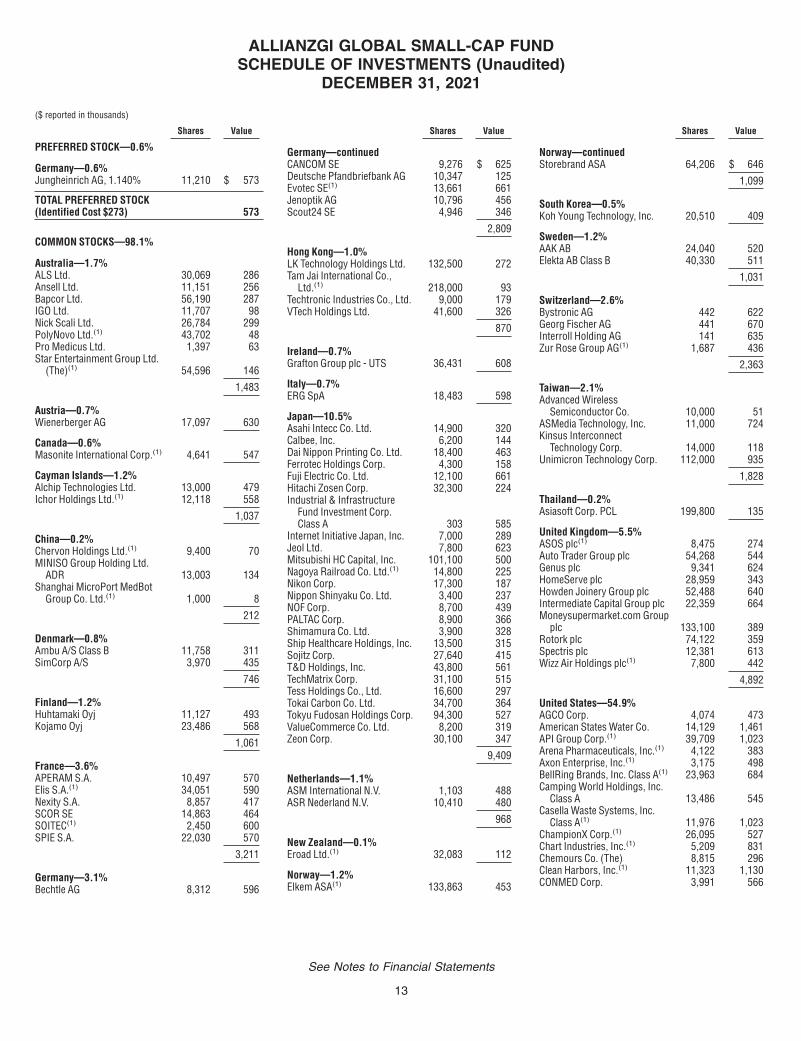
AllianzGI Global Small-Cap Fund
Machinery 7%Semiconductors & Semiconductor Equipment 6Banks 6Equity Real Estate Investment 5Commercial Services & Supplies 5IT Services 5Software 4Healthcare Equipment & Supplies 4Biotechnology 3Chemicals 3Other (includes short-term investment) 52
Total 100%
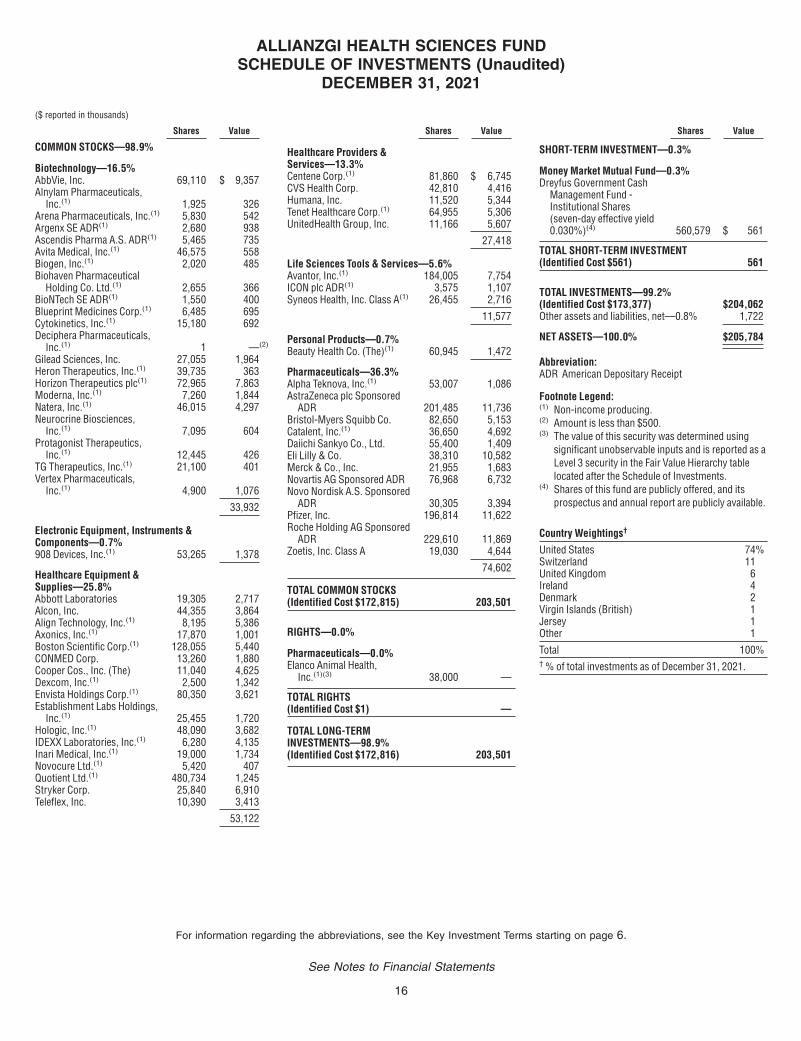
AllianzGI Health Sciences Fund
Pharmaceuticals 36%Healthcare Equipment & Supplies 26Biotechnology 17Healthcare Providers & Services 13Life Sciences Tools & Services 6Personal Products 1Electronic Equipment, Instruments & Components 1
Total 100%
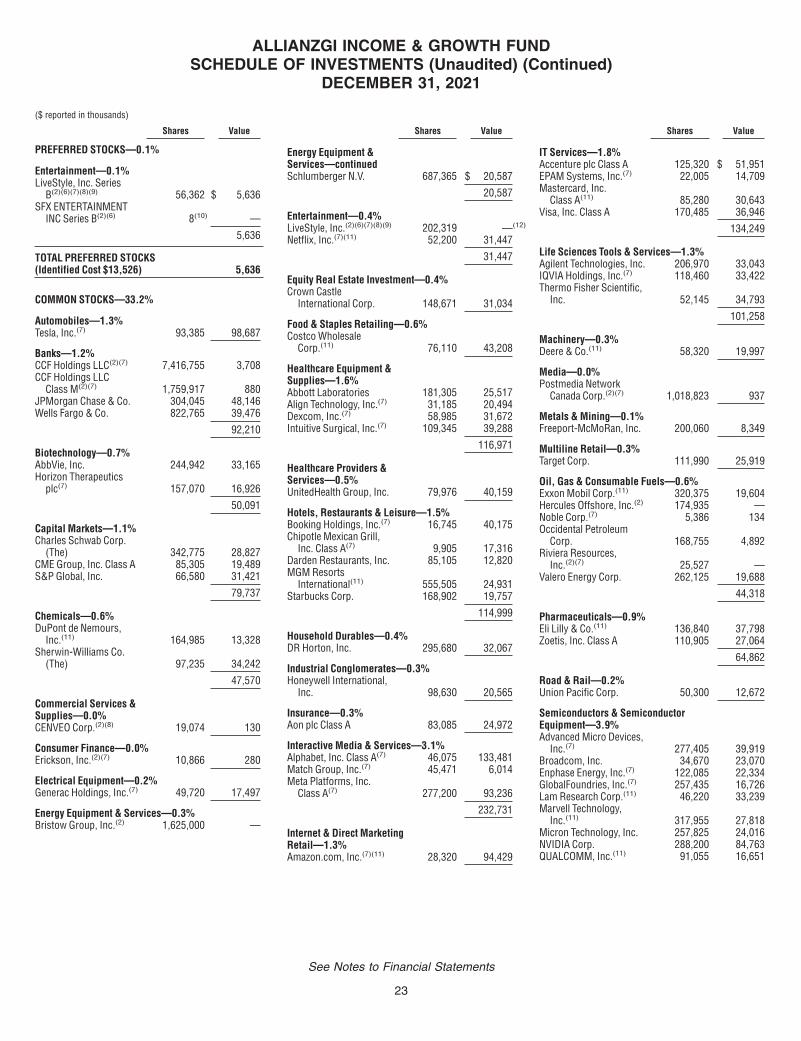
AllianzGI Income & Growth Fund
Common Stocks 33%Software 5%Semiconductors & Semiconductor Equipment 4Interactive Media & Services 3All other Common Stocks 21
Corporate Bonds and Notes 31Media 3Oil, Gas & Consumable Fuels 3Telecommunications 2All other Corporate Bonds and Notes 23
Convertible Bonds and Notes 25Internet 6Software 5Semiconductors 1All other Convertible Bonds and Notes 13
Convertible Preferred Stocks 7Short-Term Investment 4
Total 100%
AllianzGI Mid-Cap Growth Fund
Software 13%Semiconductors & Semiconductor Equipment 11Healthcare Equipment & Supplies 8IT Services 6Electronic Equipment, Instruments & Components 5Electrical Equipment 5Life Sciences Tools & Services 5Specialty Retail 4Textiles, Apparel & Luxury Goods 4Hotels, Restaurants & Leisure 3Other (includes short-term investment) 36
Total 100%
VIRTUS INVESTMENT TRUSTPORTFOLIO HOLDINGS SUMMARY WEIGHTINGS (Unaudited)
DECEMBER 31, 2021
7
AllianzGI Small-Cap Fund
Biotechnology 6%Banks 6Semiconductors & Semiconductor Equipment 5Healthcare Equipment & Supplies 4Capital Markets 4Equity Real Estate Investment 4Food Products 4Oil, Gas & Consumable Fuels 3Trading Companies & Distributors 3Specialty Retail 3Other (includes short-term investment) 58
Total 100%
AllianzGI Technology Fund
Software 29%Semiconductors & Semiconductor Equipment 26IT Services 11Interactive Media & Services 10Technology Hardware, Storage & Peripherals 9Internet & Direct Marketing Retail 2Hotels, Restaurants & Leisure 2Automobiles 1Auto Components 1Road & Rail 1Other (includes short-term investment and written options) 8
Total 100%
NFJ Dividend Value Fund
Financials 18%Information Technology 14Health Care 13Real Estate 11Industrials 11Consumer Discretionary 10Utilities 7Other (includes short-term investment) 16
Total 100%
NFJ International Value Fund
Information Technology 25%Financials 23Real Estate 10Industrials 8Consumer Discretionary 6Materials 6Energy 6Other (includes short-term investment) 16
Total 100%
NFJ Large-Cap Value Fund
Financials 19%Industrials 17Health Care 14Information Technology 12Consumer Discretionary 9Materials 6Utilities 5Other (includes short-term investment) 18
Total 100%
NFJ Mid-Cap Value Fund
Industrials 17%Financials 16Information Technology 13Consumer Discretionary 13Utilities 9Health Care 9Materials 6Other (includes short-term investment) 17
Total 100%
NFJ Small-Cap Value Fund
Financials 30%Industrials 17Consumer Discretionary 12Information Technology 10Utilities 8Materials 6Health Care 4Other (includes short-term investment) 13
Total 100%
VIRTUS INVESTMENT TRUSTPORTFOLIO HOLDINGS SUMMARY WEIGHTINGS (Unaudited) (Continued)
DECEMBER 31, 2021
8
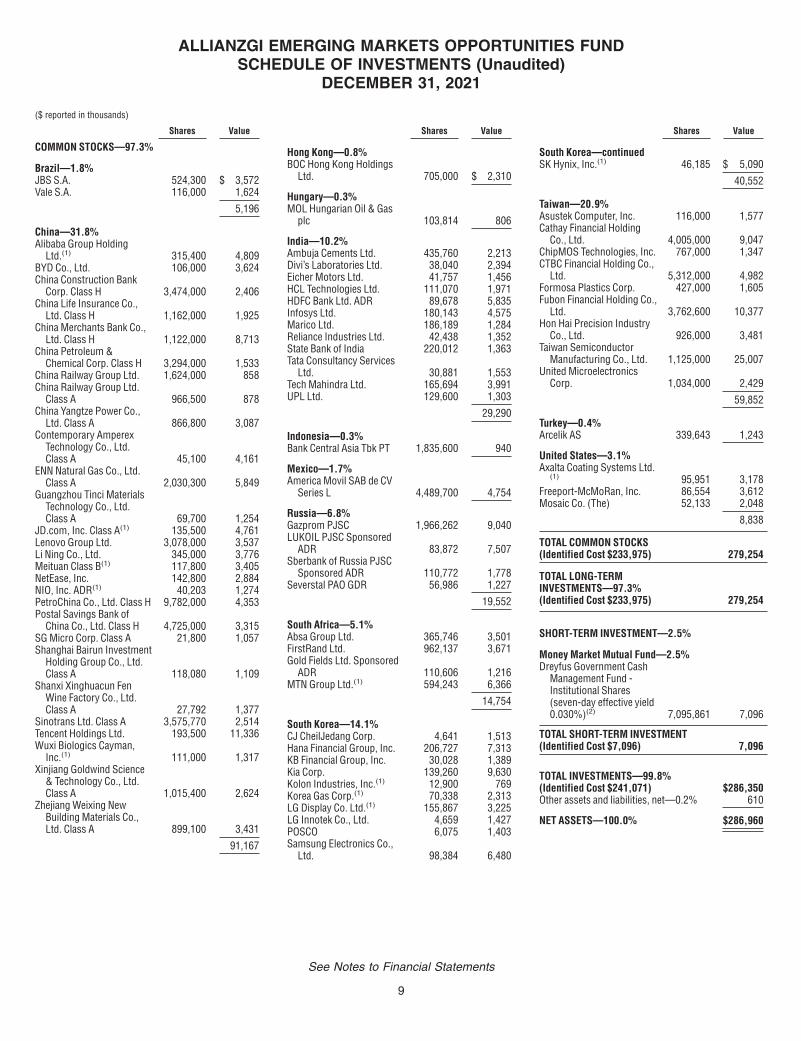
Shares Value
COMMON STOCKS—97.3%
Brazil—1.8%JBS S.A. 524,300 $ 3,572Vale S.A. 116,000 1,624
5,196
China—31.8%Alibaba Group Holding
Ltd.(1) 315,400 4,809BYD Co., Ltd. 106,000 3,624China Construction Bank
Corp. Class H 3,474,000 2,406China Life Insurance Co.,
Ltd. Class H 1,162,000 1,925China Merchants Bank Co.,
Ltd. Class H 1,122,000 8,713China Petroleum &
Chemical Corp. Class H 3,294,000 1,533China Railway Group Ltd. 1,624,000 858China Railway Group Ltd.
Class A 966,500 878China Yangtze Power Co.,
Ltd. Class A 866,800 3,087Contemporary Amperex
Technology Co., Ltd.Class A 45,100 4,161
ENN Natural Gas Co., Ltd.Class A 2,030,300 5,849
Guangzhou Tinci MaterialsTechnology Co., Ltd.Class A 69,700 1,254
JD.com, Inc. Class A(1) 135,500 4,761Lenovo Group Ltd. 3,078,000 3,537Li Ning Co., Ltd. 345,000 3,776Meituan Class B(1) 117,800 3,405NetEase, Inc. 142,800 2,884NIO, Inc. ADR(1) 40,203 1,274PetroChina Co., Ltd. Class H 9,782,000 4,353Postal Savings Bank of
China Co., Ltd. Class H 4,725,000 3,315SG Micro Corp. Class A 21,800 1,057Shanghai Bairun Investment
Holding Group Co., Ltd.Class A 118,080 1,109
Shanxi Xinghuacun FenWine Factory Co., Ltd.Class A 27,792 1,377
Sinotrans Ltd. Class A 3,575,770 2,514Tencent Holdings Ltd. 193,500 11,336Wuxi Biologics Cayman,
Inc.(1) 111,000 1,317Xinjiang Goldwind Science
& Technology Co., Ltd.Class A 1,015,400 2,624
Zhejiang Weixing NewBuilding Materials Co.,Ltd. Class A 899,100 3,431
91,167
Shares Value
Hong Kong—0.8%BOC Hong Kong Holdings
Ltd. 705,000 $ 2,310
Hungary—0.3%MOL Hungarian Oil & Gas
plc 103,814 806
India—10.2%Ambuja Cements Ltd. 435,760 2,213Divi’s Laboratories Ltd. 38,040 2,394Eicher Motors Ltd. 41,757 1,456HCL Technologies Ltd. 111,070 1,971HDFC Bank Ltd. ADR 89,678 5,835Infosys Ltd. 180,143 4,575Marico Ltd. 186,189 1,284Reliance Industries Ltd. 42,438 1,352State Bank of India 220,012 1,363Tata Consultancy Services
Ltd. 30,881 1,553Tech Mahindra Ltd. 165,694 3,991UPL Ltd. 129,600 1,303
29,290
Indonesia—0.3%Bank Central Asia Tbk PT 1,835,600 940
Mexico—1.7%America Movil SAB de CV
Series L 4,489,700 4,754
Russia—6.8%Gazprom PJSC 1,966,262 9,040LUKOIL PJSC Sponsored
ADR 83,872 7,507Sberbank of Russia PJSC
Sponsored ADR 110,772 1,778Severstal PAO GDR 56,986 1,227
19,552
South Africa—5.1%Absa Group Ltd. 365,746 3,501FirstRand Ltd. 962,137 3,671Gold Fields Ltd. Sponsored
ADR 110,606 1,216MTN Group Ltd.(1) 594,243 6,366
14,754
South Korea—14.1%CJ CheilJedang Corp. 4,641 1,513Hana Financial Group, Inc. 206,727 7,313KB Financial Group, Inc. 30,028 1,389Kia Corp. 139,260 9,630Kolon Industries, Inc.(1) 12,900 769Korea Gas Corp.(1) 70,338 2,313LG Display Co. Ltd.(1) 155,867 3,225LG Innotek Co., Ltd. 4,659 1,427POSCO 6,075 1,403Samsung Electronics Co.,
Ltd. 98,384 6,480
Shares Value
South Korea—continuedSK Hynix, Inc.(1) 46,185 $ 5,090
40,552
Taiwan—20.9%Asustek Computer, Inc. 116,000 1,577Cathay Financial Holding
Co., Ltd. 4,005,000 9,047ChipMOS Technologies, Inc. 767,000 1,347CTBC Financial Holding Co.,
Ltd. 5,312,000 4,982Formosa Plastics Corp. 427,000 1,605Fubon Financial Holding Co.,
Ltd. 3,762,600 10,377Hon Hai Precision Industry
Co., Ltd. 926,000 3,481Taiwan Semiconductor
Manufacturing Co., Ltd. 1,125,000 25,007United Microelectronics
Corp. 1,034,000 2,429
59,852
Turkey—0.4%Arcelik AS 339,643 1,243
United States—3.1%Axalta Coating Systems Ltd.
(1) 95,951 3,178Freeport-McMoRan, Inc. 86,554 3,612Mosaic Co. (The) 52,133 2,048
8,838
TOTAL COMMON STOCKS(Identified Cost $233,975) 279,254
TOTAL LONG-TERMINVESTMENTS—97.3%(Identified Cost $233,975) 279,254
SHORT-TERM INVESTMENT—2.5%
Money Market Mutual Fund—2.5%Dreyfus Government Cash
Management Fund -Institutional Shares(seven-day effective yield0.030%)(2) 7,095,861 7,096
TOTAL SHORT-TERM INVESTMENT(Identified Cost $7,096) 7,096
TOTAL INVESTMENTS—99.8%(Identified Cost $241,071) $286,350Other assets and liabilities, net—0.2% 610
NET ASSETS—100.0% $286,960
ALLIANZGI EMERGING MARKETS OPPORTUNITIES FUNDSCHEDULE OF INVESTMENTS (Unaudited)
DECEMBER 31, 2021
($ reported in thousands)
See Notes to Financial Statements
9
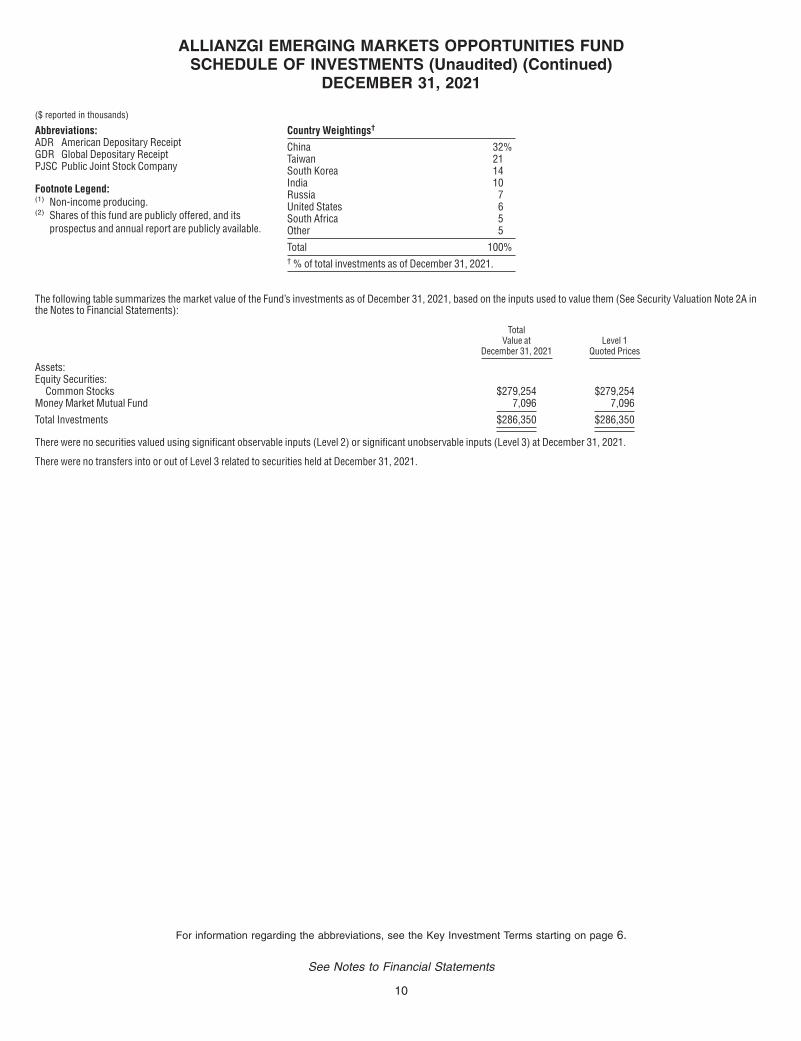
Abbreviations:ADR American Depositary ReceiptGDR Global Depositary ReceiptPJSC Public Joint Stock Company
Footnote Legend:(1) Non-income producing.(2) Shares of this fund are publicly offered, and its
prospectus and annual report are publicly available.
Country Weightings†
China 32%Taiwan 21South Korea 14India 10Russia 7United States 6South Africa 5Other 5
Total 100%† % of total investments as of December 31, 2021.
The following table summarizes the market value of the Fund’s investments as of December 31, 2021, based on the inputs used to value them (See Security Valuation Note 2A inthe Notes to Financial Statements):
TotalValue at
December 31, 2021Level 1
Quoted Prices
Assets:Equity Securities:
Common Stocks $279,254 $279,254Money Market Mutual Fund 7,096 7,096
Total Investments $286,350 $286,350
There were no securities valued using significant observable inputs (Level 2) or significant unobservable inputs (Level 3) at December 31, 2021.
There were no transfers into or out of Level 3 related to securities held at December 31, 2021.
ALLIANZGI EMERGING MARKETS OPPORTUNITIES FUNDSCHEDULE OF INVESTMENTS (Unaudited) (Continued)
DECEMBER 31, 2021
($ reported in thousands)
For information regarding the abbreviations, see the Key Investment Terms starting on page 6.
See Notes to Financial Statements
10
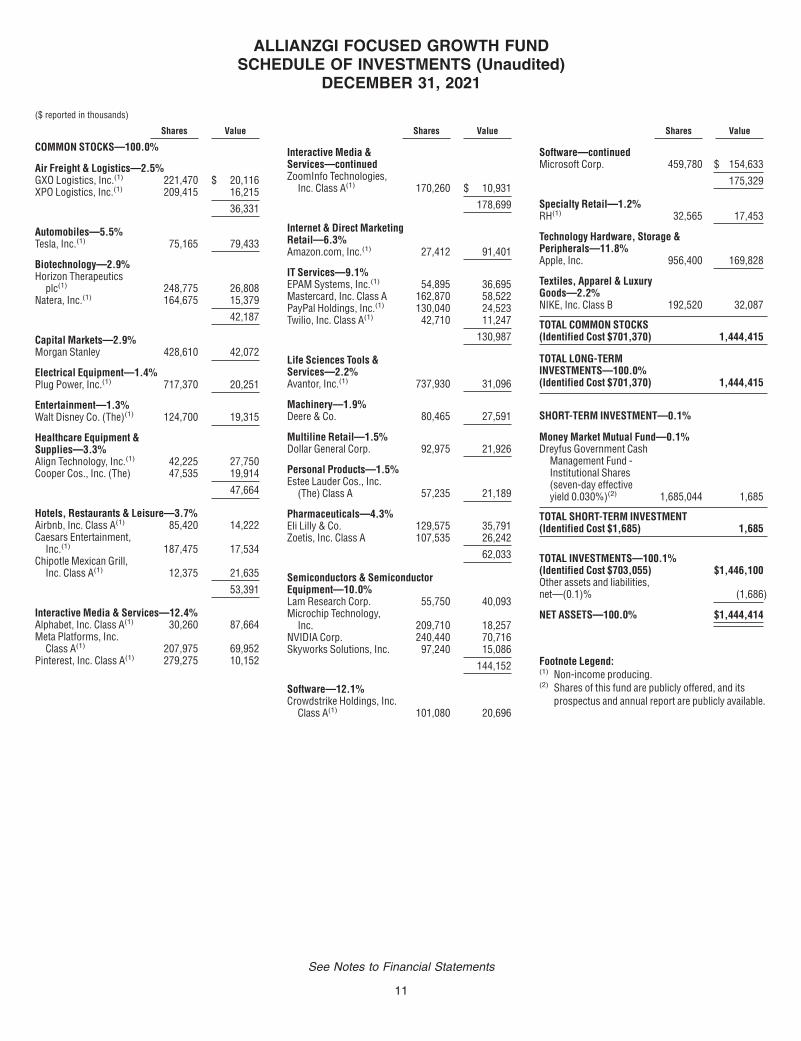
Shares Value
COMMON STOCKS—100.0%
Air Freight & Logistics—2.5%GXO Logistics, Inc.(1) 221,470 $ 20,116XPO Logistics, Inc.(1) 209,415 16,215
36,331
Automobiles—5.5%Tesla, Inc.(1) 75,165 79,433
Biotechnology—2.9%Horizon Therapeutics
plc(1) 248,775 26,808Natera, Inc.(1) 164,675 15,379
42,187
Capital Markets—2.9%Morgan Stanley 428,610 42,072
Electrical Equipment—1.4%Plug Power, Inc.(1) 717,370 20,251
Entertainment—1.3%Walt Disney Co. (The)(1) 124,700 19,315
Healthcare Equipment &Supplies—3.3%Align Technology, Inc.(1) 42,225 27,750Cooper Cos., Inc. (The) 47,535 19,914
47,664
Hotels, Restaurants & Leisure—3.7%Airbnb, Inc. Class A(1) 85,420 14,222Caesars Entertainment,
Inc.(1) 187,475 17,534Chipotle Mexican Grill,
Inc. Class A(1) 12,375 21,635
53,391
Interactive Media & Services—12.4%Alphabet, Inc. Class A(1) 30,260 87,664Meta Platforms, Inc.
Class A(1) 207,975 69,952Pinterest, Inc. Class A(1) 279,275 10,152
Shares Value
Interactive Media &Services—continuedZoomInfo Technologies,
Inc. Class A(1) 170,260 $ 10,931
178,699
Internet & Direct MarketingRetail—6.3%Amazon.com, Inc.(1) 27,412 91,401
IT Services—9.1%EPAM Systems, Inc.(1) 54,895 36,695Mastercard, Inc. Class A 162,870 58,522PayPal Holdings, Inc.(1) 130,040 24,523Twilio, Inc. Class A(1) 42,710 11,247
130,987
Life Sciences Tools &Services—2.2%Avantor, Inc.(1) 737,930 31,096
Machinery—1.9%Deere & Co. 80,465 27,591
Multiline Retail—1.5%Dollar General Corp. 92,975 21,926
Personal Products—1.5%Estee Lauder Cos., Inc.
(The) Class A 57,235 21,189
Pharmaceuticals—4.3%Eli Lilly & Co. 129,575 35,791Zoetis, Inc. Class A 107,535 26,242
62,033
Semiconductors & SemiconductorEquipment—10.0%Lam Research Corp. 55,750 40,093Microchip Technology,
Inc. 209,710 18,257NVIDIA Corp. 240,440 70,716Skyworks Solutions, Inc. 97,240 15,086
144,152
Software—12.1%Crowdstrike Holdings, Inc.
Class A(1) 101,080 20,696
Shares Value
Software—continuedMicrosoft Corp. 459,780 $ 154,633
175,329
Specialty Retail—1.2%RH(1) 32,565 17,453
Technology Hardware, Storage &Peripherals—11.8%Apple, Inc. 956,400 169,828
Textiles, Apparel & LuxuryGoods—2.2%NIKE, Inc. Class B 192,520 32,087
TOTAL COMMON STOCKS(Identified Cost $701,370) 1,444,415
TOTAL LONG-TERMINVESTMENTS—100.0%(Identified Cost $701,370) 1,444,415
SHORT-TERM INVESTMENT—0.1%
Money Market Mutual Fund—0.1%Dreyfus Government Cash
Management Fund -Institutional Shares(seven-day effectiveyield 0.030%)(2) 1,685,044 1,685
TOTAL SHORT-TERM INVESTMENT(Identified Cost $1,685) 1,685
TOTAL INVESTMENTS—100.1%(Identified Cost $703,055) $1,446,100Other assets and liabilities,net—(0.1)% (1,686)
NET ASSETS—100.0% $1,444,414
Footnote Legend:(1) Non-income producing.(2) Shares of this fund are publicly offered, and its
prospectus and annual report are publicly available.
ALLIANZGI FOCUSED GROWTH FUNDSCHEDULE OF INVESTMENTS (Unaudited)
DECEMBER 31, 2021
($ reported in thousands)
See Notes to Financial Statements
11
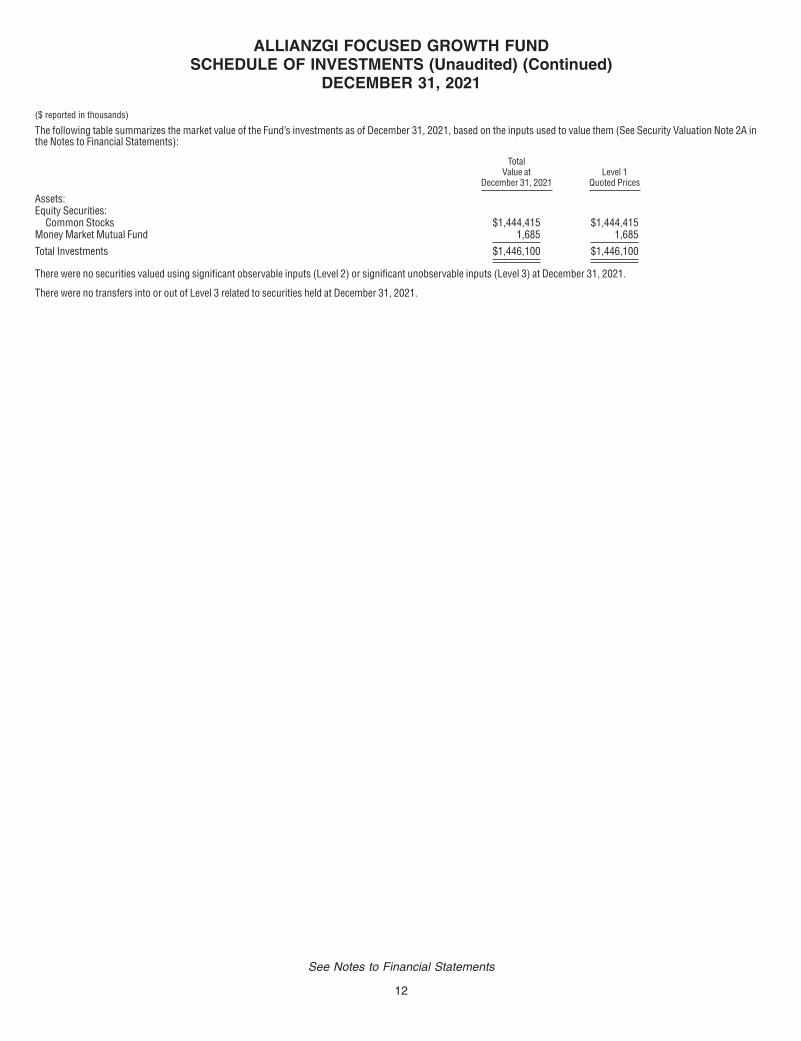
The following table summarizes the market value of the Fund’s investments as of December 31, 2021, based on the inputs used to value them (See Security Valuation Note 2A inthe Notes to Financial Statements):
TotalValue at
December 31, 2021Level 1
Quoted Prices
Assets:Equity Securities:
Common Stocks $1,444,415 $1,444,415Money Market Mutual Fund 1,685 1,685
Total Investments $1,446,100 $1,446,100
There were no securities valued using significant observable inputs (Level 2) or significant unobservable inputs (Level 3) at December 31, 2021.
There were no transfers into or out of Level 3 related to securities held at December 31, 2021.
ALLIANZGI FOCUSED GROWTH FUNDSCHEDULE OF INVESTMENTS (Unaudited) (Continued)
DECEMBER 31, 2021
($ reported in thousands)
See Notes to Financial Statements
12
Shares Value
PREFERRED STOCK—0.6%
Germany—0.6%Jungheinrich AG, 1.140% 11,210 $ 573
TOTAL PREFERRED STOCK(Identified Cost $273) 573
COMMON STOCKS—98.1%
Australia—1.7%ALS Ltd. 30,069 286Ansell Ltd. 11,151 256Bapcor Ltd. 56,190 287IGO Ltd. 11,707 98Nick Scali Ltd. 26,784 299PolyNovo Ltd.(1) 43,702 48Pro Medicus Ltd. 1,397 63Star Entertainment Group Ltd.
(The)(1) 54,596 146
1,483
Austria—0.7%Wienerberger AG 17,097 630
Canada—0.6%Masonite International Corp.(1) 4,641 547
Cayman Islands—1.2%Alchip Technologies Ltd. 13,000 479Ichor Holdings Ltd.(1) 12,118 558
1,037
China—0.2%Chervon Holdings Ltd.(1) 9,400 70MINISO Group Holding Ltd.
ADR 13,003 134Shanghai MicroPort MedBot
Group Co. Ltd.(1) 1,000 8
212
Denmark—0.8%Ambu A/S Class B 11,758 311SimCorp A/S 3,970 435
746
Finland—1.2%Huhtamaki Oyj 11,127 493Kojamo Oyj 23,486 568
1,061
France—3.6%APERAM S.A. 10,497 570Elis S.A.(1) 34,051 590Nexity S.A. 8,857 417SCOR SE 14,863 464SOITEC(1) 2,450 600SPIE S.A. 22,030 570
3,211
Germany—3.1%Bechtle AG 8,312 596
Shares Value
Germany—continuedCANCOM SE 9,276 $ 625Deutsche Pfandbriefbank AG 10,347 125Evotec SE(1) 13,661 661Jenoptik AG 10,796 456Scout24 SE 4,946 346
2,809
Hong Kong—1.0%LK Technology Holdings Ltd. 132,500 272Tam Jai International Co.,
Ltd.(1) 218,000 93Techtronic Industries Co., Ltd. 9,000 179VTech Holdings Ltd. 41,600 326
870
Ireland—0.7%Grafton Group plc - UTS 36,431 608
Italy—0.7%ERG SpA 18,483 598
Japan—10.5%Asahi Intecc Co. Ltd. 14,900 320Calbee, Inc. 6,200 144Dai Nippon Printing Co. Ltd. 18,400 463Ferrotec Holdings Corp. 4,300 158Fuji Electric Co. Ltd. 12,100 661Hitachi Zosen Corp. 32,300 224Industrial & Infrastructure
Fund Investment Corp.Class A 303 585
Internet Initiative Japan, Inc. 7,000 289Jeol Ltd. 7,800 623Mitsubishi HC Capital, Inc. 101,100 500Nagoya Railroad Co. Ltd.(1) 14,800 225Nikon Corp. 17,300 187Nippon Shinyaku Co. Ltd. 3,400 237NOF Corp. 8,700 439PALTAC Corp. 8,900 366Shimamura Co. Ltd. 3,900 328Ship Healthcare Holdings, Inc. 13,500 315Sojitz Corp. 27,640 415T&D Holdings, Inc. 43,800 561TechMatrix Corp. 31,100 515Tess Holdings Co., Ltd. 16,600 297Tokai Carbon Co. Ltd. 34,700 364Tokyu Fudosan Holdings Corp. 94,300 527ValueCommerce Co. Ltd. 8,200 319Zeon Corp. 30,100 347
9,409
Netherlands—1.1%ASM International N.V. 1,103 488ASR Nederland N.V. 10,410 480
968
New Zealand—0.1%Eroad Ltd.(1) 32,083 112
Norway—1.2%Elkem ASA(1) 133,863 453
Shares Value
Norway—continuedStorebrand ASA 64,206 $ 646
1,099
South Korea—0.5%Koh Young Technology, Inc. 20,510 409
Sweden—1.2%AAK AB 24,040 520Elekta AB Class B 40,330 511
1,031
Switzerland—2.6%Bystronic AG 442 622Georg Fischer AG 441 670Interroll Holding AG 141 635Zur Rose Group AG(1) 1,687 436
2,363
Taiwan—2.1%Advanced Wireless
Semiconductor Co. 10,000 51ASMedia Technology, Inc. 11,000 724Kinsus Interconnect
Technology Corp. 14,000 118Unimicron Technology Corp. 112,000 935
1,828
Thailand—0.2%Asiasoft Corp. PCL 199,800 135
United Kingdom—5.5%ASOS plc(1) 8,475 274Auto Trader Group plc 54,268 544Genus plc 9,341 624HomeServe plc 28,959 343Howden Joinery Group plc 52,488 640Intermediate Capital Group plc 22,359 664Moneysupermarket.com Group
plc 133,100 389Rotork plc 74,122 359Spectris plc 12,381 613Wizz Air Holdings plc(1) 7,800 442
4,892
United States—54.9%AGCO Corp. 4,074 473American States Water Co. 14,129 1,461API Group Corp.(1) 39,709 1,023Arena Pharmaceuticals, Inc.(1) 4,122 383Axon Enterprise, Inc.(1) 3,175 498BellRing Brands, Inc. Class A(1) 23,963 684Camping World Holdings, Inc.
Class A 13,486 545Casella Waste Systems, Inc.
Class A(1) 11,976 1,023ChampionX Corp.(1) 26,095 527Chart Industries, Inc.(1) 5,209 831Chemours Co. (The) 8,815 296Clean Harbors, Inc.(1) 11,323 1,130CONMED Corp. 3,991 566
ALLIANZGI GLOBAL SMALL-CAP FUNDSCHEDULE OF INVESTMENTS (Unaudited)
DECEMBER 31, 2021
($ reported in thousands)
See Notes to Financial Statements
13
Shares Value
United States—continuedCoty, Inc. Class A(1) 94,624 $ 994Diamondback Energy, Inc. 9,231 996DigitalOcean Holdings, Inc.(1) 3,941 317Dolby Laboratories, Inc.
Class A 4,517 430First Industrial Realty Trust,
Inc. 12,538 830Graphic Packaging Holding Co. 42,568 830Hawaiian Electric Industries,
Inc. 12,360 513Hecla Mining Co. 45,796 239Houghton Mifflin Harcourt
Co.(1) 25,461 410Huntsman Corp. 20,110 701Hyatt Hotels Corp. Class A(1) 2,784 267ICF International, Inc. 13,448 1,379II-VI, Inc.(1) 4,958 339Intellia Therapeutics, Inc.(1) 1,899 224ITT, Inc. 13,134 1,342Kilroy Realty Corp. 14,296 950Legend Biotech Corp. ADR(1) 4,134 193LendingClub Corp.(1) 17,597 425Lindblad Expeditions Holdings,
Inc.(1) 46,348 723LPL Financial Holdings, Inc. 8,063 1,291Marathon Digital Holdings,
Inc.(1) 2,903 95Materion Corp. 10,362 953Matson, Inc. 14,869 1,339MaxLinear, Inc.(1) 17,858 1,346MP Materials Corp.(1) 7,275 330NanoString Technologies,
Inc.(1) 5,516 233Natera, Inc.(1) 8,695 812National Vision Holdings,
Inc.(1) 7,931 381Paylocity Holding Corp.(1) 1,703 402Pebblebrook Hotel Trust 35,539 795Perficient, Inc.(1) 6,836 884Pinnacle Financial Partners,
Inc. 13,177 1,258Planet Fitness, Inc. Class A(1) 13,166 1,193
Shares Value
United States—continuedPopular, Inc. 14,043 $ 1,152Ranpak Holdings Corp.(1) 21,490 808RH(1) 1,002 537Saia, Inc.(1) 2,593 874Silvergate Capital Corp.
Class A(1) 2,090 310Smartsheet, Inc. Class A(1) 13,213 1,023Summit Materials, Inc.
Class A(1) 21,889 879SunPower Corp.(1) 11,514 240Switch, Inc. Class A 38,602 1,106Syneos Health, Inc. Class A(1) 8,988 923Tenet Healthcare Corp.(1) 14,925 1,219Terreno Realty Corp. 17,532 1,495TG Therapeutics, Inc.(1) 4,296 82Turning Point Therapeutics,
Inc.(1) 2,211 105Varonis Systems, Inc.(1) 9,844 480Webster Financial Corp. 19,815 1,106Western Alliance Bancorp 10,639 1,145WideOpenWest, Inc.(1) 66,215 1,425Workiva, Inc. Class A(1) 3,665 478YETI Holdings, Inc.(1) 6,818 565Zynga, Inc. Class A(1) 33,573 215
49,021
Virgin Islands (British)—2.7%Biohaven Pharmaceutical
Holding Co. Ltd.(1) 3,246 447Capri Holdings Ltd.(1) 21,210 1,377Establishment Labs Holdings,
Inc.(1) 8,849 598
2,422
TOTAL COMMON STOCKS(Identified Cost $67,396) 87,501
TOTAL LONG-TERMINVESTMENTS—98.7%(Identified Cost $67,669) 88,074
Shares Value
SHORT-TERM INVESTMENT—0.8%
Money Market Mutual Fund—0.8%Dreyfus Government Cash
Management Fund -Institutional Shares(seven-day effective yield0.030%)(2) 676,718 $ 677
TOTAL SHORT-TERM INVESTMENT(Identified Cost $677) 677
TOTAL INVESTMENTS—99.5%(Identified Cost $68,346) $88,751Other assets and liabilities, net—0.5% 490
NET ASSETS—100.0% $89,241
Abbreviations:ADR American Depositary ReceiptUTS Unit Trust Shares
Footnote Legend:(1) Non-income producing.(2) Shares of this fund are publicly offered, and its
prospectus and annual report are publicly available.
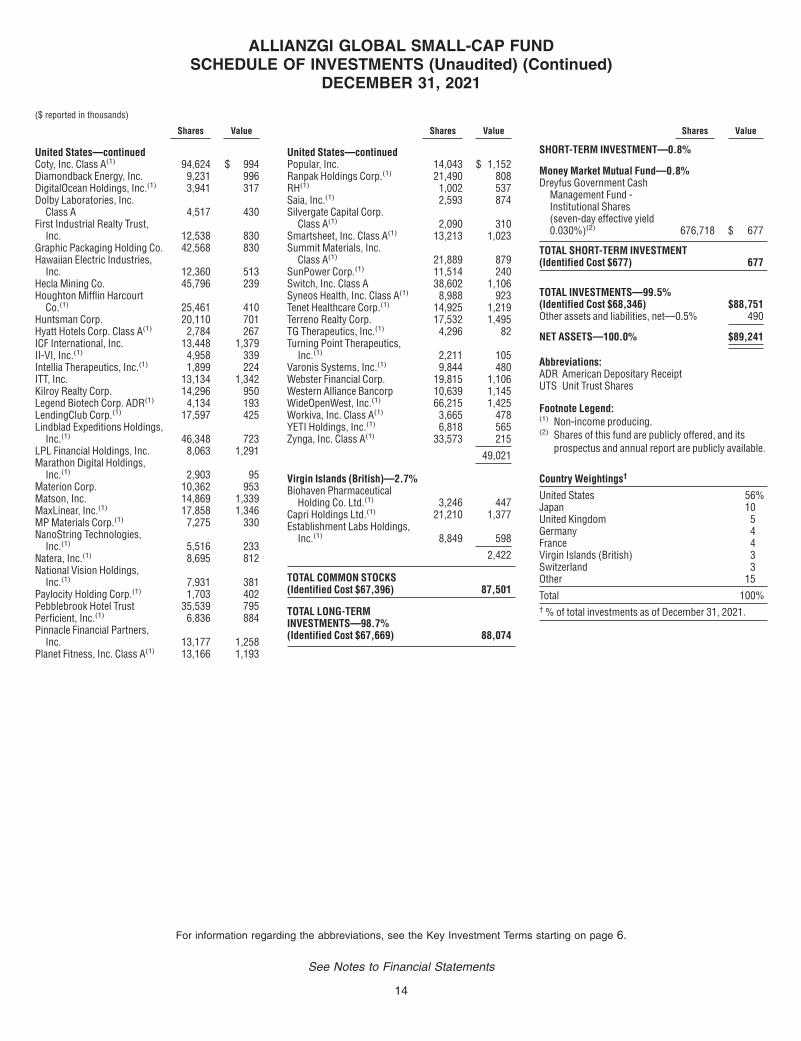
Country Weightings†
United States 56%Japan 10United Kingdom 5Germany 4France 4Virgin Islands (British) 3Switzerland 3Other 15
Total 100%† % of total investments as of December 31, 2021.
ALLIANZGI GLOBAL SMALL-CAP FUNDSCHEDULE OF INVESTMENTS (Unaudited) (Continued)
DECEMBER 31, 2021
($ reported in thousands)
For information regarding the abbreviations, see the Key Investment Terms starting on page 6.
See Notes to Financial Statements
14
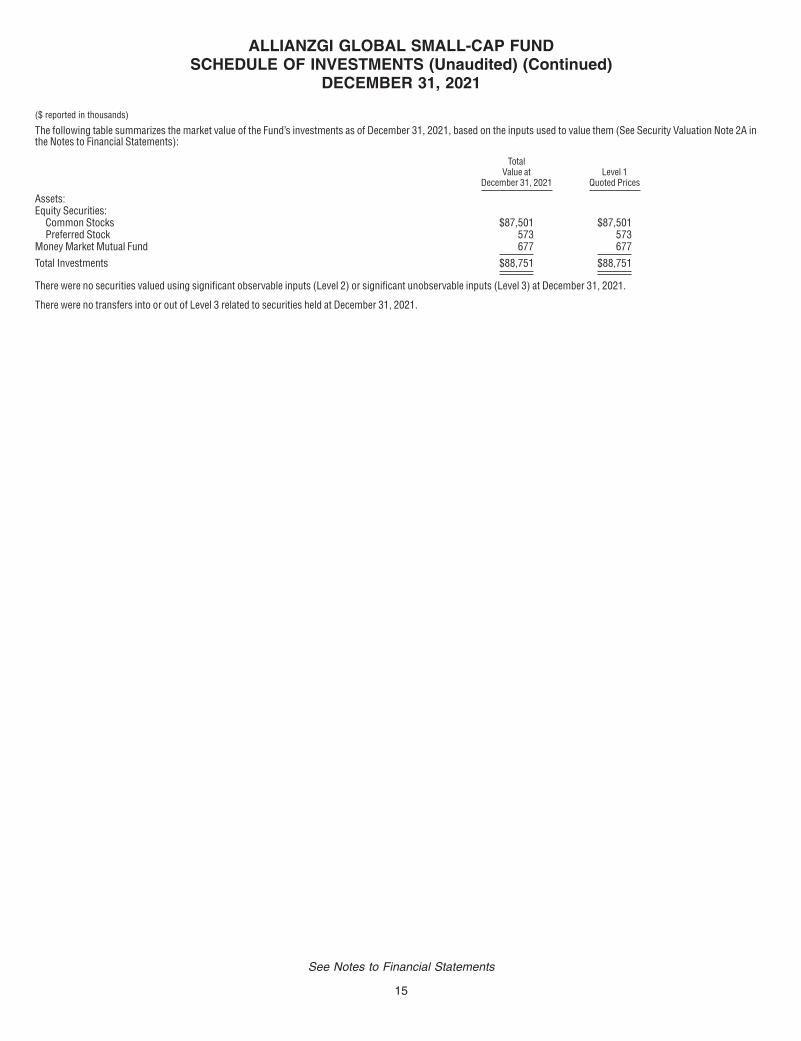
The following table summarizes the market value of the Fund’s investments as of December 31, 2021, based on the inputs used to value them (See Security Valuation Note 2A inthe Notes to Financial Statements):
TotalValue at
December 31, 2021Level 1
Quoted Prices
Assets:Equity Securities:
Common Stocks $87,501 $87,501Preferred Stock 573 573
Money Market Mutual Fund 677 677
Total Investments $88,751 $88,751
There were no securities valued using significant observable inputs (Level 2) or significant unobservable inputs (Level 3) at December 31, 2021.
There were no transfers into or out of Level 3 related to securities held at December 31, 2021.
ALLIANZGI GLOBAL SMALL-CAP FUNDSCHEDULE OF INVESTMENTS (Unaudited) (Continued)
DECEMBER 31, 2021
($ reported in thousands)
See Notes to Financial Statements
15
Shares Value
COMMON STOCKS—98.9%
Biotechnology—16.5%AbbVie, Inc. 69,110 $ 9,357Alnylam Pharmaceuticals,
Inc.(1) 1,925 326Arena Pharmaceuticals, Inc.(1) 5,830 542Argenx SE ADR(1) 2,680 938Ascendis Pharma A.S. ADR(1) 5,465 735Avita Medical, Inc.(1) 46,575 558Biogen, Inc.(1) 2,020 485Biohaven Pharmaceutical
Holding Co. Ltd.(1) 2,655 366BioNTech SE ADR(1) 1,550 400Blueprint Medicines Corp.(1) 6,485 695Cytokinetics, Inc.(1) 15,180 692Deciphera Pharmaceuticals,
Inc.(1) 1 —(2)
Gilead Sciences, Inc. 27,055 1,964Heron Therapeutics, Inc.(1) 39,735 363Horizon Therapeutics plc(1) 72,965 7,863Moderna, Inc.(1) 7,260 1,844Natera, Inc.(1) 46,015 4,297Neurocrine Biosciences,
Inc.(1) 7,095 604Protagonist Therapeutics,
Inc.(1) 12,445 426TG Therapeutics, Inc.(1) 21,100 401Vertex Pharmaceuticals,
Inc.(1) 4,900 1,076
33,932
Electronic Equipment, Instruments &Components—0.7%908 Devices, Inc.(1) 53,265 1,378
Healthcare Equipment &Supplies—25.8%Abbott Laboratories 19,305 2,717Alcon, Inc. 44,355 3,864Align Technology, Inc.(1) 8,195 5,386Axonics, Inc.(1) 17,870 1,001Boston Scientific Corp.(1) 128,055 5,440CONMED Corp. 13,260 1,880Cooper Cos., Inc. (The) 11,040 4,625Dexcom, Inc.(1) 2,500 1,342Envista Holdings Corp.(1) 80,350 3,621Establishment Labs Holdings,
Inc.(1) 25,455 1,720Hologic, Inc.(1) 48,090 3,682IDEXX Laboratories, Inc.(1) 6,280 4,135Inari Medical, Inc.(1) 19,000 1,734Novocure Ltd.(1) 5,420 407Quotient Ltd.(1) 480,734 1,245Stryker Corp. 25,840 6,910Teleflex, Inc. 10,390 3,413
53,122
Shares Value
Healthcare Providers &Services—13.3%Centene Corp.(1) 81,860 $ 6,745CVS Health Corp. 42,810 4,416Humana, Inc. 11,520 5,344Tenet Healthcare Corp.(1) 64,955 5,306UnitedHealth Group, Inc. 11,166 5,607
27,418
Life Sciences Tools & Services—5.6%Avantor, Inc.(1) 184,005 7,754ICON plc ADR(1) 3,575 1,107Syneos Health, Inc. Class A(1) 26,455 2,716
11,577
Personal Products—0.7%Beauty Health Co. (The)(1) 60,945 1,472
Pharmaceuticals—36.3%Alpha Teknova, Inc.(1) 53,007 1,086AstraZeneca plc Sponsored
ADR 201,485 11,736Bristol-Myers Squibb Co. 82,650 5,153Catalent, Inc.(1) 36,650 4,692Daiichi Sankyo Co., Ltd. 55,400 1,409Eli Lilly & Co. 38,310 10,582Merck & Co., Inc. 21,955 1,683Novartis AG Sponsored ADR 76,968 6,732Novo Nordisk A.S. Sponsored
ADR 30,305 3,394Pfizer, Inc. 196,814 11,622Roche Holding AG Sponsored
ADR 229,610 11,869Zoetis, Inc. Class A 19,030 4,644
74,602
TOTAL COMMON STOCKS(Identified Cost $172,815) 203,501
RIGHTS—0.0%
Pharmaceuticals—0.0%Elanco Animal Health,
Inc.(1)(3) 38,000 —
TOTAL RIGHTS(Identified Cost $1) —
TOTAL LONG-TERMINVESTMENTS—98.9%(Identified Cost $172,816) 203,501
Shares Value
SHORT-TERM INVESTMENT—0.3%
Money Market Mutual Fund—0.3%Dreyfus Government Cash
Management Fund -Institutional Shares(seven-day effective yield0.030%)(4) 560,579 $ 561
TOTAL SHORT-TERM INVESTMENT(Identified Cost $561) 561
TOTAL INVESTMENTS—99.2%(Identified Cost $173,377) $204,062Other assets and liabilities, net—0.8% 1,722
NET ASSETS—100.0% $205,784
Abbreviation:ADR American Depositary Receipt
Footnote Legend:(1) Non-income producing.(2) Amount is less than $500.(3) The value of this security was determined using
significant unobservable inputs and is reported as aLevel 3 security in the Fair Value Hierarchy tablelocated after the Schedule of Investments.
(4) Shares of this fund are publicly offered, and itsprospectus and annual report are publicly available.
Country Weightings†
United States 74%Switzerland 11United Kingdom 6Ireland 4Denmark 2Virgin Islands (British) 1Jersey 1Other 1
Total 100%† % of total investments as of December 31, 2021.
ALLIANZGI HEALTH SCIENCES FUNDSCHEDULE OF INVESTMENTS (Unaudited)
DECEMBER 31, 2021
($ reported in thousands)
For information regarding the abbreviations, see the Key Investment Terms starting on page 6.
See Notes to Financial Statements
16
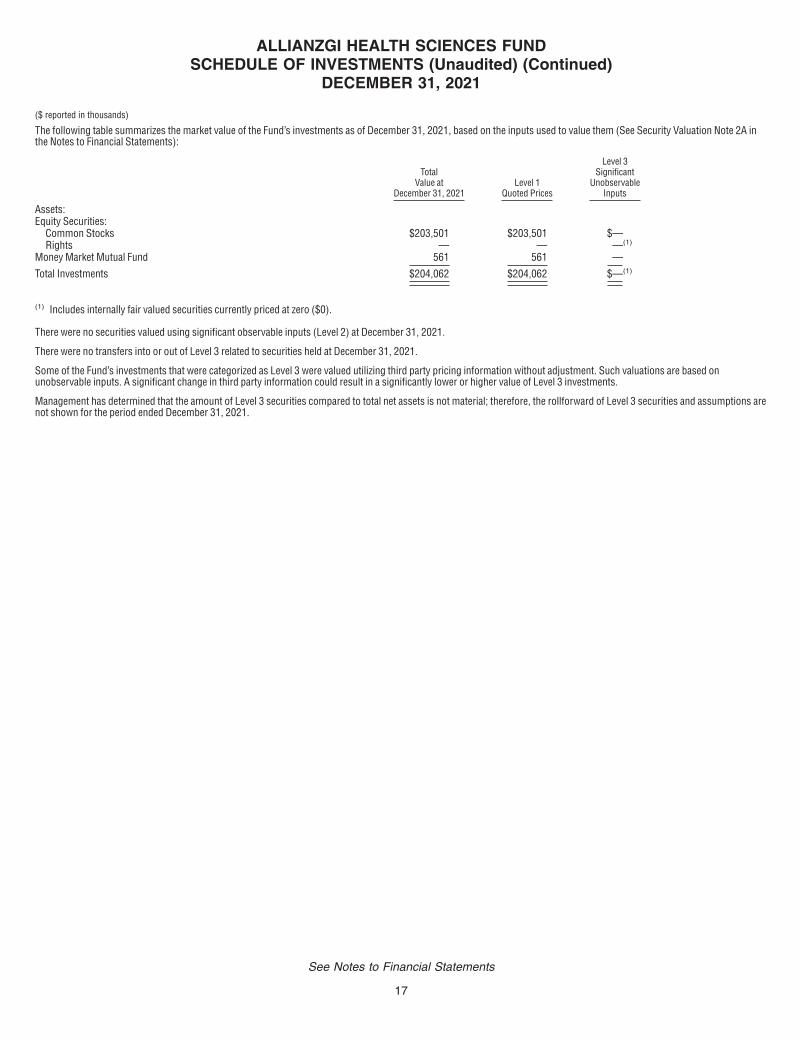
The following table summarizes the market value of the Fund’s investments as of December 31, 2021, based on the inputs used to value them (See Security Valuation Note 2A inthe Notes to Financial Statements):
TotalValue at
December 31, 2021Level 1
Quoted Prices
Level 3Significant
UnobservableInputs
Assets:Equity Securities:
Common Stocks $203,501 $203,501 $—Rights — — —(1)
Money Market Mutual Fund 561 561 —
Total Investments $204,062 $204,062 $—(1)
(1) Includes internally fair valued securities currently priced at zero ($0).
There were no securities valued using significant observable inputs (Level 2) at December 31, 2021.
There were no transfers into or out of Level 3 related to securities held at December 31, 2021.
Some of the Fund’s investments that were categorized as Level 3 were valued utilizing third party pricing information without adjustment. Such valuations are based onunobservable inputs. A significant change in third party information could result in a significantly lower or higher value of Level 3 investments.
Management has determined that the amount of Level 3 securities compared to total net assets is not material; therefore, the rollforward of Level 3 securities and assumptions arenot shown for the period ended December 31, 2021.
ALLIANZGI HEALTH SCIENCES FUNDSCHEDULE OF INVESTMENTS (Unaudited) (Continued)
DECEMBER 31, 2021
($ reported in thousands)
See Notes to Financial Statements
17
Par Value Value
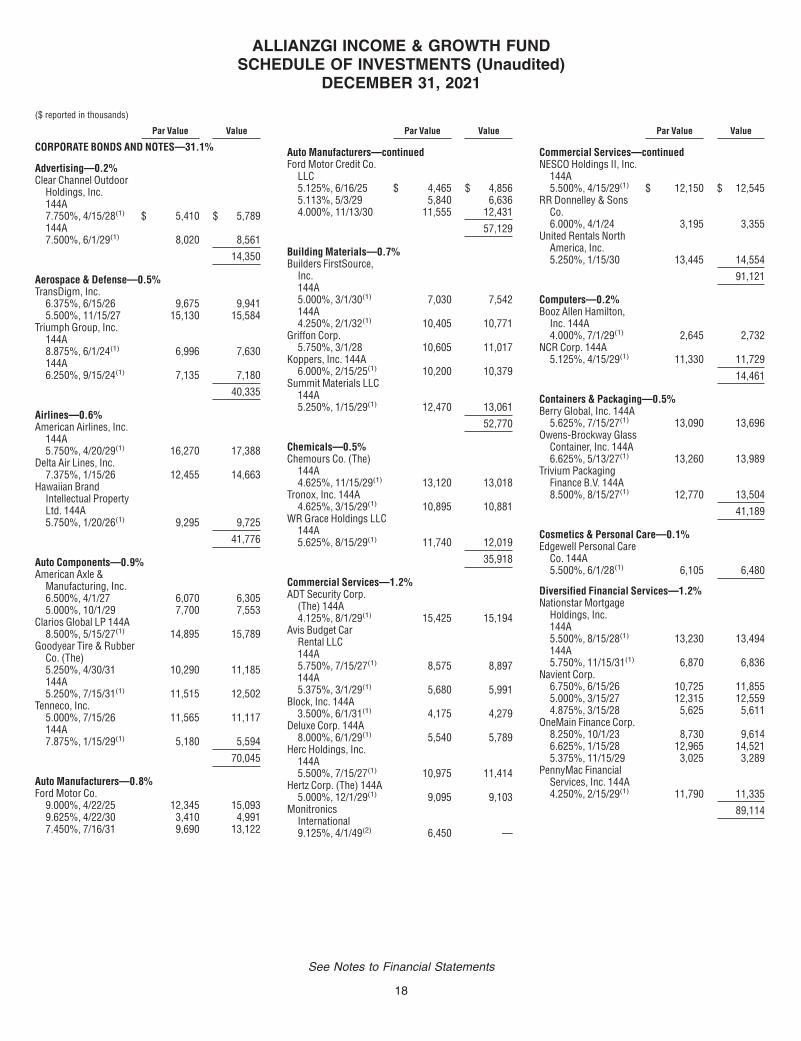
CORPORATE BONDS AND NOTES—31.1%
Advertising—0.2%Clear Channel Outdoor
Holdings, Inc.144A7.750%, 4/15/28(1) $ 5,410 $ 5,789144A7.500%, 6/1/29(1) 8,020 8,561
14,350
Aerospace & Defense—0.5%TransDigm, Inc.
6.375%, 6/15/26 9,675 9,9415.500%, 11/15/27 15,130 15,584
Triumph Group, Inc.144A8.875%, 6/1/24(1) 6,996 7,630144A6.250%, 9/15/24(1) 7,135 7,180
40,335
Airlines—0.6%American Airlines, Inc.
144A5.750%, 4/20/29(1) 16,270 17,388
Delta Air Lines, Inc.7.375%, 1/15/26 12,455 14,663
Hawaiian BrandIntellectual PropertyLtd. 144A5.750%, 1/20/26(1) 9,295 9,725
41,776
Auto Components—0.9%American Axle &
Manufacturing, Inc.6.500%, 4/1/27 6,070 6,3055.000%, 10/1/29 7,700 7,553
Clarios Global LP 144A8.500%, 5/15/27(1) 14,895 15,789
Goodyear Tire & RubberCo. (The)5.250%, 4/30/31 10,290 11,185144A5.250%, 7/15/31(1) 11,515 12,502
Tenneco, Inc.5.000%, 7/15/26 11,565 11,117144A7.875%, 1/15/29(1) 5,180 5,594
70,045
Auto Manufacturers—0.8%Ford Motor Co.
9.000%, 4/22/25 12,345 15,0939.625%, 4/22/30 3,410 4,9917.450%, 7/16/31 9,690 13,122
Par Value Value
Auto Manufacturers—continuedFord Motor Credit Co.
LLC5.125%, 6/16/25 $ 4,465 $ 4,8565.113%, 5/3/29 5,840 6,6364.000%, 11/13/30 11,555 12,431
57,129
Building Materials—0.7%Builders FirstSource,
Inc.144A5.000%, 3/1/30(1) 7,030 7,542144A4.250%, 2/1/32(1) 10,405 10,771
Griffon Corp.5.750%, 3/1/28 10,605 11,017
Koppers, Inc. 144A6.000%, 2/15/25(1) 10,200 10,379
Summit Materials LLC144A5.250%, 1/15/29(1) 12,470 13,061
52,770
Chemicals—0.5%Chemours Co. (The)
144A4.625%, 11/15/29(1) 13,120 13,018
Tronox, Inc. 144A4.625%, 3/15/29(1) 10,895 10,881
WR Grace Holdings LLC144A5.625%, 8/15/29(1) 11,740 12,019
35,918
Commercial Services—1.2%ADT Security Corp.
(The) 144A4.125%, 8/1/29(1) 15,425 15,194
Avis Budget CarRental LLC144A5.750%, 7/15/27(1) 8,575 8,897144A5.375%, 3/1/29(1) 5,680 5,991
Block, Inc. 144A3.500%, 6/1/31(1) 4,175 4,279
Deluxe Corp. 144A8.000%, 6/1/29(1) 5,540 5,789
Herc Holdings, Inc.144A5.500%, 7/15/27(1) 10,975 11,414
Hertz Corp. (The) 144A5.000%, 12/1/29(1) 9,095 9,103
MonitronicsInternational9.125%, 4/1/49(2) 6,450 —
Par Value Value
Commercial Services—continuedNESCO Holdings II, Inc.
144A5.500%, 4/15/29(1) $ 12,150 $ 12,545
RR Donnelley & SonsCo.6.000%, 4/1/24 3,195 3,355
United Rentals NorthAmerica, Inc.5.250%, 1/15/30 13,445 14,554
91,121
Computers—0.2%Booz Allen Hamilton,
Inc. 144A4.000%, 7/1/29(1) 2,645 2,732
NCR Corp. 144A5.125%, 4/15/29(1) 11,330 11,729
14,461
Containers & Packaging—0.5%Berry Global, Inc. 144A
5.625%, 7/15/27(1) 13,090 13,696Owens-Brockway Glass
Container, Inc. 144A6.625%, 5/13/27(1) 13,260 13,989
Trivium PackagingFinance B.V. 144A8.500%, 8/15/27(1) 12,770 13,504
41,189
Cosmetics & Personal Care—0.1%Edgewell Personal Care
Co. 144A5.500%, 6/1/28(1) 6,105 6,480
Diversified Financial Services—1.2%Nationstar Mortgage
Holdings, Inc.144A5.500%, 8/15/28(1) 13,230 13,494144A5.750%, 11/15/31(1) 6,870 6,836
Navient Corp.6.750%, 6/15/26 10,725 11,8555.000%, 3/15/27 12,315 12,5594.875%, 3/15/28 5,625 5,611
OneMain Finance Corp.8.250%, 10/1/23 8,730 9,6146.625%, 1/15/28 12,965 14,5215.375%, 11/15/29 3,025 3,289
PennyMac FinancialServices, Inc. 144A4.250%, 2/15/29(1) 11,790 11,335
89,114
ALLIANZGI INCOME & GROWTH FUNDSCHEDULE OF INVESTMENTS (Unaudited)
DECEMBER 31, 2021
($ reported in thousands)
See Notes to Financial Statements
18
Par Value Value
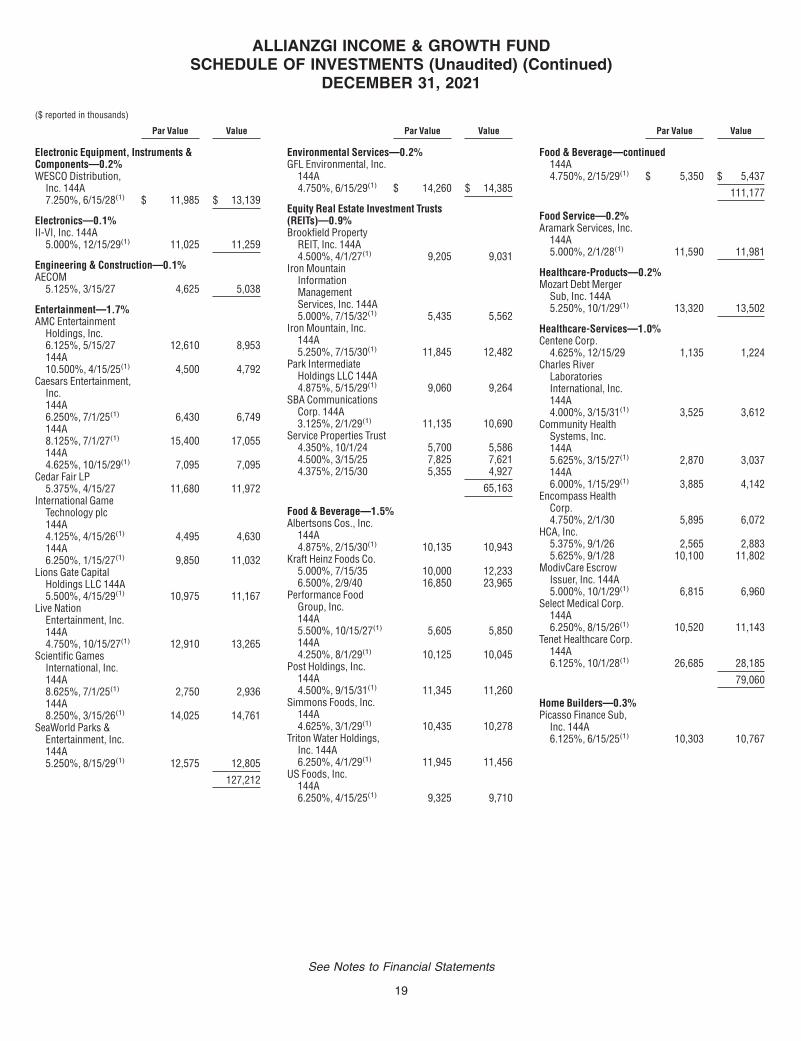
Electronic Equipment, Instruments &Components—0.2%WESCO Distribution,
Inc. 144A7.250%, 6/15/28(1) $ 11,985 $ 13,139
Electronics—0.1%II-VI, Inc. 144A
5.000%, 12/15/29(1) 11,025 11,259
Engineering & Construction—0.1%AECOM
5.125%, 3/15/27 4,625 5,038
Entertainment—1.7%AMC Entertainment
Holdings, Inc.6.125%, 5/15/27 12,610 8,953144A10.500%, 4/15/25(1) 4,500 4,792
Caesars Entertainment,Inc.144A6.250%, 7/1/25(1) 6,430 6,749144A8.125%, 7/1/27(1) 15,400 17,055144A4.625%, 10/15/29(1) 7,095 7,095
Cedar Fair LP5.375%, 4/15/27 11,680 11,972
International GameTechnology plc144A4.125%, 4/15/26(1) 4,495 4,630144A6.250%, 1/15/27(1) 9,850 11,032
Lions Gate CapitalHoldings LLC 144A5.500%, 4/15/29(1) 10,975 11,167
Live NationEntertainment, Inc.144A4.750%, 10/15/27(1) 12,910 13,265
Scientific GamesInternational, Inc.144A8.625%, 7/1/25(1) 2,750 2,936144A8.250%, 3/15/26(1) 14,025 14,761
SeaWorld Parks &Entertainment, Inc.144A5.250%, 8/15/29(1) 12,575 12,805
127,212
Par Value Value
Environmental Services—0.2%GFL Environmental, Inc.
144A4.750%, 6/15/29(1) $ 14,260 $ 14,385
Equity Real Estate Investment Trusts(REITs)—0.9%Brookfield Property
REIT, Inc. 144A4.500%, 4/1/27(1) 9,205 9,031
Iron MountainInformationManagementServices, Inc. 144A5.000%, 7/15/32(1) 5,435 5,562
Iron Mountain, Inc.144A5.250%, 7/15/30(1) 11,845 12,482
Park IntermediateHoldings LLC 144A4.875%, 5/15/29(1) 9,060 9,264
SBA CommunicationsCorp. 144A3.125%, 2/1/29(1) 11,135 10,690
Service Properties Trust4.350%, 10/1/24 5,700 5,5864.500%, 3/15/25 7,825 7,6214.375%, 2/15/30 5,355 4,927
65,163
Food & Beverage—1.5%Albertsons Cos., Inc.
144A4.875%, 2/15/30(1) 10,135 10,943
Kraft Heinz Foods Co.5.000%, 7/15/35 10,000 12,2336.500%, 2/9/40 16,850 23,965
Performance FoodGroup, Inc.144A5.500%, 10/15/27(1) 5,605 5,850144A4.250%, 8/1/29(1) 10,125 10,045
Post Holdings, Inc.144A4.500%, 9/15/31(1) 11,345 11,260
Simmons Foods, Inc.144A4.625%, 3/1/29(1) 10,435 10,278
Triton Water Holdings,Inc. 144A6.250%, 4/1/29(1) 11,945 11,456
US Foods, Inc.144A6.250%, 4/15/25(1) 9,325 9,710
Par Value Value
Food & Beverage—continued144A4.750%, 2/15/29(1) $ 5,350 $ 5,437
111,177
Food Service—0.2%Aramark Services, Inc.
144A5.000%, 2/1/28(1) 11,590 11,981
Healthcare-Products—0.2%Mozart Debt Merger
Sub, Inc. 144A5.250%, 10/1/29(1) 13,320 13,502
Healthcare-Services—1.0%Centene Corp.
4.625%, 12/15/29 1,135 1,224Charles River
LaboratoriesInternational, Inc.144A4.000%, 3/15/31(1) 3,525 3,612
Community HealthSystems, Inc.144A5.625%, 3/15/27(1) 2,870 3,037144A6.000%, 1/15/29(1) 3,885 4,142
Encompass HealthCorp.4.750%, 2/1/30 5,895 6,072
HCA, Inc.5.375%, 9/1/26 2,565 2,8835.625%, 9/1/28 10,100 11,802
ModivCare EscrowIssuer, Inc. 144A5.000%, 10/1/29(1) 6,815 6,960
Select Medical Corp.144A6.250%, 8/15/26(1) 10,520 11,143
Tenet Healthcare Corp.144A6.125%, 10/1/28(1) 26,685 28,185
79,060
Home Builders—0.3%Picasso Finance Sub,
Inc. 144A6.125%, 6/15/25(1) 10,303 10,767
ALLIANZGI INCOME & GROWTH FUNDSCHEDULE OF INVESTMENTS (Unaudited) (Continued)
DECEMBER 31, 2021
($ reported in thousands)
See Notes to Financial Statements
19

Par Value Value
Home Builders—continuedTaylor Morrison
Communities, Inc.144A5.750%, 1/15/28(1) $ 7,925 $ 8,856
19,623
Home Furnishings—0.1%Tempur Sealy
International, Inc.144A3.875%, 10/15/31(1) 4,485 4,493
Household Products/Wares—0.1%Spectrum Brands, Inc.
144A3.875%, 3/15/31(1) 8,430 8,325
Internet—0.6%Endure Digital, Inc.
144A6.000%, 2/15/29(1) 9,110 8,472
Match Group HoldingsII LLC 144A5.000%, 12/15/27(1) 8,560 8,902
Netflix, Inc. 144A5.375%, 11/15/29(1) 5,965 7,084
Uber Technologies, Inc.144A8.000%, 11/1/26(1) 6,925 7,375144A7.500%, 9/15/27(1) 12,690 13,811
45,644
Investment Companies—0.2%Compass Group
DiversifiedHoldings LLC144A5.250%, 4/15/29(1) 14,195 14,869144A5.000%, 1/15/32(1) 3,650 3,741
18,610
Iron & Steel—0.5%Cleveland-Cliffs, Inc.
5.875%, 6/1/27 10,950 11,402144A9.875%, 10/17/25(1) 3,480 3,939144A6.750%, 3/15/26(1) 11,470 12,144
United States SteelCorp.6.875%, 3/1/29 12,110 13,033
40,518
Leisure Time—0.8%Carnival Corp.
144A10.500%, 2/1/26(1) 7,405 8,453144A5.750%, 3/1/27(1) 8,455 8,455
Par Value Value
Leisure Time—continued144A6.000%, 5/1/29(1) $ 10,775 $ 10,721
NCL Corp., Ltd. 144A5.875%, 3/15/26(1) 14,550 14,486
Royal CaribbeanCruises Ltd.144A11.500%, 6/1/25(1) 4,945 5,538144A5.500%, 4/1/28(1) 11,030 11,157
58,810
Lodging—0.9%Boyd Gaming Corp.
144A8.625%, 6/1/25(1) 4,999 5,357144A4.750%, 6/15/31(1) 6,045 6,166
Hilton DomesticOperating Co., Inc.144A4.000%, 5/1/31(1) 7,890 8,068144A3.625%, 2/15/32(1) 10,825 10,768
Hilton Grand VacationsBorrowerEscrow LLC 144A5.000%, 6/1/29(1) 2,965 3,039
MGM ResortsInternational5.500%, 4/15/27 2,650 2,8224.750%, 10/15/28 13,640 14,049
Station Casinos LLC144A4.625%, 12/1/31(1) 6,785 6,841
Wynn Las Vegas LLC144A5.500%, 3/1/25(1) 8,645 8,904
66,014
Machinery-Construction &Mining—0.1%Terex Corp. 144A
5.000%, 5/15/29(1) 7,100 7,295
Machinery-Diversified—0.0%Colfax Corp. 144A
6.375%, 2/15/26(1) 3,116 3,221
Media—3.3%CCO Holdings LLC
4.500%, 5/1/32 21,375 21,990144A5.375%, 6/1/29(1) 14,780 15,950
CSC Holdings LLC144A7.500%, 4/1/28(1) 12,490 13,396144A5.750%, 1/15/30(1) 16,900 16,837144A4.625%, 12/1/30(1) 4,300 4,069
Par Value Value
Media—continuedDirectv Financing LLC
144A5.875%, 8/15/27(1) $ 15,910 $ 16,287
DISH DBS Corp.7.375%, 7/1/28 13,135 13,2995.125%, 6/1/29 11,740 10,683144A5.750%, 12/1/28(1) 9,505 9,600
Gray Escrow II, Inc.144A5.375%, 11/15/31(1) 5,420 5,576
Gray Television, Inc.144A4.750%, 10/15/30(1) 15,120 15,026
iHeartCommunications,Inc.8.375%, 5/1/27 10,655 11,234
Nexstar Media, Inc.144A5.625%, 7/15/27(1) 13,405 14,130144A4.750%, 11/1/28(1) 5,800 5,909
Scripps Escrow II, Inc.144A3.875%, 1/15/29(1) 1,600 1,598144A5.375%, 1/15/31(1) 10,660 10,833
Sirius XM Radio, Inc.144A4.000%, 7/15/28(1) 8,960 9,010144A4.125%, 7/1/30(1) 9,665 9,665144A3.875%, 9/1/31(1) 9,950 9,755
TEGNA, Inc.5.000%, 9/15/29 9,150 9,356
Virgin Media Finance plc144A5.000%, 7/15/30(1) 7,405 7,368
Virgin Media SecuredFinance plc144A5.500%, 5/15/29(1) 7,590 8,014144A4.500%, 8/15/30(1) 9,225 9,283
248,868
Metal Fabricate/Hardware—0.2%Park-Ohio Industries,
Inc.6.625%, 4/15/27 12,890 12,510
Mining—0.5%FMG Resources August
2006 Pty Ltd. 144A4.375%, 4/1/31(1) 3,925 4,121
Freeport-McMoRan,Inc.5.250%, 9/1/29 10,690 11,705
ALLIANZGI INCOME & GROWTH FUNDSCHEDULE OF INVESTMENTS (Unaudited) (Continued)
DECEMBER 31, 2021
($ reported in thousands)
See Notes to Financial Statements
20
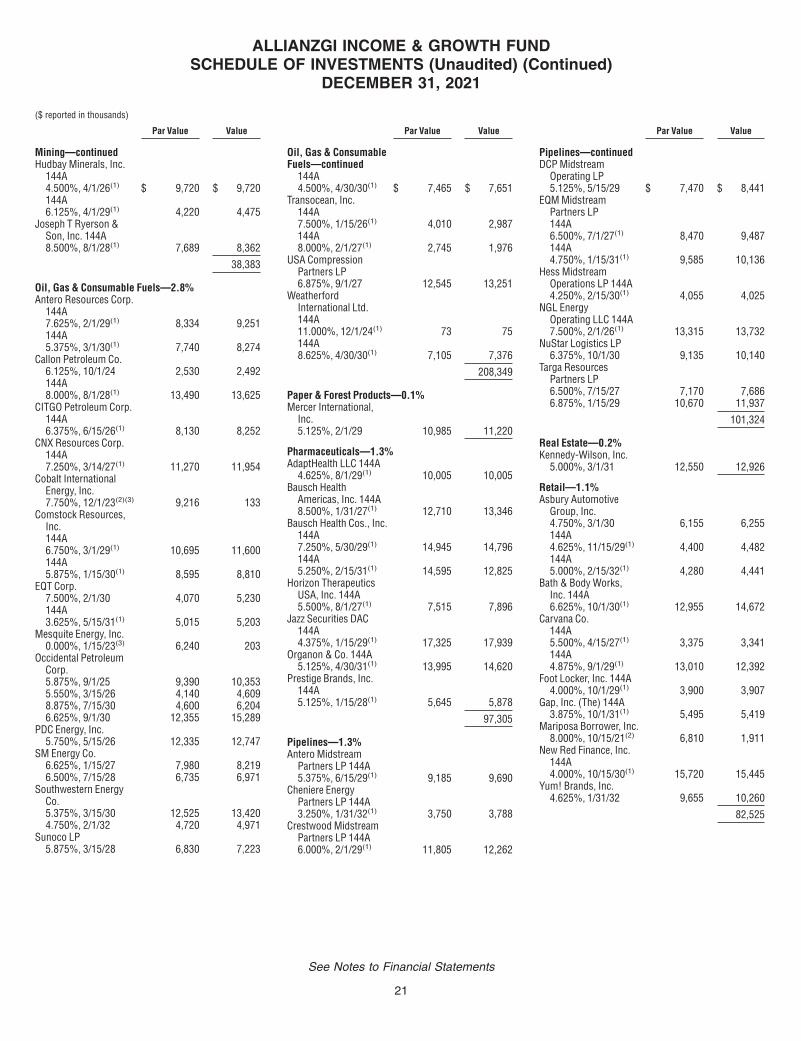
Par Value Value
Mining—continuedHudbay Minerals, Inc.
144A4.500%, 4/1/26(1) $ 9,720 $ 9,720144A6.125%, 4/1/29(1) 4,220 4,475
Joseph T Ryerson &Son, Inc. 144A8.500%, 8/1/28(1) 7,689 8,362
38,383
Oil, Gas & Consumable Fuels—2.8%Antero Resources Corp.
144A7.625%, 2/1/29(1) 8,334 9,251144A5.375%, 3/1/30(1) 7,740 8,274
Callon Petroleum Co.6.125%, 10/1/24 2,530 2,492144A8.000%, 8/1/28(1) 13,490 13,625
CITGO Petroleum Corp.144A6.375%, 6/15/26(1) 8,130 8,252
CNX Resources Corp.144A7.250%, 3/14/27(1) 11,270 11,954
Cobalt InternationalEnergy, Inc.7.750%, 12/1/23(2)(3) 9,216 133
Comstock Resources,Inc.144A6.750%, 3/1/29(1) 10,695 11,600144A5.875%, 1/15/30(1) 8,595 8,810
EQT Corp.7.500%, 2/1/30 4,070 5,230144A3.625%, 5/15/31(1) 5,015 5,203
Mesquite Energy, Inc.0.000%, 1/15/23(3) 6,240 203
Occidental PetroleumCorp.5.875%, 9/1/25 9,390 10,3535.550%, 3/15/26 4,140 4,6098.875%, 7/15/30 4,600 6,2046.625%, 9/1/30 12,355 15,289
PDC Energy, Inc.5.750%, 5/15/26 12,335 12,747
SM Energy Co.6.625%, 1/15/27 7,980 8,2196.500%, 7/15/28 6,735 6,971
Southwestern EnergyCo.5.375%, 3/15/30 12,525 13,4204.750%, 2/1/32 4,720 4,971
Sunoco LP5.875%, 3/15/28 6,830 7,223
Par Value Value
Oil, Gas & ConsumableFuels—continued
144A4.500%, 4/30/30(1) $ 7,465 $ 7,651
Transocean, Inc.144A7.500%, 1/15/26(1) 4,010 2,987144A8.000%, 2/1/27(1) 2,745 1,976
USA CompressionPartners LP6.875%, 9/1/27 12,545 13,251
WeatherfordInternational Ltd.144A11.000%, 12/1/24(1) 73 75144A8.625%, 4/30/30(1) 7,105 7,376
208,349
Paper & Forest Products—0.1%Mercer International,
Inc.5.125%, 2/1/29 10,985 11,220
Pharmaceuticals—1.3%AdaptHealth LLC 144A
4.625%, 8/1/29(1) 10,005 10,005Bausch Health
Americas, Inc. 144A8.500%, 1/31/27(1) 12,710 13,346
Bausch Health Cos., Inc.144A7.250%, 5/30/29(1) 14,945 14,796144A5.250%, 2/15/31(1) 14,595 12,825
Horizon TherapeuticsUSA, Inc. 144A5.500%, 8/1/27(1) 7,515 7,896
Jazz Securities DAC144A4.375%, 1/15/29(1) 17,325 17,939
Organon & Co. 144A5.125%, 4/30/31(1) 13,995 14,620
Prestige Brands, Inc.144A5.125%, 1/15/28(1) 5,645 5,878
97,305
Pipelines—1.3%Antero Midstream
Partners LP 144A5.375%, 6/15/29(1) 9,185 9,690
Cheniere EnergyPartners LP 144A3.250%, 1/31/32(1) 3,750 3,788
Crestwood MidstreamPartners LP 144A6.000%, 2/1/29(1) 11,805 12,262
Par Value Value
Pipelines—continuedDCP Midstream
Operating LP5.125%, 5/15/29 $ 7,470 $ 8,441
EQM MidstreamPartners LP144A6.500%, 7/1/27(1) 8,470 9,487144A4.750%, 1/15/31(1) 9,585 10,136
Hess MidstreamOperations LP 144A4.250%, 2/15/30(1) 4,055 4,025
NGL EnergyOperating LLC 144A7.500%, 2/1/26(1) 13,315 13,732
NuStar Logistics LP6.375%, 10/1/30 9,135 10,140
Targa ResourcesPartners LP6.500%, 7/15/27 7,170 7,6866.875%, 1/15/29 10,670 11,937
101,324
Real Estate—0.2%Kennedy-Wilson, Inc.
5.000%, 3/1/31 12,550 12,926
Retail—1.1%Asbury Automotive
Group, Inc.4.750%, 3/1/30 6,155 6,255144A4.625%, 11/15/29(1) 4,400 4,482144A5.000%, 2/15/32(1) 4,280 4,441
Bath & Body Works,Inc. 144A6.625%, 10/1/30(1) 12,955 14,672
Carvana Co.144A5.500%, 4/15/27(1) 3,375 3,341144A4.875%, 9/1/29(1) 13,010 12,392
Foot Locker, Inc. 144A4.000%, 10/1/29(1) 3,900 3,907
Gap, Inc. (The) 144A3.875%, 10/1/31(1) 5,495 5,419
Mariposa Borrower, Inc.8.000%, 10/15/21(2) 6,810 1,911
New Red Finance, Inc.144A4.000%, 10/15/30(1) 15,720 15,445
Yum! Brands, Inc.4.625%, 1/31/32 9,655 10,260
82,525
ALLIANZGI INCOME & GROWTH FUNDSCHEDULE OF INVESTMENTS (Unaudited) (Continued)
DECEMBER 31, 2021
($ reported in thousands)
See Notes to Financial Statements
21

Par Value Value
Semiconductors—0.2%Amkor Technology, Inc.
144A6.625%, 9/15/27(1) $ 9,410 $ 9,946
Synaptics, Inc. 144A4.000%, 6/15/29(1) 5,940 6,029
15,975
Software—0.6%Clarivate Science
Holdings Corp.144A3.875%, 7/1/28(1) 6,310 6,342144A4.875%, 7/1/29(1) 11,325 11,485
Consensus CloudSolutions, Inc.144A6.000%, 10/15/26(1) 3,065 3,188144A6.500%, 10/15/28(1) 6,765 7,069
Elastic N.V. 144A4.125%, 7/15/29(1) 4,215 4,170
Rackspace TechnologyGlobal, Inc. 144A5.375%, 12/1/28(1) 3,990 3,890
SS&C Technologies,Inc. 144A5.500%, 9/30/27(1) 12,455 13,016
49,160
Telecommunications—2.1%Avaya, Inc. 144A
6.125%, 9/15/28(1) 10,780 11,427CommScope
Technologies LLC144A5.000%, 3/15/27(1) 11,030 10,313
CommScope, Inc. 144A8.250%, 3/1/27(1) 5,495 5,647
FrontierCommunicationsHoldings LLC144A5.000%, 5/1/28(1) 10,915 11,242144A6.000%, 1/15/30(1) 8,295 8,337
GTT Communications,Inc. 144A7.875%, 12/31/24(1)(3) 10,045 1,205
Hughes SatelliteSystems Corp.6.625%, 8/1/26 13,080 14,640
LogMeIn, Inc. 144A5.500%, 9/1/27(1) 12,660 12,812
Lumen Technologies,Inc.144A5.125%, 12/15/26(1) 12,205 12,701144A4.500%, 1/15/29(1) 15,690 15,180
Par Value Value
Telecommunications—continued144A5.375%, 6/15/29(1) $ 14,075 $ 14,075
Plantronics, Inc. 144A4.750%, 3/1/29(1) 7,485 7,139
Sprint Corp.7.125%, 6/15/24 6,860 7,7017.625%, 3/1/26 8,595 10,319
T-Mobile USA, Inc.3.375%, 4/15/29 8,250 8,4063.500%, 4/15/31 6,135 6,383
WindstreamServices LLC 144A6.375%, 8/1/23(1)(2)(3) 7,464 —
157,527
Transportation—0.3%Fortress Transportation
& InfrastructureInvestors LLC144A9.750%, 8/1/27(1) 12,065 13,513144A5.500%, 5/1/28(1) 7,450 7,592
21,105
TOTAL CORPORATE BONDS ANDNOTES(Identified Cost $2,338,689) 2,336,334
LEVERAGED LOANS—0.1%
Retail—0.1%Petco Health and
Wellness Co., Inc.First Lien (3 monthLIBOR + 3.250%)4.000%, 3/3/28 (4) 8,426 8,408
TOTAL LEVERAGED LOANS(Identified Cost $8,431) 8,408
Shares
CONVERTIBLE PREFERRED STOCKS—6.4%
Auto Components—0.4%Aptiv plc Series A,
5.500% 174,000 32,032
Banks—0.7%Bank of America Corp.
Series L, 7.250%(5) 13,030 18,833Wells Fargo & Co. Series
L, 7.500%(5) 24,365 36,317
55,150
Capital Markets—0.4%KKR & Co., Inc. Series C,
6.000% 292,185 27,217
Shares Value
Commercial Services &Supplies—0.2%GFL Environmental, Inc.,
6.000% 157,520 $ 13,696
Communications Equipment—0.3%T-Mobile US 2020 Cash
MandatoryExchangeable Trust144A, 5.250%(1) 23,055 24,040
Diversified Financial Services—0.2%Chewy, Inc. 2020
MandatoryExchangeable Trust144A, 6.500%(1) 9,640 13,014
Electric Utilities—0.8%NextEra Energy, Inc.,
5.279% 448,430 25,803NextEra Energy, Inc.,
6.219% 592,930 34,336
60,139
Electronic Components—0.1%II-VI, Inc. Series A,
6.000% 23,240 6,577
Healthcare Equipment &Supplies—0.4%Boston Scientific Corp.
Series A, 5.500% 266,550 30,563
Life Sciences Tools & Services—1.3%Avantor, Inc. Series A,
6.250% 226,190 29,226Danaher Corp. Series B,
5.000% 39,720 69,040
98,266
Machinery—0.2%Stanley Black & Decker,
Inc., 5.250% 108,840 11,884
Pharmaceuticals—0.1%Elanco Animal Health,
Inc., 5.000% 229,565 10,252
Professional Services—0.2%Clarivate plc Series A,
5.250% 183,905 16,710
Semiconductors & SemiconductorEquipment—1.1%Broadcom, Inc. Series A,
8.000% 37,975 78,813
TOTAL CONVERTIBLE PREFERREDSTOCKS(Identified Cost $397,719) 478,353
ALLIANZGI INCOME & GROWTH FUNDSCHEDULE OF INVESTMENTS (Unaudited) (Continued)
DECEMBER 31, 2021
($ reported in thousands)
See Notes to Financial Statements
22
Shares Value
PREFERRED STOCKS—0.1%
Entertainment—0.1%LiveStyle, Inc. Series
B(2)(6)(7)(8)(9) 56,362 $ 5,636SFX ENTERTAINMENT
INC Series B(2)(6) 8(10) —
5,636
TOTAL PREFERRED STOCKS(Identified Cost $13,526) 5,636
COMMON STOCKS—33.2%
Automobiles—1.3%Tesla, Inc.(7) 93,385 98,687
Banks—1.2%CCF Holdings LLC(2)(7) 7,416,755 3,708CCF Holdings LLC
Class M(2)(7) 1,759,917 880JPMorgan Chase & Co. 304,045 48,146Wells Fargo & Co. 822,765 39,476
92,210
Biotechnology—0.7%AbbVie, Inc. 244,942 33,165Horizon Therapeutics
plc(7) 157,070 16,926
50,091
Capital Markets—1.1%Charles Schwab Corp.
(The) 342,775 28,827CME Group, Inc. Class A 85,305 19,489S&P Global, Inc. 66,580 31,421
79,737
Chemicals—0.6%DuPont de Nemours,
Inc.(11) 164,985 13,328Sherwin-Williams Co.
(The) 97,235 34,242
47,570
Commercial Services &Supplies—0.0%CENVEO Corp.(2)(8) 19,074 130
Consumer Finance—0.0%Erickson, Inc.(2)(7) 10,866 280
Electrical Equipment—0.2%Generac Holdings, Inc.(7) 49,720 17,497
Energy Equipment & Services—0.3%Bristow Group, Inc.(2) 1,625,000 —
Shares Value
Energy Equipment &Services—continuedSchlumberger N.V. 687,365 $ 20,587
20,587
Entertainment—0.4%LiveStyle, Inc.(2)(6)(7)(8)(9) 202,319 —(12)
Netflix, Inc.(7)(11) 52,200 31,447
31,447
Equity Real Estate Investment—0.4%Crown Castle
International Corp. 148,671 31,034
Food & Staples Retailing—0.6%Costco Wholesale
Corp.(11) 76,110 43,208
Healthcare Equipment &Supplies—1.6%Abbott Laboratories 181,305 25,517Align Technology, Inc.(7) 31,185 20,494Dexcom, Inc.(7) 58,985 31,672Intuitive Surgical, Inc.(7) 109,345 39,288
116,971
Healthcare Providers &Services—0.5%UnitedHealth Group, Inc. 79,976 40,159
Hotels, Restaurants & Leisure—1.5%Booking Holdings, Inc.(7) 16,745 40,175Chipotle Mexican Grill,
Inc. Class A(7) 9,905 17,316Darden Restaurants, Inc. 85,105 12,820MGM Resorts
International(11) 555,505 24,931Starbucks Corp. 168,902 19,757
114,999
Household Durables—0.4%DR Horton, Inc. 295,680 32,067
Industrial Conglomerates—0.3%Honeywell International,
Inc. 98,630 20,565
Insurance—0.3%Aon plc Class A 83,085 24,972
Interactive Media & Services—3.1%Alphabet, Inc. Class A(7) 46,075 133,481Match Group, Inc.(7) 45,471 6,014Meta Platforms, Inc.
Class A(7) 277,200 93,236
232,731
Internet & Direct MarketingRetail—1.3%Amazon.com, Inc.(7)(11) 28,320 94,429
Shares Value
IT Services—1.8%Accenture plc Class A 125,320 $ 51,951EPAM Systems, Inc.(7) 22,005 14,709Mastercard, Inc.
Class A(11) 85,280 30,643Visa, Inc. Class A 170,485 36,946
134,249
Life Sciences Tools & Services—1.3%Agilent Technologies, Inc. 206,970 33,043IQVIA Holdings, Inc.(7) 118,460 33,422Thermo Fisher Scientific,
Inc. 52,145 34,793
101,258
Machinery—0.3%Deere & Co.(11) 58,320 19,997
Media—0.0%Postmedia Network
Canada Corp.(2)(7) 1,018,823 937
Metals & Mining—0.1%Freeport-McMoRan, Inc. 200,060 8,349
Multiline Retail—0.3%Target Corp. 111,990 25,919
Oil, Gas & Consumable Fuels—0.6%Exxon Mobil Corp.(11) 320,375 19,604Hercules Offshore, Inc.(2) 174,935 —Noble Corp.(7) 5,386 134Occidental Petroleum
Corp. 168,755 4,892Riviera Resources,
Inc.(2)(7) 25,527 —Valero Energy Corp. 262,125 19,688
44,318
Pharmaceuticals—0.9%Eli Lilly & Co.(11) 136,840 37,798Zoetis, Inc. Class A 110,905 27,064
64,862
Road & Rail—0.2%Union Pacific Corp. 50,300 12,672
Semiconductors & SemiconductorEquipment—3.9%Advanced Micro Devices,
Inc.(7) 277,405 39,919Broadcom, Inc. 34,670 23,070Enphase Energy, Inc.(7) 122,085 22,334GlobalFoundries, Inc.(7) 257,435 16,726Lam Research Corp.(11) 46,220 33,239Marvell Technology,
Inc.(11) 317,955 27,818Micron Technology, Inc. 257,825 24,016NVIDIA Corp. 288,200 84,763QUALCOMM, Inc.(11) 91,055 16,651
ALLIANZGI INCOME & GROWTH FUNDSCHEDULE OF INVESTMENTS (Unaudited) (Continued)
DECEMBER 31, 2021
($ reported in thousands)
See Notes to Financial Statements
23
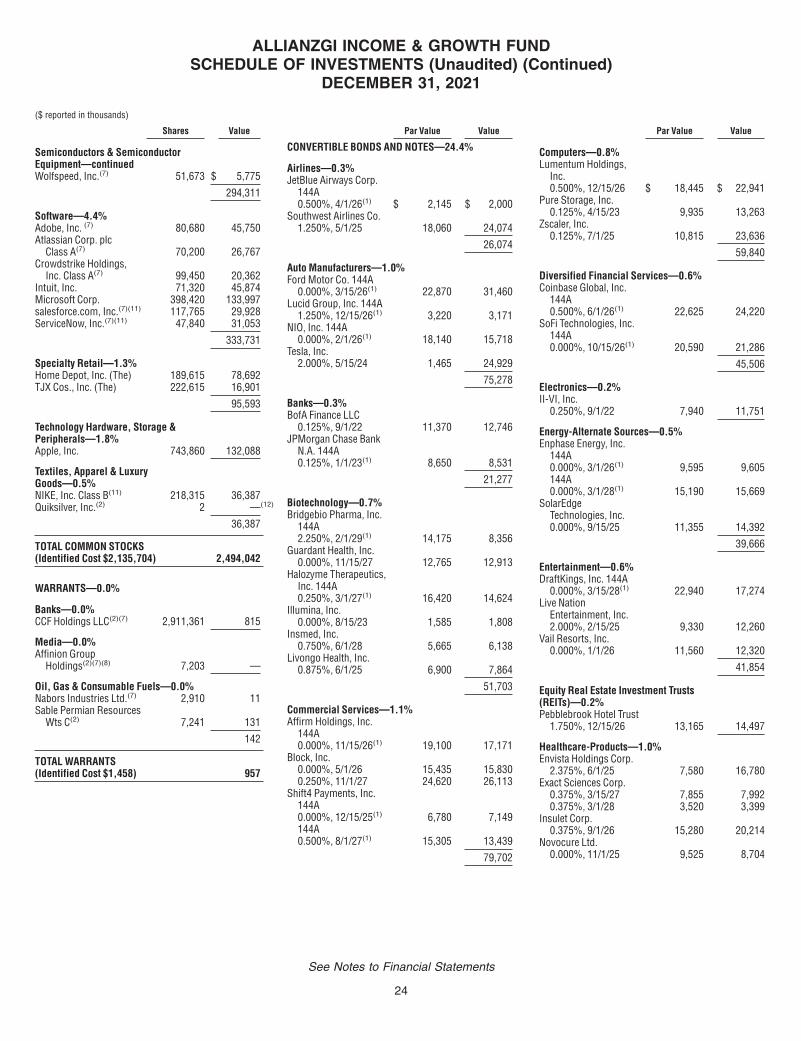
Shares Value
Semiconductors & SemiconductorEquipment—continuedWolfspeed, Inc.(7) 51,673 $ 5,775
294,311
Software—4.4%Adobe, Inc. (7) 80,680 45,750Atlassian Corp. plc
Class A(7) 70,200 26,767Crowdstrike Holdings,
Inc. Class A(7) 99,450 20,362Intuit, Inc. 71,320 45,874Microsoft Corp. 398,420 133,997salesforce.com, Inc.(7)(11) 117,765 29,928ServiceNow, Inc.(7)(11) 47,840 31,053
333,731
Specialty Retail—1.3%Home Depot, Inc. (The) 189,615 78,692TJX Cos., Inc. (The) 222,615 16,901
95,593
Technology Hardware, Storage &Peripherals—1.8%Apple, Inc. 743,860 132,088
Textiles, Apparel & LuxuryGoods—0.5%NIKE, Inc. Class B(11) 218,315 36,387Quiksilver, Inc.(2) 2 —(12)
36,387
TOTAL COMMON STOCKS(Identified Cost $2,135,704) 2,494,042
WARRANTS—0.0%
Banks—0.0%CCF Holdings LLC(2)(7) 2,911,361 815
Media—0.0%Affinion Group
Holdings(2)(7)(8) 7,203 —
Oil, Gas & Consumable Fuels—0.0%Nabors Industries Ltd.(7) 2,910 11Sable Permian Resources
Wts C(2) 7,241 131
142
TOTAL WARRANTS(Identified Cost $1,458) 957
Par Value Value
CONVERTIBLE BONDS AND NOTES—24.4%
Airlines—0.3%JetBlue Airways Corp.
144A0.500%, 4/1/26(1) $ 2,145 $ 2,000
Southwest Airlines Co.1.250%, 5/1/25 18,060 24,074
26,074
Auto Manufacturers—1.0%Ford Motor Co. 144A
0.000%, 3/15/26(1) 22,870 31,460Lucid Group, Inc. 144A
1.250%, 12/15/26(1) 3,220 3,171NIO, Inc. 144A
0.000%, 2/1/26(1) 18,140 15,718Tesla, Inc.
2.000%, 5/15/24 1,465 24,929
75,278
Banks—0.3%BofA Finance LLC
0.125%, 9/1/22 11,370 12,746JPMorgan Chase Bank
N.A. 144A0.125%, 1/1/23(1) 8,650 8,531
21,277
Biotechnology—0.7%Bridgebio Pharma, Inc.
144A2.250%, 2/1/29(1) 14,175 8,356
Guardant Health, Inc.0.000%, 11/15/27 12,765 12,913
Halozyme Therapeutics,Inc. 144A0.250%, 3/1/27(1) 16,420 14,624
Illumina, Inc.0.000%, 8/15/23 1,585 1,808
Insmed, Inc.0.750%, 6/1/28 5,665 6,138
Livongo Health, Inc.0.875%, 6/1/25 6,900 7,864
51,703
Commercial Services—1.1%Affirm Holdings, Inc.
144A0.000%, 11/15/26(1) 19,100 17,171
Block, Inc.0.000%, 5/1/26 15,435 15,8300.250%, 11/1/27 24,620 26,113
Shift4 Payments, Inc.144A0.000%, 12/15/25(1) 6,780 7,149144A0.500%, 8/1/27(1) 15,305 13,439
79,702
Par Value Value
Computers—0.8%Lumentum Holdings,
Inc.0.500%, 12/15/26 $ 18,445 $ 22,941
Pure Storage, Inc.0.125%, 4/15/23 9,935 13,263
Zscaler, Inc.0.125%, 7/1/25 10,815 23,636
59,840
Diversified Financial Services—0.6%Coinbase Global, Inc.
144A0.500%, 6/1/26(1) 22,625 24,220
SoFi Technologies, Inc.144A0.000%, 10/15/26(1) 20,590 21,286
45,506
Electronics—0.2%II-VI, Inc.
0.250%, 9/1/22 7,940 11,751
Energy-Alternate Sources—0.5%Enphase Energy, Inc.
144A0.000%, 3/1/26(1) 9,595 9,605144A0.000%, 3/1/28(1) 15,190 15,669
SolarEdgeTechnologies, Inc.0.000%, 9/15/25 11,355 14,392
39,666
Entertainment—0.6%DraftKings, Inc. 144A
0.000%, 3/15/28(1) 22,940 17,274Live Nation
Entertainment, Inc.2.000%, 2/15/25 9,330 12,260
Vail Resorts, Inc.0.000%, 1/1/26 11,560 12,320
41,854
Equity Real Estate Investment Trusts(REITs)—0.2%Pebblebrook Hotel Trust
1.750%, 12/15/26 13,165 14,497
Healthcare-Products—1.0%Envista Holdings Corp.
2.375%, 6/1/25 7,580 16,780Exact Sciences Corp.
0.375%, 3/15/27 7,855 7,9920.375%, 3/1/28 3,520 3,399
Insulet Corp.0.375%, 9/1/26 15,280 20,214
Novocure Ltd.0.000%, 11/1/25 9,525 8,704
ALLIANZGI INCOME & GROWTH FUNDSCHEDULE OF INVESTMENTS (Unaudited) (Continued)
DECEMBER 31, 2021
($ reported in thousands)
See Notes to Financial Statements
24
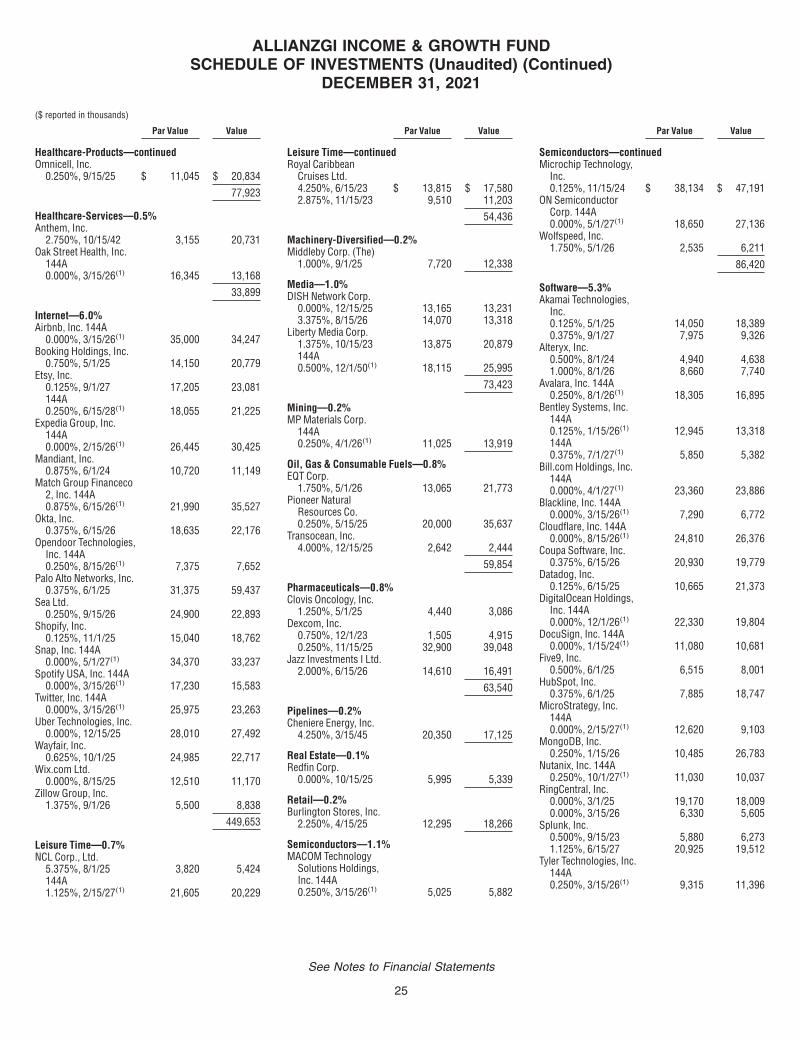
Par Value Value
Healthcare-Products—continuedOmnicell, Inc.
0.250%, 9/15/25 $ 11,045 $ 20,834
77,923
Healthcare-Services—0.5%Anthem, Inc.
2.750%, 10/15/42 3,155 20,731Oak Street Health, Inc.
144A0.000%, 3/15/26(1) 16,345 13,168
33,899
Internet—6.0%Airbnb, Inc. 144A
0.000%, 3/15/26(1) 35,000 34,247Booking Holdings, Inc.
0.750%, 5/1/25 14,150 20,779Etsy, Inc.
0.125%, 9/1/27 17,205 23,081144A0.250%, 6/15/28(1) 18,055 21,225
Expedia Group, Inc.144A0.000%, 2/15/26(1) 26,445 30,425
Mandiant, Inc.0.875%, 6/1/24 10,720 11,149
Match Group Financeco2, Inc. 144A0.875%, 6/15/26(1) 21,990 35,527
Okta, Inc.0.375%, 6/15/26 18,635 22,176
Opendoor Technologies,Inc. 144A0.250%, 8/15/26(1) 7,375 7,652
Palo Alto Networks, Inc.0.375%, 6/1/25 31,375 59,437
Sea Ltd.0.250%, 9/15/26 24,900 22,893
Shopify, Inc.0.125%, 11/1/25 15,040 18,762
Snap, Inc. 144A0.000%, 5/1/27(1) 34,370 33,237
Spotify USA, Inc. 144A0.000%, 3/15/26(1) 17,230 15,583
Twitter, Inc. 144A0.000%, 3/15/26(1) 25,975 23,263
Uber Technologies, Inc.0.000%, 12/15/25 28,010 27,492
Wayfair, Inc.0.625%, 10/1/25 24,985 22,717
Wix.com Ltd.0.000%, 8/15/25 12,510 11,170
Zillow Group, Inc.1.375%, 9/1/26 5,500 8,838
449,653
Leisure Time—0.7%NCL Corp., Ltd.
5.375%, 8/1/25 3,820 5,424144A1.125%, 2/15/27(1) 21,605 20,229
Par Value Value
Leisure Time—continuedRoyal Caribbean
Cruises Ltd.4.250%, 6/15/23 $ 13,815 $ 17,5802.875%, 11/15/23 9,510 11,203
54,436
Machinery-Diversified—0.2%Middleby Corp. (The)
1.000%, 9/1/25 7,720 12,338
Media—1.0%DISH Network Corp.
0.000%, 12/15/25 13,165 13,2313.375%, 8/15/26 14,070 13,318
Liberty Media Corp.1.375%, 10/15/23 13,875 20,879144A0.500%, 12/1/50(1) 18,115 25,995
73,423
Mining—0.2%MP Materials Corp.
144A0.250%, 4/1/26(1) 11,025 13,919
Oil, Gas & Consumable Fuels—0.8%EQT Corp.
1.750%, 5/1/26 13,065 21,773Pioneer Natural
Resources Co.0.250%, 5/15/25 20,000 35,637
Transocean, Inc.4.000%, 12/15/25 2,642 2,444
59,854
Pharmaceuticals—0.8%Clovis Oncology, Inc.
1.250%, 5/1/25 4,440 3,086Dexcom, Inc.
0.750%, 12/1/23 1,505 4,9150.250%, 11/15/25 32,900 39,048
Jazz Investments I Ltd.2.000%, 6/15/26 14,610 16,491
63,540
Pipelines—0.2%Cheniere Energy, Inc.
4.250%, 3/15/45 20,350 17,125
Real Estate—0.1%Redfin Corp.
0.000%, 10/15/25 5,995 5,339
Retail—0.2%Burlington Stores, Inc.
2.250%, 4/15/25 12,295 18,266
Semiconductors—1.1%MACOM Technology
Solutions Holdings,Inc. 144A0.250%, 3/15/26(1) 5,025 5,882
Par Value Value
Semiconductors—continuedMicrochip Technology,
Inc.0.125%, 11/15/24 $ 38,134 $ 47,191
ON SemiconductorCorp. 144A0.000%, 5/1/27(1) 18,650 27,136
Wolfspeed, Inc.1.750%, 5/1/26 2,535 6,211
86,420
Software—5.3%Akamai Technologies,
Inc.0.125%, 5/1/25 14,050 18,3890.375%, 9/1/27 7,975 9,326
Alteryx, Inc.0.500%, 8/1/24 4,940 4,6381.000%, 8/1/26 8,660 7,740
Avalara, Inc. 144A0.250%, 8/1/26(1) 18,305 16,895
Bentley Systems, Inc.144A0.125%, 1/15/26(1) 12,945 13,318144A0.375%, 7/1/27(1) 5,850 5,382
Bill.com Holdings, Inc.144A0.000%, 4/1/27(1) 23,360 23,886
Blackline, Inc. 144A0.000%, 3/15/26(1) 7,290 6,772
Cloudflare, Inc. 144A0.000%, 8/15/26(1) 24,810 26,376
Coupa Software, Inc.0.375%, 6/15/26 20,930 19,779
Datadog, Inc.0.125%, 6/15/25 10,665 21,373
DigitalOcean Holdings,Inc. 144A0.000%, 12/1/26(1) 22,330 19,804
DocuSign, Inc. 144A0.000%, 1/15/24(1) 11,080 10,681
Five9, Inc.0.500%, 6/1/25 6,515 8,001
HubSpot, Inc.0.375%, 6/1/25 7,885 18,747
MicroStrategy, Inc.144A0.000%, 2/15/27(1) 12,620 9,103
MongoDB, Inc.0.250%, 1/15/26 10,485 26,783
Nutanix, Inc. 144A0.250%, 10/1/27(1) 11,030 10,037
RingCentral, Inc.0.000%, 3/1/25 19,170 18,0090.000%, 3/15/26 6,330 5,605
Splunk, Inc.0.500%, 9/15/23 5,880 6,2731.125%, 6/15/27 20,925 19,512
Tyler Technologies, Inc.144A0.250%, 3/15/26(1) 9,315 11,396
ALLIANZGI INCOME & GROWTH FUNDSCHEDULE OF INVESTMENTS (Unaudited) (Continued)
DECEMBER 31, 2021
($ reported in thousands)
See Notes to Financial Statements
25

Par Value Value
Software—continuedUnity Software, Inc.
144A0.000%, 11/15/26(1) $ 28,435 $ 25,947
Workday, Inc.0.250%, 10/1/22 14,710 27,361
Zynga, Inc.0.250%, 6/1/24 3,630 3,9180.000%, 12/15/26 5,190 4,736
399,787
TOTAL CONVERTIBLE BONDS ANDNOTES(Identified Cost $1,778,687) 1,833,070
TOTAL LONG-TERMINVESTMENTS—95.3%(Identified Cost $6,674,214) 7,156,800
Shares
SHORT-TERM INVESTMENTS—4.2%
Money Market Mutual Fund—4.0%Dreyfus Government
Cash ManagementFund - InstitutionalShares (seven-dayeffective yield0.030%)(13) 300,926,383 300,926
Total Money Market Mutual Fund(Identified Cost $300,926) 300,926
Affiliated Mutual Fund—0.2%Virtus AllianzGI High
Yield Bond Fund(6)(13) 1,307,728 11,063
Total Affiliated Mutual Fund(Identified Cost $11,033) 11,063
TOTAL SHORT-TERM INVESTMENTS(Identified Cost $311,959) 311,989
TOTAL INVESTMENTS, BEFOREWRITTEN OPTIONS—99.5%(Identified Cost $6,986,173) 7,468,789
Value
WRITTEN OPTIONS—(0.0)%(See open writtenoptions schedule)TOTAL WRITTEN OPTIONS(Premiums Received $1,195) $ (753)
TOTAL INVESTMENTS, NET OFWRITTEN OPTIONS—99.5%(Identified Cost $6,984,978) $7,468,036Other assets and liabilities, net—0.5% 40,334
NET ASSETS—100.0% $7,508,370
Abbreviations:LIBOR London Interbank Offered RateLLC Limited Liability CompanyLP Limited PartnershipREIT Real Estate Investment TrustS&P Standard & Poor’sSBA Small Business Administration
Footnote Legend:(1) Security exempt from registration under
Rule 144A of the Securities Act of 1933. Thesesecurities may be resold in transactions exemptfrom registration, normally to qualifiedinstitutional buyers. At December 31, 2021, thesesecurities amounted to a value of $2,376,395 or31.6% of net assets.
(2) The value of this security was determined usingsignificant unobservable inputs and is reported asa Level 3 security in the Fair Value Hierarchy tablelocated after the Schedule of Investments.
(3) Security in default; no interest payments are beingreceived during the bankruptcy proceedings.
(4) Variable rate security. Rate disclosed is as ofDecember 31, 2021. Information in parenthesisrepresents benchmark and reference rate for eachsecurity. Certain variable rate securities are notbased on a published reference rate and spreadbut are determined by the issuer or agent and arebased on current market conditions, or, formortgage-backed securities, are impacted by theindividual mortgages which are paying off overtime. These securities do not indicate a referencerate and spread in their descriptions.
(5) No contractual maturity date.(6) Affiliated company. See Note 4G in Notes to
Financial Statements.(7) Non-income producing.(8) All or a portion of the security is restricted.(9) A member of the Fund’s portfolio management
team is a member of the board of directors ofLiveStyle, Inc. The aggregate value of investmentsby the Fund in LiveStyle, Inc. represents 0.08% ofnet assets. See Note 4G in the Notes to FinancialStatements.
(10) Value shown as par value.(11) All or a portion of the security is segregated as
collateral for written options.(12) Amount is less than $500.(13) Shares of this fund are publicly offered, and its
prospectus and annual report are publiclyavailable.
Country Weightings†
United States 93%United Kingdom 2Canada 1Cayman Islands 1Bermuda 1Liberia 1Ireland 1
Total 100%† % of total investments, net of written options, as ofDecember 31, 2021.
ALLIANZGI INCOME & GROWTH FUNDSCHEDULE OF INVESTMENTS (Unaudited) (Continued)
DECEMBER 31, 2021
($ reported in thousands)
For information regarding the abbreviations, see the Key Investment Terms starting on page 6.
See Notes to Financial Statements
26
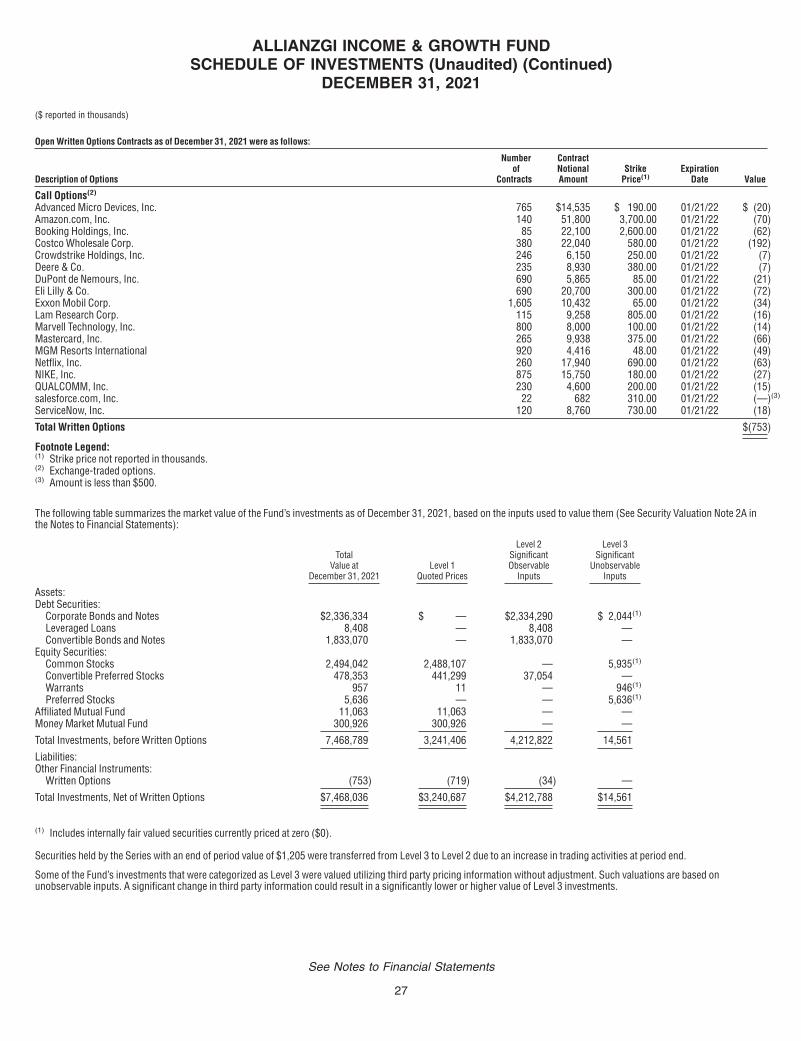
Open Written Options Contracts as of December 31, 2021 were as follows:
Description of Options
Numberof
Contracts
ContractNotionalAmount
StrikePrice(1)
ExpirationDate Value
Call Options(2)
Advanced Micro Devices, Inc. 765 $14,535 $ 190.00 01/21/22 $ (20)Amazon.com, Inc. 140 51,800 3,700.00 01/21/22 (70)Booking Holdings, Inc. 85 22,100 2,600.00 01/21/22 (62)Costco Wholesale Corp. 380 22,040 580.00 01/21/22 (192)Crowdstrike Holdings, Inc. 246 6,150 250.00 01/21/22 (7)Deere & Co. 235 8,930 380.00 01/21/22 (7)DuPont de Nemours, Inc. 690 5,865 85.00 01/21/22 (21)Eli Lilly & Co. 690 20,700 300.00 01/21/22 (72)Exxon Mobil Corp. 1,605 10,432 65.00 01/21/22 (34)Lam Research Corp. 115 9,258 805.00 01/21/22 (16)Marvell Technology, Inc. 800 8,000 100.00 01/21/22 (14)Mastercard, Inc. 265 9,938 375.00 01/21/22 (66)MGM Resorts International 920 4,416 48.00 01/21/22 (49)Netflix, Inc. 260 17,940 690.00 01/21/22 (63)NIKE, Inc. 875 15,750 180.00 01/21/22 (27)QUALCOMM, Inc. 230 4,600 200.00 01/21/22 (15)salesforce.com, Inc. 22 682 310.00 01/21/22 (—)(3)
ServiceNow, Inc. 120 8,760 730.00 01/21/22 (18)
Total Written Options $(753)
Footnote Legend:(1) Strike price not reported in thousands.(2) Exchange-traded options.(3) Amount is less than $500.
The following table summarizes the market value of the Fund’s investments as of December 31, 2021, based on the inputs used to value them (See Security Valuation Note 2A inthe Notes to Financial Statements):
TotalValue at
December 31, 2021Level 1
Quoted Prices
Level 2SignificantObservable
Inputs
Level 3Significant
UnobservableInputs
Assets:Debt Securities:
Corporate Bonds and Notes $2,336,334 $ — $2,334,290 $ 2,044(1)
Leveraged Loans 8,408 — 8,408 —Convertible Bonds and Notes 1,833,070 — 1,833,070 —
Equity Securities:Common Stocks 2,494,042 2,488,107 — 5,935(1)
Convertible Preferred Stocks 478,353 441,299 37,054 —Warrants 957 11 — 946(1)
Preferred Stocks 5,636 — — 5,636(1)
Affiliated Mutual Fund 11,063 11,063 — —Money Market Mutual Fund 300,926 300,926 — —
Total Investments, before Written Options 7,468,789 3,241,406 4,212,822 14,561
Liabilities:Other Financial Instruments:
Written Options (753) (719) (34) —
Total Investments, Net of Written Options $7,468,036 $3,240,687 $4,212,788 $14,561
(1) Includes internally fair valued securities currently priced at zero ($0).
Securities held by the Series with an end of period value of $1,205 were transferred from Level 3 to Level 2 due to an increase in trading activities at period end.
Some of the Fund’s investments that were categorized as Level 3 were valued utilizing third party pricing information without adjustment. Such valuations are based onunobservable inputs. A significant change in third party information could result in a significantly lower or higher value of Level 3 investments.
ALLIANZGI INCOME & GROWTH FUNDSCHEDULE OF INVESTMENTS (Unaudited) (Continued)
DECEMBER 31, 2021
($ reported in thousands)
See Notes to Financial Statements
27

The following is a reconciliation of assets of the Fund for Level 3 investments for which significant unobservable inputs were used to determine fair value.
Total
CorporateBonds
And NotesLeveraged
LoansCommonStocks Warrants
PreferredStocks
Investments in SecuritiesBalance as of June 30, 2021: $ 45,580 $ 5,046(a) $ 11,673 $ 8,943(a) $ 1,536(a) $ 18,382(a)
Accrued discount/(premium) - - - - - -Realized gain (loss) (28,818) (21,994) - (7,169) - 345Change in unrealized appreciation (depreciation)(b) 24,095 21,095 - 4,283 (590) (693)Purchases - - - - - -Sales(c) (25,091) (898) (11,673) (122) - (12,398)Transfers from Level 3(d) (1,205) (1,205) - - - -Balance as of December 31, 2021 $ 14,561 $ 2,044(a) $ - $ 5,935(a) $ 946(a) $ 5,636(a)
(a) Includes internally fair valued security currently priced at zero ($0).
(b) The change in unrealized appreciation (depreciation) on investments still held at December 31, 2021, was $(5,913).
(c) Includes paydowns on securities.
(d) “Transfers into and/or from” represent the ending value as of December 31, 2021, for any investment security where a change in the pricing level occurred from the beginningto the end of the period.
The following table presents additional information about valuation techniques and inputs used for investments that are measured at fair value and categorized within Level 3 atDecember 31, 2021:
Investments in Securities – Assets
EndingBalance at
December 31, 2021 Valuation Technique UsedUnobservable
InputsInput
Values
Preferred Stocks:LiveStyle, Inc. Series B $5,636 Market and Company Comparables EV Multiples 5.03x (0.29x - 21.73x)
Illiquidity Discount 30%
Common Stocks:CCF Holdings LLC $4,588 Market and Company Comparables EV Multiples 1.26x (0.57x - 2.03x)
0.65x (0.33x - 0.95x)Illiquidity Discount 20%
CENVEO Corp. $ 130 Market and Company Comparables EV Multiples 0.58x (0.35x - 0.98x)4.84x (3.44x - 6.04x)0.65x (0.55x - 0.72x)
Illiquidity Discount 20%
Erickson, Inc. $ 280 Market and Company Comparables EV Multiples 1.29x (0.83x - 2.43x)10.91x (9.18x - 14.51x)
1.00x (0.57x - 1.49x)M&A Transaction Multiples
Illiquidity Discount0.96x (0.41x - 1.96x)
20%
LiveStyle, Inc $ — (1) Market and Company Comparables EV Multiples 5.03x (0.29x - 21.73x)Illiquidity Discount 30%
Postmedia Network Canada Corp. $ 937 Market and Company Comparables EV Multiples 0.86x (0.45x - 3.71x)5.48x (2.51x - 22.52x)
M&A Transaction MultiplesIlliquidity Discount
9.69x (7.52x - 12.30x)10%
Quiksilver, Inc. $ — (1) Market and Company Comparables EV Multiples 0.87x (0.33x - 1.37x)
ALLIANZGI INCOME & GROWTH FUNDSCHEDULE OF INVESTMENTS (Unaudited) (Continued)
DECEMBER 31, 2021
($ reported in thousands)
See Notes to Financial Statements
28
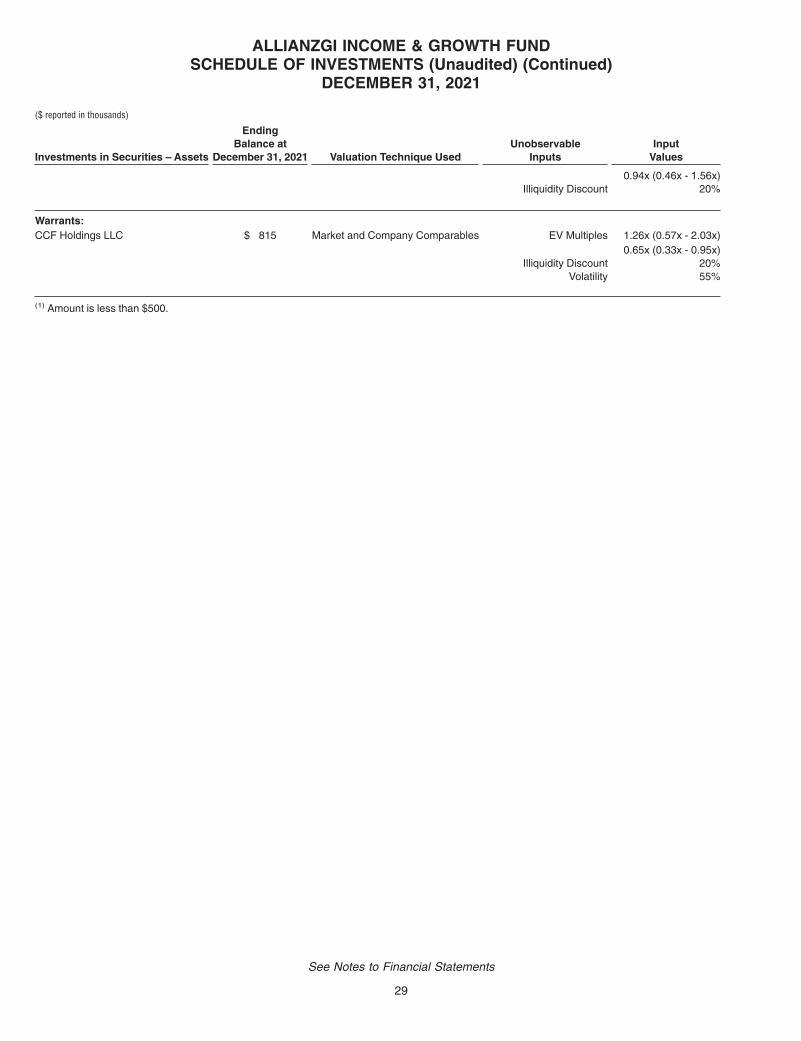
Investments in Securities – Assets
EndingBalance at
December 31, 2021 Valuation Technique UsedUnobservable
InputsInput
Values
0.94x (0.46x - 1.56x)Illiquidity Discount 20%
Warrants:CCF Holdings LLC $ 815 Market and Company Comparables EV Multiples 1.26x (0.57x - 2.03x)
0.65x (0.33x - 0.95x)Illiquidity Discount 20%
Volatility 55%
(1) Amount is less than $500.
ALLIANZGI INCOME & GROWTH FUNDSCHEDULE OF INVESTMENTS (Unaudited) (Continued)
DECEMBER 31, 2021
($ reported in thousands)
See Notes to Financial Statements
29
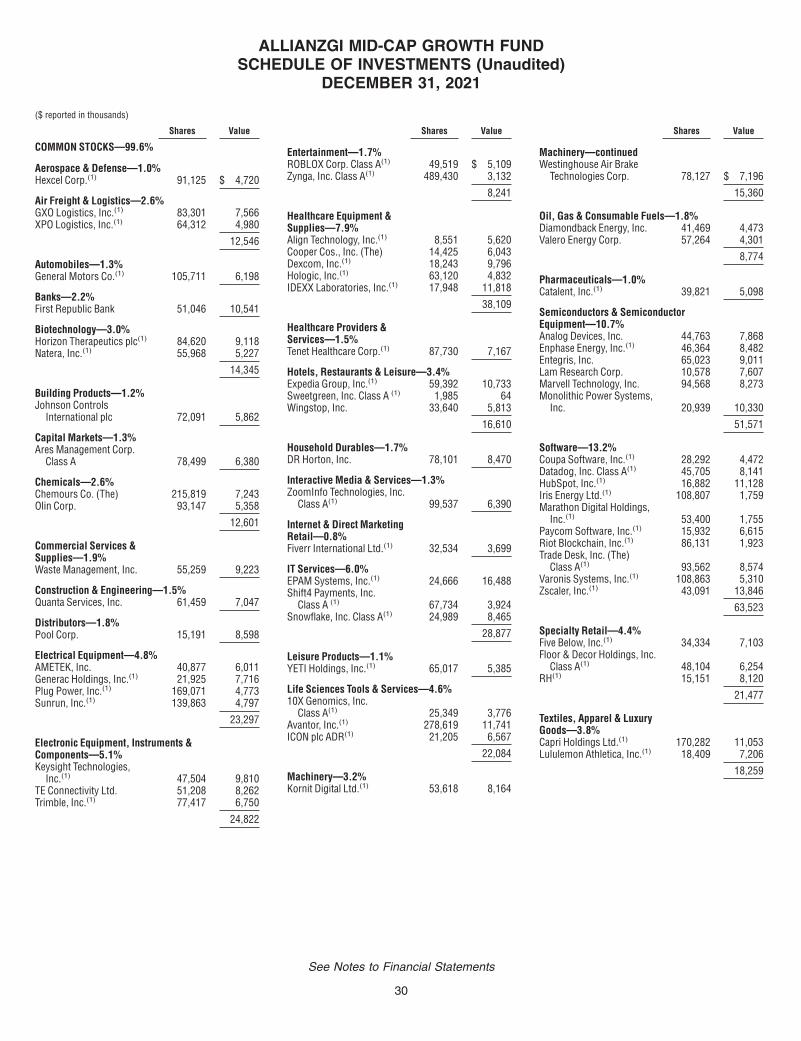
Shares Value
COMMON STOCKS—99.6%
Aerospace & Defense—1.0%Hexcel Corp.(1) 91,125 $ 4,720
Air Freight & Logistics—2.6%GXO Logistics, Inc.(1) 83,301 7,566XPO Logistics, Inc.(1) 64,312 4,980
12,546
Automobiles—1.3%General Motors Co.(1) 105,711 6,198
Banks—2.2%First Republic Bank 51,046 10,541
Biotechnology—3.0%Horizon Therapeutics plc(1) 84,620 9,118Natera, Inc.(1) 55,968 5,227
14,345
Building Products—1.2%Johnson Controls
International plc 72,091 5,862
Capital Markets—1.3%Ares Management Corp.
Class A 78,499 6,380
Chemicals—2.6%Chemours Co. (The) 215,819 7,243Olin Corp. 93,147 5,358
12,601
Commercial Services &Supplies—1.9%Waste Management, Inc. 55,259 9,223
Construction & Engineering—1.5%Quanta Services, Inc. 61,459 7,047
Distributors—1.8%Pool Corp. 15,191 8,598
Electrical Equipment—4.8%AMETEK, Inc. 40,877 6,011Generac Holdings, Inc.(1) 21,925 7,716Plug Power, Inc.(1) 169,071 4,773Sunrun, Inc.(1) 139,863 4,797
23,297
Electronic Equipment, Instruments &Components—5.1%Keysight Technologies,
Inc.(1) 47,504 9,810TE Connectivity Ltd. 51,208 8,262Trimble, Inc.(1) 77,417 6,750
24,822
Shares Value
Entertainment—1.7%ROBLOX Corp. Class A(1) 49,519 $ 5,109Zynga, Inc. Class A(1) 489,430 3,132
8,241
Healthcare Equipment &Supplies—7.9%Align Technology, Inc.(1) 8,551 5,620Cooper Cos., Inc. (The) 14,425 6,043Dexcom, Inc.(1) 18,243 9,796Hologic, Inc.(1) 63,120 4,832IDEXX Laboratories, Inc.(1) 17,948 11,818
38,109
Healthcare Providers &Services—1.5%Tenet Healthcare Corp.(1) 87,730 7,167
Hotels, Restaurants & Leisure—3.4%Expedia Group, Inc.(1) 59,392 10,733Sweetgreen, Inc. Class A (1) 1,985 64Wingstop, Inc. 33,640 5,813
16,610
Household Durables—1.7%DR Horton, Inc. 78,101 8,470
Interactive Media & Services—1.3%ZoomInfo Technologies, Inc.
Class A(1) 99,537 6,390
Internet & Direct MarketingRetail—0.8%Fiverr International Ltd.(1) 32,534 3,699
IT Services—6.0%EPAM Systems, Inc.(1) 24,666 16,488Shift4 Payments, Inc.
Class A (1) 67,734 3,924Snowflake, Inc. Class A(1) 24,989 8,465
28,877
Leisure Products—1.1%YETI Holdings, Inc.(1) 65,017 5,385
Life Sciences Tools & Services—4.6%10X Genomics, Inc.
Class A(1) 25,349 3,776Avantor, Inc.(1) 278,619 11,741ICON plc ADR(1) 21,205 6,567
22,084
Machinery—3.2%Kornit Digital Ltd.(1) 53,618 8,164
Shares Value
Machinery—continuedWestinghouse Air Brake
Technologies Corp. 78,127 $ 7,196
15,360
Oil, Gas & Consumable Fuels—1.8%Diamondback Energy, Inc. 41,469 4,473Valero Energy Corp. 57,264 4,301
8,774
Pharmaceuticals—1.0%Catalent, Inc.(1) 39,821 5,098
Semiconductors & SemiconductorEquipment—10.7%Analog Devices, Inc. 44,763 7,868Enphase Energy, Inc.(1) 46,364 8,482Entegris, Inc. 65,023 9,011Lam Research Corp. 10,578 7,607Marvell Technology, Inc. 94,568 8,273Monolithic Power Systems,
Inc. 20,939 10,330
51,571
Software—13.2%Coupa Software, Inc.(1) 28,292 4,472Datadog, Inc. Class A(1) 45,705 8,141HubSpot, Inc.(1) 16,882 11,128Iris Energy Ltd.(1) 108,807 1,759Marathon Digital Holdings,
Inc.(1) 53,400 1,755Paycom Software, Inc.(1) 15,932 6,615Riot Blockchain, Inc.(1) 86,131 1,923Trade Desk, Inc. (The)
Class A(1) 93,562 8,574Varonis Systems, Inc.(1) 108,863 5,310Zscaler, Inc.(1) 43,091 13,846
63,523
Specialty Retail—4.4%Five Below, Inc.(1) 34,334 7,103Floor & Decor Holdings, Inc.
Class A(1) 48,104 6,254RH(1) 15,151 8,120
21,477
Textiles, Apparel & LuxuryGoods—3.8%Capri Holdings Ltd.(1) 170,282 11,053Lululemon Athletica, Inc.(1) 18,409 7,206
18,259
ALLIANZGI MID-CAP GROWTH FUNDSCHEDULE OF INVESTMENTS (Unaudited)
DECEMBER 31, 2021
($ reported in thousands)
See Notes to Financial Statements
30

Shares Value
Trading Companies &Distributors—1.2%United Rentals, Inc.(1) 16,881 $ 5,609
TOTAL COMMON STOCKS(Identified Cost $343,075) 480,883
TOTAL LONG-TERMINVESTMENTS—99.6%(Identified Cost $343,075) 480,883
Shares Value
SHORT-TERM INVESTMENT—0.6%
Money Market Mutual Fund—0.6%Dreyfus Government Cash
Management Fund -Institutional Shares(seven-day effective yield0.030%)(2) 2,936,972 $ 2,937
TOTAL SHORT-TERM INVESTMENT(Identified Cost $2,937) 2,937
TOTAL INVESTMENTS—100.2%(Identified Cost $346,012) $483,820Other assets and liabilities, net—(0.2)% (1,149)
NET ASSETS—100.0% $482,671
Abbreviation:ADR American Depositary Receipt
Footnote Legend:(1) Non-income producing.(2) Shares of this fund are publicly offered, and its
prospectus and annual report are publicly available.
Country Weightings†
United States 87%Ireland 5Israel 2Virgin Islands (British) 2Switzerland 2Canada 2
Total 100%† % of total investments as of December 31, 2021.
The following table summarizes the market value of the Fund’s investments as of December 31, 2021, based on the inputs used to value them (See Security Valuation Note 2A inthe Notes to Financial Statements):
TotalValue at
December 31, 2021Level 1
Quoted Prices
Assets:Equity Securities:
Common Stocks $480,883 $480,883Money Market Mutual Fund 2,937 2,937
Total Investments $483,820 $483,820
There were no securities valued using significant observable inputs (Level 2) or significant unobservable inputs (Level 3) at December 31, 2021.
There were no transfers into or out of Level 3 related to securities held at December 31, 2021.
ALLIANZGI MID-CAP GROWTH FUNDSCHEDULE OF INVESTMENTS (Unaudited) (Continued)
DECEMBER 31, 2021
($ reported in thousands)
For information regarding the abbreviations, see the Key Investment Terms starting on page 6.
See Notes to Financial Statements
31

Shares Value
COMMON STOCKS—97.4%
Aerospace & Defense—0.5%Axon Enterprise, Inc.(1) 3,613 $ 567HEICO Corp. 2,489 359
926
Auto Components—0.2%LCI Industries 2,341 365
Banks—5.6%Banc of California, Inc. 31,231 613Central Pacific Financial
Corp. 12,692 357First Financial Bankshares,
Inc. 8,717 443First Foundation, Inc. 3,187 79Glacier Bancorp, Inc. 6,716 381Hancock Whitney Corp. 19,408 971Hilltop Holdings, Inc. 13,181 463Hope Bancorp, Inc. 41,692 613Independent Bank Corp. 748 61Investors Bancorp, Inc. 41,957 636PacWest Bancorp 22,463 1,015Pinnacle Financial Partners,
Inc. 10,017 957Preferred Bank 932 67Sandy Spring Bancorp, Inc. 25,766 1,239Silvergate Capital Corp.
Class A(1) 1,711 253SouthState Corp. 5,618 450Texas Capital Bancshares,
Inc.(1) 6,727 405TriState Capital Holdings,
Inc.(1) 1,873 57United Bankshares, Inc. 7,677 278Valley National Bancorp 32,948 453Western Alliance Bancorp 5,617 605
10,396
Beverages—1.2%Celsius Holdings, Inc.(1) 1,677 125Coca-Cola Consolidated,
Inc. 3,343 2,070
2,195
Biotechnology—6.3%Arcturus Therapeutics
Holdings, Inc.(1) 751 28Arena Pharmaceuticals,
Inc.(1) 2,680 249Arrowhead
Pharmaceuticals, Inc.(1) 3,949 262Avid Bioservices, Inc.(1) 2,200 64Avita Medical, Inc.(1) 8,916 107BioCryst Pharmaceuticals,
Inc.(1) 32,234 446Biohaven Pharmaceutical
Holding Co. Ltd.(1) 6,043 833Blueprint Medicines Corp.(1) 9,112 976ChemoCentryx, Inc.(1) 1,385 50Cytokinetics, Inc.(1) 15,813 721
Shares Value
Biotechnology—continuedDeciphera Pharmaceuticals,
Inc.(1) 710 $ 7Dynavax Technologies
Corp.(1) 3,211 45Eagle Pharmaceuticals,
Inc.(1) 4,775 243Fate Therapeutics, Inc.(1) 2,947 172Halozyme Therapeutics,
Inc.(1) 5,167 208Heron Therapeutics, Inc.(1) 8,197 75Homology Medicines, Inc.(1) 1,234 5Horizon Therapeutics plc(1) 6,774 730Inovio Pharmaceuticals,
Inc.(1) 3,617 18Intellia Therapeutics, Inc.(1) 7,717 912Invitae Corp.(1) 1,896 29IVERIC bio, Inc.(1) 17,969 300Karuna Therapeutics, Inc.(1) 265 35Karyopharm Therapeutics,
Inc.(1) 2,233 14Keros Therapeutics, Inc.(1) 4,534 265Kodiak Sciences, Inc.(1) 2,109 179Krystal Biotech, Inc.(1) 479 34Kura Oncology, Inc.(1) 1,744 24MannKind Corp.(1) 9,000 39MeiraGTx Holdings plc(1) 904 21Mersana Therapeutics,
Inc.(1) 26,785 167Mirati Therapeutics, Inc.(1) 604 89Natera, Inc.(1) 13,070 1,221Precision BioSciences,
Inc.(1) 1,481 11Protagonist Therapeutics,
Inc.(1) 12,058 412Rocket Pharmaceuticals,
Inc.(1) 2,975 65Sorrento Therapeutics,
Inc.(1) 6,897 32SpringWorks Therapeutics,
Inc.(1) 2,852 177Sutro Biopharma, Inc.(1) 3,869 58TG Therapeutics, Inc.(1) 28,788 547Turning Point Therapeutics,
Inc.(1) 4,582 219Twist Bioscience Corp.(1) 1,107 86Ultragenyx Pharmaceutical,
Inc.(1) 1,526 128United Therapeutics Corp.(1) 2,779 600Vanda Pharmaceuticals,
Inc.(1) 1,812 28Veracyte, Inc.(1) 1,934 80Vericel Corp.(1) 2,693 106Viking Therapeutics, Inc.(1) 2,828 13Xencor, Inc.(1) 10,976 440Y-mAbs Therapeutics,
Inc.(1) 795 13ZIOPHARM Oncology,
Inc.(1) 7,090 8
11,591
Building Products—2.6%Builders FirstSource, Inc.(1) 25,466 2,183
Shares Value
Building Products—continuedCSW Industrials, Inc. 531 $ 64Masonite International
Corp.(1) 3,492 412PGT Innovations, Inc.(1) 2,150 48UFP Industries, Inc. 23,300 2,144
4,851
Capital Markets—3.7%AllianceBernstein
Holding LP 18,122 885Artisan Partners Asset
Management, Inc. Class A 12,002 572Barings BDC, Inc. 29,560 326Evercore, Inc. Class A 6,076 825Freedom Holding Corp.
N.V.(1) 6,080 422Golub Capital BDC, Inc. 42,715 659Hercules Capital, Inc. 25,825 428LPL Financial Holdings, Inc. 5,422 868Main Street Capital Corp. 7,212 324Moelis & Co. Class A 18,229 1,139PJT Partners, Inc. Class A 6,138 455
6,903
Chemicals—1.8%Balchem Corp. 2,343 395Chemours Co. (The) 15,713 528HB Fuller Co. 14,866 1,204Sensient Technologies Corp. 6,487 649Trinseo plc 11,227 589
3,365
Commercial Services &Supplies—1.2%Casella Waste Systems, Inc.
Class A(1) 10,170 869Clean Harbors, Inc.(1) 8,331 831Montrose Environmental
Group, Inc.(1) 1,100 77Tetra Tech, Inc. 2,243 381
2,158
Communications Equipment—0.8%Calix, Inc.(1) 19,244 1,539
Construction & Engineering—1.2%API Group Corp.(1) 35,518 915Construction Partners, Inc.
Class A(1) 2,516 74EMCOR Group, Inc. 5,063 645MasTec, Inc.(1) 4,354 402NV5 Global, Inc.(1) 1,305 180Sterling Construction Co.,
Inc.(1) 3,874 102
2,318
Construction Materials—0.4%Summit Materials, Inc.
Class A(1) 18,442 740
ALLIANZGI SMALL-CAP FUNDSCHEDULE OF INVESTMENTS (Unaudited)
DECEMBER 31, 2021
($ reported in thousands)
See Notes to Financial Statements
32
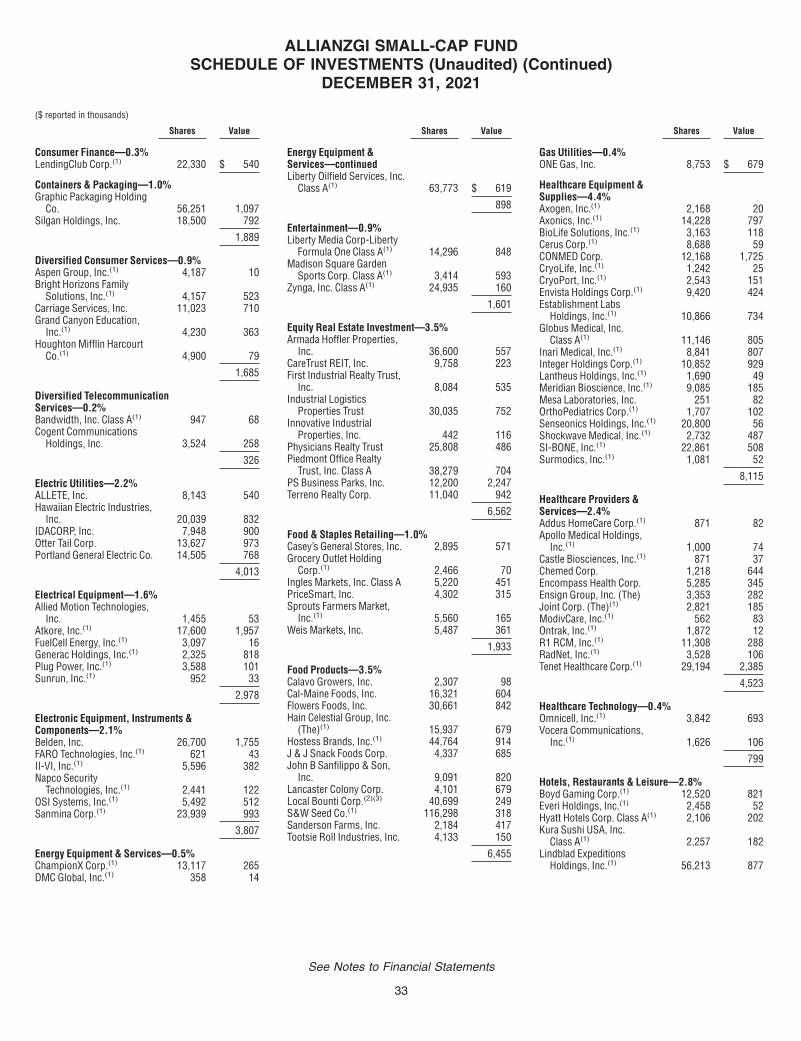
Shares Value
Consumer Finance—0.3%LendingClub Corp.(1) 22,330 $ 540
Containers & Packaging—1.0%Graphic Packaging Holding
Co. 56,251 1,097Silgan Holdings, Inc. 18,500 792
1,889
Diversified Consumer Services—0.9%Aspen Group, Inc.(1) 4,187 10Bright Horizons Family
Solutions, Inc.(1) 4,157 523Carriage Services, Inc. 11,023 710Grand Canyon Education,
Inc.(1) 4,230 363Houghton Mifflin Harcourt
Co.(1) 4,900 79
1,685
Diversified TelecommunicationServices—0.2%Bandwidth, Inc. Class A(1) 947 68Cogent Communications
Holdings, Inc. 3,524 258
326
Electric Utilities—2.2%ALLETE, Inc. 8,143 540Hawaiian Electric Industries,
Inc. 20,039 832IDACORP, Inc. 7,948 900Otter Tail Corp. 13,627 973Portland General Electric Co. 14,505 768
4,013
Electrical Equipment—1.6%Allied Motion Technologies,
Inc. 1,455 53Atkore, Inc.(1) 17,600 1,957FuelCell Energy, Inc.(1) 3,097 16Generac Holdings, Inc.(1) 2,325 818Plug Power, Inc.(1) 3,588 101Sunrun, Inc.(1) 952 33
2,978
Electronic Equipment, Instruments &Components—2.1%Belden, Inc. 26,700 1,755FARO Technologies, Inc.(1) 621 43II-VI, Inc.(1) 5,596 382Napco Security
Technologies, Inc.(1) 2,441 122OSI Systems, Inc.(1) 5,492 512Sanmina Corp.(1) 23,939 993
3,807
Energy Equipment & Services—0.5%ChampionX Corp.(1) 13,117 265DMC Global, Inc.(1) 358 14
Shares Value
Energy Equipment &Services—continuedLiberty Oilfield Services, Inc.
Class A(1) 63,773 $ 619
898
Entertainment—0.9%Liberty Media Corp-Liberty
Formula One Class A(1) 14,296 848Madison Square Garden
Sports Corp. Class A(1) 3,414 593Zynga, Inc. Class A(1) 24,935 160
1,601
Equity Real Estate Investment—3.5%Armada Hoffler Properties,
Inc. 36,600 557CareTrust REIT, Inc. 9,758 223First Industrial Realty Trust,
Inc. 8,084 535Industrial Logistics
Properties Trust 30,035 752Innovative Industrial
Properties, Inc. 442 116Physicians Realty Trust 25,808 486Piedmont Office Realty
Trust, Inc. Class A 38,279 704PS Business Parks, Inc. 12,200 2,247Terreno Realty Corp. 11,040 942
6,562
Food & Staples Retailing—1.0%Casey’s General Stores, Inc. 2,895 571Grocery Outlet Holding
Corp.(1) 2,466 70Ingles Markets, Inc. Class A 5,220 451PriceSmart, Inc. 4,302 315Sprouts Farmers Market,
Inc.(1) 5,560 165Weis Markets, Inc. 5,487 361
1,933
Food Products—3.5%Calavo Growers, Inc. 2,307 98Cal-Maine Foods, Inc. 16,321 604Flowers Foods, Inc. 30,661 842Hain Celestial Group, Inc.
(The)(1) 15,937 679Hostess Brands, Inc.(1) 44,764 914J & J Snack Foods Corp. 4,337 685John B Sanfilippo & Son,
Inc. 9,091 820Lancaster Colony Corp. 4,101 679Local Bounti Corp.(2)(3) 40,699 249S&W Seed Co.(1) 116,298 318Sanderson Farms, Inc. 2,184 417Tootsie Roll Industries, Inc. 4,133 150
6,455
Shares Value
Gas Utilities—0.4%ONE Gas, Inc. 8,753 $ 679
Healthcare Equipment &Supplies—4.4%Axogen, Inc.(1) 2,168 20Axonics, Inc.(1) 14,228 797BioLife Solutions, Inc.(1) 3,163 118Cerus Corp.(1) 8,688 59CONMED Corp. 12,168 1,725CryoLife, Inc.(1) 1,242 25CryoPort, Inc.(1) 2,543 151Envista Holdings Corp.(1) 9,420 424Establishment Labs
Holdings, Inc.(1) 10,866 734Globus Medical, Inc.
Class A(1) 11,146 805Inari Medical, Inc.(1) 8,841 807Integer Holdings Corp.(1) 10,852 929Lantheus Holdings, Inc.(1) 1,690 49Meridian Bioscience, Inc.(1) 9,085 185Mesa Laboratories, Inc. 251 82OrthoPediatrics Corp.(1) 1,707 102Senseonics Holdings, Inc.(1) 20,800 56Shockwave Medical, Inc.(1) 2,732 487SI-BONE, Inc.(1) 22,861 508Surmodics, Inc.(1) 1,081 52
8,115
Healthcare Providers &Services—2.4%Addus HomeCare Corp.(1) 871 82Apollo Medical Holdings,
Inc.(1) 1,000 74Castle Biosciences, Inc.(1) 871 37Chemed Corp. 1,218 644Encompass Health Corp. 5,285 345Ensign Group, Inc. (The) 3,353 282Joint Corp. (The)(1) 2,821 185ModivCare, Inc.(1) 562 83Ontrak, Inc.(1) 1,872 12R1 RCM, Inc.(1) 11,308 288RadNet, Inc.(1) 3,528 106Tenet Healthcare Corp.(1) 29,194 2,385
4,523
Healthcare Technology—0.4%Omnicell, Inc.(1) 3,842 693Vocera Communications,
Inc.(1) 1,626 106
799
Hotels, Restaurants & Leisure—2.8%Boyd Gaming Corp.(1) 12,520 821Everi Holdings, Inc.(1) 2,458 52Hyatt Hotels Corp. Class A(1) 2,106 202Kura Sushi USA, Inc.
Class A(1) 2,257 182Lindblad Expeditions
Holdings, Inc.(1) 56,213 877
ALLIANZGI SMALL-CAP FUNDSCHEDULE OF INVESTMENTS (Unaudited) (Continued)
DECEMBER 31, 2021
($ reported in thousands)
See Notes to Financial Statements
33
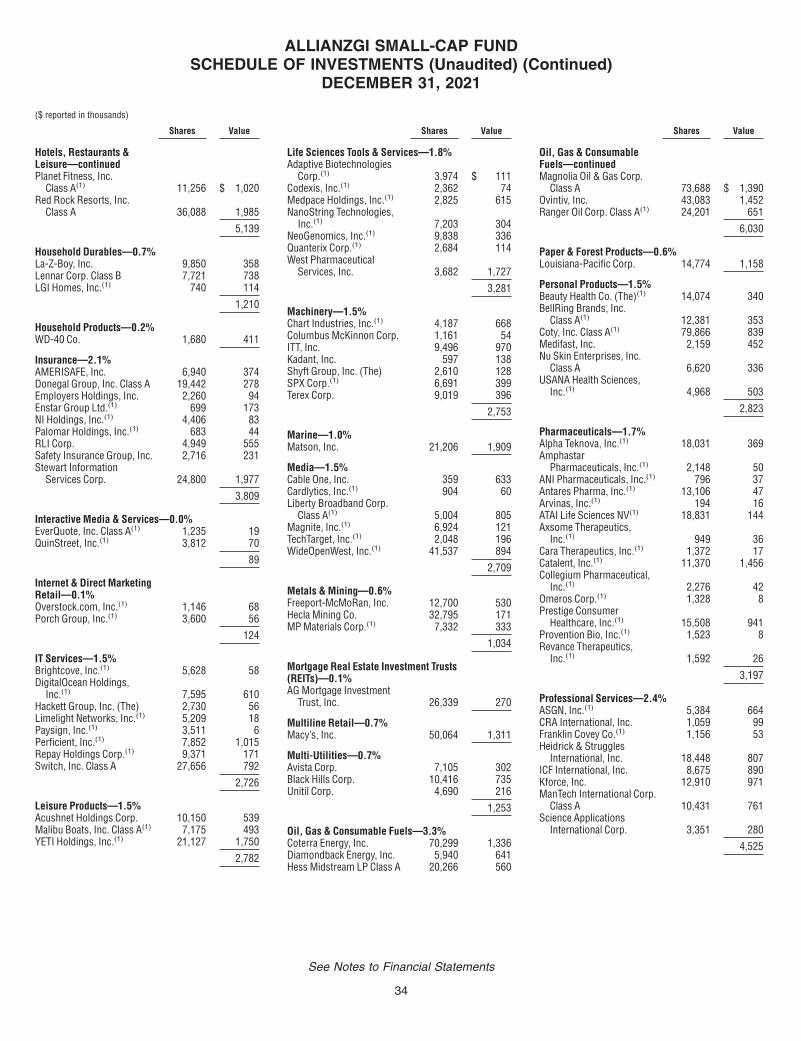
Shares Value
Hotels, Restaurants &Leisure—continuedPlanet Fitness, Inc.
Class A(1) 11,256 $ 1,020Red Rock Resorts, Inc.
Class A 36,088 1,985
5,139
Household Durables—0.7%La-Z-Boy, Inc. 9,850 358Lennar Corp. Class B 7,721 738LGI Homes, Inc.(1) 740 114
1,210
Household Products—0.2%WD-40 Co. 1,680 411
Insurance—2.1%AMERISAFE, Inc. 6,940 374Donegal Group, Inc. Class A 19,442 278Employers Holdings, Inc. 2,260 94Enstar Group Ltd.(1) 699 173NI Holdings, Inc.(1) 4,406 83Palomar Holdings, Inc.(1) 683 44RLI Corp. 4,949 555Safety Insurance Group, Inc. 2,716 231Stewart Information
Services Corp. 24,800 1,977
3,809
Interactive Media & Services—0.0%EverQuote, Inc. Class A(1) 1,235 19QuinStreet, Inc.(1) 3,812 70
89
Internet & Direct MarketingRetail—0.1%Overstock.com, Inc.(1) 1,146 68Porch Group, Inc.(1) 3,600 56
124
IT Services—1.5%Brightcove, Inc.(1) 5,628 58DigitalOcean Holdings,
Inc.(1) 7,595 610Hackett Group, Inc. (The) 2,730 56Limelight Networks, Inc.(1) 5,209 18Paysign, Inc.(1) 3,511 6Perficient, Inc.(1) 7,852 1,015Repay Holdings Corp.(1) 9,371 171Switch, Inc. Class A 27,656 792
2,726
Leisure Products—1.5%Acushnet Holdings Corp. 10,150 539Malibu Boats, Inc. Class A(1) 7,175 493YETI Holdings, Inc.(1) 21,127 1,750
2,782
Shares Value
Life Sciences Tools & Services—1.8%Adaptive Biotechnologies
Corp.(1) 3,974 $ 111Codexis, Inc.(1) 2,362 74Medpace Holdings, Inc.(1) 2,825 615NanoString Technologies,
Inc.(1) 7,203 304NeoGenomics, Inc.(1) 9,838 336Quanterix Corp.(1) 2,684 114West Pharmaceutical
Services, Inc. 3,682 1,727
3,281
Machinery—1.5%Chart Industries, Inc.(1) 4,187 668Columbus McKinnon Corp. 1,161 54ITT, Inc. 9,496 970Kadant, Inc. 597 138Shyft Group, Inc. (The) 2,610 128SPX Corp.(1) 6,691 399Terex Corp. 9,019 396
2,753
Marine—1.0%Matson, Inc. 21,206 1,909
Media—1.5%Cable One, Inc. 359 633Cardlytics, Inc.(1) 904 60Liberty Broadband Corp.
Class A(1) 5,004 805Magnite, Inc.(1) 6,924 121TechTarget, Inc.(1) 2,048 196WideOpenWest, Inc.(1) 41,537 894
2,709
Metals & Mining—0.6%Freeport-McMoRan, Inc. 12,700 530Hecla Mining Co. 32,795 171MP Materials Corp.(1) 7,332 333
1,034
Mortgage Real Estate Investment Trusts(REITs)—0.1%AG Mortgage Investment
Trust, Inc. 26,339 270
Multiline Retail—0.7%Macy’s, Inc. 50,064 1,311
Multi-Utilities—0.7%Avista Corp. 7,105 302Black Hills Corp. 10,416 735Unitil Corp. 4,690 216
1,253
Oil, Gas & Consumable Fuels—3.3%Coterra Energy, Inc. 70,299 1,336Diamondback Energy, Inc. 5,940 641Hess Midstream LP Class A 20,266 560
Shares Value
Oil, Gas & ConsumableFuels—continuedMagnolia Oil & Gas Corp.
Class A 73,688 $ 1,390Ovintiv, Inc. 43,083 1,452Ranger Oil Corp. Class A(1) 24,201 651
6,030
Paper & Forest Products—0.6%Louisiana-Pacific Corp. 14,774 1,158
Personal Products—1.5%Beauty Health Co. (The)(1) 14,074 340BellRing Brands, Inc.
Class A(1) 12,381 353Coty, Inc. Class A(1) 79,866 839Medifast, Inc. 2,159 452Nu Skin Enterprises, Inc.
Class A 6,620 336USANA Health Sciences,
Inc.(1) 4,968 503
2,823
Pharmaceuticals—1.7%Alpha Teknova, Inc.(1) 18,031 369Amphastar
Pharmaceuticals, Inc.(1) 2,148 50ANI Pharmaceuticals, Inc.(1) 796 37Antares Pharma, Inc.(1) 13,106 47Arvinas, Inc.(1) 194 16ATAI Life Sciences NV(1) 18,831 144Axsome Therapeutics,
Inc.(1) 949 36Cara Therapeutics, Inc.(1) 1,372 17Catalent, Inc.(1) 11,370 1,456Collegium Pharmaceutical,
Inc.(1) 2,276 42Omeros Corp.(1) 1,328 8Prestige Consumer
Healthcare, Inc.(1) 15,508 941Provention Bio, Inc.(1) 1,523 8Revance Therapeutics,
Inc.(1) 1,592 26
3,197
Professional Services—2.4%ASGN, Inc.(1) 5,384 664CRA International, Inc. 1,059 99Franklin Covey Co.(1) 1,156 53Heidrick & Struggles
International, Inc. 18,448 807ICF International, Inc. 8,675 890Kforce, Inc. 12,910 971ManTech International Corp.
Class A 10,431 761Science Applications
International Corp. 3,351 280
4,525
ALLIANZGI SMALL-CAP FUNDSCHEDULE OF INVESTMENTS (Unaudited) (Continued)
DECEMBER 31, 2021
($ reported in thousands)
See Notes to Financial Statements
34

Shares Value
Real Estate Management &Development—0.0%eXp World Holdings, Inc. 2,252 $ 76
Road & Rail—0.6%Saia, Inc.(1) 3,108 1,047
Semiconductors & SemiconductorEquipment—4.9%ACM Research, Inc.
Class A(1) 598 51Amkor Technology, Inc. 27,989 694Axcelis Technologies, Inc.(1) 2,001 149FormFactor, Inc.(1) 1,906 87Ichor Holdings Ltd.(1) 35,598 1,639Kulicke & Soffa Industries,
Inc. 22,749 1,377MACOM Technology
Solutions Holdings,Inc.(1) 14,719 1,153
MaxLinear, Inc.(1) 24,278 1,830Onto Innovation, Inc.(1) 6,248 632SunPower Corp.(1) 12,293 257Ultra Clean Holdings, Inc.(1) 19,631 1,126
8,995
Software—2.5%Agilysys, Inc.(1) 2,263 101Asana, Inc. Class A(1) 3,649 272Box, Inc. Class A(1) 19,785 518Cerence, Inc.(1) 4,582 351Digital Turbine, Inc.(1) 2,720 166Domo, Inc. Class B(1) 1,409 70LivePerson, Inc.(1) 1,331 48Marathon Digital Holdings,
Inc.(1) 3,573 117Model N, Inc.(1) 1,875 56OneSpan, Inc.(1) 621 10Paylocity Holding Corp.(1) 1,617 382PROS Holdings, Inc.(1) 496 17Riot Blockchain, Inc.(1) 1,957 44Sapiens International Corp.
N.V. 2,470 85Smartsheet, Inc. Class A(1) 11,712 907Tenable Holdings, Inc.(1) 6,940 382Upland Software, Inc.(1) 2,056 37Varonis Systems, Inc.(1) 15,705 766Workiva, Inc. Class A(1) 2,803 366
4,695
Specialty Retail—3.1%Asbury Automotive Group,
Inc.(1) 2,353 407Boot Barn Holdings, Inc.(1) 1,325 163Camping World Holdings,
Inc. Class A 16,176 654
Shares Value
Specialty Retail—continuedDick’s Sporting Goods, Inc. 8,408 $ 967Genesco, Inc.(1) 15,963 1,024Hibbett, Inc. 5,482 394Lithia Motors, Inc. 2,156 640Rent-A-Center, Inc. 9,038 434Shoe Carnival, Inc. 16,169 632TravelCenters of America,
Inc.(1) 6,546 338
5,653
Specialty Stores—0.3%National Vision Holdings,
Inc.(1) 11,254 540
Textiles, Apparel & LuxuryGoods—2.5%Capri Holdings Ltd.(1) 15,443 1,002Crocs, Inc.(1) 16,159 2,072Deckers Outdoor Corp.(1) 1,477 541Oxford Industries, Inc. 9,550 970
4,585
Thrifts & Mortgage Finance—1.3%Capitol Federal Financial,
Inc. 36,731 416Flagstar Bancorp, Inc. 24,624 1,180PCSB Financial Corp. 4,231 81Premier Financial Corp. 1,864 58Waterstone Financial, Inc. 30,426 665
2,400
Trading Companies &Distributors—3.2%Boise Cascade Co. 14,503 1,033GMS, Inc.(1) 26,154 1,572Rush Enterprises, Inc.
Class A 28,075 1,562WESCO International, Inc.(1) 13,604 1,790
5,957
Water Utilities—1.9%American States Water Co. 16,955 1,754Cadiz, Inc.(1) 20,539 79California Water Service
Group 13,410 963Middlesex Water Co. 531 64SJW Group 9,012 660
3,520
TOTAL COMMON STOCKS(Identified Cost $136,816) 180,161
Shares Value
MASTER LIMITED PARTNERSHIPS AND RELATEDCOMPANIES—0.2%
Downstream/Other—0.2%Enviva Partners LP 2,131 $ 150Sunoco LP 5,792 237
387
TOTAL MASTER LIMITEDPARTNERSHIPS AND RELATEDCOMPANIES(Identified Cost $219) 387
TOTAL LONG-TERMINVESTMENTS—97.6%(Identified Cost $137,035) 180,548
SHORT-TERM INVESTMENT—2.4%
Money Market Mutual Fund—2.4%Dreyfus Government Cash
Management Fund -Institutional Shares(seven-day effective yield0.030%)(4) 4,384,290 4,384
TOTAL SHORT-TERM INVESTMENT(Identified Cost $4,384) 4,384
TOTAL INVESTMENTS—100.0%(Identified Cost $141,419) $184,932Other assets and liabilities, net—(0.0)% (48)
NET ASSETS—100.0% $184,884
Abbreviations:LP Limited PartnershipREIT Real Estate Investment Trust
Footnote Legend:(1) Non-income producing.(2) The value of this security was determined using
significant unobservable inputs and is reported as aLevel 3 security in the Fair Value Hierarchy tablelocated after the Schedule of Investments.
(3) Security is restricted from resale.(4) Shares of this fund are publicly offered, and its
prospectus and annual report are publicly available.
ALLIANZGI SMALL-CAP FUNDSCHEDULE OF INVESTMENTS (Unaudited) (Continued)
DECEMBER 31, 2021
($ reported in thousands)
For information regarding the abbreviations, see the Key Investment Terms starting on page 6.
See Notes to Financial Statements
35
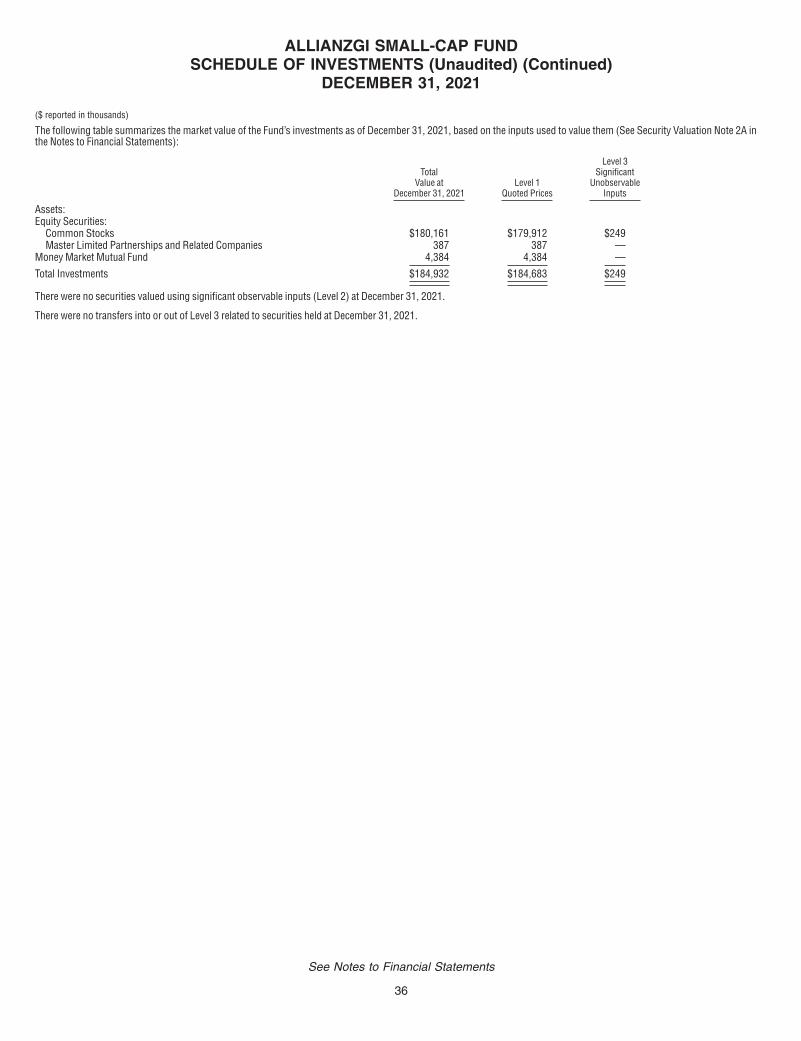
The following table summarizes the market value of the Fund’s investments as of December 31, 2021, based on the inputs used to value them (See Security Valuation Note 2A inthe Notes to Financial Statements):
TotalValue at
December 31, 2021Level 1
Quoted Prices
Level 3Significant
UnobservableInputs
Assets:Equity Securities:
Common Stocks $180,161 $179,912 $249Master Limited Partnerships and Related Companies 387 387 —
Money Market Mutual Fund 4,384 4,384 —
Total Investments $184,932 $184,683 $249
There were no securities valued using significant observable inputs (Level 2) at December 31, 2021.
There were no transfers into or out of Level 3 related to securities held at December 31, 2021.
ALLIANZGI SMALL-CAP FUNDSCHEDULE OF INVESTMENTS (Unaudited) (Continued)
DECEMBER 31, 2021
($ reported in thousands)
See Notes to Financial Statements
36
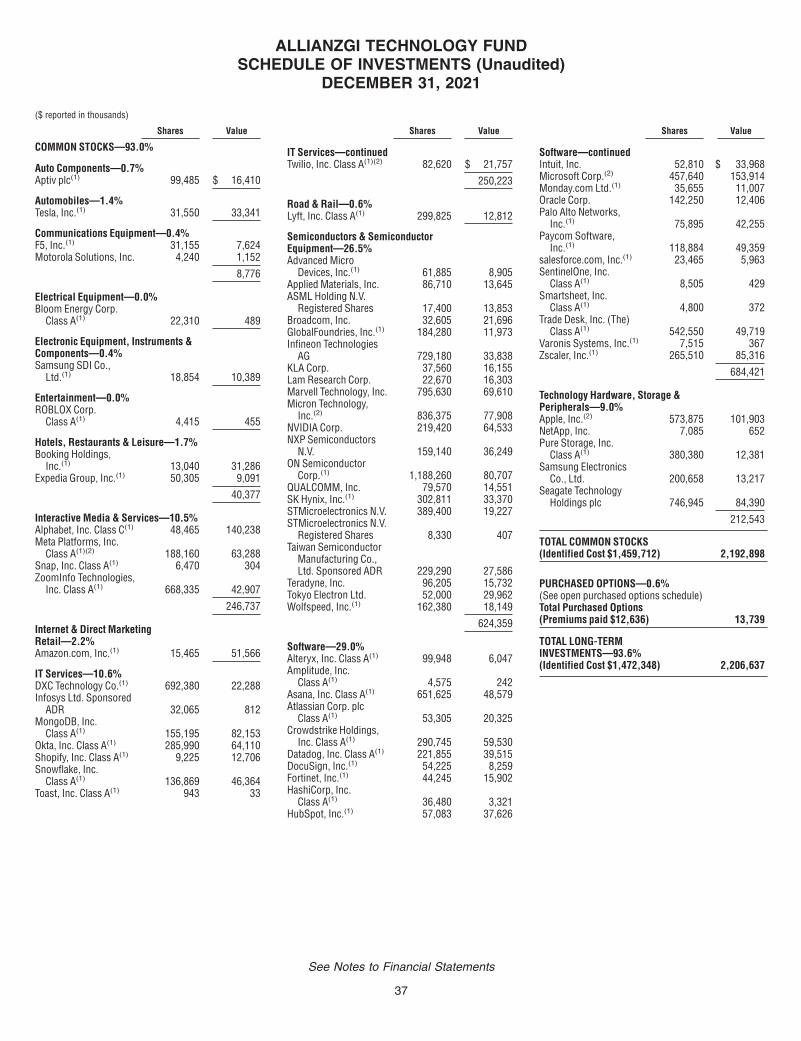
Shares Value
COMMON STOCKS—93.0%
Auto Components—0.7%Aptiv plc(1) 99,485 $ 16,410
Automobiles—1.4%Tesla, Inc.(1) 31,550 33,341
Communications Equipment—0.4%F5, Inc.(1) 31,155 7,624Motorola Solutions, Inc. 4,240 1,152
8,776
Electrical Equipment—0.0%Bloom Energy Corp.
Class A(1) 22,310 489
Electronic Equipment, Instruments &Components—0.4%Samsung SDI Co.,
Ltd.(1) 18,854 10,389
Entertainment—0.0%ROBLOX Corp.
Class A(1) 4,415 455
Hotels, Restaurants & Leisure—1.7%Booking Holdings,
Inc.(1) 13,040 31,286Expedia Group, Inc.(1) 50,305 9,091
40,377
Interactive Media & Services—10.5%Alphabet, Inc. Class C(1) 48,465 140,238Meta Platforms, Inc.
Class A(1)(2) 188,160 63,288Snap, Inc. Class A(1) 6,470 304ZoomInfo Technologies,
Inc. Class A(1) 668,335 42,907
246,737
Internet & Direct MarketingRetail—2.2%Amazon.com, Inc.(1) 15,465 51,566
IT Services—10.6%DXC Technology Co.(1) 692,380 22,288Infosys Ltd. Sponsored
ADR 32,065 812MongoDB, Inc.
Class A(1) 155,195 82,153Okta, Inc. Class A(1) 285,990 64,110Shopify, Inc. Class A(1) 9,225 12,706Snowflake, Inc.
Class A(1) 136,869 46,364Toast, Inc. Class A(1) 943 33
Shares Value
IT Services—continuedTwilio, Inc. Class A(1)(2) 82,620 $ 21,757
250,223
Road & Rail—0.6%Lyft, Inc. Class A(1) 299,825 12,812
Semiconductors & SemiconductorEquipment—26.5%Advanced Micro
Devices, Inc.(1) 61,885 8,905Applied Materials, Inc. 86,710 13,645ASML Holding N.V.
Registered Shares 17,400 13,853Broadcom, Inc. 32,605 21,696GlobalFoundries, Inc.(1) 184,280 11,973Infineon Technologies
AG 729,180 33,838KLA Corp. 37,560 16,155Lam Research Corp. 22,670 16,303Marvell Technology, Inc. 795,630 69,610Micron Technology,
Inc.(2) 836,375 77,908NVIDIA Corp. 219,420 64,533NXP Semiconductors
N.V. 159,140 36,249ON Semiconductor
Corp.(1) 1,188,260 80,707QUALCOMM, Inc. 79,570 14,551SK Hynix, Inc.(1) 302,811 33,370STMicroelectronics N.V. 389,400 19,227STMicroelectronics N.V.
Registered Shares 8,330 407Taiwan Semiconductor
Manufacturing Co.,Ltd. Sponsored ADR 229,290 27,586
Teradyne, Inc. 96,205 15,732Tokyo Electron Ltd. 52,000 29,962Wolfspeed, Inc.(1) 162,380 18,149
624,359
Software—29.0%Alteryx, Inc. Class A(1) 99,948 6,047Amplitude, Inc.
Class A(1) 4,575 242Asana, Inc. Class A(1) 651,625 48,579Atlassian Corp. plc
Class A(1) 53,305 20,325Crowdstrike Holdings,
Inc. Class A(1) 290,745 59,530Datadog, Inc. Class A(1) 221,855 39,515DocuSign, Inc.(1) 54,225 8,259Fortinet, Inc.(1) 44,245 15,902HashiCorp, Inc.
Class A(1) 36,480 3,321HubSpot, Inc.(1) 57,083 37,626
Shares Value
Software—continuedIntuit, Inc. 52,810 $ 33,968Microsoft Corp.(2) 457,640 153,914Monday.com Ltd.(1) 35,655 11,007Oracle Corp. 142,250 12,406Palo Alto Networks,
Inc.(1) 75,895 42,255Paycom Software,
Inc.(1) 118,884 49,359salesforce.com, Inc.(1) 23,465 5,963SentinelOne, Inc.
Class A(1) 8,505 429Smartsheet, Inc.
Class A(1) 4,800 372Trade Desk, Inc. (The)
Class A(1) 542,550 49,719Varonis Systems, Inc.(1) 7,515 367Zscaler, Inc.(1) 265,510 85,316
684,421
Technology Hardware, Storage &Peripherals—9.0%Apple, Inc.(2) 573,875 101,903NetApp, Inc. 7,085 652Pure Storage, Inc.
Class A(1) 380,380 12,381Samsung Electronics
Co., Ltd. 200,658 13,217Seagate Technology
Holdings plc 746,945 84,390
212,543
TOTAL COMMON STOCKS(Identified Cost $1,459,712) 2,192,898
PURCHASED OPTIONS—0.6%(See open purchased options schedule)Total Purchased Options(Premiums paid $12,636) 13,739
TOTAL LONG-TERMINVESTMENTS—93.6%(Identified Cost $1,472,348) 2,206,637
ALLIANZGI TECHNOLOGY FUNDSCHEDULE OF INVESTMENTS (Unaudited)
DECEMBER 31, 2021
($ reported in thousands)
See Notes to Financial Statements
37
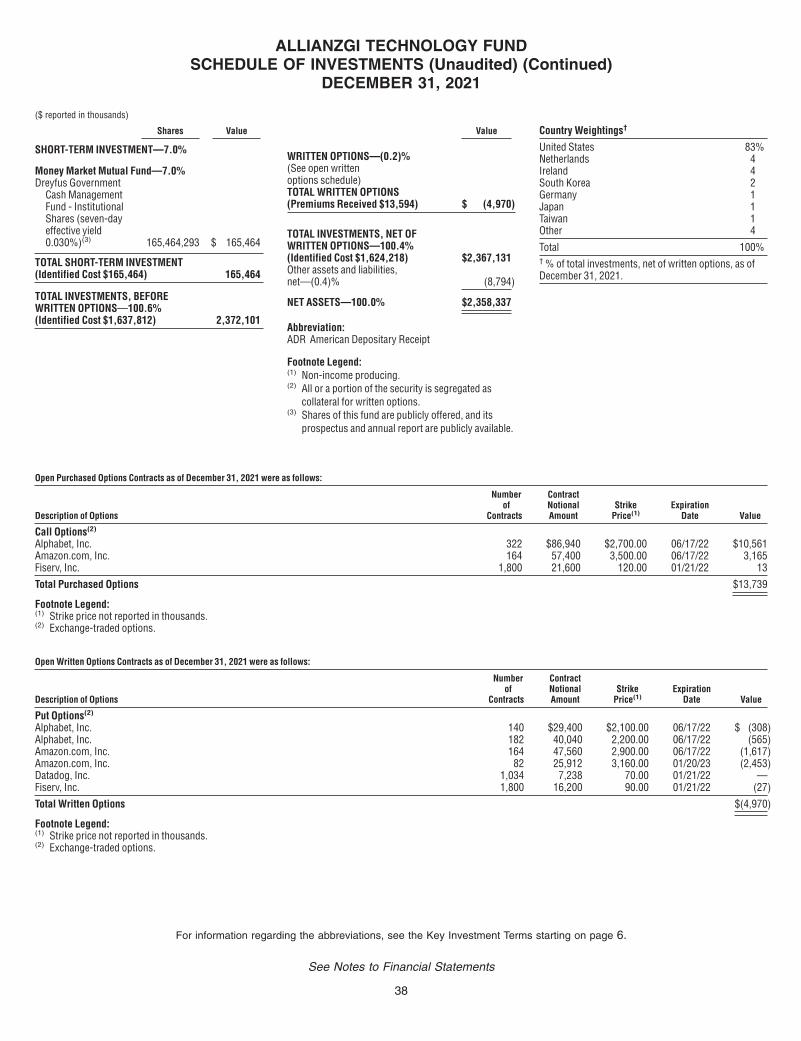
Shares Value
SHORT-TERM INVESTMENT—7.0%
Money Market Mutual Fund—7.0%Dreyfus Government
Cash ManagementFund - InstitutionalShares (seven-dayeffective yield0.030%)(3) 165,464,293 $ 165,464
TOTAL SHORT-TERM INVESTMENT(Identified Cost $165,464) 165,464
TOTAL INVESTMENTS, BEFOREWRITTEN OPTIONS—100.6%(Identified Cost $1,637,812) 2,372,101
Value
WRITTEN OPTIONS—(0.2)%(See open writtenoptions schedule)TOTAL WRITTEN OPTIONS(Premiums Received $13,594) $ (4,970)
TOTAL INVESTMENTS, NET OFWRITTEN OPTIONS—100.4%(Identified Cost $1,624,218) $2,367,131Other assets and liabilities,net—(0.4)% (8,794)
NET ASSETS—100.0% $2,358,337
Abbreviation:ADR American Depositary Receipt
Footnote Legend:(1) Non-income producing.(2) All or a portion of the security is segregated as
collateral for written options.(3) Shares of this fund are publicly offered, and its
prospectus and annual report are publicly available.
Country Weightings†
United States 83%Netherlands 4Ireland 4South Korea 2Germany 1Japan 1Taiwan 1Other 4
Total 100%† % of total investments, net of written options, as ofDecember 31, 2021.
Open Purchased Options Contracts as of December 31, 2021 were as follows:
Description of Options
Numberof
Contracts
ContractNotionalAmount
StrikePrice(1)
ExpirationDate Value
Call Options(2)
Alphabet, Inc. 322 $86,940 $2,700.00 06/17/22 $10,561Amazon.com, Inc. 164 57,400 3,500.00 06/17/22 3,165Fiserv, Inc. 1,800 21,600 120.00 01/21/22 13
Total Purchased Options $13,739
Footnote Legend:(1) Strike price not reported in thousands.(2) Exchange-traded options.
Open Written Options Contracts as of December 31, 2021 were as follows:
Description of Options
Numberof
Contracts
ContractNotionalAmount
StrikePrice(1)
ExpirationDate Value
Put Options(2)
Alphabet, Inc. 140 $29,400 $2,100.00 06/17/22 $ (308)Alphabet, Inc. 182 40,040 2,200.00 06/17/22 (565)Amazon.com, Inc. 164 47,560 2,900.00 06/17/22 (1,617)Amazon.com, Inc. 82 25,912 3,160.00 01/20/23 (2,453)Datadog, Inc. 1,034 7,238 70.00 01/21/22 —Fiserv, Inc. 1,800 16,200 90.00 01/21/22 (27)
Total Written Options $(4,970)
Footnote Legend:(1) Strike price not reported in thousands.(2) Exchange-traded options.
ALLIANZGI TECHNOLOGY FUNDSCHEDULE OF INVESTMENTS (Unaudited) (Continued)
DECEMBER 31, 2021
($ reported in thousands)
For information regarding the abbreviations, see the Key Investment Terms starting on page 6.
See Notes to Financial Statements
38
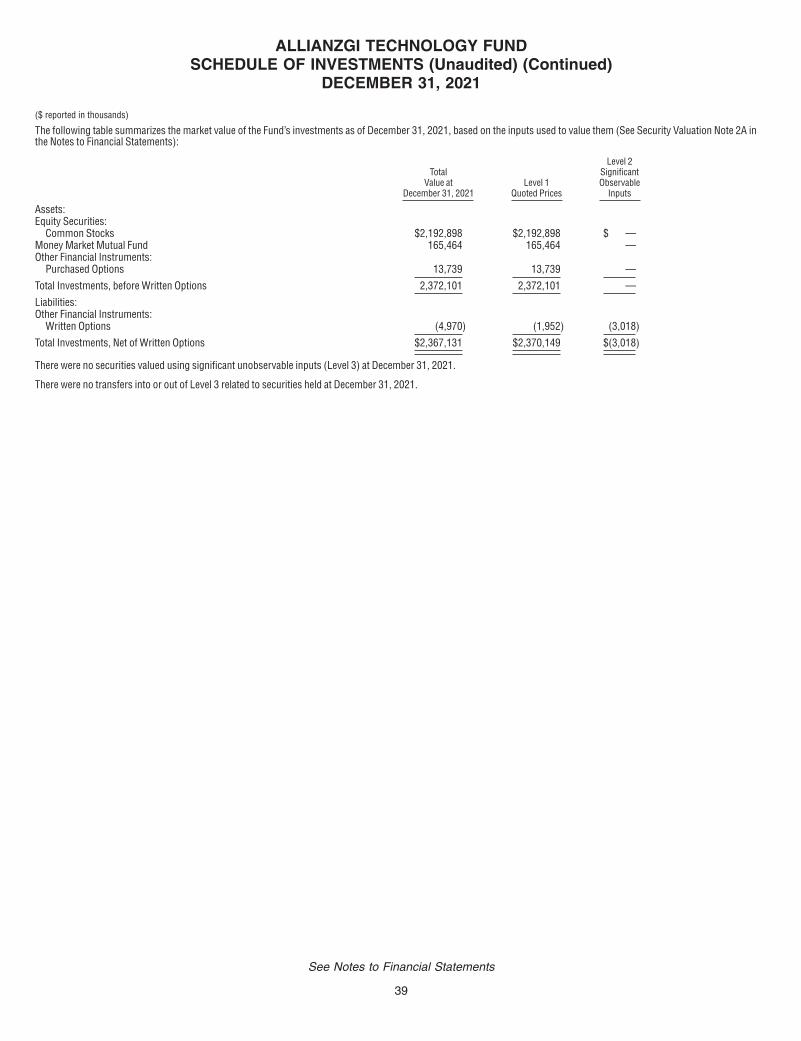
The following table summarizes the market value of the Fund’s investments as of December 31, 2021, based on the inputs used to value them (See Security Valuation Note 2A inthe Notes to Financial Statements):
TotalValue at
December 31, 2021Level 1
Quoted Prices
Level 2SignificantObservable
Inputs
Assets:Equity Securities:
Common Stocks $2,192,898 $2,192,898 $ —Money Market Mutual Fund 165,464 165,464 —Other Financial Instruments:
Purchased Options 13,739 13,739 —
Total Investments, before Written Options 2,372,101 2,372,101 —
Liabilities:Other Financial Instruments:
Written Options (4,970) (1,952) (3,018)
Total Investments, Net of Written Options $2,367,131 $2,370,149 $(3,018)
There were no securities valued using significant unobservable inputs (Level 3) at December 31, 2021.
There were no transfers into or out of Level 3 related to securities held at December 31, 2021.
ALLIANZGI TECHNOLOGY FUNDSCHEDULE OF INVESTMENTS (Unaudited) (Continued)
DECEMBER 31, 2021
($ reported in thousands)
See Notes to Financial Statements
39
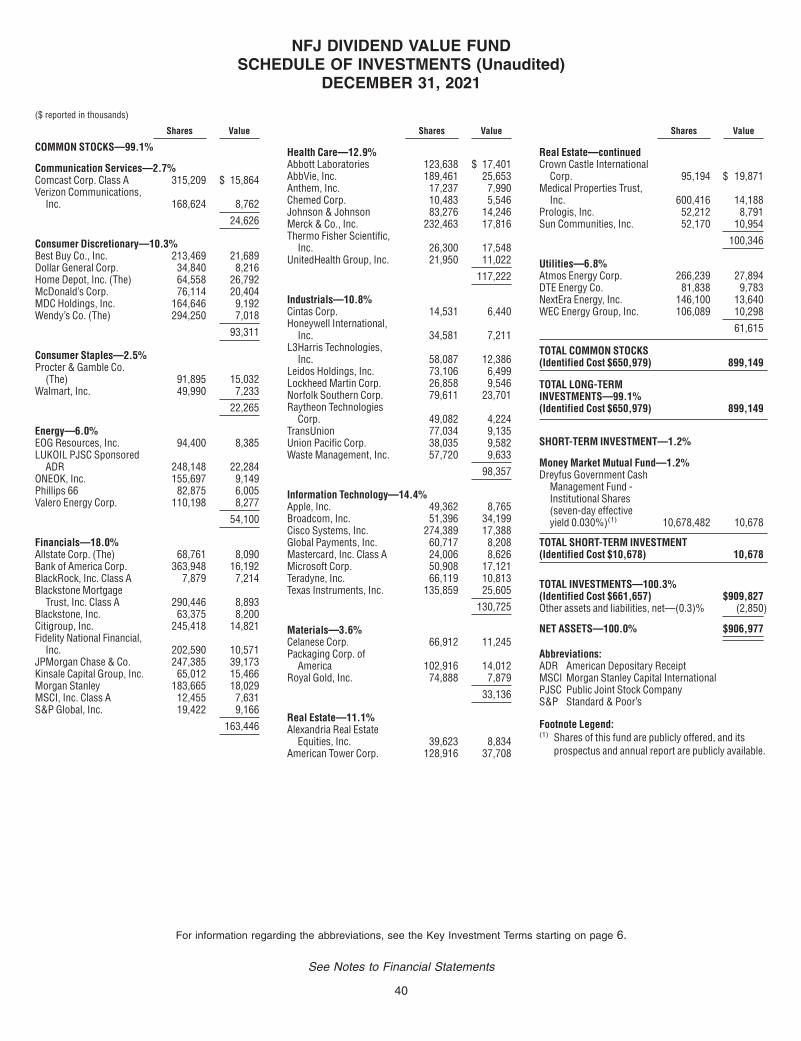
Shares Value
COMMON STOCKS—99.1%
Communication Services—2.7%Comcast Corp. Class A 315,209 $ 15,864Verizon Communications,
Inc. 168,624 8,762
24,626
Consumer Discretionary—10.3%Best Buy Co., Inc. 213,469 21,689Dollar General Corp. 34,840 8,216Home Depot, Inc. (The) 64,558 26,792McDonald’s Corp. 76,114 20,404MDC Holdings, Inc. 164,646 9,192Wendy’s Co. (The) 294,250 7,018
93,311
Consumer Staples—2.5%Procter & Gamble Co.
(The) 91,895 15,032Walmart, Inc. 49,990 7,233
22,265
Energy—6.0%EOG Resources, Inc. 94,400 8,385LUKOIL PJSC Sponsored
ADR 248,148 22,284ONEOK, Inc. 155,697 9,149Phillips 66 82,875 6,005Valero Energy Corp. 110,198 8,277
54,100
Financials—18.0%Allstate Corp. (The) 68,761 8,090Bank of America Corp. 363,948 16,192BlackRock, Inc. Class A 7,879 7,214Blackstone Mortgage
Trust, Inc. Class A 290,446 8,893Blackstone, Inc. 63,375 8,200Citigroup, Inc. 245,418 14,821Fidelity National Financial,
Inc. 202,590 10,571JPMorgan Chase & Co. 247,385 39,173Kinsale Capital Group, Inc. 65,012 15,466Morgan Stanley 183,665 18,029MSCI, Inc. Class A 12,455 7,631S&P Global, Inc. 19,422 9,166
163,446
Shares Value
Health Care—12.9%Abbott Laboratories 123,638 $ 17,401AbbVie, Inc. 189,461 25,653Anthem, Inc. 17,237 7,990Chemed Corp. 10,483 5,546Johnson & Johnson 83,276 14,246Merck & Co., Inc. 232,463 17,816Thermo Fisher Scientific,
Inc. 26,300 17,548UnitedHealth Group, Inc. 21,950 11,022
117,222
Industrials—10.8%Cintas Corp. 14,531 6,440Honeywell International,
Inc. 34,581 7,211L3Harris Technologies,
Inc. 58,087 12,386Leidos Holdings, Inc. 73,106 6,499Lockheed Martin Corp. 26,858 9,546Norfolk Southern Corp. 79,611 23,701Raytheon Technologies
Corp. 49,082 4,224TransUnion 77,034 9,135Union Pacific Corp. 38,035 9,582Waste Management, Inc. 57,720 9,633
98,357
Information Technology—14.4%Apple, Inc. 49,362 8,765Broadcom, Inc. 51,396 34,199Cisco Systems, Inc. 274,389 17,388Global Payments, Inc. 60,717 8,208Mastercard, Inc. Class A 24,006 8,626Microsoft Corp. 50,908 17,121Teradyne, Inc. 66,119 10,813Texas Instruments, Inc. 135,859 25,605
130,725
Materials—3.6%Celanese Corp. 66,912 11,245Packaging Corp. of
America 102,916 14,012Royal Gold, Inc. 74,888 7,879
33,136
Real Estate—11.1%Alexandria Real Estate
Equities, Inc. 39,623 8,834American Tower Corp. 128,916 37,708
Shares Value
Real Estate—continuedCrown Castle International
Corp. 95,194 $ 19,871Medical Properties Trust,
Inc. 600,416 14,188Prologis, Inc. 52,212 8,791Sun Communities, Inc. 52,170 10,954
100,346
Utilities—6.8%Atmos Energy Corp. 266,239 27,894DTE Energy Co. 81,838 9,783NextEra Energy, Inc. 146,100 13,640WEC Energy Group, Inc. 106,089 10,298
61,615
TOTAL COMMON STOCKS(Identified Cost $650,979) 899,149
TOTAL LONG-TERMINVESTMENTS—99.1%(Identified Cost $650,979) 899,149
SHORT-TERM INVESTMENT—1.2%
Money Market Mutual Fund—1.2%Dreyfus Government Cash
Management Fund -Institutional Shares(seven-day effectiveyield 0.030%)(1) 10,678,482 10,678
TOTAL SHORT-TERM INVESTMENT(Identified Cost $10,678) 10,678
TOTAL INVESTMENTS—100.3%(Identified Cost $661,657) $909,827Other assets and liabilities, net—(0.3)% (2,850)
NET ASSETS—100.0% $906,977
Abbreviations:ADR American Depositary ReceiptMSCI Morgan Stanley Capital InternationalPJSC Public Joint Stock CompanyS&P Standard & Poor’s
Footnote Legend:(1) Shares of this fund are publicly offered, and its
prospectus and annual report are publicly available.
NFJ DIVIDEND VALUE FUNDSCHEDULE OF INVESTMENTS (Unaudited)
DECEMBER 31, 2021
($ reported in thousands)
For information regarding the abbreviations, see the Key Investment Terms starting on page 6.
See Notes to Financial Statements
40
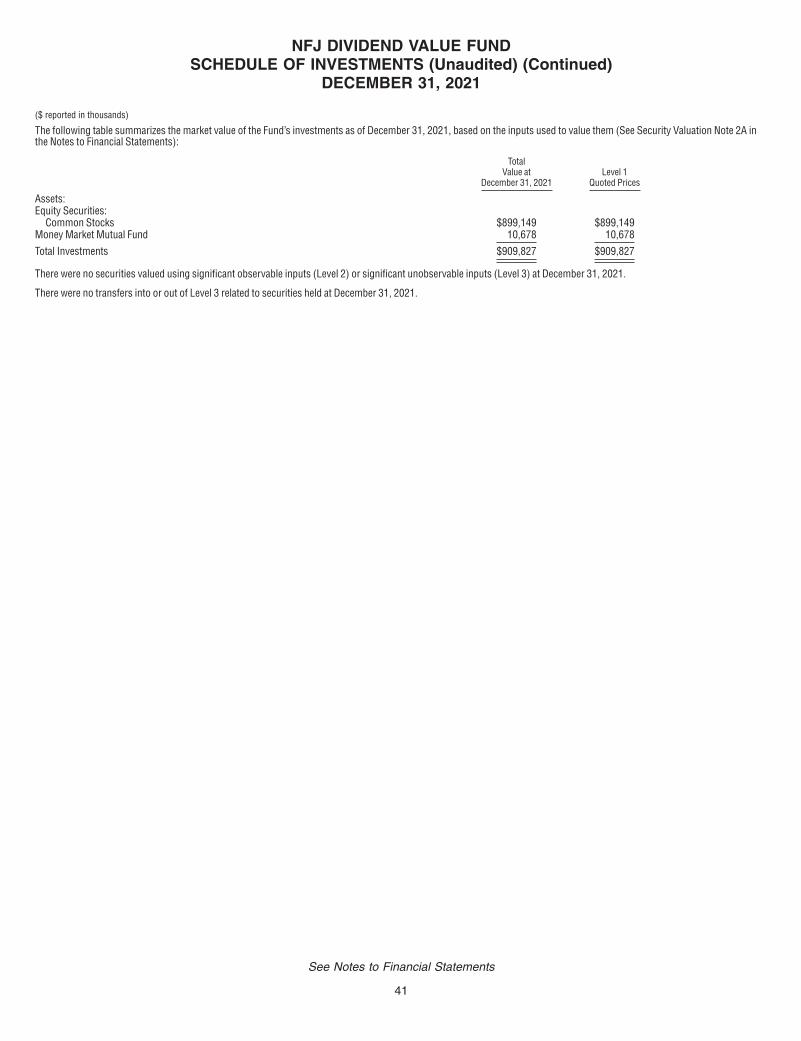
The following table summarizes the market value of the Fund’s investments as of December 31, 2021, based on the inputs used to value them (See Security Valuation Note 2A inthe Notes to Financial Statements):
TotalValue at
December 31, 2021Level 1
Quoted Prices
Assets:Equity Securities:
Common Stocks $899,149 $899,149Money Market Mutual Fund 10,678 10,678
Total Investments $909,827 $909,827
There were no securities valued using significant observable inputs (Level 2) or significant unobservable inputs (Level 3) at December 31, 2021.
There were no transfers into or out of Level 3 related to securities held at December 31, 2021.
NFJ DIVIDEND VALUE FUNDSCHEDULE OF INVESTMENTS (Unaudited) (Continued)
DECEMBER 31, 2021
($ reported in thousands)
See Notes to Financial Statements
41

Shares Value
PREFERRED STOCK—4.3%
South Korea—4.3%Samsung Electronics Co.,
Ltd., 2.180% 105,991 $ 6,348
TOTAL PREFERRED STOCK(Identified Cost $6,774) 6,348
COMMON STOCKS—94.8%
Australia—1.7%JB Hi-Fi Ltd. 49,632 1,745Macquarie Group Ltd. 4,834 722
2,467
Brazil—0.9%B3 S.A. - Brasil Bolsa Balcao 661,900 1,324
Canada—2.5%Canadian National Railway
Co. 5,941 730Cogeco Communications,
Inc. 12,650 1,007National Bank of Canada 17,204 1,312Royal Bank of Canada 5,374 570
3,619
China—16.9%Alibaba Group Holding
Ltd.(1) 181,400 2,766China Lesso Group
Holdings Ltd. 1,535,000 2,205China Merchants Bank Co.,
Ltd. Class A 761,300 5,818ENN Energy Holdings Ltd. 58,700 1,105Longfor Group Holdings
Ltd. 616,000 2,899Luxshare Precision Industry
Co., Ltd. Class A 682,475 5,269NetEase, Inc. 31,100 628Ping An Insurance Group
Co. of China Ltd. Class A 273,100 2,160Tencent Holdings Ltd. 33,300 1,951
24,801
Finland—2.5%Kesko Oyj Class B 87,806 2,933Valmet Oyj 16,902 726
3,659
France—7.5%BioMerieux 23,500 3,342BNP Paribas S.A. 32,370 2,240Kering S.A. 391 315L’Oreal S.A. 2,948 1,399
Shares Value
France—continuedSanofi 21,459 $ 2,164Schneider Electric SE 7,418 1,456
10,916
Germany—3.1%Muenchener
Rueckversicherungs-GesellschaftAG in MuenchenRegistered Shares 5,350 1,587
Vonovia SE 52,783 2,914
4,501
Hong Kong—1.7%AIA Group Ltd. 71,400 720Hong Kong Exchanges &
Clearing Ltd. 12,500 730Techtronic Industries Co.,
Ltd. 56,000 1,114
2,564
India—0.9%HDFC Bank Ltd. ADR 9,644 628Reliance Industries Ltd.
Sponsored GDR 144A(2) 10,837 693
1,321
Italy—1.7%Enel SpA 310,137 2,488
Japan—7.9%Advantest Corp. 7,700 730Disco Corp. 2,400 733ITOCHU Corp. 118,700 3,630KDDI Corp. 24,000 702Sony Group Corp. 17,300 2,177Tokio Marine Holdings, Inc. 13,300 739Tokyo Electron Ltd. 1,300 749Toyota Motor Corp. 118,400 2,167
11,627
Kazakhstan—0.5%Kaspi.KZ JSC GDR 5,962 692
Netherlands—0.5%Wolters Kluwer N.V. 6,291 742
Russia—4.1%LUKOIL PJSC Sponsored
ADR 66,588 5,980
Saudi Arabia—0.9%Saudi Arabian Oil Co. 138,137 1,317
Singapore—5.9%DBS Group Holdings Ltd. 122,800 2,976
Shares Value
Singapore—continuedMapletree Industrial Trust 2,835,500 $ 5,702
8,678
South Africa—2.6%Gold Fields Ltd. Sponsored
ADR 344,448 3,785
South Korea—2.0%Samsung Electronics Co.,
Ltd. 45,279 2,982
Spain—2.0%Iberdrola S.A. 248,534 2,946
Sweden—0.5%Swedish Match AB 91,361 728
Switzerland—5.1%Nestle S.A. Registered
Shares 5,174 724Roche Holding AG 1,748 727Swiss Life Holding AG
Registered Shares 2,641 1,620Zurich Insurance Group AG 9,918 4,358
7,429
Taiwan—7.0%E.Sun Financial Holding Co.,
Ltd. 695,778 706Micro-Star International
Co., Ltd. 454,000 2,634Taiwan Semiconductor
Manufacturing Co., Ltd. 268,000 5,957Vanguard International
Semiconductor Corp. 162,000 925
10,222
United Kingdom—7.8%3i Group plc 40,111 787BAE Systems plc 178,701 1,330London Stock Exchange
Group plc 43,928 4,120Rio Tinto plc 77,748 5,148
11,385
United States—8.6%American Tower Corp. 10,068 2,945Broadcom, Inc. 9,444 6,284Global Payments, Inc. 12,972 1,754
NFJ INTERNATIONAL VALUE FUNDSCHEDULE OF INVESTMENTS (Unaudited)
DECEMBER 31, 2021
($ reported in thousands)
See Notes to Financial Statements
42

Shares Value
United States—continuedTeradyne, Inc. 9,857 $ 1,612
12,595
TOTAL COMMON STOCKS(Identified Cost $120,284) 138,768
TOTAL LONG-TERMINVESTMENTS—99.1%(Identified Cost $127,058) 145,116
Shares Value
SHORT-TERM INVESTMENT—0.1%
Money Market Mutual Fund—0.1%Dreyfus Government Cash
Management Fund -Institutional Shares(seven-day effective yield0.030%)(3) 127,773 $ 128
TOTAL SHORT-TERM INVESTMENT(Identified Cost $128) 128
TOTAL INVESTMENTS—99.2%(Identified Cost $127,186) $145,244Other assets and liabilities, net—0.8% 1,118
NET ASSETS—100.0% $146,362
Abbreviations:ADR American Depositary ReceiptGDR Global Depositary ReceiptJSC Joint Stock CompanyPJSC Public Joint Stock Company
Footnote Legend:(1) Non-income producing.(2) Security exempt from registration under Rule 144A
of the Securities Act of 1933. These securities maybe resold in transactions exempt from registration,normally to qualified institutional buyers. AtDecember 31, 2021, these securities amounted to avalue of $693 or 0.5% of net assets.
(3) Shares of this fund are publicly offered, and itsprospectus and annual report are publicly available.
Country Weightings†
China 17%United States 9Japan 8United Kingdom 8France 8Taiwan 7South Korea 6Other 37
Total 100%† % of total investments as of December 31, 2021.
The following table summarizes the market value of the Fund’s investments as of December 31, 2021, based on the inputs used to value them (See Security Valuation Note 2A inthe Notes to Financial Statements):
TotalValue at
December 31, 2021Level 1
Quoted Prices
Assets:Equity Securities:
Common Stocks $138,768 $138,768Preferred Stock 6,348 6,348
Money Market Mutual Fund 128 128
Total Investments $145,244 $145,244
There were no securities valued using significant observable inputs (Level 2) or significant unobservable inputs (Level 3) at December 31, 2021.
There were no transfers into or out of Level 3 related to securities held at December 31, 2021.
NFJ INTERNATIONAL VALUE FUNDSCHEDULE OF INVESTMENTS (Unaudited) (Continued)
DECEMBER 31, 2021
($ reported in thousands)
For information regarding the abbreviations, see the Key Investment Terms starting on page 6.
See Notes to Financial Statements
43
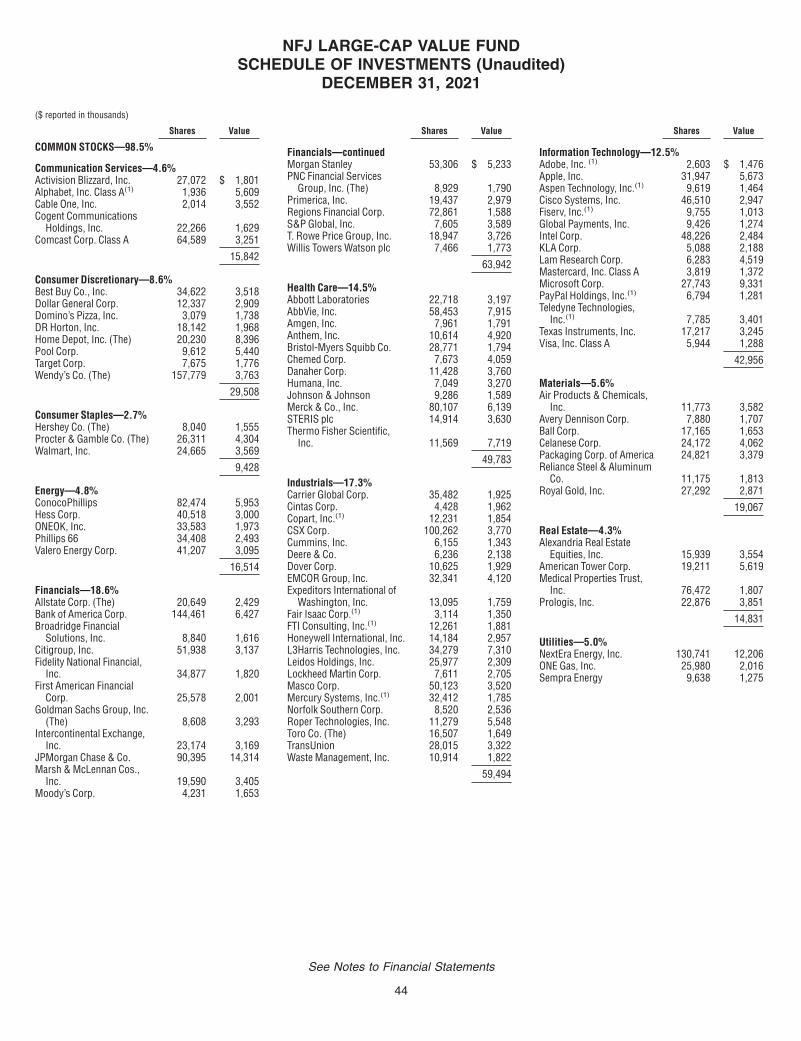
Shares Value
COMMON STOCKS—98.5%
Communication Services—4.6%Activision Blizzard, Inc. 27,072 $ 1,801Alphabet, Inc. Class A(1) 1,936 5,609Cable One, Inc. 2,014 3,552Cogent Communications
Holdings, Inc. 22,266 1,629Comcast Corp. Class A 64,589 3,251
15,842
Consumer Discretionary—8.6%Best Buy Co., Inc. 34,622 3,518Dollar General Corp. 12,337 2,909Domino’s Pizza, Inc. 3,079 1,738DR Horton, Inc. 18,142 1,968Home Depot, Inc. (The) 20,230 8,396Pool Corp. 9,612 5,440Target Corp. 7,675 1,776Wendy’s Co. (The) 157,779 3,763
29,508
Consumer Staples—2.7%Hershey Co. (The) 8,040 1,555Procter & Gamble Co. (The) 26,311 4,304Walmart, Inc. 24,665 3,569
9,428
Energy—4.8%ConocoPhillips 82,474 5,953Hess Corp. 40,518 3,000ONEOK, Inc. 33,583 1,973Phillips 66 34,408 2,493Valero Energy Corp. 41,207 3,095
16,514
Financials—18.6%Allstate Corp. (The) 20,649 2,429Bank of America Corp. 144,461 6,427Broadridge Financial
Solutions, Inc. 8,840 1,616Citigroup, Inc. 51,938 3,137Fidelity National Financial,
Inc. 34,877 1,820First American Financial
Corp. 25,578 2,001Goldman Sachs Group, Inc.
(The) 8,608 3,293Intercontinental Exchange,
Inc. 23,174 3,169JPMorgan Chase & Co. 90,395 14,314Marsh & McLennan Cos.,
Inc. 19,590 3,405Moody’s Corp. 4,231 1,653
Shares Value
Financials—continuedMorgan Stanley 53,306 $ 5,233PNC Financial Services
Group, Inc. (The) 8,929 1,790Primerica, Inc. 19,437 2,979Regions Financial Corp. 72,861 1,588S&P Global, Inc. 7,605 3,589T. Rowe Price Group, Inc. 18,947 3,726Willis Towers Watson plc 7,466 1,773
63,942
Health Care—14.5%Abbott Laboratories 22,718 3,197AbbVie, Inc. 58,453 7,915Amgen, Inc. 7,961 1,791Anthem, Inc. 10,614 4,920Bristol-Myers Squibb Co. 28,771 1,794Chemed Corp. 7,673 4,059Danaher Corp. 11,428 3,760Humana, Inc. 7,049 3,270Johnson & Johnson 9,286 1,589Merck & Co., Inc. 80,107 6,139STERIS plc 14,914 3,630Thermo Fisher Scientific,
Inc. 11,569 7,719
49,783
Industrials—17.3%Carrier Global Corp. 35,482 1,925Cintas Corp. 4,428 1,962Copart, Inc.(1) 12,231 1,854CSX Corp. 100,262 3,770Cummins, Inc. 6,155 1,343Deere & Co. 6,236 2,138Dover Corp. 10,625 1,929EMCOR Group, Inc. 32,341 4,120Expeditors International of
Washington, Inc. 13,095 1,759Fair Isaac Corp.(1) 3,114 1,350FTI Consulting, Inc.(1) 12,261 1,881Honeywell International, Inc. 14,184 2,957L3Harris Technologies, Inc. 34,279 7,310Leidos Holdings, Inc. 25,977 2,309Lockheed Martin Corp. 7,611 2,705Masco Corp. 50,123 3,520Mercury Systems, Inc.(1) 32,412 1,785Norfolk Southern Corp. 8,520 2,536Roper Technologies, Inc. 11,279 5,548Toro Co. (The) 16,507 1,649TransUnion 28,015 3,322Waste Management, Inc. 10,914 1,822
59,494
Shares Value
Information Technology—12.5%Adobe, Inc. (1) 2,603 $ 1,476Apple, Inc. 31,947 5,673Aspen Technology, Inc.(1) 9,619 1,464Cisco Systems, Inc. 46,510 2,947Fiserv, Inc.(1) 9,755 1,013Global Payments, Inc. 9,426 1,274Intel Corp. 48,226 2,484KLA Corp. 5,088 2,188Lam Research Corp. 6,283 4,519Mastercard, Inc. Class A 3,819 1,372Microsoft Corp. 27,743 9,331PayPal Holdings, Inc.(1) 6,794 1,281Teledyne Technologies,
Inc.(1) 7,785 3,401Texas Instruments, Inc. 17,217 3,245Visa, Inc. Class A 5,944 1,288
42,956
Materials—5.6%Air Products & Chemicals,
Inc. 11,773 3,582Avery Dennison Corp. 7,880 1,707Ball Corp. 17,165 1,653Celanese Corp. 24,172 4,062Packaging Corp. of America 24,821 3,379Reliance Steel & Aluminum
Co. 11,175 1,813Royal Gold, Inc. 27,292 2,871
19,067
Real Estate—4.3%Alexandria Real Estate
Equities, Inc. 15,939 3,554American Tower Corp. 19,211 5,619Medical Properties Trust,
Inc. 76,472 1,807Prologis, Inc. 22,876 3,851
14,831
Utilities—5.0%NextEra Energy, Inc. 130,741 12,206ONE Gas, Inc. 25,980 2,016Sempra Energy 9,638 1,275
NFJ LARGE-CAP VALUE FUNDSCHEDULE OF INVESTMENTS (Unaudited)
DECEMBER 31, 2021
($ reported in thousands)
See Notes to Financial Statements
44

Shares Value
Utilities—continuedWEC Energy Group, Inc. 17,008 $ 1,651
17,148
TOTAL COMMON STOCKS(Identified Cost $249,203) 338,513
TOTAL LONG-TERMINVESTMENTS—98.5%(Identified Cost $249,203) 338,513
Shares Value
SHORT-TERM INVESTMENT—1.5%
Money Market Mutual Fund—1.5%Dreyfus Government Cash
Management Fund -Institutional Shares(seven-day effective yield0.030%)(2) 4,992,326 $ 4,992
TOTAL SHORT-TERM INVESTMENT(Identified Cost $4,992) 4,992
TOTAL INVESTMENTS—100.0%(Identified Cost $254,195) $343,505Other assets and liabilities, net—0.0% 116
NET ASSETS—100.0% $343,621
Abbreviation:S&P Standard & Poor’s
Footnote Legend:(1) Non-income producing.(2) Shares of this fund are publicly offered, and its
prospectus and annual report are publicly available.
The following table summarizes the market value of the Fund’s investments as of December 31, 2021, based on the inputs used to value them (See Security Valuation Note 2A inthe Notes to Financial Statements):
TotalValue at
December 31, 2021Level 1
Quoted Prices
Assets:Equity Securities:
Common Stocks $338,513 $338,513Money Market Mutual Fund 4,992 4,992
Total Investments $343,505 $343,505
There were no securities valued using significant observable inputs (Level 2) or significant unobservable inputs (Level 3) at December 31, 2021.
There were no transfers into or out of Level 3 related to securities held at December 31, 2021.
NFJ LARGE-CAP VALUE FUNDSCHEDULE OF INVESTMENTS (Unaudited) (Continued)
DECEMBER 31, 2021
($ reported in thousands)
For information regarding the abbreviations, see the Key Investment Terms starting on page 6.
See Notes to Financial Statements
45
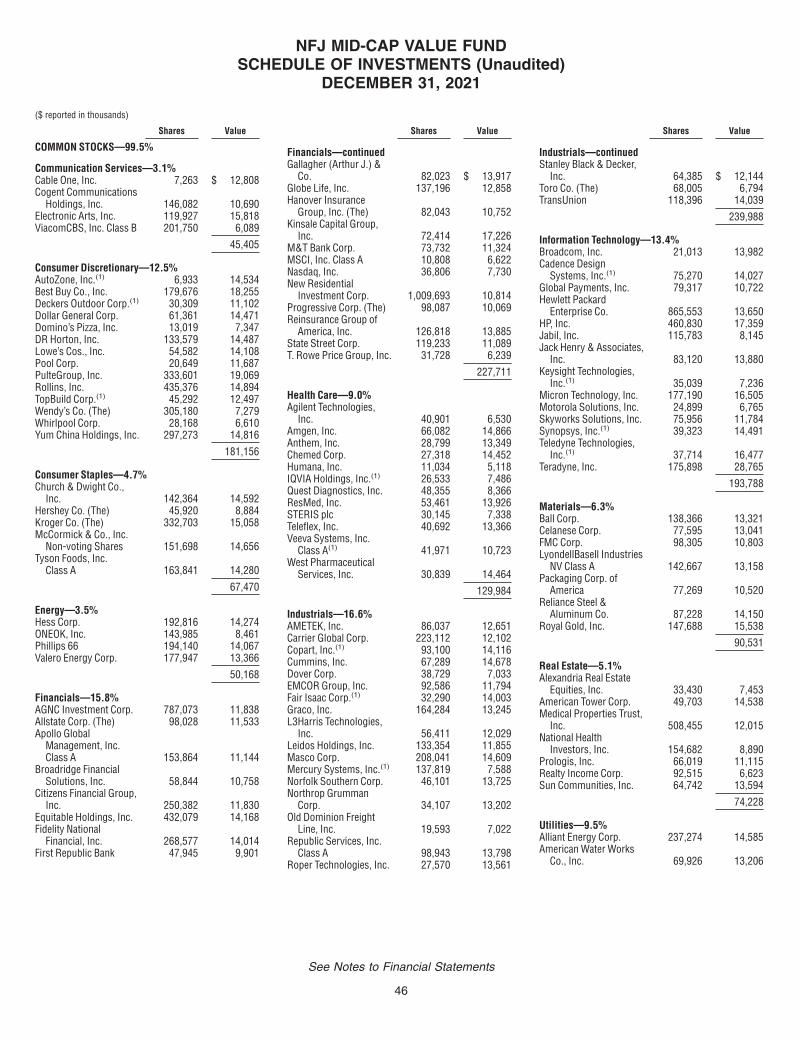
Shares Value
COMMON STOCKS—99.5%
Communication Services—3.1%Cable One, Inc. 7,263 $ 12,808Cogent Communications
Holdings, Inc. 146,082 10,690Electronic Arts, Inc. 119,927 15,818ViacomCBS, Inc. Class B 201,750 6,089
45,405
Consumer Discretionary—12.5%AutoZone, Inc.(1) 6,933 14,534Best Buy Co., Inc. 179,676 18,255Deckers Outdoor Corp.(1) 30,309 11,102Dollar General Corp. 61,361 14,471Domino’s Pizza, Inc. 13,019 7,347DR Horton, Inc. 133,579 14,487Lowe’s Cos., Inc. 54,582 14,108Pool Corp. 20,649 11,687PulteGroup, Inc. 333,601 19,069Rollins, Inc. 435,376 14,894TopBuild Corp.(1) 45,292 12,497Wendy’s Co. (The) 305,180 7,279Whirlpool Corp. 28,168 6,610Yum China Holdings, Inc. 297,273 14,816
181,156
Consumer Staples—4.7%Church & Dwight Co.,
Inc. 142,364 14,592Hershey Co. (The) 45,920 8,884Kroger Co. (The) 332,703 15,058McCormick & Co., Inc.
Non-voting Shares 151,698 14,656Tyson Foods, Inc.
Class A 163,841 14,280
67,470
Energy—3.5%Hess Corp. 192,816 14,274ONEOK, Inc. 143,985 8,461Phillips 66 194,140 14,067Valero Energy Corp. 177,947 13,366
50,168
Financials—15.8%AGNC Investment Corp. 787,073 11,838Allstate Corp. (The) 98,028 11,533Apollo Global
Management, Inc.Class A 153,864 11,144
Broadridge FinancialSolutions, Inc. 58,844 10,758
Citizens Financial Group,Inc. 250,382 11,830
Equitable Holdings, Inc. 432,079 14,168Fidelity National
Financial, Inc. 268,577 14,014First Republic Bank 47,945 9,901
Shares Value
Financials—continuedGallagher (Arthur J.) &
Co. 82,023 $ 13,917Globe Life, Inc. 137,196 12,858Hanover Insurance
Group, Inc. (The) 82,043 10,752Kinsale Capital Group,
Inc. 72,414 17,226M&T Bank Corp. 73,732 11,324MSCI, Inc. Class A 10,808 6,622Nasdaq, Inc. 36,806 7,730New Residential
Investment Corp. 1,009,693 10,814Progressive Corp. (The) 98,087 10,069Reinsurance Group of
America, Inc. 126,818 13,885State Street Corp. 119,233 11,089T. Rowe Price Group, Inc. 31,728 6,239
227,711
Health Care—9.0%Agilent Technologies,
Inc. 40,901 6,530Amgen, Inc. 66,082 14,866Anthem, Inc. 28,799 13,349Chemed Corp. 27,318 14,452Humana, Inc. 11,034 5,118IQVIA Holdings, Inc.(1) 26,533 7,486Quest Diagnostics, Inc. 48,355 8,366ResMed, Inc. 53,461 13,926STERIS plc 30,145 7,338Teleflex, Inc. 40,692 13,366Veeva Systems, Inc.
Class A(1) 41,971 10,723West Pharmaceutical
Services, Inc. 30,839 14,464
129,984
Industrials—16.6%AMETEK, Inc. 86,037 12,651Carrier Global Corp. 223,112 12,102Copart, Inc.(1) 93,100 14,116Cummins, Inc. 67,289 14,678Dover Corp. 38,729 7,033EMCOR Group, Inc. 92,586 11,794Fair Isaac Corp.(1) 32,290 14,003Graco, Inc. 164,284 13,245L3Harris Technologies,
Inc. 56,411 12,029Leidos Holdings, Inc. 133,354 11,855Masco Corp. 208,041 14,609Mercury Systems, Inc.(1) 137,819 7,588Norfolk Southern Corp. 46,101 13,725Northrop Grumman
Corp. 34,107 13,202Old Dominion Freight
Line, Inc. 19,593 7,022Republic Services, Inc.
Class A 98,943 13,798Roper Technologies, Inc. 27,570 13,561
Shares Value
Industrials—continuedStanley Black & Decker,
Inc. 64,385 $ 12,144Toro Co. (The) 68,005 6,794TransUnion 118,396 14,039
239,988
Information Technology—13.4%Broadcom, Inc. 21,013 13,982Cadence Design
Systems, Inc.(1) 75,270 14,027Global Payments, Inc. 79,317 10,722Hewlett Packard
Enterprise Co. 865,553 13,650HP, Inc. 460,830 17,359Jabil, Inc. 115,783 8,145Jack Henry & Associates,
Inc. 83,120 13,880Keysight Technologies,
Inc.(1) 35,039 7,236Micron Technology, Inc. 177,190 16,505Motorola Solutions, Inc. 24,899 6,765Skyworks Solutions, Inc. 75,956 11,784Synopsys, Inc.(1) 39,323 14,491Teledyne Technologies,
Inc.(1) 37,714 16,477Teradyne, Inc. 175,898 28,765
193,788
Materials—6.3%Ball Corp. 138,366 13,321Celanese Corp. 77,595 13,041FMC Corp. 98,305 10,803LyondellBasell Industries
NV Class A 142,667 13,158Packaging Corp. of
America 77,269 10,520Reliance Steel &
Aluminum Co. 87,228 14,150Royal Gold, Inc. 147,688 15,538
90,531
Real Estate—5.1%Alexandria Real Estate
Equities, Inc. 33,430 7,453American Tower Corp. 49,703 14,538Medical Properties Trust,
Inc. 508,455 12,015National Health
Investors, Inc. 154,682 8,890Prologis, Inc. 66,019 11,115Realty Income Corp. 92,515 6,623Sun Communities, Inc. 64,742 13,594
74,228
Utilities—9.5%Alliant Energy Corp. 237,274 14,585American Water Works
Co., Inc. 69,926 13,206
NFJ MID-CAP VALUE FUNDSCHEDULE OF INVESTMENTS (Unaudited)
DECEMBER 31, 2021
($ reported in thousands)
See Notes to Financial Statements
46

Shares Value
Utilities—continuedAtmos Energy Corp. 209,180 $ 21,916DTE Energy Co. 69,629 8,323Eversource Energy 179,517 16,333ONE Gas, Inc. 124,325 9,646Sempra Energy 106,319 14,064WEC Energy Group, Inc. 187,779 18,228Xcel Energy, Inc. 312,998 21,190
137,491
TOTAL COMMON STOCKS(Identified Cost $1,113,219) 1,437,920
TOTAL LONG-TERMINVESTMENTS—99.5%(Identified Cost $1,113,219) 1,437,920
Shares Value
SHORT-TERM INVESTMENT—0.7%
Money Market Mutual Fund—0.7%Dreyfus Government
Cash ManagementFund - InstitutionalShares (seven-dayeffective yield0.030%)(2) 10,031,698 $ 10,032
TOTAL SHORT-TERM INVESTMENT(Identified Cost $10,032) 10,032
TOTAL INVESTMENTS—100.2%(Identified Cost $1,123,251) $1,447,952Other assets and liabilities,net—(0.2)% (2,222)
NET ASSETS—100.0% $1,445,730
Abbreviation:MSCI Morgan Stanley Capital International
Footnote Legend:(1) Non-income producing.(2) Shares of this fund are publicly offered, and its
prospectus and annual report are publicly available.
The following table summarizes the market value of the Fund’s investments as of December 31, 2021, based on the inputs used to value them (See Security Valuation Note 2A inthe Notes to Financial Statements):
TotalValue at
December 31, 2021Level 1
Quoted Prices
Assets:Equity Securities:
Common Stocks $1,437,920 $1,437,920Money Market Mutual Fund 10,032 10,032
Total Investments $1,447,952 $1,447,952
There were no securities valued using significant observable inputs (Level 2) or significant unobservable inputs (Level 3) at December 31, 2021.
There were no transfers into or out of Level 3 related to securities held at December 31, 2021.
NFJ MID-CAP VALUE FUNDSCHEDULE OF INVESTMENTS (Unaudited) (Continued)
DECEMBER 31, 2021
($ reported in thousands)
For information regarding the abbreviations, see the Key Investment Terms starting on page 6.
See Notes to Financial Statements
47
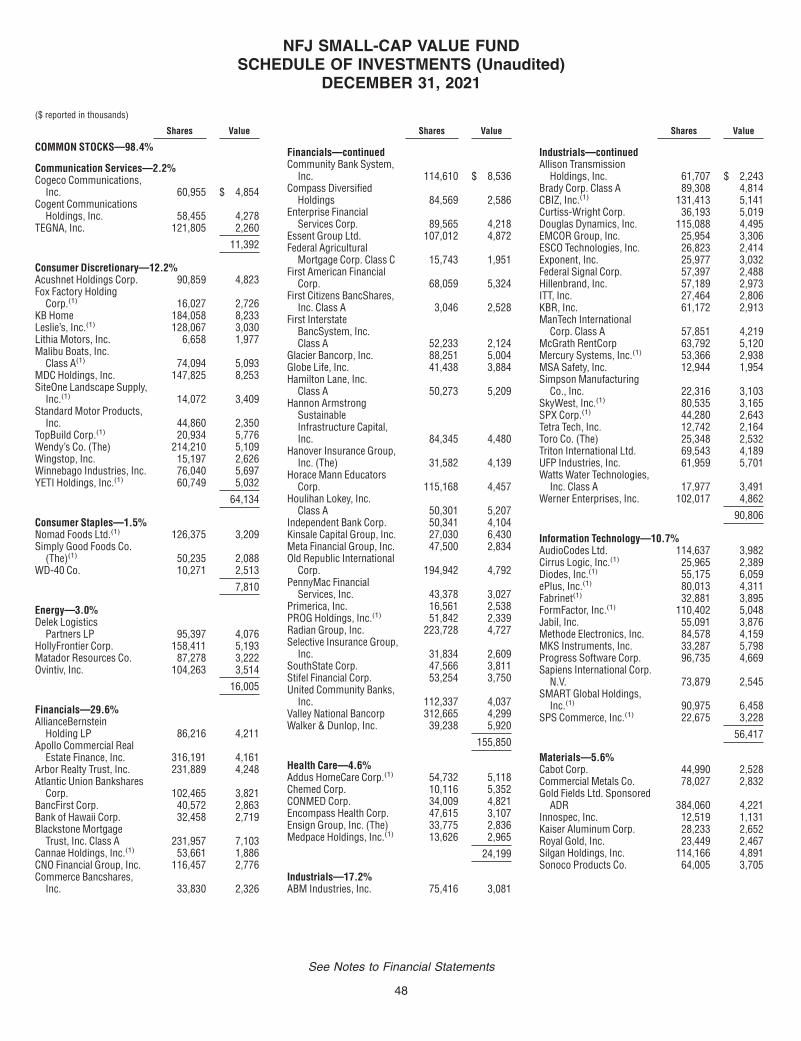
Shares Value
COMMON STOCKS—98.4%
Communication Services—2.2%Cogeco Communications,
Inc. 60,955 $ 4,854Cogent Communications
Holdings, Inc. 58,455 4,278TEGNA, Inc. 121,805 2,260
11,392
Consumer Discretionary—12.2%Acushnet Holdings Corp. 90,859 4,823Fox Factory Holding
Corp.(1) 16,027 2,726KB Home 184,058 8,233Leslie’s, Inc.(1) 128,067 3,030Lithia Motors, Inc. 6,658 1,977Malibu Boats, Inc.
Class A(1) 74,094 5,093MDC Holdings, Inc. 147,825 8,253SiteOne Landscape Supply,
Inc.(1) 14,072 3,409Standard Motor Products,
Inc. 44,860 2,350TopBuild Corp.(1) 20,934 5,776Wendy’s Co. (The) 214,210 5,109Wingstop, Inc. 15,197 2,626Winnebago Industries, Inc. 76,040 5,697YETI Holdings, Inc.(1) 60,749 5,032
64,134
Consumer Staples—1.5%Nomad Foods Ltd.(1) 126,375 3,209Simply Good Foods Co.
(The)(1) 50,235 2,088WD-40 Co. 10,271 2,513
7,810
Energy—3.0%Delek Logistics
Partners LP 95,397 4,076HollyFrontier Corp. 158,411 5,193Matador Resources Co. 87,278 3,222Ovintiv, Inc. 104,263 3,514
16,005
Financials—29.6%AllianceBernstein
Holding LP 86,216 4,211Apollo Commercial Real
Estate Finance, Inc. 316,191 4,161Arbor Realty Trust, Inc. 231,889 4,248Atlantic Union Bankshares
Corp. 102,465 3,821BancFirst Corp. 40,572 2,863Bank of Hawaii Corp. 32,458 2,719Blackstone Mortgage
Trust, Inc. Class A 231,957 7,103Cannae Holdings, Inc.(1) 53,661 1,886CNO Financial Group, Inc. 116,457 2,776Commerce Bancshares,
Inc. 33,830 2,326
Shares Value
Financials—continuedCommunity Bank System,
Inc. 114,610 $ 8,536Compass Diversified
Holdings 84,569 2,586Enterprise Financial
Services Corp. 89,565 4,218Essent Group Ltd. 107,012 4,872Federal Agricultural
Mortgage Corp. Class C 15,743 1,951First American Financial
Corp. 68,059 5,324First Citizens BancShares,
Inc. Class A 3,046 2,528First Interstate
BancSystem, Inc.Class A 52,233 2,124
Glacier Bancorp, Inc. 88,251 5,004Globe Life, Inc. 41,438 3,884Hamilton Lane, Inc.
Class A 50,273 5,209Hannon Armstrong
SustainableInfrastructure Capital,Inc. 84,345 4,480
Hanover Insurance Group,Inc. (The) 31,582 4,139
Horace Mann EducatorsCorp. 115,168 4,457
Houlihan Lokey, Inc.Class A 50,301 5,207
Independent Bank Corp. 50,341 4,104Kinsale Capital Group, Inc. 27,030 6,430Meta Financial Group, Inc. 47,500 2,834Old Republic International
Corp. 194,942 4,792PennyMac Financial
Services, Inc. 43,378 3,027Primerica, Inc. 16,561 2,538PROG Holdings, Inc.(1) 51,842 2,339Radian Group, Inc. 223,728 4,727Selective Insurance Group,
Inc. 31,834 2,609SouthState Corp. 47,566 3,811Stifel Financial Corp. 53,254 3,750United Community Banks,
Inc. 112,337 4,037Valley National Bancorp 312,665 4,299Walker & Dunlop, Inc. 39,238 5,920
155,850
Health Care—4.6%Addus HomeCare Corp.(1) 54,732 5,118Chemed Corp. 10,116 5,352CONMED Corp. 34,009 4,821Encompass Health Corp. 47,615 3,107Ensign Group, Inc. (The) 33,775 2,836Medpace Holdings, Inc.(1) 13,626 2,965
24,199
Industrials—17.2%ABM Industries, Inc. 75,416 3,081
Shares Value
Industrials—continuedAllison Transmission
Holdings, Inc. 61,707 $ 2,243Brady Corp. Class A 89,308 4,814CBIZ, Inc.(1) 131,413 5,141Curtiss-Wright Corp. 36,193 5,019Douglas Dynamics, Inc. 115,088 4,495EMCOR Group, Inc. 25,954 3,306ESCO Technologies, Inc. 26,823 2,414Exponent, Inc. 25,977 3,032Federal Signal Corp. 57,397 2,488Hillenbrand, Inc. 57,189 2,973ITT, Inc. 27,464 2,806KBR, Inc. 61,172 2,913ManTech International
Corp. Class A 57,851 4,219McGrath RentCorp 63,792 5,120Mercury Systems, Inc.(1) 53,366 2,938MSA Safety, Inc. 12,944 1,954Simpson Manufacturing
Co., Inc. 22,316 3,103SkyWest, Inc.(1) 80,535 3,165SPX Corp.(1) 44,280 2,643Tetra Tech, Inc. 12,742 2,164Toro Co. (The) 25,348 2,532Triton International Ltd. 69,543 4,189UFP Industries, Inc. 61,959 5,701Watts Water Technologies,
Inc. Class A 17,977 3,491Werner Enterprises, Inc. 102,017 4,862
90,806
Information Technology—10.7%AudioCodes Ltd. 114,637 3,982Cirrus Logic, Inc.(1) 25,965 2,389Diodes, Inc.(1) 55,175 6,059ePlus, Inc.(1) 80,013 4,311Fabrinet(1) 32,881 3,895FormFactor, Inc.(1) 110,402 5,048Jabil, Inc. 55,091 3,876Methode Electronics, Inc. 84,578 4,159MKS Instruments, Inc. 33,287 5,798Progress Software Corp. 96,735 4,669Sapiens International Corp.
N.V. 73,879 2,545SMART Global Holdings,
Inc.(1) 90,975 6,458SPS Commerce, Inc.(1) 22,675 3,228
56,417
Materials—5.6%Cabot Corp. 44,990 2,528Commercial Metals Co. 78,027 2,832Gold Fields Ltd. Sponsored
ADR 384,060 4,221Innospec, Inc. 12,519 1,131Kaiser Aluminum Corp. 28,233 2,652Royal Gold, Inc. 23,449 2,467Silgan Holdings, Inc. 114,166 4,891Sonoco Products Co. 64,005 3,705
NFJ SMALL-CAP VALUE FUNDSCHEDULE OF INVESTMENTS (Unaudited)
DECEMBER 31, 2021
($ reported in thousands)
See Notes to Financial Statements
48
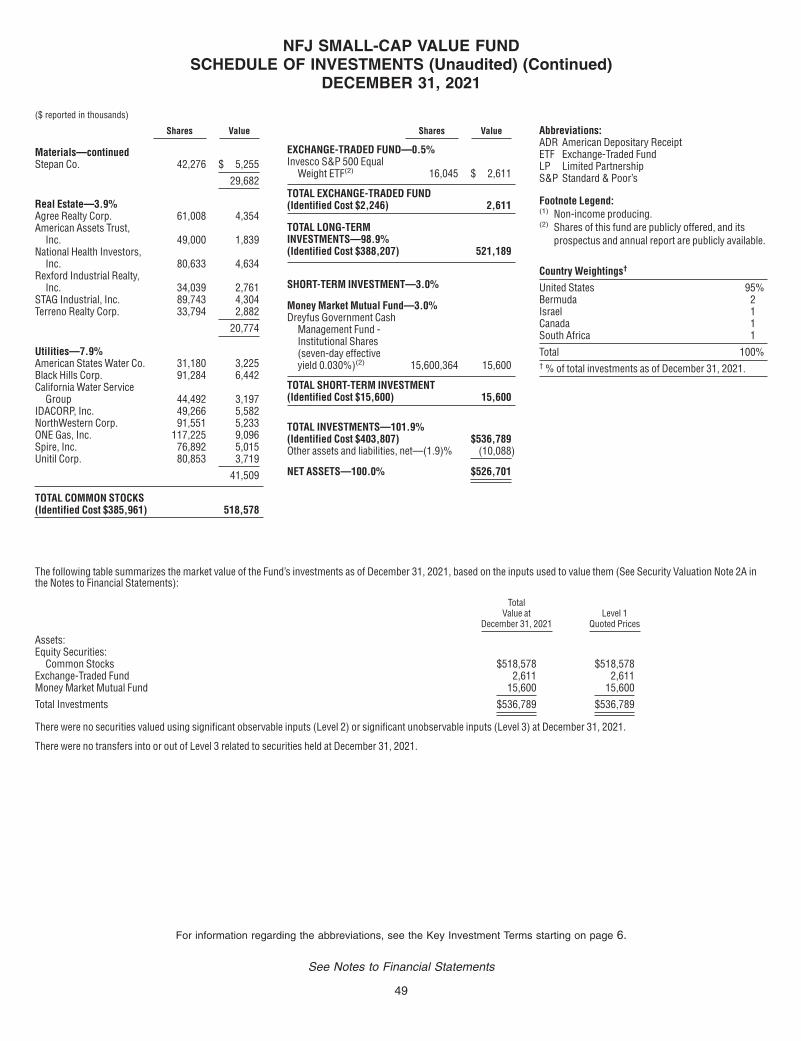
Shares Value
Materials—continuedStepan Co. 42,276 $ 5,255
29,682
Real Estate—3.9%Agree Realty Corp. 61,008 4,354American Assets Trust,
Inc. 49,000 1,839National Health Investors,
Inc. 80,633 4,634Rexford Industrial Realty,
Inc. 34,039 2,761STAG Industrial, Inc. 89,743 4,304Terreno Realty Corp. 33,794 2,882
20,774
Utilities—7.9%American States Water Co. 31,180 3,225Black Hills Corp. 91,284 6,442California Water Service
Group 44,492 3,197IDACORP, Inc. 49,266 5,582NorthWestern Corp. 91,551 5,233ONE Gas, Inc. 117,225 9,096Spire, Inc. 76,892 5,015Unitil Corp. 80,853 3,719
41,509
TOTAL COMMON STOCKS(Identified Cost $385,961) 518,578
Shares Value
EXCHANGE-TRADED FUND—0.5%Invesco S&P 500 Equal
Weight ETF(2) 16,045 $ 2,611
TOTAL EXCHANGE-TRADED FUND(Identified Cost $2,246) 2,611
TOTAL LONG-TERMINVESTMENTS—98.9%(Identified Cost $388,207) 521,189
SHORT-TERM INVESTMENT—3.0%
Money Market Mutual Fund—3.0%Dreyfus Government Cash
Management Fund -Institutional Shares(seven-day effectiveyield 0.030%)(2) 15,600,364 15,600
TOTAL SHORT-TERM INVESTMENT(Identified Cost $15,600) 15,600
TOTAL INVESTMENTS—101.9%(Identified Cost $403,807) $536,789Other assets and liabilities, net—(1.9)% (10,088)
NET ASSETS—100.0% $526,701
Abbreviations:ADR American Depositary ReceiptETF Exchange-Traded FundLP Limited PartnershipS&P Standard & Poor’s
Footnote Legend:(1) Non-income producing.(2) Shares of this fund are publicly offered, and its
prospectus and annual report are publicly available.
Country Weightings†
United States 95%Bermuda 2Israel 1Canada 1South Africa 1
Total 100%† % of total investments as of December 31, 2021.
The following table summarizes the market value of the Fund’s investments as of December 31, 2021, based on the inputs used to value them (See Security Valuation Note 2A inthe Notes to Financial Statements):
TotalValue at
December 31, 2021Level 1
Quoted Prices
Assets:Equity Securities:
Common Stocks $518,578 $518,578Exchange-Traded Fund 2,611 2,611Money Market Mutual Fund 15,600 15,600
Total Investments $536,789 $536,789
There were no securities valued using significant observable inputs (Level 2) or significant unobservable inputs (Level 3) at December 31, 2021.
There were no transfers into or out of Level 3 related to securities held at December 31, 2021.
NFJ SMALL-CAP VALUE FUNDSCHEDULE OF INVESTMENTS (Unaudited) (Continued)
DECEMBER 31, 2021
($ reported in thousands)
For information regarding the abbreviations, see the Key Investment Terms starting on page 6.
See Notes to Financial Statements
49
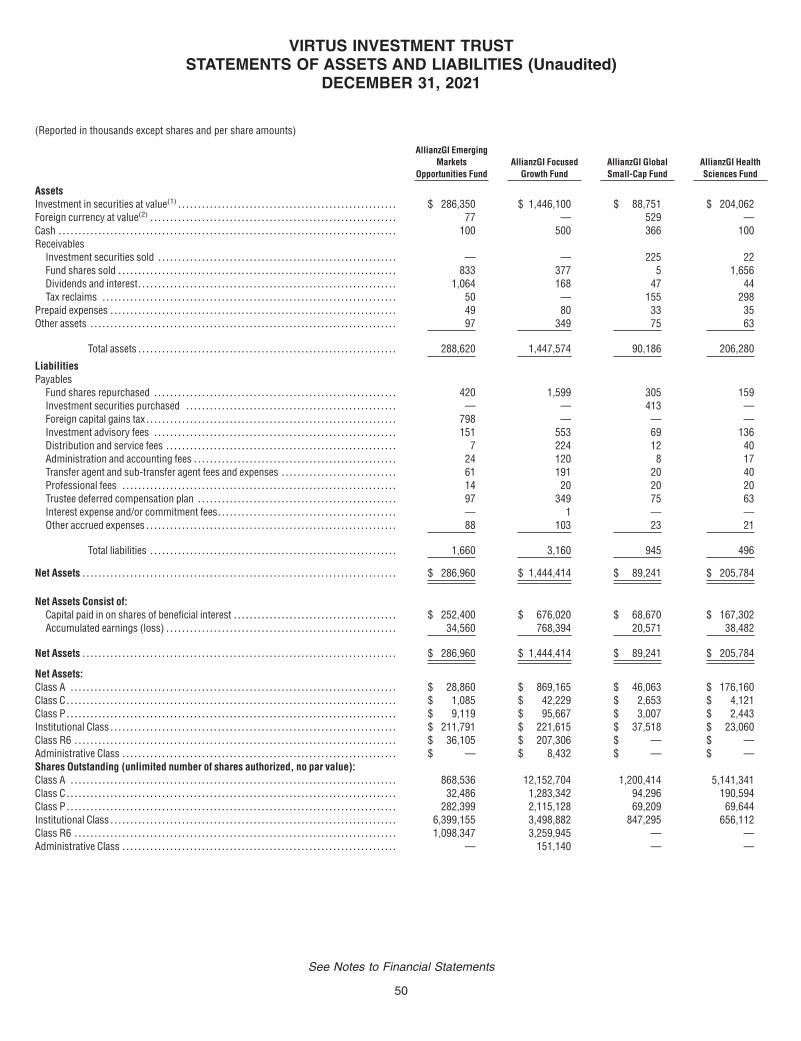
AllianzGI EmergingMarkets
Opportunities FundAllianzGI Focused
Growth FundAllianzGI GlobalSmall-Cap Fund
AllianzGI HealthSciences Fund
AssetsInvestment in securities at value(1) . . . . . . . . . . . . . . . . . . . . . . . . . . . . . . . . . . . . . . . . . . . . . . . . . . . . . . . $ 286,350 $ 1,446,100 $ 88,751 $ 204,062Foreign currency at value(2) . . . . . . . . . . . . . . . . . . . . . . . . . . . . . . . . . . . . . . . . . . . . . . . . . . . . . . . . . . . . . . 77 — 529 —Cash . . . . . . . . . . . . . . . . . . . . . . . . . . . . . . . . . . . . . . . . . . . . . . . . . . . . . . . . . . . . . . . . . . . . . . . . . . . . . . . . . . . . . 100 500 366 100Receivables
Investment securities sold . . . . . . . . . . . . . . . . . . . . . . . . . . . . . . . . . . . . . . . . . . . . . . . . . . . . . . . . . . . . — — 225 22Fund shares sold . . . . . . . . . . . . . . . . . . . . . . . . . . . . . . . . . . . . . . . . . . . . . . . . . . . . . . . . . . . . . . . . . . . . . . 833 377 5 1,656Dividends and interest. . . . . . . . . . . . . . . . . . . . . . . . . . . . . . . . . . . . . . . . . . . . . . . . . . . . . . . . . . . . . . . . . 1,064 168 47 44Tax reclaims . . . . . . . . . . . . . . . . . . . . . . . . . . . . . . . . . . . . . . . . . . . . . . . . . . . . . . . . . . . . . . . . . . . . . . . . . . 50 — 155 298
Prepaid expenses . . . . . . . . . . . . . . . . . . . . . . . . . . . . . . . . . . . . . . . . . . . . . . . . . . . . . . . . . . . . . . . . . . . . . . . . 49 80 33 35Other assets . . . . . . . . . . . . . . . . . . . . . . . . . . . . . . . . . . . . . . . . . . . . . . . . . . . . . . . . . . . . . . . . . . . . . . . . . . . . . 97 349 75 63
Total assets . . . . . . . . . . . . . . . . . . . . . . . . . . . . . . . . . . . . . . . . . . . . . . . . . . . . . . . . . . . . . . . . . 288,620 1,447,574 90,186 206,280
LiabilitiesPayables
Fund shares repurchased . . . . . . . . . . . . . . . . . . . . . . . . . . . . . . . . . . . . . . . . . . . . . . . . . . . . . . . . . . . . . 420 1,599 305 159Investment securities purchased . . . . . . . . . . . . . . . . . . . . . . . . . . . . . . . . . . . . . . . . . . . . . . . . . . . . . — — 413 —Foreign capital gains tax . . . . . . . . . . . . . . . . . . . . . . . . . . . . . . . . . . . . . . . . . . . . . . . . . . . . . . . . . . . . . . . 798 — — —Investment advisory fees . . . . . . . . . . . . . . . . . . . . . . . . . . . . . . . . . . . . . . . . . . . . . . . . . . . . . . . . . . . . . 151 553 69 136Distribution and service fees . . . . . . . . . . . . . . . . . . . . . . . . . . . . . . . . . . . . . . . . . . . . . . . . . . . . . . . . . . 7 224 12 40Administration and accounting fees . . . . . . . . . . . . . . . . . . . . . . . . . . . . . . . . . . . . . . . . . . . . . . . . . . . 24 120 8 17Transfer agent and sub-transfer agent fees and expenses . . . . . . . . . . . . . . . . . . . . . . . . . . . . . 61 191 20 40Professional fees . . . . . . . . . . . . . . . . . . . . . . . . . . . . . . . . . . . . . . . . . . . . . . . . . . . . . . . . . . . . . . . . . . . . . 14 20 20 20Trustee deferred compensation plan . . . . . . . . . . . . . . . . . . . . . . . . . . . . . . . . . . . . . . . . . . . . . . . . . . 97 349 75 63Interest expense and/or commitment fees. . . . . . . . . . . . . . . . . . . . . . . . . . . . . . . . . . . . . . . . . . . . . — 1 — —Other accrued expenses . . . . . . . . . . . . . . . . . . . . . . . . . . . . . . . . . . . . . . . . . . . . . . . . . . . . . . . . . . . . . . . 88 103 23 21
Total liabilities . . . . . . . . . . . . . . . . . . . . . . . . . . . . . . . . . . . . . . . . . . . . . . . . . . . . . . . . . . . . . . 1,660 3,160 945 496
Net Assets . . . . . . . . . . . . . . . . . . . . . . . . . . . . . . . . . . . . . . . . . . . . . . . . . . . . . . . . . . . . . . . . . . . . . . . . . . . . . . . $ 286,960 $ 1,444,414 $ 89,241 $ 205,784
Net Assets Consist of:Capital paid in on shares of beneficial interest . . . . . . . . . . . . . . . . . . . . . . . . . . . . . . . . . . . . . . . . . $ 252,400 $ 676,020 $ 68,670 $ 167,302Accumulated earnings (loss) . . . . . . . . . . . . . . . . . . . . . . . . . . . . . . . . . . . . . . . . . . . . . . . . . . . . . . . . . . 34,560 768,394 20,571 38,482
Net Assets . . . . . . . . . . . . . . . . . . . . . . . . . . . . . . . . . . . . . . . . . . . . . . . . . . . . . . . . . . . . . . . . . . . . . . . . . . . . . . . $ 286,960 $ 1,444,414 $ 89,241 $ 205,784
Net Assets:Class A . . . . . . . . . . . . . . . . . . . . . . . . . . . . . . . . . . . . . . . . . . . . . . . . . . . . . . . . . . . . . . . . . . . . . . . . . . . . . . . . . . $ 28,860 $ 869,165 $ 46,063 $ 176,160Class C . . . . . . . . . . . . . . . . . . . . . . . . . . . . . . . . . . . . . . . . . . . . . . . . . . . . . . . . . . . . . . . . . . . . . . . . . . . . . . . . . . . $ 1,085 $ 42,229 $ 2,653 $ 4,121Class P . . . . . . . . . . . . . . . . . . . . . . . . . . . . . . . . . . . . . . . . . . . . . . . . . . . . . . . . . . . . . . . . . . . . . . . . . . . . . . . . . . . $ 9,119 $ 95,667 $ 3,007 $ 2,443Institutional Class . . . . . . . . . . . . . . . . . . . . . . . . . . . . . . . . . . . . . . . . . . . . . . . . . . . . . . . . . . . . . . . . . . . . . . . . $ 211,791 $ 221,615 $ 37,518 $ 23,060Class R6 . . . . . . . . . . . . . . . . . . . . . . . . . . . . . . . . . . . . . . . . . . . . . . . . . . . . . . . . . . . . . . . . . . . . . . . . . . . . . . . . . $ 36,105 $ 207,306 $ — $ —Administrative Class . . . . . . . . . . . . . . . . . . . . . . . . . . . . . . . . . . . . . . . . . . . . . . . . . . . . . . . . . . . . . . . . . . . . . $ — $ 8,432 $ — $ —Shares Outstanding (unlimited number of shares authorized, no par value):Class A . . . . . . . . . . . . . . . . . . . . . . . . . . . . . . . . . . . . . . . . . . . . . . . . . . . . . . . . . . . . . . . . . . . . . . . . . . . . . . . . . . 868,536 12,152,704 1,200,414 5,141,341Class C . . . . . . . . . . . . . . . . . . . . . . . . . . . . . . . . . . . . . . . . . . . . . . . . . . . . . . . . . . . . . . . . . . . . . . . . . . . . . . . . . . . 32,486 1,283,342 94,296 190,594Class P . . . . . . . . . . . . . . . . . . . . . . . . . . . . . . . . . . . . . . . . . . . . . . . . . . . . . . . . . . . . . . . . . . . . . . . . . . . . . . . . . . . 282,399 2,115,128 69,209 69,644Institutional Class . . . . . . . . . . . . . . . . . . . . . . . . . . . . . . . . . . . . . . . . . . . . . . . . . . . . . . . . . . . . . . . . . . . . . . . . 6,399,155 3,498,882 847,295 656,112Class R6 . . . . . . . . . . . . . . . . . . . . . . . . . . . . . . . . . . . . . . . . . . . . . . . . . . . . . . . . . . . . . . . . . . . . . . . . . . . . . . . . . 1,098,347 3,259,945 — —Administrative Class . . . . . . . . . . . . . . . . . . . . . . . . . . . . . . . . . . . . . . . . . . . . . . . . . . . . . . . . . . . . . . . . . . . . . — 151,140 — —
VIRTUS INVESTMENT TRUSTSTATEMENTS OF ASSETS AND LIABILITIES (Unaudited)
DECEMBER 31, 2021
(Reported in thousands except shares and per share amounts)
See Notes to Financial Statements
50

AllianzGI EmergingMarkets
Opportunities FundAllianzGI Focused
Growth FundAllianzGI GlobalSmall-Cap Fund
AllianzGI HealthSciences Fund
Net Asset Value and Redemption Price Per Share:*
Class A . . . . . . . . . . . . . . . . . . . . . . . . . . . . . . . . . . . . . . . . . . . . . . . . . . . . . . . . . . . . . . . . . . . . . . . . . . . . . . . . . . $ 33.23 $ 71.52 $ 38.37 $ 34.26Class C . . . . . . . . . . . . . . . . . . . . . . . . . . . . . . . . . . . . . . . . . . . . . . . . . . . . . . . . . . . . . . . . . . . . . . . . . . . . . . . . . . . $ 33.38 $ 32.91 $ 28.13 $ 21.62Class P . . . . . . . . . . . . . . . . . . . . . . . . . . . . . . . . . . . . . . . . . . . . . . . . . . . . . . . . . . . . . . . . . . . . . . . . . . . . . . . . . . . $ 32.29 $ 45.23 $ 43.46 $ 35.08Institutional Class . . . . . . . . . . . . . . . . . . . . . . . . . . . . . . . . . . . . . . . . . . . . . . . . . . . . . . . . . . . . . . . . . . . . . . . . $ 33.10 $ 63.34 $ 44.28 $ 35.15Class R6 . . . . . . . . . . . . . . . . . . . . . . . . . . . . . . . . . . . . . . . . . . . . . . . . . . . . . . . . . . . . . . . . . . . . . . . . . . . . . . . . . $ 32.87 $ 63.59 $ — $ —Administrative Class . . . . . . . . . . . . . . . . . . . . . . . . . . . . . . . . . . . . . . . . . . . . . . . . . . . . . . . . . . . . . . . . . . . . . $ — $ 55.79 $ — $ —Maximum Offering Price Per Share (NAV/(1-Maximum Sales Charge)):Class A . . . . . . . . . . . . . . . . . . . . . . . . . . . . . . . . . . . . . . . . . . . . . . . . . . . . . . . . . . . . . . . . . . . . . . . . . . . . . . . . . . $ 35.16 $ 75.68 $ 40.60 $ 36.25Maximum Sales Charge - Class A . . . . . . . . . . . . . . . . . . . . . . . . . . . . . . . . . . . . . . . . . . . . . . . . . . . . . . . . 5.50% 5.50% 5.50% 5.50%
(1) Investment in securities at cost. . . . . . . . . . . . . . . . . . . . . . . . . . . . . . . . . . . . . . . . . . . . . . . . . . . . . . . . $ 241,071 $ 703,055 $ 68,346 $ 173,377(2) Foreign currency at cost. . . . . . . . . . . . . . . . . . . . . . . . . . . . . . . . . . . . . . . . . . . . . . . . . . . . . . . . . . . . . . . $ 77 $ — $ 523 $ —
* Net Asset Value and Redemption Price Per Share are calculated using unrounded net assets.
VIRTUS INVESTMENT TRUSTSTATEMENTS OF ASSETS AND LIABILITIES (Unaudited) (Continued)
DECEMBER 31, 2021
(Reported in thousands except shares and per share amounts)
See Notes to Financial Statements
51
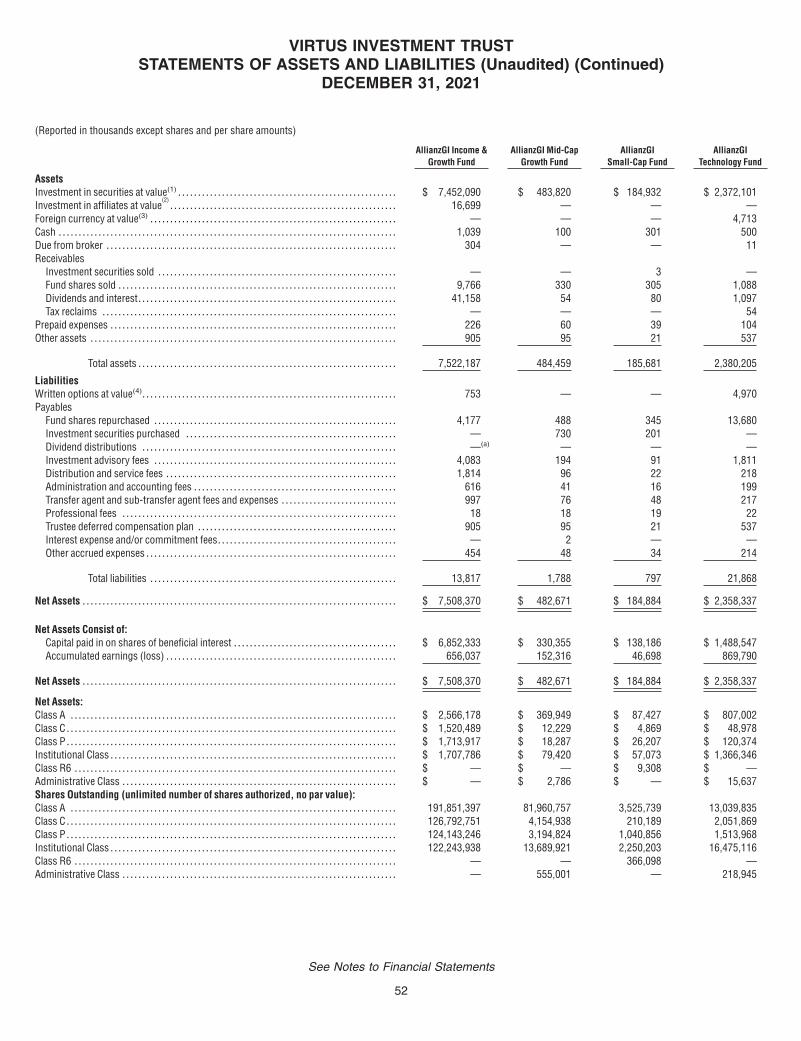
AllianzGI Income &Growth Fund
AllianzGI Mid-CapGrowth Fund
AllianzGISmall-Cap Fund
AllianzGITechnology Fund
AssetsInvestment in securities at value(1) . . . . . . . . . . . . . . . . . . . . . . . . . . . . . . . . . . . . . . . . . . . . . . . . . . . . . . . $ 7,452,090 $ 483,820 $ 184,932 $ 2,372,101Investment in affiliates at value
(2). . . . . . . . . . . . . . . . . . . . . . . . . . . . . . . . . . . . . . . . . . . . . . . . . . . . . . . . . 16,699 — — —
Foreign currency at value(3) . . . . . . . . . . . . . . . . . . . . . . . . . . . . . . . . . . . . . . . . . . . . . . . . . . . . . . . . . . . . . . — — — 4,713Cash . . . . . . . . . . . . . . . . . . . . . . . . . . . . . . . . . . . . . . . . . . . . . . . . . . . . . . . . . . . . . . . . . . . . . . . . . . . . . . . . . . . . . 1,039 100 301 500Due from broker . . . . . . . . . . . . . . . . . . . . . . . . . . . . . . . . . . . . . . . . . . . . . . . . . . . . . . . . . . . . . . . . . . . . . . . . . 304 — — 11Receivables
Investment securities sold . . . . . . . . . . . . . . . . . . . . . . . . . . . . . . . . . . . . . . . . . . . . . . . . . . . . . . . . . . . . — — 3 —Fund shares sold . . . . . . . . . . . . . . . . . . . . . . . . . . . . . . . . . . . . . . . . . . . . . . . . . . . . . . . . . . . . . . . . . . . . . . 9,766 330 305 1,088Dividends and interest. . . . . . . . . . . . . . . . . . . . . . . . . . . . . . . . . . . . . . . . . . . . . . . . . . . . . . . . . . . . . . . . . 41,158 54 80 1,097Tax reclaims . . . . . . . . . . . . . . . . . . . . . . . . . . . . . . . . . . . . . . . . . . . . . . . . . . . . . . . . . . . . . . . . . . . . . . . . . . — — — 54
Prepaid expenses . . . . . . . . . . . . . . . . . . . . . . . . . . . . . . . . . . . . . . . . . . . . . . . . . . . . . . . . . . . . . . . . . . . . . . . . 226 60 39 104Other assets . . . . . . . . . . . . . . . . . . . . . . . . . . . . . . . . . . . . . . . . . . . . . . . . . . . . . . . . . . . . . . . . . . . . . . . . . . . . . 905 95 21 537
Total assets . . . . . . . . . . . . . . . . . . . . . . . . . . . . . . . . . . . . . . . . . . . . . . . . . . . . . . . . . . . . . . . . . 7,522,187 484,459 185,681 2,380,205
LiabilitiesWritten options at value(4). . . . . . . . . . . . . . . . . . . . . . . . . . . . . . . . . . . . . . . . . . . . . . . . . . . . . . . . . . . . . . . . 753 — — 4,970Payables
Fund shares repurchased . . . . . . . . . . . . . . . . . . . . . . . . . . . . . . . . . . . . . . . . . . . . . . . . . . . . . . . . . . . . . 4,177 488 345 13,680Investment securities purchased . . . . . . . . . . . . . . . . . . . . . . . . . . . . . . . . . . . . . . . . . . . . . . . . . . . . . — 730 201 —Dividend distributions . . . . . . . . . . . . . . . . . . . . . . . . . . . . . . . . . . . . . . . . . . . . . . . . . . . . . . . . . . . . . . . . —(a) — — —Investment advisory fees . . . . . . . . . . . . . . . . . . . . . . . . . . . . . . . . . . . . . . . . . . . . . . . . . . . . . . . . . . . . . 4,083 194 91 1,811Distribution and service fees . . . . . . . . . . . . . . . . . . . . . . . . . . . . . . . . . . . . . . . . . . . . . . . . . . . . . . . . . . 1,814 96 22 218Administration and accounting fees . . . . . . . . . . . . . . . . . . . . . . . . . . . . . . . . . . . . . . . . . . . . . . . . . . . 616 41 16 199Transfer agent and sub-transfer agent fees and expenses . . . . . . . . . . . . . . . . . . . . . . . . . . . . . 997 76 48 217Professional fees . . . . . . . . . . . . . . . . . . . . . . . . . . . . . . . . . . . . . . . . . . . . . . . . . . . . . . . . . . . . . . . . . . . . . 18 18 19 22Trustee deferred compensation plan . . . . . . . . . . . . . . . . . . . . . . . . . . . . . . . . . . . . . . . . . . . . . . . . . . 905 95 21 537Interest expense and/or commitment fees. . . . . . . . . . . . . . . . . . . . . . . . . . . . . . . . . . . . . . . . . . . . . — 2 — —Other accrued expenses . . . . . . . . . . . . . . . . . . . . . . . . . . . . . . . . . . . . . . . . . . . . . . . . . . . . . . . . . . . . . . . 454 48 34 214
Total liabilities . . . . . . . . . . . . . . . . . . . . . . . . . . . . . . . . . . . . . . . . . . . . . . . . . . . . . . . . . . . . . . 13,817 1,788 797 21,868
Net Assets . . . . . . . . . . . . . . . . . . . . . . . . . . . . . . . . . . . . . . . . . . . . . . . . . . . . . . . . . . . . . . . . . . . . . . . . . . . . . . . $ 7,508,370 $ 482,671 $ 184,884 $ 2,358,337
Net Assets Consist of:Capital paid in on shares of beneficial interest . . . . . . . . . . . . . . . . . . . . . . . . . . . . . . . . . . . . . . . . . $ 6,852,333 $ 330,355 $ 138,186 $ 1,488,547Accumulated earnings (loss) . . . . . . . . . . . . . . . . . . . . . . . . . . . . . . . . . . . . . . . . . . . . . . . . . . . . . . . . . . 656,037 152,316 46,698 869,790
Net Assets . . . . . . . . . . . . . . . . . . . . . . . . . . . . . . . . . . . . . . . . . . . . . . . . . . . . . . . . . . . . . . . . . . . . . . . . . . . . . . . $ 7,508,370 $ 482,671 $ 184,884 $ 2,358,337
Net Assets:Class A . . . . . . . . . . . . . . . . . . . . . . . . . . . . . . . . . . . . . . . . . . . . . . . . . . . . . . . . . . . . . . . . . . . . . . . . . . . . . . . . . . $ 2,566,178 $ 369,949 $ 87,427 $ 807,002Class C . . . . . . . . . . . . . . . . . . . . . . . . . . . . . . . . . . . . . . . . . . . . . . . . . . . . . . . . . . . . . . . . . . . . . . . . . . . . . . . . . . . $ 1,520,489 $ 12,229 $ 4,869 $ 48,978Class P . . . . . . . . . . . . . . . . . . . . . . . . . . . . . . . . . . . . . . . . . . . . . . . . . . . . . . . . . . . . . . . . . . . . . . . . . . . . . . . . . . . $ 1,713,917 $ 18,287 $ 26,207 $ 120,374Institutional Class . . . . . . . . . . . . . . . . . . . . . . . . . . . . . . . . . . . . . . . . . . . . . . . . . . . . . . . . . . . . . . . . . . . . . . . . $ 1,707,786 $ 79,420 $ 57,073 $ 1,366,346Class R6 . . . . . . . . . . . . . . . . . . . . . . . . . . . . . . . . . . . . . . . . . . . . . . . . . . . . . . . . . . . . . . . . . . . . . . . . . . . . . . . . . $ — $ — $ 9,308 $ —Administrative Class . . . . . . . . . . . . . . . . . . . . . . . . . . . . . . . . . . . . . . . . . . . . . . . . . . . . . . . . . . . . . . . . . . . . . $ — $ 2,786 $ — $ 15,637Shares Outstanding (unlimited number of shares authorized, no par value):Class A . . . . . . . . . . . . . . . . . . . . . . . . . . . . . . . . . . . . . . . . . . . . . . . . . . . . . . . . . . . . . . . . . . . . . . . . . . . . . . . . . . 191,851,397 81,960,757 3,525,739 13,039,835Class C . . . . . . . . . . . . . . . . . . . . . . . . . . . . . . . . . . . . . . . . . . . . . . . . . . . . . . . . . . . . . . . . . . . . . . . . . . . . . . . . . . . 126,792,751 4,154,938 210,189 2,051,869Class P . . . . . . . . . . . . . . . . . . . . . . . . . . . . . . . . . . . . . . . . . . . . . . . . . . . . . . . . . . . . . . . . . . . . . . . . . . . . . . . . . . . 124,143,246 3,194,824 1,040,856 1,513,968Institutional Class . . . . . . . . . . . . . . . . . . . . . . . . . . . . . . . . . . . . . . . . . . . . . . . . . . . . . . . . . . . . . . . . . . . . . . . . 122,243,938 13,689,921 2,250,203 16,475,116Class R6 . . . . . . . . . . . . . . . . . . . . . . . . . . . . . . . . . . . . . . . . . . . . . . . . . . . . . . . . . . . . . . . . . . . . . . . . . . . . . . . . . — — 366,098 —Administrative Class . . . . . . . . . . . . . . . . . . . . . . . . . . . . . . . . . . . . . . . . . . . . . . . . . . . . . . . . . . . . . . . . . . . . . — 555,001 — 218,945
VIRTUS INVESTMENT TRUSTSTATEMENTS OF ASSETS AND LIABILITIES (Unaudited) (Continued)
DECEMBER 31, 2021
(Reported in thousands except shares and per share amounts)
See Notes to Financial Statements
52

AllianzGI Income &Growth Fund
AllianzGI Mid-CapGrowth Fund
AllianzGISmall-Cap Fund
AllianzGITechnology Fund
Net Asset Value and Redemption Price Per Share:*
Class A . . . . . . . . . . . . . . . . . . . . . . . . . . . . . . . . . . . . . . . . . . . . . . . . . . . . . . . . . . . . . . . . . . . . . . . . . . . . . . . . . . $ 13.38 $ 4.51 $ 24.80 $ 61.89Class C . . . . . . . . . . . . . . . . . . . . . . . . . . . . . . . . . . . . . . . . . . . . . . . . . . . . . . . . . . . . . . . . . . . . . . . . . . . . . . . . . . . $ 11.99 $ 2.94 $ 23.17 $ 23.87Class P . . . . . . . . . . . . . . . . . . . . . . . . . . . . . . . . . . . . . . . . . . . . . . . . . . . . . . . . . . . . . . . . . . . . . . . . . . . . . . . . . . . $ 13.81 $ 5.72 $ 25.18 $ 79.51Institutional Class . . . . . . . . . . . . . . . . . . . . . . . . . . . . . . . . . . . . . . . . . . . . . . . . . . . . . . . . . . . . . . . . . . . . . . . . $ 13.97 $ 5.80 $ 25.36 $ 82.93Class R6 . . . . . . . . . . . . . . . . . . . . . . . . . . . . . . . . . . . . . . . . . . . . . . . . . . . . . . . . . . . . . . . . . . . . . . . . . . . . . . . . . $ — $ — $ 25.42 $ —Administrative Class . . . . . . . . . . . . . . . . . . . . . . . . . . . . . . . . . . . . . . . . . . . . . . . . . . . . . . . . . . . . . . . . . . . . . $ — $ 5.02 $ — $ 71.42Maximum Offering Price Per Share (NAV/(1-Maximum Sales Charge)):Class A . . . . . . . . . . . . . . . . . . . . . . . . . . . . . . . . . . . . . . . . . . . . . . . . . . . . . . . . . . . . . . . . . . . . . . . . . . . . . . . . . . $ 14.16 $ 4.77 $ 26.24 $ 65.49Maximum Sales Charge - Class A . . . . . . . . . . . . . . . . . . . . . . . . . . . . . . . . . . . . . . . . . . . . . . . . . . . . . . . . 5.50% 5.50% 5.50% 5.50%
(1) Investment in securities at cost. . . . . . . . . . . . . . . . . . . . . . . . . . . . . . . . . . . . . . . . . . . . . . . . . . . . . . . . $ 6,961,615 $ 346,012 $ 141,419 $ 1,637,812(2)
Investment in affiliates at cost . . . . . . . . . . . . . . . . . . . . . . . . . . . . . . . . . . . . . . . . . . . . . . . . . . . . . . . . . $ 24,558 $ — $ — $ —(3) Foreign currency at cost. . . . . . . . . . . . . . . . . . . . . . . . . . . . . . . . . . . . . . . . . . . . . . . . . . . . . . . . . . . . . . . $ — $ — $ — $ 4,061(4) Written options premiums received . . . . . . . . . . . . . . . . . . . . . . . . . . . . . . . . . . . . . . . . . . . . . . . . . . . $ 1,195 $ — $ — $ 13,594
(a) Amount is less than $500.* Net Asset Value and Redemption Price Per Share are calculated using unrounded net assets.
VIRTUS INVESTMENT TRUSTSTATEMENTS OF ASSETS AND LIABILITIES (Unaudited) (Continued)
DECEMBER 31, 2021
(Reported in thousands except shares and per share amounts)
See Notes to Financial Statements
53
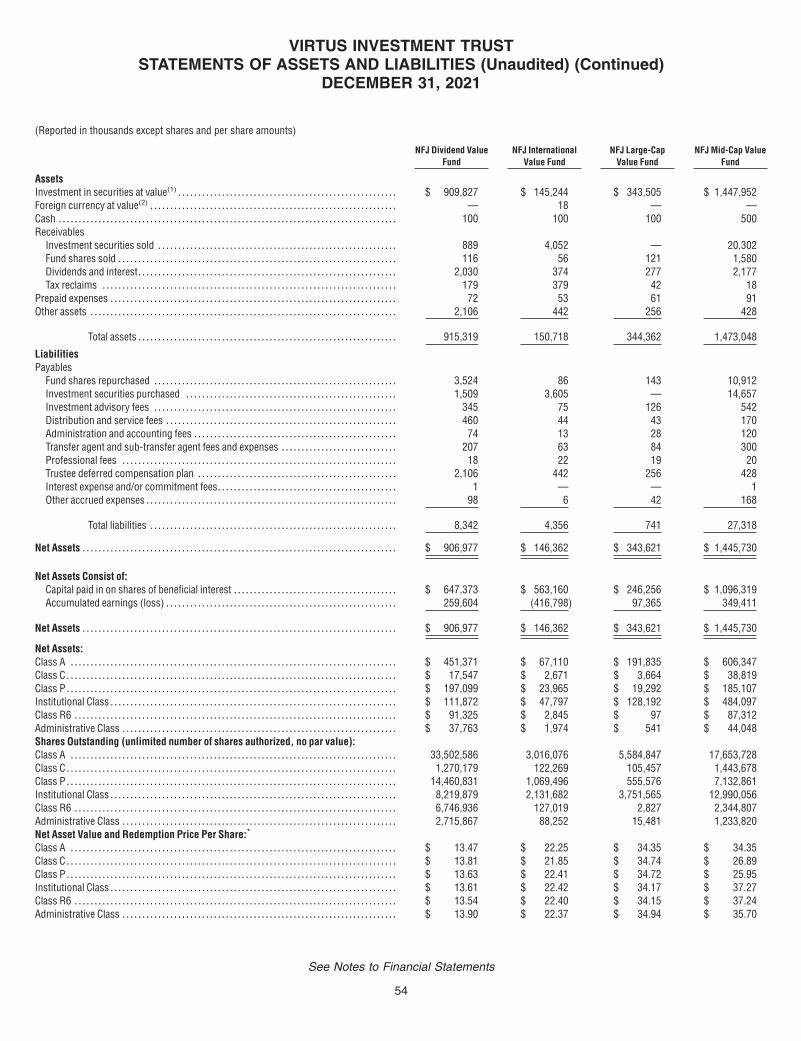
NFJ Dividend ValueFund
NFJ InternationalValue Fund
NFJ Large-CapValue Fund
NFJ Mid-Cap ValueFund
AssetsInvestment in securities at value(1) . . . . . . . . . . . . . . . . . . . . . . . . . . . . . . . . . . . . . . . . . . . . . . . . . . . . . . . $ 909,827 $ 145,244 $ 343,505 $ 1,447,952Foreign currency at value(2) . . . . . . . . . . . . . . . . . . . . . . . . . . . . . . . . . . . . . . . . . . . . . . . . . . . . . . . . . . . . . . — 18 — —Cash . . . . . . . . . . . . . . . . . . . . . . . . . . . . . . . . . . . . . . . . . . . . . . . . . . . . . . . . . . . . . . . . . . . . . . . . . . . . . . . . . . . . . 100 100 100 500Receivables
Investment securities sold . . . . . . . . . . . . . . . . . . . . . . . . . . . . . . . . . . . . . . . . . . . . . . . . . . . . . . . . . . . . 889 4,052 — 20,302Fund shares sold . . . . . . . . . . . . . . . . . . . . . . . . . . . . . . . . . . . . . . . . . . . . . . . . . . . . . . . . . . . . . . . . . . . . . . 116 56 121 1,580Dividends and interest. . . . . . . . . . . . . . . . . . . . . . . . . . . . . . . . . . . . . . . . . . . . . . . . . . . . . . . . . . . . . . . . . 2,030 374 277 2,177Tax reclaims . . . . . . . . . . . . . . . . . . . . . . . . . . . . . . . . . . . . . . . . . . . . . . . . . . . . . . . . . . . . . . . . . . . . . . . . . . 179 379 42 18
Prepaid expenses . . . . . . . . . . . . . . . . . . . . . . . . . . . . . . . . . . . . . . . . . . . . . . . . . . . . . . . . . . . . . . . . . . . . . . . . 72 53 61 91Other assets . . . . . . . . . . . . . . . . . . . . . . . . . . . . . . . . . . . . . . . . . . . . . . . . . . . . . . . . . . . . . . . . . . . . . . . . . . . . . 2,106 442 256 428
Total assets . . . . . . . . . . . . . . . . . . . . . . . . . . . . . . . . . . . . . . . . . . . . . . . . . . . . . . . . . . . . . . . . . 915,319 150,718 344,362 1,473,048
LiabilitiesPayables
Fund shares repurchased . . . . . . . . . . . . . . . . . . . . . . . . . . . . . . . . . . . . . . . . . . . . . . . . . . . . . . . . . . . . . 3,524 86 143 10,912Investment securities purchased . . . . . . . . . . . . . . . . . . . . . . . . . . . . . . . . . . . . . . . . . . . . . . . . . . . . . 1,509 3,605 — 14,657Investment advisory fees . . . . . . . . . . . . . . . . . . . . . . . . . . . . . . . . . . . . . . . . . . . . . . . . . . . . . . . . . . . . . 345 75 126 542Distribution and service fees . . . . . . . . . . . . . . . . . . . . . . . . . . . . . . . . . . . . . . . . . . . . . . . . . . . . . . . . . . 460 44 43 170Administration and accounting fees . . . . . . . . . . . . . . . . . . . . . . . . . . . . . . . . . . . . . . . . . . . . . . . . . . . 74 13 28 120Transfer agent and sub-transfer agent fees and expenses . . . . . . . . . . . . . . . . . . . . . . . . . . . . . 207 63 84 300Professional fees . . . . . . . . . . . . . . . . . . . . . . . . . . . . . . . . . . . . . . . . . . . . . . . . . . . . . . . . . . . . . . . . . . . . . 18 22 19 20Trustee deferred compensation plan . . . . . . . . . . . . . . . . . . . . . . . . . . . . . . . . . . . . . . . . . . . . . . . . . . 2,106 442 256 428Interest expense and/or commitment fees. . . . . . . . . . . . . . . . . . . . . . . . . . . . . . . . . . . . . . . . . . . . . 1 — — 1Other accrued expenses . . . . . . . . . . . . . . . . . . . . . . . . . . . . . . . . . . . . . . . . . . . . . . . . . . . . . . . . . . . . . . . 98 6 42 168
Total liabilities . . . . . . . . . . . . . . . . . . . . . . . . . . . . . . . . . . . . . . . . . . . . . . . . . . . . . . . . . . . . . . 8,342 4,356 741 27,318
Net Assets . . . . . . . . . . . . . . . . . . . . . . . . . . . . . . . . . . . . . . . . . . . . . . . . . . . . . . . . . . . . . . . . . . . . . . . . . . . . . . . $ 906,977 $ 146,362 $ 343,621 $ 1,445,730
Net Assets Consist of:Capital paid in on shares of beneficial interest . . . . . . . . . . . . . . . . . . . . . . . . . . . . . . . . . . . . . . . . . $ 647,373 $ 563,160 $ 246,256 $ 1,096,319Accumulated earnings (loss) . . . . . . . . . . . . . . . . . . . . . . . . . . . . . . . . . . . . . . . . . . . . . . . . . . . . . . . . . . 259,604 (416,798) 97,365 349,411
Net Assets . . . . . . . . . . . . . . . . . . . . . . . . . . . . . . . . . . . . . . . . . . . . . . . . . . . . . . . . . . . . . . . . . . . . . . . . . . . . . . . $ 906,977 $ 146,362 $ 343,621 $ 1,445,730
Net Assets:Class A . . . . . . . . . . . . . . . . . . . . . . . . . . . . . . . . . . . . . . . . . . . . . . . . . . . . . . . . . . . . . . . . . . . . . . . . . . . . . . . . . . $ 451,371 $ 67,110 $ 191,835 $ 606,347Class C . . . . . . . . . . . . . . . . . . . . . . . . . . . . . . . . . . . . . . . . . . . . . . . . . . . . . . . . . . . . . . . . . . . . . . . . . . . . . . . . . . . $ 17,547 $ 2,671 $ 3,664 $ 38,819Class P . . . . . . . . . . . . . . . . . . . . . . . . . . . . . . . . . . . . . . . . . . . . . . . . . . . . . . . . . . . . . . . . . . . . . . . . . . . . . . . . . . . $ 197,099 $ 23,965 $ 19,292 $ 185,107Institutional Class . . . . . . . . . . . . . . . . . . . . . . . . . . . . . . . . . . . . . . . . . . . . . . . . . . . . . . . . . . . . . . . . . . . . . . . . $ 111,872 $ 47,797 $ 128,192 $ 484,097Class R6 . . . . . . . . . . . . . . . . . . . . . . . . . . . . . . . . . . . . . . . . . . . . . . . . . . . . . . . . . . . . . . . . . . . . . . . . . . . . . . . . . $ 91,325 $ 2,845 $ 97 $ 87,312Administrative Class . . . . . . . . . . . . . . . . . . . . . . . . . . . . . . . . . . . . . . . . . . . . . . . . . . . . . . . . . . . . . . . . . . . . . $ 37,763 $ 1,974 $ 541 $ 44,048Shares Outstanding (unlimited number of shares authorized, no par value):Class A . . . . . . . . . . . . . . . . . . . . . . . . . . . . . . . . . . . . . . . . . . . . . . . . . . . . . . . . . . . . . . . . . . . . . . . . . . . . . . . . . . 33,502,586 3,016,076 5,584,847 17,653,728Class C . . . . . . . . . . . . . . . . . . . . . . . . . . . . . . . . . . . . . . . . . . . . . . . . . . . . . . . . . . . . . . . . . . . . . . . . . . . . . . . . . . . 1,270,179 122,269 105,457 1,443,678Class P . . . . . . . . . . . . . . . . . . . . . . . . . . . . . . . . . . . . . . . . . . . . . . . . . . . . . . . . . . . . . . . . . . . . . . . . . . . . . . . . . . . 14,460,831 1,069,496 555,576 7,132,861Institutional Class . . . . . . . . . . . . . . . . . . . . . . . . . . . . . . . . . . . . . . . . . . . . . . . . . . . . . . . . . . . . . . . . . . . . . . . . 8,219,879 2,131,682 3,751,565 12,990,056Class R6 . . . . . . . . . . . . . . . . . . . . . . . . . . . . . . . . . . . . . . . . . . . . . . . . . . . . . . . . . . . . . . . . . . . . . . . . . . . . . . . . . 6,746,936 127,019 2,827 2,344,807Administrative Class . . . . . . . . . . . . . . . . . . . . . . . . . . . . . . . . . . . . . . . . . . . . . . . . . . . . . . . . . . . . . . . . . . . . . 2,715,867 88,252 15,481 1,233,820Net Asset Value and Redemption Price Per Share:*
Class A . . . . . . . . . . . . . . . . . . . . . . . . . . . . . . . . . . . . . . . . . . . . . . . . . . . . . . . . . . . . . . . . . . . . . . . . . . . . . . . . . . $ 13.47 $ 22.25 $ 34.35 $ 34.35Class C . . . . . . . . . . . . . . . . . . . . . . . . . . . . . . . . . . . . . . . . . . . . . . . . . . . . . . . . . . . . . . . . . . . . . . . . . . . . . . . . . . . $ 13.81 $ 21.85 $ 34.74 $ 26.89Class P . . . . . . . . . . . . . . . . . . . . . . . . . . . . . . . . . . . . . . . . . . . . . . . . . . . . . . . . . . . . . . . . . . . . . . . . . . . . . . . . . . . $ 13.63 $ 22.41 $ 34.72 $ 25.95Institutional Class . . . . . . . . . . . . . . . . . . . . . . . . . . . . . . . . . . . . . . . . . . . . . . . . . . . . . . . . . . . . . . . . . . . . . . . . $ 13.61 $ 22.42 $ 34.17 $ 37.27Class R6 . . . . . . . . . . . . . . . . . . . . . . . . . . . . . . . . . . . . . . . . . . . . . . . . . . . . . . . . . . . . . . . . . . . . . . . . . . . . . . . . . $ 13.54 $ 22.40 $ 34.15 $ 37.24Administrative Class . . . . . . . . . . . . . . . . . . . . . . . . . . . . . . . . . . . . . . . . . . . . . . . . . . . . . . . . . . . . . . . . . . . . . $ 13.90 $ 22.37 $ 34.94 $ 35.70
VIRTUS INVESTMENT TRUSTSTATEMENTS OF ASSETS AND LIABILITIES (Unaudited) (Continued)
DECEMBER 31, 2021
(Reported in thousands except shares and per share amounts)
See Notes to Financial Statements
54
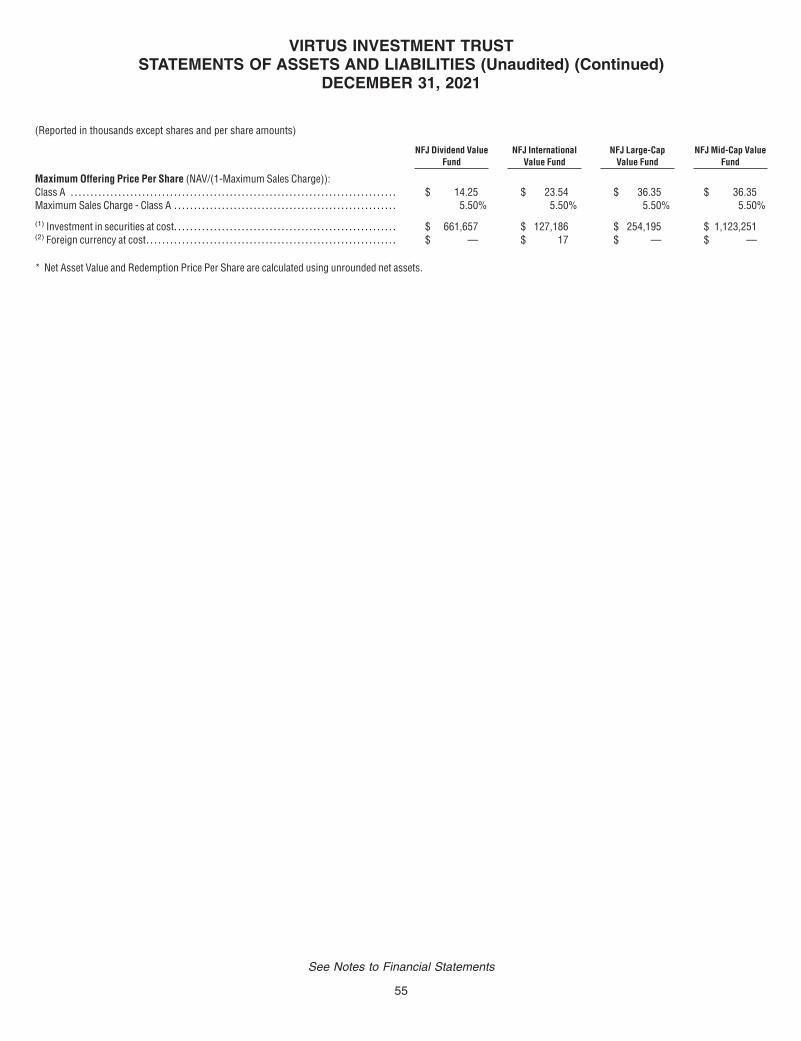
NFJ Dividend ValueFund
NFJ InternationalValue Fund
NFJ Large-CapValue Fund
NFJ Mid-Cap ValueFund
Maximum Offering Price Per Share (NAV/(1-Maximum Sales Charge)):Class A . . . . . . . . . . . . . . . . . . . . . . . . . . . . . . . . . . . . . . . . . . . . . . . . . . . . . . . . . . . . . . . . . . . . . . . . . . . . . . . . . . $ 14.25 $ 23.54 $ 36.35 $ 36.35Maximum Sales Charge - Class A . . . . . . . . . . . . . . . . . . . . . . . . . . . . . . . . . . . . . . . . . . . . . . . . . . . . . . . . 5.50% 5.50% 5.50% 5.50%
(1) Investment in securities at cost. . . . . . . . . . . . . . . . . . . . . . . . . . . . . . . . . . . . . . . . . . . . . . . . . . . . . . . . $ 661,657 $ 127,186 $ 254,195 $ 1,123,251(2) Foreign currency at cost. . . . . . . . . . . . . . . . . . . . . . . . . . . . . . . . . . . . . . . . . . . . . . . . . . . . . . . . . . . . . . . $ — $ 17 $ — $ —
* Net Asset Value and Redemption Price Per Share are calculated using unrounded net assets.
VIRTUS INVESTMENT TRUSTSTATEMENTS OF ASSETS AND LIABILITIES (Unaudited) (Continued)
DECEMBER 31, 2021
(Reported in thousands except shares and per share amounts)
See Notes to Financial Statements
55
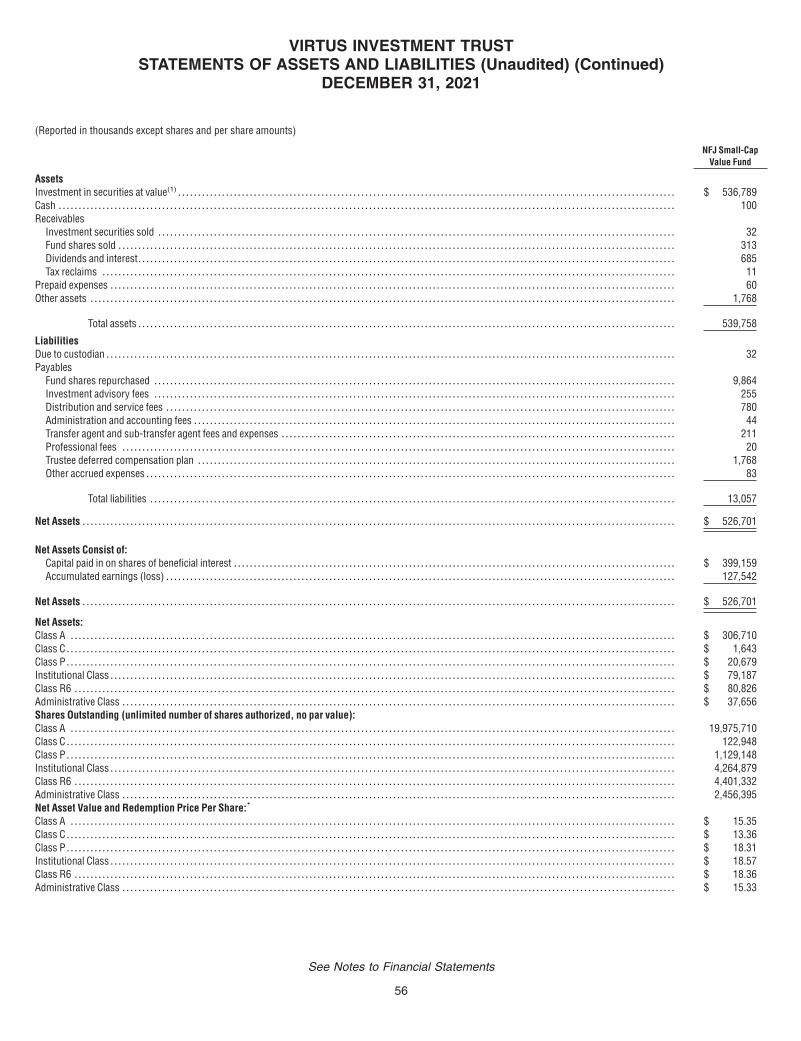
NFJ Small-CapValue Fund
AssetsInvestment in securities at value(1) . . . . . . . . . . . . . . . . . . . . . . . . . . . . . . . . . . . . . . . . . . . . . . . . . . . . . . . . . . . . . . . . . . . . . . . . . . . . . . . . . . . . . . . . . . . . . . . . . . . . . . . . . . . . . . . . . . . . . . . . . . . . . $ 536,789Cash . . . . . . . . . . . . . . . . . . . . . . . . . . . . . . . . . . . . . . . . . . . . . . . . . . . . . . . . . . . . . . . . . . . . . . . . . . . . . . . . . . . . . . . . . . . . . . . . . . . . . . . . . . . . . . . . . . . . . . . . . . . . . . . . . . . . . . . . . . . . . . . . . . . . . . . . . . . 100Receivables
Investment securities sold . . . . . . . . . . . . . . . . . . . . . . . . . . . . . . . . . . . . . . . . . . . . . . . . . . . . . . . . . . . . . . . . . . . . . . . . . . . . . . . . . . . . . . . . . . . . . . . . . . . . . . . . . . . . . . . . . . . . . . . . . . . . . . . . . . 32Fund shares sold . . . . . . . . . . . . . . . . . . . . . . . . . . . . . . . . . . . . . . . . . . . . . . . . . . . . . . . . . . . . . . . . . . . . . . . . . . . . . . . . . . . . . . . . . . . . . . . . . . . . . . . . . . . . . . . . . . . . . . . . . . . . . . . . . . . . . . . . . . . . 313Dividends and interest. . . . . . . . . . . . . . . . . . . . . . . . . . . . . . . . . . . . . . . . . . . . . . . . . . . . . . . . . . . . . . . . . . . . . . . . . . . . . . . . . . . . . . . . . . . . . . . . . . . . . . . . . . . . . . . . . . . . . . . . . . . . . . . . . . . . . . . 685Tax reclaims . . . . . . . . . . . . . . . . . . . . . . . . . . . . . . . . . . . . . . . . . . . . . . . . . . . . . . . . . . . . . . . . . . . . . . . . . . . . . . . . . . . . . . . . . . . . . . . . . . . . . . . . . . . . . . . . . . . . . . . . . . . . . . . . . . . . . . . . . . . . . . . . 11
Prepaid expenses . . . . . . . . . . . . . . . . . . . . . . . . . . . . . . . . . . . . . . . . . . . . . . . . . . . . . . . . . . . . . . . . . . . . . . . . . . . . . . . . . . . . . . . . . . . . . . . . . . . . . . . . . . . . . . . . . . . . . . . . . . . . . . . . . . . . . . . . . . . . . . 60Other assets . . . . . . . . . . . . . . . . . . . . . . . . . . . . . . . . . . . . . . . . . . . . . . . . . . . . . . . . . . . . . . . . . . . . . . . . . . . . . . . . . . . . . . . . . . . . . . . . . . . . . . . . . . . . . . . . . . . . . . . . . . . . . . . . . . . . . . . . . . . . . . . . . . . 1,768
Total assets . . . . . . . . . . . . . . . . . . . . . . . . . . . . . . . . . . . . . . . . . . . . . . . . . . . . . . . . . . . . . . . . . . . . . . . . . . . . . . . . . . . . . . . . . . . . . . . . . . . . . . . . . . . . . . . . . . . . . . . . . . . . . . . . . . . . . . . 539,758
LiabilitiesDue to custodian . . . . . . . . . . . . . . . . . . . . . . . . . . . . . . . . . . . . . . . . . . . . . . . . . . . . . . . . . . . . . . . . . . . . . . . . . . . . . . . . . . . . . . . . . . . . . . . . . . . . . . . . . . . . . . . . . . . . . . . . . . . . . . . . . . . . . . . . . . . . . . . 32Payables
Fund shares repurchased . . . . . . . . . . . . . . . . . . . . . . . . . . . . . . . . . . . . . . . . . . . . . . . . . . . . . . . . . . . . . . . . . . . . . . . . . . . . . . . . . . . . . . . . . . . . . . . . . . . . . . . . . . . . . . . . . . . . . . . . . . . . . . . . . . . 9,864Investment advisory fees . . . . . . . . . . . . . . . . . . . . . . . . . . . . . . . . . . . . . . . . . . . . . . . . . . . . . . . . . . . . . . . . . . . . . . . . . . . . . . . . . . . . . . . . . . . . . . . . . . . . . . . . . . . . . . . . . . . . . . . . . . . . . . . . . . . 255Distribution and service fees . . . . . . . . . . . . . . . . . . . . . . . . . . . . . . . . . . . . . . . . . . . . . . . . . . . . . . . . . . . . . . . . . . . . . . . . . . . . . . . . . . . . . . . . . . . . . . . . . . . . . . . . . . . . . . . . . . . . . . . . . . . . . . . . 780Administration and accounting fees . . . . . . . . . . . . . . . . . . . . . . . . . . . . . . . . . . . . . . . . . . . . . . . . . . . . . . . . . . . . . . . . . . . . . . . . . . . . . . . . . . . . . . . . . . . . . . . . . . . . . . . . . . . . . . . . . . . . . . . . . 44Transfer agent and sub-transfer agent fees and expenses . . . . . . . . . . . . . . . . . . . . . . . . . . . . . . . . . . . . . . . . . . . . . . . . . . . . . . . . . . . . . . . . . . . . . . . . . . . . . . . . . . . . . . . . . . . . . . . . . . . 211Professional fees . . . . . . . . . . . . . . . . . . . . . . . . . . . . . . . . . . . . . . . . . . . . . . . . . . . . . . . . . . . . . . . . . . . . . . . . . . . . . . . . . . . . . . . . . . . . . . . . . . . . . . . . . . . . . . . . . . . . . . . . . . . . . . . . . . . . . . . . . . . 20Trustee deferred compensation plan . . . . . . . . . . . . . . . . . . . . . . . . . . . . . . . . . . . . . . . . . . . . . . . . . . . . . . . . . . . . . . . . . . . . . . . . . . . . . . . . . . . . . . . . . . . . . . . . . . . . . . . . . . . . . . . . . . . . . . . . 1,768Other accrued expenses . . . . . . . . . . . . . . . . . . . . . . . . . . . . . . . . . . . . . . . . . . . . . . . . . . . . . . . . . . . . . . . . . . . . . . . . . . . . . . . . . . . . . . . . . . . . . . . . . . . . . . . . . . . . . . . . . . . . . . . . . . . . . . . . . . . . . 83
Total liabilities . . . . . . . . . . . . . . . . . . . . . . . . . . . . . . . . . . . . . . . . . . . . . . . . . . . . . . . . . . . . . . . . . . . . . . . . . . . . . . . . . . . . . . . . . . . . . . . . . . . . . . . . . . . . . . . . . . . . . . . . . . . . . . . . . . . . 13,057
Net Assets . . . . . . . . . . . . . . . . . . . . . . . . . . . . . . . . . . . . . . . . . . . . . . . . . . . . . . . . . . . . . . . . . . . . . . . . . . . . . . . . . . . . . . . . . . . . . . . . . . . . . . . . . . . . . . . . . . . . . . . . . . . . . . . . . . . . . . . . . . . . . . . . . . . . . $ 526,701
Net Assets Consist of:Capital paid in on shares of beneficial interest . . . . . . . . . . . . . . . . . . . . . . . . . . . . . . . . . . . . . . . . . . . . . . . . . . . . . . . . . . . . . . . . . . . . . . . . . . . . . . . . . . . . . . . . . . . . . . . . . . . . . . . . . . . . . . . $ 399,159Accumulated earnings (loss) . . . . . . . . . . . . . . . . . . . . . . . . . . . . . . . . . . . . . . . . . . . . . . . . . . . . . . . . . . . . . . . . . . . . . . . . . . . . . . . . . . . . . . . . . . . . . . . . . . . . . . . . . . . . . . . . . . . . . . . . . . . . . . . . 127,542
Net Assets . . . . . . . . . . . . . . . . . . . . . . . . . . . . . . . . . . . . . . . . . . . . . . . . . . . . . . . . . . . . . . . . . . . . . . . . . . . . . . . . . . . . . . . . . . . . . . . . . . . . . . . . . . . . . . . . . . . . . . . . . . . . . . . . . . . . . . . . . . . . . . . . . . . . . $ 526,701
Net Assets:Class A . . . . . . . . . . . . . . . . . . . . . . . . . . . . . . . . . . . . . . . . . . . . . . . . . . . . . . . . . . . . . . . . . . . . . . . . . . . . . . . . . . . . . . . . . . . . . . . . . . . . . . . . . . . . . . . . . . . . . . . . . . . . . . . . . . . . . . . . . . . . . . . . . . . . . . . . $ 306,710Class C . . . . . . . . . . . . . . . . . . . . . . . . . . . . . . . . . . . . . . . . . . . . . . . . . . . . . . . . . . . . . . . . . . . . . . . . . . . . . . . . . . . . . . . . . . . . . . . . . . . . . . . . . . . . . . . . . . . . . . . . . . . . . . . . . . . . . . . . . . . . . . . . . . . . . . . . . $ 1,643Class P . . . . . . . . . . . . . . . . . . . . . . . . . . . . . . . . . . . . . . . . . . . . . . . . . . . . . . . . . . . . . . . . . . . . . . . . . . . . . . . . . . . . . . . . . . . . . . . . . . . . . . . . . . . . . . . . . . . . . . . . . . . . . . . . . . . . . . . . . . . . . . . . . . . . . . . . . $ 20,679Institutional Class . . . . . . . . . . . . . . . . . . . . . . . . . . . . . . . . . . . . . . . . . . . . . . . . . . . . . . . . . . . . . . . . . . . . . . . . . . . . . . . . . . . . . . . . . . . . . . . . . . . . . . . . . . . . . . . . . . . . . . . . . . . . . . . . . . . . . . . . . . . . . . $ 79,187Class R6 . . . . . . . . . . . . . . . . . . . . . . . . . . . . . . . . . . . . . . . . . . . . . . . . . . . . . . . . . . . . . . . . . . . . . . . . . . . . . . . . . . . . . . . . . . . . . . . . . . . . . . . . . . . . . . . . . . . . . . . . . . . . . . . . . . . . . . . . . . . . . . . . . . . . . . . $ 80,826Administrative Class . . . . . . . . . . . . . . . . . . . . . . . . . . . . . . . . . . . . . . . . . . . . . . . . . . . . . . . . . . . . . . . . . . . . . . . . . . . . . . . . . . . . . . . . . . . . . . . . . . . . . . . . . . . . . . . . . . . . . . . . . . . . . . . . . . . . . . . . . . . $ 37,656Shares Outstanding (unlimited number of shares authorized, no par value):Class A . . . . . . . . . . . . . . . . . . . . . . . . . . . . . . . . . . . . . . . . . . . . . . . . . . . . . . . . . . . . . . . . . . . . . . . . . . . . . . . . . . . . . . . . . . . . . . . . . . . . . . . . . . . . . . . . . . . . . . . . . . . . . . . . . . . . . . . . . . . . . . . . . . . . . . . . 19,975,710Class C . . . . . . . . . . . . . . . . . . . . . . . . . . . . . . . . . . . . . . . . . . . . . . . . . . . . . . . . . . . . . . . . . . . . . . . . . . . . . . . . . . . . . . . . . . . . . . . . . . . . . . . . . . . . . . . . . . . . . . . . . . . . . . . . . . . . . . . . . . . . . . . . . . . . . . . . . 122,948Class P . . . . . . . . . . . . . . . . . . . . . . . . . . . . . . . . . . . . . . . . . . . . . . . . . . . . . . . . . . . . . . . . . . . . . . . . . . . . . . . . . . . . . . . . . . . . . . . . . . . . . . . . . . . . . . . . . . . . . . . . . . . . . . . . . . . . . . . . . . . . . . . . . . . . . . . . . 1,129,148Institutional Class . . . . . . . . . . . . . . . . . . . . . . . . . . . . . . . . . . . . . . . . . . . . . . . . . . . . . . . . . . . . . . . . . . . . . . . . . . . . . . . . . . . . . . . . . . . . . . . . . . . . . . . . . . . . . . . . . . . . . . . . . . . . . . . . . . . . . . . . . . . . . . 4,264,879Class R6 . . . . . . . . . . . . . . . . . . . . . . . . . . . . . . . . . . . . . . . . . . . . . . . . . . . . . . . . . . . . . . . . . . . . . . . . . . . . . . . . . . . . . . . . . . . . . . . . . . . . . . . . . . . . . . . . . . . . . . . . . . . . . . . . . . . . . . . . . . . . . . . . . . . . . . . 4,401,332Administrative Class . . . . . . . . . . . . . . . . . . . . . . . . . . . . . . . . . . . . . . . . . . . . . . . . . . . . . . . . . . . . . . . . . . . . . . . . . . . . . . . . . . . . . . . . . . . . . . . . . . . . . . . . . . . . . . . . . . . . . . . . . . . . . . . . . . . . . . . . . . . 2,456,395Net Asset Value and Redemption Price Per Share:*
Class A . . . . . . . . . . . . . . . . . . . . . . . . . . . . . . . . . . . . . . . . . . . . . . . . . . . . . . . . . . . . . . . . . . . . . . . . . . . . . . . . . . . . . . . . . . . . . . . . . . . . . . . . . . . . . . . . . . . . . . . . . . . . . . . . . . . . . . . . . . . . . . . . . . . . . . . . $ 15.35Class C . . . . . . . . . . . . . . . . . . . . . . . . . . . . . . . . . . . . . . . . . . . . . . . . . . . . . . . . . . . . . . . . . . . . . . . . . . . . . . . . . . . . . . . . . . . . . . . . . . . . . . . . . . . . . . . . . . . . . . . . . . . . . . . . . . . . . . . . . . . . . . . . . . . . . . . . . $ 13.36Class P . . . . . . . . . . . . . . . . . . . . . . . . . . . . . . . . . . . . . . . . . . . . . . . . . . . . . . . . . . . . . . . . . . . . . . . . . . . . . . . . . . . . . . . . . . . . . . . . . . . . . . . . . . . . . . . . . . . . . . . . . . . . . . . . . . . . . . . . . . . . . . . . . . . . . . . . . $ 18.31Institutional Class . . . . . . . . . . . . . . . . . . . . . . . . . . . . . . . . . . . . . . . . . . . . . . . . . . . . . . . . . . . . . . . . . . . . . . . . . . . . . . . . . . . . . . . . . . . . . . . . . . . . . . . . . . . . . . . . . . . . . . . . . . . . . . . . . . . . . . . . . . . . . . $ 18.57Class R6 . . . . . . . . . . . . . . . . . . . . . . . . . . . . . . . . . . . . . . . . . . . . . . . . . . . . . . . . . . . . . . . . . . . . . . . . . . . . . . . . . . . . . . . . . . . . . . . . . . . . . . . . . . . . . . . . . . . . . . . . . . . . . . . . . . . . . . . . . . . . . . . . . . . . . . . $ 18.36Administrative Class . . . . . . . . . . . . . . . . . . . . . . . . . . . . . . . . . . . . . . . . . . . . . . . . . . . . . . . . . . . . . . . . . . . . . . . . . . . . . . . . . . . . . . . . . . . . . . . . . . . . . . . . . . . . . . . . . . . . . . . . . . . . . . . . . . . . . . . . . . . $ 15.33
VIRTUS INVESTMENT TRUSTSTATEMENTS OF ASSETS AND LIABILITIES (Unaudited) (Continued)
DECEMBER 31, 2021
(Reported in thousands except shares and per share amounts)
See Notes to Financial Statements
56
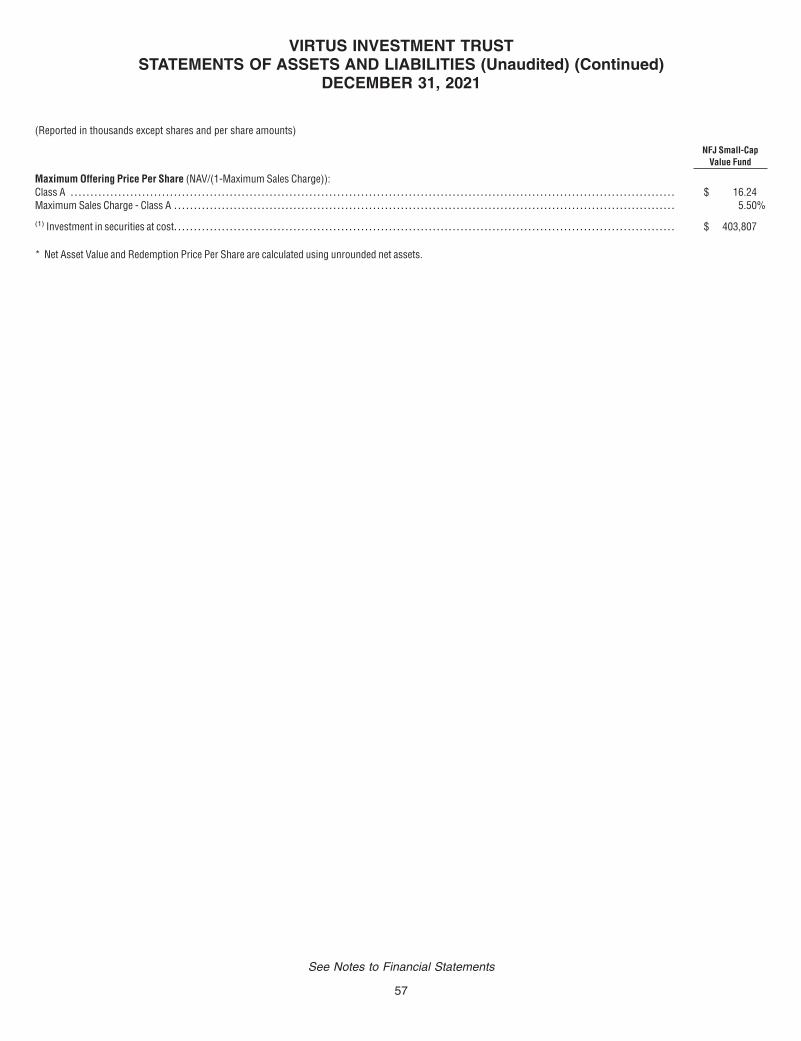
NFJ Small-CapValue Fund
Maximum Offering Price Per Share (NAV/(1-Maximum Sales Charge)):Class A . . . . . . . . . . . . . . . . . . . . . . . . . . . . . . . . . . . . . . . . . . . . . . . . . . . . . . . . . . . . . . . . . . . . . . . . . . . . . . . . . . . . . . . . . . . . . . . . . . . . . . . . . . . . . . . . . . . . . . . . . . . . . . . . . . . . . . . . . . . . . . . . . . . . . . . . $ 16.24Maximum Sales Charge - Class A . . . . . . . . . . . . . . . . . . . . . . . . . . . . . . . . . . . . . . . . . . . . . . . . . . . . . . . . . . . . . . . . . . . . . . . . . . . . . . . . . . . . . . . . . . . . . . . . . . . . . . . . . . . . . . . . . . . . . . . . . . . . . . 5.50%
(1) Investment in securities at cost. . . . . . . . . . . . . . . . . . . . . . . . . . . . . . . . . . . . . . . . . . . . . . . . . . . . . . . . . . . . . . . . . . . . . . . . . . . . . . . . . . . . . . . . . . . . . . . . . . . . . . . . . . . . . . . . . . . . . . . . . . . . . . $ 403,807
* Net Asset Value and Redemption Price Per Share are calculated using unrounded net assets.
VIRTUS INVESTMENT TRUSTSTATEMENTS OF ASSETS AND LIABILITIES (Unaudited) (Continued)
DECEMBER 31, 2021
(Reported in thousands except shares and per share amounts)
See Notes to Financial Statements
57

AllianzGI EmergingMarkets
Opportunities FundAllianzGI Focused
Growth FundAllianzGI GlobalSmall-Cap Fund
AllianzGI HealthSciences Fund
AllianzGI Income &Growth Fund
Investment IncomeDividends . . . . . . . . . . . . . . . . . . . . . . . . . . . . . . . . . . . . . . . . . . . . . . . $ 5,695 $ 3,270 $ 493 $ 861 $ 19,985Dividends from affiliates. . . . . . . . . . . . . . . . . . . . . . . . . . . . . . . . . — — — — 278Interest . . . . . . . . . . . . . . . . . . . . . . . . . . . . . . . . . . . . . . . . . . . . . . . . . — — — — 60,908Foreign taxes withheld . . . . . . . . . . . . . . . . . . . . . . . . . . . . . . . . . . (845) — (30) (5) (21)
Total investment income . . . . . . . . . . . . . . . . . . . . . . 4,850 3,270 463 856 81,150
ExpensesInvestment advisory fees . . . . . . . . . . . . . . . . . . . . . . . . . . . . . . . . 1,240 3,343 432 807 23,756Distribution and service fees, Class A . . . . . . . . . . . . . . . . . . . 40 1,115 62 220 3,126Distribution and service fees, Class C . . . . . . . . . . . . . . . . . . . 6 239 15 19 7,537Distribution and service fees, Administrative Class . . . . . . — 9 — — —Administration and accounting fees . . . . . . . . . . . . . . . . . . . . . 146 728 51 103 3,565Transfer agent fees and expenses . . . . . . . . . . . . . . . . . . . . . . . 66 346 23 50 1,614Sub-transfer agent fees and expenses, Class A . . . . . . . . . 22 260 26 73 691Sub-transfer agent fees and expenses, Class C . . . . . . . . . . 1 14 2 2 504Sub-transfer agent fees and expenses, Class P . . . . . . . . . . 4 42 2 —(1) 719Sub-transfer agent fees and expenses, Institutional
Class . . . . . . . . . . . . . . . . . . . . . . . . . . . . . . . . . . . . . . . . . . . . . . . . . 117 67 14 11 586Sub-transfer agent fees and expenses, Administrative
Class . . . . . . . . . . . . . . . . . . . . . . . . . . . . . . . . . . . . . . . . . . . . . . . . . — 2 — — —Custodian fees . . . . . . . . . . . . . . . . . . . . . . . . . . . . . . . . . . . . . . . . . . 50 18 11 3 105Printing fees and expenses . . . . . . . . . . . . . . . . . . . . . . . . . . . . . 9 30 3 5 152Professional fees . . . . . . . . . . . . . . . . . . . . . . . . . . . . . . . . . . . . . . . 20 21 17 18 42Interest expense and/or commitment fees. . . . . . . . . . . . . . . —(1) 4 —(1) —(1) 15Registration fees . . . . . . . . . . . . . . . . . . . . . . . . . . . . . . . . . . . . . . . . 18 24 19 12 69Trustees’ fees and expenses . . . . . . . . . . . . . . . . . . . . . . . . . . . . 23 112 8 15 542Miscellaneous expenses. . . . . . . . . . . . . . . . . . . . . . . . . . . . . . . . . 20 50 8 20 96
Total expenses . . . . . . . . . . . . . . . . . . . . . . . . . . . . . . . . . . . . . . . . 1,782 6,424 693 1,358 43,119Less net expenses reimbursed and/or waived by
investment adviser and/or administrator (2). . . . . . . . . . . (352) (31) 4 —(1) (37)
Net expenses . . . . . . . . . . . . . . . . . . . . . . . . . . . . . . . . . . . . . . . . . 1,430 6,393 697 1,358 43,082
Net investment income (loss) . . . . . . . . . . . . . . . . . . . . . . . . . . . . . 3,420 (3,123) (234) (502) 38,068
Net Realized and Unrealized Gain (Loss) on InvestmentsNet realized gain (loss) from:
Investments . . . . . . . . . . . . . . . . . . . . . . . . . . . . . . . . . . . . . . . . . . 103 95,124 2,427 21,827 194,026Investment in affiliates. . . . . . . . . . . . . . . . . . . . . . . . . . . . . . . . — — — — 225Foreign currency transactions . . . . . . . . . . . . . . . . . . . . . . . . 17 — 3 2 —Foreign capital gains tax . . . . . . . . . . . . . . . . . . . . . . . . . . . . . . (508) — — — —Forward foreign currency transactions . . . . . . . . . . . . . . . 89 — (5) — —Written options . . . . . . . . . . . . . . . . . . . . . . . . . . . . . . . . . . . . . . . — — — — 2,500
Net change in unrealized appreciation (depreciation) on:Investments . . . . . . . . . . . . . . . . . . . . . . . . . . . . . . . . . . . . . . . . . . (34,744) 20,808 (2,024) (1,974) 51,415Investment in affiliates. . . . . . . . . . . . . . . . . . . . . . . . . . . . . . . . — — — — 212Foreign currency transactions . . . . . . . . . . . . . . . . . . . . . . . . 6 — 2 —(1) —Foreign capital gains tax . . . . . . . . . . . . . . . . . . . . . . . . . . . . . . 285 — — — —Written options . . . . . . . . . . . . . . . . . . . . . . . . . . . . . . . . . . . . . . . — — — — 3,516
Net realized and unrealized gain (loss) on investments . . (34,752) 115,932 403 19,855 251,894
VIRTUS INVESTMENT TRUSTSTATEMENTS OF OPERATIONS (Unaudited)SIX MONTHS ENDED DECEMBER 31, 2021
($ reported in thousands)
See Notes to Financial Statements
58

AllianzGI EmergingMarkets
Opportunities FundAllianzGI Focused
Growth FundAllianzGI GlobalSmall-Cap Fund
AllianzGI HealthSciences Fund
AllianzGI Income &Growth Fund
Net increase (decrease) in net assets resulting fromoperations. . . . . . . . . . . . . . . . . . . . . . . . . . . . . . . . . . . . . . . . . . . . . . . $(31,332) $112,809 $ 169 $19,353 $289,962
(1) Amount is less than $500.(2) See Note 4D in Notes to Financial Statements.
VIRTUS INVESTMENT TRUSTSTATEMENTS OF OPERATIONS (Unaudited) (Continued)
SIX MONTHS ENDED DECEMBER 31, 2021
($ reported in thousands)
See Notes to Financial Statements
59

AllianzGI Mid-CapGrowth Fund
AllianzGISmall-Cap Fund
AllianzGITechnology Fund
NFJ Dividend ValueFund
NFJ InternationalValue Fund
Investment IncomeDividends . . . . . . . . . . . . . . . . . . . . . . . . . . . . . . . . . . . . . . . . . . . . . . . $ 891 $1,364 $ 4,042 $ 11,545 $ 2,594Foreign taxes withheld . . . . . . . . . . . . . . . . . . . . . . . . . . . . . . . . . . — (2) (221) (263) (253)
Total investment income . . . . . . . . . . . . . . . . . . . . . . 891 1,362 3,821 11,282 2,341
ExpensesInvestment advisory fees . . . . . . . . . . . . . . . . . . . . . . . . . . . . . . . . 1,193 532 11,324 2,006 448Distribution and service fees, Class A . . . . . . . . . . . . . . . . . . . 490 110 1,046 545 87Distribution and service fees, Class C . . . . . . . . . . . . . . . . . . . 69 24 269 90 15Distribution and service fees, Administrative Class . . . . . . 4 — 26 44 2Administration and accounting fees . . . . . . . . . . . . . . . . . . . . . 251 91 1,229 438 77Transfer agent fees and expenses . . . . . . . . . . . . . . . . . . . . . . . 126 43 583 208 37Sub-transfer agent fees and expenses, Class A . . . . . . . . . 97 32 352 237 77Sub-transfer agent fees and expenses, Class C . . . . . . . . . . 4 2 25 10 2Sub-transfer agent fees and expenses, Class P . . . . . . . . . . 15 18 100 89 13Sub-transfer agent fees and expenses, Institutional
Class . . . . . . . . . . . . . . . . . . . . . . . . . . . . . . . . . . . . . . . . . . . . . . . . . 21 18 361 132 13Sub-transfer agent fees and expenses, Administrative
Class . . . . . . . . . . . . . . . . . . . . . . . . . . . . . . . . . . . . . . . . . . . . . . . . . —(1) — 72 4 1Custodian fees . . . . . . . . . . . . . . . . . . . . . . . . . . . . . . . . . . . . . . . . . . 8 16 42 16 14Printing fees and expenses . . . . . . . . . . . . . . . . . . . . . . . . . . . . . 11 5 54 27 6Professional fees . . . . . . . . . . . . . . . . . . . . . . . . . . . . . . . . . . . . . . . 17 16 27 18 18Interest expense and/or commitment fees. . . . . . . . . . . . . . . 3 2 4 2 —(1)
Registration fees . . . . . . . . . . . . . . . . . . . . . . . . . . . . . . . . . . . . . . . . 19 28 28 28 31Trustees’ fees and expenses . . . . . . . . . . . . . . . . . . . . . . . . . . . . 39 13 216 70 13Miscellaneous expenses. . . . . . . . . . . . . . . . . . . . . . . . . . . . . . . . . 34 13 72 50 23
Total expenses . . . . . . . . . . . . . . . . . . . . . . . . . . . . . . . . . . . . . . . . 2,401 963 15,830 4,014 877Less net expenses reimbursed and/or waived by
investment adviser and/or administrator (2). . . . . . . . . . . — (40) (57) (99) (22)
Net expenses . . . . . . . . . . . . . . . . . . . . . . . . . . . . . . . . . . . . . . . . . 2,401 923 15,773 3,915 855
Net investment income (loss) . . . . . . . . . . . . . . . . . . . . . . . . . . . . . (1,510) 439 (11,952) 7,367 1,486
Net Realized and Unrealized Gain (Loss) on InvestmentsNet realized gain (loss) from:
Investments . . . . . . . . . . . . . . . . . . . . . . . . . . . . . . . . . . . . . . . . . . 35,773 5,956 230,842 60,498 6,138Foreign currency transactions . . . . . . . . . . . . . . . . . . . . . . . . — — (36) — 6Forward foreign currency transactions . . . . . . . . . . . . . . . — — (25) — —Written options . . . . . . . . . . . . . . . . . . . . . . . . . . . . . . . . . . . . . . . — — 376 — —
Net change in unrealized appreciation (depreciation) on:Investments . . . . . . . . . . . . . . . . . . . . . . . . . . . . . . . . . . . . . . . . . . (15,630) (329) (81,644) 32,791 (9,677)Foreign currency transactions . . . . . . . . . . . . . . . . . . . . . . . . — — 30 — (9)Written options . . . . . . . . . . . . . . . . . . . . . . . . . . . . . . . . . . . . . . . — — 3,605 — —
Net realized and unrealized gain (loss) on investments . . 20,143 5,627 153,148 93,289 (3,542)
Net increase (decrease) in net assets resulting fromoperations. . . . . . . . . . . . . . . . . . . . . . . . . . . . . . . . . . . . . . . . . . . . . . . $ 18,633 $6,066 $141,196 $100,656 $(2,056)
(1) Amount is less than $500.(2) See Note 4D in Notes to Financial Statements.
VIRTUS INVESTMENT TRUSTSTATEMENTS OF OPERATIONS (Unaudited) (Continued)
SIX MONTHS ENDED DECEMBER 31, 2021
($ reported in thousands)
See Notes to Financial Statements
60
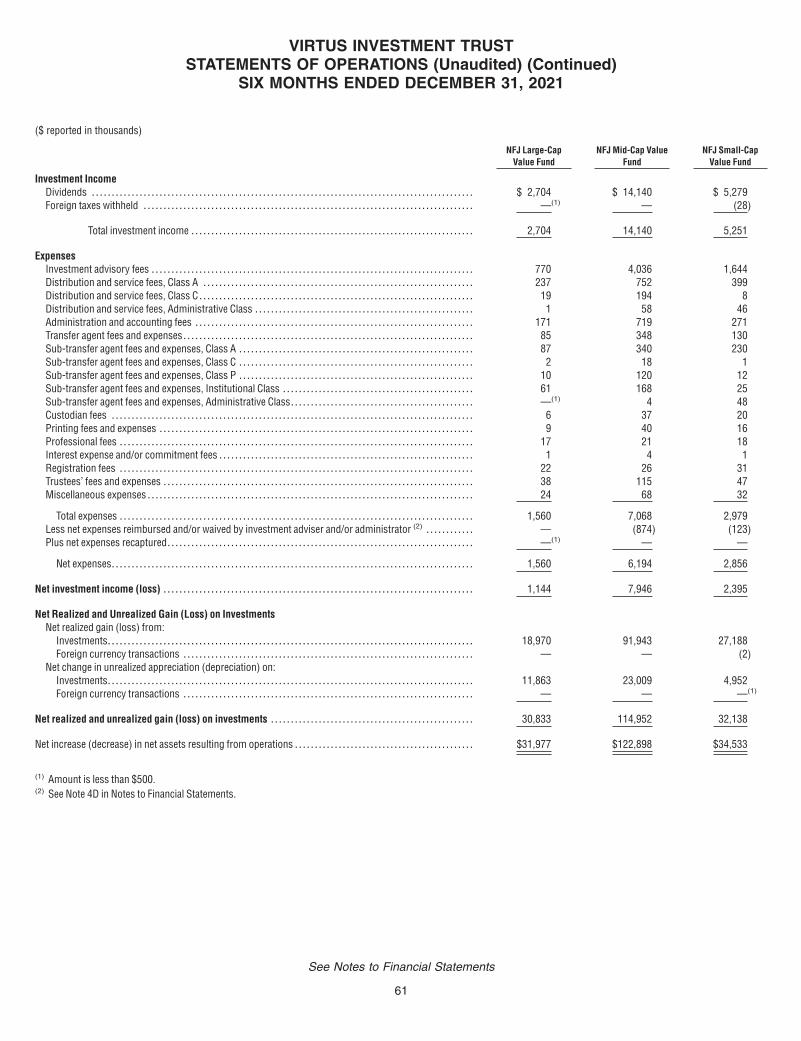
NFJ Large-CapValue Fund
NFJ Mid-Cap ValueFund
NFJ Small-CapValue Fund
Investment IncomeDividends . . . . . . . . . . . . . . . . . . . . . . . . . . . . . . . . . . . . . . . . . . . . . . . . . . . . . . . . . . . . . . . . . . . . . . . . . . . . . . . . . . . . . . . . . . . . . . . . $ 2,704 $ 14,140 $ 5,279Foreign taxes withheld . . . . . . . . . . . . . . . . . . . . . . . . . . . . . . . . . . . . . . . . . . . . . . . . . . . . . . . . . . . . . . . . . . . . . . . . . . . . . . . . . . . —(1) — (28)
Total investment income . . . . . . . . . . . . . . . . . . . . . . . . . . . . . . . . . . . . . . . . . . . . . . . . . . . . . . . . . . . . . . . . . . . . . . . 2,704 14,140 5,251
ExpensesInvestment advisory fees . . . . . . . . . . . . . . . . . . . . . . . . . . . . . . . . . . . . . . . . . . . . . . . . . . . . . . . . . . . . . . . . . . . . . . . . . . . . . . . . . 770 4,036 1,644Distribution and service fees, Class A . . . . . . . . . . . . . . . . . . . . . . . . . . . . . . . . . . . . . . . . . . . . . . . . . . . . . . . . . . . . . . . . . . . . 237 752 399Distribution and service fees, Class C . . . . . . . . . . . . . . . . . . . . . . . . . . . . . . . . . . . . . . . . . . . . . . . . . . . . . . . . . . . . . . . . . . . . . 19 194 8Distribution and service fees, Administrative Class . . . . . . . . . . . . . . . . . . . . . . . . . . . . . . . . . . . . . . . . . . . . . . . . . . . . . . . 1 58 46Administration and accounting fees . . . . . . . . . . . . . . . . . . . . . . . . . . . . . . . . . . . . . . . . . . . . . . . . . . . . . . . . . . . . . . . . . . . . . . 171 719 271Transfer agent fees and expenses . . . . . . . . . . . . . . . . . . . . . . . . . . . . . . . . . . . . . . . . . . . . . . . . . . . . . . . . . . . . . . . . . . . . . . . . . 85 348 130Sub-transfer agent fees and expenses, Class A . . . . . . . . . . . . . . . . . . . . . . . . . . . . . . . . . . . . . . . . . . . . . . . . . . . . . . . . . . . 87 340 230Sub-transfer agent fees and expenses, Class C . . . . . . . . . . . . . . . . . . . . . . . . . . . . . . . . . . . . . . . . . . . . . . . . . . . . . . . . . . . 2 18 1Sub-transfer agent fees and expenses, Class P . . . . . . . . . . . . . . . . . . . . . . . . . . . . . . . . . . . . . . . . . . . . . . . . . . . . . . . . . . . 10 120 12Sub-transfer agent fees and expenses, Institutional Class . . . . . . . . . . . . . . . . . . . . . . . . . . . . . . . . . . . . . . . . . . . . . . . . 61 168 25Sub-transfer agent fees and expenses, Administrative Class. . . . . . . . . . . . . . . . . . . . . . . . . . . . . . . . . . . . . . . . . . . . . . —(1) 4 48Custodian fees . . . . . . . . . . . . . . . . . . . . . . . . . . . . . . . . . . . . . . . . . . . . . . . . . . . . . . . . . . . . . . . . . . . . . . . . . . . . . . . . . . . . . . . . . . . 6 37 20Printing fees and expenses . . . . . . . . . . . . . . . . . . . . . . . . . . . . . . . . . . . . . . . . . . . . . . . . . . . . . . . . . . . . . . . . . . . . . . . . . . . . . . . 9 40 16Professional fees . . . . . . . . . . . . . . . . . . . . . . . . . . . . . . . . . . . . . . . . . . . . . . . . . . . . . . . . . . . . . . . . . . . . . . . . . . . . . . . . . . . . . . . . . 17 21 18Interest expense and/or commitment fees . . . . . . . . . . . . . . . . . . . . . . . . . . . . . . . . . . . . . . . . . . . . . . . . . . . . . . . . . . . . . . . . 1 4 1Registration fees . . . . . . . . . . . . . . . . . . . . . . . . . . . . . . . . . . . . . . . . . . . . . . . . . . . . . . . . . . . . . . . . . . . . . . . . . . . . . . . . . . . . . . . . . 22 26 31Trustees’ fees and expenses . . . . . . . . . . . . . . . . . . . . . . . . . . . . . . . . . . . . . . . . . . . . . . . . . . . . . . . . . . . . . . . . . . . . . . . . . . . . . . 38 115 47Miscellaneous expenses . . . . . . . . . . . . . . . . . . . . . . . . . . . . . . . . . . . . . . . . . . . . . . . . . . . . . . . . . . . . . . . . . . . . . . . . . . . . . . . . . . 24 68 32
Total expenses . . . . . . . . . . . . . . . . . . . . . . . . . . . . . . . . . . . . . . . . . . . . . . . . . . . . . . . . . . . . . . . . . . . . . . . . . . . . . . . . . . . . . . . . . 1,560 7,068 2,979Less net expenses reimbursed and/or waived by investment adviser and/or administrator (2) . . . . . . . . . . . . — (874) (123)Plus net expenses recaptured. . . . . . . . . . . . . . . . . . . . . . . . . . . . . . . . . . . . . . . . . . . . . . . . . . . . . . . . . . . . . . . . . . . . . . . . . . . . . —(1) — —
Net expenses. . . . . . . . . . . . . . . . . . . . . . . . . . . . . . . . . . . . . . . . . . . . . . . . . . . . . . . . . . . . . . . . . . . . . . . . . . . . . . . . . . . . . . . . . . . 1,560 6,194 2,856
Net investment income (loss) . . . . . . . . . . . . . . . . . . . . . . . . . . . . . . . . . . . . . . . . . . . . . . . . . . . . . . . . . . . . . . . . . . . . . . . . . . . . . . 1,144 7,946 2,395
Net Realized and Unrealized Gain (Loss) on InvestmentsNet realized gain (loss) from:
Investments. . . . . . . . . . . . . . . . . . . . . . . . . . . . . . . . . . . . . . . . . . . . . . . . . . . . . . . . . . . . . . . . . . . . . . . . . . . . . . . . . . . . . . . . . . . . 18,970 91,943 27,188Foreign currency transactions . . . . . . . . . . . . . . . . . . . . . . . . . . . . . . . . . . . . . . . . . . . . . . . . . . . . . . . . . . . . . . . . . . . . . . . . . — — (2)
Net change in unrealized appreciation (depreciation) on:Investments. . . . . . . . . . . . . . . . . . . . . . . . . . . . . . . . . . . . . . . . . . . . . . . . . . . . . . . . . . . . . . . . . . . . . . . . . . . . . . . . . . . . . . . . . . . . 11,863 23,009 4,952Foreign currency transactions . . . . . . . . . . . . . . . . . . . . . . . . . . . . . . . . . . . . . . . . . . . . . . . . . . . . . . . . . . . . . . . . . . . . . . . . . — — —(1)
Net realized and unrealized gain (loss) on investments . . . . . . . . . . . . . . . . . . . . . . . . . . . . . . . . . . . . . . . . . . . . . . . . . . . 30,833 114,952 32,138
Net increase (decrease) in net assets resulting from operations . . . . . . . . . . . . . . . . . . . . . . . . . . . . . . . . . . . . . . . . . . . . . $31,977 $122,898 $34,533
(1) Amount is less than $500.(2) See Note 4D in Notes to Financial Statements.
VIRTUS INVESTMENT TRUSTSTATEMENTS OF OPERATIONS (Unaudited) (Continued)
SIX MONTHS ENDED DECEMBER 31, 2021
($ reported in thousands)
See Notes to Financial Statements
61

AllianzGI Emerging MarketsOpportunities Fund AllianzGI Focused Growth Fund AllianzGI Global Small-Cap Fund
Six Months EndedDecember 31,
2021(Unaudited)
Year EndedJune 30,
2021
Six Months EndedDecember 31,
2021(Unaudited)
Year EndedJune 30,
2021
Six Months EndedDecember 31,
2021(Unaudited)
Year EndedJune 30,
2021
Increase (Decrease) in Net Assets Resulting fromOperationsNet investment income (loss) . . . . . . . . . . . . . . . . . . . . . . . . . . . . . . $ 3,420 $ 3,567 $ (3,123) $ (5,397) $ (234) $ (379)Net realized gain (loss) . . . . . . . . . . . . . . . . . . . . . . . . . . . . . . . . . . . . . (299) 65,009 95,124 252,636 2,425 25,830Net change in unrealized appreciation (depreciation) . . . . . . . (34,453) 35,507 20,808 239,898 (2,022) 10,708
Increase (decrease) in net assets resulting fromoperations . . . . . . . . . . . . . . . . . . . . . . . . . . . . . . . . . . . . . . . . . . . . . . . (31,332) 104,083 112,809 487,137 169 36,159
Dividends and Distributions to ShareholdersNet Investment Income and Net Realized Gains:
Class A . . . . . . . . . . . . . . . . . . . . . . . . . . . . . . . . . . . . . . . . . . . . . . . . . . (397) (332) (141,631) (61,955) (12,359) (2,066)Class C . . . . . . . . . . . . . . . . . . . . . . . . . . . . . . . . . . . . . . . . . . . . . . . . . . . — (—)(1) (12,875) (7,421) (853) (208)Class R. . . . . . . . . . . . . . . . . . . . . . . . . . . . . . . . . . . . . . . . . . . . . . . . . . . — — — (2,811) — —Class P . . . . . . . . . . . . . . . . . . . . . . . . . . . . . . . . . . . . . . . . . . . . . . . . . . . (163) (215) (23,010) (11,539) (726) (213)Institutional Class . . . . . . . . . . . . . . . . . . . . . . . . . . . . . . . . . . . . . . . . (4,023) (2,694) (40,132) (17,047) (8,802) (1,361)Class R6 . . . . . . . . . . . . . . . . . . . . . . . . . . . . . . . . . . . . . . . . . . . . . . . . . (727) (371) (36,559) (15,711) — —Administrative Class . . . . . . . . . . . . . . . . . . . . . . . . . . . . . . . . . . . . . — — (1,643) (563) — —
Total dividends and distributions to shareholders. . . . . . . . . (5,310) (3,612) (255,850) (117,047) (22,740) (3,848)
Change in Net Assets from Capital Transactions (See Note 6):Class A . . . . . . . . . . . . . . . . . . . . . . . . . . . . . . . . . . . . . . . . . . . . . . . . . . (960) (11,810) 82,791 19,585 7,173 (1,210)Class C . . . . . . . . . . . . . . . . . . . . . . . . . . . . . . . . . . . . . . . . . . . . . . . . . . . (486) (1,106) 2,950 (8,647) 138 (2,124)Class R. . . . . . . . . . . . . . . . . . . . . . . . . . . . . . . . . . . . . . . . . . . . . . . . . . . — — — (24,766) — —Class P . . . . . . . . . . . . . . . . . . . . . . . . . . . . . . . . . . . . . . . . . . . . . . . . . . . 2,250 (10,319) 4,372 (5,468) 102 (2,742)Institutional Class . . . . . . . . . . . . . . . . . . . . . . . . . . . . . . . . . . . . . . . . 32,407 (52,891) 36,222 (12,240) 5,761 (2,151)Class R6 . . . . . . . . . . . . . . . . . . . . . . . . . . . . . . . . . . . . . . . . . . . . . . . . . 9,888 2,631 29,788 12,989 — —Administrative Class . . . . . . . . . . . . . . . . . . . . . . . . . . . . . . . . . . . . . — — 2,883 553 — —
Increase (decrease) in net assets from capitaltransactions . . . . . . . . . . . . . . . . . . . . . . . . . . . . . . . . . . . . . . . . . . . . . 43,099 (73,495) 159,006 (17,994) 13,174 (8,227)
Net increase (decrease) in net assets . . . . . . . . . . . . . . . . . . . . . . . . 6,457 26,976 15,965 352,096 (9,397) 24,084
Net AssetsBeginning of period . . . . . . . . . . . . . . . . . . . . . . . . . . . . . . . . . . . . . . . . . . . 280,503 253,527 1,428,449 1,076,353 98,638 74,554
End of Period. . . . . . . . . . . . . . . . . . . . . . . . . . . . . . . . . . . . . . . . . . . . . . . . . . $ 286,960 $ 280,503 $ 1,444,414 $ 1,428,449 $ 89,241 $ 98,638
(1) Amount is less than $500.
VIRTUS INVESTMENT TRUSTSTATEMENTS OF CHANGES IN NET ASSETS
($ reported in thousands)
See Notes to Financial Statements
62
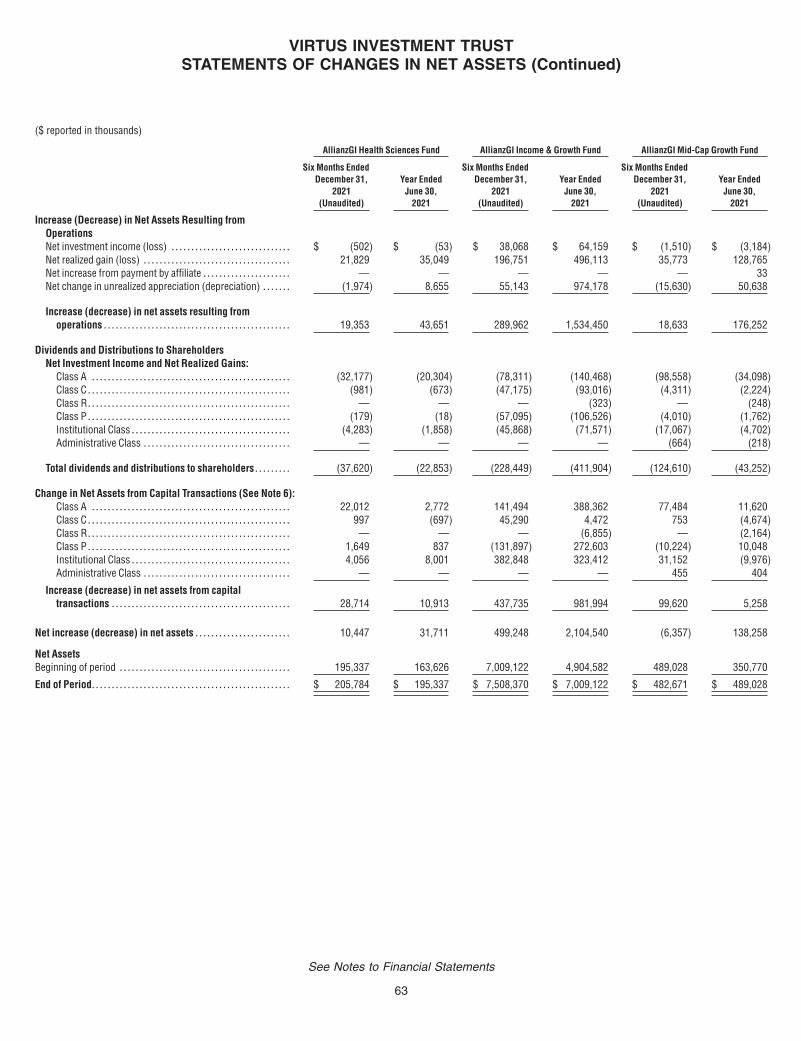
AllianzGI Health Sciences Fund AllianzGI Income & Growth Fund AllianzGI Mid-Cap Growth Fund
Six Months EndedDecember 31,
2021(Unaudited)
Year EndedJune 30,
2021
Six Months EndedDecember 31,
2021(Unaudited)
Year EndedJune 30,
2021
Six Months EndedDecember 31,
2021(Unaudited)
Year EndedJune 30,
2021
Increase (Decrease) in Net Assets Resulting fromOperationsNet investment income (loss) . . . . . . . . . . . . . . . . . . . . . . . . . . . . . . $ (502) $ (53) $ 38,068 $ 64,159 $ (1,510) $ (3,184)Net realized gain (loss) . . . . . . . . . . . . . . . . . . . . . . . . . . . . . . . . . . . . . 21,829 35,049 196,751 496,113 35,773 128,765Net increase from payment by affiliate . . . . . . . . . . . . . . . . . . . . . . — — — — — 33Net change in unrealized appreciation (depreciation) . . . . . . . (1,974) 8,655 55,143 974,178 (15,630) 50,638
Increase (decrease) in net assets resulting fromoperations . . . . . . . . . . . . . . . . . . . . . . . . . . . . . . . . . . . . . . . . . . . . . . . 19,353 43,651 289,962 1,534,450 18,633 176,252
Dividends and Distributions to ShareholdersNet Investment Income and Net Realized Gains:
Class A . . . . . . . . . . . . . . . . . . . . . . . . . . . . . . . . . . . . . . . . . . . . . . . . . . (32,177) (20,304) (78,311) (140,468) (98,558) (34,098)Class C . . . . . . . . . . . . . . . . . . . . . . . . . . . . . . . . . . . . . . . . . . . . . . . . . . . (981) (673) (47,175) (93,016) (4,311) (2,224)Class R. . . . . . . . . . . . . . . . . . . . . . . . . . . . . . . . . . . . . . . . . . . . . . . . . . . — — — (323) — (248)Class P . . . . . . . . . . . . . . . . . . . . . . . . . . . . . . . . . . . . . . . . . . . . . . . . . . . (179) (18) (57,095) (106,526) (4,010) (1,762)Institutional Class . . . . . . . . . . . . . . . . . . . . . . . . . . . . . . . . . . . . . . . . (4,283) (1,858) (45,868) (71,571) (17,067) (4,702)Administrative Class . . . . . . . . . . . . . . . . . . . . . . . . . . . . . . . . . . . . . — — — — (664) (218)
Total dividends and distributions to shareholders. . . . . . . . . (37,620) (22,853) (228,449) (411,904) (124,610) (43,252)
Change in Net Assets from Capital Transactions (See Note 6):Class A . . . . . . . . . . . . . . . . . . . . . . . . . . . . . . . . . . . . . . . . . . . . . . . . . . 22,012 2,772 141,494 388,362 77,484 11,620Class C . . . . . . . . . . . . . . . . . . . . . . . . . . . . . . . . . . . . . . . . . . . . . . . . . . . 997 (697) 45,290 4,472 753 (4,674)Class R. . . . . . . . . . . . . . . . . . . . . . . . . . . . . . . . . . . . . . . . . . . . . . . . . . . — — — (6,855) — (2,164)Class P . . . . . . . . . . . . . . . . . . . . . . . . . . . . . . . . . . . . . . . . . . . . . . . . . . . 1,649 837 (131,897) 272,603 (10,224) 10,048Institutional Class . . . . . . . . . . . . . . . . . . . . . . . . . . . . . . . . . . . . . . . . 4,056 8,001 382,848 323,412 31,152 (9,976)Administrative Class . . . . . . . . . . . . . . . . . . . . . . . . . . . . . . . . . . . . . — — — — 455 404
Increase (decrease) in net assets from capitaltransactions . . . . . . . . . . . . . . . . . . . . . . . . . . . . . . . . . . . . . . . . . . . . . 28,714 10,913 437,735 981,994 99,620 5,258
Net increase (decrease) in net assets . . . . . . . . . . . . . . . . . . . . . . . . 10,447 31,711 499,248 2,104,540 (6,357) 138,258
Net AssetsBeginning of period . . . . . . . . . . . . . . . . . . . . . . . . . . . . . . . . . . . . . . . . . . . 195,337 163,626 7,009,122 4,904,582 489,028 350,770
End of Period. . . . . . . . . . . . . . . . . . . . . . . . . . . . . . . . . . . . . . . . . . . . . . . . . . $ 205,784 $ 195,337 $ 7,508,370 $ 7,009,122 $ 482,671 $ 489,028
VIRTUS INVESTMENT TRUSTSTATEMENTS OF CHANGES IN NET ASSETS (Continued)
($ reported in thousands)
See Notes to Financial Statements
63
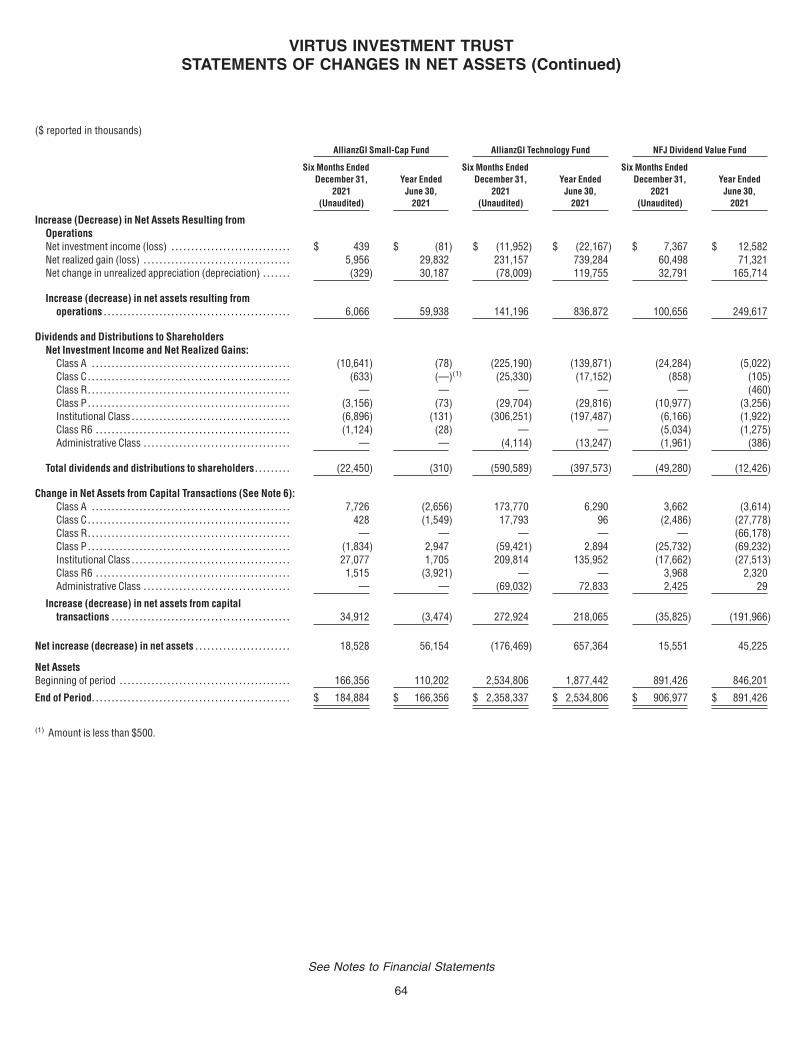
AllianzGI Small-Cap Fund AllianzGI Technology Fund NFJ Dividend Value Fund
Six Months EndedDecember 31,
2021(Unaudited)
Year EndedJune 30,
2021
Six Months EndedDecember 31,
2021(Unaudited)
Year EndedJune 30,
2021
Six Months EndedDecember 31,
2021(Unaudited)
Year EndedJune 30,
2021
Increase (Decrease) in Net Assets Resulting fromOperationsNet investment income (loss) . . . . . . . . . . . . . . . . . . . . . . . . . . . . . . $ 439 $ (81) $ (11,952) $ (22,167) $ 7,367 $ 12,582Net realized gain (loss) . . . . . . . . . . . . . . . . . . . . . . . . . . . . . . . . . . . . . 5,956 29,832 231,157 739,284 60,498 71,321Net change in unrealized appreciation (depreciation) . . . . . . . (329) 30,187 (78,009) 119,755 32,791 165,714
Increase (decrease) in net assets resulting fromoperations . . . . . . . . . . . . . . . . . . . . . . . . . . . . . . . . . . . . . . . . . . . . . . . 6,066 59,938 141,196 836,872 100,656 249,617
Dividends and Distributions to ShareholdersNet Investment Income and Net Realized Gains:
Class A . . . . . . . . . . . . . . . . . . . . . . . . . . . . . . . . . . . . . . . . . . . . . . . . . . (10,641) (78) (225,190) (139,871) (24,284) (5,022)Class C . . . . . . . . . . . . . . . . . . . . . . . . . . . . . . . . . . . . . . . . . . . . . . . . . . . (633) (—)(1) (25,330) (17,152) (858) (105)Class R. . . . . . . . . . . . . . . . . . . . . . . . . . . . . . . . . . . . . . . . . . . . . . . . . . . — — — — — (460)Class P . . . . . . . . . . . . . . . . . . . . . . . . . . . . . . . . . . . . . . . . . . . . . . . . . . . (3,156) (73) (29,704) (29,816) (10,977) (3,256)Institutional Class . . . . . . . . . . . . . . . . . . . . . . . . . . . . . . . . . . . . . . . . (6,896) (131) (306,251) (197,487) (6,166) (1,922)Class R6 . . . . . . . . . . . . . . . . . . . . . . . . . . . . . . . . . . . . . . . . . . . . . . . . . (1,124) (28) — — (5,034) (1,275)Administrative Class . . . . . . . . . . . . . . . . . . . . . . . . . . . . . . . . . . . . . — — (4,114) (13,247) (1,961) (386)
Total dividends and distributions to shareholders. . . . . . . . . (22,450) (310) (590,589) (397,573) (49,280) (12,426)
Change in Net Assets from Capital Transactions (See Note 6):Class A . . . . . . . . . . . . . . . . . . . . . . . . . . . . . . . . . . . . . . . . . . . . . . . . . . 7,726 (2,656) 173,770 6,290 3,662 (3,614)Class C . . . . . . . . . . . . . . . . . . . . . . . . . . . . . . . . . . . . . . . . . . . . . . . . . . . 428 (1,549) 17,793 96 (2,486) (27,778)Class R. . . . . . . . . . . . . . . . . . . . . . . . . . . . . . . . . . . . . . . . . . . . . . . . . . . — — — — — (66,178)Class P . . . . . . . . . . . . . . . . . . . . . . . . . . . . . . . . . . . . . . . . . . . . . . . . . . . (1,834) 2,947 (59,421) 2,894 (25,732) (69,232)Institutional Class . . . . . . . . . . . . . . . . . . . . . . . . . . . . . . . . . . . . . . . . 27,077 1,705 209,814 135,952 (17,662) (27,513)Class R6 . . . . . . . . . . . . . . . . . . . . . . . . . . . . . . . . . . . . . . . . . . . . . . . . . 1,515 (3,921) — — 3,968 2,320Administrative Class . . . . . . . . . . . . . . . . . . . . . . . . . . . . . . . . . . . . . — — (69,032) 72,833 2,425 29
Increase (decrease) in net assets from capitaltransactions . . . . . . . . . . . . . . . . . . . . . . . . . . . . . . . . . . . . . . . . . . . . . 34,912 (3,474) 272,924 218,065 (35,825) (191,966)
Net increase (decrease) in net assets . . . . . . . . . . . . . . . . . . . . . . . . 18,528 56,154 (176,469) 657,364 15,551 45,225
Net AssetsBeginning of period . . . . . . . . . . . . . . . . . . . . . . . . . . . . . . . . . . . . . . . . . . . 166,356 110,202 2,534,806 1,877,442 891,426 846,201
End of Period. . . . . . . . . . . . . . . . . . . . . . . . . . . . . . . . . . . . . . . . . . . . . . . . . . $ 184,884 $ 166,356 $ 2,358,337 $ 2,534,806 $ 906,977 $ 891,426
(1) Amount is less than $500.
VIRTUS INVESTMENT TRUSTSTATEMENTS OF CHANGES IN NET ASSETS (Continued)
($ reported in thousands)
See Notes to Financial Statements
64

NFJ International Value Fund NFJ Large-Cap Value Fund
Six Months EndedDecember 31,
2021(Unaudited)
Year EndedJune 30,
2021
Six Months EndedDecember 31,
2021(Unaudited)
Year EndedJune 30,
2021
Increase (Decrease) in Net Assets Resulting from OperationsNet investment income (loss) . . . . . . . . . . . . . . . . . . . . . . . . . . . . . . . . . . . . . . . . . . . . . . . . . . . . . . . . . . . . . . . . . . . . . . $ 1,486 $ 2,183 $ 1,144 $ 2,943Net realized gain (loss) . . . . . . . . . . . . . . . . . . . . . . . . . . . . . . . . . . . . . . . . . . . . . . . . . . . . . . . . . . . . . . . . . . . . . . . . . . . . . 6,144 29,101 18,970 19,471Net change in unrealized appreciation (depreciation) . . . . . . . . . . . . . . . . . . . . . . . . . . . . . . . . . . . . . . . . . . . . . . . (9,686) 16,296 11,863 77,782
Increase (decrease) in net assets resulting from operations. . . . . . . . . . . . . . . . . . . . . . . . . . . . . . . . . . . . . . (2,056) 47,580 31,977 100,196
Dividends and Distributions to ShareholdersNet Investment Income and Net Realized Gains:
Class A . . . . . . . . . . . . . . . . . . . . . . . . . . . . . . . . . . . . . . . . . . . . . . . . . . . . . . . . . . . . . . . . . . . . . . . . . . . . . . . . . . . . . . . . . . (1,146) (1,133) (10,609) (1,253)Class C . . . . . . . . . . . . . . . . . . . . . . . . . . . . . . . . . . . . . . . . . . . . . . . . . . . . . . . . . . . . . . . . . . . . . . . . . . . . . . . . . . . . . . . . . . . (39) (71) (192) (4)Class R. . . . . . . . . . . . . . . . . . . . . . . . . . . . . . . . . . . . . . . . . . . . . . . . . . . . . . . . . . . . . . . . . . . . . . . . . . . . . . . . . . . . . . . . . . . — (62) — (5)Class P . . . . . . . . . . . . . . . . . . . . . . . . . . . . . . . . . . . . . . . . . . . . . . . . . . . . . . . . . . . . . . . . . . . . . . . . . . . . . . . . . . . . . . . . . . . (458) (494) (1,080) (176)Institutional Class . . . . . . . . . . . . . . . . . . . . . . . . . . . . . . . . . . . . . . . . . . . . . . . . . . . . . . . . . . . . . . . . . . . . . . . . . . . . . . . . (879) (870) (7,178) (1,404)Class R6 . . . . . . . . . . . . . . . . . . . . . . . . . . . . . . . . . . . . . . . . . . . . . . . . . . . . . . . . . . . . . . . . . . . . . . . . . . . . . . . . . . . . . . . . . (50) (35) (6) —Administrative Class . . . . . . . . . . . . . . . . . . . . . . . . . . . . . . . . . . . . . . . . . . . . . . . . . . . . . . . . . . . . . . . . . . . . . . . . . . . . . (28) (92) (30) (5)
Total dividends and distributions to shareholders. . . . . . . . . . . . . . . . . . . . . . . . . . . . . . . . . . . . . . . . . . . . . . . . . (2,600) (2,757) (19,095) (2,847)
Change in Net Assets from Capital Transactions (See Note 6):Class A . . . . . . . . . . . . . . . . . . . . . . . . . . . . . . . . . . . . . . . . . . . . . . . . . . . . . . . . . . . . . . . . . . . . . . . . . . . . . . . . . . . . . . . . . . (3,998) (1,129) 62 (15,877)Class C . . . . . . . . . . . . . . . . . . . . . . . . . . . . . . . . . . . . . . . . . . . . . . . . . . . . . . . . . . . . . . . . . . . . . . . . . . . . . . . . . . . . . . . . . . . (797) (5,828) (543) (5,531)Class R. . . . . . . . . . . . . . . . . . . . . . . . . . . . . . . . . . . . . . . . . . . . . . . . . . . . . . . . . . . . . . . . . . . . . . . . . . . . . . . . . . . . . . . . . . . — (5,730) — (1,567)Class P . . . . . . . . . . . . . . . . . . . . . . . . . . . . . . . . . . . . . . . . . . . . . . . . . . . . . . . . . . . . . . . . . . . . . . . . . . . . . . . . . . . . . . . . . . . (1,922) (3,918) (2,010) (391)Institutional Class . . . . . . . . . . . . . . . . . . . . . . . . . . . . . . . . . . . . . . . . . . . . . . . . . . . . . . . . . . . . . . . . . . . . . . . . . . . . . . . . 1,129 (1,414) (5,687) (2,360)Class R6 . . . . . . . . . . . . . . . . . . . . . . . . . . . . . . . . . . . . . . . . . . . . . . . . . . . . . . . . . . . . . . . . . . . . . . . . . . . . . . . . . . . . . . . . . 176 1,073 100 —Administrative Class . . . . . . . . . . . . . . . . . . . . . . . . . . . . . . . . . . . . . . . . . . . . . . . . . . . . . . . . . . . . . . . . . . . . . . . . . . . . . 779 (1,691) —(1) (827)
Increase (decrease) in net assets from capital transactions . . . . . . . . . . . . . . . . . . . . . . . . . . . . . . . . . . . . . . (4,633) (18,637) (8,078) (26,553)
Net increase (decrease) in net assets . . . . . . . . . . . . . . . . . . . . . . . . . . . . . . . . . . . . . . . . . . . . . . . . . . . . . . . . . . . . . . . . (9,289) 26,186 4,804 70,796
Net AssetsBeginning of period . . . . . . . . . . . . . . . . . . . . . . . . . . . . . . . . . . . . . . . . . . . . . . . . . . . . . . . . . . . . . . . . . . . . . . . . . . . . . . . . . . . 155,651 129,465 338,817 268,021
End of Period. . . . . . . . . . . . . . . . . . . . . . . . . . . . . . . . . . . . . . . . . . . . . . . . . . . . . . . . . . . . . . . . . . . . . . . . . . . . . . . . . . . . . . . . . . $ 146,362 $ 155,651 $ 343,621 $ 338,817
(1) Amount is less than $500.
VIRTUS INVESTMENT TRUSTSTATEMENTS OF CHANGES IN NET ASSETS (Continued)
($ reported in thousands)
See Notes to Financial Statements
65
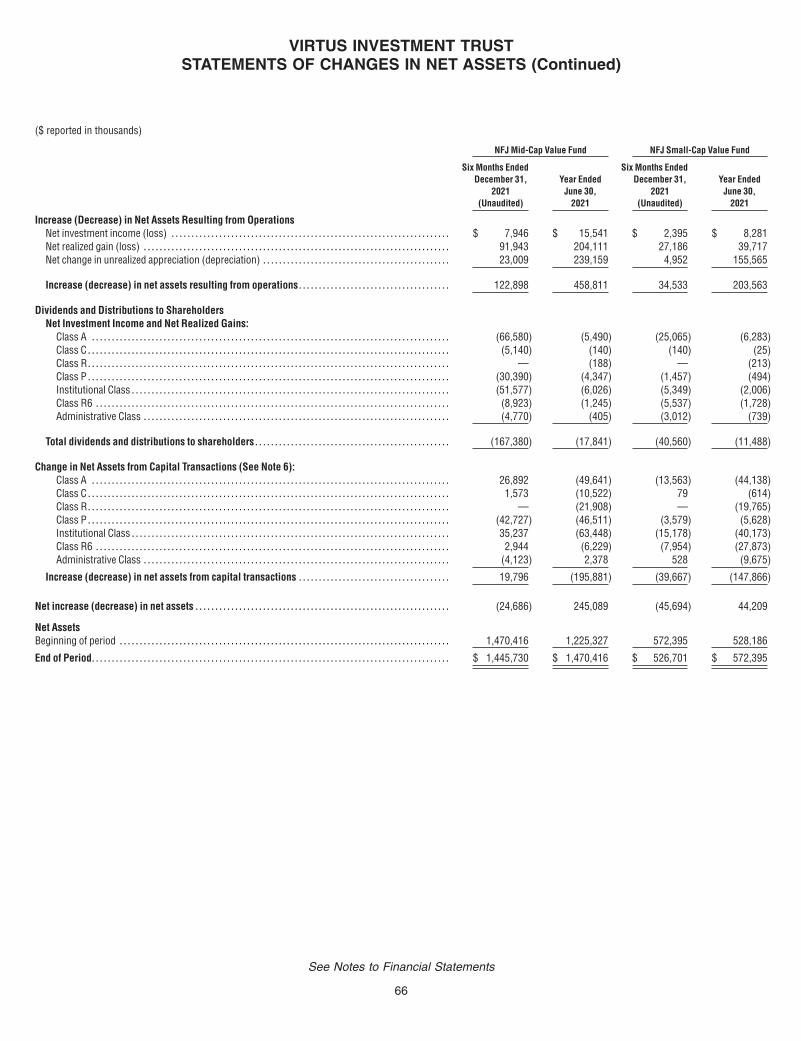
NFJ Mid-Cap Value Fund NFJ Small-Cap Value Fund
Six Months EndedDecember 31,
2021(Unaudited)
Year EndedJune 30,
2021
Six Months EndedDecember 31,
2021(Unaudited)
Year EndedJune 30,
2021
Increase (Decrease) in Net Assets Resulting from OperationsNet investment income (loss) . . . . . . . . . . . . . . . . . . . . . . . . . . . . . . . . . . . . . . . . . . . . . . . . . . . . . . . . . . . . . . . . . . . . . . $ 7,946 $ 15,541 $ 2,395 $ 8,281Net realized gain (loss) . . . . . . . . . . . . . . . . . . . . . . . . . . . . . . . . . . . . . . . . . . . . . . . . . . . . . . . . . . . . . . . . . . . . . . . . . . . . . 91,943 204,111 27,186 39,717Net change in unrealized appreciation (depreciation) . . . . . . . . . . . . . . . . . . . . . . . . . . . . . . . . . . . . . . . . . . . . . . . 23,009 239,159 4,952 155,565
Increase (decrease) in net assets resulting from operations. . . . . . . . . . . . . . . . . . . . . . . . . . . . . . . . . . . . . . 122,898 458,811 34,533 203,563
Dividends and Distributions to ShareholdersNet Investment Income and Net Realized Gains:
Class A . . . . . . . . . . . . . . . . . . . . . . . . . . . . . . . . . . . . . . . . . . . . . . . . . . . . . . . . . . . . . . . . . . . . . . . . . . . . . . . . . . . . . . . . . . (66,580) (5,490) (25,065) (6,283)Class C . . . . . . . . . . . . . . . . . . . . . . . . . . . . . . . . . . . . . . . . . . . . . . . . . . . . . . . . . . . . . . . . . . . . . . . . . . . . . . . . . . . . . . . . . . . (5,140) (140) (140) (25)Class R. . . . . . . . . . . . . . . . . . . . . . . . . . . . . . . . . . . . . . . . . . . . . . . . . . . . . . . . . . . . . . . . . . . . . . . . . . . . . . . . . . . . . . . . . . . — (188) — (213)Class P . . . . . . . . . . . . . . . . . . . . . . . . . . . . . . . . . . . . . . . . . . . . . . . . . . . . . . . . . . . . . . . . . . . . . . . . . . . . . . . . . . . . . . . . . . . (30,390) (4,347) (1,457) (494)Institutional Class . . . . . . . . . . . . . . . . . . . . . . . . . . . . . . . . . . . . . . . . . . . . . . . . . . . . . . . . . . . . . . . . . . . . . . . . . . . . . . . . (51,577) (6,026) (5,349) (2,006)Class R6 . . . . . . . . . . . . . . . . . . . . . . . . . . . . . . . . . . . . . . . . . . . . . . . . . . . . . . . . . . . . . . . . . . . . . . . . . . . . . . . . . . . . . . . . . (8,923) (1,245) (5,537) (1,728)Administrative Class . . . . . . . . . . . . . . . . . . . . . . . . . . . . . . . . . . . . . . . . . . . . . . . . . . . . . . . . . . . . . . . . . . . . . . . . . . . . . (4,770) (405) (3,012) (739)
Total dividends and distributions to shareholders. . . . . . . . . . . . . . . . . . . . . . . . . . . . . . . . . . . . . . . . . . . . . . . . . (167,380) (17,841) (40,560) (11,488)
Change in Net Assets from Capital Transactions (See Note 6):Class A . . . . . . . . . . . . . . . . . . . . . . . . . . . . . . . . . . . . . . . . . . . . . . . . . . . . . . . . . . . . . . . . . . . . . . . . . . . . . . . . . . . . . . . . . . 26,892 (49,641) (13,563) (44,138)Class C . . . . . . . . . . . . . . . . . . . . . . . . . . . . . . . . . . . . . . . . . . . . . . . . . . . . . . . . . . . . . . . . . . . . . . . . . . . . . . . . . . . . . . . . . . . 1,573 (10,522) 79 (614)Class R. . . . . . . . . . . . . . . . . . . . . . . . . . . . . . . . . . . . . . . . . . . . . . . . . . . . . . . . . . . . . . . . . . . . . . . . . . . . . . . . . . . . . . . . . . . — (21,908) — (19,765)Class P . . . . . . . . . . . . . . . . . . . . . . . . . . . . . . . . . . . . . . . . . . . . . . . . . . . . . . . . . . . . . . . . . . . . . . . . . . . . . . . . . . . . . . . . . . . (42,727) (46,511) (3,579) (5,628)Institutional Class . . . . . . . . . . . . . . . . . . . . . . . . . . . . . . . . . . . . . . . . . . . . . . . . . . . . . . . . . . . . . . . . . . . . . . . . . . . . . . . . 35,237 (63,448) (15,178) (40,173)Class R6 . . . . . . . . . . . . . . . . . . . . . . . . . . . . . . . . . . . . . . . . . . . . . . . . . . . . . . . . . . . . . . . . . . . . . . . . . . . . . . . . . . . . . . . . . 2,944 (6,229) (7,954) (27,873)Administrative Class . . . . . . . . . . . . . . . . . . . . . . . . . . . . . . . . . . . . . . . . . . . . . . . . . . . . . . . . . . . . . . . . . . . . . . . . . . . . . (4,123) 2,378 528 (9,675)
Increase (decrease) in net assets from capital transactions . . . . . . . . . . . . . . . . . . . . . . . . . . . . . . . . . . . . . . 19,796 (195,881) (39,667) (147,866)
Net increase (decrease) in net assets . . . . . . . . . . . . . . . . . . . . . . . . . . . . . . . . . . . . . . . . . . . . . . . . . . . . . . . . . . . . . . . . (24,686) 245,089 (45,694) 44,209
Net AssetsBeginning of period . . . . . . . . . . . . . . . . . . . . . . . . . . . . . . . . . . . . . . . . . . . . . . . . . . . . . . . . . . . . . . . . . . . . . . . . . . . . . . . . . . . 1,470,416 1,225,327 572,395 528,186
End of Period. . . . . . . . . . . . . . . . . . . . . . . . . . . . . . . . . . . . . . . . . . . . . . . . . . . . . . . . . . . . . . . . . . . . . . . . . . . . . . . . . . . . . . . . . . $ 1,445,730 $ 1,470,416 $ 526,701 $ 572,395
VIRTUS INVESTMENT TRUSTSTATEMENTS OF CHANGES IN NET ASSETS (Continued)
($ reported in thousands)
See Notes to Financial Statements
66

VIRTUS INVESTMENT TRUSTFINANCIAL HIGHLIGHTS
SELECTED PER SHARE DATA AND RATIOS FOR A SHARE OUTSTANDINGTHROUGHOUT EACH PERIOD
Net
Ass
etV
alu
e,B
egin
nin
go
fP
erio
d
Net
Inve
stm
ent
Inco
me
(Lo
ss)(1
)
Net
Rea
lized
and
Un
real
ized
Gai
n(L
oss
)
Tota
lfro
mIn
vest
men
tO
per
atio
ns
Div
iden
ds
fro
mN
etIn
vest
men
tIn
com
e
Ret
urn
of
Cap
ital
Dis
trib
uti
on
sfr
om
Net
Rea
lized
Gai
ns
Tota
lDis
trib
uti
on
s
Pay
men
tfr
om
Aff
iliat
e
Ch
ang
ein
Net
Ass
etV
alu
e
Net
Ass
etV
alu
e,E
nd
of
Per
iod
Tota
lRet
urn
(2)(
3)
Net
Ass
ets,
En
do
fP
erio
d(i
nth
ou
san
ds)
Rat
ioo
fN
etE
xpen
ses
toA
vera
ge
Net
Ass
ets(4
)(5
)
Rat
ioo
fG
ross
Exp
ense
sto
Ave
rag
eN
etA
sset
s(4)(
5)
Rat
ioo
fN
etIn
vest
men
tIn
com
e(L
oss
)to
Ave
rag
eN
etA
sset
s(4)
Po
rtfo
lioTu
rno
ver
Rat
e(2)
AllianzGI EmergingMarketsOpportunities Fund
Class A7/1/21 to 12/31/21(6) $ 37.61 0.37 (4.30) (3.93) (0.45) — — (0.45) — (4.38) $ 33.23 (10.40)% $ 28,860 1.29% 1.48% 2.09% 46%7/1/20 to 6/30/21 25.88 0.33 11.71 12.04 (0.31) — — (0.31) — 11.73 37.61 46.70 33,740 1.28(7) 1.57 0.98 807/1/19 to 6/30/20 27.06 0.46 (1.08) (0.62) (0.56) — — (0.56) — (1.18) 25.88 (2.45) 32,514 1.28 1.63 1.75 837/1/18 to 6/30/19 28.53 0.56 (1.55) (0.99) (0.48) — — (0.48) — (1.47) 27.06 (3.29) 48,388 1.26 1.61 2.08 1017/1/17 to 6/30/18 26.59 0.41 1.85 2.26 (0.32) — — (0.32) — 1.94 28.53 8.44 108,279 1.26 1.61 1.36 887/1/16 to 6/30/17 22.60 0.41 3.98 4.39 (0.40) — — (0.40) — 3.99 26.59 19.76 154,357 1.42 1.62 1.69 155Class C7/1/21 to 12/31/21(6) $ 37.41 0.27 (4.30) (4.03) — — — — — (4.03) $ 33.38 (10.75)% $ 1,085 2.04% 2.23% 1.50% 46%7/1/20 to 6/30/21 25.69 0.07 11.65 11.72 —(8) — — — — 11.72 37.41 45.62 1,713 2.03(7) 2.30 0.22 807/1/19 to 6/30/20 26.81 0.28 (1.10) (0.82) (0.30) — — (0.30) — (1.12) 25.69 (3.16) 2,022 2.03 2.38 1.08 837/1/18 to 6/30/19 28.05 0.31 (1.45) (1.14) (0.10) — — (0.10) — (1.24) 26.81 (4.05) 3,675 2.01 2.36 1.15 1017/1/17 to 6/30/18 26.13 0.16 1.84 2.00 (0.08) — — (0.08) — 1.92 28.05 7.63 8,113 2.01 2.36 0.55 887/1/16 to 6/30/17 22.09 0.19 3.96 4.15 (0.11) — — (0.11) — 4.04 26.13 18.91 8,982 2.17 2.37 0.80 155Class P7/1/21 to 12/31/21(6) $ 36.71 0.38 (4.19) (3.81) (0.61) — — (0.61) — (4.42) $ 32.29 (10.29)% $ 9,119 1.04% 1.19% 2.21% 46%7/1/20 to 6/30/21 25.30 0.33 11.53 11.86 (0.45) — — (0.45) — 11.41 36.71 47.12 7,945 1.02(7) 1.32 1.05 807/1/19 to 6/30/20 26.46 0.53 (1.06) (0.53) (0.63) — — (0.63) — (1.16) 25.30 (2.19) 12,814 1.03 1.38 2.07 837/1/18 to 6/30/19 28.02 0.55 (1.47) (0.92) (0.64) — — (0.64) — (1.56) 26.46 (3.05) 20,454 1.01 1.36 2.08 1017/1/17 to 6/30/18 26.17 0.46 1.84 2.30 (0.45) — — (0.45) — 1.85 28.02 8.71 29,887 1.01 1.36 1.55 887/1/16 to 6/30/17 22.23 0.44 3.94 4.38 (0.44) — — (0.44) — 3.94 26.17 20.11 21,586 1.17 1.37 1.86 155Institutional Class7/1/21 to 12/31/21(6) $ 37.62 0.43 (4.31) (3.88) (0.64) — — (0.64) — (4.52) $ 33.10 (10.25)% $ 211,791 0.94% 1.20% 2.40% 46%7/1/20 to 6/30/21 25.91 0.48 11.70 12.18 (0.47) — — (0.47) — 11.71 37.62 47.27 206,383 0.93(7) 1.26 1.43 807/1/19 to 6/30/20 27.10 0.54 (1.06) (0.52) (0.67) — — (0.67) — (1.19) 25.91 (2.11) 186,595 0.93 1.28 2.05 837/1/18 to 6/30/19 28.72 0.54 (1.47) (0.93) (0.69) — — (0.69) — (1.62) 27.10 (2.97) 282,196 0.91 1.26 2.03 1017/1/17 to 6/30/18 26.83 0.53 1.85 2.38 (0.49) — — (0.49) — 1.89 28.72 8.79 197,536 0.91 1.26 1.74 887/1/16 to 6/30/17 22.74 0.49 4.03 4.52 (0.43) — — (0.43) — 4.09 26.83 20.26 72,688 1.07 1.27 2.02 155Class R67/1/21 to 12/31/21(6) $ 37.40 0.40 (4.25) (3.85) (0.68) — — (0.68) — (4.53) $ 32.87 (10.22)% $ 36,105 0.89% 1.09% 2.28% 46%7/1/20 to 6/30/21 25.78 0.49 11.64 12.13 (0.51) — — (0.51) — 11.62 37.40 47.34 30,722 0.88(7) 1.18 1.47 807/1/19 to 6/30/20 26.96 0.54 (1.03) (0.49) (0.69) — — (0.69) — (1.18) 25.78 (2.04) 19,582 0.88 1.23 2.10 837/1/18 to 6/30/19 28.57 0.57 (1.48) (0.91) (0.70) — — (0.70) — (1.61) 26.96 (2.93) 23,647 0.86 1.21 2.13 1017/1/17 to 6/30/18 26.69 0.62 1.76 2.38 (0.50) — — (0.50) — 1.88 28.57 8.85 24,277 0.86 1.21 2.03 887/1/16 to 6/30/17 22.69 0.60 3.90 4.50 (0.50) — — (0.50) — 4.00 26.69 20.27 692 1.02 1.22 2.46 155
The footnote legend is at the end of the financial highlights.
See Notes to Financial Statements
67

Net
Ass
etV
alu
e,B
egin
nin
go
fP
erio
d
Net
Inve
stm
ent
Inco
me
(Lo
ss)(1
)
Net
Rea
lized
and
Un
real
ized
Gai
n(L
oss
)
Tota
lfro
mIn
vest
men
tO
per
atio
ns
Div
iden
ds
fro
mN
etIn
vest
men
tIn
com
e
Ret
urn
of
Cap
ital
Dis
trib
uti
on
sfr
om
Net
Rea
lized
Gai
ns
Tota
lDis
trib
uti
on
s
Pay
men
tfr
om
Aff
iliat
e
Ch
ang
ein
Net
Ass
etV
alu
e
Net
Ass
etV
alu
e,E
nd
of
Per
iod
Tota
lRet
urn
(2)(
3)
Net
Ass
ets,
En
do
fP
erio
d(i
nth
ou
san
ds)
Rat
ioo
fN
etE
xpen
ses
toA
vera
ge
Net
Ass
ets(4
)(5
)
Rat
ioo
fG
ross
Exp
ense
sto
Ave
rag
eN
etA
sset
s(4)(
5)
Rat
ioo
fN
etIn
vest
men
tIn
com
e(L
oss
)to
Ave
rag
eN
etA
sset
s(4)
Po
rtfo
lioTu
rno
ver
Rat
e(2)
AllianzGI FocusedGrowth Fund
Class A7/1/21 to 12/31/21(6) $ 79.25 (0.21) 6.15 5.94 — — (13.67) (13.67) — (7.73) $ 71.52 8.04% $ 869,165 0.94%(9) 0.94% (0.50)% 11%7/1/20 to 6/30/21 58.46 (0.35) 27.26 26.91 — — (6.12) (6.12) — 20.79 79.25 47.50 860,373 0.97(7) 1.04 (0.50) 507/1/19 to 6/30/20 53.33 (0.10) 12.28 12.18 — — (7.05) (7.05) — 5.13 58.46 24.74 618,302 1.00 1.12 (0.20) 637/1/18 to 6/30/19 56.83 (0.08) 2.48 2.40 — — (5.90) (5.90) — (3.50) 53.33 6.79 577,106 1.00 1.12 (0.15) 507/1/17 to 6/30/18 46.62 —(8) 10.92 10.92 — — (0.71) (0.71) — 10.21 56.83 23.53 421,188 0.99 1.11 — 407/1/16 to 6/30/17 40.72 0.06 6.85 6.91 — — (1.01) (1.01) — 5.90 46.62 17.29 373,359 1.05 1.11 0.15 46Class C7/1/21 to 12/31/21(6) $ 43.67 (0.28) 3.19 2.91 — — (13.67) (13.67) — (10.76) $ 32.91 7.65% $ 42,229 1.69%(9) 1.69% (1.25)% 11%7/1/20 to 6/30/21 34.58 (0.50) 15.71 15.21 — — (6.12) (6.12) — 9.09 43.67 46.39 48,650 1.73(9) 1.79 (1.25) 507/1/19 to 6/30/20 34.42 (0.31) 7.52 7.21 — — (7.05) (7.05) — 0.16 34.58 23.79 45,878 1.77 1.87 (0.97) 637/1/18 to 6/30/19 39.41 (0.36) 1.27 0.91 — — (5.90) (5.90) — (4.99) 34.42 5.93 48,706 1.77 1.87 (0.93) 507/1/17 to 6/30/18 32.76 (0.29) 7.65 7.36 — — (0.71) (0.71) — 6.65 39.41 22.59 233,854 1.76 1.86 (0.77) 407/1/16 to 6/30/17 29.12 (0.19) 4.84 4.65 — — (1.01) (1.01) — 3.64 32.76 16.40 217,685 1.81 1.86 (0.62) 46Class P7/1/21 to 12/31/21(6) $ 54.85 (0.08) 4.13 4.05 — — (13.67) (13.67) — (9.62) $ 45.23 8.17% $ 95,667 0.71%(9) 0.71% (0.27)% 11%7/1/20 to 6/30/21 41.83 (0.13) 19.27 19.14 — — (6.12) (6.12) — 13.02 54.85 47.83 105,688 0.73(9) 0.80 (0.26) 507/1/19 to 6/30/20 39.91 0.01 8.96 8.97 — — (7.05) (7.05) — 1.92 41.83 25.03 84,929 0.77 0.87 0.03 637/1/18 to 6/30/19 44.18 0.03 1.60 1.63 — — (5.90) (5.90) — (4.27) 39.91 7.01 91,265 0.77 0.87 0.09 507/1/17 to 6/30/18 36.33 0.09 8.52 8.61 (0.05) — (0.71) (0.76) — 7.85 44.18 23.84 109,456 0.76 0.86 0.23 407/1/16 to 6/30/17 31.88 0.14 5.32 5.46 — — (1.01) (1.01) — 4.45 36.33 17.54 80,667 0.81 0.86 0.41 46Institutional Class7/1/21 to 12/31/21(6) $ 71.58 (0.09) 5.52 5.43 — — (13.67) (13.67) — (8.24) $ 63.34 8.19% $ 221,615 0.67% 0.69% (0.23)% 11%7/1/20 to 6/30/21 53.11 (0.12) 24.71 24.59 — — (6.12) (6.12) — 18.47 71.58 47.94 209,066 0.67 0.74 (0.19) 507/1/19 to 6/30/20 48.89 0.06 11.21 11.27 — — (7.05) (7.05) — 4.22 53.11 25.15 165,726 0.67 0.77 0.13 637/1/18 to 6/30/19 52.51 0.09 2.19 2.28 — — (5.90) (5.90) — (3.62) 48.89 7.15 162,173 0.67 0.77 0.18 507/1/17 to 6/30/18 43.02 0.16 10.08 10.24 (0.04) — (0.71) (0.75) — 9.49 52.51 23.93 177,278 0.66 0.76 0.33 407/1/16 to 6/30/17 37.53 0.20 6.30 6.50 — — (1.01) (1.01) — 5.49 43.02 17.67 195,161 0.71 0.76 0.50 46Class R67/1/21 to 12/31/21(6) $ 71.80 (0.07) 5.53 5.46 — — (13.67) (13.67) — (8.21) $ 63.59 8.21% $ 207,306 0.62% 0.63% (0.18)% 11%7/1/20 to 6/30/21 53.23 (0.10) 24.79 24.69 — — (6.12) (6.12) — 18.57 71.80 48.02 198,031 0.62 0.68 (0.15) 507/1/19 to 6/30/20 48.96 0.09 11.23 11.32 — — (7.05) (7.05) — 4.27 53.23 25.22 136,519 0.62 0.72 0.19 637/1/18 to 6/30/19 52.56 0.11 2.19 2.30 — — (5.90) (5.90) — (3.60) 48.96 7.18 134,485 0.62 0.72 0.23 507/1/17 to 6/30/18 43.04 0.19 10.10 10.29 (0.06) — (0.71) (0.77) — 9.52 52.56 24.03 114,054 0.61 0.71 0.38 407/1/16 to 6/30/17 37.53 0.21 6.31 6.52 — — (1.01) (1.01) — 5.51 43.04 17.72 36,374 0.66 0.71 0.53 46Administrative Class7/1/21 to 12/31/21(6) $ 64.69 (0.16) 4.93 4.77 — — (13.67) (13.67) — (8.90) $ 55.79 8.04% $ 8,432 0.92% 0.94% (0.49)% 11%7/1/20 to 6/30/21 48.56 (0.26) 22.51 22.25 — — (6.12) (6.12) — 16.13 64.69 47.60 6,641 0.92 1.00 (0.44) 507/1/19 to 6/30/20 45.36 (0.05) 10.30 10.25 — — (7.05) (7.05) — 3.20 48.56 24.84 4,518 0.92 1.02 (0.11) 637/1/18 to 6/30/19 49.33 (0.04) 1.97 1.93 — — (5.90) (5.90) — (3.97) 45.36 6.88 5,138 0.92 1.02 (0.08) 507/1/17 to 6/30/18 40.51 0.03 9.50 9.53 — — (0.71) (0.71) — 8.82 49.33 23.63 4,017 0.91 1.01 0.07 407/1/16 to 6/30/17 35.48 0.09 5.95 6.04 — — (1.01) (1.01) — 5.03 40.51 17.39 4,288 0.96 1.01 0.25 46
VIRTUS INVESTMENT TRUSTFINANCIAL HIGHLIGHTS (Continued)
SELECTED PER SHARE DATA AND RATIOS FOR A SHARE OUTSTANDINGTHROUGHOUT EACH PERIOD
The footnote legend is at the end of the financial highlights.
See Notes to Financial Statements
68
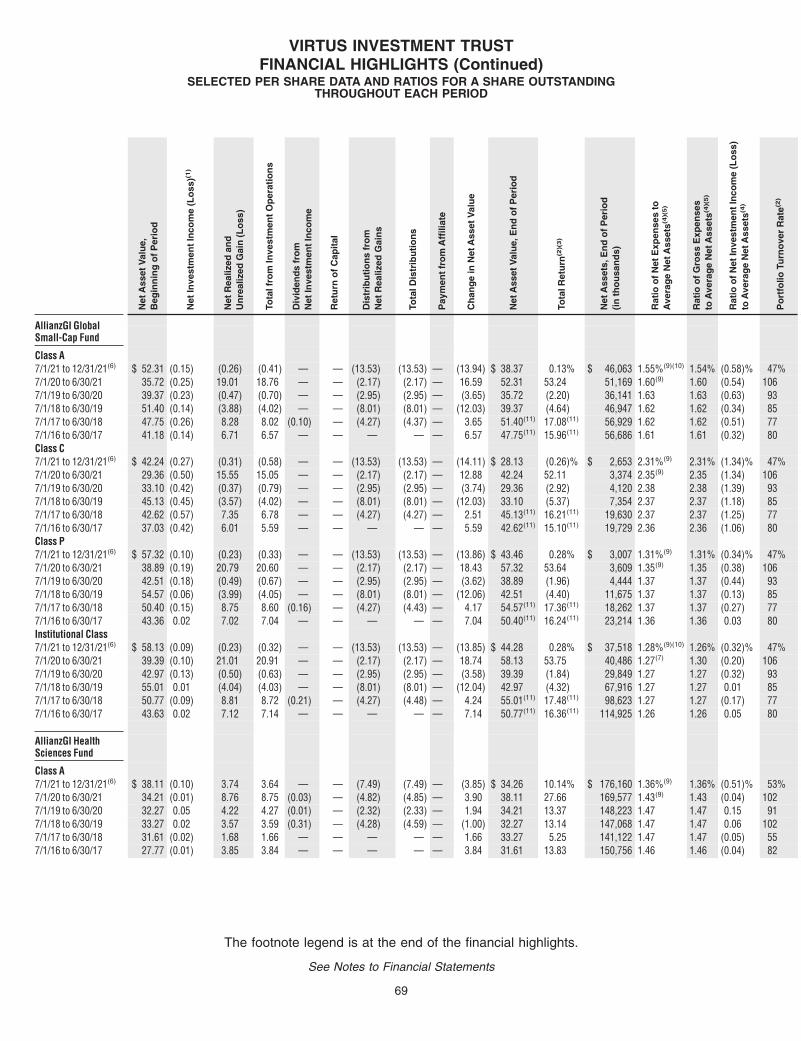
Net
Ass
etV
alu
e,B
egin
nin
go
fP
erio
d
Net
Inve
stm
ent
Inco
me
(Lo
ss)(1
)
Net
Rea
lized
and
Un
real
ized
Gai
n(L
oss
)
Tota
lfro
mIn
vest
men
tO
per
atio
ns
Div
iden
ds
fro
mN
etIn
vest
men
tIn
com
e
Ret
urn
of
Cap
ital
Dis
trib
uti
on
sfr
om
Net
Rea
lized
Gai
ns
Tota
lDis
trib
uti
on
s
Pay
men
tfr
om
Aff
iliat
e
Ch
ang
ein
Net
Ass
etV
alu
e
Net
Ass
etV
alu
e,E
nd
of
Per
iod
Tota
lRet
urn
(2)(
3)
Net
Ass
ets,
En
do
fP
erio
d(i
nth
ou
san
ds)
Rat
ioo
fN
etE
xpen
ses
toA
vera
ge
Net
Ass
ets(4
)(5
)
Rat
ioo
fG
ross
Exp
ense
sto
Ave
rag
eN
etA
sset
s(4)(
5)
Rat
ioo
fN
etIn
vest
men
tIn
com
e(L
oss
)to
Ave
rag
eN
etA
sset
s(4)
Po
rtfo
lioTu
rno
ver
Rat
e(2)
AllianzGI GlobalSmall-Cap Fund
Class A7/1/21 to 12/31/21(6) $ 52.31 (0.15) (0.26) (0.41) — — (13.53) (13.53) — (13.94) $ 38.37 0.13% $ 46,063 1.55%(9)(10) 1.54% (0.58)% 47%7/1/20 to 6/30/21 35.72 (0.25) 19.01 18.76 — — (2.17) (2.17) — 16.59 52.31 53.24 51,169 1.60(9) 1.60 (0.54) 1067/1/19 to 6/30/20 39.37 (0.23) (0.47) (0.70) — — (2.95) (2.95) — (3.65) 35.72 (2.20) 36,141 1.63 1.63 (0.63) 937/1/18 to 6/30/19 51.40 (0.14) (3.88) (4.02) — — (8.01) (8.01) — (12.03) 39.37 (4.64) 46,947 1.62 1.62 (0.34) 857/1/17 to 6/30/18 47.75 (0.26) 8.28 8.02 (0.10) — (4.27) (4.37) — 3.65 51.40(11) 17.08(11) 56,929 1.62 1.62 (0.51) 777/1/16 to 6/30/17 41.18 (0.14) 6.71 6.57 — — — — — 6.57 47.75(11) 15.96(11) 56,686 1.61 1.61 (0.32) 80Class C7/1/21 to 12/31/21(6) $ 42.24 (0.27) (0.31) (0.58) — — (13.53) (13.53) — (14.11) $ 28.13 (0.26)% $ 2,653 2.31%(9) 2.31% (1.34)% 47%7/1/20 to 6/30/21 29.36 (0.50) 15.55 15.05 — — (2.17) (2.17) — 12.88 42.24 52.11 3,374 2.35(9) 2.35 (1.34) 1067/1/19 to 6/30/20 33.10 (0.42) (0.37) (0.79) — — (2.95) (2.95) — (3.74) 29.36 (2.92) 4,120 2.38 2.38 (1.39) 937/1/18 to 6/30/19 45.13 (0.45) (3.57) (4.02) — — (8.01) (8.01) — (12.03) 33.10 (5.37) 7,354 2.37 2.37 (1.18) 857/1/17 to 6/30/18 42.62 (0.57) 7.35 6.78 — — (4.27) (4.27) — 2.51 45.13(11) 16.21(11) 19,630 2.37 2.37 (1.25) 777/1/16 to 6/30/17 37.03 (0.42) 6.01 5.59 — — — — — 5.59 42.62(11) 15.10(11) 19,729 2.36 2.36 (1.06) 80Class P7/1/21 to 12/31/21(6) $ 57.32 (0.10) (0.23) (0.33) — — (13.53) (13.53) — (13.86) $ 43.46 0.28% $ 3,007 1.31%(9) 1.31% (0.34)% 47%7/1/20 to 6/30/21 38.89 (0.19) 20.79 20.60 — — (2.17) (2.17) — 18.43 57.32 53.64 3,609 1.35(9) 1.35 (0.38) 1067/1/19 to 6/30/20 42.51 (0.18) (0.49) (0.67) — — (2.95) (2.95) — (3.62) 38.89 (1.96) 4,444 1.37 1.37 (0.44) 937/1/18 to 6/30/19 54.57 (0.06) (3.99) (4.05) — — (8.01) (8.01) — (12.06) 42.51 (4.40) 11,675 1.37 1.37 (0.13) 857/1/17 to 6/30/18 50.40 (0.15) 8.75 8.60 (0.16) — (4.27) (4.43) — 4.17 54.57(11) 17.36(11) 18,262 1.37 1.37 (0.27) 777/1/16 to 6/30/17 43.36 0.02 7.02 7.04 — — — — — 7.04 50.40(11) 16.24(11) 23,214 1.36 1.36 0.03 80Institutional Class7/1/21 to 12/31/21(6) $ 58.13 (0.09) (0.23) (0.32) — — (13.53) (13.53) — (13.85) $ 44.28 0.28% $ 37,518 1.28%(9)(10) 1.26% (0.32)% 47%7/1/20 to 6/30/21 39.39 (0.10) 21.01 20.91 — — (2.17) (2.17) — 18.74 58.13 53.75 40,486 1.27(7) 1.30 (0.20) 1067/1/19 to 6/30/20 42.97 (0.13) (0.50) (0.63) — — (2.95) (2.95) — (3.58) 39.39 (1.84) 29,849 1.27 1.27 (0.32) 937/1/18 to 6/30/19 55.01 0.01 (4.04) (4.03) — — (8.01) (8.01) — (12.04) 42.97 (4.32) 67,916 1.27 1.27 0.01 857/1/17 to 6/30/18 50.77 (0.09) 8.81 8.72 (0.21) — (4.27) (4.48) — 4.24 55.01(11) 17.48(11) 98,623 1.27 1.27 (0.17) 777/1/16 to 6/30/17 43.63 0.02 7.12 7.14 — — — — — 7.14 50.77(11) 16.36(11) 114,925 1.26 1.26 0.05 80
AllianzGI HealthSciences Fund
Class A7/1/21 to 12/31/21(6) $ 38.11 (0.10) 3.74 3.64 — — (7.49) (7.49) — (3.85) $ 34.26 10.14% $ 176,160 1.36%(9) 1.36% (0.51)% 53%7/1/20 to 6/30/21 34.21 (0.01) 8.76 8.75 (0.03) — (4.82) (4.85) — 3.90 38.11 27.66 169,577 1.43(9) 1.43 (0.04) 1027/1/19 to 6/30/20 32.27 0.05 4.22 4.27 (0.01) — (2.32) (2.33) — 1.94 34.21 13.37 148,223 1.47 1.47 0.15 917/1/18 to 6/30/19 33.27 0.02 3.57 3.59 (0.31) — (4.28) (4.59) — (1.00) 32.27 13.14 147,068 1.47 1.47 0.06 1027/1/17 to 6/30/18 31.61 (0.02) 1.68 1.66 — — — — — 1.66 33.27 5.25 141,122 1.47 1.47 (0.05) 557/1/16 to 6/30/17 27.77 (0.01) 3.85 3.84 — — — — — 3.84 31.61 13.83 150,756 1.46 1.46 (0.04) 82
VIRTUS INVESTMENT TRUSTFINANCIAL HIGHLIGHTS (Continued)
SELECTED PER SHARE DATA AND RATIOS FOR A SHARE OUTSTANDINGTHROUGHOUT EACH PERIOD
The footnote legend is at the end of the financial highlights.
See Notes to Financial Statements
69

Net
Ass
etV
alu
e,B
egin
nin
go
fP
erio
d
Net
Inve
stm
ent
Inco
me
(Lo
ss)(1
)
Net
Rea
lized
and
Un
real
ized
Gai
n(L
oss
)
Tota
lfro
mIn
vest
men
tO
per
atio
ns
Div
iden
ds
fro
mN
etIn
vest
men
tIn
com
e
Ret
urn
of
Cap
ital
Dis
trib
uti
on
sfr
om
Net
Rea
lized
Gai
ns
Tota
lDis
trib
uti
on
s
Pay
men
tfr
om
Aff
iliat
e
Ch
ang
ein
Net
Ass
etV
alu
e
Net
Ass
etV
alu
e,E
nd
of
Per
iod
Tota
lRet
urn
(2)(
3)
Net
Ass
ets,
En
do
fP
erio
d(i
nth
ou
san
ds)
Rat
ioo
fN
etE
xpen
ses
toA
vera
ge
Net
Ass
ets(4
)(5
)
Rat
ioo
fG
ross
Exp
ense
sto
Ave
rag
eN
etA
sset
s(4)(
5)
Rat
ioo
fN
etIn
vest
men
tIn
com
e(L
oss
)to
Ave
rag
eN
etA
sset
s(4)
Po
rtfo
lioTu
rno
ver
Rat
e(2)
AllianzGI HealthSciencesFund (Continued)
Class C7/1/21 to 12/31/21(6) $ 26.74 (0.17) 2.54 2.37 — — (7.49) (7.49) — (5.12) $ 21.62 9.69% $ 4,121 2.13%(9) 2.13% (1.27)% 53%7/1/20 to 6/30/21 25.44 (0.21) 6.33 6.12 —(8) — (4.82) (4.82) — 1.30 26.74 26.73 3,758 2.18(9) 2.18 (0.80) 1027/1/19 to 6/30/20 24.71 (0.15) 3.20 3.05 — — (2.32) (2.32) — 0.73 25.44 12.52 4,221 2.22 2.22 (0.60) 917/1/18 to 6/30/19 26.43 (0.19) 2.75 2.56 — — (4.28) (4.28) — (1.72) 24.71 12.34 4,131 2.22 2.22 (0.75) 1027/1/17 to 6/30/18 25.30 (0.21) 1.34 1.13 — — — — — 1.13 26.43 4.47 8,218 2.22 2.22 (0.81) 557/1/16 to 6/30/17 22.40 (0.18) 3.08 2.90 — — — — — 2.90 25.30 12.95 10,358 2.21 2.21 (0.79) 82Class P7/1/21 to 12/31/21(6) $ 38.79 (0.04) 3.82 3.78 — — (7.49) (7.49) — (3.71) $ 35.08 10.32% $ 2,443 1.03%(9) 1.03% (0.19)% 53%7/13/20(12) to 6/30/21 35.14 0.09 8.62 8.71 (0.24) — (4.82) (5.06) — 3.65 38.79 26.91 880 1.13(9) 1.13 0.25 102(13)
Institutional Class7/1/21 to 12/31/21(6) $ 38.87 (0.06) 3.83 3.77 — — (7.49) (7.49) — (3.72) $ 35.15 10.27% $ 23,060 1.12% 1.13% (0.28)% 53%7/1/20 to 6/30/21 34.85 0.10 8.94 9.04 (0.20) — (4.82) (5.02) — 4.02 38.87 28.07 21,122 1.12 1.14 0.28 1027/1/19 to 6/30/20 32.76 0.15 4.30 4.45 (0.04) — (2.32) (2.36) — 2.09 34.85 13.76 11,182 1.12 1.12 0.45 917/1/18 to 6/30/19 33.69 0.13 3.63 3.76 (0.41) — (4.28) (4.69) — (0.93) 32.76 13.54 4,290 1.12 1.12 0.39 1027/1/17 to 6/30/18 31.90 0.10 1.69 1.79 — — — — — 1.79 33.69 5.61 2,854 1.12 1.12 0.29 557/1/16 to 6/30/17 27.93 0.09 3.88 3.97 — — — — — 3.97 31.90 14.21 3,692 1.11 1.11 0.31 82
AllianzGI Income &Growth Fund
Class A7/1/21 to 12/31/21(6) $ 13.26 0.07 0.47 0.54 (0.09) — (0.33) (0.42) — 0.12 $ 13.38 4.22% $2,566,178 1.12%(9) 1.12% 1.10% 31%7/1/20 to 6/30/21 10.89 0.14 3.07 3.21 (0.19) — (0.65) (0.84) — 2.37 13.26 30.29 2,403,182 1.19(7)(9) 1.22 1.11 837/1/19 to 6/30/20 11.01 0.18 0.54 0.72 (0.21) — (0.63) (0.84) — (0.12) 10.89 6.98 1,631,126 1.28 1.29 1.65 937/1/18 to 6/30/19 11.34 0.20 0.38 0.58 (0.25) — (0.66) (0.91) — (0.33) 11.01(11) 5.45(11) 1,458,642 1.28 1.29 1.84 667/1/17 to 6/30/18 11.24 0.23 0.82 1.05 (0.28) — (0.67) (0.95) — 0.10 11.34 9.58 1,250,639 1.28 1.29 1.99 1027/1/16 to 6/30/17 10.80 0.27 1.17 1.44 (0.32) — (0.68) (1.00) — 0.44 11.24 13.88 1,091,888 1.29 1.29 2.45 159Class C7/1/21 to 12/31/21(6) $ 11.94 0.02 0.41 0.43 (0.05) — (0.33) (0.38) — 0.05 $ 11.99 3.73% $1,520,489 1.89%(9) 1.89% 0.33% 31%7/1/20 to 6/30/21 9.89 0.04 2.78 2.82 (0.12) — (0.65) (0.77) — 2.05 11.94 29.31 1,467,948 1.95(7)(9) 1.98 0.36 837/1/19 to 6/30/20 10.07 0.09 0.50 0.59 (0.14) — (0.63) (0.77) — (0.18) 9.89 6.31 1,215,780 2.03 2.04 0.90 937/1/18 to 6/30/19 10.46 0.11 0.34 0.45 (0.18) — (0.66) (0.84) — (0.39) 10.07(11) 4.60(11) 1,234,667 2.03 2.04 1.09 667/1/17 to 6/30/18 10.44 0.13 0.76 0.89 (0.20) — (0.67) (0.87) — 0.02 10.46 8.78 1,116,788 2.03 2.04 1.24 1027/1/16 to 6/30/17 10.10 0.18 1.09 1.27 (0.25) — (0.68) (0.93) — 0.34 10.44 13.08 1,090,887 2.04 2.04 1.70 159Class P7/1/21 to 12/31/21(6) $ 13.67 0.09 0.48 0.57 (0.10) — (0.33) (0.43) — 0.14 $ 13.81 4.34% $1,713,917 0.90%(9) 0.90% 1.32% 31%7/1/20 to 6/30/21 11.20 0.17 3.17 3.34 (0.22) — (0.65) (0.87) — 2.47 13.67 30.61 1,822,852 0.95(7)(9) 0.98 1.35 837/1/19 to 6/30/20 11.29 0.21 0.57 0.78 (0.24) — (0.63) (0.87) — (0.09) 11.20 7.32 1,253,364 1.03 1.04 1.90 937/1/18 to 6/30/19 11.61 0.23 0.38 0.61 (0.27) — (0.66) (0.93) — (0.32) 11.29(11) 5.64(11) 1,122,083 1.03 1.04 2.09 667/1/17 to 6/30/18 11.48 0.26 0.84 1.10 (0.30) — (0.67) (0.97) — 0.13 11.61 9.90 897,716 1.03 1.04 2.24 1027/1/16 to 6/30/17 11.01 0.31 1.19 1.50 (0.35) — (0.68) (1.03) — 0.47 11.48 14.14 690,147 1.04 1.04 2.69 159
VIRTUS INVESTMENT TRUSTFINANCIAL HIGHLIGHTS (Continued)
SELECTED PER SHARE DATA AND RATIOS FOR A SHARE OUTSTANDINGTHROUGHOUT EACH PERIOD
The footnote legend is at the end of the financial highlights.
See Notes to Financial Statements
70
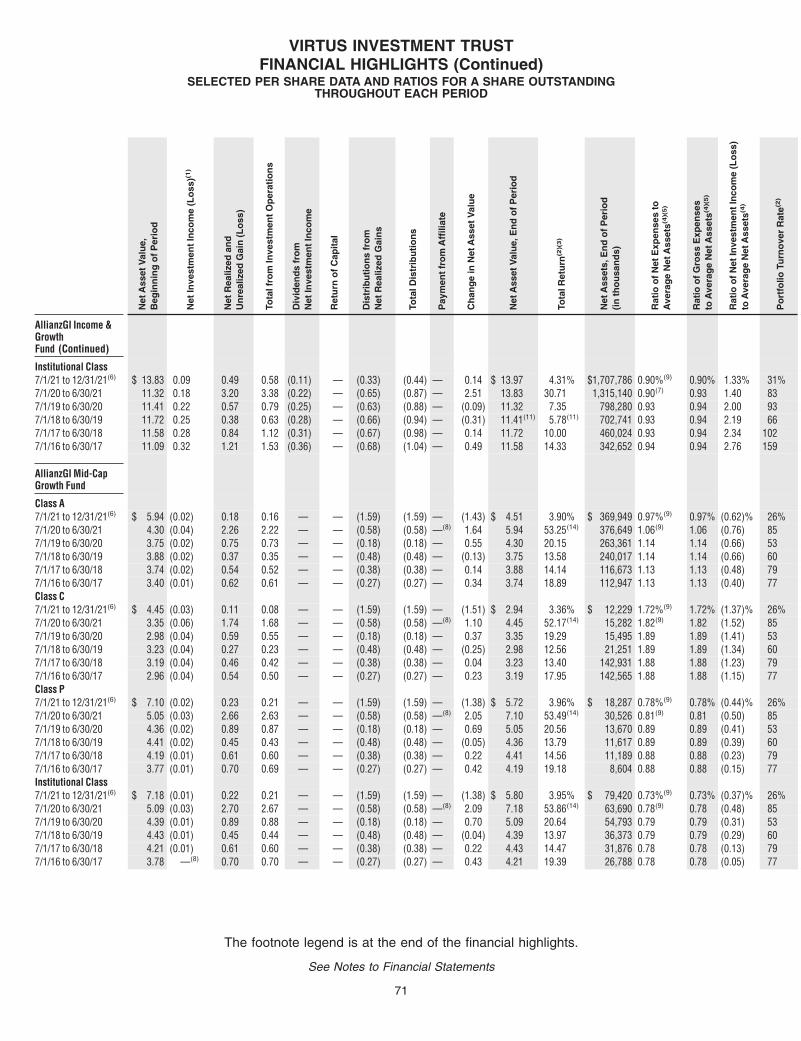
Net
Ass
etV
alu
e,B
egin
nin
go
fP
erio
d
Net
Inve
stm
ent
Inco
me
(Lo
ss)(1
)
Net
Rea
lized
and
Un
real
ized
Gai
n(L
oss
)
Tota
lfro
mIn
vest
men
tO
per
atio
ns
Div
iden
ds
fro
mN
etIn
vest
men
tIn
com
e
Ret
urn
of
Cap
ital
Dis
trib
uti
on
sfr
om
Net
Rea
lized
Gai
ns
Tota
lDis
trib
uti
on
s
Pay
men
tfr
om
Aff
iliat
e
Ch
ang
ein
Net
Ass
etV
alu
e
Net
Ass
etV
alu
e,E
nd
of
Per
iod
Tota
lRet
urn
(2)(
3)
Net
Ass
ets,
En
do
fP
erio
d(i
nth
ou
san
ds)
Rat
ioo
fN
etE
xpen
ses
toA
vera
ge
Net
Ass
ets(4
)(5
)
Rat
ioo
fG
ross
Exp
ense
sto
Ave
rag
eN
etA
sset
s(4)(
5)
Rat
ioo
fN
etIn
vest
men
tIn
com
e(L
oss
)to
Ave
rag
eN
etA
sset
s(4)
Po
rtfo
lioTu
rno
ver
Rat
e(2)
AllianzGI Income &GrowthFund (Continued)
Institutional Class7/1/21 to 12/31/21(6) $ 13.83 0.09 0.49 0.58 (0.11) — (0.33) (0.44) — 0.14 $ 13.97 4.31% $1,707,786 0.90%(9) 0.90% 1.33% 31%7/1/20 to 6/30/21 11.32 0.18 3.20 3.38 (0.22) — (0.65) (0.87) — 2.51 13.83 30.71 1,315,140 0.90(7) 0.93 1.40 837/1/19 to 6/30/20 11.41 0.22 0.57 0.79 (0.25) — (0.63) (0.88) — (0.09) 11.32 7.35 798,280 0.93 0.94 2.00 937/1/18 to 6/30/19 11.72 0.25 0.38 0.63 (0.28) — (0.66) (0.94) — (0.31) 11.41(11) 5.78(11) 702,741 0.93 0.94 2.19 667/1/17 to 6/30/18 11.58 0.28 0.84 1.12 (0.31) — (0.67) (0.98) — 0.14 11.72 10.00 460,024 0.93 0.94 2.34 1027/1/16 to 6/30/17 11.09 0.32 1.21 1.53 (0.36) — (0.68) (1.04) — 0.49 11.58 14.33 342,652 0.94 0.94 2.76 159
AllianzGI Mid-CapGrowth Fund
Class A7/1/21 to 12/31/21(6) $ 5.94 (0.02) 0.18 0.16 — — (1.59) (1.59) — (1.43) $ 4.51 3.90% $ 369,949 0.97%(9) 0.97% (0.62)% 26%7/1/20 to 6/30/21 4.30 (0.04) 2.26 2.22 — — (0.58) (0.58) —(8) 1.64 5.94 53.25(14) 376,649 1.06(9) 1.06 (0.76) 857/1/19 to 6/30/20 3.75 (0.02) 0.75 0.73 — — (0.18) (0.18) — 0.55 4.30 20.15 263,361 1.14 1.14 (0.66) 537/1/18 to 6/30/19 3.88 (0.02) 0.37 0.35 — — (0.48) (0.48) — (0.13) 3.75 13.58 240,017 1.14 1.14 (0.66) 607/1/17 to 6/30/18 3.74 (0.02) 0.54 0.52 — — (0.38) (0.38) — 0.14 3.88 14.14 116,673 1.13 1.13 (0.48) 797/1/16 to 6/30/17 3.40 (0.01) 0.62 0.61 — — (0.27) (0.27) — 0.34 3.74 18.89 112,947 1.13 1.13 (0.40) 77Class C7/1/21 to 12/31/21(6) $ 4.45 (0.03) 0.11 0.08 — — (1.59) (1.59) — (1.51) $ 2.94 3.36% $ 12,229 1.72%(9) 1.72% (1.37)% 26%7/1/20 to 6/30/21 3.35 (0.06) 1.74 1.68 — — (0.58) (0.58) —(8) 1.10 4.45 52.17(14) 15,282 1.82(9) 1.82 (1.52) 857/1/19 to 6/30/20 2.98 (0.04) 0.59 0.55 — — (0.18) (0.18) — 0.37 3.35 19.29 15,495 1.89 1.89 (1.41) 537/1/18 to 6/30/19 3.23 (0.04) 0.27 0.23 — — (0.48) (0.48) — (0.25) 2.98 12.56 21,251 1.89 1.89 (1.34) 607/1/17 to 6/30/18 3.19 (0.04) 0.46 0.42 — — (0.38) (0.38) — 0.04 3.23 13.40 142,931 1.88 1.88 (1.23) 797/1/16 to 6/30/17 2.96 (0.04) 0.54 0.50 — — (0.27) (0.27) — 0.23 3.19 17.95 142,565 1.88 1.88 (1.15) 77Class P7/1/21 to 12/31/21(6) $ 7.10 (0.02) 0.23 0.21 — — (1.59) (1.59) — (1.38) $ 5.72 3.96% $ 18,287 0.78%(9) 0.78% (0.44)% 26%7/1/20 to 6/30/21 5.05 (0.03) 2.66 2.63 — — (0.58) (0.58) —(8) 2.05 7.10 53.49(14) 30,526 0.81(9) 0.81 (0.50) 857/1/19 to 6/30/20 4.36 (0.02) 0.89 0.87 — — (0.18) (0.18) — 0.69 5.05 20.56 13,670 0.89 0.89 (0.41) 537/1/18 to 6/30/19 4.41 (0.02) 0.45 0.43 — — (0.48) (0.48) — (0.05) 4.36 13.79 11,617 0.89 0.89 (0.39) 607/1/17 to 6/30/18 4.19 (0.01) 0.61 0.60 — — (0.38) (0.38) — 0.22 4.41 14.56 11,189 0.88 0.88 (0.23) 797/1/16 to 6/30/17 3.77 (0.01) 0.70 0.69 — — (0.27) (0.27) — 0.42 4.19 19.18 8,604 0.88 0.88 (0.15) 77Institutional Class7/1/21 to 12/31/21(6) $ 7.18 (0.01) 0.22 0.21 — — (1.59) (1.59) — (1.38) $ 5.80 3.95% $ 79,420 0.73%(9) 0.73% (0.37)% 26%7/1/20 to 6/30/21 5.09 (0.03) 2.70 2.67 — — (0.58) (0.58) —(8) 2.09 7.18 53.86(14) 63,690 0.78(9) 0.78 (0.48) 857/1/19 to 6/30/20 4.39 (0.01) 0.89 0.88 — — (0.18) (0.18) — 0.70 5.09 20.64 54,793 0.79 0.79 (0.31) 537/1/18 to 6/30/19 4.43 (0.01) 0.45 0.44 — — (0.48) (0.48) — (0.04) 4.39 13.97 36,373 0.79 0.79 (0.29) 607/1/17 to 6/30/18 4.21 (0.01) 0.61 0.60 — — (0.38) (0.38) — 0.22 4.43 14.47 31,876 0.78 0.78 (0.13) 797/1/16 to 6/30/17 3.78 —(8) 0.70 0.70 — — (0.27) (0.27) — 0.43 4.21 19.39 26,788 0.78 0.78 (0.05) 77
VIRTUS INVESTMENT TRUSTFINANCIAL HIGHLIGHTS (Continued)
SELECTED PER SHARE DATA AND RATIOS FOR A SHARE OUTSTANDINGTHROUGHOUT EACH PERIOD
The footnote legend is at the end of the financial highlights.
See Notes to Financial Statements
71

Net
Ass
etV
alu
e,B
egin
nin
go
fP
erio
d
Net
Inve
stm
ent
Inco
me
(Lo
ss)(1
)
Net
Rea
lized
and
Un
real
ized
Gai
n(L
oss
)
Tota
lfro
mIn
vest
men
tO
per
atio
ns
Div
iden
ds
fro
mN
etIn
vest
men
tIn
com
e
Ret
urn
of
Cap
ital
Dis
trib
uti
on
sfr
om
Net
Rea
lized
Gai
ns
Tota
lDis
trib
uti
on
s
Pay
men
tfr
om
Aff
iliat
e
Ch
ang
ein
Net
Ass
etV
alu
e
Net
Ass
etV
alu
e,E
nd
of
Per
iod
Tota
lRet
urn
(2)(
3)
Net
Ass
ets,
En
do
fP
erio
d(i
nth
ou
san
ds)
Rat
ioo
fN
etE
xpen
ses
toA
vera
ge
Net
Ass
ets(4
)(5
)
Rat
ioo
fG
ross
Exp
ense
sto
Ave
rag
eN
etA
sset
s(4)(
5)
Rat
ioo
fN
etIn
vest
men
tIn
com
e(L
oss
)to
Ave
rag
eN
etA
sset
s(4)
Po
rtfo
lioTu
rno
ver
Rat
e(2)
AllianzGI Mid-CapGrowthFund (Continued)
Administrative Class7/1/21 to 12/31/21(6) $ 6.43 (0.02) 0.20 0.18 — — (1.59) (1.59) — (1.41) $ 5.02 3.96% $ 2,786 0.92%(9) 0.92% (0.56)% 26%7/1/20 to 6/30/21 4.62 (0.04) 2.43 2.39 — — (0.58) (0.58) —(8) 1.81 6.43 53.26(14) 2,881 0.99(9) 0.99 (0.69) 857/1/19 to 6/30/20 4.01 (0.02) 0.81 0.79 — — (0.18) (0.18) — 0.61 4.62 20.34 1,748 1.04 1.04 (0.56) 537/1/18 to 6/30/19 4.11 (0.02) 0.40 0.38 — — (0.48) (0.48) — (0.10) 4.01 13.61 1,525 1.04 1.04 (0.54) 607/1/17 to 6/30/18 3.94 (0.02) 0.57 0.55 — — (0.38) (0.38) — 0.17 4.11 14.19 1,441 1.03 1.03 (0.40) 797/1/16 to 6/30/17 3.56 (0.01) 0.66 0.65 — — (0.27) (0.27) — 0.38 3.94 19.19 575 1.03 1.03 (0.30) 77
AllianzGI Small-CapFund
Class A7/1/21 to 12/31/21(6) $ 27.49 0.05 0.69 0.74 (0.02) — (3.41) (3.43) — (2.69) $ 24.80 3.29% $ 87,427 1.17% 1.18% 0.36% 27%7/1/20 to 6/30/21 17.55 (0.04) 10.00 9.96 (0.02) — — (0.02) — 9.94 27.49 56.80 87,605 1.17 1.23 (0.17) 887/1/19 to 6/30/20 19.50 0.04 (1.98) (1.94) (0.01) — — (0.01) — (1.95) 17.55(11) (9.95)(11) 58,062 1.17 1.27 0.23 1107/1/18 to 6/30/19 21.61 0.07 (0.53) (0.46) (0.02) — (1.63) (1.65) — (2.11) 19.50 (0.62) 66,269 1.18 1.27 0.35 787/1/17 to 6/30/18 20.51 (0.02) 3.92 3.90 — — (2.80) (2.80) — 1.10 21.61 19.96 44,860 1.31 1.31 (0.07) 1267/1/16 to 6/30/17 16.71 0.03 3.79 3.82 (0.01) — (0.01) (0.02) — 3.80 20.51(11) 22.82(11) 39,509 1.31 1.31 0.15 152Class C7/1/21 to 12/31/21(6) $ 25.99 (0.05) 0.64 0.59 — — (3.41) (3.41) — (2.82) $ 23.17 2.89% $ 4,869 1.92% 1.96% (0.39)% 27%7/1/20 to 6/30/21 16.70 (0.20) 9.49 9.29 —(8) — — — — 9.29 25.99 55.63 4,940 1.92 1.99 (0.92) 887/1/19 to 6/30/20 18.68 (0.09) (1.89) (1.98) — — — — — (1.98) 16.70(11) (10.60)(11) 4,251 1.92 2.02 (0.53) 1107/1/18 to 6/30/19 20.92 (0.07) (0.54) (0.61) — — (1.63) (1.63) — (2.24) 18.68 (1.39) 7,873 1.93 2.02 (0.36) 787/1/17 to 6/30/18 20.07 (0.17) 3.82 3.65 — — (2.80) (2.80) — 0.85 20.92 19.10 35,080 2.06 2.06 (0.82) 1267/1/16 to 6/30/17 16.48 (0.11) 3.71 3.60 — — (0.01) (0.01) — 3.59 20.07(11) 21.82(11) 32,802 2.06 2.06 (0.60) 152Class P7/1/21 to 12/31/21(6) $ 27.82 0.08 0.71 0.79 (0.02) — (3.41) (3.43) — (2.64) $ 25.18 3.42% $ 26,207 0.92% 0.97% 0.54% 27%7/1/20 to 6/30/21 17.76 0.02 10.12 10.14 (0.08) — — (0.08) — 10.06 27.82 57.18 28,986 0.92 1.02 0.08 887/1/19 to 6/30/20 19.74 0.08 (1.99) (1.91) (0.07) — — (0.07) — (1.98) 17.76(11) (9.74)(11) 16,747 0.92 1.02 0.44 1107/1/18 to 6/30/19 21.81 0.12 (0.53) (0.41) (0.03) — (1.63) (1.66) — (2.07) 19.74 (0.36) 9,637 0.93 1.02 0.61 787/1/17 to 6/30/18 20.63 0.03 3.95 3.98 — — (2.80) (2.80) — 1.18 21.81 20.25 6,883 1.06 1.06 0.12 1267/1/16 to 6/30/17 16.77 0.07 3.81 3.88 (0.01) — (0.01) (0.02) — 3.86 20.63(11) 23.12(11) 3,425 1.06 1.06 0.39 152Institutional Class7/1/21 to 12/31/21(6) $ 28.07 0.11 0.69 0.80 (0.10) — (3.41) (3.51) — (2.71) $ 25.36 3.43% $ 57,073 0.82% 0.94% 0.79% 27%7/1/20 to 6/30/21 17.92 0.04 10.22 10.26 (0.11) — — (0.11) — 10.15 28.07 57.35 36,211 0.82 0.96 0.19 887/1/19 to 6/30/20 19.90 0.09 (1.99) (1.90) (0.08) — — (0.08) — (1.98) 17.92(11) (9.62)(11) 22,028 0.82 0.92 0.49 1107/1/18 to 6/30/19 21.96 0.14 (0.53) (0.39) (0.04) — (1.63) (1.67) — (2.06) 19.90 (0.29) 9,077 0.83 0.92 0.70 787/1/17 to 6/30/18 20.73 0.05 3.98 4.03 — — (2.80) (2.80) — 1.23 21.96 20.40 8,104 0.96 0.96 0.21 1267/1/16 to 6/30/17 16.84 0.10 3.81 3.91 (0.01) — (0.01) (0.02) — 3.89 20.73(11) 23.22(11) 3,037 0.96 0.96 0.52 152
VIRTUS INVESTMENT TRUSTFINANCIAL HIGHLIGHTS (Continued)
SELECTED PER SHARE DATA AND RATIOS FOR A SHARE OUTSTANDINGTHROUGHOUT EACH PERIOD
The footnote legend is at the end of the financial highlights.
See Notes to Financial Statements
72
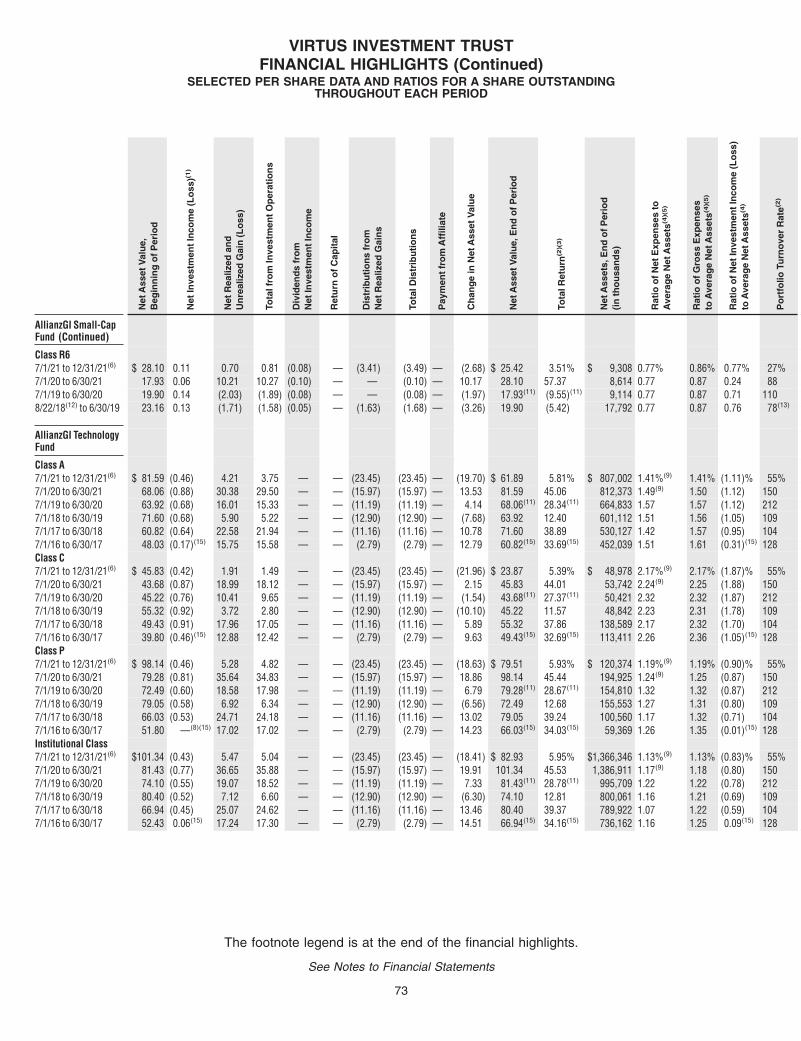
Net
Ass
etV
alu
e,B
egin
nin
go
fP
erio
d
Net
Inve
stm
ent
Inco
me
(Lo
ss)(1
)
Net
Rea
lized
and
Un
real
ized
Gai
n(L
oss
)
Tota
lfro
mIn
vest
men
tO
per
atio
ns
Div
iden
ds
fro
mN
etIn
vest
men
tIn
com
e
Ret
urn
of
Cap
ital
Dis
trib
uti
on
sfr
om
Net
Rea
lized
Gai
ns
Tota
lDis
trib
uti
on
s
Pay
men
tfr
om
Aff
iliat
e
Ch
ang
ein
Net
Ass
etV
alu
e
Net
Ass
etV
alu
e,E
nd
of
Per
iod
Tota
lRet
urn
(2)(
3)
Net
Ass
ets,
En
do
fP
erio
d(i
nth
ou
san
ds)
Rat
ioo
fN
etE
xpen
ses
toA
vera
ge
Net
Ass
ets(4
)(5
)
Rat
ioo
fG
ross
Exp
ense
sto
Ave
rag
eN
etA
sset
s(4)(
5)
Rat
ioo
fN
etIn
vest
men
tIn
com
e(L
oss
)to
Ave
rag
eN
etA
sset
s(4)
Po
rtfo
lioTu
rno
ver
Rat
e(2)
AllianzGI Small-CapFund (Continued)
Class R67/1/21 to 12/31/21(6) $ 28.10 0.11 0.70 0.81 (0.08) — (3.41) (3.49) — (2.68) $ 25.42 3.51% $ 9,308 0.77% 0.86% 0.77% 27%7/1/20 to 6/30/21 17.93 0.06 10.21 10.27 (0.10) — — (0.10) — 10.17 28.10 57.37 8,614 0.77 0.87 0.24 887/1/19 to 6/30/20 19.90 0.14 (2.03) (1.89) (0.08) — — (0.08) — (1.97) 17.93(11) (9.55)(11) 9,114 0.77 0.87 0.71 1108/22/18(12) to 6/30/19 23.16 0.13 (1.71) (1.58) (0.05) — (1.63) (1.68) — (3.26) 19.90 (5.42) 17,792 0.77 0.87 0.76 78(13)
AllianzGI TechnologyFund
Class A7/1/21 to 12/31/21(6) $ 81.59 (0.46) 4.21 3.75 — — (23.45) (23.45) — (19.70) $ 61.89 5.81% $ 807,002 1.41%(9) 1.41% (1.11)% 55%7/1/20 to 6/30/21 68.06 (0.88) 30.38 29.50 — — (15.97) (15.97) — 13.53 81.59 45.06 812,373 1.49(9) 1.50 (1.12) 1507/1/19 to 6/30/20 63.92 (0.68) 16.01 15.33 — — (11.19) (11.19) — 4.14 68.06(11) 28.34(11) 664,833 1.57 1.57 (1.12) 2127/1/18 to 6/30/19 71.60 (0.68) 5.90 5.22 — — (12.90) (12.90) — (7.68) 63.92 12.40 601,112 1.51 1.56 (1.05) 1097/1/17 to 6/30/18 60.82 (0.64) 22.58 21.94 — — (11.16) (11.16) — 10.78 71.60 38.89 530,127 1.42 1.57 (0.95) 1047/1/16 to 6/30/17 48.03 (0.17)(15) 15.75 15.58 — — (2.79) (2.79) — 12.79 60.82(15) 33.69(15) 452,039 1.51 1.61 (0.31)(15) 128Class C7/1/21 to 12/31/21(6) $ 45.83 (0.42) 1.91 1.49 — — (23.45) (23.45) — (21.96) $ 23.87 5.39% $ 48,978 2.17%(9) 2.17% (1.87)% 55%7/1/20 to 6/30/21 43.68 (0.87) 18.99 18.12 — — (15.97) (15.97) — 2.15 45.83 44.01 53,742 2.24(9) 2.25 (1.88) 1507/1/19 to 6/30/20 45.22 (0.76) 10.41 9.65 — — (11.19) (11.19) — (1.54) 43.68(11) 27.37(11) 50,421 2.32 2.32 (1.87) 2127/1/18 to 6/30/19 55.32 (0.92) 3.72 2.80 — — (12.90) (12.90) — (10.10) 45.22 11.57 48,842 2.23 2.31 (1.78) 1097/1/17 to 6/30/18 49.43 (0.91) 17.96 17.05 — — (11.16) (11.16) — 5.89 55.32 37.86 138,589 2.17 2.32 (1.70) 1047/1/16 to 6/30/17 39.80 (0.46)(15) 12.88 12.42 — — (2.79) (2.79) — 9.63 49.43(15) 32.69(15) 113,411 2.26 2.36 (1.05)(15) 128Class P7/1/21 to 12/31/21(6) $ 98.14 (0.46) 5.28 4.82 — — (23.45) (23.45) — (18.63) $ 79.51 5.93% $ 120,374 1.19%(9) 1.19% (0.90)% 55%7/1/20 to 6/30/21 79.28 (0.81) 35.64 34.83 — — (15.97) (15.97) — 18.86 98.14 45.44 194,925 1.24(9) 1.25 (0.87) 1507/1/19 to 6/30/20 72.49 (0.60) 18.58 17.98 — — (11.19) (11.19) — 6.79 79.28(11) 28.67(11) 154,810 1.32 1.32 (0.87) 2127/1/18 to 6/30/19 79.05 (0.58) 6.92 6.34 — — (12.90) (12.90) — (6.56) 72.49 12.68 155,553 1.27 1.31 (0.80) 1097/1/17 to 6/30/18 66.03 (0.53) 24.71 24.18 — — (11.16) (11.16) — 13.02 79.05 39.24 100,560 1.17 1.32 (0.71) 1047/1/16 to 6/30/17 51.80 —(8)(15) 17.02 17.02 — — (2.79) (2.79) — 14.23 66.03(15) 34.03(15) 59,369 1.26 1.35 (0.01)(15) 128Institutional Class7/1/21 to 12/31/21(6) $101.34 (0.43) 5.47 5.04 — — (23.45) (23.45) — (18.41) $ 82.93 5.95% $1,366,346 1.13%(9) 1.13% (0.83)% 55%7/1/20 to 6/30/21 81.43 (0.77) 36.65 35.88 — — (15.97) (15.97) — 19.91 101.34 45.53 1,386,911 1.17(9) 1.18 (0.80) 1507/1/19 to 6/30/20 74.10 (0.55) 19.07 18.52 — — (11.19) (11.19) — 7.33 81.43(11) 28.78(11) 995,709 1.22 1.22 (0.78) 2127/1/18 to 6/30/19 80.40 (0.52) 7.12 6.60 — — (12.90) (12.90) — (6.30) 74.10 12.81 800,061 1.16 1.21 (0.69) 1097/1/17 to 6/30/18 66.94 (0.45) 25.07 24.62 — — (11.16) (11.16) — 13.46 80.40 39.37 789,922 1.07 1.22 (0.59) 1047/1/16 to 6/30/17 52.43 0.06(15) 17.24 17.30 — — (2.79) (2.79) — 14.51 66.94(15) 34.16(15) 736,162 1.16 1.25 0.09(15) 128
VIRTUS INVESTMENT TRUSTFINANCIAL HIGHLIGHTS (Continued)
SELECTED PER SHARE DATA AND RATIOS FOR A SHARE OUTSTANDINGTHROUGHOUT EACH PERIOD
The footnote legend is at the end of the financial highlights.
See Notes to Financial Statements
73
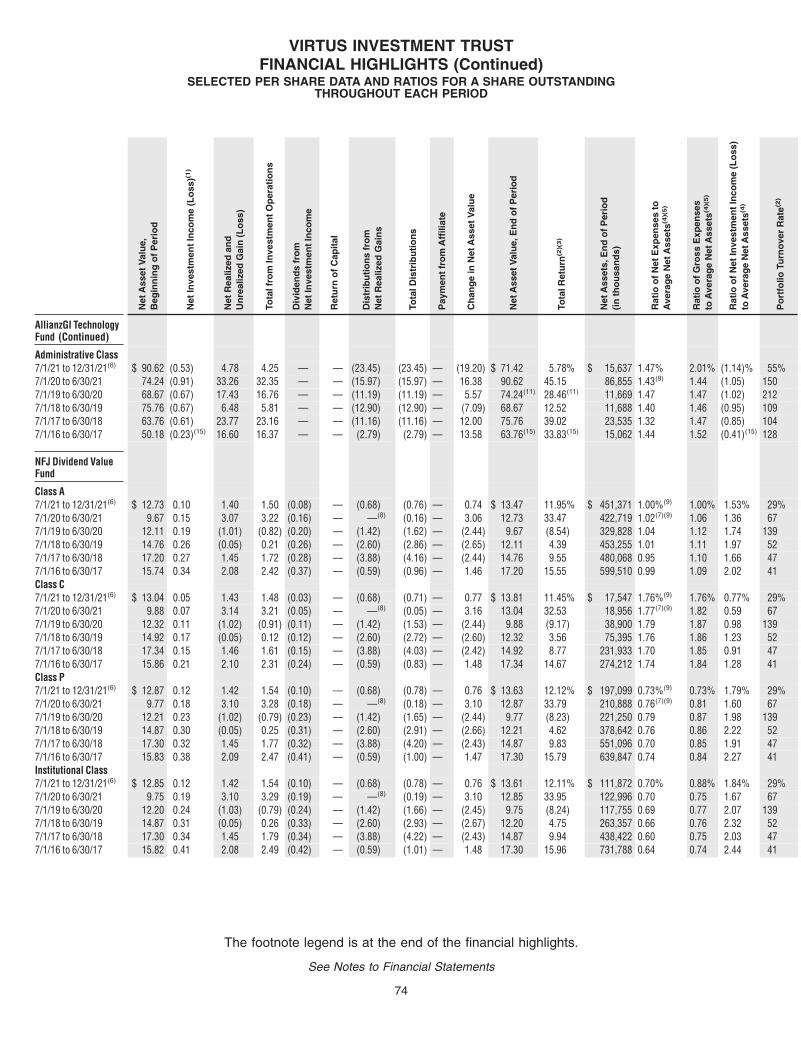
Net
Ass
etV
alu
e,B
egin
nin
go
fP
erio
d
Net
Inve
stm
ent
Inco
me
(Lo
ss)(1
)
Net
Rea
lized
and
Un
real
ized
Gai
n(L
oss
)
Tota
lfro
mIn
vest
men
tO
per
atio
ns
Div
iden
ds
fro
mN
etIn
vest
men
tIn
com
e
Ret
urn
of
Cap
ital
Dis
trib
uti
on
sfr
om
Net
Rea
lized
Gai
ns
Tota
lDis
trib
uti
on
s
Pay
men
tfr
om
Aff
iliat
e
Ch
ang
ein
Net
Ass
etV
alu
e
Net
Ass
etV
alu
e,E
nd
of
Per
iod
Tota
lRet
urn
(2)(
3)
Net
Ass
ets,
En
do
fP
erio
d(i
nth
ou
san
ds)
Rat
ioo
fN
etE
xpen
ses
toA
vera
ge
Net
Ass
ets(4
)(5
)
Rat
ioo
fG
ross
Exp
ense
sto
Ave
rag
eN
etA
sset
s(4)(
5)
Rat
ioo
fN
etIn
vest
men
tIn
com
e(L
oss
)to
Ave
rag
eN
etA
sset
s(4)
Po
rtfo
lioTu
rno
ver
Rat
e(2)
AllianzGI TechnologyFund (Continued)
Administrative Class7/1/21 to 12/31/21(6) $ 90.62 (0.53) 4.78 4.25 — — (23.45) (23.45) — (19.20) $ 71.42 5.78% $ 15,637 1.47% 2.01% (1.14)% 55%7/1/20 to 6/30/21 74.24 (0.91) 33.26 32.35 — — (15.97) (15.97) — 16.38 90.62 45.15 86,855 1.43(9) 1.44 (1.05) 1507/1/19 to 6/30/20 68.67 (0.67) 17.43 16.76 — — (11.19) (11.19) — 5.57 74.24(11) 28.46(11) 11,669 1.47 1.47 (1.02) 2127/1/18 to 6/30/19 75.76 (0.67) 6.48 5.81 — — (12.90) (12.90) — (7.09) 68.67 12.52 11,688 1.40 1.46 (0.95) 1097/1/17 to 6/30/18 63.76 (0.61) 23.77 23.16 — — (11.16) (11.16) — 12.00 75.76 39.02 23,535 1.32 1.47 (0.85) 1047/1/16 to 6/30/17 50.18 (0.23)(15) 16.60 16.37 — — (2.79) (2.79) — 13.58 63.76(15) 33.83(15) 15,062 1.44 1.52 (0.41)(15) 128
NFJ Dividend ValueFund
Class A7/1/21 to 12/31/21(6) $ 12.73 0.10 1.40 1.50 (0.08) — (0.68) (0.76) — 0.74 $ 13.47 11.95% $ 451,371 1.00%(9) 1.00% 1.53% 29%7/1/20 to 6/30/21 9.67 0.15 3.07 3.22 (0.16) — —(8) (0.16) — 3.06 12.73 33.47 422,719 1.02(7)(9) 1.06 1.36 677/1/19 to 6/30/20 12.11 0.19 (1.01) (0.82) (0.20) — (1.42) (1.62) — (2.44) 9.67 (8.54) 329,828 1.04 1.12 1.74 1397/1/18 to 6/30/19 14.76 0.26 (0.05) 0.21 (0.26) — (2.60) (2.86) — (2.65) 12.11 4.39 453,255 1.01 1.11 1.97 527/1/17 to 6/30/18 17.20 0.27 1.45 1.72 (0.28) — (3.88) (4.16) — (2.44) 14.76 9.55 480,068 0.95 1.10 1.66 477/1/16 to 6/30/17 15.74 0.34 2.08 2.42 (0.37) — (0.59) (0.96) — 1.46 17.20 15.55 599,510 0.99 1.09 2.02 41Class C7/1/21 to 12/31/21(6) $ 13.04 0.05 1.43 1.48 (0.03) — (0.68) (0.71) — 0.77 $ 13.81 11.45% $ 17,547 1.76%(9) 1.76% 0.77% 29%7/1/20 to 6/30/21 9.88 0.07 3.14 3.21 (0.05) — —(8) (0.05) — 3.16 13.04 32.53 18,956 1.77(7)(9) 1.82 0.59 677/1/19 to 6/30/20 12.32 0.11 (1.02) (0.91) (0.11) — (1.42) (1.53) — (2.44) 9.88 (9.17) 38,900 1.79 1.87 0.98 1397/1/18 to 6/30/19 14.92 0.17 (0.05) 0.12 (0.12) — (2.60) (2.72) — (2.60) 12.32 3.56 75,395 1.76 1.86 1.23 527/1/17 to 6/30/18 17.34 0.15 1.46 1.61 (0.15) — (3.88) (4.03) — (2.42) 14.92 8.77 231,933 1.70 1.85 0.91 477/1/16 to 6/30/17 15.86 0.21 2.10 2.31 (0.24) — (0.59) (0.83) — 1.48 17.34 14.67 274,212 1.74 1.84 1.28 41Class P7/1/21 to 12/31/21(6) $ 12.87 0.12 1.42 1.54 (0.10) — (0.68) (0.78) — 0.76 $ 13.63 12.12% $ 197,099 0.73%(9) 0.73% 1.79% 29%7/1/20 to 6/30/21 9.77 0.18 3.10 3.28 (0.18) — —(8) (0.18) — 3.10 12.87 33.79 210,888 0.76(7)(9) 0.81 1.60 677/1/19 to 6/30/20 12.21 0.23 (1.02) (0.79) (0.23) — (1.42) (1.65) — (2.44) 9.77 (8.23) 221,250 0.79 0.87 1.98 1397/1/18 to 6/30/19 14.87 0.30 (0.05) 0.25 (0.31) — (2.60) (2.91) — (2.66) 12.21 4.62 378,642 0.76 0.86 2.22 527/1/17 to 6/30/18 17.30 0.32 1.45 1.77 (0.32) — (3.88) (4.20) — (2.43) 14.87 9.83 551,096 0.70 0.85 1.91 477/1/16 to 6/30/17 15.83 0.38 2.09 2.47 (0.41) — (0.59) (1.00) — 1.47 17.30 15.79 639,847 0.74 0.84 2.27 41Institutional Class7/1/21 to 12/31/21(6) $ 12.85 0.12 1.42 1.54 (0.10) — (0.68) (0.78) — 0.76 $ 13.61 12.11% $ 111,872 0.70% 0.88% 1.84% 29%7/1/20 to 6/30/21 9.75 0.19 3.10 3.29 (0.19) — —(8) (0.19) — 3.10 12.85 33.95 122,996 0.70 0.75 1.67 677/1/19 to 6/30/20 12.20 0.24 (1.03) (0.79) (0.24) — (1.42) (1.66) — (2.45) 9.75 (8.24) 117,755 0.69 0.77 2.07 1397/1/18 to 6/30/19 14.87 0.31 (0.05) 0.26 (0.33) — (2.60) (2.93) — (2.67) 12.20 4.75 263,357 0.66 0.76 2.32 527/1/17 to 6/30/18 17.30 0.34 1.45 1.79 (0.34) — (3.88) (4.22) — (2.43) 14.87 9.94 438,422 0.60 0.75 2.03 477/1/16 to 6/30/17 15.82 0.41 2.08 2.49 (0.42) — (0.59) (1.01) — 1.48 17.30 15.96 731,788 0.64 0.74 2.44 41
VIRTUS INVESTMENT TRUSTFINANCIAL HIGHLIGHTS (Continued)
SELECTED PER SHARE DATA AND RATIOS FOR A SHARE OUTSTANDINGTHROUGHOUT EACH PERIOD
The footnote legend is at the end of the financial highlights.
See Notes to Financial Statements
74

Net
Ass
etV
alu
e,B
egin
nin
go
fP
erio
d
Net
Inve
stm
ent
Inco
me
(Lo
ss)(1
)
Net
Rea
lized
and
Un
real
ized
Gai
n(L
oss
)
Tota
lfro
mIn
vest
men
tO
per
atio
ns
Div
iden
ds
fro
mN
etIn
vest
men
tIn
com
e
Ret
urn
of
Cap
ital
Dis
trib
uti
on
sfr
om
Net
Rea
lized
Gai
ns
Tota
lDis
trib
uti
on
s
Pay
men
tfr
om
Aff
iliat
e
Ch
ang
ein
Net
Ass
etV
alu
e
Net
Ass
etV
alu
e,E
nd
of
Per
iod
Tota
lRet
urn
(2)(
3)
Net
Ass
ets,
En
do
fP
erio
d(i
nth
ou
san
ds)
Rat
ioo
fN
etE
xpen
ses
toA
vera
ge
Net
Ass
ets(4
)(5
)
Rat
ioo
fG
ross
Exp
ense
sto
Ave
rag
eN
etA
sset
s(4)(
5)
Rat
ioo
fN
etIn
vest
men
tIn
com
e(L
oss
)to
Ave
rag
eN
etA
sset
s(4)
Po
rtfo
lioTu
rno
ver
Rat
e(2)
NFJ Dividend ValueFund (Continued)
Class R67/1/21 to 12/31/21(6) $ 12.79 0.13 1.41 1.54 (0.11) — (0.68) (0.79) — 0.75 $ 13.54 12.17% $ 91,325 0.64%(9) 0.64% 1.90% 29%7/1/20 to 6/30/21 9.71 0.19 3.08 3.27 (0.19) — —(8) (0.19) — 3.08 12.79 33.98 82,578 0.64(7) 0.69 1.72 677/1/19 to 6/30/20 12.15 0.24 (1.02) (0.78) (0.24) — (1.42) (1.66) — (2.44) 9.71 (8.12) 60,490 0.64 0.72 2.15 1397/1/18 to 6/30/19 14.83 0.31 (0.04) 0.27 (0.35) — (2.60) (2.95) — (2.68) 12.15 4.82 65,935 0.61 0.71 2.38 527/1/17 to 6/30/18 17.27 0.34 1.45 1.79 (0.35) — (3.88) (4.23) — (2.44) 14.83 9.96 85,285 0.55 0.70 2.06 477/1/16 to 6/30/17 15.80 0.41 2.09 2.50 (0.44) — (0.59) (1.03) — 1.47 17.27 16.01 95,755 0.59 0.69 2.44 41Administrative Class7/1/21 to 12/31/21(6) $ 13.12 0.11 1.44 1.55 (0.09) — (0.68) (0.77) — 0.78 $ 13.90 11.94% $ 37,763 0.91%(9) 0.91% 1.63% 29%7/1/20 to 6/30/21 9.96 0.17 3.15 3.32 (0.16) — —(8) (0.16) — 3.16 13.12 33.55 33,289 0.94(7) 0.98 1.44 677/1/19 to 6/30/20 12.41 0.21 (1.03) (0.82) (0.21) — (1.42) (1.63) — (2.45) 9.96 (8.33) 25,794 0.94 1.02 1.84 1397/1/18 to 6/30/19 15.04 0.28 (0.05) 0.23 (0.26) — (2.60) (2.86) — (2.63) 12.41 4.42 47,049 0.91 1.01 2.07 527/1/17 to 6/30/18 17.41 0.32 1.43 1.75 (0.24) — (3.88) (4.12) — (2.37) 15.04 9.67 84,009 0.85 1.00 1.87 477/1/16 to 6/30/17 15.92 0.36 2.11 2.47 (0.39) — (0.59) (0.98) — 1.49 17.41 15.68 345,533 0.89 0.99 2.11 41
NFJ InternationalValue Fund
Class A7/1/21 to 12/31/21(6) $ 22.93 0.20 (0.51) (0.31) (0.37) — — (0.37) — (0.68) $ 22.25 (1.30)% $ 67,110 1.30% 1.36% 1.83% 30%7/1/20 to 6/30/21 16.86 0.28 6.15 6.43 (0.36) — — (0.36) — 6.07 22.93 38.47 73,311 1.30(7)(9) 1.34 1.38 1167/1/19 to 6/30/20 18.47 0.36 (1.58) (1.22) (0.39) — — (0.39) — (1.61) 16.86 (6.66) 55,297 1.30 1.37 2.06 917/1/18 to 6/30/19 18.52 0.33 (0.08) 0.25 (0.30) — — (0.30) — (0.05) 18.47 1.44 71,931 1.30 1.38 1.84 497/1/17 to 6/30/18 18.13 0.34 0.38 0.72 (0.32) (0.01) — (0.33) — 0.39 18.52 3.95 88,385 1.29 1.37 1.76 637/1/16 to 6/30/17 16.32 0.34 1.92 2.26 (0.45) — — (0.45) — 1.81 18.13 13.99 127,642 1.30 1.35 2.01 63Class C7/1/21 to 12/31/21(6) $ 22.51 0.13 (0.50) (0.37) (0.29) — — (0.29) — (0.66) $ 21.85 (1.60)% $ 2,671 2.02%(9) 2.02% 1.17% 30%7/1/20 to 6/30/21 16.57 0.11 6.04 6.15 (0.21) — — (0.21) — 5.94 22.51 37.40 3,576 2.02(9) 2.07 0.56 1167/1/19 to 6/30/20 18.15 0.22 (1.54) (1.32) (0.26) — — (0.26) — (1.58) 16.57 (7.33) 7,488 2.05 2.12 1.27 917/1/18 to 6/30/19 18.20 0.17 (0.04) 0.13 (0.18) — — (0.18) — (0.05) 18.15 0.76 13,926 2.05 2.13 0.98 497/1/17 to 6/30/18 17.86 0.19 0.37 0.56 (0.21) (0.01) — (0.22) — 0.34 18.20 3.11 36,184 2.04 2.12 0.99 637/1/16 to 6/30/17 16.09 0.23 1.86 2.09 (0.32) — — (0.32) — 1.77 17.86 13.10 54,546 2.05 2.10 1.37 63Class P7/1/21 to 12/31/21(6) $ 23.09 0.24 (0.51) (0.27) (0.41) — — (0.41) — (0.68) $ 22.41 (1.12)% $ 23,965 1.00%(9) 1.00% 2.15% 30%7/1/20 to 6/30/21 16.96 0.34 6.19 6.53 (0.40) — — (0.40) — 6.13 23.09 38.86 26,708 1.03(7)(9) 1.07 1.65 1167/1/19 to 6/30/20 18.58 0.41 (1.60) (1.19) (0.43) — — (0.43) — (1.62) 16.96 (6.45) 22,912 1.05 1.12 2.29 917/1/18 to 6/30/19 18.61 0.35 (0.04) 0.31 (0.34) — — (0.34) — (0.03) 18.58 1.76 38,655 1.05 1.13 1.93 497/1/17 to 6/30/18 18.21 0.36 0.41 0.77 (0.36) (0.01) — (0.37) — 0.40 18.61 4.17 89,644 1.04 1.12 1.87 637/1/16 to 6/30/17 16.40 0.40 1.90 2.30 (0.49) — — (0.49) — 1.81 18.21 14.20 148,540 1.05 1.10 2.34 63
VIRTUS INVESTMENT TRUSTFINANCIAL HIGHLIGHTS (Continued)
SELECTED PER SHARE DATA AND RATIOS FOR A SHARE OUTSTANDINGTHROUGHOUT EACH PERIOD
The footnote legend is at the end of the financial highlights.
See Notes to Financial Statements
75

Net
Ass
etV
alu
e,B
egin
nin
go
fP
erio
d
Net
Inve
stm
ent
Inco
me
(Lo
ss)(1
)
Net
Rea
lized
and
Un
real
ized
Gai
n(L
oss
)
Tota
lfro
mIn
vest
men
tO
per
atio
ns
Div
iden
ds
fro
mN
etIn
vest
men
tIn
com
e
Ret
urn
of
Cap
ital
Dis
trib
uti
on
sfr
om
Net
Rea
lized
Gai
ns
Tota
lDis
trib
uti
on
s
Pay
men
tfr
om
Aff
iliat
e
Ch
ang
ein
Net
Ass
etV
alu
e
Net
Ass
etV
alu
e,E
nd
of
Per
iod
Tota
lRet
urn
(2)(
3)
Net
Ass
ets,
En
do
fP
erio
d(i
nth
ou
san
ds)
Rat
ioo
fN
etE
xpen
ses
toA
vera
ge
Net
Ass
ets(4
)(5
)
Rat
ioo
fG
ross
Exp
ense
sto
Ave
rag
eN
etA
sset
s(4)(
5)
Rat
ioo
fN
etIn
vest
men
tIn
com
e(L
oss
)to
Ave
rag
eN
etA
sset
s(4)
Po
rtfo
lioTu
rno
ver
Rat
e(2)
NFJ InternationalValueFund (Continued)
Institutional Class7/1/21 to 12/31/21(6) $ 23.11 0.25 (0.52) (0.27) (0.42) — — (0.42) — (0.69) $ 22.42 (1.13)% $ 47,797 0.95%(9) 0.95% 2.18% 30%7/1/20 to 6/30/21 16.98 0.36 6.19 6.55 (0.42) — — (0.42) — 6.13 23.11 38.95 48,096 0.95 1.00 1.76 1167/1/19 to 6/30/20 18.60 0.43 (1.60) (1.17) (0.45) — — (0.45) — (1.62) 16.98 (6.33) 37,009 0.95 1.02 2.41 917/1/18 to 6/30/19 18.64 0.41 (0.08) 0.33 (0.37) — — (0.37) — (0.04) 18.60 1.84 46,473 0.95 1.03 2.24 497/1/17 to 6/30/18 18.24 0.42 0.36 0.78 (0.37) (0.01) — (0.38) — 0.40 18.64 4.27 55,924 0.94 1.02 2.14 637/1/16 to 6/30/17 16.42 0.37 1.95 2.32 (0.50) — — (0.50) — 1.82 18.24 14.33 74,272 0.95 1.00 2.18 63Class R67/1/21 to 12/31/21(6) $ 23.08 0.25 (0.51) (0.26) (0.42) — — (0.42) — (0.68) $ 22.40 (1.06)% $ 2,845 0.89%(9) 0.89% 2.22% 30%7/1/20 to 6/30/21 16.97 0.41 6.13 6.54 (0.43) — — (0.43) — 6.11 23.08 38.97 2,741 0.90 0.95 1.96 1167/1/19 to 6/30/20 18.59 0.44 (1.60) (1.16) (0.46) — — (0.46) — (1.62) 16.97 (6.28) 1,230 0.90 0.97 2.47 917/1/18 to 6/30/19 18.63 0.37 (0.04) 0.33 (0.37) — — (0.37) — (0.04) 18.59 1.88 1,277 0.90 0.98 2.07 497/1/17 to 6/30/18 18.19 0.29 0.50 0.79 (0.34) (0.01) — (0.35) — 0.44 18.63 4.31 1,836 0.89 0.97 1.48 637/1/16 to 6/30/17 16.38 0.40 1.93 2.33 (0.52) — — (0.52) — 1.81 18.19 14.42 28,460 0.90 0.95 2.33 63Administrative Class7/1/21 to 12/31/21(6) $ 23.06 0.20 (0.50) (0.30) (0.39) — — (0.39) — (0.69) $ 22.37 (1.26)% $ 1,974 1.20% 1.24% 1.78% 30%7/1/20 to 6/30/21 16.92 0.11 6.35 6.46 (0.32) — — (0.32) — 6.14 23.06 38.57 1,219 1.20 1.28 0.57 1167/1/19 to 6/30/20 18.54 0.38 (1.59) (1.21) (0.41) — — (0.41) — (1.62) 16.92 (6.58) 1,147 1.20 1.27 2.17 917/1/18 to 6/30/19 18.56 0.29 0.01 0.30 (0.32) — — (0.32) — (0.02) 18.54 1.68 1,436 1.20 1.28 1.60 497/1/17 to 6/30/18 18.19 0.38 0.35 0.73 (0.35) (0.01) — (0.36) — 0.37 18.56 4.01 4,829 1.19 1.27 1.96 637/1/16 to 6/30/17 16.37 0.36 1.92 2.28 (0.46) — — (0.46) — 1.82 18.19 14.09 4,973 1.20 1.25 2.08 63
NFJ Large-Cap ValueFund
Class A7/1/21 to 12/31/21(6) $ 33.12 0.10 3.11 3.21 (0.07) — (1.91) (1.98) — 1.23 $ 34.35 9.83% $ 191,835 1.01%(9) 1.01% 0.57% 14%7/1/20 to 6/30/21 24.49 0.23 8.62 8.85 (0.22) — — (0.22) — 8.63 33.12 36.24 184,745 1.06(9) 1.06 0.79 697/1/19 to 6/30/20 26.90 0.39 (1.88) (1.49) (0.41) — (0.51) (0.92) — (2.41) 24.49 (5.71) 150,404 1.12 1.12 1.48 1147/1/18 to 6/30/19 26.14 0.41 0.79 1.20 (0.39) — (0.05) (0.44) — 0.76 26.90 4.67 178,311 1.12 1.12 1.57 687/1/17 to 6/30/18 24.31 0.41 1.83 2.24 (0.41) — — (0.41) — 1.83 26.14 9.27 145,338 1.06 1.11 1.56 1107/1/16 to 6/30/17 20.34 0.36 3.97(16) 4.33 (0.36) — — (0.36) — 3.97 24.31(16) 21.42(16) 151,306 1.02 1.12 1.60 67Class C7/1/21 to 12/31/21(6) $ 33.54 (0.03) 3.14 3.11 — — (1.91) (1.91) — 1.20 $ 34.74 9.40% $ 3,664 1.76%(9) 1.76% (0.18)% 14%7/1/20 to 6/30/21 24.82 0.02 8.73 8.75 (0.03) — — (0.03) — 8.72 33.54 35.24 4,056 1.81(9) 1.81 0.06 697/1/19 to 6/30/20 27.23 0.19 (1.88) (1.69) (0.21) — (0.51) (0.72) — (2.41) 24.82 (6.41) 7,854 1.87 1.87 0.73 1147/1/18 to 6/30/19 26.44 0.19 0.81 1.00 (0.16) — (0.05) (0.21) — 0.79 27.23 3.82 12,080 1.87 1.87 0.70 687/1/17 to 6/30/18 24.57 0.22 1.86 2.08 (0.21) — — (0.21) — 1.87 26.44 8.49 62,232 1.81 1.86 0.82 1107/1/16 to 6/30/17 20.50 0.19 4.01(16) 4.20 (0.13) — — (0.13) — 4.07 24.57(16) 20.52(16) 70,159 1.77 1.87 0.86 67
VIRTUS INVESTMENT TRUSTFINANCIAL HIGHLIGHTS (Continued)
SELECTED PER SHARE DATA AND RATIOS FOR A SHARE OUTSTANDINGTHROUGHOUT EACH PERIOD
The footnote legend is at the end of the financial highlights.
See Notes to Financial Statements
76
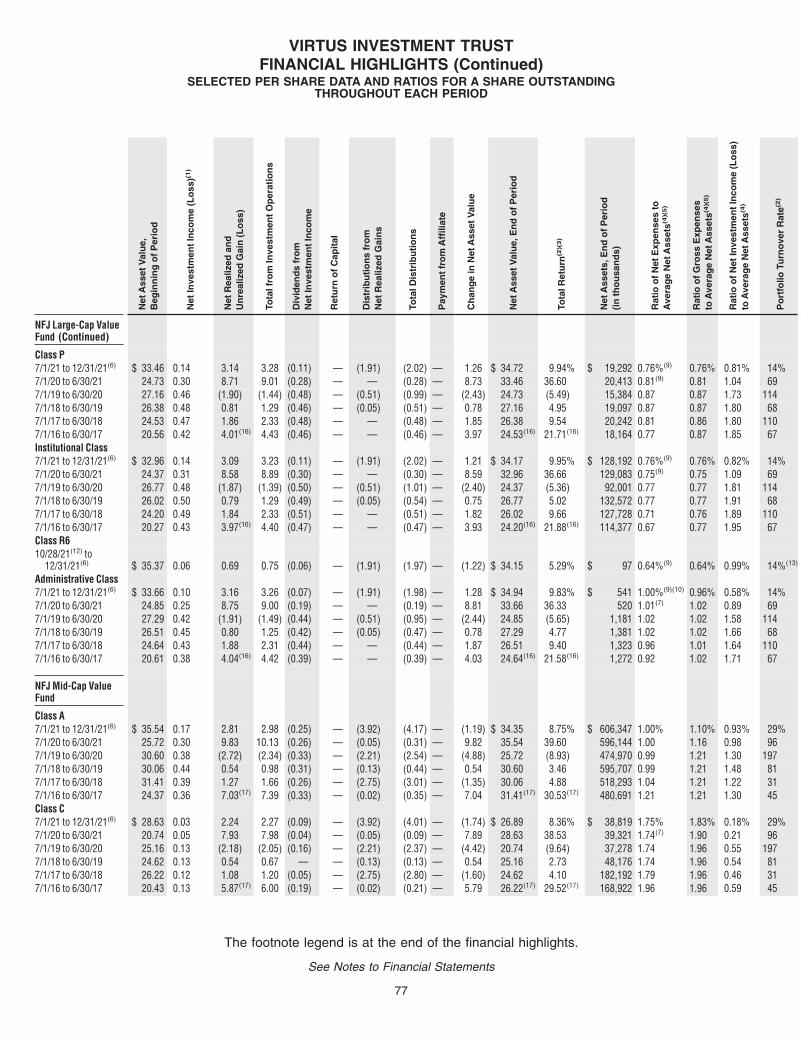
Net
Ass
etV
alu
e,B
egin
nin
go
fP
erio
d
Net
Inve
stm
ent
Inco
me
(Lo
ss)(1
)
Net
Rea
lized
and
Un
real
ized
Gai
n(L
oss
)
Tota
lfro
mIn
vest
men
tO
per
atio
ns
Div
iden
ds
fro
mN
etIn
vest
men
tIn
com
e
Ret
urn
of
Cap
ital
Dis
trib
uti
on
sfr
om
Net
Rea
lized
Gai
ns
Tota
lDis
trib
uti
on
s
Pay
men
tfr
om
Aff
iliat
e
Ch
ang
ein
Net
Ass
etV
alu
e
Net
Ass
etV
alu
e,E
nd
of
Per
iod
Tota
lRet
urn
(2)(
3)
Net
Ass
ets,
En
do
fP
erio
d(i
nth
ou
san
ds)
Rat
ioo
fN
etE
xpen
ses
toA
vera
ge
Net
Ass
ets(4
)(5
)
Rat
ioo
fG
ross
Exp
ense
sto
Ave
rag
eN
etA
sset
s(4)(
5)
Rat
ioo
fN
etIn
vest
men
tIn
com
e(L
oss
)to
Ave
rag
eN
etA
sset
s(4)
Po
rtfo
lioTu
rno
ver
Rat
e(2)
NFJ Large-Cap ValueFund (Continued)
Class P7/1/21 to 12/31/21(6) $ 33.46 0.14 3.14 3.28 (0.11) — (1.91) (2.02) — 1.26 $ 34.72 9.94% $ 19,292 0.76%(9) 0.76% 0.81% 14%7/1/20 to 6/30/21 24.73 0.30 8.71 9.01 (0.28) — — (0.28) — 8.73 33.46 36.60 20,413 0.81(9) 0.81 1.04 697/1/19 to 6/30/20 27.16 0.46 (1.90) (1.44) (0.48) — (0.51) (0.99) — (2.43) 24.73 (5.49) 15,384 0.87 0.87 1.73 1147/1/18 to 6/30/19 26.38 0.48 0.81 1.29 (0.46) — (0.05) (0.51) — 0.78 27.16 4.95 19,097 0.87 0.87 1.80 687/1/17 to 6/30/18 24.53 0.47 1.86 2.33 (0.48) — — (0.48) — 1.85 26.38 9.54 20,242 0.81 0.86 1.80 1107/1/16 to 6/30/17 20.56 0.42 4.01(16) 4.43 (0.46) — — (0.46) — 3.97 24.53(16) 21.71(16) 18,164 0.77 0.87 1.85 67Institutional Class7/1/21 to 12/31/21(6) $ 32.96 0.14 3.09 3.23 (0.11) — (1.91) (2.02) — 1.21 $ 34.17 9.95% $ 128,192 0.76%(9) 0.76% 0.82% 14%7/1/20 to 6/30/21 24.37 0.31 8.58 8.89 (0.30) — — (0.30) — 8.59 32.96 36.66 129,083 0.75(9) 0.75 1.09 697/1/19 to 6/30/20 26.77 0.48 (1.87) (1.39) (0.50) — (0.51) (1.01) — (2.40) 24.37 (5.36) 92,001 0.77 0.77 1.81 1147/1/18 to 6/30/19 26.02 0.50 0.79 1.29 (0.49) — (0.05) (0.54) — 0.75 26.77 5.02 132,572 0.77 0.77 1.91 687/1/17 to 6/30/18 24.20 0.49 1.84 2.33 (0.51) — — (0.51) — 1.82 26.02 9.66 127,728 0.71 0.76 1.89 1107/1/16 to 6/30/17 20.27 0.43 3.97(16) 4.40 (0.47) — — (0.47) — 3.93 24.20(16) 21.88(16) 114,377 0.67 0.77 1.95 67Class R610/28/21(12) to
12/31/21(6) $ 35.37 0.06 0.69 0.75 (0.06) — (1.91) (1.97) — (1.22) $ 34.15 5.29% $ 97 0.64%(9) 0.64% 0.99% 14%(13)
Administrative Class7/1/21 to 12/31/21(6) $ 33.66 0.10 3.16 3.26 (0.07) — (1.91) (1.98) — 1.28 $ 34.94 9.83% $ 541 1.00%(9)(10) 0.96% 0.58% 14%7/1/20 to 6/30/21 24.85 0.25 8.75 9.00 (0.19) — — (0.19) — 8.81 33.66 36.33 520 1.01(7) 1.02 0.89 697/1/19 to 6/30/20 27.29 0.42 (1.91) (1.49) (0.44) — (0.51) (0.95) — (2.44) 24.85 (5.65) 1,181 1.02 1.02 1.58 1147/1/18 to 6/30/19 26.51 0.45 0.80 1.25 (0.42) — (0.05) (0.47) — 0.78 27.29 4.77 1,381 1.02 1.02 1.66 687/1/17 to 6/30/18 24.64 0.43 1.88 2.31 (0.44) — — (0.44) — 1.87 26.51 9.40 1,323 0.96 1.01 1.64 1107/1/16 to 6/30/17 20.61 0.38 4.04(16) 4.42 (0.39) — — (0.39) — 4.03 24.64(16) 21.58(16) 1,272 0.92 1.02 1.71 67
NFJ Mid-Cap ValueFund
Class A7/1/21 to 12/31/21(6) $ 35.54 0.17 2.81 2.98 (0.25) — (3.92) (4.17) — (1.19) $ 34.35 8.75% $ 606,347 1.00% 1.10% 0.93% 29%7/1/20 to 6/30/21 25.72 0.30 9.83 10.13 (0.26) — (0.05) (0.31) — 9.82 35.54 39.60 596,144 1.00 1.16 0.98 967/1/19 to 6/30/20 30.60 0.38 (2.72) (2.34) (0.33) — (2.21) (2.54) — (4.88) 25.72 (8.93) 474,970 0.99 1.21 1.30 1977/1/18 to 6/30/19 30.06 0.44 0.54 0.98 (0.31) — (0.13) (0.44) — 0.54 30.60 3.46 595,707 0.99 1.21 1.48 817/1/17 to 6/30/18 31.41 0.39 1.27 1.66 (0.26) — (2.75) (3.01) — (1.35) 30.06 4.88 518,293 1.04 1.21 1.22 317/1/16 to 6/30/17 24.37 0.36 7.03(17) 7.39 (0.33) — (0.02) (0.35) — 7.04 31.41(17) 30.53(17) 480,691 1.21 1.21 1.30 45Class C7/1/21 to 12/31/21(6) $ 28.63 0.03 2.24 2.27 (0.09) — (3.92) (4.01) — (1.74) $ 26.89 8.36% $ 38,819 1.75% 1.83% 0.18% 29%7/1/20 to 6/30/21 20.74 0.05 7.93 7.98 (0.04) — (0.05) (0.09) — 7.89 28.63 38.53 39,321 1.74(7) 1.90 0.21 967/1/19 to 6/30/20 25.16 0.13 (2.18) (2.05) (0.16) — (2.21) (2.37) — (4.42) 20.74 (9.64) 37,278 1.74 1.96 0.55 1977/1/18 to 6/30/19 24.62 0.13 0.54 0.67 — — (0.13) (0.13) — 0.54 25.16 2.73 48,176 1.74 1.96 0.54 817/1/17 to 6/30/18 26.22 0.12 1.08 1.20 (0.05) — (2.75) (2.80) — (1.60) 24.62 4.10 182,192 1.79 1.96 0.46 317/1/16 to 6/30/17 20.43 0.13 5.87(17) 6.00 (0.19) — (0.02) (0.21) — 5.79 26.22(17) 29.52(17) 168,922 1.96 1.96 0.59 45
VIRTUS INVESTMENT TRUSTFINANCIAL HIGHLIGHTS (Continued)
SELECTED PER SHARE DATA AND RATIOS FOR A SHARE OUTSTANDINGTHROUGHOUT EACH PERIOD
The footnote legend is at the end of the financial highlights.
See Notes to Financial Statements
77

Net
Ass
etV
alu
e,B
egin
nin
go
fP
erio
d
Net
Inve
stm
ent
Inco
me
(Lo
ss)(1
)
Net
Rea
lized
and
Un
real
ized
Gai
n(L
oss
)
Tota
lfro
mIn
vest
men
tO
per
atio
ns
Div
iden
ds
fro
mN
etIn
vest
men
tIn
com
e
Ret
urn
of
Cap
ital
Dis
trib
uti
on
sfr
om
Net
Rea
lized
Gai
ns
Tota
lDis
trib
uti
on
s
Pay
men
tfr
om
Aff
iliat
e
Ch
ang
ein
Net
Ass
etV
alu
e
Net
Ass
etV
alu
e,E
nd
of
Per
iod
Tota
lRet
urn
(2)(
3)
Net
Ass
ets,
En
do
fP
erio
d(i
nth
ou
san
ds)
Rat
ioo
fN
etE
xpen
ses
toA
vera
ge
Net
Ass
ets(4
)(5
)
Rat
ioo
fG
ross
Exp
ense
sto
Ave
rag
eN
etA
sset
s(4)(
5)
Rat
ioo
fN
etIn
vest
men
tIn
com
e(L
oss
)to
Ave
rag
eN
etA
sset
s(4)
Po
rtfo
lioTu
rno
ver
Rat
e(2)
NFJ Mid-Cap ValueFund (Continued)
Class P7/1/21 to 12/31/21(6) $ 27.90 0.16 2.19 2.35 (0.38) — (3.92) (4.30) — (1.95) $ 25.95 8.88% $ 185,107 0.75% 0.84% 1.14% 29%7/1/20 to 6/30/21 20.30 0.29 7.74 8.03 (0.38) — (0.05) (0.43) — 7.60 27.90 39.93 239,250 0.75 0.90 1.23 967/1/19 to 6/30/20 24.68 0.36 (2.10) (1.74) (0.43) — (2.21) (2.64) — (4.38) 20.30 (8.72) 211,729 0.74 0.96 1.57 1977/1/18 to 6/30/19 24.35 0.41 0.43 0.84 (0.38) — (0.13) (0.51) — 0.33 24.68 3.75 197,201 0.74 0.96 1.70 817/1/17 to 6/30/18 26.01 0.37 1.10 1.47 (0.38) — (2.75) (3.13) — (1.66) 24.35 5.17 200,081 0.77 0.96 1.46 317/1/16 to 6/30/17 20.27 0.32 5.87(17) 6.19 (0.43) — (0.02) (0.45) — 5.74 26.01(17) 30.82(17) 52,167 0.96 0.96 1.39 45Institutional Class7/1/21 to 12/31/21(6) $ 38.28 0.25 3.04 3.29 (0.38) — (3.92) (4.30) — (1.01) $ 37.27 8.94% $ 484,097 0.65% 0.81% 1.29% 29%7/1/20 to 6/30/21 27.70 0.44 10.59 11.03 (0.40) — (0.05) (0.45) — 10.58 38.28 40.11 460,452 0.65 0.84 1.33 967/1/19 to 6/30/20 32.77 0.51 (2.92) (2.41) (0.45) — (2.21) (2.66) — (5.07) 27.70 (8.62) 385,311 0.64 0.86 1.67 1977/1/18 to 6/30/19 32.15 0.58 0.57 1.15 (0.40) — (0.13) (0.53) — 0.62 32.77 3.83 406,173 0.64 0.86 1.82 817/1/17 to 6/30/18 33.41 0.51 1.38 1.89 (0.40) — (2.75) (3.15) — (1.26) 32.15 5.26 332,110 0.66 0.86 1.53 317/1/16 to 6/30/17 25.88 0.48 7.47(17) 7.95 (0.40) — (0.02) (0.42) — 7.53 33.41(17) 30.95(17) 53,333 0.86 0.86 1.66 45Class R67/1/21 to 12/31/21(6) $ 38.24 0.26 3.04 3.30 (0.38) — (3.92) (4.30) — (1.00) $ 37.24 8.97% $ 87,312 0.60% 0.74% 1.32% 29%7/1/20 to 6/30/21 27.68 0.45 10.59 11.04 (0.43) — (0.05) (0.48) — 10.56 38.24 40.17 85,969 0.60 0.78 1.37 967/1/19 to 6/30/20 32.75 0.56 (2.95) (2.39) (0.47) — (2.21) (2.68) — (5.07) 27.68 (8.57) 66,260 0.59 0.81 1.86 1977/1/18 to 6/30/19 32.13 0.63 0.53 1.16 (0.41) — (0.13) (0.54) — 0.62 32.75 3.89 18,052 0.59 0.81 2.03 8112/18/17(12) to
6/30/18 36.74 0.18 (1.61) (1.43) (0.43) — (2.75) (3.18) — (4.61) 32.13 (4.25) 2,167 0.59 0.81 1.04 31(13)
Administrative Class7/1/21 to 12/31/21(6) $ 36.77 0.19 2.92 3.11 (0.26) — (3.92) (4.18) — (1.07) $ 35.70 8.81% $ 44,048 0.90% 1.00% 1.02% 29%7/1/20 to 6/30/21 26.59 0.34 10.17 10.51 (0.28) — (0.05) (0.33) — 10.18 36.77 39.73 49,280 0.90 1.08 1.06 967/1/19 to 6/30/20 31.57 0.42 (2.81) (2.39) (0.38) — (2.21) (2.59) — (4.98) 26.59 (8.85) 33,511 0.89 1.11 1.43 1977/1/18 to 6/30/19 31.00 0.48 0.56 1.04 (0.34) — (0.13) (0.47) — 0.57 31.57 3.60 27,405 0.89 1.11 1.58 817/1/17 to 6/30/18 32.35 0.42 1.32 1.74 (0.34) — (2.75) (3.09) — (1.35) 31.00 4.98 18,947 0.92 1.11 1.32 317/1/16 to 6/30/17 25.08 0.40 7.24(17) 7.64 (0.35) — (0.02) (0.37) — 7.27 32.35(17) 30.66(17) 5,120 1.11 1.11 1.40 45
NFJ Small-Cap ValueFund
Class A7/1/21 to 12/31/21(6) $ 15.67 0.06 0.93 0.99 (0.17) — (1.14) (1.31) — (0.32) $ 15.35 6.63% $ 306,710 1.17% 1.20% 0.75% 23%7/1/20 to 6/30/21 11.07 0.18 4.71 4.89 (0.24) — (0.05) (0.29) — 4.60 15.67 44.57 325,048 1.18(7)(9) 1.23 1.34 657/1/19 to 6/30/20 14.53 0.18 (2.28) (2.10) (0.06) — (1.30) (1.36) — (3.46) 11.07 (16.62) 267,845 1.17 1.27 1.37 1267/1/18 to 6/30/19 21.71 0.29 (2.73) (2.44) (0.62) — (4.12) (4.74) — (7.18) 14.53 (7.70) 439,710 1.18 1.26 1.65 477/1/17 to 6/30/18 24.36 0.29 1.44 1.73 (0.12) — (4.26) (4.38) — (2.65) 21.71 7.04 718,104 1.20 1.25 1.27 247/1/16 to 6/30/17 20.82 0.30 4.12 4.42 (0.32) — (0.56) (0.88) — 3.54 24.36 21.38 788,438 1.20 1.24 1.31 30
VIRTUS INVESTMENT TRUSTFINANCIAL HIGHLIGHTS (Continued)
SELECTED PER SHARE DATA AND RATIOS FOR A SHARE OUTSTANDINGTHROUGHOUT EACH PERIOD
The footnote legend is at the end of the financial highlights.
See Notes to Financial Statements
78

Net
Ass
etV
alu
e,B
egin
nin
go
fP
erio
d
Net
Inve
stm
ent
Inco
me
(Lo
ss)(1
)
Net
Rea
lized
and
Un
real
ized
Gai
n(L
oss
)
Tota
lfro
mIn
vest
men
tO
per
atio
ns
Div
iden
ds
fro
mN
etIn
vest
men
tIn
com
e
Ret
urn
of
Cap
ital
Dis
trib
uti
on
sfr
om
Net
Rea
lized
Gai
ns
Tota
lDis
trib
uti
on
s
Pay
men
tfr
om
Aff
iliat
e
Ch
ang
ein
Net
Ass
etV
alu
e
Net
Ass
etV
alu
e,E
nd
of
Per
iod
Tota
lRet
urn
(2)(
3)
Net
Ass
ets,
En
do
fP
erio
d(i
nth
ou
san
ds)
Rat
ioo
fN
etE
xpen
ses
toA
vera
ge
Net
Ass
ets(4
)(5
)
Rat
ioo
fG
ross
Exp
ense
sto
Ave
rag
eN
etA
sset
s(4)(
5)
Rat
ioo
fN
etIn
vest
men
tIn
com
e(L
oss
)to
Ave
rag
eN
etA
sset
s(4)
Po
rtfo
lioTu
rno
ver
Rat
e(2)
NFJ Small-Cap ValueFund (Continued)
Class C7/1/21 to 12/31/21(6) $ 13.78 —(8) 0.82 0.82 (0.10) — (1.14) (1.24) — (0.42) $ 13.36 6.25% $ 1,643 1.92% 1.95% 0.01% 23%7/1/20 to 6/30/21 9.74 0.07 4.14 4.21 (0.12) — (0.05) (0.17) — 4.04 13.78 43.52 1,606 1.91(9) 1.97 0.60 657/1/19 to 6/30/20 12.97 0.07 (2.00) (1.93) — — (1.30) (1.30) — (3.23) 9.74 (17.26) 1,627 1.92 2.02 0.58 1267/1/18 to 6/30/19 19.30 0.16 (2.41) (2.25) — — (4.08)(18) (4.08) — (6.33) 12.97 (8.35) 3,984 1.93 2.01 0.88 477/1/17 to 6/30/18 22.14 0.11 1.31 1.42 — — (4.26) (4.26) — (2.84) 19.30 6.26 106,052 1.95 2.00 0.54 247/1/16 to 6/30/17 19.02 0.12 3.75 3.87 (0.19) — (0.56) (0.75) — 3.12 22.14 20.45 135,225 1.95 1.99 0.56 30Class P7/1/21 to 12/31/21(6) $ 18.42 0.09 1.12 1.21 (0.18) — (1.14) (1.32) — (0.11) $ 18.31 6.83% $ 20,679 0.91%(9) 0.91% 0.99% 23%7/1/20 to 6/30/21 12.97 0.25 5.52 5.77 (0.27) — (0.05) (0.32) — 5.45 18.42 44.88 24,149 0.91(9) 0.96 1.61 657/1/19 to 6/30/20 16.79 0.25 (2.68) (2.43) (0.09) — (1.30) (1.39) — (3.82) 12.97 (16.39) 21,354 0.92 1.02 1.62 1267/1/18 to 6/30/19 24.18 0.38 (2.97) (2.59) (0.68) — (4.12) (4.80) — (7.39) 16.79 (7.49) 39,426 0.93 1.01 1.91 477/1/17 to 6/30/18 26.69 0.39 1.56 1.95 (0.20) — (4.26) (4.46) — (2.51) 24.18 7.27 65,466 0.95 1.00 1.54 247/1/16 to 6/30/17 22.74 0.36 4.54 4.90 (0.39) — (0.56) (0.95) — 3.95 26.69 21.66 72,679 0.95 0.99 1.42 30Institutional Class7/1/21 to 12/31/21(6) $ 18.66 0.10 1.14 1.24 (0.19) — (1.14) (1.33) — (0.09) $ 18.57 6.89% $ 79,187 0.82% 0.87% 1.09% 23%7/1/20 to 6/30/21 13.13 0.27 5.59 5.86 (0.28) — (0.05) (0.33) — 5.53 18.66 45.07 94,847 0.82 0.89 1.69 657/1/19 to 6/30/20 16.95 0.27 (2.72) (2.45) (0.07) — (1.30) (1.37) — (3.82) 13.13 (16.31) 99,894 0.82 0.92 1.67 1267/1/18 to 6/30/19 24.34 0.41 (3.00) (2.59) (0.68) — (4.12) (4.80) — (7.39) 16.95 (7.42) 288,309 0.83 0.91 1.98 477/1/17 to 6/30/18 26.82 0.42 1.58 2.00 (0.22) — (4.26) (4.48) — (2.48) 24.34 7.43 778,547 0.85 0.90 1.61 247/1/16 to 6/30/17 22.84 0.42 4.53 4.95 (0.41) — (0.56) (0.97) — 3.98 26.82 21.82 1,213,861 0.83 0.89 1.68 30Class R67/1/21 to 12/31/21(6) $ 18.49 0.11 1.12 1.23 (0.22) — (1.14) (1.36) — (0.13) $ 18.36 6.90% $ 80,826 0.77% 0.81% 1.14% 23%7/1/20 to 6/30/21 13.02 0.27 5.55 5.82 (0.30) — (0.05) (0.35) — 5.47 18.49 45.09 88,986 0.77 0.84 1.73 657/1/19 to 6/30/20 16.85 0.27 (2.68) (2.41) (0.12) — (1.30) (1.42) — (3.83) 13.02 (16.25) 88,885 0.77 0.87 1.76 1267/1/18 to 6/30/19 24.25 0.41 (2.99) (2.58) (0.70) — (4.12) (4.82) — (7.40) 16.85 (7.37) 150,200 0.78 0.86 2.04 477/1/17 to 6/30/18 26.75 0.44 1.56 2.00 (0.24) — (4.26) (4.50) — (2.50) 24.25 7.44 347,379 0.80 0.85 1.70 247/1/16 to 6/30/17 22.79 0.41 4.55 4.96 (0.44) — (0.56) (1.00) — 3.96 26.75 21.90 464,279 0.79 0.84 1.60 30Administrative Class7/1/21 to 12/31/21(6) $ 15.66 0.07 0.94 1.01 (0.20) — (1.14) (1.34) — (0.33) $ 15.33 6.73% $ 37,656 1.07% 1.32% 0.85% 23%7/1/20 to 6/30/21 11.02 0.20 4.70 4.90 (0.21) — (0.05) (0.26) — 4.64 15.66 44.81 37,759 1.07 1.32 1.45 657/1/19 to 6/30/20 14.48 0.19 (2.27) (2.08) (0.08) — (1.30) (1.38) — (3.46) 11.02 (16.58) 34,323 1.07 1.17 1.39 1267/1/18 to 6/30/19 21.65 0.30 (2.73) (2.43) (0.62) — (4.12) (4.74) — (7.17) 14.48 (7.64) 107,836 1.08 1.16 1.74 477/1/17 to 6/30/18 24.30 0.32 1.43 1.75 (0.14) — (4.26) (4.40) — (2.65) 21.65 7.14 206,749 1.10 1.15 1.38 247/1/16 to 6/30/17 20.78 0.33 4.11 4.44 (0.36) — (0.56) (0.92) — 3.52 24.30 21.52 365,241 1.09 1.14 1.43 30Footnote Legend:(1) Calculated using average shares outstanding.(2) Not annualized for periods less than one year.(3) Sales charges, where applicable, are not reflected in the total return calculation.(4) Annualized for periods less than one year.(5) The Funds will also indirectly bear their prorated share of expenses of any underlying funds in which they invest. Such expenses are not included in the calculation
of this ratio.
VIRTUS INVESTMENT TRUSTFINANCIAL HIGHLIGHTS (Continued)
SELECTED PER SHARE DATA AND RATIOS FOR A SHARE OUTSTANDINGTHROUGHOUT EACH PERIOD
See Notes to Financial Statements
79
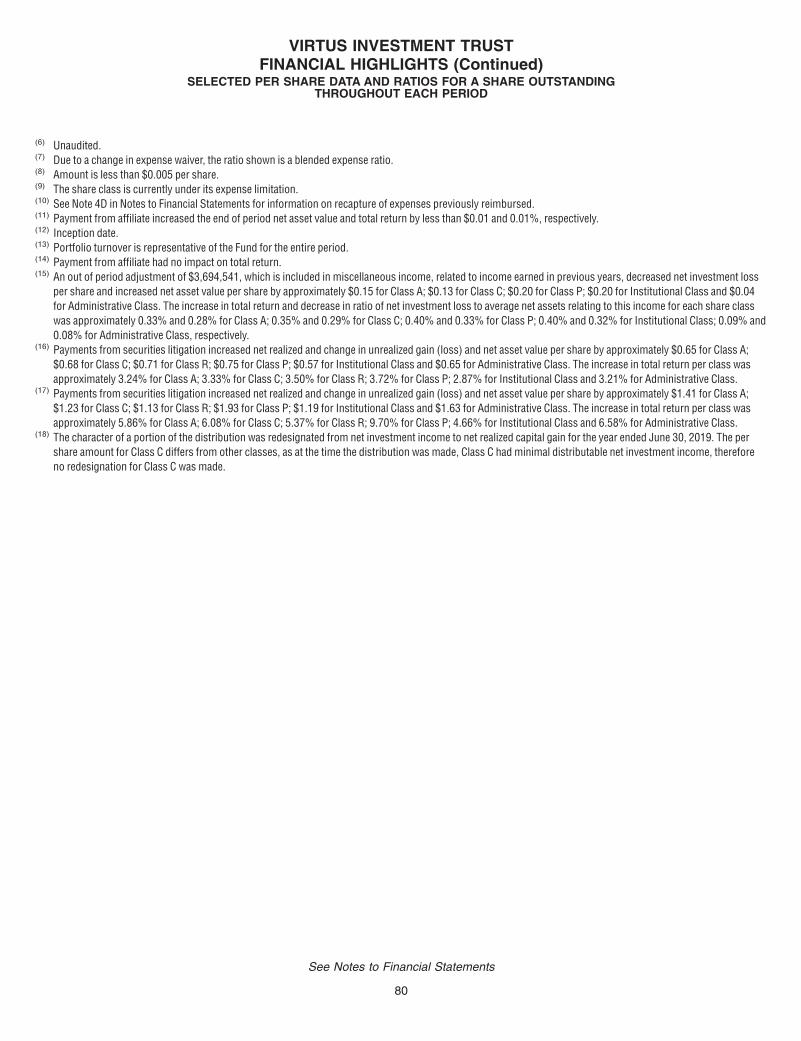
(6) Unaudited.(7) Due to a change in expense waiver, the ratio shown is a blended expense ratio.(8) Amount is less than $0.005 per share.(9) The share class is currently under its expense limitation.(10) See Note 4D in Notes to Financial Statements for information on recapture of expenses previously reimbursed.(11) Payment from affiliate increased the end of period net asset value and total return by less than $0.01 and 0.01%, respectively.(12) Inception date.(13) Portfolio turnover is representative of the Fund for the entire period.(14) Payment from affiliate had no impact on total return.(15) An out of period adjustment of $3,694,541, which is included in miscellaneous income, related to income earned in previous years, decreased net investment loss
per share and increased net asset value per share by approximately $0.15 for Class A; $0.13 for Class C; $0.20 for Class P; $0.20 for Institutional Class and $0.04for Administrative Class. The increase in total return and decrease in ratio of net investment loss to average net assets relating to this income for each share classwas approximately 0.33% and 0.28% for Class A; 0.35% and 0.29% for Class C; 0.40% and 0.33% for Class P; 0.40% and 0.32% for Institutional Class; 0.09% and0.08% for Administrative Class, respectively.
(16) Payments from securities litigation increased net realized and change in unrealized gain (loss) and net asset value per share by approximately $0.65 for Class A;$0.68 for Class C; $0.71 for Class R; $0.75 for Class P; $0.57 for Institutional Class and $0.65 for Administrative Class. The increase in total return per class wasapproximately 3.24% for Class A; 3.33% for Class C; 3.50% for Class R; 3.72% for Class P; 2.87% for Institutional Class and 3.21% for Administrative Class.
(17) Payments from securities litigation increased net realized and change in unrealized gain (loss) and net asset value per share by approximately $1.41 for Class A;$1.23 for Class C; $1.13 for Class R; $1.93 for Class P; $1.19 for Institutional Class and $1.63 for Administrative Class. The increase in total return per class wasapproximately 5.86% for Class A; 6.08% for Class C; 5.37% for Class R; 9.70% for Class P; 4.66% for Institutional Class and 6.58% for Administrative Class.
(18) The character of a portion of the distribution was redesignated from net investment income to net realized capital gain for the year ended June 30, 2019. The pershare amount for Class C differs from other classes, as at the time the distribution was made, Class C had minimal distributable net investment income, thereforeno redesignation for Class C was made.
VIRTUS INVESTMENT TRUSTFINANCIAL HIGHLIGHTS (Continued)
SELECTED PER SHARE DATA AND RATIOS FOR A SHARE OUTSTANDINGTHROUGHOUT EACH PERIOD
See Notes to Financial Statements
80
Note 1. Organization
Virtus Investment Trust (the “Trust”) is organized as a Massachusetts business trust and is registered under the Investment Company Act of 1940, asamended (the “1940 Act”), as an open-end management investment company.
As of the date of this report, the Trust is comprised of 13 funds (each a “Fund” or collectively, the “Funds”), each reported in this semiannual report. EachFund has a distinct investment objective and all of the Funds except the AllianzGI Focused Growth Fund and AllianzGI Technology Fund are diversified.
The Funds have the following investment objective(s):
Fund Investment objective(s)
AllianzGI Emerging Markets Opportunities Fund .. . . . . . . . . . . . . . . . . . . . . Seeking to maximize long-term capital appreciationAllianzGI Focused Growth Fund .. . . . . . . . . . . . . . . . . . . . . . . . . . . . . . . . . . . . . . . . Seeking long-term capital appreciationAllianzGI Global Small-Cap Fund.. . . . . . . . . . . . . . . . . . . . . . . . . . . . . . . . . . . . . . . Seeking long-term capital appreciationAllianzGI Health Sciences Fund .. . . . . . . . . . . . . . . . . . . . . . . . . . . . . . . . . . . . . . . . Seeking long-term capital appreciationAllianzGI Income & Growth Fund .. . . . . . . . . . . . . . . . . . . . . . . . . . . . . . . . . . . . . . . Seeking total return comprised of current income, current gains and capital
appreciation.AllianzGI Mid-Cap Growth Fund .. . . . . . . . . . . . . . . . . . . . . . . . . . . . . . . . . . . . . . . . Seeking long-term capital appreciationAllianzGI Small-Cap Fund .. . . . . . . . . . . . . . . . . . . . . . . . . . . . . . . . . . . . . . . . . . . . . . . Seeking long-term capital appreciationAllianzGI Technology Fund .. . . . . . . . . . . . . . . . . . . . . . . . . . . . . . . . . . . . . . . . . . . . . . Seeking long-term capital appreciationNFJ Dividend Value Fund.. . . . . . . . . . . . . . . . . . . . . . . . . . . . . . . . . . . . . . . . . . . . . . . . Seeking long-term growth of capital and incomeNFJ International Value Fund .. . . . . . . . . . . . . . . . . . . . . . . . . . . . . . . . . . . . . . . . . . . Seeking long-term growth of capital and incomeNFJ Large-Cap Value Fund .. . . . . . . . . . . . . . . . . . . . . . . . . . . . . . . . . . . . . . . . . . . . . Seeking long-term growth of capital and incomeNFJ Mid-Cap Value Fund .. . . . . . . . . . . . . . . . . . . . . . . . . . . . . . . . . . . . . . . . . . . . . . . . Seeking long-term growth of capital and incomeNFJ Small-Cap Value Fund.. . . . . . . . . . . . . . . . . . . . . . . . . . . . . . . . . . . . . . . . . . . . . . Seeking long-term growth of capital and income
There is no guarantee that a Fund will achieve its objective(s).
The AllianzGI Focused Growth Fund, NFJ Dividend Value Fund, NFJ International Value Fund, NFJ Large-Cap Value Fund, NFJ Mid-Cap Value Fund,and NFJ Small-Cap Value Fund offer Class A shares, Class C shares, Class P shares, Institutional Class shares, Class R6 shares, and AdministrativeClass shares. AllianzGI Emerging Markets Opportunities Fund and AllianzGI Small-Cap Fund offer Class A shares, Class C shares, Class P shares,Institutional Class shares, and Class R6 shares. AllianzGI Mid-Cap Growth Fund and AllianzGI Technology Fund offer Class A shares, Class C shares,Class P shares, Institutional Class shares and Administrative Class shares. The AllianzGI Global Small-Cap Fund, AllianzGI Health Sciences Fund, andAllianzGI Income & Growth Fund offer Class A shares, Class C shares, Class P shares, and Institutional Class shares.
Class A shares of the Funds are sold with a front-end sales charge of up to 5.50% with some exceptions. Generally, Class A shares are not subject toany charges by the Funds when redeemed; however, a 0.50% – 1% contingent deferred sales charge (“CDSC”) may be imposed on certainredemptions made within a certain period following purchases on which a finder’s fee has been paid. The period for which such CDSC applies for theFunds is 18 months. The CDSC period begins on the last day of the month preceding the month in which the purchase was made.
On May 21, 2021, all Class R shares for the AllianzGI Focused Growth Fund, AllianzGI Income & Growth Fund, AllianzGI Mid-Cap Growth Fund, NFJDividend Value Fund, NFJ International Value Fund, NFJ Large-Cap Value Fund, NFJ Mid-Cap Value Fund, and NFJ Small-Cap Value Fund wereconverted into Class A shares of the respective Fund.
Class C shares are generally sold with a 1% CDSC, applicable if redeemed within one year of purchase. Class C shares and any reinvested dividendsand other distributions paid on such shares, will be automatically converted to Class A shares of the same Fund following a required holding period,which as of March 1, 2021, was eight years. Effective February 26, 2021, if an investor intends to purchase greater than $999,999 of Class C shares,and the purchase would qualify for Class A shares with no load, then the purchase will automatically be made into a purchase of Class A shares, thusreducing expenses. Class P shares, Institutional Class shares, Class R6 shares, and Administrative Class shares are sold without a front-end salescharge or CDSC.
Class P shares are offered primarily through certain asset allocation, wrap fee and other similar programs offered by broker-dealers and otherintermediaries (“service agents”) that have established a shareholder servicing relationship with the Trust on behalf of their customers. Such programsestablished with broker-dealers or financial intermediaries may purchase shares only if the program for which the shares are being acquired willmaintain an omnibus or pooled account for each fund. Class P shares may also be offered for direct investment by other investors such as pension andprofit sharing plans, employee benefit trusts and plan alliances, endowments, foundations and corporations.
Institutional Class shares are offered primarily to clients of financial intermediaries that (i) charge such clients an ongoing fee for advisory, investment,consulting, or similar services; or (ii) have entered into an agreement with the Funds’ distributor or transfer agent to offer Institutional Class sharesthrough a no-load network or platform. Such clients may include pension and profit sharing plans, other employee benefit trusts, endowments,foundations and corporations. Institutional Class shares are also offered to private and institutional clients of, or referred by, the adviser, a subadviser ortheir affiliates, and to Trustees of the Funds and trustees/directors of affiliated open- and closed-end funds, and directors, officers and employees ofVirtus and its affiliates. If you are eligible to purchase and do purchase Institutional Class shares, you will pay no sales charge at any time. There are nodistribution and service fees applicable to Institutional Class shares.
VIRTUS INVESTMENT TRUSTNOTES TO FINANCIAL STATEMENTS (Unaudited)
DECEMBER 31, 2021
81
Class R6 shares are offered without a minimum initial investment to the following investors in plan level or omnibus accounts only (provided that they donot require or receive any compensation, administrative payments, sub-transfer agency payments or service payments with respect to Class R6shares): (i) qualified retirement plans, including, but not limited to, 401(k) plans, 457 plans, employer-sponsored 403(b) plans, and defined benefit plans;(ii) banks and trust companies; (iii) insurance companies; (iv) financial intermediaries utilizing such shares in fee-based investment advisory programs;(v) registered investment companies; and (vi) non-qualified deferred compensation plans. Other institutional investors may be permitted to purchaseClass R6 shares subject to the applicable Fund’s determination of eligibility and may be subject to a $2,500,000 minimum initial investment requirement.In addition, without a minimum initial investment requirement, Class R6 shares are available to any Trustee of the Virtus Funds and trustees/directors ofaffiliated open- and closed-end funds, directors, officers and employees of Virtus and its affiliates, and a spouse or domestic partner, child or minorgrandchild of any such qualifying individual (in each case either individually or jointly with other investors), provided in each case that those shares areheld directly with the Transfer Agent or in an eligible account. Class R6 shares do not carry sales commissions or pay Rule 12b-1 fees. Nocompensation, administrative payments, sub-transfer agency payments or service payments are paid to brokers or other entities from Fund assets orthe Funds’ distributor’s or an affiliate’s resources on sales of or investments in Class R6 shares.
Administrative Class shares are offered primarily through employee benefit plan alliances, broker-dealers, and other intermediaries, and each Fundpays service or distribution fees to such entities for services they provide to Administrative Class shareholders.
The Funds may impose an annual fee on accounts having balances of less than $2,500. The small account fee may be waived in certain circumstances,as disclosed in the prospectuses and/or statement of additional information. The fees collected will be used to offset certain expenses of the Funds.These fees are reflected as “Less low balance account fees” in each Fund’s Statement of Operations for the period, as applicable.
Each class of shares has identical voting, dividend, liquidation and other rights and the same terms and conditions, except that each class bears anyexpenses attributable specifically to that class (“class-specific expenses”) and has exclusive voting rights with respect to any Rule 12b-1 and/orshareholder service plan (“12b-1 Plan”) approved by the Board. Class P shares, Institutional Class shares, Class R6 shares, and Administrative Classshares are not subject to a 12b-1 Plan. Class-specific expenses may include shareholder servicing fees, sub-transfer agency fees, and fees under a12b-1 Plan, as well as certain other expenses as designated by the Funds’ Treasurer and approved by the Board. Investment income, commonoperating expenses and realized and unrealized gains and losses of each Fund are borne pro-rata by the holders of each class of shares.
Note 2. Significant Accounting Policies
The Trust is an investment company that follows the accounting and reporting guidance of the Financial Accounting Standards Board (“FASB”)Accounting Standards Codification Topic 946 Financial Services – Investment Companies. The following is a summary of significant accounting policiesconsistently followed by the Funds in the preparation of their financial statements and for derivatives, included in Note 3 below. The preparation offinancial statements in conformity with U.S. generally accepted accounting principles (“U.S. GAAP”) requires management to make estimates andassumptions that affect the reported amounts of assets and liabilities, disclosure of contingent assets and liabilities at the date of the financialstatements, and the reported amounts of increases and decreases in net assets from operations during the reporting period. Actual results could differfrom those estimates and those differences could be significant.
A. Security ValuationEach Fund utilizes a fair value hierarchy which prioritizes the inputs to valuation techniques used to measure fair value into three broad levels. TheFunds’ policy is to recognize transfers into or out of Level 3 at the end of the reporting period.
Level 1 – quoted prices in active markets for identical securities (security types generally include listed equities).
Level 2 – prices determined using other significant observable inputs (including quoted prices for similar securities, interest rates,prepayment speeds, credit risk, etc.).
Level 3 – prices determined using significant unobservable inputs (including the Valuation Committee’s own assumptions in determining thefair value of investments).
A description of the valuation techniques applied to a Fund’s major categories of assets and liabilities measured at fair value on a recurring basis isas follows:
Equity securities are valued at the official closing price (typically last sale) on the exchange on which the securities are primarily traded or, if noclosing price is available, at the last bid price and are categorized as Level 1 in the hierarchy. Restricted equity securities and private placementsthat are illiquid, or are internally fair valued by the Valuation Committee, are generally categorized as Level 3 in the hierarchy.
Certain non-U.S. securities may be fair valued in cases where closing prices are not readily available or are deemed not reflective of readilyavailable market prices. For example, significant events (such as movement in the U.S. securities market, or other regional and local developments)may occur between the time that non-U.S. markets close (where the security is principally traded) and the time that a Fund calculates its net assetvalue (“NAV”) at the close of regular trading on the New York Stock Exchange (“NYSE”) (generally 4 p.m. Eastern time) that may impact the value ofsecurities traded in these non-U.S. markets. In such cases, the Funds fair value non-U.S. securities using an independent pricing service whichconsiders the correlation of the trading patterns of the non-U.S. security to the intraday trading in the U.S. markets for investments such as ADRs,financial futures, ETFs, and certain indexes, as well as prices for similar securities. Such fair valuations are categorized as Level 2 in the hierarchy.Because the frequency of significant events is not predictable, fair valuation of certain non-U.S. common stocks may occur on a frequent basis.
Debt securities, including convertible bonds, and restricted securities, are valued based on evaluated quotations received from independent pricingservices or from dealers who make markets in such securities. For most bond types, the pricing service utilizes matrix pricing that considers one ormore of the following factors: yield or price of bonds of comparable quality, coupon, maturity, current cash flows, type, activity of the underlying
VIRTUS INVESTMENT TRUSTNOTES TO FINANCIAL STATEMENTS (Unaudited) (Continued)
DECEMBER 31, 2021
82
equities, and current day trade information, as well as dealer supplied prices. These valuations are generally categorized as Level 2 in thehierarchy. Structured debt instruments, such as mortgage-backed and asset-backed securities may also incorporate collateral analysis and utilizecash flow models for valuation and are generally categorized as Level 2 in the hierarchy. Pricing services do not provide pricing for all securities andtherefore indicative bids from dealers are utilized which are based on pricing models used by market makers in the security and are generallycategorized as Level 2 in the hierarchy. Debt securities that are internally fair valued by the Valuation Committee are generally categorized asLevel 3 in the hierarchy.
Listed derivatives, such as options, that are actively traded are valued based on quoted prices from the exchange and are categorized as Level 1 inthe hierarchy. Over-the-counter (“OTC”) derivative contracts, which include forward currency contracts and equity-linked instruments, do not requirematerial subjectivity as pricing inputs are observed from actively quoted markets and are categorized as Level 2 in the hierarchy.
Investments in open-end mutual funds are valued at NAV. Investments in closed-end funds and ETFs are valued as of the close of regular tradingon the NYSE each business day. Each is categorized as Level 1 in the hierarchy.
A summary of the inputs used to value a Fund’s net assets by each major security type is disclosed at the end of the Schedule of Investments foreach Fund. The inputs or methodologies used for valuing securities are not necessarily an indication of the risk associated with investing in thosesecurities.
B. Security Transactions and Investment IncomeSecurity transactions are recorded on the trade date. Realized gains and losses from the sale of securities are determined on the identified costbasis. Dividend income is recognized on the ex-dividend date or, in the case of certain foreign securities, as soon as a Fund is notified. Interestincome is recorded on the accrual basis. Each Fund amortizes premiums and accretes discounts using the effective interest method. Premiums oncallable debt securities are amortized to interest income to the earliest call date using the effective interest method. Conversion premium is notamortized. Any distributions from underlying funds are recorded in accordance with the character of the distributions as designated by theunderlying funds.
Dividend income from REITs is recorded using management’s estimate of the percentage of income included in distributions received from suchinvestments based on historical information and other industry sources. The return of capital portion of the estimate is a reduction to investmentincome and a reduction in the cost basis of each investment which increases net realized gain (loss) and net change in unrealized appreciation(depreciation). If the return of capital distributions exceed their cost basis, the distributions are treated as realized gains. The actual amounts ofincome, return of capital, and capital gains are only determined by each REIT after its fiscal year-end, and may differ from the estimated amounts.
C. Income TaxesEach Fund is treated as a separate taxable entity. It is the intention of each Fund to comply with the requirements of Subchapter M of the InternalRevenue Code of 1986, as amended (the “Code”) and to distribute substantially all of its taxable income to its shareholders. Therefore, no provisionfor federal income taxes or excise taxes has been made.
Certain Funds may be subject to foreign taxes on income, gains on investments or currency repatriation, a portion of which may be recoverable.Each Fund will accrue such taxes and recoveries as applicable based upon current interpretations of the tax rules and regulations that exist in themarkets in which it invests.
Management of the Funds has concluded that there are no significant uncertain tax positions that would require recognition in the financialstatements. Each Fund’s U.S. federal income tax return is generally subject to examination by the Internal Revenue Service for a period of threeyears after it is filed. State, local and/or non-U.S. tax returns and/or other filings may be subject to examination for different periods, depending uponthe tax rules of each applicable jurisdiction.
D. Distributions to ShareholdersDistributions are recorded by each Fund on the ex-dividend date. Income and capital gain distributions are determined in accordance with incometax regulations which may differ from U.S. GAAP.
E. ExpensesExpenses incurred together by a Fund and other affiliated mutual funds are allocated in proportion to the net assets of each such fund, exceptwhere allocation of direct expenses to each Fund or an alternative allocation method can be more appropriately used.
In addition to the net annual operating expenses that a Fund bears directly, the shareholders of a Fund indirectly bear the pro-rata expenses of anyunderlying mutual funds in which the Fund invests.
F. Convertible SecuritiesCertain Funds may invest a portion of their assets in convertible securities. Although convertible securities derive part of their value from that of thesecurities into which they are convertible, they are not considered derivative financial instruments. However, certain of the Funds’ investments inconvertible securities include features which render them sensitive to price changes in their underlying securities. The value of structured/syntheticconvertible securities can be affected by interest rate changes and credit risks of the issuer. Such securities may be structured in ways that limittheir potential for capital appreciation, and the entire value of the security may be at risk of loss depending on the performance of the underlyingequity security. Consequently, the Funds are exposed to greater downside risk than traditional convertible securities, but typically still less than thatof the underlying stock.
VIRTUS INVESTMENT TRUSTNOTES TO FINANCIAL STATEMENTS (Unaudited) (Continued)
DECEMBER 31, 2021
83

G. Foreign Currency TransactionsNon-U.S. investment securities and other assets and liabilities denominated in foreign currencies are translated into U.S. dollar amounts at theforeign currency exchange rate effective at the end of the reporting period. Cost of investments is translated at the currency exchange rate effectiveat the trade date. The gain or loss resulting from a change in currency exchange rates between the trade and settlement date of a portfoliotransaction is treated as a gain or loss on foreign currency. Likewise, the gain or loss resulting from a change in currency exchange rates betweenthe date income is accrued and the date it is paid is treated as a gain or loss on foreign currency. The Funds do not isolate that portion of the resultsof operations arising from changes in foreign exchange rates on investments from the fluctuations arising from changes in the market prices ofsecurities held. Such fluctuations are included with the net realized and unrealized gain or loss on investments.
H. When-issued Purchases and Forward Commitments (Delayed Delivery)Certain Funds may engage in when-issued or forward commitment transactions. Securities purchased on a when-issued or forward commitmentbasis are also known as delayed delivery transactions. Delayed delivery transactions involve a commitment by a Fund to purchase or sell a securityat a future date (ordinarily up to 90 days later). When-issued or forward commitments enable the Funds to lock in what is believed to be anattractive price or yield on a particular security for a period of time, regardless of future changes in interest rates. Each Fund records when-issuedand forward commitment securities on the trade date. Each Fund maintains collateral for the securities purchased. Securities purchased on awhen-issued or forward commitment basis begin earning interest on the settlement date.
I. Leveraged LoansCertain Funds may invest in direct debt instruments which are interests in amounts owed by a corporate, governmental, or other borrower tolenders or lending syndicates. Leveraged loans are generally non-investment grade and often involve borrowers that are highly leveraged. TheFunds may invest in obligations of borrowers who are in bankruptcy proceedings. Leveraged loans are typically senior in the corporate capitalstructure of the borrower. A loan is often administered by a bank or other financial institution (the “lender”) that acts as agent for all holders. Theagent administers the terms of the loan, as specified in the leveraged loan. A Fund’s investments in loans may be in the form of participations inloans or assignments of all or a portion of loans from third parties. When investing in loan participations, a Fund has the right to receive payments ofprincipal, interest and any fees to which it is entitled only from the lender selling the loan participation and only upon receipt by the lender ofpayments from the borrower. A Fund generally has no right to enforce compliance with the terms of the leveraged loan with the borrower. As aresult, a Fund may be subject to the credit risk of both the borrower and the lender that is selling the leveraged loan. When a Fund purchasesassignments from lenders it acquires direct rights against the borrower on the loan.
A Fund may invest in multiple series or tranches of a loan, which may have varying terms and carry different associated risks. Leveraged loans mayinvolve foreign borrowers and investments may be denominated in foreign currencies. Direct indebtedness of emerging countries involves a riskthat the government entities responsible for the repayment of the debt may be unable, or unwilling, to pay the principal and interest when due.
The leveraged loans have floating rate loan interests which generally pay interest at rates that are periodically determined by reference to a baselending rate plus a premium. The base lending rates are generally LIBOR, SOFR, the prime rate offered by one or more U.S. banks or the certificateof deposit rate. When a leveraged loan is purchased a Fund may pay an assignment fee. On an ongoing basis, a Fund may receive a commitmentfee based on the undrawn portion of the underlying line of credit portion of a leveraged loan. Prepayment penalty fees are received upon theprepayment of a leveraged loan by a borrower. Prepayment penalty, facility, commitment, consent and amendment fees are recorded to income asearned or paid.
J. WarrantsThe Funds may receive warrants. Warrants are securities that are usually issued together with a debt security or preferred stock and that give theholder the right to buy a proportionate amount of common stock at a specified price. Warrants may be freely transferable and are often traded onmajor exchanges. Warrants normally have a life that is measured in years and entitle the holder to buy common stock of a company at a price thatis usually higher than the market price at the time the warrant is issued. Warrants may entail greater risks than certain other types of investments.Generally, warrants do not carry the right to receive dividends or exercise voting rights with respect to the underlying securities, and they do notrepresent any rights in the assets of the issuer. In addition, their value does not necessarily change with the value of the underlying securities, andthey cease to have value if they are not exercised on or before their expiration date. If the market price of the underlying stock does not exceed theexercise price during the life of the warrant, the warrant will expire worthless. Warrants may increase the potential profit or loss to be realized fromthe investment as compared with investing the same amount in the underlying securities. Similarly, the percentage increase or decrease in thevalue of an equity security warrant may be greater than the percentage increase or decrease in the value of the underlying common stock. Warrantsmay relate to the purchase of equity or debt securities. Debt obligations with warrants attached to purchase equity securities have manycharacteristics of convertible securities and their prices may, to some degree, reflect the performance of the underlying stock. Debt obligations alsomay be issued with warrants attached to purchase additional debt securities at the same coupon rate. A decline in interest rates would permit aFund to sell such warrants at a profit. If interest rates rise, these warrants would generally expire with no value.
K. Securities LendingFunds may loan securities to qualified brokers through a securities lending agency agreement with The Bank of New York Mellon (“BNYM”). Underthe securities lending policy, when lending securities a Fund is required to maintain collateral with a market value not less than 100% of the marketvalue of loaned securities. Collateral is adjusted daily in connection with changes in the market value of securities on loan. Collateral may consist ofcash and securities issued by the U.S. Government or its agencies. Cash collateral is invested in a short-term money market fund. Dividendsearned on the collateral and premiums paid by the broker are recorded as income by the Fund net of fees and rebates charged/paid by BNYM for
VIRTUS INVESTMENT TRUSTNOTES TO FINANCIAL STATEMENTS (Unaudited) (Continued)
DECEMBER 31, 2021
84
its services as securities lending agent and in connection with this securities lending program. Lending portfolio securities involves a risk of delay inthe recovery of the loaned securities or in the declining value of the collateral.
Securities lending transactions are entered into by each Fund under a Master Securities Lending Agreement (“MSLA”) which permits the Fund,under certain circumstances including an event of default (such as bankruptcy or insolvency), to offset amounts payable by the Fund to the samecounterparty against amounts to be received and create one single net payment due to or from the Fund.
As of December 31, 2021, none of the Funds were lending under the agreement with BNYM.
Note 3. Derivative Financial Instruments and Transactions($ reported in thousands)
Disclosures about derivative instruments and hedging activities are intended to enable investors to understand how and why a Fund uses derivatives,how derivatives are accounted for, and how derivative instruments affect a Fund’s results of operations and financial position. Summarized below aresuch disclosures and accounting policies for each specific type of derivative instrument used by certain Funds.
A. Forward Foreign Currency Exchange ContractsA forward foreign currency exchange contract is an agreement between two parties to buy and sell a currency at a set exchange rate on a futuredate. Forward foreign currency exchange contracts, when used by a Fund, help to manage the overall exposure to the currencies in which some ofthe investments held by the Fund are denominated. The contract is marked-to-market daily and the change in market value is recorded by the Fundas an unrealized appreciation or depreciation. When the contract is closed, the Fund records a realized gain or loss equal to the difference betweenthe value at the time it was opened and the value at the time it was closed. The use of forward foreign currency exchange contracts involves the riskthat the value of the contract changes unfavorably due to movements in the value of the referenced foreign currencies. Non-deliverable forwardforeign currency exchange contracts are settled with the counterparty in U.S. dollars without the delivery of foreign currency.
During the period ended December 31, 2021, the AllianzGI Emerging Markets Opportunities Fund, AllianzGI Global Small-Cap Fund, and AllianzGITechnology Fund entered into forward foreign currency exchange contracts as an economic hedge against either specific transactions or portfolioinstruments or to obtain exposure to, or hedge exposure away from, foreign currencies (foreign currency exchange rate risk).
Forward foreign currency contracts outstanding at period end, if any, are listed after each Fund’s Schedule of Investments.
B. Options ContractsAn options contract provides the purchaser with the right, but not the obligation, to buy (call option) or sell (put option) a financial instrument at anagreed upon price. Certain Funds may purchase or write both put and call options on portfolio securities. A Fund doing so is subject to equity pricerisk and/or foreign currency risk in the normal course of pursuing its investment objectives.
When a Fund purchases an option, it pays a premium and an amount equal to that premium is recorded as an asset. When a Fund writes an option,it receives a premium and an amount equal to that premium is recorded as a liability. The asset or liability is adjusted daily to reflect the currentmarket value of the option. Holdings of the Fund designated to cover outstanding written options are noted in the Schedules of Investments.Purchased options are reported as an asset within “Investment in securities at value” in the Statements of Assets and Liabilities. Written options arereported as a liability within “Written options at value.” Changes in value of the purchased option are included in “Net change in unrealizedappreciation (depreciation) from investments” in the Statements of Operations. Changes in value of written options are included in “Net change inunrealized appreciation (depreciation) from written options” in the Statements of Operations.
If an option expires unexercised, the Fund realizes a gain or loss to the extent of the premium received or paid. If an option is exercised, thepremium received or paid is recorded as an adjustment to the proceeds from the sale or the cost basis of the purchase. The difference between thepremium and the amount received or paid on effecting a closing purchase or sale transaction is also treated as a realized gain or loss. Gain or losson purchased options is included in “Net realized gain (loss) on investments” in the Statements of Operations. Gain or loss on written options ispresented separately as “Net realized gain (loss) from written options” in the Statements of Operations.
The risk in writing call options is that the Fund gives up the opportunity for profit if the market price/foreign currency rate of the referencedsecurity/currency increases and the option is exercised. The risk in writing put options is that the Fund may incur a loss if the market price/foreigncurrency rate of the referenced security/currency decreases and the option is exercised. The risk in buying options is that the Fund pays a premiumwhether or not the option is exercised. The use of such instruments may involve certain additional risks as a result of unanticipated movements inthe market. Writers (sellers) of options are subject to unlimited risk of loss, as the seller will be obligated to deliver or take delivery of the security ata predetermined price which may, upon exercise of the option, be significantly different from the then-market value.
During the period ended December 31, 2021, the AllianzGI Income & Growth Fund and AllianzGI Technology Fund invested in written covered calloptions contracts in an attempt to manage equity price risk and with the purpose of generating realized gains.
VIRTUS INVESTMENT TRUSTNOTES TO FINANCIAL STATEMENTS (Unaudited) (Continued)
DECEMBER 31, 2021
85

The following is a summary of derivative instruments categorized by primary risk exposure, presented in the Statements of Assets and Liabilities atDecember 31, 2021:
Primary RiskAllianzGI Income& Growth Fund
AllianzGITechnology Fund
Asset DerivativesEquity contracts Purchased options at value(1) $ — $13,739
Total $ — $13,739
Liability DerivativesEquity contracts Written options at value $(753) $ (4,970)
Total $(753) $ (4,970)
The following is a summary of derivative instruments categorized by primary risk exposure, presented in the Statements of Operations for the periodended December 31, 2021:
Primary Risk
AllianzGIEmerging Markets
OpportunitiesFund
AllianzGI GlobalSmall-Cap Fund
AllianzGI Income& Growth Fund
AllianzGITechnology Fund
Net Realized Gain (Loss) FromEquity contracts Purchased options(2) $— $ — $ — $ (2,034)Equity contracts Written options — — 2,500 376
Foreign currency contractsForward foreign currencytransactions 89 (5) — (25)
Total $89 $ (5) $2,500 $ (1,683)
Net Change in Unrealized Appreciation/Depreciation onEquity contracts Purchased options(3) $— $ — $ — $ 2,697Equity contracts Written options — — 3,516 3,605
Total $— $ — $3,516 $ 6,302
(1)Amount included in Investment in securities at value.
(2)Amount included in Net realized gain (loss) on investments.
(3)Amount included in Net change in unrealized appreciation (depreciation) on investments.
The quarterly average values (unless otherwise specified) of the derivatives held by the Funds in the tables shown below indicate the volume ofderivative activity for each applicable Fund for the period ended December 31, 2021.
AllianzGIEmergingMarkets
OpportunitiesFund
AllianzGIGlobal
Small-CapFund
Forward Foreign Currency Exchange PurchaseContracts(2). . . . . . . . . . . . . . . . . . . . . . . . . . . . . . . . . . . . . . . . . $748 $36
Forward Foreign Currency Exchange SaleContracts(2). . . . . . . . . . . . . . . . . . . . . . . . . . . . . . . . . . . . . . . . . 790 51
AllianzGIIncome &
Growth Fund
AllianzGITechnology
Fund
Purchased Options(1) . . . . . . . . . . . . . . . . . . . . . . . . . . . . . . . . $ — $15,402Written Options(1) . . . . . . . . . . . . . . . . . . . . . . . . . . . . . . . . . . . . 1,431 14,083
VIRTUS INVESTMENT TRUSTNOTES TO FINANCIAL STATEMENTS (Unaudited) (Continued)
DECEMBER 31, 2021
86

AllianzGIIncome &
Growth Fund
AllianzGITechnology
Fund
Forward Foreign Currency Exchange PurchaseContracts(2). . . . . . . . . . . . . . . . . . . . . . . . . . . . . . . . . . . . . . . . . $ — $ 4,601
Forward Foreign Currency Exchange SaleContracts(2). . . . . . . . . . . . . . . . . . . . . . . . . . . . . . . . . . . . . . . . . — 1,192
(1) Premium amount.(2) Notional amount.
C. Derivative RisksA derivative contract may suffer a mark-to-market loss if the value of the contract decreases due to an unfavorable change in the market rates orvalues of the underlying instrument. Losses can also occur if the counterparty does not perform under the contract.
A Fund’s risk of loss from counterparty credit risk on derivatives bought or sold OTC, rather than traded on a securities exchange, is generallylimited to the aggregate unrealized gain netted against any collateral held by such Fund. For OTC purchased options, each Fund bears the risk ofloss of the amount of the premiums paid plus the positive change in market values net of any collateral held by such Fund should the counterpartyfail to perform under the contracts. Options written by a Fund do not typically give rise to counterparty credit risk, as options written generallyobligate the Fund, and not the counterparty to perform.
With exchange traded purchased options and futures and centrally cleared swaps generally speaking, there is less counterparty credit risk to theFund since the exchange or clearinghouse, as counterparty to such instruments, guarantees against a possible default. The clearinghouse standsbetween the buyer and the seller of the contract; therefore, credit risk is limited to failure of the clearinghouse. While offset rights may exist underapplicable law, a Fund does not have a contractual right of offset against a clearing broker or clearinghouse in the event of a default (including thebankruptcy or insolvency) of the clearing broker or clearinghouse. Additionally, credit risk exists in exchange traded futures and centrally clearedswaps with respect to initial and variation margin that is held in a clearing broker’s customer accounts. While clearing brokers are required tosegregate customer margin from their own assets, in the event that a clearing broker becomes insolvent or goes into bankruptcy and at that timethere is a shortfall in the aggregate amount of margin held by the clearing broker for all its clients, typically the shortfall would be allocated on a prorata basis across all the clearing broker’s customers, potentially resulting in losses to the Fund.
In order to better define its contractual rights and to secure rights that will help a Fund mitigate its counterparty risk, each Fund may enter into anInternational Swaps and Derivatives Association, Inc. Master Agreement (“ISDA Master Agreement”) or similar agreement with its derivativecontract counterparties. An ISDA Master Agreement is a bilateral agreement between a Fund and a counterparty that governs certain OTCderivatives and typically contains, among other things, collateral posting terms and netting provisions in the event of a default and/or terminationevent. Under an ISDA Master Agreement, a Fund may, under certain circumstances, offset with the counterparty certain derivative financialinstruments’ payables and/or receivables with collateral held and/or posted and create one single net payment. The provisions of the ISDA MasterAgreement typically permit a single net payment in the event of default including the bankruptcy or insolvency of the counterparty. However,bankruptcy or insolvency laws of a particular jurisdiction may impose restrictions on or prohibitions against the right of offset in bankruptcy,insolvency or other events. In addition, certain ISDA Master Agreements allow counterparties to OTC derivatives to terminate derivative contractsprior to maturity in the event a Fund’s net assets decline by a stated percentage or the Fund fails to meet the terms of its ISDA Master Agreements,which would cause the Fund to accelerate payment of any net liability owed to the counterparty.
D. Collateral Requirements and Master Netting Agreements (“MNA”)For derivatives traded under an ISDA Master Agreement, the collateral requirements are typically calculated by netting the mark-to-market amountfor each transaction under such agreement and comparing that amount to the value of any collateral currently pledged by the Funds and thecounterparty.
Cash collateral that has been pledged to cover obligations of a Fund and cash collateral received from the counterparty, if any, is reportedseparately on the Statements of Assets and Liabilities as cash pledged as collateral and cash received as collateral, respectively. Non-cashcollateral pledged by a Fund, if any, is noted in the Schedules of Investments. Typically, the Funds and counterparties are not permitted to sell,re-pledge or use the collateral they receive. To the extent amounts due to a Fund from its counterparties are not fully collateralized, contractually orotherwise, the Fund bears the risk of loss from counterparty non-performance. The Funds attempt to mitigate counterparty risk by only entering intoagreements with counterparties that they believe have the financial resources to honor their obligations and by monitoring the financial stability ofthose counterparties.
For financial reporting purposes, the Funds do not offset derivative assets and derivative liabilities that are subject to netting arrangements in theStatements of Assets and Liabilities.
The following tables present the Funds’ derivative assets and liabilities by counterparty net of amounts available for offset under a MNA and net ofthe related collateral received/pledged by the Funds as of December 31, 2021.
VIRTUS INVESTMENT TRUSTNOTES TO FINANCIAL STATEMENTS (Unaudited) (Continued)
DECEMBER 31, 2021
87

At December 31, 2021, the Funds’ derivative assets and liabilities (by type) are as follows:
AllianzGI Income &Growth Fund
AllianzGI TechnologyFund
Assets Liabilities Assets Liabilities
Derivative Financial Instruments:Purchased options $— $ — $ 13,739 $ —Written options — 753 — 4,970
Total derivative assets andliabilities in the Statements ofAssets and Liabilities $— $ 753 $ 13,739 $ 4,970
Derivatives not subject to a MNAor similar agreement — (753) (13,739) (4,970)
Total assets and liabilitiessubject to a MNA $— $ — $ — $ —
Note 4. Investment Advisory Fees and Related Party Transactions($ reported in thousands)
A. Investment AdviserVirtus Investment Advisers, Inc. (the “Adviser”), an indirect, wholly-owned subsidiary of Virtus Investment Partners, Inc. (“Virtus”), is the investmentadviser to the Funds. The Adviser manages the Funds’ investment programs and general operations of the Funds, including oversight of the Funds’subadvisers.
As compensation for its services to the Funds, the Adviser is entitled to a fee, which is calculated daily and paid monthly based upon the followingannual rates as a percentage of the average daily net assets of each Fund:
Fund Advisory Fee
AllianzGI Emerging Markets Opportunities Fund .. . 0.85%AllianzGI Focused Growth Fund .. . . . . . . . . . . . . . . . . . . . . 0.45AllianzGI Global Small-Cap Fund.. . . . . . . . . . . . . . . . . . . . 0.90AllianzGI Health Sciences Fund .. . . . . . . . . . . . . . . . . . . . . 0.80AllianzGI Income & Growth Fund .. . . . . . . . . . . . . . . . . . . . 0.65AllianzGI Mid-Cap Growth Fund .. . . . . . . . . . . . . . . . . . . . . 0.47AllianzGI Small-Cap Fund .. . . . . . . . . . . . . . . . . . . . . . . . . . . . 0.60AllianzGI Technology Fund .. . . . . . . . . . . . . . . . . . . . . . . . . . . 0.90NFJ Dividend Value Fund.. . . . . . . . . . . . . . . . . . . . . . . . . . . . . 0.45NFJ International Value Fund .. . . . . . . . . . . . . . . . . . . . . . . . 0.60NFJ Large-Cap Value Fund .. . . . . . . . . . . . . . . . . . . . . . . . . . 0.45NFJ Mid-Cap Value Fund .. . . . . . . . . . . . . . . . . . . . . . . . . . . . . 0.55NFJ Small-Cap Value Fund.. . . . . . . . . . . . . . . . . . . . . . . . . . . 0.60
During the period ended December 31, 2021, the AllianzGI Income & Growth Fund invested a portion of its assets in Virtus AllianzGI High YieldBond Fund, an affiliated mutual fund. In order to avoid any duplication of advisory fees, the Adviser voluntarily waived its advisory fees in an amountequal to that which would otherwise be paid by the Fund on the assets invested in the Virtus AllianzGI High Yield Bond Fund. For the period endedDecember 31, 2021, the waiver amounted to $37. This waiver was in addition to the expense limitation and/or fee waiver covered elsewhere inthese financial statements and is included in the Statements of Operations in “Less expenses reimbursed and/or waived by investment adviserand/or distributor.”
VIRTUS INVESTMENT TRUSTNOTES TO FINANCIAL STATEMENTS (Unaudited) (Continued)
DECEMBER 31, 2021
88
B. SubadvisersThe subadvisers manage the investments of each Fund for which they are paid a fee by the Adviser. A list of the subadvisers and the Funds theyserve as of the end of the period is as follows:
Fund Subadviser
AllianzGI Emerging Markets Opportunities Fund .. . AllianzGI U.S.(1)
AllianzGI Focused Growth Fund .. . . . . . . . . . . . . . . . . . . . AllianzGI U.S.(1)
AllianzGI Global Small-Cap Fund .. . . . . . . . . . . . . . . . . . . AllianzGI U.S.(1)
AllianzGI Health Sciences Fund .. . . . . . . . . . . . . . . . . . . . . AllianzGI U.S.(1)
AllianzGI Income & Growth Fund .. . . . . . . . . . . . . . . . . . . AllianzGI U.S.(1)
AllianzGI Mid-Cap Growth Fund .. . . . . . . . . . . . . . . . . . . . . AllianzGI U.S.(1)
AllianzGI Small-Cap Fund .. . . . . . . . . . . . . . . . . . . . . . . . . . . AllianzGI U.S.(1)
AllianzGI Technology Fund .. . . . . . . . . . . . . . . . . . . . . . . . . . AllianzGI U.S.(1)
NFJ Dividend Value Fund .. . . . . . . . . . . . . . . . . . . . . . . . . . . . NFJ(2)
NFJ International Value Fund .. . . . . . . . . . . . . . . . . . . . . . . . NFJ(2)
NFJ Large-Cap Value Fund .. . . . . . . . . . . . . . . . . . . . . . . . . . NFJ(2)
NFJ Mid-Cap Value Fund .. . . . . . . . . . . . . . . . . . . . . . . . . . . . NFJ(2)
NFJ Small-Cap Value Fund .. . . . . . . . . . . . . . . . . . . . . . . . . . NFJ(2)
(1) Allianz Global Investors U.S. LLC (“AllianzGI U.S.”).(2) NFJ Investment Group, LLC (“NFJ”), which is an indirect, wholly-owned subsidiary of Virtus.
C. Expense LimitationsThe Adviser has contractually agreed to limit each Fund’s annual total operating expenses, subject to the exceptions listed below, so that suchexpenses do not exceed, on an annualized basis, the following respective percentages of average daily net assets through February 1, 2023.Following the contractual period, the Adviser may discontinue these expense limitation arrangements at any time. The waivers and reimbursementsare accrued daily and received monthly.
Fund Class A Class C Class PInstitutional
Class Class R6Administrative
Class
AllianzGI Emerging Markets Opportunities Fund .. . 1.29% 2.04% 1.04% 0.94% 0.89% N/A%AllianzGI Focused Growth Fund .. . . . . . . . . . . . . . . . . . . . . 1.00(1) 1.77(1) 0.77(1) 0.67 0.62 0.92AllianzGI Global Small-Cap Fund.. . . . . . . . . . . . . . . . . . . . 1.63(1) 2.38(1) 1.38(1) 1.28(1) N/A N/AAllianzGI Health Sciences Fund .. . . . . . . . . . . . . . . . . . . . . 1.47(1) 2.22(1) 1.22(1) 1.12 N/A N/AAllianzGI Income & Growth Fund .. . . . . . . . . . . . . . . . . . . . 1.28(1) 2.03(1) 1.03(1) 0.93(1) N/A N/AAllianzGI Mid-Cap Growth Fund .. . . . . . . . . . . . . . . . . . . . . 1.14(1) 1.89(1) 0.89(1) 0.79(1) N/A 1.04AllianzGI Small-Cap Fund .. . . . . . . . . . . . . . . . . . . . . . . . . . . . 1.17 1.92 0.92 0.82 0.77 N/AAllianzGI Technology Fund .. . . . . . . . . . . . . . . . . . . . . . . . . . . 1.57(1) 2.32(1) 1.32(1) 1.22(1) N/A 1.47NFJ Dividend Value Fund.. . . . . . . . . . . . . . . . . . . . . . . . . . . . . 1.05(1) 1.80(1) 0.80(1) 0.70 0.65(1) 0.95(1)
NFJ International Value Fund .. . . . . . . . . . . . . . . . . . . . . . . . 1.30 2.05(1) 1.05(1) 0.95(1) 0.90(1) 1.20NFJ Large-Cap Value Fund .. . . . . . . . . . . . . . . . . . . . . . . . . . 1.12(1) 1.87(1) 0.87(1) 0.77(1) 0.65(1),(2) 1.02(1)
NFJ Mid-Cap Value Fund .. . . . . . . . . . . . . . . . . . . . . . . . . . . . . 1.00 1.75 0.75 0.65 0.60 0.90NFJ Small-Cap Value Fund.. . . . . . . . . . . . . . . . . . . . . . . . . . . 1.17 1.92 0.92(1) 0.82 0.77 1.07
(1) Each share class is currently below its expense cap.(2) Effective October 28, 2021. For the period July 1, 2021 through October 27, 2021, the expense cap was as follows for Class R6 shares: 0.72%.
The exclusions include front-end or contingent deferred loads, taxes, leverage and borrowing expenses (such as commitment, amendment andrenewal expenses on credit or redemption facilities), interest, brokerage commissions, expenses incurred in connection with any merger orreorganization, unusual or infrequently occurring expenses (such as litigation), acquired fund fees and expenses, and dividend expenses, if any.
VIRTUS INVESTMENT TRUSTNOTES TO FINANCIAL STATEMENTS (Unaudited) (Continued)
DECEMBER 31, 2021
89

D. Expense RecaptureUnder certain conditions, the Adviser may recapture operating expenses reimbursed or fees waived under these arrangements within three yearsafter the date on which such amounts were incurred or waived. A Fund must pay its ordinary operating expenses before the Adviser is entitled toany reimbursement and must remain in compliance with any applicable expense limitations or, if none, the expense limitation in effect at the time ofthe waiver or reimbursement. All or a portion of the following Adviser reimbursed expenses may be recaptured by the period ending December 31:
Expiration
Fund 2024 2025 Total
AllianzGI Emerging Markets Opportunities FundClass A .. . . . . . . . . . . . . . . . . . . . . . . . . . . . . . . . . . . . . . . . . . . . . . . $ 32 $ 30 $ 62Class C.. . . . . . . . . . . . . . . . . . . . . . . . . . . . . . . . . . . . . . . . . . . . . . . 1 1 2Class P .. . . . . . . . . . . . . . . . . . . . . . . . . . . . . . . . . . . . . . . . . . . . . . . 7 6 13Institutional Class .. . . . . . . . . . . . . . . . . . . . . . . . . . . . . . . . . . . 235 281 516Class R6 .. . . . . . . . . . . . . . . . . . . . . . . . . . . . . . . . . . . . . . . . . . . . . 31 34 65
AllianzGI Focused Growth FundInstitutional Class .. . . . . . . . . . . . . . . . . . . . . . . . . . . . . . . . . . . 20 21 41Class R6 .. . . . . . . . . . . . . . . . . . . . . . . . . . . . . . . . . . . . . . . . . . . . . 3 10 13Administrative Class .. . . . . . . . . . . . . . . . . . . . . . . . . . . . . . . . 1 1 2
AllianzGI Global Small-Cap FundInstitutional Class .. . . . . . . . . . . . . . . . . . . . . . . . . . . . . . . . . . . 5 2 7
AllianzGI Health Sciences FundInstitutional Class .. . . . . . . . . . . . . . . . . . . . . . . . . . . . . . . . . . . 2 1 3
AllianzGI Income & Growth FundInstitutional Class .. . . . . . . . . . . . . . . . . . . . . . . . . . . . . . . . . . . —(1) — —
AllianzGI Small-Cap FundClass A .. . . . . . . . . . . . . . . . . . . . . . . . . . . . . . . . . . . . . . . . . . . . . . . 7 3 10Class C.. . . . . . . . . . . . . . . . . . . . . . . . . . . . . . . . . . . . . . . . . . . . . . . 1 1 2Class P .. . . . . . . . . . . . . . . . . . . . . . . . . . . . . . . . . . . . . . . . . . . . . . . 9 9 18Institutional Class .. . . . . . . . . . . . . . . . . . . . . . . . . . . . . . . . . . . 28 24 52Class R6 .. . . . . . . . . . . . . . . . . . . . . . . . . . . . . . . . . . . . . . . . . . . . . 4 4 8
AllianzGI Technology FundAdministrative Class .. . . . . . . . . . . . . . . . . . . . . . . . . . . . . . . . — 57 57
NFJ Dividend Value FundInstitutional Class .. . . . . . . . . . . . . . . . . . . . . . . . . . . . . . . . . . . 1 108 109
NFJ International Value FundClass A .. . . . . . . . . . . . . . . . . . . . . . . . . . . . . . . . . . . . . . . . . . . . . . . — 22 22Institutional Class .. . . . . . . . . . . . . . . . . . . . . . . . . . . . . . . . . . . 3 1 4Class R6 .. . . . . . . . . . . . . . . . . . . . . . . . . . . . . . . . . . . . . . . . . . . . . —(1) —(1) —Administrative Class .. . . . . . . . . . . . . . . . . . . . . . . . . . . . . . . . —(1) 1 1
NFJ Mid-Cap Value FundClass A .. . . . . . . . . . . . . . . . . . . . . . . . . . . . . . . . . . . . . . . . . . . . . . . 186 301 487Class C.. . . . . . . . . . . . . . . . . . . . . . . . . . . . . . . . . . . . . . . . . . . . . . . 10 16 26Class P .. . . . . . . . . . . . . . . . . . . . . . . . . . . . . . . . . . . . . . . . . . . . . . . 68 106 174Institutional Class .. . . . . . . . . . . . . . . . . . . . . . . . . . . . . . . . . . . 298 369 667Class R6 .. . . . . . . . . . . . . . . . . . . . . . . . . . . . . . . . . . . . . . . . . . . . . 51 58 109Administrative Class .. . . . . . . . . . . . . . . . . . . . . . . . . . . . . . . . 26 24 50
NFJ Small-Cap Value FundClass A .. . . . . . . . . . . . . . . . . . . . . . . . . . . . . . . . . . . . . . . . . . . . . . . — 46 46Class C.. . . . . . . . . . . . . . . . . . . . . . . . . . . . . . . . . . . . . . . . . . . . . . . — —(1) —Institutional Class .. . . . . . . . . . . . . . . . . . . . . . . . . . . . . . . . . . . 16 18 34Class R6 .. . . . . . . . . . . . . . . . . . . . . . . . . . . . . . . . . . . . . . . . . . . . . 13 14 27Administrative Class .. . . . . . . . . . . . . . . . . . . . . . . . . . . . . . . . 70 47 117
(1) Amount is less than $500.
VIRTUS INVESTMENT TRUSTNOTES TO FINANCIAL STATEMENTS (Unaudited) (Continued)
DECEMBER 31, 2021
90
During the period ended December 31, 2021, the Adviser recaptured expenses previously waived for the following Funds:
Fund Class A Class C Class P Institutional Class Administrative Class Class R6 Total
AllianzGI Focused Growth Fund .. . . . $— $— $— $— $ 1 $ 1 $ 2AllianzGI Global Small-Cap Fund .. . . 2 —(1) — 6 — — 8AllianzGI Health Sciences Fund.. . . . . —(1) —(1) — 1 — — 1AllianzGI Income & Growth Fund .. . . — — — —(1) — — —AllianzGI Small-Cap Fund .. . . . . . . . . . . —(1) —(1) 1 — — — 1AllianzGI Technology Fund .. . . . . . . . . . — — — — 1 — 1NFJ Dividend Value Fund .. . . . . . . . . . . . 1 — — 8 —(1) 1 10NFJ International Value Fund.. . . . . . . . 2 —(1) —(1) 2 —(1) —(1) 4NFJ Large-Cap Value Fund.. . . . . . . . . . — — — 8 —(1) — 8NFJ Small-Cap Value Fund .. . . . . . . . . . 1 —(1) —(1) — 2 — 3
(1) Amount is less than $500.
E. DistributorVP Distributors, LLC (“VP Distributors”), an indirect, wholly-owned subsidiary of Virtus, serves as the distributor of each Fund’s shares. VPDistributors has advised the Funds that for the six months (the “period”) ended December 31, 2021, it retained net commissions of $715 for Class Ashares and CDSC of $10 and $62 for Class A shares and Class C shares, respectively.
In addition, each Fund pays VP Distributors 12b-1 fees under a 12b-1 Plan as a percentage of the average daily net assets of each respective classat the annual rates of 0.25% for Class A shares and Administrative Class shares , and 1.00% for Class C shares. Class P shares, Institutional Classshares, and Class R6 shares, are not subject to a 12b-1 Plan.
Under certain circumstances, shares of certain Virtus Mutual Funds may be exchanged for shares of the same class of certain other Virtus MutualFunds on the basis of the relative NAV per share at the time of the exchange. On exchanges with share classes that carry a CDSC, the CDSCschedule of the original shares purchased continues to apply.
F. Administrator and Transfer AgentVirtus Fund Services, LLC, an indirect, wholly-owned subsidiary of Virtus, serves as the administrator and transfer agent to the Funds.
For the period ended December 31, 2021, the Funds incurred administration fees totaling $7,294 which are included in the Statements ofOperations within the line item “Administration and accounting fees.” The fees are calculated daily and paid monthly.
For the period ended December 31, 2021, the Funds incurred transfer agent fees totaling $3,252 which are included in the Statements ofOperations within the line item “Transfer agent fees and expenses.” The fees are calculated daily and paid monthly.
G. Investments with AffiliatesThe Funds are permitted to purchase assets from or sell assets to certain related affiliates under specified conditions outlined in proceduresadopted by the Board. The procedures have been designed to ensure that any purchase or sale of assets by the Funds from or to another fund orportfolio that are, or could be, considered an affiliate by virtue of having a common investment adviser (or affiliated investment advisers), commonTrustees and/or common officers comply with Rule 17a-7 under the 1940 Act. Further, as defined under the procedures, each transaction is effectedat the current market price.
During the period ended December 31, 2021, the Funds did not engage in any transactions pursuant to Rule 17a-7 under the 1940 Act.
Outside of Rule 17a-7 transactions, other investments with affiliated issuers are separately reported in this footnote. An affiliated issuer includes anycompany in which the Fund held 5% or more of a company’s outstanding voting shares at any point during the period, as well as othercircumstances where an investment adviser or subadviser to the Fund is deemed to exercise, directly or indirectly, a certain level of control over thecompany.
VIRTUS INVESTMENT TRUSTNOTES TO FINANCIAL STATEMENTS (Unaudited) (Continued)
DECEMBER 31, 2021
91
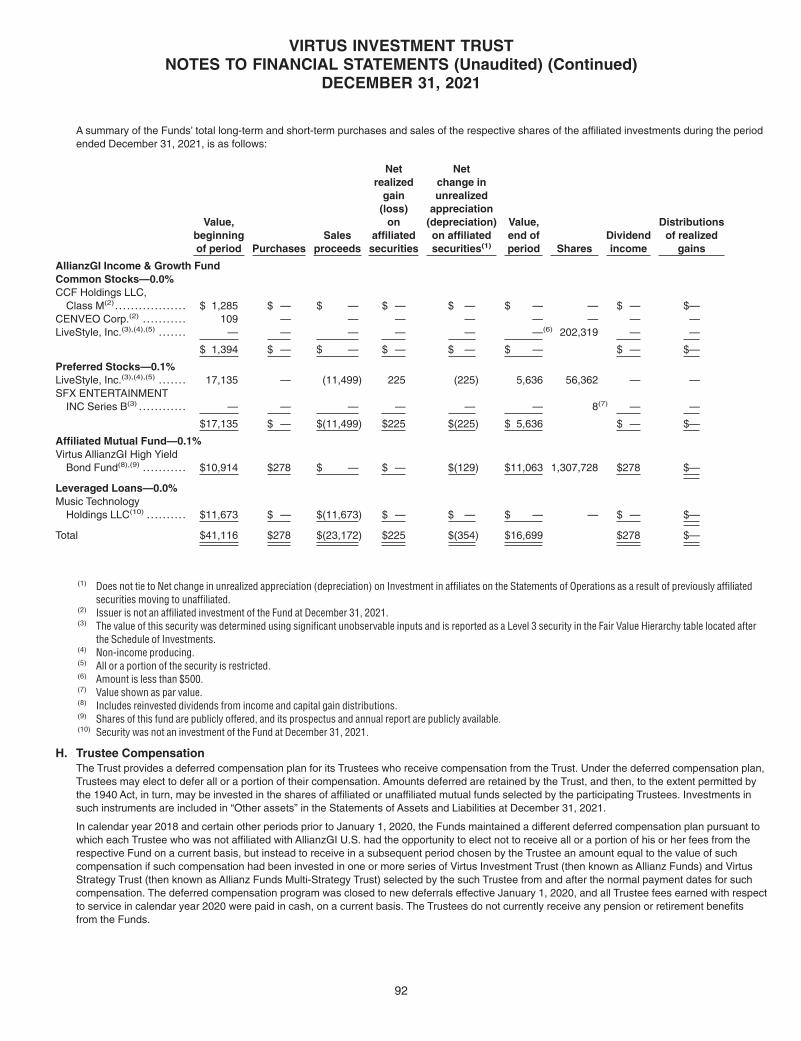
A summary of the Funds’ total long-term and short-term purchases and sales of the respective shares of the affiliated investments during the periodended December 31, 2021, is as follows:
Value,beginningof period Purchases
Salesproceeds
Netrealized
gain(loss)
onaffiliated
securities
Netchange inunrealized
appreciation(depreciation)on affiliatedsecurities(1)
Value,end ofperiod Shares
Dividendincome
Distributionsof realized
gains
AllianzGI Income & Growth FundCommon Stocks—0.0%CCF Holdings LLC,
Class M(2). . . . . . . . . . . . . . . . . . $ 1,285 $ — $ — $ — $ — $ — — $ — $—CENVEO Corp.(2) . . . . . . . . . . . 109 — — — — — — — —LiveStyle, Inc.(3),(4),(5) . . . . . . . — — — — — —(6) 202,319 — —
$ 1,394 $ — $ — $ — $ — $ — $ — $—
Preferred Stocks—0.1%LiveStyle, Inc.(3),(4),(5) . . . . . . . 17,135 — (11,499) 225 (225) 5,636 56,362 — —SFX ENTERTAINMENT
INC Series B(3) . . . . . . . . . . . . — — — — — — 8(7) — —
$17,135 $ — $(11,499) $225 $(225) $ 5,636 $ — $—
Affiliated Mutual Fund—0.1%Virtus AllianzGI High Yield
Bond Fund(8),(9) . . . . . . . . . . . $10,914 $278 $ — $ — $(129) $11,063 1,307,728 $278 $—
Leveraged Loans—0.0%Music Technology
Holdings LLC(10) . . . . . . . . . . $11,673 $ — $(11,673) $ — $ — $ — — $ — $—
Total $41,116 $278 $(23,172) $225 $(354) $16,699 $278 $—
(1) Does not tie to Net change in unrealized appreciation (depreciation) on Investment in affiliates on the Statements of Operations as a result of previously affiliatedsecurities moving to unaffiliated.
(2) Issuer is not an affiliated investment of the Fund at December 31, 2021.(3) The value of this security was determined using significant unobservable inputs and is reported as a Level 3 security in the Fair Value Hierarchy table located after
the Schedule of Investments.(4) Non-income producing.(5) All or a portion of the security is restricted.(6) Amount is less than $500.(7) Value shown as par value.(8) Includes reinvested dividends from income and capital gain distributions.(9) Shares of this fund are publicly offered, and its prospectus and annual report are publicly available.(10) Security was not an investment of the Fund at December 31, 2021.
H. Trustee CompensationThe Trust provides a deferred compensation plan for its Trustees who receive compensation from the Trust. Under the deferred compensation plan,Trustees may elect to defer all or a portion of their compensation. Amounts deferred are retained by the Trust, and then, to the extent permitted bythe 1940 Act, in turn, may be invested in the shares of affiliated or unaffiliated mutual funds selected by the participating Trustees. Investments insuch instruments are included in “Other assets” in the Statements of Assets and Liabilities at December 31, 2021.
In calendar year 2018 and certain other periods prior to January 1, 2020, the Funds maintained a different deferred compensation plan pursuant towhich each Trustee who was not affiliated with AllianzGI U.S. had the opportunity to elect not to receive all or a portion of his or her fees from therespective Fund on a current basis, but instead to receive in a subsequent period chosen by the Trustee an amount equal to the value of suchcompensation if such compensation had been invested in one or more series of Virtus Investment Trust (then known as Allianz Funds) and VirtusStrategy Trust (then known as Allianz Funds Multi-Strategy Trust) selected by the such Trustee from and after the normal payment dates for suchcompensation. The deferred compensation program was closed to new deferrals effective January 1, 2020, and all Trustee fees earned with respectto service in calendar year 2020 were paid in cash, on a current basis. The Trustees do not currently receive any pension or retirement benefitsfrom the Funds.
VIRTUS INVESTMENT TRUSTNOTES TO FINANCIAL STATEMENTS (Unaudited) (Continued)
DECEMBER 31, 2021
92

In addition to the Trustee fees deferred in the current period, the Funds still have obligations with respect to Trustee fees deferred in 2018 and inother periods prior to January 1, 2020, and will continue to have such obligations until all deferred Trustee fees are paid out pursuant to the terms ofthe applicable deferred compensation plan.
Note 5. Purchases and Sales of Securities($ reported in thousands)
Purchases and sales of securities (excluding U.S. Government and agency securities, forward currency contracts, written options, and short-termsecurities) during the period ended December 31, 2021, were as follows:
Purchases Sales
AllianzGI Emerging Markets Opportunities Fund .. . $ 167,758 $ 128,578AllianzGI Focused Growth Fund .. . . . . . . . . . . . . . . . . . . . . 157,952 258,020AllianzGI Global Small-Cap Fund.. . . . . . . . . . . . . . . . . . . . 43,308 52,413AllianzGI Health Sciences Fund .. . . . . . . . . . . . . . . . . . . . . 104,219 111,725AllianzGI Income & Growth Fund .. . . . . . . . . . . . . . . . . . . . 2,351,045 2,144,396AllianzGI Mid-Cap Growth Fund .. . . . . . . . . . . . . . . . . . . . . 128,266 153,801AllianzGI Small-Cap Fund .. . . . . . . . . . . . . . . . . . . . . . . . . . . . 58,114 46,553AllianzGI Technology Fund .. . . . . . . . . . . . . . . . . . . . . . . . . . . 1,256,921 1,600,026NFJ Dividend Value Fund.. . . . . . . . . . . . . . . . . . . . . . . . . . . . . 255,676 336,214NFJ International Value Fund .. . . . . . . . . . . . . . . . . . . . . . . . 42,863 45,713NFJ Large-Cap Value Fund .. . . . . . . . . . . . . . . . . . . . . . . . . . 47,567 74,608NFJ Mid-Cap Value Fund .. . . . . . . . . . . . . . . . . . . . . . . . . . . . . 411,056 548,784NFJ Small-Cap Value Fund.. . . . . . . . . . . . . . . . . . . . . . . . . . . 123,784 198,354
There were no purchases or sales of long-term U.S. Government and agency securities during the period ended December 31, 2021.
Note 6. Capital Share Transactions
(reported in thousands)
Transactions in shares of capital stock, during the periods ended as indicated below, were as follows:
AllianzGI Emerging Markets Opportunities Fund AllianzGI Focused Growth Fund
Six Months EndedDecember 31, 2021
(Unaudited)Year Ended
June 30, 2021
Six Months EndedDecember 31, 2021
(Unaudited)Year Ended
June 30, 2021
SHARES AMOUNT SHARES AMOUNT SHARES AMOUNT SHARES AMOUNT
Class AShares sold 47 $ 1,674 141 $ 4,828 336 $ 26,117 992 $ 70,415Reinvestment of distributions 11 373 9 312 1,892 131,234 821 56,994Shares repurchased (86) (3,007) (510) (16,950) (932) (74,560) (1,532) (107,824)
Net Increase / (Decrease) (28) $ (960) (360) $ (11,810) 1,296 $ 82,791 281 $ 19,585
Class CShares sold 1 $ 26 5 $ 188 46 $ 1,900 131 $ 5,206Reinvestment of distributions — — —(1) 1 393 12,557 185 7,088Shares repurchased (14) (512) (38) (1,295) (270) (11,507) (528) (20,941)
Net Increase / (Decrease) (13) $ (486) (33) $ (1,106) 169 $ 2,950 (212) $ (8,647)
Class R*
Shares sold — $ — — $ — — $ — 92 $ 4,398Reinvestment of distributions — — — — — — 56 2,575Shares repurchased — — — — — — (654) (31,739)
Net Increase / (Decrease) — $ — — $ — — $ — (506) $ (24,766)
Class PShares sold 98 $ 3,343 84 $ 2,891 313 $ 17,026 302 $ 14,932Reinvestment of distributions 5 161 7 213 430 18,881 199 9,540Shares repurchased (38) (1,254) (381) (13,423) (555) (31,535) (604) (29,940)
Net Increase / (Decrease) 65 $ 2,250 (290) $ (10,319) 188 $ 4,372 (103) $ (5,468)
VIRTUS INVESTMENT TRUSTNOTES TO FINANCIAL STATEMENTS (Unaudited) (Continued)
DECEMBER 31, 2021
93

AllianzGI Emerging Markets Opportunities Fund AllianzGI Focused Growth Fund
Six Months EndedDecember 31, 2021
(Unaudited)Year Ended
June 30, 2021
Six Months EndedDecember 31, 2021
(Unaudited)Year Ended
June 30, 2021
SHARES AMOUNT SHARES AMOUNT SHARES AMOUNT SHARES AMOUNT
Institutional ClassShares sold 1,294 $ 46,046 1,662 $ 58,167 517 $ 38,456 580 $ 37,222Reinvestment of distributions 102 3,324 73 2,426 585 35,935 225 14,072Shares repurchased (483) (16,963) (3,449) (113,484) (524) (38,169) (1,005) (63,534)
Net Increase / (Decrease) 913 $ 32,407 (1,714) $ (52,891) 578 $ 36,222 (200) $ (12,240)
Class R6Shares sold 389 $ 13,914 290 $ 10,104 205 $ 15,419 590 $ 38,207Reinvestment of distributions 22 727 11 371 593 36,560 250 15,711Shares repurchased (135) (4,753) (239) (7,844) (296) (22,191) (647) (40,929)
Net Increase / (Decrease) 276 $ 9,888 62 $ 2,631 502 $ 29,788 193 $ 12,989
Administrative ClassShares sold — $ — — $ — 26 $ 1,752 12 $ 728Reinvestment of distributions — — — — 30 1,642 10 563Shares repurchased — — — — (7) (511) (13) (738)
Net Increase / (Decrease) — $ — — $ — 49 $ 2,883 9 $ 553
AllianzGI Global Small-Cap Fund AllianzGI Health Sciences Fund
Six Months EndedDecember 31, 2021
(Unaudited)Year Ended
June 30, 2021
Six Months EndedDecember 31, 2021
(Unaudited)Year Ended
June 30, 2021
SHARES AMOUNT SHARES AMOUNT SHARES AMOUNT SHARES AMOUNT
Class AShares sold 26 $ 1,193 70 $ 3,342 73 $ 2,705 125 $ 4,406Reinvestment of distributions 315 11,665 41 1,912 935 31,093 588 19,561Shares repurchased (118) (5,685) (145) (6,464) (316) (11,786) (597) (21,195)
Net Increase / (Decrease) 223 $ 7,173 (34) $ (1,210) 692 $ 22,012 116 $ 2,772
Class CShares sold 3 $ 94 5 $ 181 24 $ 577 12 $ 318Reinvestment of distributions 31 847 5 206 47 981 29 673Shares repurchased (20) (803) (70) (2,511) (21) (561) (66) (1,688)
Net Increase / (Decrease) 14 $ 138 (60) $ (2,124) 50 $ 997 (25) $ (697)
Class PShares sold 1 $ 49 7 $ 346 45 $ 1,567 23 $ 843Reinvestment of distributions 16 682 3 158 5 179 1 18Shares repurchased (11) (629) (62) (3,246) (3) (97) (1) (24)
Net Increase / (Decrease) 6 $ 102 (52) $ (2,742) 47 $ 1,649 23 $ 837
Institutional ClassShares sold 30 $ 1,741 146 $ 8,093 150 $ 6,018 275 $ 9,933Reinvestment of distributions 206 8,802 26 1,361 124 4,230 54 1,822Shares repurchased (85) (4,782) (234) (11,605) (161) (6,192) (107) (3,754)
Net Increase / (Decrease) 151 $ 5,761 (62) $ (2,151) 113 $ 4,056 222 $ 8,001
VIRTUS INVESTMENT TRUSTNOTES TO FINANCIAL STATEMENTS (Unaudited) (Continued)
DECEMBER 31, 2021
94
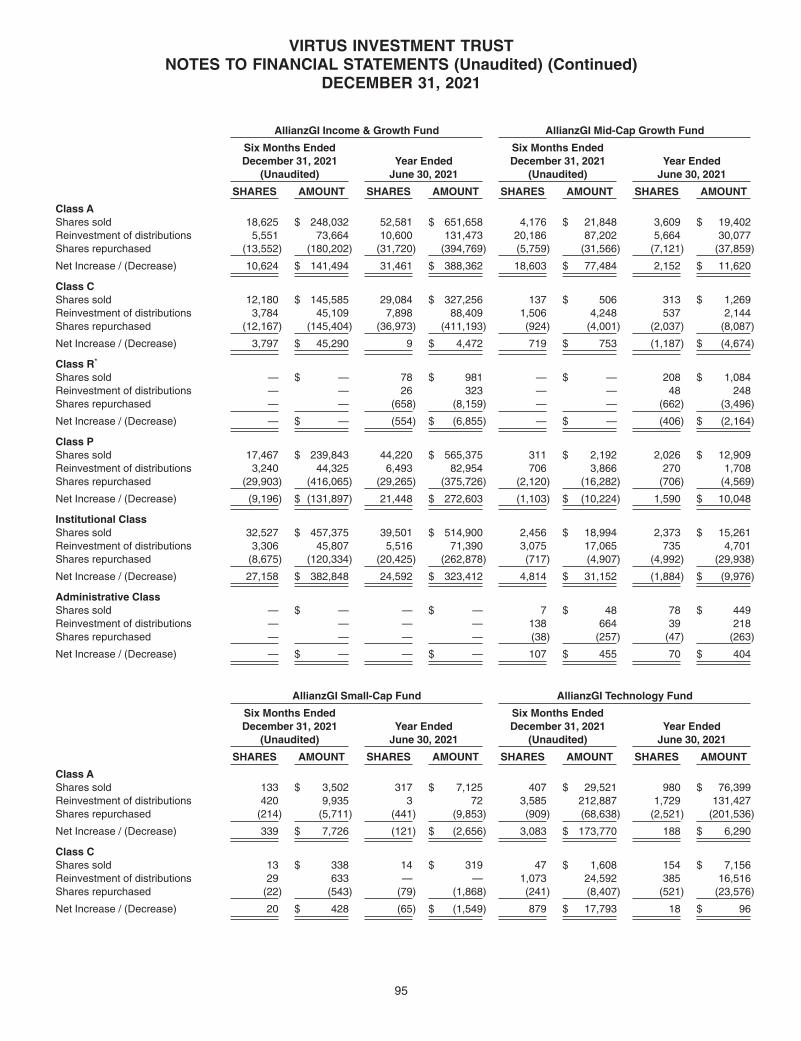
AllianzGI Income & Growth Fund AllianzGI Mid-Cap Growth Fund
Six Months EndedDecember 31, 2021
(Unaudited)Year Ended
June 30, 2021
Six Months EndedDecember 31, 2021
(Unaudited)Year Ended
June 30, 2021
SHARES AMOUNT SHARES AMOUNT SHARES AMOUNT SHARES AMOUNT
Class AShares sold 18,625 $ 248,032 52,581 $ 651,658 4,176 $ 21,848 3,609 $ 19,402Reinvestment of distributions 5,551 73,664 10,600 131,473 20,186 87,202 5,664 30,077Shares repurchased (13,552) (180,202) (31,720) (394,769) (5,759) (31,566) (7,121) (37,859)
Net Increase / (Decrease) 10,624 $ 141,494 31,461 $ 388,362 18,603 $ 77,484 2,152 $ 11,620
Class CShares sold 12,180 $ 145,585 29,084 $ 327,256 137 $ 506 313 $ 1,269Reinvestment of distributions 3,784 45,109 7,898 88,409 1,506 4,248 537 2,144Shares repurchased (12,167) (145,404) (36,973) (411,193) (924) (4,001) (2,037) (8,087)
Net Increase / (Decrease) 3,797 $ 45,290 9 $ 4,472 719 $ 753 (1,187) $ (4,674)
Class R*
Shares sold — $ — 78 $ 981 — $ — 208 $ 1,084Reinvestment of distributions — — 26 323 — — 48 248Shares repurchased — — (658) (8,159) — — (662) (3,496)
Net Increase / (Decrease) — $ — (554) $ (6,855) — $ — (406) $ (2,164)
Class PShares sold 17,467 $ 239,843 44,220 $ 565,375 311 $ 2,192 2,026 $ 12,909Reinvestment of distributions 3,240 44,325 6,493 82,954 706 3,866 270 1,708Shares repurchased (29,903) (416,065) (29,265) (375,726) (2,120) (16,282) (706) (4,569)
Net Increase / (Decrease) (9,196) $ (131,897) 21,448 $ 272,603 (1,103) $ (10,224) 1,590 $ 10,048
Institutional ClassShares sold 32,527 $ 457,375 39,501 $ 514,900 2,456 $ 18,994 2,373 $ 15,261Reinvestment of distributions 3,306 45,807 5,516 71,390 3,075 17,065 735 4,701Shares repurchased (8,675) (120,334) (20,425) (262,878) (717) (4,907) (4,992) (29,938)
Net Increase / (Decrease) 27,158 $ 382,848 24,592 $ 323,412 4,814 $ 31,152 (1,884) $ (9,976)
Administrative ClassShares sold — $ — — $ — 7 $ 48 78 $ 449Reinvestment of distributions — — — — 138 664 39 218Shares repurchased — — — — (38) (257) (47) (263)
Net Increase / (Decrease) — $ — — $ — 107 $ 455 70 $ 404
AllianzGI Small-Cap Fund AllianzGI Technology Fund
Six Months EndedDecember 31, 2021
(Unaudited)Year Ended
June 30, 2021
Six Months EndedDecember 31, 2021
(Unaudited)Year Ended
June 30, 2021
SHARES AMOUNT SHARES AMOUNT SHARES AMOUNT SHARES AMOUNT
Class AShares sold 133 $ 3,502 317 $ 7,125 407 $ 29,521 980 $ 76,399Reinvestment of distributions 420 9,935 3 72 3,585 212,887 1,729 131,427Shares repurchased (214) (5,711) (441) (9,853) (909) (68,638) (2,521) (201,536)
Net Increase / (Decrease) 339 $ 7,726 (121) $ (2,656) 3,083 $ 173,770 188 $ 6,290
Class CShares sold 13 $ 338 14 $ 319 47 $ 1,608 154 $ 7,156Reinvestment of distributions 29 633 — — 1,073 24,592 385 16,516Shares repurchased (22) (543) (79) (1,868) (241) (8,407) (521) (23,576)
Net Increase / (Decrease) 20 $ 428 (65) $ (1,549) 879 $ 17,793 18 $ 96
VIRTUS INVESTMENT TRUSTNOTES TO FINANCIAL STATEMENTS (Unaudited) (Continued)
DECEMBER 31, 2021
95
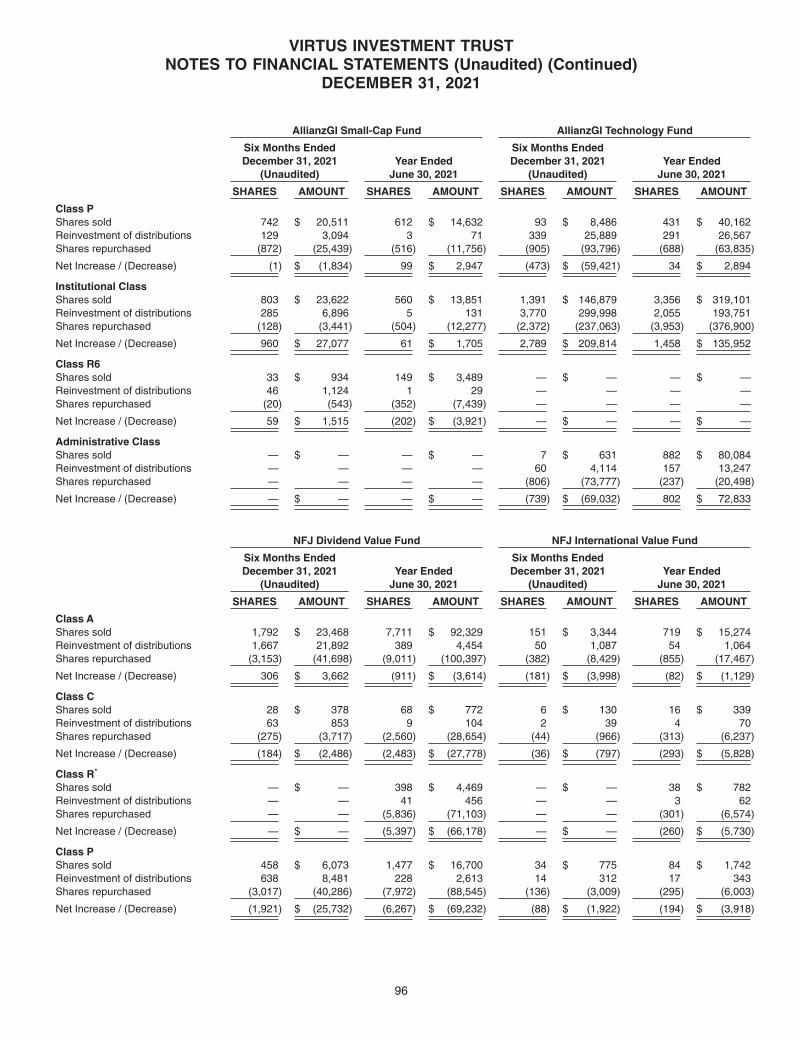
AllianzGI Small-Cap Fund AllianzGI Technology Fund
Six Months EndedDecember 31, 2021
(Unaudited)Year Ended
June 30, 2021
Six Months EndedDecember 31, 2021
(Unaudited)Year Ended
June 30, 2021
SHARES AMOUNT SHARES AMOUNT SHARES AMOUNT SHARES AMOUNT
Class PShares sold 742 $ 20,511 612 $ 14,632 93 $ 8,486 431 $ 40,162Reinvestment of distributions 129 3,094 3 71 339 25,889 291 26,567Shares repurchased (872) (25,439) (516) (11,756) (905) (93,796) (688) (63,835)
Net Increase / (Decrease) (1) $ (1,834) 99 $ 2,947 (473) $ (59,421) 34 $ 2,894
Institutional ClassShares sold 803 $ 23,622 560 $ 13,851 1,391 $ 146,879 3,356 $ 319,101Reinvestment of distributions 285 6,896 5 131 3,770 299,998 2,055 193,751Shares repurchased (128) (3,441) (504) (12,277) (2,372) (237,063) (3,953) (376,900)
Net Increase / (Decrease) 960 $ 27,077 61 $ 1,705 2,789 $ 209,814 1,458 $ 135,952
Class R6Shares sold 33 $ 934 149 $ 3,489 — $ — — $ —Reinvestment of distributions 46 1,124 1 29 — — — —Shares repurchased (20) (543) (352) (7,439) — — — —
Net Increase / (Decrease) 59 $ 1,515 (202) $ (3,921) — $ — — $ —
Administrative ClassShares sold — $ — — $ — 7 $ 631 882 $ 80,084Reinvestment of distributions — — — — 60 4,114 157 13,247Shares repurchased — — — — (806) (73,777) (237) (20,498)
Net Increase / (Decrease) — $ — — $ — (739) $ (69,032) 802 $ 72,833
NFJ Dividend Value Fund NFJ International Value Fund
Six Months EndedDecember 31, 2021
(Unaudited)Year Ended
June 30, 2021
Six Months EndedDecember 31, 2021
(Unaudited)Year Ended
June 30, 2021
SHARES AMOUNT SHARES AMOUNT SHARES AMOUNT SHARES AMOUNT
Class AShares sold 1,792 $ 23,468 7,711 $ 92,329 151 $ 3,344 719 $ 15,274Reinvestment of distributions 1,667 21,892 389 4,454 50 1,087 54 1,064Shares repurchased (3,153) (41,698) (9,011) (100,397) (382) (8,429) (855) (17,467)
Net Increase / (Decrease) 306 $ 3,662 (911) $ (3,614) (181) $ (3,998) (82) $ (1,129)
Class CShares sold 28 $ 378 68 $ 772 6 $ 130 16 $ 339Reinvestment of distributions 63 853 9 104 2 39 4 70Shares repurchased (275) (3,717) (2,560) (28,654) (44) (966) (313) (6,237)
Net Increase / (Decrease) (184) $ (2,486) (2,483) $ (27,778) (36) $ (797) (293) $ (5,828)
Class R*
Shares sold — $ — 398 $ 4,469 — $ — 38 $ 782Reinvestment of distributions — — 41 456 — — 3 62Shares repurchased — — (5,836) (71,103) — — (301) (6,574)
Net Increase / (Decrease) — $ — (5,397) $ (66,178) — $ — (260) $ (5,730)
Class PShares sold 458 $ 6,073 1,477 $ 16,700 34 $ 775 84 $ 1,742Reinvestment of distributions 638 8,481 228 2,613 14 312 17 343Shares repurchased (3,017) (40,286) (7,972) (88,545) (136) (3,009) (295) (6,003)
Net Increase / (Decrease) (1,921) $ (25,732) (6,267) $ (69,232) (88) $ (1,922) (194) $ (3,918)
VIRTUS INVESTMENT TRUSTNOTES TO FINANCIAL STATEMENTS (Unaudited) (Continued)
DECEMBER 31, 2021
96
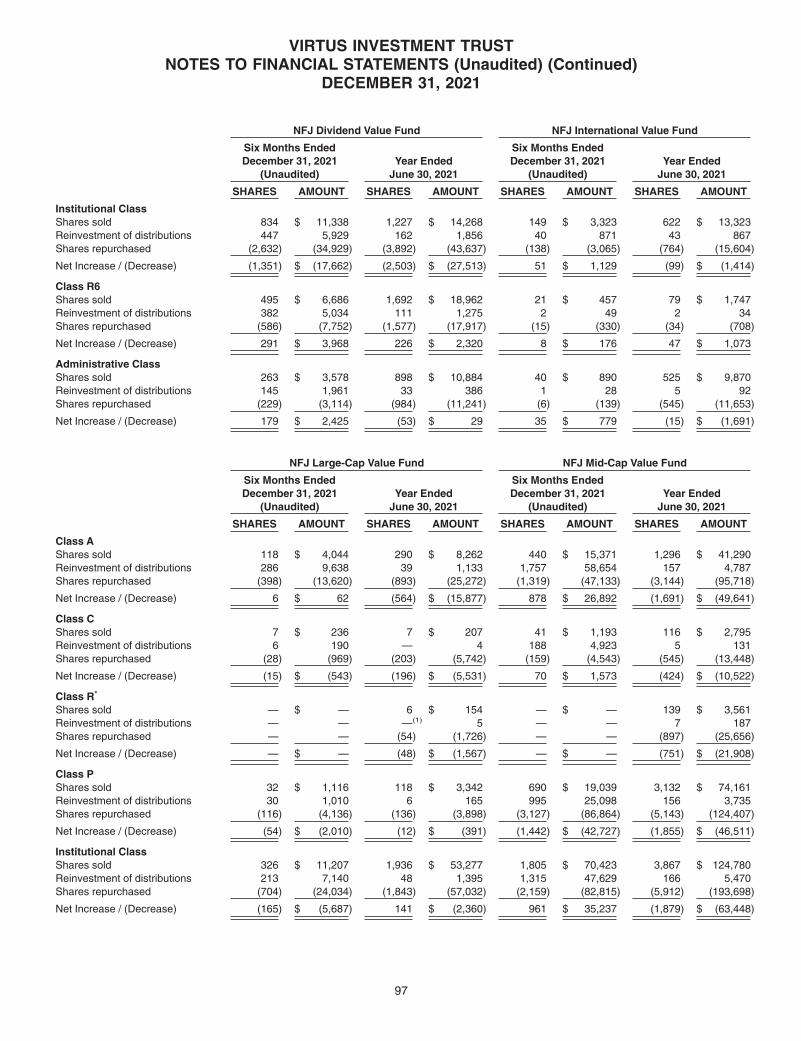
NFJ Dividend Value Fund NFJ International Value Fund
Six Months EndedDecember 31, 2021
(Unaudited)Year Ended
June 30, 2021
Six Months EndedDecember 31, 2021
(Unaudited)Year Ended
June 30, 2021
SHARES AMOUNT SHARES AMOUNT SHARES AMOUNT SHARES AMOUNT
Institutional ClassShares sold 834 $ 11,338 1,227 $ 14,268 149 $ 3,323 622 $ 13,323Reinvestment of distributions 447 5,929 162 1,856 40 871 43 867Shares repurchased (2,632) (34,929) (3,892) (43,637) (138) (3,065) (764) (15,604)
Net Increase / (Decrease) (1,351) $ (17,662) (2,503) $ (27,513) 51 $ 1,129 (99) $ (1,414)
Class R6Shares sold 495 $ 6,686 1,692 $ 18,962 21 $ 457 79 $ 1,747Reinvestment of distributions 382 5,034 111 1,275 2 49 2 34Shares repurchased (586) (7,752) (1,577) (17,917) (15) (330) (34) (708)
Net Increase / (Decrease) 291 $ 3,968 226 $ 2,320 8 $ 176 47 $ 1,073
Administrative ClassShares sold 263 $ 3,578 898 $ 10,884 40 $ 890 525 $ 9,870Reinvestment of distributions 145 1,961 33 386 1 28 5 92Shares repurchased (229) (3,114) (984) (11,241) (6) (139) (545) (11,653)
Net Increase / (Decrease) 179 $ 2,425 (53) $ 29 35 $ 779 (15) $ (1,691)
NFJ Large-Cap Value Fund NFJ Mid-Cap Value Fund
Six Months EndedDecember 31, 2021
(Unaudited)Year Ended
June 30, 2021
Six Months EndedDecember 31, 2021
(Unaudited)Year Ended
June 30, 2021
SHARES AMOUNT SHARES AMOUNT SHARES AMOUNT SHARES AMOUNT
Class AShares sold 118 $ 4,044 290 $ 8,262 440 $ 15,371 1,296 $ 41,290Reinvestment of distributions 286 9,638 39 1,133 1,757 58,654 157 4,787Shares repurchased (398) (13,620) (893) (25,272) (1,319) (47,133) (3,144) (95,718)
Net Increase / (Decrease) 6 $ 62 (564) $ (15,877) 878 $ 26,892 (1,691) $ (49,641)
Class CShares sold 7 $ 236 7 $ 207 41 $ 1,193 116 $ 2,795Reinvestment of distributions 6 190 — 4 188 4,923 5 131Shares repurchased (28) (969) (203) (5,742) (159) (4,543) (545) (13,448)
Net Increase / (Decrease) (15) $ (543) (196) $ (5,531) 70 $ 1,573 (424) $ (10,522)
Class R*
Shares sold — $ — 6 $ 154 — $ — 139 $ 3,561Reinvestment of distributions — — —(1) 5 — — 7 187Shares repurchased — — (54) (1,726) — — (897) (25,656)
Net Increase / (Decrease) — $ — (48) $ (1,567) — $ — (751) $ (21,908)
Class PShares sold 32 $ 1,116 118 $ 3,342 690 $ 19,039 3,132 $ 74,161Reinvestment of distributions 30 1,010 6 165 995 25,098 156 3,735Shares repurchased (116) (4,136) (136) (3,898) (3,127) (86,864) (5,143) (124,407)
Net Increase / (Decrease) (54) $ (2,010) (12) $ (391) (1,442) $ (42,727) (1,855) $ (46,511)
Institutional ClassShares sold 326 $ 11,207 1,936 $ 53,277 1,805 $ 70,423 3,867 $ 124,780Reinvestment of distributions 213 7,140 48 1,395 1,315 47,629 166 5,470Shares repurchased (704) (24,034) (1,843) (57,032) (2,159) (82,815) (5,912) (193,698)
Net Increase / (Decrease) (165) $ (5,687) 141 $ (2,360) 961 $ 35,237 (1,879) $ (63,448)
VIRTUS INVESTMENT TRUSTNOTES TO FINANCIAL STATEMENTS (Unaudited) (Continued)
DECEMBER 31, 2021
97
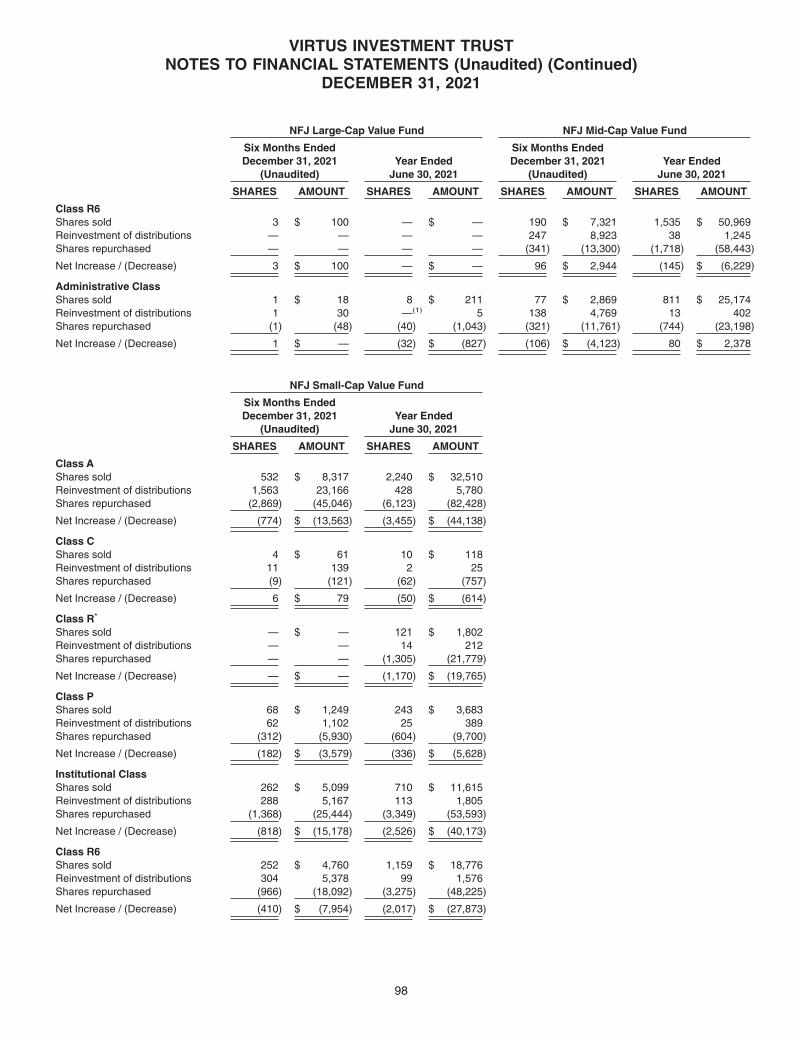
NFJ Large-Cap Value Fund NFJ Mid-Cap Value Fund
Six Months EndedDecember 31, 2021
(Unaudited)Year Ended
June 30, 2021
Six Months EndedDecember 31, 2021
(Unaudited)Year Ended
June 30, 2021
SHARES AMOUNT SHARES AMOUNT SHARES AMOUNT SHARES AMOUNT
Class R6Shares sold 3 $ 100 — $ — 190 $ 7,321 1,535 $ 50,969Reinvestment of distributions — — — — 247 8,923 38 1,245Shares repurchased — — — — (341) (13,300) (1,718) (58,443)
Net Increase / (Decrease) 3 $ 100 — $ — 96 $ 2,944 (145) $ (6,229)
Administrative ClassShares sold 1 $ 18 8 $ 211 77 $ 2,869 811 $ 25,174Reinvestment of distributions 1 30 —(1) 5 138 4,769 13 402Shares repurchased (1) (48) (40) (1,043) (321) (11,761) (744) (23,198)
Net Increase / (Decrease) 1 $ — (32) $ (827) (106) $ (4,123) 80 $ 2,378
NFJ Small-Cap Value Fund
Six Months EndedDecember 31, 2021
(Unaudited)Year Ended
June 30, 2021
SHARES AMOUNT SHARES AMOUNT
Class AShares sold 532 $ 8,317 2,240 $ 32,510Reinvestment of distributions 1,563 23,166 428 5,780Shares repurchased (2,869) (45,046) (6,123) (82,428)
Net Increase / (Decrease) (774) $ (13,563) (3,455) $ (44,138)
Class CShares sold 4 $ 61 10 $ 118Reinvestment of distributions 11 139 2 25Shares repurchased (9) (121) (62) (757)
Net Increase / (Decrease) 6 $ 79 (50) $ (614)
Class R*
Shares sold — $ — 121 $ 1,802Reinvestment of distributions — — 14 212Shares repurchased — — (1,305) (21,779)
Net Increase / (Decrease) — $ — (1,170) $ (19,765)
Class PShares sold 68 $ 1,249 243 $ 3,683Reinvestment of distributions 62 1,102 25 389Shares repurchased (312) (5,930) (604) (9,700)
Net Increase / (Decrease) (182) $ (3,579) (336) $ (5,628)
Institutional ClassShares sold 262 $ 5,099 710 $ 11,615Reinvestment of distributions 288 5,167 113 1,805Shares repurchased (1,368) (25,444) (3,349) (53,593)
Net Increase / (Decrease) (818) $ (15,178) (2,526) $ (40,173)
Class R6Shares sold 252 $ 4,760 1,159 $ 18,776Reinvestment of distributions 304 5,378 99 1,576Shares repurchased (966) (18,092) (3,275) (48,225)
Net Increase / (Decrease) (410) $ (7,954) (2,017) $ (27,873)
VIRTUS INVESTMENT TRUSTNOTES TO FINANCIAL STATEMENTS (Unaudited) (Continued)
DECEMBER 31, 2021
98

NFJ Small-Cap Value Fund
Six Months EndedDecember 31, 2021
(Unaudited)Year Ended
June 30, 2021
SHARES AMOUNT SHARES AMOUNT
Administrative ClassShares sold 82 $ 1,302 376 $ 5,178Reinvestment of distributions 204 3,012 55 739Shares repurchased (241) (3,786) (1,133) (15,592)
Net Increase / (Decrease) 45 $ 528 (702) $ (9,675)
* On May 21, 2021, all Class R shares were converted into Class A shares. These transactions are included as subscriptions of Class A shares and redemptions ofClass R shares in the tables above.
(1) Amount is less than 500 shares.
Note 7. 10% Shareholders
As of December 31, 2021, certain Funds had individual shareholder account(s) and/or omnibus shareholder account(s) (comprised of a group ofindividual shareholders), which individually amounted to more than 10% of the total shares outstanding of such Fund as detailed below:
% of SharesOutstanding
Number ofAccounts*
AllianzGI Emerging Markets Opportunities Fund .. . 55% 2AllianzGI Focused Growth Fund .. . . . . . . . . . . . . . . . . . . . . 10 1AllianzGI Global Small-Cap Fund.. . . . . . . . . . . . . . . . . . . . 34 2AllianzGI Health Sciences Fund .. . . . . . . . . . . . . . . . . . . . . 41 2AllianzGI Mid-Cap Growth Fund .. . . . . . . . . . . . . . . . . . . . . 12 1AllianzGI Small-Cap Fund .. . . . . . . . . . . . . . . . . . . . . . . . . . . . 11 1AllianzGI Technology Fund .. . . . . . . . . . . . . . . . . . . . . . . . . . . 28 2NFJ International Value Fund .. . . . . . . . . . . . . . . . . . . . . . . . 13 1NFJ Large-Cap Value Fund .. . . . . . . . . . . . . . . . . . . . . . . . . . 18 1NFJ Small-Cap Value Fund.. . . . . . . . . . . . . . . . . . . . . . . . . . . 18 1
* The shareholders are not affiliated with Virtus.
Note 8. Credit and Market Risk and Asset Concentration
Local, regional or global events such as war, acts of terrorism, the spread of infectious illness or other public health issue, recessions, or other eventscould have a significant impact on a Fund and its investments, including hampering the ability of each Fund’s portfolio manager(s) to invest each Fund’sassets as intended.
In July 2017, the head of the United Kingdom Financial Conduct Authority announced the intention to phase out the use of LIBOR by the end of 2021.However, after subsequent announcements by the FCA, the LIBOR administrator and other regulators, certain of the most widely used LIBORs areexpected to continue until mid-2023. The Funds may be exposed to financial instruments tied to LIBOR to determine payment obligations, financingterms, hedging strategies or investment value. The expected discontinuation of LIBOR could have a significant impact on the financial markets and maypresent a material risk for certain market participants, including the Funds. Abandonment of or modifications to LIBOR could lead to significant short-and long-term uncertainty and market instability. The risks associated with this discontinuation and transition may be exacerbated if the work necessaryto effect an orderly transition to an alternative reference rate is not completed in a timely manner. It remains uncertain the effects such changes will haveon the Funds, issuers of instruments in which the Funds invest, and the financial markets generally.
In countries with limited or developing markets, investments may present greater risks than in more developed markets and the prices of suchinvestments may be volatile. The consequences of political, social or economic changes in these markets may have disruptive effects on the marketprices of these investments and the income they generate, as well as a Fund’s ability to repatriate such amounts.
Certain Funds may invest a high percentage of their assets in specific sectors of the market in the pursuit of their investment objectives. Fluctuations inthese sectors of concentration may have a greater impact on a Fund, positive or negative, than if the Fund did not concentrate its investments in suchsectors.
At December 31, 2021, the following Funds held securities issued by various companies in specific sectors as detailed below:
VIRTUS INVESTMENT TRUSTNOTES TO FINANCIAL STATEMENTS (Unaudited) (Continued)
DECEMBER 31, 2021
99
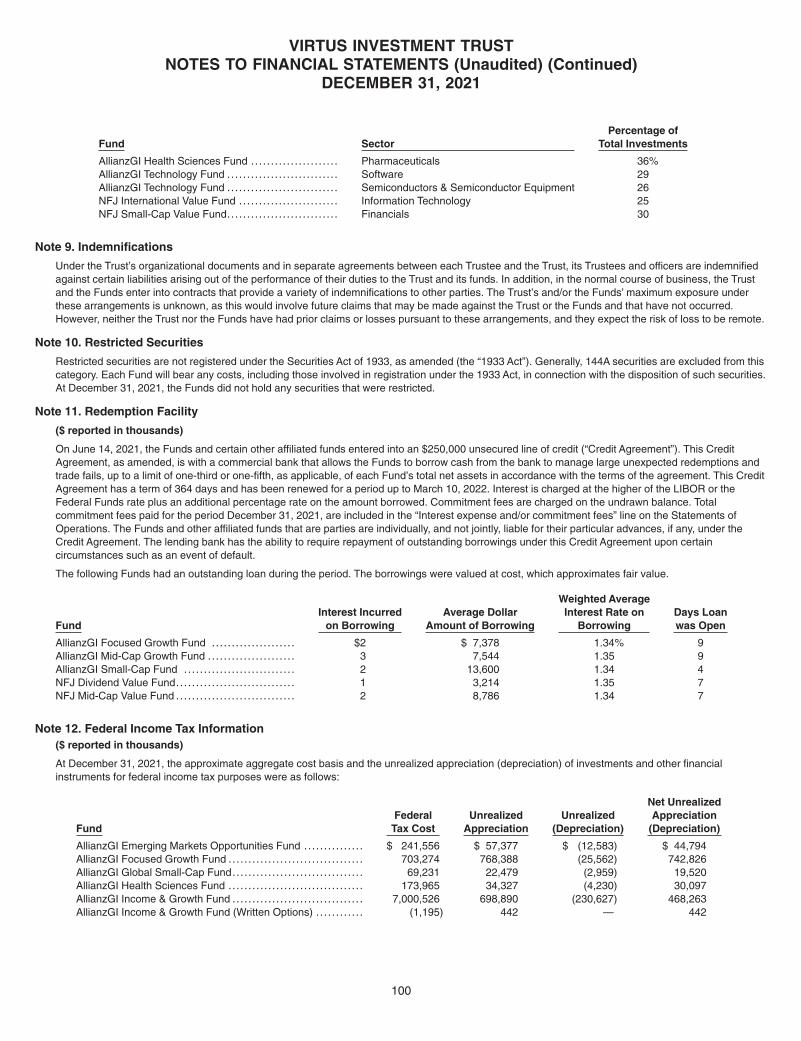
Fund SectorPercentage of
Total Investments
AllianzGI Health Sciences Fund .. . . . . . . . . . . . . . . . . . . . . Pharmaceuticals 36%AllianzGI Technology Fund .. . . . . . . . . . . . . . . . . . . . . . . . . . . Software 29AllianzGI Technology Fund .. . . . . . . . . . . . . . . . . . . . . . . . . . . Semiconductors & Semiconductor Equipment 26NFJ International Value Fund .. . . . . . . . . . . . . . . . . . . . . . . . Information Technology 25NFJ Small-Cap Value Fund.. . . . . . . . . . . . . . . . . . . . . . . . . . . Financials 30
Note 9. Indemnifications
Under the Trust’s organizational documents and in separate agreements between each Trustee and the Trust, its Trustees and officers are indemnifiedagainst certain liabilities arising out of the performance of their duties to the Trust and its funds. In addition, in the normal course of business, the Trustand the Funds enter into contracts that provide a variety of indemnifications to other parties. The Trust’s and/or the Funds’ maximum exposure underthese arrangements is unknown, as this would involve future claims that may be made against the Trust or the Funds and that have not occurred.However, neither the Trust nor the Funds have had prior claims or losses pursuant to these arrangements, and they expect the risk of loss to be remote.
Note 10. Restricted Securities
Restricted securities are not registered under the Securities Act of 1933, as amended (the “1933 Act”). Generally, 144A securities are excluded from thiscategory. Each Fund will bear any costs, including those involved in registration under the 1933 Act, in connection with the disposition of such securities.At December 31, 2021, the Funds did not hold any securities that were restricted.
Note 11. Redemption Facility
($ reported in thousands)
On June 14, 2021, the Funds and certain other affiliated funds entered into an $250,000 unsecured line of credit (“Credit Agreement”). This CreditAgreement, as amended, is with a commercial bank that allows the Funds to borrow cash from the bank to manage large unexpected redemptions andtrade fails, up to a limit of one-third or one-fifth, as applicable, of each Fund’s total net assets in accordance with the terms of the agreement. This CreditAgreement has a term of 364 days and has been renewed for a period up to March 10, 2022. Interest is charged at the higher of the LIBOR or theFederal Funds rate plus an additional percentage rate on the amount borrowed. Commitment fees are charged on the undrawn balance. Totalcommitment fees paid for the period December 31, 2021, are included in the “Interest expense and/or commitment fees” line on the Statements ofOperations. The Funds and other affiliated funds that are parties are individually, and not jointly, liable for their particular advances, if any, under theCredit Agreement. The lending bank has the ability to require repayment of outstanding borrowings under this Credit Agreement upon certaincircumstances such as an event of default.
The following Funds had an outstanding loan during the period. The borrowings were valued at cost, which approximates fair value.
FundInterest Incurred
on BorrowingAverage Dollar
Amount of Borrowing
Weighted AverageInterest Rate on
BorrowingDays Loanwas Open
AllianzGI Focused Growth Fund .. . . . . . . . . . . . . . . . . . . . $2 $ 7,378 1.34% 9AllianzGI Mid-Cap Growth Fund .. . . . . . . . . . . . . . . . . . . . . 3 7,544 1.35 9AllianzGI Small-Cap Fund .. . . . . . . . . . . . . . . . . . . . . . . . . . . 2 13,600 1.34 4NFJ Dividend Value Fund.. . . . . . . . . . . . . . . . . . . . . . . . . . . . . 1 3,214 1.35 7NFJ Mid-Cap Value Fund .. . . . . . . . . . . . . . . . . . . . . . . . . . . . . 2 8,786 1.34 7
Note 12. Federal Income Tax Information($ reported in thousands)
At December 31, 2021, the approximate aggregate cost basis and the unrealized appreciation (depreciation) of investments and other financialinstruments for federal income tax purposes were as follows:
FundFederal
Tax CostUnrealized
AppreciationUnrealized
(Depreciation)
Net UnrealizedAppreciation
(Depreciation)
AllianzGI Emerging Markets Opportunities Fund .. . . . . . . . . . . . . . $ 241,556 $ 57,377 $ (12,583) $ 44,794AllianzGI Focused Growth Fund .. . . . . . . . . . . . . . . . . . . . . . . . . . . . . . . . . 703,274 768,388 (25,562) 742,826AllianzGI Global Small-Cap Fund.. . . . . . . . . . . . . . . . . . . . . . . . . . . . . . . . 69,231 22,479 (2,959) 19,520AllianzGI Health Sciences Fund .. . . . . . . . . . . . . . . . . . . . . . . . . . . . . . . . . 173,965 34,327 (4,230) 30,097AllianzGI Income & Growth Fund .. . . . . . . . . . . . . . . . . . . . . . . . . . . . . . . . 7,000,526 698,890 (230,627) 468,263AllianzGI Income & Growth Fund (Written Options) . . . . . . . . . . . . (1,195) 442 — 442
VIRTUS INVESTMENT TRUSTNOTES TO FINANCIAL STATEMENTS (Unaudited) (Continued)
DECEMBER 31, 2021
100

FundFederal
Tax CostUnrealized
AppreciationUnrealized
(Depreciation)
Net UnrealizedAppreciation
(Depreciation)
AllianzGI Mid-Cap Growth Fund .. . . . . . . . . . . . . . . . . . . . . . . . . . . . . . . . . $ 346,889 $159,144 $ (22,213) $136,931AllianzGI Small-Cap Fund .. . . . . . . . . . . . . . . . . . . . . . . . . . . . . . . . . . . . . . . . 141,919 47,082 (4,069) 43,013AllianzGI Technology Fund (Including Purchased Options). . . . 1,661,570 742,753 (32,222) 710,531AllianzGI Technology Fund (Written Options) . . . . . . . . . . . . . . . . . . . (13,594) 8,624 — 8,624NFJ Dividend Value Fund.. . . . . . . . . . . . . . . . . . . . . . . . . . . . . . . . . . . . . . . . . 670,518 242,905 (3,596) 239,309NFJ International Value Fund .. . . . . . . . . . . . . . . . . . . . . . . . . . . . . . . . . . . . 128,754 23,471 (6,981) 16,490NFJ Large-Cap Value Fund .. . . . . . . . . . . . . . . . . . . . . . . . . . . . . . . . . . . . . . 255,669 90,836 (3,000) 87,836NFJ Mid-Cap Value Fund .. . . . . . . . . . . . . . . . . . . . . . . . . . . . . . . . . . . . . . . . . 1,140,866 324,071 (16,985) 307,086NFJ Small-Cap Value Fund.. . . . . . . . . . . . . . . . . . . . . . . . . . . . . . . . . . . . . . . 415,474 126,115 (4,800) 121,315
Certain Funds have capital loss carryforwards available to offset future realized capital gains, if any, to the extent permitted by the Code. Net capitallosses are carried forward without expiration and generally retain their short-term and/or long-term tax character, as applicable. For the fiscal year endedJune 30, 2021, the Funds’ capital loss carryovers were as follows:
Fund Short-Term Long-Term
AllianzGI Emerging Markets Opportunities Fund .. . . . . . . . . . . . . . $ 8,616 $ —NFJ International Value Fund .. . . . . . . . . . . . . . . . . . . . . . . . . . . . . . . . . . . . 249,610 189,222
Note 13. Regulatory Matters and Litigation
From time to time, the Trust, the Funds, the Adviser and/or the subadvisers and/or their affiliates may be involved in litigation and arbitration as well asexaminations and investigations by various regulatory bodies, including the SEC, involving compliance with, among other things, securities laws, clientinvestment guidelines, laws governing the activities of broker-dealers and other laws and regulations affecting their activities. At this time, the Adviserbelieves that the outcomes of such matters are not likely, either individually or in aggregate, to be material to these financial statements.
Note 14. Recent Accounting Pronouncement
In March 2020, the FASB issued Accounting Standards Update No. 2020-04 (“ASU 2020-04”), Reference Rate Reform (Topic 848) – Facilitation of theEffects of Reference Rate Reform on Financial Reporting. The amendments in ASU 2020-04 provides optional temporary financial reporting relief fromthe effect of certain types of contract modifications due to the planned discontinuation of the LIBOR and other interbank-offered reference rates as of theend of 2021. ASU 2020-04 is effective for certain reference rate-related contract modifications that occur during the period March 12, 2020 throughDecember 31, 2022. Management is currently evaluating the impact, if any, of applying ASU 2020-04.
Note 15. Subsequent Events
Management has evaluated the impact of all subsequent events on the Funds through the date the financial statements were available for issuance, andhas determined that there are no subsequent events requiring recognition or disclosure in these financial statements.
VIRTUS INVESTMENT TRUSTNOTES TO FINANCIAL STATEMENTS (Unaudited) (Continued)
DECEMBER 31, 2021
101

THIS PAGE INTENTIONALLY BLANK.

THIS PAGE INTENTIONALLY BLANK.

THIS PAGE INTENTIONALLY BLANK.
TrusteesPhilip R. McLoughlin, ChairmanGeorge R. AylwardDonald C. BurkeSarah E. CoganDeborah A. DeCotisF. Ford DrummondSidney E. HarrisJohn R. MallinConnie D. McDanielGeraldine M. McNamaraR. Keith WaltonBrian T. Zino
Advisory Board MemberWilliam R. Moyer
OfficersGeorge R. Aylward, PresidentPeter Batchelar, Senior Vice PresidentW. Patrick Bradley, Executive Vice President,
Chief Financial Officer and TreasurerKevin J. Carr, Senior Vice President and
Assistant SecretaryNancy J. Engberg, Senior Vice President and
Chief Compliance OfficerJennifer Fromm, Vice President, Chief Legal
Officer, Counsel and SecretaryJulia R. Short, Senior Vice PresidentRichard W. Smirl, Executive Vice President
Investment AdviserVirtus Investment Advisers, Inc.One Financial PlazaHartford, CT 06103-2608
Principal UnderwriterVP Distributors, LLCOne Financial PlazaHartford, CT 06103-2608
Administrator and Transfer AgentVirtus Fund Services, LLCOne Financial PlazaHartford, CT 06103-2608
CustodianThe Bank of New York Mellon240 Greenwich StreetNew York, NY 10286-1048
How to Contact UsMutual Fund Services 1-800-243-1574Adviser Consulting Group 1-800-243-4361
Website Virtus.com
Important Notice to ShareholdersThe Securities and Exchange Commission has modified mailing regulations for semiannual and annualshareholder fund reports to allow mutual fund companies to send a single copy of these reports to shareholderswho share the same mailing address. If you would like additional copies, please call Mutual Fund Services at1-800-243-1574.
VIRTUS INVESTMENT TRUST101 Munson StreetGreenfield, MA 01301-9668

For more information about Virtus Mutual Funds,
please contact us at 1-800-243-1574, or visit Virtus.com.
P.O. Box 9874Providence, RI 02940-8074
8033 2-22
Related Documents