VIRTUAL REALITY DRIVING SIMULATOR FOR OLDER DRIVERS Project Evaluation Report Report prepared for McLean Care | By Alicia Eugene, Harvest Community Sector Consultants | August 2019

Welcome message from author
This document is posted to help you gain knowledge. Please leave a comment to let me know what you think about it! Share it to your friends and learn new things together.
Transcript
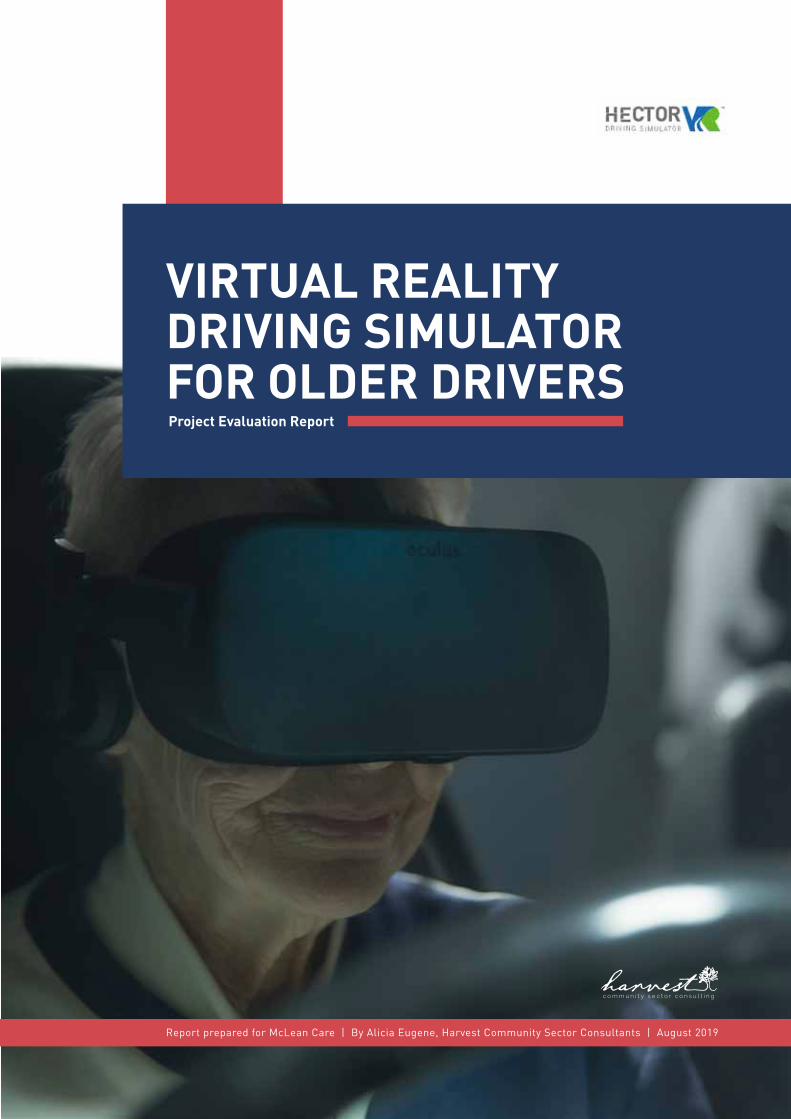
VIRTUAL REALITY DRIVING SIMULATOR FOR OLDER DRIVERSProject Evaluation Report
Report prepared for McLean Care | By Alicia Eugene, Harvest Community Sector Consultants | August 2019

2
This project was conducted by: With funding from:
3
Acknowledgements .......................................................................................................5
Abbreviations and Acronyms ...........................................................................................6
List of Tables ..................................................................................................................7
List of Figures .................................................................................................................7
Executive Summary ........................................................................................................8
Chapter 1: Introduction ...............................................................................................10
Chapter 2: Literature Review .......................................................................................14
Chapter 3: Evaluation Methodology ............................................................................21
3.1 Ethics Approval .................................................................................................22
3.2 Research questions ...........................................................................................22
3.3 Methodological Approach .................................................................................23
3.4 Participant target group and recruitment strategies ...........................................24
3.5 Consent ...........................................................................................................25
3.6 Research Activities ............................................................................................25
3.7 Data Collection Strategies ................................................................................26
3.7.1 Action Research .......................................................................................26
3.7.2 Focus Groups ...........................................................................................27
3.7.3 TAM-VR Tool ............................................................................................31
3.8 Managing Potential Bias in the Sample ..............................................................31
3.9 Data Management ............................................................................................32
3.10 Limitations of the Evaluation ............................................................................32
Chapter 4: Results .......................................................................................................33
4.1 Participant Profile .............................................................................................34
4.2 Project Outcomes .............................................................................................36
4.2.1 TAM VR Results .......................................................................................36
4.2.2 Mixed Reality Design ...............................................................................41
4.2.3 Driving Test Results ..................................................................................43
4.2.4 Rates of Simulator Sickness .....................................................................45
4.2.5 Older Driver Behaviour .............................................................................47
TABLE OF
CONTENTS
4
4.3 Process Evaluation ............................................................................................49
4.3.1 Steering Committee Self-Review ..............................................................50
4.3.2 Questionnaire Responses .........................................................................55
4.3.3 Focus Group Responses ...........................................................................56
4.3.4 Summary of Challenges and Enablers ........................................................57
Chapter 5: Discussion of Major Findings .......................................................................60
Chapter 6: Conclusion and Recommendations .............................................................68
References ....................................................................................................................70
APPENDIX A – ..............................................................................................................73
PLAIN LANGUAGE STATEMENT AND CONSENT FORM ..................................................79
APPENDIX B – ..............................................................................................................80
Steering Committee Self Evaluation Survey – Free Text Responses .................................80
5
This report was prepared with the contribution and cooperation of the following key stakeholders:
• Sue Thomson, CEO, McLean Care
• Nikole Fletcher, ICT Manager, McLean Care
• Dr Michael Mortimer, Deakin University
• Dr Ben Horan, Deakin University
• Alan Wild, ICT team member, McLean Care
• Heidi Manning, 2Creative Media, project media partner
This project would not have been possible without the support and participation of the older people from the
Inverell and Tamworth communities, including members of the Kamilaroi nation. We thank them all for their
willingness to try something new and for giving their permission to share their results, comments and images
in this report.
The project was funded by the Department of Health through a Dementia and Aged Care grant.AC
KN
OW
LED
GEM
ENTS
6
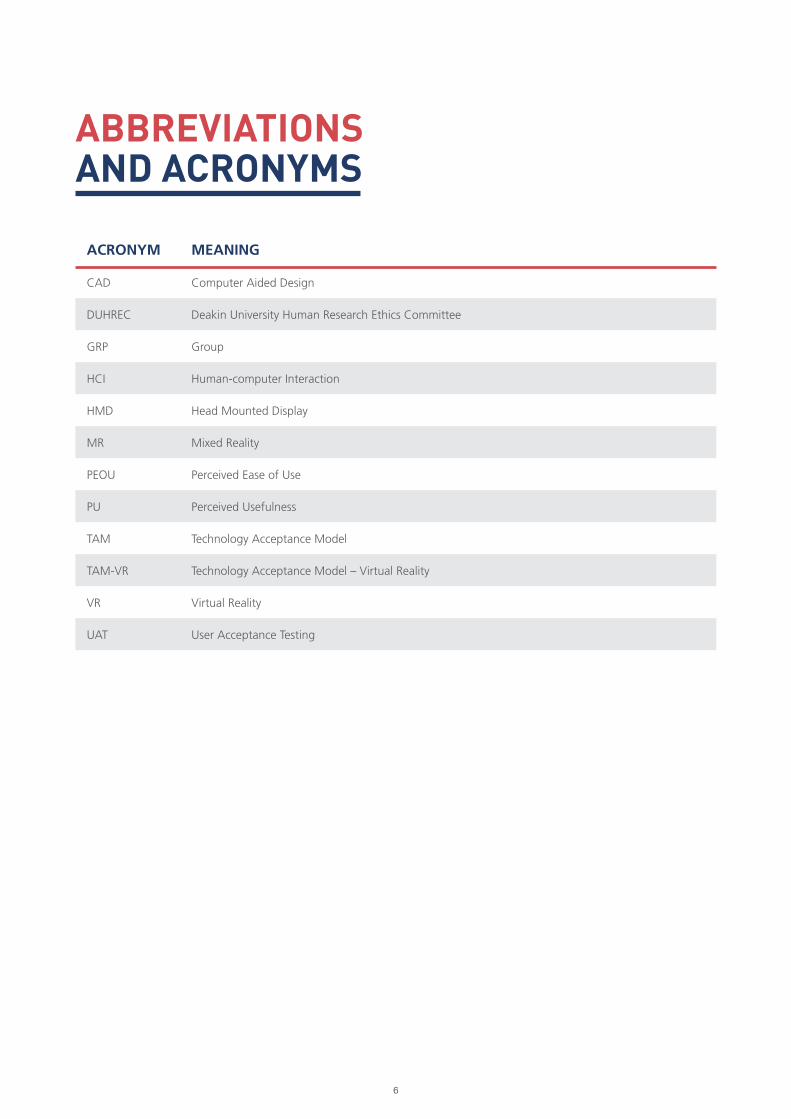
ABBREVIATIONS AND ACRONYMS
ACRONYM MEANING
CAD Computer Aided Design
DUHREC Deakin University Human Research Ethics Committee
GRP Group
HCI Human-computer Interaction
HMD Head Mounted Display
MR Mixed Reality
PEOU Perceived Ease of Use
PU Perceived Usefulness
TAM Technology Acceptance Model
TAM-VR Technology Acceptance Model – Virtual Reality
VR Virtual Reality
UAT User Acceptance Testing
7
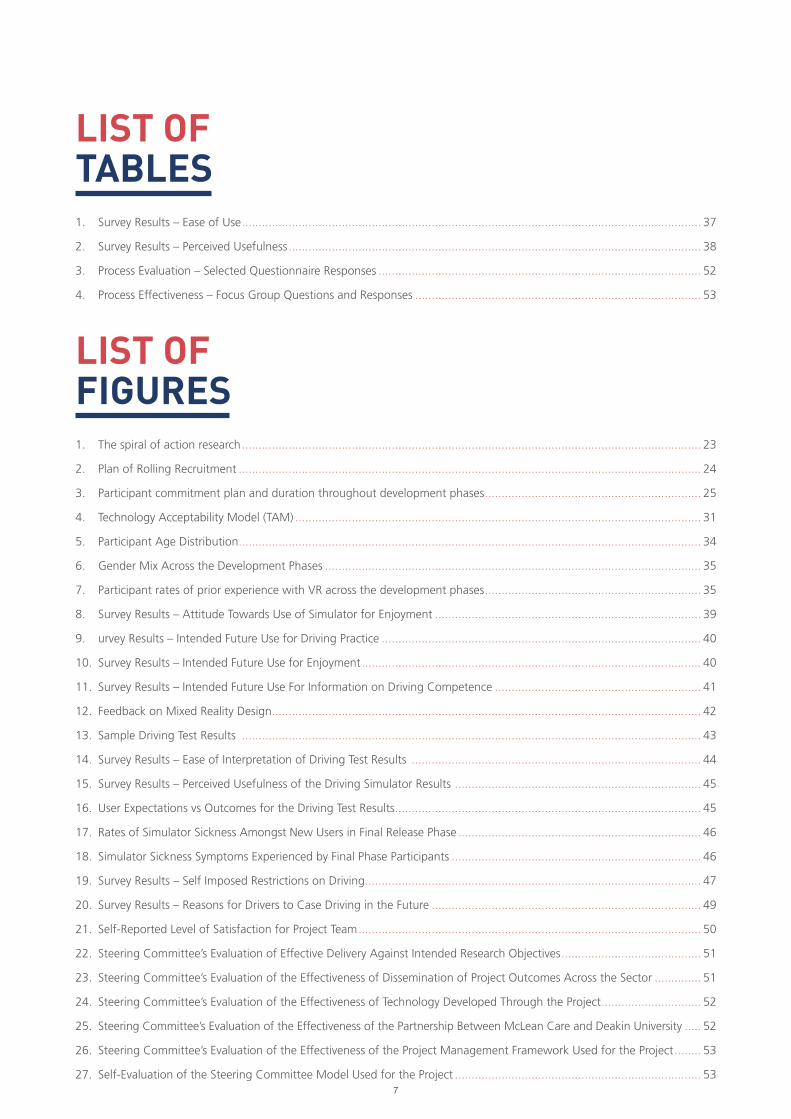
1. Survey Results – Ease of Use .......................................................................................................................................... 37
2. Survey Results – Perceived Usefulness ............................................................................................................................ 38
3. Process Evaluation – Selected Questionnaire Responses ................................................................................................. 52
4. Process Effectiveness – Focus Group Questions and Responses ...................................................................................... 53
LIST OF TABLES
1. The spiral of action research .......................................................................................................................................... 23
2. Plan of Rolling Recruitment ........................................................................................................................................... 24
3. Participant commitment plan and duration throughout development phases ................................................................. 25
4. Technology Acceptability Model (TAM) .......................................................................................................................... 31
5. Participant Age Distribution ........................................................................................................................................... 34
6. Gender Mix Across the Development Phases ................................................................................................................. 35
7. Participant rates of prior experience with VR across the development phases ................................................................. 35
8. Survey Results – Attitude Towards Use of Simulator for Enjoyment ................................................................................ 39
9. urvey Results – Intended Future Use for Driving Practice ................................................................................................ 40
10. Survey Results – Intended Future Use for Enjoyment ...................................................................................................... 40
11. Survey Results – Intended Future Use For Information on Driving Competence .............................................................. 41
12. Feedback on Mixed Reality Design ................................................................................................................................. 42
13. Sample Driving Test Results .......................................................................................................................................... 43
14. Survey Results – Ease of Interpretation of Driving Test Results ....................................................................................... 44
15. Survey Results – Perceived Usefulness of the Driving Simulator Results .......................................................................... 45
16. User Expectations vs Outcomes for the Driving Test Results ............................................................................................ 45
17. Rates of Simulator Sickness Amongst New Users in Final Release Phase ......................................................................... 46
18. Simulator Sickness Symptoms Experienced by Final Phase Participants ........................................................................... 46
19. Survey Results – Self Imposed Restrictions on Driving ..................................................................................................... 47
20. Survey Results – Reasons for Drivers to Case Driving in the Future ................................................................................. 49
21. Self-Reported Level of Satisfaction for Project Team ....................................................................................................... 50
22. Steering Committee’s Evaluation of Effective Delivery Against Intended Research Objectives .......................................... 51
23. Steering Committee’s Evaluation of the Effectiveness of Dissemination of Project Outcomes Across the Sector .............. 51
24. Steering Committee’s Evaluation of the Effectiveness of Technology Developed Through the Project .............................. 52
25. Steering Committee’s Evaluation of the Effectiveness of the Partnership Between McLean Care and Deakin University ..... 52
26. Steering Committee’s Evaluation of the Effectiveness of the Project Management Framework Used for the Project ........ 53
27. Self-Evaluation of the Steering Committee Model Used for the Project .......................................................................... 53
LIST OF FIGURES
8
Driving is key to independence for many older people and is considered essential for completing
daily tasks such as shopping, attending medical appointments and engaging in social or
community activities. This is especially true for those who reside in rural communities or other
areas where public and private transport options are limited.
However, research consistently highlights that accident risk increases for the older driver
population. Several factors are likely to contribute to this increased risk, including age-related
changes in sensory and perceptual processing, attention, and cognitive ability.
Driving cessation is associated with a number of negative outcomes. These include marked
declines in quality of life and general health, increases in clinically significant depression, reduced
social networks (regardless of the ability to use public transport) and premature entry to residential
aged care.
The question of how to support older people to maintain their driving competence; or to relinquish
their drivers licence based on an objective assessment of their ability is therefore an increasingly
pressing policy issue in many developed countries with ageing populations.
Through funding from the Australian Government’s Department of Health, this project aimed to
develop Australia’s first driving simulator specifically with, and for, older drivers.
In partnership with Deakin University, McLean Care created a fit-for-purpose mixed reality driving
simulator prototype that has been officially launched as “Hector VR”. Hector VR is mobile,
replicable and able to be accessed anywhere that is out of the weather and with access to power.
It combines the cut-down shell of a physical vehicle with a VR headset. A number of controls in
the physical car, including the steering wheel, brake, accelerator and indicators link to the controls
in the virtual vehicle. Users can select from three different driving scenarios, including a town-
driving scenario (modelled on the regional township of Inverell) and a country driving scenario
complete with hazards such as stock on the road and a kangaroo crossing the driver’s path
unexpectedly. Drivers receive a results summary that shows reaction speeds, and adherence to
common road rules (such as speed limits, giving way, and correct indicating).
The simulator was developed using an action research and co-design methodology in which
feedback at each stage was used to inform the development and successive improvement of
later iterations of the simulator across a three-phase model. A specially modified Technology
Acceptance Model tool was developed to help capture user attitudes towards and perceptions of
the simulator across the phases of its development.
More than 63 older people (aged 65+) were recruited to help develop the simulator. This
exceeded the original participant target by approximately 26%, highlighting the broad support
received from the local community throughout the development phases.
In addition to completing pre-and post- simulator driving questionnaires, participants also
responded to questions about their current and future driving behavior. These results indicated
that half of the older drivers in the research sample already place limits on their own driving,
predominantly by no longer driving at night or by limiting where they drive (e.g. high traffic areas
like Sydney). EXEC
UTI
VE S
UM
MA
RY

9
Focus group sessions were also held for the final development phase of the simulator. The
qualitative results were thematically analysed and used to supplement the quantitative data
collected throughout the project.
Project outcomes indicate positive end-user feedback and acceptance with more than 75% of
participants indicating they would use the driving simulator in the future if they wanted to know
more about their driving competence, 81% indicating the driving simulator is easy to use, 97%
indicating the results from the driving simulator are useful and 100% indicating the simulator
driving test results are easy to understand.
The project has already received various national and international awards and a range of
opportunities for future use of Hector VR are being explored.
10
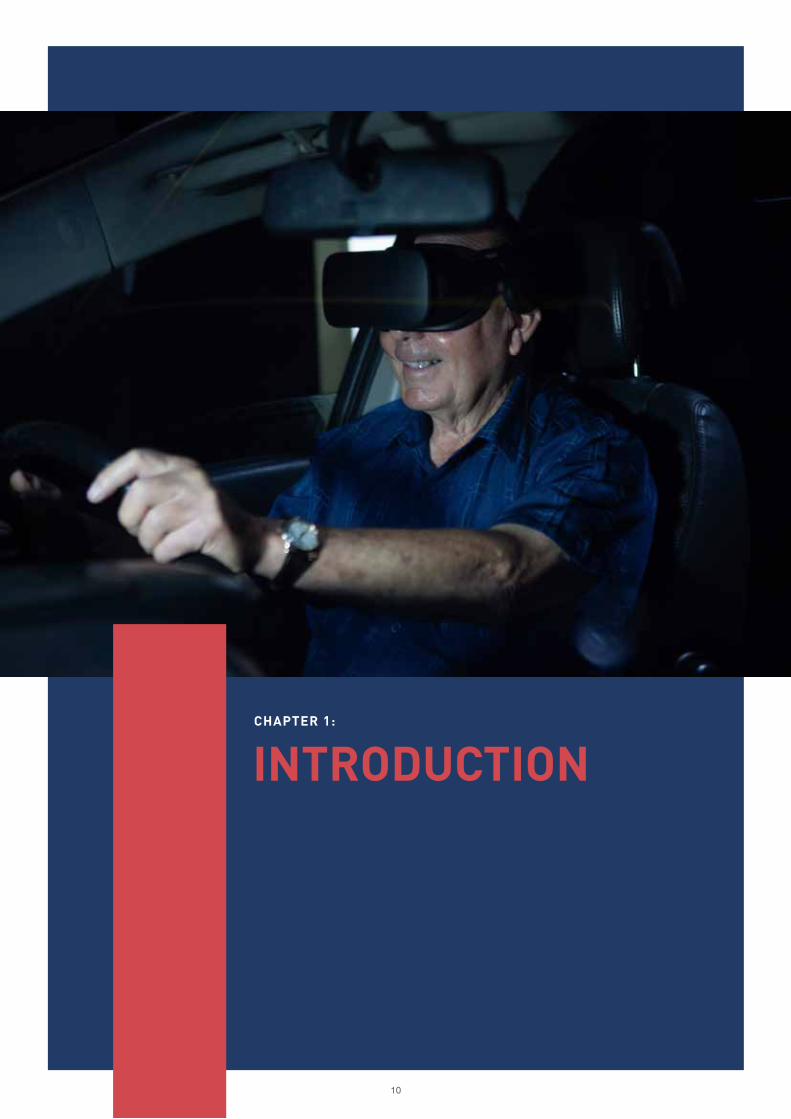
INTRODUCTIONCHAPTER 1:
11
As a specialist not-for-profit regional and rural aged care service provider, the team at McLean
Care were acutely aware of the significant impact of having a drivers licence on the quality of life
of older people in the geographically dispersed farming communities in which they operate in the
regional areas of north western NSW and south western Queensland.
Conversely, they were also aware that having to relinquish a drivers licence made older people
highly vulnerable, sometimes prompting otherwise unnecessary entry in to residential aged care.
This was particularly marked in rural areas without access to alternative transport options such as
buses, taxis or ubers.
The cost of undergoing mandatory driver training, and the stress experienced by many older
drivers caused by pressure from well-meaning family members about the perceived age-related
reduction in their driving competence was also recognized.
Having previously undertaken a successful small-scale trial using VR technology with a small group
of their residents, McLean Care recognized the potential for emerging technologies such as VR to
address some of the challenges of ageing in regional and rural communities.
The team put forward a concept of a VR driving simulator that could test older drivers against
the same competencies as a “real-life” driving test. The idea was to provide older drivers in the
community with access to objective information about their core driving abilities. In turn, it was
hoped that this would aid dignified decision making by older drivers about whether (and when) to
relinquish their licences; and help older people to maintain their independence in the community
for as long as it is safe to do so.
The project was one of only eight projects that received funding in a 2017 national grant round
through the federal Department of Health’s Dementia and Aged Care grants scheme.
As the project clearly required very specific VR subject matter expertise and designers capable
of building a driving simulator from the ground up, the McLean team examined a number of
potential university partners from around Australia.
Ultimately, the team from the CADET VR Laboratory in the School of Engineering at Deakin
University were selected as being the best fit. This research-industry partnership between the two
organisations proved to be critical to the overall success of the project.
An experienced project manager was also appointed to oversee the project and collectively, key
staff from McLean and Deakin established a Project Steering Committee to oversee the project.
The Steering Committee met on a regular basis to check progress against milestones and to
actively manage any emerging risks and issues.
Through the development and evaluation of the VR driving simulator, the project aimed to:
• Improve the driving competencies of elderly drivers in a low-risk and supported environment;
• Enable elderly drivers to safely and easily assess their driving competencies to help inform
decisions surrounding the relinquishing of a driver’s licence;
• Use the results of user evaluations to inform development refinements between successive
development stages of the VR driving simulator;
• Evaluate the efficacy of the VR driving simulator in achieving its aims.
Within a co-design framework, over 65 older people were involved in helping to test and review
the driving simulator across three development phases. Other stakeholders included local police
and ambulance staff, the local Council, Chamber of Commerce and local politicians were engaged
in the project. The project also received wide media coverage including print, online, radio and
TV. Since the completion of the prototype simulator, the team has won various national and
international awards for the project.INTR
OD
UCT
ION
12
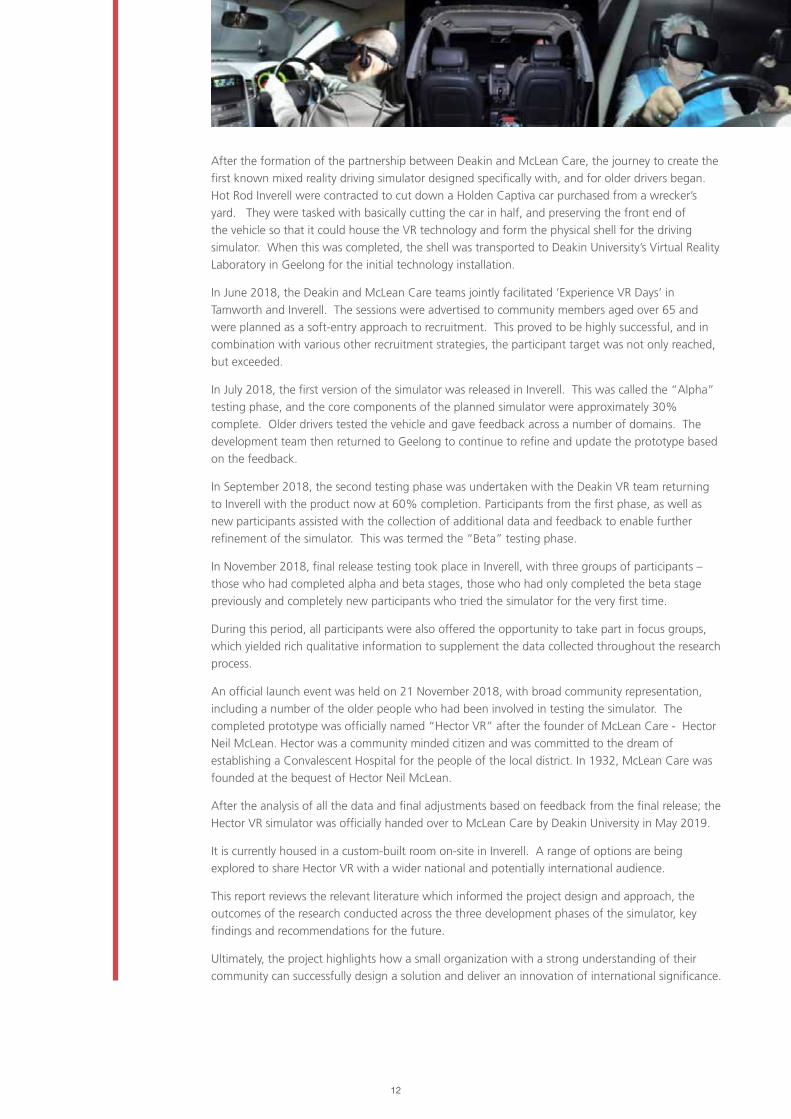
After the formation of the partnership between Deakin and McLean Care, the journey to create the
first known mixed reality driving simulator designed specifically with, and for older drivers began.
Hot Rod Inverell were contracted to cut down a Holden Captiva car purchased from a wrecker’s
yard. They were tasked with basically cutting the car in half, and preserving the front end of
the vehicle so that it could house the VR technology and form the physical shell for the driving
simulator. When this was completed, the shell was transported to Deakin University’s Virtual Reality
Laboratory in Geelong for the initial technology installation.
In June 2018, the Deakin and McLean Care teams jointly facilitated ‘Experience VR Days’ in
Tamworth and Inverell. The sessions were advertised to community members aged over 65 and
were planned as a soft-entry approach to recruitment. This proved to be highly successful, and in
combination with various other recruitment strategies, the participant target was not only reached,
but exceeded.
In July 2018, the first version of the simulator was released in Inverell. This was called the “Alpha”
testing phase, and the core components of the planned simulator were approximately 30%
complete. Older drivers tested the vehicle and gave feedback across a number of domains. The
development team then returned to Geelong to continue to refine and update the prototype based
on the feedback.
In September 2018, the second testing phase was undertaken with the Deakin VR team returning
to Inverell with the product now at 60% completion. Participants from the first phase, as well as
new participants assisted with the collection of additional data and feedback to enable further
refinement of the simulator. This was termed the “Beta” testing phase.
In November 2018, final release testing took place in Inverell, with three groups of participants –
those who had completed alpha and beta stages, those who had only completed the beta stage
previously and completely new participants who tried the simulator for the very first time.
During this period, all participants were also offered the opportunity to take part in focus groups,
which yielded rich qualitative information to supplement the data collected throughout the research
process.
An official launch event was held on 21 November 2018, with broad community representation,
including a number of the older people who had been involved in testing the simulator. The
completed prototype was officially named “Hector VR” after the founder of McLean Care - Hector
Neil McLean. Hector was a community minded citizen and was committed to the dream of
establishing a Convalescent Hospital for the people of the local district. In 1932, McLean Care was
founded at the bequest of Hector Neil McLean.
After the analysis of all the data and final adjustments based on feedback from the final release; the
Hector VR simulator was officially handed over to McLean Care by Deakin University in May 2019.
It is currently housed in a custom-built room on-site in Inverell. A range of options are being
explored to share Hector VR with a wider national and potentially international audience.
This report reviews the relevant literature which informed the project design and approach, the
outcomes of the research conducted across the three development phases of the simulator, key
findings and recommendations for the future.
Ultimately, the project highlights how a small organization with a strong understanding of their
community can successfully design a solution and deliver an innovation of international significance.

13
ResearchTimeline
September 2018Beta phase release and
evaluation
November 2018Final phase release
and evaluationFocus groups
February - April 2018Ethics and Project
Planning
June 2018VR experience days and participant recruitment
July 2018Alpha phase release and
evaluation
December 2017McLean Care and Deakin
University partnership established
February 2018Acquisition of vehicle
June 2019Final delivery of
simulator to custom built room at McLean Care
Process evaluation completed
21 November 2019Official launch of
Hector VR
December 2018 - March 2019Final modifications to
simulator by Deakin Uni
14
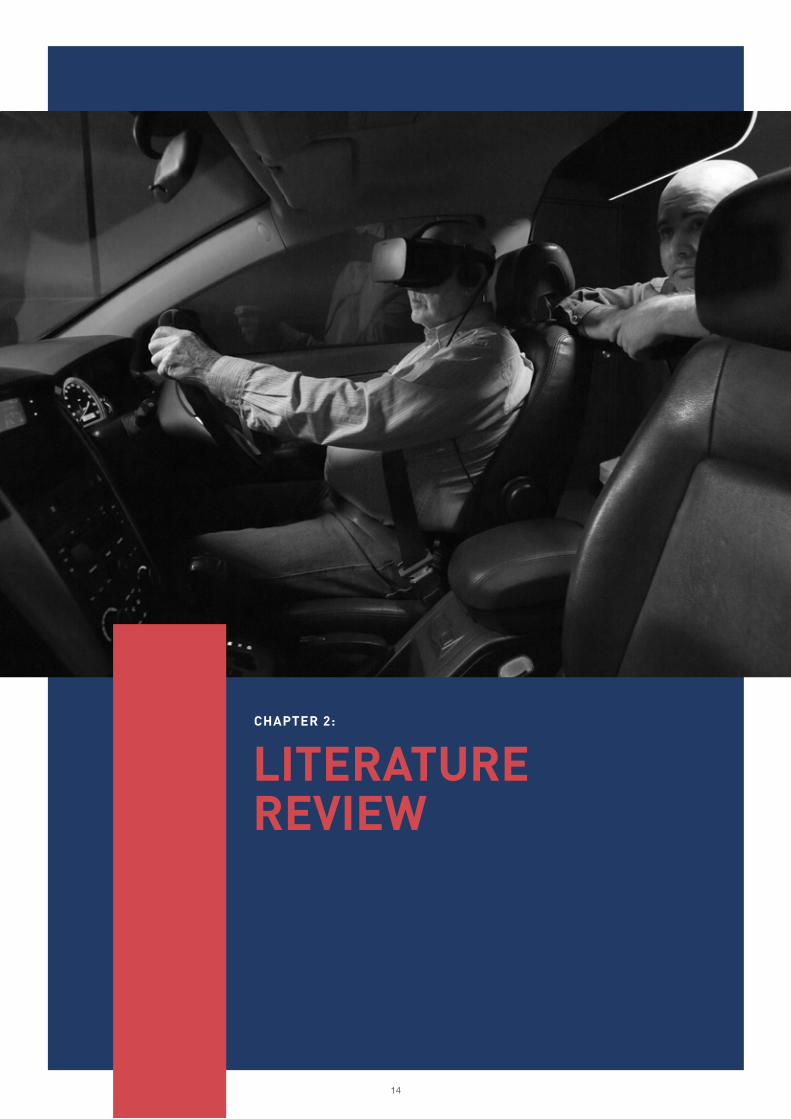
LITERATURE REVIEW
CHAPTER 2:
15
Driving, Independence and Age-Related Changes in Driving Competence
Profile of Accidents Involving Older Drivers
To many older people, driving is not only their primary form of transport, but also a symbol of independence, freedom and
self-reliance, enabling the exercise of choice and control (Whelan, Langford, Oxley, Koppel, and Charlton, 2006). Driving is
key to independent mobility for many older people and is considered essential for completing daily tasks such as shopping,
attending medical appointments and engaging in social or community activities. Webber, Porter and Menec (2010)
conceptualise mobility amongst the elderly as “the ability to move within community environments that expand from one’s
home, to the neighbourhood and to regions beyond.” They consider mobility for older people to be an essential attribute of
quality of life. This need for independent mobility can be especially marked for older people who reside in rural communities
or other areas where public and private transport options are limited.
Driving is a complex task which requires many interlinking cognitive, perceptual and physiological processes. Reductions in
physical and cognitive abilities is a natural part of the ageing process, and can negatively affect safety of driving in different
ways. There is therefore a need to strike a balance between continued independence of individual drivers and broader
considerations of general road safety. Research consistently highlights that accident risk increases for the older driver
population (Langford & Koppel, 2006). Several factors are likely to contribute to this increased risk, including age-related
changes in sensory and perceptual processing, attention, and cognitive ability (Ni, Kang and Andersen, 2010).
According to the Victorian Transport Accident Commission, drivers older than 75 years have the highest risk of losing their
lives in a motor vehicle crash in Victoria. Similarly, national data compiled by the Bureau of Transport, Infrastructure and
Regional Economics (2014) found that each year in Australia, 250 people aged 65 and over die from road crashes and
approximately 4,000 more are hospitalised. Many more near-misses or single vehicle accidents not resulting in hospitalisation
go unreported. According to the Bureau, there is also evidence of recent increasing annual trends in the rates of fatalities
and hospitalisations amongst this driver population, compared to a reduction in younger driver injury and death rates.
The types of fatal crashes involving older drivers also differ from fatal crashes involving other age groups. The aggregated
data for the decade 2004 – 2014 analysed by the Bureau of Transport, Infrastructure and Regional Economics (2014), for
instance, confirms earlier research findings that intersections are over-represented, as are multiple vehicle crashes. German
researchers have also found that there are typical situations that are more difficult for older drivers and more likely to result
in accidents. These are mainly giving right of way, turning, and driving backwards, particularly in difficult or unexpected
situations such as complex crossroads (Karthaus and Falkenstein, 2016). According to the UK Department of Transport
(2001), older drivers are involved in collisions that generally occur in daylight, at intersection and at low speeds. It is posited
that older drivers in particular have difficulty in making critical decisions under time pressure and dealing with immense traffic
conditions (Musselwhite and Haddad, 2010). Hence, many of their collisions occur when drivers become overloaded with
information when performing manoeuvres (Brendemuhl et al. 1988), merging onto roads (Schlag 1993), and older drivers are
over represented in at-fault collisions at junctions and intersections, especially those with no traffic control (e.g. traffic signals
and lights) and those that involve right-hand turns (in the UK—i.e. across the oncoming traffic) (Hakamies-Blomqvist 1988;
Preusser et al, 1998).
Similar trends regarding rates of older driver fatalities are noted across OECD countries (Bureau of Transport, Infrastructure
and Regional Economics (2014).
16
Impact of Driving Cessation on Older People
Older Drivers Adapting Their Driving Behaviour to Reflect Changing Abilities
Over the past fifty years, the number of Australians over the age of 65 has increased by 300% to 3.4 million, and those
over 85 years by 900% to almost half a million people (Australian Institute of Health and Welfare). The Australian Bureau
of Statistics (ABS) predicts that by 2064 there will be more than 9 million Australians aged over 65, and almost 2 million
Australians aged 85 or older. According to the World Health Organisation (WHO), the world’s population aged older than
60 years is estimated to grow to about two billion by the year 2050 (World Health Organisation and Alzheimer’s Disease
International 2012).
Forfeiture of driving privileges is considered a major loss by many older adults in terms of social identification, control
and independence. For many, it can result in an increase in depressive symptoms including clinically significant depression
(Marottoli, de Leon and Glass, 1997) and a decline in out of home activity levels, declining community access and connection
and a range of other negative outcomes. These include marked declines in quality of life and general health (Edwards,
Lunsman, Perkins, Rebok, & Roth, 2009), increases in clinically significant depression (Mezuk & Rebok, 2008), reduced social
networks (regardless of the ability to use public transport) (ibid) and premature entry to residential aged care (Edwards,
Perkins, Ross, & Reynolds, 2009).
The decision as to whether to retain or relinquish a driver’s license has a direct impact on the quality of life of older people
and, often, on their need to access aged care services, potentially resulting in premature access to residential aged care
services with associated increases in public health and care costs. A study with more than 1500 subjects showed that older
people who stopped driving a car for more than six months had a five-fold higher risk for permanent care than active drivers,
independent of confounding factors such as health state (Freeman, Gange, Munoz, and West, 2006).
The question of how to support older people to maintain their driving competence; or to relinquish their drivers licence based
on an objective assessment of their ability is therefore an increasingly pressing policy issue in many developed countries with
ageing populations.
There is some evidence that older drivers themselves adapt their driving behavior to reflect their changing abilities. A UK
study found that 100% of the older driver sample they interviewed adjusted their driving to reflect changing abilities. They
did this by either changing their behaviour (e.g. driving slower with increased gaps) or changing their travel behaviour (e.g.
not going out at night and not driving at busy times) (Musselwhite and Haddad, 2010). An Australian study with a sample
of 656 drivers aged 55 and older from urban areas, country towns and rural areas in the state of Victoria found that the
highest avoidance levels were seen for busy traffic, night driving and driving at night when wet. About one-quarter of the
participants reported avoiding these situations. More than half of drivers who avoided night driving or driving at night when
wet reported doing so because of vision-related issues, especially adjusting to glare from lights (Charlton, Oxley, Fildes, Oxley
& Newstead, 2003).
17
Effectiveness of Mandatory Testing of Older Drivers
Use of Driving Simulators for Research
A number of countries, including some jurisdictions in Australia, have introduced mandatory testing and / or screening
for older drivers above a certain age. However, the effectiveness of this approach has been questioned by a number of
researchers. Hakamies-Blomqvist, Johansson, and Lundberg (2016) compared the number of fatal accidents in Finland, which
requires drivers aged 70 and above to undergo medical tests to renew their driving license, and in Sweden, a country without
such tests. No advantage was found in the Finnish system concerning the reduction of accident rates.
Similarly, in another recent study, Siren and Meng (2012) compared the rate of fatal accidents in Denmark before and after
the introduction of a medical plus a short cognitive screening test for elderly drivers. Again, no reduction of accidents was
found in the period after test introduction. A study by Redelmeier, Yarnell, Deva Thiruchelva and Tibshirani (2012) showed
that physicians’ warnings to patients who are potentially unfit
to drive revealed a small reduction in hospital admissions for road accidents but also substantially increased the number
of admissions for depression. In addition, stopping driving leads to a decrease in outdoor activities, social interactions
and related cognitive simulation, which keep the elderly cognitively fit (Marottoli, de Leon, Glass, Williams, Cooney, and
Berkman, 2000).
According to Karthaus and Falkenstein (2016), blanket restrictions on driving for the elderly is therefore not a good solution
in terms of either traffic security or the health and wellbeing of older people. They propose that rather, measures should be
taken that find a trade-off between security and mobility to preserve driving within the older driver group.
Whilst there is well established longitudinal research in relation to older road users and road safety issues, there is more
limited research around measures that can be taken to increase, or at least maintain, older driver competency. The use of
emerging Virtual Reality (VR) technology has been identified as one potential means of supporting older drivers to make an
informed decision regarding their ongoing driving competence and potentially to practice driving in a virtual, low-risk and
supported environment (Karthaus and Falkenstein, 2016).
Driving simulators have been used in research to determine older driver competency in specific road conditions and driving
scenarios. For example, researchers Trick, Toxopeus and Wilson (2010) used driving simulators to investigate the driving
performance of older drivers when exposed to lack of road visibility (e.g. fog), traffic density, and navigational tasks. Frittelli
et al (2009) studied the effects of Alzheimer’s disease and mild cognitive impairment on driving performance using a
driving simulator.
The supportive advantages offered by the immersive interactive characteristics inherent to VR have been highlighted in
the literature as making VR an important tool for potentially improving the quality and efficacy of health care and social
support services needed by the world’s growing elderly population (Garcia-Betances, Jiminez-Mixco, Arredondo and Cabrera-
Umpierrez, 2014).
In recent years VR has gained from several technological advancements such as low-cost mobile computing, reduced latency
in data communication, a significant improvement in graphical rendering and real-time tracking systems. This has seen an
influx of low-cost commercially available VR hardware that is improving the level of user immersion over traditional methods
such as fixed 2D displays, keyboard, mice, joysticks and gamepads.

18
Driving simulators can provide a much safer environment when conducting driving research, education, and training. The
benefits of using a driving simulator include reproducible scenarios, a safe environment to explore hazardous situations, ease
of data collection, unique feedback (e.g., replaying scenarios), and standardization of results. According to Michaels et al
(2017) compared to on-road driving studies, the virtual environment of a driving simulator provides several advantages. Chief
among these is that participants’
reactions to potentially life-threatening driving situations can be evaluated in perfect safety. Driving simulators allow
researchers to reliably control, standardize and replicate specific driving events and conditions, such as route difficulty, traffic,
weather, in ways that are simply not possible with on-road study designs that use open (i.e. public roads) or closed roads
(specially designed closed circuits). Moreover, driving simulators allow researchers to collect and process a wealth of objective,
performance-based data in a relatively short time.
Karthaus and Falkenstein (2016) highlight that driving simulators allow the simulation and repetition of complex traffic
situations independent of daytime and weather. Moreover, they avoid risk to the drivers and other road users when
encountering difficult situations in real traffic. The high control over driving situations and tasks and the exclusion of
confounding variables enables a high degree of standardization between subjects and therefore allows for comparisons
between subjects and groups. They suggest that driving simulators are therefore a good compromise between laboratory
experiments, which are far from reality, and real driving, which is hard to control.
Several studies confirm the validity of driving simulator data to estimate driving behaviour in real traffic (Szlyk et al, 1995). In
particular, coping with complex situations in the simulator is related well to real driving performance in older drivers (Casutt,
Martin, Keller, and Jäncke, 2014).
Design Challenges of Driving Simulators: Simulator Sickness
Although driving simulators provide several advantages for research and for driver training purposes, they also have several
design challenges, including user discomfort during operation such as simulator sickness (De Winter, Van Leuween and
Happee, 2012). Older people in particular are more susceptible to simulator sickness than younger people (Brooks et al,
2010). Researchers have suggested this may be due to physiological reasons such as better eyesight amongst younger
drivers, or due to younger people being more likely to have previous exposure to technology (Reed, Parkes, Peacock, Lang
& Rehm, 2007). Others have suggested that symptoms related with older age, such as increased dizziness and problems
with balance, could be an explanation for the fact that age is associated with simulator sickness. (Brooks et al., 2010) Some
research has also indicated women are more susceptible than men (Matas, Nettelbeck, & Burns, 2015).
Simulator sickness has been described as a syndrome because of the breadth of its symptoms, including headache, sweating,
dry mouth, drowsiness, disorientation, vertigo, nausea, dizziness and vomiting (Brooks et al, 2010). The most widely accepted
theory explaining simulator sickness is the sensory conflict theory, which states that an incompatibility of different sensory
information, such as visual, auditory, and motion, occurs at the same time, causing the various physiological symptoms
(Jacobs et al, 2019). The symptoms are usually temporary and often decrease within one to two hours (Mullen, Weaver,
Riendeau, Morrison, & Bédard, 2010).
In a large Scottish experiment with over 700 participants, rates of simulator sickness experienced by participants completing
truck driving training using a driving simulator caused approximately 50% of participants to drop out of the study (Reed,
Parkes, Peacock, Lang and Rehm, 2007). A 2015 study of 88 older drivers (average age 73) using a desktop driving
simulator, reported that 59% of participants experienced simulator sickness that caused them to discontinue with the trial
(Matas, Nettelbeck & Burns, 2015). They found that older adults, females, and those with a prior history of motion sickness
may be especially at risk.
In a recent study by Jacobs et al (2019), 83 participants (including 84 with Huntington’s disease), drove in a driving simulator
that included urban and motorway scenarios. All participants were still active drivers. Thirty percent of their sample group
19
dropped out due to simulator sickness, which they found was positively correlated with older age and female gender but not
associated with cognitive functioning.
To reduce the risk of dropout, the authors recommend starting the simulator assessment with scenarios that are less visually
demanding (e.g., motorway scenarios and straight roads) before continuing to more complex and detailed scenarios
with curves and sudden stops (e.g., urban scenarios). This way, participants can become better adapted to the simulated
environment. They also suggested the configuration of detailed scenarios should be optimized, in particular the refresh rates
of the visual information on the screen.
Other authors have suggested that adaptation to the simulator before the actual driving test could reduce the dropout
due to simulator sickness. Such previous studies have shown that multiple exposures and more time between the practice
session and the actual driving simulator test can decrease the occurrence of simulator sickness (Domeyer, Cassavaugh, &
Backs, 2013).
Recent Advancements in VR Technology and Use in Driving Training
In recent years, advancements have been made in fully immersive stereoscopic systems, including VR, augmented reality
(AR), and MR solutions. Each provide benefits including improved depth cues and updated visuals based on user movement
(e.g., the natural viewing of an environment with head movements). These advancements are related to the increase in
research on the possible benefits of using VR head-mount displays (HMDs), such as Oculus Rift and HTC Vive, to improve
the level of immersion in existing driving simulators. VR Head Mounted Displays (HMDs) offer users the ability to view virtual
environments using natural head rotations and user tracking systems allow more natural interactions using gesture-based
controls such as simply pointing to areas of interest. The rapid introduction of VR hardware such as HMDs has seen a vast
change to human-computer interaction (HCI) in a range of fields such as architectural and Computer Aided Design (CAD),
education, entertainment and training.
Driving simulators are included in those applications reaping the benefits from the advances in VR hardware For example,
Likitweerawong and Palee (2018) investigated the benefits of using an Oculus Rift VR HMD to allow younger drivers to
practice driving skills before taking a driving test. Ali, Elnaggarz, Reichardtz and Abdennadher (2016) shows promising
results in using VR to help train users for good driving behaviors.
Several studies show positive effects of simulator training on driving competence in real traffic.
Roenker, Cissel, Ball, Wadley, and Edwards (2003) compared simulator training and functional training in older drivers. The
authors assessed driving performance before, directly after, and 18 months after the training both in a simulator and in real
traffic. The simulator training (but not the functional training) improved the behaviour of older drivers at left turns and traffic
lights. Research by Lavallière, Simoneau, Tremblay, Laurendeau, and Teasdale (2012) found improvements in real-life driving
when the simulator training was coupled with driving-specific feedback. In a recent study by Casutt, Theill, Martin, Keller
and Jäncke, L. (2014 B), older drivers were assigned either to simulator training, attention training, or a no-training control
group. Before the training phase, driving performance in real traffic and cognitive performance in traffic-related tests was
assessed for all participants. After 10 training sessions, both tests were administered again. Both training groups improved
their cognitive test performance compared to the control group, but only the group trained in the simulator showed an
improvement in real driving performance. The authors assume that the advantage of the simulator training is due to its more
realistic and dynamic structure, which facilitates transfer to real traffic situations, whereas functional training is more abstract
and removed from reality.
20
Application to Hector VR project
The Hector VR project built on this body of research to build a Mixed Reality driving simulator that was successively improved
over development phases, based on feedback from an older driver user group. A number of domains were examined in the
project, including the efficacy of the simulator for its intended purpose, user perceptions, design features that enhanced
the efficacy of the simulator, self-reported changes and adaptations in older driver behavior, rates of simulator sickness
experienced by participants, and perceived efficacy of drivers results summary for simulator users.

21
EVALUATION METHODOLOGY
CHAPTER 3:
22
Ethics Approval
Research questions
A full Human Research Ethics Application was submitted to the Deakin University Human Research Ethics
Committee (DUHREC) on 11 January 2018 (ID: BH00028).
The DUHREC is registered with the National Health and Medical Research Council and therefore works within
the guidelines of the National Statement on Ethical Conduct in Human Research 2007.
In the case of this project, Ethics Approval was required as the research examined a cohort of vulnerable
people, specifically the elderly. Particular consideration was given to the issue of informed consent and
ensuring any perception of a dependent relationship between aged care service recipients and staff from
McLean Care was appropriately managed.
The project gained ethics approval at the scheduled committee meeting on 8 March 2018.
The defined purpose of the research component of the Hector VR project was to understand:
• If participants find that using the simulator provides useful information about their driving competence;
• If participants find that this information about their driving competence is useful in informing future
decisions about driver licencing and possible relinquishment of licences;
• The level of user acceptance of the technology;
• To what extent the final developed simulator delivers against the intended design outcomes and the
feedback from users in the earlier release stages;
• Whether the process utilised to deliver the project is effective.
3.1
3.2
23
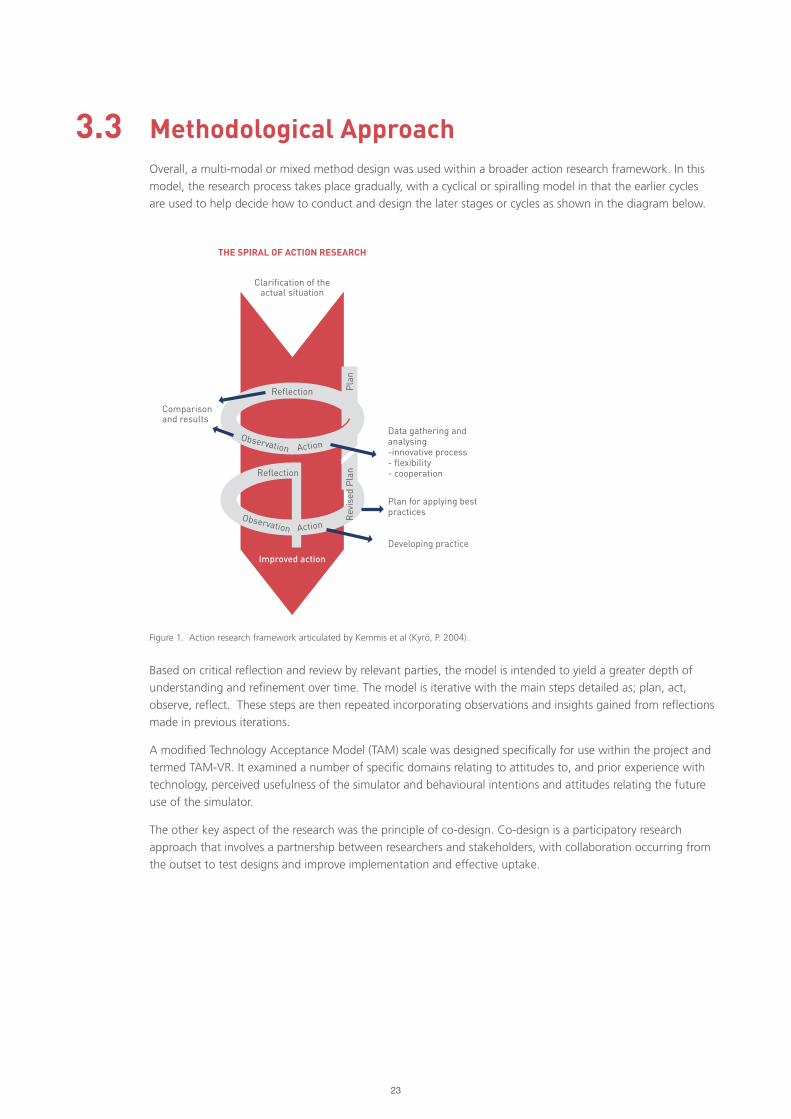
Methodological ApproachOverall, a multi-modal or mixed method design was used within a broader action research framework. In this
model, the research process takes place gradually, with a cyclical or spiralling model in that the earlier cycles
are used to help decide how to conduct and design the later stages or cycles as shown in the diagram below.
Based on critical reflection and review by relevant parties, the model is intended to yield a greater depth of
understanding and refinement over time. The model is iterative with the main steps detailed as; plan, act,
observe, reflect. These steps are then repeated incorporating observations and insights gained from reflections
made in previous iterations.
A modified Technology Acceptance Model (TAM) scale was designed specifically for use within the project and
termed TAM-VR. It examined a number of specific domains relating to attitudes to, and prior experience with
technology, perceived usefulness of the simulator and behavioural intentions and attitudes relating the future
use of the simulator.
The other key aspect of the research was the principle of co-design. Co-design is a participatory research
approach that involves a partnership between researchers and stakeholders, with collaboration occurring from
the outset to test designs and improve implementation and effective uptake.
Figure 1. Action research framework articulated by Kemmis et al (Kyrö, P. 2004).
3.3
Improved action
Clarification of the actual situation
THE SPIRAL OF ACTION RESEARCH
Pla
n
Reflection
Observation
Observation
Action
Action
Data gathering and analysing-innovative process- flexibility- cooperation
Plan for applying best practices
Developing practice
Comparison and results
Rev
ised
Pla
n
Reflection

24
Participant target group and recruitment strategiesA sample target of 50 older people was set for the project.
The inclusion criterion were:
• Adult men and women aged over 65;
• Who can give informed consent;
• Who have no physical or sensory impairment that would prevent them from accessing a non-modified
vehicle independently; and
• Who have no health conditions that would preclude them from holding an Australian driver’s license.
These criterion were designed to meet the requirements of the project and also to ensure that potential issues
with informed consent were appropriately managed. In particular, the research team identified that it would
be necessary to ensure that people with dementia or other cognitive impairments were not inadvertently
involved in the trial without giving informed consent.
In addition to the criterion specifically relating to informed consent, a further criterion of having no health
conditions that would preclude them from having an Australian drivers licence was also added. This was
designed to be a secondary means of ruling out participants impacted by dementia or other impairments that
would be screened through the Australian driver licencing system.
A range of targeted participant recruitment activities were undertaken, including advertising via:
• Local media (community radio and newspaper)
• McLean Care’s social media (Facebook posts)
• Flyers and posters at McLean Care’s residential aged care facility
• Invitations mailed to community care clients
• Liaison and invitations through local aged care networks to include other providers
A community “Try VR Morning for Older People” was hosted in Inverell and Tamworth and advertised through
both paid advertising and free community radio. Staff from the team at Deakin University attended the event
along with McLean Care staff and showcased different immersive VR experiences – such as virtual diving
and whale encounter experiences. After trying the VR technology, attendees were then invited to sign up
to participate in the research project. These community events were particularly effective in yielding high
response rates from interested research participants.
A rolling recruitment model was utilised to fit in with the 3 phase approach to development. The diagram
below summarises the planned recruitment numbers.
3.4
Figure 2. Plan of rolling participant recruitment model across alpha, beta and final release development phases.
25
Consent
Research Activities
Once a person expressed an interest in participating, they were provided with the Plain Language Statement
(PLS) and consent form (Appendix B) for consideration. If requested, assistance was offered by a member of
the research team to read through the document and/or to answer any questions. This was done by a member
of the research team and not a staff member of McLean Care in order to manage any potential ethical issues
relating to the perception of a “dependent relationship” between clients receiving services from McLean Care
which may impact on their ability to freely give consent to participate.
Where recruitment took place in a group-based environment, such as the “Try VR days”, the PLS was read
aloud to the group of participants after each person had been provided with a copy of the PLS and consent
form. An opportunity was then provided for participants to ask any questions or seek clarification on any
aspect of the project or research process.
It was anticipated that some participants would want to see the VR headset that would be used with the
simulator, so this was made available for potential participants to view and to handle prior to making their final
decision as to whether to participate.
Provision was made in advance for use of translators if required; although none were requested.
As the evaluation activities took place in three phases that were a couple of months apart, one of the key
researchers also verbally re-confirmed participant consent immediately prior to each use of the VR simulator by
the individual participant.
Participants were offered another copy of the PLS for their information and reminded that they could withdraw
from the project at any time without consequence or disadvantage.
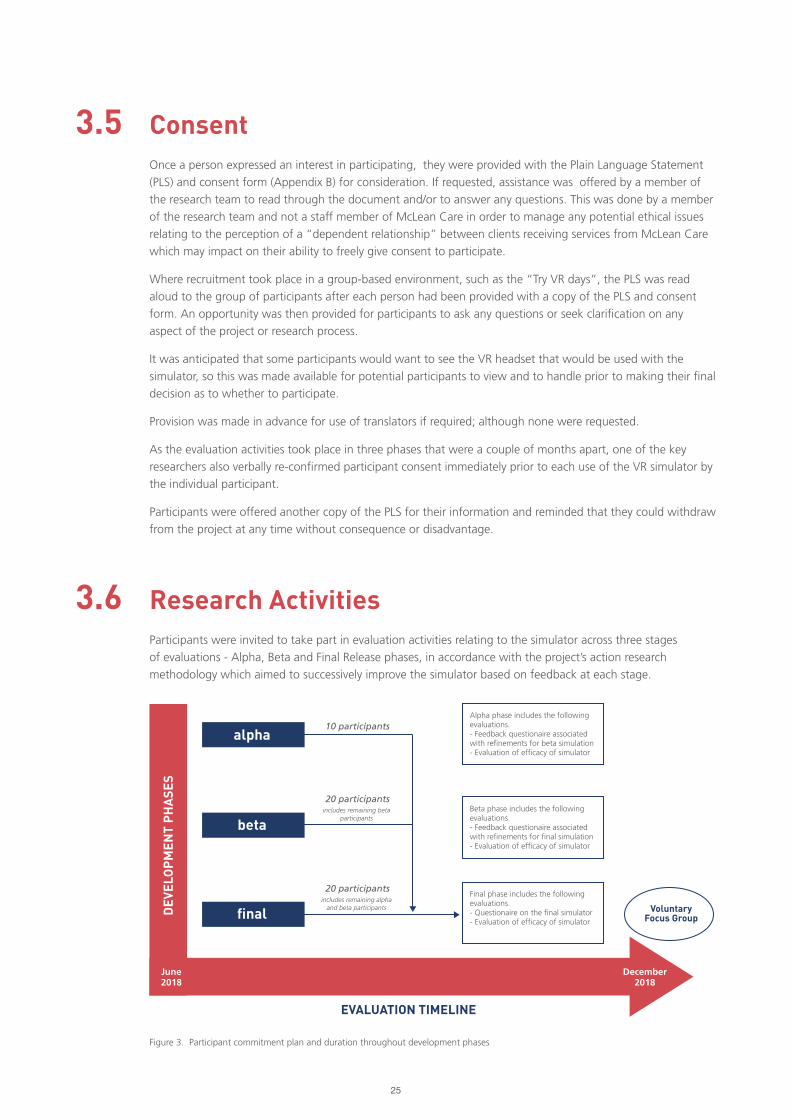
Participants were invited to take part in evaluation activities relating to the simulator across three stages
of evaluations - Alpha, Beta and Final Release phases, in accordance with the project’s action research
methodology which aimed to successively improve the simulator based on feedback at each stage.
3.5
3.6
Figure 3. Participant commitment plan and duration throughout development phases
December2018
June2018
DEV
ELO
PM
ENT
PH
ASE
S
EVALUATION TIMELINE
alpha
beta
final
10 participants
20 participants
20 participants
Alpha phase includes the following evaluations.- Feedback questionaire associated with refinements for beta simulation- Evaluation of efficacy of simulator
Beta phase includes the following evaluations.- Feedback questionaire associated with refinements for final simulation- Evaluation of efficacy of simulator
includes remaining beta participants
includes remaining alpha and beta participants
Final phase includes the following evaluations.- Questionaire on the final simulator- Evaluation of efficacy of simulator
VoluntaryFocus Group
26
Research Activities included:
• Questionnaires
• Focus Groups
• Individual Interviews
• Collection of data from the participant’s use of the simulator, including heart rate
The three participant groups were referred to as GRP1, GRP2, and GRP3. GRP1 participated in evaluation
activities for the Alpha, Beta and Final Release stages, GRP2 participated in evaluation activities for Beta and
Final Release stages and GRP3 participated in evaluation activities for the Final Release stage.
It is noted that given natural attrition, i.e. those who withdraw from participation, less than the full number of
participants predicted may have moved from one evaluation session to the next.
Involvement in the evaluation activities took approximately one and a half hours for each participant at each
evaluation phase. This means that participants in GRP1 engaged in activity for a duration of four and a half
hours across Alpha, Beta and Final Release phases. Participants from GPR2 engaged in activity for a duration
of three hours across Beta and Final Release phases and participants from GRP3 were engaged in activity for a
duration of one and a half hours for the Final Release stage.
The duration of one and a half hours per activity, was benchmarked on the standard Occupational Therapist
(OT) assessment time usually required for a driver competence assessment for elderly drivers and with due
consideration of participants’ age and comfort levels, with tea and coffee refreshments available.
In addition to the evaluation activities for each development phase, there was a final focus group conducted
which took approximately one hour. Participants from across the three groups attended. The focus group
allowed participants to provide feedback on the overall evaluation process.
As such, if a participant was involved in all three phases of the project, as well as the focus group, their total
time commitment was approximately five and a half hours (spread over at least three different dates).
No remuneration was offered for participation in the research.
Data Collection Strategies3.7.1 ACTION RESEARCH
User evaluations were undertaken across three development phases (alpha, beta and final release). The phased
development approach enabled feedback by participants to inform and guide subsequent development stages
in an interactive co-design process.
Each participant undertook at least one virtual driving experience, answered a series of driver behaviour
questions and completed pre- and post-surveys based on a modified Technology Acceptance Model 2 (TAM-2)
standardised evaluation tool (Vankatesh & Davis, 2000). Likert-scale questions were used to elicit feedback
on the level of user acceptance, ease-of-use and attitudinal information relating to future intention to use the
technology.
Performance and health metric data was collected as part of the evaluation when using the simulator. This
was collected through non-intrusive off the shelf measurement devices (such as a FitBit) and the simulator’s
software and captured automatically while using the VR driving simulator.
3.7
27
3.7.2 FOCUS GROUPS
Focus groups are a key tool in action research and provide a rich, interactive method of data collection. They
are particularly useful in the development phase of a product – offering researchers valuable feedback from the
target population which then informs the usability of a product.
A focus group is generally defined as a small group of participants, with an interviewer or moderator, asking
targeted questions about a specific topic. Both verbal and observational data is collected and is guided by the
purpose of the research study. The focus group moderator’s role is particularly important to the success of the
process. Robust facilitation skills are required to present an unbiased approach whilst also building rapport and
trust in the group, thus providing participants with permission to openly offer constructive or critical feedback.
Each members’ experiences, language and worldview contribute, and interact with each other – potentially
eliciting deep emotions, insights and motivations. Some would describe focus group research as being less
clinical and more about the real world.
Research has confirmed that focus groups can be useful for examining use of technology by elderly people
to assist “ageing in place.” A study by Peek et al (2016) confirmed that design approaches that prioritise the
needs and wishes of elderly participants during technology development is more likely to result in high rates of
acceptance and to yield actual benefits for older people.
In the Hector VR project, focus groups were held at the completion of testing to provide further detail and
to yield rich qualitative information to complement the quantitative data collection methods. A total of 24
participants took part in the focus groups (with an option of two different two hour time slots made available).
12 participated in each session.
The focus groups were facilitated by an experienced focus group facilitator and a series of 14 questions were
asked. The questions were structured into three primary themes:
Theme 1: Technology
1. What do you believe are the best features of Hector?
2. What do you think still needs to be improved on Hector?
3. Did you find having the VR combined with a real car enhanced your experience? If so, how?
4. Is there anything that could be done to make the driving experience more comfortable?
5. What other road rules / driving competencies or scenarios do you think we should incorporate for testing?
Theme 2: Process
1. What did you enjoy about being involved in this project?
2. What words would you use to describe the way the research was managed / your interactions with
the team?
3. What are your reflections on the time you were asked to give to be involved?
4. Did you feel that the project was clearly explained to you? What was done well? What could be improved?
Theme 3: “Big Picture”
5. In your experience, do you find that most older drivers self-moderate their driving? How?
6. Why is keeping your licence important to you?
7. How do you think it would impact you if you didn’t have your licence?
8. What are the main reasons you would use a driving simulator like Hector?
9. What do you think we should do with Hector next?
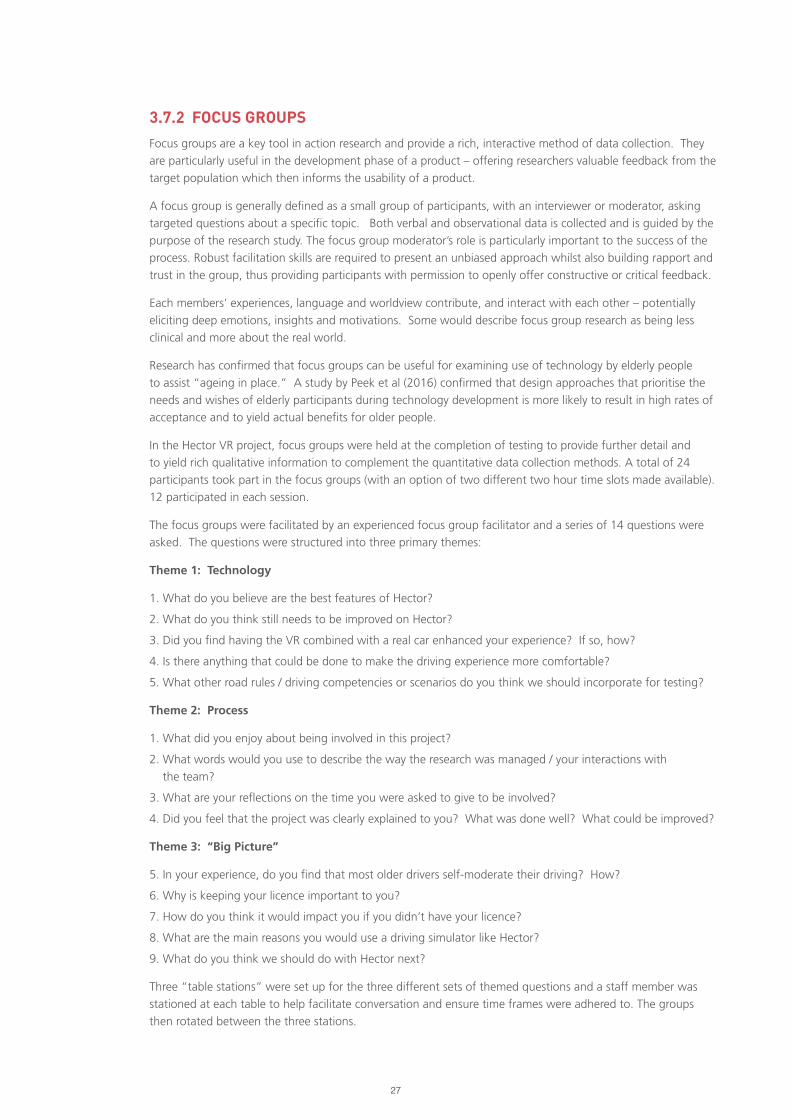
Three “table stations” were set up for the three different sets of themed questions and a staff member was
stationed at each table to help facilitate conversation and ensure time frames were adhered to. The groups
then rotated between the three stations.
28
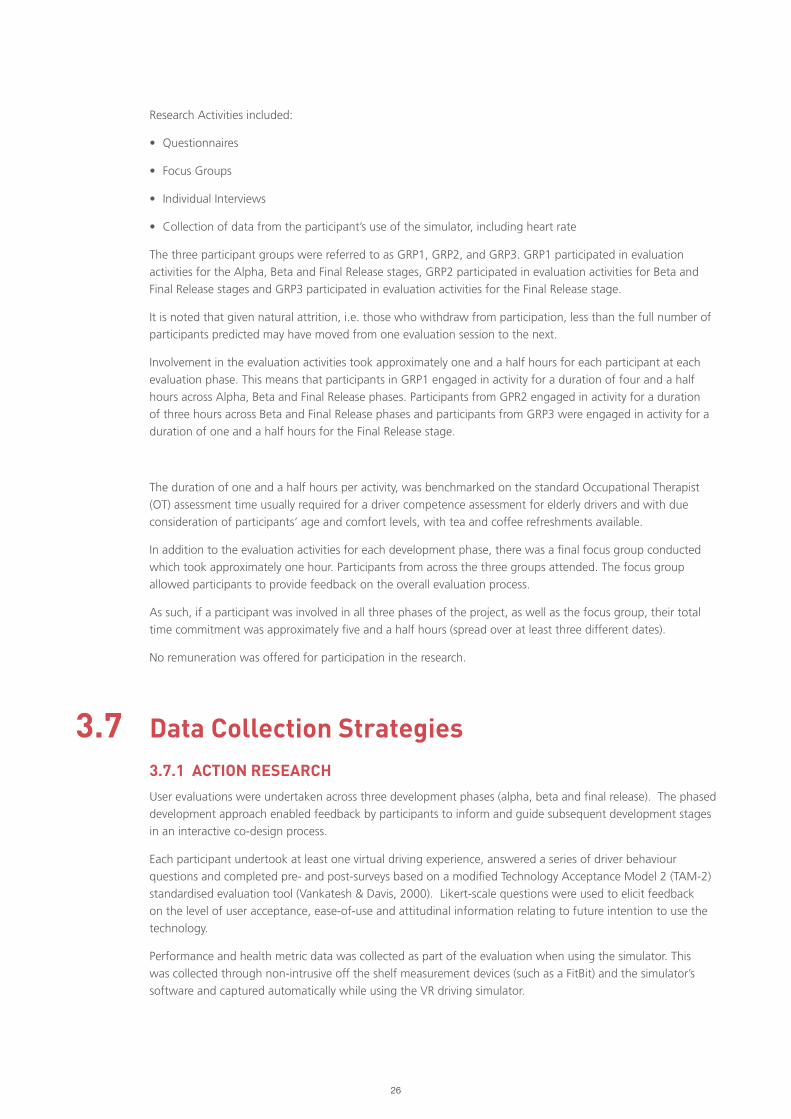
At the end, each individual participant was given 10 coloured stickers that they used to “vote” on the
discussion points that they thought were the most important or relevant to them individually.
The responses were then converted to an electronic format and thematically analysed for identification of
key results.
29

30
Hector VR Focus Groups in Action
31
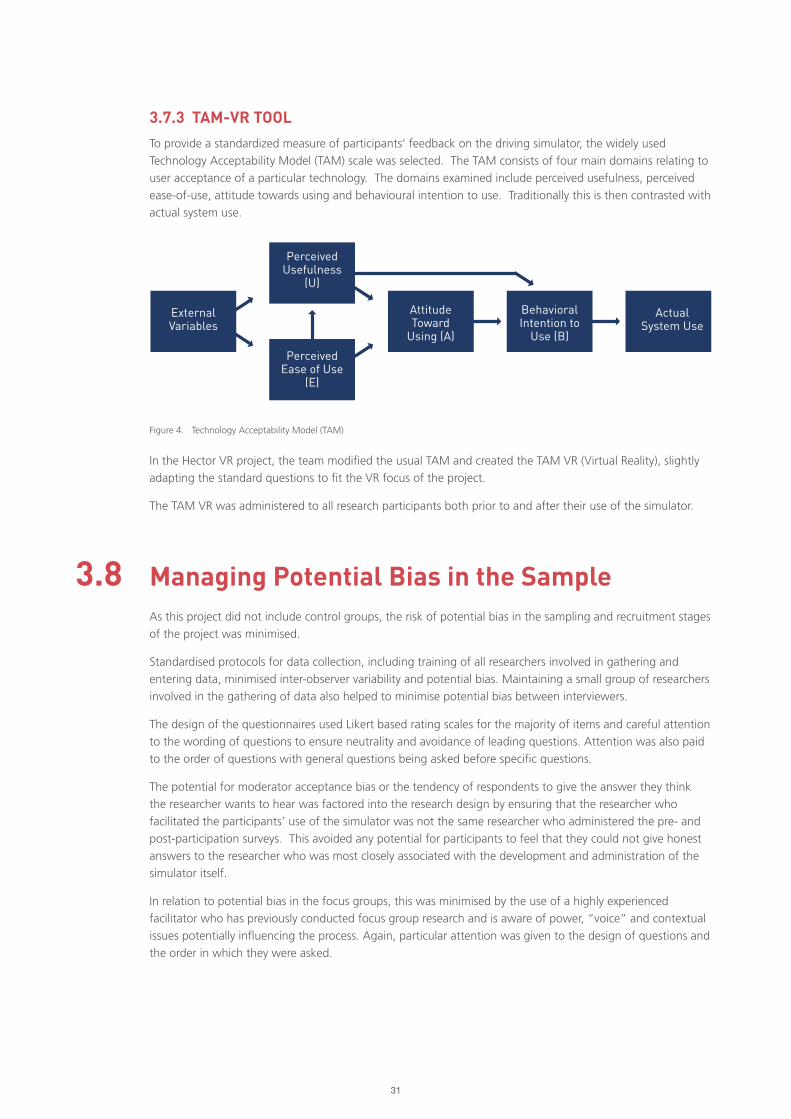
3.7.3 TAM-VR TOOL
To provide a standardized measure of participants’ feedback on the driving simulator, the widely used
Technology Acceptability Model (TAM) scale was selected. The TAM consists of four main domains relating to
user acceptance of a particular technology. The domains examined include perceived usefulness, perceived
ease-of-use, attitude towards using and behavioural intention to use. Traditionally this is then contrasted with
actual system use.
In the Hector VR project, the team modified the usual TAM and created the TAM VR (Virtual Reality), slightly
adapting the standard questions to fit the VR focus of the project.
The TAM VR was administered to all research participants both prior to and after their use of the simulator.
Figure 4. Technology Acceptability Model (TAM)
Managing Potential Bias in the SampleAs this project did not include control groups, the risk of potential bias in the sampling and recruitment stages
of the project was minimised.
Standardised protocols for data collection, including training of all researchers involved in gathering and
entering data, minimised inter-observer variability and potential bias. Maintaining a small group of researchers
involved in the gathering of data also helped to minimise potential bias between interviewers.
The design of the questionnaires used Likert based rating scales for the majority of items and careful attention
to the wording of questions to ensure neutrality and avoidance of leading questions. Attention was also paid
to the order of questions with general questions being asked before specific questions.
The potential for moderator acceptance bias or the tendency of respondents to give the answer they think
the researcher wants to hear was factored into the research design by ensuring that the researcher who
facilitated the participants’ use of the simulator was not the same researcher who administered the pre- and
post-participation surveys. This avoided any potential for participants to feel that they could not give honest
answers to the researcher who was most closely associated with the development and administration of the
simulator itself.
In relation to potential bias in the focus groups, this was minimised by the use of a highly experienced
facilitator who has previously conducted focus group research and is aware of power, “voice” and contextual
issues potentially influencing the process. Again, particular attention was given to the design of questions and
the order in which they were asked.
3.8
ExternalVariables
PerceivedUsefulness
(U)
PerceivedEase of Use
(E)
AttitudeToward
Using (A)
BehavioralIntention to
Use (B)
ActualSystem Use
32
Data ManagementData management strategies were implemented in line with the strategy approved as part of the Ethics
application.
Paper-based data obtained from questionnaires, focus groups and individual participant interviews was
digitised (scanned) and securely stored using Deakin approved Syncplicity cloud storage. Paper- based data
was then disposed of using a security bin where the documents are then destroyed using a secure document
destruction service.
Electronic data captured during the relevant evaluation activities from measurement devices on the simulator
will be first acquired and stored on the local system capturing the data. The electronic data will then be
transferred to the Syncplicity cloud storage system and deleted from the device it was originally stored on.
Only members of the project/research team listed herein will have access to the Syncplicity cloud storage
project repository. Data will be retained for the minimum requirement of 5 years as outlined in Deakin’s
Research Conduct Policy.
Only the research team have access to the information through a password protection protocol.
3.9
Limitations of the EvaluationIt is possible that some confounding factors may have impacted the outcomes of the evaluation. For instance,
reported attitudes to and perceptions of the user acceptance of the technology being utilised in the project
may have been influenced by external factors such as additional exposure to new technology external to
the project itself. As much as possible, the influence of external confounding factors was factored in to the
research design and identified in the open-ended questions included in the questionnaires.
3.10

33
RESULTSCHAPTER 4:
34
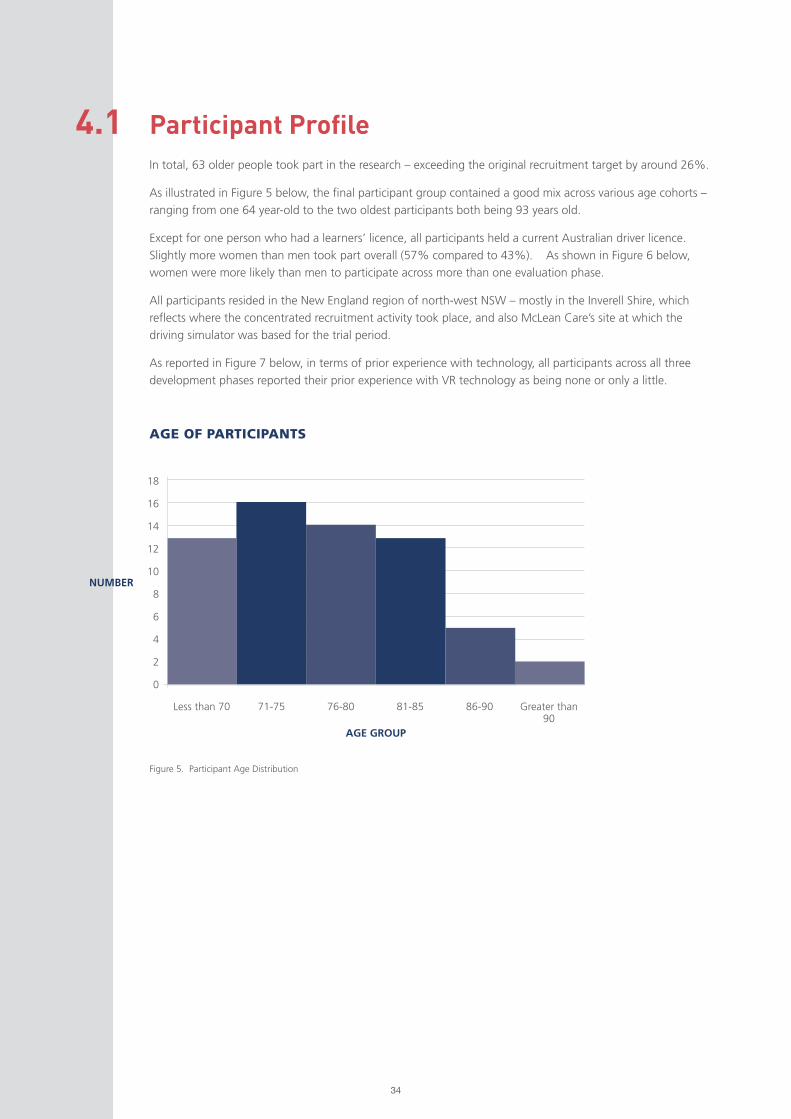
Participant ProfileIn total, 63 older people took part in the research – exceeding the original recruitment target by around 26%.
As illustrated in Figure 5 below, the final participant group contained a good mix across various age cohorts –
ranging from one 64 year-old to the two oldest participants both being 93 years old.
Except for one person who had a learners’ licence, all participants held a current Australian driver licence.
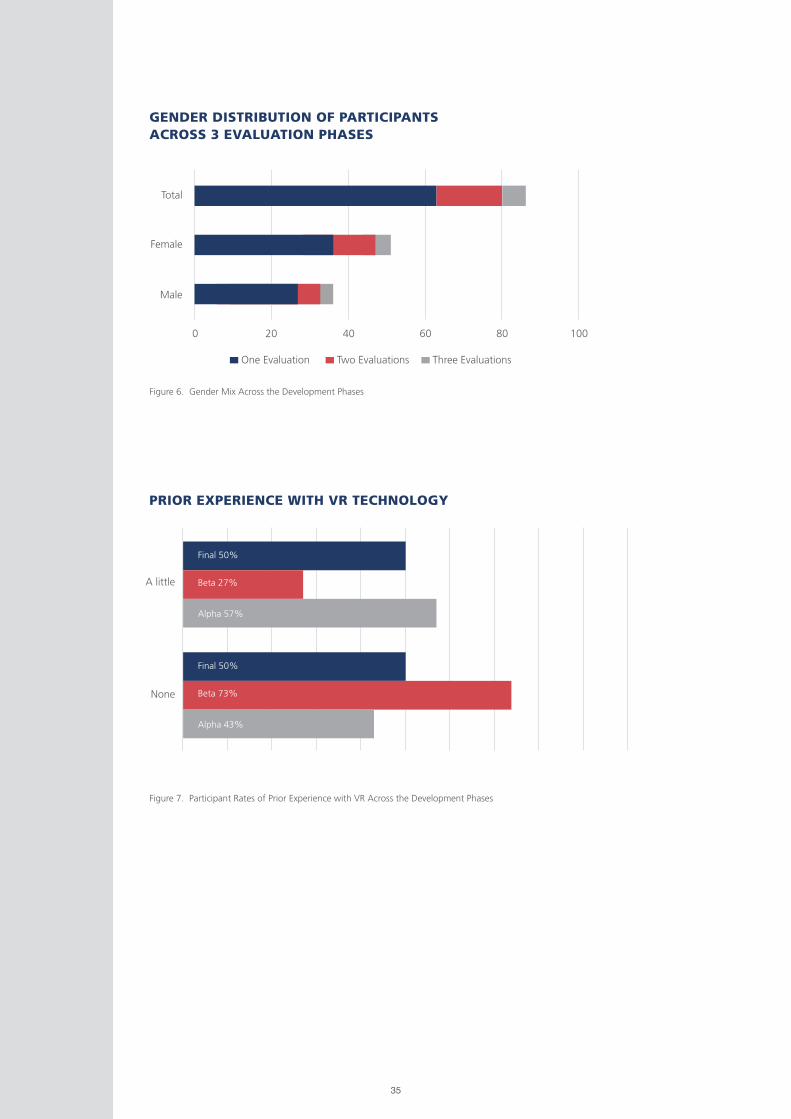
Slightly more women than men took part overall (57% compared to 43%). As shown in Figure 6 below,
women were more likely than men to participate across more than one evaluation phase.
All participants resided in the New England region of north-west NSW – mostly in the Inverell Shire, which
reflects where the concentrated recruitment activity took place, and also McLean Care’s site at which the
driving simulator was based for the trial period.
As reported in Figure 7 below, in terms of prior experience with technology, all participants across all three
development phases reported their prior experience with VR technology as being none or only a little.
4.1
Figure 5. Participant Age Distribution
18
16
14
12
10
8
6
4
2
0
71-75 76-80 81-85 86-90 Greater than 90
AGE OF PARTICIPANTS
NUMBER
AGE GROUP
Less than 70
35
Figure 6. Gender Mix Across the Development Phases
Figure 7. Participant Rates of Prior Experience with VR Across the Development Phases
GENDER DISTRIBUTION OF PARTICIPANTS ACROSS 3 EVALUATION PHASES
PRIOR EXPERIENCE WITH VR TECHNOLOGY
0
Male
Female
Total
20
One Evaluation Two Evaluations Three Evaluations
40 60 80 100
A little
Final 50%
Final 50%
Beta 27%
Beta 73%
Alpha 57%
Alpha 43%
None
36
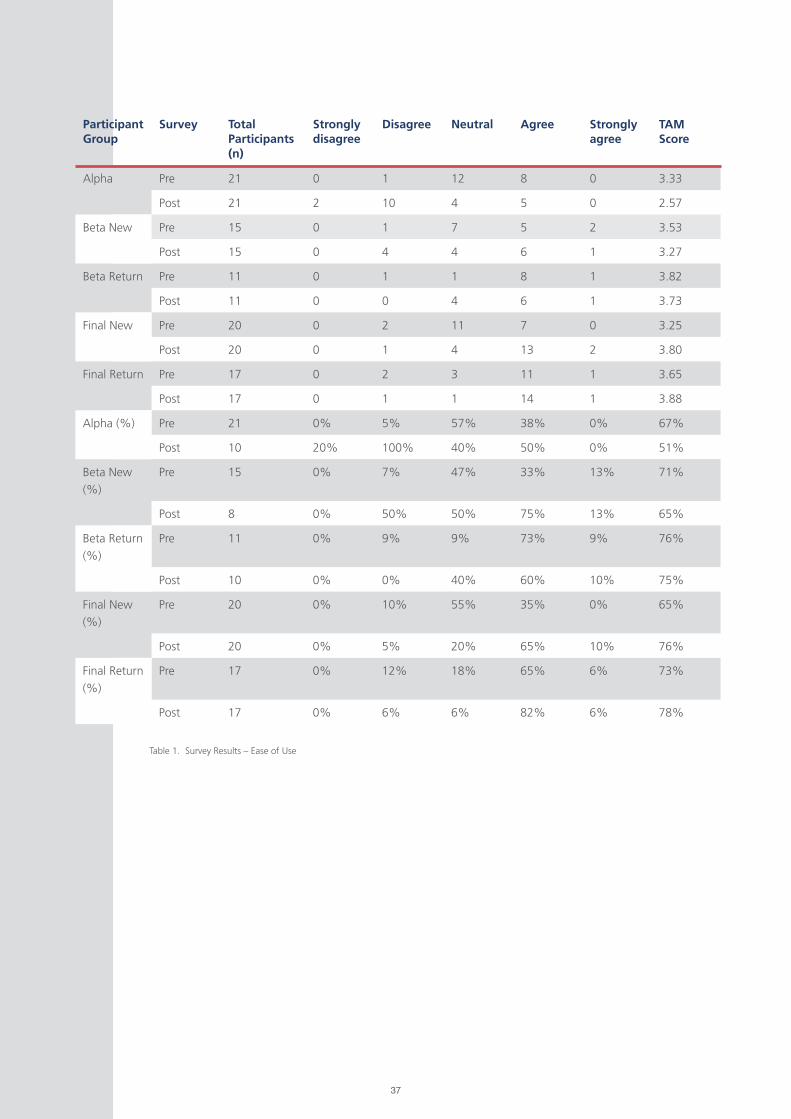
Project Outcomes 4.2.1 TAM VR RESULTS
The TAM VR questionnaire tool was administered to all participants prior to and, and after their use of the
simulator. Participants who took part in two or three phases repeated the TAM VR questions in each phase.
EASE OF USE
In the pre-participation questionnaire, participants were asked to indicate their level of agreement with the
statement ‘I expect the simulator will be easy to use’. In the post-participation questionnaire, participants
were then asked to indicate their level of agreement with the statement ‘The simulator is easy to use.’ Both
questions used a likert five point response scale.
As detailed further in Table 1 below, with the exception of the cohort of participants who participated in both
the Alpha and Beta phase evaluations, all other participants reported that the ease of use of the simulator
exceeded their expectations. This was based on a comparative measure between their pre-use responses and
their post-use responses.
Further, there is a trend evident across the three development phases of improved ratings of usability by
participants. By the final release stage, only 35% of new participants (with no prior exposure to the simulator),
agreed or strongly agreed that they expected the simulator would be easy to use. In comparison, after their
use of the simulator, 75% agreed or strongly agreed that the simulator had been easy to use. This means their
expectations were more than doubly exceeded.
Similarly, in the final phase of evaluations, 71% of returning participants agreed or strongly agreed that
they expected the simulator would be easy to use. After they had used it, this rate had increased to 88%,
indicating a very high usability rate for the final release prototype.
4.2
37
Participant Group
Survey Total Participants(n)
Strongly disagree
Disagree Neutral Agree Strongly agree
TAM Score
Alpha Pre 21 0 1 12 8 0 3.33
Post 21 2 10 4 5 0 2.57
Beta New Pre 15 0 1 7 5 2 3.53
Post 15 0 4 4 6 1 3.27
Beta Return Pre 11 0 1 1 8 1 3.82
Post 11 0 0 4 6 1 3.73
Final New Pre 20 0 2 11 7 0 3.25
Post 20 0 1 4 13 2 3.80
Final Return Pre 17 0 2 3 11 1 3.65
Post 17 0 1 1 14 1 3.88
Alpha (%) Pre 21 0% 5% 57% 38% 0% 67%
Post 10 20% 100% 40% 50% 0% 51%
Beta New
(%)
Pre 15 0% 7% 47% 33% 13% 71%
Post 8 0% 50% 50% 75% 13% 65%
Beta Return
(%)
Pre 11 0% 9% 9% 73% 9% 76%
Post 10 0% 0% 40% 60% 10% 75%
Final New
(%)
Pre 20 0% 10% 55% 35% 0% 65%
Post 20 0% 5% 20% 65% 10% 76%
Final Return
(%)
Pre 17 0% 12% 18% 65% 6% 73%
Post 17 0% 6% 6% 82% 6% 78%
Table 1. Survey Results – Ease of Use
38
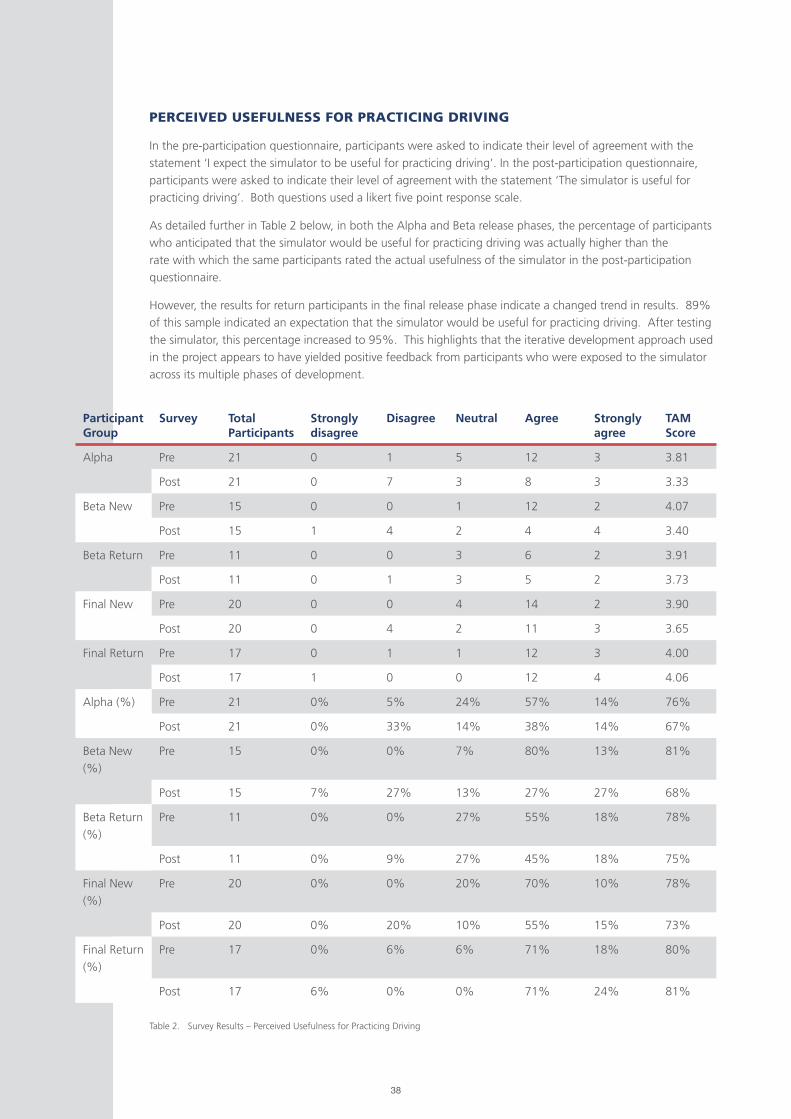
PERCEIVED USEFULNESS FOR PRACTICING DRIVING
In the pre-participation questionnaire, participants were asked to indicate their level of agreement with the
statement ‘I expect the simulator to be useful for practicing driving’. In the post-participation questionnaire,
participants were asked to indicate their level of agreement with the statement ‘The simulator is useful for
practicing driving’. Both questions used a likert five point response scale.
As detailed further in Table 2 below, in both the Alpha and Beta release phases, the percentage of participants
who anticipated that the simulator would be useful for practicing driving was actually higher than the
rate with which the same participants rated the actual usefulness of the simulator in the post-participation
questionnaire.
However, the results for return participants in the final release phase indicate a changed trend in results. 89%
of this sample indicated an expectation that the simulator would be useful for practicing driving. After testing
the simulator, this percentage increased to 95%. This highlights that the iterative development approach used
in the project appears to have yielded positive feedback from participants who were exposed to the simulator
across its multiple phases of development.
Participant Group
Survey Total Participants
Strongly disagree
Disagree Neutral Agree Strongly agree
TAM Score
Alpha Pre 21 0 1 5 12 3 3.81
Post 21 0 7 3 8 3 3.33
Beta New Pre 15 0 0 1 12 2 4.07
Post 15 1 4 2 4 4 3.40
Beta Return Pre 11 0 0 3 6 2 3.91
Post 11 0 1 3 5 2 3.73
Final New Pre 20 0 0 4 14 2 3.90
Post 20 0 4 2 11 3 3.65
Final Return Pre 17 0 1 1 12 3 4.00
Post 17 1 0 0 12 4 4.06
Alpha (%) Pre 21 0% 5% 24% 57% 14% 76%
Post 21 0% 33% 14% 38% 14% 67%
Beta New
(%)
Pre 15 0% 0% 7% 80% 13% 81%
Post 15 7% 27% 13% 27% 27% 68%
Beta Return
(%)
Pre 11 0% 0% 27% 55% 18% 78%
Post 11 0% 9% 27% 45% 18% 75%
Final New
(%)
Pre 20 0% 0% 20% 70% 10% 78%
Post 20 0% 20% 10% 55% 15% 73%
Final Return
(%)
Pre 17 0% 6% 6% 71% 18% 80%
Post 17 6% 0% 0% 71% 24% 81%
Table 2. Survey Results – Perceived Usefulness for Practicing Driving

39
Figure 8. Survey Results – Attitude towards use of simulator for enjoyment
USE OF THE SIMULATOR FOR ENJOYMENTIn the pre-participation questionnaire, participants were asked to indicate their level of agreement with the
statement ‘I expect using the driving simulator will be enjoyable’. In the post-participation questionnaire,
participants were asked to indicate their level of acceptance with the statement ‘I enjoyed using the driving
simulator’. Both questions used a likert five point response scale.
As detailed further in Figure 8 below, in the alpha and beta release phases, across both new and returning
participants, their pre-use expectations of enjoyment when using the simulator were below their actual
reported rates of enjoyment post-use, indicating their expectations were not meet.
It is expected that this result is largely attributable to the high rates of simulator sickness experienced by the
majority of users during these release phases. This result is explored further in the discussion of key findings.
However, by the final release of the prototype, new participants (with no prior exposure to the simulator)
anticipated and actual levels of enjoyment when using the simulator were met. Returning participants in the
final stage who had used the simulator before actually had their expectations regarding enjoyment exceeded.
This highlights that through the iterative development process of successively improving the simulator based
on user feedback in each trial, the final product reached a point of meeting user expectations in relation to
enjoyment. Again, this may also reflect reduced rates of reported simulator sickness amongst participants in
the final release stage.
EXPECTATIONS AND EXPERIENCES OF ENJOYMENT RELATING TO THE SIMULATOR
Fina
lRe
turn
Fina
lN
ewBe
taRe
turn
Beta
New
Alp
ha
Post
Post
Post
Post
Post
Pre
Pre
Pre
Pre
Pre
1 2 3 4 5
1 - Strongly disagree, 2 - Disagree, 3 - Neutral, 4 - Agree, 5 - Strongly disagree Response to the pre-participation question “I expect using the driving simulator will be enjoyable.”
Response to the post-participation question “I enjoyed using the driving simulator.”
40
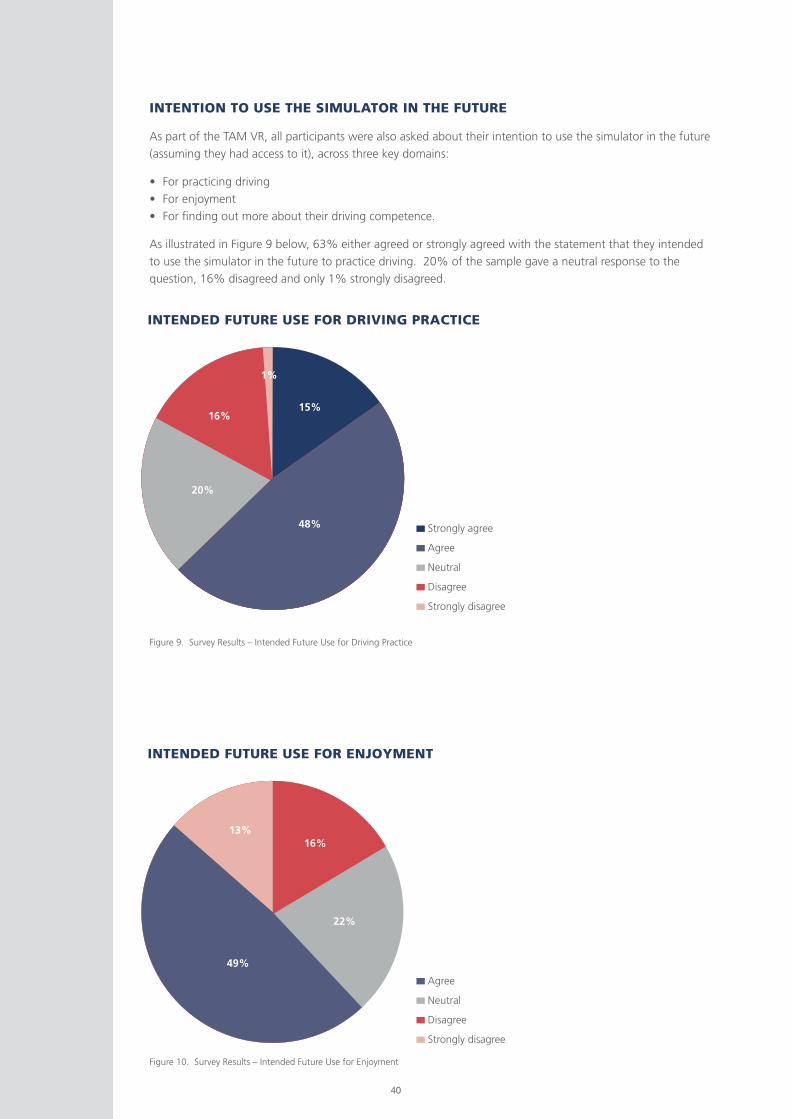
INTENTION TO USE THE SIMULATOR IN THE FUTURE
As part of the TAM VR, all participants were also asked about their intention to use the simulator in the future
(assuming they had access to it), across three key domains:
• For practicing driving
• For enjoyment
• For finding out more about their driving competence.
As illustrated in Figure 9 below, 63% either agreed or strongly agreed with the statement that they intended
to use the simulator in the future to practice driving. 20% of the sample gave a neutral response to the
question, 16% disagreed and only 1% strongly disagreed.
Figure 9. Survey Results – Intended Future Use for Driving Practice
Figure 10. Survey Results – Intended Future Use for Enjoyment
INTENDED FUTURE USE FOR DRIVING PRACTICE
INTENDED FUTURE USE FOR ENJOYMENT
15%
48%
49%
22%
16%13%
20%
16%
1%
Strongly agree
Agree
Neutral
Disagree
Strongly disagree
Agree
Neutral
Disagree
Strongly disagree
41
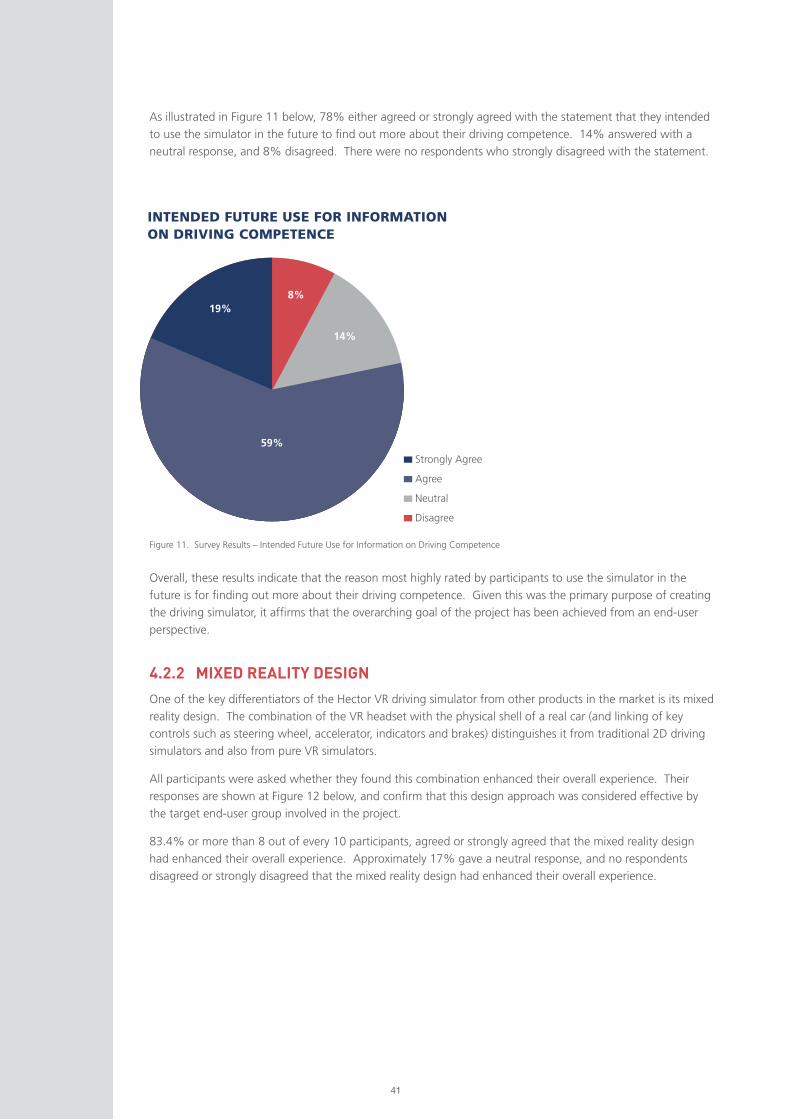
As illustrated in Figure 11 below, 78% either agreed or strongly agreed with the statement that they intended
to use the simulator in the future to find out more about their driving competence. 14% answered with a
neutral response, and 8% disagreed. There were no respondents who strongly disagreed with the statement.
Figure 11. Survey Results – Intended Future Use for Information on Driving Competence
INTENDED FUTURE USE FOR INFORMATION ON DRIVING COMPETENCE
4.2.2 MIXED REALITY DESIGN
One of the key differentiators of the Hector VR driving simulator from other products in the market is its mixed
reality design. The combination of the VR headset with the physical shell of a real car (and linking of key
controls such as steering wheel, accelerator, indicators and brakes) distinguishes it from traditional 2D driving
simulators and also from pure VR simulators.
All participants were asked whether they found this combination enhanced their overall experience. Their
responses are shown at Figure 12 below, and confirm that this design approach was considered effective by
the target end-user group involved in the project.
83.4% or more than 8 out of every 10 participants, agreed or strongly agreed that the mixed reality design
had enhanced their overall experience. Approximately 17% gave a neutral response, and no respondents
disagreed or strongly disagreed that the mixed reality design had enhanced their overall experience.
Overall, these results indicate that the reason most highly rated by participants to use the simulator in the
future is for finding out more about their driving competence. Given this was the primary purpose of creating
the driving simulator, it affirms that the overarching goal of the project has been achieved from an end-user
perspective.
Strongly Agree
Agree
Neutral
Disagree
59%
19%8%
14%
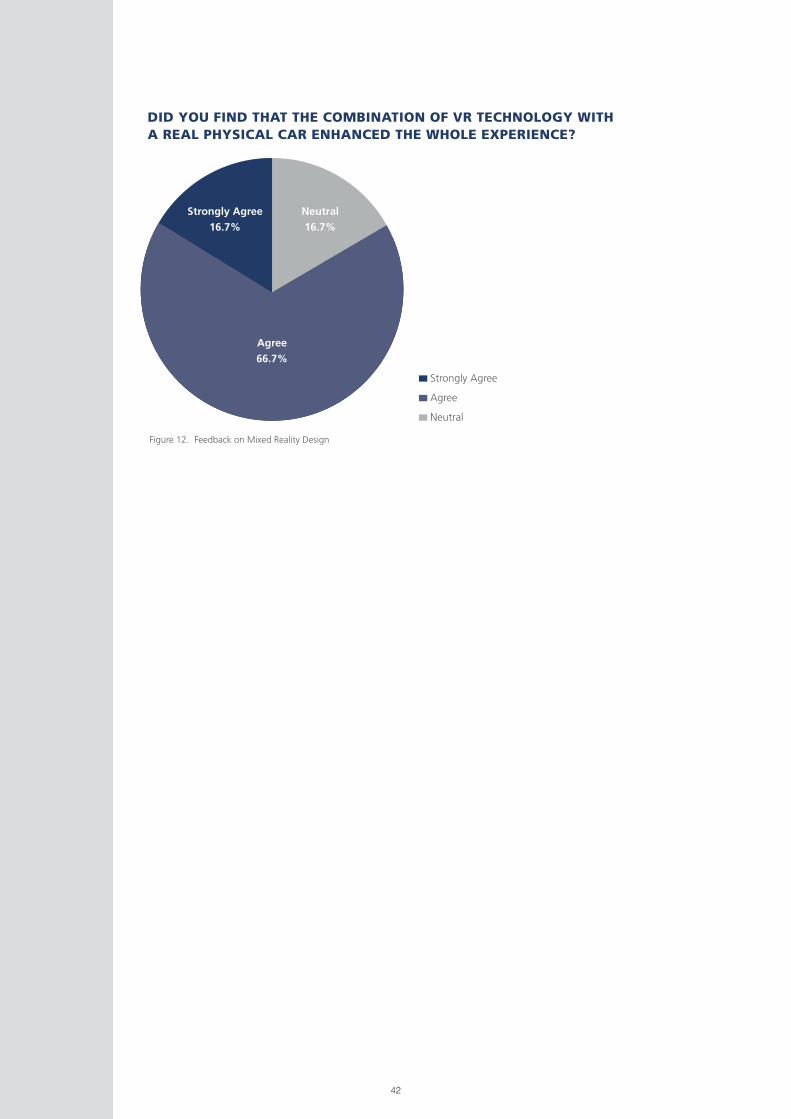
42
Figure 12. Feedback on Mixed Reality Design
DID YOU FIND THAT THE COMBINATION OF VR TECHNOLOGY WITH A REAL PHYSICAL CAR ENHANCED THE WHOLE EXPERIENCE?
Strongly Agree
Agree
Neutral
Agree
66.7%
Strongly Agree
16.7%
Neutral
16.7%
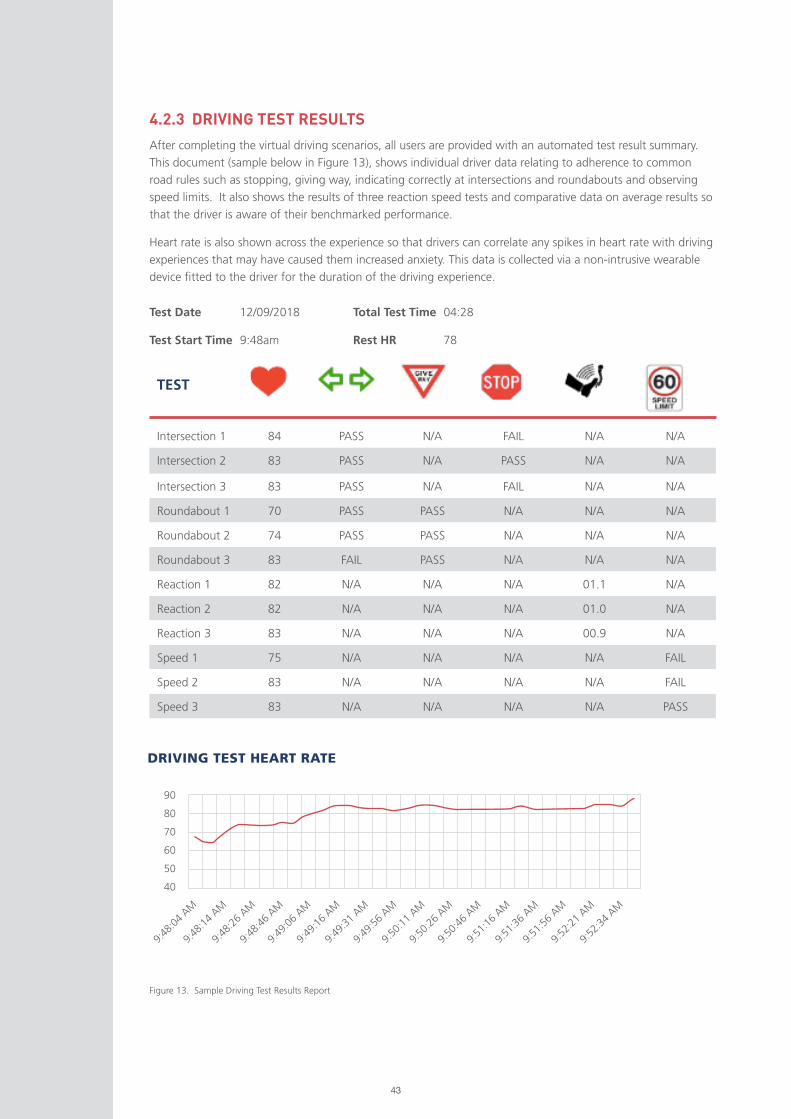
43
4.2.3 DRIVING TEST RESULTS
After completing the virtual driving scenarios, all users are provided with an automated test result summary.
This document (sample below in Figure 13), shows individual driver data relating to adherence to common
road rules such as stopping, giving way, indicating correctly at intersections and roundabouts and observing
speed limits. It also shows the results of three reaction speed tests and comparative data on average results so
that the driver is aware of their benchmarked performance.
Heart rate is also shown across the experience so that drivers can correlate any spikes in heart rate with driving
experiences that may have caused them increased anxiety. This data is collected via a non-intrusive wearable
device fitted to the driver for the duration of the driving experience.
TEST
Intersection 1 84 PASS N/A FAIL N/A N/A
Intersection 2 83 PASS N/A PASS N/A N/A
Intersection 3 83 PASS N/A FAIL N/A N/A
Roundabout 1 70 PASS PASS N/A N/A N/A
Roundabout 2 74 PASS PASS N/A N/A N/A
Roundabout 3 83 FAIL PASS N/A N/A N/A
Reaction 1 82 N/A N/A N/A 01.1 N/A
Reaction 2 82 N/A N/A N/A 01.0 N/A
Reaction 3 83 N/A N/A N/A 00.9 N/A
Speed 1 75 N/A N/A N/A N/A FAIL
Speed 2 83 N/A N/A N/A N/A FAIL
Speed 3 83 N/A N/A N/A N/A PASS
Test Date 12/09/2018
Test Start Time 9:48am
Total Test Time 04:28
Rest HR 78
DRIVING TEST HEART RATE
Figure 13. Sample Driving Test Results Report
90
80
70
60
50
40
9:48
:04
AM
9:48
:14
AM
9:48
:26
AM
9:48
:46
AM
9:49
:16
AM
9:49
:06
AM
9:49
:31
AM
9:49
:56
AM
9:50
:11
AM
9:50
:26
AM
9:50
:46
AM
9:51
:16
AM
9:51
:36
AM
9:51
:56
AM
9:52
:21
AM
9:52
:34
AM
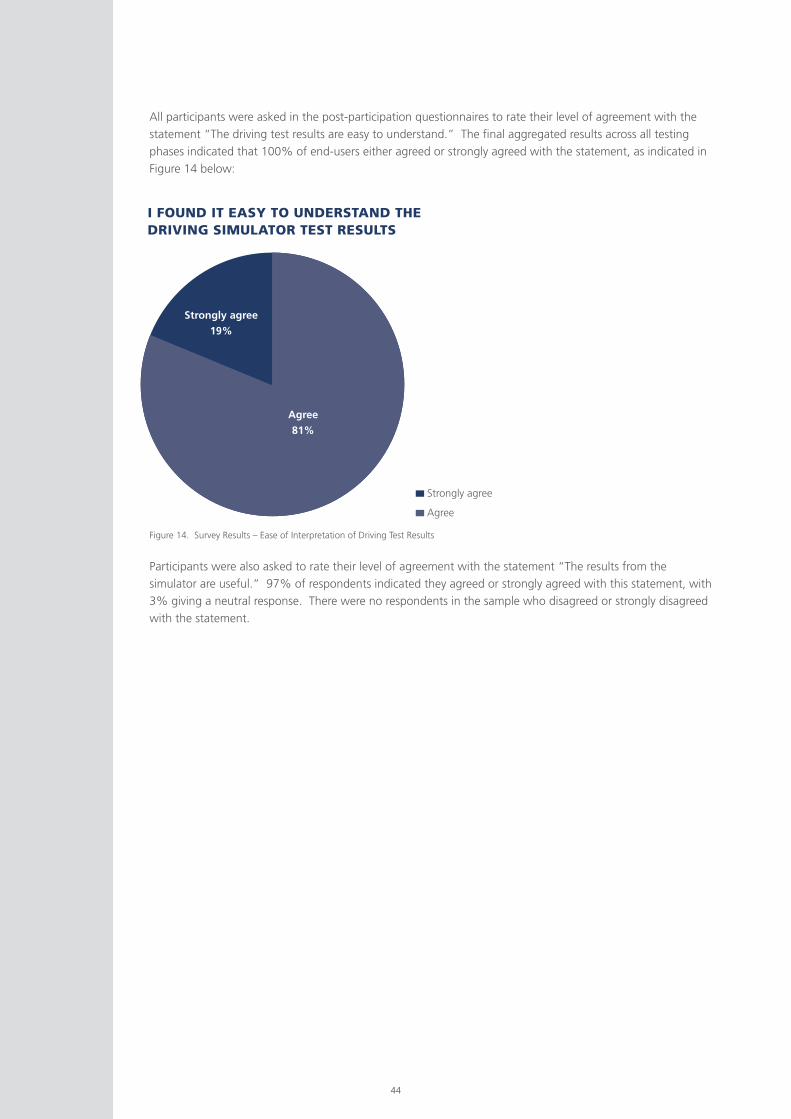
44
All participants were asked in the post-participation questionnaires to rate their level of agreement with the
statement “The driving test results are easy to understand.” The final aggregated results across all testing
phases indicated that 100% of end-users either agreed or strongly agreed with the statement, as indicated in
Figure 14 below:
Participants were also asked to rate their level of agreement with the statement “The results from the
simulator are useful.” 97% of respondents indicated they agreed or strongly agreed with this statement, with
3% giving a neutral response. There were no respondents in the sample who disagreed or strongly disagreed
with the statement.
Figure 14. Survey Results – Ease of Interpretation of Driving Test Results
I FOUND IT EASY TO UNDERSTAND THE DRIVING SIMULATOR TEST RESULTS
Strongly agree
Agree
Agree
81%
Strongly agree
19%
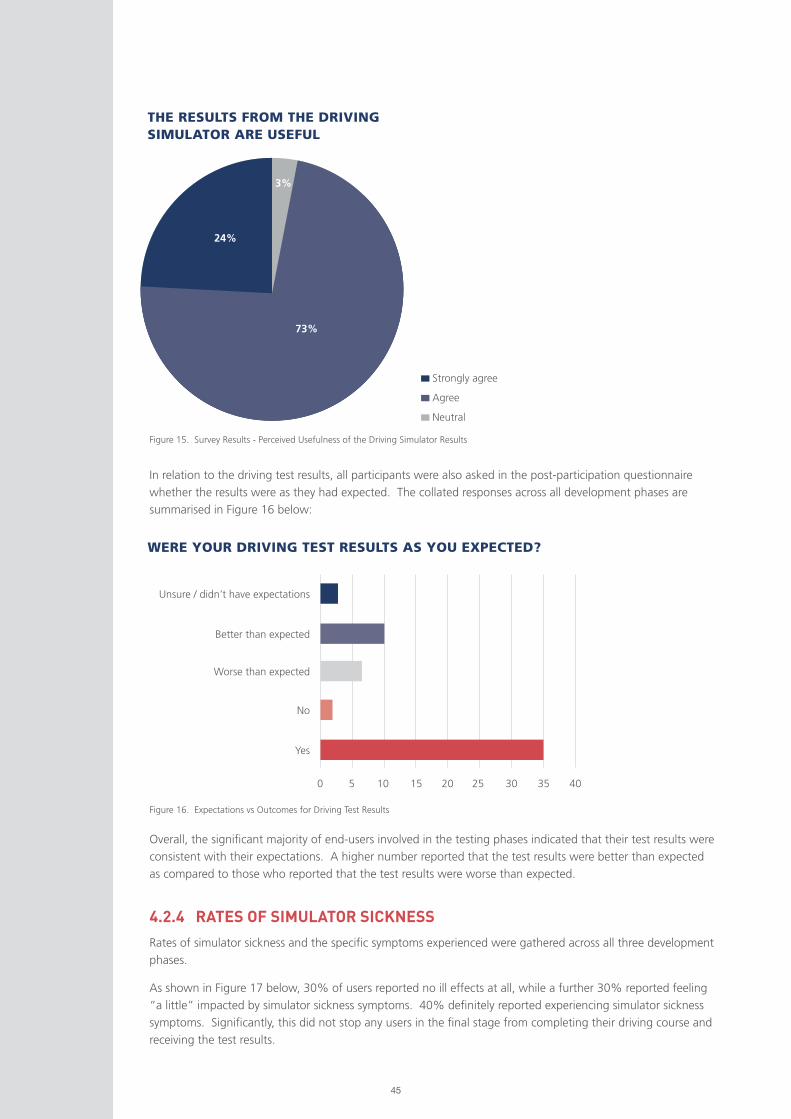
45
Figure 15. Survey Results - Perceived Usefulness of the Driving Simulator Results
Figure 16. Expectations vs Outcomes for Driving Test Results
THE RESULTS FROM THE DRIVING SIMULATOR ARE USEFUL
WERE YOUR DRIVING TEST RESULTS AS YOU EXPECTED?
In relation to the driving test results, all participants were also asked in the post-participation questionnaire
whether the results were as they had expected. The collated responses across all development phases are
summarised in Figure 16 below:
4.2.4 RATES OF SIMULATOR SICKNESS
Rates of simulator sickness and the specific symptoms experienced were gathered across all three development
phases.
As shown in Figure 17 below, 30% of users reported no ill effects at all, while a further 30% reported feeling
“a little” impacted by simulator sickness symptoms. 40% definitely reported experiencing simulator sickness
symptoms. Significantly, this did not stop any users in the final stage from completing their driving course and
receiving the test results.
Overall, the significant majority of end-users involved in the testing phases indicated that their test results were
consistent with their expectations. A higher number reported that the test results were better than expected
as compared to those who reported that the test results were worse than expected.
73%
24%
3%
Strongly agree
Agree
Neutral
0
Unsure / didn’t have expectations
Better than expected
Worse than expected
No
Yes
5 10 15 20 25 30 35 40
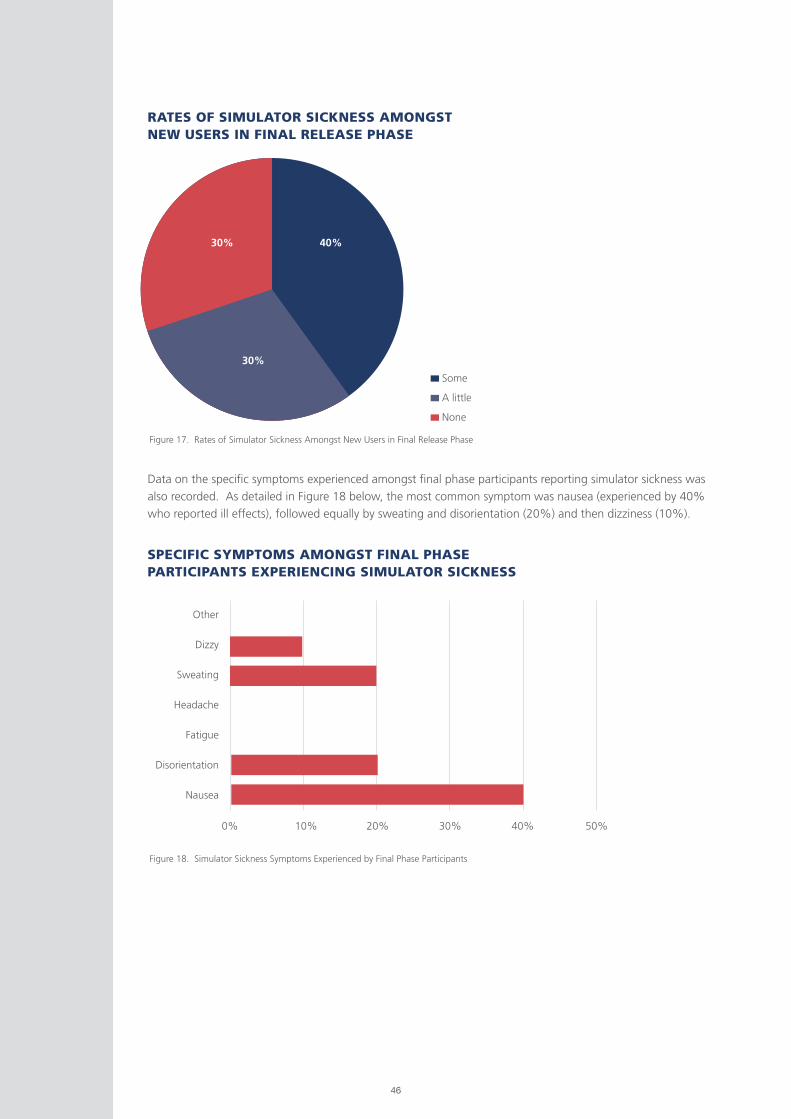
46
Some
A little
None
Figure 17. Rates of Simulator Sickness Amongst New Users in Final Release Phase
Figure 18. Simulator Sickness Symptoms Experienced by Final Phase Participants
RATES OF SIMULATOR SICKNESS AMONGST NEW USERS IN FINAL RELEASE PHASE
SPECIFIC SYMPTOMS AMONGST FINAL PHASE PARTICIPANTS EXPERIENCING SIMULATOR SICKNESS
Data on the specific symptoms experienced amongst final phase participants reporting simulator sickness was
also recorded. As detailed in Figure 18 below, the most common symptom was nausea (experienced by 40%
who reported ill effects), followed equally by sweating and disorientation (20%) and then dizziness (10%).
0%
Other
Dizzy
Sweating
Headache
Fatigue
Disorientation
Nausea
10% 20% 30% 40% 50%
30%
30% 40%

47
4.2.5 OLDER DRIVER BEHAVIOUR
Drivers were asked about their behavior in regard to relinquishing their driver license in the future and any self-
limitations they put on their driving currently.
A total of 46 (n) participants responded to the question “Do you put limits on your own driving license?”
Exactly half of these respondents indicated that they do place limits on their driving behaviour. An additional
question regarding what changes they make to their driving was then asked. It had 6 suggested categories
plus an “other” option with a free text field for additional information:
(i) Limits on how far I drive
(ii) Limits to driving at night
(iii) Limits to where I drive
(iv) Automatic vehicle only
(v) Do not drive as often.
(vi) Other (free text)
Participants could select multiple answers as relevant.
As shown in Figure 19 below, 86% indicated they limit their night-time driving, 82% indicated they limit
driving in certain locations, for example unfamiliar areas or areas of high traffic such as Sydney. 34% also
indicated that they limit the distance they drive.
Figure 19. Survey Results – Self Imposed restrictions on Driving
LIMITATIONS OLDER DRIVERS PLACE ON THEIR OWN DRIVING
0%
%
10%
Limits how far I drive34%
Limits to driving at night86%
Limits to where I drive82%
Do not drive as often8%
20% 30% 40% 50% 60% 70% 80% 90% 100%
48
This issue was also explored further in the focus groups, with the following questions being asked:
“In your experience, do you find that most older drivers self-moderate their driving? If so, how?”
The responses were thematically analysed. The results confirmed the outcomes of the questionnaires and also
identified a number of secondary themes in relation to how older drivers were perceived by the focus group
participants to modify their driving behavior:
• Driving more slowly,
• Being more deliberate when checking what’s coming,
• Being more aware when towing a caravan,
• Not having passengers in the car,
• Using the train for longer trips,
• Not driving on dual carriageway roads,
• Selecting the time of day to drive to the shops when there are less cars on the road,
• Taking someone with them to share the driving, particularly on long-distance trips (examples given
were husband, daughter, sister).
In the questionnaires, participants were also asked: ‘ In the future why would you stop driving?’. It had 5
suggested categories plus an “other” option with a free text field for additional information:
(i) Because I have had an accident
(ii) Because of concerns about a medical condition impacting my driving
(iii) Because of the cost of maintaining a vehicle
(iv) Because of concerns I won’t pass a driving test
(v) Because I feel unsafe and am concerned about having an accident
(vi) Other (free text)
Participants could select multiple answers as relevant.
As shown in Figure 20 below, 91% indicated that they would stop driving if they were feeling unsafe and
concerned about having an accident, 83% would stop because of concerns about a medical condition
impacting their driving, and there was an equal response rate of 22% for respondents who indicated they
would stop because of concerns about not passing a driving test and due to an accident. Only 4% indicated
they would stop driving in the future if they were concerned about the cost of maintaining a vehicle.
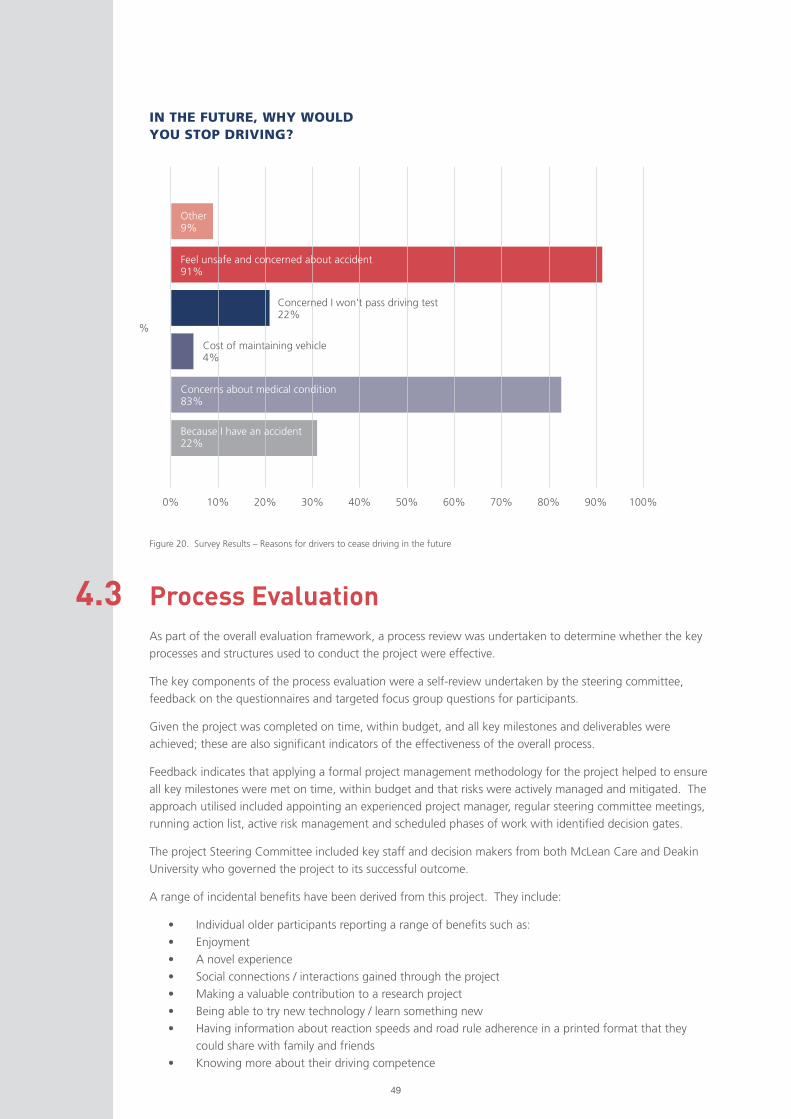
49
Figure 20. Survey Results – Reasons for drivers to cease driving in the future
IN THE FUTURE, WHY WOULD YOU STOP DRIVING?
Process Evaluation4.3 As part of the overall evaluation framework, a process review was undertaken to determine whether the key
processes and structures used to conduct the project were effective.
The key components of the process evaluation were a self-review undertaken by the steering committee,
feedback on the questionnaires and targeted focus group questions for participants.
Given the project was completed on time, within budget, and all key milestones and deliverables were
achieved; these are also significant indicators of the effectiveness of the overall process.
Feedback indicates that applying a formal project management methodology for the project helped to ensure
all key milestones were met on time, within budget and that risks were actively managed and mitigated. The
approach utilised included appointing an experienced project manager, regular steering committee meetings,
running action list, active risk management and scheduled phases of work with identified decision gates.
The project Steering Committee included key staff and decision makers from both McLean Care and Deakin
University who governed the project to its successful outcome.
A range of incidental benefits have been derived from this project. They include:
• Individual older participants reporting a range of benefits such as:
• Enjoyment
• A novel experience
• Social connections / interactions gained through the project
• Making a valuable contribution to a research project
• Being able to try new technology / learn something new
• Having information about reaction speeds and road rule adherence in a printed format that they
could share with family and friends
• Knowing more about their driving competence
0%
%
10% 20% 30% 40% 50% 60% 70% 80% 90% 100%
Because I have an accident22%
Concerns about medical condition83%
Cost of maintaining vehicle4%
Concerned I won’t pass driving test22%
Feel unsafe and concerned about accident91%
Other 9%
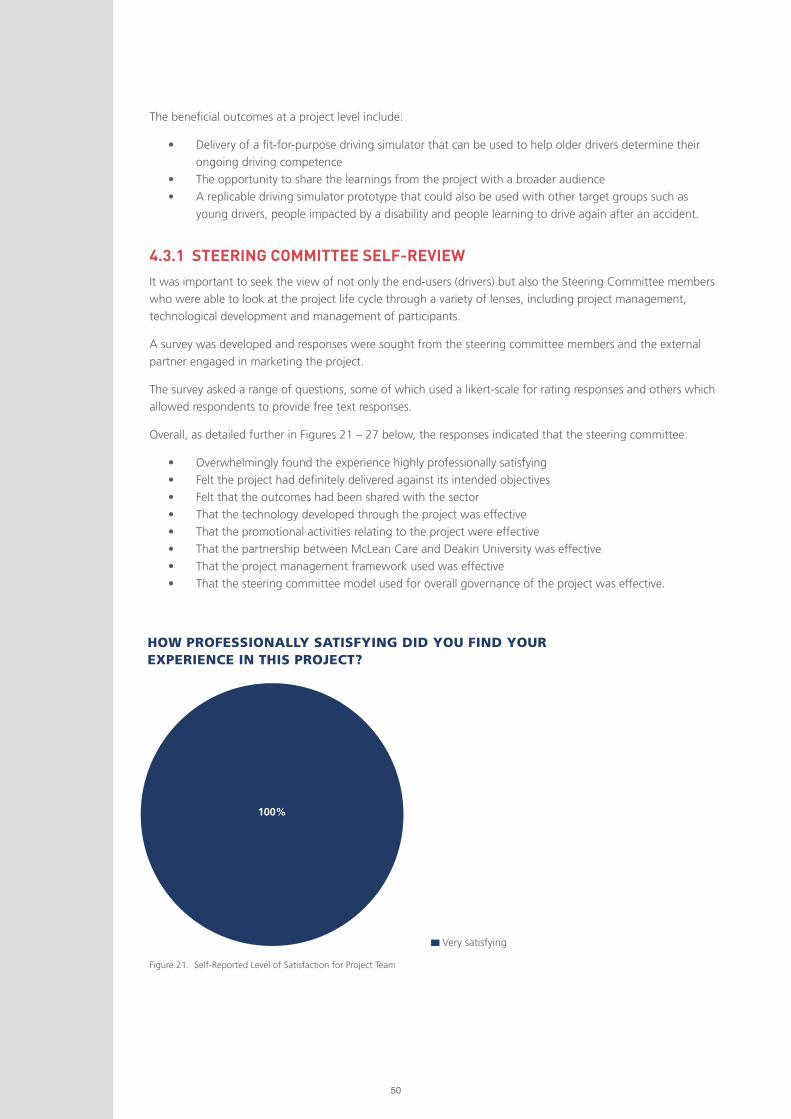
50
The beneficial outcomes at a project level include:
• Delivery of a fit-for-purpose driving simulator that can be used to help older drivers determine their
ongoing driving competence
• The opportunity to share the learnings from the project with a broader audience
• A replicable driving simulator prototype that could also be used with other target groups such as
young drivers, people impacted by a disability and people learning to drive again after an accident.
4.3.1 STEERING COMMITTEE SELF-REVIEW
It was important to seek the view of not only the end-users (drivers) but also the Steering Committee members
who were able to look at the project life cycle through a variety of lenses, including project management,
technological development and management of participants.
A survey was developed and responses were sought from the steering committee members and the external
partner engaged in marketing the project.
The survey asked a range of questions, some of which used a likert-scale for rating responses and others which
allowed respondents to provide free text responses.
Overall, as detailed further in Figures 21 – 27 below, the responses indicated that the steering committee:
• Overwhelmingly found the experience highly professionally satisfying
• Felt the project had definitely delivered against its intended objectives
• Felt that the outcomes had been shared with the sector
• That the technology developed through the project was effective
• That the promotional activities relating to the project were effective
• That the partnership between McLean Care and Deakin University was effective
• That the project management framework used was effective
• That the steering committee model used for overall governance of the project was effective.
Figure 21. Self-Reported Level of Satisfaction for Project Team
HOW PROFESSIONALLY SATISFYING DID YOU FIND YOUR EXPERIENCE IN THIS PROJECT?
100%
Very satisfying
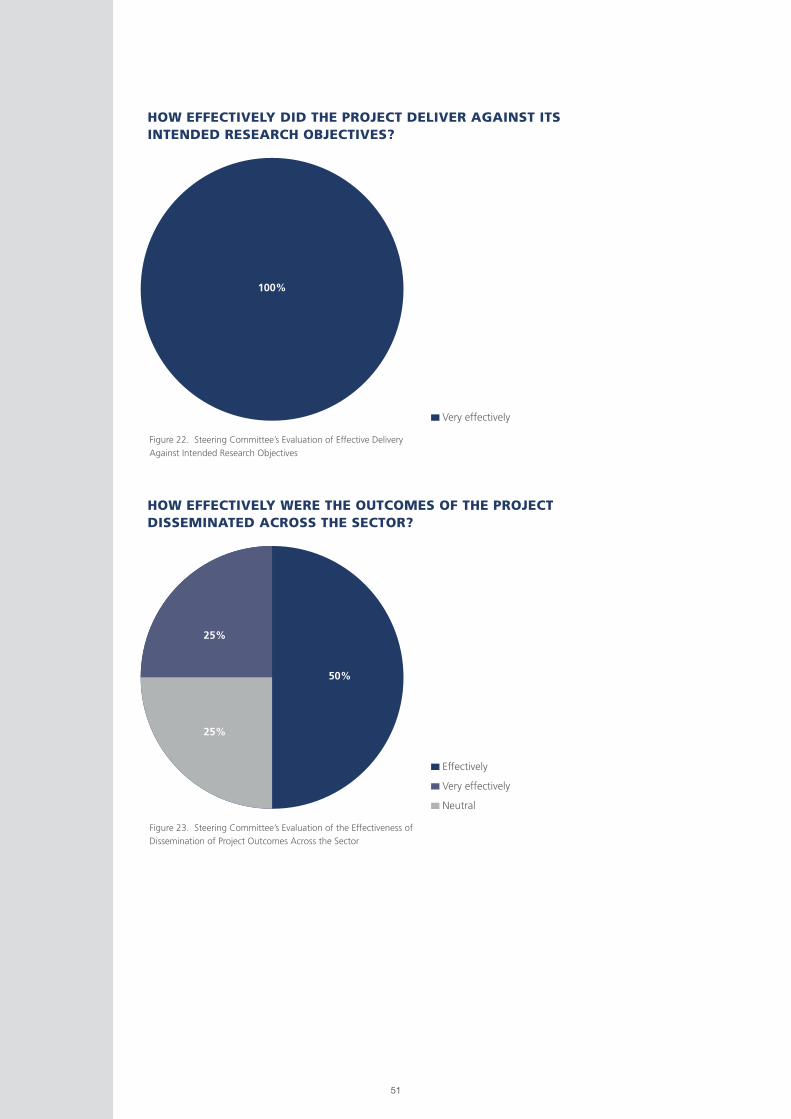
51
Figure 22. Steering Committee’s Evaluation of Effective Delivery
Against Intended Research Objectives
Figure 23. Steering Committee’s Evaluation of the Effectiveness of
Dissemination of Project Outcomes Across the Sector
HOW EFFECTIVELY DID THE PROJECT DELIVER AGAINST ITS INTENDED RESEARCH OBJECTIVES?
HOW EFFECTIVELY WERE THE OUTCOMES OF THE PROJECT DISSEMINATED ACROSS THE SECTOR?
100%
50%
25%
25%
Effectively
Very effectively
Neutral
Very effectively

52
Figure 24. Steering Committee’s Evaluation of the Effectiveness
of Technology Developed Through the Project
HOW EFFECTIVE WAS THE TECHNOLOGY DEVELOPED THROUGH THIS PROJECT?
75%
25%
Very effective
Effective
Figure 25. Steering Committee’s Evaluation of the Effectiveness
of the Partnership Between McLean Care and Deakin University
HOW EFFECTIVE WAS THE PARTNERSHIP BETWEEN MCLEAN CARE AND DEAKIN UNIVERSITY?
75%
25%
Very effective
Effective
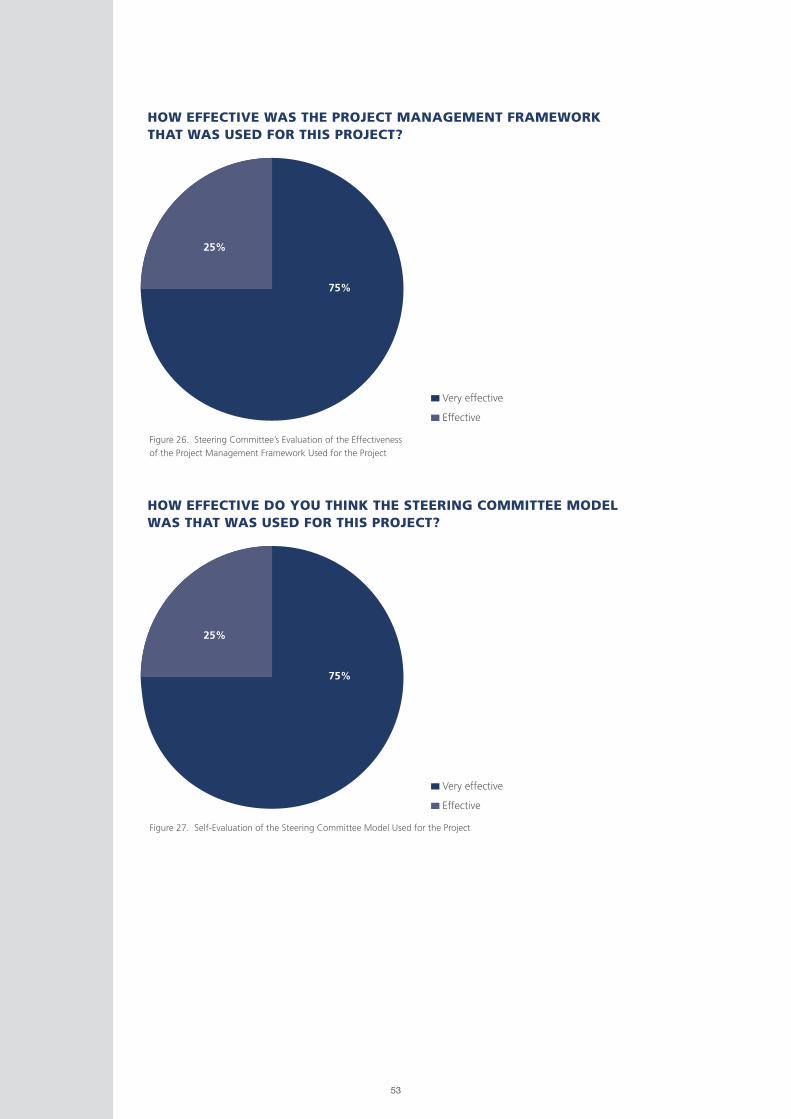
53
Figure 26. Steering Committee’s Evaluation of the Effectiveness
of the Project Management Framework Used for the Project
HOW EFFECTIVE WAS THE PROJECT MANAGEMENT FRAMEWORK THAT WAS USED FOR THIS PROJECT?
75%
25%
Very effective
Effective
Figure 27. Self-Evaluation of the Steering Committee Model Used for the Project
HOW EFFECTIVE DO YOU THINK THE STEERING COMMITTEE MODEL WAS THAT WAS USED FOR THIS PROJECT?
75%
25%
Very effective
Effective

54
The free text portion of the survey asked the steering committee to consider various aspects of the project
in respect to what worked well, what could be improved and what did not work well. The full responses are
provided in Appendix B.
Some of the comments in relation to what worked particularly well about the Steering Committee included:
• Collaboration, idea exchange, meetings were planned, targeted and efficient
• The steering committee meetings were well run and everyone was provided with appropriate
documentation (agenda, minutes, action register) that made each meeting run smoothly
Some of the comments in relation to what worked particularly well about the relationship between Deakin and
McLean Care include:
• Collaboration, communication, idea exchange, sharing of information, sense of equal partners
• Both partners worked well in providing professional insights throughout the project.
• Great, respectful communication. Subject matter experts who respected each others’ areas of
expertise as well. Building personal relationships and rapport by spending time in person that
complemented the professional working relationships. Good will, highly professional people involved
all round.
In response to the question “What do you think were the key enablers for this project?” some of the key
responses include:
• The shared vision and strategy alignment of the project, ability to be flexible with project and Hector
design
• The collaborative partnership between industry (McLean Care) and university (Deakin).
• The immersive experience of the car
• Right staff, right mix of subject matter expertise, well framed research approach, project manager.
In response to the question “What do you think were the main issues and barriers encountered?”, the key
responses were:
• The main challenge was the timeline required for development
• VR technology environment and the final location
• Unanticipated rates of motion sickness by users.
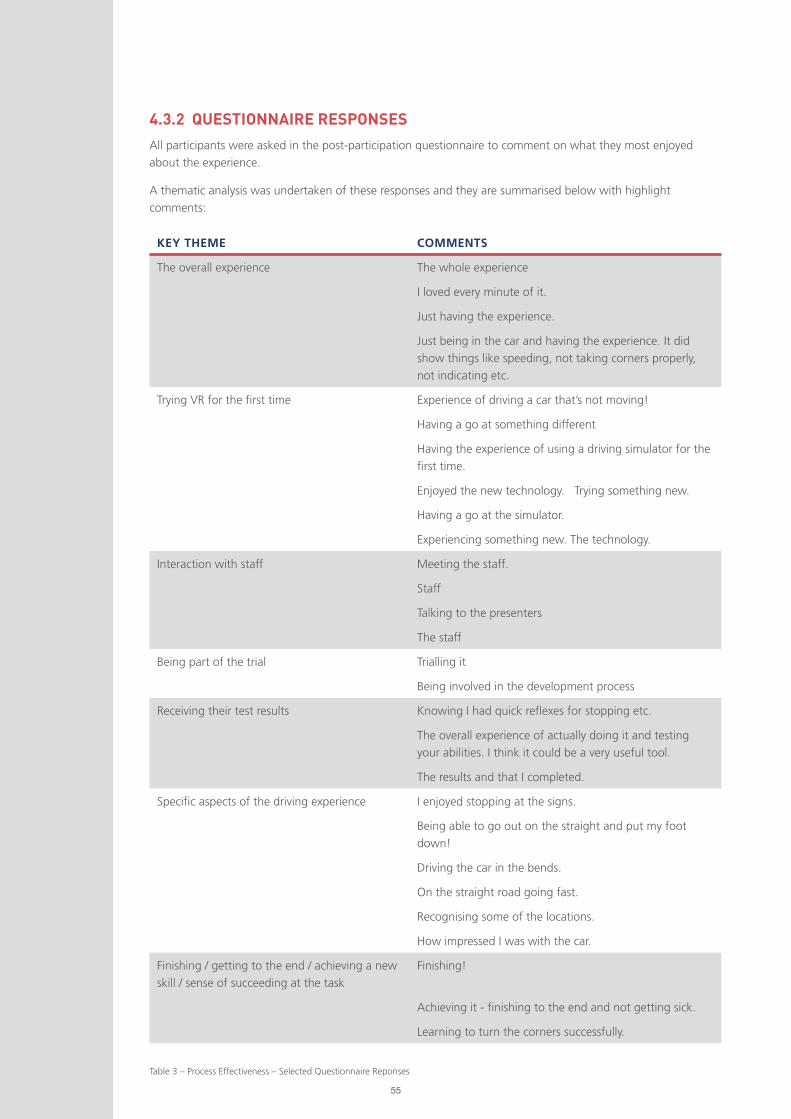
55
KEY THEME COMMENTS
The overall experience The whole experience
I loved every minute of it.
Just having the experience.
Just being in the car and having the experience. It did
show things like speeding, not taking corners properly,
not indicating etc.
Trying VR for the first time Experience of driving a car that’s not moving!
Having a go at something different
Having the experience of using a driving simulator for the
first time.
Enjoyed the new technology. Trying something new.
Having a go at the simulator.
Experiencing something new. The technology.
Interaction with staff Meeting the staff.
Staff
Talking to the presenters
The staff
Being part of the trial Trialling it
Being involved in the development process
Receiving their test results Knowing I had quick reflexes for stopping etc.
The overall experience of actually doing it and testing
your abilities. I think it could be a very useful tool.
The results and that I completed.
Specific aspects of the driving experience I enjoyed stopping at the signs.
Being able to go out on the straight and put my foot
down!
Driving the car in the bends.
On the straight road going fast.
Recognising some of the locations.
How impressed I was with the car.
Finishing / getting to the end / achieving a new
skill / sense of succeeding at the task
Finishing!
Achieving it - finishing to the end and not getting sick.
Learning to turn the corners successfully.
Table 3 – Process Effectiveness – Selected Questionnaire Reponses
4.3.2 QUESTIONNAIRE RESPONSES
All participants were asked in the post-participation questionnaire to comment on what they most enjoyed
about the experience.
A thematic analysis was undertaken of these responses and they are summarised below with highlight
comments:

56
4.3.3 FOCUS GROUP RESPONSES
Six process-related questions were asked in the focus groups to gain a participant perspective on whether the
process used for the project was effective. The responses are summarised in the table below:
QUESTION SAMPLE OF RESPONSES
What are your reflections on the time you were
asked to give to be involved?”
• Time allocated was just right
• Did not feel rushed
• Was not too much time to give up
• Well worth it
• Reasonable
• Well timed
Did you feel that the project was clearly explained to
you?” and “What was done well?’
• There was understanding of what was coming
• Side effects were explained
• Some things were needing to be experienced
rather than explained
• Explained well
• Care taken to ensure comfort – particularly with
headset
• Supportive and informative
• Continual instruction of what to expect
throughout drive was beneficial
• Reassuring was comforting
“What could be improved?” • Unsure of reaction test – location and how it
would appear
• Trial of what is coming on a screen first before
going into VR. Gives more idea of what is going
to happen
“What words would you use to describe the way
the research was managed / your interactions with
the team?”
• Team was great
• Feedback listened to and acted upon
• Excellent
• Well planned
• Helpful
• Care given by staff
• Professional
• Friendly and comprehensive
• Patient
• Caring
• Explained well
“What did you enjoy most about being involved in
this project?”
• Experiencing VR
• Enjoyed the challenge
• New technology
• Enjoyed graphics and feedback
• Interesting
57
QUESTION SAMPLE OF RESPONSES
“What did you enjoy most about being involved in
this project?”
• Staff were good
• Discussing involvement and findings with family
and friends
• Trying to assist the elderly
• Physical reactions were measured
• To find out what it was all about
• Reinforcement of road rules
• Great that it was bought to rural setting
• Having results printed
• New experience / technology
• Interesting and exciting
• Finding out physical reactions to vehicle
• Competitive results – bragging to family
• Enjoyed noticeable improvements
• Enjoyed educating others about project
• Exposure to new opportunity to be involved in
research – rural area
• Contributing to feedback
• Fun and educational for older people
Table 4 – Process Effectiveness - Focus Group questions and responses
Overall, the responses indicate that participants enjoyed a number of aspects of the project, that their
commitment of time to the project was reasonable, that the project was clearly explained to them, and that
the project overall was conducted professionally.
4.3.4 SUMMARY OF CHALLENGES AND ENABLERS
As part of a commitment to continuous improvement and to understand the challenges and enablers the
project team compiled a summary of the key challenges and enablers for the Hector VR project. The lessons
learnt, critical success factors and improvement opportunities were captured across the lifecycle of the project
and are summarised below:
A critical success factor for this project was the effective research-industry partnership between McLean Care
and Deakin University. This provided just the right mix of subject matter expertise to realise the vision for
the project.
Formalising the partnership between McLean Care and Deakin University with a contract at the start of the
relationship that outlined key milestones and related payment plan ensured a common understanding of
expectations, roles and responsibilities and avoided potential confusion or misunderstanding later in the
project. It also helped to ensure the project was delivered within budget and on time.
The recruitment strategies used for the research component of the project were highly successful and resulted
in the target for research participant numbers not only being achieved, but exceeded.
WHAT WORKED WELL
58
The media promotion strategies were effective and resulted in a broad coverage and positive reporting on the
project across a range of mediums (print, online, TV and social media).
The iterative / action research methodology was highly effective within the overall research and development
design. Specifically, it enabled feedback from each testing phase of the project to be incorporated in to
subsequent design phases to ultimately achieve a high degree of user acceptance.
This project had a range of social impacts and outcomes for older people. A co-design methodology was
therefore particularly well suited to the project. This approach actively involves the end users in the design
process. By inviting and valuing the input of 63 local older people across the Hector VR project design phases,
it increased their buy-in, ongoing participation and the ultimate suitability of the simulator for its intended
user audience.
Combining quantitative and qualitative data collection methodologies yielded rich data and offered a unique
“human perspective” on the outcomes and impacts of the project and insight in to the impact of not having a
driving licence for older people living in rural and farming communities.
Applying a formal project management methodology including the appointment of an experienced project
manager helped to ensure all key milestones were met on time, within budget and that risks were actively
managed and mitigated. This approach included regular steering committee meetings, running action list,
active risk management and scheduled phases of work with identified decision gates.
The project Steering Committee included key staff and authorized decision makers from both McLean Care
and Deakin University who governed the project to its successful outcome. Having these key staff involved
ensured decisions could be made quickly and effectively, resources could be committed when required and
there were no or minimal delays in waiting for necessary approvals.
Requirement for Subject Matter Expertise: The development of a VR driving simulator required highly
specialised skills and expertise. To address this issue, a review of various university specialist options across
Australia was considered by McLean Care. Deakin University’s CADET VR Laboratory team were identified as
having the requisite breadth and depth of skills and experience and were engaged as the project partner. The
relationship was formalised with a contract outlining roles and responsibilities as well as payment milestones.
Adverse Reactions to the Simulator: Research highlights that simulator sickness can be experienced by some
users. The steering committee identified that there was a need to ensure participants were aware of this risk
prior to giving consent to participate and to minimise the adverse reactions through design adaptations. The
participant consent form was drawn up to include highlighting this risk and was approved by legal advisers
prior to implementation.
The design process across successive phases also allowed for improved technology and adaptations over time
that were tested by participants and found to minimise adverse reactions across the three phases.
Managing User Risks: The Steering Committee identified that there was a risk that participants may base
decisions on future driving competence purely on the results of the driving simulator which was still a
prototype in development. Legal advice was sought regarding appropriate disclaimers for use of the vehicle.
The solution that as ultimately implemented is a requirement for all participants to sign a disclaimer on first
use. A reminder disclaimer flashes on the screen at the start of each simulator use (which must be actively
accepted by the user pressing the accelerator pedal in the vehicle); and the results print-out also contains a
reminder that the results should not form the sole basis of decision-making.
Poor engagement from a key stakeholder: The intended research design was to benchmark the simulated
driving test against the actual driving test conducted for older drivers in NSW. However, despite multiple
attempts at contact across a prolonged period of time, the project team was unable to access the information
THE CHALLENGES ENCOUNTERED
59
they required. When multiple attempts at contact proved fruitless, the Steering Committee discussed
alternative options for accessing the information required to inform the design of the virtual driving test.
This information was eventually accessed from publicly available online sources and from reviewing academic
literature on the most common factors impacting accidents by older drivers such as failing to give way and not
turning correctly at a T intersection.
Automating results from the heart rate monitoring: The initial trials utilised a Fit-Bit smart watch to capture
heart rate information from users during the driving simulation. However, a manual process was required to
download the data and pair it with the driving simulator data. An alternative automated process using
a different heart rate monitoring was trialled and implemented prior to handover of the final simulator
prototype from Deakin to McLean.
One of the design components that was raised through the development and testing phases was the potential
to incorporate and trial a motion platform in the design of the simulator. Research on this design element
indicates that it may have some impact on reducing levels of motion sickness experienced by some users.
However, it was out of budget for the current project to trial this design element. The opportunity to trial it in
the future may significantly improve the overall design of the simulator and reduce motion sickness amongst
some users.
With additional funding, the Hector VR driving simulator could be trialled on a much larger scale and made
available to older people across regional and rural Australia using a regional “road show” model. This next
phase of the project would help to determine levels of user acceptance against a much higher sample of users,
and would also ensure that the benefits of the technology are made available to a significantly higher number
of older people in regional and rural Australia.
There is the potential for the simulator to be useful with a variety of other target groups, including learner
drivers, people who are learning to drive again after an accident or illness, and people with a disability.
OPPORTUNITIES FOR THE FUTURE
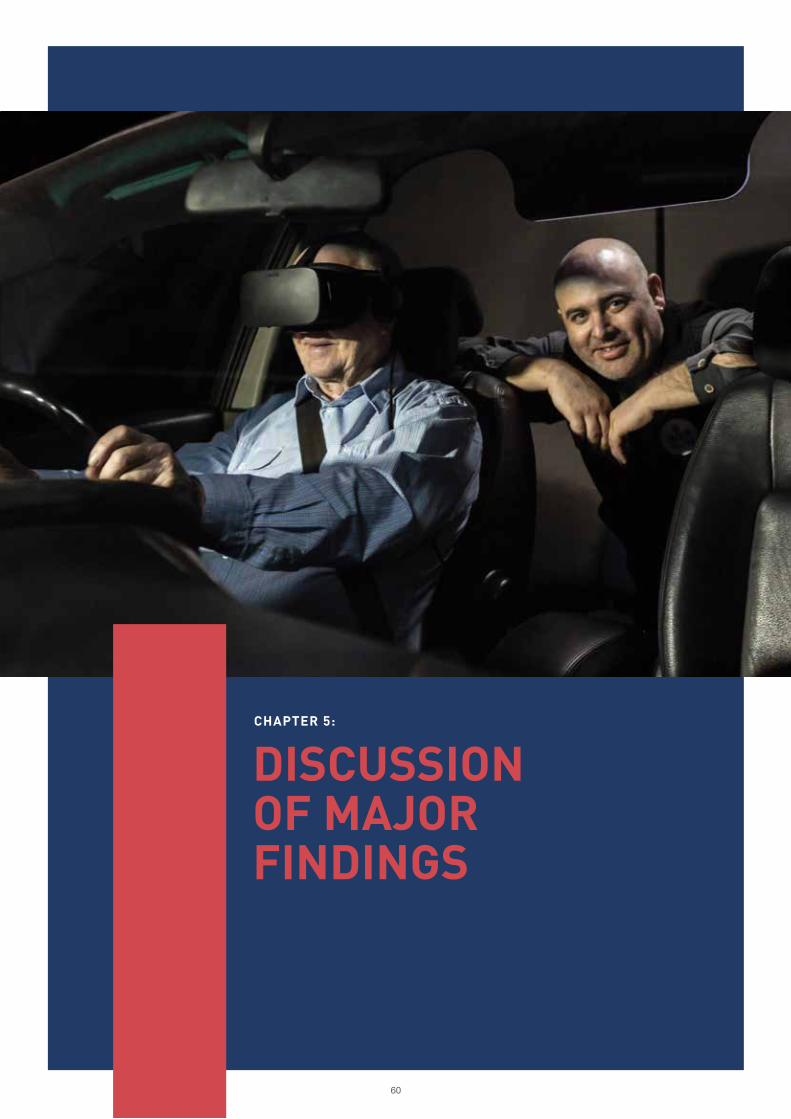
60
DISCUSSION OF MAJOR FINDINGS
CHAPTER 5:
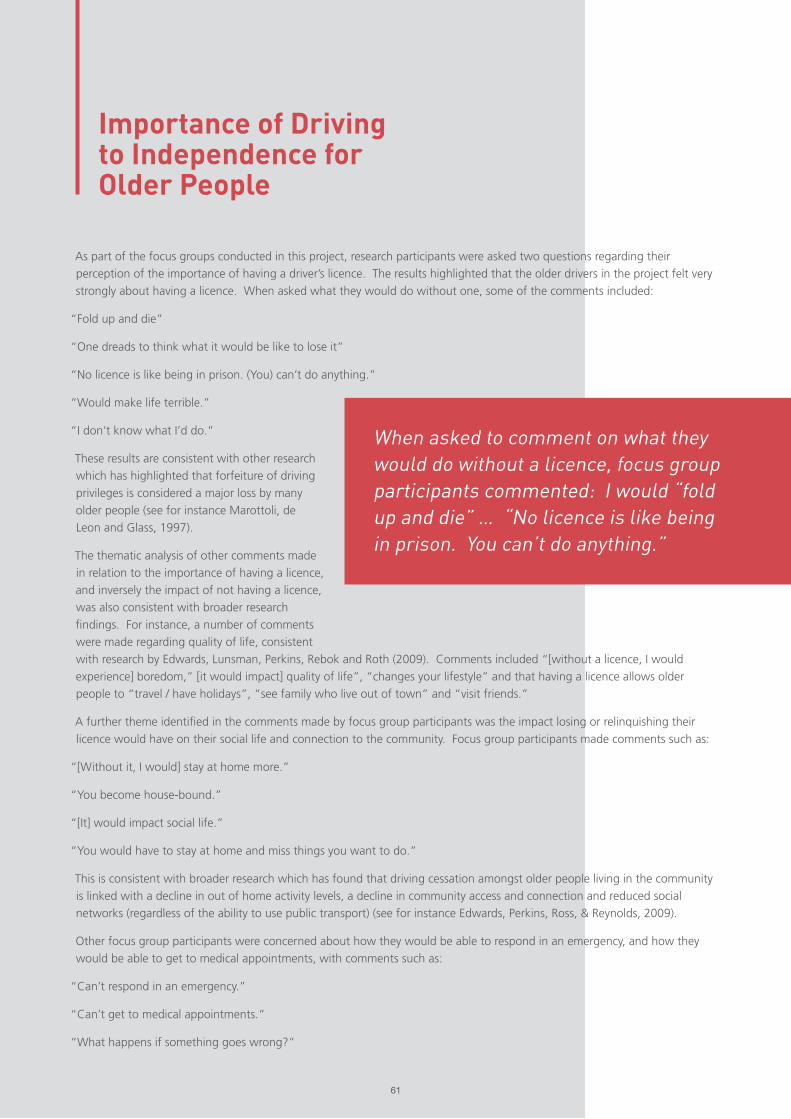
61
As part of the focus groups conducted in this project, research participants were asked two questions regarding their
perception of the importance of having a driver’s licence. The results highlighted that the older drivers in the project felt very
strongly about having a licence. When asked what they would do without one, some of the comments included:
“Fold up and die”
“One dreads to think what it would be like to lose it”
“No licence is like being in prison. (You) can’t do anything.”
“Would make life terrible.”
“I don’t know what I’d do.”
These results are consistent with other research
which has highlighted that forfeiture of driving
privileges is considered a major loss by many
older people (see for instance Marottoli, de
Leon and Glass, 1997).
The thematic analysis of other comments made
in relation to the importance of having a licence,
and inversely the impact of not having a licence,
was also consistent with broader research
findings. For instance, a number of comments
were made regarding quality of life, consistent
with research by Edwards, Lunsman, Perkins, Rebok and Roth (2009). Comments included “[without a licence, I would
experience] boredom,” [it would impact] quality of life”, “changes your lifestyle” and that having a licence allows older
people to “travel / have holidays”, “see family who live out of town” and “visit friends.”
A further theme identified in the comments made by focus group participants was the impact losing or relinquishing their
licence would have on their social life and connection to the community. Focus group participants made comments such as:
“[Without it, I would] stay at home more.”
“You become house-bound.”
“[It] would impact social life.”
“You would have to stay at home and miss things you want to do.”
This is consistent with broader research which has found that driving cessation amongst older people living in the community
is linked with a decline in out of home activity levels, a decline in community access and connection and reduced social
networks (regardless of the ability to use public transport) (see for instance Edwards, Perkins, Ross, & Reynolds, 2009).
Other focus group participants were concerned about how they would be able to respond in an emergency, and how they
would be able to get to medical appointments, with comments such as:
“Can’t respond in an emergency.”
“Can’t get to medical appointments.”
“What happens if something goes wrong?”
Importance of Driving to Independence for Older People
When asked to comment on what they would do without a licence, focus group participants commented: I would “fold up and die” … “No licence is like being in prison. You can’t do anything.”
61
62
Not surprisingly given the project was conducted in a regional farming community, a number of participants also highlighted
that losing the independence related to having a licence was perhaps more of an issue in a country area. Comments were
made such as:
“Big issue in rural/farming communities”
“If you don’t have a network of family/friends here, who do you rely on?”
“Depends if family is still nearby.”
“Not such a pain if you live in a city.”
An additional theme identified in the analysis of the Hector VR focus groups that has not been particularly emphasised in the
reviewed literature, was the sense of becoming dependent on others and not wanting to be a burden. This is reflected in
the comments made by the focus group participants, such as [I] don’t want to be a burden on my family” and that without a
licence, they would “become dependent on others.”
Overall, the focus group participants painted a compelling picture of the impact that they perceived losing their licence would
have on them in the rural community in which they live. This confirms the importance of the Hector VR project and its aim
of providing older people with objective information about their driving competence as a means of supporting them to make
informed decisions about if and when to relinquish their licence. In turn, it is hoped that premature or unnecessary licence
relinquishment is avoided for as long as possible, with associated positive impacts on the quality of life, social connectedness
and independence of older Australians.
62
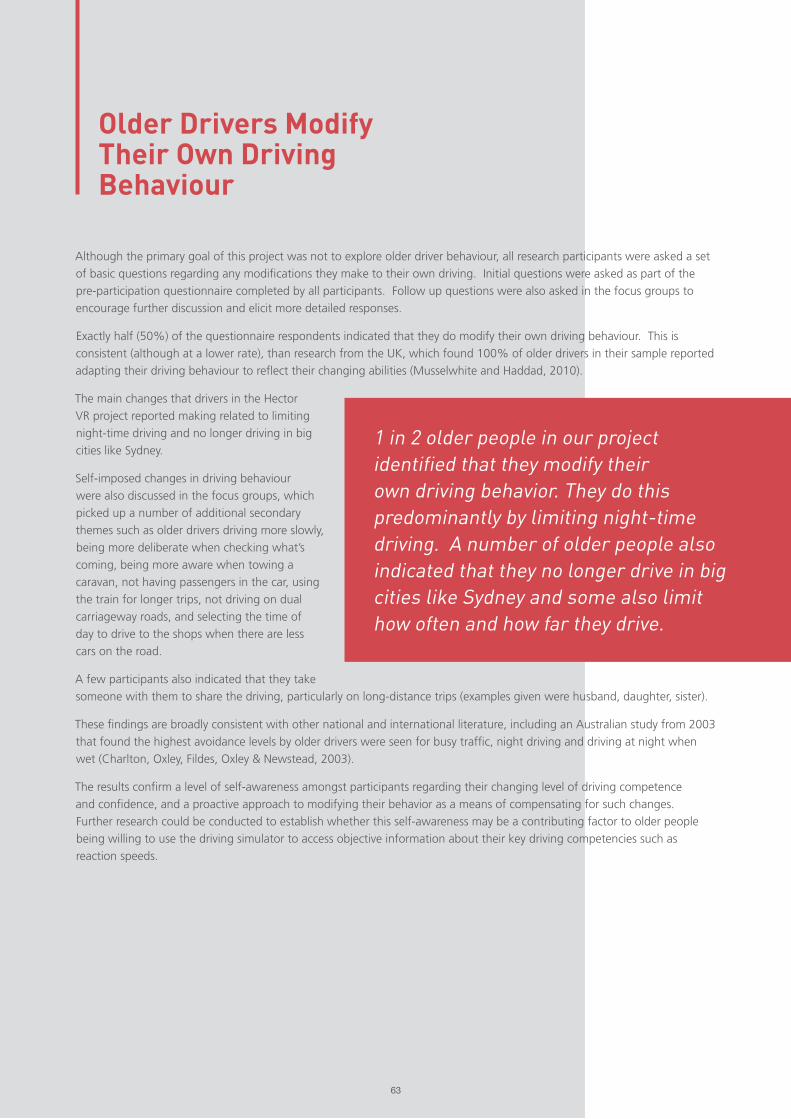
63
Although the primary goal of this project was not to explore older driver behaviour, all research participants were asked a set
of basic questions regarding any modifications they make to their own driving. Initial questions were asked as part of the
pre-participation questionnaire completed by all participants. Follow up questions were also asked in the focus groups to
encourage further discussion and elicit more detailed responses.
Exactly half (50%) of the questionnaire respondents indicated that they do modify their own driving behaviour. This is
consistent (although at a lower rate), than research from the UK, which found 100% of older drivers in their sample reported
adapting their driving behaviour to reflect their changing abilities (Musselwhite and Haddad, 2010).
The main changes that drivers in the Hector
VR project reported making related to limiting
night-time driving and no longer driving in big
cities like Sydney.
Self-imposed changes in driving behaviour
were also discussed in the focus groups, which
picked up a number of additional secondary
themes such as older drivers driving more slowly,
being more deliberate when checking what’s
coming, being more aware when towing a
caravan, not having passengers in the car, using
the train for longer trips, not driving on dual
carriageway roads, and selecting the time of
day to drive to the shops when there are less
cars on the road.
A few participants also indicated that they take
someone with them to share the driving, particularly on long-distance trips (examples given were husband, daughter, sister).
These findings are broadly consistent with other national and international literature, including an Australian study from 2003
that found the highest avoidance levels by older drivers were seen for busy traffic, night driving and driving at night when
wet (Charlton, Oxley, Fildes, Oxley & Newstead, 2003).
The results confirm a level of self-awareness amongst participants regarding their changing level of driving competence
and confidence, and a proactive approach to modifying their behavior as a means of compensating for such changes.
Further research could be conducted to establish whether this self-awareness may be a contributing factor to older people
being willing to use the driving simulator to access objective information about their key driving competencies such as
reaction speeds.
Older Drivers Modify Their Own Driving Behaviour
1 in 2 older people in our project identified that they modify their own driving behavior. They do this predominantly by limiting night-time driving. A number of older people also indicated that they no longer drive in big cities like Sydney and some also limit how often and how far they drive.
63
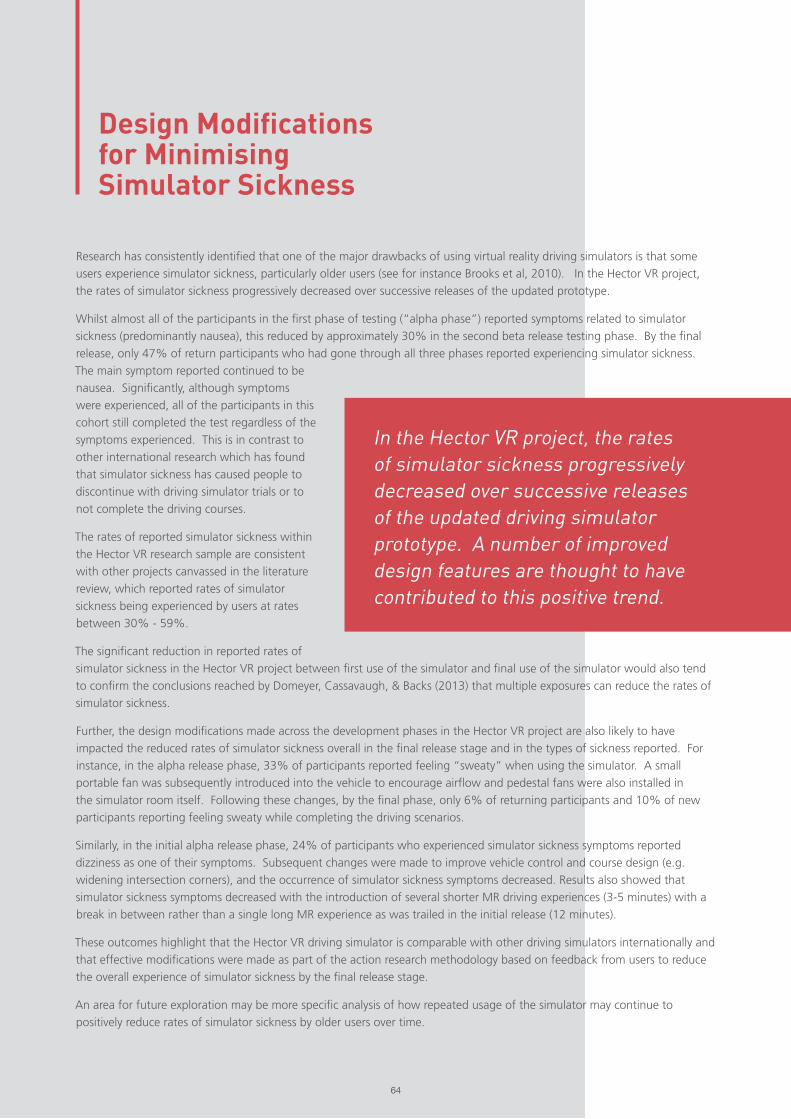
64
Research has consistently identified that one of the major drawbacks of using virtual reality driving simulators is that some
users experience simulator sickness, particularly older users (see for instance Brooks et al, 2010). In the Hector VR project,
the rates of simulator sickness progressively decreased over successive releases of the updated prototype.
Whilst almost all of the participants in the first phase of testing (“alpha phase”) reported symptoms related to simulator
sickness (predominantly nausea), this reduced by approximately 30% in the second beta release testing phase. By the final
release, only 47% of return participants who had gone through all three phases reported experiencing simulator sickness.
The main symptom reported continued to be
nausea. Significantly, although symptoms
were experienced, all of the participants in this
cohort still completed the test regardless of the
symptoms experienced. This is in contrast to
other international research which has found
that simulator sickness has caused people to
discontinue with driving simulator trials or to
not complete the driving courses.
The rates of reported simulator sickness within
the Hector VR research sample are consistent
with other projects canvassed in the literature
review, which reported rates of simulator
sickness being experienced by users at rates
between 30% - 59%.
The significant reduction in reported rates of
simulator sickness in the Hector VR project between first use of the simulator and final use of the simulator would also tend
to confirm the conclusions reached by Domeyer, Cassavaugh, & Backs (2013) that multiple exposures can reduce the rates of
simulator sickness.
Further, the design modifications made across the development phases in the Hector VR project are also likely to have
impacted the reduced rates of simulator sickness overall in the final release stage and in the types of sickness reported. For
instance, in the alpha release phase, 33% of participants reported feeling “sweaty” when using the simulator. A small
portable fan was subsequently introduced into the vehicle to encourage airflow and pedestal fans were also installed in
the simulator room itself. Following these changes, by the final phase, only 6% of returning participants and 10% of new
participants reporting feeling sweaty while completing the driving scenarios.
Similarly, in the initial alpha release phase, 24% of participants who experienced simulator sickness symptoms reported
dizziness as one of their symptoms. Subsequent changes were made to improve vehicle control and course design (e.g.
widening intersection corners), and the occurrence of simulator sickness symptoms decreased. Results also showed that
simulator sickness symptoms decreased with the introduction of several shorter MR driving experiences (3-5 minutes) with a
break in between rather than a single long MR experience as was trailed in the initial release (12 minutes).
These outcomes highlight that the Hector VR driving simulator is comparable with other driving simulators internationally and
that effective modifications were made as part of the action research methodology based on feedback from users to reduce
the overall experience of simulator sickness by the final release stage.
An area for future exploration may be more specific analysis of how repeated usage of the simulator may continue to
positively reduce rates of simulator sickness by older users over time.
Design Modifications for Minimising Simulator Sickness
In the Hector VR project, the rates of simulator sickness progressively decreased over successive releases of the updated driving simulator prototype. A number of improved design features are thought to have contributed to this positive trend.
64
65
Research has consistently identified that one of the major drawbacks of using virtual reality driving simulators is that some
users experience simulator sickness, particularly older users (see for instance Brooks et al, 2010). In the Hector VR project,
the rates of simulator sickness progressively decreased over successive releases of the updated prototype.
Whilst almost all of the participants in the first phase of testing (“alpha phase”) reported symptoms related to simulator
sickness (predominantly nausea), this reduced by approximately 30% in the second beta release testing phase. By the
final release, only 47% of return participants who had gone through all three phases reported experiencing simulator
sickness. The main symptom reported continued to be nausea. Significantly, although symptoms were experienced, all of
the participants in this cohort still completed the test regardless of the symptoms experienced. This is in contrast to other
international research which has found that simulator sickness has caused people to discontinue with driving simulator trials
or to not complete the driving courses.
The rates of reported simulator sickness within the Hector VR research sample are consistent with other projects canvassed in
the literature review, which reported rates of simulator sickness being experienced by users at rates between 30% - 59%.
The significant reduction in reported rates of simulator sickness in the Hector VR project between first use of the simulator
and final use of the simulator would also tend to confirm the conclusions reached by Domeyer, Cassavaugh, & Backs (2013)
that multiple exposures can reduce the rates of simulator sickness.
Further, the design modifications made across the development phases in the Hector VR project are also likely to have
impacted the reduced rates of simulator sickness overall in the final release stage and in the types of sickness reported. For
instance, in the alpha release phase, 33% of participants reported feeling “sweaty” when using the simulator. A small
portable fan was subsequently introduced into the vehicle to encourage airflow and pedestal fans were also installed in
the simulator room itself. Following these changes, by the final phase, only 6% of returning participants and 10% of new
participants reporting feeling sweaty while completing the driving scenarios.
Similarly, in the initial alpha release phase, 24% of participants who experienced simulator sickness symptoms reported
dizziness as one of their symptoms. Subsequent changes were made to improve vehicle control and course design (e.g.
widening intersection corners), and the occurrence of simulator sickness symptoms decreased. Results also showed that
simulator sickness symptoms decreased with the introduction of several shorter MR driving experiences (3-5 minutes) with a
break in between rather than a single long MR experience as was trailed in the initial release (12 minutes).
These outcomes highlight that the Hector VR driving simulator is comparable with other driving simulators internationally and
that effective modifications were made as part of the action research methodology based on feedback from users to reduce
the overall experience of simulator sickness by the final release stage.
An area for future exploration may be more specific analysis of how repeated usage of the simulator may continue to
positively reduce rates of simulator sickness by older users over time.
65

66
The Hector VR project used an iterative design process, with successive improvements and modifications being made to the
simulator across the three release and testing phases.
All participants were asked a series of questions in the post-participation questionnaire that were aimed at understanding the
perceived usefulness of the product, and the likelihood that target users would engage with the technology in the future.
The results highlighted a high degree of positive feedback. For instance:
97% of users indicated that they agreed or strongly agreed that the test results printed out to summarise the driver
performance are useful.
100% of users indicated that they agreed or
strongly agreed that the test results were easy
to understand.
83.4% of users indicated that they agreed
or strongly agreed that the combination of
virtual reality technology with a real physical car
enhanced the overall experience.
Responses to open-ended questions about
whether the results were as the drivers had expected were also thematically analysed. The definite majority of users reported
that the results regarding their driving competence were either as they expected, or better than they expected.
Additional feedback was gathered through an open-ended question asked in the post-participation questionnaires inviting
participants to comment on their overall experience. Some of the key comments included:
“I loved it. I want one in my lounge room!”
“I thoroughly enjoyed it.”
“Exhilirating!”
“Excellent”
“Very good. Terrific. Really liked it.”
“More than happy to take part. I think it will be very significant.”
“I was very impressed with it all. I liked the country driving as that’s what it’s like
around here.”
“Nice easy car to drive.”
“I loved every minute of it.”
Overall, these results evidence the success of the project in creating a fit-for-purpose driving simulator with very high rates of
end-user acceptance of the technology.
Fit-for-Purpose Driving Simulator
100% of users indicated that they agreed or strongly agreed that the test results were easy to understand.
66
“Exhilirating!”
“I loved it. I want one in my lounge room!”
67
As part of the TAM-VR scale administered with all participants across the three phases of the project, the older drivers were
asked a set of questions regarding their intention to use the driving simulator in the future (assuming they had access to it).
The questions were deliberately intended to determine any differences in the purposes for which older drivers were most
likely to access the simulator.
Overall, 63% of the total sample group indicated that they would use the simulator again in the future for enjoyment. 19%
disagreed with the statement. It is likely that to some extent, this result was influenced by the rates of simulator sickness
experienced by some users.
Similarly, 63% agreed or strongly agreed that
they would use the simulator again in the
future to practice driving, with 16% disagreeing
with this statement.
In comparison, overall, 78% of the sample
group indicated that they agreed or strongly
agreed with the statement “if I wanted to know
more about my driving competence, I would
use the driving simulator.” Only 8% disagreed
with the statement.
Comments made in the focus group were also
consistent with these findings. For instance,
when asked why they would use Hector VR
in the future, focus group respondents made
comments such as:
“To give you an idea of how competent you still
are at driving.”
“Show if your skills are slipping.”
“Hone your skills.”
“Test your reactions.”
“Check reaction times to stopping.”
“Fun.”
Responses to open-ended question in the post-
participation questionnaire also yielded some
rich insights. Comments were made such as:
“It would become second nature to just book yourself in every 6 months or so, just like going to the doctor”
Overall, this is a very high acceptance rate and highlights that the driving simulator is perceived by the target end-user group
as being fit for its intended purpose of providing objective information to older drivers that will help them to make informed
decisions about ongoing driving competence. The secondary reasons for intended use in the future were to practice driving
and for enjoyment, again in line with the intended project outcomes.
Self-Reported Reasons for Older Drivers Intending to Use the Driving Simulator in the Future
Overall, the main reason older drivers gave for intending to use the Hector VR driving simulator in the future is to find out more about their driving competence. 78% of the sample group reported intending to use it for this purpose, highlighting that the project has achieved its goal of creating a simulator suitable for providing older drivers with objective information that will help them make informed decisions about their driving. Other reported reasons for accessing the simulator in the future are for practicing driving and for enjoyment.
“It would become second nature to just book yourself in every 6 months or so, just like going to the doctor”
67
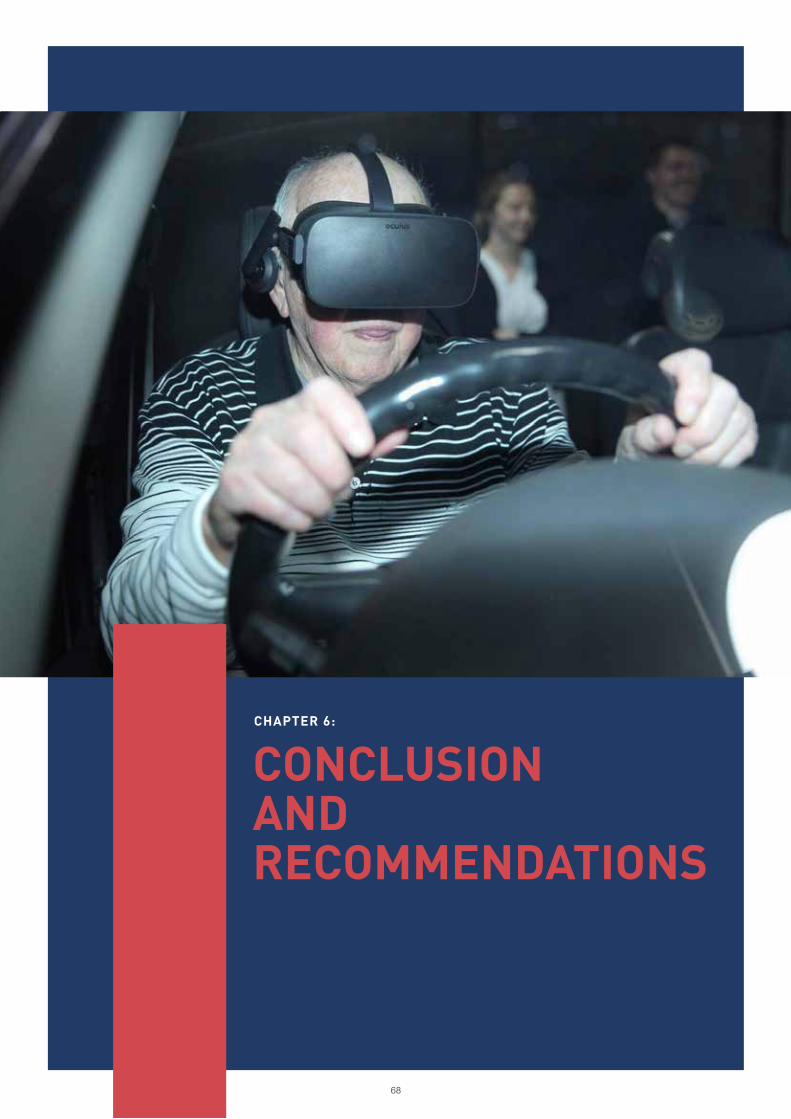
68
CONCLUSION AND RECOMMENDATIONS
CHAPTER 6:
69
Overall, the Hector VR Driving Simulator project delivered against all stated aims and objectives and has
produced valuable research and an effective prototype that could easily be replicated and utilised broadly
across the Australian and potentially, the international community.
Use of the Hector VR driving simulator on an ongoing basis / broader scale is likely to yield benefits including:
o Improved quality of life for older drivers by preventing premature / unwarranted licence relinquishment
o Improved road safety outcomes
This project has highlighted the utility of an effective research-industry partnership and the application of a
robust project management methodology for the development of an innovation of this nature.
The iterative co-design methodology across three development phases was also particularly effective in this
context. From the outset, and throughout all stages of the project, the end users – older drivers, were made
central to the process. Their views and input were highly valued and translated directly in to the design of the
final prototype.
The project has yielded rich insights regarding older driver behaviour, their willingness to engage with
emerging technologies such as VR, and the high degree of user-acceptance of the final product
The research outcomes are consistent with existing research in the field regarding the importance older people
place on the independence, mobility and community access that having a drivers’ licence offers, particularly in
regional and rural communities.
It is apparent that the Hector VR driving simulator offers older drivers the opportunity to test their skills in a
low-risk, safe and supported environment. The driving test results offer individual drivers objective information
about their driving competence and adherence to road rules in the simulated environment. Although the
sample size is not large enough to reach broader conclusions, for the sample in this study at least, the
simulator has offered a tool that supports informed and dignified decision making about future driving options.
Overall, the process used and the outcomes achieved are consistent with the original aims of the study.
It is recommended that:
1. The results of this project continue to be widely shared and disseminated within the sector and in other
appropriate forums.
2. Funding be sought to trial the simulator prototype on a much larger scale and with a variety of target user
groups such as those with a disability, young drivers and older people with dementia.
3. Funding be sought to incorporate and trial a motion platform in the design of the simulator to investigate
whether this reduces the rates of simulator sickness experienced by users.
4. Funding be sought to take the current simulator “on the road” and make it accessible to more older drivers
across more regional communities.
Recommendations
Conclusion

70
Ali, A. Elnaggarz, A., Reichardtz, D. and Abdennadher, S. (2016) “Gamified Virtual Reality Driving Simulator for
Asserting Driving Behaviors.”, International Conference on Game, Game Art, and Gamification, pp. 1-6.
Australian Bureau of Statistics, http://www.abs.gov.au
Australian Institute of Health and Welfare, http://www.aihw.gov.au/ageing/
Brendemuhl D, Schmidt U, Schenk N. (1988) “Driving behaviour of elderly motorists in standardised test
runs under road traffic conditions”. In: Rothengatter J, de Bruin R, editors. Road user behaviour: theory and
research. Dordrecht: Van Gorcum.
Brooks, J.O., Goodenough, R.R., Crisler, MC., Klein, ND., Alley, RL., Koon, BL., Logan, WC., Ogle, JH., Tyrrell,
RA., Wills, RF. (2010) “Simulator sickness during driving simulation studies” Accident Analysis and Prevention.
Volume 42, Issue 3, May 2010, pp 788 – 796.
Casutt, G.; Martin, M.; Keller, M.; Jäncke, L. (2014) The relation between performance in on-road driving,
cognitive screening and driving simulator in older healthy adults. Transp. Res. Part F 2014, 22, 232–244.
Casutt, G.; Theill, N.; Martin, M.; Keller, M.; Jäncke, L. (2014 B) The drive-wise project: Driving simulator
training increases real driving performance in healthy older drivers. Front. Aging Neurosci. 2014, 6, 85.
Charlton, J. L., Oxley, J., Fildes, B., Oxley, P., & Newstead, S. (2003). Self-regulatory behaviours of older drivers.
Annual proceedings. Association for the Advancement of Automotive Medicine, 47, pp 181–194.
De Winter,J., Van Leuween, P., and Happee, P (2012) “Advantages and disadvantages of driving simulators: a
discussion,” in Proceedings of Measuring Behavior, pp. 47-50.
DfT (Department for Transport, UK) (2001) Older Drivers: A Literature Review. London: Department for
Transport.
Domeyer, J., Cassavaugh, N., & Backs, R. (2013) “The use of adaptation to reduce simulator sickness in driving
assessment and research” in Accident; analysis and prevention 53: pp 127-32.
Edwards, J. D., Lunsman, M., Perkins, M. Rebok, G.W. & Roth, D.L. (2009) Driving cessation and health
trajectories in older adults Journals of Gerontology Series A: Biomedical Sciences and Medical Sciences, vol. 64,
pp. 1290-1295, 2009. doi:10.1093/gerona/glp114
Edwards, J.D., Perkins, M., Ross, L.A., & Reynolds, S.L. (2009) Driving Status and Three-Year Mortality
Among Community-Dwelling Older Adults J Gerontol A Biol Sci Med Sci. Vol 64A. No 2, pp 300 – 305.
doi:10.1093/gerona/gln019
Freeman, E.E.; Gange, S.J.; Munoz, B.; West, S.K. (2006) Driving status and risk of entry into long-term care in
older adults. Am. J. Public Health 2006, 96, pp 1254–1259.
Frittelli, C., Borghetti, D., Iudice, G., Bonanni, E., Maestri,M., Tognoni, G., Pasquali, L., Iudice, A (2009) “Effects
of Alzheimer’s disease and mild cognitive impairment on driving ability: a controlled clinical study by simulated
driving test,” International Journal of Geriatric Psychiatry: A journal of the psychiatry of late life and allied
sciences, pp. 232-238. https://doi.org/10.1002/gps.2095
Garcia-Betances, R., Jiminez-Mixco, V., Arredondo, M and Cabrera-Umpierrez, M. (2014) “Using Virtual Reality
for Cognitive Training of the Elderly” American Journal of Alzheimer’s Disease and Other Dementias. Published
online 7 August 2014 at: http://aja.sagepub.com/content/early/2014/08/07/1533317514545866
Hakamies-Blomqvist L (1988) Fatal road accidents involving elderly drivers. Paper presented at the commission
of the European communities workshop on errors in the operation of transport systems, Cambridge.
Hakamies-Blomqvist, L.; Johansson, K.; Lundberg, C. (1996) Medical screening of older drivers as a traffic
safety measure—A comparative Finnish–Swedish evaluation study. J. Am. Geriatr. Soc. 1996, 44, 650–653.
REF
EREN
CES
71
Jacobs, M., van der Zwaana, KF., Hart, EP, Groeneveld, GJ, Roosa, RA. “Comparable rates of simulator sickness
in Huntington’s disease and healthy individuals” Transportation Research Part F: Traffic Psychology and
Behaviour. Volume 60, January 2019, Pages 499-504. https://doi.org/10.1016/j.trf.2018.11.007
Karthaus, M. and Falkenstein, M. (2016) “Functional Changes and Driving Performance in Older Drivers:
Assessment and Interventions.” Geriatrics. Published 20 May 2016.
Kyrö, P. (2004). Benchmarking as an action research process. Benchmarking: An International Journal
Langford, J & Koppel, S. (2006). Epidemiology of older driver crashes – Identifying older driver risk factors and
exposure patterns. Transportation Research Part F: Traffic Psychology and Behaviour. 9. 309-321. doi:10.1016/j.
trf.2006.03.005.
Lavallière, M.; Simoneau, M.; Tremblay, M.; Laurendeau, D.; Teasdale, N. (2012) “Active training and driving-
specific feedback improve older drivers’ visual search prior to lane changes.” BMC Geriatr. 2012, 12, 5.
Likitweerawong, K. and Palee, P. (2018) “The virtual reality serious game for learning driving skills before
taking practical test,” in International Conference on Digital Arts, Media and Technology (ICDAMT), 2018, pp.
158-161
Marottoli, RA, Mendes de Leon, CF and Glass, TA (1997) “Driving cessation and increased depressive
symptoms: Prospective evidence from the new haven EPESE.” Journal of American Geriatric Society. Volume
45: pp 202 – 206.
Marottoli, R.A.; de Leon, C.F.M.; Glass, T.A.;Williams, C.S.; Cooney, L.M., Jr.; Berkman, L.F. (2000)
“Consequences of driving cessation: Decreased out-of-home activity levels. J. Gerontol. B 2000, 55, pp
334–340.
Matas,N.A., Nettelbeck, T. & Burns, NR. (2015) “Dropout during a driving simulator study: A survival analysis”
Journal of Safety Research, 55 (2015), pp. 159-169. https://doi.org/10.1016/j.jsr.2015.08.004
Mezuk,B. & Rebok, G.W. (2008) Social Integration and Social Support Among Older Adults Following Driving
Cessation, The Journals of Gerontology: Series B, Volume 63, Issue 5, Pages S298–303. Accessible at: https://
doi.org/10.1093/geronb/63.5.S298
Michaels J, Chaumillon R, Nguyen-Tri D, Watanabe D, Hirsch P, Bellavance F, et al. (2017) Driving simulator
scenarios and measures to faithfully evaluate risky driving behaviour: A comparative study of different driver
age groups. PLoS ONE 12(10): e0185909. https://doi.org/10.1371/journal.pone.0185909
Mullen, NW., Weaver, B., Riendeau, JA., Morrison, L.E., Bédard, M. (2010) “Driving performance and
susceptibility to simulator sickness: Are they related? American Journal of Occupational Therapy, 64 (2) (2010),
pp. 288-295
Musselwhite, C., & Haddad, H. (2010). Exploring older drivers’ perceptions of driving. European journal of
ageing, 7(3), 181–188. doi:10.1007/s10433-010-0147-3
Ni, R., Kang, J., and Andersen, G. (2010) Age-related declines in car following performance under simulated
fog conditions Accid Anal Prev 42 (3): 818 – 826. doi:10.1016/j.aap.2009.04.023.
Peek, S., Michael, T., Wouters, E., Luijkx, K., Vrijhoef, H. (2016) “What it Takes to Successfully Implement
Technology for Ageing in Place: Focus Groups with Stakeholders.” Journal of Medical Internet Research 18 (5)
e98 pp 1 – 13. http://www.jmir.org/2016/5/e98/
Preusser, DF., Williams, AF., Ferguson, SA., Ulmer, RG., Weinstein, HB. (1998) “Fatal crash risk for older drivers
at intersections.” Accid Anal Prev. 30(2):pp 151-159.
Redelmeier, D.A.; Yarnell, C.J.; Deva Thiruchelva, A.B.; Tibshirani, R.J. (2012) “Physicians’ Warnings for unfit
drivers and the risk of trauma from road crashes. N. Engl. J. Med. 2012, 367, pp 1228–1236

72
Reed, N., Parkes, A., Peacock, C., Lang, B. & Rehm, L, (2007) SCOTSIM: An Evaluation of The Effectiveness
of Two Truck Simulators for Professional Driver Training. Accessed at: https://www.researchgate.net/
publication/276886488_SCOTSIM_an_evaluation_of_the_effectiveness_of_two_truck_simulators_for_
professional_driver_training/citation/download
Roenker, D.L.; Cissel, G.M.; Ball, K.K.;Wadley, V.G.; Edwards, J.D. (2003) “Speed-of-processing and driving
simulator training result in improved driving performance.” Hum. Factors 2003, 45, pp 218–233
Schlag, B. (1993) “Elderly drivers in Germany – fitness and driving behaviour.” Accid Anal Prev, 1993, Feb 25
(1) pp 47 – 55.
Siren, A.; and Meng, A. (2012) “Cognitive screening of older drivers does not produce safety benefits.” Accid.
Anal. Prev. 2012, 45, pp 634–638.
Szlyk, J.P.; Pizzimenti, C.E.; Fishman, G.A.; Kelsch, R.; Wetzel, L.C.; Kagan, S.; Ho, K. (1995) “A comparison of
driving in older subjects with and without age-related macular degeneration.” Arch. Ophthalmol. 1995, 113,
pp 1033–1040.
Transport Accident Commission, http://www.tac.vic.gov.au/road-safety/statistics/summaries/older-driver-
statistics
Trick,LM., Toxopeus, R. and Wilson,D. (2010) “The effects of visibility conditions, traffic density, and
navigational challenge on speed compensation and driving performance in older adults,” Accident Analysis &
Prevention, vol. 42, pp. 1661-1671.
Webber, S.C.; Porter, M.M.; Menec, V.H. (2010) “Mobility in older adults: A comprehensive framework.”
Gerontologist 2010, 50, pp 443–450
Whelan,M., Langford,J., Oxley, J., Koppel, S. and Charlton,J. (2006) “The Elderly and Mobility: A Review of the
Literature.” Melbourne: Monash University Accident Research Centre. Report No. 255. Accessible at: https://
www.monash.edu/ data/assets/pdf_file/0017/216530/muarc255.pdf Accessed 13 February 2018
World Health Organisation and Alzheimer’s Disease International (2012) “Dementia: A Public Health Priority.”
Accessed at: http://www.who.int/mental_health/publications/dementia_report_2012/en/ Accessed 13
February 2018
73
APPENDIX A –
PLAIN LANGUAGE STATEMENT AND CONSENT FORM
TO: Participants
PLAIN LANGUAGE STATEMENT
Full Project Title: Virtual Reality (VR) Driving Simulator for Elderly Drivers
Principal Researcher: A/Prof. Ben Horan
Student Researcher:
Associate Researcher(s): Michael Mortimer, Sue Thomson, Alicia Eugene
You are invited to take part in this research project. You have been invited to participate because you meet the criterion
for participation in relation to your age being sixty-five (65) years and older. This Plain Language Statement/Consent Form
tells you about the research project. It explains what is involved in using the virtual reality driving simulator and why we are
conducting this research. Knowing what is involved will help you decide if you want to take part in the research. Please read
this information carefully. Ask questions about anything that you don’t understand or want to know more about. Before
deciding if to take part, you might want to talk about it with a relative or friend.
Participation in this research is completely voluntary. If you don’t wish to take part you don’t have to.
If you decide you want to take part in the research project, you will be asked to sign the consent form. By signing it you are
telling us that you:
• Understand what you have read;
• Consent to take part in the research project; and
• Consent to the collection and use of your personal and health information as described You will be given a copy of this
Plain Language Statement (PLS) and Consent Form to keep.
WHO IS ORGANISING AND FUNDING THIS RESEARCH?
This research project is being conducted by McLean Care in collaboration with Deakin University and Aubade Consultants.
It is funded by the Australian Government through the Dementia and Aged Care Services fund and McLean Care is the
primary grant recipient. Staff from Deakin University and Aubade Consultants will receive payment from McLean Care for
undertaking the research.
Date:
Introduction
74
You and your families will not benefit financially from this research project, even if knowledge acquired through this research
leads to discoveries that are of commercial value to McLean Care and/or Deakin University.
No member of the research team will receive a personal financial benefit from your involvement in this research project other
than their ordinary wages.
WHO HAS REVIEWED THE RESEARCH PROJECT?
All research in Australia involving humans is reviewed by an independent group of people called a Human Research Ethics
Committee (HREC). The ethical aspects of this research project have been approved by the HREC of Deakin University.
This project will be carried out according to the National Statement on Ethical Conduct in Human Research (2007). This
statement has been developed to protect the interests of people who agree to participate in human research studies.
WHAT IS THE PURPOSE OF THIS RESEARCH?
Overall, this research explores whether a virtual reality driving simulator can help older drivers to test their driving competence
in a completely safe, low-risk “virtual environment” and use the information generated to make informed decisions regarding
ongoing driving licencing options.
Driving is the key to independence for many adults. However, the ability to drive safely can begin to decline in older drivers,
and therefore there is a need to strike a balance between continued independence of individual drivers and broader
considerations of general road safety. The decision as to whether to retain or relinquish a driver’s licence has a direct impact
on the quality of life of older people and, often, on their need to access aged care services. Some research has shown that
older people are more likely to access residential aged care once they relinquish their licence, even if their preference is to stay
in their own homes. Currently in NSW, it is compulsory for older drivers to take a practical driving test every two year after
their 85th birthday. Similar requirements are also in place in other states and territories in Australia.
The purpose of this research is to understand:
• If participants find that using the simulator provides useful information about their driving competence;
• If participants find that this information about their driving competence is useful in informing future decisions about
driver licencing;
• The level of user acceptance of the technology;
• To what extent the final product delivers against the intended design outcomes and the feedback from users in the
earlier release stages;
• Whether the process utilised to deliver the project is effective.
This research has been funded by the Australian Government through the Dementia and Aged Care Services fund.
This research is being conducted through a collaborative partnership between McLean Care, Deakin University and Aubade
Consultants.
WHAT DOES PARTICIPATION IN THIS RESEARCH INVOLVE?
This project involves giving older drivers the opportunity to drive in a safe, low-risk “virtual” environment. It is expected that
the virtual driving experience will help elderly drivers understand more about their competence as a driver and / or to practice
driving without actually being on the road.
The simulator will include different road environments and realistic driving scenarios such as country driving, driving in town
and responding to various levels of road traffic and commonly encountered driving hazards. It is modelled on the local
township of Inverell in regional NSW.
More than just a driving simulator, it will also monitor and record a range of important data and information from the user
such as their response rate times and other important health and performance metrics. This is expected to provide older
drivers with important information to help them make an informed decision about their driving in a completely private, safe
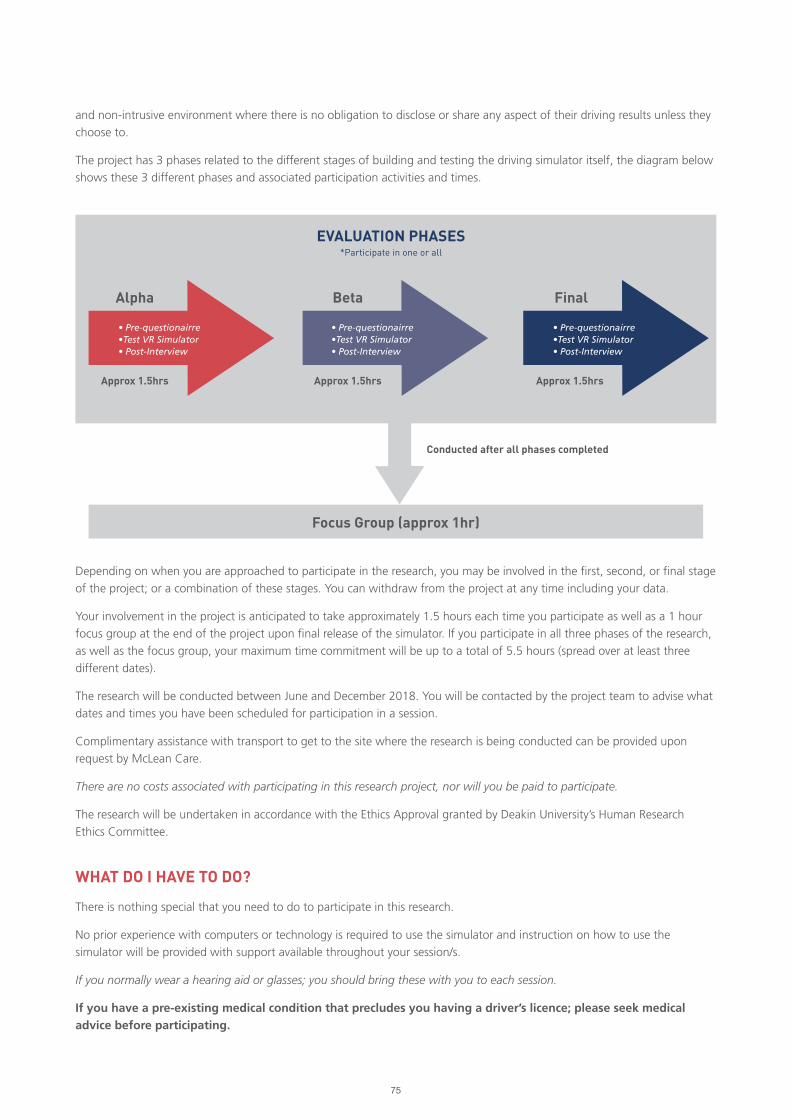
75
and non-intrusive environment where there is no obligation to disclose or share any aspect of their driving results unless they
choose to.
The project has 3 phases related to the different stages of building and testing the driving simulator itself, the diagram below
shows these 3 different phases and associated participation activities and times.
Depending on when you are approached to participate in the research, you may be involved in the first, second, or final stage
of the project; or a combination of these stages. You can withdraw from the project at any time including your data.
Your involvement in the project is anticipated to take approximately 1.5 hours each time you participate as well as a 1 hour
focus group at the end of the project upon final release of the simulator. If you participate in all three phases of the research,
as well as the focus group, your maximum time commitment will be up to a total of 5.5 hours (spread over at least three
different dates).
The research will be conducted between June and December 2018. You will be contacted by the project team to advise what
dates and times you have been scheduled for participation in a session.
Complimentary assistance with transport to get to the site where the research is being conducted can be provided upon
request by McLean Care.
There are no costs associated with participating in this research project, nor will you be paid to participate.
The research will be undertaken in accordance with the Ethics Approval granted by Deakin University’s Human Research
Ethics Committee.
WHAT DO I HAVE TO DO?
There is nothing special that you need to do to participate in this research.
No prior experience with computers or technology is required to use the simulator and instruction on how to use the
simulator will be provided with support available throughout your session/s.
If you normally wear a hearing aid or glasses; you should bring these with you to each session.
If you have a pre-existing medical condition that precludes you having a driver’s licence; please seek medical advice before participating.
Alpha
Approx 1.5hrs Approx 1.5hrs
Conducted after all phases completed
Approx 1.5hrs
Beta
Focus Group (approx 1hr)
Final
EVALUATION PHASES*Participate in one or all
• Pre-questionairre•Test VR Simulator• Post-Interview
• Pre-questionairre•Test VR Simulator• Post-Interview
• Pre-questionairre•Test VR Simulator• Post-Interview
76
When you attend a scheduled session, you will be asked to complete some questionnaires and then take part in a simulated
driving experience using virtual reality technology. You will be interviewed again after your driving experience.
The user experience for the driving simulator has been designed to mimic real life driving as much as possible. Several
considerations have been factored in to the design of the simulator to ensure it is very user-friendly and accessible for older
drivers, including those with mobility issues. This includes adjustable seat heights, a familiar Australian vehicle, and the
graphics in the VR environment modelled on the local Inverell township. One-on-one support to fit and use the VR headset
will also be provided.
WHAT ARE THE POSSIBLE BENEFITS OF TAKING PART?
By deciding to participate in this project, you will be taking part in research that is the first-of-its-kind in Australia.
You will personally receive completely private and confidential information regarding your virtual driving experience that you
might find interesting such as your driving response rate times.
Some research indicates that using virtual reality technology can be an enjoyable and exciting experience for participants as it
exposes people to a new experience.
Your input and participation will also help to contribute to the body of research regarding the impact that driving has on the
general well-being on elderly people; and the importance of exploring emerging technologies as a tool for supporting older
people to make an informed decision about their ongoing driving competence.
WHAT ARE THE POSSIBLE RISKS AND DISADVANTAGES OF TAKING PART?
There are no known or anticipated risks or disadvantages of taking part in this research.
Consistent with real-life driving experiences and the use of technology such as 4D movies and gaming technology, some
participants may experience some discomforts such as motion sickness and or claustrophobia.
A trained staff member will be in the room with you at all times and if you are experiencing any discomfort, you can stop
immediately and simply remove the headset. If the headset causes discomfort, you can choose to use an alternative projected
visual display instead.
WILL I BE GIVEN THE RESULTS OF THE RESEARCH PROJECT?
Each individual participant can request to access the data collected from their driving experience in either a printed or
electronic format.
If you indicate on this consent form (by ticking the relevant box) that you would like to receive information on the general
outcomes of the research project, you will be sent a copy of a research summary document at the conclusion of the project
period to the postal address or email address that you have nominated.
WHAT WILL HAPPEN TO INFORMATION ABOUT ME?
The information you supply in the questionnaires and interviews together with the results of your driving experience will be
stored in a re-identifiable format and be used for general data analysis within the overall sample of 50 people.
A re-identifiable format means that all individual identifiers (e.g. your name and personal details) will be not be stored in
the same location with the data collected about your use of the simulator. A unique 8-digit number will be used to store
your data and you will be given a copy of this number in your first evaluation activity. This number is linked to your personal
identifiers (e.g. your name and personal details) using another key which will be stored separately by the lead researcher. You
will be requested to bring this number to subsequent evaluation activities. If you lose this number for subsequent research
activities you can ask the research team to recover the number for you.
77
Video or audio recorded will also be stored securely using the same 8-digit number and without your personal
details attached.
Only the approved researchers listed in this research form will have direct access to your data.
The data will be securely stored in a format approved by the University for a minimum period of 5 years in accordance with
the Deakin ethics approval requirements.
In accordance with relevant Australian and NSW privacy and other relevant laws, you have the right to request access to your
information collected and stored by the research team. You also have the right to request that any information be withdrawn
or corrected. Please contact one of the research team members listed in the contacts section below if you would like to
access your information.
It is anticipated that the results of this research project will be published and/or presented in a variety of forums. In any
publication and/or presentation, information will be provided in such a way that you cannot be identified unless prior
permission has been obtained.
OTHER RELEVANT INFORMATION ABOUT THE RESEARCH PROJECT
It is anticipated that a total of 50 people from the New England region will participate in this research project.
Participants may be recruited at different stages of the project. All participants of a particular phase of the project will
undergo through the same process, and there are no control/case groups in this project.
All research will be undertaken at McLean Care’s customised VR room facility located at 67 Killean Street, Inverell, NSW.
CONTACTS
The person you may need to contact will depend on the nature of your query.
If you want more information concerning this project or want to discuss your involvement in the project further, you can
contact:
General enquiries
Name Alicia Eugene
Position Project Manager
Telephone 0447 336 987
Email [email protected]
Chief Executive Officer (CEO)
Name Sue Thomson
Position Chief Executive Officer (CEO)
Telephone (02) 6721 7300
Email [email protected]
Name Associate Professor Ben Horan
Position Research Lead
Telephone 0401 345 711
Email [email protected]
78
COMPLAINTS
If you have any complaints about any aspect of the project, the way it is being conducted or any questions about your rights
as a research participant, then you may contact:
Name The Human Research Ethics Office
Address Deakin University, 221 Burwood Highway, Burwood
Victoria 3125
Telephone (03) 9251 7129
Email [email protected]
* Please quote project number BH00028

79
PLAIN LANGUAGE STATEMENT
AND CONSENT FORM
TO: Participants
CONSENT FORM
Full Project Title: Virtual Reality (VR) Driving Simulator for Elderly Drivers
Reference Number: BH00028
I have read and I understand the attached Plain Language Statement.
I freely agree to participate in this project according to the conditions in the Plain Language Statement.
I understand that as a willing participant of the project I may be recorded either via audio or video during individual
interviews or focus groups. I will have the option to review any audio, video recordings and can request the withdrawal of the
recorded content or amend any transcripts created as part of the interviewing or focus group process.
I understand that the research project may consist of up to 3 different evaluation phases each requiring approximately
1.5 hours of participation as well a possible 1 hour focus group session. Participation is voluntary and I have the option to
withdraw at any phase.
I have been given a copy of the Plain Language Statement and Consent Form to keep.
The researcher has agreed not to reveal my identity and personal details, including where information about this project is
published, or presented in any public form.
Participant’s Name (printed)
Signature Date
Date:
(Tick here) I would like to receive information on the general outcomes of the research project, and send it to:
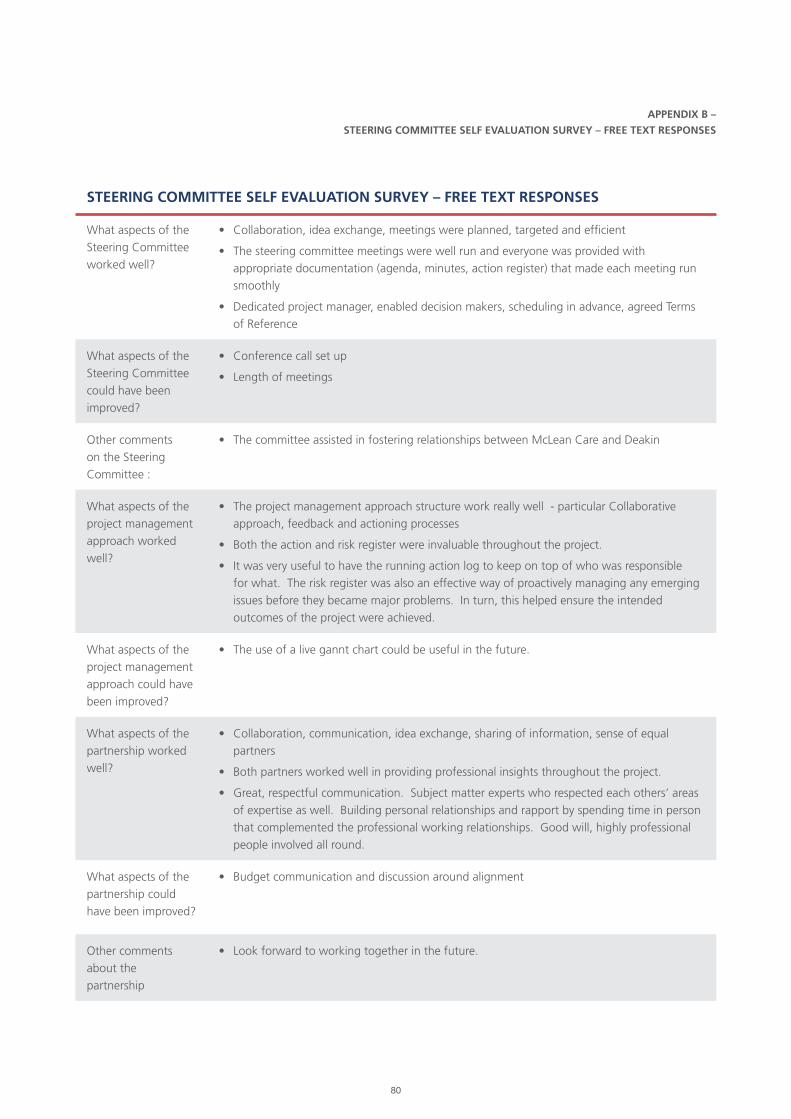
80
APPENDIX B –
STEERING COMMITTEE SELF EVALUATION SURVEY – FREE TEXT RESPONSES
STEERING COMMITTEE SELF EVALUATION SURVEY – FREE TEXT RESPONSES
What aspects of the
Steering Committee
worked well?
• Collaboration, idea exchange, meetings were planned, targeted and efficient
• The steering committee meetings were well run and everyone was provided with
appropriate documentation (agenda, minutes, action register) that made each meeting run
smoothly
• Dedicated project manager, enabled decision makers, scheduling in advance, agreed Terms
of Reference
What aspects of the
Steering Committee
could have been
improved?
• Conference call set up
• Length of meetings
Other comments
on the Steering
Committee :
• The committee assisted in fostering relationships between McLean Care and Deakin
What aspects of the
project management
approach worked
well?
• The project management approach structure work really well - particular Collaborative
approach, feedback and actioning processes
• Both the action and risk register were invaluable throughout the project.
• It was very useful to have the running action log to keep on top of who was responsible
for what. The risk register was also an effective way of proactively managing any emerging
issues before they became major problems. In turn, this helped ensure the intended
outcomes of the project were achieved.
What aspects of the
project management
approach could have
been improved?
• The use of a live gannt chart could be useful in the future.
What aspects of the
partnership worked
well?
• Collaboration, communication, idea exchange, sharing of information, sense of equal
partners
• Both partners worked well in providing professional insights throughout the project.
• Great, respectful communication. Subject matter experts who respected each others’ areas
of expertise as well. Building personal relationships and rapport by spending time in person
that complemented the professional working relationships. Good will, highly professional
people involved all round.
What aspects of the
partnership could
have been improved?
• Budget communication and discussion around alignment
Other comments
about the
partnership
• Look forward to working together in the future.
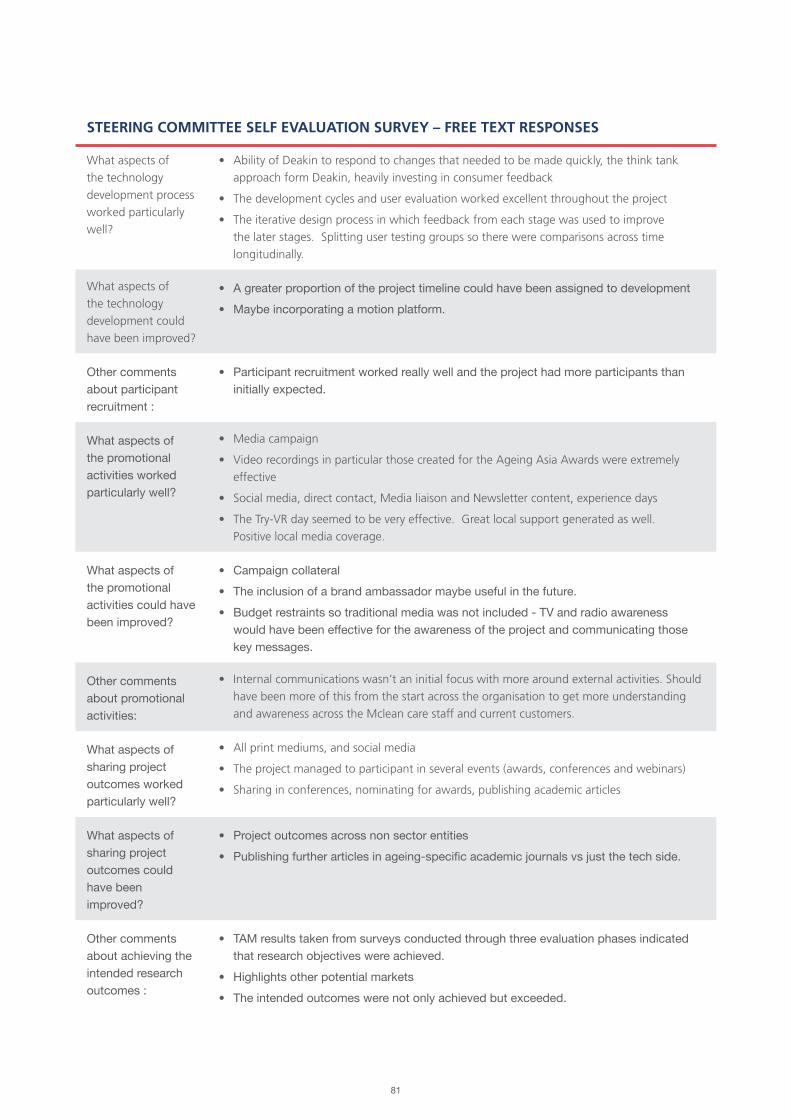
81
STEERING COMMITTEE SELF EVALUATION SURVEY – FREE TEXT RESPONSES
What aspects of
the technology
development process
worked particularly
well?
• Ability of Deakin to respond to changes that needed to be made quickly, the think tank
approach form Deakin, heavily investing in consumer feedback
• The development cycles and user evaluation worked excellent throughout the project
• The iterative design process in which feedback from each stage was used to improve
the later stages. Splitting user testing groups so there were comparisons across time
longitudinally.
What aspects of
the technology
development could
have been improved?
• A greater proportion of the project timeline could have been assigned to development• Maybe incorporating a motion platform.
Other comments about participant recruitment :
• Participant recruitment worked really well and the project had more participants than initially expected.
What aspects of the promotional activities worked particularly well?
• Media campaign
• Video recordings in particular those created for the Ageing Asia Awards were extremely
effective
• Social media, direct contact, Media liaison and Newsletter content, experience days
• The Try-VR day seemed to be very effective. Great local support generated as well.
Positive local media coverage.
What aspects of the promotional activities could have been improved?
• Campaign collateral• The inclusion of a brand ambassador maybe useful in the future.• Budget restraints so traditional media was not included - TV and radio awareness
would have been effective for the awareness of the project and communicating those key messages.
Other comments about promotional activities:
• Internal communications wasn’t an initial focus with more around external activities. Should
have been more of this from the start across the organisation to get more understanding
and awareness across the Mclean care staff and current customers.
What aspects of sharing project outcomes worked particularly well?
• All print mediums, and social media
• The project managed to participant in several events (awards, conferences and webinars)
• Sharing in conferences, nominating for awards, publishing academic articles
What aspects of sharing project outcomes could have been improved?
• Project outcomes across non sector entities• Publishing further articles in ageing-specific academic journals vs just the tech side.
Other comments about achieving the intended research outcomes :
• TAM results taken from surveys conducted through three evaluation phases indicated that research objectives were achieved.
• Highlights other potential markets• The intended outcomes were not only achieved but exceeded.

82
STEERING COMMITTEE SELF EVALUATION SURVEY – FREE TEXT RESPONSES
What do you
think were the key
enablers for this
project?
• The shared vision and strategy alignment of the project, ability to be flexible with project
and Hector design
• The collaborative partnership between industry (McLean Care) and university (Deakin).
• The immersive experience of the car
• Right staff, right mix of subject matter expertise, well framed research approach,
project manager.
What do you think
were the main
issues and barriers
encountered?
• Motion sickness has been a real barrier
• The main challenge was the timeline required for development
• VR technology environment and the final location
• Unanticipated rates of motion sickness by users.
What would you do
the same in another
similar project?
• Collaborative approach, idea think tanks, project deigns approach
• I would do the majority of the project the same as it provided a great foundation.
• Testing phase
• Agreed roles and responsibilities in contract at start, project manager, running action log
What would you do
differently in another
similar project?
• Add additional time in for final handover - seemed a bit rushed Add an additional budget
for user testing so that some of the barriers can be overcome or mitigate in a better
time frame
• Try and assign more development time, although this was difficult through this
project as I believe it provided a good balance between research, development and
promotional elements.
• Publicly visible - top of the mind awareness, more people talking about it
What do you think
were the main
benefits that were
generated out of this
project?
• Developing technology solution that actively delivers a social benefit to the older person
• There are two main benefits I believe were generated out of the project, the first of its kind
mixed reality driving simulator that provides valuable information for oilder drivers aged
65+. The second benefit was the inclusion of older participants throughout the project, even
if the Hector driving simulator wasn’t a succesful the older participants who were part of
user evluations and a real sense of inclusion to help benefit society through such advanced
research.
• The process and findings
• A fit for purpose driving simulator prototype that can be used by older drivers as well as
a range of other potential target groups. Positive media exposure for McLean Care. An
effective industry-research partnership that can be leveraged for future projects.
Who were the
beneficiaries from
this project?
• People over the aged of 65 - but the project has wider applications
• Mclean Care, Deakin University, driver’s aged 65+ and public through possible improvements
that could be made to general road safety.
• McLean Care, Deakin and the Aged Care industry
• Older people directly involved. Older people in general. McLean Care, Deakin University
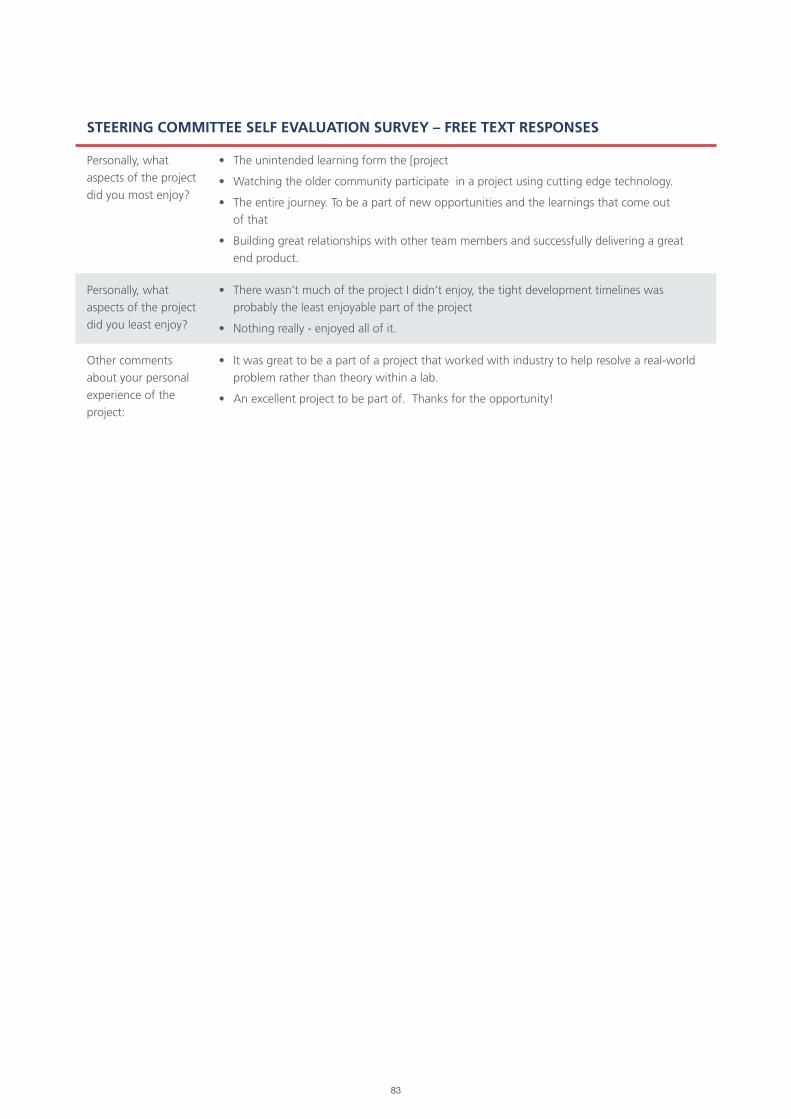
83
STEERING COMMITTEE SELF EVALUATION SURVEY – FREE TEXT RESPONSES
Personally, what
aspects of the project
did you most enjoy?
• The unintended learning form the [project
• Watching the older community participate in a project using cutting edge technology.
• The entire journey. To be a part of new opportunities and the learnings that come out
of that
• Building great relationships with other team members and successfully delivering a great
end product.
Personally, what
aspects of the project
did you least enjoy?
• There wasn’t much of the project I didn’t enjoy, the tight development timelines was
probably the least enjoyable part of the project
• Nothing really - enjoyed all of it.
Other comments
about your personal
experience of the
project:
• It was great to be a part of a project that worked with industry to help resolve a real-world
problem rather than theory within a lab.
• An excellent project to be part of. Thanks for the opportunity!

84
Related Documents