Virtual power plant in South Australia Stage 1 milestone report 31 July 2017

Welcome message from author
This document is posted to help you gain knowledge. Please leave a comment to let me know what you think about it! Share it to your friends and learn new things together.
Transcript

Virtual power plant in South Australia Stage 1 milestone report 31 July 2017

VPP-SA Public Milestone 1 Report - Final.docx AGL Confidential 1
AGL Energy Limited
ABN: 74 115 061 375
Level 24, 200 George St
Sydney NSW 2000
Locked Bag 1837
St Leonards NSW 2065
t: 02 9921 2999
f: 02 9921 2552
agl.com.au
Table of contents
1 Introduction ........................................................................................................................................4
1.1 Process overview ...............................................................................................................................4
1.2 Project context ...................................................................................................................................4
1.3 Review of performance against Stage 1 objectives .......................................................................7
2 Current stage review ..........................................................................................................................7
2.1 Development of a commercial offering ............................................................................................7
2.2 Technical product development .......................................................................................................8
2.3 Program launch ............................................................................................................................... 11
2.4 Lead generation .............................................................................................................................. 12
2.5 Sales activity ................................................................................................................................... 13
2.6 Voice of the customer ..................................................................................................................... 15
2.7 Energy storage system sales and installation metrics ............................................................... 18
2.8 Sales and installation lessons learned ......................................................................................... 18
3 Project highlights and challenges to date .................................................................................... 20
3.1 Customer acquisition ..................................................................................................................... 20
3.2 Customer demographics ................................................................................................................ 22
4 VPP performance ............................................................................................................................ 24
4.1 VPP performance summary ........................................................................................................... 24
4.2 VPP orchestration events............................................................................................................... 24
4.3 Fleet dispatch Test 1 details and results ...................................................................................... 24
4.4 Fleet dispatch Test 2A details and results ................................................................................... 25
4.5 Fleet dispatch Test 2B details and results ................................................................................... 26
4.6 Frequency control test details and results................................................................................... 28
4.7 Key learnings ................................................................................................................................... 29
5 Normal operation ............................................................................................................................ 30
5.1 Aggregated charge/discharge profiles (including coordinated fleet control) .......................... 32
5.2 Aggregated state of charge profile of the VPP ............................................................................ 32
6 HSE tracking and performance ..................................................................................................... 34
6.1 Lessons learned .............................................................................................................................. 34
6.2 Energy storage system safety ....................................................................................................... 34
VPP-SA Public Milestone 1 Report - Final.docx AGL Confidential 2
Executive summary
This report details AGL’s progress against the Stage 1 objectives of its 5 MW virtual power plant in South Australia (SA-VPP) project, and is submitted in partial fulfilment of AGL’s knowledge sharing obligations for the project’s funding partner, Australian Renewable Energy Agency (ARENA).
When complete, the 5 MW virtual power plant (VPP) will consist of 1,000 distributed energy storage systems capable of dispatching more than 9 MWh of stored energy.
At its core, the SA-VPP project seeks to demonstrate the role of distributed ‘smart’ energy storage in enabling higher penetrations of renewables in the grid. This is particularly important in the context of the discussion around grid resilience and reliability in South Australia.
As older synchronous generation is retired, dispatchable storage becomes an increasingly important component in the generation mix. The VPP provides a powerful mechanism to achieving this storage capability whilst sharing the costs and benefits of that storage amongst all stakeholders, namely consumers, wholesale market participants, and network operators.
AGL has successfully completed Stage 1 of the three-stage project and at the time of writing had sold the 150 energy storage systems allocated to this stage three months ahead of schedule. As at the end of February, 47 energy storage systems had now been installed in customers’ homes and initial trials had demonstrated that the VPP can respond as expected to both planned and unplanned dispatch events, and has the potential to respond rapidly enough to reliably participate in the six second contingency Frequency Control Ancillary Services (FCAS) market.
A summary of Stage 1 achievements is provided below, followed by a brief review of projects highlights and key challenges.
Stage 1 achievements
Technology offering
The Sunverge One Energy Storage System (previously Sunverge SIS) had been selected as
the standard hardware platform for Phase 1 of the project.
AGL increased the battery size from 7.7 kWh to 11.68 kWh at no cost to consumers to provide
greater value to customers and allow for more flexibility to test different value pools such as
backup power.
Sales performance
Sales of 150 energy storage systems were achieved well ahead of schedule by December 2016
and as at the end of February, sales of Stage 2 energy storage systems were well progressed.
There had been significant demand for the program with more than 1,200 initial leads
generated, largely from news coverage of the launch and associated social media interest.
Delivery and installation capability
At the time of writing AGL had trained four installation crews and assisted 12 electricians gain
their Clean Energy Council (CEC) accreditation for energy storage system installation as a
direct result of this program.
At the time of writing, AGL had the capacity to install approximately 12-15 energy storage
systems per week and was well progressed with plans to increase that capacity further.
At the time of writing, AGL had 47 energy storage systems currently installed.

VPP-SA Public Milestone 1 Report - Final.docx AGL Confidential 3
Stakeholder Reference Group
At the time of writing, two successful Stakeholder Reference Group meetings had been held,
which included key regulatory and policymaking bodies, as well as network service providers,
and consumer advocacy groups.
VPP performance
A series of tests were performed to demonstrate the VPP’s ability to respond to dispatch
commands, simulating a variety of dispatch ‘events’.
Initial tests showed that the VPP, even with a very small number of units installed, either
completely or substantially achieved all test criteria, proving that batteries can respond reliably
to both planned and unplanned dispatch events. Further details are provided in this report.
Early results suggested that the VPP may be able to participate in the 6 second contingency
FCAS market, but further work is required in subsequent stages to further investigate how this
may be implemented in practice.
Next steps
AGL successfully completed Stage 1 of the project by selling 150 energy storage systems. At the time of writing, sales of the next 350 units for Stage 2 were well advanced and as at the end of February 12-15 energy storage systems were being installed per week thanks to increasing installation capacity.

VPP-SA Public Milestone 1 Report - Final.docx AGL Confidential 4
1 Introduction
1.1 Project progress overview
AGL successfully completed Stage 1 of its South Australian virtual power plant program which required the
sale of 150 energy storage systems. In fact, at the time of writing, more than 250 systems had been sold
(including 150 units sold as a part of Stage 1, and more than 100 sold as a part of Stage 2). More than 70 of
the energy storage systems sold as a part of Stage 1 had been installed.
The SA-VPP program seeks to demonstrate the value that grid-connected batteries can create for a range
of stakeholders when managed as part of a coordinated virtual power plant. The value streams that have
been demonstrated in the program thus far are summarised in Table 1.1.1
Table 1.1.1: Value stream demonstration status
Value Stream Recipient Status
Increasing solar self-consumption Consumer Functionality demonstrated through ongoing performance monitoring
Utilising backup power in the event of an outage Consumer Demonstrated through discreet event
Network support through peak demand management
Network service provider
Capability demonstrated through discreet event – see Section 4
Network support through frequency control services
Network service provider
Capability demonstrated through discreet event – see Section 4
Physical hedge or arbitrage opportunity in wholesale energy market
Retailer Capability demonstrated through discreet events – see Section 4
Once complete, the SA-VPP project will include 1,000 smart, connected batteries installed behind-the-meter,
with a combined nameplate output of 5 MW and an energy storage capacity of more than 9.8 MWh.
1.2 Project context
The project is particularly important in the context of Austalia’s energy market transformation as well as South
Australia’s particular energy security position.
Customers are playing an important role in Australia’s energy market transformation, driving a shift away
from the traditional linear electricity supply chain, to a more decentralised and bi-directional market. In
addition to one in four households across Australia with installed solar PV, a proliferation of more advanced
distributed energy resources (DER) (digital metering, smart inverters, energy storage, energy management
systems, household appliance with smart controls etc.) are now entering the consumer market. These
distributed technologies offer new opportunities for customers to actively manage their energy use and to
share in value beyond the home – whether by ‘sharing’ energy with peers or participating in programs which
support the operation of the network or the wholesale market. These developments are affecting grid
utilisation and fundamentally changing the way in which consumers interact with the electricity grid.
The NEM was framed on the basis of thermal capacity investments and in most cases, assumes that demand
is relatively inelastic and that dispatchable thermal generation is able to meet demand. The optimal
VPP-SA Public Milestone 1 Report - Final.docx AGL Confidential 5
generation mix therefore becomes the balance between the load duration curve and price duration curves.
The shift to renewable energy is showing the limitations of the NEM’s thermal-centric design in that both the
load duration and price duration curves are shifting, diminishing the economic viability of incumbent large
scale synchronous generation capacity.
As the generation mix changes to incorporate a growing amount of renewable energy, demand for energy
services such as Frequency Control Ancillary Services (FCAS), reactive power, and inertia will increase as
the traditional suppliers of these services exit the market.
AGL anticipates that the needs of the wholesale energy market will increasingly be supplied through a
proliferation of DER, and the extent of the uptake and utilisation of DER may affect the role of large scale
assets within future markets. Accordingly, the wholesale market will increasingly need to accommodate a
diverse portfolio of decentralised low-emissions generation assets, which may affect both the development
of industry scale investments as well as the accessibility of supportive ancillary services.
We anticipate that the role of traditional generation will increasingly be met by flexible DER and a range of
low-emissions generation. However, the proliferation of DER within a broader generation mix will require a
commensurate ability to co-ordinate those assets in order to maximise the benefit to the primary and ancillary
wholesale markets. AGL’s virtual power plant is an example of how DER can deliver those services within a
competitive market if it is orchestrated effectively.
More broadly, AGL believes that the future of the grid will be as a gateway to multiple competitive platforms that enable a range of markets for customers. The distribution network will increasingly become the platform across which customers expect to be able to
connect and transact. Competing energy service providers are beginning to trial and offer innovative products
and services that leverage the grid to provide customers with access to other markets and value streams.
Rather than simply enabling the consumption of electricity delivered from centralised plant, the grid will have
increasingly important role facilitating a range of other service markets. These include markets for grid
stability services (frequency and voltage), markets for services which support the network in constraint
conditions, markets for wholesale demand response at times of tight supply, and 'peer-to-peer' energy
trading.
There will not be a single business or delivery model to enable these mixed interactions and respond to the
broad spectrum of customer needs and preferences. Reflective of the heterogeneity of customer needs and
preferences, AGL expects product and service offerings from a broad mix of energy service providers to be
similarly heterogeneous. The grid should provide a two-way energy platform upon which competing energy
service providers can build their product and service offerings. The distributed energy ecosystem of the future
may involve multiple distributed markets and service platforms co-existing and interacting. Energy service
providers will invest, test, learn and innovate their offerings, and bear the risks and rewards associated with
these endeavours.
The need for an optimisation function therefore is needed and should be carried out by a party that is
independent and exposed to financial incentives. By modifying the overall volume and shape of demand,
DER can be deployed and operated to avoid or delay more expensive augmentations to the network. Further,
smart inverters and local sensing devices can enable the provision of voltage and frequency services back
to the distribution network and is an associated benefit of DER.
However, a network support or grid stability service might only be required on a limited number of occasions
per year, and this is similarly the case with demand response to meet a wholesale supply constraint. The
VPP-SA Public Milestone 1 Report - Final.docx AGL Confidential 6
remainder and majority of the time, customer-owned DER installed behind-the-meter (BTM) is likely to be
employed directly for meeting the comfort and consumption needs of the customer. Accordingly, an efficient
deployment and use of DER will enable co-optimisation across these multiple uses and value streams. It will
also recognise that it is ultimately a customer’s choice as to how their BTM resources are deployed and what
compensation or reward they expect for participating in different service markets (including providing network
support).
AGL sees competition and innovation in technology and business models as the primary means for meeting
this co-optimisation challenge and aligning the interests of energy service providers with those of the
customers they serve. To enable efficient ‘value stacking’ requires the need for the location and size) of grid
support services and their value to the network to be made explicit, so that products and services can be
designed by competing energy service providers to address these and build those values into the commercial
model.
This will directly benefit customers investing in DER by ensuring the least cost deployment and highest value
use of those assets are made, and by promoting the availability of a range of retail offers and bundled
products to meet distinct customer preferences. Importantly, it will indirectly benefit all customers by ensuring
investment in assets or services which support reliable network operation are efficient, thereby ensuring the
efficiency of overall network costs.
South Australia has been at the forefront of a global transition towards high-penetration renewable grids, and
thus presents an important opportunity for the development of innovative business models that can be
subsequently replicated in other jurisdictions.
More than 43% of South Australia’s generation capacity comes from renewable sources. The high
penetration of intermittent generation has impacted the economics of incumbent thermal generators. In 2016,
Northern Power Station was the last of the State’s coal-fired generators to cease operations. A number of
the State’s gas-fired power stations have also been mothballed, with the impacts of changing energy market
dynamics amplified by high gas prices and difficulties accessing new supplies.
South Australia’s Energy Plan 1 places a clear focus on measures that encourage new power supply
indigenous to the State and on technologies which can address the intermittency of variable renewable
generation while also providing system security services (like frequency). Notably, the SA-VPP project shares
many of these goals. In addition to services of direct value to customers (increasing self-consumption of
solar), the program seeks to demonstrate services with system-wide benefits, such as responding to high
spot price events, participating in FCAS markets, and providing network support.
Policy-makers at all levels of government have begun to consider more comprehensively the opportunities
and challenges presented by the integration of new technologies into the grid and maintaining high levels of
security and reliability are being considered in various forums. Indeed, the Independent Review into the future
Security of the National Electricity Market (Finkel Review) delivered a package of recommendations to the
COAG Energy Council that are now being implemented through the Australian Energy Market Commission
(AEMC), the Australian Energy Market Operator (AEMO) and other relevant agencies and statutory
authorities, in consultation with industry and stakeholders. The VPP was featured in the final Finkel Blueprint
as a case study for the effective orchestration of solar and storage to provide multiple services in Australia’s
1 Our Energy Plan: www.ourenergyplan.sa.gov.au
VPP-SA Public Milestone 1 Report - Final.docx AGL Confidential 7
evolving energy system. AGL also presented the VPP to the Commonwealth Standing Committee on the
Environment and Energy in the context of its Inquiry into modernising Australia’s electricity grid.2
Having regard to the current policy context, it is apparent that the VPP program has been established at a
critical time in the transition of Australia’s energy markets. It has begun to inform and indeed challenge grid
operators, market operators and policy makers about the potential for energy storage systems to support the
growth of renewables in the grid. It has also substantially contributed towards policy discussions on the
development of innovative business models to deliver better outcomes for customers.
1.3 Review of performance against Stage 1 objectives
Stage 1 objectives and a review of the program’s performance against these is provided in Table 1.3.1
Table 1.3.1: Summary of performance against Stage 1 objectives
Objective Complete Reference
Establish a Stage 1 technical offering Yes Section 2.2
Establish sales, installation, and enablement mechanisms Yes Section 2.5
Engage stakeholders and begin Stakeholder Reference Group meetings Yes
Consideration and planning of Stage 2 technical offering, marketing, etc. to determine technical and commercial feasibility
Yes Section 2.1
Establish operational systems to support streamlined roll out in the rest of the project Yes Section 0
Demonstrate limited VPP capability Yes Section 4
2 Current stage review
The South Australian virtual power plant program was announced on 5 August 2016, with energy storage sales beginning in early September. The program is designed to be delivered in three stages of 150, 350 and 500 energy storage systems respectively. At the time of writing, the sales for Stage 1 were complete, and installations well progressed. A detailed summary of the key activities carried out during the Stage is provided below.
2.1 Development of a commercial offering
Stage 1 commercial offering and customer eligibility
Early AGL analysis recognised that the largest (and most readily quantifiable) value pool accessible by a VPP was the ability of a customer to use an energy storage system to arbitrage the value of solar exports against the cost of grid imports by cycling their battery at least once per day. Therefore, the commercial proposition needed to appeal to end users in the first instance, and, to achieve uptake at the scale proposed by this program, needed to provide customers with a reasonable economic payback. Further, it was acknowledged that in order to access multiple value streams (customer, network, wholesale), each with a variety of use cases, a battery that was capable of providing multiple warranted cycles per day would be essential.
2 See further https://www.aph.gov.au/Parliamentary_Business/Committees/House/Environment_and_Energy/modernelectricitygrid.
VPP-SA Public Milestone 1 Report - Final.docx AGL Confidential 8
A review of historical solar pricing and installation rates data coupled with qualitative market research showed that to achieve any sort of energy storage system uptake beyond the niche ‘early adopter’ a simple payback approaching seven to eight years was necessary.
In addition to the purchase price of the energy storage system and standard installation for $3,499 and $3,849 in Stages 1 and 2 respectively, AGL also offered the following optional extras as a part of the installation:
Backup power can be purchased for an additional $899. This additional charge includes the cost
of the hardware and labour to install a critical load panel (CLP) to which a number of critical
household circuits can be connected to maintain power to those circuits in the event of a grid
outage, or a disconnection from the grid.
Concrete plinth for an additional $699. Where a customer does not have a suitable existing
concrete base on which to install the energy storage system, AGL offers a concrete plinth as an
additional extra, which is compliant with the Sunverge installation manual and certified to comply
with AS1170.2 and AS1170.4.
2.2 Technical product development
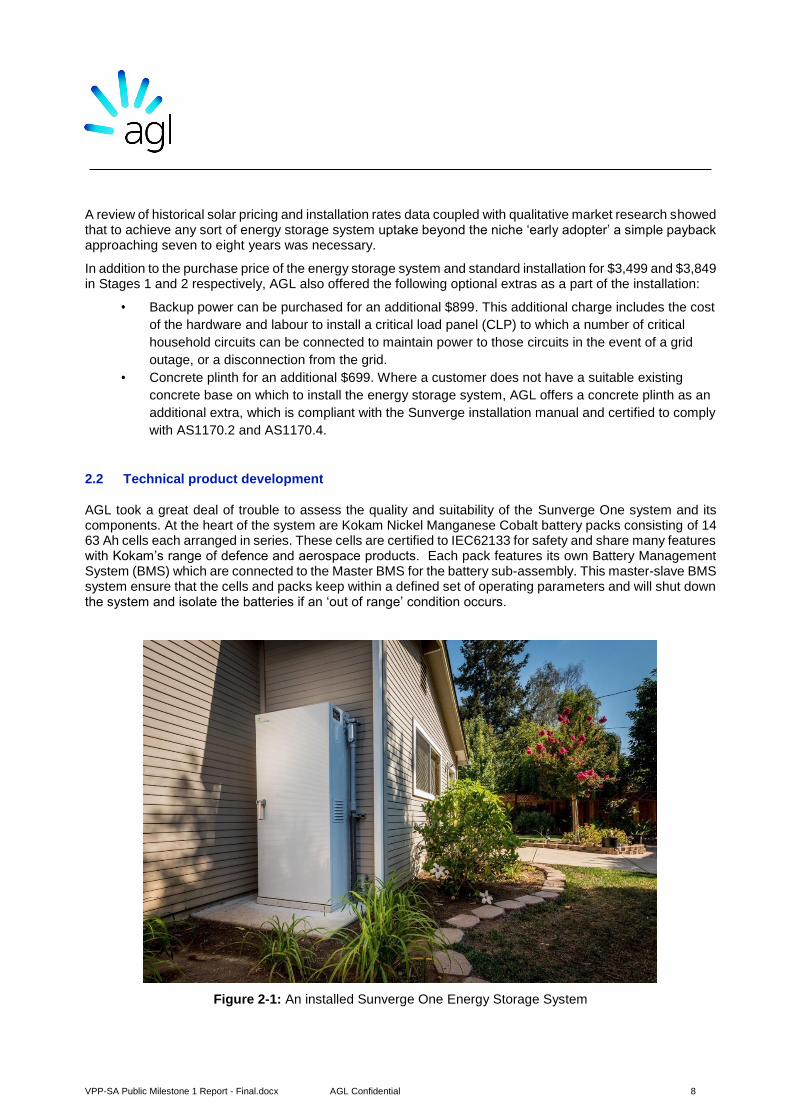
AGL took a great deal of trouble to assess the quality and suitability of the Sunverge One system and its components. At the heart of the system are Kokam Nickel Manganese Cobalt battery packs consisting of 14 63 Ah cells each arranged in series. These cells are certified to IEC62133 for safety and share many features with Kokam’s range of defence and aerospace products. Each pack features its own Battery Management System (BMS) which are connected to the Master BMS for the battery sub-assembly. This master-slave BMS system ensure that the cells and packs keep within a defined set of operating parameters and will shut down the system and isolate the batteries if an ‘out of range’ condition occurs.
Figure 2-1: An installed Sunverge One Energy Storage System
VPP-SA Public Milestone 1 Report - Final.docx AGL Confidential 9
The battery pack is connected to a Schneider Electric Conext XW+ 7048 bi-directional inverter charger. This can provide power to the grid and to a backup circuit, and manage battery charging from both AC and DC sources.
Control is provided using Sunverge’s local software running on simple embedded computing hardware.
2.2.1 Development of a battery offering for the SA-VPP project
As part of this process of developing a bespoke energy storage offering in the SA-VPP project, AGL made the decision to standardise all project hardware around an AC front-coupled architecture . This architecture is particularly important to the success of the project as it allows the Sunverge One Energy Storage System to work with the widest possible range of solar systems; important for the Australian market as there has been a wide diversity of PV inverters installed over the last few years.
Further, installing an AC front-coupled energy storage system avoids the need for the energy storage installer to revisit the compliance of the site’s solar installation if this is already existing. AS/NZS 5033:20143 is the Australian Standard that governs grid connected solar PV systems. Since rooftop solar uptake accelerated sharply in 2008 this standard has been updated several times, most recently in 2012 and 2014.
Any works done on an existing solar system – including installing a DCback-coupled energy storage system – requires the solar PV system to be brought up to standard with the current version of the Standard. Depending on the age of the system, achieving compliance with AS5033 can involve the installation of rooftop isolators, re-stringing of the array, and in some cases potentially changing the solar inverter. These upgrades are both expensive and difficult to predict without a detailed site visit.
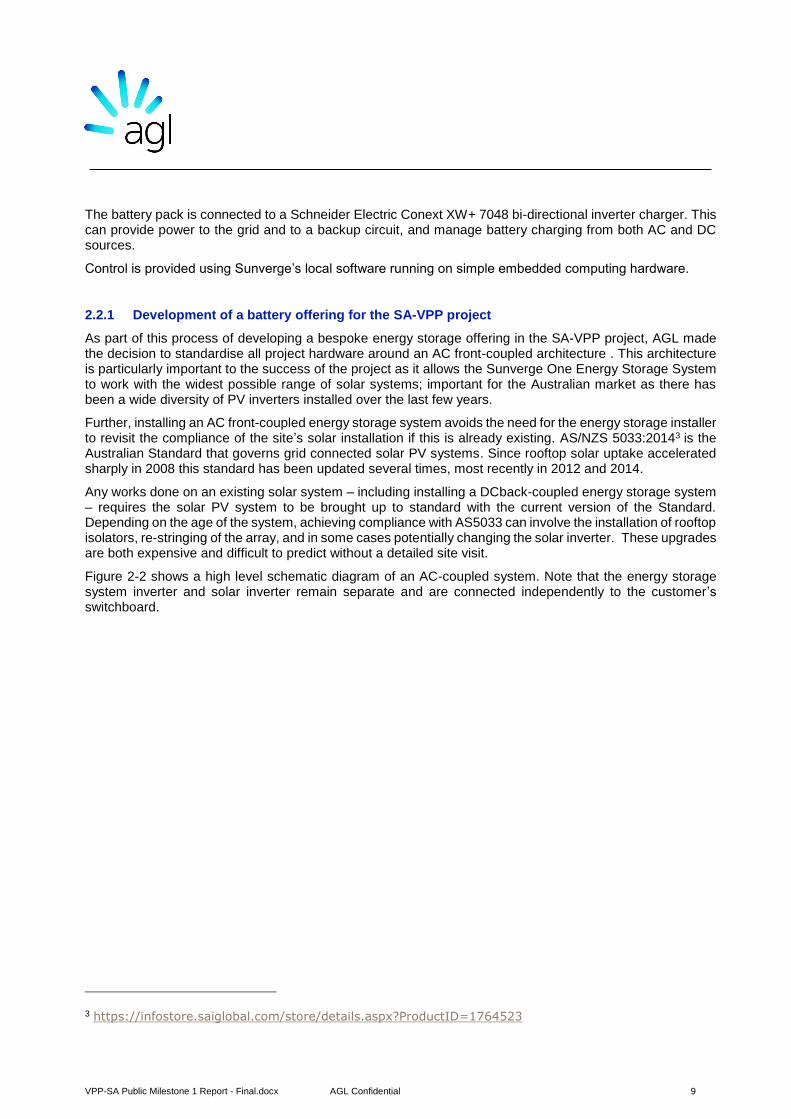
Figure 2-2 shows a high level schematic diagram of an AC-coupled system. Note that the energy storage system inverter and solar inverter remain separate and are connected independently to the customer’s switchboard.
3 https://infostore.saiglobal.com/store/details.aspx?ProductID=1764523
VPP-SA Public Milestone 1 Report - Final.docx AGL Confidential 10
Figure 2-2: AC front-coupled battery configuration
Figure 2-3 shows a DC-coupled system. Note that the solar is connected directly into the energy storage
system and the site has a single inverter.
AC-coupled

VPP-SA Public Milestone 1 Report - Final.docx AGL Confidential 11
Figure 2-3: DC back-coupled configuration
2.3 Program launch
AGL announced the virtual power plant project at a joint press conference with ARENA on 5 August 2016. South Australian Treasurer and Minister for Energy, Tom Koutsantonis, ARENA CEO Ivor Frischknecht, and AGL CEO Andy Vesey were present. The announcement generated significant media attention and was covered by all TV news networks in Adelaide (TEN News Adelaide4, for example).
Several print media outlets also reported on the launch, including:
Renew Economy5
The Australian Financial Review6
Herald Sun7
Adelaide Advertiser8
Energy Storage News9
ABC10
4 https://www.facebook.com/groups/1068159989882540/permalink/1193124300719441/ 5 http://reneweconomy.com.au/agl-invests-worlds-largest-battery-storage-virtual-power-plant-66212/ 6 http://www.afr.com/business/energy/electricity/agl-energy-to-harness-power-of-1000-batteries-in-virtual-power-plant-20160804-gqlll1 7 http://www.heraldsun.com.au/business/agl-chief-andy-vesey-sees-power-in-positive-energy/news-story/8505262cf2a84c792476ada45eb82782 8 http://www.adelaidenow.com.au/business/electricity-market-model-smashed-by-technology-says-agl-boss-vesey/news-story/fa2c7d1654a28db947d7240eb3405700 9 http://www.energy-storage.news/news/south-australia-to-get-worlds-largest-virtual-power-plant 10 http://www.abc.net.au/news/2016-12-15/virtual-power-plant-prototype-installed-in-adelaide/8123390
DC-coupled

VPP-SA Public Milestone 1 Report - Final.docx AGL Confidential 12
2.4 Lead generation
at the time of writing, more than 1,200 leads had been generated between program launch in August 2016 and the end of February 2017. Initial interest came largely from TV news coverage of the announcement and associated coverage in print and social media. Industry press articles, customer referrals and activity on AGL’s community forum message board also contributed to lead generation throughout the program.
A breakdown of leads by source is provided in the table below. This illustrates that the vast majority of initial leads came from indirect page visits (prospects searching for or navigating to the landing page) and calling into the contact centre.
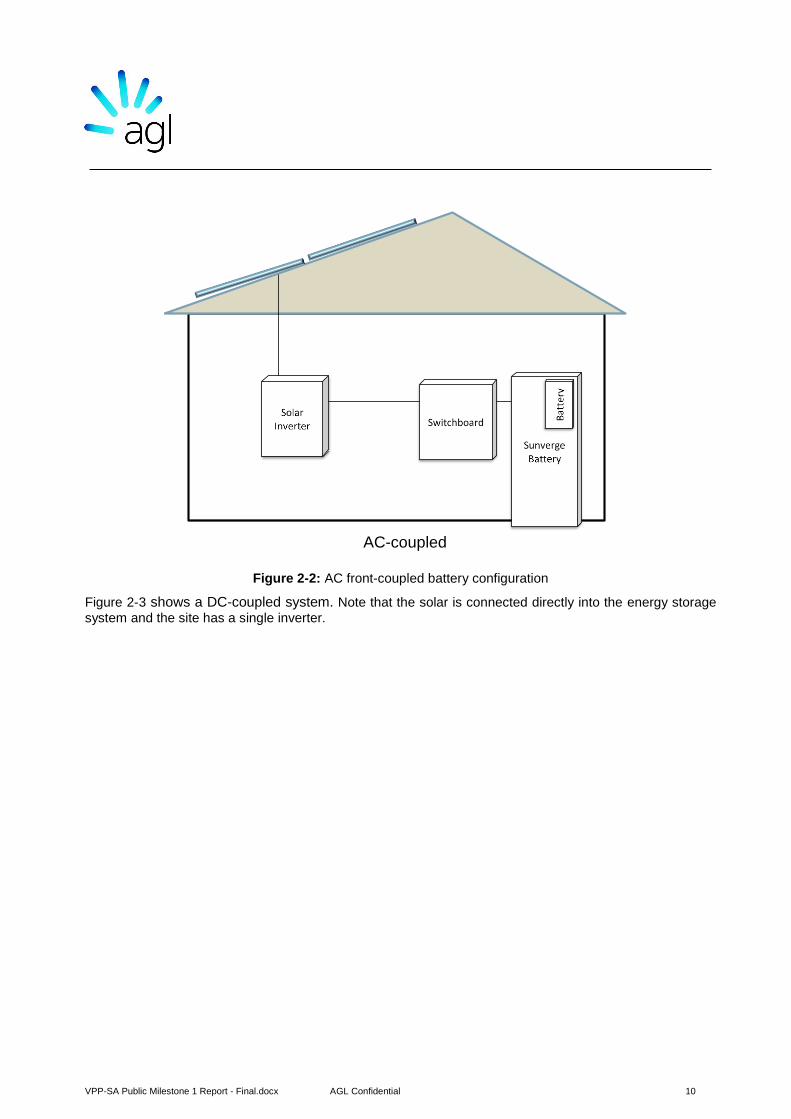
All customers were directed to a dedicated landing page www.agl.com.au/powerinnumbers to register their interest. This page included information about the program, and a video explaining the VPP concept. A screenshot from the landing page is shown in Figure 2-4 and Figure 2-5.
Figure 2-4 Virtual power plant landing page
VPP-SA Public Milestone 1 Report - Final.docx AGL Confidential 13
Figure 2-5 Virtual power plant video
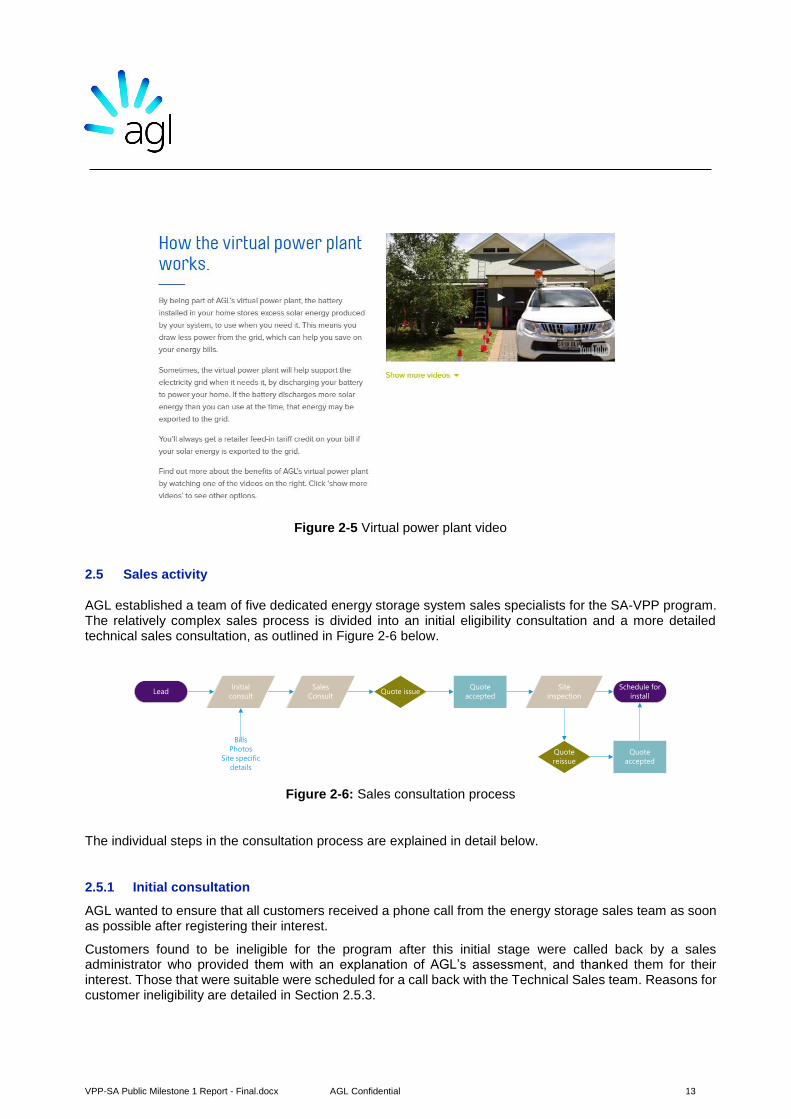
2.5 Sales activity
AGL established a team of five dedicated energy storage system sales specialists for the SA-VPP program. The relatively complex sales process is divided into an initial eligibility consultation and a more detailed technical sales consultation, as outlined in Figure 2-6 below.
LeadInitial
consultQuote issue
Quote
accepted
Sales
Consult
Bills
Photos
Site specific
details
Quote
reissue
Site
inspection
Schedule for
install
Quote
accepted
Figure 2-6: Sales consultation process
The individual steps in the consultation process are explained in detail below.
2.5.1 Initial consultation
AGL wanted to ensure that all customers received a phone call from the energy storage sales team as soon as possible after registering their interest.
Customers found to be ineligible for the program after this initial stage were called back by a sales administrator who provided them with an explanation of AGL’s assessment, and thanked them for their interest. Those that were suitable were scheduled for a call back with the Technical Sales team. Reasons for customer ineligibility are detailed in Section 2.5.3.
VPP-SA Public Milestone 1 Report - Final.docx AGL Confidential 14
2.5.2 Detailed technical sales consultation
Once suitability for the program had been determined, AGL’s Technical Sales specialists scheduled a call back with potential customers to have a more detailed discussion. This call typically took 35-45 minutes. These calls typically included:
A detailed explanation of the energy storage system product offering,
Discussion of energy storage system backup and critical load circuits,
Discussion of the potential location of the energy storage system, and
Discussion of the customer’s net consumption and solar export characteristics.
The sales consultant also discussed several mandatory topics such as program objectives, terms and conditions, early termination fees, and an estimate of customer savings. All sales calls are recorded for quality and coaching purposes. AGL has captured important learnings from these sales calls and continuously adds to a ‘Frequently Asked Questions’ list that is published on the www.agl.com.au/powerinnumbers landing page.
Once the customer accepts the quote, there is a five day cooling-off period before a site inspection is scheduled. If the site inspection reveals that any variations to the initial quote are required, the sales specialist will contact the customer again to explain the reasons for any variations. A revised quote is then sent out. Once the quote is accepted, the customer is scheduled for installation.
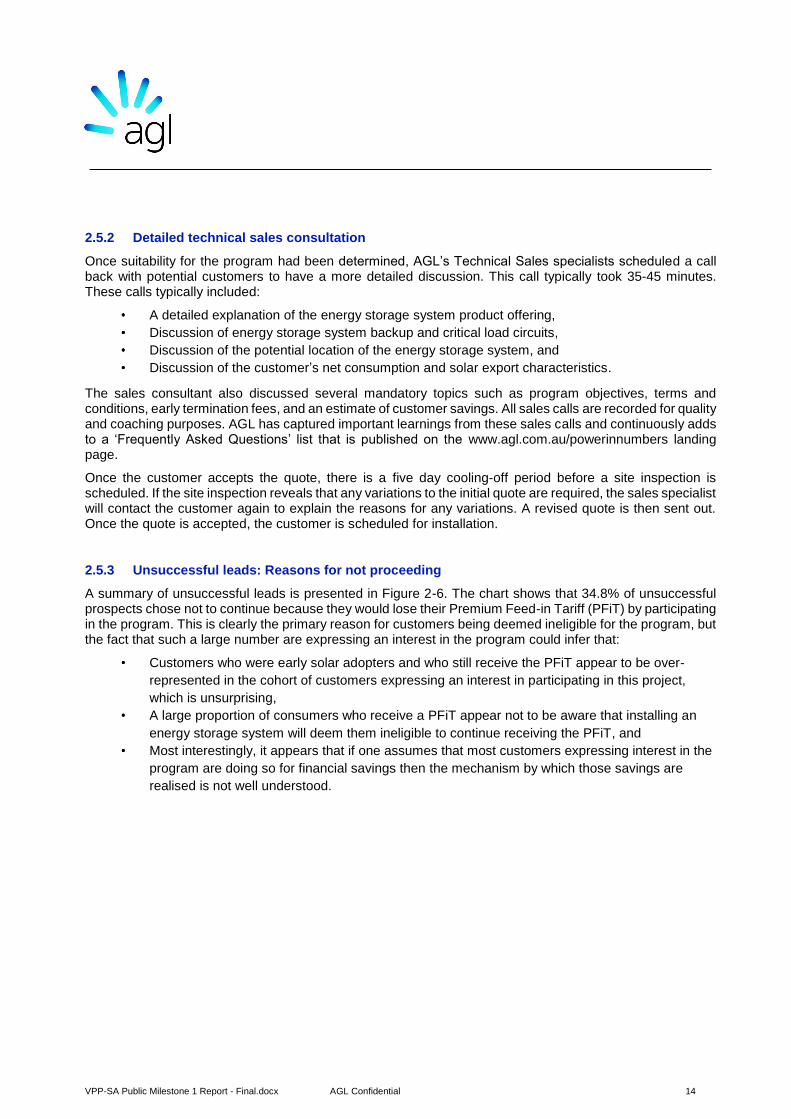
2.5.3 Unsuccessful leads: Reasons for not proceeding
A summary of unsuccessful leads is presented in Figure 2-6. The chart shows that 34.8% of unsuccessful prospects chose not to continue because they would lose their Premium Feed-in Tariff (PFiT) by participating in the program. This is clearly the primary reason for customers being deemed ineligible for the program, but the fact that such a large number are expressing an interest in the program could infer that:
Customers who were early solar adopters and who still receive the PFiT appear to be over-
represented in the cohort of customers expressing an interest in participating in this project,
which is unsurprising,
A large proportion of consumers who receive a PFiT appear not to be aware that installing an
energy storage system will deem them ineligible to continue receiving the PFiT, and
Most interestingly, it appears that if one assumes that most customers expressing interest in the
program are doing so for financial savings then the mechanism by which those savings are
realised is not well understood.
VPP-SA Public Milestone 1 Report - Final.docx AGL Confidential 15
Figure 2-7: Breakdown of unsuccessful leads
2.6 Voice of the customer
Since launching the program in August last year, AGL has engaged with more than 800 potential customers via web chats, phone calls and site visits. Through these interactions AGL has learned a great deal about customers’ expectations and needs when it comes to buying an energy storage system for their home. This section summarises the interactions that AGL has had with customers to date.
After accepting a quote AGL calls the customer to schedule a site visit. This visit typically takes between 90 minutes and two hours and allows AGL to identify the best location for installing the energy storage system and to capture any modifications or changes required to the customer’s switchboard. During this site visit, the installer will talk to the customer about backup power, and if this option is selected will help them identify the best appliances and circuits to back up.
Following the site visit, customers will receive a requote from the sales team if needed. Prior to installation, customers are contacted by an AGL scheduler who will determine a convenient date for the install.
On the day of installation, installers will arrive at site from about 7.30am and typically have completed the installation by mid-afternoon. Immediately following the installation, customers are asked to complete a customer satisfaction survey.
2.6.1 Customer satisfaction survey
AGL tracks customer satisfaction on a weekly basis by collating customer feedback from prospects who have received a quote, or had an energy storage system installed.
At the time of writing, overall customers satisfaction was tracking at 82.7%.
2.6.2 AGL community forum
AGL’s Community forum provides customers with a place to share ideas, ask questions and ask other community members for help. A virtual power plant discussion thread was created prior to the first installation in November and has been active ever since.
VPP-SA Public Milestone 1 Report - Final.docx AGL Confidential 16
Many customers and prospects now communicate with each other via the Community forum and some have gone to great lengths to post about their experiences.
2.6.3 Customer service
Following installation of their battery, customers are provided with a ‘Welcome Pack’ that provides detailed information about their energy storage system and contact details for AGL’s Customer Service team if they need assistance. AGL’s Customer Service team is available from 8.30am to 6.00pm (AEST) Monday to Friday.
Where a technical issue can’t be dealt with immediately by AGL’s frontline Customer Service agents, it is escalated to the Technical Operations team. This team frequently engage directly with customers directly, either over the phone or onsite, to rectify any issues.
2.6.4 Site-inspections
AGL carries out site inspections prior to installation for all energy storage system customers in the program. This has been done not only to identify any issues or constraints onsite prior to the day of installation but also to gather data on the physical and electrical conditions of sites, which will be used to provide insights for the industry as a part of Knowledge Sharing activities later in the project.
During the site inspection, the installer identifies a preferred and secondary energy storage system location and assesses its suitability, considering issues such as:
The proximity to habitable areas, taking into consideration the sound of the cooling fans on the
unit and nearby windows etc.,
Whether the location is in a trafficable area,
Accessibility from the road, and
Distance from switchboard.
The inspector also assesses the customer’s switchboard location, capacity, and state of repair. If the customer has elected to include backup power as a part of their purchase, the inspector also discusses which circuits and appliances will be backed up in the event of a grid outage.
The installer also completes the site inspection form which captures information about a customer’s switchboard, solar PV, preferred energy storage system location, and metering.
VPP-SA Public Milestone 1 Report - Final.docx AGL Confidential 17
2.6.5 Requoting variations to the customer
Approximately 78% of sites in Stage 1 required some form of variation. The scale, complexity
and cost of the variations span a wide range, but the most common reasons for a variation is the
need for a switchboard modification to accommodate the energy storage system connections, or
a concrete plinth to be installed where no appropriate area on which to mount the energy
storage system exists onsite. Switchboard modifications might comprise something as simple
as converting a non-protected circuit to a RCBO (residual-current circuit breaker with
overcurrent protection) protected circuit, at a cost of approximately $85, all the way to a
completely new switchboard, compliant with current standards, which could cost more than
$850.
For those customers that require a variation following a site inspection, the average value is just
over $400.The vast majority of customers opt to continue in the program despite requiring
variations, however, at the time of writing, all customers who had been quoted for a submain
upgrades had cancelled (three in total) due to the high cost of that upgrade.
2.6.6 Installing the energy storage system
Each installation team consists of three people with at least one CEC accredited energy storage system installer and licenced electrician. In most of the installation teams currently, all three installers have achieved their CEC accreditation for grid-connected energy storage system installs.
Installers typically arrive at a customer site by 7.30a.m to prepare for the delivery of the energy storage system by AGL’s logistics provider. The energy storage system is delivered using a tailgate-lift truck, and unloaded using an electric-powered pallet jack to ensure safe movement of the crate over sloping ground. The energy storage system is un-crated in a safe, flat location. If further movement is required to position the energy storage system a piano dolly is used.
A standard energy storage system installation process includes:
Installation of a concrete plinth (if required) to mount the energy storage system,
Installation of the polycrete base on top of the plinth or existing flat base, and on to which the
energy storage system is secured,
Securing the energy storage system cabinet to the polycrete pad and loading of the energy storage
system module into the cabinet,
Replacement of existing meter with an Active Stream digital meter (if required),
Modifications to and configuration of the switchboard to accommodate the AC-coupled energy
storage system,
Wiring up the critical load circuits (if requested),
Termination of the AC-coupling from the switchboard in the energy storage system,
Installation and connection of energy metering devices for the energy storage system,
Energy storage system testing, commissioning and configuration via the cloud, and
Customer training and handover – on the day of installation, AGL provides customers with training
in the safe operation and shutdown of the energy storage system, including the operation of any
bypass switches if fitted, and provides them with login details to their monitoring portal.

VPP-SA Public Milestone 1 Report - Final.docx AGL Confidential 18
Figure 2-8 Final commissioning checks being completed on a new ESS installation
2.7 Energy storage system sales and installation metrics
The rate of sales and installation of batteries in the SA-VPP project had been defined at a high level as a part of the project application to ARENA, and these are summarised in Table 2-1 below.
Table 2-1: Baseline project sales and installation milestones
Stage/Milestone Sales and installation target Completion date
Milestone 1 65 28 February 2017
Stage 1 completion 150 30 April 2017
Milestone 2 300 31 July 2017
Stage 2 completion 500 31 October 2017
Stage 3 completion 1,000 May 2018
2.8 Sales and installation lessons learned
This project has provided the opportunity to both sell and install batteries at scale. Several lessons learned from Stage 1 are outlined below.

VPP-SA Public Milestone 1 Report - Final.docx AGL Confidential 19
2.8.1 There is clear latent demand for batteries
The volume of leads generated and the high sales conversion rate achieved in Stage 1 demonstrate that there is significant latent demand for energy storage technology amongst homeowners.
The table below illustrates that the overwhelming majority of customers either called in directly to AGL’s contact centre, or navigated to the landing page after hearing about the program on news media or from another source.
Lead Source Percentage of all leads
Indirect page visits and phone leads 71%
Direct URL visits 8%
agl.com.au homepage referrals 7%
Facebook referrals 5%
Search referrals 3%
eDM 4%
Third party referrals 2%
Stage 1 sales came overwhelmingly from leads that came to AGL as a result of launch publicity and word of mouth. In fact, formal online lead generation only began in February 2017. This suggests that there were a number of customers who had clearly considered the purchase of an energy storage system in the past but had not yet purchased because of the high cost.
2.8.2 Energy storage system customers are highly engaged and tech-savvy
The majority of Stage 1 customers could be characterised as tech-savvy ‘early adopters’. Many appeared to have researched energy storage system offers extensively and asked a large number of questions during the initial sales consultation. In particular, the sales team reported a number of topics that were raised consistently in sales consultations. These include:
Expected/warranted cycle life,
Depth of discharge characteristics,
C-ratings (ratio of output to capacity), and
Battery Management Systems.
2.8.3 Customers want backup power
While the majority of sales conversations began with customer expecting that the installed energy storage system would provide backup power in the event of a power outage by default, many customers still placed a high value on the backup functionality, such that they were willing to pay the additional $899 to have this option included as part of their installation.

VPP-SA Public Milestone 1 Report - Final.docx AGL Confidential 20
2.8.4 Importance of site inspections
Pre-install site inspections are conducted for all sales. This process is essential to capture all switchboard, electrical and ground works required for a successful installation, and to provide installers with insights before they get to site as to how they will manage the installation and the delivery of the energy storage system. This improves both the safety and effectiveness of the team on the day of installation.
2.8.5 High proportion of switchboard work
AGL found that (at the time of writing) 40.5% of sites required switchboard amendment or upgrades to accommodate the energy storage system. This figure excludes the works necessary for customers choosing backup power. These works typically include increasing the size of the enclosure to accommodate additional circuit breakers, or bringing the switchboard up to the current standard.
3 Project highlights and challenges to date
3.1 Customer acquisition
There are several constraints to customer uptake of energy storage systems that have been identified, and these are discussed below.
3.1.1 Customers with a PFiT
Almost 200 potential customers who expressed an interest in the program and were otherwise eligible, chose not to proceed on the basis that installing an energy storage system would disqualify them from the PFiT.
These customers are currently paid 44c/kWh for solar power that they export to the grid in addition to the retail contribution which at the time of writing, stands stands at 6.8c/kWh. The PFiT scheme runs until 2028 and is funded by a levy on all South Australian energy consumers.
By participating in the VPP program, these customers would increase their self-consumption of solar and therefore reduce the cost to the scheme. While it should be recognised that customers receiving the PFiT would be financially worse off by installing an energy storage system, under the current rules adding an energy storage system immediately disqualifies these customers from the PFIT and creates a disincentive for them to add storage technology.
3.1.2 Inverter disconnections triggered by grid voltage
The frequency of inverter disconnections due to high grid voltage has been identified as a significant issue during Stage 1. As at the end of February, 12.5% of energy storage systems in the small fleet experienced persistently high voltages (above 256 V) that could trigger anti islanding under the recently revised requirements of AS4777. This is a key project risk due to the unavailability of these systems for charging or orchestration when disconnected from the grid.
More than one quarter of systems have experienced grid voltages of greater than 256V, and just over a third have disconnected at least once due to high grid voltage. More than half of the energy storage systems have recorded voltages above 253 V. Importantly, AGL has not seen the same level of inverter disconnection in the solar systems associated with the energy storage system, where the solar system was pre-existing, suggesting that the higher rate of energy storage system inverter disconnection is related to the new minimum and maximum voltage and frequency disconnection settings in AS4777.1:2015.

VPP-SA Public Milestone 1 Report - Final.docx AGL Confidential 21
The previous Australian Standard (AS4777.3:2005) required that inverters disconnect due to high voltage under the circumstance where it measured Vmax for more than two seconds. Vmax could be set anywhere between 230V and 270V, and was agreed with the local distribution networks service provider (DNSP).
The current version of that AS4777 standard that deals with this issue (AS4777.1:2015) requires that the inverter disconnects under the following circumstances:
Slow trip: ≥260V for two seconds.
Fast trip: 265V for 0.2 seconds.
Sustained overvoltage: when the grid voltage is sustained at Vnom-max for more than 10 minutes.
Vnom-max can be set between 244V and 258V but is set at 255V by default.
Under both the past and current version of the standard, the inverter is able to reconnect to the grid in the event that the grid voltage returns to the normal range for a continuous period of one minute.
In general, AGL has observed voltage readings over 256V in the day between 10am and 6pm (AECT), consistent with high grid voltages being caused by high levels of solar generation and relatively low household load in residential areas. However, a smaller number of sites have their peak voltages consistently after midnight when site loads are very low.
SAPN have a process whereby individuals or businesses on behalf of individuals can lodge a complaint when the voltage at a domestic address is consistently above 253V.
3.1.3 10kVA export limit
SAPN service and installation rules prohibit the installation of more than 10 kVA of embedded generation capacity on a single phase. This export limit was subsequently reduced to 5 kVa after the current version of AS4777.2:2015 came into effect. This rule posed a challenge as when combined with the Schneider 5 kW inverter in the Sunverge energy storage system, any capacity of associated solar would exceed the 5kVA limit imposed by SAPN without some form of export limiting functionality.
AGL has implemented an export limiting function through the Sunverge control software and has demonstrated to SAPN that this can reliably limit site export to a predetermined limit. This export limiting command is now shipping as standard with all energy storage systems sold.
3.1.4 Voltage rise (sub-mains)
A new revision of AS4777.1:2016 came into force on 1 April 2017. The new revision limits voltage rise to 2% at a site. This is a reduction by 3% from the previous revision that allowed 5%. While most sites comply with the current 5% limit, approximately 10-15% of homes will require an increase in the cable gauge on the consumer mains. These costs typically vary between $1000-$5000 with a small number of sites costing significantly more.
While the current standard requires the consumer and sub-mains be sized so that the voltage at the inverter terminals remain within grid voltage limits, allowing for 5% voltage rise, the incoming revision of AS4777.1:2016 requires that voltage rise 2% or 4.6 V from the point of supply (POS) to the inverter terminals (grid interactive port).
VPP-SA Public Milestone 1 Report - Final.docx AGL Confidential 22
3.2 Customer demographics
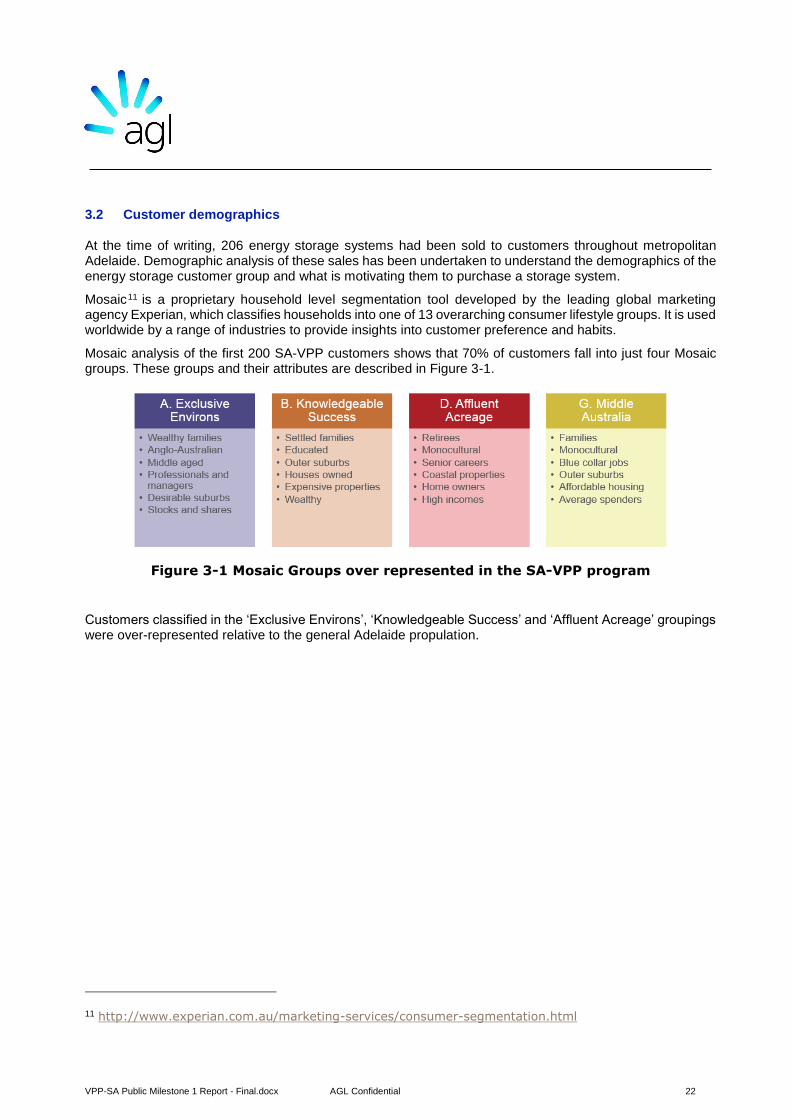
At the time of writing, 206 energy storage systems had been sold to customers throughout metropolitan Adelaide. Demographic analysis of these sales has been undertaken to understand the demographics of the energy storage customer group and what is motivating them to purchase a storage system.
Mosaic11 is a proprietary household level segmentation tool developed by the leading global marketing agency Experian, which classifies households into one of 13 overarching consumer lifestyle groups. It is used worldwide by a range of industries to provide insights into customer preference and habits.
Mosaic analysis of the first 200 SA-VPP customers shows that 70% of customers fall into just four Mosaic groups. These groups and their attributes are described in Figure 3-1.
Figure 3-1 Mosaic Groups over represented in the SA-VPP program
Customers classified in the ‘Exclusive Environs’, ‘Knowledgeable Success’ and ‘Affluent Acreage’ groupings were over-represented relative to the general Adelaide propulation.
11 http://www.experian.com.au/marketing-services/consumer-segmentation.html

VPP-SA Public Milestone 1 Report - Final.docx AGL Confidential 23
Figure 3-2: Geographic distribution of SA-VPP sales as at 28 February 2017
Geographic distribution of the sales (as at 28 February 2017) show that batteries were relatively evenly dispersed across the Adelaide metropolitan area. The map below shows the location of all SA-VPP sales to date, overlaid with Mosaic groupings. At this stage it is too early to draw conclusions about the likely geographic distribution of energy storage system sales in future.

VPP-SA Public Milestone 1 Report - Final.docx AGL Confidential 24
4 VPP performance
4.1 VPP performance summary
By the end of February 2017, 47 energy storage systems had been installed and were operating as part of the VPP. Even with a limited number of batteries in the field, initial testing of core VPP functionality has been carried out and proven to be successful.
Despite this, changes to the inverter disconnection limits in the current AS4777.1:2015 standard high grid voltage at several customer sites continues to affect the availability of a number of batteries and thereby reduces the availability of batteries in the fleet as the inverters disconnect from the grid in response to voltage that is outside of the allowable range. Of course, when an energy storage system inverter disconnects due to high grid voltage it is behaving exactly as it should, and as such this is not a failing of the storage system technology or the VPP control infrastructure, but represent a key challenge for VPP developers and network service providers alike.
4.2 VPP orchestration events
During the week of 18-23 February 2017, AGL and Sunverge successfully completed the first core function demonstrations of the capability of the VPP. AGL opted to use a 28 unit subset of the overall fleet for each of these events. It was decided to keep the storage systems involved in these tests consistent through the tests and not include newer batteries as they were installed primarily for comparison purposes but also so as not to affect the observed performance of newly installed batteries which could confuse customers monitoring their operation in the online AGL battery monitoring portal.
Table 4-1: Summary of VPP demonstrations undertaken
Ref Test Date Objective
1 Planned dispatch 21/02/2017 Demonstrate the ability of the VPP fleet to provide sustained energy storage system dispatch at a low power level over a three hour period with advance charging
2A Unplanned dispatch with sufficient capacity 17/02/2017 Demonstrate the ability of the fleet to respond immediately to requests for energy from the batteries, with some prior charging
2B Unplanned dispatch with insufficient capacity
18/02/2017 Demonstrate the ability of the fleet to respond immediately to requests for energy dispatch, but illustrated how the Sunverge units react if they do not have enough capacity available for complete dispatch
3 Frequency control 23/02/2017 Demonstrate the ability of the installed fleet to provide frequency control services by responding to an AGC signal by adjusting their rate of charging and discharging
4.3 Fleet dispatch Test 1 details and results
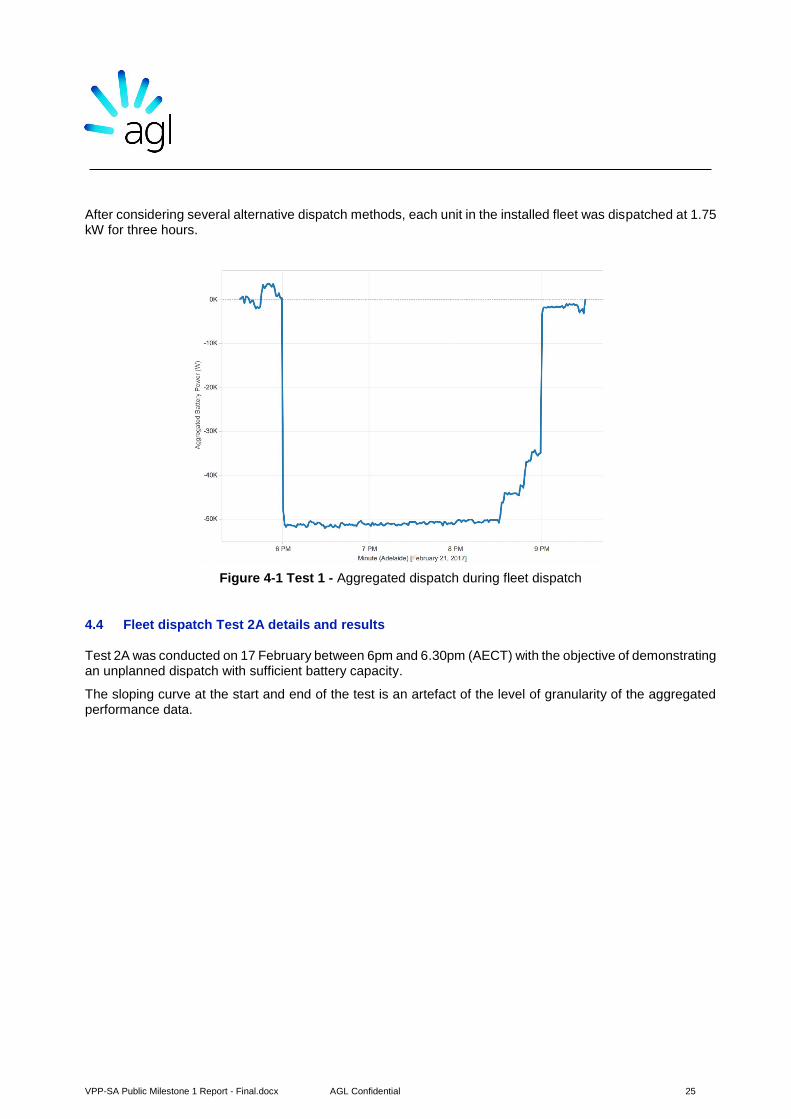
Test 1 was conducted on 21 February 2017 between 6am and 9pm (AECT) with the objective of demonstrating that the VPP fleet could respond to a command to dispatch a fixed rate of power for a set time. This test environment replicated a planned dispatch event aiming to achieve a fixed level of power output from the fleet.
VPP-SA Public Milestone 1 Report - Final.docx AGL Confidential 25
After considering several alternative dispatch methods, each unit in the installed fleet was dispatched at 1.75 kW for three hours.
Figure 4-1 Test 1 - Aggregated dispatch during fleet dispatch
4.4 Fleet dispatch Test 2A details and results
Test 2A was conducted on 17 February between 6pm and 6.30pm (AECT) with the objective of demonstrating an unplanned dispatch with sufficient battery capacity.
The sloping curve at the start and end of the test is an artefact of the level of granularity of the aggregated performance data.
VPP-SA Public Milestone 1 Report - Final.docx AGL Confidential 26
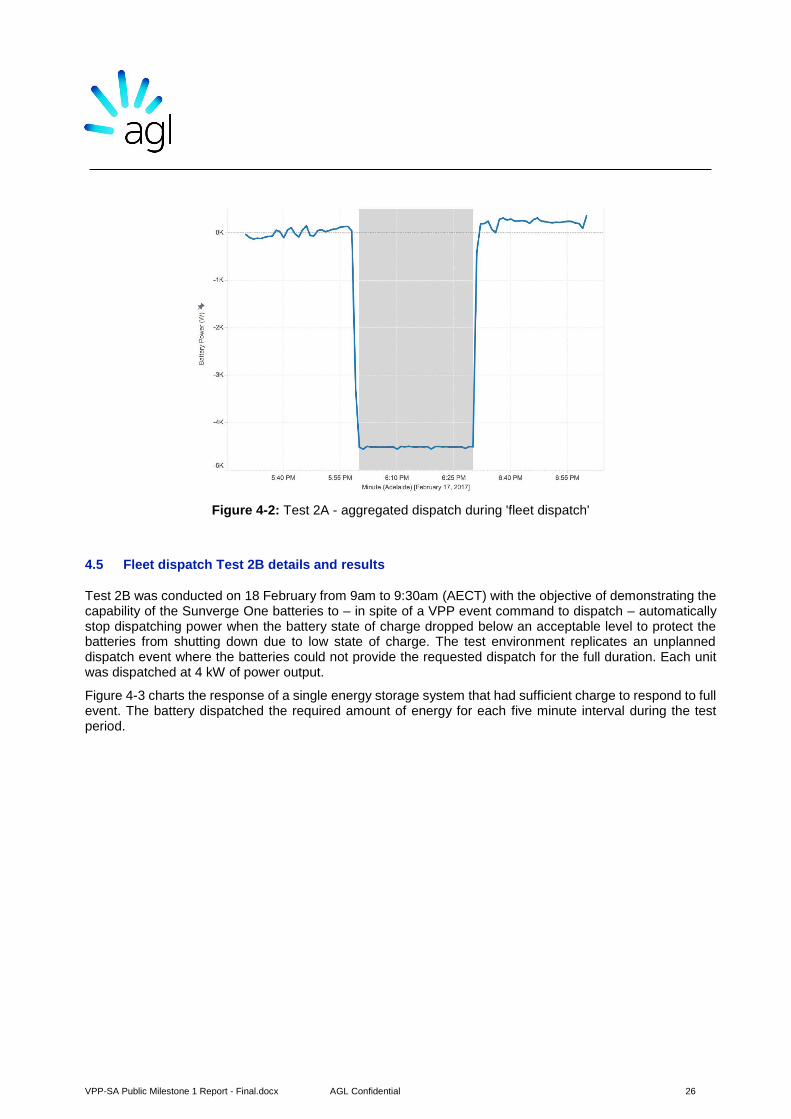
Figure 4-2: Test 2A - aggregated dispatch during 'fleet dispatch'
4.5 Fleet dispatch Test 2B details and results
Test 2B was conducted on 18 February from 9am to 9:30am (AECT) with the objective of demonstrating the capability of the Sunverge One batteries to – in spite of a VPP event command to dispatch – automatically stop dispatching power when the battery state of charge dropped below an acceptable level to protect the batteries from shutting down due to low state of charge. The test environment replicates an unplanned dispatch event where the batteries could not provide the requested dispatch for the full duration. Each unit was dispatched at 4 kW of power output.
Figure 4-3 charts the response of a single energy storage system that had sufficient charge to respond to full event. The battery dispatched the required amount of energy for each five minute interval during the test period.

VPP-SA Public Milestone 1 Report - Final.docx AGL Confidential 27
Figure 4-3: Test 2B - Aggregated dispatch for units with available capacity
Figure 4-4 charts the aggregate discharge rate of the full fleet involved in the event, and clearly illustrates that as available energy storage system capacity depletes for some storage units the aggregated fleet dispatch reduces over the test period.
Figure 4-4 Test 2B - Aggregated dispatch for units with low capacity during fleet dispatch
VPP-SA Public Milestone 1 Report - Final.docx AGL Confidential 28
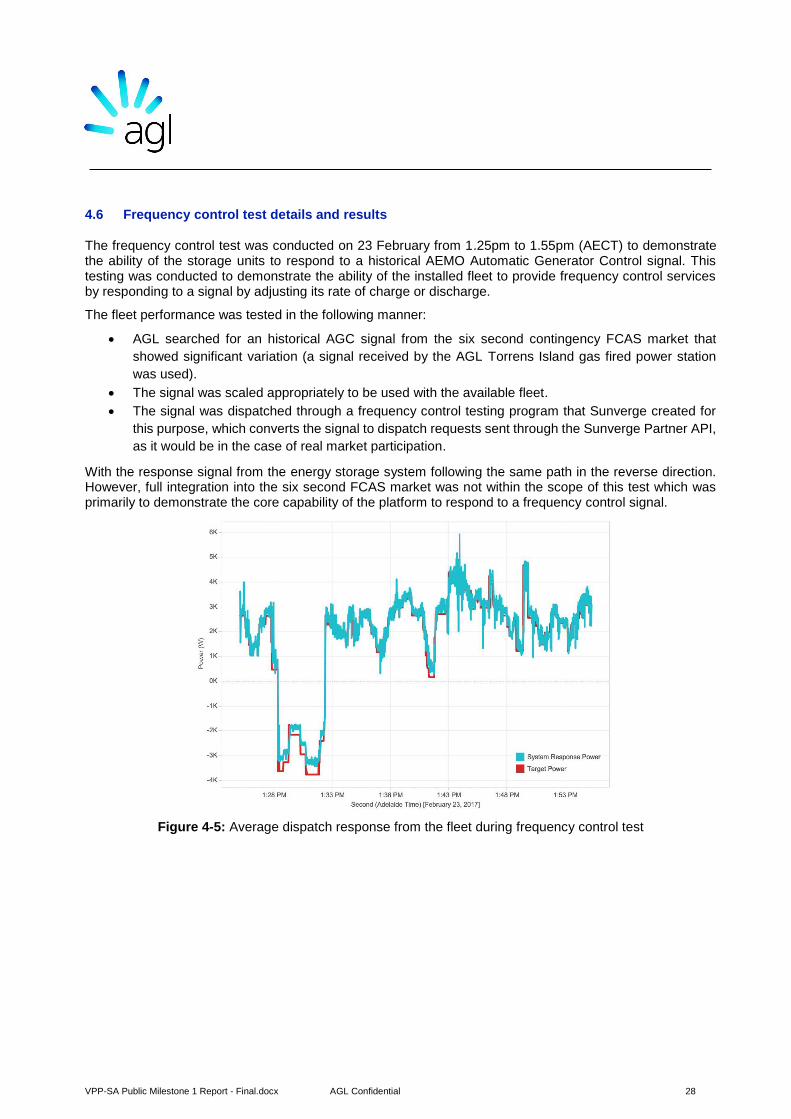
4.6 Frequency control test details and results
The frequency control test was conducted on 23 February from 1.25pm to 1.55pm (AECT) to demonstrate the ability of the storage units to respond to a historical AEMO Automatic Generator Control signal. This testing was conducted to demonstrate the ability of the installed fleet to provide frequency control services by responding to a signal by adjusting its rate of charge or discharge.
The fleet performance was tested in the following manner:
• AGL searched for an historical AGC signal from the six second contingency FCAS market that
showed significant variation (a signal received by the AGL Torrens Island gas fired power station
was used).
• The signal was scaled appropriately to be used with the available fleet.
• The signal was dispatched through a frequency control testing program that Sunverge created for
this purpose, which converts the signal to dispatch requests sent through the Sunverge Partner API,
as it would be in the case of real market participation.
With the response signal from the energy storage system following the same path in the reverse direction. However, full integration into the six second FCAS market was not within the scope of this test which was primarily to demonstrate the core capability of the platform to respond to a frequency control signal.
Figure 4-5: Average dispatch response from the fleet during frequency control test
VPP-SA Public Milestone 1 Report - Final.docx AGL Confidential 29
4.7 Key learnings
4.7.1 General fleet dispatch learnings
These tests demonstrated the capability of the energy storage system fleet to be discharged in a coordinated way to access a number of value streams. The capability demonstrated could be used to access value in the wholesale market through offsetting load, or similarly, were the energy storage systems aggregated on a specific network feeder they could have been used to limit peak demand on that feeder. A number of key learnings from the tests arise:
The initial state of charge of the battery prior to an ‘orchestration event’ is a significant
consideration.
Local network voltage is a key factor in the performance of the overall fleet, especially where the
fleet is directed to dispatch at a time when solar production is at a high level.
4.7.2 Frequency control demonstration
The ability to provide frequency control services into the National Energy Market (NEM) from a fleet of distributed energy storage systems is an exciting and important part of this demonstration project. It’s important to note that services such as this are typically provided by large generators connected to a transmission network, and as such, the provision of such services from within a distribution network presents some novel considerations. It has the potential to expand the range of value streams that a fleet of distributed energy resources installed behind the meter is able to access, and of course, provides an essential grid service that benefits all users.
The brief frequency control tests offer the following key learnings:
AGL’s initial findings show that the speed of communications to and from the energy storage
system do not preclude the fleet (pending resolution of other regulatory and technical barriers)
participating in the six second contingency FCAS market. This is an important development.
As with the other VPP dispatch demonstrations, high local grid voltages within a distribution
network present a challenge to the availability of the full fleet of energy storage systems.
Unlike (relatively) simpler discharge events, using an energy storage system fleet to provide
frequency control services may involve the battery both charging and discharging.
VPP-SA Public Milestone 1 Report - Final.docx AGL Confidential 30
5 Normal operation
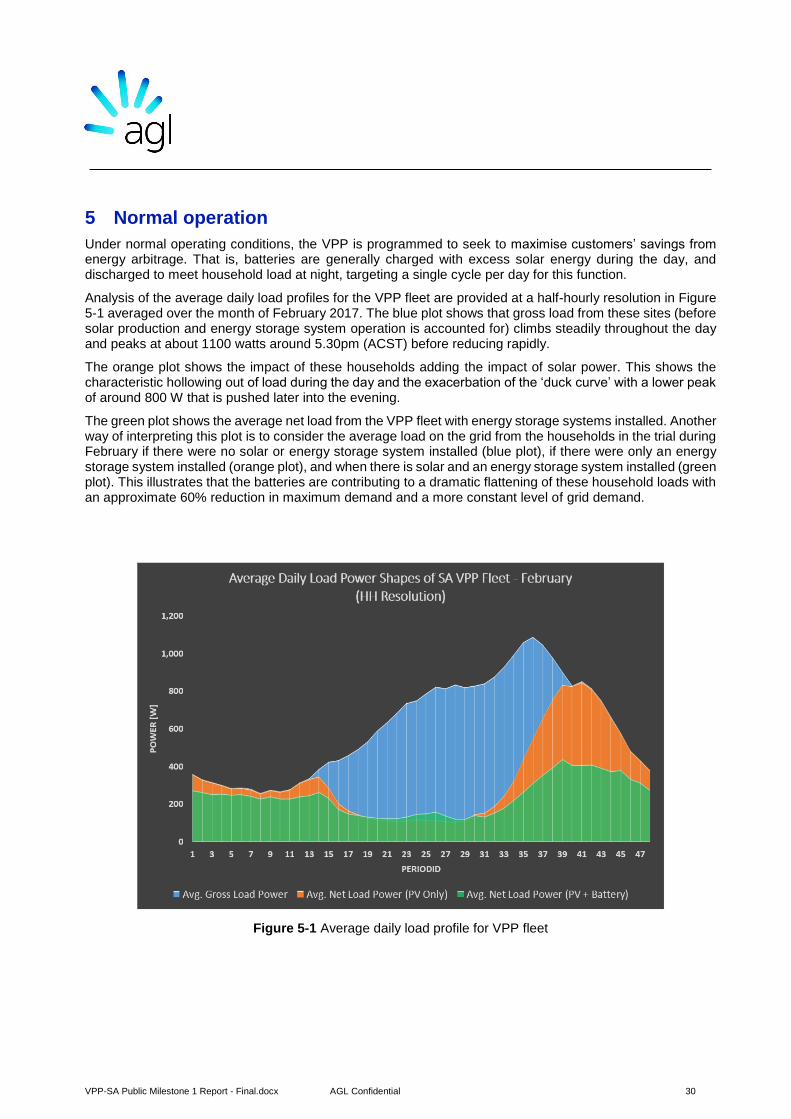
Under normal operating conditions, the VPP is programmed to seek to maximise customers’ savings from energy arbitrage. That is, batteries are generally charged with excess solar energy during the day, and discharged to meet household load at night, targeting a single cycle per day for this function.
Analysis of the average daily load profiles for the VPP fleet are provided at a half-hourly resolution in Figure 5-1 averaged over the month of February 2017. The blue plot shows that gross load from these sites (before solar production and energy storage system operation is accounted for) climbs steadily throughout the day and peaks at about 1100 watts around 5.30pm (ACST) before reducing rapidly.
The orange plot shows the impact of these households adding the impact of solar power. This shows the characteristic hollowing out of load during the day and the exacerbation of the ‘duck curve’ with a lower peak of around 800 W that is pushed later into the evening.
The green plot shows the average net load from the VPP fleet with energy storage systems installed. Another way of interpreting this plot is to consider the average load on the grid from the households in the trial during February if there were no solar or energy storage system installed (blue plot), if there were only an energy storage system installed (orange plot), and when there is solar and an energy storage system installed (green plot). This illustrates that the batteries are contributing to a dramatic flattening of these household loads with an approximate 60% reduction in maximum demand and a more constant level of grid demand.
Figure 5-1 Average daily load profile for VPP fleet

VPP-SA Public Milestone 1 Report - Final.docx AGL Confidential 31
Figure 5-2 very clearly illustrates the impact of the VPP’s normal operation on the solar export that the grid receives from the households on average. The blue plot represents the average solar production across the fleet for February 2017 if household load and energy storage system operation were not taken into account. The orange plot represents the average solar production again, but also considering the effect of household self-consumption of that solar. The green plot represents the solar export that the grid see, once the effect of household load and energy storage system operation have been taken into account. This plot demonstrates that the VPP is providing a much smoother, flatter solar export profile for to the local grid by minimising solar export at different parts of the day through both the optimisation of solar self-consumption by the customer, and charging of the energy storage system during the day.
Figure 5-2 Average daily solar production profile for VPP fleet for February 2017
VPP-SA Public Milestone 1 Report - Final.docx AGL Confidential 32
5.1 Aggregated charge/discharge profiles (including coordinated fleet control)
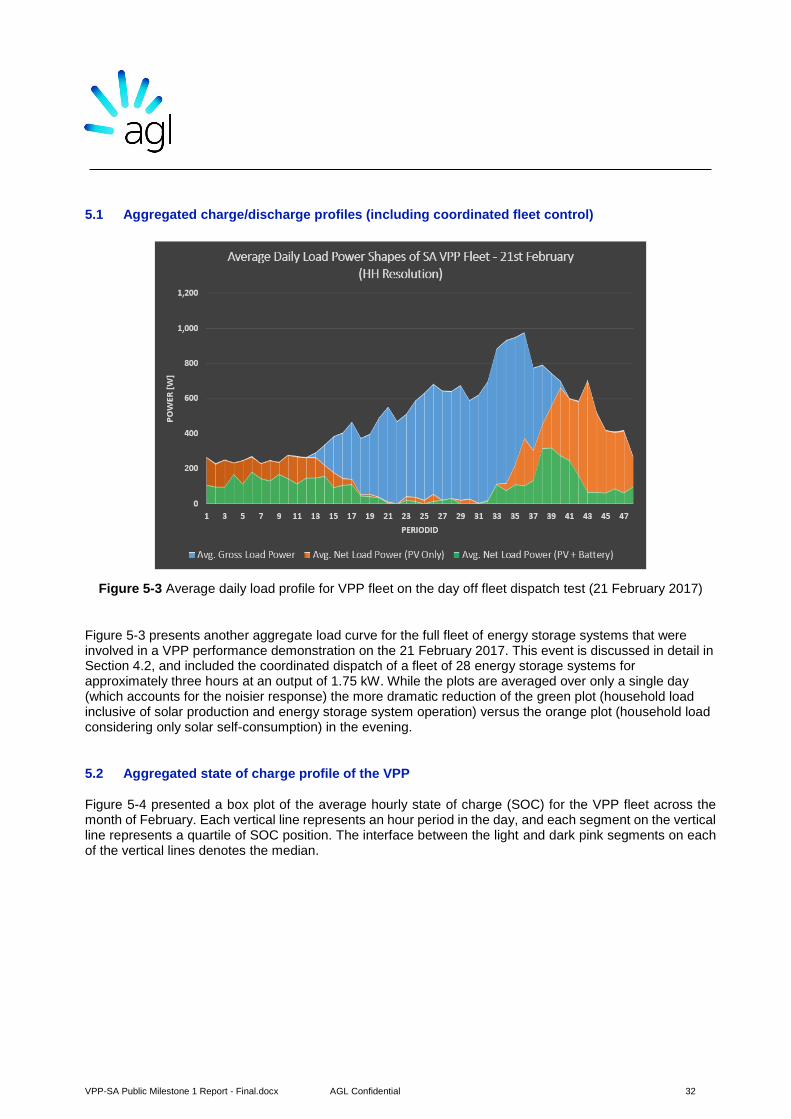
Figure 5-3 Average daily load profile for VPP fleet on the day off fleet dispatch test (21 February 2017)
Figure 5-3 presents another aggregate load curve for the full fleet of energy storage systems that were involved in a VPP performance demonstration on the 21 February 2017. This event is discussed in detail in Section 4.2, and included the coordinated dispatch of a fleet of 28 energy storage systems for approximately three hours at an output of 1.75 kW. While the plots are averaged over only a single day (which accounts for the noisier response) the more dramatic reduction of the green plot (household load inclusive of solar production and energy storage system operation) versus the orange plot (household load considering only solar self-consumption) in the evening.
5.2 Aggregated state of charge profile of the VPP
Figure 5-4 presented a box plot of the average hourly state of charge (SOC) for the VPP fleet across the month of February. Each vertical line represents an hour period in the day, and each segment on the vertical line represents a quartile of SOC position. The interface between the light and dark pink segments on each of the vertical lines denotes the median.

VPP-SA Public Milestone 1 Report - Final.docx AGL Confidential 33
Figure 5-4: Average hourly state of charge for the VPP for the month of February
Figure 5-5 shows a similar box plot for the fleet, but averaged over only the day when a coordinated discharge of the fleet was undertaken (21 February the same day that Figure 5-3 represents). The box plot very clearly shows both the pre-charging of the batteries from solar in preparation for the demonstration, and the effect of the coordinated discharge over the three hours of the demonstration in the evening.
Figure 5-5: Average hourly SOC for VPP fleet on the day of fleet dispatch Test 1 (21 February 2017)

VPP-SA Public Milestone 1 Report - Final.docx AGL Confidential 34
Figure 5-6: SOC box plot of an individual energy storage system averaged over the month of February
Figure 5-6 presents the SOC box plot for the same unit averaged over the month of February. Again, insights are relatively limited as there is implicit seasonal influence on the results.
6 HSE tracking and performance
6.1 Lessons Learned
One of the most significant lessons learned to date concerns the manual handling risks posed by the requirement to move the energy storage units into position on the customer’s property. In many cases, the installation site is not easily accessible and the path to the site can be uneven and difficult to traverse. A combination of trolleys and slide boards have been used to control those risks but there is still a considerable risk when shifting the cabinets once they have been uncrated on site.
The decision was made to ensure three people were on site when the cabinets are to be stood up from a horizontal to a vertical position to minimise the risks in the heaviest lifting phase. Steps are underway to source purpose built equipment to minimise the risks posed by the need to stand the cabinets up on site as well as the hazards of steep ground, uneven ground, tight gateways, and narrow paths.
6.2 Energy storage system safety
Lithium-ion battery safety is built on a layered approach with multiple fail safes to ensure that as a battery is unlikely to experience a dangerous operating condition and that if it does, the failure is contained within the device itself.

VPP-SA Public Milestone 1 Report - Final.docx AGL Confidential 35
Lithium-ion battery safety standards are an emerging space, however Sunverge has ensured that its systems have been tested for compliance with all relevant standards. At the very lowest level the cells are certified to the following standards:
1) IEC 62133 – Secondary cells and batteries containing alkaline or other non-acid electrolytes - Safety
requirements for portable sealed secondary lithium cells, and for batteries made from them, for use
in portable applications - Part 2: Lithium systems
2) UL 1642 – Standards for Lithium Batteries
3) UN38.3 – UN Transportation Testing for Lithium Metal and Lithium-Ion Batteries
4) KBIA 10104-01 - Secondary Lithium-Ion Cell and Battery System - Battery Energy Storage System
─ Part 1: Safety test
These standards specify a series of tests under which the cells are subjected to extreme conditions and the result must be that there is no fire and no explosion of the cells.
IEC 62133 UL1642 UN38.3 KBIA 10104
Overcharge No Test No Test No Test SOC0, 6.3V CC Charge
Hot Box 130°C, 30min
130°C, 10 Min No Test 85°C
Crush 13kN, Flat 13kN, Flat/Side No Test 6.3kN
Impact No Test No Test No Test 15,8mm diameter
9.1kg
Dropped from 610mm
Short Circuit 80mΩ, 10/45°C
80mΩ, 10/55°C 80mΩ, 55°C 5mΩ, 25°C
Packs also undergo physical testing as part of the Korea Battery Industry Association (KBIA) and UN test programs, however until recently there has not been a suitable pack standard to certify battery packs including the operation of their battery management systems. This has recently changed with the introduction of IEC62619 - Secondary cells and batteries containing alkaline or other non-acid electrolytes - Safety requirements for secondary lithium cells and batteries, for use in industrial applications. This standard has been developed based on a German standard which has been in place since 2014. This standard has been the basis under which over 43,000 behind the meter energy storage systems have been installed in Germany.
AGL is advocating for the immediate direct adoption of IEC62616 as an Australian standard and for it to be the minimum standard for battery packs installed in Australia.
At the system level Sunverge have designed and tested their system in accordance with UL 1973 - Standard for Batteries for Use in Light Electric Rail (LER) Applications and Stationary Applications. This is a very stringent US standard designed to ensure that any energy storage system can pose no danger to people living or working around the system with a key principle being that any failure of any component must be safely contained within the enclosure and not propagate beyond the energy storage system.
Related Documents


![Open Firmware Loader (OFL) Ecosystem · VPP Concepts and Interfaces . VFF . VPP Firmware Format . VNP . VPP Network Protocol defined in [VNP]. VPP . Virtual Primary Platform defined](https://static.cupdf.com/doc/110x72/5fd216df96208a103f18c17a/open-firmware-loader-ofl-ecosystem-vpp-concepts-and-interfaces-vff-vpp-firmware.jpg)