Virginia’s State and Local Budget Issues and Challenges James J. Regimbal Jr. Fiscal Analytics, Ltd. September, 2012

Welcome message from author
This document is posted to help you gain knowledge. Please leave a comment to let me know what you think about it! Share it to your friends and learn new things together.
Transcript

Virginia’s State and Local Budget
Issues and Challenges
James J. Regimbal Jr.
Fiscal Analytics, Ltd.
September, 2012
2 2 2 2
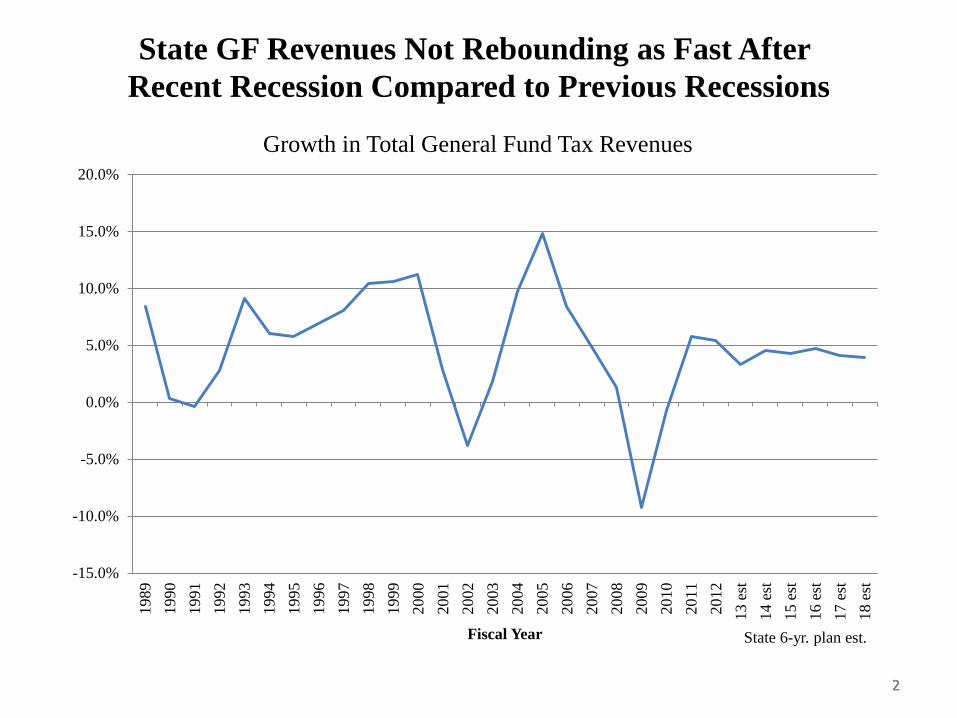
State GF Revenues Not Rebounding as Fast After
Recent Recession Compared to Previous Recessions
2
State 6-yr. plan est.
-15.0%
-10.0%
-5.0%
0.0%
5.0%
10.0%
15.0%
20.0%
1989
1990
1991
1992
1993
1994
1995
1996
1997
1998
1999
2000
2001
2002
2003
2004
2005
2006
2007
2008
2009
2010
2011
2012
13 e
st
14 e
st
15 e
st
16 e
st
17 e
st
18 e
st
Fiscal Year
Growth in Total General Fund Tax Revenues

3
Virginia Economic Growth Is Slowing
3
(2.0)
0.0
2.0
4.0
6.0
8.0
10.0
%
G
r
o
w
t
h
Growth in Individual Income Tax Withholding
12 Mo. Moving Avg (% Growth)

4
FY 2012 Surplus Mostly Spent
4
Proposal to Spend FY 2012 GF Surplus
$ Mil.
Surplus GF Revenues $129.2
Unspent GF Appropriations $319.3
Total FY 2011 GF Surplus Available: $448.5
Spending Required or Proposed by Governor:
Mandatory Re-appropriations $98.0
Revenue Stabilization Fund $78.3
State Employee Bonus $77.2
Virginia Health Care Fund balances $66.1
Discretionary Re-appropriations $41.8
Fact Fund Reserve $30.0
Accelerated Sales Tax to Transportation $20.9
Natural Disaster Sum Sufficient $17.2
Water Quality Improvement Fund $16.9
Other $2.1
Total Required/Proposed Spending $448.5

5 5
Slower Growth in FY 2013 Expected but Higher Revenue Base from FY 2012 Should Provide about
$200M in Additional Revenues for 2012-14 Biennium
5
FY 2012
Actual
FY 2013
FA Est.
Est.
Growth
FY 2014 FA
Est.
Est.
Growth
Individual Income $10,613 $11,001 3.7% $11,500 4.5%
Sales Taxes $3,122 $3,266 4.6% $3,419 4.7%
Corporate Income $860 $850 -1.2% $860 1.2%
Insurance Premiums $253 $258 2.2% $271 4.7%
Wills, Suits, Deeds $322 $350 8.7% $375 7.1%
All Other GF Revenues $678 $676 -0.3% $701 3.8%
Total GF Revenues $15,847 $16,401 3.5% $17,126 4.4%
GF Transfers $501 $407 -18.9% $423 4.0%
Total General Fund $16,348 $16,808 2.8% $17,549 4.4%
Amt Above Official Est. $129 $97 $94

6 6
Virginia Vulnerable to Federal Spending Cutbacks
• In 2010, Federal spending ($137 B total; $58B DoD) contributed approximately one-third of Virginia’s gross state product ($424 B).
- VA ranks #2 in total per capita federal spending and #1 in per capita DoD spending in 2010).
• From CY 2000-10 Virginia’s gross state product grew 60% while federal spending in Virginia grew 107%. VA particularly vulnerable to cutbacks in defense spending and procurement.
• Tax Department presented evidence at August Joint Money Committee meeting of recent slowdown in payroll withholding payments by “professional and business services” and particularly federal contractors.
• Recent report by Stephen Fuller of GMU estimates that Virginia could lose $10.7 billion in labor income from 136,191 lost Defense Dept. jobs and 71,380 non-Defense Dept. jobs over 10 years if automatic spending cuts are imposed.
• Recent 2 year federal transportation reathorization provides some funding stability.
- $54.6 billion/year versus $50.1 bil., $18.8 bil. from GF.

7 7
Can Increasing Reliance on
Non-General Fund Revenues Continue?
7
$0
$5,000
$10,000
$15,000
$20,000
$25,000
$30,000
2001 2002 2003 2004 2005 2006 2007 2008 2009 2010 2011 2012 2013
(i)
2014
(i)
Change in State Operating Appropriations ($ Mil.)
GF
NGF*
* Federal funds, higher education tuition & fees, other fees, unemployment insurance taxes, institutional revenue, etc

State Transportation Revenues Lag Economy
8
1.00
1.50
2.00
2.50
3.00
3.50
4.00
1988 1989 1990 1991 1992 1993 1994 1995 1996 1997 1998 1999 2000 2001 2002 2003 2004 2005 2006 2007 2008 2009 2010 2011 2012
Fiscal Year
Growth in Virginia Personal Income, General Funds and
Transportation Revenues
VA Personal Income
General Funds
Transportation
FY 2012: GF revenues increased 5.4%; CTF revenues increased 2.9%
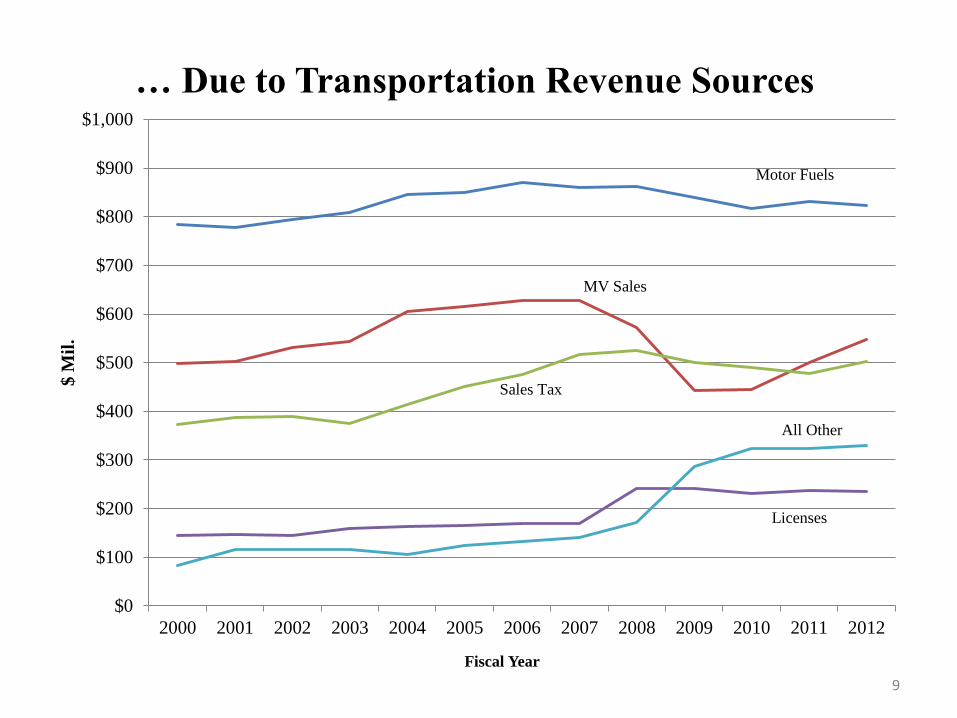
9
Fiscal Year
$0
$100
$200
$300
$400
$500
$600
$700
$800
$900
$1,000
2000 2001 2002 2003 2004 2005 2006 2007 2008 2009 2010 2011 2012
$ M
il.
… Due to Transportation Revenue Sources
Motor Fuels
MV Sales
Sales Tax
Licenses
All Other
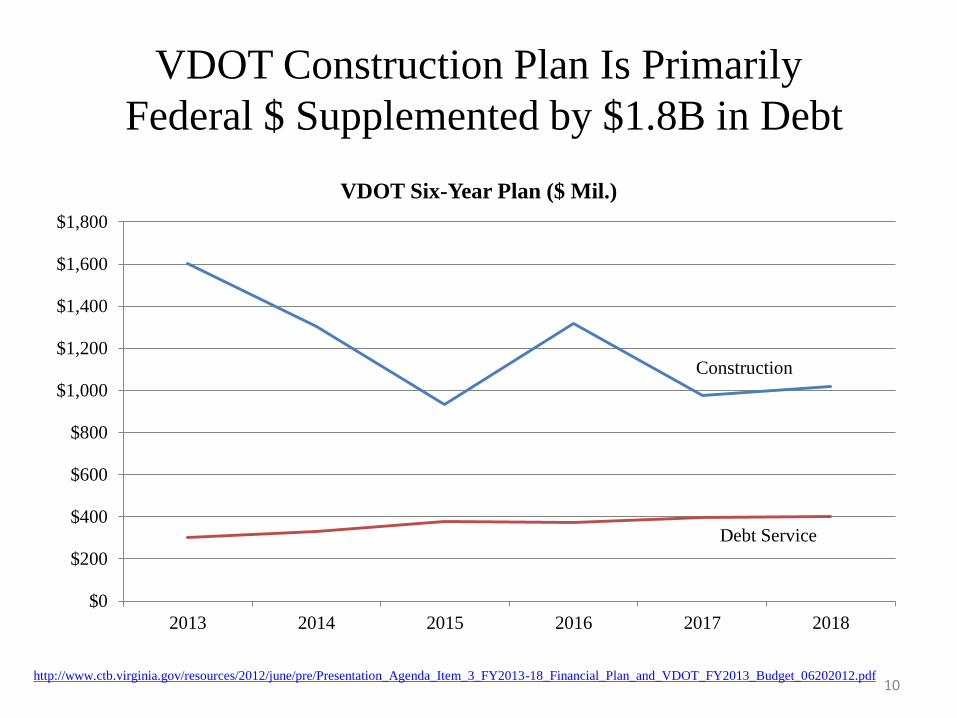
VDOT Construction Plan Is Primarily
Federal $ Supplemented by $1.8B in Debt
$0
$200
$400
$600
$800
$1,000
$1,200
$1,400
$1,600
$1,800
2013 2014 2015 2016 2017 2018
VDOT Six-Year Plan ($ Mil.)
Debt Service
http://www.ctb.virginia.gov/resources/2012/june/pre/Presentation_Agenda_Item_3_FY2013-18_Financial_Plan_and_VDOT_FY2013_Budget_06202012.pdf
Construction
10

11 11 11
Local Revenues Also Continue to Suffer
11
Source: 1990-2011, Auditor of Public Accounts
FY 12 estimates from VML/VACO 2011 Fiscal Survey
-6.0%
-4.0%
-2.0%
0.0%
2.0%
4.0%
6.0%
8.0%
10.0%
12.0%
14.0%
16.0%
Fiscal Year
% Change in Local Revenues
Real Property Taxes
Total Local Revenue

12 12
State Support For
Locally-Administered Programs Has Fallen
12 Source: APA Comparative Reports on Local Revenues and Expenditures, Fiscal Years 2000-2011
26.0%
27.0%
28.0%
29.0%
30.0%
31.0%
32.0%
33.0%
34.0%
2000 2001 2002 2003 2004 2005 2006 2007 2008 2009 2010 2011
State Categorical Aid As % of Local Expenditures

13 13 13 13
State Assistance for Localities Continuing to Decline From Pre-Recession Levels
Major State GF Aid for Locally-Administered Programs
FY 2009 FY 2010 FY 2011 FY 2012 FY 2013 FY 2014
GF Direct Aid to K-12 $5,607.6 $4,769.8 $4,713.3 $4,891.2 $5,240.6 $5,268.3
Health and Human Services $888.4 $878.7 $816.8 $827.2 $846.4 $811.8
Public Safety $734.3 $556.8 $686.0 $667.7 $677.8 $678.4
HB 599 (Aid-to-Police) $197.3 $180.8 $178.7 $172.4 $172.4 $172.4
Constitutional Officers $155.3 $142.2 $144.2 $143.8 $143.5 $143.5
Car Tax $950.0 $950.0 $950.0 $950.0 $950.0 $950.0
Aid-to-Locality Reduction ($50.0) ($50.0) ($60.0) ($60.0) ($50.0) ($45.0)
Total Local GF Aid $8,285.6 $7,247.5 $7,250.3 $7,419.9 $7,808.3 $7,807.0
Total GF Appropriations $15,943.0 $14,787.2 $15,457.4 $16,556.9 $17,340.7 $17,502.0
% Local GF Aid 52.0% 49.0% 46.9% 44.8% 45.0% 44.6%

14 14 14 14
Falling Revenues and Reduced State Support
Require Tough Choices for Local Budgets * 88 localities responding to VML/VACO survey
Top 3 FY 12 Local Budget
Balancing Actions
Delay or cancel capital outlay/infrastructure 40
Draw down reserves 29
Salary Freeze 26
Increase tax rates 21
Eliminate Vacant Positions and RIF 20
Targeted cuts in other services and programs 19
Delay of annual equip. replacement programs 12
Fee increases 12
Reducing staff health care benefits 11
Targeted cuts in public education 10
Hiring freeze 7
Reduced contributions to civic/cultural 6
Renegotiate debt 5
Replacing local general funds with special funds 4
Across the board service cut 3
Early retirement incentives 2
Targeted cuts in public safety services 2
Other 4

15 15
Can the State Restore Program Cuts?
Serious Challenges Must Be Overcome.
1. Revenues not growing as fast as usual coming out of a recession (under 5%
revenue growth expected in 2012-14). Tax changes reducing revenues. Concern
over potential impact of federal deficit reductions. However, expect FY 12
revenue surplus to flow thru to 2012-14 biennium, providing $300+ million in
additional appropriation capacity over adopted budget.
2. Rainy Day Fund must be constitutionally restored – Half of any GF* revenue
growth above prior 6-yr. avg. (2% now) goes to RDF. Actual FY 2012 revenues
require a $245 million deposit to the RDF in FY 2014.
3. VRS contribution rates for teachers and state employees are being significantly
increased since recession lows.
4. Medicaid spending will continue to grow faster than state revenues. 2014 impact
of federal health care big unknown, but law as written would add up to 425,000
new Medicaid recipients.
5. Increased use of debt will have long-term consequences.
6. Increasing efforts to use general funds for transportation.

16 16 16 16
State Six-Year GF Plan ($ Mil.)
Expects Tight Budgets Going Forward*
16 * See http://dpb.virginia.gov/forms/20120206-1%5C2012_GFSix-YearPlan.pdf. Does not include FY2018 ending balance of $653 million.
FY 2013-18 Annual GF Appropriation Growth Expected
K-12 Education 3.1%
Higher and Other Education 4.4%
Medicaid 6.4%
Other H&HS 0.6%
Public Safety 0.6%
Other Finance and Admin. 0.1%
Judicial 0.3%
Commerce & Trade -2.6%
Nat Res., Ag, Forestry -5.1%
Total Appropriations 3.2%

17 17 17
General Fund Tax Changes Over Last Two
Decades Swamp 2004 Tax Increase
Enacted/Amended 2010-12 ($ Mil.)
Age Subtraction (net of 2004 means testing) 1994 and 2004 ($555)
Subtraction for UI/Military/Gov't Empl 1999 ($73)
Historic Rehab Tax Credit 1999 ($92)
Coalfield Employment Tax Credits 2000 ($89)
Low Income Tax Relief 2000, 2004, and 2007 ($377)
Land Preservation Tax Credit 2003 ($275)
2004 Tax Reform Increases* 2004 $1,603
Elim. 2.5% Sales Tax on Food 2004 ($437)
Car Tax Reimbursement 1997, 2003 ($1,900)
Shift Insurance Premiums and Recordation from GF to
Transportation 2009 ($340)
Estate Tax Repeal 2009 ($280)
Other Tax Changes since 1999 1999-2011 ($182)
Total ($2,997)
* Includes cigarette tax increase dedicated to Health Care Fund
Sources: Senate Finance Committee Retreat, Revenue Outlook, Nov. 18 , 2010
Summary of Amendments to the 2010-2012 Budget, Money Committee Staff. May 2010

$80 $85 $157
$224
$362
$575
$716
$472
$248
$340
$482
$1,065
$1,190
$1,015
$575
$295 $299 $304
$439
$689
$2,387
$-
$500
$1,000
$1,500
$2,000
$2,500
1995 1996 1997 1998 1999 2000 2001 2002 2003 2004 2005 2006 2007 2008 2009 2010 2011 2012 2013 2014 15%
GF*
Revenue Stabilization Fund History
* RDF deposits and maximum calculated on individual and corporate income taxes and sales tax 18

19
Retirement Rates Are Rising
19
Notes: Employer rates only and do not include 5% member contribution.
Over the last 10 years ending June 30, 2011 VRS annual average total fund investment return has been 5.7%.
2012 Session adopted hybrid defined benefit/contribution plan for new state employees.
2011 & 2012
VRS Board
Cert. Rates FY 2011
6/25/2011-
3/24/2012
3/25/2012-
6/24/2012
FY 2012-14 FY 2012-14
VRS Board
Cert. Rates *
Adopted
Rates**
State 8.46% 2.13% 2.08% 6.58% 13.07% 8.76%
Teachers 12.91% 3.93% 6.33% 6.33% 16.77% 11.66%
* Assumes phase-in of 7.5% to 7% investment return, 2.5% COLA, and 30 year amortization
** Reflects 8.0% investment return
20 20
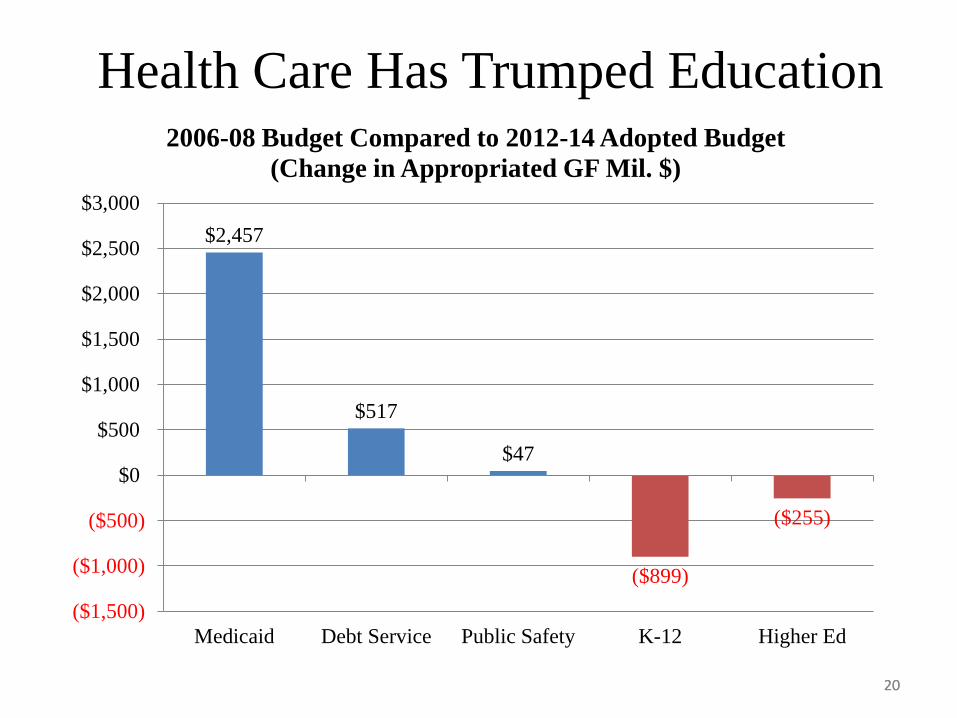
Health Care Has Trumped Education
$2,457
$517
$47
($899)
($255)
($1,500)
($1,000)
($500)
$0
$500
$1,000
$1,500
$2,000
$2,500
$3,000
Medicaid Debt Service Public Safety K-12 Higher Ed
2006-08 Budget Compared to 2012-14 Adopted Budget
(Change in Appropriated GF Mil. $)

Aged/Blind Disabled: 69% Medicaid
Expenditures With 32% Enrollment
21
Aged/Blind/Disable
Non Long Term
Care
34%
Aged/Blind/Disable
Long Term Care
35%
Caretaker Adults
8%
Pregnant Women
2%
Children
21%
FY 2012 Virginia Medicaid Expenditures
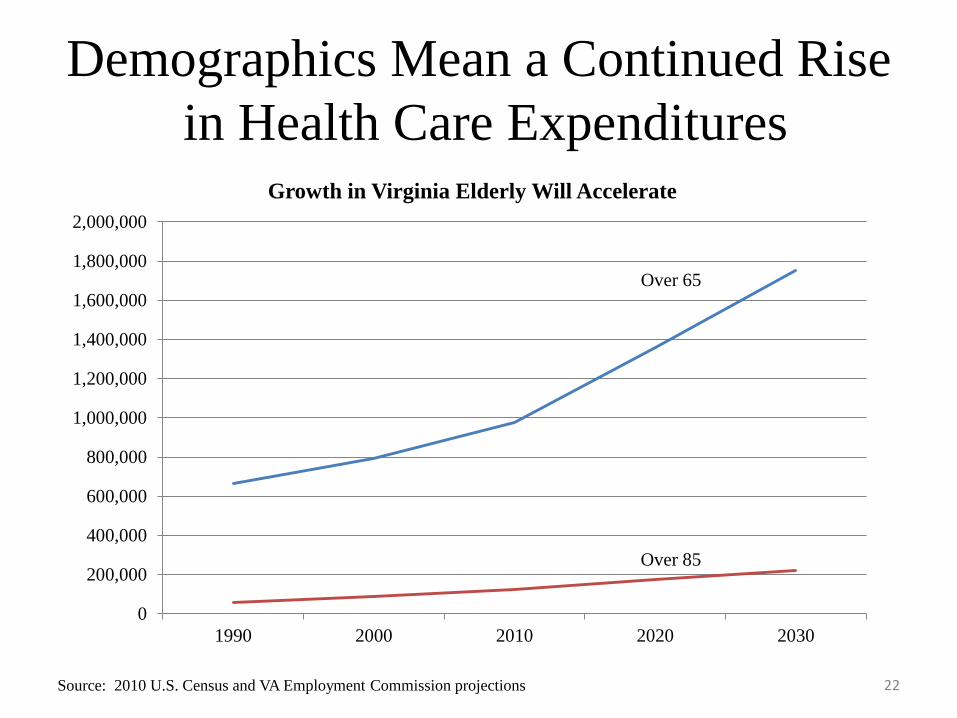
Demographics Mean a Continued Rise
in Health Care Expenditures
22
0
200,000
400,000
600,000
800,000
1,000,000
1,200,000
1,400,000
1,600,000
1,800,000
2,000,000
1990 2000 2010 2020 2030
Growth in Virginia Elderly Will Accelerate
Over 65
Over 85
Source: 2010 U.S. Census and VA Employment Commission projections

23 Sources: Senate Finance Committee Retreat, Nov. 2011
2012 Session Appropriation Acts
$28 $43
$65
$91 $105
$126 $138
$167 $185
$200 $222
$234 $223
$247 $236
$284
$321
$387
$434
$479
$542
$572
$616
$649
$0
$100
$200
$300
$400
$500
$600
$700
General Fund Debt Service Increasing Rapidly ($ Mil.)

…But New Debt Capacity Limited
If AAA Rating a Priority • Outstanding tax-supported debt of the Commonwealth increased by
$8.1 bil. or 150% from 2002 to 2011, with the largest increases occurring between 2009 and 2011.*
- Does not include $1.15 bil. in FRAN’s issued between 2000
and 2005 and $1.2 bil. GARVEE authorization in 2011 for transportation (not considered tax-supported debt).
- About $340 million in new tax-supported debt authorized in 2012 Session.
• Expect about $500 million per year in average tax-supported debt capacity to be available over the next 10 years when Debt Capacity Advisory Committee reports in December.
- Amount available for general fund and TTF debt.
* Does not include FRAN’s or Garvee’s 24

Transportation Relying More on Public-Private Partnerships
Pro’s:
• Potential for more innovation and timely delivery
• Private sector management skills
• Risk transfer to private sector
• Extends public dollars and avoids state debt capacity
• Easier to generate revenues/set toll rates
Con’s:
• Potentially higher cost of capital/tolls than purely public project
• Can circumvent process for prioritizing public dollars
• Difficult balancing act with NEPA and alternatives evaluation
• Non-compete and fairness issues
• Value for Money analysis difficult in cases of one bidder
25

26 26 26
Expect More Local Funding for Transportation System
• Local urban street maintenance expenditures exceed state payments
by 33%. State has proposed devolving secondary road maintenance.
• Local expenditures for highways exceed $365 million, not including
toll revenue, and debt service for transportation project bonds.*
• State revenue sharing increasing. 55 localities applied for $132 mil.
for 149 projects in FY 13. Maximum allocations up to $200 mil./yr.,
with $10 million per locality ($5 million may be for maintenance
projects).
• Local general funds for public transit include $265 million for
operating assistance and $58 million for capital in FY 2013.** SJR
297 DRPT recommendations could increase need for local transit
support.
26
* FY 2010 Weldon Cooper Road, Street, and Highway Finance Survey ** Dept. of Rail and Public Transportation SYIP

Virginia Is a Wealthy, Low Tax State, With
Higher Reliance on Local Revenues
27
Source: Virginia Compared to Other States, JLARC, 2012 Edition
http://jlarc.virginia.gov/reports/Rpt419.pdf
State Rank
Per capita personal income 8
State and local revenue as a percentage of personal income 49
State and local taxes as a percentage of personal income 43
Per capita state taxes 34
Per capita local taxes 13
Individual income taxes as a percentage of state and local tax revenue 7
State motor fuel tax rate rank 37

$10,613
$3,840
$860 $843 $547 $473 $390 $360 $298 $235 $231 $180
$0
$2,000
$4,000
$6,000
$8,000
$10,000
$12,000
FY 2012 Major State Tax Sources ($ Mil.)
28

29
Northern VA PD8
45%
Hampton Roads
PDC
15%
Richmond Regional
12%
All Other
29%
Percent of 2010 State Individual Income Tax
Source: Virginia Tax Department FY 2011 Annual Report
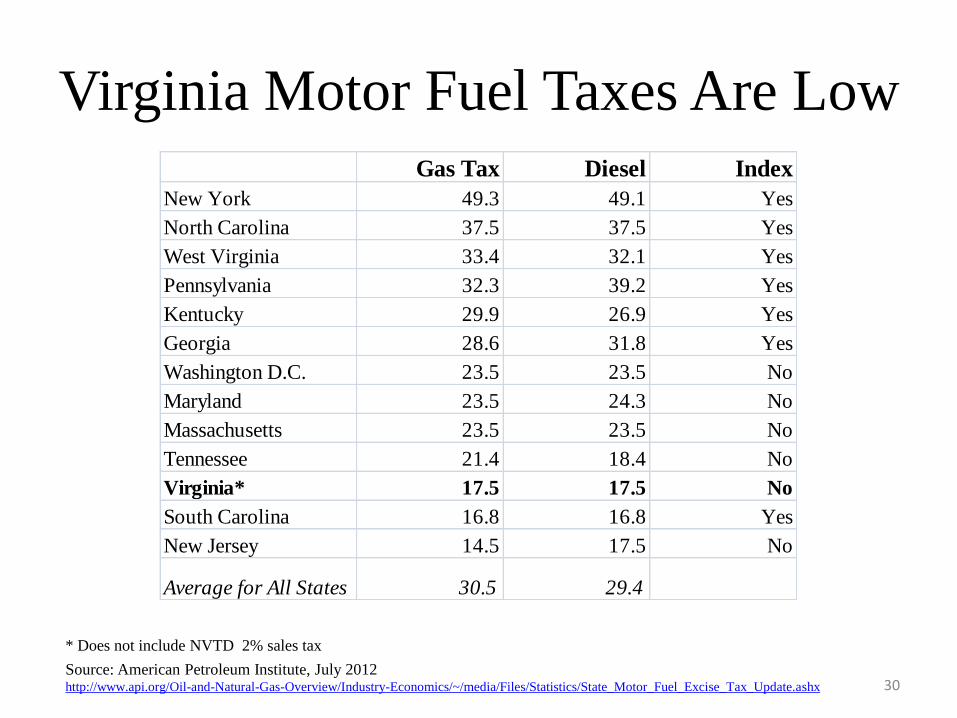
Virginia Motor Fuel Taxes Are Low
Source: American Petroleum Institute, July 2012 http://www.api.org/Oil-and-Natural-Gas-Overview/Industry-Economics/~/media/Files/Statistics/State_Motor_Fuel_Excise_Tax_Update.ashx
Gas Tax Diesel Index
New York 49.3 49.1 Yes
North Carolina 37.5 37.5 Yes
West Virginia 33.4 32.1 Yes
Pennsylvania 32.3 39.2 Yes
Kentucky 29.9 26.9 Yes
Georgia 28.6 31.8 Yes
Washington D.C. 23.5 23.5 No
Maryland 23.5 24.3 No
Massachusetts 23.5 23.5 No
Tennessee 21.4 18.4 No
Virginia* 17.5 17.5 No
South Carolina 16.8 16.8 Yes
New Jersey 14.5 17.5 No
Average for All States 30.5 29.4
30
* Does not include NVTD 2% sales tax

31 31 31
Local Revenues Dominated by Property Taxes
Source: Auditor of Public Accounts Comparative Report of Revenues and Expenditures 31
Note: “All Other Taxes” includes, transient occupancy, MV license, recordation, bank stock, tobacco, admission, severance, franchise license, other
Related Documents