Virginia’s Economy and Budget Outlook A briefing for the Virginia Association of Counties Richard D. Brown Secretary of Finance November 14, 2011

Virginia’s Economy and Budget Outlook A briefing for the Virginia Association of Counties Richard D. Brown Secretary of Finance November 14, 2011.
Dec 18, 2015
Welcome message from author
This document is posted to help you gain knowledge. Please leave a comment to let me know what you think about it! Share it to your friends and learn new things together.
Transcript
Virginia’s Economy and Budget Outlook
A briefing for the Virginia Association of Counties
Richard D. BrownSecretary of FinanceNovember 14, 2011
Topics for Discussion
• Fiscal Year 2011 Performance and Surplus
• National and Virginia Economic Indicators
• Wall Street and Virginia’s Negative Credit Watch
• Looking Ahead: Virginia Budgetary and Funding Issues
2
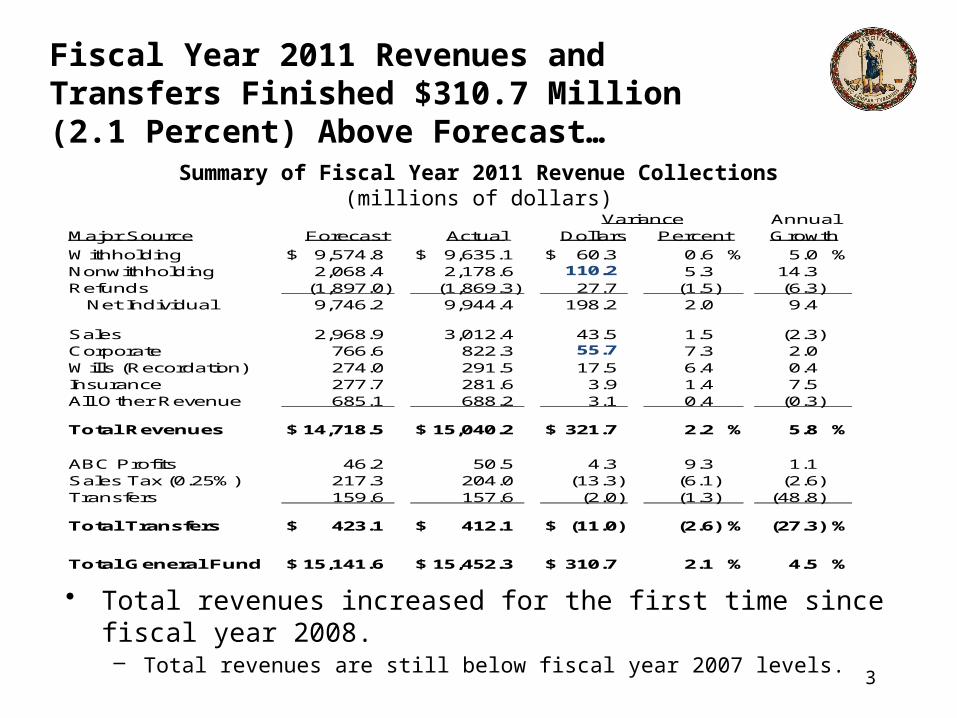
Fiscal Year 2011 Revenues and Transfers Finished $310.7 Million (2.1 Percent) Above Forecast…
• Total revenues increased for the first time since fiscal year 2008.– Total revenues are still below fiscal year 2007 levels.
Summary of Fiscal Year 2011 Revenue Collections(millions of dollars)
Major Source Forecast Actual Dollars
Withholding $ 9,574.8 $ 9,635.1 $ 60.3 0.6 % 5.0 %Nonwithholding 2,068.4 2,178.6 110.2 5.3 14.3Refunds (1,897.0) (1,869.3) 27.7 (1.5) (6.3) Net Individual 9,746.2 9,944.4 198.2 2.0 9.4
Sales 2,968.9 3,012.4 43.5 1.5 (2.3)Corporate 766.6 822.3 55.7 7.3 2.0Wills (Recordation) 274.0 291.5 17.5 6.4 0.4Insurance 277.7 281.6 3.9 1.4 7.5All Other Revenue 685.1 688.2 3.1 0.4 (0.3)
Total Revenues $ 14,718.5 $ 15,040.2 $ 321.7 2.2 % 5.8 %
ABC Profits 46.2 50.5 4.3 9.3 1.1Sales Tax (0.25%) 217.3 204.0 (13.3) (6.1) (2.6)Transfers 159.6 157.6 (2.0) (1.3) (48.8)
Total Transfers $ 423.1 $ 412.1 $ (11.0) (2.6) % (27.3) %
Total General Fund $ 15,141.6 $ 15,452.3 $ 310.7 2.1 % 4.5 %
VariancePercent Growth
Annual
3
4
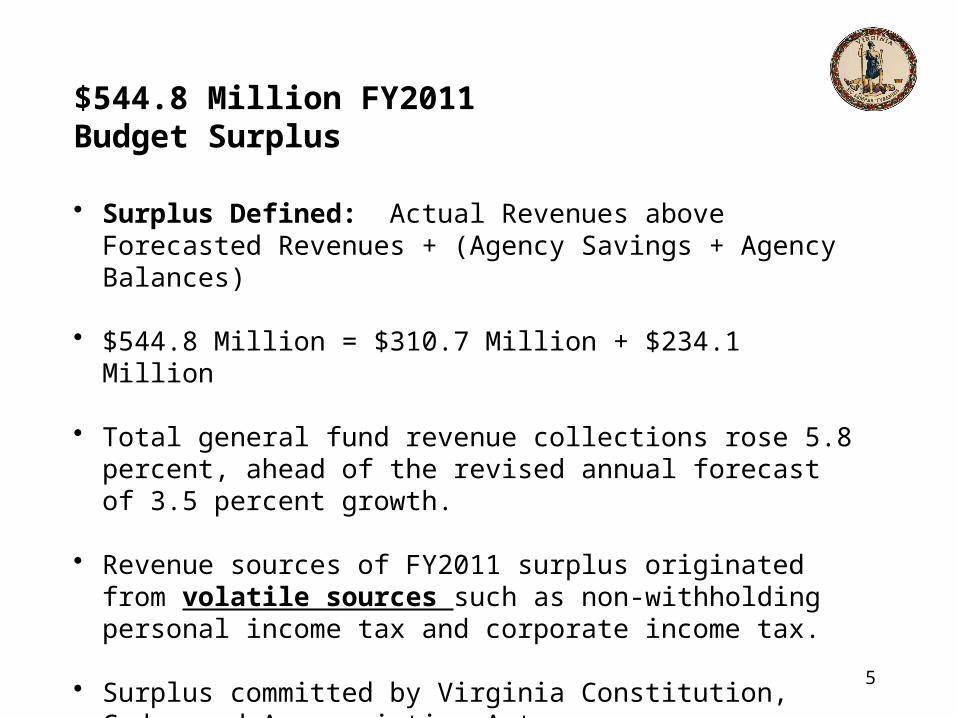
$544.8 Million FY2011 Budget Surplus
• Surplus Defined: Actual Revenues above Forecasted Revenues + (Agency Savings + Agency Balances)
• $544.8 Million = $310.7 Million + $234.1 Million
• Total general fund revenue collections rose 5.8 percent, ahead of the revised annual forecast of 3.5 percent growth.
• Revenue sources of FY2011 surplus originated from volatile sources such as non-withholding personal income tax and corporate income tax.
• Surplus committed by Virginia Constitution, Code and Appropriation Act.
5
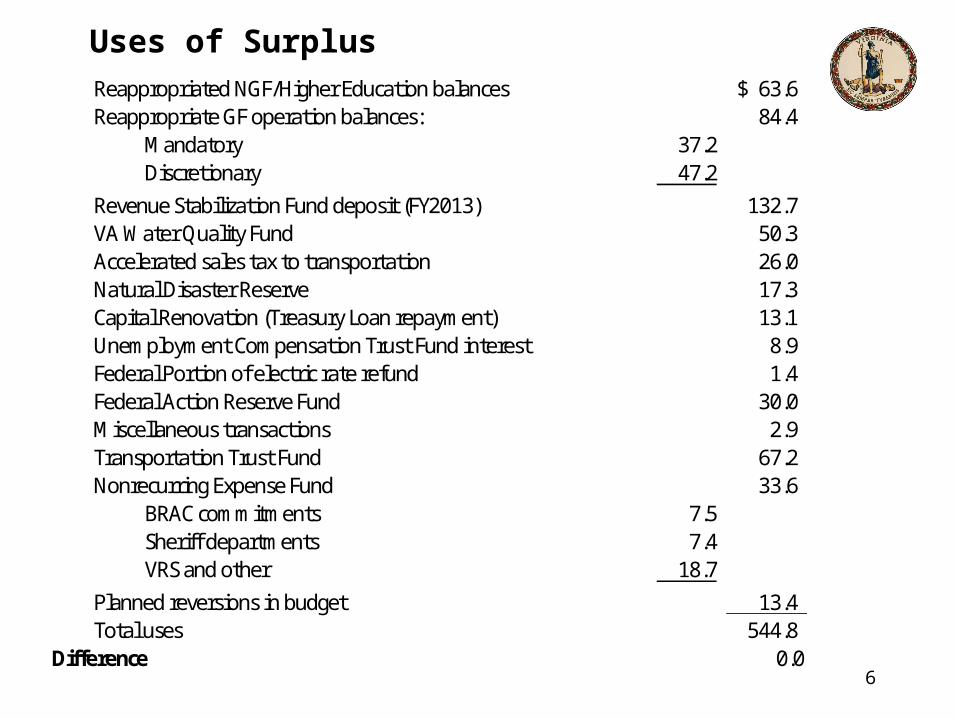
Uses of SurplusReappropriated NGF/Higher Education balances 63.6$ Reappropriate GF operation balances: 84.4
Mandatory 37.2 Discretionary 47.2
Revenue Stabilization Fund deposit (FY2013) 132.7 VA Water Quality Fund 50.3 Accelerated sales tax to transportation 26.0 Natural Disaster Reserve 17.3 Capital Renovation (Treasury Loan repayment) 13.1 Unemployment Compensation Trust Fund interest 8.9 Federal Portion of electric rate refund 1.4 Federal Action Reserve Fund 30.0 Miscellaneous transactions 2.9 Transportation Trust Fund 67.2 Nonrecurring Expense Fund 33.6
BRAC commitments 7.5 Sheriff departments 7.4 VRS and other 18.7
Planned reversions in budget 13.4 Total uses 544.8
Difference 0.06

Both the U.S. and Virginia Economies Performed Near Expectations in Fiscal Year 2011
• As measured on a fiscal year basis (July through June), estimated real GDP increased 2.6 percent.– Rising inventories supported growth, offsetting modest consumer spending in the face of employment
losses and shrinking incomes.
• In Virginia, employment gains were slightly better than expected, thanks in part to gains in the high-paying professional and business services sector. Income growth also exceeded expectations.
Summary of Key U.S. and Virginia Economic IndicatorsPercent Change Over the Prior Fiscal Year
* FY11 Actual is based on three quarters of actual data and one quarter of forecast data.
FY11 Forecast
FY11 Actual
FY12 Forecast
U.S.
Real GDP 2.2 2.6 2.7
Consumer Spending 2.1 2.5 2.3
Employment 0.5 0.6 1.6
Personal Income 3.3 5.4 3.5
Wages & Salaries 2.8 3.7 4.1
Virginia
Employment 0.7 1.2 2.0
Professional/Business 1.6 3.0 4.4
Construction/Mining (3.0) (0.3) 4.7
Personal Income * 2.8 5.0 3.6
Wages & Salaries * 2.6 3.5 4.7
7
8
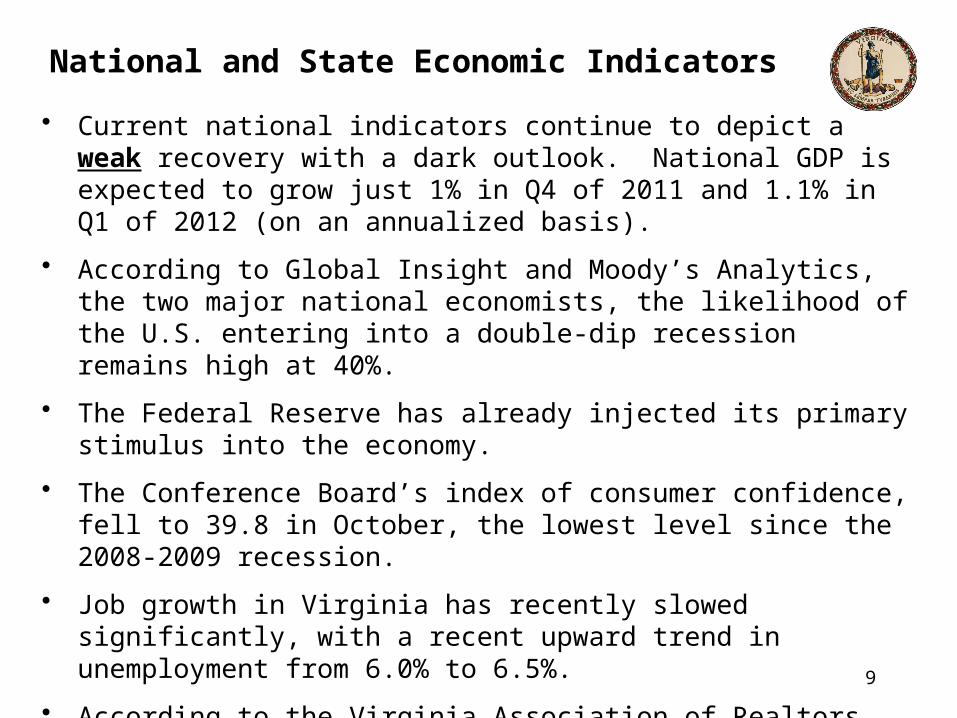
National and State Economic Indicators
• Current national indicators continue to depict a weak recovery with a dark outlook. National GDP is expected to grow just 1% in Q4 of 2011 and 1.1% in Q1 of 2012 (on an annualized basis).
• According to Global Insight and Moody’s Analytics, the two major national economists, the likelihood of the U.S. entering into a double-dip recession remains high at 40%.
• The Federal Reserve has already injected its primary stimulus into the economy.
• The Conference Board’s index of consumer confidence, fell to 39.8 in October, the lowest level since the 2008-2009 recession.
• Job growth in Virginia has recently slowed significantly, with a recent upward trend in unemployment from 6.0% to 6.5%.
• According to the Virginia Association of Realtors, for Q2 2011 compared to the prior year, the median sales price declined 2% and the total number of foreclosures increased 7.5%.
9

Virginia’s AAA Bond Rating at Risk
July 13th
Moody’s places U.S. on
review for possible Aaa downgrade
July 19th Moody’s Places Five Aaa States (including VA) on review for downgrade
August 2nd • Congress raises U.S. Statutory
Debt Limit with triggers• Moody’s confirms U.S. Aaa
rating, but changes U.S. outlook to negative
• Fitch takes no action, but announces review of U.S. to conclude by end of AugustAugust 4th Moody’s
confirms Aaa rating of
Virginia, but changes Virginia’s outlook to negative
August 8th Standard & Poor’s
places VHDA’s Commonwealth
Mortgage Bonds’ AAA rating on Negative
Credit Watch because of their “direct link” as
being insured by the FHA, an agency of the Federal Government,
which was downgraded to AA+
August 16th
Fitch confirms U.S.
AAA rating with a stable
outlook
August 5th Standard & Poor’s lowers sovereign rating of the U.S. from AAA to AA+
and changes outlook to negative
July August
Note: It is anticipated that Moody’s will conclude its review of Virginia and determine whether our outlook remains negative or returns to stable by the end of November.
10

Strategy for Addressing Bond Ratings (Future Borrowings)
• #1 - Enhance Liquidity:– Revenue Stabilization Fund (RSF) will grow to $440 million by end of FY2013 and
could double in size, $600 million by end of FY2014 with continued revenue growth. The RSF can only be used to offset a shortfall in revenue from what is anticipated in an emailed budget.
– Create Federal Action Contingency Fund (FACT) is a cash reserve that can be used to offset a variety of negative impacts on Virginia related to future federal actions which cannot be addressed by RSF.
• Replace certain losses in direct federal grants,• Use for incentives to retain or consolidate federal facilities in Virginia. Like BRAC approach.• Address federal tax policy changes from conformity,• Help businesses impacted by federal procurement or defense contracts as they change to other
customers
• #2 – Diversify Economy– Long-range strategy given immediate attention.– Executive order to direct economic development personnel to fully develop
strategy.11
12
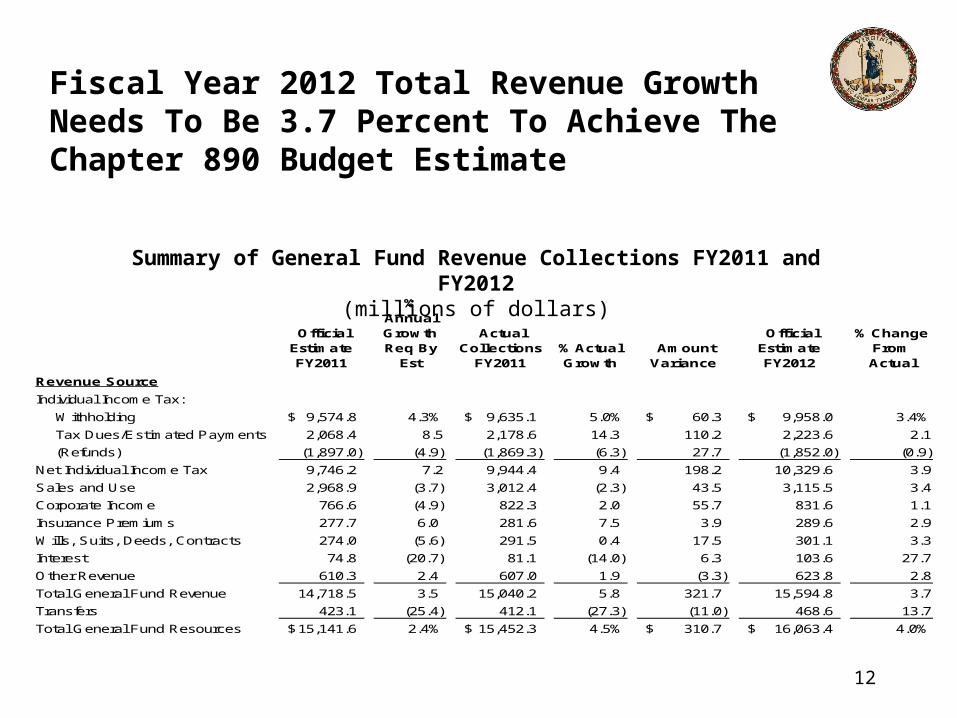
Fiscal Year 2012 Total Revenue Growth Needs To Be 3.7 Percent To Achieve The Chapter 890 Budget Estimate
Official Estimate FY2011
% Annual Growth Req By
Est
Actual Collections
FY2011 % Actual Growth
Amount Variance
Official Estimate FY2012
% Change From Actual
Revenue Source
Individual Income Tax:
Withholding 9,574.8$ 4.3% 9,635.1$ 5.0% 60.3$ 9,958.0$ 3.4%
Tax Dues/Estimated Payments 2,068.4 8.5 2,178.6 14.3 110.2 2,223.6 2.1
(Refunds) (1,897.0) (4.9) (1,869.3) (6.3) 27.7 (1,852.0) (0.9)
Net Individual Income Tax 9,746.2 7.2 9,944.4 9.4 198.2 10,329.6 3.9
Sales and Use 2,968.9 (3.7) 3,012.4 (2.3) 43.5 3,115.5 3.4
Corporate Income 766.6 (4.9) 822.3 2.0 55.7 831.6 1.1
Insurance Premiums 277.7 6.0 281.6 7.5 3.9 289.6 2.9
Wills, Suits, Deeds, Contracts 274.0 (5.6) 291.5 0.4 17.5 301.1 3.3
Interest 74.8 (20.7) 81.1 (14.0) 6.3 103.6 27.7
Other Revenue 610.3 2.4 607.0 1.9 (3.3) 623.8 2.8
Total General Fund Revenue 14,718.5 3.5 15,040.2 5.8 321.7 15,594.8 3.7
Transfers 423.1 (25.4) 412.1 (27.3) (11.0) 468.6 13.7
Total General Fund Resources 15,141.6$ 2.4% 15,452.3$ 4.5% 310.7$ 16,063.4$ 4.0%
Summary of General Fund Revenue Collections FY2011 and FY2012(millions of dollars)

13
How Are We Doing?
General Fund Revenue Collections - October 2011$ in Millions
Year-to-date
FY2012 Estimate
% Change October
Collections FY2012 FY2011 % Change
FY2012 Official
Estimate
Individual Income Tax:
Withholding $ 9,958.0 +5.3% $ 3,118.8 $ 2,989.1 +4.3% +3.4%
Nonwithholding 2,223.6 +5.0% 410.9 352.9 +16.5% +2.1%
(Refunds) (1,852.0) -5.3% (163.5) (184.1) -11.2% -0.9%
Net Individual Income Tax $10,329.6 +6.1% $ 3,366.2 $ 3,157.9 +6.6% +3.9%
Sales and Use Tax $ 3,115.5 +2.9% $ 881.1 $ 831.2 6.0% 3.4%
Corporate Income 831.6 -55.1% 208.9 216.8 -3.7% 1.1%
Wills, Suits, Deeds, Contracts 301.1 +0.9% 104.5 101.1 +3.4% +3.3%
Insurance Premiums 289.6 0 - - 0 +2.9%
Interest Income 103.6 -223.4% 26.5 24.8 +6.8% +27.7%
All Other 623.8 +12.5% 135.4 131.0 +3.4% +2.8%
Total $15,594.8 +3.1% $ 4,722.6 $ 4,462.8 +5.8% +3.7%

14
Final Thoughts on Revenue Outlook
• Over half of the FY 2011 surplus revenue came from extra nonwithholding and corporate income tax receipts, which are more difficult to predict going forward.
• National projections of economic activity appear to be deteriorating, especially in short-run (remaining half of calendar 2011), from where we were during the last legislative session.
• Coming off the higher revenue base of FY2011 (surplus), we can grow 40% less in F2012 or +3.7% than originally forecast +6.0% and meet the budget revenue estimate.
• Economic result is conflicting patterns to analyze.
Upside Downside Pent- up demand Anemic job growth
Low inflation/borrowing costs Lack of consumer demand Liquidity in system (corporate cash) Prolonged real estate slide
• The game appears to be ahead of us, not so much this year!

15
Looking Ahead: Virginia Budgetary and Funding Issues

16
Base Budget IssueStructural Balance Going Forward
$ in Millions
Carryforward Amount to Balance FY2012 $ 265.4
Less One-Time Spending:Reserve for Revenue Stabilization Fund 114.0 Supplemental Support for K-12 87.7 BHADS Trust Fund 30.0 Subtotal 231.7
Plus One-Time Revenue:Sale of Brunswick 20.0
Structural Difference Going Forward $ 53.7

Virginia Budgetary Funding Issues
State Challenges
• K-12 Public Education Rebenchmarking for Standards of Quality
• Virginia Retirement System rates for increasing unfunded pension liabilities
• State Employee salary increases
Unfunded Federal Mandates
• The U.S. Environmental Protection Agency - Watershed Improvement Plan for Clean-Up of the Chesapeake Bay with expected total costs approaching $8 Billion
• The Federal Health Care Reform Program is expected to cost Virginia in excess of $2 billion by 2022. The number of New Medicaid recipients could rise by as much as 425,000 Virginians
• Moreover, the Federal Health Care Reform Program contains a permanent “Maintenance of Eligibility (MOE)” provision for basic Medicaid services and the Children’s Health Insurance Program (CHIP).
17
18
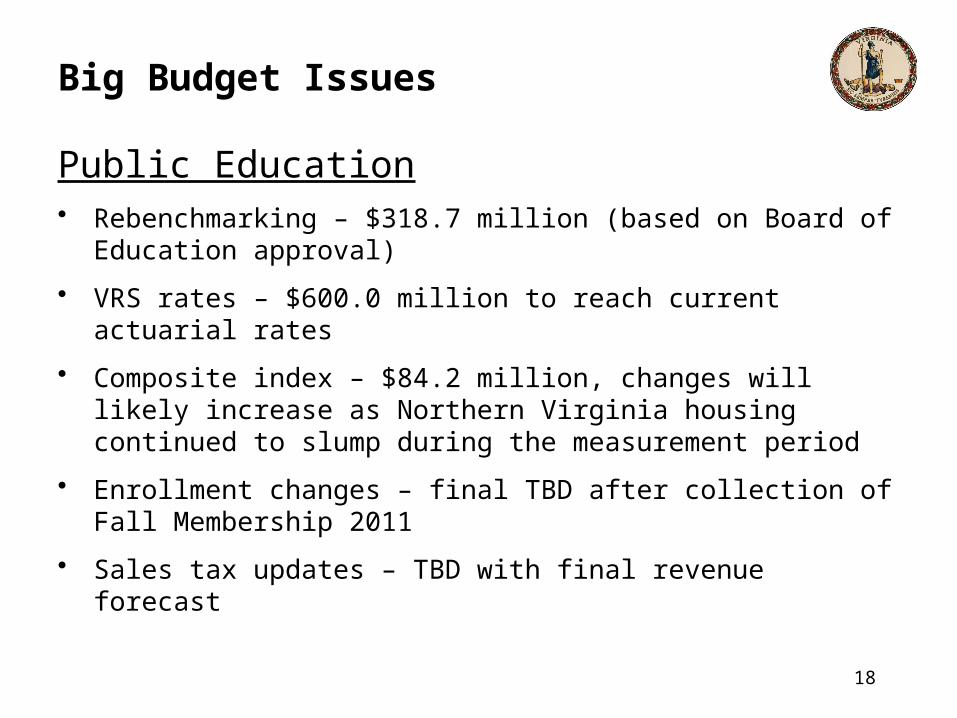
Big Budget Issues
Public Education• Rebenchmarking – $318.7 million (based on Board of
Education approval)
• VRS rates – $600.0 million to reach current actuarial rates
• Composite index – $84.2 million, changes will likely increase as Northern Virginia housing continued to slump during the measurement period
• Enrollment changes – final TBD after collection of Fall Membership 2011
• Sales tax updates – TBD with final revenue forecast

19
Higher Education• No more stimulus dollars to offset past reductions
• Tuition increase policy
• $10.0 million annual reversion in FY 2012 – maintain or eliminate?
• Focus on enrolling students in STEM programs
• 100,000 new degrees
• Student financial assistance/Tuition assistance grants (TAG)
• Future of “base adequacy” as a funding model/use of financial incentives
• State Council of Higher Ed request, approximately $350 million.
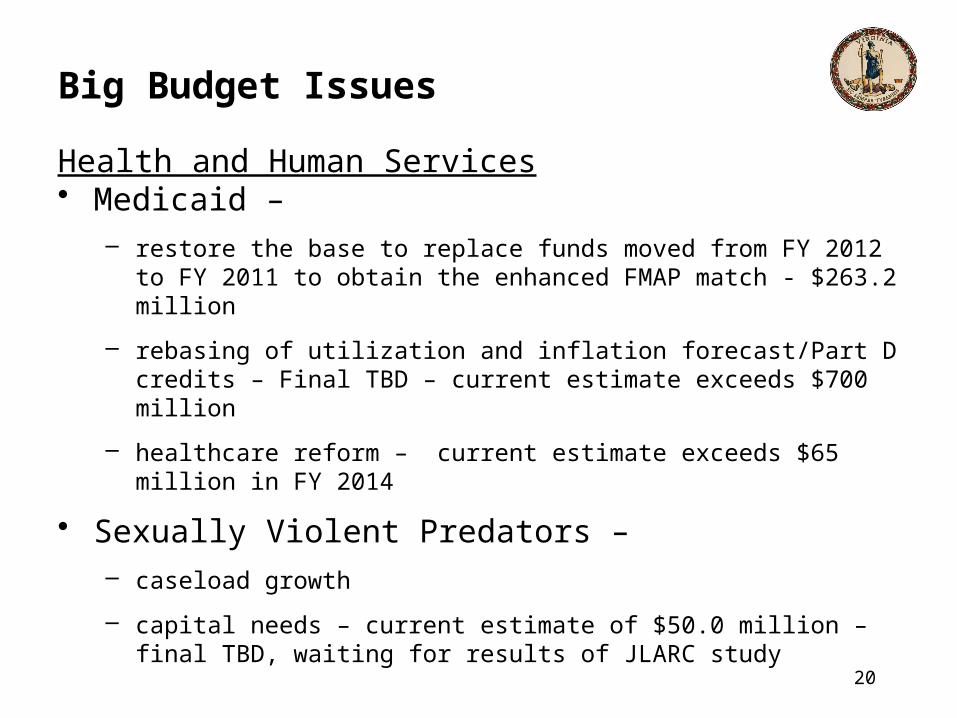
Big Budget Issues
20
Health and Human Services• Medicaid –
– restore the base to replace funds moved from FY 2012 to FY 2011 to obtain the enhanced FMAP match - $263.2 million
– rebasing of utilization and inflation forecast/Part D credits – Final TBD – current estimate exceeds $700 million
– healthcare reform – current estimate exceeds $65 million in FY 2014
• Sexually Violent Predators – – caseload growth
– capital needs – current estimate of $50.0 million – final TBD, waiting for results of JLARC study
Big Budget Issues

21
Health and Human Services – continued
• Behavioral Health – costs TBD– outcome of negotiations with the U.S. Department of Justice
– increases in community-based slots
– potential downsizing of facilities
• Replacement of TANF funds – estimate to continue current commitments - $28.8 million
• Other HHR issues – costs TBD– CSA, child welfare, local health and DSS operations
Big Budget Issues
22
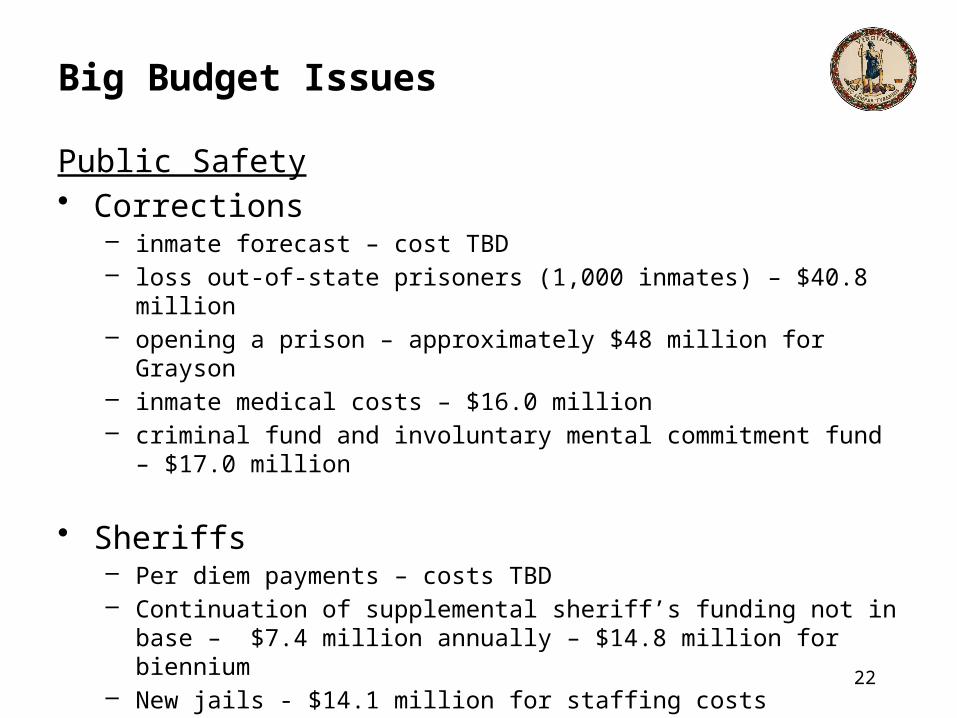
Big Budget Issues
Public Safety• Corrections
– inmate forecast – cost TBD– loss out-of-state prisoners (1,000 inmates) – $40.8 million– opening a prison – approximately $48 million for Grayson– inmate medical costs – $16.0 million– criminal fund and involuntary mental commitment fund – $17.0
million
• Sheriffs– Per diem payments – costs TBD– Continuation of supplemental sheriff’s funding not in base –
$7.4 million annually – $14.8 million for biennium– New jails - $14.1 million for staffing costs
23
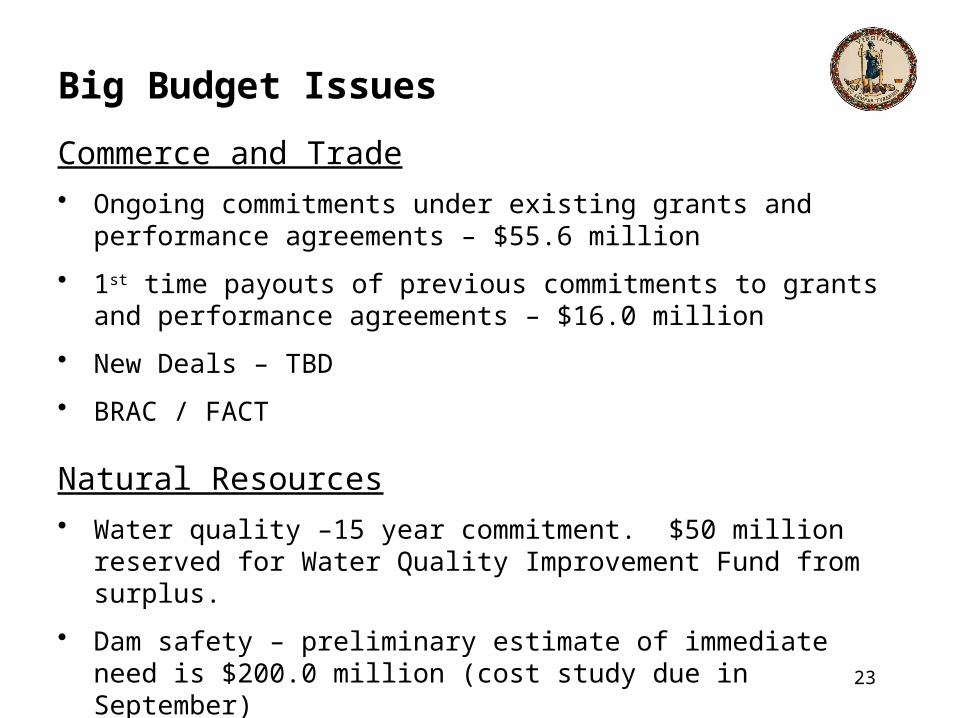
Commerce and Trade• Ongoing commitments under existing grants and
performance agreements – $55.6 million
• 1st time payouts of previous commitments to grants and performance agreements – $16.0 million
• New Deals – TBD
• BRAC / FACT
Natural Resources• Water quality –15 year commitment. $50 million reserved
for Water Quality Improvement Fund from surplus.
• Dam safety – preliminary estimate of immediate need is $200.0 million (cost study due in September)
Big Budget Issues

24
Statewide Issues• VRS Rates
– Annual cost of one percent increase – approximately $17.0 million
– Replacement of deferred amounts - $150 million annually ($300 million for biennium)
– VRS Board Certified Rates – Approximately $270 million
• Revenue Stabilization Fund – Required deposit for FY 2013 – $132.7 million
– Current estimate of required deposit in FY 2014 – $91.7 million
– A one percent shift in revenue growth will add or subtract approximately $73 million from this amount.
Big Budget Issues
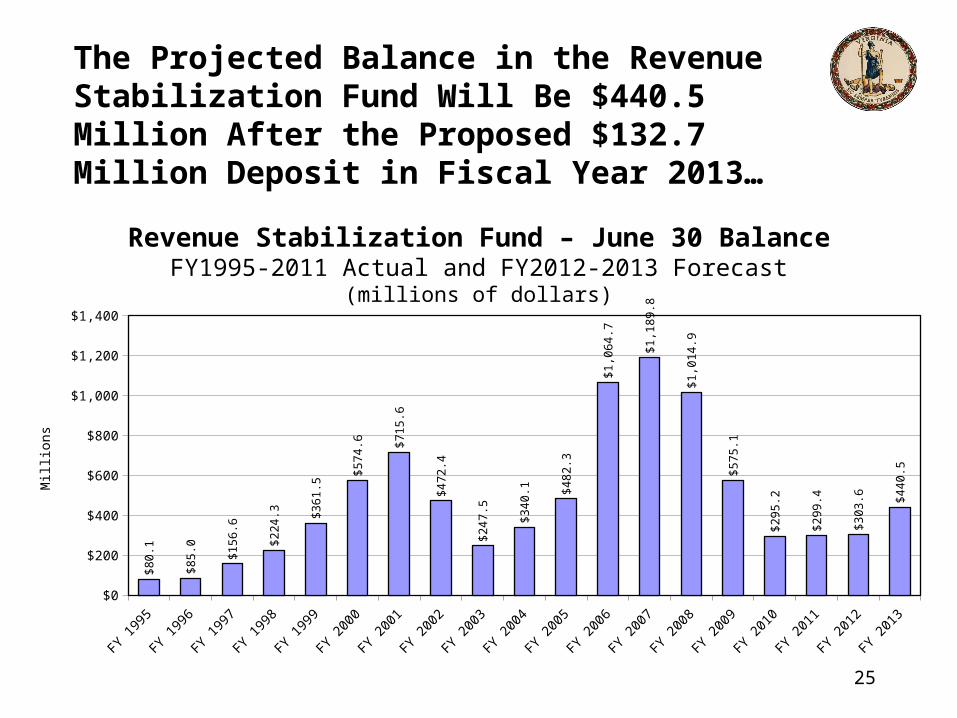
The Projected Balance in the Revenue Stabilization Fund Will Be $440.5 Million After the Proposed $132.7 Million Deposit in Fiscal Year 2013…
FY 199
5
FY 199
6
FY 199
7
FY 199
8
FY 199
9
FY 200
0
FY 200
1
FY 200
2
FY 200
3
FY 200
4
FY 200
5
FY 200
6
FY 200
7
FY 200
8
FY 200
9
FY 201
0
FY 201
1
FY 201
2
FY 201
3$0
$200
$400
$600
$800
$1,000
$1,200
$1,400
$8
0.1
$8
5.0 $1
56
.6
$2
24
.3 $3
61
.5
$5
74
.6 $7
15
.6
$4
72
.4
$2
47
.5
$3
40
.1 $4
82
.3
$1
,06
4.7
$1
,18
9.8
$1
,01
4.9
$5
75
.1
$2
95
.2
$2
99
.4
$3
03
.6 $4
40
.5Mill
ions
Revenue Stabilization Fund – June 30 BalanceFY1995-2011 Actual and FY2012-2013 Forecast
(millions of dollars)
25
26
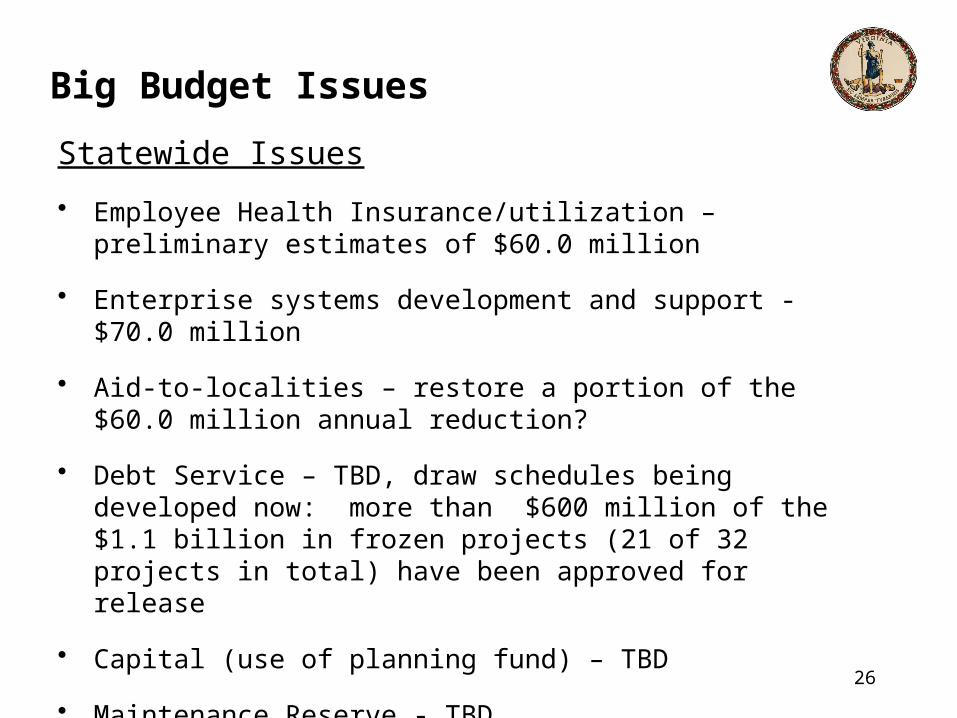
Statewide Issues
• Employee Health Insurance/utilization – preliminary estimates of $60.0 million
• Enterprise systems development and support - $70.0 million
• Aid-to-localities – restore a portion of the $60.0 million annual reduction?
• Debt Service – TBD, draw schedules being developed now: more than $600 million of the $1.1 billion in frozen projects (21 of 32 projects in total) have been approved for release
• Capital (use of planning fund) – TBD
• Maintenance Reserve - TBD
Big Budget Issues

27
Governor’s Priorities
– Job Creation (Diversification)
– Higher Education
– Retirement Funding
– Government Reform
Big Budget Issues
28
Looking Ahead: The Bottom Line

29
Looking AheadThe General Fund Budget
$ in Millions
Appropriation Act
FY2012
Assumed Base
FY2013 CommentResources
Balance from Prior Year $ 265.4 $ 116.1 ($2.1 Unappropriated Balance+ $114.0 RSF Reserve)
Adjustments to Balance 230.2 - (mostly VRS deferral)
Revenue 15,594.8 16,275.7 (+3.7% FY2012+4.5% FY2013)
Transfers 468.6 468.6 (No change but downside risks)Total Resources $ 16,559.0 $ 16,860.4
SpendingOperating Expenses: K-12 One-Time Supplement $ 87.7 $ - (Assume one-time)
Revenue Stabilization Fund 114.0 - (FY2013 Reserved in Surplus)
Intellectual Disabilities Trust 30.0 30.0 (Assume continues) Other 16,316.3 16,316.3 (Assume continues) Total Operating $ 16,548.0 $ 16,346.3 Capital Outlay 8.9 15.0 (Planning Fund)Total Spending $ 16,556.9 $ 16,361.3
Difference $ 2.1 $ 499.1
30
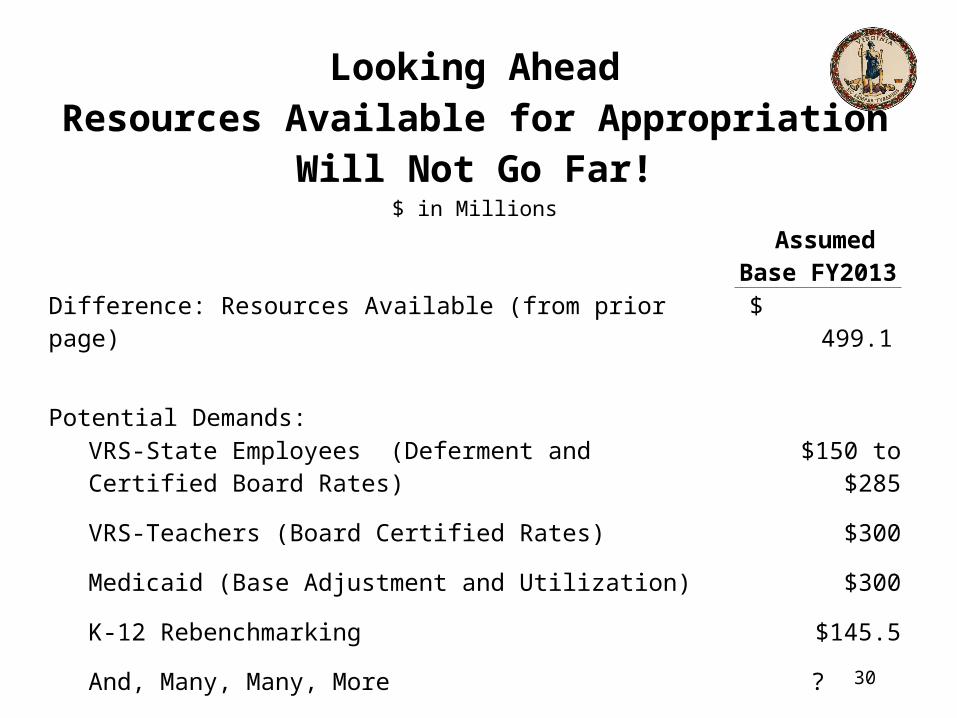
Looking Ahead
Resources Available for AppropriationWill Not Go Far!
$ in Millions
Assumed Base FY2013
Difference: Resources Available (from prior page) $ 499.1
Potential Demands:
VRS-State Employees (Deferment and Certified Board Rates) $150 to $285
VRS-Teachers (Board Certified Rates) $300
Medicaid (Base Adjustment and Utilization) $300
K-12 Rebenchmarking $145.5
And, Many, Many, More ?

Concluding Thoughts
• The economic picture has deteriorated from expectations (only 9-10 months ago).
• Because of the FY2011 revenue surplus, only moderate growth is needed to make budget estimate for FY2012. (+3.7% vs. +6.0%)
• Accordingly, FY2012 appears to be okay, but there is a greater need for flexibility and liquidity (#+@*Federal Government / Bond Rating Firms).
• Uncertainty means cash reserves are in order (Revenue Stabilization Fund/ FACT Fund).
• Slower growth will begin to squeeze budget in FY2013 as pending mandates and funding demands for core expense items exceed available resources with revised economic outlook.
31

Concluding Thoughts
• The Governor’s call for 2%, 4% and 6% budget cut plans from state agencies was in order and necessary, given the circumstances.
• FY2013 is the choke point in the budget (FY2014 is largely solved if FY2013 is addressed with on-going budget actions).
• The way ahead will be very difficult (my wife reminded me I could have retired!).
• Good luck to us all. (We will need luck and skill moving ahead.)
32
Related Documents


