2015 Virginia Tech CSES-149NP Virginia Cooperative Extension programs and employment are open to all, regardless of age, color, disability, gender, gender identity, gender expression, national origin, political affiliation, race, religion, sexual orientation, genetic information, veteran status, or any other basis protected by law. An equal opportunity/affirmative action employer. Issued in furtherance of Cooperative Extension work, Virginia Polytechnic Institute and State University, Virginia State University, and the U.S. Department of Agriculture cooperating. Edwin J. Jones, Director, Virginia Cooperative Extension, Virginia Tech, Blacksburg; M. Ray McKinnie, Interim Administrator, 1890 Extension Program, Virginia State University, Petersburg. VIRGINIA CORN HYBRID AND MANAGEMENT TRIALS IN 2015 Coordinators of Virginia Corn Hybrid Trials in 2015 Wade Thomason, Extension Specialist, Department of Crop and Soil Environmental Sciences, Virginia Tech Harry Behl, Research Specialist Senior, Department of Crop and Soil Environmental Sciences, Virginia Tech Elizabeth Rucker, Research Associate, Department of Crop and Soil Environmental Sciences, Virginia Tech Other contributors: Bruce Beahm, Foundation Seed Manager, Virginia Crop Improvement Association Foundation Seed Farm Phillip Browning, Assistant Manager, Virginia Crop Improvement Association Foundation Seed Farm Steve Gulick, Farm Manager, Northern Piedmont Center Doug Horn, Extension Agent, Rockingham County Karl Jones, Agricultural Manager Senior, Tidewater Agricultural Research and Extension Center Ned Jones, Farm Manager, Southern Piedmont Agricultural Research and Extension Center Jon Wooge, Agricultural Program Coordinator, College Farm, Virginia Tech Companies Participating in the 2015 Corn Hybrid Trials Company Brand Address AgriGold Hybrids AgriGold 5381 Akin Rd., St. Francisville, IL 62460 Augusta Seed Corporation Augusta PO Box 899, Verona, VA 24482 Crop Production Services Dyna-Gro 15277 Richmond Tappahannock Hwy, St. Stephens Church, VA 23148-0409 Doeblers Doeblers® and RPM® 202 Tiadaghton Ave., Jersey Shore, PA 17740 Dupont Pioneer Pioneer 59 Greif Parkway Suite 200, Delaware, OH 43015 Erwin-Keith Inc. Progeny Ag Products 1529 Hwy 193, Wynne, AR 72396 Monsanto Channel and Dekalb 800 N Lindbergh Blvd, St Louis, MO 63167 Meherrin Agricultural & Chemical Co. Phoenix 413 Main St., Severn, NC 27877 Seed Consultants, Inc. Seed Consultants 648 Miami Trace Rd., Washington Crthse, OH 43160 Syngenta Seeds NK 11055 Wayzata Blvd., Minnetonka, MN 55305 T.A. Seeds LLC T.A. Seeds 39 Seeds Lane, Jersey Shore, PA 17740 Terral Seed Inc. Terral Seed 111 Ellington Dr., Rayville, LA 71269 Tidewater Seed, LLC AXIS 210 Marlboro Ave Suite 25, Easton, MD 21601 Appreciation is expressed to the Virginia Corn Check-Off Board for financial support of this research and the Virginia Extension corn program

Welcome message from author
This document is posted to help you gain knowledge. Please leave a comment to let me know what you think about it! Share it to your friends and learn new things together.
Transcript

2015 Virginia Tech CSES-149NPVirginia Cooperative Extension programs and employment are open to all, regardless of age, color, disability, gender, gender identity, gender expression, national origin, political affiliation, race, religion, sexual
orientation, genetic information, veteran status, or any other basis protected by law. An equal opportunity/affirmative action employer. Issued in furtherance of Cooperative Extension work, Virginia Polytechnic Institute and State University, Virginia State University, and the U.S. Department of Agriculture cooperating. Edwin J. Jones, Director, Virginia Cooperative Extension, Virginia Tech, Blacksburg; M. Ray McKinnie, Interim
Administrator, 1890 Extension Program, Virginia State University, Petersburg.
VIRGINIA CORN HYBRID AND MANAGEMENT TRIALS IN 2015
Coordinators of Virginia Corn Hybrid Trials in 2015
Wade Thomason, Extension Specialist, Department of Crop and Soil Environmental Sciences, Virginia Tech Harry Behl, Research Specialist Senior, Department of Crop and Soil Environmental Sciences, Virginia Tech Elizabeth Rucker, Research Associate, Department of Crop and Soil Environmental Sciences, Virginia Tech
Other contributors: Bruce Beahm, Foundation Seed Manager, Virginia Crop Improvement Association Foundation Seed Farm
Phillip Browning, Assistant Manager, Virginia Crop Improvement Association Foundation Seed Farm Steve Gulick, Farm Manager, Northern Piedmont Center
Doug Horn, Extension Agent, Rockingham County Karl Jones, Agricultural Manager Senior, Tidewater Agricultural Research and Extension Center
Ned Jones, Farm Manager, Southern Piedmont Agricultural Research and Extension Center Jon Wooge, Agricultural Program Coordinator, College Farm, Virginia Tech
Companies Participating in the 2015 Corn Hybrid Trials
Company Brand Address
AgriGold Hybrids AgriGold 5381 Akin Rd., St. Francisville, IL 62460 Augusta Seed Corporation Augusta PO Box 899, Verona, VA 24482 Crop Production Services Dyna-Gro 15277 Richmond Tappahannock Hwy, St. Stephens
Church, VA 23148-0409 Doeblers Doeblers® and RPM® 202 Tiadaghton Ave., Jersey Shore, PA 17740 Dupont Pioneer Pioneer 59 Greif Parkway Suite 200, Delaware, OH 43015 Erwin-Keith Inc. Progeny Ag Products 1529 Hwy 193, Wynne, AR 72396 Monsanto Channel and Dekalb 800 N Lindbergh Blvd, St Louis, MO 63167 Meherrin Agricultural & Chemical Co. Phoenix 413 Main St., Severn, NC 27877 Seed Consultants, Inc. Seed Consultants 648 Miami Trace Rd., Washington Crthse, OH 43160 Syngenta Seeds NK 11055 Wayzata Blvd., Minnetonka, MN 55305 T.A. Seeds LLC T.A. Seeds 39 Seeds Lane, Jersey Shore, PA 17740 Terral Seed Inc. Terral Seed 111 Ellington Dr., Rayville, LA 71269 Tidewater Seed, LLC AXIS 210 Marlboro Ave Suite 25, Easton, MD 21601
Appreciation is expressed to the Virginia Corn Check-Off Board for financial support of this research and the Virginia Extension corn program

Table of ContentsBackground Information, Yield Differences, Understanding Relative Yield, and Choice of Hybrids .............................................................................................................................................................. 1
2015 Virginia Corn Hybrid Plot Information ..................................................................................................................... 2
Table 1. List of hybrids in the 2015 Virginia Corn Hybrid & Management Trials ....................................................... 3
Table 2. Handy Bt Trait Table ...................................................................................................................................... 6
Table 3. 2015 Relative yield of hybrids entered in three or more locations .................................................................. 8
Table 4. Two-year average relative yield of hybrids entered in three or more locations each year ............................ 12
Table 5. Three-year average relative yield of hybrids entered in three or more locations each year .......................... 13
Table 6. Yields at Holland, VA in 2015...................................................................................................................... 14
Table 7. Two-year average yields at Holland, VA in 2014 and 2015 ......................................................................... 16
Table 8. Three-year average yields at Holland, VA in 2013, 2014, and 2015 ............................................................ 17
Table 9. Yields at Mt. Holly, VA in 2015 ................................................................................................................... 18
Table 10. Two-year average yields at Mt. Holly, VA in 2014 and 2015 ...................................................................... 22
Table 11. Three-year average yields at Mt. Holly, VA in 2013, 2014, and 2015 .......................................................... 24
Table 12. Yields at Mt. Holly, VA under irrigation in 2015 ......................................................................................... 26
Table 13. Two-year average yields at Mt. Holly, VA under irrigation in 2014 and 2015 ............................................. 29
Table 14. Three-year average yields at Mt. Holly, VA under irrigation in 2013, 2014, and 2015 ................................ 31
Table 15. Yields at Blackstone, VA in 2015 ................................................................................................................. 32
Table 16. Two-year average yields at Blackstone, VA in 2014 and 2015 .................................................................... 34
Table 17. Three-year average yields at Blackstone, VA in 2013, 2014, and 2015 ........................................................ 35
Table 18. Yields at Blacksburg, VA in 2015 ................................................................................................................ 36
Table 19. Two-year average yields at Blacksburg, VA in 2014 and 2015 .................................................................... 38
Table 20. Three-year average yields at Blacksburg, VA in 2013, 2014, and 2015 ....................................................... 39
Table 21. Yields at Orange, VA in 2015 ....................................................................................................................... 40
Table 22. Two-year average yields at Orange, VA in 2014 and 2015 .......................................................................... 42
Table 23. Three-year average yields at Orange, VA in 2013, 2014, and 2015.............................................................. 43
Table 24. Yields at Shenandoah Valley in Rockingham County, VA in 2015 .............................................................. 44
Table 25. Two-year average yields at Shenandoah Valley, VA in 2014 and 2015 ....................................................... 46
Table 26. Three-year average yields at Shenandoah Valley, VA in 2013, 2014, and 2015 .......................................... 47

Background Information Performance trials of commercial corn hybrids were conducted at six locations in Virginia in 2015. The Mt. Holly location consisted of both an irrigated and non-irrigated test. All locations were planted with a Wintersteiger PlotKing 2600. All locations were harvested with a Massey-Ferguson 8XP plot combine. Yields have been adjusted to 15.5% moisture. Grain test weight, moisture, and plot grain weights were measured with a GrainGauge® manufactured by HarvestMaster. A list of the companies participating in the trials is shown in the above table. All hybrids entered in the Virginia trials were those submitted by commercial companies. The locations at which particular hybrids were entered were specified by the company. Companies entering hybrids were charged a fee for each hybrid per location to support the Virginia Corn Hybrid and Management Trials.
Yield Differences Experimental plots vary in yield and other measurements due to location in the field and other factors which cannot be controlled. Statistics given in the tables are intended to help the reader make valid comparisons between hybrids. The magnitude of differences which may have been due to uncontrollable variation has been computed for the data and listed at the bottom of columns as the LSD (.05) (least significant difference with 95% confidence). Differences less than the LSD are assumed not to be real differences with 95% confidence. Understanding Relative Yield Companies entering hybrids decide which hybrids are planted at which locations. Combining and comparing absolute yield and other results from multiple sites is inappropriate when not all hybrids are planted at all locations. For example, one hybrid might have an unfair advantage in such a comparison because it was tested only at sites with ideal growing conditions. Another hybrid tested at sites with less-than-ideal growing conditions would have yields that tended to be lower. In this example, it would be difficult to determine whether
yield differences were because of differences in genetic yield potential or simply because of differences in the environmental conditions under which they were tested. The solution is to compare hybrids based on relative yields rather than absolute yields.
To calculate relative yield, the yield for each hybrid at each site is divided by the average yield for all hybrids tested at that same site and multiplied by 100. Once each hybrid at each site has been assigned a relative yield, comparisons can be made between hybrids tested at the same site or different sites. For hybrids tested at multiple sites, we can also calculate a multi-site relative yield average.
Relative yields of 100 indicate hybrids that were average performers. Relative yields greater than 100 indicate yields above-average. Relative yields less than 100 indicate yields below-average. The magnitude of the relative yield numbers indicate how far above or below average a hybrid performed. For example, a hybrid with a relative yield of 110 yielded 10% of above the average yield for all hybrids at that site. Choice of Hybrids When making hybrid selections it is important to realize that hybrids differ in their performance in different environments. Some hybrids are more adapted to a wide range of environments. Hybrid performance may vary with year and location variations in rainfall, temperature, pests and other environmental variables. In these experiments, many hybrids have essentially the same yield, and great care should be taken in interpreting the results of a single year's tests, especially at only one location. For these reasons it is important, whenever possible, to also look at a hybrid's average across locations when making hybrid selections. Multi-year averages give even greater confidence to hybrid performance decisions. The relative yield tables compare the yield of a hybrid to the average yield of all hybrids in the test. These tables are an excellent summary of yield potential compared to other hybrids.
1

2015 Virginia Corn Hybrid Plot Information (Rates are on a per acre basis.)
Blacksburg Whitethorne Farm Planted: May 5, 2015 no-till into killed cereal cover Harvested: October 7, 2015 Population: 25,270 plants/acre Pesticide: 2 qt Glystar Plus® + 1 pt Atrazine 4L + 3.5 qt
Lexar EZ + Induce NIS at 0.25% April 13, 2015; 5 lb Force® 3G at planting
Fertilizer: 40-40-40 pre-plant incorporated May 4, 2015; 17 gal 20-10-0-2.2S-.127B-.25Zn at planting; 80 lb N as 30-0-0 June 10, 2015
Plot Size: 2 rows 25' x 30" 4 replications Soil Type: Hayter loam Previous crop: Soybean Cooperator: Jon Wooge Blackstone Southern Piedmont Agricultural Research & Extension Center Planted: April 17, 2015 no-till into soybean stubble Harvested: September 8, 2015 Population: 27,200 plants/acre Pesticide: 2 qt Roundup ® + 4 qt Lexar® April 17, 2015; 5
lb Force® 3G at planting Fertilizer: 1000 lb 10-10-10 pre-plant incorporated April 16,
2015; 17 gal 20-10-0-2.2S-.127B-.25Zn at planting; 80 lb N using UAN May 19, 2015
Plot Size: 2 rows 25' x 30" 4 replications Soil Type: Appling sandy loam Previous crop: Soybean Cooperator: Ned Jones Holland Tidewater Agricultural Research & Extension Center Planted: April 16, 2015 no-till after peanuts Harvested: September 1, 2015 Population: 25,150 plants/acre Pesticide: 1 qt AAtrex® 4L + 2 qt Brawl® April 13, 2015; 5
lb Force® 3G at planting Fertilizer: 392 lb 15-7-15 March 19, 2015; 17 gal 20-10-0-
2.2S-.127B-.25Zn at planting; 100 units N using 24-0-0-3 May 28, 2015
Plot Size: 2 rows 35' x 30" 4 replications Soil Type: Eunola, Nansemond, sandy loams Previous crop:Peanuts Cooperator: Karl Jones Mt Holly (dryland) Virginia Crop Improvement Association Foundation Seed Farm Planted: April 23, 2015 no-till into soybean stubble Harvested: September 14, 2015 Population: 25,720 plants/acre Pesticide: 5.5 pt Lumax® + 1.5 pt Princep® + 1.5 pt atrazine pre-plant; 5 lb Force® 3G at
planting; 8 oz Rifle® May 26, 2015 Fertilizer: 60-30-60 pre-plant incorporated; 17 gal 20-10-0- 2.2S-.127B-.25Zn at planting; 90 lb 24-0-0-3 side-dressed May 28, 2015 Soil Type: State fine sandy loam Previous crop: Soybean Cooperator: Bruce Beahm and Phillip Browning
Mt Holly (irrigated) Virginia Crop Improvement Association Foundation Seed Farm Planted: April 22-23, 2015 no-till into soybean stubble Harvested: September 15-17, 2015 Population: 32,430 plants/acre Pesticide: 5.5 pt Lumax® + 1.5 pt Atrazine + 1.5 pt
Princep® pre-plant incorporated; 5 lb Force® 3G at planting; 8 oz Banvel® May 20, 2015
Fertilizer: 60-60-80 pre-plant incorporated; 17 gal 20-10-0-2.2S-.127B-.25Zn at planting; 70 lb 24-0-0-3 June 2, 2015 fertigated + 70 lb N June 17, 2015 fertigated
Irrigation: 3.4” over the growing season June 2 = 0.15” (with N application) June 13 = 1.0” June 17 = 0.15” (with N application) July 20 = 0.5” July 23 = 0.6” July 27 = 1.0” Plot Size: 2 rows 25' x 30" 4 replications Soil Type: State fine sandy loam Previous crop: Soybean Cooperator: Bruce Beahm and Phillip Browning Orange Northern Piedmont Center Planted: April 28, 2015 no-till into small grain residue Harvested: September 23, 2015 Population: 23,630 plants/acre Pesticide: 3.5 qt Lexar® EZ + 1 pt Atrazine + 2 qt
Gramaxone® April 24, 2015; 5 lb Force® 3G at planting
Fertilizer: 30-80-60 April 24, 2015; 100 lb N side-dressed June 1, 2015
Plot Size: 2 rows 30' x 30" 4 replications Soil Type: Dyke loam Previous crop: Small grain Cooperators: Steve Gulick Shenandoah Valley (Thanks to Mark Deavers) Planted: May 13, 2015 no-till into weed cover Harvested: October 15, 2015 Population: 24,740 plants/acre Pesticide: .75 qt Aatrex® + 3.2 qt Lumax® + 1.5 qt
Princep® + 2 qt Touchdown® + 5.8 oz Asana® May 15, 2015; 5 lb Force® 3G at planting
Fertilizer: Preplant 4 tons broiler litter April 15, 2015 Plot Size: 2 rows 25' x 30" 4 replications Soil Type: Monongahela fine sandy loam Previous crop: Corn Cooperators: Doug Horn and Mark Deavers
2

Table 1. List of Hybrids in the 2015 VA Corn Hybrid & Management Trials
Brand Hybrid DTM2 Trait Group1 OBS3 INSECTAgriGold A6441STX 109 24 4 Poncho 500®AgriGold A6462STXRIB 110 24 4 Poncho 500®AgriGold A6499STXRIB 112 24 4 Poncho 500®AgriGold A6517VT3PRIB 113 23 4 Poncho 500®AgriGold A6573VT3PRIB 114 23 4 Poncho 500®AgriGold A6579STX 114 24 4 Poncho 500®Augusta A4758 107 22 no RIB 4 Cruiser 250®Augusta A4658 108 3110GT 4 Cruiser 250®Augusta A6664 114 22 no RIB 4 Cruiser 250®Augusta A6465 115 22 no RIB 4 Cruiser 250®Augusta A5063 115 22 no RIB 4 Cruiser 250®Augusta A8868 118 23 no RIB 3 Cruiser 250®Augusta A7068 118 22 no RIB 5 Cruiser 250®Axis 64K24RIB 114 22 3 Poncho 250®Axis 64T22RIB 114 22 3 Poncho 250®Axis 64D25RIB 114 22 3 Poncho 250®Axis 65H25RIB 115 22 3 Poncho 250®Axis 66T27RIB 116 22 3 Poncho 250®Channel 206-55STXRIB 106 24 2 Poncho 500®Channel 207-27STXRIB 107 24 5 Poncho 500®Channel 209-53STXRIB 109 24 2 Poncho 500®Channel 209-46STXRIB 109 24 5 Poncho 500®Channel 211-35STXRIB 111 24 5 Poncho 500®Channel 213-28STXRIB 113 24 3 Poncho 500®Channel 214-45DGVT2PRIB 114 22 + DroughtGard 5 Poncho 500®Channel 215-05STXRIB 115 24 3 Poncho 500®Channel 217-41DGVT2PRIB 117 22 + DroughtGard 2 Poncho 500®DEKALB DKC60-67RIB 110 24 7 Poncho 500®DEKALB DKC61-88RIB 111 23 7 Poncho 500®DEKALB DKC62-08RIB 112 24 7 Poncho 500®DEKALB DKC63-33RIB 113 24 7 Poncho 500®
3

Table 1. List of Hybrids in the 2015 VA Corn Hybrid & Management Trials
Brand Hybrid DTM2 Trait Group1 OBS3 INSECTDEKALB DKC64-87RIB 114 24 7 Poncho 500®DEKALB DKC65-19RIB 115 23 7 Poncho 500®DEKALB DKC66-40RIB 116 24 7 Poncho 500®DEKALB DKC67-57RIB 117 23 7 Poncho 500®DEKALB DKC67-72RIB 117 22 7 Poncho 500®Doebler's RPM® 563HXR™ 105 10 6 Poncho 1250®Doebler's RPM® 4816AM™ 108 16 3 Poncho 1250®Doebler's RPM® 5015AM™ 110 16 7 Poncho 1250®Doebler's RPM® 5125AM™ 111 16 7 Poncho 1250®Doebler's RPM® 5315AMXT™ 113 20 3 Cruiser 250®Doebler's Doeblers® 5615GRQ™ 116 2 7 Cruiser 250®Doebler's Doeblers® 5815GRQ™ 118 2 7 Cruiser 250®Dyna-Gro D50VC43 110 22 no RIB 6 Poncho 500®Dyna-Gro D52VC91 112 22 no RIB 6 Poncho 500®Dyna-Gro D54DC94 114 22 no RIB + DroughtGard 6 Poncho 250®Dyna-Gro D57DC58 117 22 no RIB + DroughtGard 6 Poncho 500®NK N59B-3111A 107 3* 5 Avicta® Complete 500 + VibranceNK N70J-3111A 112 3* 5 Avicta® Complete 500 + VibranceNK N74R-3000GT 114 2 5 Avicta® Complete 500 + VibranceNK N78C-3111 118 5 5 Avicta® Complete 500 + VibranceNK N83D-3000GT 118 2 5 Avicta® Complete 500 + VibrancePhoenix 5552A4 111 5 4 Cruiser 500® + AvictaPhoenix 6522A4 114 5 4 Cruiser 500® + AvictaPhoenix 7914A4 115 5 2 Cruiser 500® + AvictaPhoenix 6542A4 116 5 4 Cruiser 500® + AvictaPhoenix 7402A3 118 2 4 Cruiser 500® + AvictaPioneer P0339AM 103 16 7 Poncho 1250®Pioneer P0604AM 106 16 7 Poncho 1250®Pioneer P1197AM 111 16 7 Poncho 1250®Pioneer P1637VYHR 116 Optimum Leptra 6 Poncho 1250®Pioneer P2160YHR 121 13 7 Poncho 1250®
4

Table 1. List of Hybrids in the 2015 VA Corn Hybrid & Management Trials
Brand Hybrid DTM2 Trait Group1 OBS3 INSECTProgeny PGY4114VT2P 114 22 7 Poncho 1250®Progeny PGY4115VT2P 115 22 7 Poncho 1250®Progeny PGY5115VT2P 115 22 7 Poncho 1250®Progeny PGYEXP16VT2P 116 22 7 Poncho 1250®Progeny PGY4117VT3P 117 23 7 Poncho 1250®Seed Consultants SCS 1085AM™ 107 16 4 Poncho 500®Seed Consultants SCS 1094AM™ 108 16 4 Cruiser 250®Seed Consultants SC 10AQ96™ 108 5 4 Avicta® Complete 250 + VibranceSeed Consultants SC 11AQ15™ 111 2 5 Poncho 500®Seed Consultants SCS 1125AM™ 111 16 5 Poncho 500®Seed Consultants SCS 1131AM™ 112 16 5 Cruiser 250®Seed Consultants SC 11AGT43™ 113 GTCBLL 5 Poncho 1250®Seed Consultants SCS 11HR63™ 115 10 5 Poncho 1250®Seed Consultants SC 11AGT74™ 116 GTCBLL 5 Poncho 1250®Seed Consultants SC 11AQ72™ 117 2 5 Poncho 1250®T.A. Seeds TA625-30 110 4 2 Cruiser 250®T.A. Seeds TA636-22DPRIB 111 22 2 Cruiser 250®T.A. Seeds TA736-22DPRIB 113 22 2 Cruiser 250®T.A. Seeds TA746-28RIB 114 24 2 Cruiser 250®Terral Seed REV 18BHR84 108 13 4 Poncho 1250®Terral Seed REV 22BHR43 112 13 4 Poncho 1250®Terral Seed REV 23BHR55 113 13 4 Poncho 1250®Terral Seed REV 24BHR93 114 13 4 Poncho 1250®Terral Seed REV 25BHR26 115 13 4 Poncho 1250®Terral Seed REV 26BHR50 116 13 4 Poncho 1250®1 Trait Group according to Table 2.2 Days to maturity (DTM) provided by company; differences in maturity rating methods may exist.3Number of observations hybrid occurred (OBS); the greater the observations, the more reliable the data. Hybrids are sorted by Brand then DTM.
5

Chris DiFonzo, Michigan State University, East Lansing, MI &
Eileen Cullen, University of Wisconsin, Madison, WI
CDD #028 Updated April 2014
Handy Bt Trait Table Field Crops Entomology
Program MSU
Many corn hybrids contain multiple transgenic traits and seed costs are rising. Meanwhile, refuge requirements dramatically for multi-trait corn, generally dropping from 20% to 10% or 5%, depending on the trait package and company. Some traits still require a structured refuge planted as a block or series of rows, but many hybrids are now sold as refuge-in-the-bag (RIB). Purchasing the right trait package for your pest spectrum, and understanding its refuge requirement, is critical to maximizing profitability and delaying resistance. But this process may be confusing. The table on page 2 of this bulletin summarizes, to the best of our ability, currently available Bt traits, their spectrum of control, and refuge requirements. We make every attempt to provide up-to-date information for each Bt option. However, it is still important for you to take the following steps: *Understand the terminology used by your seed company; *Understand the biology of each trait, the expected level of control, and refuge requirements; *Confirm that the seed you ordered the previous year is the seed delivered to you in spring; *Keep good planting records; *For herbicide applications, Ask Twice-Spray Once, especially if you hire a custom applicator; *Save a representative sample of bag tags = the first thing to check if something goes wrong; *Most important, if you see unexpected damage or poor performance of a trait during the field season, contact your seed dealer immediately so that the field can be visited while the problem is still visible and fresh samples can be taken.
The most up-to-date version of this
bulletin is posted at: www.msuent.com
Insect targets
BCW black cutworm CEW corn earworm ECB European corn borer FAW fall armyworm RW corn rootworm SB stalk borer WBC western bean cutworm
Herbicide traits
GT glyphosate tolerant LL Liberty Link (glufosinate-tolerant) RR2 Roundup Ready 2 (glyphosate-tolerant)
Abbreviations
used in the
Bt Trait Table
NEW
Cheat Sheet
------
Event
names
for proteins
expressed
in Bt plants
Target or Activity Protein(s) expressed Event Trade name
corn borer Cry1Ab MON 810 YieldGard CB
corn borer + glufosinate tolerance Cry1Ab + PAT Bt11 Agrisure CB/LL
corn borer + glufosinate tolerance Cry1F + PAT TC1507 Herculex 1 or CB
broad lep control Vip3Aa MIR162 Agrisure Viptera
broad lep control Cry1A.105 + Cry2Ab2 MON89034 Yieldgard VT Pro
rootworm eCry3.1Ab 5307 Agrisure Duracade
rootworm mCry3A MIR604 Agrisure RW
rootworm Cry3Bb1 + CP4 EPSPS MON88017 YieldGard VT RW
rootworm + glufosinate tolerance Cry34Ab1/Cry35Ab1 + PAT DAS-59122-7 Herculex RW
glyphosate tolerance mEPSPS GA21 Roundup Ready
glyphosate tolerance CP4 EPSPS NK603 Roundup Ready 2
6

DiFonzo&Cullen’s
Handy Bt trait table
Updated April 2014
Bt protein(s)
Insects controlled (bold)
or suppressed (italics)
Above-ground------------In soil
Herbicide
tolerant?
Refuge %, location
in the MIDWEST Agrisure Trait Family
1-Agrisure CB/LL/RW Cry1Ab mCry3A ECB CEW FAW SB RW LL 20% in field/adjacent 2-Agrisure 3000GT Cry1Ab mCry3A ECB CEW FAW SB RW GT LL 20% in field/adjacent 3-Agrisure Artesian 3011A
Cry1Ab mCry3A ECB CEW FAW SB RW GT LL 20% in field/adjacent
4-Agrisure Viptera 3110
Cry1Ab Vip3A BCW CEW ECB
FAW WBC SB
--- GT LL 20% within ½ mile
5-Agrisure Viptera 3111
Cry1Ab mCry3A Vip3A
BCW CEW ECB
FAW WBC SB
RW GT LL
20% in field/adjacent
6-Agrisure 3122 E-Z Refuge
Cry1Ab Cry1F mCry3A Cry34/35Ab1
BCW ECB FAW
WBC CEW SB
RW
GT 5% in the bag
7-Agrisure Viptera 3220 E-Z Refuge
Cry1Ab Cry1F Vip3A
BCW CEW ECB
FAW WBC SB
--- GT 5% in the bag
8-Agrisure Duracade 5122
Cry1Ab Cry1F mCry3A eCry3.1Ab
BCW CEW ECB
FAW WBC SB
RW
GT LL
5% in the bag
9-Agrisure Duracade 5222
Cry1Ab Cry1F Vip3A mCry3A eCry3.1Ab
BCW CEW ECB
FAW WBC SB
RW
GT LL
5% in the bag
Herculex Trait Family
10-Herculex 1 (HX1) Cry1F BCW ECB FAW
WBC CEW SB
--- LL
RR2 (most)
20% within ½ mile
11-Herculex XTRA (HXX)
Cry1F Cry34/35Ab1
BCW ECB FAW
WBC CEW SB
RW 20% in field/adjacent
Optimum Trait Family
12-Optimum TRIsect
Cry1F mCry3A BCW ECB FAW
WBC CEW SB
RW
LL RR2
20% in field/adjacent
13-Optimum Intrasect
Cry1F Cry1Ab BCW ECB FAW
WBC CEW SB
--- LL RR2 5% within ½ mile
14-Optimum Intrasect XTra
Cry1F Cry1Ab Cry34/35Ab1
BCW ECB FAW
WBC CEW SB
RW LL RR2
20% in field/adjacent
15-Optimum Intrasect XTreme
Cry1F Cry1Ab mCry3A Cry34/35Ab1
BCW ECB FAW
WBC CEW SB
RW
LL RR2
5% in field/adjacent
16-Optimum (AM) AcreMax
Cry1F Cry1Ab BCW ECB FAW
WBC CEW SB
--- RR2 5% in the bag
17-Optimum (AMRW) AcreMax Rootworm
Cry34/35Ab1 --- RW RR2 10% in the bag
18-Optimum (AM1) AcreMax1
Cry1F Cry34/35Ab1
BCW ECB FAW
WBC CEW
RW LL RR2 10% in the bag (RW)
& 20% - ½ mile (CB)
19-Optimum (AMX) AcreMax Xtra
Cry1F Cry1Ab Cry34/35Ab1
BCW ECB FAW
WBC CEW SB
RW RR2 10% in the bag
20-Optimum (AMXT) AcreMax XTreme
Cry1F Cry1Ab mCry3A Cry34/35Ab1
BCW ECB FAW
WBC CEW SB
RW RR2 5% in the bag
YieldGard / Genuity Trait Family
21-YieldGard VT Triple Cry1Ab Cry3Bb1 ECB
CEW FAW SB
RW RR2 20% in field/adjacent
22-Genuity VT Double PRO RIB Complete
Cry1A.105+Cry2Ab2 CEW ECB FAW
--- RR2 5% in the bag
23-Genuity VT Triple PRO RIB Complete
Cry1A.105+Cry2Ab2 Cry3Bb1
CEW ECB FAW RW RR2 10% in the bag
24-Genuity SmartStax RIB Complete
Cry1A.105+Cry2Ab2 Cry1F Cry3Bb1
Cry34/35Ab1
BCW CEW ECB
FAW SB WBC
RW LL RR2 5% in the bag
Refuge Advanced Trait Family
25-REFUGE ADVANCED Powered by SmartStax
Cry1A.105+Cry2Ab2 Cry1F Cry3Bb1
Cry34/35Ab1
BCW CEW ECB
FAW SB WBC
RW LL RR2 5% in the bag 7

Table 3. 2015 RELATIVE YIELD* of corn hybrids entered in three or more locations - Virginia Tech Trials.DTM per Black- Mt Holly Mt Holly Black- Shenan-
Brand/Company Hybrid Co.1 Holland stone Dryland Irrigated burg Orange doah Mean
Channel 207-27STXRIB 107 --- 98 98 98 --- 94 92 96Seed Consultants SCS 1085AM™ 107 --- --- 92 92 95 --- 101 95Augusta A4758 107 84 --- 91 104 --- 101 --- 95NK N59B-3111A 107 76 --- 92 101 --- 102 96 93Pioneer P0604AM 106 80 95 88 100 95 94 100 93Pioneer P0339AM 103 89 105 92 89 85 96 89 92Doebler's RPM® 563HXR™ 105 --- 98 91 91 89 92 85 91
Seed Consultants SCS 1125AM™ 111 --- --- 109 107 117 110 105 110DEKALB DKC61-88RIB 111 103 106 107 104 103 106 99 104Augusta A4658 108 106 --- 98 101 --- 104 --- 102Doebler's RPM® 5125AM™ 111 104 99 102 99 100 99 111 102Doebler's RPM® 5015AM™ 110 100 102 103 103 97 109 98 102AgriGold A6462STXRIB 110 --- --- 103 103 89 --- 107 100Seed Consultants SCS 1094AM™ 108 --- --- 95 99 107 --- 99 100Pioneer P1197AM 111 94 94 102 92 110 104 102 100Channel 209-46STXRIB 109 --- 100 94 105 --- 100 96 99Channel 211-35STXRIB 111 --- 99 96 102 --- 99 99 99Doebler's RPM® 4816AM™ 108 101 --- 95 101 --- --- --- 99Terral Seed REV 18BHR84 108 90 --- 98 102 --- 105 --- 99AgriGold A6441STX 109 --- --- 97 110 99 --- 88 98Seed Consultants SC 11AQ15™ 111 --- --- 95 103 95 97 97 97Seed Consultants SC 10AQ96™ 108 --- --- 97 93 96 --- 100 97Dyna-Gro D50VC43 110 78 96 93 100 89 103 --- 93Phoenix 5552A4 111 93 95 90 94 --- --- --- 93DEKALB DKC60-67RIB 110 81 97 100 93 86 96 97 93
Augusta A6465 115 122 --- 116 106 --- --- 112 114Doebler's RPM® 5315AMXT™ 113 127 --- 100 100 --- --- --- 109Axis 65H25RIB 115 122 --- 100 103 --- --- --- 108
<108 Days Relative Maturity
108-111 Days Relative Maturity
112-115 Days Relative Maturity
8

Table 3. 2015 RELATIVE YIELD* of corn hybrids entered in three or more locations - Virginia Tech Trials.DTM per Black- Mt Holly Mt Holly Black- Shenan-
Brand/Company Hybrid Co.1 Holland stone Dryland Irrigated burg Orange doah Mean
Dyna-Gro D54DC94 114 111 101 109 100 116 112 --- 108DEKALB DKC65-19RIB 115 133 102 110 98 109 92 106 107Seed Consultants SCS 1131AM™ 112 --- --- 100 100 111 105 118 107Dyna-Gro D52VC91 112 110 102 99 111 110 103 --- 106Augusta A5063 115 111 --- 104 105 --- --- 101 106Channel 215-05STXRIB 115 --- 103 --- --- --- 106 106 105Axis 64K24RIB 114 118 --- 94 105 --- --- --- 105Terral Seed REV 24BHR93 114 91 --- 113 109 --- 106 --- 105NK N74R-3000GT 114 125 --- 100 101 --- 96 99 104Progeny PGY5115VT2P 115 119 92 103 104 105 106 97 104Progeny PGY4114VT2P 114 103 104 101 99 107 104 107 104DEKALB DKC63-33RIB 113 123 99 100 95 107 98 103 103AgriGold A6573VT3PRIB 114 --- --- 104 98 106 --- 105 103AgriGold A6499STXRIB 112 --- --- 102 104 102 --- 104 103Terral Seed REV 23BHR55 113 107 --- 100 103 --- 102 --- 103Augusta A6664 114 90 --- 111 106 --- --- 104 103AgriGold A6517VT3PRIB 113 --- --- 104 102 101 --- 105 103Axis 64D25RIB 114 96 --- 100 111 --- --- --- 102Seed Consultants SCS 11HR63™ 115 --- --- 106 108 114 92 88 102Axis 64T22RIB 114 110 --- 104 91 --- --- --- 102Progeny PGY4115VT2P 115 116 107 100 95 103 93 97 102Phoenix 6522A4 114 103 96 98 105 --- --- --- 100Terral Seed REV 25BHR26 115 92 --- 109 97 --- 103 --- 100Channel 213-28STXRIB 113 --- --- 96 98 --- --- 106 100DEKALB DKC64-87RIB 114 88 99 102 107 94 106 105 100AgriGold A6579STX 114 --- --- 93 102 99 --- 97 98DEKALB DKC62-08RIB 112 102 105 92 90 94 98 95 97NK N70J-3111A 112 90 --- 97 98 --- 94 96 95Seed Consultants SC 11AGT43™ 113 --- --- 91 95 86 97 106 95Channel 214-45DGVT2PRIB 114 --- 101 92 86 --- 98 97 95Terral Seed REV 22BHR43 112 80 --- 95 97 --- 95 --- 92
9

Table 3. 2015 RELATIVE YIELD* of corn hybrids entered in three or more locations - Virginia Tech Trials.DTM per Black- Mt Holly Mt Holly Black- Shenan-
Brand/Company Hybrid Co.1 Holland stone Dryland Irrigated burg Orange doah Mean
DEKALB DKC66-40RIB 116 125 112 106 103 115 104 104 110Terral Seed REV 26BHR50 116 130 --- 106 108 --- 93 --- 109Pioneer P2160YHR 121 125 96 114 102 101 115 107 109Pioneer P1637VYHR 116 126 108 102 98 112 101 --- 108NK N78C-3111 118 119 --- 106 92 --- 114 96 105Seed Consultants SC 11AQ72™ 117 --- --- 109 108 95 98 95 101Augusta A7068 118 108 --- 103 105 --- 88 98 101Seed Consultants SC 11AGT74™ 116 --- --- 103 96 100 99 99 99Augusta A8868 118 --- --- 101 102 --- 95 --- 99Dyna-Gro D57DC58 117 99 104 101 90 99 100 --- 99Doebler's Doeblers® 5815GRQ™ 118 101 98 101 101 96 100 94 99Doebler's Doeblers® 5615GRQ™ 116 111 98 99 91 93 95 100 98DEKALB DKC67-72RIB 117 84 102 103 96 100 102 99 98Phoenix 7402A3 118 79 101 106 106 --- --- --- 98DEKALB DKC67-57RIB 117 86 98 100 93 106 88 110 97NK N83D-3000GT 118 81 --- 103 100 --- 92 100 95Phoenix 6542A4 116 80 100 101 98 --- --- --- 95Axis 66T27RIB 116 83 --- 98 103 --- --- --- 95Progeny PGYEXP16VT2P 116 72 96 92 97 91 94 104 92Progeny PGY4117VT3P 117 87 90 90 94 91 97 92 92* Relative yield is calculated by dividing the yield of a hybrid by the average yield of all hybrids of all maturities at that location. A hybrid with a relative yield of 105 was 5% above the average of all hybrids at that location. The value of 105 is not a yield but a value relative to all other yield values at that location. Relative yields are listed in order of descending mean values.1 Days to maturity provided by company; differences in maturity rating methods may exist between companies.
>115 Days Relative Maturity
10

11

Table 4. Two-year Average RELATIVE YIELD* (2014-2015) of corn hybrids entered in three or more locations each year - Virginia Tech Trials.
DTM per RelativeBrand/Company Hybrid Co.1 Yield<108 Days Relative MaturityPioneer P0604AM 106 14 97
Doebler's RPM® 5015AM™ 110 14 104Seed Consultants SCS 1094AM™ 108 8 99Seed Consultants SC 11AQ15™ 111 9 99Channel 211-35STXRIB 111 10 98Phoenix 5552A4 111 8 97DEKALB DKC60-67RIB 110 14 94
Dyna-Gro D54DC94 114 13 114Seed Consultants SCS 1131AM™ 112 10 108Augusta A6664 114 9 106DEKALB DKC65-19RIB 115 14 106Axis 64T22RIB 114 7 103Seed Consultants SCS 11HR63™ 115 10 102DEKALB DKC62-08RIB 112 14 100Phoenix 6522A4 114 8 100Seed Consultants SC 11AGT43™ 113 10 99
DEKALB DKC66-40RIB 116 14 109Seed Consultants SC 11AQ72™ 117 10 104Phoenix 7402A3 118 8 102Seed Consultants SC 11AGT74™ 116 10 101Doebler's Doeblers® 5815GRQ™ 118 14 101Augusta A8868 118 6 101NK N83D-3000GT 118 9 100Phoenix 6542A4 116 8 99Axis 66T27RIB 116 7 98Doebler's Doeblers® 5615GRQ™ 116 14 97* Relative yield is calculated by dividing the yield of a hybrid by the average yield of all hybrids of all maturities at that location. A hybrid with a relative yield of 105 was 5% above the average of all hybrids at that location. The value of 105 is not a yield but a value relative to all other yield values at that location. Relative yields are listed in order of descending mean values. A hybrid does not have to be entered in the same three locations each year.1 Days to maturity provided by company; differences in maturity rating methods may exist between companies.2 A higher number of site/year combinations provides a better estimate of hybrid performance than a single site/year location.
Number of Obs.2
108-111 Days Relative Maturity
112-115 Days Relative Maturity
>115 Days Relative Maturity
12

Table 5. Three-year Average RELATIVE YIELD* (2013-2015) of corn hybrids entered in three or more locations each year - Virginia Tech Trials.
DTM per RelativeBrand/Company Hybrid Co.1 Yield
Phoenix 5552A4 111 12 98Seed Consultants SCS 1094AM™ 108 12 98
Seed Consultants SCS 1131AM™ 112 15 108Seed Consultants SCS 11HR63™ 115 15 106DEKALB DKC65-19RIB 115 21 104Phoenix 6522A4 114 13 102DEKALB DKC62-08RIB 112 21 100
Seed Consultants SC 11AQ72™ 117 15 104Phoenix 6542A4 116 12 100* Relative yield is calculated by dividing the yield of a hybrid by the average yield of all hybrids of all maturities at that location. A hybrid with a relative yield of 105 was 5% above the average of all hybrids at that location. The value of 105 is not a yield but a value relative to all other yield values at that location. Relative yields are listed in order of descending mean values. A hybrid does not have to be entered in the same three locations each year.1 Days to maturity provided by company; differences in maturity rating methods may exist between companies.2 A higher number of site/year combinations provides a better estimate of hybrid performance than a single site/year location.
Number of Obs.2
108-111 Days Relative Maturity
112-115 Days Relative Maturity
>115 Days Relative Maturity
13

Table 6. Corn Yields at the Tidewater AREC at HOLLAND, VIRGINIA in 2015 - Virginia Tech Trials.
DTM per Yield2 Moist Test Wt.Brand/Company Hybrid Co.1 bu/A % lb/bu<108 Days Relative MaturityPioneer P0339AM 103 86 16.5 52.6Augusta A4758 107 81 16.9 52.0Pioneer P0604AM 106 78 16.7 52.8NK N59B-3111A 107 74 23.0 50.7
Maturity Average 80 18.3 52.0L.S.D. (0.05) 33 2.6 2.0C.V. 24 8.2 2.3
108-111 Days Relative MaturityAugusta A4658 108 103 19.1 49.8Doebler's RPM® 5125AM™ 111 101 20.1 53.3DEKALB DKC61-88RIB 111 100 19.0 52.1Doebler's RPM® 4816AM™ 108 98 17.6 53.4Doebler's RPM® 5015AM™ 110 97 20.3 51.5Pioneer P1197AM 111 91 21.9 52.6Phoenix 5552A4 111 90 18.1 49.9Terral Seed REV 18BHR84 108 87 18.4 52.1DEKALB DKC60-67RIB 110 78 19.0 52.3Dyna-Gro D50VC43 110 76 17.0 53.0
Maturity Average 92 19.0 52.0L.S.D. (0.05) 31 3.9 1.5C.V. 21 14.0 1.9
112-115 Days Relative MaturityDEKALB DKC65-19RIB 115 129 21.2 52.5Doebler's RPM® 5315AMXT™ 113 123 25.6 50.4NK N74R-3000GT 114 121 23.7 47.3DEKALB DKC63-33RIB 113 119 19.9 52.5Augusta A6465 115 119 26.5 50.2Axis 65H25RIB 115 118 22.1 51.3Progeny PGY5115VT2P 115 116 23.1 49.8Axis 64K24RIB 114 114 23.2 48.8Progeny PGY4115VT2P 115 112 22.1 53.5Augusta A5063 115 108 25.6 50.8Dyna-Gro D54DC94 114 107 27.2 49.2Axis 64T22RIB 114 106 21.3 51.0Dyna-Gro D52VC91 112 106 20.6 52.4Terral Seed REV 23BHR55 113 103 24.8 49.9Progeny PGY4114VT2P 114 100 21.6 52.0Phoenix 6522A4 114 100 25.6 48.6DEKALB DKC62-08RIB 112 99 16.0 51.7Axis 64D25RIB 114 93 22.3 51.4Terral Seed REV 25BHR26 115 89 24.5 53.2
14

Table 6. Corn Yields at the Tidewater AREC at HOLLAND, VIRGINIA in 2015 - Virginia Tech Trials.
DTM per Yield2 Moist Test Wt.Brand/Company Hybrid Co.1 bu/A % lb/buTerral Seed REV 24BHR93 114 89 25.6 52.4Augusta A6664 114 87 19.1 51.6NK N70J-3111A 112 87 21.5 51.0Phoenix 7914A4 115 86 19.7 50.9DEKALB DKC64-87RIB 114 85 20.3 51.9Terral Seed REV 22BHR43 112 78 23.8 51.8
Maturity Average 104 22.7 51.0L.S.D. (0.05) 34 5.2 2.2C.V. 21 16.0 2.7
>115 Days Relative MaturityTerral Seed REV 26BHR50 116 126 26.6 52.0Pioneer P1637VYHR 116 122 28.4 51.4DEKALB DKC66-40RIB 116 122 26.6 49.5Pioneer P2160YHR 121 122 27.8 52.2NK N78C-3111 118 115 26.0 48.7Doebler's Doeblers® 5615GRQ™ 116 107 30.6 49.0Augusta A7068 118 105 23.4 52.8Doebler's Doeblers® 5815GRQ™ 118 98 26.8 49.1Dyna-Gro D57DC58 117 96 25.4 50.7Progeny PGY4117VT3P 117 84 22.6 50.7DEKALB DKC67-57RIB 117 84 21.2 52.0DEKALB DKC67-72RIB 117 82 22.1 50.8Axis 66T27RIB 116 80 22.9 50.7NK N83D-3000GT 118 78 25.4 48.6Phoenix 6542A4 116 77 26.9 47.0Phoenix 7402A3 118 77 24.0 48.5Progeny PGYEXP16VT2P 116 69 24.3 50.4
Maturity Average 97 25.3 50.2L.S.D. (0.05) 32 5.2 2.3C.V. 21 14.3 3.0Location Average 97 22.5 51.0
1 Days to maturity provided by company; differences in maturity rating methods may exist between companies.2 Reported at 15.5% moisture.Planted April 16, 2015. Harvested September 1, 2015. Population was 25,150 plants/acre.
15

Table 7. Two-year Average Corn Yields at the Tidewater AREC at HOLLAND, VIRGINIA in 2014 and 2015 - Virginia Tech Trials.
DTM per Yield2 Moist Test Wt.Brand/Company Hybrid Co.1 bu/A % lb/bu<108 Days Relative MaturityPioneer P0604AM 106 116 17.8 53.6108-111 Days Relative MaturityDoebler's RPM® 5015AM™ 110 129 20.3 51.6Phoenix 5552A4 111 124 19.1 50.7DEKALB DKC60-67RIB 110 111 19.4 53.4
Maturity Average 121 19.6 51.9L.S.D. (0.05) 17 2.5 1.3C.V. 12 11.3 2.2
112-115 Days Relative MaturityDoebler's RPM® 5315AMXT™ 113 155 23.7 51.3DEKALB DKC65-19RIB 115 153 21.2 53.5Dyna-Gro D54DC94 114 148 24.6 50.7Axis 64K24RIB 114 135 22.4 51.1Augusta A6664 114 131 20.8 52.4DEKALB DKC62-08RIB 112 130 18.2 52.4Axis 64T22RIB 114 129 22.1 51.6Phoenix 6522A4 114 117 24.0 49.9Phoenix 7914A4 115 109 22.2 51.1
Maturity Average 134 22.1 51.5L.S.D. (0.05) 25 3.0 1.6C.V. 17 13.0 2.8
>115 Days Relative MaturityDEKALB DKC66-40RIB 116 146 24.6 50.9Doebler's Doeblers® 5815GRQ™ 118 128 25.8 50.4Axis 66T27RIB 116 127 22.5 51.6Doebler's Doeblers® 5615GRQ™ 116 125 26.4 50.0Phoenix 6542A4 116 118 25.0 48.0NK N83D-3000GT 118 114 24.8 50.3Phoenix 7402A3 118 109 24.6 49.7
Maturity Average 124 24.8 50.1L.S.D. (0.05) 24 3.3 1.4C.V. 18 12.6 2.5Location Average 128 22.5 51.2
1 Days to maturity provided by company; differences in maturity rating methods may exist between companies.2 Reported at 15.5% moisture.
16

Table 8. Three-year Average Corn Yields at the Tidewater AREC at HOLLAND, VIRGINIA, 2013-2015 - Virginia Tech Trials.
DTM per Yield2 Moist Test Wt.Brand/Company Hybrid Co.1 bu/A % lb/bu108-111 Days Relative MaturityPhoenix 5552A4 111 147 19.9 51.0112-115 Days Relative MaturityDEKALB DKC65-19RIB 115 163 22.0 53.6Phoenix 6522A4 114 150 23.6 50.2DEKALB DKC62-08RIB 112 146 19.5 52.6
Maturity Average 153 21.7 52.1L.S.D. (0.05) 28 1.8 1.5C.V. 20 9.1 3.0
>115 Days Relative MaturityPhoenix 6542A4 116 138 24.8 48.6
Location Average 149 22.0 51.21 Days to maturity provided by company; differences in maturity rating methods may exist between companies.2 Reported at 15.5% moisture.
17

Table 9. Corn Yields under DRYLAND conditions at the Virginia Crop Improvement Foundation Seed Farm at MT HOLLY, VIRGINIA in 2015 - Virginia Tech Trials.
DTM per Yield2 Moist Test Wt.Brand/Company Hybrid Co.1 bu/A % lb/bu<108 Days Relative MaturityChannel 207-27STXRIB 107 188 15.7 56.0NK N59B-3111A 107 176 16.6 54.8Pioneer P0339AM 103 176 15.0 56.9Seed Consultants SCS 1085AM™ 107 175 15.4 56.2Doebler's RPM® 563HXR™ 105 175 15.1 56.7Augusta A4758 107 173 13.9 56.5Pioneer P0604AM 106 168 14.8 58.2
Maturity Average 176 15.2 56.5L.S.D. (0.05) 18 0.7 1.0C.V. 7 3.3 1.1
108-111 Days Relative MaturitySeed Consultants SCS 1125AM™ 111 209 16.7 55.2DEKALB DKC61-88RIB 111 205 15.7 56.4Doebler's RPM® 5015AM™ 110 197 15.7 56.7AgriGold A6462STXRIB 110 196 16.1 56.1Pioneer P1197AM 111 195 15.7 56.7Doebler's RPM® 5125AM™ 111 194 15.6 56.3Channel 209-53STXRIB 109 193 16.7 56.0DEKALB DKC60-67RIB 110 190 15.2 56.7Terral Seed REV 18BHR84 108 187 15.9 56.8Augusta A4658 108 187 15.6 55.2Seed Consultants SC 10AQ96™ 108 186 15.5 55.9AgriGold A6441STX 109 184 15.4 55.3Channel 211-35STXRIB 111 184 17.4 57.5Seed Consultants SCS 1094AM™ 108 182 15.6 56.6Doebler's RPM® 4816AM™ 108 181 15.2 56.9Seed Consultants SC 11AQ15™ 111 181 18.5 55.2Channel 209-46STXRIB 109 180 16.1 57.0Dyna-Gro D50VC43 110 178 14.9 56.1Phoenix 5552A4 111 173 16.3 56.4
Maturity Average 189 16.0 56.2L.S.D. (0.05) 19 0.9 1.6C.V. 7 3.8 2.0
112-115 Days Relative MaturityAugusta A6465 115 221 18.9 54.0Terral Seed REV 24BHR93 114 216 18.5 55.4Augusta A6664 114 212 17.6 56.8DEKALB DKC65-19RIB 115 210 17.9 58.4Terral Seed REV 25BHR26 115 209 17.1 57.7Dyna-Gro D54DC94 114 208 18.1 54.7Seed Consultants SCS 11HR63™ 115 203 17.4 56.7
18

Table 9. Corn Yields under DRYLAND conditions at the Virginia Crop Improvement Foundation Seed Farm at MT HOLLY, VIRGINIA in 2015 - Virginia Tech Trials.
DTM per Yield2 Moist Test Wt.Brand/Company Hybrid Co.1 bu/A % lb/buAugusta A5063 115 200 18.5 56.3AgriGold A6573VT3PRIB 114 199 17.9 54.8Axis 64T22RIB 114 199 18.8 56.5AgriGold A6517VT3PRIB 113 198 17.7 54.1Progeny PGY5115VT2P 115 197 17.7 57.4AgriGold A6499STXRIB 112 195 17.9 59.0DEKALB DKC64-87RIB 114 195 16.3 56.4Progeny PGY4114VT2P 114 193 16.3 57.2Seed Consultants SCS 1131AM™ 112 192 17.5 56.4Progeny PGY4115VT2P 115 192 17.7 58.3Axis 64D25RIB 114 192 18.4 54.5Terral Seed REV 23BHR55 113 191 17.0 55.8NK N74R-3000GT 114 191 16.8 54.6Doebler's RPM® 5315AMXT™ 113 191 16.8 55.4DEKALB DKC63-33RIB 113 191 15.6 57.5Axis 65H25RIB 115 191 18.3 57.4Dyna-Gro D52VC91 112 190 17.3 58.2Phoenix 6522A4 114 187 17.9 54.5NK N70J-3111A 112 186 16.2 55.7Channel 213-28STXRIB 113 183 16.5 56.2Terral Seed REV 22BHR43 112 182 16.2 58.9Axis 64K24RIB 114 179 16.7 56.8AgriGold A6579STX 114 178 17.5 56.9DEKALB DKC62-08RIB 112 176 15.7 57.0Channel 214-45DGVT2PRIB 114 175 16.3 56.6Seed Consultants SC 11AGT43™ 113 173 19.2 54.0
Maturity Average 194 17.4 56.4L.S.D. (0.05) 19 0.8 1.2C.V. 7 3.3 1.4
>115 Days Relative MaturityPioneer P2160YHR 121 218 19.3 58.0Seed Consultants SC 11AQ72™ 117 209 19.5 55.2Terral Seed REV 26BHR50 116 203 19.5 56.9Phoenix 7402A3 118 203 19.9 54.6DEKALB DKC66-40RIB 116 202 17.9 55.7NK N78C-3111 118 202 18.8 52.6DEKALB DKC67-72RIB 117 197 17.8 56.0Augusta A7068 118 197 19.5 57.0Seed Consultants SC 11AGT74™ 116 197 19.9 56.5NK N83D-3000GT 118 196 20.4 55.4Pioneer P1637VYHR 116 194 16.7 57.2Doebler's Doeblers® 5815GRQ™ 118 193 20.7 54.8
19

Table 9. Corn Yields under DRYLAND conditions at the Virginia Crop Improvement Foundation Seed Farm at MT HOLLY, VIRGINIA in 2015 - Virginia Tech Trials.
DTM per Yield2 Moist Test Wt.Brand/Company Hybrid Co.1 bu/A % lb/buPhoenix 6542A4 116 193 18.4 53.6Dyna-Gro D57DC58 117 193 18.7 55.6Augusta A8868 118 192 19.3 54.5DEKALB DKC67-57RIB 117 192 18.1 57.7Doebler's Doeblers® 5615GRQ™ 116 188 18.6 54.2Axis 66T27RIB 116 186 19.2 54.6Progeny PGYEXP16VT2P 116 176 19.1 55.4Progeny PGY4117VT3P 117 173 18.3 55.3
Maturity Average 195 19.0 55.5L.S.D. (0.05) 17 0.9 1.0C.V. 6 3.5 1.2Location Average 191 17.3 56.1
1 Days to maturity provided by company; differences in maturity rating methods may exist between companies.2 Reported at 15.5% moisture.Planted April 23, 2015. Harvested September 14, 2015. Population was 25,720 plants/acre.
20

21

Table 10. Two-year Average Corn Yields under DRYLAND conditions at the Virginia Crop Improvement Foundation Seed Farm at MT HOLLY, VIRGINIA in 2014 and 2015 - VirginiaTech Trials.
DTM per Yield2 Moist Test Wt.Brand/Company Hybrid Co.1 bu/A % lb/bu<108 Days Relative MaturityPioneer P0604AM 106 134 16.7 56.9108-111 Days Relative MaturityDoebler's RPM® 5015AM™ 110 162 16.7 55.6Channel 211-35STXRIB 111 147 18.8 56.8DEKALB DKC60-67RIB 110 145 16.7 56.7Channel 209-53STXRIB 109 144 18.2 55.1Channel 209-46STXRIB 109 144 17.5 56.1Seed Consultants SC 11AQ15™ 111 141 20.8 54.4Phoenix 5552A4 111 141 18.1 55.1Seed Consultants SCS 1094AM™ 108 140 16.8 55.7
Maturity Average 146 18.0 55.7L.S.D. (0.05) 17 0.8 1.5C.V. 10 4.3 2.4
112-115 Days Relative MaturityDyna-Gro D54DC94 114 167 20.2 53.5Augusta A6664 114 165 20.0 54.7DEKALB DKC65-19RIB 115 154 19.6 56.9Phoenix 6522A4 114 147 19.7 53.4Axis 64T22RIB 114 142 21.0 54.0Seed Consultants SCS 1131AM™ 112 138 21.1 55.2Seed Consultants SCS 11HR63™ 115 138 18.9 55.4Seed Consultants SC 11AGT43™ 113 137 20.2 53.7DEKALB DKC62-08RIB 112 132 17.8 55.6Doebler's RPM® 5315AMXT™ 113 116 17.1 52.3
Maturity Average 144 19.6 54.5L.S.D. (0.05) 15 0.9 1.6C.V. 10 4.5 2.8
>115 Days Relative MaturityPhoenix 7402A3 118 162 21.8 54.2DEKALB DKC66-40RIB 116 155 20.3 54.5Seed Consultants SC 11AGT74™ 116 149 22.0 54.7Phoenix 6542A4 116 146 21.3 52.6Seed Consultants SC 11AQ72™ 117 146 21.7 54.5Doebler's Doeblers® 5615GRQ™ 116 145 21.1 53.6NK N83D-3000GT 118 144 22.6 53.8Doebler's Doeblers® 5815GRQ™ 118 144 23.1 53.7Axis 66T27RIB 116 130 21.0 54.2
Maturity Average 147 21.6 54.0L.S.D. (0.05) 15 0.8 0.9C.V. 10 3.4 1.5
22

Table 10. Two-year Average Corn Yields under DRYLAND conditions at the Virginia Crop Improvement Foundation Seed Farm at MT HOLLY, VIRGINIA in 2014 and 2015 - VirginiaTech Trials.
DTM per Yield2 Moist Test Wt.Brand/Company Hybrid Co.1 bu/A % lb/bu
Location Average 145 19.7 54.71 Days to maturity provided by company; differences in maturity rating methods may exist between companies.2 Reported at 15.5% moisture.
23

Table 11. Three-year Average Corn Yields under DRYLAND conditions at the Virginia Crop Improvement Foundation Seed Farm at MT HOLLY, VIRGINIA, 2013-2015 - VirginiaTech Trials.
DTM per Yield2 Moist Test Wt.Brand/Company Hybrid Co.1 bu/A % lb/bu108-111 Days Relative MaturitySeed Consultants SCS 1094AM™ 108 154 16.8 55.2Phoenix 5552A4 111 149 17.5 54.4Channel 209-53STXRIB 109 148 17.6 55.5
Maturity Average 150 17.3 55.0L.S.D. (0.05) 22 0.8 1.5C.V. 15 5.1 3.0
112-115 Days Relative MaturityDEKALB DKC65-19RIB 115 156 18.5 57.1Phoenix 6522A4 114 153 19.5 53.2Seed Consultants SCS 11HR63™ 115 148 18.3 55.2Seed Consultants SCS 1131AM™ 112 144 20.0 55.5DEKALB DKC62-08RIB 112 141 17.5 55.2
Maturity Average 148 18.8 55.2L.S.D. (0.05) 14 0.8 1.0C.V. 11 4.7 2.0
>115 Days Relative MaturitySeed Consultants SC 11AQ72™ 117 153 20.8 54.9Phoenix 6542A4 116 151 20.4 52.8
Maturity Average 152 20.6 53.8L.S.D. (0.05) 16 0.8 0.9C.V. 11 4.1 1.7Location Average 150 18.7 54.9
1 Days to maturity provided by company; differences in maturity rating methods may exist between companies.2 Reported at 15.5% moisture.
24

25

Table 12. Corn Yields under IRRIGATED conditions at the Virginia Crop Improvement Foundation Seed Farm at MT HOLLY, VIRGINIA in 2015 - Virginia Tech Trials.
DTM per Yield2 Moist Test Wt.Brand/Company Hybrid Co.1 bu/A % lb/bu<108 Days Relative MaturityAugusta A4758 107 239 14.6 56.0NK N59B-3111A 107 231 17.0 55.6Pioneer P0604AM 106 228 15.4 57.9Channel 207-27STXRIB 107 225 16.1 54.8Seed Consultants SCS 1085AM™ 107 211 15.7 56.9Doebler's RPM® 563HXR™ 105 209 15.1 56.7Pioneer P0339AM 103 204 16.7 56.5
Maturity Average 221 15.8 56.3L.S.D. (0.05) 23 0.8 1.9C.V. 6 3.3 2.2
108-111 Days Relative MaturityAgriGold A6441STX 109 252 15.7 55.6Seed Consultants SCS 1125AM™ 111 245 17.1 55.5Channel 209-46STXRIB 109 241 16.8 56.6DEKALB DKC61-88RIB 111 238 16.2 56.9Seed Consultants SC 11AQ15™ 111 236 19.0 55.4AgriGold A6462STXRIB 110 235 16.4 56.5Doebler's RPM® 5015AM™ 110 235 16.6 55.5Terral Seed REV 18BHR84 108 233 16.8 56.2Channel 211-35STXRIB 111 232 17.7 56.4Augusta A4658 108 232 16.3 55.5Doebler's RPM® 4816AM™ 108 231 16.4 56.1Dyna-Gro D50VC43 110 230 15.9 55.6Seed Consultants SCS 1094AM™ 108 227 16.6 56.7Doebler's RPM® 5125AM™ 111 226 16.1 56.7Channel 209-53STXRIB 109 220 17.7 55.5Phoenix 5552A4 111 216 17.1 54.8Seed Consultants SC 10AQ96™ 108 214 15.4 56.4DEKALB DKC60-67RIB 110 212 15.9 58.1Pioneer P1197AM 111 210 16.7 55.7
Maturity Average 230 16.6 56.1L.S.D. (0.05) 22 1.0 1.7C.V. 7 4.3 2.1
112-115 Days Relative MaturityAxis 64D25RIB 114 254 18.2 54.7Dyna-Gro D52VC91 112 253 17.3 58.0Terral Seed REV 24BHR93 114 250 19.1 55.7Seed Consultants SCS 11HR63™ 115 248 18.3 56.3DEKALB DKC64-87RIB 114 244 17.5 57.3Augusta A6664 114 243 17.4 56.5Augusta A6465 115 242 19.0 53.4
26
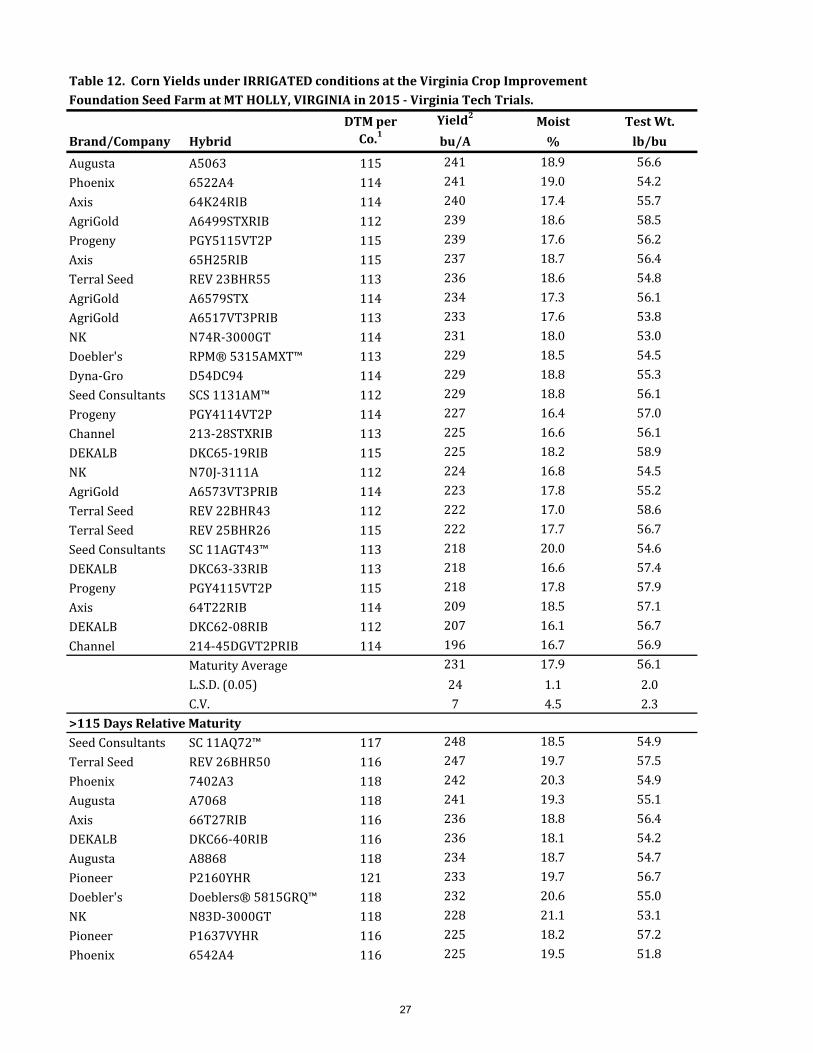
Table 12. Corn Yields under IRRIGATED conditions at the Virginia Crop Improvement Foundation Seed Farm at MT HOLLY, VIRGINIA in 2015 - Virginia Tech Trials.
DTM per Yield2 Moist Test Wt.Brand/Company Hybrid Co.1 bu/A % lb/buAugusta A5063 115 241 18.9 56.6Phoenix 6522A4 114 241 19.0 54.2Axis 64K24RIB 114 240 17.4 55.7AgriGold A6499STXRIB 112 239 18.6 58.5Progeny PGY5115VT2P 115 239 17.6 56.2Axis 65H25RIB 115 237 18.7 56.4Terral Seed REV 23BHR55 113 236 18.6 54.8AgriGold A6579STX 114 234 17.3 56.1AgriGold A6517VT3PRIB 113 233 17.6 53.8NK N74R-3000GT 114 231 18.0 53.0Doebler's RPM® 5315AMXT™ 113 229 18.5 54.5Dyna-Gro D54DC94 114 229 18.8 55.3Seed Consultants SCS 1131AM™ 112 229 18.8 56.1Progeny PGY4114VT2P 114 227 16.4 57.0Channel 213-28STXRIB 113 225 16.6 56.1DEKALB DKC65-19RIB 115 225 18.2 58.9NK N70J-3111A 112 224 16.8 54.5AgriGold A6573VT3PRIB 114 223 17.8 55.2Terral Seed REV 22BHR43 112 222 17.0 58.6Terral Seed REV 25BHR26 115 222 17.7 56.7Seed Consultants SC 11AGT43™ 113 218 20.0 54.6DEKALB DKC63-33RIB 113 218 16.6 57.4Progeny PGY4115VT2P 115 218 17.8 57.9Axis 64T22RIB 114 209 18.5 57.1DEKALB DKC62-08RIB 112 207 16.1 56.7Channel 214-45DGVT2PRIB 114 196 16.7 56.9
Maturity Average 231 17.9 56.1L.S.D. (0.05) 24 1.1 2.0C.V. 7 4.5 2.3
>115 Days Relative MaturitySeed Consultants SC 11AQ72™ 117 248 18.5 54.9Terral Seed REV 26BHR50 116 247 19.7 57.5Phoenix 7402A3 118 242 20.3 54.9Augusta A7068 118 241 19.3 55.1Axis 66T27RIB 116 236 18.8 56.4DEKALB DKC66-40RIB 116 236 18.1 54.2Augusta A8868 118 234 18.7 54.7Pioneer P2160YHR 121 233 19.7 56.7Doebler's Doeblers® 5815GRQ™ 118 232 20.6 55.0NK N83D-3000GT 118 228 21.1 53.1Pioneer P1637VYHR 116 225 18.2 57.2Phoenix 6542A4 116 225 19.5 51.8
27

Table 12. Corn Yields under IRRIGATED conditions at the Virginia Crop Improvement Foundation Seed Farm at MT HOLLY, VIRGINIA in 2015 - Virginia Tech Trials.
DTM per Yield2 Moist Test Wt.Brand/Company Hybrid Co.1 bu/A % lb/buProgeny PGYEXP16VT2P 116 221 18.5 55.9DEKALB DKC67-72RIB 117 220 18.4 55.2Seed Consultants SC 11AGT74™ 116 220 20.7 54.8Progeny PGY4117VT3P 117 214 17.9 56.0DEKALB DKC67-57RIB 117 212 19.0 56.9NK N78C-3111 118 211 19.7 52.1Doebler's Doeblers® 5615GRQ™ 116 208 18.3 54.6Dyna-Gro D57DC58 117 206 19.1 54.8
Maturity Average 227 19.2 55.1L.S.D. (0.05) 20 1.1 2.1C.V. 6 3.9 2.5Location Average 229 17.7 55.9
1 Days to maturity provided by company; differences in maturity rating methods may exist between companies.2 Reported at 15.5% moisture.Planted April 22-23, 2015. Harvested September 15-17, 2015. Population was 32,430 plants/acre.
28

Table 13. Two-year Average Corn Yields under IRRIGATED conditions at the Virginia Crop Improvement Foundation Seed Farm at MT HOLLY, VIRGINIA in 2014 and 2015 - Virginia Tech Trials.
DTM per Yield2 Moist Test Wt.Brand/Company Hybrid Co.1 bu/A % lb/bu<108 Days Relative MaturityPioneer P0604AM 106 229 15.8 57.2108-111 Days Relative MaturityChannel 209-46STXRIB 109 243 16.7 56.0Doebler's RPM® 5015AM™ 110 238 16.9 54.8Seed Consultants SCS 1094AM™ 108 235 16.9 55.3Seed Consultants SC 11AQ15™ 111 229 18.7 54.8Channel 211-35STXRIB 111 228 17.8 55.8Channel 209-53STXRIB 109 225 17.0 55.2DEKALB DKC60-67RIB 110 224 16.6 57.6Phoenix 5552A4 111 216 17.1 54.4
Maturity Average 230 17.2 55.5L.S.D. (0.05) 14 1.0 1.3C.V. 6 5.9 2.3
112-115 Days Relative MaturitySeed Consultants SCS 11HR63™ 115 260 17.9 55.8Augusta A6664 114 255 17.6 55.7Seed Consultants SCS 1131AM™ 112 246 19.0 55.3Doebler's RPM® 5315AMXT™ 113 239 18.4 54.8Dyna-Gro D54DC94 114 238 18.6 54.0DEKALB DKC65-19RIB 115 233 18.4 57.8Phoenix 6522A4 114 232 19.5 52.9DEKALB DKC62-08RIB 112 225 16.1 55.7Seed Consultants SC 11AGT43™ 113 224 19.8 54.1Axis 64T22RIB 114 212 18.5 55.6
Maturity Average 236 18.4 55.2L.S.D. (0.05) 18 1.1 1.1C.V. 8 0.8 1.8
>115 Days Relative MaturityDEKALB DKC66-40RIB 116 248 18.2 54.3Axis 66T27RIB 116 244 19.7 54.7Phoenix 7402A3 118 244 20.6 54.5NK N83D-3000GT 118 241 20.9 53.3Phoenix 6542A4 116 239 19.5 52.6Seed Consultants SC 11AQ72™ 117 239 18.9 55.4Doebler's Doeblers® 5815GRQ™ 118 238 21.0 54.4Seed Consultants SC 11AGT74™ 116 236 20.7 54.7Doebler's Doeblers® 5615GRQ™ 116 211 18.7 54.0
Maturity Average 238 19.8 54.2L.S.D. (0.05) 14 0.9 1.2C.V. 6 4.3 1.9
29

Table 13. Two-year Average Corn Yields under IRRIGATED conditions at the Virginia Crop Improvement Foundation Seed Farm at MT HOLLY, VIRGINIA in 2014 and 2015 - Virginia Tech Trials.
DTM per Yield2 Moist Test Wt.Brand/Company Hybrid Co.1 bu/A % lb/bu
Location Average 235 18.4 55.01 Days to maturity provided by company; differences in maturity rating methods may exist between companies.2 Reported at 15.5% moisture.
30

Table 14. Three-year Average Corn Yields under IRRIGATED conditions at the Virginia Crop Improvement Foundation Seed Farm at MT HOLLY, VIRGINIA, 2012-2014 - Virginia Tech Trials.
DTM per Yield2 Moist Test Wt.Brand/Company Hybrid Co.1 bu/A % lb/bu<108 Days Relative MaturitySeed Consultants SCS 1094AM™ 108 235 17.1 55.3Channel 209-53STXRIB 109 222 17.1 56.4Phoenix 5552A4 111 217 17.2 55.3
Maturity Average 225 17.1 55.7L.S.D. (0.05) 11 0.7 1.0C.V. 6 5.0 1.9
112-115 Days Relative MaturitySeed Consultants SCS 11HR63™ 115 256 18.1 56.3Seed Consultants SCS 1131AM™ 112 242 19.7 55.4Phoenix 6522A4 114 233 19.8 53.4DEKALB DKC65-19RIB 115 230 18.7 57.9DEKALB DKC62-08RIB 112 226 16.6 56.1
Maturity Average 237 18.6 55.8L.S.D. (0.05) 5 0.8 0.9C.V. 8 15.2 1.8
>115 Days Relative MaturitySeed Consultants SC 11AQ72™ 117 236 19.3 56.0Phoenix 6542A4 116 231 19.7 52.6
Maturity Average 234 19.5 54.3L.S.D. (0.05) 12 0.8 0.8C.V. 5 4.1 1.1Location Average 233 18.3 55.5
1 Days to maturity provided by company; differences in maturity rating methods may exist between companies.2 Reported at 15.5% moisture.
31

Table 15. Corn Yields at the Southern Piedmont AREC at BLACKSTONE, VIRGINIA in 2015 - Virginia Tech Trials.
DTM per Yield2 Moist Test Wt.Brand/Company Hybrid Co.1 bu/A % lb/bu<108 Days Relative MaturityPioneer P0339AM 103 213 17.1 55.7Channel 207-27STXRIB 107 199 16.4 56.4Doebler's RPM® 563HXR™ 105 198 16.3 55.2Pioneer P0604AM 106 191 16.1 57.4
Maturity Average 200 16.5 56.2L.S.D. (0.05) 22 1.3 1.4C.V. 6 4.8 1.4
108-111 Days Relative MaturityDEKALB DKC61-88RIB 111 214 16.1 57.3Doebler's RPM® 5015AM™ 110 207 16.4 55.5Channel 209-46STXRIB 109 203 16.0 56.9Doebler's RPM® 5125AM™ 111 201 17.1 55.9Channel 211-35STXRIB 111 200 16.4 57.5DEKALB DKC60-67RIB 110 195 17.5 54.9Dyna-Gro D50VC43 110 193 15.0 56.4Phoenix 5552A4 111 192 15.4 54.4Pioneer P1197AM 111 190 15.9 56.7
Maturity Average 200 16.2 56.2L.S.D. (0.05) 23 1.6 1.8C.V. 8 6.6 2.1
112-115 Days Relative MaturityProgeny PGY4115VT2P 115 216 18.2 56.7DEKALB DKC62-08RIB 112 213 16.4 54.9Progeny PGY4114VT2P 114 211 16.9 57.0Channel 215-05STXRIB 115 209 16.5 56.7DEKALB DKC65-19RIB 115 206 16.9 58.4Dyna-Gro D52VC91 112 206 16.4 57.4Channel 214-45DGVT2PRIB 114 205 17.4 55.5Dyna-Gro D54DC94 114 203 16.6 56.2DEKALB DKC63-33RIB 113 201 16.5 57.2DEKALB DKC64-87RIB 114 200 17.0 55.9Phoenix 7914A4 115 199 18.5 55.7Phoenix 6522A4 114 193 16.6 55.4Progeny PGY5115VT2P 115 186 17.2 55.9
Maturity Average 204 17.0 56.4L.S.D. (0.05) 27 1.4 2.4C.V. 9 5.8 2.8
>115 Days Relative MaturityDEKALB DKC66-40RIB 116 227 18.2 55.9Pioneer P1637VYHR 116 219 18.1 55.8Dyna-Gro D57DC58 117 210 17.0 55.6
32

Table 15. Corn Yields at the Southern Piedmont AREC at BLACKSTONE, VIRGINIA in 2015 - Virginia Tech Trials.
DTM per Yield2 Moist Test Wt.Brand/Company Hybrid Co.1 bu/A % lb/buChannel 217-41DGVT2PRIB 117 209 16.1 54.8DEKALB DKC67-72RIB 117 206 17.7 55.9Phoenix 7402A3 118 203 17.9 56.7Phoenix 6542A4 116 202 18.3 54.9Doebler's Doeblers® 5615GRQ™ 116 199 18.8 54.2DEKALB DKC67-57RIB 117 198 17.6 56.0Doebler's Doeblers® 5815GRQ™ 118 198 17.8 56.6Progeny PGYEXP16VT2P 116 194 18.2 55.4Pioneer P2160YHR 121 194 17.2 56.0Progeny PGY4117VT3P 117 183 16.8 56.1
Maturity Average 203 17.7 55.7L.S.D. (0.05) 25 2.1 2.3C.V. 8 8.2 2.8Location Average 202 17.0 56.1
1 Days to maturity provided by company; differences in maturity rating methods may exist between companies.2 Reported at 15.5% moisture.Planted April 17, 2015. Harvested September 8, 2015. Population was 27,200 plants/acre.
33

Table 16. Two-year Average Corn Yields at the Southern Piedmont AREC at BLACKSTONE, VIRGINIA in 2014 and 2015 - Virginia Tech Trials.
DTM per Yield2 Moist Test Wt.Brand/Company Hybrid Co.1 bu/A % lb/bu<108 Days Relative MaturityPioneer P0604AM 106 190 17.7 56.7108-111 Days Relative MaturityDoebler's RPM® 5015AM™ 110 207 19.6 54.2Phoenix 5552A4 111 188 18.4 53.3DEKALB DKC60-67RIB 110 180 19.8 54.0Channel 211-35STXRIB 111 174 19.2 55.1
Maturity Average 187 19.3 54.1L.S.D. (0.05) 16 1.8 1.4C.V. 8 8.4 2.3
112-115 Days Relative MaturityDyna-Gro D54DC94 114 209 19.8 53.7Phoenix 6522A4 114 198 19.0 53.7DEKALB DKC62-08RIB 112 197 18.5 54.1DEKALB DKC65-19RIB 115 194 18.9 56.9Phoenix 7914A4 115 189 21.1 53.9
Maturity Average 197 19.4 54.5L.S.D. (0.05) 19 1.0 1.0C.V. 8 4.5 1.5
>115 Days Relative MaturityDEKALB DKC66-40RIB 116 213 19.9 54.5Doebler's Doeblers® 5815GRQ™ 118 194 21.5 55.1Phoenix 7402A3 118 191 21.0 54.5Phoenix 6542A4 116 189 21.2 53.0Doebler's Doeblers® 5615GRQ™ 116 185 20.5 53.0
Maturity Average 195 20.8 54.0L.S.D. (0.05) 19 1.7 1.9C.V. 9 7.3 3.2Location Average 193 19.7 54.4
1 Days to maturity provided by company; differences in maturity rating methods may exist between companies.2 Reported at 15.5% moisture.
34

Table 17. Three-year Average Corn Yields at the Southern Piedmont AREC at BLACKSTONE, VIRGINIA, 2013-2015 - Virginia Tech Trials.
DTM per Yield2 Moist Test Wt.Brand/Company Hybrid Co.1 bu/A % lb/bu108-111 Days Relative MaturityPhoenix 5552A4 111 196 19.2 52.5112-115 Days Relative MaturityPhoenix 6522A4 114 211 20.9 52.3DEKALB DKC62-08RIB 112 201 18.8 53.8DEKALB DKC65-19RIB 115 195 19.8 56.0
Maturity Average 202 19.8 54.0L.S.D. (0.05) 17 1.2 1.0C.V. 9 6.4 1.8
>115 Days Relative MaturityPhoenix 6542A4 116 196 22.3 52.1
Location Average 200 20.2 53.31 Days to maturity provided by company; differences in maturity rating methods may exist between companies.2 Reported at 15.5% moisture.
35

Table 18. Corn Yields at KENTLAND Farm at BLACKSBURG, VA in 2015 - Virginia Tech Trials.
DTM per Yield2 Moist Test Wt.Brand/Company Hybrid Co.1 bu/A % lb/bu<108 Days Relative MaturityPioneer P0604AM 106 234 18.9 58.6Seed Consultants SCS 1085AM™ 107 233 19.1 55.1Doebler's RPM® 563HXR™ 105 220 19.1 55.4Pioneer P0339AM 103 209 19.0 55.1
Maturity Average 224 19.0 56.1L.S.D. (0.05) 31 0.8 1.3C.V. 9 2.5 1.4
108-111 Days Relative MaturitySeed Consultants SCS 1125AM™ 111 286 20.5 53.7Pioneer P1197AM 111 271 20.6 55.0Seed Consultants SCS 1094AM™ 108 263 19.6 54.5DEKALB DKC61-88RIB 111 253 20.1 55.6Doebler's RPM® 5125AM™ 111 246 20.2 55.2T.A. Seeds TA625-30 110 244 21.5 53.6AgriGold A6441STX 109 242 20.0 53.6Doebler's RPM® 5015AM™ 110 239 20.4 54.4Seed Consultants SC 10AQ96™ 108 237 20.5 54.6Seed Consultants SC 11AQ15™ 111 233 22.3 52.6AgriGold A6462STXRIB 110 220 20.0 55.4Dyna-Gro D50VC43 110 218 18.8 55.3T.A. Seeds TA636-22DPRIB 111 215 19.7 55.3DEKALB DKC60-67RIB 110 212 20.2 56.8
Maturity Average 241 20.3 54.7L.S.D. (0.05) 28 1.0 1.7C.V. 7 3.2 1.8
112-115 Days Relative MaturityDyna-Gro D54DC94 114 285 21.7 52.0Seed Consultants SCS 11HR63™ 115 281 23.2 52.8Seed Consultants SCS 1131AM™ 112 273 22.0 54.0Dyna-Gro D52VC91 112 269 21.1 56.2DEKALB DKC65-19RIB 115 268 20.9 55.6T.A. Seeds TA736-22DPRIB 113 265 21.6 55.2Progeny PGY4114VT2P 114 263 21.7 54.4DEKALB DKC63-33RIB 113 263 20.0 55.3AgriGold A6573VT3PRIB 114 261 21.0 50.9Progeny PGY5115VT2P 115 258 21.3 53.3Progeny PGY4115VT2P 115 253 21.1 55.1T.A. Seeds TA746-28RIB 114 252 21.2 53.1AgriGold A6499STXRIB 112 251 20.7 59.6AgriGold A6517VT3PRIB 113 249 21.4 52.1AgriGold A6579STX 114 244 21.7 52.7DEKALB DKC64-87RIB 114 232 21.7 54.2
36

Table 18. Corn Yields at KENTLAND Farm at BLACKSBURG, VA in 2015 - Virginia Tech Trials.
DTM per Yield2 Moist Test Wt.Brand/Company Hybrid Co.1 bu/A % lb/buDEKALB DKC62-08RIB 112 231 19.7 54.5Seed Consultants SC 11AGT43™ 113 212 23.5 52.0
Maturity Average 256 21.4 54.0L.S.D. (0.05) 31 1.0C.V. 7 2.8 1.6
>115 Days Relative MaturityDEKALB DKC66-40RIB 116 283 22.0 53.6Pioneer P1637VYHR 116 276 21.6 53.8DEKALB DKC67-57RIB 117 261 21.4 54.0Pioneer P2160YHR 121 248 24.1 54.4Seed Consultants SC 11AGT74™ 116 246 24.6 53.3DEKALB DKC67-72RIB 117 245 22.7 53.8Dyna-Gro D57DC58 117 244 23.7 52.7Doebler's Doeblers® 5815GRQ™ 118 236 25.4 51.3Seed Consultants SC 11AQ72™ 117 233 24.2 52.1Doebler's Doeblers® 5615GRQ™ 116 230 23.0 53.4Progeny PGY4117VT3P 117 223 21.0 54.2Progeny PGYEXP16VT2P 116 223 23.9 52.0
Maturity Average 245 23.1 53.2L.S.D. (0.05) 37 1.0 1.8C.V. 9 2.7 1.9Location Average 242 21 54
1 Days to maturity provided by company; differences in maturity rating methods may exist between companies.2 Reported at 15.5% moisture.Planted May 5, 2015. Harvested October 8, 2015. Population was 25,270 plants/acre.
37

Table 19. Two-year Average Corn Yields at Kentland Farm at BLACKSBURG, VIRGINIA in 2014 and 2015 - Virginia Tech Trials.
DTM per Yield2 Moist Test Wt.Brand/Company Hybrid Co.1 bu/A % lb/bu<108 Days Relative MaturityPioneer P0604AM 106 205 19.5 57.3108-111 Days Relative MaturityDEKALB DKC60-67RIB 110 184 20.0 56.0Seed Consultants SCS 1094AM™ 108 204 19.9 53.7Seed Consultants SC 11AQ15™ 111 217 23.2 52.2Channel 211-35STXRIB 111 205 22.3 53.1Doebler's RPM® 5015AM™ 110 187 20.0 53.4
Maturity Average 199 21.1 53.7L.S.D. (0.05) 19 0.8 1.3C.V. 9 3.3 2.1
112-115 Days Relative MaturityDyna-Gro D54DC94 114 233 22.2 51.9DEKALB DKC65-19RIB 115 221 22.5 54.2DEKALB DKC62-08RIB 112 211 22.2 52.7Seed Consultants SCS 11HR63™ 115 242 23.3 52.6Seed Consultants SCS 1131AM™ 112 227 23.1 54.1Seed Consultants SC 11AGT43™ 113 198 24.3 52.2
Maturity Average 222 22.9 52.9L.S.D. (0.05) 22 1.2 1.5C.V. 9 4.7 2.3
>115 Days Relative MaturityDEKALB DKC66-40RIB 116 233 23.4 52.3Seed Consultants SC 11AQ72™ 117 208 25.5 52.1Seed Consultants SC 11AGT74™ 116 210 26.6 52.0Doebler's Doeblers® 5615GRQ™ 116 190 23.4 52.3Doebler's Doeblers® 5815GRQ™ 118 209 26.6 50.8
Maturity Average 210 25.1 51.9L.S.D. (0.05) 23 1.1 1.1C.V. 10 3.9 1.7Location Average 211 22.8 53.1
1 Days to maturity provided by company; differences in maturity rating methods may exist between companies.2 Reported at 15.5% moisture.
38

Table 20. Three-year Average Corn Yields at Kentland Farm at BLACKSBURG, VIRGINIA, 2013-2015 - Virginia Tech Trials.
DTM per Yield2 Moist Test Wt.Brand/Company Hybrid Co.1 bu/A % lb/bu108-111 Days Relative MaturitySeed Consultants SCS 1094AM™ 108 196 20.3 53.4112-115 Days Relative MaturitySeed Consultants SCS 11HR63™ 115 240 21.9 52.8Seed Consultants SCS 1131AM™ 112 225 22.1 53.9DEKALB DKC65-19RIB 115 217 21.6 54.8DEKALB DKC62-08RIB 112 208 21.0 52.6
Maturity Average 223 21.7 53.5L.S.D. (0.05) 13 0.8 1.2C.V. 7 4.1 2.3
>115 Days Relative MaturitySeed Consultants SC 11AQ72™ 117 214 24.2 52.1
Location Average 217 21.8 53.31 Days to maturity provided by company; differences in maturity rating methods may exist between companies.2 Reported at 15.5% moisture.
39

Table 21. Corn Yields at the Northern Piedmont Center at ORANGE, VIRGINIA in 2015 - Virginia Tech Trials.
DTM per Yield2 Moist Test Wt.Brand/Company Hybrid Co.1 bu/A % lb/bu<108 Days Relative MaturityNK N59B-3111A 107 200 16.8 57.6Channel 206-55STXRIB 106 199 15.1 57.5Augusta A4758 107 199 14.7 57.3Pioneer P0339AM 103 189 15.3 56.3Pioneer P0604AM 106 184 14.4 58.6Channel 207-27STXRIB 107 184 14.6 56.4Doebler's RPM® 563HXR™ 105 181 14.4 57.6
Maturity Average 191 15.0 57.3L.S.D. (0.05) 17 1.3 2.7C.V. 6 5.9 2.8
108-111 Days Relative MaturitySeed Consultants SCS 1125AM™ 111 217 16.3 57.6Doebler's RPM® 5015AM™ 110 213 15.4 56.9DEKALB DKC61-88RIB 111 209 14.8 56.1Terral Seed REV 18BHR84 108 207 15.2 57.5Augusta A4658 108 204 15.7 57.3Pioneer P1197AM 111 203 15.2 56.3Dyna-Gro D50VC43 110 203 14.8 57.1Channel 209-46STXRIB 109 196 15.6 55.8Channel 211-35STXRIB 111 195 15.8 58.3Doebler's RPM® 5125AM™ 111 194 14.6 56.6Seed Consultants SC 11AQ15™ 111 190 18.1 57.0DEKALB DKC60-67RIB 110 188 15.9 57.6
Maturity Average 202 15.6 57.0L.S.D. (0.05) 22 0.9 1.8C.V. 7 4.0 2.0
112-115 Days Relative MaturityDyna-Gro D54DC94 114 220 17.4 53.9Progeny PGY5115VT2P 115 209 16.2 58.7Channel 215-05STXRIB 115 209 16.7 57.4DEKALB DKC64-87RIB 114 209 16.4 57.3Terral Seed REV 24BHR93 114 208 17.3 56.4Seed Consultants SCS 1131AM™ 112 206 17.2 58.7Progeny PGY4114VT2P 114 205 15.7 58.9Dyna-Gro D52VC91 112 202 16.0 58.4Terral Seed REV 25BHR26 115 202 18.0 58.4Terral Seed REV 23BHR55 113 201 16.0 56.5Channel 214-45DGVT2PRIB 114 193 15.7 58.0DEKALB DKC63-33RIB 113 193 15.8 58.6DEKALB DKC62-08RIB 112 192 15.8 58.0Seed Consultants SC 11AGT43™ 113 190 18.8 53.9
40

Table 21. Corn Yields at the Northern Piedmont Center at ORANGE, VIRGINIA in 2015 - Virginia Tech Trials.
DTM per Yield2 Moist Test Wt.Brand/Company Hybrid Co.1 bu/A % lb/buNK N74R-3000GT 114 188 16.5 55.4Terral Seed REV 22BHR43 112 187 15.7 58.6NK N70J-3111A 112 185 16.0 56.9Progeny PGY4115VT2P 115 183 17.6 58.7Seed Consultants SCS 11HR63™ 115 181 16.3 56.6DEKALB DKC65-19RIB 115 180 16.6 59.6
Maturity Average 197 16.6 57.4L.S.D. (0.05) 23 1.5 2.8C.V. 8 6.4 3.2
>115 Days Relative MaturityPioneer P2160YHR 121 226 19.0 58.6NK N78C-3111 118 224 18.7 53.7DEKALB DKC66-40RIB 116 205 18.0 59.3Channel 217-41DGVT2PRIB 117 202 16.4 54.8DEKALB DKC67-72RIB 117 200 17.7 56.4Pioneer P1637VYHR 116 198 16.6 57.4Dyna-Gro D57DC58 117 197 17.1 55.0Doebler's Doeblers® 5815GRQ™ 118 196 19.9 56.4Seed Consultants SC 11AGT74™ 116 195 19.1 57.1Seed Consultants SC 11AQ72™ 117 193 18.7 57.4Progeny PGY4117VT3P 117 190 16.3 58.6Doebler's Doeblers® 5615GRQ™ 116 187 18.9 55.2Augusta A8868 118 187 17.4 57.1Progeny PGYEXP16VT2P 116 184 16.8 55.1Terral Seed REV 26BHR50 116 183 18.5 58.3NK N83D-3000GT 118 181 18.8 57.2Augusta A7068 118 174 19.0 56.7DEKALB DKC67-57RIB 117 174 17.2 58.5
Maturity Average 194 18.0 56.8L.S.D. (0.05) 19 1.1 2.4C.V. 7 4.4 2.8Location Average 196 16.6 57.2
1 Days to maturity provided by company; differences in maturity rating methods may exist between companies.2 Reported at 15.5% moisture.Planted April 28, 2015. Harvested September 23, 2015. Population was 23,630 plants/acre.
41

Table 22. Two-Year Average Corn Yields at the Northern Piedmont Center at ORANGE, VIRGINIA in 2014 and 2015 - Virginia Tech Trials.
DTM per Yield2 Moist Test Wt.Brand/Company Hybrid Co.1 bu/A % lb/bu<108 Days Relative MaturityPioneer P0604AM 106 169 14.8 58.7108-111 Days Relative MaturityDoebler's RPM® 5015AM™ 110 189 16.4 56.2Channel 211-35STXRIB 111 177 16.4 57.5DEKALB DKC60-67RIB 110 164 16.3 57.3
Maturity Average 177 16.3 57.0L.S.D. (0.05) 17 0.9 1.5C.V. 8 4.3 1.8
112-115 Days Relative MaturityDyna-Gro D54DC94 114 189 18.7 54.1Seed Consultants SCS 1131AM™ 112 180 17.8 58.4DEKALB DKC62-08RIB 112 177 16.8 56.5Seed Consultants SC 11AGT43™ 113 170 19.4 54.0DEKALB DKC65-19RIB 115 168 18.1 58.5Seed Consultants SCS 11HR63™ 115 164 17.8 55.8
Maturity Average 175 18.1 56.2L.S.D. (0.05) 15 1.2 2.4C.V. 8 6.1 3.5
>115 Days Relative MaturityDEKALB DKC66-40RIB 116 172 18.5 57.1Augusta A8868 118 169 18.5 55.8Doebler's Doeblers® 5815GRQ™ 118 169 20.4 55.1Seed Consultants SC 11AQ72™ 117 165 20.3 55.6Seed Consultants SC 11AGT74™ 116 163 19.9 55.3Doebler's Doeblers® 5615GRQ™ 116 161 19.9 54.4
Maturity Average 167 19.6 55.5L.S.D. (0.05) 13 1.1 1.6C.V. 7 5.4 2.5Location Average 172 18.1 56.3
1 Days to maturity provided by company; differences in maturity rating methods may exist between companies.2 Reported at 15.5% moisture.
42

Table 23. Three-Year Average Corn Yields at the Northern Piedmont Center at ORANGE, VIRGINIA, 2013-2015 - Virginia Tech Trials.
DTM per Yield2 Moist Test Wt.Brand/Company Hybrid Co.1 bu/A % lb/bu112-115 Days Relative MaturitySeed Consultants SCS 1131AM™ 112 200 18.7 57.6DEKALB DKC65-19RIB 115 189 18.7 57.5DEKALB DKC62-08RIB 112 188 17.6 55.5Seed Consultants SCS 11HR63™ 115 182 18.6 55.3
Maturity Average 190 18.4 56.4L.S.D. (0.05) 13 0.6 1.5C.V. 8 3.9 2.8
>115 Days Relative MaturitySeed Consultants SC 11AQ72™ 117 179 21.1 54.8
Location Average 187 18.9 56.11 Days to maturity provided by company; differences in maturity rating methods may exist between companies.2 Reported at 15.5% moisture.
43

Table 24. Corn Yields in ROCKINGHAM COUNTY, VIRGINIA in 2015 (Thanks to Mark Deevers) - Virginia Tech Trials.
DTM per Yield2 Moist Test Wt.Brand/Company Hybrid Co.1 bu/A % lb/bu<108 Days Relative MaturitySeed Consultants SCS 1085AM™ 107 223 17.3 55.5Pioneer P0604AM 106 220 16.3 58.6NK N59B-3111A 107 212 18.2 54.8Channel 207-27STXRIB 107 202 18.2 55.0Channel 206-55STXRIB 106 201 16.0 57.2Pioneer P0339AM 103 197 16.4 55.0Doebler's RPM® 563HXR™ 105 186 17.5 55.5
Maturity Average 206 17.1 55.9L.S.D. (0.05) 19 2.1 2.0C.V. 6 3.8 2.3
108-111 Days Relative MaturityDoebler's RPM® 5125AM™ 111 245 17.5 56.6AgriGold A6462STXRIB 110 235 18.2 56.0Seed Consultants SCS 1125AM™ 111 231 18.2 55.9Pioneer P1197AM 111 224 18.6 54.9Seed Consultants SC 10AQ96™ 108 221 18.1 55.5DEKALB DKC61-88RIB 111 219 17.0 56.4Seed Consultants SCS 1094AM™ 108 219 17.2 54.8Channel 211-35STXRIB 111 218 19.5 55.8Doebler's RPM® 5015AM™ 110 216 17.6 55.7DEKALB DKC60-67RIB 110 213 17.4 57.3Seed Consultants SC 11AQ15™ 111 213 20.4 53.9T.A. Seeds TA625-30 110 212 19.6 53.8Channel 209-46STXRIB 109 210 18.2 57.0T.A. Seeds TA636-22DPRIB 111 210 17.5 55.2AgriGold A6441STX 109 194 16.8 53.8
Maturity Average 219 18.1 55.5L.S.D. (0.05) 20 1.0 2.1C.V. 6 3.8 2.5
112-115 Days Relative MaturitySeed Consultants SCS 1131AM™ 112 260 19.3 56.5Augusta A6465 115 246 20.0 52.9Progeny PGY4114VT2P 114 235 19.0 56.2Channel 215-05STXRIB 115 234 20.4 54.0Channel 213-28STXRIB 113 234 18.5 54.8DEKALB DKC65-19RIB 115 234 19.7 57.2Seed Consultants SC 11AGT43™ 113 233 20.1 54.8AgriGold A6573VT3PRIB 114 232 19.5 53.4AgriGold A6517VT3PRIB 113 231 19.0 53.1DEKALB DKC64-87RIB 114 230 19.1 55.3T.A. Seeds TA736-22DPRIB 113 230 17.9 57.1
44

Table 24. Corn Yields in ROCKINGHAM COUNTY, VIRGINIA in 2015 (Thanks to Mark Deevers) - Virginia Tech Trials.
DTM per Yield2 Moist Test Wt.Brand/Company Hybrid Co.1 bu/A % lb/buAugusta A6664 114 229 18.6 56.4AgriGold A6499STXRIB 112 228 18.8 56.6T.A. Seeds TA746-28RIB 114 228 17.3 55.8DEKALB DKC63-33RIB 113 226 17.9 55.8Augusta A5063 115 222 18.6 56.6NK N74R-3000GT 114 218 20.4 52.9Channel 214-45DGVT2PRIB 114 214 19.3 54.5Progeny PGY5115VT2P 115 214 18.8 54.9AgriGold A6579STX 114 214 18.8 55.6Progeny PGY4115VT2P 115 213 17.2 57.1NK N70J-3111A 112 212 19.3 54.0DEKALB DKC62-08RIB 112 210 18.4 55.4Seed Consultants SCS 11HR63™ 115 194 19.2 56.2
Maturity Average 226 19.0 55.3L.S.D. (0.05) 24 1.3 2.1C.V. 7 4.7 2.4
>115 Days Relative MaturityDEKALB DKC67-57RIB 117 242 19.6 56.3Pioneer P2160YHR 121 235 20.6 56.5Progeny PGYEXP16VT2P 116 229 20.8 53.2DEKALB DKC66-40RIB 116 228 19.8 54.2NK N83D-3000GT 118 220 21.8 53.0Doebler's Doeblers® 5615GRQ™ 116 219 19.7 55.0Seed Consultants SC 11AGT74™ 116 218 22.0 55.1DEKALB DKC67-72RIB 117 217 19.9 54.8Augusta A7068 118 217 20.4 57.2NK N78C-3111 118 212 19.1 52.7Seed Consultants SC 11AQ72™ 117 210 22.3 53.9Doebler's Doeblers® 5815GRQ™ 118 208 22.5 53.9Progeny PGY4117VT3P 117 204 18.8 55.3
Maturity Average 220 20.6 54.7L.S.D. (0.05) 25 1.3 1.7C.V. 8 4.5 1.8Location Average 217 19 55
1 Days to maturity provided by company; differences in maturity rating methods may exist between companies.2 Reported at 15.5% moisture.Planted May 13, 2015. Harvested October 15, 2015. Population was 24,700 plants/acre.
45

Table 25. Two-year Average Corn Yields at SHENANDOAH VALLEY, VIRGINIA in 2014 and 2015 - Virginia Tech Trials.
DTM per Yield4 Moist Test Wt.Brand/Company Hybrid Co.3 bu/A % lb/bu<108 Days Relative MaturityPioneer P0604AM 106 176 15.2 58.5108-111 Days Relative MaturityDoebler's RPM® 5015AM™ 110 195 16.2 56.2Channel 211-35STXRIB 111 189 17.5 56.8Seed Consultants SCS 1094AM™ 108 188 16.0 55.2T.A. Seeds TA625-30 110 187 18.0 54.0Seed Consultants SC 11AQ15™ 111 187 19.2 54.5DEKALB DKC60-67RIB 110 175 16.1 57.4
Maturity Average 187 17.2 55.7L.S.D. (0.05) 12 0.9 0.9C.V. 6 4.9 1.5
112-115 Days Relative MaturitySeed Consultants SCS 1131AM™ 112 230 18.1 56.5Seed Consultants SC 11AGT43™ 113 201 18.7 55.4Augusta A6664 114 194 17.3 56.9DEKALB DKC65-19RIB 115 191 18.5 57.9Seed Consultants SCS 11HR63™ 115 185 17.9 56.1DEKALB DKC62-08RIB 112 183 17.2 56.0
Maturity Average 197 17.9 56.5L.S.D. (0.05) 25 1.0 1.7C.V. 11 5.0 2.6
>115 Days Relative MaturitySeed Consultants SC 11AQ72™ 117 201 19.8 55.0DEKALB DKC66-40RIB 116 191 18.3 54.7Doebler's Doeblers® 5615GRQ™ 116 186 18.4 55.0Seed Consultants SC 11AGT74™ 116 181 19.9 56.8Doebler's Doeblers® 5815GRQ™ 118 178 20.3 55.1
Maturity Average 188 19.3 55.3L.S.D. (0.05) 18 1.0 1.3C.V. 9 4.9 2.1Location Average 190 17.9 56.0
1 Days to maturity provided by company; differences in maturity rating methods may exist between companies.2 Reported at 15.5% moisture.
46

Table 26. Three-year Average Corn Yields at SHENANDOAH VALLEY, VIRGINIA, 2013-2015 - Virginia Tech Trials.
DTM per Yield4 Moist Test Wt.Brand/Company Hybrid Co.3 bu/A % lb/bu108-111 Days Relative MaturitySeed Consultants SCS 1094AM™ 108 189 17.9 54.0112-115 Days Relative MaturitySeed Consultants SCS 1131AM™ 112 247 20.5 55.8Seed Consultants SCS 11HR63™ 115 229 19.8 54.6DEKALB DKC65-19RIB 115 198 20.3 56.4DEKALB DKC62-08RIB 112 197 19.5 54.7
Maturity Average 218 20.0 55.4L.S.D. (0.05) 20 0.9 1.4C.V. 10 5.1 2.6
>115 Days Relative MaturitySeed Consultants SC 11AQ72™ 117 211 22.7 53.4
Location Average 212 20.1 54.81 Days to maturity provided by company; differences in maturity rating methods may exist between companies.2 Reported at 15.5% moisture.
47

[Type here]
Related Documents