The Pennsylvania State University University Park Campus Freight, Fuel, & Emissions GE Transportation EDSGN 100 Section 001 Design Team 7 The Armadillos Fall 2015 Team Member James Ross Team Member Marisa Coltabaugh Team Member Arianna Vetrano Team Member Daniel Weisner Submitted to:

Welcome message from author
This document is posted to help you gain knowledge. Please leave a comment to let me know what you think about it! Share it to your friends and learn new things together.
Transcript

The Pennsylvania State UniversityUniversity Park Campus
Freight, Fuel, & EmissionsGE Transportation
EDSGN 100
Section 001
Design Team 7The ArmadillosFall 2015
Team Member James RossTeam Member Marisa ColtabaughTeam Member Arianna Vetrano Team Member Daniel Weisner
Submitted to:Professor Berezniak
College of EngineeringSchool of Engineering Design, Technology and Professional ProgramsPenn State University
08 Dec 2015


ACKNOWLEDGMENTS
Penn State University
Dean, College of EngineeringAmr Elnashai Ph.D., Harold and Inge Marcus Dean of Engineering
Department Head, SEDTAPPSven Bilén, PE
Course InstructorJohn Berezniak, PE
Laboratory AssistantsSean Fitzpatrick, Mechanical Engineering
GE Transportation
James Bunce, Senior Manager – LNG ProgramGE Transportation – Erie, PA2901 E Lake Rd, Erie, PA 16531

The Pennsylvania State UniversityUniversity Park Campus
Freight; Fuel & EmissionsGE Transportation
TABLE OF CONTENTSSECTION 1. EXECUTIVE SUMMARY
SECTION 2. INTRODUCTION2.1 PROJECT OBJECTIVES2.2 PROJECT BACKGROUND2.3 PROJECT SPONSOR BACKGROUND2.4 PROJECT DESCRIPTION2.5 PROJECT FREIGHT REQUIREMENTS2.6 TRANSPORTATION MODE COMPARISONS
SECTION 3. TRANSPORTATION INFRASTRUCTURE CONDITION AND CAPACITY3.1 INTRODUCTION3.2 PENNSYLVANIA ROADS AND BRIDGES3.3 PENNSYLVENAI INLAND WATER WAY SYSTEM3.4 PENNSYLVANIA FREIGHT RAIL SYSTEM
SECTION 4. STANDARD CAPACITY FOR ALTERNATE TRANSPORTATION MODES4.1 CARGO CAPACITY4.2 EQUIVALENT UNITS4.3 EQUIVALENT LENGTHS
SECTION 5. TRANSPORTATION COSTS AND CONCEPT OF OPERATIONS (ConOps)
5.1 TRUCKS5.2 BARGES5.3 RAILROAD5.4 MOST ECONOMICAL TRANSPORTATION SOLUTION5.5 CONCEPT OF OPERATIONS (CONOPS)
SECTION 6. EPA DIESEL EMISSION STANDARDS6.1 BACKGROUND6.2 TIER 0-2 STANDARDS6.3 TIER 3-4 STANDARDS

The Pennsylvania State UniversityUniversity Park Campus
Freight; Fuel & EmissionsGE Transportation
SECTION 7. DIESEL ENGINE EXHAUST EMISSIONS (DEEE)7.1 DIESEL EMISSION CHEMISTRY7.2 DIESEL EMISSION REDUCTION STRATEGIES7.3 ALTERNATE FUELS7.4 HUMAN HEALTH ISSUES
SECTION 8. LOCOMOTIVE FLEET UPGRADE8.1 ALTERNATIVES8.2 EXISTING FLEET MAKE-UP8.3 INVESTMENT DATA8.4 UPGRADE STRATEGY8.5 UPGRADE SCHEDULE AND COSTS
SECTION 9. SUMMARY
SECTION 10. REFERENCES

The Pennsylvania State UniversityUniversity Park Campus
Freight; Fuel & Emissions
SECTION 1 EXECUTIVE SUMMARY
Pittsburgh needs to reduce exhaust emissions from transportation to within EPA standards, and is seeking a cost efficient strategy to do that. The city moves 165,000 tons of freight by rail. However, current engines meet Tier 2 EPA emission standards and are approaching overhaul, at which new or remanufactured engines will need to meet at least Tier 3 standards.
This strategy involves a combination of several transportation systems: sell existing engines and purchase new ones for the fleet of locomotives, upgrade the fleet from Tier 2 to Tier 3 standards with after treatment technology, switch to alternative fuels, or use freight methods alternative to rail. The strategy in this report involves upgrading the 15 lowest mileage Tier 2 locomotives with after treatment to Tier 3 at $850,000 each for a total cost of $12.75 million; selling the 25 highest mileage Tier 2 locomotives at $1.5 million (M) each for $37.5 million and purchasing 25 Tier 4 locomotives at $4 M each for $100 M totaling a cost of $62.5 million split into 2 installments over 2 years; and selling the 10 remaining next highest mileage Tier 2 locomotives for $15 million and buying 2 tow barges to compensate for and exceed the current capacity for shipping, at $28.5 million for a total cost of $13.5 million. Giving a total project cost of $88.75 million. Switching to alternative fuel would be much more expensive and is not a part of this strategy.
Section 2 introduces the project by summarizing some important background information, project details and the problem we are to solve. It then discusses alternate methods of transporting freight (train, barge, and truck) and the advantages and disadvantages of using each.
Section 3 explains the American Society of Civil Engineers Report Card for Pennsylvania’s infrastructure including roads, bridges, inland waterways, and rail transportation.
Section 4 compares the different modes of transporting freight that we are focusing on: one barge, one 15 barge tow, one bulk type railroad car, one boxcar type railroad car, one 100 car train unit, and one highway truck trailer. In this section we compare their cargo capacities, units, and lengths.
Section 5 provides information on carrying capacities, costs of operation, and emission of certain greenhouse gases for different transportation methods. It also provides the
1 | P a g e

The Pennsylvania State UniversityUniversity Park Campus
Freight; Fuel & Emissions
transportation solution with operational constraints, a model of operations, performance characteristics, and a plan for continuing operation under duress.
Section 6 shows the current EPA standards for Tiers 0-4 for diesel exhaust emissions regulations, and gives a brief history and summary for the Tiers. Also described in this section are important dates and several tables quantifying emissions requirements.
Section 7 looks at the diesel exhaust emissions and why certain pollutants in them are harmful, after treatment upgrades to diesel engines that can reduce emissions and how effective they are quantifiably, and fuel alternatives to diesel.
Section 8 provides the upgrade strategy for how the original fleet was changed. There are final costs of all investments and a schedule of how those costs will be paid. The best solution would minimize both cost and emissions.
2 | P a g e

The Pennsylvania State UniversityUniversity Park Campus
Freight; Fuel & Emissions
SECTION 2 INTRODUCTION
2.1 Project Objectives. Pittsburgh is looking for the design of a cost-effective solution for its freight that reduces smog and meets EPA requirements, while maintaining or increasing freight capacity into and out of this important port city.
2.2 Project Background. Every day into and out of the port city of Pittsburgh, approx. 165,000 tons of freight or minerals (coal, etc.) per day travel via rail. Smog from locomotive emissions is a key complaint of city residents. Smog is generated from engine-emitted NOx. Tier 2 locomotives used to haul freight are approaching age for overhaul, at which time investments will be required to meet EPA Tier 3 (or higher) requirements.
2.3 Project Sponsor Background. GE Transportation, a unit of GE (NYSE: GE), solves the world’s toughest transportation challenges. GE Transportation builds equipment that moves the rail, mining, and marine industries. GE’s fuel-efficient and lower-emissions freight and passenger locomotives; diesel engines for rail; marine and stationary power applications; signaling and software solutions; drive systems for mining trucks; and value-added services help customers grow. GE Transportation is headquartered in Chicago, IL, and employs approximately 13,000 employees worldwide.
2.4 Project Description. Each design team should research and evaluate the suggestions made for fleet upgrade or alternate shipping methods. For upgrades, consider physical constraints of new hardware, as well as fuel storage requirements. Provide your recommendations, commenting on impact to:
1) Emissions/Regulatory requirements2) Costs: fuel, infrastructure, etc.3) Freight throughput/capacity4) Public opinion5) On time delivery
2.5 Project Freight Requirements. There are 15 trains per day running on the current schedule consisting of 3 mineral trains and 12 freight trains. All together the fleet is made up of 50, Tier II trains. Each mineral trains can carry up to 12,000 ton of coal with 3 locomotives while the freight trains can carry up to 7,000 ton of freight with 2 locomotives.
3 | P a g e

The Pennsylvania State UniversityUniversity Park Campus
Freight; Fuel & Emissions
2.6 Transportation Mode Comparisons.
a. Trucks.
Advantages :o Can transport cargo to places where trains and cargo ships cannot reach.
For example, “door to door” is possible with trucks. o Can travel at a faster speed than the other three options
Disadvantages :o Cargo capacity is the smallest o Least energy efficient. Carrying one ton of cargo, a truck can go 59 miles
per gallon compared to a train that can go 202 miles per gallon, and a barge that can go 514 miles per gallon.
o Least environmentally friendly. One truck emits 0.0063 pounds of hydrocarbons per mile compared to .0046 pounds (train) and .0009 (barge). It also emits 0.0190 pounds of carbon monoxide per mile compared to .0064 pounds (train) and .002 (barge). Lastly, one truck will emit 0.1017 pounds of nitrous oxide per mile compared to .0183 pounds (train) and .0053 (barge).
o Need a lot more trucks in order to transport the same amount of cargo as the Barge and the train.
o Costs the most amount of money to operate. $5.35 to transport one ton of freight.
b. Barges. Advantages :
o Most environmentally friendly (refer to information above in Truck’s disadvantages)
o Can transport goods across bodies of watero Costs the least amount of money to operate: $0.97 to transport one ton of
cargo one mile. o Can transport the most amount of cargo at a time. One 15 barge tow can
carry 22,500 ton while one 100 car train unit can carry 10,500 tons, and a large semi can only carry 26 ton.
Disadvantages: o Can only travel through water. This is very limiting because there are only
two rivers around Pittsburgh, the Allegheny River and the Monongahela River which both fed into the Ohio River. This restricts cargo transportation inland.
4 | P a g e

The Pennsylvania State UniversityUniversity Park Campus
Freight; Fuel & Emissions
o Is the slowest mode of transportation compared to the train and truck. The speed of the cargo ships can vary, however, on the rivers surrounding Pittsburgh, speeds tend to be lower in around the 2-5 knot range.
c. Railroad. Advantages
o Can transport freight inland. Disadvantages
o For this project, trains would need to either be upgraded or new Tier 4s will have to be purchased.
o Transportation is limited to the range and extent of the railways.
5 | P a g e

The Pennsylvania State UniversityUniversity Park Campus
Freight; Fuel & Emissions
SECTION 3 TRANSPORTATION INFRASTRUCTURE CONDITION AND CAPACITY
3.1 Introduction. The 2014 Report Card for Pennsylvania Infrastructure helps citizens of Pennsylvania see how safe their infrastructure is and what changes need to be made to improve the infrastructure in order to keep people and the economy safe. Overall, Pennsylvania’s infrastructure received a C- letter grade. These letter grades are reflective of the condition of the infrastructure with an F being deteriorating, a C being of fair condition, and an A being of excellent condition. References can be found in Section 10.
3.2 Pennsylvania Roads and Bridges. Pennsylvania’s road conditions are rated at a D-, meaning they are in poor condition. This is most likely due to the 8.8 million drivers that travel almost 100 billion miles a year. Pennsylvania’s interstate roads handle more than double the national average of truck travel at 34% of all travel done in the state. It is obvious to see the need to expand Pennsylvania’s roadways when it is explained that each Pennsylvania driver wastes 86 gallons of fuel a year and spends over four weeks of vacation time backed up on the roads due to congestion. Pennsylvania’s bridge conditions are currently rated at a D+, meaning they are in poor condition. The Commonwealth has over 22,660 bridges that 114 million drivers traverse over every day. About
1 in every 4 of these bridges are considered to be Structurally Deficient and about 1 in every 5 of these bridges are considered to be Functionally Obsolete. This is not to say they are unsafe to use, these bridges simply do not meet the American Society of Civil Engineer’s standards for functionality and structural efficiency, which were recently updated with
stricter requirements. The percentage of Structurally Deficient bridges has decreased by 4% since 2010 with an
increase in funds, but they are short-lived. Overall, Pennsylvania will need to increase its funds for infrastructure drastically if it intends to improve bridge and roadway conditions.
6 | P a g e
Figure 3.2a Pennsylvania Interstate
Figure 3.2b Typical Bridge

The Pennsylvania State UniversityUniversity Park Campus
Freight; Fuel & Emissions
For more information on Pennsylvania roadways and Pennsylvania’s bridges please see the references in Section 10.
3.3 Pennsylvania Inland Water Ways. There are no commercial inland waterway systems currently in operation in eastern Pennsylvania. All of Pennsylvania’s waterways depends on the western side of the state, specifically the Port of Pittsburgh (Figure 3.3a). The Port of Pittsburgh accounts for 50% of the state’s waterborne commerce at 35 million tons of cargo each year. The port is capable of handling more cargo than it is currently operating with and relies on its ability to operate efficiently. The Pittsburgh Port currently supports more than 200 river terminals and barge service suppliers. The U.S. Army Corps of Engineers operates and maintains 200 miles of navigable waterways and 17 navigation locks
and dams in western Pennsylvania. None of the dams in western Pennsylvania have a satisfactory rating with three of the 17 dams being in unsatisfactory condition. An unsatisfactory condition means these dams need immediate repair and improvement. Of Pennsylvania’s 17 locking systems three are of satisfactory condition and six are of unsatisfactory condition. Pennsylvania’s Inland Waterway system
currently has a rating of D+ but, that rating should improve around
2023 when the USACE finishes its improvement of the Lower Monongahela River’s infrastructure. The Federal Marine Highway Corridor M-70 (Figure 3.3b) connects channels and ports from Pittsburgh to Kansas City, playing a major role in alleviating congestion from truck travel on highways and allowing for more efficient freight transportation. This corridor also reduces emissions and highway maintenance costs, improves safety, and conserves energy by putting more cargo on the waterways than on the roads. For more information on Pennsylvania’s inland waterways and the Federal Marine Highway Corridor M-70 please see the references in Section 10.
7 | P a g e
Figure 3.3a Port of Pittsburgh
Figure 3.3b Federal Marine Highway Corridor M-70

The Pennsylvania State UniversityUniversity Park Campus
Freight; Fuel & Emissions
3.4 Pennsylvania Freight Rail System. Pennsylvania’s Freight Rail System (Figure 3.4) has a rating of a B, meaning most of the rail system is in good condition. The Commonwealth has 5,145 miles of operational freight railroad and 65 freight railroads. Larger, Class I, railroads carry between 100 and 120 million gross tons of freight per year, while 124 rail lines in Pennsylvania are considered at risk of abandonment because of low density traffic. These rail lines carry less than five million gross tons of freight per year,
making it difficult to maintain those lines due to a lack of revenue. In 2007,
201.6 million tons of freight passed through the state, that number is expected to increase to 246 million by 2035. Pennsylvania’s current railroad freight demand exceeds its infrastructure capability. It’s estimated that the Commonwealth would need more than $280 million dollars to expand and improve infrastructure to accommodate demand. For more information on Pennsylvania’s freight rail system please see the references in Section 10.
8 | P a g e
Figure 3.4a Pennsylvania’s Freight Rail System
Figure 3.4b Typical Freight Train

The Pennsylvania State UniversityUniversity Park Campus
Freight; Fuel & Emissions
SECTION 4 STANDARD CAPACITY FOR ALTERNATE TRANSPORTATION MODES
4.1 Cargo Capacity.
1. One Barge: a. 1500 Tonb. 52,500 Bushelsc. 453,600 gallons
2. One 15 Barge Tow:a. 22,500 Tonb. 787,599 Bushels, c. 6804,000 Gallons
3. One Bulk Type Railroad Car: a. 100 Tonb. 3,500 Bushelsc. 30,240 Gallons
4. One Boxcar Type Railroad Car:a. 103.25 Ton
5. 100 Car Train Unita. 10,500 Tonb. 350,000 Bushelsc. 3,024,000 Gallons
6. One Highway Truck Trailer: a. 26 Tonb. 910 Bushelsc. 7865 Gallons
Given the information above, it is evident that one 15-barge tow has the largest cargo capacity followed by one barge, one boxcar type railroad car, one bulk type railroad car, and finally one highway truck trailer. One 15-barge tow can carry 225 times as much as one bulk type railroad car and approximately 865 times as much as one highway truck trailer.
9 | P a g e

The Pennsylvania State UniversityUniversity Park Campus
Freight; Fuel & Emissions
4.2 Equivalent Units. One Barge = 15 Bulk Type Railroad Car = 58 Trucks
One 15 Barge Tow = 2.25 100 Car Unit Trains = 870 Trucks
According to the information shown above, one 15-barge tow can carry the amount of 100 train cars and 870 large semis.
4.3 Equivalent Lengths. 1. One 15 Barge Tow is approximately .25 miles2. 2.25 100 Car Train Unit is approximately 2.75 miles3. 870 trucks (bumper to bumper) is approximately 11.5 miles
According to the information above one can clearly tell that if you line up the different modes of transportation carrying 22,500 ton, the 15 Barge Tow would have the shortest span, (.25 miles), followed by 2.75 miles of train cars, and 11.5 miles of trucks.
10 | P a g e

The Pennsylvania State UniversityUniversity Park Campus
Freight; Fuel & Emissions
SECTION 5 TRANSPORTATION COSTS AND CONCEPT OF OPERATIONS (ConOps)
5.1 Trucks. The cost of transporting cargo by truck is, on average, $67.00 an hour or $5.35 to move one ton of freight for every mile. The majority of the cost comes from fuel costs and driver wages. The average pay for a truck driver in 2012 was $18.37 an hour. The average fuel costs per hour was $25.78 in 2013. The cost of truck transportation is also affected by repair and maintenance costs, insurance premiums, replacement of tires, toll costs, permits and license costs, paying driver benefits, and truck/trailer lease or purchase costs. References can be found in Section 10.
5.2 Barges. A typical tow barge consists of one towboat with a horsepower of 3000 pushing 15 barges along. Cost of operating a tow barge depends on its horsepower. A typical tow barge carrying 22,500 tons traveling 100 miles per day costs $12,080 a day. This cost includes replacement costs, operational costs, and fuel costs. To move one ton of freight one mile by barge costs approximately $0.97. References can be found in Section 10.
5.3 Railroad. To move one ton of freight one mile by rail costs approximately $2.53. To move freight by carload can cost anywhere from $700 to $3,500 depending on what is being shipped. To transport freight by rail the Revenue to Variable Cost (RVC) ratio must be taken into account. A typical RVC is about 180%. Altogether transporting by railroad is cheaper than by truck but more expensive than by barge. References can be found in Section 10.
5.4 Most Economical Transportation Solution. The most economical transportation system for transporting 165,000 tons of freight in and out of Pittsburgh daily would be to have 15 locomotives upgraded and overhauled from Tier 2 to Tier 3. Twenty-five new Tier 4 locomotives will be bought with the money received from selling 35 locomotives that were not upgraded from Tier 2 to Tier 3. These 35 locomotives will be the locomotives with the highest mileage accumulated and closest to being in need of overhaul and maintenance. This new system would only allow for 40 locomotives instead of 50. This means five mineral trains would be in use and 12 freight trains would be in use. In addition to the new rail transport system, two tow barges will be included in transporting freight in and out of Pittsburgh. With this system 189,000 tons of freight could be transported in and out of Pittsburgh. No trucks will be used in this transportation model. It was assumed that a local distribution center would have its own transportation system. This system is the most
11 | P a g e

The Pennsylvania State UniversityUniversity Park Campus
Freight; Fuel & Emissions
economical plan as well as the most eco-friendly plan. A model of operations is shown below as Figure 5.4.
5.5 Concept of Operations (ConOps).
a. General Description. The proposed transportation system will include five mineral trains capable of carrying 60,000 tons of freight, 12 freight trains capable of carrying 84,000 tons of freight, and two tow barge capable of carrying 45,000 tons of freight. This transportation system will be operating off of a multimodal system comprised of two different modes of transport.
b. Operational Policies and Constraints. Barge workers usually travel for two to three weeks at a time on the job. Those working on freight locomotives often work irregular schedules in less clean and comfortable conditions than those on passenger locomotives. All transport workers are expected to be able to work day or night to keep the system operating 24 hours a day, seven days a week. However, regulations require workers to take time off between runs or shifts so that health of the worker can be maintained. Operating the large vessels that carry such large amounts of freight often come with very little space for the operator to drive the vessel and workers can feel cramped in such difficult conditions. With the proposed system there will only be 40 locomotives in the fleet rather than 50 because of the addition of other modes of transportation. References can be found in Section 10.
12 | P a g e
Figure 5.4 Model of Operations

The Pennsylvania State UniversityUniversity Park Campus
Freight; Fuel & Emissions
c. Performance characteristics. The new transportation system will allow for up to 189,000 tons of freight to be transported daily. Transporting freight by rail has the capacity to transport one ton of freight 202 miles per gallon of fuel. Transporting freight by barge has the capacity to transport one ton of freight 514 miles per gallon of fuel. Transporting freight by barge has, on average, 0.01 deaths per billion ton-miles traveled and 0.09 injuries per billion ton-miles traveled. Transporting freight by rail has, on average, 1.15 deaths per billion ton-miles traveled and 21.77 injuries per billion ton-miles traveled. Transporting freight by truck has, on average, 0.84 deaths per billion ton-miles and an unknown number of injuries per billion ton-miles traveled. References can be found in Section 10.
d. Operational Impacts. Transporting freight by barge emits 0.0009 lbs. of hydrocarbons per ton-mile, 0.002 lbs. of carbon monoxide per ton-mile, and 0.0053 lbs. of nitrous oxide per ton-mile. Transporting freight by rail emits 0.0046 lbs. of hydrocarbons per ton-mile, 0.0064 lbs. of carbon monoxide per ton-mile, and 0.0183 lbs. of nitrous oxide per ton-mile. Transporting freight by truck emits 0.0063 lbs. of hydrocarbons per ton-mile, 0.019 lbs. of carbon monoxide per ton-mile, and 0.1017 lbs. of nitrous oxide per ton-mile. Transporting freight by truck is responsible for 74% of emissions of greenhouse gases created by freight transport. Transporting freight by rail is responsible for 9% of emissions of greenhouse gases created by freight transport. Transporting freight by water is responsible for 7% of the emissions of greenhouse gases created by freight transport. The adjustment of locomotive tiers to Tier 3 and Tier 4 is also to keep emissions of particulates within EPA standards as well as to help the system run more efficiently. The transportation system should also provide jobs to the local population of Pittsburgh. References can be found in Section 10.
e. Continuity of Operations. In the event of a terrorist attack or extreme weather conditions all modes of transport would come to a halt. If a situation is deemed life threatening or unsafe in any way, employee lives will not be put at risk for any reason. Once a situation has been deemed safe for transporting freight and employee lives are not at risk the transportation system will resume operation.
13 | P a g e

The Pennsylvania State UniversityUniversity Park Campus
Freight; Fuel & Emissions
SECTION 6 EPA DIESEL EMISSION STANDARDS
6.1 Background. The EPA first adopted regulations for diesel fuel emissions in 1973. Diesel fuel emissions have been a major contributor to increasing the greenhouse effect and, subsequently, climate change, as well as human health problems. Please refer to section 7.4 Human Health issues for more information.
In March 2008, EPA finalized a three part program that will dramatically reduce emissions from diesel locomotives of all types -- line-haul, switch, and passenger rail. The rule will cut PM emissions from these engines by as much as 90 percent and NOx emissions by as much as 80 percent when fully implemented. The standards are based on the application of high-efficiency catalytic after-treatment technology for freshly manufactured engines built in 2015 and later.
EPA standards also apply for existing locomotives when they are remanufactured. Requirements are also in place to reduce idling for new and remanufactured locomotives.
The intent of the new standards is to eliminate or reduce pollutants caused by diesel emissions considered generally harmful moving forward. According to the final rule on emissions standards for compression ignition internal combustion engines, the final standards are estimated to reduce Nitrogen Oxides (NOx) by 38,000 tons per year (tpy), Particulate Matter (PM) by 3,000 tpy, Sulfur Dioxide (SO2) by 9,000 tpy, non-methane Hydrocarbons (HC) by 600 tpy, and Carbon Monoxide (CO) by 18,000 tpy.
Tier 0-2 standards:The first emission regulation for railroad locomotives was adopted on 17 December
1997 [63 FR 18997-19084, 16 Apr 1998]. The rulemaking, which became effective in 2000,
applies to locomotives originally manufactured from 1973, any time they are manufactured or remanufactured. Tier 0-2 standards are met through engine design methods, without the use of exhaust gas after-treatment.
Tier 3-4 standards:A regulation signed on 14 March 2008 introduced more stringent emission
requirements [73 FR 88 250 98 - 25352, 6 May 2008]. Tier 3 standards, to be met by engine design methods, become effective from 2011/12. Tier 4 standards, which are expected to require exhaust gas after-treatment technologies, become effective from 2015. The 2008 regulation also includes more stringent emission standards for remanufactured Tier 0 - 2 locomotives. At the Tier 4 standard, the EPA regulated sulfur emissions at a limit of 500 ppm effective June 2007, and 15 ppm effective June 2015
14 | P a g e

The Pennsylvania State UniversityUniversity Park Campus
Freight; Fuel & Emissions
Exemptions include electric locomotives, locomotives manufactured before 1973, and historic steam powered locomotives.
6.2 Tier 0-2 Standards. Tier 0: Applies to engines manufactured and remanufactured from 1973 to 2001. Tier 0 standards mark engines manufactured and remanufactured after the EPA’s initial diesel emissions standards were passed. The initial standards limit the amount of Nitrogen Oxides (NOx), Particulate Matter (PM), Carbon Monoxide (CO) which turns to Carbon Dioxide (CO2) when released into the atmosphere, and Hydro Carbons (HC). Refer to section 7.1 for hazards associated with each, and section 7.2 for some current strategies to reduce these emissions. Refer to Table 1 for permitted emissions standards and Table 6.2 for smoke opacity standards.
Tier 1: Applies to engines manufactured and remanufactured from 2002 to 2004. More stringent emissions standards by the EPA were passed on Dec. 17, 1997 and became effective in 2000. These standards are separated into Tiers (Tiers 0, 1, and 2) with more stringent emissions levels as the Tiers progress. Refer to table 6.1.
Tier 2: Applies to engines manufactured and remanufactured from 2005 and after. Refer to table 6.1.
Values in the table are given in grams per brake horsepower-hour (g/bhp-hr).
Table 6.1
15 | P a g e

The Pennsylvania State UniversityUniversity Park Campus
Freight; Fuel & Emissions
Table 6.2
6.3 Tier 3-4 Standards. New regulations passed on March 14, 2008 and made effective in 2011/2012 strengthened the Tier 0 - 2 standards for existing locomotives, and introduced new, stricter Tier 3 and Tier 4 emission standards. Smoke opacity regulations were unaffected. Refer to Table 6.3 for the new emissions standards for Tiers 0-2 engines, and Tiers 3 and 4 engines.
Tier 3: Applies to engines manufactured and remanufactured from 2012 to 2014. Tier 3 standards became effective in 2011/2012.
Although not indicated in the Tiered standards chart, all non-road diesel engines from 2007 to 2011 were required to meet a maximum level of 500 ppm of Sulfur Oxide (SOx) emissions, which phased down to 15 ppm SOx by 2011 and onward. SOx emissions in exhaust come from unburned Sulfur in the fuel, and are therefore dependent on the the sulfur content in the fuel. Most diesel fuel is now regulated and contains little enough sulfur to not include SOx emissions in these tables.
Tier 4: Applies to engines manufactured and remanufactured from 2015 and on. Table 6.3 shows the 2015 emissions standards for Tiers 0-4. Table 6.4 shows the phase in progression for Tier 4 standards from 2011 onward.
16 | P a g e

The Pennsylvania State UniversityUniversity Park Campus
Freight; Fuel & Emissions
Table 6.3
Table 6.4
17 | P a g e

The Pennsylvania State UniversityUniversity Park Campus
Freight; Fuel & Emissions
SECTION 7 DIESEL ENGINE EXHAUST EMISSIONS (DEEE)
7.1 Diesel Emission Chemistry.
a. NOx. Nitrogen Oxide and Nitrogen Dioxide. These are produced in the high heat and pressure environment of diesel combustion. This occurs at the top of the cylinder and moment of fuel injection, where the air is most compressed and at its highest temperature. NOx are useful in trace amounts in the atmosphere (for creating ozone, and producing nitrates and nitrites for soil nutrients). However, at high levels NOx can cause acid rain, can be dangerous to human health as they are toxic, can create a surplus of Nitrite and Nitrate nutrients (say that 5 times fast) which causes algal blooms and other environmental problems, and is a major factor in smog formation (no, not the dragon). Road transportation is attributed with 40-70% of NOx emissions, diesel engines impacting this amount most significantly with 85% of the road transportation emissions (that’s about 35 - 60% of total NOx emissions).
Table 7.1 shows NOx and Non Methane Hydrocarbons (NMHC) emissions standards for Tier 4 diesel engines of different sizes.
Table 7.1
b. Particulate Matter (PM). Particles in exhaust emissions. Particulate matter is made up of soot, ash, and trace metallic particles that are a byproduct of diesel combustion. These particles are tiny (fine), usually about 15-40 nm diameter spheres. PM is very damaging for lungs because the particles can penetrate deep into them. Not only are soot, ash, and metallic particles abrasive and damaging to lungs themselves, they can react with elements in the atmosphere to create other carcinogens. Table 7.2 shows PM emissions standards for Tier 4 diesel engines of different sizes.
18 | P a g e

The Pennsylvania State UniversityUniversity Park Campus
Freight; Fuel & Emissions
Table 7.2
c. CO2. Carbon Monoxide. CO is a byproduct of diesel combustion when there isn’t enough oxygen present to create Carbon Dioxide (CO2) during the high pressure and temperature of combustion. It can cause carbon monoxide poisoning in relatively high concentrations, however, in the atmosphere it typically combines with Oxygen to form Carbon Dioxide. Because of regulations and caps on other pollutants from diesel exhaust, particularly NOx and particulate matter, CO emissions from diesel exhaust are relatively much lower than other pollutants and well below EPA standards.
CO2 emissions, which in diesel fuel are also produced from CO (section 7.1c) and HC (section 7.1d), are at an estimated 77 billion tons per year and will grow to an estimated 90 billion tons per year by 2020. Transportation is the second largest contributor to CO2 emissions, responsible for a range of 22% or about 17 billion tons per year and about 20 billion tons per year by 2020.
d. Hydrocarbons (HC). Compounds consisting entirely of Hydrogen and Carbon, for example Methane (CH4) or usually chemical compounds with the suffix -ane. In the case of diesel emissions, non-methane hydrocarbons (NMHC) are considered. HC are flammable and useful as fuel. In the atmosphere, they react with Oxygen to form other compounds, like CO2 and water. During combustion in a diesel engine, some amount of HC escapes unburned as exhaust. This occurs at insufficiently low temperatures near the cylinder walls. The amount increases with irregular burning, typically at light loads, accelerating rapidly and repeatedly, poor fuel injection, and other variable reasons. Large amounts of CO2 accelerates the greenhouse gas effect on global warming. HC are almost a main contributor in ground level ozone, and transportation produces 50% of ground level ozone. Table 7.1 shows non methane hydrocarbon (NMHC) levels for Tier 4 diesel engines.
19 | P a g e

The Pennsylvania State UniversityUniversity Park Campus
Freight; Fuel & Emissions
7.2 Diesel Emission Reduction Strategies. This section reviews three main after treatments to reduce emissions. Diesel oxidation catalyst (DOC) to reduce Carbon Monoxide and Hydro Carbons. Diesel particulate filter (DPF) to reduce particulate matter. Selective catalytic reduction (SCR) to reduce Nitrogen Oxides.
Diesel Oxidation Catalyst: The main purpose of DOC’s is to oxidize HC and CO emissions into H2O and CO2 respectively. This can also help, in conjunction with other methods, to reduce particulate matter and NOx production. There is some O2 concentration in diesel exhaust emissions and the DOC catalyzes the remaining O2 to react with HC and CO. The DOC’s efficiency increases with increased temperature, and so does the DPF which typically takes exhaust from the DOC. Temperature increase with oxidizing HC and CO. The DOC chamber is wash-coated with noble metals, i.e. Platinum (Pt) and Palladium (Pd), to reduce catalyst sintering. The important factors in DOC’s are ones that contribute to heating, and thus efficiency, such as volume, shape, conversion efficiency, temperature efficiency, etc.
DOC’s were introduced in the 1970’s and are common in most diesel engines. They can reduce HC and CO emissions by an estimated 60-90%. The most popular versions contain higher concentrations of Platinum and Palladium. One of the drawbacks of DOC’s is that the reaction also produces SOx (Sulfur oxides), which there aren’t after-treatment devices to remove, and which can damage after-treatment devices that come after the DOC.
The criteria for HC and CO emissions are the same for Tier 2 and Tier 3, and would only be met for Tier 4 at 77% reduction. Also, with current sulfur content regulations for diesel fuel it would remain within the Tier 3 limit, but not the Tier 4 emission standard.
Figure 7.1 (DOC illustration from)
Diesel Particulate Filter: The increased temperature from the DOC prior to the DPF generate pressure to force the exhaust emissions through a membrane that acts like a mechanical filter removing particles from the exhaust. The channels of the DPF are plugged forcing exhaust through the membranes. The filters have thin, parallel walls. As exhaust is forced through them, the particles diffuse and “stick” to the membranes. The walls are designed to allow air to easily and efficiently pass through while filtering particles. Eventually, the walls of the DPF get backed up with particulate matter, which
20 | P a g e
The Pennsylvania State UniversityUniversity Park Campus
Freight; Fuel & Emissions
needs to be burned off to regenerate the DPF. Having a backed up DPF can reduce fuel efficiency, and can even cause engine failure. This burning usually occurs as soon as the DPF hits a set limit, or by depositing a catalyst in the DPF trap that can cause burning of the excess particulate matter.
The DPF reduces PM emissions by 90%. Installed on a Tier 2 vehicle, that would put emissions at .01 ppm of PM, which, referring to table 7.1b, meets EPA standards for Tier 4 large diesel engines.
Figure 7.2 (Example of a DPF from www.bowmannz.com)
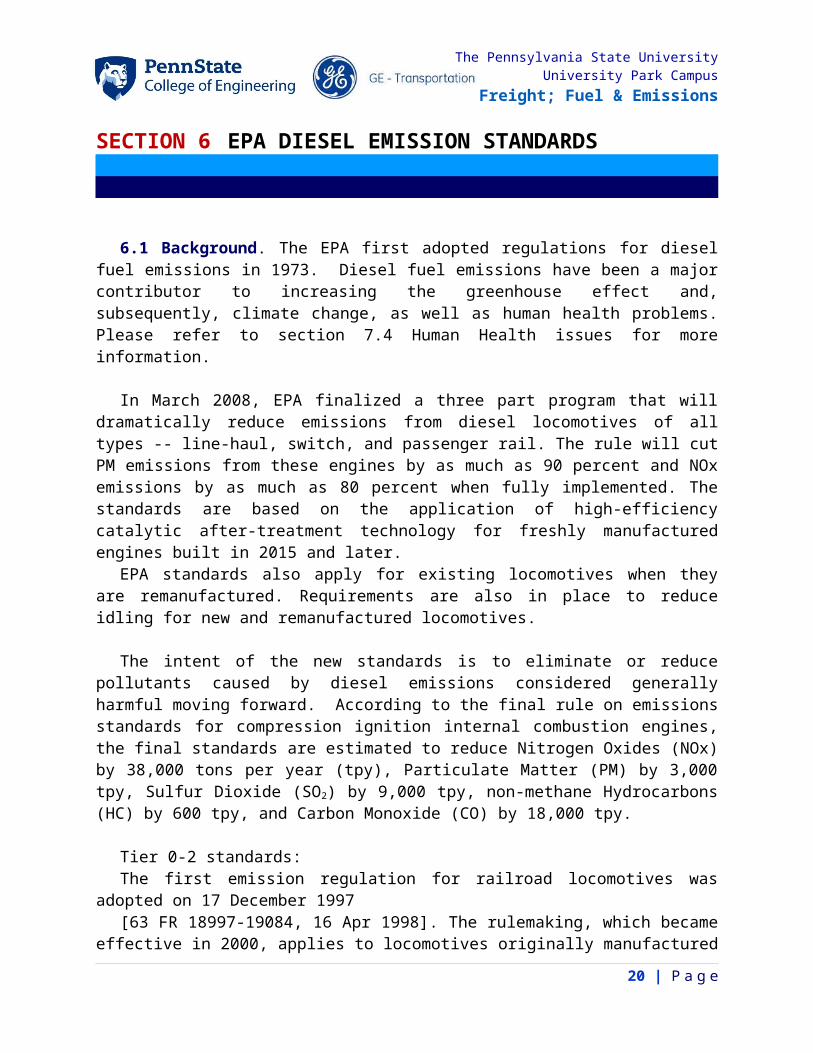
Continuously Regenerating Trap: A continuously regenerating trap (CRT) converts CO and HC to CO2 and H2O. It effectively reduces PM, CO, and HC emissions by 95%, putting those emissions within the Tier 4 regulations.
The system is a catalytic converter combined with a particulate “filter”. The first consists of a platinum oxidation catalyst, that oxidizes CO, HC, and NO to CO2, H2O, and NO2, removing 95% of CO and HC emissions. This chamber disperses exhaust evenly, and in the next chamber NO2 oxidizes Carbon from the particulate matter into CO2 and NO (which then oxidizes back into NO2 hence the continuously descriptor), along with an ultra-fine ceramic filter to remove PM. This filter reduces a small amount of NOx and would to be used in conjunction with another device such as selective catalytic reduction.
21 | P a g e

The Pennsylvania State UniversityUniversity Park Campus
Freight; Fuel & Emissions
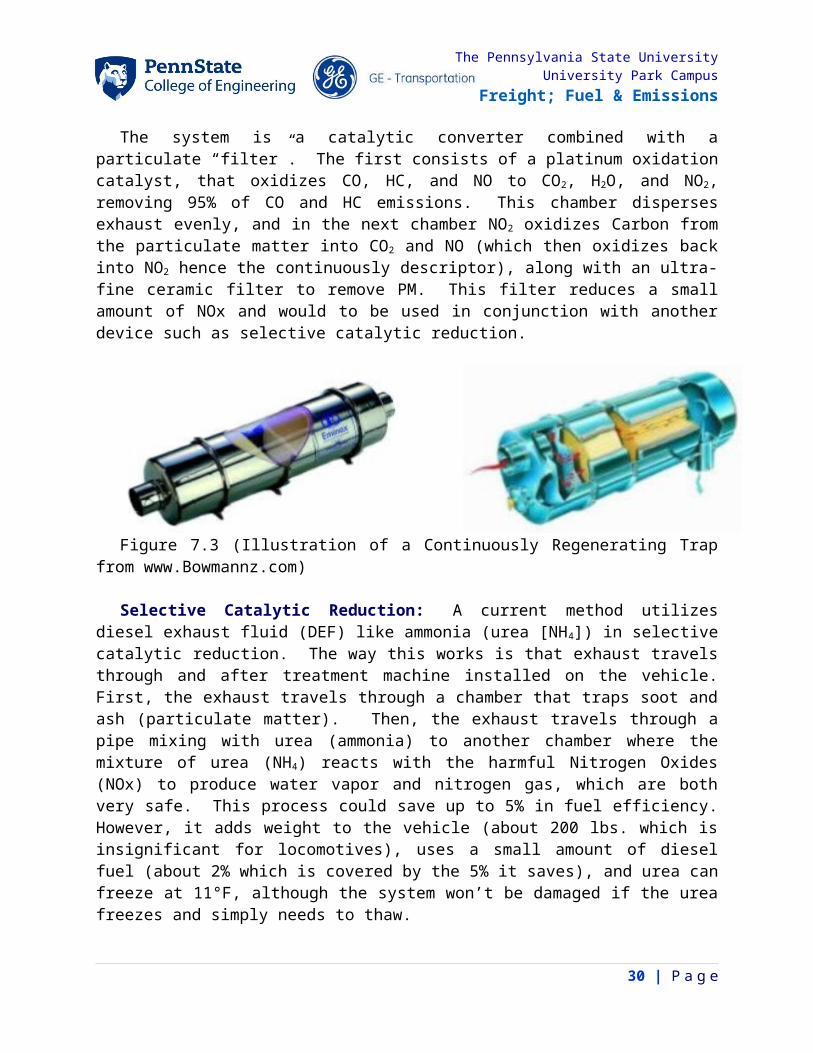
Figure 7.3 (Illustration of a Continuously Regenerating Trap from www.Bowmannz.com)
Selective Catalytic Reduction: A current method utilizes diesel exhaust fluid (DEF) like ammonia (urea [NH4]) in selective catalytic reduction. The way this works is that exhaust travels through and after treatment machine installed on the vehicle. First, the exhaust travels through a chamber that traps soot and ash (particulate matter). Then, the exhaust travels through a pipe mixing with urea (ammonia) to another chamber where the mixture of urea (NH4) reacts with the harmful Nitrogen Oxides (NOx) to produce water vapor and nitrogen gas, which are both very safe. This process could save up to 5% in fuel efficiency. However, it adds weight to the vehicle (about 200 lbs. which is insignificant for locomotives), uses a small amount of diesel fuel (about 2% which is covered by the 5% it saves), and urea can freeze at 11°F, although the system won’t be damaged if the urea freezes and simply needs to thaw.
An SCR reduces NOx emissions by 95% putting it within the requirements for Tier 4 diesel engines.
Figure 7.4 (Illustration of a Selective Catalytic Reducer from www.Bowmannz.com)
After Treatment ConsiderationsThese devices are relatively cheap and quickly installed, compared to purchasing a new
locomotive or remanufacturing an old one. After treatment can bring regulated diesel exhaust emissions within Tier 3 standards easily, and even Tier 4 except for SOx emissions. However, the parts themselves are made of expensive materials, and expensive if frequent maintenance or replacement are necessary. Some devices will not operate properly and
22 | P a g e

The Pennsylvania State UniversityUniversity Park Campus
Freight; Fuel & Emissions
could deteriorate more rapidly at low temperatures (SCR: urea can freeze at 11℉), low outputs (DOC: low temperatures and pressure from low outputs would decrease efficiency), or under high stress (DPF: will not regenerate filter properly). Although it would be a viable quick, temporary solution for limiting diesel emissions to Tier 3 standards until overhauling them to Tier 4 standard engines.
7.3 Alternate Fuels. Using alternative fuels such as natural gas, biodiesel, methyl alcohol, electric hybrid engines, etc., can completely reduce or eliminate these pollutants.
Electric and Hybrid Electric:Freightliner Custom Chassis Corporation, a Daimler Trucks Company in Gaffney, SC
began construction of an all-electric freight truck chassis. It is the first all-electric freight vehicle of its class. It uses a Tesla lithium-ion battery, which can travel 100 miles on one charge. However, it takes 6-8 hours to charge. The battery is regenerated somewhat during travel by the truck’s braking system. Energy from braking is stored in the batteries rather than lost to heat. The range of these trucks is limited, and they are best used as delivery vehicles for quick, local trips with lots of braking. Electric motors have no pollution during use. Consider, however, the hazards of disposing old or damaged batteries, and the environmental impact associated with creating each battery. Figure 7.5 illustrates a drawing of an electric chassis.
Figure 7.5 (Electric Light-freight Truck Chassis)
Hybrid electric/diesel freight trucks operate alternatively on diesel and electric battery power. The battery, like in the electric truck, is regenerated somewhat by braking. They reduce fuel consumption by 35%, and sometimes more under the right conditions. The hybrid trucks are also more efficient for quick, local trips with lots of braking. Hybrid vehicles blend existent diesel systems with electric battery (lithium-ion, lead-acid, etc.) power. Because of the reduction in fuel use, emissions are drastically reduced as well. Figure 7.6 illustrates a hybrid electric/diesel freight truck.
Converting to electric or hybrid electric freight trucks could be useful and realistic in the scope of this project since waterways and railroads provide long haul transportation, it
23 | P a g e

The Pennsylvania State UniversityUniversity Park Campus
Freight; Fuel & Emissions
could be possible to limit transportation via freight truck locally by providing access for local vendors to waterway harbors and railroad depots. Shorter trips in traffic are perfect for electric vehicles. However, it would not be practical for long distance shipping.
Figure 7.6 (Electric/diesel hybrid freight truck)
Natural Gas According to the Center for American Progress, natural gas can reduce carbon
emissions by as much as 25% from diesel. Natural gas has a low energy content compared to gasoline and, as used in freight, comes as compressed natural gas (CNG) or liquefied natural gas (LNG) to condense more energy into an economical volume.
CNG gets about the same fuel economy as gasoline on a gallon of gasoline equivalent basis. One gallon of gasoline equivalent is about 5.7 pounds of CNG. LNG is made by reducing the temperature to -260℉. More gas can be stored in a smaller volume, and give a larger range of travel. One gallon of gasoline is about 1.5 gallons of LNG. However, storage can be complicated with LNG. It has to be kept at low temperatures using double-wall, vacuum insulated tanks, and after sometime may begin to vaporize as the temperature increases, which necessitates venting or use. The costs associated with liquefying, containing, and storing LNG makes it more expensive than CNG. LNG has the highest octane rating of alternative fuels at 130.
BiodieselBiodiesel fuel is produced by natural renewable resources, and can replace or partially
replace diesel fuel. It is made from plant and animal byproducts and oils. It is readily accessible in food processing wastes much like homemade diesel pick-up trucks that run on discarded vegetable oil from restaurants. It is made through a chemical process, by introducing Potassium Hydroxide and Methanol to the oils. This process produces glycerin, which can be used for soap and pharmaceuticals, and biodiesel. Biodiesel produces significantly less carbon and other pollutants than traditional diesel fuel. It can be used in any diesel internal combustion engine with little or no modification. “If the biodiesel is B20 or less then no modifications need to be made to the engine, but if a higher concentration is
24 | P a g e

The Pennsylvania State UniversityUniversity Park Campus
Freight; Fuel & Emissions
used then the fuel lines, gaskets, and fuel pump seals need to be modified because biodiesel has been shown to deteriorate these.” (Chris Pagliaro, WordPress.com). It can also be mixed with regular diesel fuel.
Biodiesel is the only alternative fuel to have complete US EPA emissions tests as of April, 2011. The results show pure biodiesel has 67% less HC, 48% less CO, and 47% less PM. However, it has some drawbacks. It has a slightly higher price per gallon than gasoline. At low temperatures ( 0≅ ℃), it thickens and can stop flowing. This can be prevented to a point with additives to lower the freezing point. It can also deteriorate engine and fuel injection components not made for biodiesel over a long lifetime.
With extremely reduced pollutant emissions from biodiesel, and little or no need to convert engines, biodiesel would be a good candidate for this project.
Alternative Fuel ConsiderationsSince railroad freight using diesel engines is already established, the size of this project
would likely be too great to convert all diesel locomotives to fuels alternative to diesel. The scope of converting each vehicle, or at least fueling stations to an alternative fuel is greater than other solutions, such as upgrading locomotives, buying new ones, or using other transportation like barges and freight trucks.
7.4 Human Health Issues. Diesel fuel emissions are a major contributor to greenhouse gases’ effect on climate change. Carbon Monoxide, Nitrogen Oxides, Hydrocarbons, and Particulate Matter are the primary pollutants in diesel fuel emissions. EPA regulations are meant to mitigate some of these effects. The World Health Organization (WHO) estimates that air pollution causes billions of dollars in medical costs and lost productivity, and millions of deaths (2.4 million), especially in the developing world. Approximately 20-30% of pollution comes from transportation. According to some studies, exposure to diesel fuel emissions can cause cancer in humans. It also causes lung damage and respiratory problems.
25 | P a g e

The Pennsylvania State UniversityUniversity Park Campus
Freight; Fuel & Emissions
SECTION 8 LOCOMOTIVE FLEET UPGRADE
8.1 Alternatives.
i. Sell existing fleet and purchase new locomotives ii. Upgrade fleet with exhaust after-treatment hardware
iii. Utilize alternate fuels (Biodiesel, CNG, LNG, etc.) which may produce less NOx, CO, HC, and PM.
iv. Utilize other modes of transportation (by truck, sea, air, etc.)
8.2 Existing Fleet Make-Up. NOTE: Assume:
i. Fleet consists of the following locomotivesii. Locomotives are rebuilt at 750,000 mile intervals.
No. of Existing
Locomotives
Locomotive Group
Designation
Assumed Existing Locomotive Mileage
Range
Assumed Existing Diesel
Type
10 A <150,000 Tier 2
10 B >150,000 and <300,000 Tier 2
10 C >300,000 and <450,000 Tier 2
10 D >450,000 and < 600,000 Tier 2
10 E >600,000 and <750,000 Tier 2
8.3 Investment Data.
Diesel Locomotive Upgrade
Tier II -> Tier III: $750k x 15 locomotives
After-treatment: $100k x 15 locomotives
Total: $12.75M
New Locomotive
Tier IV Locomotive: $4M x 25 locomotives
26 | P a g e

The Pennsylvania State UniversityUniversity Park Campus
Freight; Fuel & Emissions
Total: $100M
Barge Tow
Towboat with 3000 horsepower: $3M x 2
Barge: $750k x 30 barges
Total: $28.5M
Selling Locomotives
Old Tier II Locomotives: $1.5M x 35 locomotives
Total: $52.5M
Grand Total: $88.75M
8.4 Upgrade Strategy. The primary objective for the upgrade was to minimize cost and emissions. The best solution involved a compromise between the two. Since new Tier III locomotives were much more expensive than upgrading Tier II locomotives to Tier III, all Tier III trains in the final fleet would be upgraded instead of bought. All locomotives that were not upgraded to Tier III would be brand new Tier IV locomotives. A graph was constructed to show the relationship between the number of Tier III and Tier IV locomotives and the cost and emissions associated with them (see Table 8.2). Where the lines intersect shows the combination of Tier III and IV locomotives that would be the most cost efficient and environmentally friendly. This point was 25 locomotives upgraded to Tier III and 25 brand new Tier IV locomotives. Two barge tows were included in the final fleet because they are low on emissions and are relatively cheap for how much cargo they can hold. The 2 barge tows hold enough cargo to replace 10 Tier II locomotives that would have been upgraded to Tier III. These Tier III locomotives were replaced by barge tows instead of Tier IV locomotives because this solution is more eco-friendly. The 15 locomotives with the lowest mileage will be upgraded from Tier II to Tier III. The 35 highest mileage locomotives will be sold for $1.5M each. 25 new Tier IV locomotives will be added to the fleet, for a total of 40 locomotives. The 10 remaining locomotives will be replaced by 2 towboats with 15 barges each. The new Tier IV locomotives and barge tows are more eco-friendly, while upgrading from Tier II to Tier III locomotives is more cost-efficient.
Table 8.2 Cost and NOx Emissions versus Number of Upgraded Tier III and New Tier IV Locomotives
27 | P a g e

The Pennsylvania State UniversityUniversity Park Campus
Freight; Fuel & Emissions
8.5 Upgrade Schedule and Costs. The upgrade would cost a net estimate of $88.75 million. This cost can be split into multiple sections: upgrading Tier II Locomotives to Tier III, buying new Tier IV locomotives, and buying the two barge tows. Everything will be paid for in a term of four years. The first year will include the cost of upgrading the 15 Tier II locomotives to Tier III. This would cost $12.75 million for the first year. Buying the Tier IV locomotives will be the largest expense, which is why this will be completed over the second and third years. The first of the two years will be spent selling 12 Tier II locomotives and using that money to purchase 12 Tier IV locomotives. This would be a net total of $30 million. The next year would involve selling another 13 Tier II locomotives and buying 13 Tier IV locomotives for a total of 25 Tier IV locomotives. This would be a net total of $32.5 million for the third year. The fourth and final year would consist of selling the last 10 Tier II locomotives and purchasing the 2 barge tows. The net total for the fourth year would be $13.5 million. This plan was made with the intention of having a two year return on the investment, which would mean $88.75 million in profit would be generated within two years after the final fleet is assembled. Since it will take four years to fully assemble the fleet, this assumes a yearly profit of $14.8 million for six years.
SECTION 9 SUMMARY
Section 2 introduces the project by summarizing some important background information, project details and the problem we are to solve. It then discusses alternate methods of transporting freight (train, barge, and truck) and the advantages and disadvantages of using each. Each mode of transportation seems to have their unique advantages and
28 | P a g e

The Pennsylvania State UniversityUniversity Park Campus
Freight; Fuel & Emissions
disadvantages. It really depends on the situation in which the advantages or disadvantages may weigh more heavily. For this project, however, it seems that the truck is at a bigger disadvantage considering it is the least environmentally friendly and its small cargo capacity. The barge seemed to come as an advantage since unlike the truck, it is most environmentally friendly and can carry the most cargo.
Section 3 discusses the ASCE Report Card for Pennsylvania’s infrastructure. It goes into detail explaining what the ratings mean as far as safety concerns and how the general public should be aware. The overall rating given to the Commonwealth’s infrastructure is a C-, with roads and bridges having a rating of a D-, inland waterways having a rating of a D+, and the freight rail system having a rating of B.
Section 4 compares cargo capacity, equivalent units, and equivalent lengths of five different modes of transporting freight: one barge, one 15 barge tow, one bulk type railroad car, one boxcar type railroad car, one 100 car train unit, and one highway truck trailer. It is clear that the barges can hold several times as much cargo than can a train, and can hold even more cargo than a truck could.
Section 5 discusses the costs of transporting freight by different means of transportation. It also discusses the transportation solution as well as the solutions operational constraints, the amount of greenhouse gases emitted per means of transport, statistics of injuries and deaths caused by each type of transport, and the amount of freight transported per day. In order to transport 165,000 tons of freight in and out of Pittsburgh daily, a combination of transportation systems will be used. Five mineral trains, as well as 12 freight trains will be implemented in the new system by selling 35 Tier 2 locomotives to buy 25 new Tier 4 locomotives and overhauling 15 Tier 2 locomotives to be upgraded to Tier 3 status. Two tow barges will also be included in the transportation system. With this combination of rail and water transport the system can transport 189,000 tons of freight per day.
Section 6 discusses the EPA’s diesel exhaust emissions. The standards began in 1973. As of 1997, more stringent standards were created that would gradually modify diesel engines to meet the EPA’s Tier 2 standards. The previous standards (1973 to 2001) became Tier 0, and Tier 1 standards officially became effective from 2002-2004, and Tier 2 followed in 2005. In 2008, new standards were created that would start a Tier 3, and gradually move toward Tier 4 standards. Tier 3 standards became effective in 2012, and Tier 4 in 2015. The Tier 4 standards require exhaust after treatment technology. All engines manufactured or remanufactured from 2015 onward will need to meet Tier 4 standards.
Section 7 discusses the chemistry of diesel exhaust pollutants, after treatment technologies to reduce pollutant emissions, alternatives to diesel fuel, and the impacts of diesel pollutants on human and global health. There are 4 main pollutants in diesel exhaust
29 | P a g e

The Pennsylvania State UniversityUniversity Park Campus
Freight; Fuel & Emissions
emissions which are regulated by the EPA’s standards: NOx (Nitrogen Oxides) which contribute to smog, algal blooms, acid rain, and can be toxic; CO (Carbon Monoxide) which is toxic and turns to carbon dioxide in the atmosphere, a greenhouse gas; PM (Particulate Matter) which is soot, ash, smoke, etc., and is carcinogenic and causes lung damage; and HC (hydrocarbons) which are unburned hydrocarbons from the fuel and can cause ground level ozone and create excess carbon dioxide. The after treatment technologies discussed are DPF (diesel particulate filter), DOC (diesel oxidation catalyst), SCR (selective catalytic reducer), and CRT (continuously regenerating trap). These devices are often used in conjunction with each other, and can reduce all diesel exhaust emissions to within Tier 4 standards, except for SOx (sulfur oxides) which are regulated in fuel. Alternative fuels discussed are electricity, natural gas, and biodiesel. Electric and electric hybrid motors would eliminate exhaust emissions. Natural gas would reduce emissions beyond Tier 4 standards, however, vehicles would have to be converted and it can be difficult to store. Biodiesel would reduce exhaust emissions with little or no conversion necessary, however, it costs about $1 per gallon more than regular diesel and can deteriorate the fuel injection system. The exhaust emissions are not only carcinogenic, toxic, or damaging to humans; but contribute to smog and greenhouse gases that accelerate global warming. Transportation is responsible for 22% of the world’s CO2 emissions, 40-70% of the world’s NOx emissions, and an estimated 20-30% of the world’s harmful emissions.
Section 8 discusses the upgrade strategy, cost, and schedule for the solution. The solution involves upgrading 15 Tier II locomotives to Tier III, buying 25 Tier IV locomotives, buying 2 barge tows, and selling the 35 Tier II locomotives that will not be upgraded. The locomotives that will be upgraded will be those with the lowest mileage, and the locomotives that will be sold will be those with the highest mileage. This solution was the best balance of being cost effective and environmentally friendly. This solution has a final cost of $88.75 million, and will be implemented in parts over a four year period.
30 | P a g e
The Pennsylvania State UniversityUniversity Park Campus
Freight; Fuel & Emissions
SECTION 10REFERENCES
Section 2:
"Shipping Comparisons." For Business Industry RSS. N.p., n.d. Web. 02 Dec. 2015. http://business.tenntom.org/why-use-the-waterway/shipping-comparisons/
"MAERSK PITTSBURGH Current Position (IMO 9342176) | VesselFinder." MAERSK PITTSBURGH Current Position (IMO 9342176) | VesselFinder. N.p., n.d. Web. 02 Dec. 2015. https://www.vesselfinder.com/?imo=9342176
AOPOA Online. (n.d.). Retrieved November 25, 2015, from http://www.aopoa.net/shipping_faqs.html
Torrey, W., & Murray, D. (2014, September 1). An Analysis of the Operational Costs of Trucking: A 2014 Update. Retrieved November 25, 2015, from http://www.atri-online.org/wp-content/uploads/2014/09/ATRI-Operational-Costs-of-Trucking-2014-FINAL.pdf
Section 3:
Bridges. (n.d.). Retrieved November 27, 2015, from http://pareportcard.org/PARC2014/downloads/PA_2014_RC_Bridges.pdf
Federal Marine Highway Corridor M-70. (n.d.). Retrieved November 27, 2015, from http://www.port.pittsburgh.pa.us/index.aspx?page=241
Freight Rail. (n.d.). Retrieved November 27, 2015, from http://pareportcard.org/PARC2014/downloads/PA_2014_RC_Rail.pdf
Inland Waterways. (n.d.). Retrieved November 27, 2015, from http://pareportcard.org/PARC2014/downloads/PA_2014_RC_Inland_Waterways.pdf
Pennsylvania's Infrastructure Matters. (n.d.). Retrieved November 27, 2015, from http://pareportcard.org/index.php
Roads. (n.d.). Retrieved November 27, 2015, from http://pareportcard.org/PARC2014/downloads/PA_2014_RC_Roads.pdf
31 | P a g e

The Pennsylvania State UniversityUniversity Park Campus
Freight; Fuel & Emissions
Section 4:
Compare. Des Moines, IA: River Transportation Division, Iowa Dept. of Transportation, 1981. Iowa Department of Transportation. Web. http://www.iowadot.gov/compare.pdf
Section 5:
5.1:
Bureau of Labor Statistics, U.S. Department of Labor, Occupational Outlook Handbook, 2014-15 Edition, Heavy and Tractor-trailer Truck Drivers,
on the Internet at http://www.bls.gov/ooh/transportation-and-material-moving/heavy-and-tractor-trailer-truck-drivers.htm (visited November 01, 2015).
Torrey, W., & Murray, D. (2014, September 1). An Analysis of the Operational Costs of Trucking: A 2014 Update. Retrieved November 25, 2015, from http://www.atri-online.org/wp-content/uploads/2014/09/ATRI-Operational-Costs-of-Trucking-2014-FINAL.pdf
5.2:
Gonzales, D., Searcy, E., & Eksioglu, S. (2013, January 3). Cost analysis for high-volume and long-haul transportation of densified biomass feedstock. Retrieved November 25, 2015, from https://www.cavs.msstate.edu/publications/docs/2013/03/11509TRA_Eksioglu.pdf
AOPOA Online. (n.d.). Retrieved November 25, 2015, from http://www.aopoa.net/shipping_faqs.html
5.3:
AOPOA Online. (n.d.). Retrieved November 25, 2015, from http://www.aopoa.net/shipping_faqs.html
Analysis of Freight Rail Rates for U.S. Shippers. (2014, March 1). Retrieved November 27, 2015, from http://www.americanchemistry.com/Policy/Rail-Transportation/Full-Report-Analysis-of-Freight-Rail-Rates-for-US-Shippers.pdf
32 | P a g e

The Pennsylvania State UniversityUniversity Park Campus
Freight; Fuel & Emissions
5.5b:
Bureau of Labor Statistics, U.S. Department of Labor, Occupational Outlook Handbook, 2014-15 Edition, Heavy and Tractor-trailer Truck Drivers,
on the Internet at http://www.bls.gov/ooh/transportation-and-material-moving/heavy-and-tractor-trailer-truck-drivers.htm (visited November 01, 2015).
Bureau of Labor Statistics, U.S. Department of Labor, Occupational Outlook Handbook, 2014-15 Edition, Railroad Occupations,
on the Internet at http://www.bls.gov/ooh/transportation-and-material-moving/railroad-occupations.htm (visited October 31, 2015).
Bureau of Labor Statistics, U.S. Department of Labor, Occupational Outlook Handbook, 2014-15 Edition, Water Transportation Occupations,
on the Internet at http://www.bls.gov/ooh/transportation-and-material-moving/water-transportation-occupations.htm (visited October 31, 2015).
5.5c:
AOPOA Online. (n.d.). Retrieved November 25, 2015, from http://www.aopoa.net/shipping_faqs.html
Shipping Comparisons. (n.d.). Retrieved November 27, 2015, from http://business.tenntom.org/why-use-the-waterway/shipping-comparisons/
5.5d:
Freight Transportation. (n.d.). Retrieved November 27, 2015, from http://www.c2es.org/technology/factsheet/FreightTransportation
Shipping Comparisons. (n.d.). Retrieved November 27, 2015, from http://business.tenntom.org/why-use-the-waterway/shipping-comparisons/
Section 6:
"US emission standards for railway locomotives." US Code of Federal Regulations CFR.40: 85,89,92. Web. 1 Dec. 2015.
Environmental Protection Agency. Nonroad Engines, Equipment, and Vehicles. EPA, 9 May 2014. Web. 2 Dec. 2015. http://www3.epa.gov/otaq/locomotives.htm.
33 | P a g e

The Pennsylvania State UniversityUniversity Park Campus
Freight; Fuel & Emissions
"Standards of Performance for Stationary Compression Ignition Internal Combustion Engines." [EPA-HQ-OAR-2005-0029, FRL- RIN 2060-AM82] CFR .40: 60,85,89,94,1039,1065,106. Print.
"US EPA Clean Air Nonroad Diesel Regulation." MECA.org. EPA, 11 May 2014. cms.psu.edu. Web. 3 Dec. 2015. http://www.meca.org/regulation/us-epa-clean-air-nonroad-diesel-rule
Section 7:
U.S. Environmental Protection Agency (EPA). (2002) Health assessment document for diesel engine exhaust. Prepared by the National Center for Environmental Assessment, Washington, DC, for the Office of Transportation and Air Quality; EPA/600/8-90/057F. Available from: National Technical Information Service, Springfield, VA; PB2002-107661, and http://www.epa.gov/ncea
Resitoglu, Ibrahim A., Kemal Altinisik, and Ali Keskin. "The pollutant emissions from diesel-engine vehicles and exhaust aftertreatment systems." Clean Tech Environmental Policy 17 (2014): 15-27. Print.
7.2
Zhang, Johnathan. "Diesel Emission Technology - Part II of Automotive After Treatment System." Bowmannz (2010). Web. 4 Dec. 2015. http://bowmannz.com/research
7.3:
"CATA Compressed Natural Gas Program." CATA Compressed Natural Gas Program. Web. 1 Dec. 2015. http://www.catabus.com/AboutCATA/CNGProgram/index.html
Pagliaro, Chris. "The Chemistry of the Diesel Engine." WordPress.com, 29 Nov. 2012. Web. 2 Dec. 2015. https://chembloggreen1.wordpress.com/page/2/.
Bachman, Kate. 6 Alternatives to Diesel for Freight Transport. Sustainable Manufacturer Network, 12 Apr. 2011. Web. 2 Dec. 2015. http://sustainablemfr.com/air-emissions/6-alternatives-diesel-freight-transport
Section 8:
34 | P a g e

The Pennsylvania State UniversityUniversity Park Campus
Freight; Fuel & Emissions
"Frequently Asked Questions on the Inland Waterways Navigation System."Coosa-Alabama
River Improvement Association, Inc. Web. 1 Dec. 2015. http://www.caria.org/iwns_faq.html
"Estimating Transport Costs." Cambridge Systematics, Inc.: 1-23. Print.
"Frequently Asked Questions." SEDTAPP. Pennsylvania State University. Web. 1 Dec. 2015. http://sedtapp.psu.edu/design/design_projects/edsgn100/fa15/faq.html
35 | P a g e

36 | P a g e
Related Documents