Views on the U.S. Housing Market Prepared: May 15, 2012 Overview The deflating of the U.S. housing bubble was a primary driver of the 2008-2009 financial crises. As of January 2012, the decline in housing prices has been 34% since the 2006 peak, according to S&P/Case-Shiller 20 City Composite. In the meantime, U.S. economic growth remains below potential expectations and this condition is likely to persist until the housing market finds some solid footing. While much has been made this spring about a full recovery in the housing market, we are much more sanguine in our view. We see the strong positives of affordability and improving builder sentiment counterbalanced by still high delinquencies and vacancy rates. We believe time will be part of the solution as it affords lenders the ability to get through the foreclosure backlog, and perhaps implement novel solutions such as “rent to foreclose.” Time may also allow for greater recovery in employment and for foreclosed properties to provide supply to the growing rental market. Over the next two years, we believe the pace of decline in housing prices should stabilize and housing inventories should normalize. We are likely to see improving homebuilder activity, especially targeted at the rental market. At this point, we feel housing will likely become a positive contributor to economic growth in the near future. Housing prices have fallen significantly below long-term trends and many homes may be quite undervalued. Real Housing Prices Important disclosures provided on page 3. Situation Analysis 400 350 300 250 200 150 100 50 0 1980 Quarterly U.S. House Price Index 1975 1985 1990 1995 2000 2005 Dec 2011 2010 Trendline Source: Federal Housing Finance Agency (FHFA); data through December 2011

Welcome message from author
This document is posted to help you gain knowledge. Please leave a comment to let me know what you think about it! Share it to your friends and learn new things together.
Transcript
Views on the U.S. Housing MarketPrepared: May 15, 2012
OverviewThe deflating of the U.S. housing bubble was a primary driver of the 2008-2009 financial crises. As of January 2012, the decline in housing prices has been 34% since the 2006 peak, according to S&P/Case-Shiller 20 City Composite. In the meantime, U.S. economic growth remains below potential expectations and this condition is likely to persist until the housing market finds some solid footing. While much has been made this spring about a full recovery in the housing market, we are much more sanguine in our view. We see the strong positives of affordability and improving builder sentiment counterbalanced by still high delinquencies and vacancy rates. We believe time will be part of the solution as it affords lenders the ability to get through the foreclosure backlog, and perhaps implement novel solutions such as “rent to foreclose.” Time may also allow for greater recovery in employment and for foreclosed properties to provide supply to the growing rental market. Over the next two years, we believe the pace of decline in housing prices should stabilize and housing inventories should normalize. We are likely to see improving homebuilder activity, especially targeted at the rental market. At this point, we feel housing will likely become a positive contributor to economic growth in the near future.
Housing prices have fallen significantly below long-term trends and many homes may be quite undervalued.
Real Housing Prices
Important disclosures provided on page 3.
Situation Analysis
400
350
300
250
200
150
100
50
01980
Quarterly U.S. House Price Index
1975 1985 1990 1995 2000 2005 Dec2011
2010
Trendline
Source: Federal Housing Finance Agency (FHFA); data through December 2011
Important disclosures provided on page 3.
Page 2Views on the U.S. Housing Market
Situation Analysis
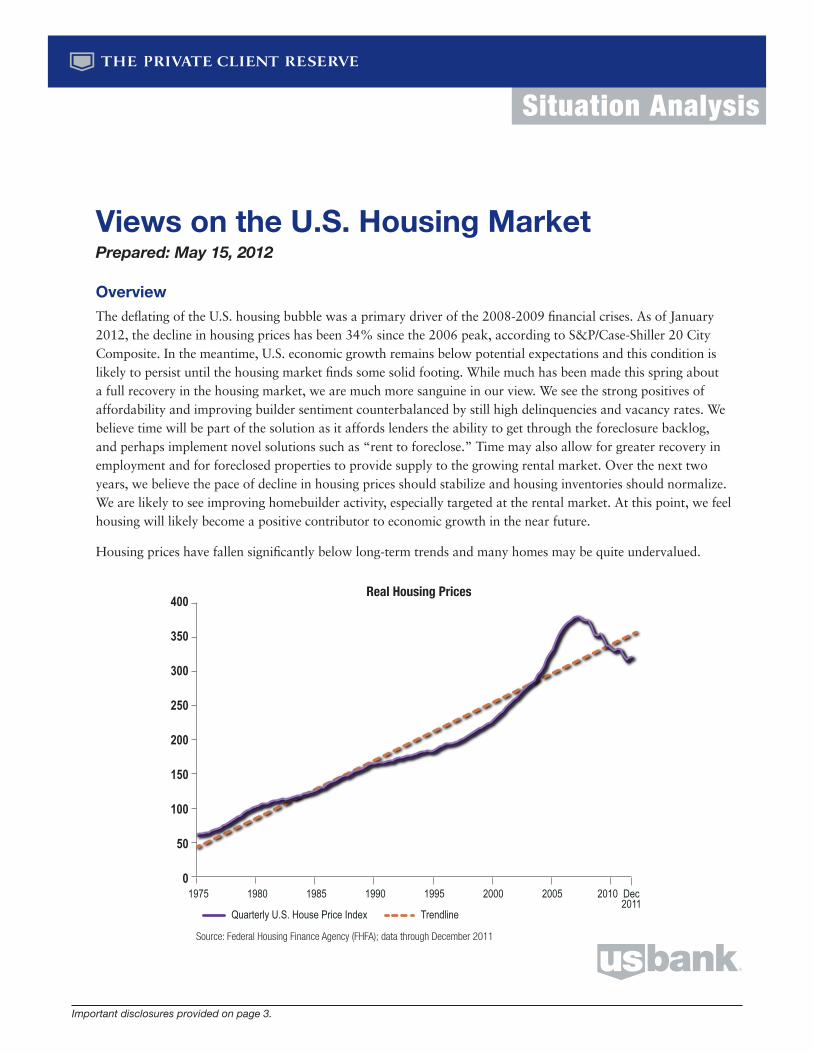
Housing affordability has skyrocketed, especially relative to rents. Constraints on household formation and relatively tight lending standards likely mean this condition will remain for some time.
Rent-to-Home Price Ratio vs.Housing Affordability
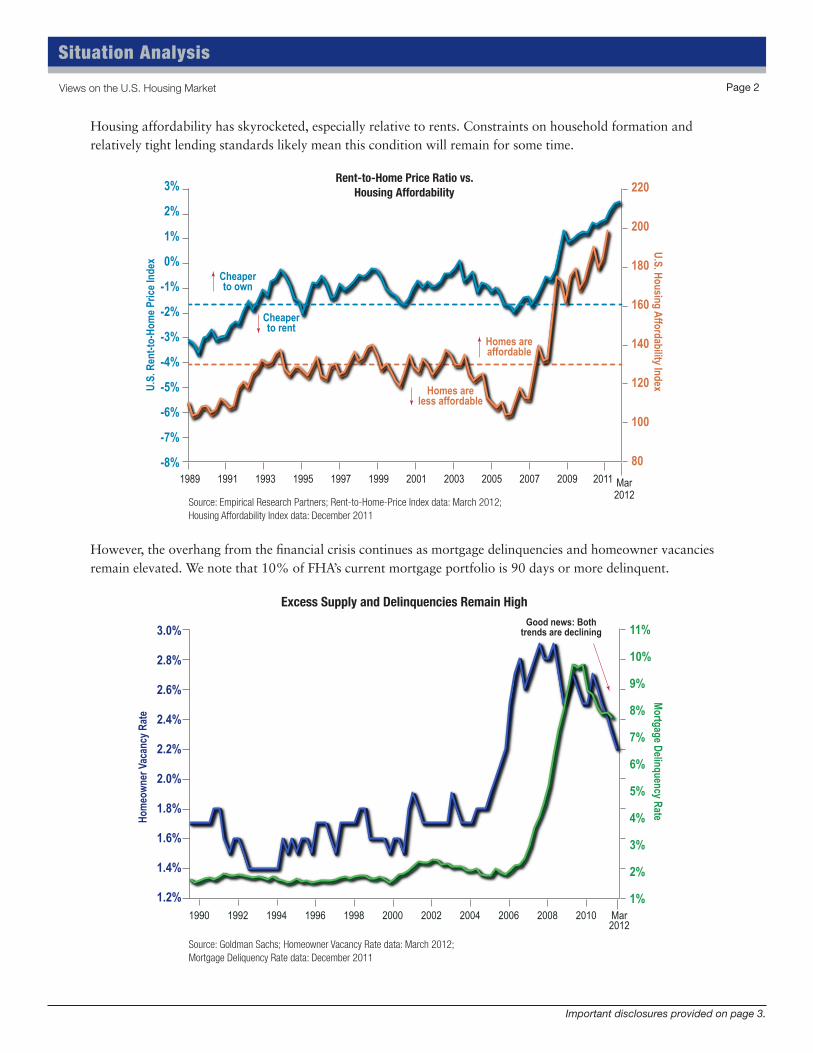
However, the overhang from the financial crisis continues as mortgage delinquencies and homeowner vacancies remain elevated. We note that 10% of FHA’s current mortgage portfolio is 90 days or more delinquent.
Excess Supply and Delinquencies Remain High
3%
2%
1%
0%
-1%
-2%
-3%
-4%
-5%
-6%
-7%
-8%
220
200
180
160
140
120
100
801989 1991
U.S
. Ren
t-to-
Hom
e Pr
ice
Inde
xU
.S. Housing A
ffordability Index
1993 1995 19991997 2003 20052001 2007 2011 Mar2012
2009
Cheaperto own
Cheaperto rent
Homes areaffordable
Homes areless affordable
3.0%
2.8%
2.6%
2.4%
2.2%
2.0%
1.8%
1.6%
1.4%
1.2%
11%
10%
9%
8%
7%
6%
5%
4%
3%
2%
1%1990 1992
Hom
eow
ner V
acan
cy R
ate
Mortgage D
elinquency Rate
1994 1996 20001998 2004 20062002 2008 Mar2012
2010
Good news: Bothtrends are declining
Source: Empirical Research Partners; Rent-to-Home-Price Index data: March 2012; Housing Affordability Index data: December 2011
Source: Goldman Sachs; Homeowner Vacancy Rate data: March 2012; Mortgage Deliquency Rate data: December 2011
Page 3Views on the U.S. Housing Market
Situation Analysis
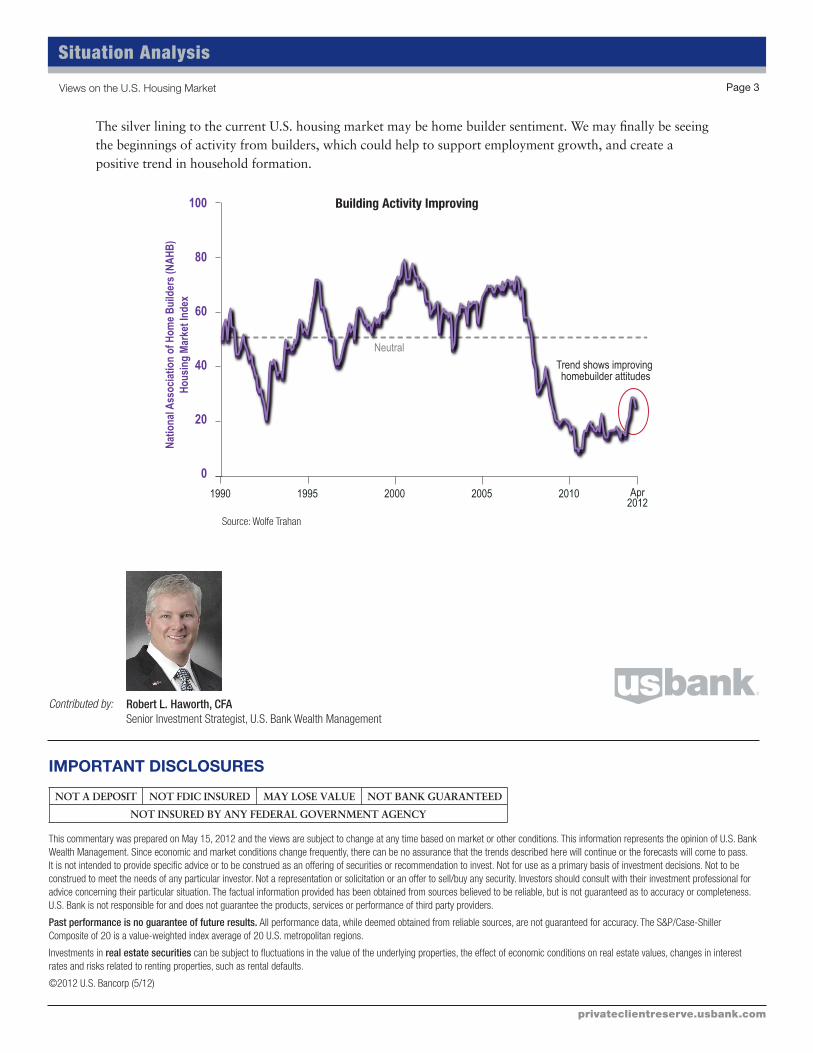
The silver lining to the current U.S. housing market may be home builder sentiment. We may finally be seeing the beginnings of activity from builders, which could help to support employment growth, and create a positive trend in household formation.
Building Activity Improving
IMPORTANT DISCLOSURES
This commentary was prepared on May 15, 2012 and the views are subject to change at any time based on market or other conditions. This information represents the opinion of U.S. Bank Wealth Management. Since economic and market conditions change frequently, there can be no assurance that the trends described here will continue or the forecasts will come to pass. It is not intended to provide specific advice or to be construed as an offering of securities or recommendation to invest. Not for use as a primary basis of investment decisions. Not to be construed to meet the needs of any particular investor. Not a representation or solicitation or an offer to sell/buy any security. Investors should consult with their investment professional for advice concerning their particular situation. The factual information provided has been obtained from sources believed to be reliable, but is not guaranteed as to accuracy or completeness. U.S. Bank is not responsible for and does not guarantee the products, services or performance of third party providers.
Past performance is no guarantee of future results. All performance data, while deemed obtained from reliable sources, are not guaranteed for accuracy. The S&P/Case-Shiller Composite of 20 is a value-weighted index average of 20 U.S. metropolitan regions.
Investments in real estate securities can be subject to fluctuations in the value of the underlying properties, the effect of economic conditions on real estate values, changes in interest rates and risks related to renting properties, such as rental defaults.
©2012 U.S. Bancorp (5/12)
privateclientreserve.usbank.com
Contributed by: Robert L. Haworth, CFASenior Investment Strategist, U.S. Bank Wealth Management
100
80
60
40
20
0
1990 1995 2000 2005 2010
Neutral
Trend shows improving homebuilder attitudes
Apr2012
Nat
iona
l Ass
ocia
tion
of H
ome
Bui
lder
s (N
AH
B)
Hou
sing
Mar
ket I
ndex
Source: Wolfe Trahan
Related Documents