In vivo biodistribution of fluorescent nanocolloids intended for drug delivery. Evaluation of PEGylation state and fluorophore incorporation approach. Silje Storås Milankovic. A thesis submitted in partial fulfilment of the requirements for the degree of Master of Pharmacy Centre for Pharmacy Department of Biomedicine University of Bergen 31.05.2012

Welcome message from author
This document is posted to help you gain knowledge. Please leave a comment to let me know what you think about it! Share it to your friends and learn new things together.
Transcript

In vivo biodistribution of fluorescent nanocolloids
intended for drug delivery.
Evaluation of PEGylation state and fluorophore incorporation approach.
Silje Storås Milankovic.
A thesis submitted in partial fulfilment of the requirements for
the degree of Master of Pharmacy
Centre for Pharmacy
Department of Biomedicine
University of Bergen
31.05.2012

- 1 -
Front illustration:
Left: NIR image overlaid on x-ray image of mouse injected with solid nanoparticles conjugated with
DY-700
Upper right: Confocal image of liver from mouse injected with solid nanoparticles conjugated to
rhodamine
Lower right: Confocal image of brown adipose tissue from mouse injected with solid nanoparticles
conjugated to rhodamine

- 2 -
Acknowledgments
This thesis is written as a partial fulfilment of the requirements for my degree in pharmacy.
The practical part was conducted from August 2011 to May 2012 at the Institute for
Biomedicine with support from the Faculty of Medicine and Dentistry and the Centre for
Pharmacy, University of Bergen.
First, I would like to thank my supervisors, Stein Ove Døskeland, Lars Herfindal and Emmet
McCormack for sharing their knowledge, and introducing me to such a fascinating area of
research. Your encouragement and many stimulating discussions are highly appreciated. I
would like to thank Lars Herfindal especially for all his help and good advice, for always
being available for questions and for excellent guidance during the writing of this thesis.
Many thanks go to Lene Vikebø for teaching me how to shave the animals, and a lot of
technical support during the imaging. You are outstanding! I would also like to thank all the
other lab personnel at the TSG lab for a fun and supportive work environment. I will miss you
all.
I would like to thank my fellow master students at the institute of Biomedicine for support,
understanding and good conversations during the year. I also have to thank all my fellow
pharmacy students, many close friends, for encouragement, support and for five great years
together.
Finally, a lot of gratitude goes to my husband Dragan Milankovic and our daughter Rebekka
for vital support, and for always believing in me. I also have to tank my father, Oskar Storås,
for driving me up to the mice at night on many occasions.
I could never have done this without any you!
Silje Storås Milankovic
Bergen, May 2012

- 3 -
Abbreviations:
BBB Blood brain barrier
DAPI 4',6-diamidino-2-phenylindole DNA fluorescent stain
DLS Dynamic light scatterer
DNA Deoxyribonucleic acid
EPR Enhanced permeability and retention (effect)
FDA Food and Drugs Administration
FUS Focused ultrasound surgery
GH General healthcare
i.v. Intravenously
ICG indocyanine green
IR Infrared
Mn number average molecular weight
MPS Mononuclear phagocyte system
MRI Magnetic resonance imaging
mV Milli-volts
Mw Molecular weight
NIR Near Infrared
Nm Nanometers
PDI Polydispersity index.
PEG polyethylene glycol
PEO polyethylene oxide
PGA Poly (glycolic acid)
PLA Poly (lactic acid)
PLGA poly (lactic-co-glycolic acid)
PVA Poly vinyl alcohol
QD’s Quantum dots
RES Reticuloendothelial system
RPM Revolutions per minute
SDS Sodium dodecyl sulfate
SEM Standard deviation of the mean
TTA Tetradecylthioacetic acid
UV Ultra violet (light)
VEGF vascular endothelial growth factor,
Z average (size) Also known as the cumulants means. Intensity averaged particle
diameter.
- 4 -
Abstract
To move the use of PLGA nanocolloids from laboratories towards the use in humans require
careful investigations around pharmacokinetics and biodistributions. The biodistributions of
the nanocolloids can be traced through NIR in vivo imaging in a non-invasive manner. In the
present study the biodistributions of two types of PLGA nanocolloids were compared,
nanocapsules with an oily core loaded with carbocyanine dyes and solid nanoparticles with
the fluorescent dye covalently linked. The nanocolloids were produced by nanoprecipitation;
all were of injectable sizes, showed monodispersity and negative zeta potentials.
The biodistributions of DiD dye loaded nanocapsules with an oily core and solid nanoparticles
conjugated to the dye DY-700 were injected in mice, and followed over 24 hours through NIR
imaging, before organs were collected and imaged. Bone marrow was also collected. Solid
nanoparticles were also made with a polymer covalently linked to rhodamine. After 24 hours
the organs were collected for further ex vivo analysis by confocal microscopy.
The nanocolloids seemed to accumulate mainly in the liver, spleen and the intestine. The
accumulation developed differently, and the PEGylated nanocarriers showed indications of
longer circulation times, and lower accumulation in the liver. The oily core nanocapsules
showed fluorescence accumulation in the bones, which was not seen with the solid
nanocapsules. This was confirmed by quantification of fluorescence in collected bone
marrow. This, together with accumulation in the intestine and fluorescence lifetime
investigations suggested that DiD loaded nanocapsules release some dye. In line with this
nanocolloids with the fluorescent dye covalently linked did not accumulate in the bone
marrow, and to a small degree in the intestine. The ex vivo investigations were in concurrence
with the results seen in vivo. PEGylated nanoparticles dominated in the spleen and brown
adipose tissue whereas unPEGylated nanoparticles dominated in the liver and lungs.
Taken together, this study give insight in the biodistributions of nanocolloids intended for
incorporation of chemotherapeutics, and also one has to be careful when choosing
fluorescence labelling approach for in vivo detection of nanoparticles.
- 5 -
Contents:
Acknowledgements..................................................................................................................................2
Abbreviations...........................................................................................................................................3
Abstract....................................................................................................................................................4
Contents...................................................................................................................................................5
1. Introduction..........................................................................................................................7 1.1. Introduction to nanocolloids.........................................................................................7 1.2. Biodegradable nanocolloids made from PLGA..........................................................10 1.3. Use and potential areas of application of nanocolloids..............................................14 1.4. NIR optical imaging in the drug development process and as a diagnostic tool........16 1.5. Aims of the study........................................................................................................20
2. Materials.............................................................................................................................21 2.1. Reagents and chemicals..............................................................................................21 2.2. Solutions.....................................................................................................................22 2.3. Mice............................................................................................................................23 2.4. Anaesthetics and other drugs......................................................................................23 2.5. Instruments.................................................................................................................24 2.6. Computer software.....................................................................................................24 2.7. Disposable consumables............................................................................................25
3. Methods.............................................................................................................................26 3.1. Production of solid nanoparticles by the precipitation method.................................26
3.1.1. Production of non-fluorescent solid nanoparticles..........................................28 3.1.2. Solid particles conjugated with a fluorescent moiety for in vivo
experimentation..................................................................................................29 3.2. Preparation of solid nanocapsules with an oily core.................................................29 3.3. Characterisation of nanocolloids...............................................................................30
3.3.1. Dynamic light scattering, DLS.......................................................................30 3.3.2. Evaluation of binding to bovine serum albumin, BSA...................................31
3.4. Mouse handling.........................................................................................................31 3.4.1. Shaving...........................................................................................................32 3.4.2. Intravenous (i.v) injections.............................................................................32

- 6 -
3.4.3. Sedation.........................................................................................................32 3.4.4. Animal welfare..............................................................................................33 3.4.5. Euthanasia of mice and collection of organs.................................................33
3.5. In vivo investigation of nanocolloids.......................................................................33 3.5.1. NIR imaging of dye loaded nanocapsules.....................................................33 3.5.2. NIR imaging of solid nanoparticles with DY 700.........................................34 3.5.3. Ex vivo imaging of mice injected with solid nanoparticles labelled with
rhodamine.........................................................................................................35 3.6. Preparation of mouse specimens.............................................................................35
3.6.1. Fixation of tissues and cryosectioning..........................................................35 3.6.2. Confocal microscopy investigations of solid nanoparticles conjugated
with rhodamine.............................................................................................36 3.6.3. Measurements of fluorescence in bone marrow...........................................36
4. Results............................................................................................................................37 4.1. Production and characterisation of nanocolloids made by the nanoprecipitation
method.....................................................................................................................37 4.1.1. Solid nanoparticles........................................................................................37 4.1.2. Nanocapsules with an oily core....................................................................39 4.1.3. Binding of nanocolloids to bovine serum albumin.......................................41
4.2. In vivo distributions of labelled nanocolloids.........................................................42 4.2.1. Biodistribution of nanocapsules with an oily core.......................................42 4.2.2. Biodistribution of solid nanoparticles labelled with DY-700......................51
4.3. Ex vivo analysis of fluorescence accumulation......................................................54 4.3.1. Microscopic analysis of tissue and organ distribution of solid nanoparticles
labelled with rhodamine..................................................................................54 4.3.2. Fluorescence estimations in bone marrow...................................................57
5. Discussion......................................................................................................................59 5.1. Evaluation of nanocolloids produced.....................................................................59 5.2. Comparison of biodistributions of PEGylated and unPEGylated nanocolloids.....61 5.3. Differences when the fluorescence when the fluorophores is loaded or covalently
bound to the polymer.............................................................................................65 5.4. Conclusion.............................................................................................................67
5.5. Future studies................................................................................................................68
5.6. References.....................................................................................................................70

- 7 -
1. Introduction
1.1 Introduction to nanocolloids:
Polymeric nanocolloids are promising drug delivery systems for drugs with low aqueous
solubility or detrimental side effects. They can be used as slow release carriers or they can
have ligands for site-specific delivery. Nanocolloids could increase solubility, decrease
degradation during circulation and concentrate the drug at the desired site of action, while
decreasing unwanted side effects, and all these features can be incorporated in one
nanocolloid [1]. Both small molecular weight drugs and larger biological macromolecules
such as DNA and proteins can be incorporated into nanocolloids. Together with targeted
delivery, nanocolloids can incorporate a trigger, such as pH sensitivity, that leads to release of
the active agent only when the desired site of action is reached [2].
Nanocolloids are particles in the colloidal size range, normally recognized as between 1 and
1000 nm. Drugs can be encapsulated, adsorbed, dispersed in or chemically bound to the
polymer [3]. Some believe that the active agents should be encapsulated inside or bound to
the colloid. Adsorption of the active agent to the particles after formation is often effective in
vitro, but fails in vivo due to interactions with the reticuloendothelial system (RES).
Macrophages quickly remove the active agents from the surface of the particles [1].
Nanocolloids can consist of materials such as lipids, polymers and inorganic materials and
numerous nanocolloid assemblies have been developed [4]. Nanocolloids should be made of
non toxic materials that have a safe route of degradation. This is not always the case, for
example are quantum dots (QD’s) made from inorganic materials such as cadmium selenide
and zinc sulphide [5]. QD’s are very stable in the body and have been shown to exhibit
cytotoxicity including apoptosis [6]. QD’s could cause accumulation in the body, with
unknown effects at this stage. Moreover, the nanocolloids are too large to be excreted by
glomeluar filtration, something which promotes longer circulation times, but also requires an
alternative route of excretion [1].
The small sizes of the nanocolloids allow them to be injected intravenously, as they will not
block the veins [3]. The small size is promising also for the development of pulmonary and
trans-dermal drug delivery systems. It has been found that colloids under 200 nm in diameter

- 8 -
show a decreased rate of clearance and an increased circulation time. This is believed to be
due to the large radius of curvature of the colloid that prevents binding of opsonins [3].
Examples of systems produced are liposomes, micelles, solid nanoparticles (Figure 1.1A),
nanocapsules (Figure 1.1 B), solid lipid nanoparticles, microemulsions and carbon nanotubes.
Liposomes are also promising as drug carriers, but are prone to rapid leakage of water-soluble
drugs, and their stability and ability to control release is lower than for polymeric
nanoparticles [4].
Figure 1.1 Panel A shows the structure of solid nanoparticles (nanospheres). The drug is captured in or
adsorbed on to the polymer matrix. Panel B shows the structure of a nanocapsule, where a layer of polymer
surrounds an oily core that holds a lipophillic drug. Taken from [7]
The nanocolloid should exhibit stability under physiological conditions. The nanoparticles
and its surface functionalisations must have the ability to resist and traverse the physiological
environment [1]. The nanocolloids often have hydrophilic molecules such as polyethylene
glycol (PEG) adsorbed or bound to the surface but other surface coatings such as albumin and
chitosan have also been tried [8]. The surface coatings aid in the steric stabilisation of the
colloids and in addition they are meant to prevent adhesion of opsonins, and render the
nanocolloids “stealth” from the macrophages in the blood. PEG chains create a highly water
bound barrier which blocks the adhesion of opsonins [3].This further promotes long
circulation times.
Several drug formulations using polymeric nanocolloids are already used in the clinical, such
as Abraxane, where the chemotherapeutic paclitaxel is bound to albumin, which is formulated

- 9 -
into nanocapsules [9]. Abraxane is indicated as a secondary treatment for metastatic breast
cancer where standard treatment has failed [10]. Abraxane is an example of a nanocolloid
produced with a natural occurring species. Other natural occurring polymers such as the
complex sugars (hyaluronan and chitosan) and inorganics (hydroxyapatite) has also been used
to produce nanocolloids [11]. In this study a synthetic biodegradable polymer, poly (lactic-co-
glycolic acid) (PLGA) that belongs to the α-hydroxy acids polymer family was used. Another
synthetic polymer in use is the polyanhydrides [11], the early described nanoparticles were
mainly formulated from poly (alkylcyanoacrylate) [4].
In this thesis it has been focused on the use of nanocolloids that can be used as drug carriers
for chemotherapeutics that have low aqueous solubility and/or toxic side effects. The use of
nanocolloids as drug carriers for chemotherapeutics and as a research and diagnostic tool for
tumours have received much attention due to the enhance permeability and retention (EPR)
effect. Solid tumour tissue has enhanced vasculature permeability due to release of vascular
endothelial growth factor, VEGF, and exhibit extravasation of macromolecules, including
plasma proteins and liposomes. Clearance from the interstitial space of the tumour is slow,
and the macromolecules are retained for a prolonged time [12]. This is also known as passive
targeting.
Nanocolloids are also promising as a tool in drug development and as diagnostic or research
tool used as optical imaging contrast agents. Optical imaging includes methods such as
magnetic resonance imaging (MRI), ultrasound and fluorescent optical imaging. 1H-MRI is
useful for detecting tumours and measuring morphological parameters. The sensitivity is low,
but spatial resolution is good, and multiple sessions are possible. Super paramagnetic iron
oxide nanoparticles, an MIR contrast agent, have been encapsulated together with the near
infrared dye indocyanine green (ICG) into multimodal PLGA nanoparticles for use with MRI
and fluorescent optical imaging [13]. But the method is costly, and only available at
specialized animal facilities [14]. MRI is commonly used in hospitals, and contrast agents
developed could be moved to the clinics more easily than NIR fluorescent imaging contras
agents, which is more rarely used in humans. Nanocolloids could also be used to further
develop and enhance techniques such as high-intensity focused ultrasound ablation, also
known as focused ultrasound surgery (FUS) [15]. PLGA nanoparticles with super
paramagnetic iron oxide that allow real time image guidance during FUS and to give the high
resolution images obtainable with MRI have been developed [15].

- 10 -
The use of nanocolloids in in vivo fluorescence imaging has been particularly explored, and is
utilised in this study. When the nanocolloids are associated with NIR contrast agents their
movement in vivo can be traced through NIR optical imaging. There is low autofluorescence
from the main tissue adsorbing components and water in the NIR window (700-1100 nm), and
NIR light penetrates deeper into and out from tissues than does UV, visible or far IR light [6].
NIR contrast agents can be used with or without drugs in the nanocolloids, and the movement
and accumulation in tissues such as tumours can be traced through a minimally invasive,
nonionising method [6]. When both therapeutic agent and an imaging probe are combined in
a nanocolloid, they are often termed multimodal or multifunctional nanocolloids [16]. Such
multimodal nanocolloids could be envisioned to contain an fluorescent dye, a specific
targeting agent, one or more drugs, a cell penetrating agent, a stimulus sensitive agent or any
combination of these [17]. When both a diagnostic tool and a therapeutic are combined in this
way it is called theranostics.
To be useful as drug delivery systems, the pharmaceutical industry needs nanocolloids that
exhibit biocompatibility, biodegradation, encapsulation of the active therapeutic, colloidal
stability, improved pharmacokinetics and controlled-release kinetics. None of the
nanocolloids made to date fulfils all of these demands [1]. The successful transition of
nanocolloids as contrast agents from the laboratories to use in the clinics requires more
information around the biodistributions, clearance and biocompatibility of the nanocolloids
[16].
1.2 Biodegradable nanocolloids made from PLGA
Some of the most widely used polymers used for nanocolloid are the linear, aliphatic
polyesters such as PLGA, which is the co-polymer of PLA (poly lactic acid) and PGA (poly
glycolic acid) (Figure 1.2). PLGA is well characterized, has long clinical experience and is
commercially used for microparticulate and nanocolloid drug delivery systems. PLGA is
biocompatible, biodegradable and is approved by the FDA for use in humans. In the body it
undergoes hydrolysis to lactic and glycolic acid (Figure 1.2), species that are known to the
organism, and are further eliminated by the normal metabolic pathways. The polymer
therefore exhibits minimal systemic toxicity. PLGA is for instance used in the production of
bioresorbable surgical devices [11].

- 11 -
Figure 1.2 Structure and biodegradation of poly (lactic-co-glycolic acid), PLGA. X and y is the number of lactic
acid units and glycolic acid unit, respectively. Modified from [11].
PLGA polymer properties depend on several parameters. The molecular weight, composition
and even the type of drug incorporated play a role. The ratio of lactic to glycolic acid can be
varied to produce nanocolloids with tuneable mechanical properties and a wide range of
erosion times. The presence of methyl side groups in PLA makes it more hydrophobic than
PGA. PLA rich PLGA polymers therefore adsorb less water, and degrade more slowly. The
biodegradation of PLGA is directly related to its degree of crystallinity. The crystallinity of
the polymer depends on the molecular weight. A high degree of PGA will reduce the PLGA
co polymers crystallinity and promote hydration and hydrolysis. Increasing amounts of PGA
therefore leads to faster degradation rates, and a ratio of 50:50 of PLA/PGA shows the fastest
degradation [11]. The composition of the polymer chosen influences the nanocolloids
produced together with many other parameters. If the polymer degradation occurs suddenly
with a change in the environment or at a specific time point this might lead to dose dumping,
meaning that a large dose meant for sustained release is suddenly released into the
environment [18]. Other problems such as inconsistent release and drug-polymer interactions
can occur and affect the pharmacokinetics of the nanocolloids [11]. The releases of the drug
from the polymer matrix represent a parameter that needs to be carefully investigated.

- 12 -
All nanocolloids show quick clearance from the blood stream und uptake by the mononuclear
phagocyte system (MPS) and naked nanocolloids therefore has a relatively poor therapeutic
effect [17]. Biodistribution investigations of PLGA nanocolloids have indicated accumulation
in tissues such as liver, bone marrow, lymph nodes, spleen and peritoneal macrophages [11].
Their hydrophobic surface makes them easily recognizable for the macrophages in the blood
stream. To render the surface of the nanocolloids more hydrophilic, they are often coated with
highly hydrophilic molecules such as PEG and polyethylene oxide (PEO). PLGA is often
made as a block copolymer together with PEG (Figure 1.2). Both diblock copolymers and
triblock copolymers with ABA (PLGA-PEG-PLGA) and BAB (PEG-PLGA-PEG) types
exist. In the diblock types the PEG molecules orient themselves towards the exterior of the
particle, and provide steric and hydrated repulsion [11]. This comes with the price of reduced
drug loading capacity due to steric interference of interactions between PLGA and the drug
[11]. As the PEG is bound the PLGA no desorption of the PEG layer can take place.
Figure 1.3 Structure of PLGA-PEG diblock copolymer. X and y represent the number of PLA and PGA
monomers, respectively. Y represents the number of PEG monomers present on the diblock polymer.
For a colloidal system to be stable repulsive forces between the particles in the colloidal
dispersion must be dominant to prevent flocculation and coagulation (Figure 1.3). Irreversible
droplet size increases leads to destabilisation through two mechanisms, Ostwald ripening and
coalescence. Ostwald ripening is growing of the lager droplets at the expense of the smaller
ones while coalescence occurs when two drops collide and merge. Coalescence is the main
destabilising mechanism in micro sized colloids, but is normally prevented with
nanoemulsions due to the small droplet size. Ostwald ripening is therefore process the main
nanoemuslion destabilising mechanism [19]. There have been some indication that the
trapping of the lipophillic species such as soy lecithin within the oil droplet and polymeric
shell of lipid nanocolloids is able to limit Ostwald ripening and aid in the stabilisation of the
lipid polymer nanocolloids [19]. The lipid nanocolloids also experience favoured stability due
to the heterogeneous nature of the lipid core [20].

- 13 -
Figure 1.4 A: Steric stabilisation due to macromolecules such as PEG hindering the particles in close
association. B: Electrostatic repulsion due to distribution repulsive mechanisms between particles of equal
charge. Modified from [21].
The zeta potential represents an index for electrostatic stabilization of nanocolloids (Figure
1.4). The zeta potential is a measure of the surface charge of the particle. As the potential
increases or decreases the stronger the electrostatic repulsion between particles becomes
leading to stabilization. A nanocolloid stabilized solely by electrostatic repulsion needs to
have a minimum zeta potential of ± 30 mV [21] Nanocolloids with PEG on the surface
normally have a negative zeta potential due to the hydrated layer formed on the surface of the
nanocolloids [4]. The PEG chains will give steric repulsion in addition (Figure 1.3), and PEG
therefore has a double role in rendering the nanocolloids more stable, aiding in both
electrostatic and steric stabilisation.
The most common method for producing PLGA nanocolloids is the solvent evaporation
method first described by Fessi, H., et al. [22], but others such as the double (multiple)
emulsion method, phase separation and salting out of nanocolloids have also been utlised. The
main problem when trying to encapsulate a hydrophillic species is the rapid diffusion of the
molecule in the outer aqeous phase during emulsification. Therefor a variation of the of the
solvent evarporation method was developed, the nanoprecipitation method (Figure 3.1) [23].
In this method the organic solution is added to the aqeous phase in a controlled manner, ie
drop-wise or injection by needle [24]. Nanocolloids are formed instantly by rapid solvent
diffusion [17]. This method is described in detail in section 3.1.1. Several nanocolloid
structures can be produced by these methods, and the terminolgy around the nanocolloids are

- 14 -
sometimes confusing and overlapping. PLGA can form micelles, solid nanoparticles,
nanocapsules and polymersomes to name some [3]. Solid nanoparticles (also called
nanospheres (Figure 1.1 A) have a solid polymer matrix that drugs can be dissolved,
entrapped, encapsuated, cheimically bound or adsorbed to. They are typically between 100
and 200 nm in diameter.The arhitecture of the particles made are strongly dependent on the
copolymer composition and moleclar weight of the polymer. Nanocapsules and
polymersomes are vesicular systems with the drug entrapped in the core of the nanocolloid.
Polymersomes are analogue to liposomes, and have an aqeous core surronded by a bilyaer of
the polymer [3]. They are good carriers for water soluble therapeutics. Polymersomes can be
sized from 5 nm to 5000 nm. Nanocapsules (Figure 1.1 B) have an oily core and a solid layer
of polymer surrounding the core. They have a size range of about 100-300 nm. They therefore
have a high volume reservoar for the encapsulation of lipophillic species. Nanocapsules are
made with an mixture of polymer and lipids such as soy lechitin. The choise of lipids
influcences the visocity of the oily core, and it can be adapted to the viscosity of the lipid
cargo [25]. The nanocapsules produced in this study are composed of a mixture of solid and
liquid lipids, and the composition of the lipids (soy lechitin and miglyoil) cold be changed to
fasilitate the drug that is beeing incorporated.
The drug loading capacity of the nanocolloids and the interactions between the drug and the
polymer depend on the chemical structure of the drug, the chemical properties of the polymer
chosen and the conditions during drug loading [17]. The biodegradation of these nanocolloids
is affected by several parameters such as morphology, porosity, glass transition temperature
and additives in the composition. It is difficult to predict the biodistribution of nanocolloids
and in vivo studies are necessary to evaluate each nanocolloid designed [26].
1.3 Use and potential areas of application for nanocolloids
The use of polymeric nanocolloids holds promises of enhancing drug delivery of a wide
variety of therapeutics in several therapeutic areas. Particular in the fields of cancer therapy
due to the EPR effect and as controlled delivery devises for vaccines these colloidal drug
delivery systems show promising results [4]. Examples of targeting moieties that have been
used together with PLGA nanocolloids are folate [27] and specific peptides or carbohydrates
that are selective for selectins and integrins [28]. Folate receptors are expressed in several
human cancers [29], while selectins and integrins are involved in metastatic events [17].

- 15 -
PLGA lipid nanocolloids have been developed that were labelled with folate. They had the
FDA approved NIR dye ICG encapsulated [27]. It was showed that the nanocolloid was
actively taken up into cells presenting folate receptors, and through in vivo imaging that the
nanocolloids labelled with folate developed higher accumulation into the tumours areas as
compared to free dye and non-folate labelled nanocolloid [27]. Jubeli et al. developed PLGA
nanocolloids to target E-selectin receptors though a well-described glycoprotein. The
nanocolloids consisted of PLGA conjugated to PEG that already had been covalently bound to
the targeting glycoprotein. In addition the nanocolloid contained a PLGA polymer covalently
bound the NIR dye rhodamine (Figure 1.6). These nanocolloids showed promising results in
vivo. They were shown to be internalised and concentrated in the targeted tissues [28].
Nanocolloids have been used to encapsulate the anti-malaria drug halofantrine. This drug has
serious cardiotoxixty, which hinders intravenous administration during the acute phase of
malaria. The nanocolloids allowed injection of higher doses and they showed longer
circulation times than the free dye and importantly, no cardiac side effects were observed
[30].
Polynucleotide, DNA and plasmid vaccines work by delivering genes for expression in host
cells, so that the anti-genic protein is produced in the vicinity of professional antigen
presenting cells. Both humoral and cell mediated immune responses are initiated. The
polynucleotide needs to be delivered to the target cells, internalise to the nucleus, and remain
bioactive in the biological environment [17]. Nanocolloids serves as a very promising
platform for the delivery of macromolecular vaccines and a lot of research is being conducted
in the field.
Interest in oral delivery of nanocolloids, followed by uptake into the Peyer’s patches and
adjacent lymphoid tissue has been shown a lot of interest, and could aid in the development of
oral vaccines and in cancer therapy [4]. PEG has been show to enhance mucoadhesivity in the
Peyer’s patches [17]. This route has the advantage of avoiding fist pass metabolism that could
be advantageous for several therapeutics [31]. Nanoparticles have a large surface area and
good mucosal permeation. The lungs have a rich blood supply and thin alveolar walls. This
means that nanoparticles could be used in inhalation formulations. Here positively charged
PLGA nanocolloids surface coated with chitosan have showed the best results, due to their
enhanced mucoadhesivity [4].

- 16 -
Nanocolloids have also been developed for uptake through the blood brain barrier (BBB) via
specific receptor mediated uptake [17]. PGLA were conjugated either to a targeting moiety or
a NIR fluorescent dye in the Texas red family. Mixtures of these polymers were used produce
PLGA nanocolloids that crossed the BBB, and that could be visualized through NIR in vivo
imaging [32]. More specific ligands and better surface coating of the polymeric nanocarriers
are needed before targeting of the BBB can be effectively achieved.
1.4 NIR optical imaging in the drug development process and as a
diagnostic tool.
The drug discovery process is long and expensive and most drugs leads are discarded in the
transition between in vitro and in vivo investigation due to unfavourable pharmacokinetics
[14]. The use of nanocolloids could mean that drugs previously discarded can be further
developed. NIR imaging can aid in drug discovery in the laboratory, during translation from
in vitro research to preclinical investigations and eventually in evaluating the biodistribution,
pharmacokinetics and biological activity of promising therapeutic agents [14]. Nanocolloids
are accumulated in tumour tissue due to the EPR effect, and therefore most of the
nanocolloids developed for imaging purposes are designed for cancer research. The use of
NIR optical imaging is not as commonly used in humans as MRI.
In animal research one of the main principles are the three R’s. This stands for replacement,
reduction and refinement. Replacement is difficult, as few systems can mimic the complicated
systems experienced in vivo. Some has therefore suggested using responsibility as an
alternative R [33]. The use of NIR imaging during animal experiments will reduce the amount
of animals needed, as the same animal can be tracked over longer periods of time, instead of
euthanising animals at each time point. In addition it will lead to refinement of the
experiments. Several parameters can be refined. Excitement in the far red window leads to
better spatial resolution [14] the incorporation of the fluorophore into nanocolloids leads to
better signal to background ratios and quantum yields [34]. More specific limits in the
experiments can be set, for parameters such as tumour growth, due to the in vivo evaluations.
The use of NIR optical imaging as a diagnostic and drug discovery tool requires effective
fluorescent optical probes. Multimodal polymeric nanocolloids are promising as such probes.
They can for instance be used as theranostics, containing both a diagnostic probe and a
therapeutic compound. QD’s or semiconductor nanocrystals display outstanding optical

- 17 -
properties due to a bright and easily controllable emission maxima, and broad absorption
spectra [35]. But QD’s have potential toxic issues, that might hamper further development for
human use [20]. Organic fluorophores are more biocompatible, and one is approved for the
use in humans by the FDA, indocyanine green (ICG) [27]. But nontoxic organic fluorophores
often suffer from rapid photo bleaching, non-specific adsorption of proteins and rapid
degradation [6].
Both QD’s [5] and organic fluorophores [20, 27, 28, 30, 32, 36, 37] can be incorporated into
PLGA nanocolloids. In this study organic fluorophores with satisfactory biocompatibility
have been used. When the fluorophore is incorporated into nanocolloids they are less prone to
photobleaching, giving better quantum yields. The nanocolloid shields the fluorophore from
the environment preventing degradation, known as the matrix shielding effect [6].
Nanocolloids as fluorescent probes have better signal intensity than the organic fluorophore
alone, which makes it possible to trace more weakly expressed targets [14]. Nanocolloids can
also hold two or more probes, and in this way the chance of reaching the intended target can
be increased [14]. Each nanoparticle can accommodate several fluorescent molecules. The
main advantage of incorporating the fluorophore into nanocolloids is the increase in
circulation half -life and the increased stability of the signal. Some of the polymeric
nanocolloids have shown significant leakage and loss of the fluorophore during circulation.
The polymer matrix may not be suitable for providing the matrix shielding effect [1].
Nanocolloids made from PLGA can have the fluorescent dye encapsulated or covalently
linked to the PLGA polymer backbone. Both methods are used here. A common strategy for
making fluorescent nanoparticles is to incorporate lipophillic dyes into the oily cores of
nanocapsules (Figure 1.1 B) [30, 37]. In the present study the long chain dialkylcarbocyanine
dyes DiD (Figure 1.5 B) and DiI were incorporated into nanocapsules with an oily core.

- 18 -
Figure 1.5 Panel A shows the emission and absorption specter of DiD bound to lipophillic membranes. Panels B
shows the molecular structure of DiD. Modified from [38]
The dyes bind to lipid membranes and are active in the NIR window (Figure 1.5 A). The
nonpolar, viscous local environment of nanoemulsions have been shown to promote high
quantum yields, 1.6 – 3.2 times higher than their hydrophilic counterpart [20]. These
nanoemulsions, also called lipidots by Gravier et al., have shown optical properties that can
quantitatively compete with those of commercial QD’s. The nanoemulsions also showed low
cytotoxicity, and can be used both for in vitro and in vivo investigations [20]. These “lipidots”
were made with the use of high energy ultrasonificaton, to ensure a small particle size. The
oily core of the nanocapsules produced here should provide the dyes with a similar
environment. Nanocolloids are optically transparent, and during NIR optical imaging we see
the fluorophore, and not the nanocolloid itself. There has been indications of swelling and
other morphological changes in the dye loaded nanocolloids [6]. This might lead to the dye
escaping the nanocolloid, and the advantages of the nanocolloids as contrast agents are lost.
The free fluorescent dye can also have different properties when not encapsulated, leading to
misinterpretation of results.
In this study solid nanocolloids were also prepared from PLGA covalently linked to two
different fluorescent dyes, rhodamine through a PEG spacer (Figure 1.6) [28] and the Texas
red dye DY-700 [36]. When the fluorescent dye is covalently linked to the polymer no
leakage of the fluorophore is experienced, but smaller amounts are incorporated than when
the dye is encapsulated. Due to a more complicated synthesis of fluorescent labelled

- 19 -
polymers, less is known about the differences in biodistribution of nanocolloids consisting of
such polymers.
Figure 1.6 Solid nanoparticles made with PLGA PEG and a PLGA PEG polymer labelled with the fluorescent
dye rhodamine. This gives PEGylated fluorescent particles after nanoprecipitation. Modified from reference
[28].
Some evidence of NIR optical imaging in the clinics is emerging. A portable device, the
Fluobeam® system uses a laser and a CCC camera in a portable 2D fluorescence system for
image guided tumour surgery [14]. As the techniques develop and tissue penetration becomes
more efficient NIR optical imaging will play a large role in the diagnostics of tumours and
potentially other applications within surgery. The use of PLGA nanocolloids as drug delivery
systems will enable the use of drugs previously unattainable due to unfavourable
pharmacokinetics and side effects.

- 20 -
1.5 Aims of the study:
The overall aim was to evaluate the biodistributions of fluorescent PLGA nanocolloids,
intended to be used as drug carriers for chemotherapeutics. The nanocolloids would be made
either as solid nanoparticles with the fluorescent dye conjugated to the polymer or as
nanocapsules with an oily core loaded with the fluorescent dye. A mouse model was chosen
to conduct in vivo investigations utilizing NIR optical imaging on healthy mice, commonly
used to evaluate fluorescent nanocolloids.
The fate of dye-loaded nanocapsules in vivo will be evaluated at different time-points, and the
effect of PEGylation studied. Analysis the fluorescent lifetimes will be conducted to further
evaluate the nature of the fluorescent biodistributions seen. Solid nanoparticles will be
evaluated on the biodistribution of the fluorescence, and the effect of PEGylation. The two
kinds of nanocolloids will also be compared.
Further ex vivo examinations will be conducted to compare with the results seen in vivo. No
exact quantifications can be done with in vivo imaging, and we wanted to investigate if the
results seen ex vivo would reflected the distributions seen in vivo. The tissue distributions of
solid nanocolloids were examined through confocal microscopy.

- 21 -
2. Materials
2.1 Reagents and chemicals
Table 2.1 Reagents and chemicals:
Name Catalogue
number
Supplier
Resomer d 50155 (PLGA-PEG) 743423-14-5
(CAS)
Boehringer Ingelheim,
Germany
Resomer RG504 (PLGA) 26780-50-7
(CAS)
Evonik Industries, Germany
PLGA-Rhodamine [28] A gift from Gillian Barratt,
Unv. Paris 11, sud.
Chatenay Malabry
PLGA-DY700 [36] A gift from Nikolas Tsapis,
Unv. Paris 11, sud.
Chatenay Malabry
Acetone 32201 Sigma Aldrich, USA
Polyvinyl Alcohol (PVA) P-8136 SIGMA, USA
Sodium Cholate Hydrate C1254-100G Sigma Aldrich, USA
Bovine Serum Albumin (BSA) A-9647 Sigma, USA
VECTASHIELD mounting medium H-1000 Vector Labs, USA
Tissue Tec o.c.t compound, mounting
medium
4583 Sakura Norway AS
Emulmetic (Lecithin)
(95 % Phosphatidylcholine)
930 Lucas Meyer Cosmetics,
France
Emulmetic (Lecithin)
(50 % Phosphatidylcholine)
900 Lucas Meyer Cosmetics,
France
Miglyol 810 SASOL Germany GmbH
Sucrose 10274 BDH AnalR, UK
Formaldehyde solution 37 % 1.04003.1000 Merck, Germany
DiD oil (1,1′-Dioctadecyl-3,3,3′,3′-
Tetramethylindodicarbocyanine
perchlorate)
D307 INVITROGENTM
, USA
DiI oil (1,1'-dioctadecyl-3,3,3',3'-
tetramethylindocarbocyanine
perchlorate)
D282 INVITROGENTM
, USA
Sodium dodecyl sulfate (SDS) L5750-800G Sigma Aldrich, USA
Peanut oil 315218 A-PRO
All the water used during the experimentation was type 1, reagent-grade water. A Milli-Q
Academic water purification system was utilized with a Quantum EX with Millipak-Express
20 Filter unit. During the rest of this text this milli-q water is simply denoted “water”.

- 22 -
2.2 Solutions
1x Phosphate Buffered Saline (PBS), 500 mL
0.1 g KCl,
0.1 g KH2PO4
0.675 g Na2HPO4·2H2O
4 g NaCl, 450 ml water.
The solids were dissolved in the water. The pH was adjusted to 7.4 using 1M NaOH and the
volume adjusted to 500 mL. The solution was autoclaved.
2 % v/v formaldehyde in PBS, 500 mL
27 mL Formaldehyde solution 37 %
PBS to a total volume of 500 mL
30 % w/v sucrose in PBS, 500 mL
150 g Sucrose
PBS to a total volume of 500 mL
5 and 10 % w/v sucrose in water, 100 mL
5 or 10 g Sucrose
Water to a total volume of 100 mL
The solution was sterile filtrated through a 0.45 and 0.2 filter
20 % v/w SDS, 500 mL
100 g SDS
Water to a total volume of 500 mL
The solution was sterile filtrated through a 0.45 and 0.2 filter

- 23 -
2.3 Mice
BL6, males. Vivarium
Nod/scid, females. Vivarium
Housing of animals:
IVC cage (Green-line) TECNIPLAST Sealsafe, Italy
Scanbur bedding Abedd, Germany
Rat and mice no 1 (E) 801002 Special diets services, UK
2.4 Anaesthetics and other drugs
Name Catalogue nr Supplier
Isoba Vet (isoflourane, 100 %) 014083 InterVet, The Netherlands
Viscotears 002140 Novartis, Switzerland
Sodium Chloride 9 mg/ml 477786 Fresenius Kabi, Norway.
Hair removal:
Veet cream (3 min) Reckitt Benckiser, UK
- 24 -
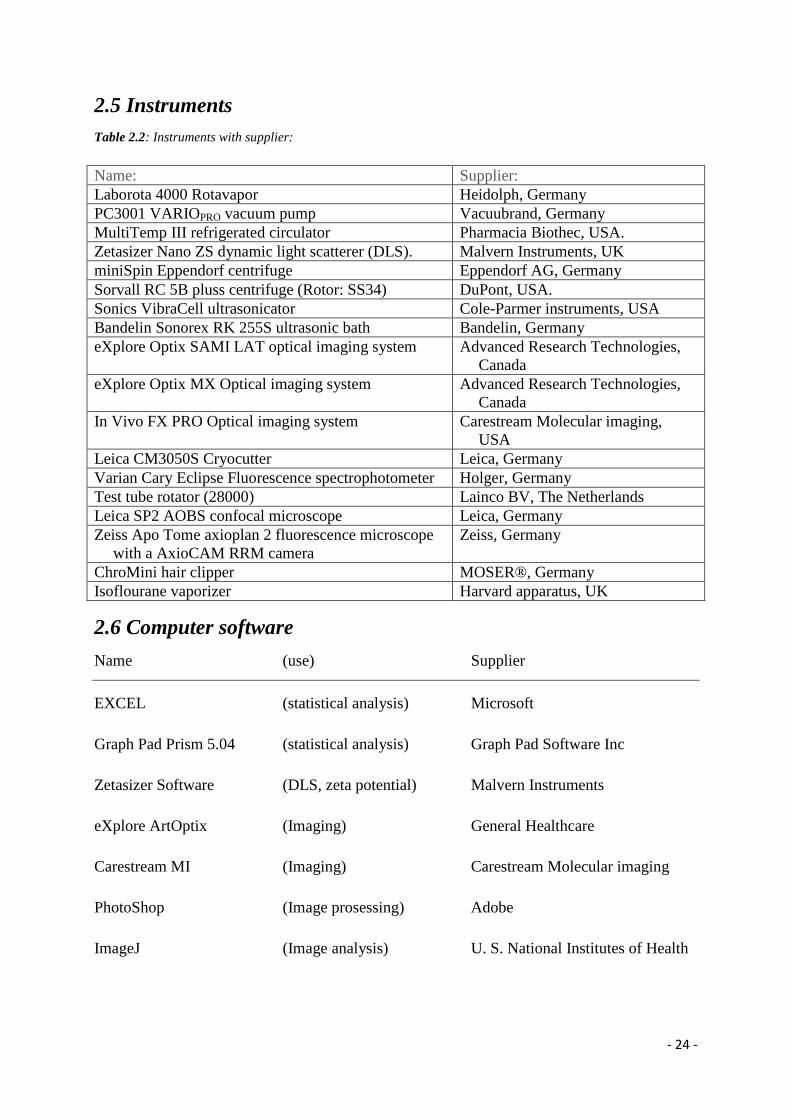
2.5 Instruments
Table 2.2: Instruments with supplier:
Name: Supplier:
Laborota 4000 Rotavapor Heidolph, Germany
PC3001 VARIOPRO vacuum pump Vacuubrand, Germany
MultiTemp III refrigerated circulator Pharmacia Biothec, USA.
Zetasizer Nano ZS dynamic light scatterer (DLS). Malvern Instruments, UK
miniSpin Eppendorf centrifuge Eppendorf AG, Germany
Sorvall RC 5B pluss centrifuge (Rotor: SS34) DuPont, USA.
Sonics VibraCell ultrasonicator Cole-Parmer instruments, USA
Bandelin Sonorex RK 255S ultrasonic bath Bandelin, Germany
eXplore Optix SAMI LAT optical imaging system
Advanced Research Technologies,
Canada
eXplore Optix MX Optical imaging system Advanced Research Technologies,
Canada
In Vivo FX PRO Optical imaging system Carestream Molecular imaging,
USA
Leica CM3050S Cryocutter Leica, Germany
Varian Cary Eclipse Fluorescence spectrophotometer Holger, Germany
Test tube rotator (28000) Lainco BV, The Netherlands
Leica SP2 AOBS confocal microscope Leica, Germany
Zeiss Apo Tome axioplan 2 fluorescence microscope
with a AxioCAM RRM camera
Zeiss, Germany
ChroMini hair clipper MOSER®, Germany
Isoflourane vaporizer Harvard apparatus, UK
2.6 Computer software
Name (use) Supplier
EXCEL (statistical analysis) Microsoft
Graph Pad Prism 5.04 (statistical analysis) Graph Pad Software Inc
Zetasizer Software (DLS, zeta potential) Malvern Instruments
eXplore ArtOptix (Imaging) General Healthcare
Carestream MI (Imaging) Carestream Molecular imaging
PhotoShop (Image prosessing) Adobe
ImageJ (Image analysis) U. S. National Institutes of Health

- 25 -
2.7 Disposable consumables
Table 2.3 Disposable consumables:
Name Catalogue number Supplier
Eppendorf tube, 1,5 mL 7590 15 BRAND
Falcon tubes, 15 mL 188271 CellStar
Falcon tubes, 50 mL 227261 CellStar
Transfer Pipettes 86.1172/86.1173 SARSTEDT, Germany
Scalpels No 11 0303 Swann-Morton, UK
Syringe OmnicanTM 0,5 mL (0,3x12
mm)
9151125 Braun, Germany
Syringe 1 mL BD Plastipak 302187 BD Medical, Spain
Syringe 5 mL BD Plastipak 300013 BD Medical, Spain
Syringe Filter Filtropur 0.45 μm 83.1826 SARSTEDT, Germany
Syringe Filter Filtropur 0.20 μm 83.1826.001 SARSTEDT, Germany
Tubes 13 mL 62.515.006 SARSTEDT, Germany
Glass vials 20 mL Perkin Elmer®, USA.
Disposable curettes (Size) 7590 15 Brand, Germany
Folded capillary cuvette (Zeta) DTS 1061 Malvern, UK.

- 26 -
3. Methods
Unless otherwise stated all statistical analysis and data processing was performed in Microsoft
EXCEL. All errors are given as standard error of the means.
3.1 Production of solid nanoparticles by the precipitation method:
The particles were made using an adaptation of the nanoprecipitation method [22]. The
polymer was first dissolved in acetone and the organic phase was then added drop-wise to the
water phase containing a stabiliser (Table 3.1). This was done using a glass syringe with a
needle with an inner diameter of 1 mm, while under vigorous stirring to ensure that the
acetone was rapidly dispersed in the aqueous phase (Figure 3.1). This gives the particles
uniform size. The polymer dissolves in acetone, but not in the water mixture and precipitates
in the water/acetone mix. If the particles were to be loaded with a drug, this would also be
dissolved in the organic phase. An opaque solution was achieved as the particles were formed.
The acetone was then evaporated using a rotavapor. Evaporation of acetone was confirmed by
smelling and by measurement of the remaining volume. If this was lower than the volume of
water phase in the emulsion it was assumed that all the acetone was removed.
Figure 3.1 Nanoprecipitation by glass syringe. Note that the tip of the needle is below the surface of the water
phase.
Glass syringe
Needle 1mm
Beaker with magnet
Magnetic stirrer

- 27 -
The nanoparticles were next washed by adding 10 ml water to the emulsion, followed by
centrifugation at 20 800 x g for 30 min. The supernatant was removed and the pellet
redispersed in water. The particles were then centrifuged for another 30 minutes at 20 800 x g.
The supernatant was removed and the particles redispersed in 0.5 ml of 5 % w/v sucrose in
water. They were sterile filtrated through a 0.45 µm filter before use and/or injection into
animals.
The size and polydispersity of all nanoparticles made were evaluated by dynamic light
scattering, DLS (section 3.3.1).
Table 3.1: Solid nanoparticles made by the nanoprecipitation method:
Organic phase: Water phase:
PEGylated particles
for evaluation.
Section 3.1.1
PLGA; Resomer 50155.
Stock: 7.5 mg/ml and 2.5
mg/ml.
See table 3.2
Polyvinyl alcohol 0.5% w/v,
5 ml.
PEGylated particles
for evaluation.
Section 3.1.1
PLGA; Resomer 50155.
Stock: 7.5 mg/ml and 2.5
mg/ml.
4 ml stock solution added to
water phase
Sodium cholate 1.5 % w/v,
5 ml.
PEGylated particles
with Rhodamine for
in vivo use.
Section 3.1.2
7.5 mg PLGA Resomer 50155
7.5 mg PLGA-Rhodamine
Dissolved in 4 ml acetone
Sodium cholate, 1.5 % w/v
5 ml.
UnPEGylated
particles with
Rhodamine for in
vivo use.
Section 3.1.2
7.5 mg PLGA Resomer RG504
7.5 mg PLGA-Rhodamine.
Dissolved in 4 ml acetone
Sodium cholate, 0.5 % w/v
5 ml.
PEGylated particles
with DY-700 for in
vivo use
Section 3.1.2
27.7 mg PLGA Resomer 50155
0.3 mg PLGA-DY 700
Dissolved in 4 ml acetone
Sodium cholate, 0.5 % w/v
5 ml.
UnPEGylated
particles with DY-
700 for in vivo use.
Section 3.1.2
27.7 mg PLGA Resomer
RG504
0.3 mg PLGA-DY 700
Dissolved in 4 ml acetone
Sodium cholate, 0.5 % w/v
5 ml.

- 28 -
3.1.1 Production of non-fluorescence solid nanoparticles:
To make particles stabilised by PVA, two stock solutions of polymer in acetone were
prepared (Table 3.1 and 3.2). The amount of polymer varies, but the amount of water phase is
kept constant at 5 mL. The water phase contained 0.5 % w/v polyvinyl alcohol. They were
prepared as described in section 3.1.
Table 3.2 Nanoparticles prepared to compare the effect on size when varying the amount of polymer.
Stock solution
(mg/mL)
Amount of stock
solution (mL)
Amount of PLGA
(mg)
7.5 4 30
7.5 3 22.5
7.5 2 15
7.5 1 7.5
2.5 4 10
2.5 3 7.5
2.5 2 5
2.5 1 2.5
To make particles stabilised by sodium cholate, stock solutions of PEGylated PLGA in
acetone with concentrations of 2.5 mg/mL and 7.5 mg/mL was made. 4 mL aliquots of these
organic phases, equivalent to 10 and 30 mg PLGA, were taken out and precipitated into 5 ml
of the water phase as described in section 3.1, see table 3.1. The water phase contained 1.5 %
w/v of sodium cholate as the stabiliser.

- 29 -
3.1.2. Solid particles conjugated with a fluorescent moiety for in vivo experimentation:
The particles with rhodamine-conjugated polymer (PLGA-rhodamine) were prepared by
dissolving a mixture of PLGA-rhodamine and PLGA with or without PEG at a 1:1 ratio in
acetone to reach a final concentration of 3.75 mg/mL. A total of 15 mg polymer is added to 5
mL of 1.5 % w/v sodium cholate. The particles were prepared as described in section 3.1.
The polymer conjugated to rhodamine contains short PEG chains (300 g/mol), estimated to be
too short to mask the charge of the PLA blocks end-groups of the copolymer [28]. The
particles made with unPEGylated PLGA were therefore regarded as unPEGylated.
The unPEGylated particles aggregated during centrifugation, and the aggregate could not be
reconstituted. These particles were instead evaporated to a total volume of 1 mL, and then
sterile filtrated through a 0.45 um filter. Then they were made isotone by mixing equal
amounts of the particle solution and a 10 % w/v sucrose solution. Less of the stabiliser was
removed by this procedure, therefore a lower concentration of stabilizer was used, 0.5 %
sodium cholate.
The particles with PLGA conjugated to a Texas red dye, DY-700, was made with 0.5 % w/v
sodium cholate as the stabilizer. One percent of total polymer was PLGA-DY [36]. A total of
30 mg polymer was dissolved in 4 mL organic phase (Table 3.1). The particles were prepared
as described in section 3.1. After precipitation a pale blue opaque emulsion was formed. As
for the rhodamine particles, the unPEGylated particles were not centrifuged, but evaporated to
a volume total of 1 ml, and sterile filtrated as described for the rhodamine conjugated
particles.
3.2 Preparation of nanocapsules with an oily core.
Nanocapsules were prepared using the nanoprecipitation method [22]. The polymer, PLGA
with or without PEG, Mygliol as the oily core, soy lecithin as surfactants and either DiD or
DiI were dissolved in acetone (Table 3.3). The mixture needed to be heated to about 45 °C to
dissolve the soy lecithin. This organic mixture was then added drop-wise to the aqueous phase
as shown in Figure 3.1. If the acetone is not rapidly dispensed through the water phase, larger
aggregates are formed. No stabilizer was used.
After precipitation the organic solvent was removed by evaporation at 150 bar, using a
rotavapor. The pressures was then reduced to 30 bar, and the solution was further

- 30 -
concentrated to a volume of approximately 1 ml. It was then sterile filtrated through a 0.45
µm filter.
Table 3.3: Nanocapsules prepared:
Organic phase: Water phase:
Empty PEGylated
nanocapsules for
characterization:
In 10 ml of acetone:
15 mg PLGA: Resomer
50155
62,5 uL Mygliol
9,375 mg Emulmetic 930
9,375 mg Emulmetic 900
5 ml water
DiD loaded PEGylated and
unPEGylated nanocapsules
for NIR imaging.
In 10 ml of acetone:
15 mg PLGA: Resomer
50155 in PEGylated,
Resomer RG504 for
unPEGylated.
3mg DiD
62,5 uL Mygliol
9,375 mg Emulmetic 930
9,375 mg Emulmetic 900
5 mL water
DiI loaded PEGylated and
unPEGylated nanoparticles
for NIR imaging
In 10 ml of acetone:
15 mg PLGA: Resomer
50155 for PEGylated,
Resomer RG504 for
unPEGylated.
1 mg DiI
62,5 uL Mygliol
9,375 mg Emulmetic 930
9,375 mg Emulmetic 900
5 mL water
Before in vivo use the nanocapsule suspension was adjusted to isotonic 5 % sucrose by
mixing 1:1 with 10 % w/v sucrose solution.
All particles made were evaluated for size and polydispersity by DLS, see section 3.3.1
3.3 Characterisation of nanocolloids
3.3.1 Dynamic light scattering, DLS:
To evaluate the size, polydispersity and zeta potentials of the nanocolloids, a Zetasizer Nano
ZS DLS was used. This measures the Brownian motions of the nanocolloids, and uses this
and the given viscosity of the dispersant to calculate the size of a sphere that would move with
the same speed as the nanocolloid in the sample. One will thus get information about the
hydrodynamic diameter and the polydispersity of the nanocolloids in the suspension.
- 31 -
All measurements were done at a 1:100 dilution of nanocolloid solution in water. The
contents were thoroughly mixed, and transferred to disposable plastic cuvettes. PLGA was
chosen as the material and water as the dispersant. The Zetasizer Nano ZS optimises
measurements settings to obtain reliable measurements. Each sample was measured three
times, and data was given as z-average (nm, diameter), PDI (Mw/Mn) and peak size (nm,
diameter).
To evaluate the zeta potential of the different nanoparticles, the samples were diluted 1:100 in
water and transferred to a Malvern folded capillary cuvette, making sure there was no air in
the loop. The system was set to make between 10 and 500 measurements in each run, and
three runs were made on each sample. The zeta potential is a measurement of electric
potential in the interfacial double layer of the particles, the potential difference between the
dispersion medium and the stationary layer of fluid attached to the dispersed particle (Figure
1.4).
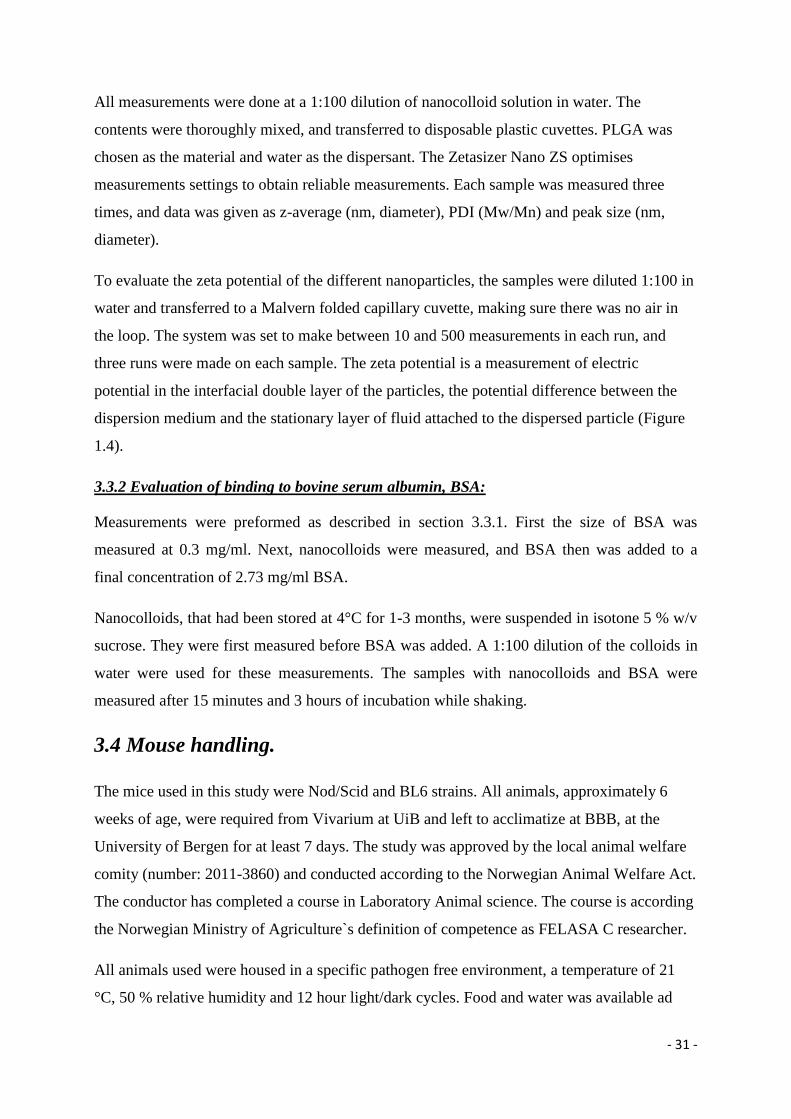
3.3.2 Evaluation of binding to bovine serum albumin, BSA:
Measurements were preformed as described in section 3.3.1. First the size of BSA was
measured at 0.3 mg/ml. Next, nanocolloids were measured, and BSA then was added to a
final concentration of 2.73 mg/ml BSA.
Nanocolloids, that had been stored at 4°C for 1-3 months, were suspended in isotone 5 % w/v
sucrose. They were first measured before BSA was added. A 1:100 dilution of the colloids in
water were used for these measurements. The samples with nanocolloids and BSA were
measured after 15 minutes and 3 hours of incubation while shaking.
3.4 Mouse handling.
The mice used in this study were Nod/Scid and BL6 strains. All animals, approximately 6
weeks of age, were required from Vivarium at UiB and left to acclimatize at BBB, at the
University of Bergen for at least 7 days. The study was approved by the local animal welfare
comity (number: 2011-3860) and conducted according to the Norwegian Animal Welfare Act.
The conductor has completed a course in Laboratory Animal science. The course is according
the Norwegian Ministry of Agriculture`s definition of competence as FELASA C researcher.
All animals used were housed in a specific pathogen free environment, a temperature of 21
°C, 50 % relative humidity and 12 hour light/dark cycles. Food and water was available ad
- 32 -
libitum. The food was removed 12 hours before imaging of the animals to avoid
autofluorescence from food in the intestine.
To avoid transfer of pathogens between immune-competent and immune-deficient mouse
strains, the equipment was always washed thoroughly and sterilised with alcohol before and
after use.
3.4.1 Shaving
To avoid autofluorescence from the fur of the mice, the mice were shaved and the hair further
removed by applying hair removal cream one week before imaging. The use of the hair
removal cream was repeated on the day or the day before the imaging. In this way any nips
and cuts would heal. Coagulated blood species in nips and cuts turn up as bright spots on the
imaging system, as they have strong autofluorescence. The mice were anaesthetised as
described in section 3.4.3. While under anaesthesia the mice were carefully shaved using a
hair clipper. The hair removal cream was then carefully distributed on the mouse and left to
work for one min. A cotton pad was soaked in tempered water and used to rinse off the cream.
When all visible cream was removed the mouse was rinsed again with a clean cotton pad. The
mice were then transferred to a solitary chamber to recover from the anaesthesia.
3.4.2 Intravenous (i.v.) injections
Intravenous injection was done on wake mice by placing the mouse in a restrainer. The
restrainer has a light source that illuminates the tail from underneath, making the veins
visible. The injections were given with a 0.5 mL syringe with a 0.3x12 mm tip.
3.4.3 Sedation
Isoflourane (Isoba VetTM
) was used both to induce anaesthesia, and as a sedative during the
procedures. A portable vaporizer system was used to administer the gas. O2 was used as the
propellant gas. The mouse was first put in a chamber until anaesthesia was induced, and then
moved to a nozzle either inside the imager or on the table top. The amount of isoflourane
administer was lowered to the minimum concentration to keep the animals sedated and the
sedation period was kept as short as possible. The mice were put under a heating lamp when
recovering from sedation. In addition the mice were given a drop of Viscotears on the eyes
when in the imager.
- 33 -
3.4.4 Animal welfare
During the imaging procedure the animals were starved. In some periods the animals also
received anaesthetic gas for periods up to 30 minutes. In some instances when the animals
appeared to have reduced general condition or recovered poorly from anaesthesia, they would
be given either 9 mg/mL sodium chloride or 5 % sucrose by subcutaneous injection.
3.4.5 Euthanasia of mice and collection of organs.
Mice were euthanized by CO2, and left in the CO2 chamber for 3 minutes before organs were
removed. The abdomen was opened, and white adipose tissue was collected. Next the
intestine was removed, and the stomach discarded. The spleen and kidneys were then
exposed, and collected, before the liver was pulled away from the diaphragm and cut out. The
diaphragm and the ribcage were then opened and the heart and lungs were collected. As much
as possible of the muscle was removed from the femurs, and the femur carefully released
from the hip bone and after imaging the bone marrow was collected as described in section
3.6.4. Finally, subcutaneous brown adipose tissue was collected from the area between the
shoulder blades. A piece of skin from the mice was also collected.
The tissues were imaged as described in sections 3.5.2 and 3.5.3, or processed for
cryosectioning as described in section 3.6.2.
3.5 In vivo investigation of nanocolloids
3.5.1 NIR imaging of mice injected with dye loaded nanocapsules
An eXplore Optix from General Healthcare (GH) was used to obtain fluorescent images from
the mice injected with nanoparticles loaded with NIR-dye. The mice (female Nod/Scid of 6-8
weeks) were prepared as described in section 3.4.1. A 670 nm laser was utilized with Cy5.5
fluorescence. Emission was measured with a broad field collection filter. The system ran a
power automation program to determine the optimal laser power. Scans were recorded at 10
min, 1, 2, 4, 8, 12 and 24 hours. The maximum fluorescence was measured at each time point.
After the 24 hours scan, the mouse was euthanized and organs collected as described in
section 3.6.1. The organs were placed on white bench paper and photographed before
imaging. After imaging bone marrow was collected as described in section 3.6.4.
The injections of nanocapsules given contained 0.275 µmoles of DiD or 0.174 µmoles of DiI.
One mouse was injected intravenously (Section 3.4.2) with an equivalent amount of free DiD

- 34 -
dye, and imaged as described. The free dye was dissolved in a small amount of
pharmaceutical grade peanut oil, and added isotone sucrose at a ratio of 1:100. This solution
was emulsified by a cycle of 10 minutes in an ultrasonic baht followed by 1 minute
ultrasonification on a Sonics VibraCell ultrasonicator at 80 amplitude. This was repeated three
times.
The fluorescence intensity (photons/second) is then measured. Measurements were made on
pixels that were 1.5 mm2. This is overlaid on a black and white picture of the mouse. Using
the software ArtOptix, regions of interest (ROI) of equal size were made at each time point.
The amount of fluorescence at in each area of interest was given. Background fluorescence is
subtracted from each ROI before analysis. Data analysis, time course graphs and statistical
analysis were done in the Prism software. In addition representations of fluorescence lifetime
in each pixels were made in the ArtOptix software, along with analysis of the different
lifetimes. Due to technical problems with the laser, it was not possible to obtain data for
quantification of the imaging of mice injected with the DiI-loaded nanoparticles. One set of
pictures is given to exemplify the biodistribution for these capsules.
3.5.2 NIR imaging of mice injected with solid nanoparticles labelled with DY-700:
Female white nod/scid mice, approximately 10 weeks of age, with the fur removed (see
section 3.4.1) were used. Before and during imaging they were anaesthetised as described in
section 3.3.3. Imaging was performed by a Carestream FXPRO imaging system with x-ray.
Excitation was at 710 nm and emission was collected at 750 nm. The animals were imaged at
the time-points described in section 3.5.1. The maximum fluorescence was measured at each
time point, in addition a white light picture, a fluorescence scan and an x-ray picture was
obtained. After the 24 hours scan, the mice was euthanized and organs collected as described
in section 3.6.1. The organs of interest were then imaged on a Petri dish. After imaging, the
bone marrow was collected from the femur and analyzed as described in section 3.6.4.
Using the imager software overlays of x-ray and fluorescent images were made. In addition
regions of interest were drawn on the fluorescent images, and the sum of florescence at each
time point collected. The data was normalised for size of the ROIs. These data were used for
time course analysis using Prism and is presented together with the images.

- 35 -
3.5.3 Ex vivo imaging of mice injected with solid nanoparticles labelled with Rhodamine:
Male black BL6 mice were used for the in vivo experiments. The particles were administrated
as described in section 3.4.2. Twenty-four hours after injection, the mice were euthanized and
the organs of interest were removed by dissection as described in section 3.4.5. The
specimens were then fixed and cryosectioned as described in section 3.6.1.
The sections were examined by fluorescence microscopy and evaluated for further confocal
microscopy (Section 3.6.2). Routinely, fluorescence images were collected (red, green and
blue fluorescence) and a visible light image was captured. Based on the fluorescence images,
the three best specimens from each organ were chosen for confocal imaging.
3.6 Preparation of mouse specimens.
3.6.1 Fixation of tissues and cryosectioning:
Organs and tissues were fixed in 2 % v/w formaldehyde in PBS for 24-48 hours. The organs
were next placed in 30 % v/w Sucrose in PBS until subsidence (Approximately 48-72 hours).
This is a sign that they were saturated with sucrose, which serves as a cryoprotectant. The
specimens were then transferred to plastic vials with paper in the bottom, and frozen at -80 oC
for at least 24 hours before cryosectioning.
The specimens were kept on dry ice during preparation of cryosectioning. The specimens
were fixed to the sample holder using CytofixTM
, and the specimen was then covered with
cytofix to ensure maximum rigidity during sectioning. The sample holder with the specimen
mounted was left on the dry ice until the fixative had solidified. Cryosectioning was
performed at – 20 °C, and sections with a thickness of 14 µm were made. Sections were
transferred gently to water and next onto a glass slide. Sections were sampled every 150 µm.
The sections were left to dry at room temperature, in the dark, over night. Brown and white
adipose tissue sections were not spread on water, as it forms droplets immediately. Instead
these sections were placed directly on a room tempered glass slide.
The slides were mounted under cover slips by adding 7 µL of Vectashield TM
onto the
sections. This mounting media is glycerol-based and do not solidify, but remains a viscous
liquid [39]. It prevents photo bleaching, and is compatible with fluorescence microscopy. Any
air bubbles formed under the glass was carefully pushed out and the cover slips were
permanently sealed around the perimeter with nail polish. Mounted slides were stored at 4 °C.

- 36 -
3.6.2 Confocal microscopy investigations of solid nanoparticles conjugated with
rhodamine.
The sections chosen from the fluorescence microscopy (Section 3.5.1) were evaluated on a
Leica SP2 AOBS, and the best section was found for each organ. An HCX PL APO 63.0x1.4
NA oil objective was used. Background fluorescence was gathered by excitation with a 405
nm laser and the emission was gathered between 407 and 478 nm. This channel is portrayed
as red. The particles were exited with a 543 nm laser and emission gathered between 550 and
655 nm. This channel was depicted green to facilitate visualisation on the computer screen.
The images were recorded in 1024 x 1024 pixels (voxel size of 232 nm) and optimized with
two-line averaging. An overlay of the two fluorescent channels red and green was made using
Leica Lite software. The confocal imaging was performed at the Molecular Imaging Centre
(FUGE, Norwegian Research Council), University of Bergen.
The green channel, depicting the particles, was then processed in Image J, and estimations of
positive cells in the sections were made. A cut out value of 4 pixels (about 17 µm2) was
chosen. Four images from different parts of each section were analyzed.
3.6.3 Measurements of fluorescence in bone marrow
The femurs were cut at both ends, and 0.5 mL of PBS was used to flush out the bone marrow
repeatedly from the bone. After collection 250 µL of 20 % sterile filtrated Sodium dodecyl
sulphate, SDS, solution was added to the total of one mL of bone marrow cell sample for each
mouse, to give an end concentration of 5 % SDS. The sample was next centrifuged at 6700 x
g for 10 minutes in a miniSpin Eppendorf centrifuge. The supernatant was then transferred to
a quarts cuvette for measurements in a Varian Cary Eclipse Fluorescence spectrophotometer.
A scan of excitation and emission wavelengths were preformed on DiD and DiI to get optimal
signal form the samples. 5 % SDS in water was blank. Six measurements were taken from
each sample.

- 37 -
4. Results
4.1 Production and characterisation of nanocolloids made by the
nanoprecipitation method.
4.1.1 Solid nanoparticles:
First it was examined if the type of stabiliser could influence the size of the nanoparticles.
When the carriers were made with PVA as the stabiliser, the z average size was between 90
and 140 nm (diameter), there was always only one peak, and the polydispersity was below
0.1, which is satisfactory. As the ratio of organic phase to aqueous phase increased, there was
an increase in size of the particles (Figure 4.3 A). A ratio of 1:10 organic phase:aqueous phase
gave the smallest particles. However, the variations in size were seen under the different
conditions tested were small (Figure 4.2). Nanocolloids made with PVA as the stabiliser was
difficult to redisperse after centrifugation. In addition it is believed that some PVA remains
associated with the nanocarriers despite repeated washing because PVA forms an
interconnected network with the polymer at the interface. This is shown to affect the release
of the drug load [2].
Figure 4.1 Z-average size (Mw/Mn) for solid nanoparticles made with PVA as the stabiliser and a total of 15 mg
PLGA (Ratio organic to aqueous phase: 1:5).
It was therefore decided to make nanoparticles with sodium cholate as the stabiliser. This is a
biocompatible bile salt. When particles were made with sodium cholate as the stabiliser, the
particles were smaller than the particles made with PVA, between 55 and 65 nm in z average

- 38 -
diameter (Figure 4.3 B). They also gave pellets that easily redispersed. During the washing
cycle the carriers would aggregate if redispersed in PBS. It was therefore decided to
redisperse them in isotone sucrose, 5 % w/v, which gave stable pellets that easily redispersed.
An example of the size distribution is shown in figure 4.2. Only one peak was seen, and the
PDI was low (0.089), although somewhat larger than for the particles made with PVA
(0.047).
Figure 4.2 Z-average distributions (Mw/Mn) for solid nanoparticles made with sodium cholate as the stabiliser
and a total of 30 mg PLGA (Ratio organic to aqueous phase: 2:5).
Figure 4.3: Size of solid nanoparticles made by the precipitation method as described in section 3.1. The amount
(mg) of polymer is given together with the ratio of organic phase:aqueous phase, in brackets. Both z-average
size and peak size are given. A: Particles made with PVA as the stabiliser. B: Particles made with Sodium
Cholate as the stabiliser.
Based on these results it was decided to continue with a ratio of 2:5 between organic phase
and water phase and using sodium cholate as the stabiliser (Table 4.1). The zeta potential of

- 39 -
the different solid nanocolloids produced was next investigated. All the particles had a
negative zeta potential (Table 4.1) and the unPEGylated particles showed the lowest
potentials, and should experience electrostatic repulsion between the particles, and some
degree of electrostatic stabilisation (Figure 1.4).
Table 4.1 Characterisation of solid nanoparticles conjugated to a fluorescent dye, made for in vivo
investigations. The data show average and standard deviation of the mean. Batch to batch variations were under
3 %.
Nanocolloid Z average
(nm)
PDI
(Mw/Mn)
Peak size
(nm)
Zeta
potential
(mV)
PEGylated solid
nanoparticles conjugated
with Rhodamine
129.9 ± 0.67 0.145 ± 0.004 136.9 ± 1.11 -45.23 ± 4,98
unPEGylated solid
nanoparticles conjugated
with Rhodamine
133.8 ± 0.92 0.121 ± 0.007 153.7 ± 2.66 Not
estimated
PEGylated solid
nanoparticles conjugated
with DY-700
106.0 ± 0,72 0.254 ± 0,039 108.3 ± 4.66 -22.83 ± 1,17
unPEGylated solid
nanoparticles conjugated
with DY-700
128.2 ± 5.36 0.123 ± 0,005 142.9 ± 5.64 -52.90 ± 0.88
4.1.2 Nanocapsules with an oily core:
Nanocapsules made by precipitation can be made with or without stabilisator [19, 20, 30,
32].Stabilisation should be enabled though a mixture of the insoluble phospholipids and by
steric stabilisation due to the PEGylation [20].
Nanocapsules with a size between 150 and 205 nm were produced. Batch to batch variations
were always under 6 %. The polydispersity indexes (Table 4.2) were low and consequently
increased as sucrose was added. An example of the size distribution of the nanocapsules is
given in Figure 4.4. Both the PEGylated and the unPEGylated nanocapsules show larger size
distributions than the solid nanoparticles. The zeta potential of nanocapsules loaded with DiD
was investigated (Table 4.2). The nanocapsules showed negative zeta potentials that would
give the emulsions some degree of electrostatic stabilisation. As for the solid nanocolloids, the
unPEGylated nanocapsules showed the greatest zeta potentials (compared to the PEGylated
equivalents). This could indicate that the PEG-chains mask some of the negative carboxyl

- 40 -
groups on PLGA. The zeta potentials are generally higher than the potential measured for the
solid nanoparticles (Table 4.1)
Figure 4.4 Z-average distributions (Mw/Mn) for unPEGylated nanocapsules with an oily core.
The stability of the nanocapsules over a month was investigated (Figure 4.5). Nanocapsule
suspensions were suspended in 5 % sucrose or in water. The suspensions were then sterile
filtrated through 0.45 µm filters and stored in room temperature. Measurements were
performed as described in section 3.3.1. The initial size of the capsules was 275.8 ± 9.7 nm.
After 7 days the nanocapsules stored in water had decreased in size from 276 nm to about 190
nm and stabilised there. The nanocapsules stored in sucrose showed an increase in size.

- 41 -
Figure 4.5 Stability of oily core nanocarriers over one month. They were stored in room temperature either as a
sterile filtrate or as an isotone solution. Measurements were made on day seven and 28. The size is given as the
z-average (Mw/Mn).
Table 4.2 Overview of nanocapsules with an oily core made for in vivo experimentation. The data show average
and standard deviation of the mean. Batch to batch variations were under 4 %.
Nanocolloid Z average
(nm)
PDI
(Mw/Mn)
Peak size
(nm)
Zeta
potential
(mV)
PEGylated Nanocapsules
with an oily core loaded with
DiD
230.4 ±
15.81
0.337 ± 0.022 197.6 ± 14.82 -32.00 ± 2.29
unPEGylated nanocapsules
with an oily core loaded with
DiD
158.7 ± 0.92 0.203 ± 0.007 154.4 ± 3.54 -22.13 ± 1.31
PEGylated nanocapsules with
an oily core loaded with DiI
158.7 ± 2,65 0.261 ± 0.027 154.4 ± 3.54 Not
estimated
unPEGylated nanocapsules
with an oily core loaded with
DiI
189.7 ± 2.31 0.233 ± 0.011 232.9 ± 4.21 Not
estimated
4.1.3 Binding of nanocolloids to bovine serum albumin
When foreign bodies are administered intravenously, they are normally cleared form the
bloodstream quickly by the mononuclear phagocyte system. If plasma proteins, such as
albumin, bind to the nanocolloids this would lead to quicker complement activation and
uptake by macrophages. It was therefore decided to investigate if bovine serum albumin
(BSA) was adsorbed onto the nanocolloids. BSA was measured as a 0.3 mg/ml solution. The
0
50
100
150
200
250
300
350
400
450
Day 0 water Day 7 water Day 28 water Day 7 Isotone Day 28 isotone
Z -
ave
rage
(n
m)

- 42 -
average size measured were 13.69 ± 5.24 nm. The solution was very polydisperse (0,623 ±
0,282) and two additional peaks at about 50 and 250 nm, probably aggregates, were also seen.
The solid nanocarriers show little variation over the three hours (Figure 4.6 A). The
PEGylated nanocarriers showed an increase in size after 15 minutes, and then returned to the
original size. This increase was only seen on the first three measurements (Peak size: 130.9 ±
8.15 nm). In the second set of measurements no such increase is seen (Peaks size: 98.0 ± 1.73
nm). The unPEGylated carriers show no variation in size at all, but remain stable at around
160 nm.
Figure 4.6 Evaluation of binding to BSA. Measurements were preformed before addition of BSA and after 15
minutes and three hours. A: Comparison of PEGylated and unPEGylated solid nanocarriers. B: PEGylated
nanocapsules with an oily core.
PEGylated oily core nanocapsules increased in size when incubated with BSA, about 100 nm
already after 15 minutes (Figure 4.6 B). The size had decreased somewhat again after three
hours (324.8 ± 9.46 nm). The same batches of carriers were evaluated at two different
occasions, and the mean of 6 measurements is given.
4.2 In vivo distributions of labelled nanocolloids
4.2.1. Biodistribution of nanocapsules with an oily core
We wanted to see the change in biodistribution of nanocolloids over time, and used live
imaging to make it possible to follow the nanocolloids in mice in a non invasive manner
without sacrificing the animals at each time point. The fluorescence biodistributions of the
PEGylated nanocapsules (Figure 4.7 A) showed four main distributions, in areas
corresponding to the intestinal tract, liver, lungs and bone. The first four hours there was a

- 43 -
strong signal from liver and lung indicating particles circulating in the blood. The areas
around the femurs also showed accumulation of fluorescence at the first time-points. The
fluorescence in the organs after 24 hours showed a similar accumulation. (Figure 4.7 B and
C). Accumulation of fluorescence in the spinal column and sternum appeared at about 4 hours
and then increased over the 24 hours. The femurs were visible from 10 minutes. The
development of total fluorescence intensity is shown in Figure 4.7 D. The highest intensity
was seen after 10 hours and there was a clear drop after 1 hour. The fluorescence then slowly
increases again over the 24 hours. The high readings after 10 minutes (see also 4.8 D) might
be due to the particles being highly concentrated in a small area just after injection. Within
one hour the nanocapsules might be distributed deeper in the body, which will give lower
readings.
Figure 4.7 Biodistribution of PEGylated nanocapsules loaded with DiD. A: Fluorescence intensity (photon
counts per second) overlaid on an image of the mouse. Ventral and dorsal intensity is shown. B: Fluorescence
counts from the organs. C: Colour image of organs scanned.1: Skin, 2: Lungs, 3: Spleen, 4: Kidneys, 5: Liver, 6:
Hind legs, 7: Brown adipose tissue, 8: White adipose tissue, 9: Heart, 10: Intestine D: Development of the
fluorescence intensity over 24 hours. Ventral and dorsal maximum fluorescence is added at each time point (6
measurements).

- 44 -
The unPEGylated nanocapsules showed a similar fluorescence biodistribution to the
PEGylated nanocapsules (Figure 4.8). Fluorescence from the femur area developed more
slowly than for the PEGylated nanocapsules but a clear uptake was seen (Figure 4.8 A). The
signal from the liver stayed more consistent over the 24 hours than it did in the mice given
PEGylated capsules. Lower initial and overall fluorescence intensity was seen for these
capsules (Figure 4.8 D). The strongest intensity for these capsules was seen after 12 hours.
There was an initial drop, but it is not as marked as for the unPEGylated capsules. The organs
showed a similar distribution what was seen during the in vivo imaging, with strong
fluorescence from liver, spleen and adipose tissues, in addition to the intestine (Figure 4.8 B
and C). More fluorescence from the lungs and liver was seen for the unPEGylated
nanocapsules (Figure 4.7 C and D) than for the PEGylated nanocapsules (Figure 4.8 C and
D).
Figure 4.8 Biodistribution of unPEGylated nanocapsules loaded with DiD. A: Development of fluorescence
intensity (photon counts per second) at the different time points. Ventral and dorsal intensity is shown. B:
Fluorescence intensity from the organs 24 hours post injection. C: Colour image of organs scanned.1: Skin, 2:
Spleen, 3: Lungs, 4: Kidneys, 5: Liver, 6: Hind legs, 7: Brown adipose tissue, 8: White adipose tissue, 9: Heart,

- 45 -
10: Intestine. D: Development of the fluorescence intensity over 24 hours. Ventral and dorsal maximum
fluorescence is added at each time point (6 measurements).
A mouse was given free dye as a comparison to the encapsulated dye (Figure 4.9). The dye
was dissolved in a small amount of pharmaceutical grade peanut oil, and emulsified by
ultrasonication. An equivalent dose to the amount of dye in the nanocapsules was
administrated through i.v. injection. The free dye showed high accumulation into the liver and
some into the lungs. The free dye was also accumulated in the bones, clearly visible in the
femurs and the spinal column (Figure 4.9 A). Fluorescence was seen in the adipose tissues, in
addition to liver, spleen and some in the intestine (Figure 4.9 B and C). The fluorescence from
the abdominal area was not as distinct as for the nanocapsules (Figure 4.7 and 4.8). The total
fluorescence intensity (Figure 4.9 D) did not show the initial drop in fluorescence seen for the
nanocapsules (Figure 4.7 D and 4.8 D). The animal injected with free dye show the lowest
maximum fluorescence intensity (0,428*107 ± 0.52*10
6 PC/s). This was measured after 12
hours.
Figure 4.9 Biodistribution of fluoresce from free dye. Panel A shows the development of fluorescence intensity
(photon counts per second) at the different time points. Ventral and dorsal intensity is shown. B: The fluorescent

- 46 -
intensity in the organs 24 hours post injection. C: Colour image of organs scanned. 1: Liver, 2: Heart, 3:
Kidneys, 4: Lungs, 5: Spleen, 6: Intestine, 7: White adipose tissue, 8: Hind legs, 9: Brown adipose tissue, 10:
Skin. D:Development of the fluorescence intensity over 24 hours. Ventral and dorsal maximum fluorescence is
added at each time point (2 measurements).
The nanocapsules that were loaded with DiI instead of DiD showed similar biodistributions
(Figure 4.13). The PEGylated nanocapsules (Figure 4.10 A) showed a stronger signal from
the intestine than the unPEGylated nanocapsules (Figure 4.10 B) when loaded with DiI. This
was similar to the nanocapsules loaded with DiD (Figure 4.7 and 4.8), and might indicate that
PEGylated nanocapsules are more easily excreted into the intestine. The unPEGylated
nanocapsules showed the strongest signals from the liver region. Due to technical problems
with the eXplore optix imager, a laser with the wrong intensity was used to measure the
nanocapsules loaded with DiI, and no quantification of the data was possible [20].

- 47 -
Figure 4.10 Biodistribution of nanocapsules loaded with DiI. A: The development of fluorescence intensity
(photon counts per second) at the different time points for PEGylated nanocapsules. Ventral and dorsal
fluorescence is shown. B: The development of the fluorescence intensity for PEGylated nanocapsules. Ventral
and dorsal fluorescence is shown. C: Fluorescence from organs 24 hours after injection with PEGylated
nanocapsules; 1: Liver, 2: Intestine, 3: Lungs, 4: Brown adipose tissue, 5: Hind legs, 6: Spleen, 7: Kidneys, 8:
Heart, 9: White adipose tissue, 10: Skin. D: Organ fluorescence from unPEGylated nanocapsules; 1: Hind legs,
2: Spleen, 3: Brown adipose tissue, 4: White adipose tissue, 5: Lungs, 6: Heart, 7: Kidneys, 8: Liver, 9:
Intestine, 10: Skin.

- 48 -
Analysis of the fluorescence lifetime was done to enable further interpretation of the
biodistributions. Fluorophores change their lifetime according to the solvent they are
dispersed in, and could give information about differences about whether the dye stayed
encapsulated in or was released from the nanocapsules. A double exponential distribution
with two lifetimes in different compartments was shown (Figure 4.11). One shorter lifetime
was seen, which was measured mostly in the intestinal tract (Table 4.3), but that was different
from the fluorescence lifetime of the autofluorescence. One longer lifetime was seen mostly
in the liver, lungs and bone (Table 4.3). Estimations of the fluorescence lifetimes of the
nanocapsules loaded with DiD in isotone solutions and free dye in a nanoemulsion of peanut
oil were made in the imager system (Table 4.3). Also here two distinct lifetimes was seen for
all solutions measured.
Table 4.3 Fluorescence lifetimes of nanocapsules loaded with DiD; in solution (400 µL of nanocapsule solution
measured) and in vivo (measurements made in the liver of three mice).
Type of solution Shorter
fluorescent
lifetime
Percentage of
the short
lifetime
Longer
fluorescent
lifetime
Percentage of
the long lifetime
PEGylated
nanocapsules in
solution
0.60 78.5 1.76 21.5
unPEGylated
nanocapsules in
solution
0.44 77.2 1.68 22.8
Free dye in solution 0.37 66.7 1.24 33.3
PEGylated
nanocapsules in
vivo
0.41 ± 0.004 74.5 ± 1.50 1.55 ± 0.02 25.5 ± 1.49
unPEGylated
nanocapsules in
vivo
0.34 ± 0.02 72.0 ± 0,70 1.33 ± 0.05 28.0 ± 0,69
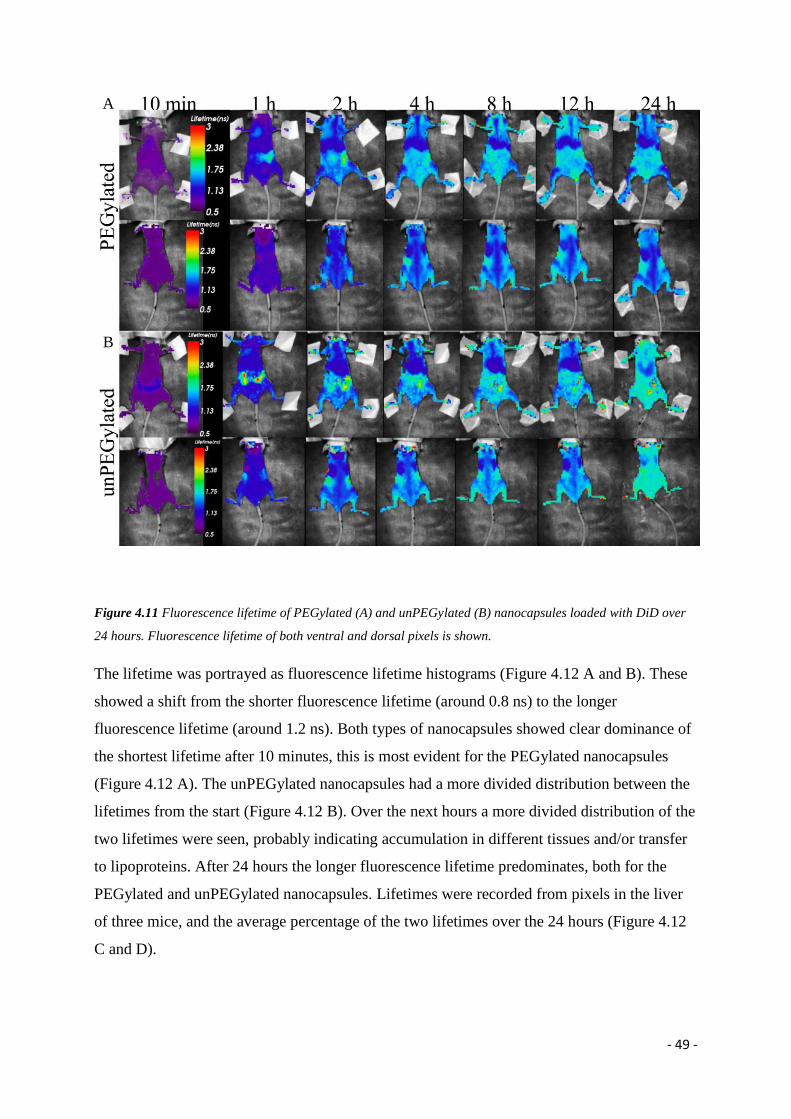
- 49 -
Figure 4.11 Fluorescence lifetime of PEGylated (A) and unPEGylated (B) nanocapsules loaded with DiD over
24 hours. Fluorescence lifetime of both ventral and dorsal pixels is shown.
The lifetime was portrayed as fluorescence lifetime histograms (Figure 4.12 A and B). These
showed a shift from the shorter fluorescence lifetime (around 0.8 ns) to the longer
fluorescence lifetime (around 1.2 ns). Both types of nanocapsules showed clear dominance of
the shortest lifetime after 10 minutes, this is most evident for the PEGylated nanocapsules
(Figure 4.12 A). The unPEGylated nanocapsules had a more divided distribution between the
lifetimes from the start (Figure 4.12 B). Over the next hours a more divided distribution of the
two lifetimes were seen, probably indicating accumulation in different tissues and/or transfer
to lipoproteins. After 24 hours the longer fluorescence lifetime predominates, both for the
PEGylated and unPEGylated nanocapsules. Lifetimes were recorded from pixels in the liver
of three mice, and the average percentage of the two lifetimes over the 24 hours (Figure 4.12
C and D).
B
A

- 50 -
Figure 4.12 Panel A and B shows fluorescence lifetime histograms for PEGylated and unPEGylated
nanocapsules, respectively. Both ventral and dorsal fluorescence is shown. The x-axis show fluorescence lifetime
in nanoseconds (0-3) and the y-axis represent intensity. C and D: Percentages of the two fluorescent lifetimes
from pixels in the liver for PEGylated nanocapsules (C) and unPEGylated nanocapsules (D). The PEGylated
nanocapsules showed a distinct shift over the 24 hours. The unPEGylated nanocapsules show no such shift.
These showed that the PEGylated nanocapsules (Figure 4.12 C) had a distinctive transition
from the shorter fluorescence lifetime towards the longer lifetime. The unPEGylated
nanocapsules (Figure 4.12 D) show no such shift in the fluorescence lifetime over the 24
hours; however a minor shift in the opposite direction towards the longer fluorescence
lifetime was detected.

- 51 -
4.2.2 Biodistribution of solid nanoparticles labelled with Texas red (DY-700)
Next we wanted to find out if the time related changes in tissue distribution of fluorescence
incorporated in nanocapsules reflected nanocapsule localization, or if fluorescent dye had
leaked from the capsules. We wanted to look for differences in biodistribution of the solid
nanoparticles and the nanocapsules. As rhodamine has excitation and emission below the NIR
window, it cannot be used in the imaging systems and we decided used PLGA polymer
covalently linked to Texas red dye DY-700 for this. The biodistribution of particles
conjugated to DY-700 was investigated by NIR imaging with X-ray since the dye-loaded
nanocapsules showed strong fluorescence from the areas around the femurs, sternum and
spinal column (Section 4.2.3).
The fluorescence scans of the animals injected with PEGylated nanoparticles showed
generalised fluorescence that was hard to distinguish from the background fluorescence
(Figure 4.13). This was probably due to technical problems during the scans. However, we
noted strong fluorescence from the intestine, spleen and white adipose tissue. Fluorescence
was also seen from the kidneys (Figure 4.13 B and C). Less was seen in the liver and lungs.
Fluorescence from the bones was not seen. The development of maximum fluorescence
intensity over 24 hours is shown (Figure 4.13 D). The intensity was the highest after 10
minutes and gradually declines until 8 hours. The intensity then increased.

- 52 -
Figure 4.13 Biodistribution of PEGylated nanoparticles conjugated to a Texas red dye. A: Development of
fluorescence intensity (photon counts per second) at the different time points. Ventral and dorsal intensity is
shown. B: Fluorescence intensity in the organs after 24 hours. C: Colour image of organs scanned. 1; Intestine,
2; Kidneys, 3; Liver, 4; Heart, 5; Hind legs, 6; Lungs, 7; Brown adipose tissue, 8; Spleen, 9; White adipose
tissue, 10; Skin. D: Development of total fluorescence intensity over 24 hours. Ventral and dorsal maximum
fluorescence is added at each time point (2 measurements).
The mice injected with unPEGylated solid nanoparticles conjugated to DY-700 showed a
similar biodistribution over the 24 hours as the mice injected with PEGylated nanoparticles.
The development of the fluorescence intensity over 24 hours is showed in Figure 4.14 A. The
intensity was the strongest after one hour (1.42*108 ± 3.245*10
7) and then declined towards
24 hours (Figure 4.14 D). At ten minutes most of the fluorescence was in the abdomen and
lungs. The fluorescence intensity was then mainly seen in the liver and the abdomen. In
contrast to the PEGylated solid nanoparticles, we found that the unPEGylated solid
nanoparticles, most of the fluorescence was found in the liver after 24 hours. The organs scans
reflected these findings (Figure 4.14 B and D), and fluorescence was mainly seen from liver
and spleen, with some signal from the intestine and the lungs. The unPEGylated nanoparticles

- 53 -
showed stronger accumulation in the liver than the PEGylated particles showed, but less in the
intestine. The PEGylated nanoparticles also showed a signal from the adipose tissues. No such
signal was seen for the unPEGylated nanoparticles. UnPEGylated nanocapsules (Figure 4.8)
showed a large signal from the lungs, this is not seen when the dye is covalently bound. In
addition there were seen differences between the amounts in femurs, and the adipose tissues.
Figure 4.14 Biodistribution of unPEGylated nanoparticles conjugated to a Texas red dye. Panel A shows the
development of fluorescence intensity (photon counts per second) at the different time points. Ventral and dorsal
intensity is shown. Panel B shows the fluorescence intensity in the organs after 24 hours. Panel C; Colour image
of organs scanned. 1; Intestine, 2; Kidneys, 3; Liver, 4; Heart, 5; Hind legs, 6; Lungs, 7; Brown adipose tissue,
8; Spleen, 9; White adipose tissue, 10; Skin. Panel D shows the development of the fluorescence intensity over 24
hours. Ventral and dorsal maximum fluorescence is added at each time point (2 measurements).

- 54 -
4.3 Ex vivo analysis of fluorescence accumulation
4.3.1 Microscopic analysis of tissue and organ distribution of solid nanoparticles labelled
with rhodamine
To find out more about the tissue distributions of fluorescently labelled nanocolloids, we
injected i.v. with solid nanoparticles with rhodamine covalently linked to the polymer
backbone. After 24 hours the mouse was sacrificed, and tissue removed for examination by
confocal microscopy. The positive cell counts show a preference for tissues such as liver,
spleen and lungs (Figure 4.15). This is also visible as high amounts of positive cells in these
tissues on confocal microscopy investigations (Figure 4.16 A-F and J-L). A high amount of
the carriers were also found in brown adipose tissue (Figure 4.15 and 4.16 G-I). In the lungs
(Figure 4.16 J-L) and skin (Figure 4.16 M-O) some nanoparticles were seen, and few or none
carriers were seen in the kidneys, the heart and white adipose tissue (Figure 4.15).
Figure 4.15 A: Total counts for the different parallels. B: Estimations of positive cells in the different tissues 24
hours after injection of solid nanoparticles covalently labelled with rhodamine. All counts are given as the mean
of 4 measurements. PEGylated particles, unPEGylated particles and a control (not given nanocolloid) are
shown.

- 55 -
The counts of total positive cells in the tissues showed a lager quantity of PEGylated than
unPEGylated particles in the tissues. This could indicate that the PEGylated nanoparticles are
present to a higher degree after 24 hours, and a higher portion of the unPEGylated
nanoparticles might be degraded at this point. The largest differences were seen in the tissues
with the highest counts (Figure 4.15). The unPEGylated tissues show larger accumulation in
the spleen (Figure 4.16 D-F), brown adipose tissue (Figure 4.16 G-I) and skin (Figure 4.16 M-
O) than the PEGylated nanoparticles. The PEGylated nanoparticles showed larger
accumulation in the liver (Figure 4.16 J-K), white adipose tissue and the lungs (Figure 4.16 J-
K) than does the unPEGylated nanoparticles. The larger accumulation in the liver and lungs
suggests that particles that have been taken up by macrophages present in these organs. Notice
that the unPEGylated are mainly accumulated in the liver, while the PEGylated are mainly in
the spleen and brown adipose tissue.

- 56 -
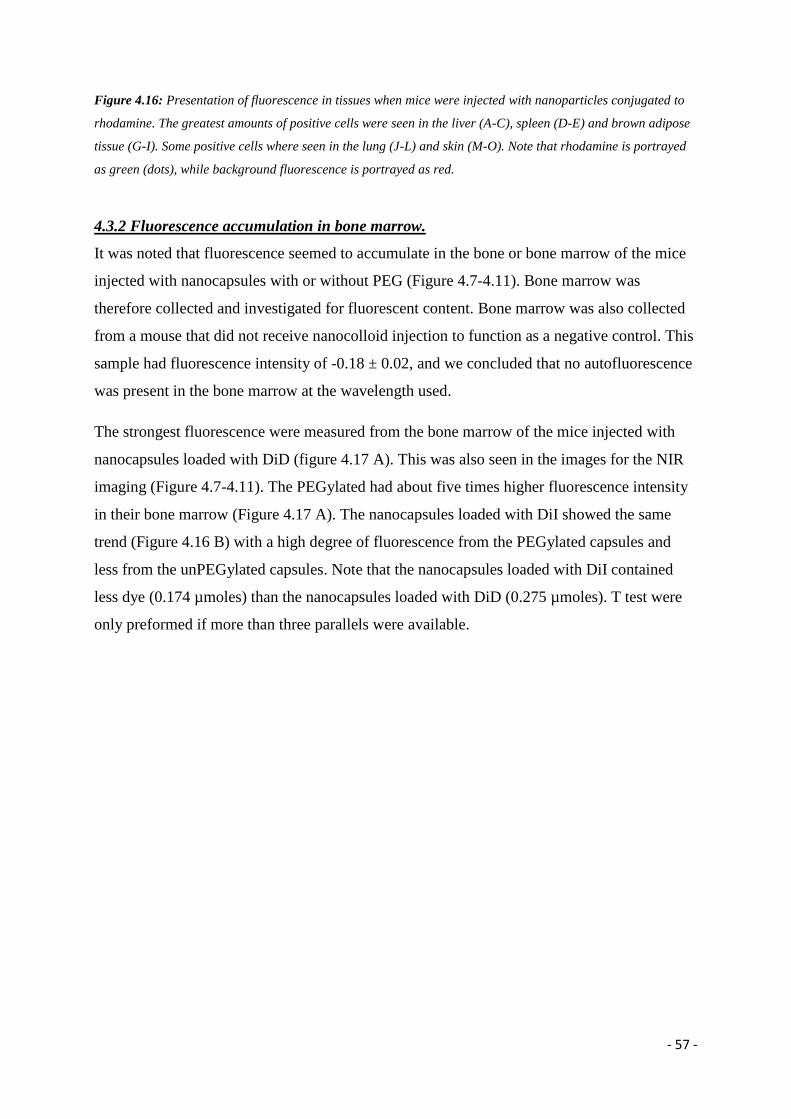
- 57 -
Figure 4.16: Presentation of fluorescence in tissues when mice were injected with nanoparticles conjugated to
rhodamine. The greatest amounts of positive cells were seen in the liver (A-C), spleen (D-E) and brown adipose
tissue (G-I). Some positive cells where seen in the lung (J-L) and skin (M-O). Note that rhodamine is portrayed
as green (dots), while background fluorescence is portrayed as red.
4.3.2 Fluorescence accumulation in bone marrow.
It was noted that fluorescence seemed to accumulate in the bone or bone marrow of the mice
injected with nanocapsules with or without PEG (Figure 4.7-4.11). Bone marrow was
therefore collected and investigated for fluorescent content. Bone marrow was also collected
from a mouse that did not receive nanocolloid injection to function as a negative control. This
sample had fluorescence intensity of -0.18 ± 0.02, and we concluded that no autofluorescence
was present in the bone marrow at the wavelength used.
The strongest fluorescence were measured from the bone marrow of the mice injected with
nanocapsules loaded with DiD (figure 4.17 A). This was also seen in the images for the NIR
imaging (Figure 4.7-4.11). The PEGylated had about five times higher fluorescence intensity
in their bone marrow (Figure 4.17 A). The nanocapsules loaded with DiI showed the same
trend (Figure 4.16 B) with a high degree of fluorescence from the PEGylated capsules and
less from the unPEGylated capsules. Note that the nanocapsules loaded with DiI contained
less dye (0.174 µmoles) than the nanocapsules loaded with DiD (0.275 µmoles). T test were
only preformed if more than three parallels were available.

- 58 -
Figure 4.17 Measurements of fluorescence in bone marrow. A: Mice injected with DiD loaded nanocapsules. B:
Mice injected with nanocapsules loaded with DiI. C: Mice were injected with nanoparticles conjugated to DY-
700. D: Mice were injected with nanoparticles conjugated to Rhodamine. Note the differences in scale in Y-axis
in A to D. T test were performed when there were more than three parallels were available (A, C).
None of the mice injected with either type of solid nanoparticles showed any accumulation of
fluorescence in the bone marrow (Figure 4.17 C and D). The mice injected with solid
nanoparticles conjugated to DY-700 showed florescence close to zero both for the PEGylated
and unPEGylated kind. T-test showed no significant difference between the two groups (P-
value: 0.74). The mice injected with solid nanoparticles conjugated to Rhodamine showed
negative measurements of fluorescence, both for the PEGylated and unPEGylated kind. It was
concluded that fluorescence does not travel to the bone marrow when conjugated to the
polymer.

- 59 -
5 Discussion
5.1 Evaluation of nanocolloids produced.
The safe delivery of therapeutically active ingredients to their desired site of action without
unwanted effects on other tissues is challenging to achieve. We have used nanoprecipitation
(Figure 4.1), a well established and easily up-scalable method [22, 23], for the production of
PLGA nanocolloids for use as drug delivery systems and NIR fluorescent contras agents
(Figure 1.5 and 1.6). The nanocolloids produced have the opportunity to be used as
theranostics. The method uses a safe and biocompatible polymer, PLGA, which is approved
by the FDA. A biocompatible stabiliser was used only when necessary, and non-chlorinated
solvents were used. Chlorinated solvents are toxic, and could degrade some drugs and
proteins [4]. All the ingredients are already used in the pharmaceutical industry, and are of
low cost. The process requires little input of energy, as no ultrasonication or other high energy
requiring methods were used. This means lower production costs on large scale. The
nanocolloids biodistributions were traced in vivo through NIR optical imaging and the results
were evaluated together with ex vivo examinations of organs and tissues.
The drug delivery systems were produced with the delivery of chemotherapeutics in mind.
Chemotherapeutics often have a low aqueous solubility and high toxicity [37]. The latter is
necessary to eliminate the cancer cells, but can also lead to severe side effects on healthy
tissues. Incorporation of the drugs in nanocolloids means that the use of drugs with low
aqueous solubility can be more easily achieved, without chemically changing the drug, and
the exposure of the chemotherapeutic to healthy tissues is significantly decreased [27, 30]. It
is hoped that the nanocolloids produced in the presented study is designed to function in a
similar manner and it is therefore necessary with careful in vivo examinations of the
nanocolloids distributions and pharmacokinetic patterns.
All the nanocolloids produced were of a size that allows for intravenous injection, normally
recognized as below 5 µm [40]. A capillary is around 8 µm [41]. The size distributions were
monodisperse (Figure 4.1-2 and 4.4) and the oily core nanocapsules (Table 4.1 and Figure
4.3) were bigger than the solid nanoparticles (Table 4.2). The size of the nanocapsules is
influenced by the size of the oily core. All nanocolloids had low polydispersity indexes (Table
4.1 and 4.3) and low batch to batch variations were seen. The oily core nanocapsules showed
slightly higher polydispersity indexes than the solid nanoparticles (Table 4.1 and 4.2), which

- 60 -
is in line with other studies on this type of nanocolloid [42]. The same study showed a strong
influence of lecithin on the zeta potentials of nanocolloids, and concluded that high
concentrations of soy lecithin imparted a low negative zeta potential at around –45 mV. This
is not in concurrence with the results obtained here, where the solid nanocolloids showed the
lowest zeta potential (Table 4.1) and the nanocapsules showed markedly higher zeta potentials
(Table 4.2). Another study showed zeta potentials closer to neutral [20], and the zeta
potentials measured here were between these two results. It might be that differences in the
methods used for producing the nanocolloids influences how the polymers and lipids orient
themselves and therefore also characteristics such as zeta potential. Another possible
explanation is that different dispersion mediums were used for the measurements, namely 5 %
glucose (the present study), PBS [20] and 9 mg/ml NaCl [42]. The zeta potential is highly
influenced by pH and ionic concentrations.
The nanocapsules with an oily core were shown to be stable for up to one month in water
(Figure 4.5), probably due to steric stabilisation from the PEG chains present (Figure 1.4).
Other has shown good stability of these nanocolloids [19]. The different stabilisers tested for
use with the solid nanoparticles (Figure 4.3) did not seem to influence the nanoprecipitation
itself, but had an effect during washing. This shows that the type of stabiliser can be varied to
fit the type of PLGA polymer and drug chosen to produce the nanocolloids. The use of
stabiliser is in itself somewhat problematic, as residues of the molecule can stay dissolved in
the nanocolloid solution or associate/adsorb on the polymer matrix and this have been showed
to affect the properties of the nanocolloids [2]. Less is known about the effect of residual
stabiliser on nanocolloids distribution, release and degradation. But it is known that the type
of drug incorporated in nanocolloids can influence the properties of the polymer [11], and it is
therefore likely that residual stabiliser will do the same. Here we decided to use low
concentrations of sodium cholate as stabiliser. This is biocompatible, with minimal side
effects compared to for instance PVA and related detergents [43]. We were also able to
demonstrate the possibility of production of oily core nanocapsules without the use of a
stabiliser. These are generally made with stabilisers such as poloxamer 188 [30, 32], but
evidence of stabilisation by entrapped lipids in the oily core should indicate that these
nanocolloids could to be produced without the aid of a stabiliser [19, 20]. When nanocolloids
where washed with PBS, they had a tendency to flocculate, probably due changes in the ionic
strength of the dispersion medium. Isotonic sucrose was used instead, and have also been used
in other studies [30]. The nanocapsules produced without stabiliser showed an increase of

- 61 -
polydispersity index after addition of glucose. The nanocapsules also showed a marked
increase in size after incubation with BSA (Figure 4.6). The solid nanoparticles showed none
of these characteristics. This might indicate that the nanocapsules made without stabiliser are
more easily affected by changes in the dispersion medium than the solid nanoparticles. The
incorporation of the fluorescent dyes into the PLGA polymer has been shown to not affect the
size, morphology and PDIs of the nanocolloids produced [20, 36]. The incorporation should
also not negatively affect the fluorescent properties of the dyes incorporated [28].
5.2 Comparison of the biodistributions of PEGylated and
unPEGylated nanocolloids:
The nanocapsules with an oily core appeared to accumulate mainly in the intestinal track,
liver, lungs and bone (Figure 4.7 and 4.8). Both the PEGylated and the unPEGylated
nanocapsules showed this pattern, but the development was different over time. The
PEGylated nanoparticles (Figure 4.7) showed the strongest signal from the liver and lungs up
to four hours, and after this an increase in fluorescence from the bones and the general lower
abdomen was seen. There was also an accumulation of fluorescence in the upper neck (Figure
4.7 dorsal pictures), an area known to contain brown adipose tissue [44], visible already after
10 minutes, and further accumulation over the 24 hours are detected. The fluorescence
intensities (Figure 4.7 D) showed a drop from ten minutes to one hour. This is probably due to
distribution of fluorescence in the tissues. The fluorescence intensity then rises again until 12
hours, where it seems to reach a plateau.
The unPEGylated particles (Figure 4.8) showed a distinct and increasing uptake into the liver
and spleen over the 24 hours, which was not seen to this extent for the PEGylated
nanocapsules. This might indicate more circulating PEGylated particles and more
accumulation of the unPEGylated particles in the liver over the 24 hours. A distinct and
slowly accumulating fluorescence from the femurs was also visible for the unPEGylated
nanocapsules. Less accumulation of fluorescence was seen from the lower abdomen, and the
dorsal fluorescence in the area rich in brown adipose tissue developed only after 8 hours. The
fluorescence intensities (Figure 4.8 D) shows the same drop in signal from 10 minutes to 1
hour, but it is not as marked as for the PEGylated nanocapsules. The signals start to decrease
after 12 hours, not seeming to reach the plateau seen for the PEGylated nanocapsules. This
might indicate less capture of the PEGylated nanocapsules by macrophages.

- 62 -
The free dye (Figure 4.9) showed clear signals from the lungs and liver, and in the liver the
intensity start to decrease after 8 hours, indicating metabolism of the dye. An interesting
observation was that the bone marrow appeared to have the highest fluorescence intensity.
The accumulation in the spine is particularly visible on the dorsal images, peaking at 24
hours. It might be that the uptakes of fluorescence into bone seen for the nanocapsules are of
free dye either from the surface of the particles or dye that has escaped the nanocapsules, and
not the nanocapsules themselves.
As expected, the type of fluorophore did not affect the distribution of fluorescence. The mice
injected with DiI (Figure 4.13) showed similar biodistributions to the nanocapsules loaded
with DiD. The PEGylated nanocapsules (Figure 4.13 A) showed accumulation in the liver and
maybe lungs the first hours, and after 4 hours an increase in the intestine is seen towards the
24 hours. Accumulation in the intestine and spleen was seen for the unPEGylated
nanocapsules (Figure 4.13 B), maybe an indication of more metabolism of these nanocolloids.
Interestingly there are reports that the more blue-shifted DiI do not produce an signal in the
NIR window [20]. However, in our system, DiI produced clear signals, but due to a defect in
the laser intensity adjustment, the power used was too low to record data with sufficient
fluorescent intensities.
The unPEGylated solid nanoparticles labelled with DY-700, had mostly accumulated in
regions corresponding to the liver 10 minutes after injection (Figure 4.14). After one hour the
whole lower abdomen showed strong fluorescence. The fluorescence then relocated towards
the liver and spleen over the 24 hours. The organ showed fluorescence from the lungs for the
PEGylated nanoparticles (Figure 4.13) but not for the unPEGylated, which differs from the
results seen ex vivo, where the unPEGylated nanoparticles showed accumulation in the lungs
(Figure 4.15). The organs also showed a high amount of fluorescence in the intestine for the
PEGylated, but less for the unPEGylated nanoparticles. This could indicate that more of the
PEGylated nanocapsules remain in the circulation after 24 hours. The intensity of total
fluorescence (Figures 4.13-14 D) was highest for the PEGylated nanoparticles. The curve
decreased towards 8 hours and then starts to increase again. One possibility is that the dye has
started to be released from the polymer at this point. The unPEGylated nanoparticles had a
lower maximum intensity and it is seems to be stabilising after 24 hours. This also indicates a
higher elimination of the unPEGylated than the PEGylated nanoparticles after 24 hours.
Unfortunately, due to technical problems the mice injected PEGylated nanocapsules gave
- 63 -
poor intensity reading on the in vivo scans and to further compare unPEGylated and
PEGylated solid nanoparticles further investigations are needed.
Taken together, the unPEGylated nanocolloids produced are more quickly accumulated in the
liver. The PEGylated nanocolloids appear to have a longer circulation time. The oily core
nanocolloids showed increasing amounts in the intestine, seen after 8 hours for the
unPEGylated nanocapsules, and 12 hours for the PEGylated nanocapsules. The PEGylated
nanocapsules also seem to have more stable fluorescence intensity after the 24 hours. The
solid nanoparticles show less accumulation in the intestine, and were mostly accumulated in
the liver after 24 hours. Both types the nanocapsules and the solid nanoparticles showed a
stronger over all fluorescence from the PEGylated nanocolloids. This is also indicative of a
faster removal from the blood stream of the unPEGylated nanocapsules.
The fluorescence lifetime of the nanocapsules were investigated to further understand the
fluorescence biodistributions. These analyses showed that there were two distinct lifetimes
present both in the nanocapsules, in free dye (in peanut oil), and in the animals (Table 4.3).
There was a shift from the shorter lifetime towards the longer lifetime as time progressed
(Figure 4.12) indicating a change of state of the dye, such as accumulation in constituents in
the blood, for instance plasma proteins or lipoproteins, and in other tissues. The shorter
lifetime seems to accumulate in the intestinal tract (Figure 4.11), both for PEGylated and
unPEGylated nanocapsules, also visible in the organs after 24 hours (Figure 4.7-8 and 4.14-
15). The longer lifetime was mostly seen in the liver, spleen and bone marrow, tissues rich in
macrophages. Interestingly, there was a transition of lifetime from shorter to longer in the
liver in animals injected with PEGylated nanocapsules (Figure 4.12 C), but not in animals
injected with unPEGylated nanocapsules (Figure 4.12 D). This can indicate leakage of dye
from PEGylated nanocapsules taken up by e.g. macrophages. If seen together with the results
from the fluorescence intensity investigations this gives a strong indication that the
nanocolloids or the fluorophore itself are transported to the lymphatic circulation after capture
by macrophages, and drained out into the intestine [20, 32]. Also the solid nanoparticles were
accumulated the liver and spleen (Figure 4.15) and taken together this indicates that
nanocolloids are accumulated organs such as the liver and spleen (Figure 4.16), while the free
dye is accumulated in bone marrow, as indicated when fluorescence was measured in bone
marrow collected (Figure 4.17). Indications of metabolism of this free dye were seen in the
liver (Figure 4.9), but an interesting question raised is how long the dye taken up into bone
will remain before metabolism occurs. DiD loaded nanocapsules have shown signals from the

- 64 -
liver for up to a few weeks [20], and further investigations around the properties of the dyes in
vivo are needed. The solid nanoparticles showed no fluorescence from the bones (Figures
4.13, 4.14 and 4.17), which points toward only free dye being incorporated into the bone
marrow, and not the nanocolloids themselves.
The effect of PEGylation was also investigated inside tissues ex vivo through confocal
microscopy (Figure 4.15 and 4.16), as no precise calculations can be done though NIR in vivo
imaging. These results were similar to the distributions seen in vivo, and the PEGylated
nanoparticles were found in the greatest amount (Figure 4.16). The high counts were due to
the large accumulation in the spleen and brown adipose tissue that was not seen for the
unPEGylated nanoparticles. It was found a higher count of the unPEGylated nanoparticles in
the liver and the lung, similar to what has been found in other studies [45]. This is likely to be
particles captured by macrophages. The accumulation in the lungs was not visible during in
vivo imaging. The Fluorescence might be situated too deep to be effectively transmitted in
vivo. The large accumulations in the spleen for the PEGylated nanocolloids might not be
visible for the same reason. A large accumulation in brown adipose tissue was seen for both
kinds of particles, the largest accumulation for the PEGylated nanocapsules. This is
interesting, as it gives an indication of the effect of both the EPR theory and the effect of
PEGylation; Brown adipose tissue has fenestrated capillaries [44], and the nanocolloids
produces do show retention in the tissue. In addition the PEGylated were present in the largest
amount (Figure 4.15). This indicates that they circulated longer, so that a larger amount could
reach the brown adipose tissue. This gives an indication that the nanocolloids produced here
could be used as drug delivery systems that passively target tumours, as they also have
fenestrated capillaries [12]. Passive targeting using similar nanocolloids have been
demonstrated in several tumour models [27, 37]. PEGylation of PLGA has been shown to
lead to longer circulation times as it prevents opsonisation and capture by macrophages. PEG
chains over 20 kDa have shown the best results at preventing uptake in macrophages in vitro
[42], another study showed that the nanocolloids with a high PEG content had more
degradation over 7 days at 37 °C [45]. This further shows the need for in vivo studies of each
specific drug delivery system envisioned [26].

- 65 -
5.3 Differences in biodistribution when the fluorescent dye is loaded
or covalently bound to the polymer.
One challenge when using nanocolloids for in vivo optical imaging is that we cannot visualise
the nanocolloids themselves, only record the fluorescence. Particularly with the nanocapsules
with an oily core this could be problem, and significant leakage of the fluorescent dyes during
circulation has been reported [6]. There could also be a small amount of dye dissolved in the
aqueous phase of the suspension which complicates the data analysis further. To avoid this
problem, the nanocapsules could be dialysed or gel filtrated [20, 37]. Leakage of DiD during
storage have been seen for similar nanocapsules [20]. Oily core nanocapsules have been
shown to have encapsulation efficacy above 90 % for the carbocyanine dyes, including DiD
and DiI, and the loading of the dye had no influence on the diameter, size distribution or zeta
potentials [20].
The use of nanocolloids produced with fluorescent dyes covalently linked to the polymer
should experience no leakage, as the dyes covalent bonds to the polymer backbone have to be
broken before any free dye can be seen in vivo. PLGA polymers with a ratio of PLA:PGA of
50:50 like the one used here have demonstrated the fastest degradation rates [11, 26]. Half
lives of PLGA nanocolloids are often given at around 15 days, but degradation of PLGA is
highly dependent on many factors, such as the chemical composition, additives such as acidic
or basic species, a crystalline or amorphous morphology, size, shape, glass transition
temperature and more [26].
In this study only the solid nanoparticles were made with the fluorescent-PLGA conjugates.
But nanocapsules could also be made with these polymers. By this, potential leakage of dye
will be avoided, and it can be investigated if the difference in biodistribution is caused by
leakage of dye, or accumulation of the nanocolloids themselves. The main advantage of
nanocapsules with an oily core is that several dye molecules can be incorporated. Less dye
would be incorporated if the fluorescence is in the shell of the nanocapsules and not
encapsulated. Here one percent of PLGA-DY-700 was used, more than this could be
incorporated to yield stronger signals. To use PLGA-DY-700 to monitor the development of
fluorescence from DiD loaded nanocapsules would be of value to compare the distributions
seen.

- 66 -
The nanocapsules produced here show significant amounts of fluorescence from the bone
marrow collected from the femur (Figure 4.15), also visible on the in vivo recordings (Figures
4.7-11). Animals injected with nanocolloids that had the dye covalently bound showed no
accumulation of fluorescence in the bone marrow (Figures 4.13-14) and no fluorescence were
detected in the collected bone marrow (Figure 4.17). More accumulation was seen into bones
such as the spinal column and sternum in addition to the femurs in the mouse injected with
free dye (Figure 4.9) than for the animals injected with nanocapsules. The highest amounts of
fluorescence from the bone marrow was seen in the animals injected with PEGylated
nanocapsules, both when DiD and DiI was used (Figure 4.17). This suggests that the
PEGylated nanocapsules are more leaky than the unPEGylated nanocapsules. The addition of
PEG chains might disturb the interactions between the dye and the PLGA, resulting in a
release of dye through the polymer shell, or more seemingly that unPEGylated PLGA can
pack itself tighter around the oily core, and that the addition of PEG chains leads to a less
packed shell of polymer around the core. It has been shown that PEGylated carriers have a
lower drug loading capacity, due to the steric interference of the PEG chains [11]. A higher
amount of free dye might be present in the nanocapsule solution of the PEGylated
nanocapsules, because of this.
Characterisations showed that the nanocapsules seemed to be affected by changes in the
medium, such as addition of glucose and BSA (Figure 4.6), to a higher degree than the solid
nanocolloids. They showed instability when monitored over a month (Figure 4.5). It seems
that leakage of fluorescence from the nanocapsules, and then especially the PEGylated
nanocapsules were experienced. The fluorescence lifetime investigations (Figure 4.12) also
showed indication of rising levels the longer lifetime (Table 4.3) through the shift from the
lifetime with the shorter lifetime towards a less uniform distribution of longer lifetimes. It is
uncertain if the shift in lifetime suggest release of dye and that the short lifetime accumulating
in the intestine (Figure 4.11) or if what is seen is the nanocapsules entering the enterohepatic
circulations, something that have been indicated for these nanocolloids [31, 32]. The
nanocapsules with an oily core seem to experience leakage, most distinct from the PEGylated
nanocapsules. This could be because no stabiliser was used, and the formulation might
improve from the use of a stabiliser such as a poloxamer. In some studies the nanocapsules
have been produced without stabiliser [19, 20], others have utilised poloxamer 188 [30, 32].
The instability seen for the nanocapsules here might mean that the “trapped species” theory

- 67 -
for stabilisation does not hold up, at least not for lipid-polymer mixes, and only applicable for
nanoemulsions [20].
An important consideration to make here is that if the carbocyanine dyes (Figure 1.5) leak
from the nanocapsules, it is likely that drugs with related structures will also be released in a
similar manner. An example of a lead compound where this could become an issue is
tetradecylthioacetic acid, TTA, an synthetic modified fatty acid, shown to activate the
peroxisome proliferator activated receptor (PPAR) [46, 47]. They regulate the expression of
genes involved in lipid metabolism and are interesting as lipid lowering drugs [48]. TTA has
been shown to attenuate dyslipidemia in male patients with type 2 diabetes mellitus and affect
bone proliferation [46]. Nanocapsules would seem like a promising drug delivery vehicle for
TTA, but the issues concerning leakage of the species incorporated need to be investigated.
5.4 Concluding remarks
We have successfully investigated the biodistribution of solid nanoparticles and nanocapsules
with an oily core. The effect of PEGylation on the nanocolloids found was as expected. The
PEGylated nanocapsules show indications of longer circulation times and seem to be captured
by macrophages to a lesser degree than the unPEGylated nanocapsules. This is shown by
higher uptake into the liver and higher levels present in the intestine, indicated as the route of
excretion of these nanocolloids is through the lymphatic system, and have also been showed
by others [31, 32].
This study suggest that there is leakage of dye from the nanocapsules, clearly indicated by the
visible accumulations seen from the nanocapsules (Figure 4.7-11), and no such accumulation
was visible for the solid nanoparticles (Figure 4.12-13). Measurements of fluorescence in the
bone marrow (Figure 4.15), also showed strong fluorescence in the samples collected from
mice injected with nanocapsules, and no such fluorescence was found in the samples collected
from mice injected with the solid nanoparticles. When taken together with the
characterisations that showed larger instability of the nanocapsules than the solid
nanoparticles (Figure 4.6) it appears that leakage of fluorophore form the oily core had
occurred.
Nanocolloids made from polymers that have the fluorescent dye conjugated to the polymer
seem to have an advantage and would give more reliable results with more ease of analysis, as
the nanocapsules produced here showed leakiness of the incorporated dye. An important

- 68 -
consideration to be made here is that drugs with similar structures to that of the carbocyanine
dyes also might be leaked from the nanocolloid. One will also have to further evaluate the
safety of the dyes in vivo.
5.5 Future studies
The nanocapsules with an oily core were produced without stabiliser. They were shown to be
leaky. It would therefore be interesting to compare the nanocapsules made with and without
stabiliser. This could give indications of differences in stability, and if the “trapped species”
theory holds up [19]. Further investigations around the leakiness of these nanocapsules would
have to be preformed. It is now seen that it is important that any residual free dye in the
nanocolloids are dialysed or otherwise removed before evaluation.
Since the degradation of PLGA nanocolloids are dependent of several factors, and difficult to
predict, the biodistributions of all the nanocolloids should be traced for longer than 24 hours
to enable further interpretation of the sustainable release abilities, accumulation and further
degradation and elimination in vivo.
It would be particularly interesting to determine if the differences in biodistributions between
nanocapsules and nanoparticles are due to leakage of fluorophore or due to real differences in
biodistributions between the two colloids. I would like to follow and compare the
development of fluorescence from DiD loaded nanocapsules with the solid nanoparticles and
to further compare this with development from free dye. Also the production of nanocapsules
with covalently linked fluorophores could give answers around how well the carbocyanine
dyes are retained in the nanocapsules. It is possible to incorporate the DY-700 in the
polymeric shell, and a green-fluorescent carbocyanine dye into the oily core. Although green
fluorescence is not as suited as NIR fluorescent dyes, it would be possible to get an idea of
differences in biodistribution between the two different fluorophores. Small animal imager for
green fluorescence is present at the molecular imaging centre (MIC) at UiB.
It would be useful to collect tissue samples at several time points for ex vivo investigations,
preferably for all the nanocolloids used. This was done at 3 hours for the solid nanoparticles
conjugated to rhodamine, but due to problems with the method at this point, the colloid
administered showed only traces of fluorescence. Nanocolloids covalently linked to Texas red
are promising drug discovery tools, as the images from in vivo examinations could be directly
compared to counts made ex vivo and in principle, immune-staining can be preformed to
- 69 -
detect which cell types that accumulate the nanoparticles. Further examinations of solid
nanoparticles would because of this preferably be conducted with PLGA-DY-700.
When the parameters above have been investigated, it would be very interesting to use these
nanocarriers as theranostics to investigate a metastatic tumour model in rodents. The cancer
cells could be labelled with green florescence, e.g. green fluorescent protein, while the
nanocolloids is coupled whit a red fluorophore, such as DY-700. In addition one or more
chemotherapeutics would be incorporated into the nanocolloid together with a targeting
moiety, such as folate. One could then investigate both the ability of the nanocolloids to locate
and accumulate in the tumour cells, and also the effectiveness of the chemotherapeutics in the
same model.
When the parameters above have been investigated, these nanocarriers could become useful
as theranostics for instance to investigate a metastatic tumour model in rodents. One can
imagine a system where the cancer cells express green fluorescent protein, while the
nanocolloids are labelled with a red fluorophore, such as DY-700. In addition one or more
chemotherapeutics can be incorporated into the nanocolloid together with a tumour-targeting
moiety, for instance folate. The location of the metastases can then be detected by in vivo
imaging, and also if the nanocolloids accumulate in tumour-infiltrated tissues or organs.
Moreover, one can detect the efficacy of the nanocolloids by measuring if the fluorescent
signal from the tumours decreases. Then, we can clearly state that the nanocolloids are multi-
modal.

- 70 -
References:
1. Adair, J.H., et al., Nanoparticulate Alternatives for Drug Delivery. ACS Nano, 2010. 4(9): p. 4967-4970.
2. Sahoo, S.K., et al., Residual polyvinyl alcohol associated with poly (d,l-lactide-co-glycolide) nanoparticles affects their physical properties and cellular uptake. Journal of Controlled Release, 2002. 82(1): p. 105-114.
3. Letchford, K. and H. Burt, A review of the formation and classification of amphiphilic block copolymer nanoparticulate structures: micelles, nanospheres, nanocapsules and polymersomes. European Journal of Pharmaceutics and Biopharmaceutics, 2007. 65(3): p. 259-269.
4. Hans, M.L. and A.M. Lowman, Biodegradable nanoparticles for drug delivery and targeting. Current Opinion in Solid State and Materials Science, 2002. 6(4): p. 319-327.
5. Nehilla, B.J.A., P.G.; Desai, T. A., Surfactant-Free, Drug-Quantum-Dot Coloaded Poly(lactide-co-glycolide) Nanoparticles: Towards Multifunctional Nanoparticles. ACS Nano, 2008. 2(3): p. 538-544.
6. Altınoğlu, E.İ. and J.H. Adair, Near infrared imaging with nanoparticles. Wiley Interdisciplinary Reviews: Nanomedicine and Nanobiotechnology, 2010. 2(5): p. 461-477.
7. Herfindal, L.N., I. M.; Milankovic, S.M., Bruk av nanokolloidar i behandling av sjukdomer. Naturen, 2012. In Press.
8. Ravi Kumar, M.N.V., U. Bakowsky, and C.M. Lehr, Preparation and characterization of cationic PLGA nanospheres as DNA carriers. Biomaterials, 2004. 25(10): p. 1771-1777.
9. Felleskatalogen. 2012 30.05.12]; Available from: http://www.felleskatalogen.no/medisin/abraxane-celgene-572142#egenskap.
10. Statens Legemiddelverk SPC Abraxane. p. http://www.legemiddelverket.no/custom/Preparatsok/prepSearch____80333.aspx?SearchID=71e5a0e4-33f4-41ce-8b1e-615e3c11d075.
11. Makadia, H.K. and S.J. Siegel, Poly Lactic-co-Glycolic Acid (PLGA) as Biodegradable Controlled Drug Delivery Carrier. Polymers, 2011. 3(3): p. 1377-1397.
12. Maeda, H., The enhanced permeability and retention (EPR) effect in tumor vasculature: the key role of tumor-selective macromolecular drug targeting. Advances in Enzyme Regulation, 2001. 41(1): p. 189-207.
13. Lim, Y.T., Noh, Y.-W., Han, J. H., Cai, Q.-Y., Yoon, K.-H. and Chung, B. H. , Biocompatible Polymer-Nanoparticle-Based Bimodal Imaging Contrast Agents for the Labeling and Tracking of Dendritic Cells. Small, 2008(4): p. 1640–1645.
14. Dufort, S., et al., Optical small animal imaging in the drug discovery process. Biochimica et Biophysica Acta (BBA) - Biomembranes, 2010. 1798(12): p. 2266-2273.
15. Sun, Y., et al., Superparamagnetic PLGA-iron oxide microcapsules for dual-modality US/MR imaging and high intensity focused US breast cancer ablation. Biomaterials, (0).
16. Kumar, R., et al., In Vivo Biodistribution and Clearance Studies Using Multimodal Organically Modified Silica Nanoparticles. ACS Nano, 2010. 4(2): p. 699-708.
17. Mahapatro, A. and D.K. Singh, Biodegradable nanoparticles are excellent vehicle for site directed in-vivo delivery of drugs and vaccines. J Nanobiotechnology, 2011. 9: p. 55.
18. Aulton, M., Aulton`s Pharmaceutics - The design and manufacture of medicines, ed. A.M. E.2007: Churchill Livingstone Elsevier.
19. Delmas, T., et al., How To Prepare and Stabilize Very Small Nanoemulsions. Langmuir, 2011. 27(5): p. 1683-1692.
20. Gravier, J.N., F. P.; Delmas T.; Mittler F.; Couffin A. C.; Vinet F.; Texier, I. , Lipidots: competetive organic alternative to quantom dots for in vivo fluorescence imaging. Journal of Biomedical Optics, 2011. 16(9).

- 71 -
21. Instruments, M. Zeta potential An introduction in 30 minutes. Technical note. 15.04.2012]. 22. Fessi, H., et al., Nanocapsule formation by interfacial polymer deposition following solvent
displacement. International Journal of Pharmaceutics, 1989. 55(1): p. R1-R4. 23. Govender, T., et al., PLGA nanoparticles prepared by nanoprecipitation: drug loading and
release studies of a water soluble drug. Journal of Controlled Release, 1999. 57(2): p. 171-185.
24. Chacón, M., et al., Optimized preparation of poly d,l (lactic-glycolic) microspheres and nanoparticles for oral administration. International Journal of Pharmaceutics, 1996. 141(1–2): p. 81-91.
25. Delmas, T.C., A. C.; Bayle, P. A.; de Crecy, F.; Neumann E.; Vinet, F.; Bardet, J.; Texier, I., Preparation and characterization of highly stable lipid nanoparticles with amorphous core of tunable viscosity. Journal of Colloidal and Interface Science, 2011(360): p. 471-481.
26. Anderson, J.M. and M.S. Shive, Biodegradation and biocompatibility of PLA and PLGA microspheres. Advanced Drug Delivery Reviews, 1997. 28(1): p. 5-24.
27. Zheng, C., et al., Indocyanine green-loaded biodegradable tumor targeting nanoprobes for in vitro and in vivo imaging. Biomaterials, 2012. 33(22): p. 5603-5609.
28. Jubeli, E.M., L; Nicolas, V.; Barratt, G., Preparation of E-selectin-targeting nanoparticles and preliminary in vitro evaluation. International Journal of Pharmaceutics, 2012. 426: p. 291-301.
29. Clifton, G.T., et al., Folate receptor α: A storied past and promising future in immunotherapy. Human Vaccines, 2011. 7(2): p. 183-190.
30. Mosqueira, V.C.F.L., P.M.; Bories, C.; Legrand, P.; Devissaguet, J. P; Barratt, G. , Efficacy and pharmacokinetics of intravenous nanocapsule formulations of Halofantrine in plasmoudium berghei-infected mice. Anitmicrobial agents and Chemoterapy, 2004. 48(4): p. 1222-1228.
31. Das S.; Chaudhury, A., Recent Advances in Lipid Nanoparticle Formulations with Solid Matrix for Oral Drug Delivery. PharmSciTech. , 2011. 12(1): p. 62-76.
32. Tosi, G., et al., NIR-labeled nanoparticles engineered for brain targeting: in vivo optical imaging application and fluorescent microscopy evidences. Journal of Neural Transmission, 2011. 118(1): p. 145-153.
33. A., S., Alternatives to the use of animals, in UiB Animal research course2012. 34. John V, F., In vivo near-infrared fluorescence imaging. Current Opinion in Chemical Biology,
2003. 7(5): p. 626-634. 35. Jin, Z. and N. Hildebrandt, Semiconductor quantum dots for in vitro diagnostics and cellular
imaging. Trends in Biotechnology, (0). 36. Reul, R., et al., Near infrared labeling of PLGA for in vivo imaging of nanoparticles. Polymer
Chemistry, 2012. 3(3): p. 694-702. 37. Goutayer, M., et al., Tumor targeting of functionalized lipid nanoparticles: Assessment by in
vivo fluorescence imaging. European Journal of Pharmaceutics and Biopharmaceutics, 2010. 75(2): p. 137-147.
38. Invitrogen. 2012. Available from: http://www.invitrogen.com/site/us/en/home/support/Product-Technical-Resources/Product-Spectra.307lip.html.
39. [cited 2012 22.04.2012]; Available from: http://www.vectorlabs.com/catalog.aspx?prodID=427.
40. Gref, R., et al., Biodegradable Long-Circulating Polymeric Nanospheres. Science, 1994. 263(5153): p. 1600-1603.
41. Sand, O.S., Ø. V.; Haug E., Menneskets fysiologi, 2001, Gyldendal Akademisk. p. 309. 42. Mosqueira, V.C.F., et al., Relationship between complement activation, cellular uptake and
surface physicochemical aspects of novel PEG-modified nanocapsules. Biomaterials, 2001. 22(22): p. 2967-2979.

- 72 -
43. Müller, R.H., D. Rühl, and S.A. Runge, Biodegradation of solid lipid nanoparticles as a function of lipase incubation time. International Journal of Pharmaceutics, 1996. 144(1): p. 115-121.
44. CANNON, B. and J. NEDERGAARD, Brown Adipose Tissue: Function and Physiological Significance. Physiological Reviews, 2004. 84(1): p. 277-359.
45. Avgoustakis, K., et al., Effect of copolymer composition on the physicochemical characteristics, in vitro stability, and biodistribution of PLGA–mPEG nanoparticles. International Journal of Pharmaceutics, 2003. 259(1–2): p. 115-127.
46. Stunes, A.K., et al., Skeletal effects of the saturated 3-thia Fatty Acid tetradecylthioacetic Acid in rats. PPAR Res, 2011. 2011: p. 436358.
47. Vigerust, N.F., et al., Fish oil and 3-thia fatty acid have additive effects on lipid metabolism but antagonistic effects on oxidative damage when fed to rats for 50 weeks. The Journal of Nutritional Biochemistry, (0).
48. Walker, R.W.C., Clinical Pharmacy and Therapeutics2007, Churchill Livingstone Elsevier.
Related Documents