Financial statements • Independent Audit Report 72 • Statement by the Chief Executive and Chief Finance Officer 74 • Statement of Comprehensive Income 75 • Balance Sheet 76 • Statement of Changes in Equity 77 • Cash Flow Statement 78 • Schedule of Commitments 79 • Schedule of Contingencies 81 • Notes to and forming part of the financial statements: 85 Note 1: Summary of Significant Accounting Policies 85 Note 2: Events After the Reporting Period 92 Note 3: Expenses 93 Note 4: Income 94 Note 5: Financial Assets 95 Note 6: Non-Financial Assets 96 Note 7: Payables 100 Note 8: Non-Interest Bearing Liabilities 100 Note 9: Provisions 101 Note 10: Cash Flow Reconciliation 102 Note 11: Contingent Assets and Liabilities 103 Note 12: Senior Executive Remuneration 103 Note 13: Remuneration of Auditors 106 Note 14: Financial Instruments 107 Note 15: Administered – Expenses 110 Note 16: Administered – Financial Assets 110 Note 17: Administered – Payables 111 Note 18: Administered – Cash Flow Reconciliation 111 Note 19: Administered – Contingent Assets and Liabilities 111 Note 20: Administered – Financial Instruments 112 Note 21: Administered – Financial Assets Reconciliation 114 Note 22: Appropriations 115 Note 23: Special Accounts 119 Note 24: Compensation Debt Relief 119 Note 25: Reporting of Outcomes 119 Note 26: Net Cash Appropriation Arrangements 121

Welcome message from author
This document is posted to help you gain knowledge. Please leave a comment to let me know what you think about it! Share it to your friends and learn new things together.
Transcript

Financial statements• Independent Audit Report 72• Statement by the Chief Executive and Chief Finance Officer 74• Statement of Comprehensive Income 75• Balance Sheet 76• Statement of Changes in Equity 77• Cash Flow Statement 78• Schedule of Commitments 79• Schedule of Contingencies 81• Notes to and forming part of the financial statements: 85
Note 1: Summary of Significant Accounting Policies 85Note 2: Events After the Reporting Period 92Note 3: Expenses 93Note 4: Income 94Note 5: Financial Assets 95Note 6: Non-Financial Assets 96Note 7: Payables 100Note 8: Non-Interest Bearing Liabilities 100Note 9: Provisions 101Note 10: Cash Flow Reconciliation 102Note 11: Contingent Assets and Liabilities 103Note 12: Senior Executive Remuneration 103Note 13: Remuneration of Auditors 106Note 14: Financial Instruments 107Note 15: Administered – Expenses 110Note 16: Administered – Financial Assets 110Note 17: Administered – Payables 111Note 18: Administered – Cash Flow Reconciliation 111Note 19: Administered – Contingent Assets and Liabilities 111Note 20: Administered – Financial Instruments 112Note 21: Administered – Financial Assets Reconciliation 114Note 22: Appropriations 115Note 23: Special Accounts 119Note 24: Compensation Debt Relief 119Note 25: Reporting of Outcomes 119Note 26: Net Cash Appropriation Arrangements 121

Independent Audit Report


Statement by the Chief Executive and Chief Finance Officer
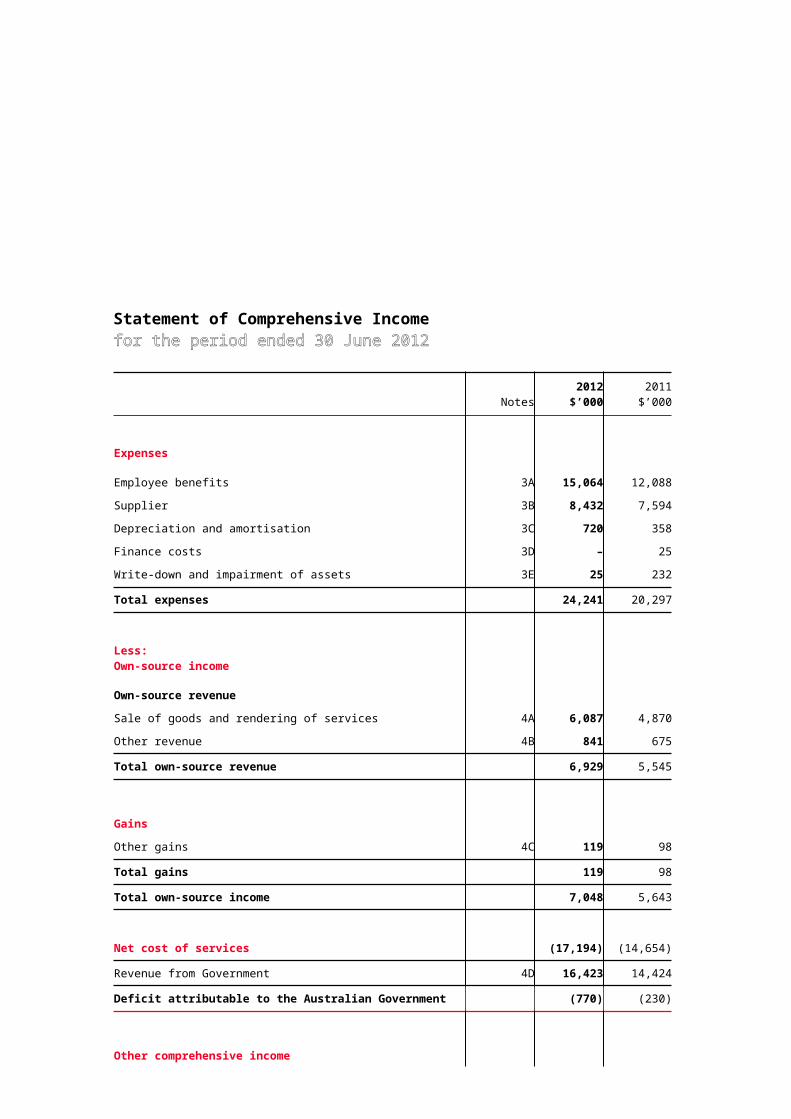
Statement of Comprehensive Income for the period ended 30 June 2012
Notes2012
$’0002011
$’000
Expenses
Employee benefits 3A 15,064 12,088 Supplier 3B 8,432 7,594 Depreciation and amortisation 3C 720 358 Finance costs 3D – 25 Write-down and impairment of assets 3E 25 232 Total expenses 24,241 20,297
Less: Own-source income
Own-source revenueSale of goods and rendering of services 4A 6,087 4,870 Other revenue 4B 841 675 Total own-source revenue 6,929 5,545
GainsOther gains 4C 119 98 Total gains 119 98 Total own-source income 7,048 5,643
Net cost of services (17,194) (14,654)Revenue from Government 4D 16,423 14,424 Deficit attributable to the Australian Government (770) (230)
Other comprehensive incomeChanges in asset revaluation reserves – (422)Total other comprehensive income – (422)
Total comprehensive loss attributable to the Australian Government (770) (652)
The above statement should be read in conjunction with the accompanying notes.

Balance Sheetas at 30 June 2012
Notes2012
$’0002011
$’000
Assets
Financial AssetsCash and cash equivalents 5A 1,681 1,081 Trade and other receivables 5B 6,139 7,804 Total financial assets 7,820 8,885
Non-Financial AssetsInfrastructure, plant and equipment 6A,B 5,423 5,822 Intangibles 6C,D 907 –Other non-financial assets 6E 108 45 Total non-financial assets 6,438 5,867 Total assets 14,258 14,752
Liabilities
PayablesSuppliers payables 7A 2,048 816 Other payables 7B 3,060 4,327 Total payables 5,108 5,143
Non-interest Bearing LiabilitiesLease incentives 8A 5,095 5,667 Total non-interest bearing liabilities 5,095 5,667
ProvisionsEmployee provisions 9A 2,935 2,302 Other provisions 9B 238 335 Total provisions 3,173 2,637 Total liabilities 13,376 13,447
Net assets 882 1,305

EquityContributed equity 1,788 1,442 Accumulated results (906) (137)Total equity 882 1,305
The above statement should be read in conjunction with the accompanying notes.
Statement of Changes in Equityfor the period ended 30 June 2012
Accumulated results
Asset revaluation
reserveContributed
equity/capitalTotal equity
2012$’000
2011$’000
2012$’000
2011$’000
2012$’000
2011$’000
2012$’000
2011$’000
Opening balanceBalance carried forward from previous period (137) 93 – 422 1,442 115 1,305 630 Adjusted opening balance (137) 93 – 422 1,442 115 1,305 630
Comprehensive incomeChanges in asset revaluation reserves:
Computer, plant and equipment – – – (40) – – – (40)Leasehold improvements – – – (382) – – – (382)
Deficit for the period (770) (230) (770) (230)Total comprehensive income (770) (230) – (422) – – (770) (652)of which:
Attributable to the Australian Government (770) (230) – (422) – – (770) (652)
Transactions with owners
Contributions by ownersEquity Injection – Appropriations – – – – – 510 – 510 Departmental Capital Budget – – – – 346 817 346 817 Sub-total transactions with owners – – – – 346 1,327 346 1,327 Closing balance attributable to the Australian
(906) (137) – – 1,788 1,442 882 1,305

Government
The above statement should be read in conjunction with the accompanying notes.
Cash Flow Statementfor the period ended 30 June 2012
Notes2012
$’0002011
$’000
OPERATING ACTIVITIES
Cash receivedGoods and services 5,195 7,139 Appropriations 16,153 14,424 Net GST received 94 101 Cash transferred from the Official Public Account 10,893 5,900 Total cash received 32,335 27,564
Cash usedEmployees (14,327) (11,826)Suppliers (8,029) (8,755)Section 31 Receipts transferred to the Offical Public Account (9,315) (6,325)Total cash used (31,671) (26,906)Net cash from operating activities 10 664 658
INVESTING ACTIVITIES
Cash receivedProceeds from lease incentive – 5,577 Total cash received – 5,577

Cash usedPurchase of infrastructure, plant and equipment (711) (5,593)Purchase of intangibles (540) –Total cash used (1,251) (5,593)Net cash used by investing activities (1,251) (16)
FINANCING ACTIVITIES
Cash receivedAppropriations – Capital Injection 1,187 –Total cash received 1,187 –
Cash and cash equivalents at the beginning of the reporting period 1,081 642 Net increase in cash held 600 439 Cash and cash equivalents at the end of the reporting period
5A 1,681 1,081
The above statement should be read in conjunction with the accompanying notes.
Schedule of Commitmentsas at 30 June 2012
2012$’000
2011$’000
BY TYPE
Commitments receivableSublease rental income (10,074) (10,999)Other commitments receivable (5,515) (2,269)Net GST recoverable on commitments1 (1,602) (2,122)Total commitments receivable (17,191) (15,390)
Commitments payable
Capital commitmentsInfrastructure, plant and equipment2 137 1,157 Total capital commitments 137 1,157
Other commitmentsOperating leases2 34,360 37,423 Other 316 150 Total other commitments 34,676 37,573

2012$’000
2011$’000
Net commitments by type 17,622 23,340
BY MATURITY
Commitments receivable
Operating lease incomeOne year or less (960) (925)From one to five years (5,375) (5,179)Over five years (3,738) (4,895)Total operating lease income (10,074) (10,999)
Other commitments receivableOne year or less (5,808) (1,974)From one to five years (1,309) (2,417)Total other commitments receivable (7,117) (4,391)Total commitments receivable (17,191) (15,390)
Commitments Payable
Capital commitmentsOne year or less 137 1,157 Total capital commitments 137 1,157
Operating lease commitmentsOne year or less 3,575 3,327 From one to five years 18,286 17,731 Over five years 12,499 16,365 Total operating lease commitments 34,360 37,423
Other CommitmentsOne year or less 316 150 Total other commitments 316 150 Total commitments payable 34,813 38,730 Net commitments by maturity 17,622 23,340
Note: Commitments are GST inclusive where relevant.
Nature of Leases/General Description1. Outstanding payments for leasehold improvements2. Operating leases included are effectively non-cancellable and comprise:Leases for office accommodationLease payments are subject to fixed annual rental increases. The initial period of accommodation are still current and there are 2 options in the lease agreement to renew.Agreements for the provision of motor vehicles to senior executive officersNo contingent rentals exist and there are no renewal or purchase options available to the Commission.Lease agreement in relation to the provision of desktop computer equipment and printersThe lessor provides all desktop computer equipment and software. The lease agreement allows for variations to the duration of the rental period and to the equipment being provided.Other commitmentsConsists of agreements with other entities for the provision of goods and services, outgoings and agreements equally proportionately unperformed.

The above statement should be read in conjunction with the accompanying notes.
Schedule of Contingenciesas at 30 June 2012
2012$’000
2011$’000
Contingent assets – –Total contingent assets – –
Contingent liabilitiesMake-good costs 79 –Total contingent liabilities 79 –
Net contingent liabilities ( 79) –
Details of each class of contingent assets and liabilities, including those not included above because they cannot be quantified, are disclosed in Note 11: Contingent liabilities and assets.
This schedule should be read in conjunction with the accompanying notes.
Administered Schedule of Comprehensive Incomefor the period ended 30 June 2012
Notes2012
$’0002011
$’000
EXPENSESSuppliers 15 122 –Total expenses administered on behalf of Government 122 –
Net cost of services 122 –Deficit (122) –
The above schedule should be read in conjunction with the accompanying notes.

Administered Schedule of Assets and Liabilitiesas at 30 June 2012
Notes2012
$’0002011
$’000
ASSETS
Financial assetsTrade and other receivables 16 12 –Total financial assets 12 –
Total assets administered on behalf of Government 12 –
LIABILITIES
PayablesSuppliers 17 1 –Total liabilities administered on behalf of Government 1 –
Net assets 11 –
The above schedule should be read in conjunction with the accompanying notes.
Administered Reconciliation Schedule
2012$’000
2011$’000
Opening administered assets less administered liabilities as at 1 July – –Surplus (deficit) items:Less: Administered expenses (non CAC) (122) –
Administered transfers to/from Australian Government:
Appropriation transfers from OPA:Annual appropriations for administered expenses (non CAC) 133 –
Closing administered assets less administered liabilities
11 –
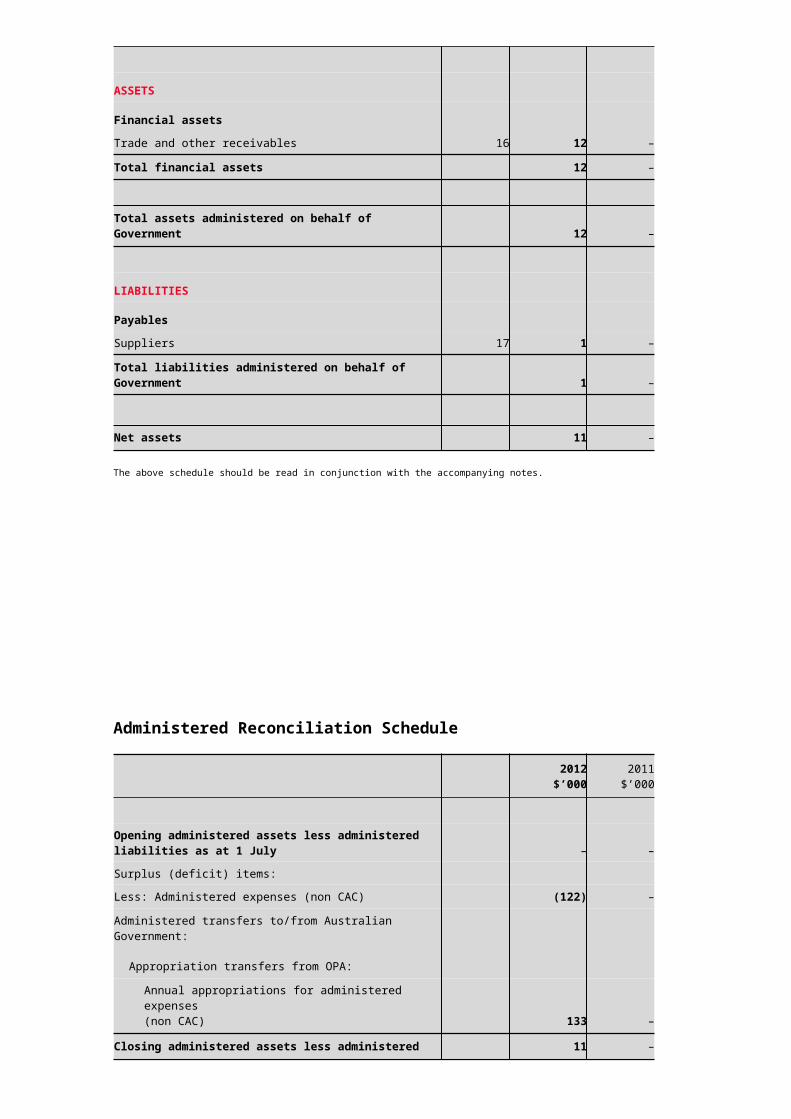
as at 30 June
The above schedule should be read in conjunction with the accompanying notes.
Administered Cash Flow Statementfor the period ended 30 June 2012
Notes2012
$’0002011
$’000
OPERATING ACTIVITIESCash received – –Total cash received – –
Cash usedSuppliers 15 (122) –Total cash used (122) –Net cash flows used by operating activities (122) –
Cash and cash equivalents at the beginning of the reporting period – –
Cash from Official Public Account for: – Appropriations 122 –Cash and cash equivalents at the end of the reporting period – –
This schedule should be read in conjunction with the accompanying notes.
Schedule of Administered Commitmentsas at 30 June 2012
Notes2012
$’0002011
$’000
BY TYPECommitments receivable – –Total commitments receivable – –
Commitments payable – –Total commitments payable – –Net commitments by type – –

BY MATURITYCommitments receivable – –Total commitments receivable – –
Commitments payable – –Total commitments payable – –Net commitments by maturity – –
The above schedule should be read in conjunction with the accompanying notes.
Schedule of Administered Contingenciesas at 30 June 2012
2012$’000
2011$’000
Administered contingent assets – –Administered contingent liabilities – –Net administered contingent assets/(liabilities) – –
Details of each class of contingent liabilities and contingent assets in the above table are disclosed in Note 19, along with information on significant remote contingencies and contingencies that cannot be quantified.
The above schedule should be read in conjunction with the accompanying notes.
Notes to and forming part of the financial statementsfor the period ended 30 June 2012
Note 1: Summary of Significant Accounting Policies1.1 Objectives of The Australian Human Rights CommissionThe Australian Human Rights Commission (the Commission) is an Australian Government controlled entity. It is a not-for-profit entity. The Commission’s objective is to ensure that Australians have access to independent human rights complaint handling and public inquiries processes and benefit from human rights education, promotion, monitoring and compliance activities.The Commission is structured to meet the following outcome:“An Australian Society in which human rights are respected, protected and promoted through independent investigation and resolution of complaints, education and research to promote and eliminate discrimination, and monitoring, and reporting on human rights.”
The continued existence of the Commission in its present form and with its present programs is dependent on Government policy and on continuing appropriations by Parliament for the Commission’s

administration and programs.Commission activities contributing toward this outcome are classified as either departmental or administered. Departmental activities involve the use of assets, liabilities, income and expenses controlled or incurred by the Commission in its own right. Administered activities involve the management or oversight by the Commission, on behalf of the Government, of items controlled or incurred by the Government.The administered activities conducted by the Commission on behalf of the Government relate to the National Anti-racism Partnership Strategy.
1.2 Basis of Preparation of the Financial StatementsThe financial statements are required by section 49 of the Financial Management and Accountability Act 1997 and are general purpose financial statements.The Financial Statements have been prepared in accordance with:• Finance Minister’s Orders (or FMO) for reporting periods ending on or after 1 July 2011; and•Australian Accounting Standards and Interpretations issued by the Australian Accounting Standards Board (AASB) that apply for the reporting period.The financial statements have been prepared on an accrual basis and in accordance with the historical cost convention, except for certain assets and liabilities at fair value. Except where stated, no allowance is made for the effect of changing prices on the results or the financial position.The financial statements are presented in Australian dollars and values are rounded to the nearest thousand dollars unless otherwise specified. Unless an alternative treatment is specifically required by an accounting standard or the FMO, assets and liabilities are recognised in the balance sheet when and only when it is probable that future economic benefits will flow to the entity or a future sacrifice of economic benefits will be required and the amounts of the assets or liabilities can be reliably measured. However, assets and liabilities arising under Agreements Equally Proportionately Unperformed are not recognised unless required by an accounting standard. Liabilities and assets that are unrecognised are reported in the schedule of commitments or the schedule of contingencies.Unless alternative treatment is specifically required by an accounting standard, income and expenses are recognised in the statement of comprehensive income when and only when the flow, consumption or loss of economic benefits has occurred and can be reliably measured.
1.3 Significant Accounting Judgements and EstimatesNo significant accounting assumptions or estimates have been identified that have a significant risk of
causing a material adjustment to carrying amounts of assets and liabilities within the next accounting period.
1.4 New Australian Accounting StandardsAdoption of New Australian Accounting Standard RequirementsNo accounting standard has been adopted earlier than the application date as stated in the standard. Future Australian Accounting Standard RequirementsNew standards, revised standards, interpretations and amending standards issued by the Australian Accounting Standards Board prior to the signing of the statement by the Chief Executive and Chief Finance Officer, are not expected to have a material financial impact on the Commission for future reporting periods.
1.5 RevenueRevenue from GovernmentAmounts appropriated for departmental outputs for the year (adjusted for any formal additions and reductions) are recognised as revenue when the Commission gains control of the appropriation, except for certain amounts that relate to activities that are reciprocal in nature, in which case revenue is recognised only when it has been earned.Appropriations receivable are recognised at their nominal amounts.Other Types of RevenueRevenue from the sale of goods is recognised when:
the risks and rewards of ownership have been transferred to the buyer; the Commission retains no managerial involvement or effective control over the goods; the revenue and transaction costs incurred can be reliably measured; and it is probable that the economic benefits associated with the transaction will flow to the

entity. Revenue from rendering of services is recognised by reference to the stage of completion of
contracts at the reporting date. The revenue is recognised when:
the amount of revenue, stage of completion and transaction costs incurred can be reliably measured; and
the probable economic benefits associated with the transaction will flow to the entity. The stage of completion of contracts at the reporting date is determined by reference to: the proportion that costs incurred to date bear to the estimated total costs of the transaction.
Receivables for goods and services, which have 30 day terms, are recognised at the nominal amounts due less any impairment allowance account. Collectability of debts is reviewed at end of reporting period. Allowances are made when collectability of the debt is no longer probable.
1.6 GainsResources Received Free of ChargeResources received free of charge are recognised as gains when, and only when, a fair value can be reliably determined and the services would have been purchased if they had not been donated. Use of those resources is recognised as an expense.Sale of AssetsGains from disposal of assets are recognised when control of the asset has passed to the buyer.
1.7 Transactions with the Government as OwnerEquity InjectionsAmounts appropriated which are designated as ‘equity injections’ for a year (less any formal reductions) and Departmental Capital Budgets (DCBs) are recognised directly in contributed equity in that year.Other Distributions to OwnersThe FMOs require that distributions to owners be debited to contributed equity unless in the nature of a dividend.
1.8 Employee BenefitsLiabilities for ‘short-term employee benefits’ (as defined in AASB 119 Employee Benefits) and termination benefits due within twelve months of end of reporting period are measured at their nominal amounts.The nominal amount is calculated with regard to the rates expected to be paid on settlement of the liability.Other long-term employee benefits are measured as net total of the present value of the defined benefit obligation at the end of the reporting period minus the fair value at the end of the reporting period of plan assets (if any) out of which the obligations are to be settled directly. LeaveThe liability for employee benefits includes provision for annual leave and long service leave. No provision has been made for sick leave as all sick leave is non-vesting and the average sick leave taken in future years by employees of the Commission is estimated to be less than the annual entitlement for sick leave.The leave liabilities are calculated on the basis of employees’ remuneration at the estimated salary rates that will applied at the time the leave is taken, including the Commission’s employer superannuation contribution rates to the extent that the leave is likely to be taken during service rather than paid out on termination.The liability for long service leave has been determined by reference to the work of an actuary as at 30 June 2012. The estimate of the present value of the liability takes into account attrition rates and pay increases through promotion and inflation.Separation and RedundancyProvision is made for separation and redundancy benefit payments. The Commission recognises a provision for termination when it has developed a detailed formal plan for the terminations and has informed those employees affected that it will carry out the terminations.
SuperannuationStaff of the Commission are members of the Commonwealth Superannuation Scheme (CSS), the Public Sector Superannuation Scheme (PSS) or the PSS accumulation plan (PSSap).The CSS and PSS are defined benefit schemes for the Australian Government. The PSSap is a defined contribution scheme.

The liability for defined benefits is recognised in the financial statements of the Australian Government and is settled by the Australian Government in due course. This liability is reported by the Department of Finance and Deregulation as an administered item.The Commission makes employer contributions to the employee superannuation scheme at rates determined by an actuary to be sufficient to meet the current cost to the Government of the superannuation entitlements of the Commission’s employees. The Commission accounts for the contributions as if they were contributions to defined contribution plans.The liability for superannuation recognised as at 30 June represents outstanding contributions for the final fortnight of the year.
1.9 LeasesA distinction is made between finance leases and operating leases. Finance leases effectively transfer from the lessor to the lessee substantially all the risks and rewards incidental to ownership of leased assets. An operating lease is a lease that is not a finance lease. In operating leases, the lessor effectively retains substantially all such risks and benefits.Where an asset is acquired by means of a finance lease, the asset is capitalised at either the fair value of the lease infrastructure or, if lower, the present value of minimum lease payments at the inception of the contract and a liability is recognised at the same time and for the same amount. The discount rate used is the interest rate implicit in the lease. Leased assets are amortised over the period of the lease. Lease payments are allocated between the principal component and the interest expense.Operating lease payments are expensed on a straight-line basis which is representative of the pattern of benefits derived from the leased assets.
1.10 CashCash and cash equivalents includes cash on hand, cash held with outsiders, demand deposits in bank accounts with an original maturity of 3 months or less that are readily convertible to known amounts of cash and subject to insignificant risk of changes in value. Cash is recognised at its nominal amount.
1.11 Financial AssetsThe Commission classifies its financial assets as ‘loans and receivables’.The classification depends on the nature and purpose of the financial assets and is determined at the time of initial recognition.Financial assets are recognised and derecognised upon trade date.Effective Interest MethodThe effective interest method is a method of calculating the amortised cost of a financial asset and of allocating interest income over the relevant period. The effective interest rate is the rate that exactly discounts estimated future cash receipts through the expected life of the financial asset, or, where appropriate, a shorter period.Loans and ReceivablesTrade receivables, loans and other receivables that have fixed or determinable payments that are not quoted in an active market are classified as ‘loans and receivables’. Loans and receivables are measured at cost. Impairment of Financial AssetsFinancial assets are assessed for impairment at the end of each reporting period.Financial assets held at cost – If there is objective evidence that an impairment loss has been incurred for loans and receivables the amount of the impairment loss is the difference between the carrying amount of the asset and the present value of the estimated future cash flows discounted at the current market rate for similar assets.
1.12 Financial LiabilitiesFinancial liabilities are classified as ‘other financial liabilities’.Financial liabilities are recognised and derecognised upon ‘trade date’.Other Financial LiabilitiesOther financial liabilities, including borrowings, are initially measured at fair value, net of transaction costs. Other financial liabilities are subsequently measured at amortised cost using the effective interest

method, with interest expense recognised on an effective yield basis. The effective interest method is a method of calculating the amortised cost of a financial liability and of allocating interest expense over the relevant period. The effective interest rate is the rate that exactly discounts estimated future cash payments through the expected life of the financial liability, or, where appropriate, a shorter period.Supplier and other payables are recognised at amortised cost. Liabilities are recognised to the extent that the goods or services have been received (and irrespective of having been invoiced).
1.13 Contingent Liabilities and Contingent AssetsContingent liabilities and contingent assets are not recognised in the balance sheet but are reported in the relevant schedules and notes. They may arise from uncertainty as to the existence of a liability or asset or represent an asset or liability in respect of which the amount cannot be reliably measured. Contingent assets are disclosed when settlement is probable but not virtually certain and contingent liabilities are disclosed when settlement is greater than remote.
1.14 Acquisition of AssetsAssets are recorded at cost on acquisition except as stated below. The cost of acquisition includes the fair value of assets transferred in exchange and liabilities undertaken. Financial assets are initially measured at their fair value plus transaction costs where appropriate.Assets acquired at no cost, or for nominal consideration, are initially recognised as assets and income at their fair value at the date of acquisition, unless acquired as a consequence of restructuring of administrative arrangements. In the latter case, assets are initially recognised as contributions by owners at the amounts at which they were recognised in the transferor agency’s accounts immediately prior to the restructuring.
1.15 Infrastructure, Plant and Equipment Asset Recognition ThresholdPurchases of infrastructure, plant and equipment are recognised initially at cost in the balance sheet, except for purchases costing less than $2,000, which are expensed in the year of acquisition (other than where they form part of a group of similar items which are significant in total).The initial cost of an asset includes an estimate of the cost of dismantling and removing the item and restoring the site on which it is located. This is particularly relevant to ‘make good’ provisions in property leases taken up by the Commission where there exists an obligation to restore the property to its original condition. These costs are included in the value of the Commission’s leasehold improvements with a corresponding provision for the ‘make good’ recognised.RevaluationsFair values for each class of asset are determined as shown below:
Asset Class Fair Value Measured at:
Computer, plant and equipment Market valueLeasehold improvements Depreciated replacement cost
Following initial recognition at cost, infrastructure, plant and equipment are carried at fair value less subsequent accumulated depreciation and accumulated impairment losses. Valuations are conducted with sufficient frequency to ensure that the carrying amounts of assets do not differ materially from the assets’ fair values as at the reporting date. The regularity of independent valuations depends upon the volatility of movements in market values for the relevant assets. Revaluation adjustments are made on a class basis. Any revaluation increment is credited to equity under the heading of asset revaluation reserve except to the extent that it reverses a previous revaluation decrement of the same asset class that was previously recognised in the surplus/deficit. Revaluation decrements for a class of assets are recognised directly in the surplus/deficit except to the extent that they reverse a previous revaluation increment for that class.Any accumulated depreciation as at the revaluation date is eliminated against the gross carrying amount of the asset and the asset restated to the revalued amount.Depreciation

Depreciable infrastructure, plant and equipment assets are written-off to their estimated residual values over their estimated useful lives to the Commission using, in all cases, the straight-line method of depreciation.Depreciation rates (useful lives), residual values and methods are reviewed at each reporting date and necessary adjustments are recognised in the current, or current and future reporting periods, as appropriate.
Depreciation rates applying to each class of depreciable asset are based on the following useful lives:
Asset Class 2012 2011
Computer, plant and equipment 4 to 10 years 4 to 10 yearsLeasehold improvements Lease term Lease term
ImpairmentAll assets were assessed for impairment at 30 June 2012. Where indications of impairment exist, the asset’s recoverable amount is estimated and an impairment adjustment made if the asset’s recoverable amount is less than its carrying amount.The recoverable amount of an asset is the higher of its fair value less costs to sell and its value in use. Value in use is the present value of the future cash flows expected to be derived from the asset. Where the future economic benefit of an asset is not primarily dependent on the asset’s ability to generate future cash flows, and the asset would be replaced if the Commission were deprived of the asset, its value in use is taken to be its depreciated replacement cost.DerecognitionAn item of infrastructure, plant and equipment is derecognised upon disposal or when no further future economic benefits are expected from its use or disposal.
1.16 IntangiblesThe Commission’s intangibles comprise internally developed and/or customised software for internal use. These assets are carried at cost less accumulated amortisation and accumulated impairment losses.Software is amortised on a straight-line basis over its anticipated useful life. The useful lives of the Commission’s software are 2 to 5 years (2010-11: 2 to 5 years).All software assets were assessed for indications of impairment as at 30 June 2012.
1.17 TaxationThe Commission is exempt from all forms of taxation except Fringe Benefits Tax (FBT) and the Goods and Services Tax (GST).Revenues, expenses and assets are recognised net of GST except:
where the amount of GST incurred is not recoverable from the Australian Taxation Office; and for receivables and payables.
1.18 Reporting of Administered ActivitiesAdministered revenues, expenses, assets, liabilities and cash flows are disclosed in the administered schedules and related notes.Except where otherwise stated below, administered items are accounted for on the same basis and using the same policies as for departmental items, including the application of Australian Accounting Standards.Administered Cash Transfers to and from the Official Public AccountRevenue collected by the entity for use by the Government rather than the entity is administered revenue. Collections are transferred to the Official Public Account (OPA) maintained by the Department of Finance and Deregulation. Conversely, cash is drawn from the OPA to make payments under Parliamentary appropriation on behalf of Government. These transfers to and from the OPA are adjustments to the administered cash held by the entity on behalf of the Government and reported as such in the schedule of administered cash flows and in the administered reconciliation schedule.

Note 2: Events After the Reporting PeriodThe Commission is not aware of any significant events that have occurred since balance date that warrant disclosure in these financial statements.
Reporting of Administered ActivitiesThe Commission is not aware of any significant events that have occurred since balance date that warrant disclosure in these financial statements.
Note 3: Expenses
2012$’000
2011$’000
Note 3A: Employee BenefitsWages and salaries 11,690 9,523
Superannuation:Defined contribution plans 1,038 749 Defined benefit plans 760 761
Leave and other entitlements 1,279 813 Separation and redundancies 220 173 Other employee expenses 77 69 Total employee benefits 15,064 12,088
Note 3B: Supplier
Goods and servicesGeneral property operating expenses 783 654 Insurance 45 38 Office consumables 124 112 Official travel 1,111 1,309 Postage and freight 45 51 Printing and publications 199 213 Professional services and fees 2,317 2,001 Reference materials, subscriptions and licences 341 260 Staff training 100 131 Telecommunications 289 277 Other 565 309 Total goods and services 5,920 5,355

Goods and services are made up of:Provision of goods – related entities 4 66 Provision of goods – external parties 862 617 Rendering of services – related entities 399 537 Rendering of services – external parties 4,655 4,135
Total goods and services 5,920 5,355
Other supplier expenses
Operating lease rentals – related entities:Minimum lease payments 2,473 2,206
Workers compensation expenses 39 33 Total other supplier expenses 2,512 2,239 Total supplier expenses 8,432 7,594
Note 3C: Depreciation and Amortisation
Depreciation:
Infrastructure, plant and equipment:Computer, plant and equipment 118 283
Total depreciation 118 283
Amortisation:
Infrastructure, plant and equipment:Deferred costs – make good – 56 Amortisation leasehold Improvements 559 –
Intangibles:Computer software 43 19
Total amortisation 602 75 Total depreciation and amortisation 720 358
Note 3D: Finance CostsUnwinding of discount – 25 Total finance costs – 25
Note 3E: Write-Down and Impairment of Assets
Asset write-downs and impairments from:Infrastructure, plant and equipment – written off 5 232 Financial assets – written off 1 –Bad debts – written off 19 –
Total write-down and impairment of assets 25 232

Note 4: Income
2012$’000
2011$’000
OWN-SOURCE REVENUE
Note 4A: Sale of Goods and Rendering of ServicesProvision of goods – external parties 2 2 Rendering of services – related entities 5,581 4,269 Rendering of services – external parties 504 599 Total sale of goods and rendering of services 6,087 4,870
Note 4B: Other Revenue
Rental Income
Operating lease:Sub lease rental income 841 675
Total rental income 841 675
GAINS
Note 4C: Other GainsResources received free of charge 50 50 Gain on reduction of prior year provisions 69 48 Total other gains 119 98
REVENUE FROM GOVERNMENT
Note 4D: Revenue from Government
Appropriations:Departmental Appropriations 16,423 14,424
Total revenue from Government 16,423 14,424

Note 5: Financial Assets
2012$’000
2011$’000
Note 5A: Cash and Cash EquivalentsCash on hand or on deposit 1,681 1,081 Total cash and cash equivalents 1,681 1,081
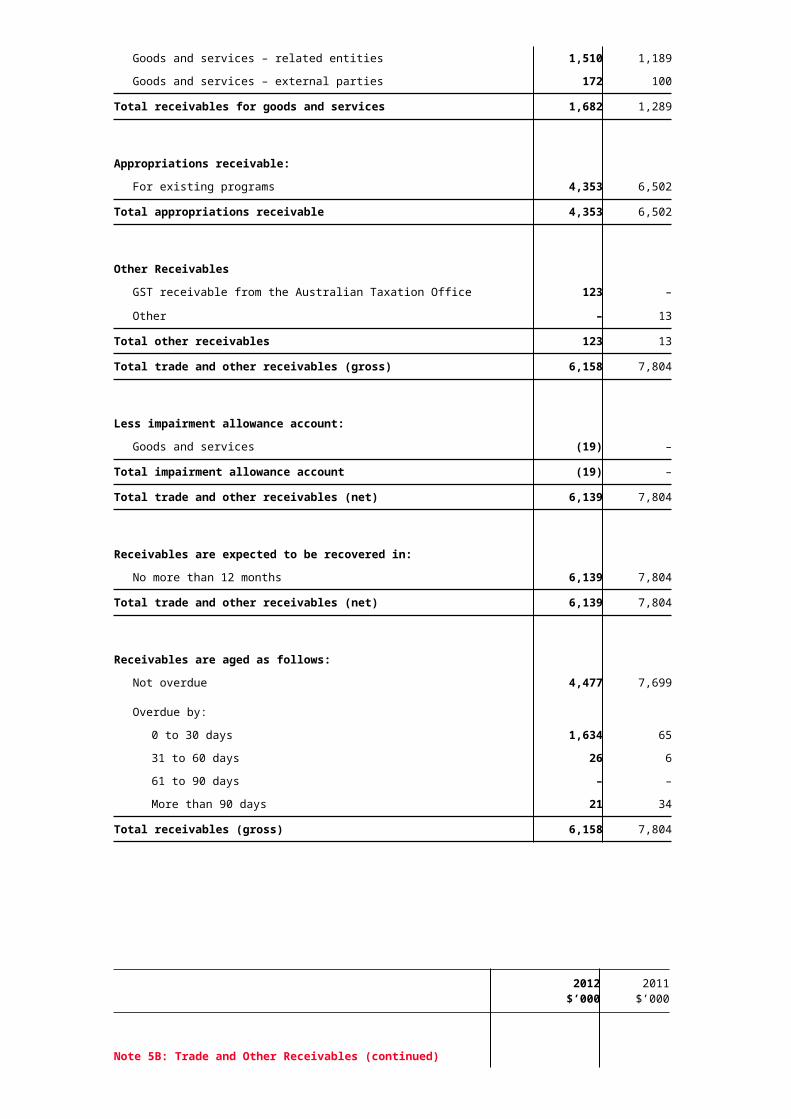
Note 5B: Trade and Other Receivables
Goods and Services:Goods and services – related entities 1,510 1,189 Goods and services – external parties 172 100
Total receivables for goods and services 1,682 1,289
Appropriations receivable:For existing programs 4,353 6,502
Total appropriations receivable 4,353 6,502
Other ReceivablesGST receivable from the Australian Taxation Office 123 –Other – 13
Total other receivables 123 13 Total trade and other receivables (gross) 6,158 7,804
Less impairment allowance account:Goods and services (19) –
Total impairment allowance account (19) –Total trade and other receivables (net) 6,139 7,804

Receivables are expected to be recovered in:No more than 12 months 6,139 7,804
Total trade and other receivables (net) 6,139 7,804
Receivables are aged as follows:Not overdue 4,477 7,699
Overdue by:0 to 30 days 1,634 65 31 to 60 days 26 6 61 to 90 days – –More than 90 days 21 34
Total receivables (gross) 6,158 7,804
2012$’000
2011$’000
Note 5B: Trade and Other Receivables (continued)
The impairment allowance account is aged as follows:
Overdue by:0 to 30 days – –31 to 60 days – –61 to 90 days – –More than 90 days (19) –
Total impairment allowance account (19) –
Reconciliation of the Impairment Allowance Account:
Movements in relation to 2011-12
Goods and services
$’000Total
$’000
Opening balance – –Amounts written off (19) (19)
Closing balance (19) (19)
Note 6: Non-Financial Assets
2012$’000
2011$’000
Note 6A: Infrastructure, Plant and Equipment

Computer, plant and equipment:Gross carrying value (at fair value) 606 368 Accumulated depreciation (201) (123)
Total computer, plant and equipment 405 245
Leasehold improvements:Gross carrying value (at fair value) 5,578 5,984 Accumulated amortisation (559) (407)Deferred costs – make good – 388 Accumulated amortisation – (388)
Total leasehold improvements 5,018 5,577 Total infrastructure, plant and equipment 5,423 5,822 No revaluations were conducted as at 30 June 2012. No indicators of impairment were found for infrastructure, plant and equipment.
Computer,plant &
equipment$’000
LeaseholdImprovem
ents$’000
Total$’000
As at 1 July 2011Gross book value 368 5,984 6,352 Accumulated depreciation and impairment (123) (407) (530)
Net book value 1 July 2011 245 5,577 5,822
Additions:By purchase 238 – 238
Depreciation/Amortisation expense (118) (559) (677)
Disposals:Other 40 – 40
Net book value 30 June 2012 405 5,018 5,423
Net book value as of 30 June 2012 represented by:Gross book value 606 5,577 6,183 Accumulated depreciation and impairment (201) (559) (760)
405 5,018 5,423
Note 6B: Reconciliation of the Opening and Closing Balances of Infrastructure, Plant and Equipment 2010-11
Computer, plant
&
LeaseholdImproveme
nts
Total$’000
equipment$’000 $’000
As at 1 July 2010Gross book value 784 789 1,573 Accumulated depreciation and impairment – (351) (351)Net Book Value 1 July 2010 784 438 1,222
Additions:By purchase 16 5,577 5,593
Revaluations and impairments recognised through equity (40) (382) (422)Depreciation/Amortisation expense (283) (56) (339)
Disposals:Other (232) – (232)
Net Book Value 30 June 2011 245 5,577 5,822
Net book value as of 30 June 2011 represented by:Gross book value 368 5,984 6,352 Accumulated depreciation and impairment (123) (407) (530)
245 5,577 5,822
2012$’000
2011$’000
Note 6C: Intangibles
Computer software:
Internally customised – in progress 166 –
Internally customised – in use – 31
Internally developed – in use 784 440
Total computer software (gross) 950 471
Accumulated amortisation (43) (471)
Total computer software (net) 907 –
Total intangibles 907 –
No indicators of impairment were found for intangible assets.No intangibles are expected to be sold or disposed of within the next 12 months.
Computer software
internally
Computer software
internally
Computer software
internally
Total$’000

customised – in
progress$’000
customised – in use
$’000
developed
in use$’000
As at 1 July 2011Gross book value – 31 440 471 Accumulated amortisation and impairment – (31) (440) (471)
Net book value 1 July 2011 – – – –
Additions:By purchase or internally customised 166 – 784 950
Amortisation – – (43) (43)
Net book value 30 June 2012 166 – 741 907
Net book value as of 30 June 2012 represented by:Gross book value 166 – 784 950 Accumulated amortisation and impairment – – (43) (43)
166 – 741 907
Note 6D: Reconciliation of the Opening and Closing Balances of Intangibles 2010-11
Computer software
internally customised
– in progress
$’000
Computer software
internally customised
– in use$’000
Computer software
internally developed
in use$’000
Total$’000
As at 1 July 2010Gross book value – 31 440 31 Accumulated amortisation and impairment – (23) ( 429) ( 23)Net book value 1 July 2010 – 8 11 8 Amortisation – ( 8) (11) ( 8)Net book value 30 June 2011 – – – –
Net book value as of 30 June 2011 represented by:Gross book value – 31 440 31 Accumulated amortisation and impairment – (31) (440) ( 31)
– – – –
2012$’000
2011$’000
Note 6E: Other Non-Financial AssetsPrepayments 108 45 Total other non-financial assets 108 45

Total other non-financial assets – are expected to be recovered in:
No more than 12 months 101 41 More than 12 months 7 4
Total other non-financial assets 108 45 No indicators of impairment were found for other non-financial assets.
Note7: Payables
2012$’000
2011$’000
Note 7A: SuppliersTrade creditors and accruals 1,616 816 Rent payable 432 –Total suppliers payables 2,048 816
Suppliers payables expected to be settled within 12 months:Related entities 360 132 External parties 1,688 684 Total 2,048 816
Settlement is generally made in accordance with the terms of the supplier invoice.
Note 7B: Other PayablesSalaries and wages 349 260 Superannuation 54 38 Other employee expenses 9 8 Revenue received in advance 2,640 3,964 Administered GST Payable 8 57 Total other payables 3,060 4,327
Total other payables are expected to be settled in:No more than 12 months 2,595 3,087 More than 12 months 465 1,240 Total other payables 3,060 4,327
Note 8: Non-interest Bearing Liabilities
2012$’000
2011$’000
Note 8A: Non-interest Bearing LiabilitiesLease incentives i 5,095 5,667 Total non-interest bearing liabilities 5,095 5,667

Payable:Within one year 566 568 In one to five years 2,833 3,391 In more than five years 1,696 1,708 Total non-interest bearing liabilities 5,095 5,667
i. Lease incentive included in property operating lease.
Note 9: Provisions
2012$’000
2011$’000
Note 9A: Employee ProvisionsLeave 2,850 2,302 Separation and redundancies 84 –Total employee provisions 2,935 2,302
Employee provisions are expected to be settled in:No more than 12 months 2,215 1,856 More than 12 months 720 446 Total employee provisions 2,935 2,302
Note 9B: Other ProvisionsProvision for contract obligations 159 256 Provision for restoration obligations 79 79 Total other provisions 238 335
Other provisions are expected to be settled in:No more than 12 months 159 335 More than 12 months 79 –Total other provisions 238 335
Provisionfor
contractobligation
s$’000
Provision for
restoration
obligations
$’000Total$’000
Carrying amount 1 July 2011 256 79 335 Additional provisions made 88 – 88 Amounts used (185) – (185)Closing balance 2012 159 79 238

Note 10: Cash Flow Reconciliation
2012$’000
2011$’000
Reconciliation of cash and cash equivalents as per Balance Sheet to Cash Flow Statement
Cash and cash equivalents as per:Cash flow statement 1,681 1,081 Balance sheet 1,681 1,081 Difference – –
Reconciliation of net cost of services to net cash from operating activities:Net cost of services (17,194) (14,654)Add revenue from Government 16,423 14,424
Adjustments for non-cash itemsDepreciation/amortisation 720 358 Finance costs and restoration obligations – 25 Net write down of financial assets 19 –Net write down of non-financial assets 5 232 Unwinding of leasehold fitout incentive (572) –
Changes in assets / liabilities(Increase) / decrease in net receivables 773 (467)(Increase) / decrease in other non-financial assets (63) 41 Increase / (decrease) in employee provisions 736 205 Increase / (decrease) in supplier payables 1,232 (209)Increase / (decrease) in other payables (1,319) 1,176 Increase / (decrease) in other provisions (97) (515)Increase / (decrease) in non-interest bearing liabilities – 42 Net cash from operating activities 664 658
Note 11: Contingent Assets and LiabilitiesUnquantifiable ContingenciesAt 30 June 2012, the Commission (or officers of the Commission) was named as a respondent in one application before the Administrative Decisions Judicial Review (ADJR).The Commission is also appearing as an intervener in three matters before the Family Court of Australia and one matter before the High Court.

It is not possible to estimate the amounts of the eventual payments that may be required in relation to the unresolved claims, though it is not common for costs to be awarded against the Commission in these matters.
Note 12: Senior Executive Remuneration
2012$
2011$
Note 12A: Senior Executive Remuneration Expenses for the Reporting Period
Short-term employee benefits:Salary 2,002,310 1,345,811 Annual leave accrued 73,862 9,866 Other 58,203 31,564
Total short-term employee benefits 2,134,375 1,387,241
Post-employment benefits:Superannuation 197,663 137,935
Total post-employment benefits 197,663 137,935
Other long-term benefits:Long-service leave 48,047 26,320
Total other long-term benefits 48,047 26,320
Termination benefits
Total employment benefits 2,380,085 1,551,496 Notes:1. Note 12A is prepared on an accrual basis (therefore the performance bonus expenses disclosed above may differ from the cash ‘Bonus paid’ in Note 12B).2. Note 12A excludes acting arrangements and part-year service where total remuneration expensed for a senior executive was less than $150,000.
Note 12B: Average Annual Reportable Remuneration Paid to Substantive Senior Executives During the Reporting Period

2012
Average annual reportable remuneration¹
Senior Executives
No.
Reportable salary²
$
Contributed superannuatio
n³ $
Reportable
allowances4
$
Bonus paid5
$ Total
Total remuneration (including part-time arrangements):
$180,000 to $209,999 2 171,821 26,322 – –198,14
2
$210,000 to $239,999 1 211,185 26,085 – –237,27
0
$270,000 to $299,999 6 220,804 40,266 9,701 –270,77
0
Total 9
2011
Average annual reportable remuneration¹
Senior Executives
No.
Reportable salary²
$
Contributed superannuation³
$
Reportable allowances
4
$
Bonus paid5
$ Total
Total remuneration (including part-time arrangements):
less than $150,000 1 145,000 – – –145,00
0
$150,000 to $179,999 1 171,765 – – –171,76
5
$180,000 to $209,999 4 191,120 – – –191,12
0
Total 6Notes:1. This table reports substantive senior executives who received remuneration during the reporting period. Each row is an averaged figure based on headcount for individuals in the band.2. ‘Reportable salary’ includes the following:
a) gross payments (less any bonuses paid, which are separated out and disclosed in the ‘bonus paid’ column);b) reportable fringe benefits (at the net amount prior to ‘grossing up’ to account for tax benefits); andc) exempt foreign employment income.
3. The ‘contributed superannuation’ amount is the average actual superannuation contributions paid to senior executives in that reportable remuneration band during the reporting period, including any salary sacrificed amounts payslips.4. ‘Reportable allowances’ are the average actual allowances paid as per the ‘total allowances’ line on individuals’ payment summaries.5. ‘Bonus paid’ represents average actual bonuses paid during the reporting period in that reportable remuneration band. The ‘bonus paid’ within a particular band may vary between financial years due to various factors such as individuals commencing with or leaving the entity during the financial year. There were no performance bonuses paid during the financial year6. Various salary sacrifice arrangements were available to senior executives including superannuation, motor vehicle and expense payment fringe benefits. Salary sacrifice benefits are reported in the ‘reportable salary’ column, excluding salary sacrificed superannuation, which is reported in the ‘contributed superannuation’ column.

Note 12C: Other Highly Paid Staff
2012
Average annual reportable remuneration¹
StaffNo.
Reportable salary²
$
Contributed superannuatio
n³ $
Reportable
allowances4
$
Bonus paid5
$ Total
Total remuneration (including part-time arrangements):
$150,000 to $179,999 2 110,131 44,602 – –154,73
3
Total 2
Notes:1. This table reports staff: a) who were employed by the entity during the reporting period; b) whose reportable remuneration was $150,000 or more for the financial period; and c) were not required to be disclosed in Tables A, B or director disclosures.
Each row is an averaged figure based on headcount for individuals in the band.2. ‘Reportable salary’ includes the following: a) gross payments (less any bonuses paid, which are separated out and disclosed in the ‘bonus paid’ column); b) reportable fringe benefits (at the net amount prior to ‘grossing up’ to account for tax benefits); and c) exempt foreign employment income.
3. The ‘contributed superannuation’ amount is the average actual superannuation contributions paid to staff in that reportable remuneration band during the reporting period, including any salary sacrificed amounts.4. ‘Reportable allowances’ are the average actual allowances paid as per the ‘total allowances’ line on individuals’ payment summaries.5. There were no bonuses paid to other highly paid staff during the financial year. 6. Various salary sacrifice arrangements were available to other highly paid staff including superannuation, motor vehicle and expense payment fringe benefits. Salary sacrifice benefits are reported in the ‘reportable salary’ column, excluding salary sacrificed superannuation, which is reported in the ‘contributed superannuation’ column.
Note 13: Remuneration of Auditors
2012 $’000
2011 $’000
Financial statement audit services were provided free of charge to the Commission by the Australian National Audit Office (ANAO).
Fair value of the services providedFinancial statement audit services 50 50
Total 50 50
No other services were provided by the ANAO.

Note 14: Financial Instruments
2012$’000
2011$’000
Note 14A: Categories of Financial Instruments
Financial Assets
Loans and receivables:
Cash and cash equivalents 1,681 1,081
Trade and other receivables 1,663 1,302
Appropriation receivable 4,353 6,502 GST receivable from the Australian Taxation Office (ATO) 125 –
Carrying amount of financial assets 7,822 8,885
Financial Liabilities
Other liabilities:
Trade creditors and accruals 2,048 816
Lease incentives 5,095 5,667
Revenue received in advance 2,640 3,964 GST payable to the Australian Taxation Office (ATO) 8 57
Carrying amount of financial liabilities 9,791 10,504
Carryingamount
2012$’000
Fairvalue 2012
$’000
Carryingamount
2011$’000
Fairvalue 2011
$’000
Note 14B: Fair Value of Financial Instruments
Financial AssetsCash and cash equivalents 1,681 1,681 1,081 1,081 Trade and other receivables 1,663 1,663 1,197 1,302

Appropriation receivable 4,353 4,353 6,502 6,502 GST receivable from the ATO 125 125 – –Total 7,822 7,822 8,780 8,885
Financial LiabilitiesTrade creditors and accruals 2,048 2,048 816 816 Lease incentives 5,095 5,095 5,667 5,667 Revenue received in advance 2,640 2,640 3,964 3,964 GST Payable to the ATO 8 8 57 57 Total 9,791 9,791 10,504 10,504
Note 14C: Credit RiskThe Commission’s maximum exposures to credit risk at reporting date in relation to each class of recognised financial asset is the carrying amount of those assets as indicated in the Balance Sheet.The Commission has no significant exposures to any concentrations of credit risk nor does it hold any collateral to mitigate against credit risk.
Credit quality of financial instruments not past due or individually determined as impaired:
Not past duenor
impaired 2012
$’000
Not past duenor
impaired2011
$’000
Past due or
impaired 2012
$’000
Past due orimpaired
2011$’000
Loans and receivablesCash and cash equivalents 1,681 1,081 – –Trade and other receivables 1,616 1,197 47 105 Appropriation receivable 4,353 6,502 – –GST receivable from the ATO 125 – – –Total 7,775 8,780 47 105
Ageing of financial assets that were past due but not impaired for 2012:
0 to 30days $’000
31 to 60days $’000
61 to 90days $’000
90+days $’000
Total $’000
Trade and other receivables 26 – – 21 47
Total 26 – – 21 47

Ageing of financial assets that were past due but not impaired for 2011:
0 to 30days$’000
31 to 60days$’000
61 to 90days$’000
90+days$’000
Total$’000
Trade and other receivables 65 6 – 34 105Total 65 6 – 34 105
Note 14D: Liquidity RiskThe Commission’s financial liabilities are payables, accrued expenses, revenue received in advance and other non-interest bearing liabilities. The exposure to liquidity risk is based on the notion that the Commission will encounter difficulty in meeting its obligations associated with financial liabilities. This is unlikely due to the appropriation funding and mechanisms available to the Commission (e.g. Advance to the Minister for Finance) and internal policies and procedures put in place to endure there are appropriate resources to meet its financial obligations.
Maturities for non-derivative financial liabilities 2012
Ondemand
$’000
within 1year
$’000
1 to 2years $’000
2 to 5years $’000
> 5years$’000
Total $’000
Trade creditors and accruals – 2,048 – – – 2,048 Lease incentives – 566 1,133 1,700 1,696 5,095 Revenue received in advance – 2,640 – – – 2,640 GST Payable to the ATO – 8 – – – 8
Total – 5,262 1,133 1,700 1,696 9,791
Maturities for non-derivative financial liabilities 2011
Ondemand
$’000
within 1year
$’000
1 to 2years $’000
2 to 5years $’000
> 5years$’000
Total $’000
Trade creditors and accruals – 816 – – – 816

Lease incentives – 568 566 1,700 2,833 5,667 Revenue received in advance – 3,964 – – – 3,964 GST Payable to the ATO – 57 – – – 57 Total – 5,405 566 1,700 2,833 10,504
The Commission had no derivative financial liabilities in both the current and prior year.
Note 14E: Market RiskThe Commission holds basic financial instruments that do not expose the Commission to certain market risks. The Commission is not exposed to ‘interest rate risk’, ‘currency risk’ or ‘other price risk’.
Note 15: Administered – Expenses
2012$’000
2011$’000
Note 15A: Suppliers
Goods and ServicesAdvertising 24 –Contractors 80 –Travel 12 –Other 6 –Total goods and services 122 –
Goods and services are made up of:Rendering of services – related entities 9 –Rendering of services – external parties 113 –

Total goods and services 122 –
Note 16: Administered – Financial Assets
2012$’000
2011$’000
Note 16A: Trade and Other Receivables
Other receivables:GST receivable from Australian Taxation Office 12 –Total other receivables 12 –Total trade and other receivables (gross) 12 –Total trade and other receivables (net) 12 –
Receivables are expected to be recovered in:No more than 12 months 12 –Total trade and other receivables (net) 12 –
Receivables were aged as follows:Not overdue 12 –Overdue by: – –
0 to 30 days – –31 to 60 days – –61 to 90 days – –
More than 90 days – –Total receivables (gross) 12 –
Note 17: Administered – Payables
2012$’000
2011$’000
Note 17A: SuppliersTrade creditors and accruals 1 –Total suppliers 1 –
Supplier payables expected to be settled within 12 months:External parties 1 –Total supplier payables 1 –
Settlement is generally made in accordance with the terms of the supplier invoice.

Note 18: Administered – Cash Flow Reconciliation
2012$’000
2011$’000
Reconciliation of cash and cash equivalents as per Administered Schedule of Assets and Liabilities to Administered Cash Flow Statement
Cash and cash equivalents as per:Schedule of administered cash flows – –Schedule of administered assets and liabilities – –Difference – –
Reconciliation of net cost of services to net cash from operating activities:Net cost of services (122) –
Changes in assets / liabilities –Net cash from operating activities (122) –
Note 19: Administered – Contingent Assets and LiabilitiesThe Commission has no administered contingent assets or liabilities.
Note 20: Administered – Financial Instruments
2012$’000
2011$’000
Note 20A: Categories of Financial Instruments

Financial Assets
Loans and receivables:GST receivable from the Australian Taxation Office (ATO) 12 –Carrying amount of financial assets 12 –
Financial Liabilities
Other liabilitiesAccruals 1 –Carrying amount of financial liabilities 1 –
Carryingamount
2012$’000
Fairvalue 2012
$’000
Carryingamount
2011$’000
Fairvalue 2011
$’000
Note 20B: Fair Value of Financial Instruments
Financial AssetsGST receivable from the ATO 12 12 – –Total 12 12 – –
Financial liabilitiesAccruals 1 1 – –Total 1 1 – –
Note 20C: Credit RiskThe following table illustrates the Commission’s gross exposure to credit risk, excluding any collateral or credit enhancements.
2012$’000
2011$’000
Financial assetsGST Receivable from the ATO 12 –Total 12 –
Financial liabilitiesAccruals 1 –Total 1 –
In relation to the Commission’s gross credit risk the following collateral is held: nil (2011: nil)

Note 20C: Credit Risk (continued)
Credit quality of financial instruments not past due or individually determined as impaired
Not Past Due Nor
Impaired 2012
$’000
Not Past Due Nor
Impaired 2011
$’000
Past due or
impaired 2012
$’000
Past due or impaired
2011$’000
GST Receivable from the ATO 12 – – –Total 12 – – –
Ageing of financial assets that were past due but not impaired for 2012
0 to 30 days
$’000
31 to 60days
$’000
61 to 90days
$’000
90+days
$’000Total$’000
GST Receiveable from the ATO 12 – – – 12
Total 12 – – – 12
Ageing of financial assets that were past due but not impaired for 2011
0 to 30 days
$’000
31 to 60days
$’000
61 to 90days
$’000
90+days
$’000Total
$’000
GST Receiveable from the ATO – – – – –Total – – – – –
The Commission had no derivative financial liabilities in both the current and prior financial year.
Note 21: Administered Financial Assets Reconciliation
Notes2012
$’0002011
$’000
Financial assetsTotal financial assets as per schedule of administered assets and liabilities 12 –Less: non-financial instrument components – –
Total non-financial instrument components 12 –
Total financial assets as per financial instruments note 12 –

Note 22: Appropriations
Table A: Annual Appropriations (‘Recoverable GST exclusive’)
2012 Appropriations
Appropriation Act FMA Act
Total appropriati
on$’000
Annual Appropriati
on$’000
Appropriations reduced
$’000AFM
$’000Section 30
$’000Section 31
$’000Section 32
$’000
DEPARTMENTALOrdinary annual services 16,153 – – – 4,209 270 20,632
Other servicesEquity – – – – –Loans – – – – –
Total departmental 16,153 – – – 4,209 270 20,632
ADMINISTERED
Ordinary annual servicesAdministered items – – – – 140 140
Total administered – – – – 140 140
Notes: (a) variances represent the agency’s 30 June 2012 cash balance (refer note 5A) and rephased 2011 equity injection applied in 2012.
Note 22: Appropriations (continued)Table A: Annual Appropriations (‘Recoverable GST exclusive’) (continued)
2011 AppropriationsAppropriation Act FMA Act
Total appropriation
$’000
Annual Appropriation
$’000
Appropriations reduced
$’000AFM
$’000Section 30
$’000Section 31
$’000Section 32
$’000
DEPARTMENTALOrdinary annual services 14,424 – – – 6,643 – 21,067
Other servicesEquity 510 – – – – 510 Loans – – – – –
Total departmental 14,934 – – – 6,643 – 21,577
ADMINISTERED
Ordinary annual servicesAdministered items – – – – –
Total administered – – – – –

Notes: (a) variances represent the agency’s 30 June 2011 cash balance (refer note 5A) and undrawn equity injection.
Note 22: Appropriations (continued)
Table B: Departmental and Administered Capital Budgets (‘Recoverable GST exclusive’)
2012 Capital Budget Appropriations
Capital Budget Appropriations applied in 2012
(current and prior years)
Appropriation Act FMA ActTotal Capital
Budget Appropriatio
ns$’000
Payments for
non-financial assets3
$’000
Payments for other purposes
$’000
Annual Capital Budget
$’000
Appropriations reduced2
$’000Section 32
$’000
DEPARTMENTAL
Ordinary annual services – Departmental Capital Budget1 346 – – 346 (677) –
Notes: 1. Departmental and Administered Capital Budgets are appropriated through Appropriation Acts (No.1,3,5). They form part of ordinary annual services, and are not separately identified in the Appropriation Acts. For more information on ordinary annual services appropriations, please see Table A: Annual appropriations.2. Appropriations reduced under Appropriation Acts (No.1,3,5) 2011-12: sections 10, 11, 12 and 15 or via a determination by the Finance Minister.3. Payments made on non-financial assets include purchases of assets, expenditure on assets which has been capitalised, costs incurred to make good an asset to its original condition.4. Variance represents the balance of undrawn and unspent capital budget appropriation from current and previous financial period.
2011 Capital Budget AppropriationsCapital Budget Appropriations applied in 2011
(current and prior years)Appropriation Act FMA Act Total Capital
Budget Appropriations
$’000
Payments for non-financial
assets3
$’000
Payments for other purposes
$’000
Annual Capital Budget
$’000
Appropriations reduced2
$’000Section 32
$’000
DEPARTMENTAL
Ordinary annual services – Departmental Capital Budget1 817 – – 817 – –
Notes: 1. Departmental and Administered Capital Budgets are appropriated through Appropriation Acts (No.1,3,5). They form part of ordinary annual services, and are not separately identified in the Appropriation Acts. For more information on ordinary annual services appropriations, please see Table A: Annual appropriations. 2. Appropriations reduced under Appropriation Acts (No.1,3,5) 2010-11: sections 10, 11, 12 and 15 or via a determination by the Finance Minister.3. Payments made on non-financial assets include purchases of assets, expenditure on assets which has been capitalised, costs incurred to make good an asset to its original condition. 4. Variance represents undrawn departmental capital budget (DCB) appropriation.

Note 22: Appropriations (continued)Table C: Unspent Annual Appropriations (‘Recoverable GST exclusive’)
Authority2012
$’0002011
$’000
DEPARTMENTALAppropriation Act (No.1) 2006-2007 – 1,523 Appropriation Act (No.1) 2007-2008 – 1,500 Appropriation Act (No.1) 2008-2009 – 462 Appropriation Act (No.1) 2009-2010 – 565 Appropriation Act (No.1) 2010-2011 – 1,125 Appropriation Act (No.1) 2011-2012 3,867 –Appropriation Act (No.2) 2010-2011 – 510 Capital Budget Bill 1 (DCB) 2010-2011 167 817 Capital Budget Bill 1 (DCB) 2011-2012 319 –Total 4,353 6,502
ADMINISTEREDAppropriation Act (No.1) 2011-2012 18 –Total 18 –
Table D: Reduction in Administered Items (‘Recoverable GST exclusive’)
2012 Amount required3 – by
Appropriation Act
Total amount
required3
Total amount
appropriated4
Total reduction5
Ordinary Annual Services Act (No.1) Act (No.3) Act (No.5)
Outcome 1 121,586.36 – –121,586.36 140,000.00 (18,413.64
)

Notes: 1. Numbers in this section of the table must be disclosed to the cent.2. Administered items for 2012 were reduced to these amounts when these financial statements were tabled in Parliament as part of the entity’s 2012 annual report. This reduction was effective in 2013, but the amounts were reflected in Table A in the 2012 financial statements in the column ‘Appropriations reduced’ as they were adjustments to 2012 appropriations.3. Amount required as per Appropriation Act (Act 1 s. 11; Act 2 s. 12).4. Total amount transferred under s32 of the Financial Management and Accountability Act 1997 in 2012.5. Total reduction effective in 2013.
2011 Amount required3 – by Appropriation
Act
Total amount
required3
Total amount
appropriated4
Total reduction5
Ordinary Annual Services Act (No.1) Act (No.3) Act (No.5)
Outcome 1 – – – – – –
Notes: 1. Numbers in this section of the table must be disclosed to the cent.2. Administered items for 2011 were reduced to these amounts when these financial statements were tabled in Parliament as part of the entity’s 2011 annual report. This reduction was effective in 2012, but the amounts were reflected in Table A in the 2011 financial statements in the column ‘Appropriations reduced’ as they were adjustments to 2011 appropriations.3. Amount required as per Appropriation Act (Act 1 s. 11; Act 2 s. 12).4. Total amount appropriated in 2011.5. Total reduction effective in 2012.
Note 23: Special AccountsThe Commission had an ‘Other Trust Moneys’ special account. The account was established under Section 20 of the Financial Management and Accountability Act 1997 (FMA Act). The year ended 30 June 2012 the account had a nil opening balance and there were no transactions debited or credited to it in the 2011-2012 financial year.
The purpose of the ‘Other Trust Moneys’ special account was for the expenditure of monies temporarily held on trust or otherwise for the benefit of a person other than the Commonwealth. Any money held in this account is special public money under section 16 of the FMA Act. On 26 June 2012 the ‘Other Trust Moneys’ special account was abolished under the Financial Management and Accountability (Abolition of 24 Special Accounts) Determination 2012-02.
On 26 June 2012 the Commission established a ‘Services for Other Entities and Trust Moneys’ special account. The account was established under Section 20 of the Financial Management and Accountability Act 1997 (FMA Act) by the Financial Management and Accountability (Establishment of SOETM Special Account – AHRC) Determination 2012-05. The year ended 30 June 2012 the account had a nil opening balance and there were no transactions debited or credited to it in the 2011-2012 financial year.
Special Accounts – AdministeredThe Commission has no administered special accounts.
Note 24: Compensation and Debt ReliefThe Commission made no payments for compensation or debt relief during the reporting period.
Compensation and Debt Relief – AdministeredThe Commission made no administered payments for compensation or debt relief during the reporting period.
Note 25: Reporting of Outcomes

Outcome 1 Total
2012$’000
2011$’000
2012$’000
2011$’000
Note 25A: Net Cost of Outcome Delivery
DEPARTMENTALExpenses 24,241 20,297 24,241 20,297 Own-source income 7,048 5,643 7,048 5,643
ADMINISTEREDExpenses 122 – 122 –Net cost of outcome delivery (17,316) (14,654) (17,316) (14,654)Net costs shown include intra-government costs that are eliminated in calculating the actual Budget Outcome. Refer to the Outcome Resourcing Table on page 125 of this Annual Report.
Note 25B: Major Classes of Departmental Expense, Income, Assets and Liabilities by Outcome
Outcome 1 Total
2012$’000
2011$’000
2012$’000
2011$’000
ExpensesEmployee benefits 15,064 12,088 15,064 12,088 Supplier 8,432 7,594 8,432 7,594 Depreciation and Amortisation 720 358 720 358 Finance costs – 25 – 25 Other expenses 25 232 25 232 Total 24,241 20,297 24,241 20,297
IncomeSale of goods and services 6,087 4,870 6,087 4,870 Revenue from Government 16,423 14,424 16,423 14,424 Rental income (sub-lease) 841 675 841 675 Other gains 119 98 119 98 Total 23,470 20,067 23,470 20,067
AssetsCash and equivalents 1,681 1,081 1,681 1,081

Trade and other receivables 6,139 7,804 6,139 7,804 Infrastructure, plant and equipment 5,423 5,822 5,423 5,822 Intangibles 907 – 907 –Other non-financial assets 108 45 108 45 Total 14,258 14,752 14,258 14,752
LiabilitiesSuppliers 2,048 816 2,048 816 Lease incentives 5,095 5,667 5,095 5,667 Employee provisions 2,935 2,302 2,935 2,302 Other provisions and payables 3,298 4,662 3,298 4,662 Total 13,375 13,447 13,375 13,447
Note 25C: Major Classes of Administered Expenses, Income, Assets and Liabilities by Outcome
Outcome 1 Total
2012$’000
2011$’000
2012$’000
2011$’000
ExpensesSupplier 122 – 122 –Total 122 – 122 –
Income
Revenue from Government: Administered 122 – 122 –
Total 122 – 122 –
AssetsGST receivable from the Australian Taxation Office 12 – 12 –Total 12 – 12 –
Liabilities

Suppliers 1 – 1 –Total 1 – 1 –
Note 26: Net Cash Appropriation Arrangements
2012$’000
2011$’000
Total comprehensive loss less depreciation/amortisation expenses previously funded through revenue appropriations1 (50) (294)Plus: depreciation/amortisation expenses previously funded through revenue appropriation (720) (358)Total comprehensive loss – as per the Statement of Comprehensive Income (770) (652)
1. As per the Statement of Comprehensive Income.
Related Documents


