VIET NAM Multiple Indicator Cluster Survey 2014 Key Findings September, 2014

Welcome message from author
This document is posted to help you gain knowledge. Please leave a comment to let me know what you think about it! Share it to your friends and learn new things together.
Transcript

VIET NAM Multiple Indicator Cluster Survey 2014
Key Findings
September, 2014
The Viet Nam Multiple Indicator Cluster Survey (MICS) was carried out in 2013-2014 by the Viet Nam General Statistics Office in collaboration with the United Nations Children’s Fund (UNICEF), as part of the global MICS programme. Technical support and financial support was provided by UNICEF. The global MICS programme was developed by UNICEF in the 1990s as an international household survey programme to collect internationally comparable data on a wide range of indicators on the situation of children and women. MICS surveys measure key indicators that allow countries to generate data for use in policies and programmes, and to monitor progress towards the Millennium Development Goals (MDGs) and other internationally agreed upon commitments. The objective of this report is to facilitate the timely dissemination and use of results from the Vietnam MICS prior to the release of full tables and the final survey report that will contain detailed information on all survey findings by various demographic, social, economic characteristics. The final survey report is expected to be released in early 2015. Results presented in this report are not expected to change and are considered final. For more information on indicators and the analysis conducted in the full final report please go to mics.unicef.org and childinfo.org.
Suggested citation: General Statistics Office and UNICEF. 2014. Viet Nam Multiple Indicator Cluster Survey 2014, Key Findings. Ha Noi, Viet Nam.
1
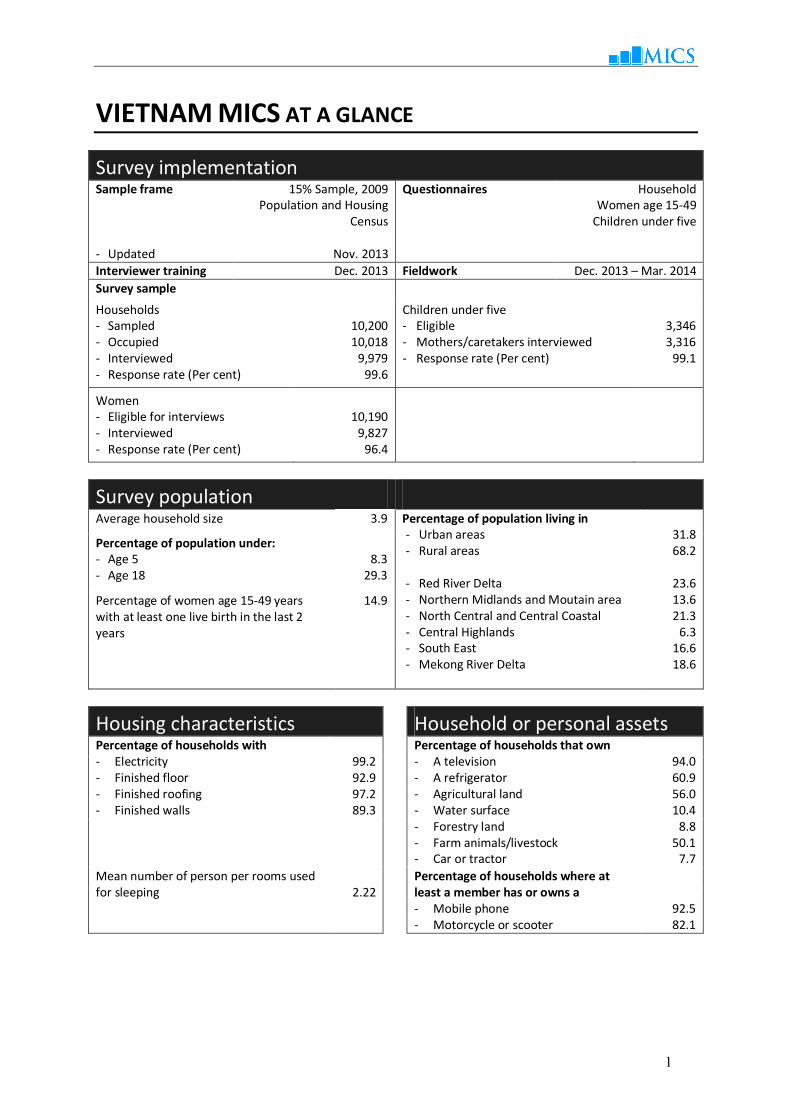
VIETNAM MICS AT A GLANCE
Survey implementation Sample frame
- Updated
15% Sample, 2009 Population and Housing
Census
Nov. 2013
Questionnaires Household Women age 15-49
Children under five
Interviewer training Dec. 2013 Fieldwork Dec. 2013 – Mar. 2014
Survey sample
Households - Sampled - Occupied - Interviewed - Response rate (Per cent)
10,200 10,018
9,979 99.6
Children under five - Eligible - Mothers/caretakers interviewed - Response rate (Per cent)
3,346 3,316
99.1
Women - Eligible for interviews - Interviewed - Response rate (Per cent)
10,190
9,827 96.4
Survey population Average household size 3.9 Percentage of population living in
- Urban areas - Rural areas - Red River Delta - Northern Midlands and Moutain area - North Central and Central Coastal - Central Highlands - South East - Mekong River Delta
31.8 68.2
23.6 13.6 21.3
6.3 16.6 18.6
Percentage of population under: - Age 5 - Age 18
8.3
29.3
Percentage of women age 15-49 years with at least one live birth in the last 2 years
14.9
Housing characteristics Household or personal assets Percentage of households with - Electricity - Finished floor - Finished roofing - Finished walls
99.2 92.9 97.2 89.3
Percentage of households that own - A television - A refrigerator - Agricultural land - Water surface - Forestry land - Farm animals/livestock - Car or tractor
94.0 60.9 56.0 10.4
8.8 50.1
7.7
Mean number of person per rooms used for sleeping
2.22
Percentage of households where at least a member has or owns a - Mobile phone - Motorcycle or scooter
92.5 82.1
2
CHILD MORTALITY
Early childhood mortality MICS Indicator
Indicator Description ValueA
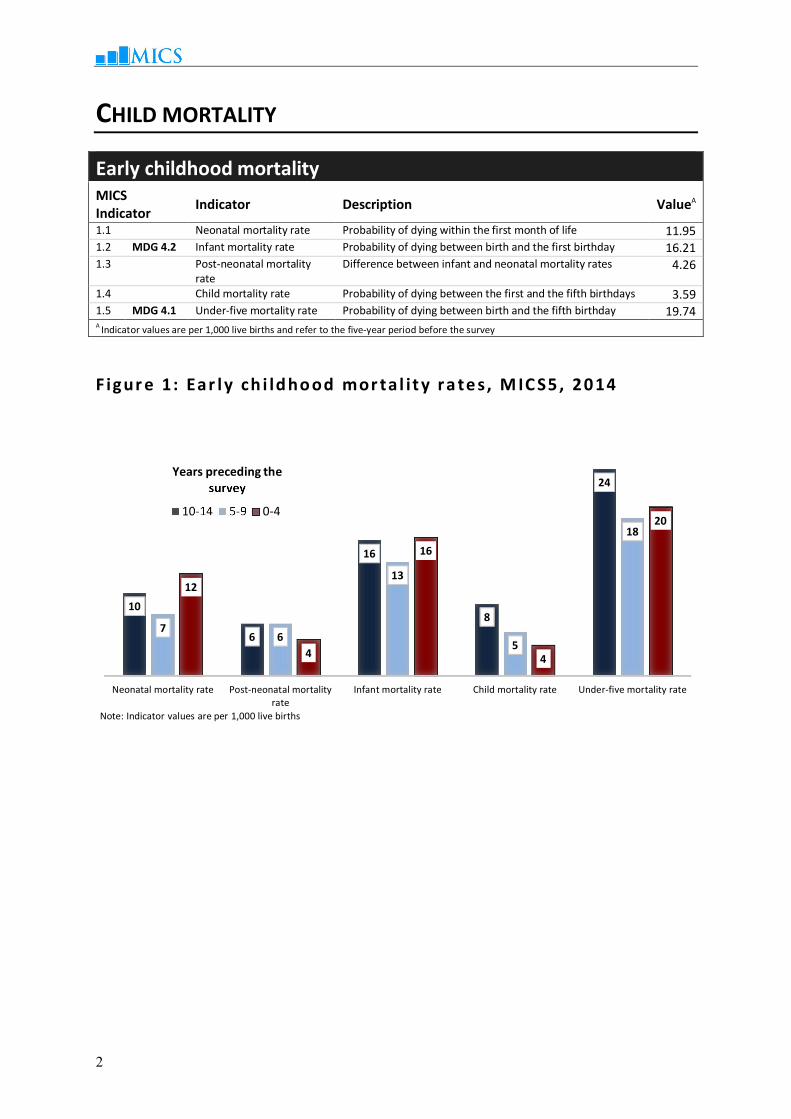
1.1 Neonatal mortality rate Probability of dying within the first month of life 11.95 1.2 MDG 4.2 Infant mortality rate Probability of dying between birth and the first birthday 16.21 1.3 Post-neonatal mortality
rate Difference between infant and neonatal mortality rates 4.26
1.4 Child mortality rate Probability of dying between the first and the fifth birthdays 3.59 1.5 MDG 4.1 Under-five mortality rate Probability of dying between birth and the fifth birthday 19.74 A
Indicator values are per 1,000 live births and refer to the five-year period before the survey
F igur e 1: Ear l y ch i ld ho od mor ta l i t y ra te s, M IC S5 , 2014
10
6
16
8
24
76
13
5
18
12
4
16
4
20
Neonatal mortality rate Post-neonatal mortalityrate
Infant mortality rate Child mortality rate Under-five mortality rate
Years preceding the survey
Note: Indicator values are per 1,000 live births
10-14 5-9 0-4

3
NUTRITION
Breastfeeding and infant feeding MICS Indicator
Indicator Description Value
2.5 Children ever breastfed Percentage of women with a live birth in the last 2 years who breastfed their last live-born child at any time
96.9
2.6 Early initiation of breastfeeding
Percentage of women with a live birth in the last 2 years who put their last newborn to the breast within one hour of birth
26.5
2.7 Exclusive breastfeeding under 6 months
Percentage of infants under 6 months of age who are exclusively breastfed
i
24.3
2.8 Predominant breastfeeding under 6 months
Percentage of infants under 6 months of age who received breast milk as the predominant source of nourishmentii during the previous day
49.0
2.9 Continued breastfeeding at 1 year
Percentage of children age 12-15 months who received breast milk during the previous day
65.6
2.10 Continued breastfeeding at 2 years
Percentage of children age 20-23 months who received breast milk during the previous day
21.8
2.11 Median duration of breastfeeding
The age in months when 50 percent of children age 0-35 months did not receive breast milk during the previous day
15.8
2.12 Age-appropriate breastfeeding
Percentage of children age 0-23 months appropriately fediii
during the previous day
46.9
2.13 Introduction of solid, semi-solid or soft foods
Percentage of infants age 6-8 months who received solid, semi-solid or soft foods during the previous day
90.7
2.14 Milk feeding frequency for non-breastfed children
Percentage of non-breastfed children age 6-23 months who received at least 2 milk feedings during the previous day
89.5
2.15 Minimum meal frequency Percentage of children age 6-23 months who received solid, semi-solid and soft foods (plus milk feeds for non-breastfed children) the minimum number of times
iv or more during the previous day
90.5
2.16 Minimum dietary diversity Percentage of children age 6–23 months who received foods from 4 or more food groups
v during the previous day
76.9
2.17a 2.17b
Minimum acceptable diet (a) Percentage of breastfed children age 6–23 months who had at least the minimum dietary diversity and the minimum meal frequency during the previous day (b) Percentage of non-breastfed children age 6–23 months who received at least 2 milk feedings and had at least the minimum dietary diversity not including milk feeds and the minimum meal frequency during the previous day
62.4
54.5
2.18 Bottle feeding Percentage of children age 0-23 months who were fed with a bottle during the previous day
44.1
Low-birthweight MICS Indicator
Indicator Description Value
2.20 Low-birthweight infants Percentage of most recent live births in the last 2 years weighing below 2,500 grams at birth
5.7
2.21 Infants weighed at birth Percentage of most recent live births in the last 2 years who were weighed at birth
94.3

4
CHILD HEALTH
Vaccinations MICS Indicator
Indicator Description Value
3.1 Tuberculosis immunization coverage
Percentage of children age 12-23 months who received BCG vaccine by their first birthday
98.0
3.2 Polio immunization coverage
Percentage of children age 12-23 months who received the third dose of OPV vaccine (OPV3) by their first birthday
91.9
3.3 Diphtheria, pertussis and tetanus (DPT) immunization coverage
Percentage of children age 12-23 months who received the third dose of DPT vaccine (DPT3) by their first birthday
88.6
3.4 MDG 4.3 Measles immunization coverage
Percentage of children age 12-23 months who received measles vaccine by their first birthday
86.2
3.5 Hepatitis B immunization coverage
Percentage of children age 12-23 months who received the third dose of Hepatitis B vaccine (HepB3) by their first birthday
87.4
3.6 Haemophilus influenzae type B (Hib) immunization coverage
Percentage of children age 12-23 months who received the third dose of Hib vaccine (Hib3) by their first birthday
87.5
3.8 Full immunization coverage
Percentage of children age 12-23 months who received allvi vaccinations recommended in the national immunization schedule by their first birthday
75.6
F igur e 2: Va c ci nat i on s by age 12 mo nt hs , M IC S5, 2014
98
9795
92
9694
89
86
7895
9287
9592
87
762
BCG
Polio1Polio2Polio3
DPT1DPT2DPT3
Measles
HepB at birthHepB1HepB2HepB3
Hib1Hib2Hib3
Fully vaccinatedNo vaccinations
Per cent
Children Age 12-23 months
97
9694
92
969593
89
71959392
959392
802
BCG
Polio1Polio2Polio3
DPT1DPT2DPT3
Measles
HepB at birthHepB1HepB2HepB3
Hib1Hib2Hib3
Fully vaccinatedNo vaccinations
Children Age 24-35 months
5
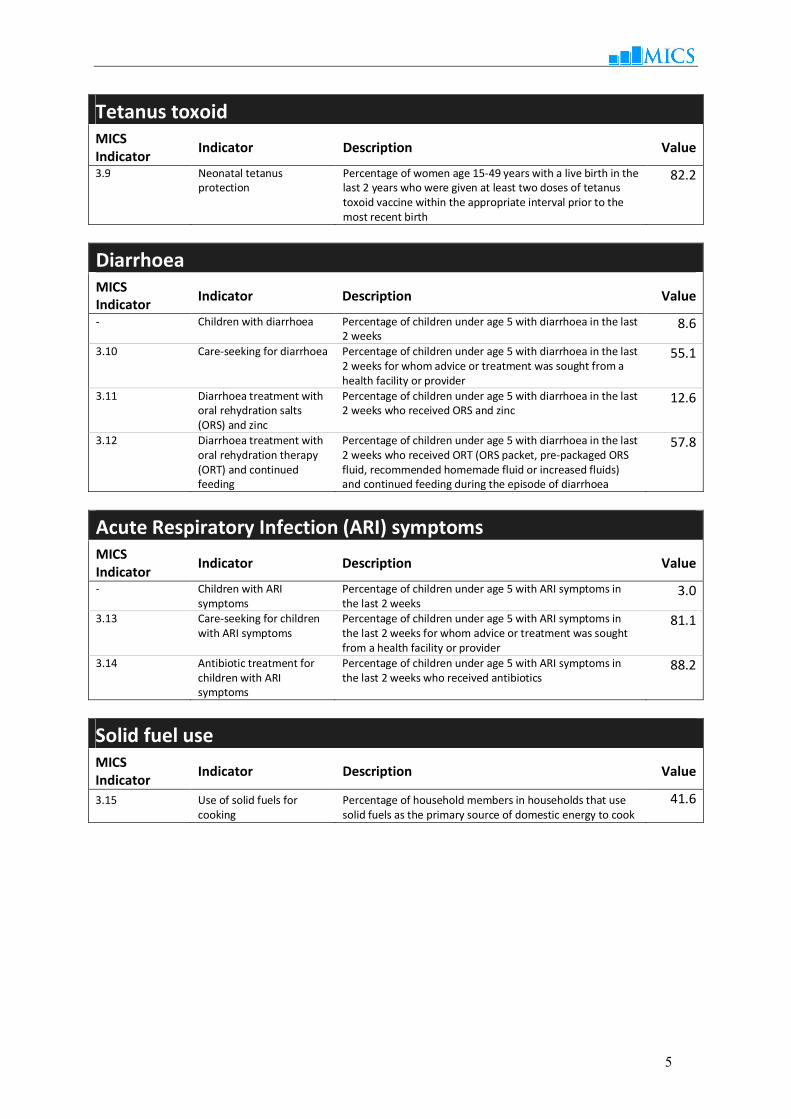
Tetanus toxoid MICS Indicator
Indicator Description Value
3.9 Neonatal tetanus protection
Percentage of women age 15-49 years with a live birth in the last 2 years who were given at least two doses of tetanus toxoid vaccine within the appropriate interval prior to the most recent birth
82.2
Diarrhoea MICS Indicator
Indicator Description Value
- Children with diarrhoea Percentage of children under age 5 with diarrhoea in the last 2 weeks
8.6
3.10 Care-seeking for diarrhoea Percentage of children under age 5 with diarrhoea in the last 2 weeks for whom advice or treatment was sought from a health facility or provider
55.1
3.11 Diarrhoea treatment with oral rehydration salts (ORS) and zinc
Percentage of children under age 5 with diarrhoea in the last 2 weeks who received ORS and zinc
12.6
3.12 Diarrhoea treatment with oral rehydration therapy (ORT) and continued feeding
Percentage of children under age 5 with diarrhoea in the last 2 weeks who received ORT (ORS packet, pre-packaged ORS fluid, recommended homemade fluid or increased fluids) and continued feeding during the episode of diarrhoea
57.8
Acute Respiratory Infection (ARI) symptoms MICS Indicator
Indicator Description Value
- Children with ARI symptoms
Percentage of children under age 5 with ARI symptoms in the last 2 weeks
3.0
3.13 Care-seeking for children with ARI symptoms
Percentage of children under age 5 with ARI symptoms in the last 2 weeks for whom advice or treatment was sought from a health facility or provider
81.1
3.14 Antibiotic treatment for children with ARI symptoms
Percentage of children under age 5 with ARI symptoms in the last 2 weeks who received antibiotics
88.2
Solid fuel use MICS Indicator
Indicator Description Value
3.15 Use of solid fuels for cooking
Percentage of household members in households that use solid fuels as the primary source of domestic energy to cook
41.6

6
WATER AND SANITATION
Water and sanitation MICS Indicator
Indicator Description Value
4.1 MDG 7.8 Use of improved drinking water sources
Percentage of household members using improved sources of drinking water
92.0
4.2 Water treatment Percentage of household members in households using unimproved drinking water who use an appropriate treatment method
79.0
4.3 MDG 7.9
Use of improved sanitation Percentage of household members using improved sanitation facilities which are not shared
79.2
4.4 Safe disposal of child’s faeces
Percentage of children age 0-2 years whose last stools were disposed of safely
57.7
4.5 Place for handwashing Percentage of households with a specific place for hand washing where water and soap or other cleansing agent are present
86.3
4.6 Availability of soap or other cleansing agent
Percentage of households with soap or other cleansing agent
92.4
F igur e 3: Us e o f i mpr o ve d wat er and sa ni tat io n i n ur ba n a nd rura l area s, MICS5 , 2014
92
79
98
9189
74
Percentage of household members usingan improved water source
Percentage of household members usingan improved sanitation facility which is not shared
Per cent
Total
Urban
Rural

7
REPRODUCTIVE HEALTH
Contraception and unmet need MICS Indicator
Indicator Description Value
- Total fertility rate Total fertility rateA for women age 15-49 years 2.4 5.1 MDG 5.4 Adolescent birth rate Age-specific fertility rate
A for women age 15-19 years 45
5.2 Early childbearing Percentage of women age 20-24 years who had at least one live birth before age 18
4.7
5.3 MDG 5.3 Contraceptive prevalence rate
Percentage of women age 15-49 years currently married or in union who are using (or whose partner is using) a (modern or traditional) contraceptive method
75.7
5.4 MDG 5.6 Unmet need Percentage of women age 15-49 years who are currently married or in union who are fecund and want to space their births or limit the number of children they have and who are not currently using contraception
6.1
A The age-specific fertility rate is defined as the number of live births to women in a specific age group during a specified period, divided by
the average number of women in that age group during the same period, expressed per 1,000 women. The age-specific fertility rate for women age 15-19 years is also termed as the adolescent birth rate.
The total fertility rate (TFR) is calculated by summing the age-specific fertility rates calculated for each of the 5-year age groups of women, from age 15 through to age 49. The TFR denotes the average number of children to which a woman will have given birth by the end of her reproductive years (by age 50) if current fertility rates prevailed.
F igur e 4: Us e o f c on trac ep t i o n, M IC S5, 2014
Modern methodsTraditional methods No method
0 10 20 30 40 50 60 70 80 90 100Per cent
Modern methods 57.0 Traditional methods 18.8
Female sterilization 2.8 Periodic abstinence 13.4
Male sterilization 0.1 Withdrawal 5.4
IUD 28.2
Injectables 1.7 Any method 75.7
Implants 0.2
Pill 11.9 No method 24.3
Male condom 11.8
Female condom 0.2
Diaphragm/Foam/Jelly 0.0
8
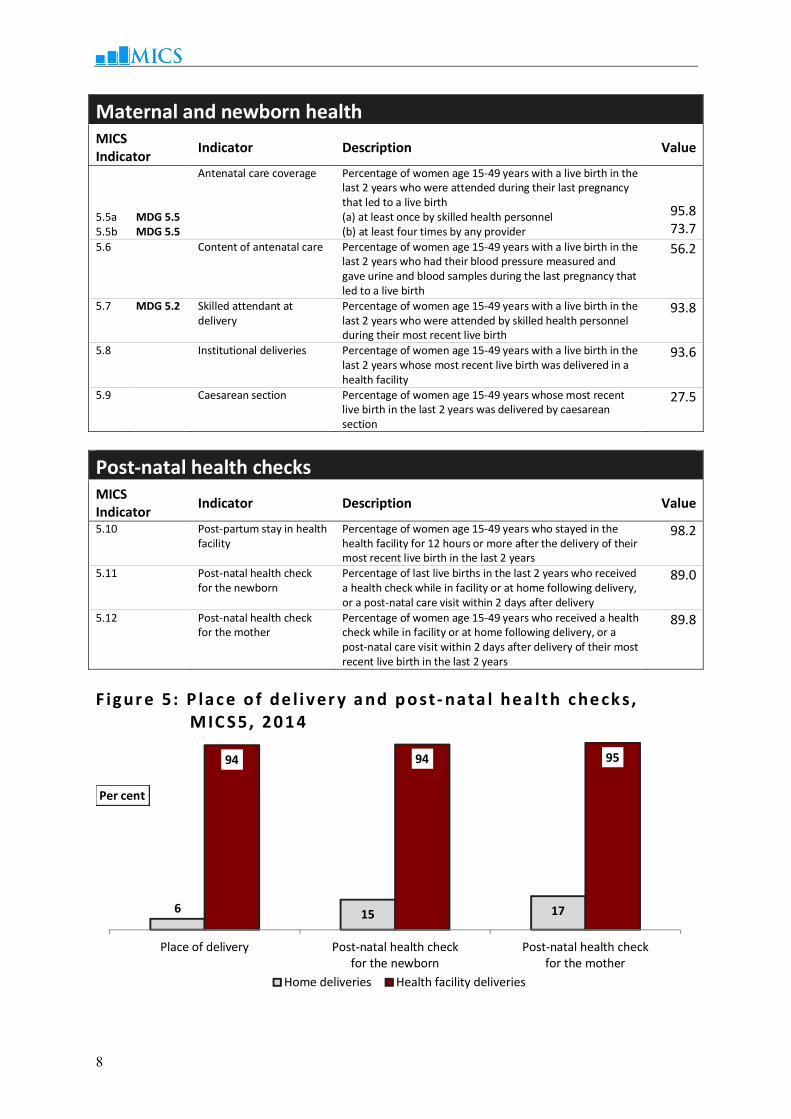
Maternal and newborn health MICS Indicator
Indicator Description Value
5.5a 5.5b
MDG 5.5 MDG 5.5
Antenatal care coverage Percentage of women age 15-49 years with a live birth in the last 2 years who were attended during their last pregnancy that led to a live birth (a) at least once by skilled health personnel (b) at least four times by any provider
95.8 73.7
5.6 Content of antenatal care Percentage of women age 15-49 years with a live birth in the last 2 years who had their blood pressure measured and gave urine and blood samples during the last pregnancy that led to a live birth
56.2
5.7 MDG 5.2 Skilled attendant at delivery
Percentage of women age 15-49 years with a live birth in the last 2 years who were attended by skilled health personnel during their most recent live birth
93.8
5.8 Institutional deliveries Percentage of women age 15-49 years with a live birth in the last 2 years whose most recent live birth was delivered in a health facility
93.6
5.9 Caesarean section Percentage of women age 15-49 years whose most recent live birth in the last 2 years was delivered by caesarean section
27.5
Post-natal health checks MICS Indicator
Indicator Description Value
5.10 Post-partum stay in health facility
Percentage of women age 15-49 years who stayed in the health facility for 12 hours or more after the delivery of their most recent live birth in the last 2 years
98.2
5.11 Post-natal health check for the newborn
Percentage of last live births in the last 2 years who received a health check while in facility or at home following delivery, or a post-natal care visit within 2 days after delivery
89.0
5.12 Post-natal health check for the mother
Percentage of women age 15-49 years who received a health check while in facility or at home following delivery, or a post-natal care visit within 2 days after delivery of their most recent live birth in the last 2 years
89.8
F igur e 5: P lac e o f de l i ver y a nd p o st- nata l hea lt h c he ck s, MIC S5, 2014
6 15 17
94 94 95
Place of delivery Post-natal health checkfor the newborn
Post-natal health checkfor the mother
Per cent
Home deliveries Health facility deliveries

9
CHILD DEVELOPMENT
Child development MICS Indicator
Indicator Description Value
6.1 Attendance to early childhood education
Percentage of children age 36-59 months who are attending an early childhood education programme
71.3
6.2 Support for learning Percentage of children age 36-59 months with whom an adult has engaged in four or more activities to promote learning and school readiness in the last 3 days
75.9
6.3 Father’s support for learning
Percentage of children age 36-59 months whose biological father has engaged in four or more activities to promote learning and school readiness in the last 3 days
14.9
6.4 Mother’s support for learning
Percentage of children age 36-59 months whose biological mother has engaged in four or more activities to promote learning and school readiness in the last 3 days
45.0
6.5 Availability of children’s books
Percentage of children under age 5 who have three or more children’s books
26.2
6.6 Availability of playthings Percentage of children under age 5 who play with two or more types of playthings
51.5
6.7 Inadequate care Percentage of children under age 5 left alone or in the care of another child younger than 10 years of age for more than one hour at least once in the last week
7.0
6.8 Early child development index
Percentage of children age 36-59 months who are developmentally on track in at least three of the following four domains: literacy-numeracy, physical, social-emotional, and learning
88.7

10
LITERACY AND EDUCATION
Literacy and educationvii MICS Indicator
Indicator Description Value
7.1 MDG 2.3 Literacy rate among young people
Percentage of young woman age 15-24 years who are able to read a short simple statement about everyday life or who attended secondary or higher education
96.5
7.2 School readiness Percentage of children in first grade of primary school who attended pre-school during the previous school year
96.8
7.3 Net intake rate in primary education
Percentage of children of school-entry age who enter the first grade of primary school
96.2
7.4 MDG 2.1 Primary school net attendance ratio (adjusted)
Percentage of children of primary school age currently attending primary or secondary school
97.7
7.5 Lower secondary school net attendance ratio (adjusted)
Percentage of children of secondary school age currently attending secondary school or higher
90.4
Upper secondary school net attendance ratio (adjusted)
Percentage of children of upper secondary school age currently attending upper secondary school or higher
70.7
7.6 MDG 2.2 Children reaching last grade of primary
Percentage of children entering the first grade of primary school who eventually reach last grade
98.6
7.7 Primary completion rate Number of children attending the last grade of primary school (excluding repeaters) divided by number of children of primary school completion age (age appropriate to final grade of primary school)
95.9
7.8 Transition rate to lower secondary school
Number of children attending the last grade of primary school during the previous school year who are in the first grade of lower secondary school during the current school year divided by number of children attending the last grade of primary school during the previous school year
98.0
Transition rate to upper secondary school
Number of children attending the last grade of lower secondary school during the previous school year who are in the first grade of upper secondary school during the current school year divided by number of children attending the last grade of lower secondary school during the previous school year
89.5
7.9 MDG 3.1 Gender parity index (primary school)
Primary school net attendance ratio (adjusted) for girls divided by primary school net attendance ratio (adjusted) for boys
1.00
7.10 MDG 3.1 Gender parity index (lower secondary school)
Lower secondary school net attendance ratio (adjusted) for girls divided by lower secondary school net attendance ratio (adjusted) for boys
1.03
Gender parity index (upper secondary school)
Upper secondary school net attendance ratio (adjusted) for girls divided by upper secondary school net attendance ratio (adjusted) for boys
1.11

11
F igur e 6: E du ca t i on i nd i cat ors b y sex , M IC S5, 2014
School readiness
97 96
Net intake rate
in primary education
Primary school
completion rate
Transition rate to secondary
school
97 96 98 93 98 98
Attendance to early
childhood education
Primary school attendance Secondary school attendance
74 69 98 98 89 92
Children reaching last grade of primary
100 97 Boys Girls
Note: All indicator values are in per cent

12
CHILD PROTECTION
Birth registration MICS Indicator
Indicator Description Value
8.1 Birth registration Percentage of children under age 5 whose births are reported registered
96.1
Child labour MICS Indicator
Indicator Description Value
8.2 Child labour Percentage of children age 5-17 years who are involved in child labour
viii
16.4
Child discipline MICS Indicator
Indicator Description Value
8.3 Violent discipline Percentage of children age 1-14 years who experienced psychological aggression or physical punishment during the last one month
68.4
F igur e 7: Ch i l d d is c i pl i n i ng me th o ds, c h i l dre n ag e 1- 14 years , MIC S5, 2014
27
68
58
Other41
Severe2.1
Only non-violentdiscipline
Any violent discipline
Psychological aggression
Physical punishment Per cent

13
Early marriage and polygyny MICS Indicator
Indicator Description Value
8.4 Marriage before age 15
Percentage of women age 15-49 years who were first married or in union before age 15
0.9
8.5 Marriage before age 18
Percentage of women age 20-49 years who were first married or in union before age 18
11.2
8.6 Young people age 15-19 years currently married or in union
Percentage of young women age 15-19 years who are married or in union
10.3
8.7 Polygyny
Percentage of women age 15-49 years who are in a polygynous union
0.7
8.8a 8.8b
Spousal age difference Percentage of young women who are married or in union and whose spouse is 10 or more years older, (a) among women age 15-19 years, (b) among women age 20-24 years
5.8 4.7
Attitudes towards domestic violence MICS Indicator
Indicator Description Value
8.12 Attitudes towards domestic violence
Percentage of women age 15-49 years who state that a husband is justified in hitting or beating his wife in at least one of the following circumstances: (1) she goes out without telling him, (2) she neglects the children, (3) she argues with him, (4) she refuses sex with him, (5) she burns the food
28.2
Children’s living arrangements MICS Indicator
Indicator Description Value
8.13 Children’s living arrangements
Percentage of children age 0-17 years living with neither biological parent
5.2
8.14 Prevalence of children with one or both parents dead
Percentage of children age 0-17 years with one or both biological parents dead
3.5
8.15 Children with at least one parent living abroad
Percentage of children 0-17 years with at least one biological parent living abroad
1.3
14
HIV/AIDS
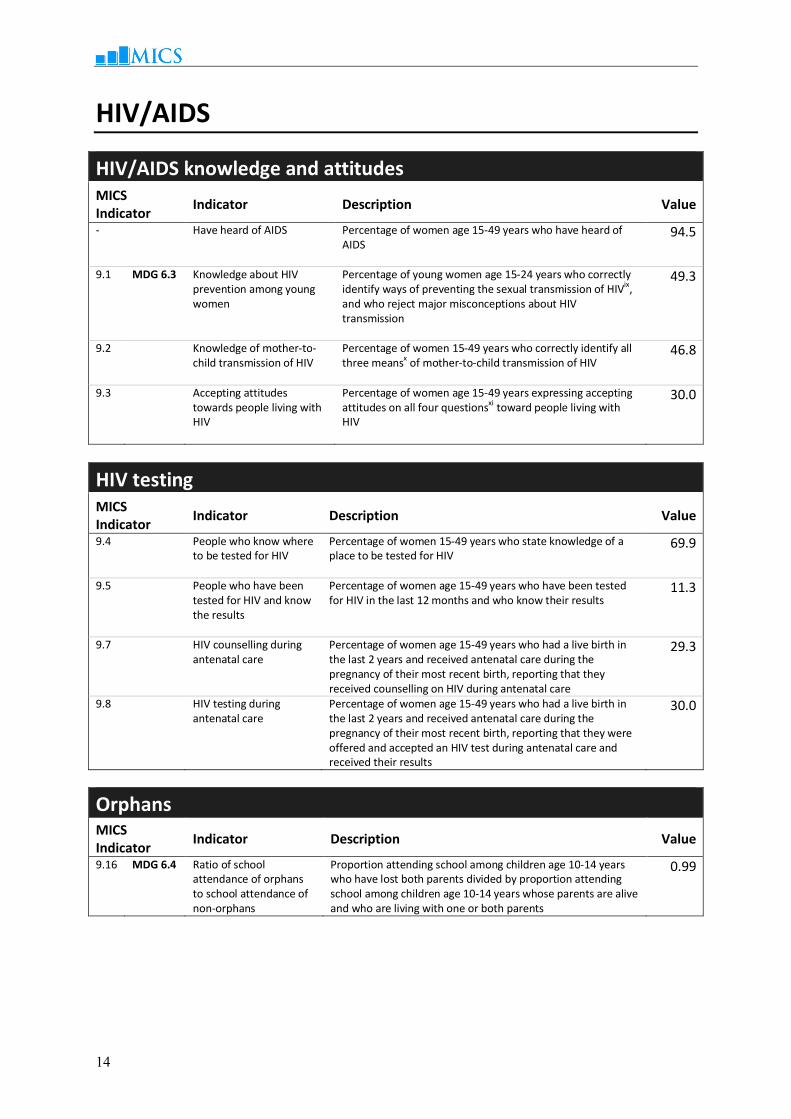
HIV/AIDS knowledge and attitudes MICS Indicator
Indicator Description Value
- Have heard of AIDS Percentage of women age 15-49 years who have heard of AIDS
94.5
9.1 MDG 6.3 Knowledge about HIV prevention among young women
Percentage of young women age 15-24 years who correctly identify ways of preventing the sexual transmission of HIV
ix,
and who reject major misconceptions about HIV transmission
49.3
9.2 Knowledge of mother-to-child transmission of HIV
Percentage of women 15-49 years who correctly identify all three means
x of mother-to-child transmission of HIV
46.8
9.3 Accepting attitudes towards people living with HIV
Percentage of women age 15-49 years expressing accepting attitudes on all four questions
xi toward people living with
HIV
30.0
HIV testing MICS Indicator
Indicator Description Value
9.4 People who know where to be tested for HIV
Percentage of women 15-49 years who state knowledge of a place to be tested for HIV
69.9
9.5 People who have been tested for HIV and know the results
Percentage of women age 15-49 years who have been tested for HIV in the last 12 months and who know their results
11.3
9.7 HIV counselling during antenatal care
Percentage of women age 15-49 years who had a live birth in the last 2 years and received antenatal care during the pregnancy of their most recent birth, reporting that they received counselling on HIV during antenatal care
29.3
9.8 HIV testing during antenatal care
Percentage of women age 15-49 years who had a live birth in the last 2 years and received antenatal care during the pregnancy of their most recent birth, reporting that they were offered and accepted an HIV test during antenatal care and received their results
30.0
Orphans MICS Indicator
Indicator Description Value
9.16 MDG 6.4 Ratio of school attendance of orphans to school attendance of non-orphans
Proportion attending school among children age 10-14 years who have lost both parents divided by proportion attending school among children age 10-14 years whose parents are alive and who are living with one or both parents
0.99

15
ACCESS TO MASS MEDIA AND ICT
Access to mass media MICS Indicator
Indicator Description Value
10.1 Exposure to mass media
Percentage of women age 15-49 years who, at least once a week, read a newspaper or magazine, listen to the radio, and watch television
13.2
Use of information/communication technology MICS Indicator
Indicator Description Value
10.2 Use of computers
Percentage of young women age 15-24 years who used a computer during the last 12 months
63.3
10.3 Use of internet
Percentage of young women age 15-24 years who used the internet during the last 12 months
66.7
Uses of mobile phone Percentage of women age 15-49 years who own a mobile phone or use one as if was theirs
81.9

16
NOTES i Infants receiving breast milk, and not receiving any other fluids or foods, with the exception of oral rehydration solution, vitamins, mineral supplements and medicines
ii Infants receiving breast milk and certain fluids (water and water-based drinks, fruit juice, ritual fluids, oral rehydration solution, drops, vitamins, minerals, and medicines), but do not receive anything else (in particular, non-human milk and food-based fluids)
iii Infants age 0-5 months who are exclusively breastfed, and children age 6-23 months who are breastfed and ate solid, semi-solid or soft foods
iv Breastfeeding children: Solid, semi-solid, or soft foods, two times for infants age 6-8 months, and three times for children 9-23 months; Non-breastfeeding children: Solid, semi-solid, or soft foods, or milk feeds, four times for children age 6-23 months
v The indicator is based on consumption of any amount of food from at least 4 out of the 7 following food groups: 1) grains,
roots and tubers, 2) legumes and nuts, 3) dairy products (milk, yogurt, cheese), 4) flesh foods (meat, fish, poultry and liver/organ meats), 5) eggs, 6) vitamin-A rich fruits and vegetables, and 7) other fruits and vegetables
vi Full vaccination includes the following: a BCG vaccination to protect against tuberculosis, three doses of Polio, three doses of DPT to protect against diphtheria, pertussis, tetanus; three doses of Hepatitis B vaccine; three doses of Hib, one dose of measles
vii Education indicators, wherever applicable, are based on information on reported school attendance (at any time during the school year), as a proxy for enrolment.
viii Children involved in child labour are defined as children involved in economic activities above the age-specific thresholds, children involved in household chores above the age-specific thresholds, and children involved in hazardous work
ix Using condoms and limiting sex to one faithful, uninfected partner
x Transmission during pregnancy, during delivery, and by breastfeeding
xi People (1) who think that a female teacher with the AIDS virus should be allowed to teach in school, (2) who would buy fresh vegetables from a shopkeeper or vendor who has the AIDS virus, (3) who would not want to keep it as a secret if a family member became infected with the AIDS virus, and (4) who would be willing to care for a family member who became sick with the AIDS virus
17
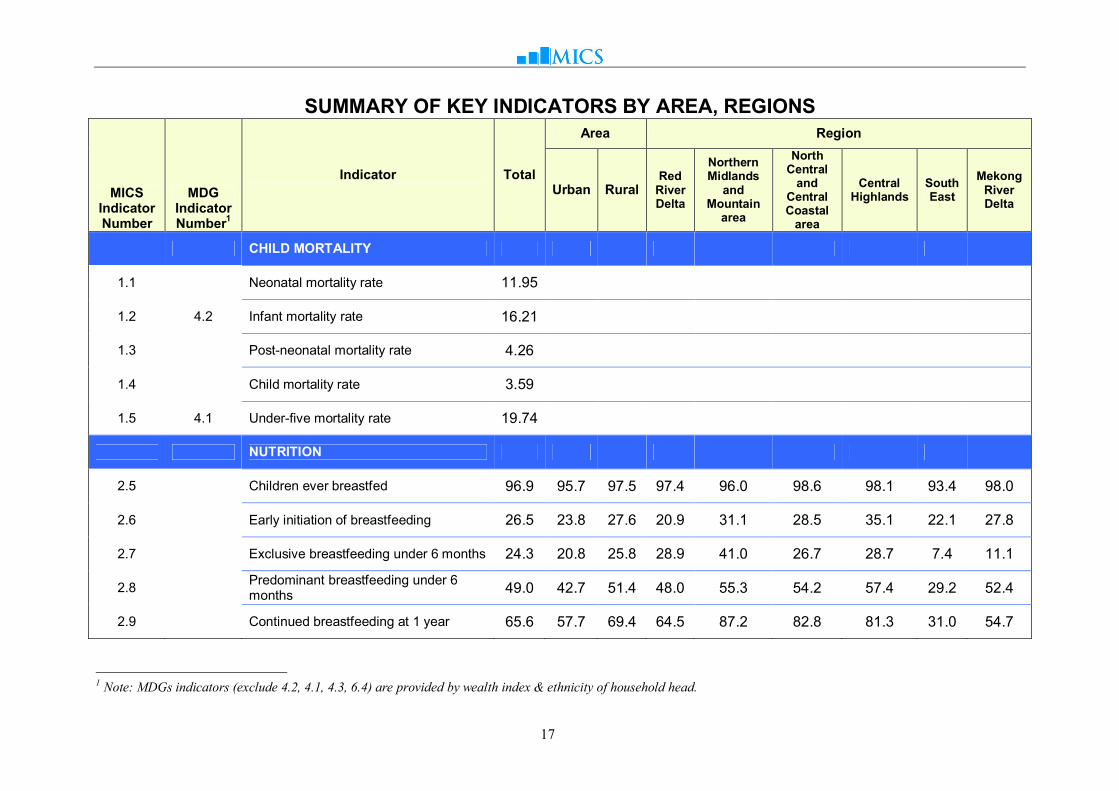
SUMMARY OF KEY INDICATORS BY AREA, REGIONS
MICS Indicator Number
MDG Indicator Number1
Indicator Total
Area Region
Urban Rural Red
River Delta
Northern Midlands
and Mountain
area
North Central
and Central Coastal
area
Central Highlands
South East
Mekong River Delta
CHILD MORTALITY
1.1
Neonatal mortality rate 11.95
1.2 4.2 Infant mortality rate 16.21
1.3
Post-neonatal mortality rate 4.26
1.4
Child mortality rate 3.59
1.5 4.1 Under-five mortality rate 19.74
NUTRITION
2.5
Children ever breastfed 96.9 95.7 97.5 97.4 96.0 98.6 98.1 93.4 98.0
2.6
Early initiation of breastfeeding 26.5 23.8 27.6 20.9 31.1 28.5 35.1 22.1 27.8
2.7
Exclusive breastfeeding under 6 months 24.3 20.8 25.8 28.9 41.0 26.7 28.7 7.4 11.1
2.8
Predominant breastfeeding under 6 months
49.0 42.7 51.4 48.0 55.3 54.2 57.4 29.2 52.4
2.9
Continued breastfeeding at 1 year 65.6 57.7 69.4 64.5 87.2 82.8 81.3 31.0 54.7
1 Note: MDGs indicators (exclude 4.2, 4.1, 4.3, 6.4) are provided by wealth index & ethnicity of household head.
18
MICS Indicator Number
MDG Indicator Number
Indicator Total
Area Region
Urban Rural Red
River Delta
Northern Midlands
and Mountain
area
North Central
and Central Coastal
area
Central Highlands
South East
Mekong River Delta
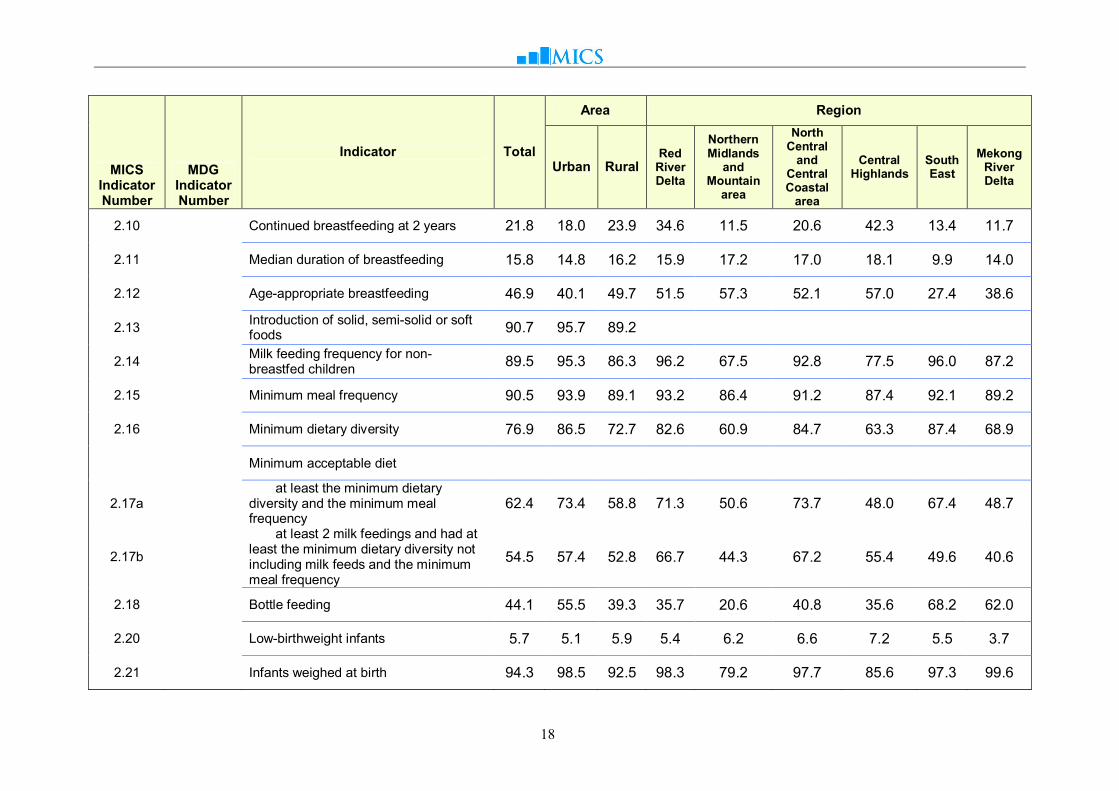
2.10
Continued breastfeeding at 2 years 21.8 18.0 23.9 34.6 11.5 20.6 42.3 13.4 11.7
2.11
Median duration of breastfeeding 15.8 14.8 16.2 15.9 17.2 17.0 18.1 9.9 14.0
2.12
Age-appropriate breastfeeding 46.9 40.1 49.7 51.5 57.3 52.1 57.0 27.4 38.6
2.13
Introduction of solid, semi-solid or soft foods
90.7 95.7 89.2
2.14
Milk feeding frequency for non-breastfed children
89.5 95.3 86.3 96.2 67.5 92.8 77.5 96.0 87.2
2.15
Minimum meal frequency 90.5 93.9 89.1 93.2 86.4 91.2 87.4 92.1 89.2
2.16
Minimum dietary diversity 76.9 86.5 72.7 82.6 60.9 84.7 63.3 87.4 68.9
Minimum acceptable diet
2.17a
at least the minimum dietary diversity and the minimum meal frequency
62.4 73.4 58.8 71.3 50.6 73.7 48.0 67.4 48.7
2.17b
at least 2 milk feedings and had at least the minimum dietary diversity not including milk feeds and the minimum meal frequency
54.5 57.4 52.8 66.7 44.3 67.2 55.4 49.6 40.6
2.18
Bottle feeding 44.1 55.5 39.3 35.7 20.6 40.8 35.6 68.2 62.0
2.20
Low-birthweight infants 5.7 5.1 5.9 5.4 6.2 6.6 7.2 5.5 3.7
2.21
Infants weighed at birth 94.3 98.5 92.5 98.3 79.2 97.7 85.6 97.3 99.6

19
MICS Indicator Number
MDG Indicator Number
Indicator Total
Area Region
Urban Rural Red
River Delta
Northern Midlands
and Mountain
area
North Central
and Central Coastal
area
Central Highlands
South East
Mekong River Delta
CHILD HEALTH
3.1
Tuberculosis immunization coverage 98.0
3.2
Polio immunization coverage 91.9
3.3
Diphtheria, pertussis and tetanus (DPT) immunization coverage
88.6
3.4 4.3 Measles immunization coverage 86.2
3.5
Hepatitis B immunization coverage 87.4
3.6
Haemophilus influenzae type B (Hib) immunization coverage
87.5
3.8
Full immunization coverage 75.6
3.9
Neonatal tetanus protection 82.2 86.2 80.5 84.1 71.0 87.6 63.7 87.8 86.0
-
Children with diarrhoea 8.6 6.0 9.7 6.6 14.1 7.7 12.7 6.8 7.4
3.10
Care-seeking for diarrhoea 55.1 50.8 56.2 46.4 46.9 60.6 60.3 56.6 68.0
3.11
Diarrhoea treatment with oral rehydration salts (ORS) and zinc
12.6 17.7 11.3 9.4 3.4 15.0 14.0 17.1 24.6
3.12
Diarrhoea treatment with oral rehydration therapy (ORT) and continued feeding
57.8 64.2 56.1 60.3 57.3 42.3 73.9 56.8 64.3

20
MICS Indicator Number
MDG Indicator Number
Indicator Total
Area Region
Urban Rural Red
River Delta
Northern Midlands
and Mountain
area
North Central
and Central Coastal
area
Central Highlands
South East
Mekong River Delta
-
Children with ARI symptoms 3.0 2.5 3.2 1.8 2.1 3.0 4.6 2.6 4.9
3.13
Care-seeking for children with ARI symptoms
81.1 81.2 81.1 80.2 32.8 100 76.3 92.1 83.1
3.14
Antibiotic treatment for children with ARI symptoms
88.2 96.5 85.5 100 47.8 100 88.5 100 83.7
3.15
Use of solid fuels for cooking 41.6 18.4 52.4 26.2 70.2 47.6 52.7 16.1 52.3
WATER AND SANITATION
4.1 7.8 Use of improved drinking water sources 92.0 98.2 89.1 99.3 89.9 86.4 83.3 97.5 88.9
4.2
Water treatment 79.0 64.1 80.2 97.3 100 94.5 31.8 67.7 68.3
4.3 7.9 Use of improved sanitation 79.2 90.9 73.8 94.1 68.8 83.8 65.4 90.9 56.8
4.4
Safe disposal of child’s faeces 57.7 71.9 51.7 69.9 36.3 58.2 45.9 73.8 49.3
4.5
Place for handwashing 86.3 91.8 83.7 94.4 75.5 86.0 81.4 90.4 80.9
4.6
Availability of soap or other cleansing agent
92.4 95.6 91.0 96.2 89.0 94.6 87.9 91.3 89.5
REPRODUCTIVE HEALTH
-
Total fertility rate 2.4 2.1 2.6 2.4 2.9 2.6 2.7 2.1 2.2
5.1 5.4 Adolescent birth rate 45 24 56 24 107 37 65 24 49
21
MICS Indicator Number
MDG Indicator Number
Indicator Total
Area Region
Urban Rural Red
River Delta
Northern Midlands
and Mountain
area
North Central
and Central Coastal
area
Central Highlands
South East
Mekong River Delta
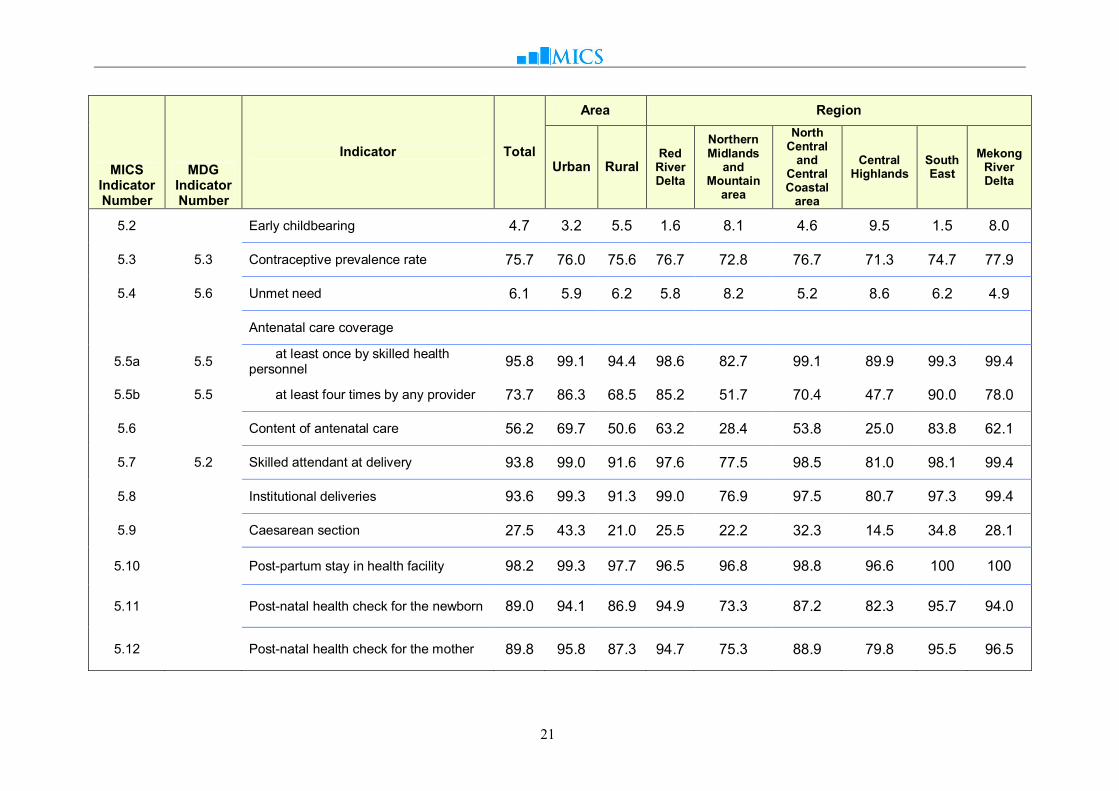
5.2
Early childbearing 4.7 3.2 5.5 1.6 8.1 4.6 9.5 1.5 8.0
5.3 5.3 Contraceptive prevalence rate 75.7 76.0 75.6 76.7 72.8 76.7 71.3 74.7 77.9
5.4 5.6 Unmet need 6.1 5.9 6.2 5.8 8.2 5.2 8.6 6.2 4.9
Antenatal care coverage
5.5a 5.5 at least once by skilled health
personnel 95.8 99.1 94.4 98.6 82.7 99.1 89.9 99.3 99.4
5.5b 5.5 at least four times by any provider 73.7 86.3 68.5 85.2 51.7 70.4 47.7 90.0 78.0
5.6
Content of antenatal care 56.2 69.7 50.6 63.2 28.4 53.8 25.0 83.8 62.1
5.7 5.2 Skilled attendant at delivery 93.8 99.0 91.6 97.6 77.5 98.5 81.0 98.1 99.4
5.8
Institutional deliveries 93.6 99.3 91.3 99.0 76.9 97.5 80.7 97.3 99.4
5.9
Caesarean section 27.5 43.3 21.0 25.5 22.2 32.3 14.5 34.8 28.1
5.10
Post-partum stay in health facility 98.2 99.3 97.7 96.5 96.8 98.8 96.6 100 100
5.11
Post-natal health check for the newborn 89.0 94.1 86.9 94.9 73.3 87.2 82.3 95.7 94.0
5.12
Post-natal health check for the mother 89.8 95.8 87.3 94.7 75.3 88.9 79.8 95.5 96.5

22
MICS Indicator Number
MDG Indicator Number
Indicator Total
Area Region
Urban Rural Red
River Delta
Northern Midlands
and Mountain
area
North Central
and Central Coastal
area
Central Highlands
South East
Mekong River Delta
CHILD DEVELOPMENT
6.1
Attendance to early childhood education 71.3 79.7 67.8 85.5 83.8 74.6 65.0 71.2 39.0
6.2
Support for learning 75.9 85.0 72.2 86.5 65.3 78.5 62.3 80.7 70.0
6.3
Father’s support for learning 14.9 22.7 11.7 21.1 9.1 14.4 12.9 19.6 9.5
6.4
Mother’s support for learning 45.0 61.9 38.0 53.9 37.0 45.1 36.8 51.6 38.0
6.5
Availability of children’s books 26.2 43.1 19.1 38.4 15.2 23.5 14.8 36.0 18.7
6.6
Availability of playthings 51.5 52.2 51.2 59.7 44.8 55.5 53.3 45.0 46.8
6.7
Inadequate care 7.0 4.4 8.1 5.1 11.5 10.3 9.4 3.4 3.5
6.8
Early child development index 88.7 90.8 87.8 93.7 81.8 87.0 90.4 89.1 89.2
LITERACY AND EDUCATION
7.1 2.3 Literacy rate among young people 96.5 98.6 95.5 99.3 87.3 98.5 92.3 98.7 97.0
7.2
School readiness 96.8 96.6 96.9 99.1 98.0 98.1 97.9 98.6 88.8
7.3
Net intake rate in primary education 96.2 97.6 95.6 99.5 91.3 100 93.9 95.6 92.6
7.4 2.1 Primary school net attendance ratio (adjusted)
97.7 98.4 97.4 98.6 95.3 99.9 94.8 97.6 97.6

23
MICS Indicator Number
MDG Indicator Number
Indicator Total
Area Region
Urban Rural Red
River Delta
Northern Midlands
and Mountain
area
North Central
and Central Coastal
area
Central Highlands
South East
Mekong River Delta
7.5
Lower secondary school net attendance ratio (adjusted)
90.4 94.8 88.6 98.1 87.7 94.1 81.6 89.9 84.4
Upper secondary school net attendance ratio (adjusted)
70.7 79.1 67.4 86.4 60.5 80.4 51.1 66.2 58.8
7.6 2.2 Children reaching last grade of primary 98.6 99.2 98.3 100 97.8 99.3 96.8 98.5 98.0
7.7
Primary completion rate 95.9 99.0 94.4 93.7 93.4 100.7 90.2 100 94.6
7.8
Transition rate to lower secondary school
98.0 100 97.2 100 98.7 97.1 94.8 97.9 98.3
Transition rate to upper secondary school
89.5 94.7 87.6 93.0 86.5 85.8 93.9 97.9 85.3
7.9 3.1 Gender parity index (primary school) 1.00 1.00 1.00 1.01 0.96 1.00 1.03 1.00 1.00
7.10 3.1 Gender parity index (lower secondary school)
1.03 1.02 1.03 1.02 0.98 1.00 1.13 1.04 1.07
Gender parity index (upper secondary school)
1.11 1.10 1.10 0.98 0.98 1.13 1.34 1.15 1.22
CHILD PROTECTION
8.1
Birth registration 96.1 96.7 95.8 98.8 95.0 98.1 92.1 95.2 93.2
8.2
Child labour 16.4 9.6 19.3 4.2 36.2 15.2 25.3 10.3 17.9
8.3
Violent discipline 68.4 66.8 69.1 62.6 60.9 71.2 79.4 68.2 73.8
8.4
Marriage before age 15 0.9 0.3 1.2 0.3 2.2 0.6 1.8 0.4 1.4
24
MICS Indicator Number
MDG Indicator Number
Indicator Total
Area Region
Urban Rural Red
River Delta
Northern Midlands
and Mountain
area
North Central
and Central Coastal
area
Central Highlands
South East
Mekong River Delta
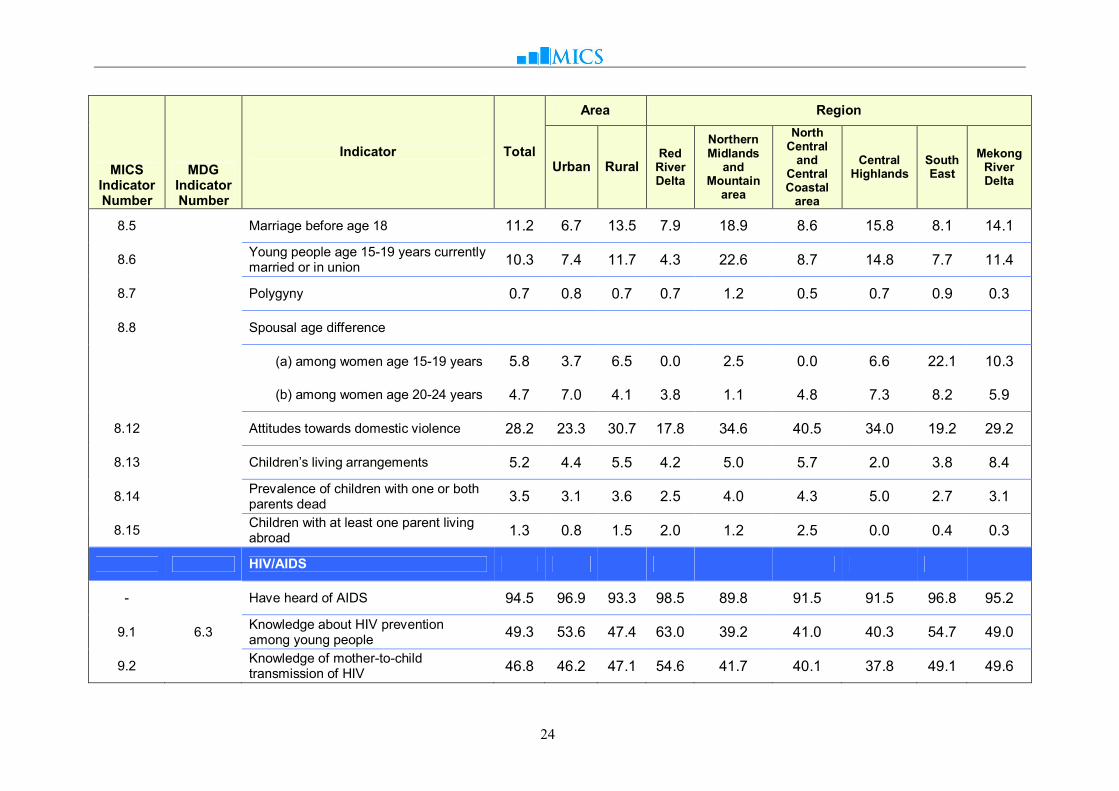
8.5
Marriage before age 18 11.2 6.7 13.5 7.9 18.9 8.6 15.8 8.1 14.1
8.6
Young people age 15-19 years currently married or in union
10.3 7.4 11.7 4.3 22.6 8.7 14.8 7.7 11.4
8.7
Polygyny 0.7 0.8 0.7 0.7 1.2 0.5 0.7 0.9 0.3
8.8
Spousal age difference
(a) among women age 15-19 years 5.8 3.7 6.5 0.0 2.5 0.0 6.6 22.1 10.3
(b) among women age 20-24 years 4.7 7.0 4.1 3.8 1.1 4.8 7.3 8.2 5.9
8.12
Attitudes towards domestic violence 28.2 23.3 30.7 17.8 34.6 40.5 34.0 19.2 29.2
8.13
Children’s living arrangements 5.2 4.4 5.5 4.2 5.0 5.7 2.0 3.8 8.4
8.14
Prevalence of children with one or both parents dead
3.5 3.1 3.6 2.5 4.0 4.3 5.0 2.7 3.1
8.15
Children with at least one parent living abroad
1.3 0.8 1.5 2.0 1.2 2.5 0.0 0.4 0.3
HIV/AIDS
-
Have heard of AIDS 94.5 96.9 93.3 98.5 89.8 91.5 91.5 96.8 95.2
9.1 6.3 Knowledge about HIV prevention among young people
49.3 53.6 47.4 63.0 39.2 41.0 40.3 54.7 49.0
9.2
Knowledge of mother-to-child transmission of HIV
46.8 46.2 47.1 54.6 41.7 40.1 37.8 49.1 49.6

25
MICS Indicator Number
MDG Indicator Number
Indicator Total
Area Region
Urban Rural Red
River Delta
Northern Midlands
and Mountain
area
North Central
and Central Coastal
area
Central Highlands
South East
Mekong River Delta
9.3
Accepting attitudes towards people living with HIV
30.0 29.2 30.4 35.7 34.9 31.7 28.5 25.7 22.3
9.4
People who know where to be tested for HIV
69.9 79.8 65.0 83.8 65.3 61.9 58.8 80.6 58.7
9.5
People who have been tested for HIV and know the results
11.3 15.1 9.4 14.1 10.3 7.4 6.1 16.9 9.4
9.7
HIV counselling during antenatal care 29.3 36.1 26.5 26.6 19.2 19.6 14.2 50.3 40.4
9.8
HIV testing during antenatal care 30.0 42.2 25.0 30.2 13.1 16.1 9.8 65.7 36.5
9.16 6.4 Ratio of school attendance of orphans to school attendance of non-orphans
0.99 0.88 1.03
ACCESS MASS MEDIA AND ICT
10.1
Exposure to mass media 13.2 18.2 10.7 16.5 9.1 12.1 5.2 17.4 11.9
10.2
Use of computers 63.3 80.5 55.2 79.8 41.0 65.8 49.0 74.9 49.7
10.3 Use of internet 66.7 83.5 58.8 82.0 45.9 69.7 49.3 78.8 53.8
- Use of mobile phone 81.9 89.6 78.0 90.7 74.1 79.5 63.4 88.3 79.5
26
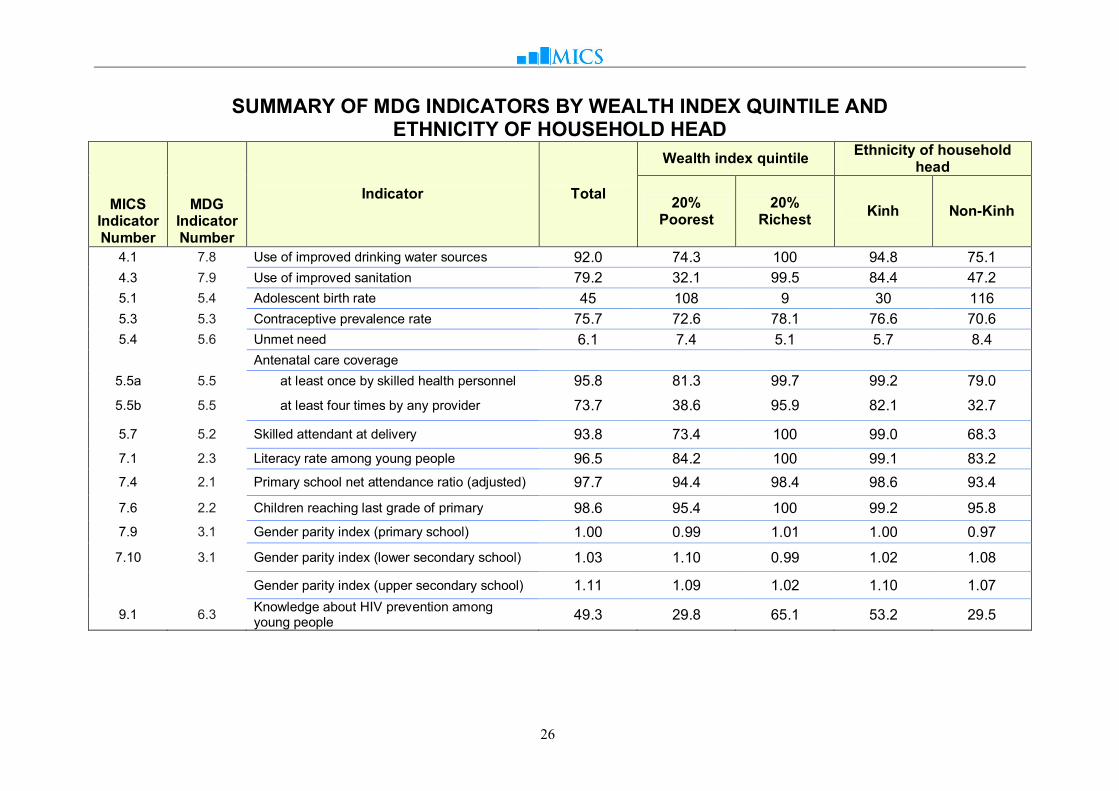
SUMMARY OF MDG INDICATORS BY WEALTH INDEX QUINTILE AND ETHNICITY OF HOUSEHOLD HEAD
MICS Indicator Number
MDG Indicator Number
Indicator Total
Wealth index quintile Ethnicity of household
head
20% Poorest
20% Richest
Kinh Non-Kinh
4.1 7.8 Use of improved drinking water sources 92.0 74.3 100 94.8 75.1
4.3 7.9 Use of improved sanitation 79.2 32.1 99.5 84.4 47.2
5.1 5.4 Adolescent birth rate 45 108 9 30 116
5.3 5.3 Contraceptive prevalence rate 75.7 72.6 78.1 76.6 70.6
5.4 5.6 Unmet need 6.1 7.4 5.1 5.7 8.4
Antenatal care coverage
5.5a 5.5 at least once by skilled health personnel 95.8 81.3 99.7 99.2 79.0
5.5b 5.5 at least four times by any provider 73.7 38.6 95.9 82.1 32.7
5.7 5.2 Skilled attendant at delivery 93.8 73.4 100 99.0 68.3
7.1 2.3 Literacy rate among young people 96.5 84.2 100 99.1 83.2
7.4 2.1 Primary school net attendance ratio (adjusted) 97.7 94.4 98.4 98.6 93.4
7.6 2.2 Children reaching last grade of primary 98.6 95.4 100 99.2 95.8
7.9 3.1 Gender parity index (primary school) 1.00 0.99 1.01 1.00 0.97
7.10 3.1 Gender parity index (lower secondary school) 1.03 1.10 0.99 1.02 1.08
Gender parity index (upper secondary school) 1.11 1.09 1.02 1.10 1.07
9.1 6.3 Knowledge about HIV prevention among young people
49.3 29.8 65.1 53.2 29.5
Related Documents