Applications of the Argus Technology for Coastal Zone Management and Engineering Video Metric Systems ™ from NorthWest Research Associates, Inc. NorthWest Research Associates, Inc. P.O. Box 3027 • 14508 NE 20th St. • Bellevue, WA 98009 888-644-NWRA • FAX 425-644-8422 www.videometricsystems.com [email protected]

Welcome message from author
This document is posted to help you gain knowledge. Please leave a comment to let me know what you think about it! Share it to your friends and learn new things together.
Transcript

Applications of the Argus Technology for Coastal Zone Management and Engineering
Video Metric Systems™from NorthWest Research Associates, Inc.
NorthWest Research Associates, Inc.P.O. Box 3027 • 14508 NE 20th St. • Bellevue, WA 98009
888-644-NWRA • FAX 425-644-8422
www.videometricsystems.com
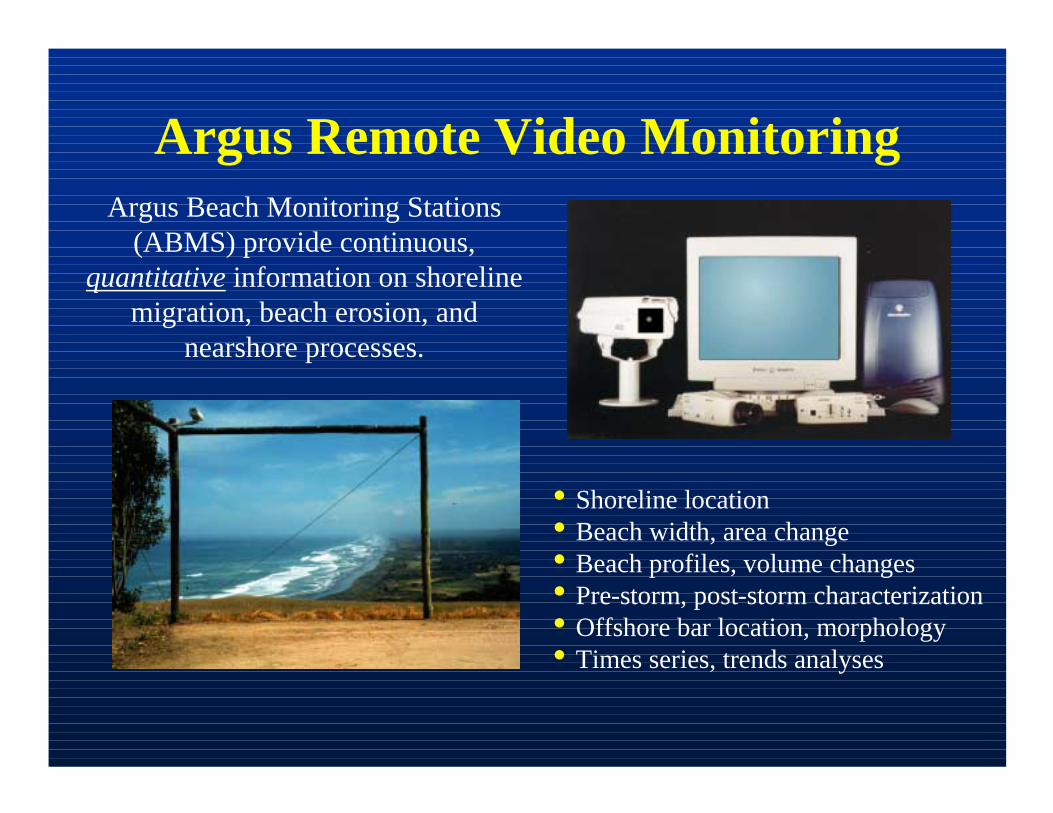
Argus Remote Video MonitoringArgus Beach Monitoring Stations
(ABMS) provide continuous, quantitative information on shoreline
migration, beach erosion, and nearshore processes.
• Shoreline location• Beach width, area change• Beach profiles, volume changes• Pre-storm, post-storm characterization• Offshore bar location, morphology• Times series, trends analyses

Objectives● Describe the Argus technology● Demonstrate capabilities through examples● Discuss roles and responsibilities● Summarize what we’ve learned about user
requirements

Outline● Overview of the technology● Data types● System performance● Case studies● New developments● Organizations and responsibilities● Steps in an Argus project● Results from user survey

The Basis for Video Monitoring
● We want to identify visual signatures of the features and processes we are interested in
● We need to determine where these signatures are located in the real world
● We need methods (algorithms) to identify and track these features in space and time
● We want these processes to be automated and easy to implement

ShorelineSand BarTrough
WavelengthWave Direction Wave Celerity
Wetted Beach
Shadow
Visual Signatures in the Nearshore

An image consists of a 640 (u) x 480 (v) matrix of pixel intensity (I) values (0-255).*
Basics of Digital Imagery
* Grayscale values; color images are recorded as pixel intensity in red, green, and blue: IRGB = (0-255, 0-255, 0-255).
1 640
480
v
u
Crop area
I=241I=167
I=18
+x-x
-y
+y
-z
+z

Photogrammetry● We convert from image (u,v) coordinates to
world (x,y,z) coordinate using photogrammetry● Problem is going from 2 knowns (u,v) to 3
unknowns (x,y,z):● To solve for (x,y), constrain z = ztide
● To solve for (z), constrain x (or y), e.g., via calculated position of a shadow line on a beach
● To maintain accuracy of geometry solutions, we need a few ground control points (GCP)

Overview of the Technology● High resolution video cameras look down
on a beach at oblique angles● SGI imaging system produces snapshot,
time exposure, and variance images with 640 x 480 pixel resolution
● Geometry solutions are solved to map pixel coordinates (u,v) into world (x,y,z) coordinates (photogrammetry)
● Pixel data are merged and rectified into Cartesian coordinate system (plan view)
● Analyses of pixel intensity over time identify and track key nearshore features, processes

Types of Video Data● “Snap shot” images● Digitally averaged time exposures (“timex”):
● Mean intensity (nominally 10 minute average)● Intensity variance (σI
2)
● Merged panoramic images (multiple cameras)● Rectified images
● Plan view in Cartesian coordinates
● Intensity along transects (“time stacks”)● Individual pixel intensity

“Snap Shot” Image 10 minuteTime Exposure
Duck, NC
Shoreline
Submergedsand bar Transverse
sand bars
Time Exposure ImagesDigitally averaging image intensity removes
short term variability (“visual noise”) and allows features in which we’re interested to be revealed.
GCP’s

Mean and Variance Images
10-min Timex 10-min Variance
CuspsCusps
In variance (σI2) images, dark areas indicate little change in pixel intensity
during the averaging period, bright areas the opposite, revealing details of features and providing measurements of range (e.g., run-up) and uncertainty.

Image Merging and Rectification
Sand BarShorelineRip ChannelsPier “Time Stack” Transect
Data from five cameras are shown in these figures.

Ground Truth of Timex Images
Bathymetry
Intensity Along Transect
50 100 150 200 250 300
SWL0
5.0
-5.0
Cross-Shore Profile 16 Oct. 86SD200 1142m
Elev
atio
n (m
)
Cross-Shore Distance (m)
Peak at Offshore BarPeak at Shoreline
Comparison of transect intensity data with measured bathymetry at Duck, NC (Lippmann and Holman, 1989)

Pixel Intensity Time Series
• Pixels provide “sensors” for visual signatures of nearshore features
• High frequency data collected at pixel sensor located above a submerged pressure sensor at Duck, NC 02/97
• Intensity data show good correlation with wave front passage
• One application of this technique is to measure wave phase speed and calculate offshore bathymetry (see New Developments)

Accuracy of Shoreline Location
8090
100110120130140150160
0 2 4 6 8 10 12 14 16 18 20 22 24 26 28 30Day
Shoreline Location(meters)
Argus Shoreline DGPS Shoreline
Comparison of shoreline location measured by an Argus station and differential GPS (DGPS) at Duck, NC (Plant and Holman, 1997)

Accuracy of Beach Profile
0.00.51.01.52.02.53.03.54.04.55.0
0 5 10 15 20 25 30 35 40
Cross-Shore Distance (meters)
BeachElev.
(meters)
ABMS
Survey
Comparison of profile of beach elevation* measured by an Argus station and traditional survey at Duck, NC (Holman et al., 1991)
* Vertical elevation is measured by solving for the z coordinate of a cross-shore “line in the sand” whose x and/or y position is known or can be calculated (e.g., shadows).

ABMS SpecificationsParameter Value
Range* ± 40 m to ± 2.5 km
Resolution*
At 100 meters from station:x,z = 0.1 m y = 0.5 mAt 1000 meters from station:x,z = 0.5 m y = 12.5 m
RMS Accuracy 0.35–2.4 m horizontal10-20 cm vertical
AveragingInterval
10 min. nominal
* Function of camera height, lens focal length

Erosion of a Nourished Beach● High rates of erosion along Long Key near
St. Petersburg, FL necessitate nourishment every 2-3 years
● Each nourishment costs ~$1.5M● Latest nourishment completed 6/96● Argus station operated 10/96 - 04/98 to study
morphology of this beach

Upham Beach Nourishment
Before
After
SouthNorthUpham Beach
SouthNorth
View from roof of condominium where Argus station was installed.

10/10/96 01/13/97
03/25/97 06/24/97
Sea wall exposed
Sediment transport
Beach Nourishment Change Sequence
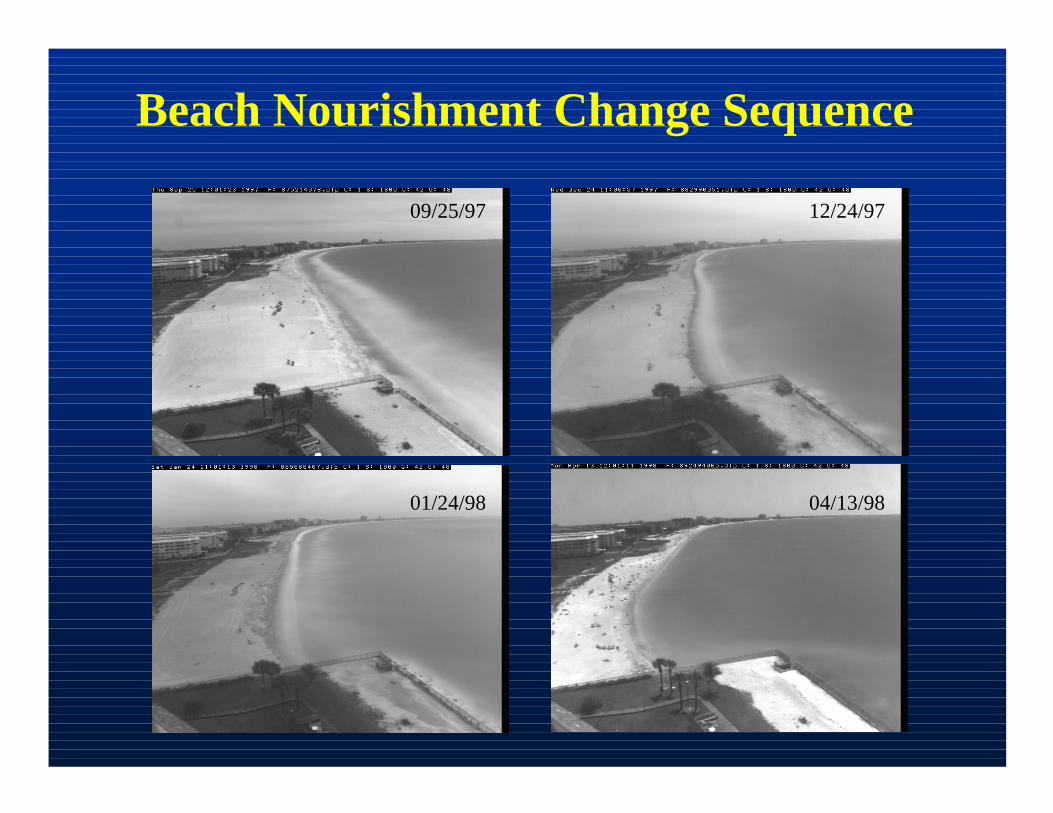
09/25/97 12/24/97
01/24/98 04/13/98
Beach Nourishment Change Sequence

Run Upham Beach Movie
Upham Beach Movie● Timex images collected at noon (EDT) each
day 10/19/96 - 04/14/98● Movie runs at 6 frames (days)/second● Things to look for:
● Erosion in the near field● Accretion in the far field● Higher rate of loss in winter of ‘97-’98 (El Nino?)● Episodic storm impacts (note especially 1/27-2/12
‘98, but don’t get fooled by missing data)

Analysis of Shoreline Retreat
• Specify transect location(s)• Identify mean shoreline from peak in timex intensity at
shore break (variance imagery shows range of run-up)• Repeat for all hours/days of interest
A horizontal transect used for image intensity analysis
Intensity along the transect
Mean shoreline location selected by ABMS software

Example non-dimensional intensity transect
Localparabolicfit
Shoreline Position Estimation

Shoreline picks
Cross-Shore (x) Distance AlongTransect at y = 75 m
Time(day)
This time stack shows cross-shore image intensity along a transect as a function of time.
Time Stack Data

Shoreline Migration
-20
0
20
40
60
80
Dec-96
Feb-97
Apr-97
Jun-97
Aug-97Oct-97
Dec-97
Feb-98
Apr-98
ShorelineRetreat(meters)
Retreat of the shoreline of a nourished beach near St. Petersburg, FL measured by an Argus Beach Monitoring Station
‘97-’98 El Nino
Stabilization, some recovery?
1st winter

Trends Analysis
-20
-10
0
10
20
30
40
50
60
70
80
Dec-96 Jan-97 Mar-97 May-97 Jul-97 Sep-97 Nov-97 Jan-98 Mar-98 May-98
Date
Cross-shoreShorelinePosition(meters)
Winter '96-'97Erosion rate = 0.21 +/- 0.02 m/dyR2 = 0.95
Winter '97-'98Erosion rate = 0.39 +/- 0.03 m/dyR2 = 0.92
Traditional spot surveys might miss trends, catch the wrong phase of the seasonal erosional cycle, and/or fail
to capture episodic changes.
Exposed seawall
Condo where ABMS installed

Use multiple transects to map changes in longshore shoreline location, beach area. If vertical profiles are measured (they
weren’t in this case), volume can be calculated.
Image Sampling Scheme

0
20
40
60
80
100
120
14050 75 100 125 150 175 200 250 300 350 400 500 750
y (m)
x (m)
Beach Area = 61,519 sq. meters
10/20/96
0
20
40
60
80
100
120
14050 75 100 125 150 175 200 250 300 350 400 500 750
y (m)
x (m)
Beach Area = 49,188 sq. meters
04/14/97
Study Area
x
y
0
20
40
60
80
100
120
14050 75 100 125 150 175 200 250 300 350 400 500 750
y (m)
x (m)
Beach Area = 25,981 sq. meters
04/01/98
0
20
40
60
80
100
120
14050 75 100 125 150 175 200 250 300 350 400 500 750
y (m)
x (m)
Beach Area = 59,715 sq. meters
12/20/96
0
20
40
60
80
100
120
14050 75 100 125 150 175 200 250 300 350 400 500 750
y (m)
x (m)
Beach Area = 41,650 sq. meters
07/27/970
20
40
60
80
100
120
14050 75 100 125 150 175 200 250 300 350 400 500 750
y (m)
x (m)
Beach Area = 42,646 sq. meters
10/04/97
0
20
40
60
80
100
120
14050 75 100 125 150 175 200 250 300 350 400 500 750
y (m)
x (m)
Beach Area = 36,723 sq. meters
01/20/98Accreted Area
Oct. 1996
Apr. 1998
Shoreline and Area Change

• Since 1995, 2 cameras• Intermediate beach
Palm Beach, Australia
• 1 m tide range• H ~ 1.5 m, T ~ 10 s
Argus Station

Rip Currents
This image is referred to as a “daytimex,” where a full day of intensity data are averaged. Daytimex’s reveal mean locations of nearshore features and are useful for
creating movies showing evolution of features.
Palm Beach, Australia

A single weekend in Australia
Rip Currents

Run Palm Beach Movie
Palm Beach Movie● Rectified daytimex images from Palm Beach,
Australia 02/96 - 12/96● Movie runs at 6 frames (days)/second● Things to look for:
● Rip channel development, translation● Bar development● Longshore displacement● Storm impacts

New Developments● Wave phase speed, direction and their
relationship to nearshore bathymetry● Visibility (turbidity)● Traffic counting, transportation impacts● Beach usage● Sea turtle nesting (with IR cameras)

Time stack of cross-shore pixel intensity • High frequency video sampling used to
measure wave phase speed (c) and direction
• Offshore bathymetry calculated from relationship between c and depth (h) expressed in shallow water wave equation
• Argus data compared to measurements made by the “CRAB” at Duck, NC during SandyDuck experiment, Oct. 1997
Argus bathymetry vs. CRAB
* Data courtesy of Hillary Stockdon (USGS) and Rob Holman (OSU)
Argus Bathymetry*
Wave fronts
Slope ∝ c
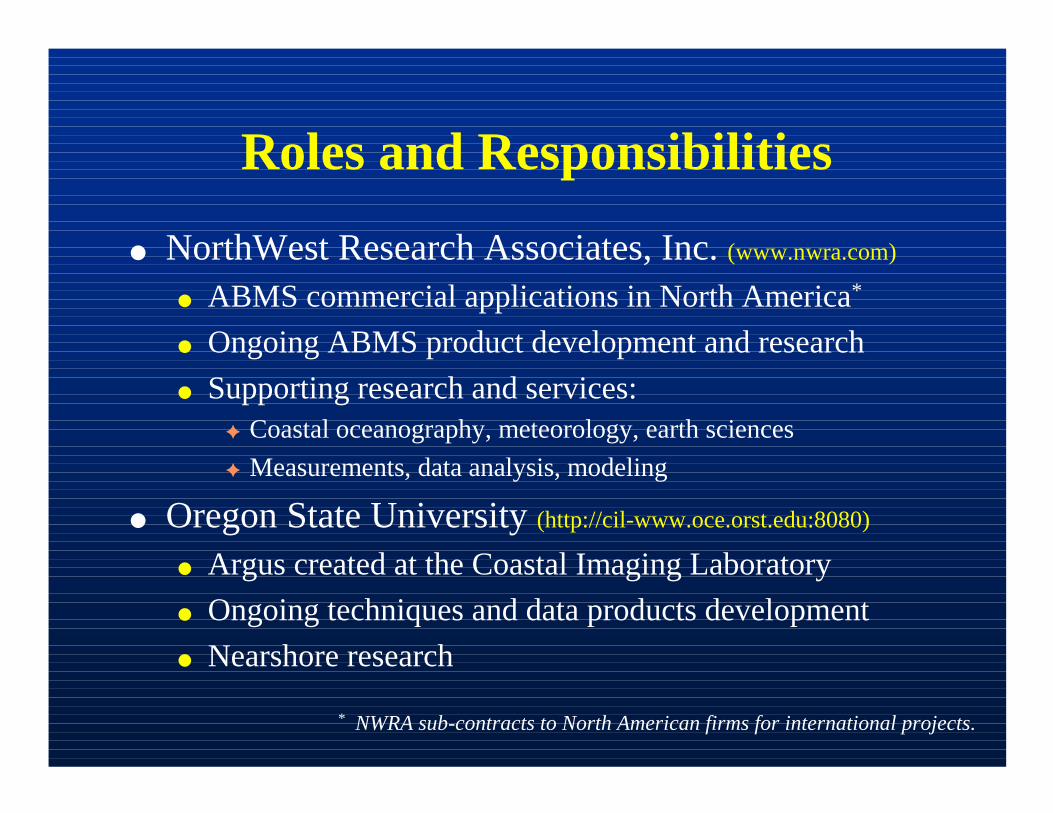
Roles and Responsibilities
● NorthWest Research Associates, Inc. (www.nwra.com)
● ABMS commercial applications in North America*
● Ongoing ABMS product development and research● Supporting research and services:
✦ Coastal oceanography, meteorology, earth sciences✦ Measurements, data analysis, modeling
● Oregon State University (http://cil-www.oce.orst.edu:8080)
● Argus created at the Coastal Imaging Laboratory● Ongoing techniques and data products development● Nearshore research
* NWRA sub-contracts to North American firms for international projects.

● USACE (http://www.frf.usace.army.mil/video.html)
● Coastal Hydraulics Lab, Field Research Facility● Applied research, ABMS ground truth comparisons
● USGS (http://coastal.er.usgs.gov/rvm)
● Coastal and Marine Geology Program● Applied research, airborne lidar surveying
● Delft Hydraulics● Government-mandated monitoring of the Dutch
coastline● ABMS commercial applications outside N.A.
Roles and Responsibilities (con’t)

Services Provided byVideo Metric Systems™
● Design monitoring programs● Deploy, operate, and maintain the stations● Process, quality control, and analyze the data● Prepare basic and advanced data packages● Develop information for public outreach (e.g.,
web page hosting, internet dissemination)● Provide supporting nearshore oceanographic
and meteorological measurements● Provide supporting R&D

Steps in an Argus Project (1 of 2)● Preparations:
● Establish requirements for spatial resolution and range✦ Number of cameras needed, sampling geometry✦ Height is important (e.g., building, tower)
● Site and equipment preparation, deployment✦ Power, shelter, communications, security, permitting, ...✦ Lens calibration (correct for distortion)✦ Survey ground control points (GCP)
● Routine operations:● Continuous data collection, processing● Remote data telemetry, monitor station status● Routine and emergency maintenance

Data Flow
ABMS
Remote Comm. PC(optional)*
Field Station NWRA Argus Metrics Operations Center
Download
ControlControl
Download
* Remote communications PC is not needed if a local internet connection can be established with the SGI™ workstation.
Web Server ftp Server
NetworkDial-up
Unix and NT Network

Field Station Design Issues● Field of view (e.g., 180°)● Range● Pixel resolution● Cover features at specific locations,
e.g. structures, horizon, vegetation line● No. of cameras● Design support tool
● Number of cameras● Camera orientation● Lens focal length
Camera location

Far Field

Near Field

Steps in an Argus Project (2 of 2)● Data processing with ABMS MatLab software
● Prepare basic data package:✦ Quality control images✦ Compute geometry solutions and apply calibrations✦ Produce image archives: merged timex, daytimex, rectified,
variance, movies, ...✦ Create data bases of transect, pixel intensity (“time stacks”)
● Prepare advanced data package:✦ Shoreline features, area, profiles, volume, ...✦ Prepare time series analyses, trends analyses, …✦ Perform final quality control
● Prepare and distribute data deliverables, reports

User Survey● What are the key problems facing the coastal
zone management and engineering communities that Argus stations can help solve?
● What are the high priority data products and services that users want?
● What are user perceptions of the major benefits offered by the technology?

Key Problems● Quantitative information for tracking long-term
(multi-year) shoreline location, migration● Support project design, evaluate project performance ● Where’s the beach? Where did the sand go?
● Pre-storm versus post-storm damage assessments● Analyze long-term trends and identify episodic
(short-term) changes, erosional hot-spots● Sand budgets (area and volume changes)● Public outreach (education), safety (rip currents)

Data Products and Services● Shoreline location● Recreational beach width, area change● Beach profiles, volume change● Time series and trends analyses● Offshore sand bar location, morphology● Confidence intervals, uncertainties● Information for public outreach, safety● Video imagery and movie archives● Turn-key project design, execution

Benefits● Obtain cost-effective monitoring for coastal resource
planning, management, and evaluation● Improve accuracy of project designs, monitor
construction, evaluate performance more thoroughly● Characterize pre-storm/post-storm damage more
completely and consistently● Detect important trends, identify “hot spots” and take
corrective action sooner● Receive continuous data with quality comparable to or
exceeding traditional survey methods● Powerful medium to reach the public

www.videometricsystems.com
Video Metric Systems™from NorthWest Research Associates, Inc.
NorthWest Research Associates, Inc.P.O. Box 3027 • 14508 NE 20th St. • Bellevue, WA 98009
888-644-NWRA • FAX 425-644-8422
Related Documents