Video Assist: a Customizable Tool for Analyzing Video Data Claude Stricker’ Jean-Luc Nicoulin2 Jintae Lee’ Silvio Munari’ University of Hawaii Depwbnent of Decision Sciences cs@ busadm. cba. hawaii. edu Abstract Analyzing real-world events captured in video is often a ve y time-consuming and labor-intensive process. This paper describes Video Assist, a software tool designed to assist encoding arld analyzing actions recorded on video tape. It presents the design rationales underlying its features such as: customizable objects and their attributes, their integration with an outliner and time- line diagrams, their directly manipulable interface, and its mechanism for supporting consistent labeling. It reports on the use gf this tool in analyzing a software review process meeting recorded on video tape. Using this example, it illustrates how Video Assist implements the phases and the operations of ESDA (Exploratoy Sequential Data .4nalysis) and how they can dramatically simpliji) the process of analyzing the sequential data in video. It concludes by discussing the current limitations qf the tool and the plans for future extension. 1. Introduction Analyzing events directly in their raw form is an essential part of much behavioral research. For instance, analyzing speeches in face-to-face meetings is an important way of determining if groups using Computer Supported Collaborative Work tool (CSCW) behave differently from groups with no computerized support VI- EncoQng and analyzing events recorded on video tapes require special features not found in the existing prodm.ivity software (text processors, spread-sheet programs, database systems, statistic programs). The observed events can be very complex: studying the behavior of people in a group may require observing their gestures, understanding their speeches, looking at the movement of their eyes and capmnng all the relationships between gestures, speeches and eye movements. The observations must be manually University of Lausanne Business School HEC silvio.munari@hec. unil. ch 2 encoded, before any analysis can start. The encoded data must be represented in a way that linear and non-linear relationships between the observed aspects can be detected. The links between the encoded data and the corresponding video segment on the tape must be preserved, in order to review the action at any time during the iterative analysis process. Currently, specific solutions have been proposed for specific tasks. Dedicated software has been created for supporting observational data analysis in human- computer interaction studies. Random-access video disks ease the manipulation of multi-media data and makes possible non-linear video editing. However, observing, encoding, and analyzing the richness of video-segments remain labor-intensive. Animated images and speech recognition systems could help, but these technologies are not mature enough for effective use in the upstream operations of the analysis process. The goal of our project is to assist the analysts with the encoding and analysis of events recorded on video tape. To achieve this goal, we have developed a software tool, called Video Assist, and implement features that help manipulate their rich, linear and non-linear representation of the data. We assume also that a set of typical operations are common to any analysis process requiring the encoding and analysis of video-recorded events. In order to present the rypical operations that a tool should support, we use the generic framework of Exploratory Sequential Data Analysis (ESDA) defined by [2]. ESDA refers to “any empirical undertaking seeking to analyze systems, environmental, and/or behavioral data (usually recorded) in which the sequential integrity of events has been preserved. The analysis of such data (a) represents a quest for their meaning in relation to some research question, (b) is guided methodologically by one or more traditions of practice, and (3) is approached (at least at the outset) in an exploratory mode.” ESDA is common in human-computer interaction studies. In other domains, like in psychology, sociology or anthr~pology. th~s type of analysis is usually called protocol analysis. discourse analysis, conversation analysis, interaction 1060-3425/97 $10.00 Q 1997 IEEE 209

Welcome message from author
This document is posted to help you gain knowledge. Please leave a comment to let me know what you think about it! Share it to your friends and learn new things together.
Transcript
Video Assist: a Customizable Tool for Analyzing Video Data
Claude Stricker’ Jean-Luc Nicoulin2 Jintae Lee’ Silvio Munari’ University of Hawaii
Depwbnent of Decision Sciences cs@ busadm. cba. hawaii. edu
Abstract Analyzing real-world events captured in video is often a ve y time-consuming and labor-intensive process. This paper describes Video Assist, a software tool designed to assist encoding arld analyzing actions recorded on video tape. It presents the design rationales underlying its features such as: customizable objects and their attributes, their integration with an outliner and time- line diagrams, their directly manipulable interface, and its mechanism for supporting consistent labeling. It reports on the use gf this tool in analyzing a software review process meeting recorded on video tape. Using this example, it illustrates how Video Assist implements the phases and the operations of ESDA (Exploratoy Sequential Data .4nalysis) and how they can dramatically simpliji) the process of analyzing the sequential data in video. It concludes by discussing the current limitations qf the tool and the plans for future extension.
1. Introduction
Analyzing events directly in their raw form is an essential part of much behavioral research. For instance, analyzing speeches in face-to-face meetings is an important way of determining if groups using Computer Supported Collaborative Work tool (CSCW) behave differently from groups with no computerized support VI-
EncoQng and analyzing events recorded on video tapes require special features not found in the existing prodm.ivity software (text processors, spread-sheet programs, database systems, statistic programs). The observed events can be very complex: studying the behavior of people in a group may require observing their gestures, understanding their speeches, looking at the movement of their eyes and capmnng all the relationships between gestures, speeches and eye movements. The observations must be manually
University of Lausanne Business School HEC
silvio. munari@hec. unil. ch
2
encoded, before any analysis can start. The encoded data must be represented in a way that linear and non-linear relationships between the observed aspects can be detected. The links between the encoded data and the corresponding video segment on the tape must be preserved, in order to review the action at any time during the iterative analysis process.
Currently, specific solutions have been proposed for specific tasks. Dedicated software has been created for supporting observational data analysis in human- computer interaction studies. Random-access video disks ease the manipulation of multi-media data and makes possible non-linear video editing. However, observing, encoding, and analyzing the richness of video-segments remain labor-intensive. Animated images and speech recognition systems could help, but these technologies are not mature enough for effective use in the upstream operations of the analysis process.
The goal of our project is to assist the analysts with the encoding and analysis of events recorded on video tape. To achieve this goal, we have developed a software tool, called Video Assist, and implement features that help manipulate their rich, linear and non-linear representation of the data. We assume also that a set of typical operations are common to any analysis process requiring the encoding and analysis of video-recorded events. In order to present the rypical operations that a tool should support, we use the generic framework of Exploratory Sequential Data Analysis (ESDA) defined by [2]. ESDA refers to “any empirical undertaking seeking to analyze systems, environmental, and/or behavioral data (usually recorded) in which the sequential integrity of events has been preserved. The analysis of such data (a) represents a quest for their meaning in relation to some research question, (b) is guided methodologically by one or more traditions of practice, and (3) is approached (at least at the outset) in an exploratory mode.” ESDA is common in human-computer interaction studies. In other domains, like in psychology, sociology or anthr~pology. th~s type of analysis is usually called protocol analysis. discourse analysis, conversation analysis, interaction
1060-3425/97 $10.00 Q 1997 IEEE 209
analysis or cognitive task analysis. Although Video Assist has been designed to support
the operations defined in ESDA, its use can go beyond academic purposes. For instance, a teacher might want to video-tape his lecturing. He could find benefits in classifying particular episodes on the tapes for later retrieval and comparing over the time. Whatever academic or practical, the generic operations found in ESDA provide a ground anchor for specifying the comprehensive requirements that a computerized support should satisfy. The teacher's example could be considered as a simplified case of ESDA, where the main purpose of the analysis is simply to class@ events.
This paper reports on the development and the use of Video Assist. Section 2 describes the design rationales by introducing the eight generic operations of ESDA. Section 3 present the main components of the tool. Section 4 reports the usage experience with Video Assist. We have used it to analyze the detaded activities in a software review meeting recorde Section 5 discusses the lessons drawn articulates the limits of our approach, Video Assist to other tools. Section 6 presents the next steps of our project.
2. Requirements
In the framework proposed is divided into three main phas (1) De3nztion of the design or (2) Observation: Raw sequences of data are generated
from the observed system, or from the environmental and behavioral events occurring. For instance, in a software usability testing observation, data could be the video recording, the keystrokes' data logs, and annotations created synchronously by an external observer.
( 3 ) Analysis. Recording and logs are integrated and a set of analytic operations are performed in order to answer the initial design or research question. For each analytic operation, data elements could be transformed into another form. For example, semi- structured notes taken during observation might be re-organized into an outline containing links to the corresponding video segments or into timeline diagrams showing the duration of speeches of different meeting participants.
[3], an ESDA process
Eight primitive operations can be performed during the Analysis: (1) Chunking is defined as the first arrangement of the
unstructured mass of events contained in the data. Adjacent data elements are grouped into larger
episodes, or flags are placed in the sequence of data for marking ends or starts of phases or of fine events. Commenting consists of writing unstructured notes that are linked to any objects of the analysis. They can be linked directly to the video segments or to data elements later produced. It can be summaries, memos, or theoretical reflections. Coding consists of creating structured labels linked to the chunks or to the data elements. It can be sophisticated predicate notations or just a combination of simple keywords. Connecting consists of relating or linking together discontinued data elements belonging to the same type of topics. Events related on a given dimension (e.g. all the comments by a given reviewers) do not occur necessarily in a contiguous way. Also the connections between the qualitatively different products (the segments o f the video tapes, the comments, the chunks etc.) must be created and maintained. The most obvious example is the mechanical connection between the video tape segments and correspondmg data elements. Comparzng can include three types of comparison. The first type is the comparison between the comments, codes, or chunks produced by several analysts in order to reveal differences in interpretation. The second type is the comparison between different parts of the data or between Merent collections of data possibly recorded under Werent conditions. The third type is the comparison between a standard model of what should occur and the observed events, based on raw data, statistical summaries, or graphical re-expressions of the data. Constraining consists of temporary removing occurrences of the products - whatever the product is. chunks, comments, codes etc - in order to focus more easily on one aspect. It mght be aggregates o f non-adjacent data elements. Conversing transforms the data in order to allow new patterns to emerge. For instance codes are converted into a new scheme, or the resolution of a time-line graphic is changed COTnpUfZng includes all the statimcal operations.
The operations can be emphasized, reduced to a minimum, or even skipped, depending on the goal of the analysis. They can occur several times during the process, if the analyst is not satisfied with the results, or if the results raise other questions. A tool should be flexible enough to support these iterations. A highly desired effect of using a computerized support is to reduce the ratio between the duration o f the analysis and the actual
2 10
duration of the obsewed events. Frequency of events varies: phases in a project can
last from one day to more than one year. Duration of meetings range froni a few minutes to an entire day. Speeches can be shorter than one second. Eye movements take less than one second. Events with short duration can have higher frequencies than events with longer duration. A tool supporting ESDA in difTerent domains must be adaptable to the spectrum of the sequential events.
We have assumed that the analysts could delegate the upstream operations (chunking, commenting and encoding) to other collaborators. The tool should provide a way to easily define different data structures, different ways to enter the data and different types of representation, according to the protocol that the collaborators should Ifollow.
3. Video Assist
Video Assist is a tool designed to help its user with the representation and analysis of videbased data on a PC. The user controls a video-tape recorder (VCR) remotely with the computer keyboard or the mouse, from within a control panel in the Microsoft Windows environment. The images are displayed in a separate monitor. The timecode from the tape is captured by the sofhvare. The user enters any events, speeches, descriptions of states or codes in data forms specifically designed for this ;task and for the type of data. Timestamps from the time-code are automatically associated with the entered information, creating an occurrence of the observed object each time that they are selected by a keystroke or by a mouse-click. A time-line diagram displays the occurrences of the observed objects in synchrony with Ihe video playing. The user can command the VCR to retrieve and play a segment of images associated with the occurrence of an object, by clicking on any rep.resentation of the associated data, e.g. from within the timeline diagram or from within an outline.
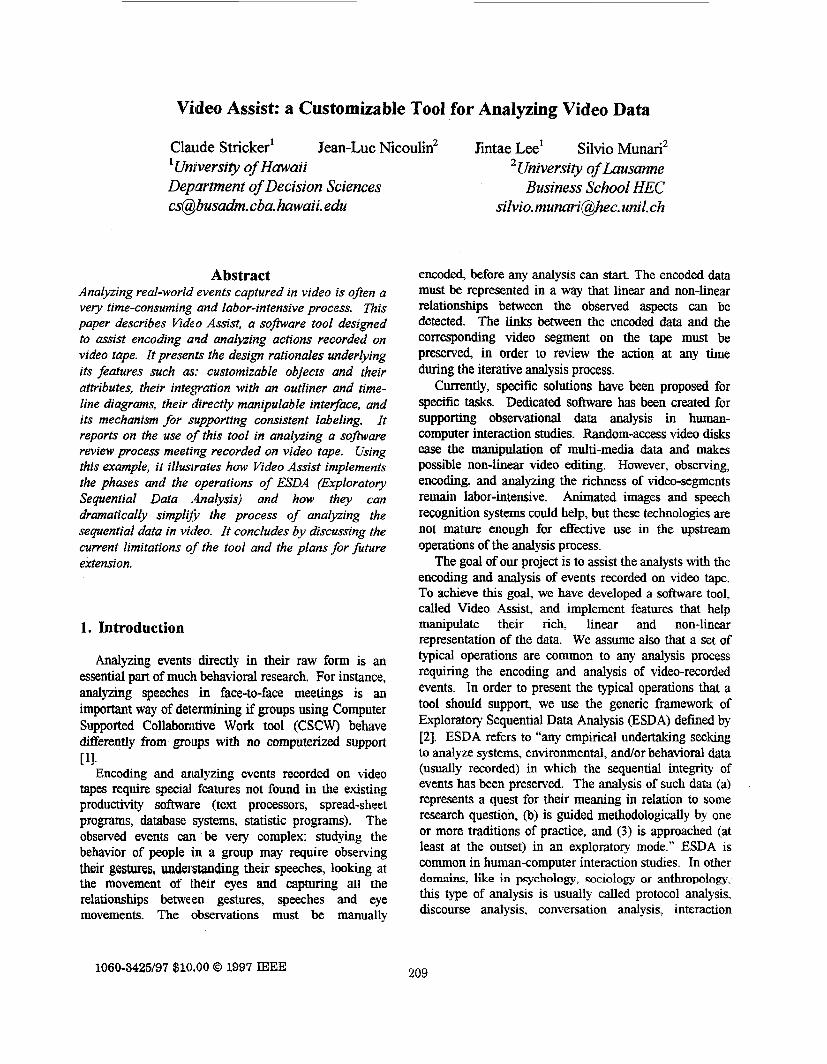
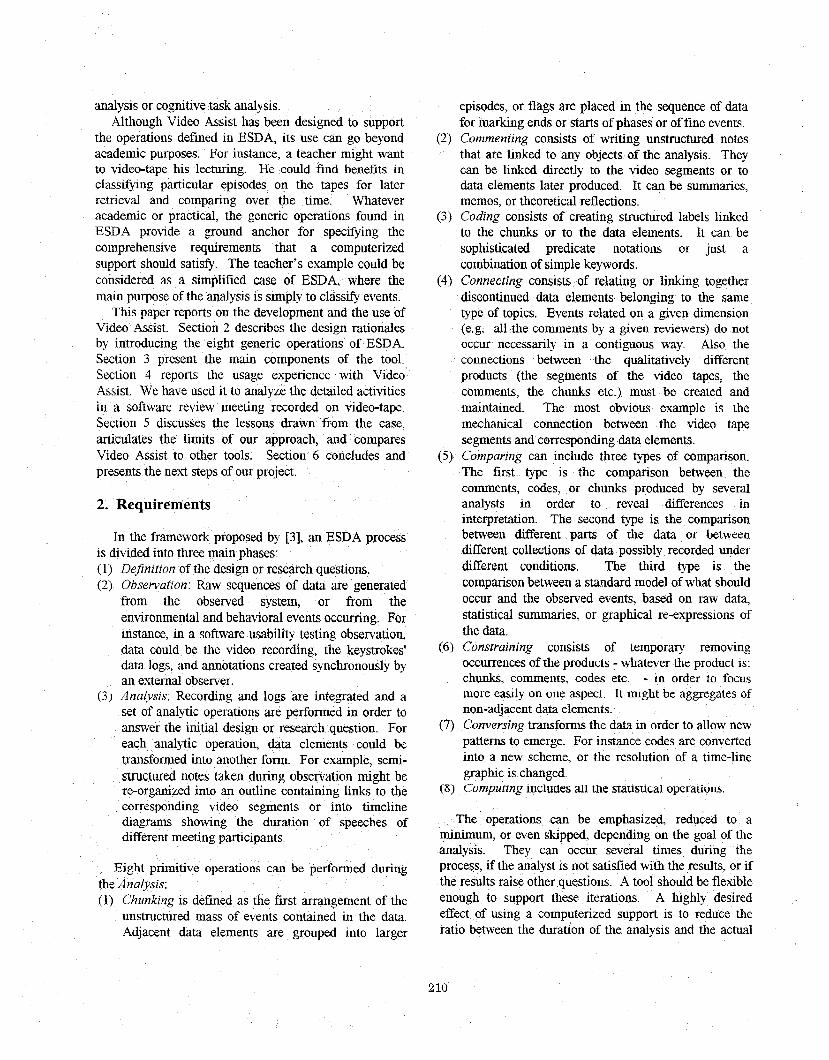
Video Assist has been implemented with the goal in mind that the analyst can customize the objects to be analyzed, their attributes, the data entry forms, and the timeline diagram from generic templates. The h a r e components of the cystem are presented in Figure 1.
c0"unication by RS232 serial pon
/- - Commands
Figure 2. Hardware components of Video Assist
Video Assist has been developed within the object- oriented environment Delphi [4], using its Pascal object- oriented language and the database Paradox. Figure 2 shows the software architecture. The remote control of the VCR is enabled by a separate module controling the RS-232 port. The database must contain two radically different kinds of data in order to offer a way to specialize the tool for different protocols: (I) The data describing the specialized components
(objects, variables, forms, and diagrams). (2) The observed or encoded data. Their " r e relies
on the customization given to the generic components objects, variables, forms, and diagrams. It requires generating the corresponding dabatase structure at runtime.
3.1. Generic components
Figure 1. Main software components
For analysis, the following must be customized according to the protocol: the objects to be analyzed, their associated attributes, the data entry forms and the diagrams for reporting and reviewing.
3.1.1. Objects. An object represents a specific view on the real-world data relevant to the analysis, e.g. speeches, movements, keyboards' events, agents or resources. An object has attributes defined by the user in order to describe its multiple aspects (e.g. duration, starting time, speech intonation). Attributes are implemented as data structures. For example, speech intonation could use the data structure "list" containing "hesitation / convinction I pemtion".
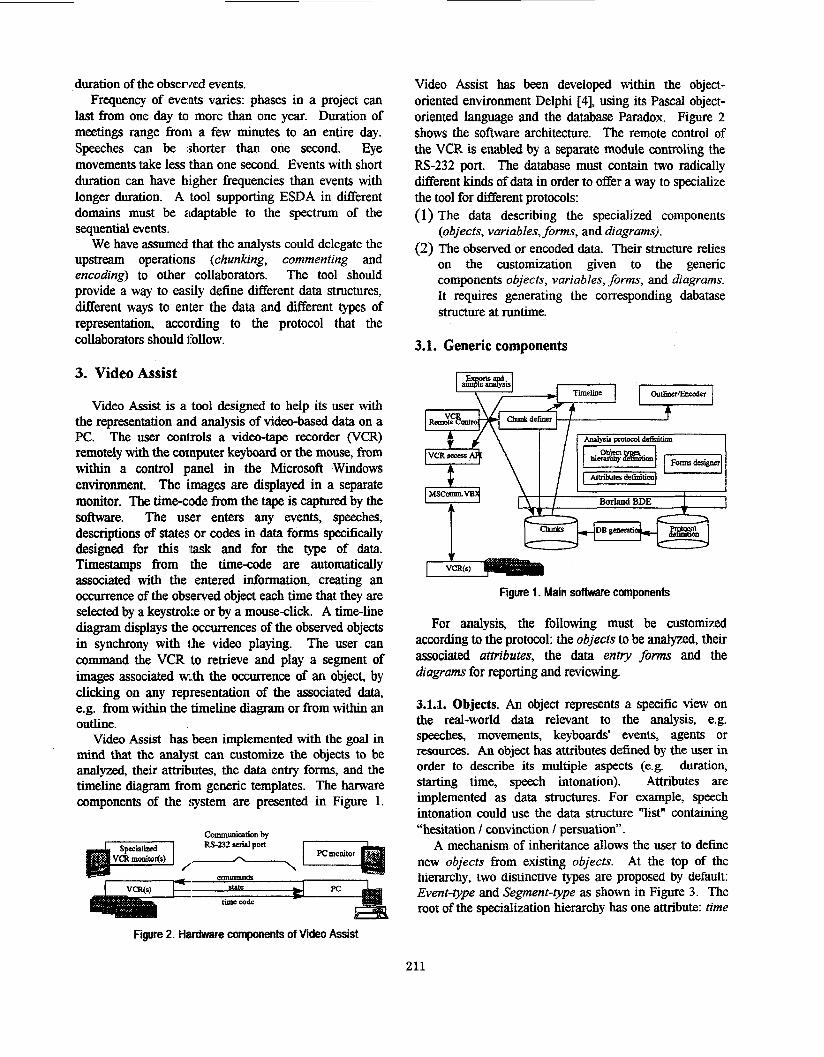
A mechanism of inheritance allows the user to define new objects from existing objects. At the top of the hierarchy, two dimnctive types are proposed by default: Event-type and Segment-type as shown in Figure 3. The root of the specialization hierarchy has one attribute: time
211
in. Event-type objects inherit this attrib type objects inherit time in and have duration added.
Figure 3. Hierarchy of the objects to be analyzed
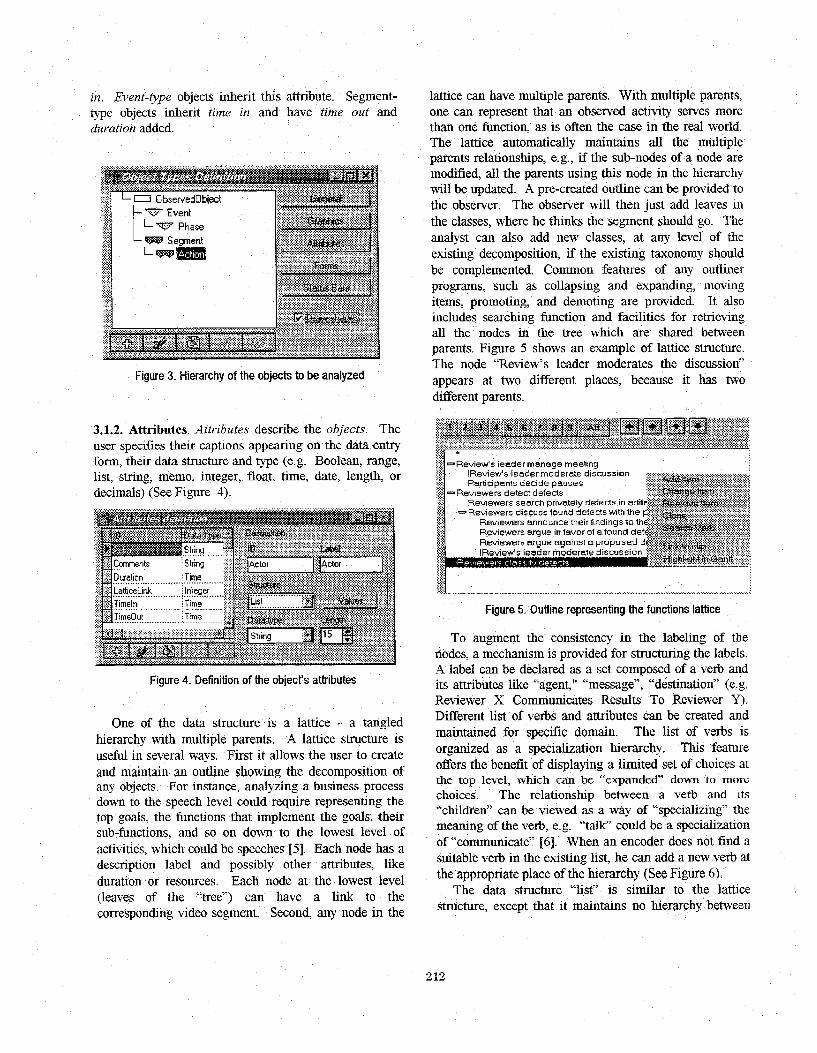
3.1.2. Attributes. Attrzbutes describe the objects. The user speclfes their caphons appearing on the data entry form, their data structure and type (e.g. Boolean, range, list. stnng, memo, integer, float, time, date, length, or decimals) (See Figure 4).
Figure 4. Definition of the object‘s attributes
One of the data structure is a lattice - a tangled hierarchy with multiple parents. A lattice structure is useful in several ways. First it allows the user to create and maintain an outline showing the decomposition of any objects. For instance, analyzing a business process down to the speech level could require representing the top goals, the functions that implement the goals, their sub-functions, and so on down to the lowest level of activities, whch could be speec 51. Each node has a description label and possibly other attributes, like duration or resources. Each node at the lowest level (leaves o f the “tree”) can have a link to the corresponding video segment. Second, any node in the
lattice can have mulbple parents. With multiple parents, one can represent that an observed activity serves more than one function, as is often the case in the real world. The lattice automatically maintains all the multiple parents relationships, e.g., if the sub-nodes of a node are modified, all the parents using this node in the hierarchy will be updated. A pre-created outline can be provided to the observer. The observer will then just add leaves in the classes, where he th inks the segment should go. The analyst can also add new classes, at any level of the existing decomposition, if the existing taxonomy should be complemented. Common features of any outliner programs, such as collapsing and expanding, moving items, promoting, and demoting are provided. It also includes searchmg function and facilities for retrieving all the nodes ih the tree which are shared between parents. Figure 5 shows an example of lattice structure. The node “Review’s leader moderates the discussion” appears at two different places, because it has two different parents.
Review’s leader manage meeting IReview’s leader moderate discussion Participants decide pauses
Reviewers detect defects Reviewers search privately defeds in arii
URaiewers discuss found defe Reviewers announce theirfi Reviewers argue in favor of Reviewers nrpue nqninst a
... !$!. . _ _ .... . . ._.......~......._..........._._....__.~............._............. I.. .......... . ~.. ....... , .......... 1 ........ ...
Figure 5. Outline representing the functions lattice
To augment the consistency in the labeling of the nodes, a mechanism is provided for structuring the labels. A label can be declared as a set composed of a verb and its attributes like “agent,” “message”, “destination” ( e g Reviewer X Communicates Results To Reviewer Y). D t list of verbs and attributes can be created and maintained for specific domain. The list of verbs is organized as a specialization hierarchy. T h s feature offers the benefit of displaying a limited set of choices at the top level, which can be “expanded” down to more choices. The relationship between a verb and its “children” can be viewed as a way of “specializing” the meaning of the verb, e.g. “talk” could be a specialization of “communicate” [6]. When an encoder does not find a suitable verb in the existing list, he can add a new verb at the appropriate place of the hterarchy (See Figure 6).
The data structure “list” is similar to the lattice structure, except that it maintains no hie tween
2 12
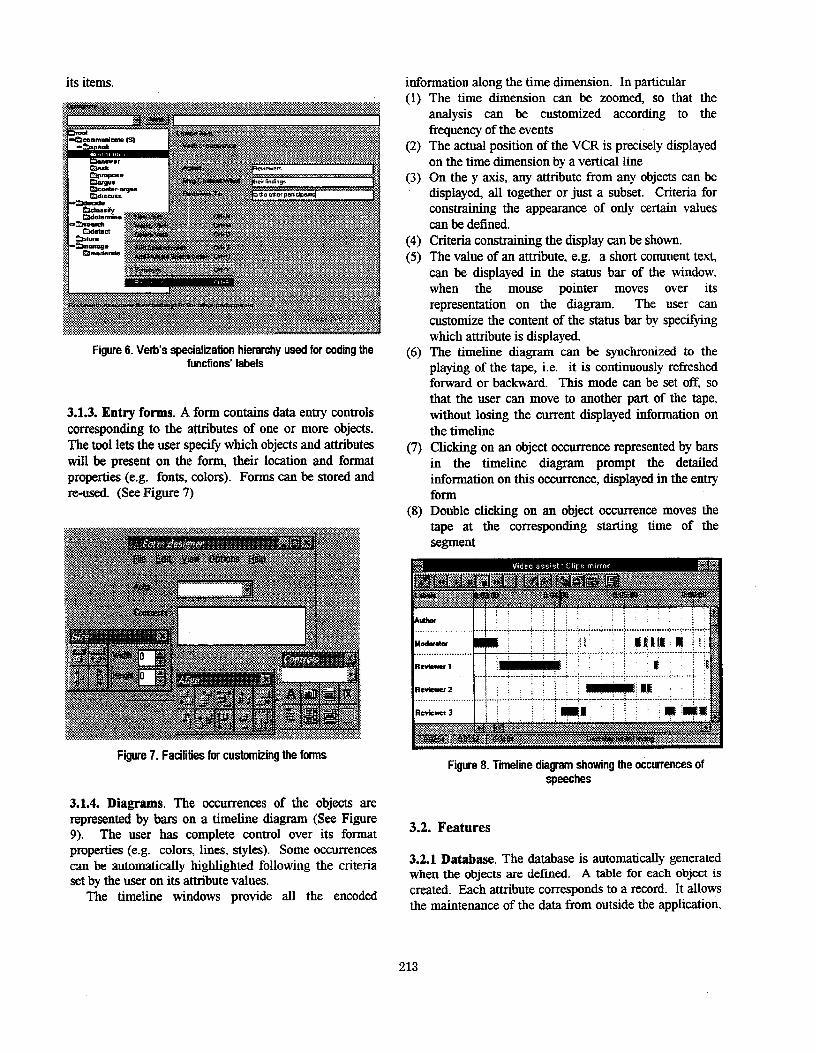
information along the time dimension. In particular its items.
Figure 6. Verb‘s specialization hierarchy used for coding the functions’ labels
3.1.3. Entry forms. A. form contains data entry controls corresponding to the attributes of one or more objects. The tool lets the user specify which objects and attributes will be present on the form, their location and format properties (e.g. fonts, colors). Forms can be stored and re-used. (See Figure 7’)
Figure 7. Facilities for customizing the forms
3.1.4. Diagrams. The occurrences of the objects are represented by bars an a timeline diagram (See Figure 9). The user has complete control over its format properties ( e g colors, lines, styles). Some occurrences can be automatically highlighted following the criteria set by the user on its attribute values.
The timeline windows provide all the encoded
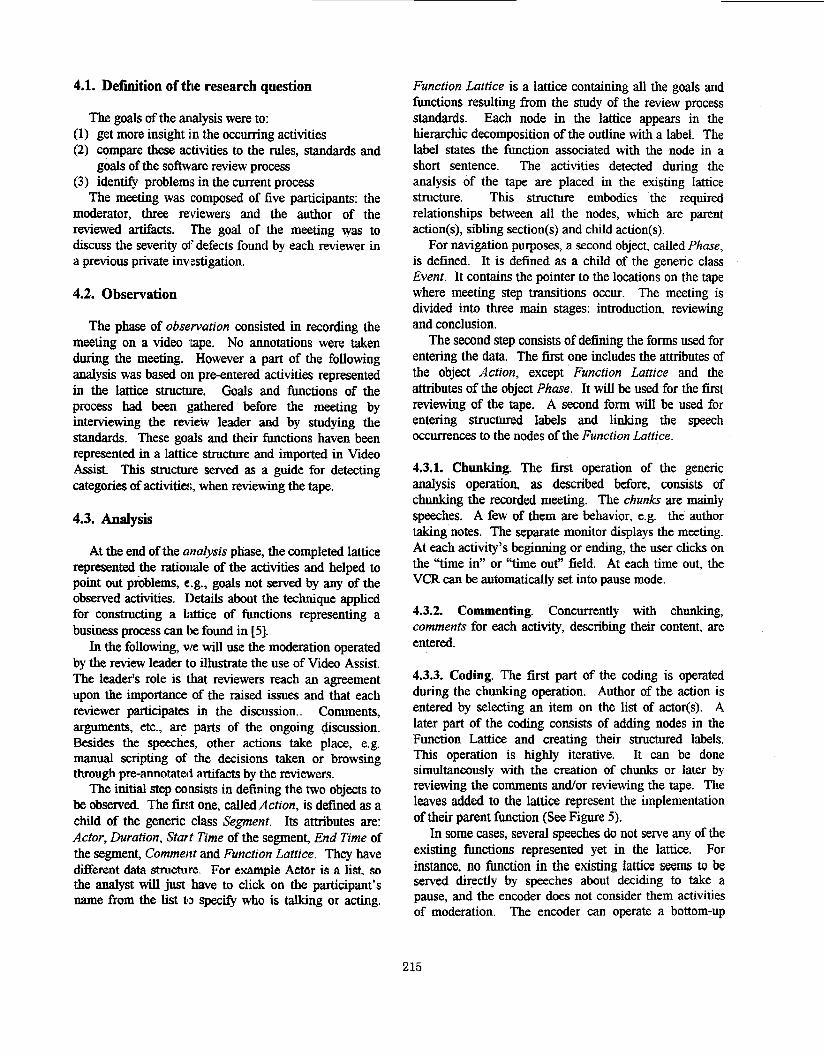
The time dimension can be zoomed, so that the analysis can be customized according to the frequency of the events The actual position of the VCR is precisely displayed on the time dimension by a vertical line On the y axis, any attribute from any objects can be displayed, all together or just a subset. Criteria for constraining the appearance of only certain values can be defined. Criteria constraining the display can be shown. The value of an attribute, e.g. a short comment text, can be displayed in the status bar of the window. when the mouse pointer moves over its representation on the diagram. The user can customize the content of the status bar by speclfylng which attribute is displayed. The timeline diagram can be synchronized to the playing of the tape, i.e. it is continuously refreshed forward or backward. This mode can be set off, so that the user can move to another part of the tape, without losing the current displayed information on the timeline Clicking on an object occurrence represented by bars in the timeline diagram prompt the detailed information on this occurrence, displayed in the entry form Double clicking on an object occurrence moves the tape at the corresponding starting time of the segment
. . .
. . I . .
Figure 8. Tmeline diagram showing the occurrences of speeches
3.2. Features
3.2.1 Database. The database is automatically generated when the objects are defined. A table for each object is created. Each attribute corresponds to a record. It allows the maintenance of the data from outside the application,
2 13
by using all the facilities offered in classic DBMS, like replacing values or searching records by using SQL queries. The conversing operation defined in Section 2 can require to replace codes by other codes. Files can be generated in the Dbase format, a widespread standard of importation in most of the existing spread-sheet or statistic software.
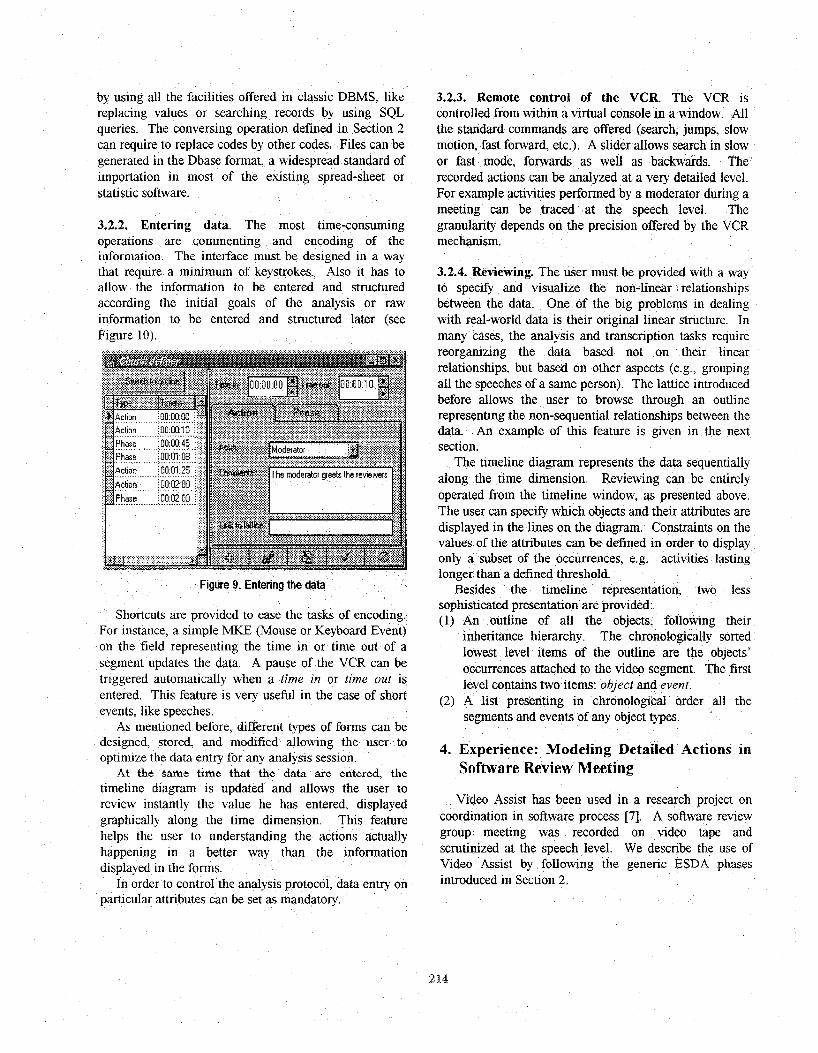
3.2.2. Entering data. The most time-consuming operations are commenting and encoding of the information The interface must be designed in a way that require a minimum of keystrokes. Also it has to allow the informatlon to be entered and structured according the initial goals of the analysis or raw information to be entered and structured later (see Figure 10).
segment updates the data. A pause of the VCR can be triggered automatically when a time in or time out is entered. This feature is very useful in the case of short events, like speeches.
A5 mentioned before, different types of designed, stored, modified allowing optimize the data e
timeline diagram is updated and allows the user to review instantly the value he has entered, displayed graphically dong the time dimension. This feature helps the user to understanding the act happening in a better way than the displayed in the forms.
particular attributes can be set as mandatory.
for any analysis session. At the Same time that the data are eatered, the
In order to control the analysis protocol, data entry on
3.2.3. Remote control of the VCR. The VCR is controlled from within a virtual console in a window. All the standard commands are offered (search, jumps, slow motion, fast forward, etc.). A slider allows search in slow or fast mode, forwards as well as backwards. The recorded actions can be analyzed at a very detailed level. For example activities performed by a moderator during a meeting can be traced at the speech level. The granularity depends on the precision offered by the VCR mechanism.
3.2.4. Reviewing. The user must be provided with a way to spec@ and visualize the non-linear between the data. One of the big problcms in dealing with real-world data is their original linear structure. In many cases, the analysis and transcription tasks require reorganizing the data based not on their linear relationships, but based on other aspects (e.g., grouping all the speeches of a same person). The lattlce introduced before allows the user to browse through an outline representing the non-sequential relationships between the data. An example of this feature is given in the next section.
The timeline diagram represents the data sequentially along the time dimension. Reviewing can be entirely operated from the timeline window, as presented above. The user can speclfy which objects and their attributes are displayed in the lines on the diagram. Constraints on the values of the attributes can be defined in order to display
subset of the occurrences, e.g. activities lasting than a defined threshold.
Besides the timeline representation, two less sophisticated presentation are provided: (1) An outline of all the objects,
ems of the outline inheritance hierarchy. The chron
ttached to the video segment. The first two items: object and event. ting in chronological order all the
ents and events of any object types
4. Experience: Modeling Detailed Actions in Software Review Meeting
Video Assist has been used in a research project on coordination in software process 171. A software review group meeting was recorded on video tape and scrutinized at the speech level. We describe the use of Video Assist by following the genenc ESDA phases introduced in Section 2.
2 14
4.1. Definition of the research question
The goals of the anialysis were to: (1) get more insight in the occurring activities (2) compare these activities to the rules, standards and
goals of the software review process (3) identify problem; in the current process
The meeting was composed of five participants: the moderator, three reviewers and the author of the reviewed artifacts. The goal of the meeting was to discuss the severity 01’ defects found by each reviewer in a previous private invlstigation.
4.2. Observation
The phase of observation consisted in recording the meeting on a video tape. No annotations were taken during the meeting. However a part of the following analysis was based 011 pre-entered activities represented in the lattice structure. Goals and functions of the process had been gathered before the meeting by interviewing the review leader and by studying the standards. These goids and their functions haven been represented in a lattice structure and imported in Video Assist. This structure served as a guide for detecting categories of activities, when reviewing the tape.
4.3. Analysis
At the end of the analysis phase, the completed lattice represented the rationale of the activities and helped to point out prbblems, e.g., goals not served by any of the observed activities. Iletails about the technique applied for constructing a lattice of functions representing a business process can be found in [5].
In the following, we will use the moderation operated by the review leader to illustrate the use of Video Assist. The leader’s role is that reviewers reach an agreement upon the importance of the raised issues and that each reviewer participates in the discussion.. Comments, arguments, etc., are parts of the ongoing discussion. Besides the speeches, other actions take place, e.g. manual scripting of the decisions taken or browsing through pre-annotated attifacts by the reviewers.
The initial step consists in defining the two objects to be observed. The first one, called Action, is defined as a child of the generic class Segment. Its attributes are: Actor, Duration, Start Time of the segment, End Time of the segment, Comment and Function Lattice. They have different data structure. For example Actor is a list so the analyst will just have to click on the participant’s name from the list 00 specify who is talking or acting.
Function Lattice is a lattice containing all the goals and functions resulting from the study of the review process standards. Each node in the lattice appears in the hierarchic decomposition of the outline with a label. The label states the function associated with the node in a short sentence. The activities detected during the analysis of the tape are placed in the existing lattice structure. This structure embodies the required relationships between all the nodes, which are parent action@), sibling section@) and child action@).
For navigation purposes, a second object, called Phase, is defined. It is defined as a child of the generic class Event. It contains the pointer to the locations on the tape where meeting step transitions occur. The meeting is divided into three main stages: introduction, reviewing and conclusion.
The second step consists of defining the forms used for entering the data. The first one includes the attributes of the object Action, except Function Lattice and the attributes of the object Phase. It will be used for the first reviewing of the tape. A second form will be used for entering structured labels and linking the speech occurrences to the nodes of the Function Lattice.
4.3.1. Chunking. The first operation of the generic analysis operation, as described before, consists of chunking the recorded meeting. The chunks are mainly speeches. A few of them are behavior, e.g. the author taking notes. The separate monitor displays the meeting. At each activity’s beginning or ending, the user clicks on the “time in” or “time out” field. At each time out, the VCR can be automatically set into pause mode.
4.3.2. Commenting. Concurrently with chunking, comments for each activity, describing their content, are entered.
4.3.3. Coding. The first part of the coding is operated during the chunking operation. Author of the action is entered by selecting an item on the list of actor@). A later part of the coding consists of adding nodes in the Function Lattice and creating their structured labels. This operation is highly iterative. It can be done simultaneously with the creation of chunks or later by reviewing the comments and/or reviewing the tape. The leaves added to the lattice represent the implementation of their parent function (See Figure 5).
In some cases, several speeches do not serve any of the existing functions represented yet in the lattice. For instance, no function in the existing lattice seems to be served directly by speeches about deciding to take a pause, and the encoder does not consider them activities of moderation. The encoder can operate a bottom-up
215
refinement of the existing functions by creating a new parent, “manage meeting”, adds its sub-function “decide to take a pause” and links the corresponding segments containing the speeches about taking a pause. The encoder uses the provided mechanism for labeling the nodes. Figure 6 shows a part of the specialization hierarchy of verbs used for describing the software review meeting speeches. Let’s assume that the closest verb to descnbe the observed speeches is “communicate” in current verb’s hierarchy. “Communicate” has no specialization yet. The encoder creates “speak” as a specialization of “communicate”. “Speak” inherits automabcally the attributes of “communicate”, i.e. Agent, What and Receiver. Later the encoder creates “argue”, “ask, “declare”, “announce” etc. as specialization of the verb “speak”. The explicit storing of the used vocabulary helps the user to code more consistently.
4.3.4. Connecting. The construction and refinement of the function lattice, is a way of specxfylng non-linear connections between the segments, i.e. connections between non-adjacent actions defined through their sibling relationships featured in the function lattice. For instance all the speeches that are occurrences of “Moderator Asks Reviewers” are listed in the lattice under this node, which is placed as a sub-function of “Review’s leader Moderates the discussion”.
4.3.5. Comparing. The comparing of sequential pattern of achvities is not required in the current analysis Occurring actimhes are only compared to the pre-built function lattice contaming the functions of the review process. Compmng is facilitated by the use of a common vocabulary (see above the verb’s specialization hierarchy) while creaung the labels describing the pre- entered functions and the observed activities.
4.3.6. Constraining. To detect moments in the meeting where the activities of moderation were more intensive, constraints about the values of the attributes to be displayed are set in the timeline diagram. For example, only occurrences of the speeches corresponding to the sub-function “review leader moderates the discussion” are represented on one line. Three other lines display the occurrences of the speeches of each reviewer. The analyst visualizes the moments at which extra time was spent on moderation. In the analyzed meeting, the moderator played also the role of reviewer. Some of his activities were intended to moderate the discussion, while others were about his opinion concerning the
focusing the analysis on one class of his a defects. Constraining the display of certai ows
Mcdentor I I 1071 7331 6651 1641 353% Wbl
Modmmgoriy 64 !4M
AsbqaSrmv,eher 43 1269 1626 113006 541 4991 1174 15161 19ph R w m r 1
ReviMrZ 5 0 3511 7861 117; $889:
Ml! 1033’ 721 164% R w ( c ~ r 3 331
TOTAL 248
‘7 25 i224%
20741 8 . i ia7i lwDag
% 01 lohlmrrbng SUBFWCTIWS Dmbon
Ckrtfyfmdm@ 525; 25 4%
, Manage mccrmg 22 4%
10841 523% I
Omen
TOTAL 2074: 1M0%
At any time during the analysis, any occurrence of objects can be played by the VCR just by clicking on its representation in the lattice or in the timeline diagram (See Figure 8).
4.3.7. Conversing. No conversing operations on the encoded data are required at th~s point.
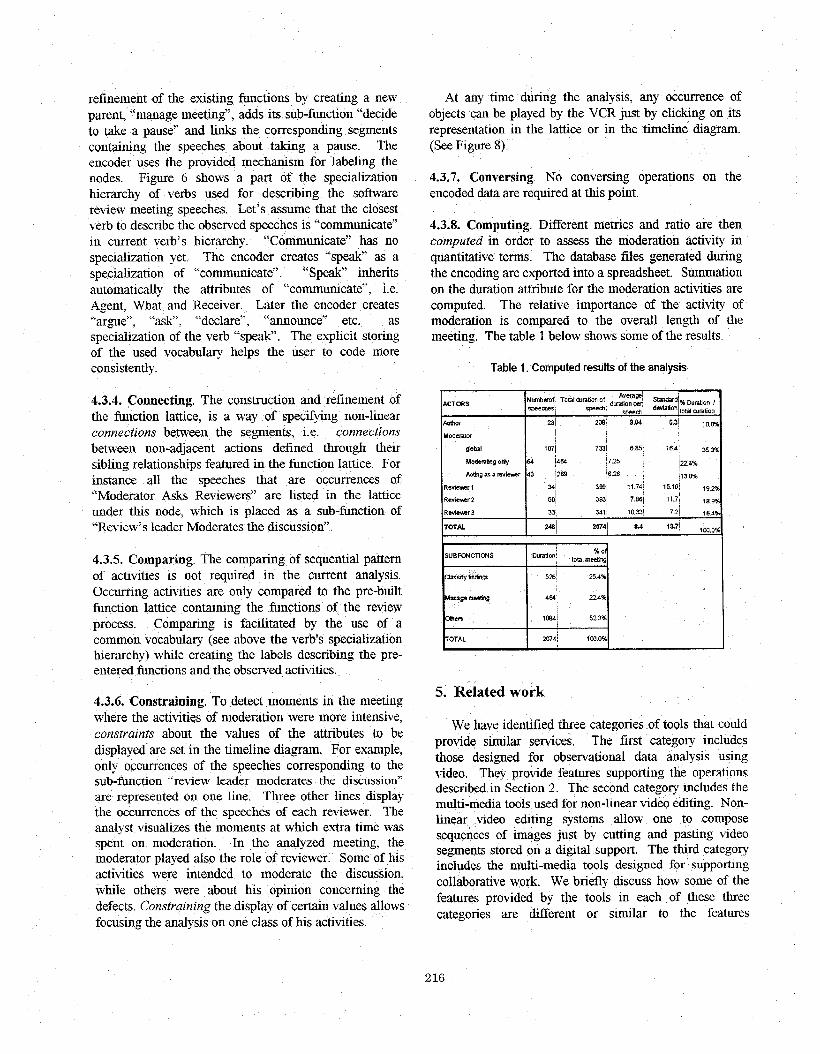
4.3.8. Computing. Different metrics and ratio are then computed in order to assess the moderation activity in quantitative terms. The database files generated during the encoding are exported into a spreadsheet. Summation on the duration attribute for the moderation activities are computed. The relative importance of the activity of moderation is compared to the overall length of the meeting. The table 1 below shows some of the results.
Table 1 . Computed results of the analysis
5. Related work
We have identified three categories of tools that could provide similar services. The first categoq includes those designed for observational data analysis using video. They provide features supporting the operahons described in Sechon 2. The second category includes the multi-media tools used for non-linear video editing. Non-
de0 edting systems allow one to compose of images just by cutting and pasting video
segments stored on a digital support. The third category includes the multi-media tools designed for suppohng collaborative work. We briefly discuss how some of the features provided by the tools in each of these three categories are different or similar to the features
2 16
implemented in Video Assist. MacSHAPA is an example tool in the first category.
MacSHAPA is designed specifically to support the operations of ESDA. 'However, it does not provide non- linear representation of video segments or of encoded data required in the "connecting" analysis operation. The lattice structure i n Video Assist allows connecting discontinued video segments and encoded data by placing them as children of the same parent node. Moreover, the lattice structure enables the creation of multiple parents for a given node, providing maximum flexibility to the analyljt. For example, an existing node can be declared as a child of other parents later in the analysis, without requiring definition of new chunks or new coded data.
The tools in the second category, such as Adobe Premier [SI, for non-linear video editing, provide features for placing flags, defining segments, and classifying segments. Annotations can be entered by using the data field "comment", which is usually provided for describing the edited video segment. But they lack several features provided in Video Assist, important in the analysis operations such as defining attributes, customizing data entry and displaying attributes' values along the time dimension.
The third category of tools used for collaborative tasks offer interesting services for recording and structuring infonnatialn based on video reviewing or on direct observation of real events. For example, Synthesis is a computer-controlled multi-media tool to enhance group communication during the early stages of collaborative work [O] . During a meeting, a script creates an outline. ' n e tool automatically links each entry of the outline to the current video segment. Later the partxipants can access directly the video segments through the outline and possibly refine the outline. However, again not found in these tools are some of the features required for the analysis operation that Video Assist provides. For example, timeline representation or any provision for defining attributes and customizing data entry forms seems to be missing in these tools.
6. Conclusion
Analyzing real-world events directly in their raw form is a necessary step if the complexity of the events must be preserved, e.g. for detailed analysis of group meetings at the speech level. The analysis process requires operations like chunking, commenting, encoding, and connecting data. Video Assist provides support for these operations by allowing the user to define the analyzed objects and their attributes, as well
as to customize the data entry forms and the diagrams. To illustrate the benefits of using Video Assist, it helps
to describe the analysis of another review meeting that we manually performed prior to the development of Video Assist. The time in, time out, comments and codes were entered into the cells of a spreadsheet program. One person was controlling the VCR and was dictating the time code to another person who was entering the data in the spreadsheet. The lattice was built later separately. This manual process was highly time-consuming. The ratio between analysis time and duration of the meeting was fifteen in the manual experience. The use of Video Assist lowered this ratio to five.
In addition to the advantages offered by storing automatically the time in and time out values, we noticed other significant benefits of using Video Assist. First, the iterations between the analysis steps were much easier to perform. During the manual process, the enormous effort required discouraged any iteration attempt. With Video Assist, the analysis could be completed easily by one single person, because the core functions - VCR remote control, analysis operations and graphical representation - are integrated by sharing dynamically all the data. Second, the lattice structure supported the progressive refinement of the analysis by the creation of new "classes" of observed activities on the fly without having to redefine new segments or change existing links. In particular, it helped us identify classes of not always adjacent activities, e.g. speeches for meeting management purpose that are not adjacent over the time. Moreover, it allowed the analyst to differentiate later the speeches about pure meeting management (e.g. deciding to take a pause) from the speeches of moderation (e.g. moderator asking reviewer's opinion).
The lattice also helped us represent and compare the activities as well as the rules, standards and goals of the software review process, define and compute appropriate quantitative measurements, and identify existing problems.
We will continue to use Video Assist for analyzing organizational processes in our fimre research. Contrasting existing model, based on data collected by interviews or by analyzing standards, with observed activities systematically coded with Video Assist. will reveal systematically problems that could not be detected otherwise. Video Assist will be used also for non- academic purposes. For instance, we will be using the tool to examine, during deaf language teaching, the skill level of the participants by decomposing, classifying, and comparing their gestures.
We plan to extend our tool in three directions. First the use of random-access video disk technology will dramatically accelerate the manipulation of the video
217
segments. The development envir ent we have used, like Delphi, offers enough m dia services for facilitating the integration of this feature in our tool. Second, the interface for encoding would gain in speed if one could enter the data by voice command. Again, the development environment should provide useful services for a voice-based interface between the system and the
Third, we plan to add to the objects, attributes e values could be multi-media objects, e.g. scanned
document, voice file, web page, in order to link together not only video segments and encoded data, but also heterogeneous objects used or referred to during the observed actions.
Notes Acknowledgements
The authors would like to thanks all the reviewers of the paper as well as Stephane Mastrogiacomo for his valuable engagement in the development of the first version of Video Assist. Most of the tool’s components of the current version have been designed and coded by Jean-Luc Nicoulin and partially by Claude Stricker. The idea of representing activities in a lattice structure is based on a current research conducted by Jintae Lee and Claude Stricker.
Support T k s work would not have been possible without the
funding of the School of Business HE Lausanne, the Swiss National Fund for Scientific Research (Grant no 1214-039627.93), Bank of Vaud, Centre Infomatique de 1’Etat de Vaud, Credit Suisse, Unicible, and by the support of the Department of Decision Sciences at the University of Hawaii (USA) and Elca Informatique (Lausanne, Switzerland).
References
[ 11 Olson, J.S., Olson, G.M., Storrosten, M., and Carter, M., “Small Group Design Meetings. An Analysis of Collaboration”. Untversity of Mshigan, Cogmtive Science and Machine Intelligence Laboratory, Technical Report No. 43. July, 1992
[2] Sanderson, P M., J. J. P Scott, T. Johnston, J Mamzer, L M. Watanabe, & J. and the enterprise of Exploratory (ESDA)”. Intematzonal Joumal 41, 1994, pp 633-68.
[3] Sanderson, P M., & Fisher, C. “ Explo Data Analysis: Foundations”, Human-Computer Interaction, 9, 1994, pp 251-317.
[4] Borland 1996 “Delphi Developer vers 2” for Microsoft Windows 95
[5] Lee, J. “Goal-based Process Analysis“, Proc. ACM Conference on Organizational computing, Milpitas, CA, November 1993.
[6] Miller, G. A. ed. “WordNet: An &-Line Lexical Database“ Intemational Joumal of Lexicography, Volume 3, Number 4,1990
[7] Munari S., Stricker, C. 1993 “Modelling Coordinabon Processes in Software Projects” Technical Report TR-93-9-1. University of Lausanne, Business School HEC, Inforge, (in fiench)
[SI Adobe 1995 “Adobe Premiere vers. 4 0” for Microsoft Windows 95
[9] Potts, C., Bolter, J D , Badre, A “Collaborative Pre-Writing With a Video-Based Group Working Memory” Graphcs, Visualizahon, and Usability Center (Georgia Institute of Technology, USA) Technical Report 93- 95.:l/ftp.gvu gatech.edulpublgvultech-reportsl93-35.ps.Z., 1993
2 18
Related Documents


