Are we there Yet? Self-Managing Wireless Networks Victor Bahl Microsoft Corporation February 2007

Victor Bahl Microsoft Corporation February 2007. Source: Victoria Poncini, MS IT 2 ~7,000 Access Points ~65,000 XP & Vista Clients ~40,000 connections/day.
Dec 21, 2015
Welcome message from author
This document is posted to help you gain knowledge. Please leave a comment to let me know what you think about it! Share it to your friends and learn new things together.
Transcript
Are we there Yet?Self-Managing Wireless Networks
Victor BahlMicrosoft Corporation
February 2007
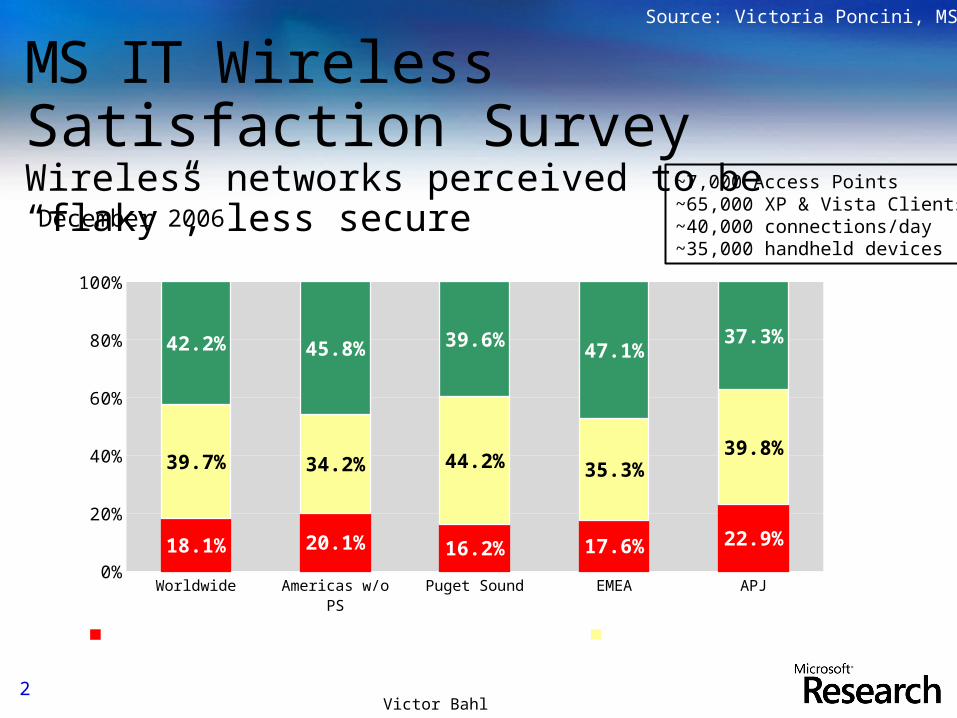
MS IT Wireless Satisfaction SurveyWireless networks perceived to be “flaky”, less secure
Worldwide Americas w/o PS Puget Sound EMEA APJ0%
20%
40%
60%
80%
100%
18.1% 20.1% 16.2% 17.6% 22.9%
39.7% 34.2% 44.2% 35.3%39.8%
42.2% 45.8% 39.6% 47.1%37.3%
Somewhat Dissatisfied or Very Dissatified Somewhat Satisfied Very Satisfied
Source: Victoria Poncini, MS IT
2
~7,000 Access Points~65,000 XP & Vista Clients~40,000 connections/day~35,000 handheld devices
December 2006
Victor Bahl
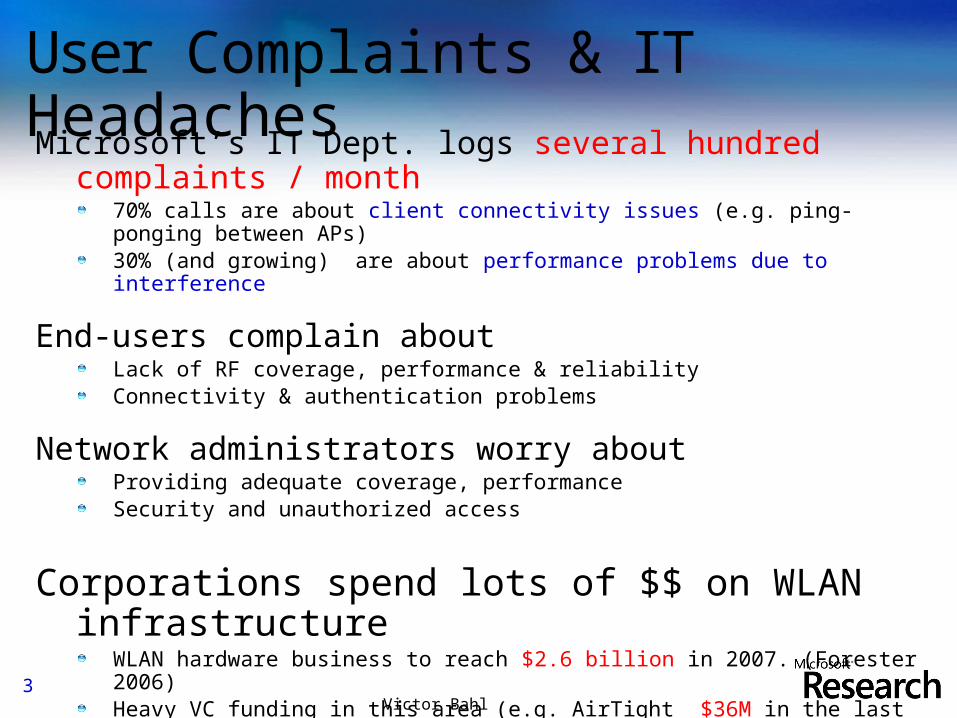
User Complaints & IT HeadachesMicrosoft’s IT Dept. logs several hundred complaints /
month70% calls are about client connectivity issues (e.g. ping-ponging between APs)30% (and growing) are about performance problems due to interference
End-users complain aboutLack of RF coverage, performance & reliabilityConnectivity & authentication problems
Network administrators worry aboutProviding adequate coverage, performanceSecurity and unauthorized access
Corporations spend lots of $$ on WLAN infrastructure
WLAN hardware business to reach $2.6 billion in 2007. (Forester 2006)Heavy VC funding in this area (e.g. AirTight $36M in the last 16 months)
Victor Bahl3
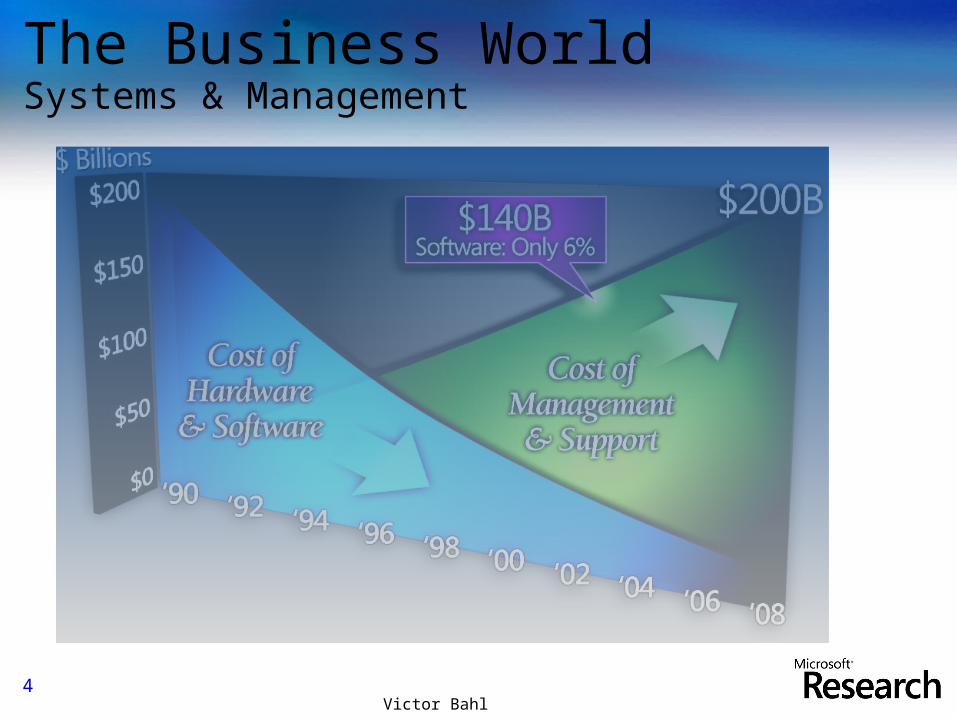
The Business World Systems & Management
4Victor Bahl
Applications 60%
App Development (29%)
App Support (31%)
Infrastructure 40%
Network (14%)
Data Center (7%)
Employee Services (5%)
Voice (5%)
Helpdesk (5%)
Security (3%)
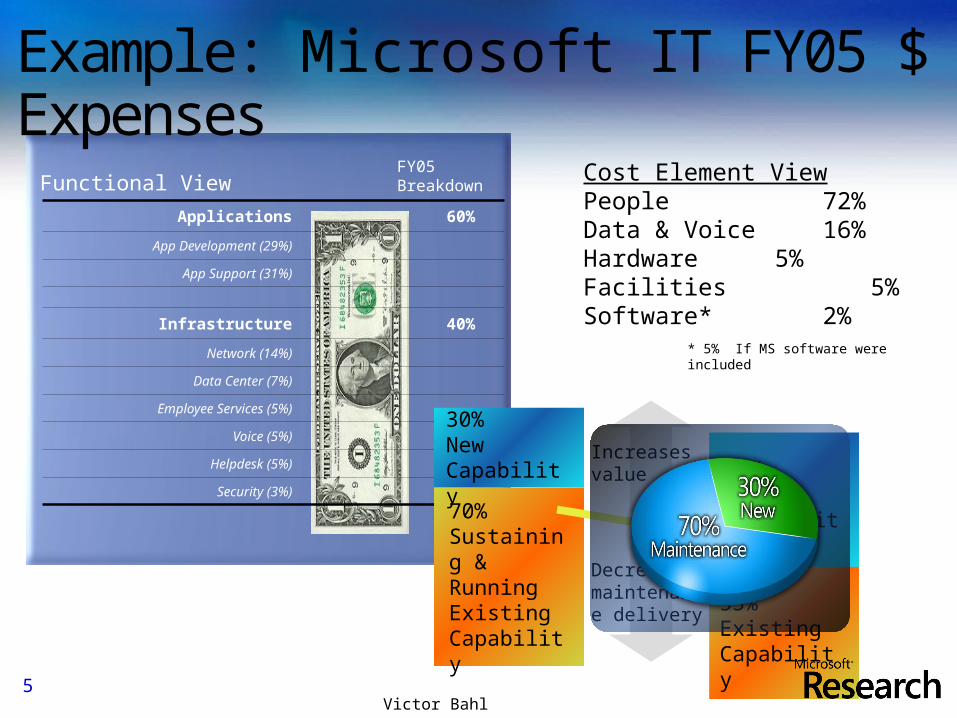
Example: Microsoft IT FY05 $ Expenses
Functional ViewFY05Breakdown
Cost Element ViewPeople 72%Data & Voice 16%Hardware 5%Facilities 5%Software* 2%
30%New Capability
70%Sustaining & RunningExistingCapability
45%New Capability
55%Existing Capability
Increases value
Decreases maintenance delivery
* 5% If MS software were included
5Victor Bahl
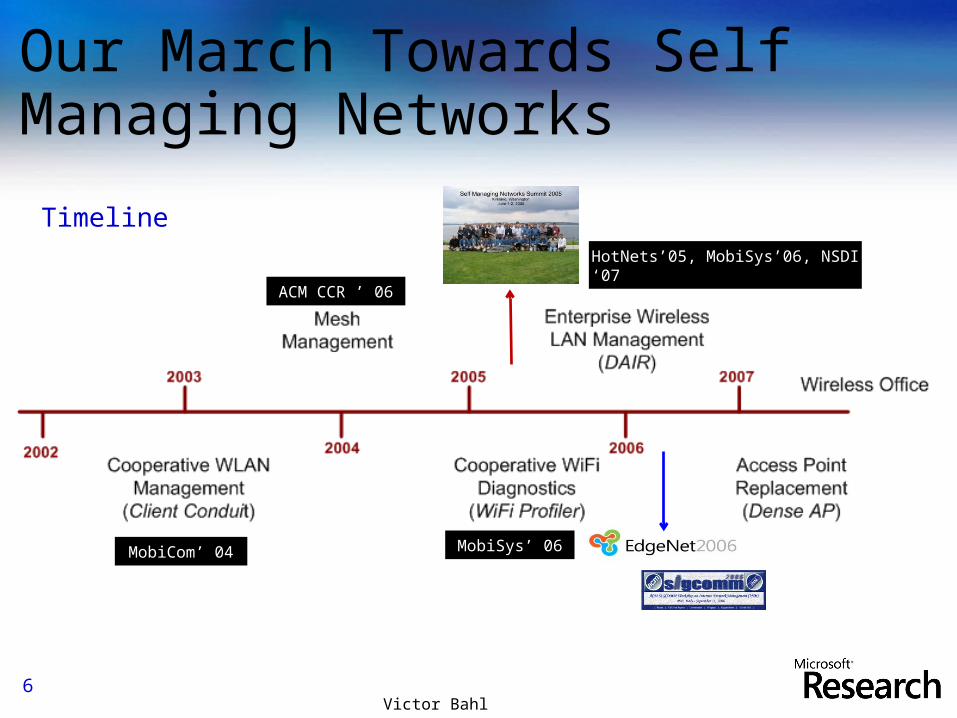
Our March Towards Self Managing Networks
Timeline
6
MobiCom’ 04
ACM CCR ’ 06
MobiSys’ 06
HotNets’05, MobiSys’06, NSDI ‘07
Victor Bahl
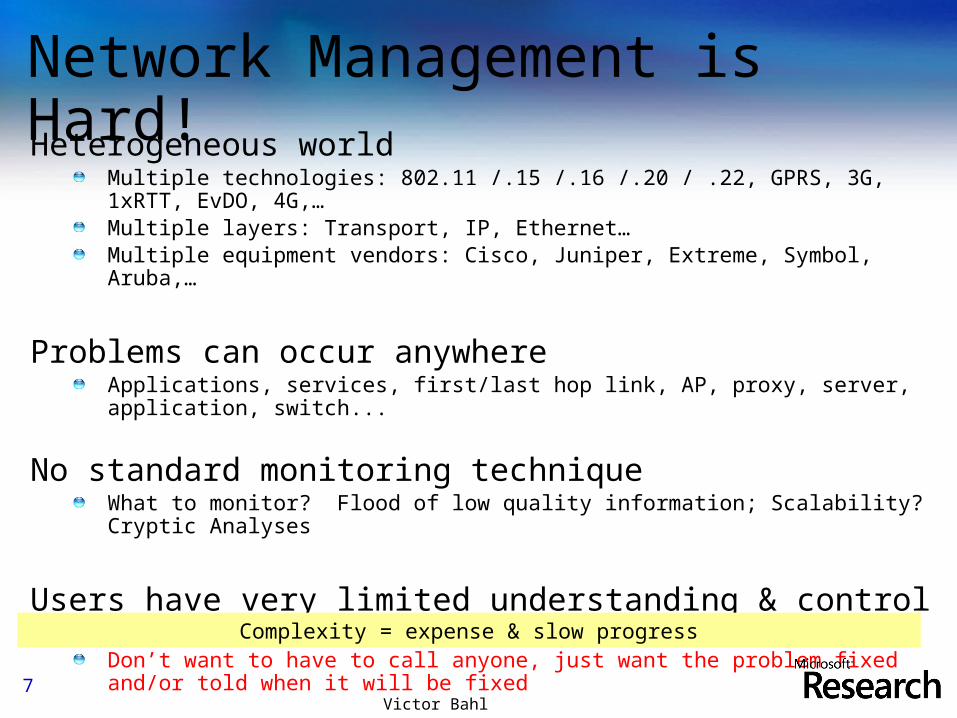
Network Management is Hard!Heterogeneous world
Multiple technologies: 802.11 /.15 /.16 /.20 / .22, GPRS, 3G, 1xRTT, EvDO, 4G,…Multiple layers: Transport, IP, Ethernet…Multiple equipment vendors: Cisco, Juniper, Extreme, Symbol, Aruba,…
Problems can occur anywhereApplications, services, first/last hop link, AP, proxy, server, application, switch...
No standard monitoring technique What to monitor? Flood of low quality information; Scalability? Cryptic Analyses
Users have very limited understanding & controlIncreased support calls are NOT the answerDon’t want to have to call anyone, just want the problem fixed and/or told when it will be fixed
Complexity = expense & slow progress
7Victor Bahl
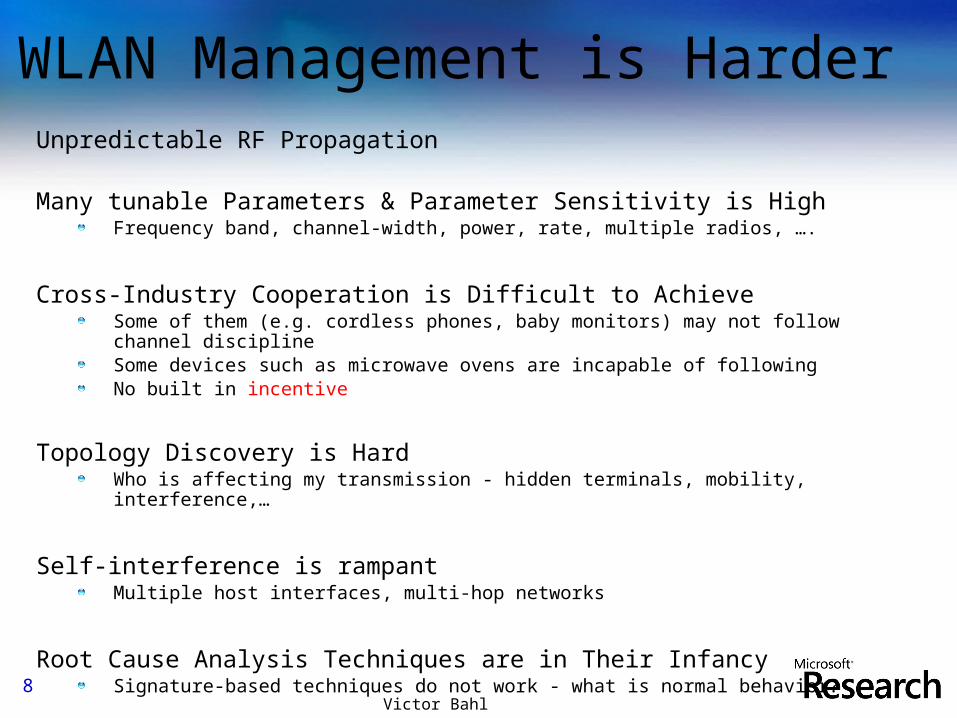
WLAN Management is HarderUnpredictable RF Propagation
Many tunable Parameters & Parameter Sensitivity is HighFrequency band, channel-width, power, rate, multiple radios, ….
Cross-Industry Cooperation is Difficult to AchieveSome of them (e.g. cordless phones, baby monitors) may not follow channel disciplineSome devices such as microwave ovens are incapable of following No built in incentive
Topology Discovery is Hard Who is affecting my transmission - hidden terminals, mobility, interference,…
Self-interference is rampantMultiple host interfaces, multi-hop networks
Root Cause Analysis Techniques are in Their InfancySignature-based techniques do not work - what is normal behavior?
No Standard Metrics for Noise, Power Level etc8
Victor Bahl
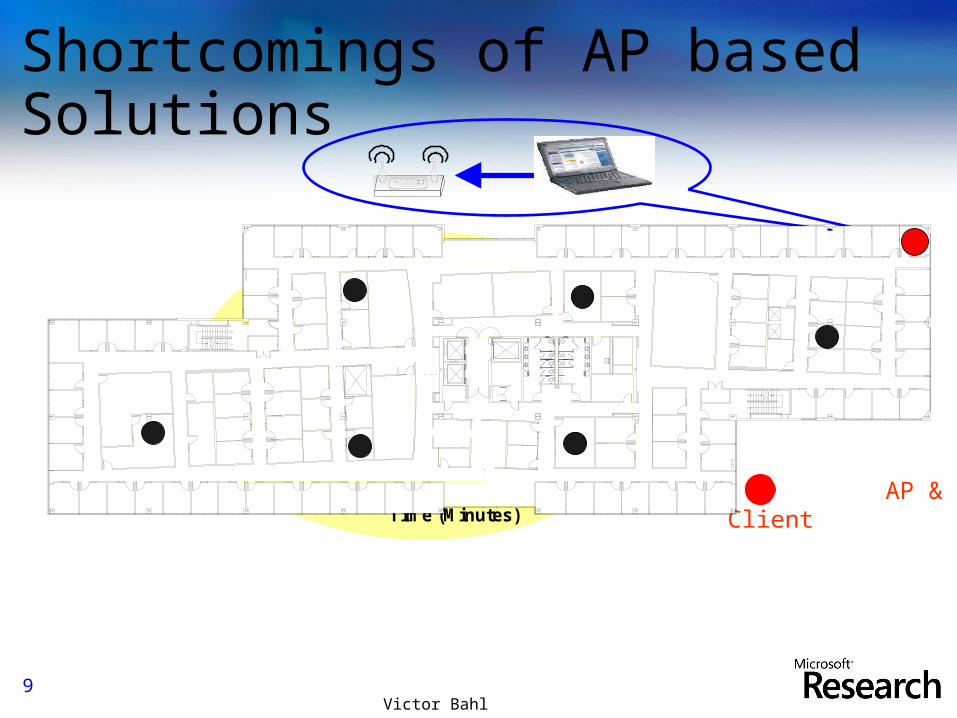
Shortcomings of AP based Solutions
UP
DN
DN
UP
EL 32
0
20
40
60
80
100
0 100 200 300Time (Minutes)
% R
ec
eiv
ed
AP & Client
MonitorsX XX
X
X
9Victor Bahl
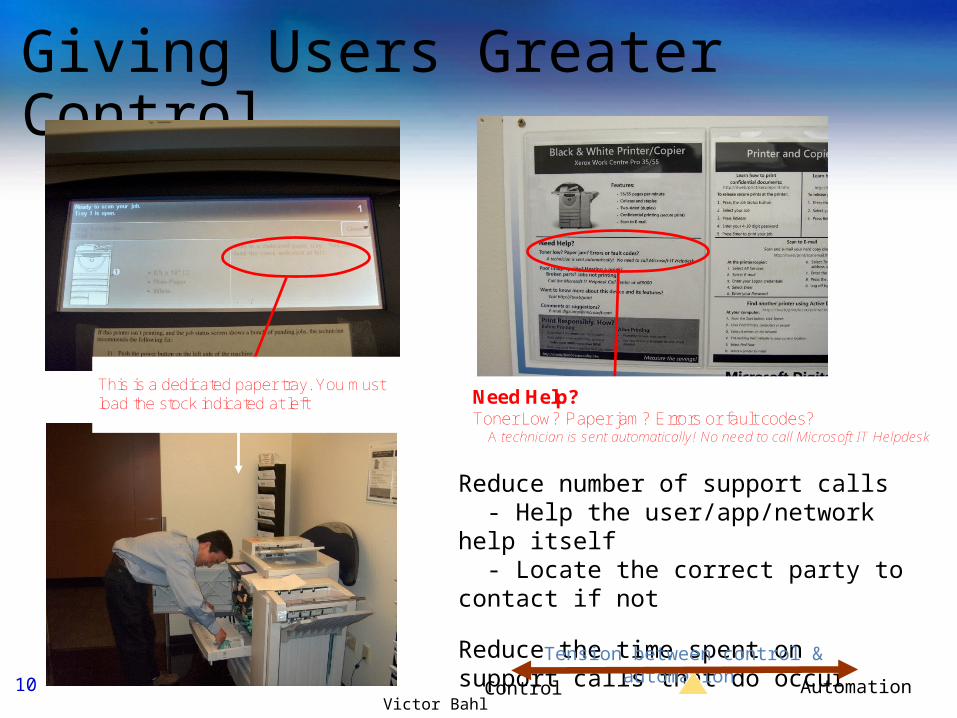
Giving Users Greater Control
This is a dedicated paper tray. You must load the stock indicated at left Need Help?
Toner Low? Paper jam? Errors or fault codes? A technician is sent automatically! No need to call Microsoft IT Helpdesk
Reduce number of support calls - Help the user/app/network help itself - Locate the correct party to contact if not
Reduce the time spent on support calls that do occur
Tension between control & automation
Control Automation10Victor Bahl
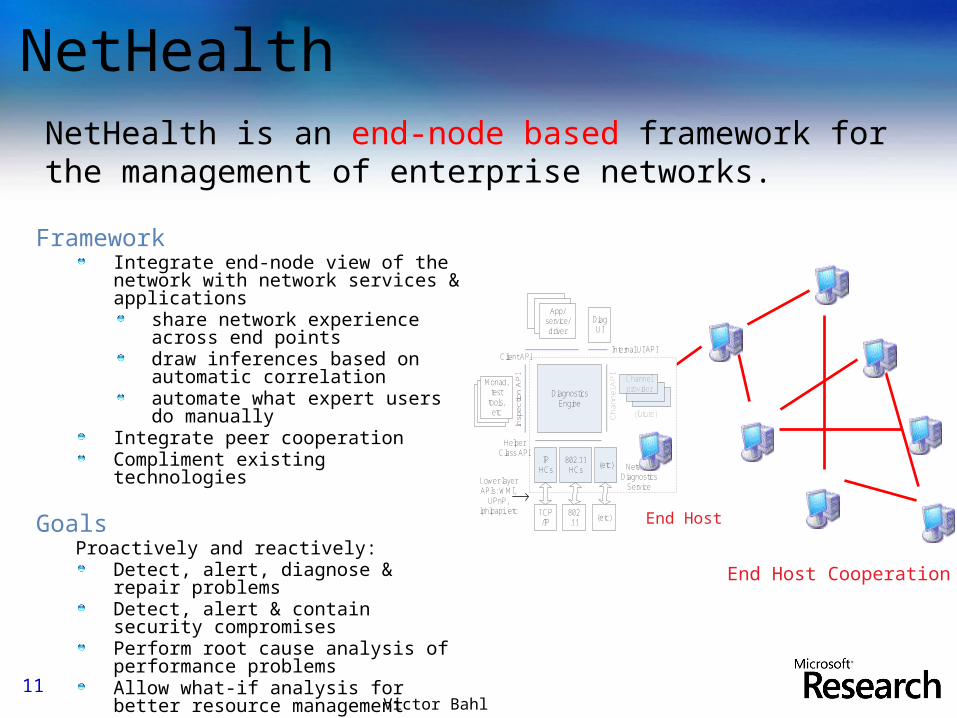
FrameworkIntegrate end-node view of the network with network services & applications
share network experience across end pointsdraw inferences based on automatic correlationautomate what expert users do manually
Integrate peer cooperationCompliment existing technologies
GoalsProactively and reactively:
Detect, alert, diagnose & repair problemsDetect, alert & contain security compromisesPerform root cause analysis of performance problemsAllow what-if analysis for better resource management
NetHealth is an end-node based framework for the management of enterprise networks.
End Host
Diagnostics Engine
IPHCs
802.11HCs
(etc)
Client API
Helper Class API
Insp
ection
AP
I
Ch
an
ne
l A
PI
DiagUI
Internal UI API
Monad,test
tools, etc
NetworkDiagnostics
Service
TCP/IP
802.11
(etc)
App/service/driver
Channel provider
(future)
Lower-layer APIs: WMI,
UPnP, Iphlpapi, etc
End Host Cooperation
NetHealth
11Victor Bahl
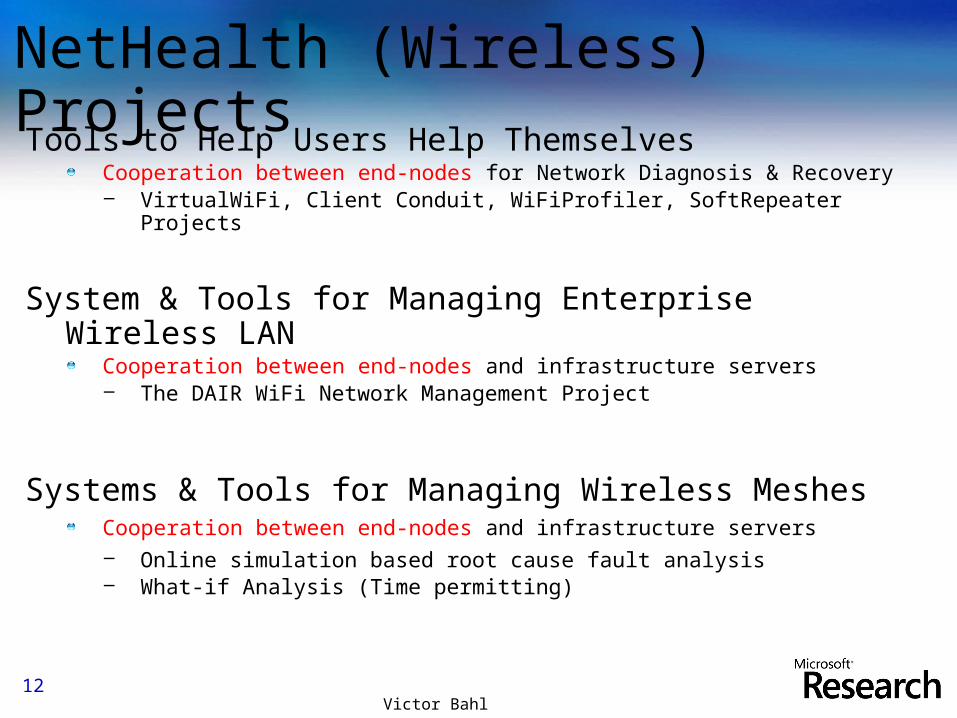
NetHealth (Wireless) ProjectsTools to Help Users Help Themselves
Cooperation between end-nodes for Network Diagnosis & Recovery– VirtualWiFi, Client Conduit, WiFiProfiler, SoftRepeater Projects
System & Tools for Managing Enterprise Wireless LANCooperation between end-nodes and infrastructure servers– The DAIR WiFi Network Management Project
Systems & Tools for Managing Wireless MeshesCooperation between end-nodes and infrastructure servers– Online simulation based root cause fault analysis– What-if Analysis (Time permitting)
12Victor Bahl
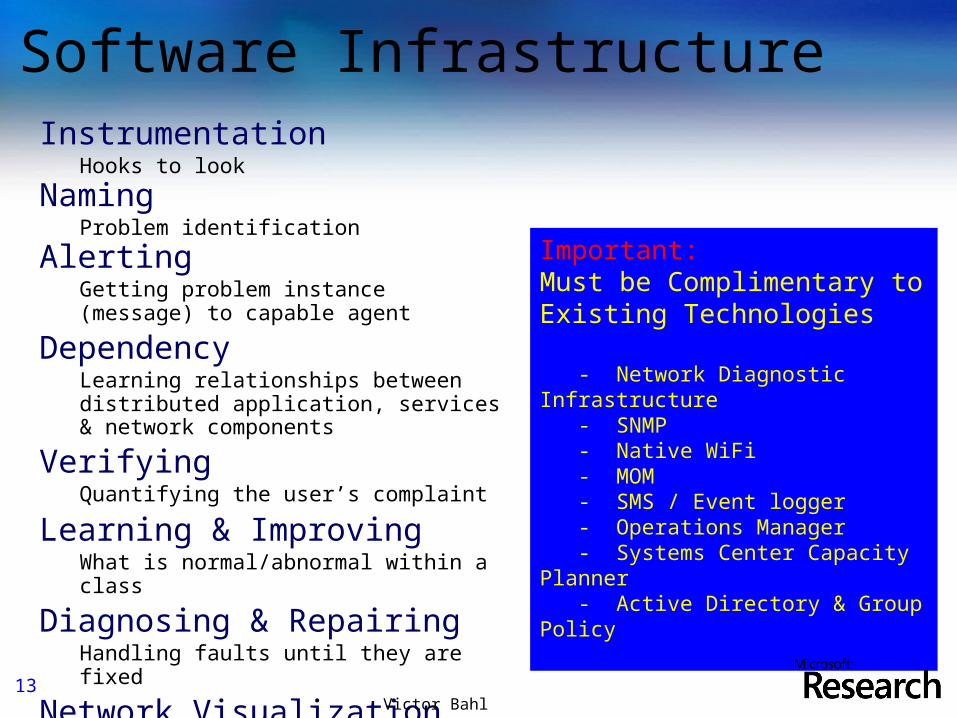
Software InfrastructureInstrumentation
Hooks to look
NamingProblem identification
AlertingGetting problem instance (message) to capable agent
DependencyLearning relationships between distributed application, services & network components
VerifyingQuantifying the user’s complaint
Learning & ImprovingWhat is normal/abnormal within a class
Diagnosing & RepairingHandling faults until they are fixed
Network Visualization
Important: Must be Complimentary to Existing Technologies
- Network Diagnostic Infrastructure - SNMP - Native WiFi - MOM - SMS / Event logger - Operations Manager - Systems Center Capacity Planner - Active Directory & Group Policy
13Victor Bahl
Tools to Help Users Help Themselves
Cooperative Peer–to-Peer Network Diagnosis & Recovery
Automate network fault diagnosis and recovery
Reduce user frustration and admin load
Use peer cooperation to improve network health
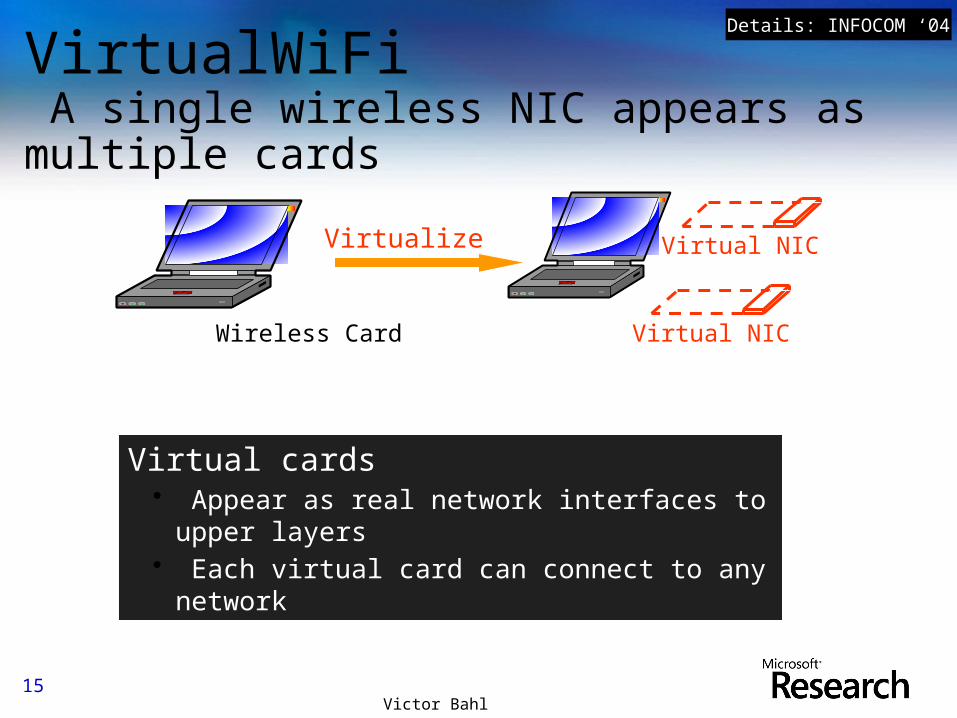
Virtual NIC
Wireless Card Virtual NIC
Virtualize
Virtual cards• Appear as real network interfaces to upper
layers• Each virtual card can connect to any
network
VirtualWiFi A single wireless NIC appears as multiple cards
Details: INFOCOM ‘04
15Victor Bahl
Stops beaconing
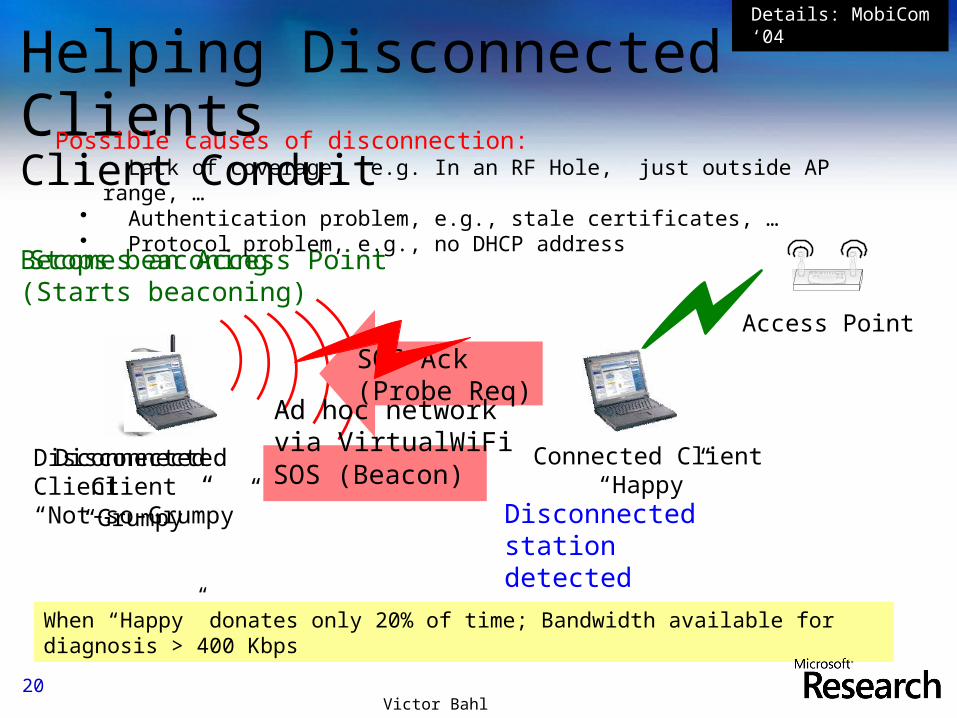
Helping Disconnected ClientsClient Conduit
Connected Client“Happy”
Disconnected Client
“Grumpy”
Access Point
Disconnected station detected
Becomes an Access Point(Starts beaconing)
SOS (Beacon)
SOS Ack(Probe Req)
Ad hoc networkvia VirtualWiFi
Help disconnected wireless clients with:• Online diagnosis• Certificate bootstrapping
Disconnected Client “Not-so-Grumpy”
Details: MobiCom ‘04
When “Happy” donates only 20% of time; Bandwidth available for diagnosis > 400 Kbps
Possible causes of disconnection:• Lack of coverage, e.g. In an RF Hole, just outside AP range, …• Authentication problem, e.g., stale certificates, …• Protocol problem, e.g., no DHCP address
20Victor Bahl
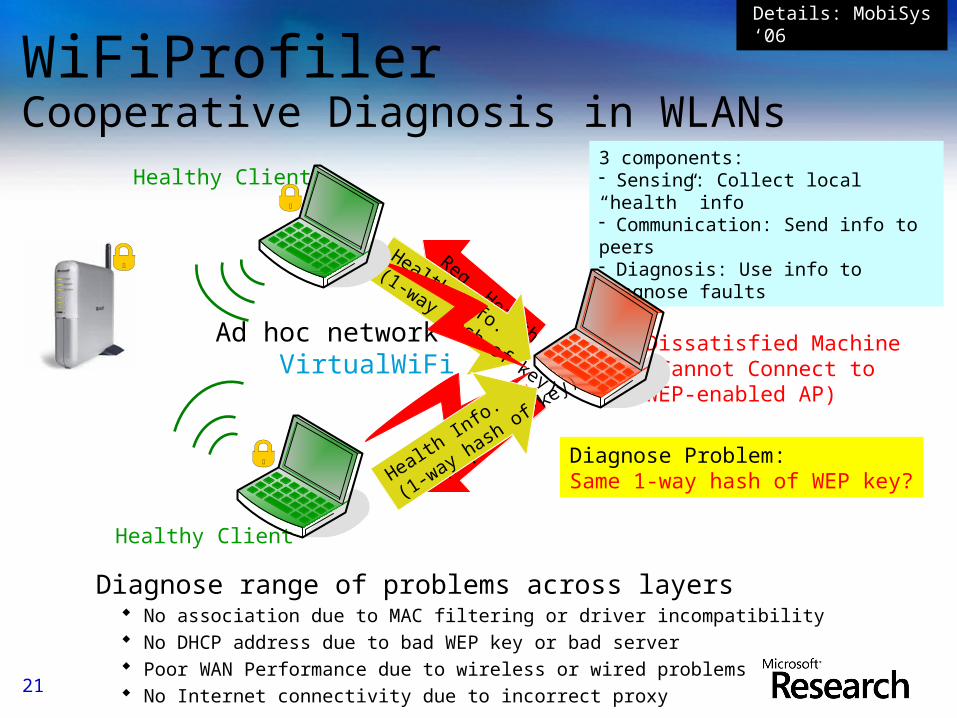
WiFiProfiler Cooperative Diagnosis in WLANs
Diagnose range of problems across layers No association due to MAC filtering or driver incompatibility No DHCP address due to bad WEP key or bad server Poor WAN Performance due to wireless or wired problems No Internet connectivity due to incorrect proxy
3 components:- Sensing: Collect local “health” info- Communication: Send info to peers- Diagnosis: Use info to diagnose faults
Details: MobiSys ‘06
Ad hoc networkvia VirtualWiFi
Dissatisfied Machine(Cannot Connect to WEP-enabled AP)
Req. Health
Req. H
ealth
Health Info.
(1-way hash of key)
Diagnose Problem:Same 1-way hash of WEP key?
Access Point
Healthy Client
Healthy Client
Health In
fo.
(1-way hash
of key)
21
0
5
10
15
20
25
30
R & C Near AP Rate Anomaly SoftRepeater
Th
rou
gh
pu
t (M
bp
s)
Client: C
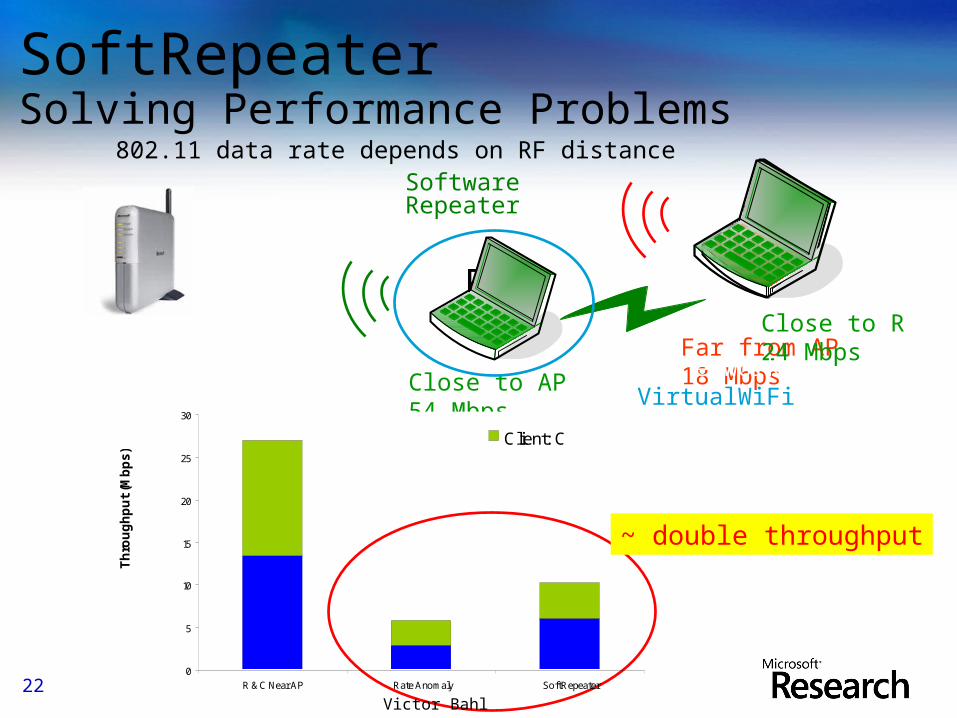
Far from AP18 MbpsClose to AP
54 Mbps
Access Point
Data Throughput ≤ 18 Mbps (Rate Anomaly of IEEE 802.11)
Close to R24 Mbps
R
SoftwareRepeater
802.11 data rate depends on RF distance
SoftRepeaterSolving Performance Problems
Ad hoc networkvia VirtualWiFi
C
~ double throughput
22Victor Bahl
C APC
AP
R
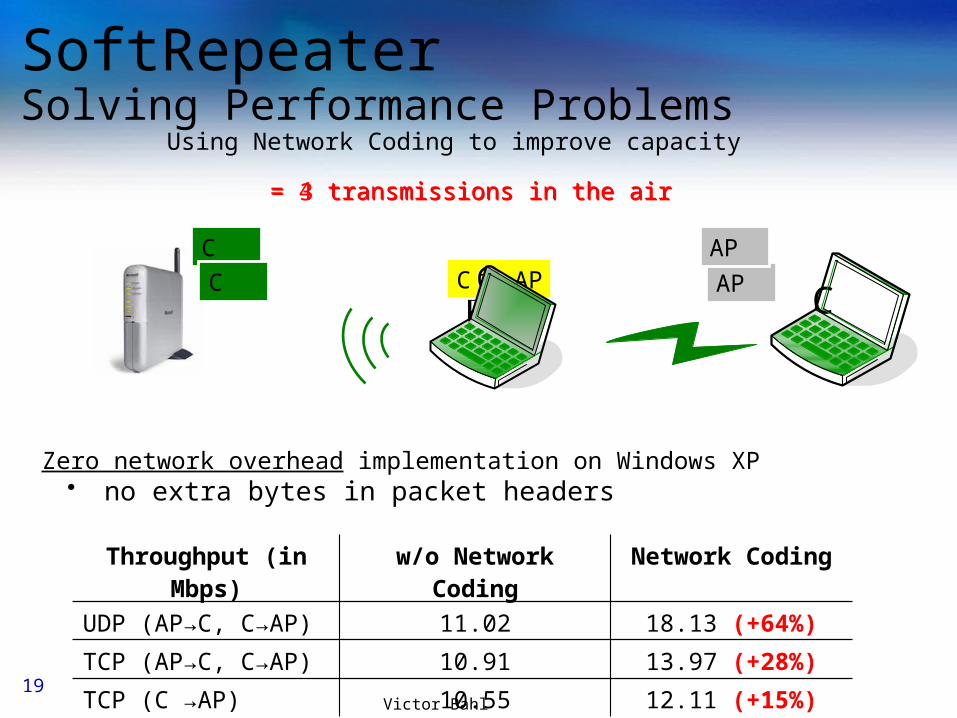
Using Network Coding to improve capacity
SoftRepeaterSolving Performance Problems
Ad hoc networkvia VirtualWiFi
CC AP
APXOR
C AP+
= 4 transmissions in the air
+
broadcast
= 3 transmissions in the air
Zero network overhead implementation on Windows XP• no extra bytes in packet headers
Throughput (in Mbps)
w/o Network Coding Network Coding
UDP (AP→C, C→AP) 11.02 18.13 (+64%)
TCP (AP→C, C→AP) 10.91 13.97 (+28%)
TCP (C →AP) 10.55 12.11 (+15%)19Victor Bahl
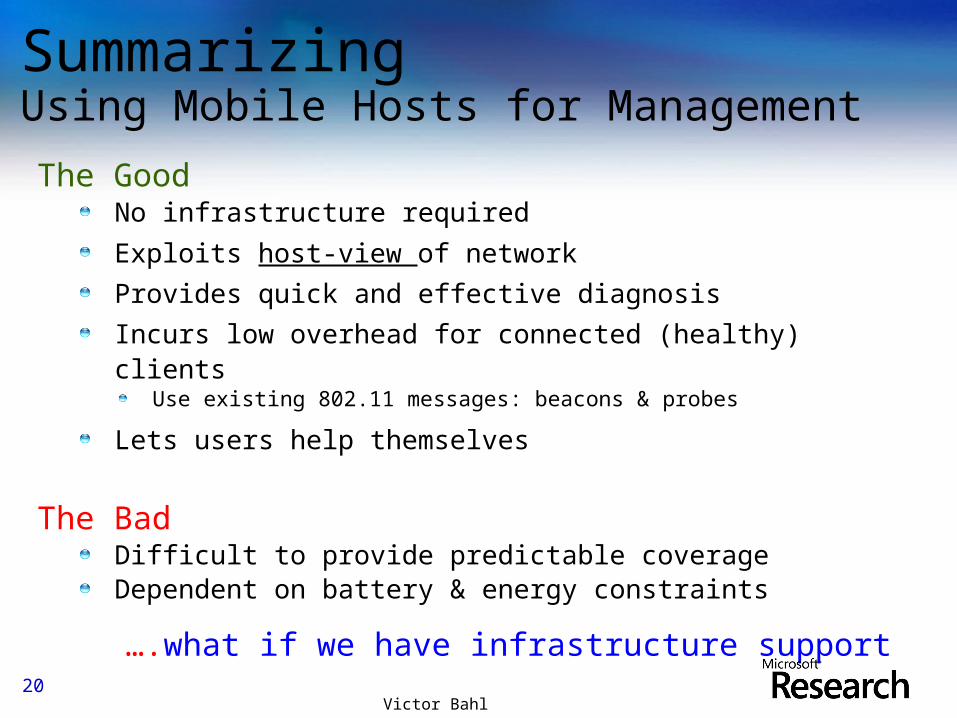
SummarizingUsing Mobile Hosts for Management
The GoodNo infrastructure required
Exploits host-view of network
Provides quick and effective diagnosis
Incurs low overhead for connected (healthy) clientsUse existing 802.11 messages: beacons & probes
Lets users help themselves
The BadDifficult to provide predictable coverageDependent on battery & energy constraints
….what if we have infrastructure support
20Victor Bahl
Tools for Managing Enterprise Wireless
NetworksCooperative Client-Server Network Diagnosis & Recovery
Automate network fault diagnosis and recovery
Reduce user frustration and admin load
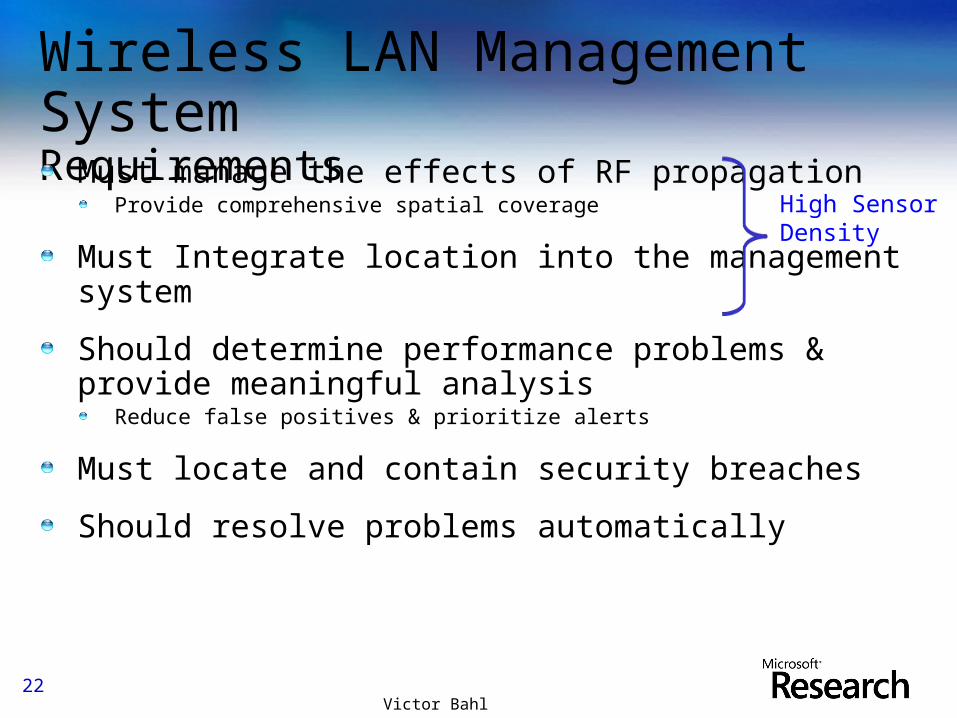
Wireless LAN Management System RequirementsMust manage the effects of RF propagation
Provide comprehensive spatial coverage
Must Integrate location into the management system
Should determine performance problems & provide meaningful analysis
Reduce false positives & prioritize alerts
Must locate and contain security breaches
Should resolve problems automatically
High Sensor Density
22Victor Bahl
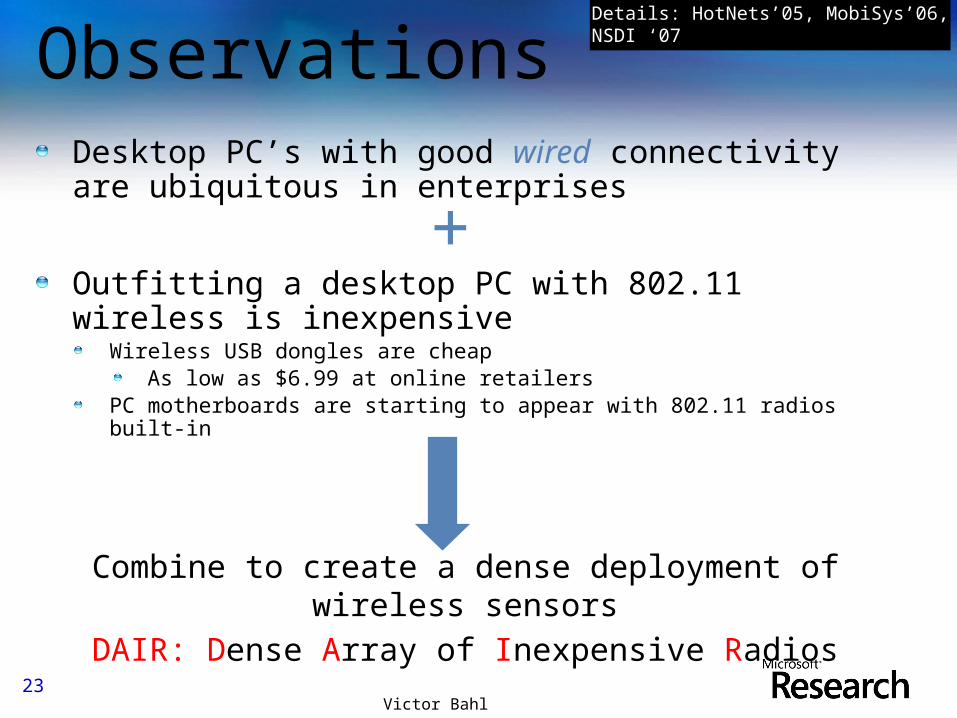
ObservationsDesktop PC’s with good wired connectivity are ubiquitous in enterprises
Outfitting a desktop PC with 802.11 wireless is inexpensive
Wireless USB dongles are cheapAs low as $6.99 at online retailers
PC motherboards are starting to appear with 802.11 radios built-in
Combine to create a dense deployment of wireless sensors
DAIR: Dense Array of Inexpensive Radios
+
Details: HotNets’05, MobiSys’06, NSDI ‘07
23Victor Bahl
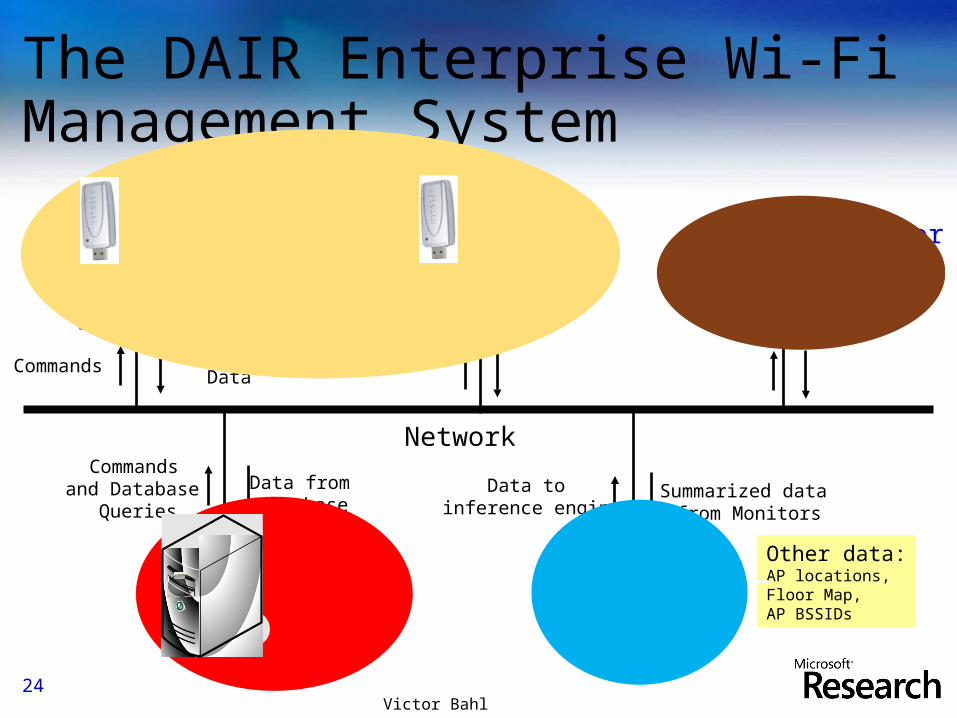
Commands
Network
Database
AirMonitor
Summarized Data
Commands
and Database Queries
Data from
databaseData to
inference engineSummarized data
from Monitors
AirMonitor
Inference Engine
The DAIR Enterprise Wi-Fi Management System
Other data:AP locations,Floor Map,AP BSSIDs
LandMonitor
24Victor Bahl
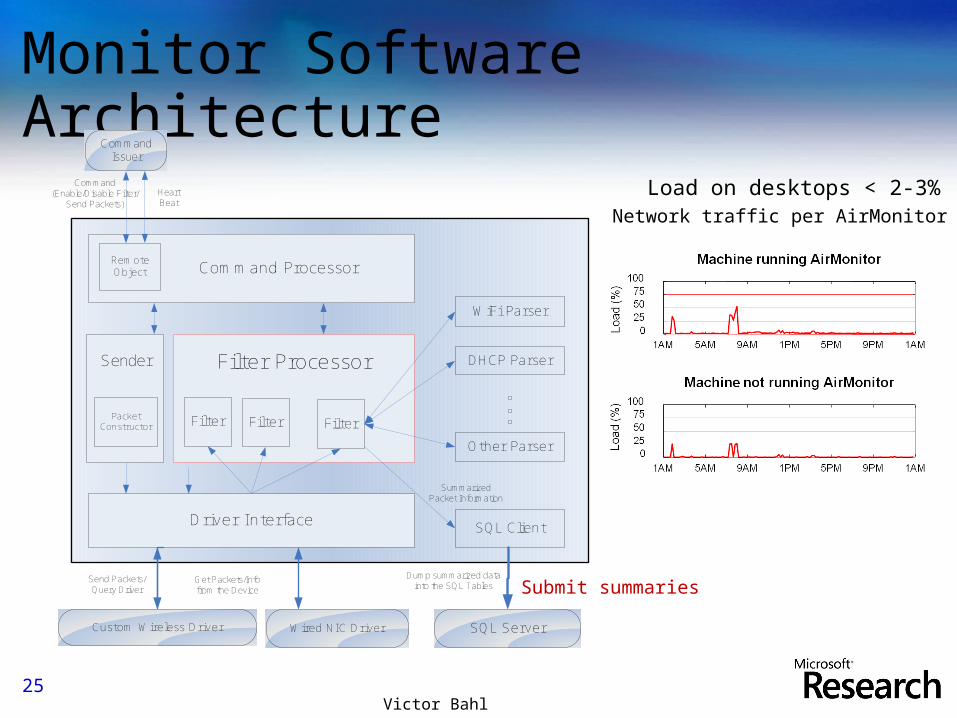
Command Processor
Filter Processor
Driver Interface
Filter
WiFi Parser
SQL Client
Remote Object
Command (Enable/Disable Filter/
Send Packets)Heart Beat
CommandIssuer
Custom Wireless Driver SQL Server
Deliver Packets to all the Registered Filters
Enable/Disable Filters
Enable/Disable Promiscuous/Logging
Summarized Packet Information
Dump summarized data into the SQL Tables
Get Packets/Info from the Device
Send Packets/Query Driver
DHCP Parser
Other Parser
Wired NIC Driver
FilterFilter
Sender
Packet
Packet Constructor
Send Packet
Monitor Software Architecture
Submit summaries
Load on desktops < 2-3%Network traffic per AirMonitor < 10Kbps
25Victor Bahl
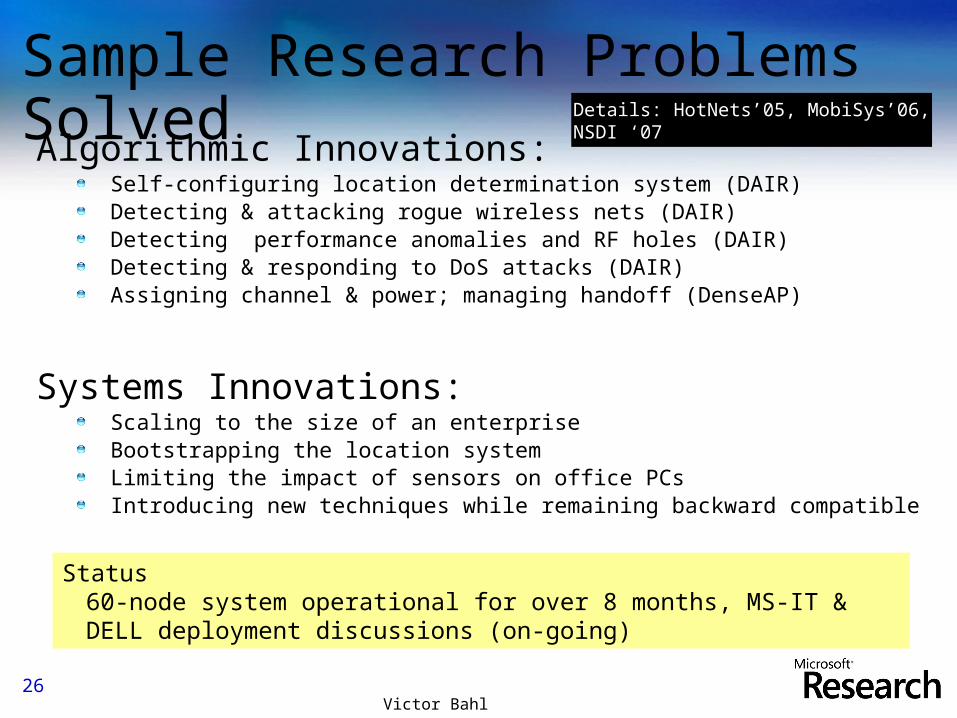
Sample Research Problems SolvedAlgorithmic Innovations:
Self-configuring location determination system (DAIR)Detecting & attacking rogue wireless nets (DAIR)Detecting performance anomalies and RF holes (DAIR)Detecting & responding to DoS attacks (DAIR)Assigning channel & power; managing handoff (DenseAP)
Systems Innovations:Scaling to the size of an enterprise Bootstrapping the location systemLimiting the impact of sensors on office PCsIntroducing new techniques while remaining backward compatible
Details: HotNets’05, MobiSys’06, NSDI ‘07
Status60-node system operational for over 8 months, MS-IT & DELL deployment discussions (on-going)
26Victor Bahl
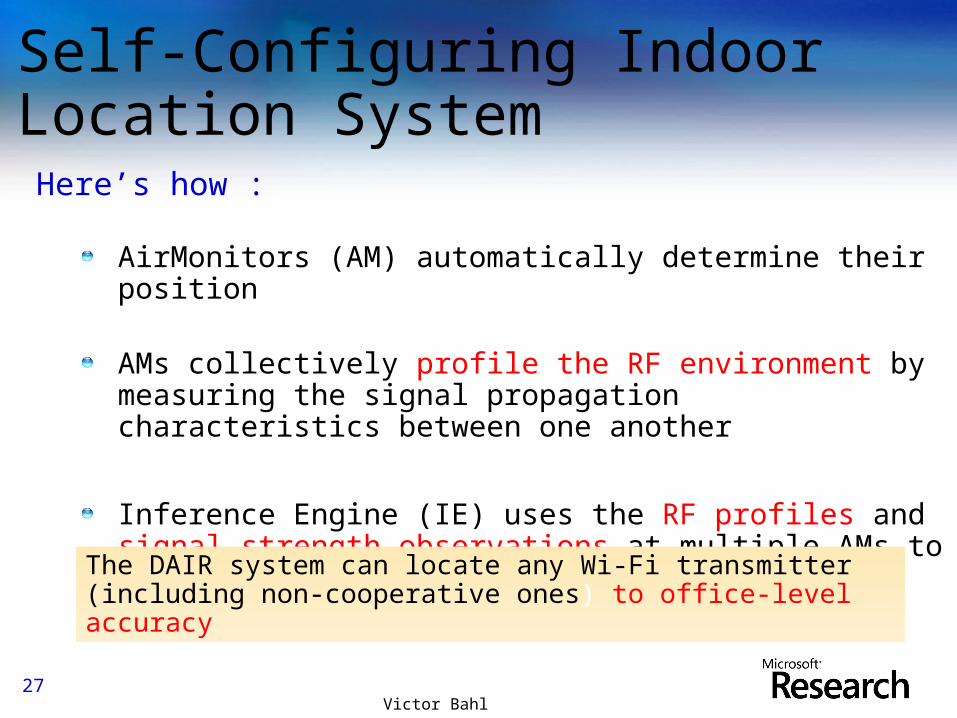
Self-Configuring Indoor Location SystemHere’s how :
AirMonitors (AM) automatically determine their position
AMs collectively profile the RF environment by measuring the signal propagation characteristics between one another
Inference Engine (IE) uses the RF profiles and signal strength observations at multiple AMs to locate Wi-Fi transmitters
The DAIR system can locate any Wi-Fi transmitter (including non-cooperative ones) to office-level accuracy
27Victor Bahl
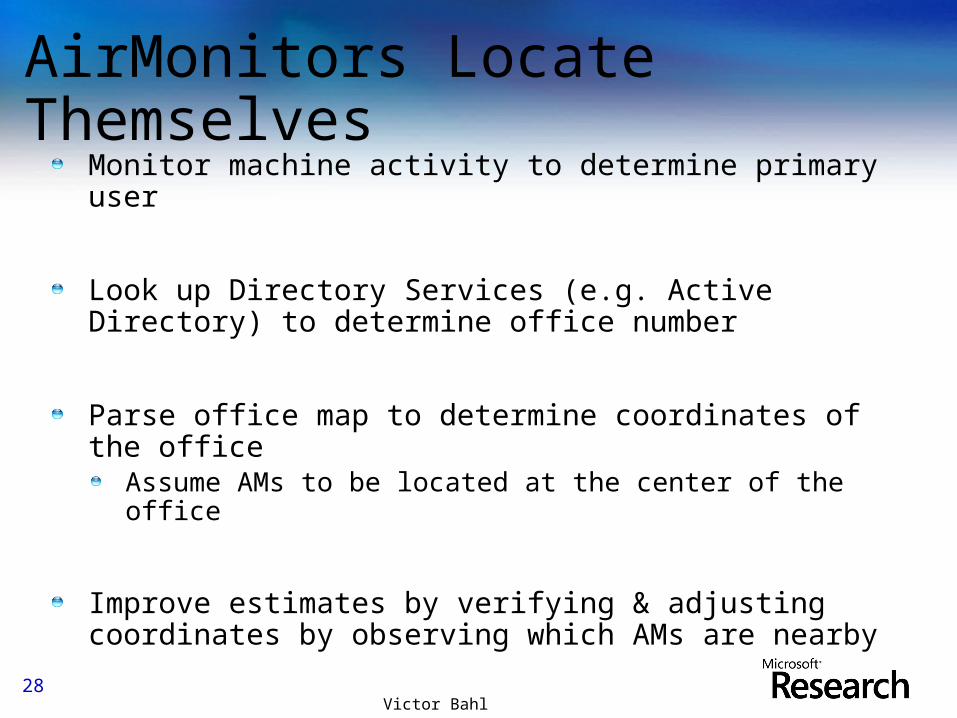
AirMonitors Locate Themselves
Monitor machine activity to determine primary user
Look up Directory Services (e.g. Active Directory) to determine office number
Parse office map to determine coordinates of the officeAssume AMs to be located at the center of the office
Improve estimates by verifying & adjusting coordinates by observing which AMs are nearby
28Victor Bahl
0
5
10
15
20
25
30
35
40
45
50
1 4 7 10 13 16 19 22 25 28 31 34 37 40 43 46 49 52 55 58 61 64 67 70
Sample
Sig
nal
Str
eng
th (
dB
m)
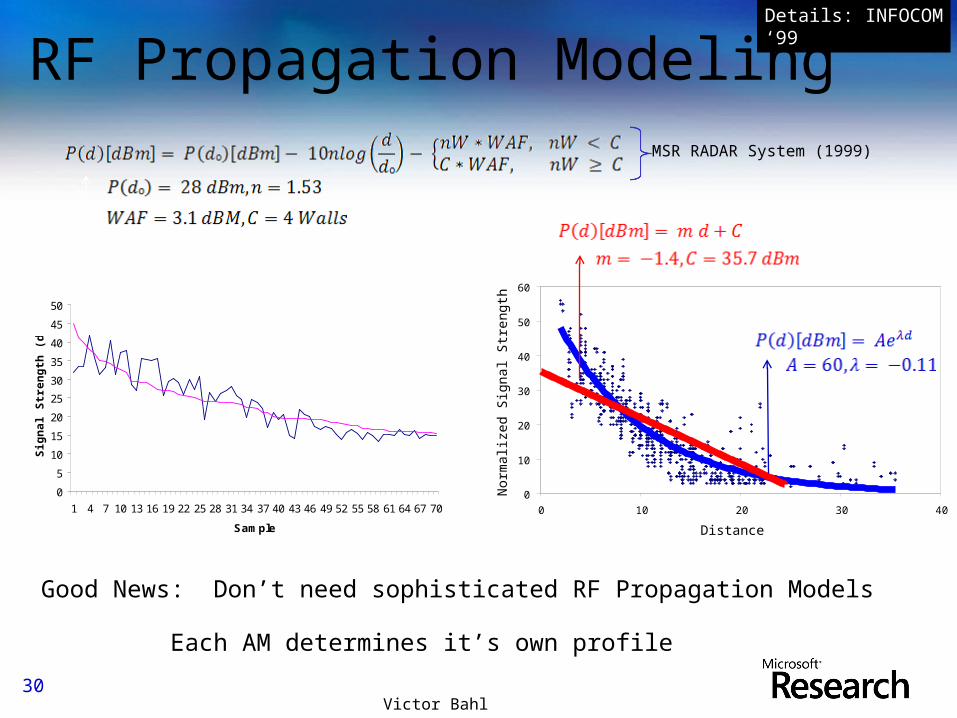
RF Propagation Modeling
Good News: Don’t need sophisticated RF Propagation Models
0
10
20
30
40
50
60
0 10 20 30 40
Distance
Norm
aliz
ed
Sig
nal S
tren
gth
MSR RADAR System (1999)
Each AM determines it’s own profile
30
Details: INFOCOM ‘99
Victor Bahl
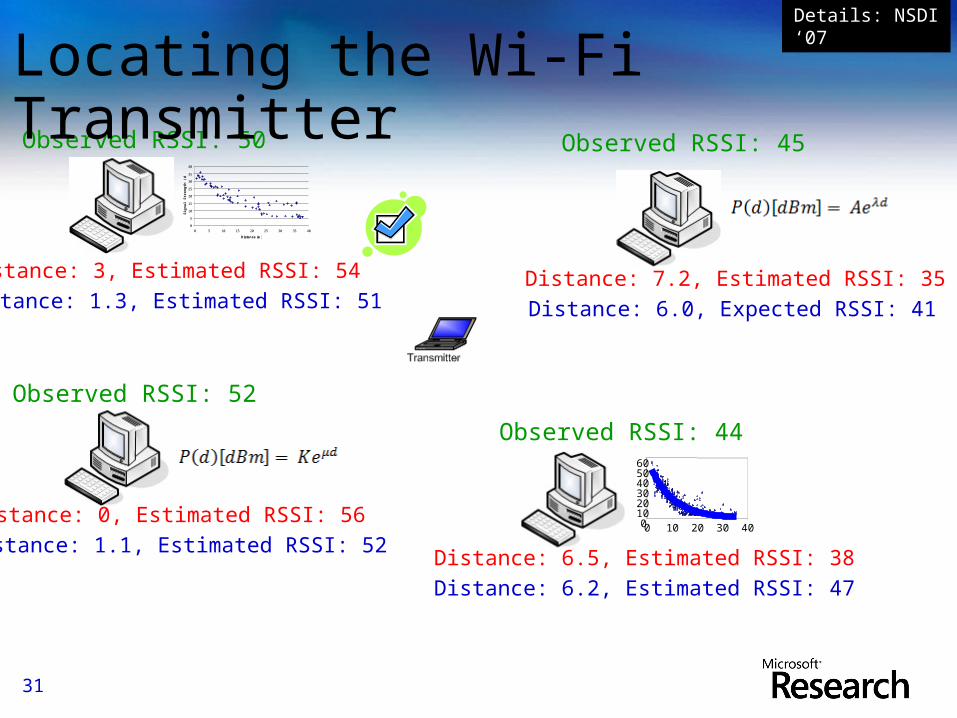
Observed RSSI: 52
Distance: 0, Estimated RSSI: 56Distance: 1.1, Estimated RSSI: 52
Observed RSSI: 50
Distance: 3, Estimated RSSI: 54Distance: 1.3, Estimated RSSI: 51
Observed RSSI: 44
Distance: 6.5, Estimated RSSI: 38Distance: 6.2, Estimated RSSI: 47
Observed RSSI: 45
Distance: 7.2, Estimated RSSI: 35Distance: 6.0, Expected RSSI: 41
Locating the Wi-Fi Transmitter
Adjust location to minimize error
0102030405060
0 10 20 30 40
0
5
10
15
20
25
30
35
40
0 5 10 15 20 25 30 35 40
Distance (m)
Sig
nal
Str
eng
th (
dB
m)
31
Details: NSDI ‘07
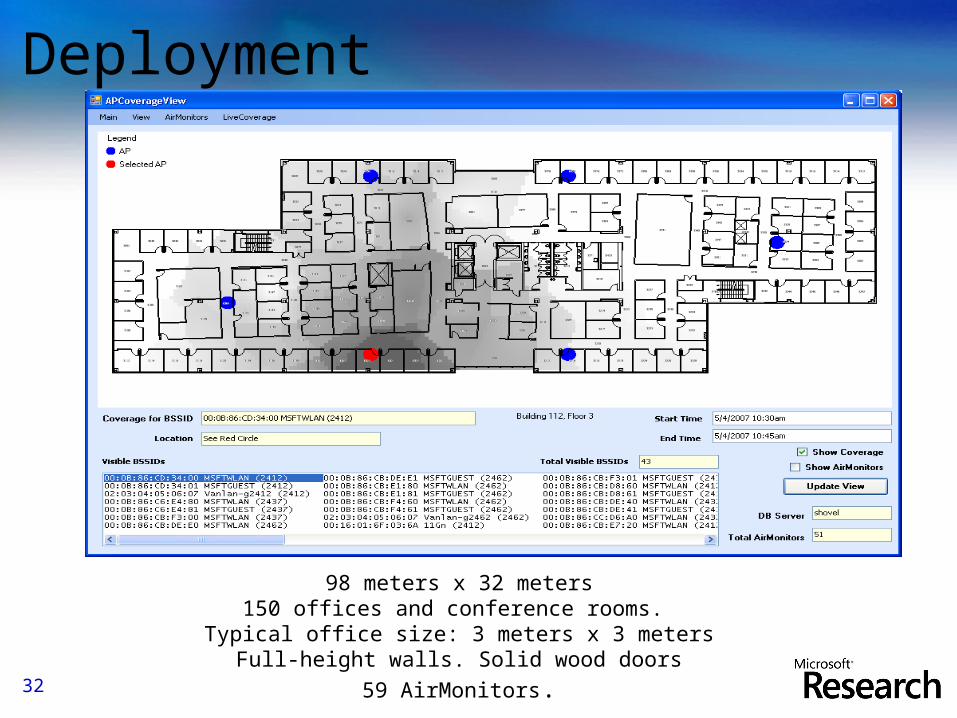
Deployment
98 meters x 32 meters150 offices and conference rooms.
Typical office size: 3 meters x 3 metersFull-height walls. Solid wood doors
59 AirMonitors.32
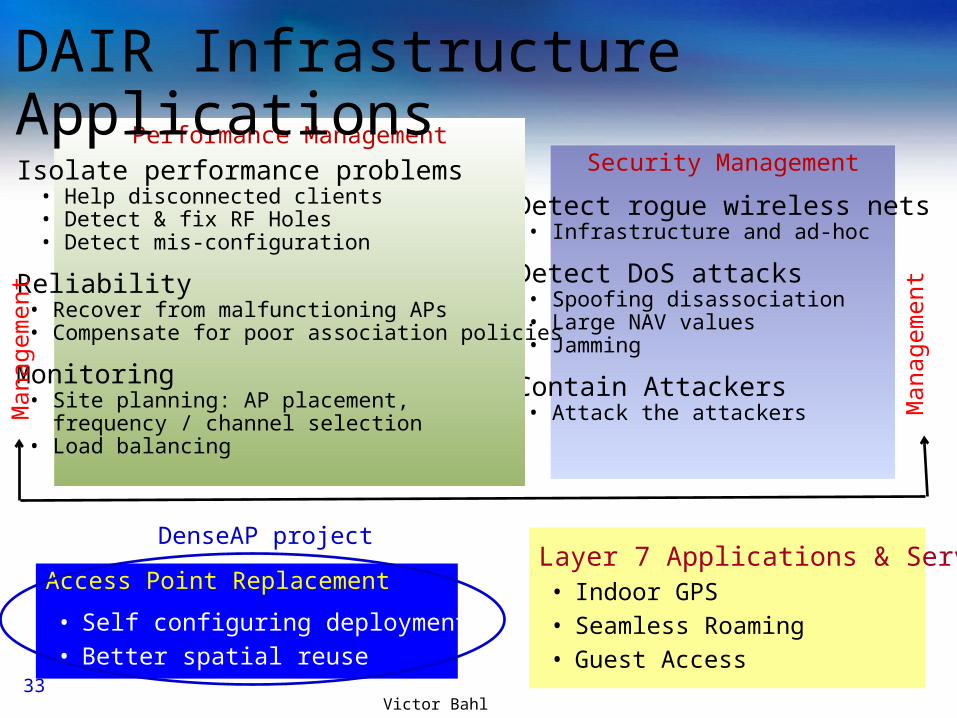
Access Point Replacement
• Self configuring deployment• Better spatial reuse
Layer 7 Applications & Services• Indoor GPS• Seamless Roaming • Guest Access
Security Management
Detect rogue wireless nets• Infrastructure and ad-hoc
Detect DoS attacks• Spoofing disassociation• Large NAV values• Jamming
Contain Attackers• Attack the attackers
Performance Management
Isolate performance problems• Help disconnected clients• Detect & fix RF Holes• Detect mis-configuration
Reliability• Recover from malfunctioning APs• Compensate for poor association policies
Monitoring• Site planning: AP placement,
frequency / channel selection• Load balancing
DAIR Infrastructure Applications
Managem
en
t
Managem
en
t
DenseAP project
33Victor Bahl
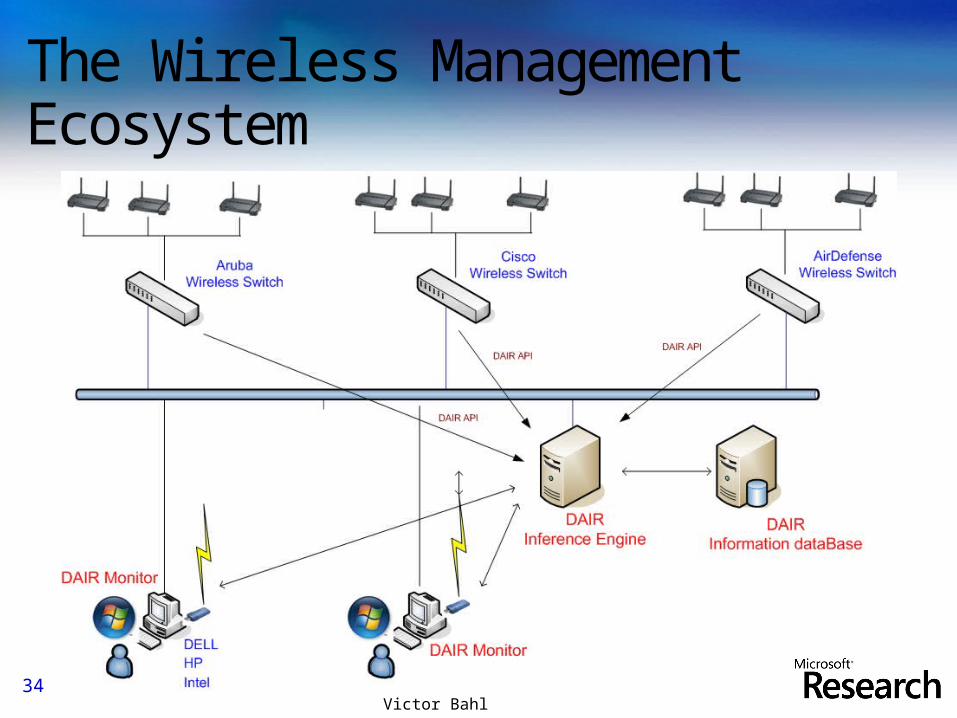
The Wireless Management Ecosystem
34Victor Bahl
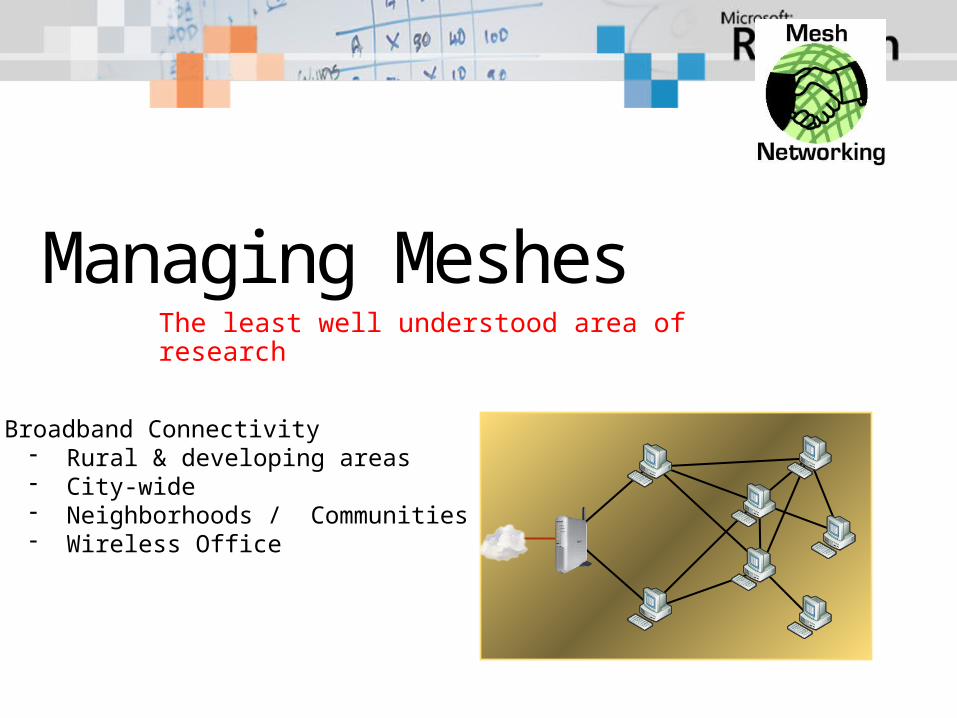
Managing Meshes
Broadband Connectivity - Rural & developing areas- City-wide- Neighborhoods / Communities- Wireless Office
The least well understood area of research
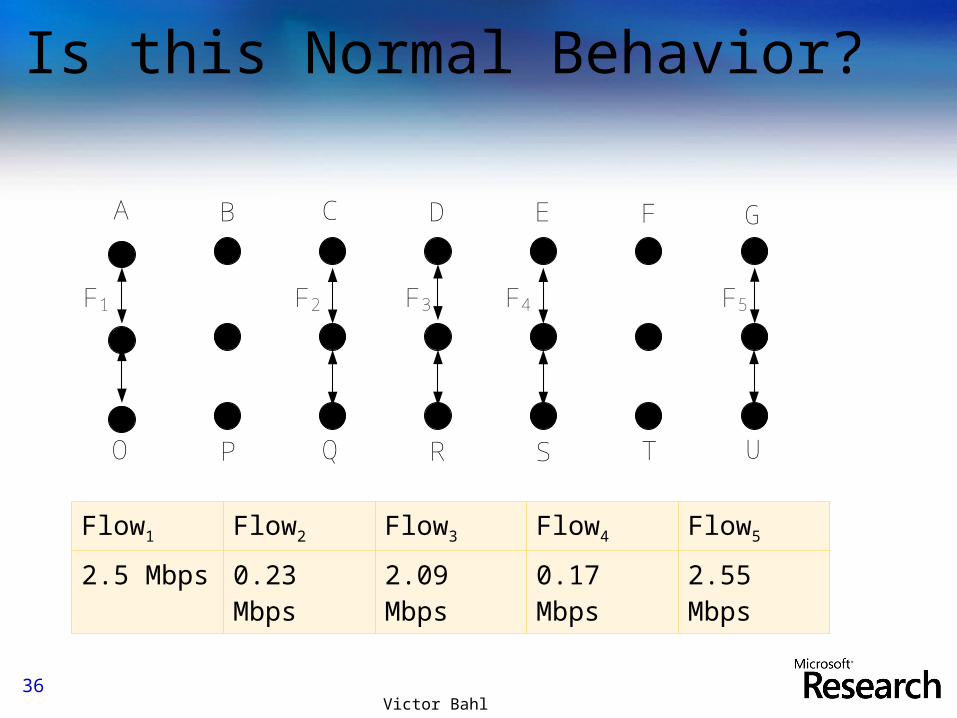
A B C D E
O P Q R S
F G
UT
F1 F2 F3 F4 F5
Is this Normal Behavior?
Flow1 Flow2 Flow3 Flow4 Flow5
2.5 Mbps 0.23 Mbps
2.09 Mbps
0.17 Mbps
2.55 Mbps
36Victor Bahl
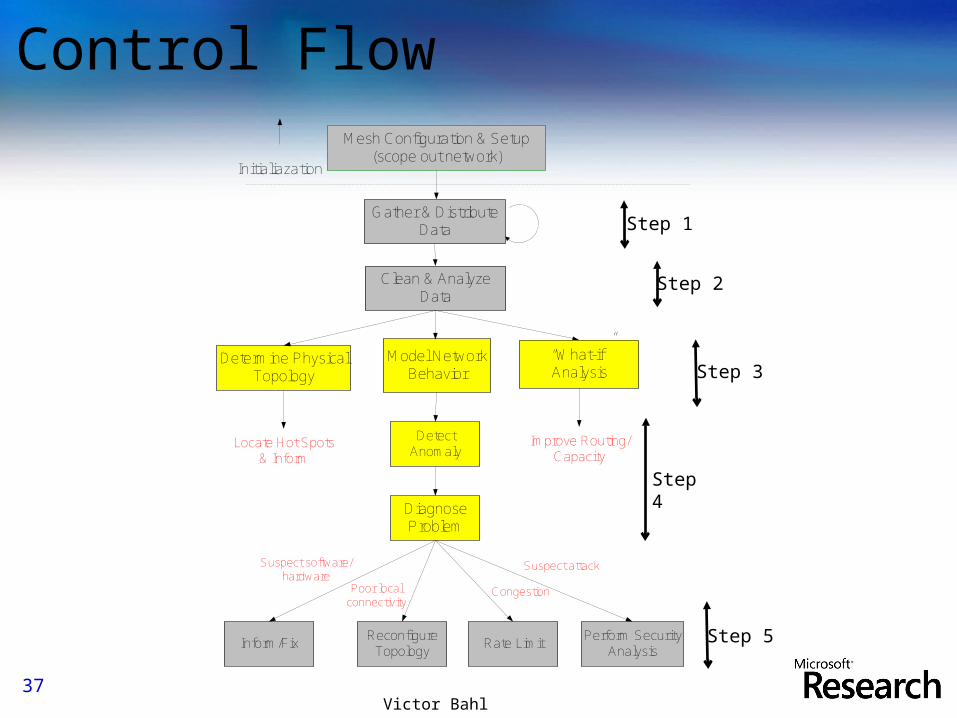
Control FlowMesh Configuration & Setup
(scope out network)
Clean & Analyze Data
Determine Physical Topology
Model Network Behavior
Improve Routing/Capacity
Detect Anomaly
Diagnose Problem
Inform/FixReconfigure
Topology Rate Limit
Perform Security Analysis
Locate Hot Spots & Inform
Initialiazation
Suspect attackSuspect software/hardware
CongestionPoor local connectivity
“What-if” Analysis
Gather & Distribute Data Step 1
Step 2
Step 3
Step 4
Step 5
37Victor Bahl
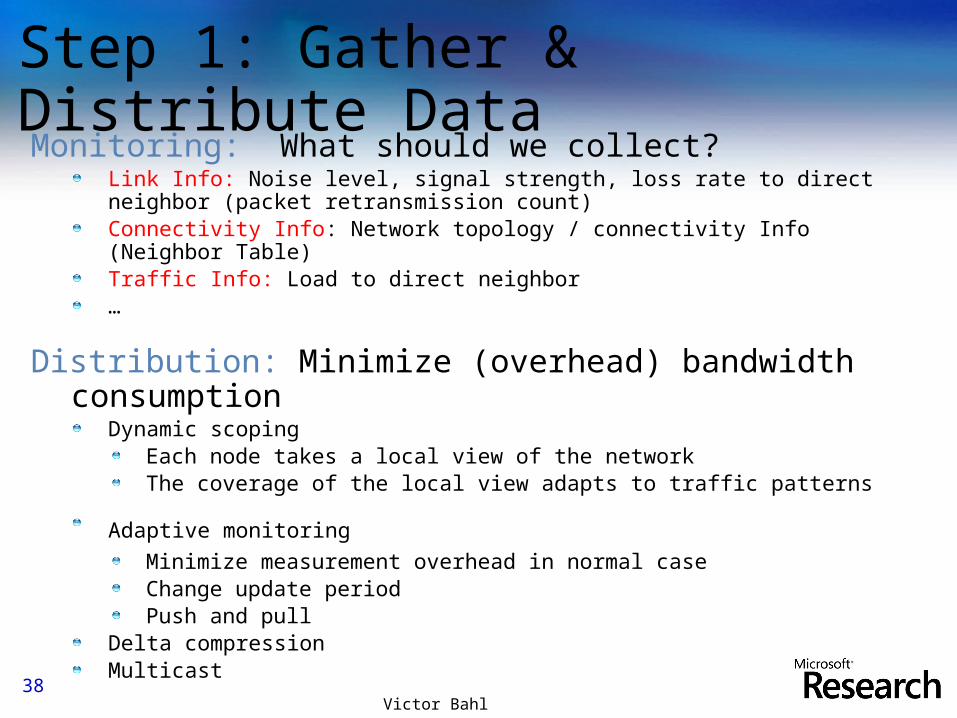
Step 1: Gather & Distribute DataMonitoring: What should we collect?
Link Info: Noise level, signal strength, loss rate to direct neighbor (packet retransmission count)Connectivity Info: Network topology / connectivity Info (Neighbor Table)Traffic Info: Load to direct neighbor…
Distribution: Minimize (overhead) bandwidth consumption
Dynamic scopingEach node takes a local view of the networkThe coverage of the local view adapts to traffic patterns
Adaptive monitoring Minimize measurement overhead in normal caseChange update periodPush and pull
Delta compressionMulticast
38Victor Bahl
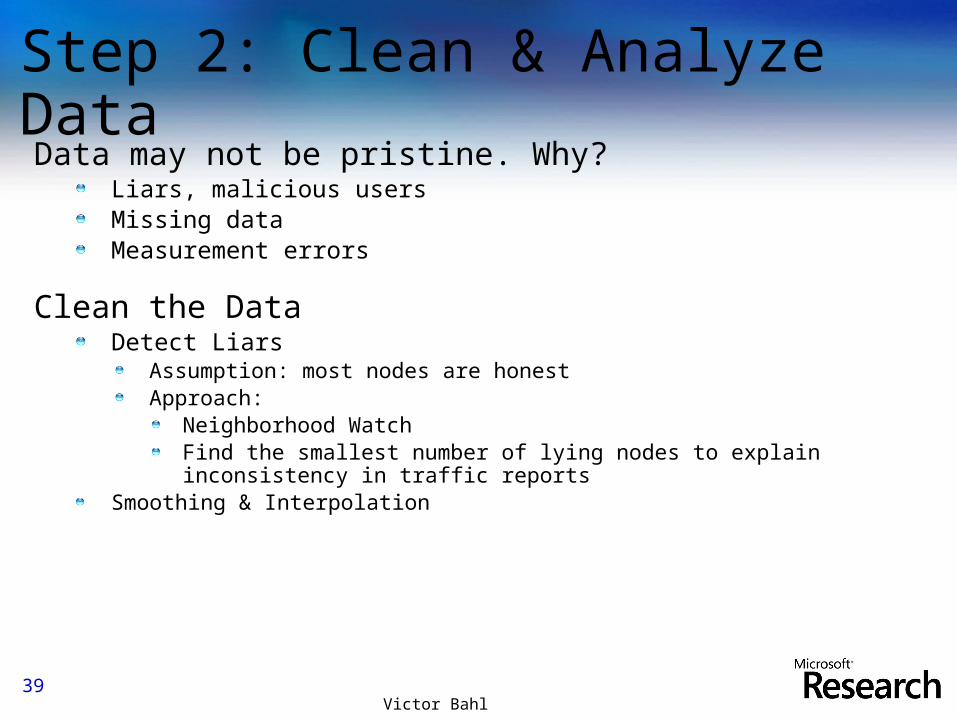
Step 2: Clean & Analyze Data
Data may not be pristine. Why?Liars, malicious usersMissing dataMeasurement errors
Clean the DataDetect Liars
Assumption: most nodes are honestApproach:
Neighborhood Watch Find the smallest number of lying nodes to explain inconsistency in traffic reports
Smoothing & Interpolation
39Victor Bahl
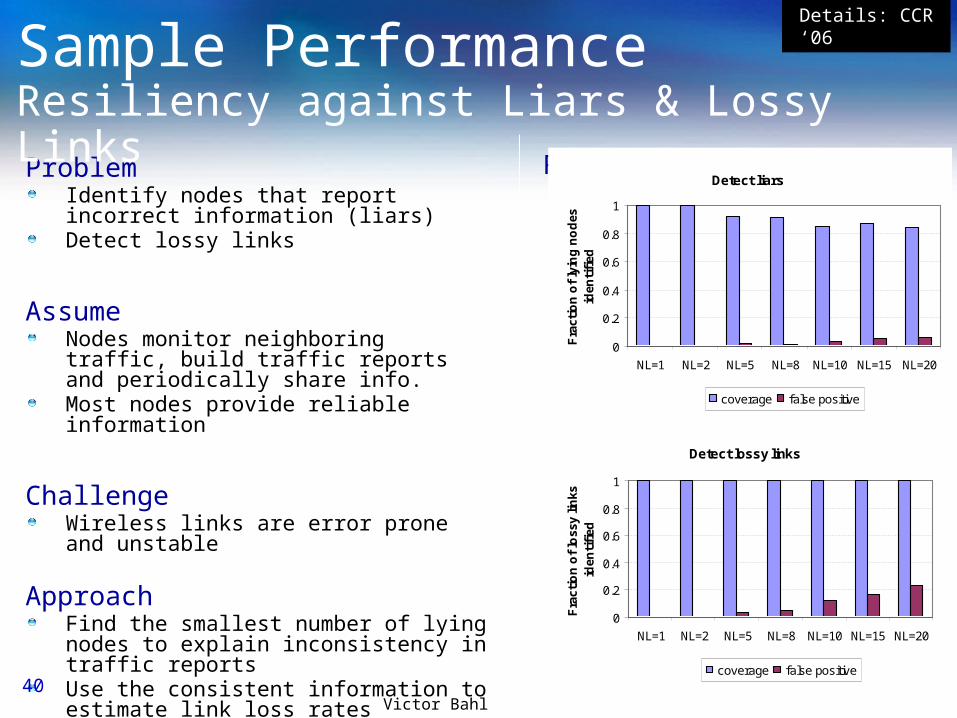
ProblemIdentify nodes that report incorrect information (liars)Detect lossy links
AssumeNodes monitor neighboring traffic, build traffic reports and periodically share info.Most nodes provide reliable information
ChallengeWireless links are error prone and unstable
ApproachFind the smallest number of lying nodes to explain inconsistency in traffic reportsUse the consistent information to estimate link loss rates
Detect liars
0
0.2
0.4
0.6
0.8
1
NL=1 NL=2 NL=5 NL=8 NL=10 NL=15 NL=20
Fra
ctio
n o
f ly
ing
no
des
id
enti
fied
coverage false positive
Detect lossy links
0
0.2
0.4
0.6
0.8
1
NL=1 NL=2 NL=5 NL=8 NL=10 NL=15 NL=20
Fra
ctio
n o
f lo
ssy
links
id
enti
fied
coverage false positive
Results
Details: CCR ‘06Sample PerformanceResiliency against Liars & Lossy Links
40Victor Bahl
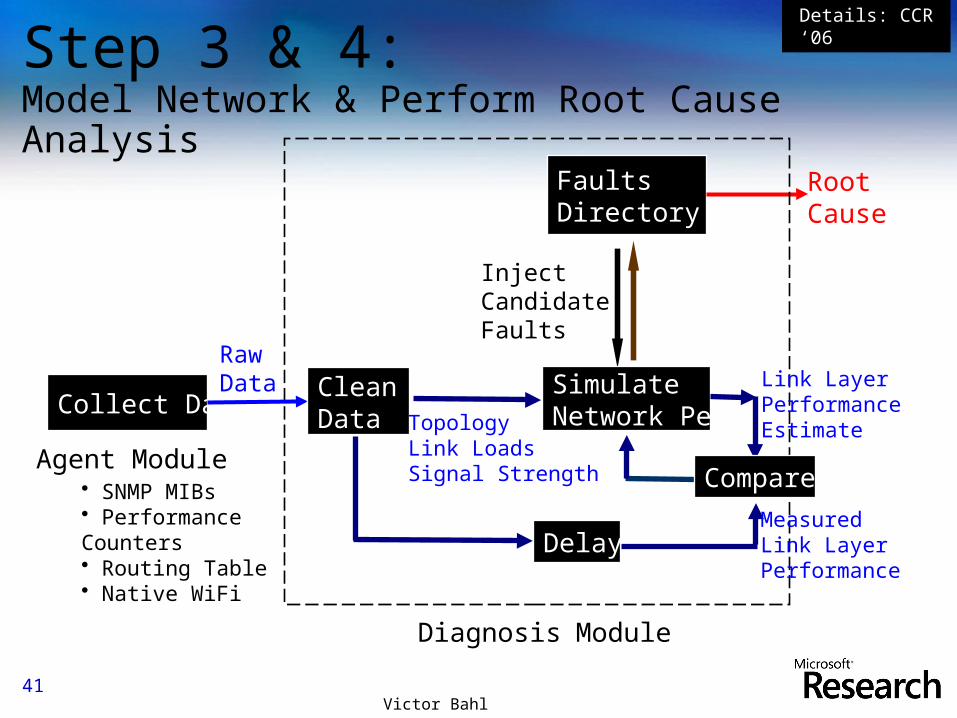
Step 3 & 4: Model Network & Perform Root Cause Analysis
Faults Directory
InjectCandidateFaults
RootCause
Diagnosis Module
Collect Data
RawData
Agent Module• SNMP MIBs• Performance Counters• Routing Table• Native WiFi
CleanData Topology
Link LoadsSignal Strength
Simulate Network Perf.
Link LayerPerformanceEstimate
Compare
DelayMeasuredLink LayerPerformance
Details: CCR ‘06
41Victor Bahl

Sample Performance
Number of faults
4 6 8 10 12 14
Coverage 1 1 0.75 0.7 0.92 0.86
False Positive
0 0 0 0 0.25 0.29
Faults detected:- Random packet dropping- MAC misbehavior- External noise
25 node random topology
Details: CCR ‘06
42Victor Bahl
Troubleshooting FrameworkChallenges [in Online Simulation based Diagnostics]:
Accurately reproduce the behavior of the network inside a simulatorBuild a fault diagnosis technique using the simulator as a diagnosis tool
AdvantagesFlexible & customizable for a large class of networksCaptures complicated interactions
within the network between the network & environment, and among multiple faults
Extensible in its ability to detect new faultsAllows what-if analysis
42Victor Bahl
Step 5: Mitigation
Responding to troubled spotsRe-route trafficRate-limitChange topology via power control & directional antenna control Flag
environmental changes & problemsMalfunctioning hardware
Launch DoS attacks against the possible attackeretc.
44Victor Bahl
So where does all this leave us……
Victor Bahl
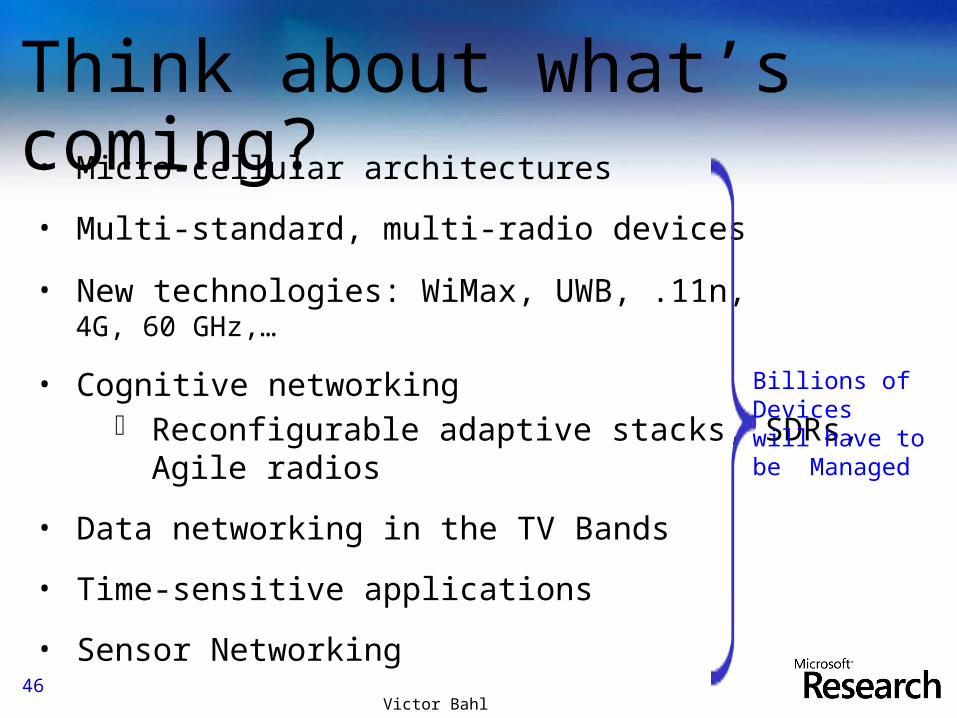
Think about what’s coming? • Micro-cellular architectures
• Multi-standard, multi-radio devices
• New technologies: WiMax, UWB, .11n, 4G, 60 GHz,…
• Cognitive networking― Reconfigurable adaptive stacks, SDRs,
Agile radios
• Data networking in the TV Bands
• Time-sensitive applications
• Sensor Networking46
Billions of Devices will have to be Managed
Victor Bahl
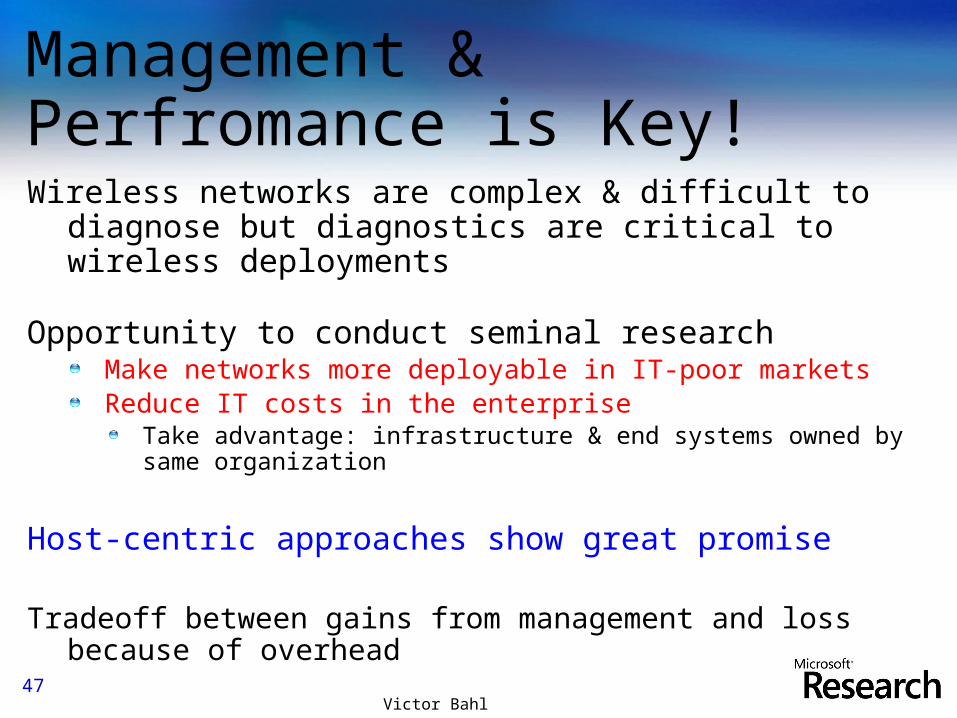
Management & Perfromance is Key! Wireless networks are complex & difficult to diagnose
but diagnostics are critical to wireless deployments
Opportunity to conduct seminal researchMake networks more deployable in IT-poor marketsReduce IT costs in the enterprise
Take advantage: infrastructure & end systems owned by same organization
Host-centric approaches show great promise
Tradeoff between gains from management and loss because of overhead
47Victor Bahl
Are we there yet?
Not yet…..To get there we need to build
…..but surely getting there Self-aware, self-healing,
easy-to- manage networks
Victor Bahl
Q/A
http://research.microsoft.com/netres/nethealth/
© 2007 Microsoft Corporation. All rights reserved. Microsoft, Windows, Windows Vista and other product names are or may be registered trademarks and/or trademarks in the U.S. and/or other countries.
The information herein is for informational purposes only and represents the current view of Microsoft Corporation as of the date of this presentation. Because Microsoft must respond to changing market conditions, it should not be interpreted to be a commitment on the part of Microsoft, and Microsoft cannot guarantee the accuracy of any information provided after
the date of this presentation. MICROSOFT MAKES NO WARRANTIES, EXPRESS, IMPLIED OR STATUTORY, AS TO THE INFORMATION IN THIS PRESENTATION.
Related Documents