Paper Ho. 970499 PREPRINT Duplication of this preprint for publication or sale is strictly prohibited without prior written permission of the Transportation Research Board VIBRATION STUDY FOR CONSOLIDATION OF PORTLAND· CEMENT CONCRETE By Shane Tymkowicz Iowa DOT and Bob Steff es Iowa DOT Interim Report for Iowa DOT Research Project MLR-95-4 For Presentation at the Transportation Research Board 76th Annual Meeting January 12-16, 1997 Washington, D.C. Project Development Division Iowa Department of Transportation

Welcome message from author
This document is posted to help you gain knowledge. Please leave a comment to let me know what you think about it! Share it to your friends and learn new things together.
Transcript

Paper Ho. 970499
PREPRINT Duplication of this preprint for publication or sale is strictly prohibited without prior written permission of the Transportation Research Board
VIBRATION STUDY FOR CONSOLIDATION OF
PORTLAND· CEMENT CONCRETE By
Shane Tymkowicz Iowa DOT
and Bob Steff es
Iowa DOT
Interim Report for
Iowa DOT Research Project MLR-95-4
For Presentation at the Transportation Research Board
76th Annual Meeting January 12-16, 1997
Washington, D.C.
Project Development Division
Iowa Department of Transportation

Vibration Study for Consolidation of
J
Portland Cement Concrete
Interim Report for
Iowa DOT Research Project MLR-95-4
By Shane Tymkowicz
Transportation Engineer Associate 515-239-1326
FAX 515-239-1943 Office of Central Iowa Transportation Center - Materials
and Robert F. Steffes
515-239-1392 FAX 515-239-1092
Assistant to the Research Engineer Office of Materials
Project Development Division Iowa Department of Transportation
Ames, Iowa 50010
January 1997
The text of this paper contains 2908 words.

Steffes, R.F., Tymkowicz, S.W.
TABLE OF CONTENTS
Page
Abstract 1
Introduction 2
Background 2
Research 4
Experiment Design 5
General Information 6
PCC Consolidation Practices 6
Vibrator Frequencies 6
Vibrator Positioning 7
Results 7
Visual Observations 8
High Pressure Air Testing 9
Conclusions 10
Future Research 10
References 11
Figure Captions 12
Table Titles y.r J_{,
Figures ~13
Tables . 27
Steffes, R.F., Tymkowicz, S.W.
DISCLAIMER
The contents of this report reflect the views of the authors and do not necessarily reflect the official views of the Iowa Department of Transportation. This report does not constitute any
standard, specification, or regulation.

Steffes, R.F., Tymkowicz, S. W. 1
ABSTRACT
The Iowa Department of Transportation has noticed an increase in the occurrence of excessively
vibrated Portland Cement Concrete (PCC) pavements. The over consolidation of PCC pavements
can be observed in several PCC pavement projects across the state oflowa. It is also believed to
be a factor in accelerating the premature deterioration of at least two pavements in Iowa. To
address the problem of excessive vibration a research project was conducted in 1995 to document
the vibratory practices of PCC slip form paving in Iowa and determine the effect of vibration on
the air content of the pavement. The primary factors studied were paver speed, vibrator
frequency, and air content relative to the location of the vibrator. The study concluded that the
Iowa Department of Transportation specification of 5000 to 8000 vibrations per minute (vpm) for
slip form pavers is effective for normal paver speeds observed on the three test paving projects.
Excessive vibration was clearly identified on one project where a vibrator frequency was found to
be 12000 vpm. When the paver speed was reduced to half the normal speed, hard air contents
indicate that excessive vibration was beginning to occur in the localized area immediately
surrounding the vibrator at a frequency of 8000 vpm. Also, the study gives indications that the
radius of influence of the vibrators is smaller than many claim.
KEYWORDS
Air Content Consolidation Pavement Portland Cement Concrete Vibration

Steffes, R.F., Tymkowicz, S.W.
INTRODUCTION
2
PCC pavements have provided good, durable highway surfaces for many years. When designed
and constructed properly the expected service life will normally range from 25 to 40 years. In
some cases a PCC paving project may suffer premature deterioration due to poor design, material
qualities, construction operations or uncontrollable events.
One characteristic normally contributing to a long service life is the existence of a proper air void
system in the PCC (1). An effective air void system will provide protection from freeze-thaw
damage by reducing the pressures that develop during the freezing and thawing of moisture within
the concrete. A second characteristic of quality concrete is the uniform dispersion of aggregate
throughout the pavement. A nonuniform or segregated mix may initiate abnormal cracking during
the hardening process. The cracking could be caused by differential drying shrinkage between
zones of greater paste content and zones of greater aggregate content.
BACKGROUND
Vibratory consolidation practices of PCC became an area of interest to the Iowa Department of
Transportation when excessive vibration was identified as a factor in the premature deterioration
of US Highway 20 in Webster County and Hamilton County (2). Deterioration of US 20 was
initially noticed in May 1990. The deterioration was unexpected since the pavement sections
were only three years old. The characteristics of the deterioration were similar to the staining and
cracking associated with D-cracking. Investigators have identified the primary source of
deterioration as either ettringite formation in the air voids or alkali-silica reactivity (3,4). Cores of

Steffes, R.F., Tymkowicz, S.W.
the pavement reveal many instances where the hardened concrete contains air contents of less
than 3 percent, which accelerated the deterioration of the pavement (2). The probable cause of
the low air content is believed to be excessive vibration during paving. Since this was the only
known instance of excessive vibration, no additional studies about vibrator consolidation of slip
form pavers were initially conducted.
3
A second cracking pattern began to emerge during the following years on the US 20 project.
Longitudinal cracks spaced at about 0.6 m (2 ft) began to appear in the pavement (Figure 1). The
transverse distance between the cracks is very similar to the spacing of the vibrators on the paver
used for the project.
During this same time interval, a similar longitudinal cracking pattern was noticed on Interstate 80
in Dallas County (Figure 2). This roadway was also three years old when longitudinal cracking
was first identified. These cracks were spaced at intervals that approximated the transverse
spacing of vibrators. Cores taken from the longitudinal cracks indicated air contents of 3 percent
in the top half of the core and 6 percent in the bottom half The longitudinal cracking pattern and
the reduced air content indicated the possibility of excessive vibration, since the vibrators were
positioned near the top of the pavement.
In other areas in the state of Iowa, longitudinal trails can be observed in the surface of some PCC
pavement projects. These trails run parallel to each other with a spacing similar to the spacing of
vibrators on pavers (Figure 3). This longitudinal disconformity of the pavement was termed
Steffes, R.F., Tymkowicz, S. W.
vibrator trail. These vibrator trails were also observed in both the US 20 pavement and the l-80
pavement.
Vibrator trails are believed to be formed by the excessive vibration of concrete. The excessive
vibration causes the paste content to increase in the localized area of the vibrator. This zone of
increased paste allows the tines of the tining machine to penetrate deeper into the surface of the
pavement, thus forming a longitudinal distortion of the pavement surface (Figure 4). Also,
vibrator trails can be found below the surface when taking cores from the pavement. If the
vibrator trail is slightly below the surface, it can become exposed by diamond grinding off the
surface material during the removal of a bump (Figure 5,6). In this case the exposed surface has
longitudinal bands where the pavement has reduced coarse aggregate due to excessive vibration.
RESEARCH
4
As a result of these observations, a research project was initiated in 1995 to evaluate the practices
of vibration during slip form PCC paving and to determine the effect of vibration on the air
content of the pavement. The primary items studied for their effect on air content were vibrator
frequency, paver speed, and transverse location relative to a vibrator. The research was
conducted on three separate interstate paving projects. On each project a test section was paved
where the paver speed was recorded and vibrator frequencies were set to known values. The
transverse location of each vibrator was carefully measured, so the relative position of the vibrator
to the location of a core would is known.

---------- i
Steffes; RF., Tymkowicz, S.W.
Experiment Design·
5
The test sections were designed to have six divisions. The test sections were a matrix of two
paver speeds and three vibrator frequencies. The speeds selected were the normal paver speed
and a slow speed which was set at half the normal paver speed. Because the normal speed for the
pavers was found to be 1.2 to 2.1 m (4 to 7 ft) per minute, the normal speed was set at 1.5 m
(5 ft) per minute. The three vibrator frequencies were 5000, 6500, and 8000 vpm. This range
was used because the Iowa Department of Transportation specifies that internal vibrators on slip
form pavers must operate within the range of 5000 to 8000 vpm. This range was established to
prevent the formation of vibrator trails and was based on preliminary work conducted during the
summer of 1994.
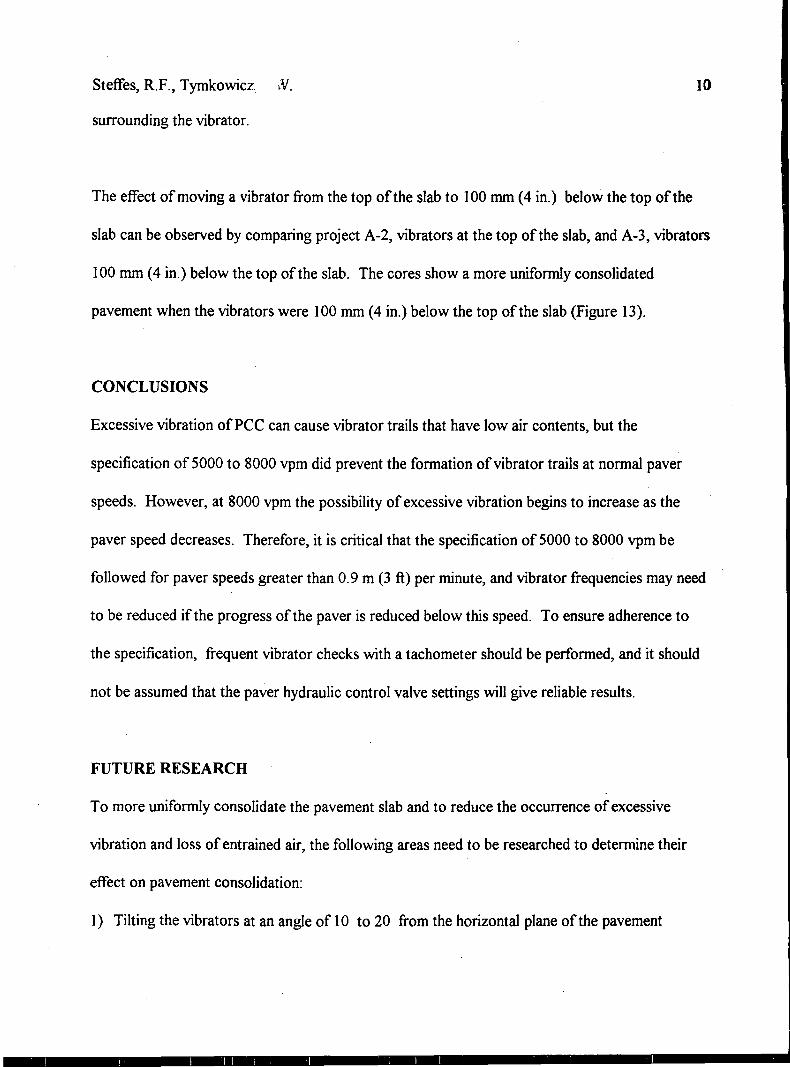
A consecutive pair of vibrators was selected to be controlled at the indicated test frequency. This
allowed cores to be taken in the vibrator trail and at the midpoint between the two controlled
vibrators (Figure 7). The other vibrators on the paver were maintained at their normal operational
frequency set by the contractor. The frequency of these vibrators was also recorded. In some
instances this allowed a comparison between a vibrator set within specification and a vibrator that
was found operating outside the specified range of 5000 to 8000 vpm.
Three cores were taken from both the vibrator trail and between the vibrator trails in each
division. The cores were cut into thirds to determine the air content of the top, middle, and
bottom portion of each core. Air content results were obtained through high pressure testing by
Iowa Department of Transportation test method number Iowa 407-B. A vertical slice was taken

Steffes, R.F., Tymkowicz, S.W. 6
off each core prior to the high pressure air test for possible image analysis testing.
General Information
Careful measurements were taken of the vibrator spacing, vibrator location relative to the edge of
the pavement, and vibrator location relative to the pan of the paver. The brand and model of each
vibrator was documented. In addition, mix design, weather conditions, type of paver, tilt of the
vibrators relative to the pavement surface, type of base, pavement design thickness, and slump
were recorded. These factors were held as constant as possible for each individual project.
PCC CONSOLTUATION PRACTICES
The paving practices of each of the three contractors was observed prior to the construction of
the test sections. The items most carefully observed during this time were the number and
location of vibrators, the types of vibrators used, the operating frequency of the vibrators, and the
speed of the paver. This allowed an opportunity to observe and compare the normal paving
operations of the contractors (Table 1).
Vibrator Frequencies
Vibration readings were found to vary substantially on each of the pavers. A difference of 3000
vpm from the slowest vibrator frequency to the highest vibrator frequency was typical. The
hydraulic control valves of individual vibrators commonly allowed a variation of several thousand
vpm for valves at the same numeric setting. Vibration readings were often found to be outside the
specified limits of 5000 to 8000 vpm. In most cases when the frequency was outside the

Steffes, R.F., Tymkowicz, S.W. 7
specification, the frequency was above the specified limit. In one instance a vibrator was found to
be operating at 12000 vpm.
Vibrator Positioning
Inspection of the pavers revealed that, in most cases, the vibrators were positioned at the level of
the paver's pan and in a horizontal position. However, some pavers had a large variation in the
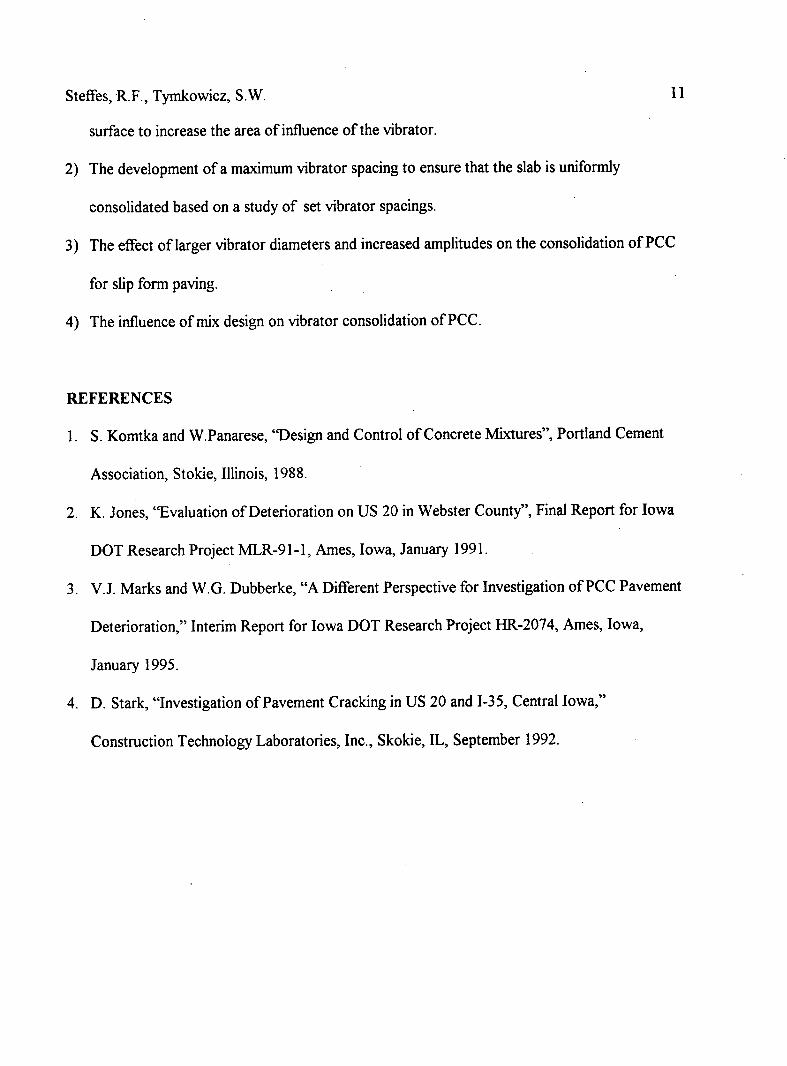
horizontal position of the vibrators. In one case the center of the vibrators ranged from 50 mm (2
in.) above the pan to 75 mm (3 in.) below the pan (Figure 8). In another case, a paver operator
indicated the vibrators were at the pan level; however, evidence from cores showed the vibrators
were as far as 125 mm ( 5 in.) below the pan. The change in position can occur from an inaccurate
position indicator, sag due to oil leakage in the hydraulic system which holds the vibrators up, or
loose bolts that hold an individual vibrator in position.
Placing the vibrators parallel to the pavement surface also minimizes the frontal area or cross
sectional area of the vibrator. In this position the possibility of excessive vibration is increased
since all the available energy from a vibrator is applied to a minimum cross sectional area of
concrete.
RESULTS
The results of this research are based on two primary factors. The first was visual observation.
The cores from the project were carefully inspected for consolidation and aggregate distribution.
The second factor was hard air testing to determine the entrained air content of the concrete.

Steffes, R.F., Tymkowicz, : 8
Visual Observations of Co: , :;
Observations from PCC cores taken on and between the vibrator trails indicate the radius of
effective consolidation from the vibrator may be smaller than many claim. The cores commonly
show significant entrapped air Within a 100 mm (4 in.) of the vibrator location. One noticeable
case of this was on project B (Figure 9). The vibrator was positioned at the top of the slab. The
test variables used in this case were slow paver speed, vibrator frequency of 8000 vpm, and on the
vibrator trail. This test section had the condition of maximum consolidation energy for the
project. The 3 cores taken from this test section show an area of aggregate separation
approximately 25 mm (I in.) below the top of the cores. This separation is starting to show the
formation of a vibrator trail. However, this consolidation effort still is leaving entrapped air only
100 mm (4 in.) from the area of segregated concrete. Similarly, on project C where a vibrator
was running at 12000 vpm entrapped air is located within 100 mm ( 4 in.) of areas of excessive
vibration (Figure I 0). In this case the vibrator was 125 mm (5 in.) below the pavement surface.
A vibrator trail can be clearly seen passing through the core, yet entrapped air can be found in the
bottom third of the cores taken in this vibrator trail.
Visual observations also revealed that the cores from the 5000 vpm test sections had significantly
more entrapped air than the 6500 and 8000 vpm test sections, especially under the test conditions
of normal paving speed. The impact of this increased entrapped air was not studied, but it
appears that the frequency of a vibrator should not be below 5000 vpm to ensure adequate
consolidation.
Steffes, R.F., Tymkowicz, S.W.
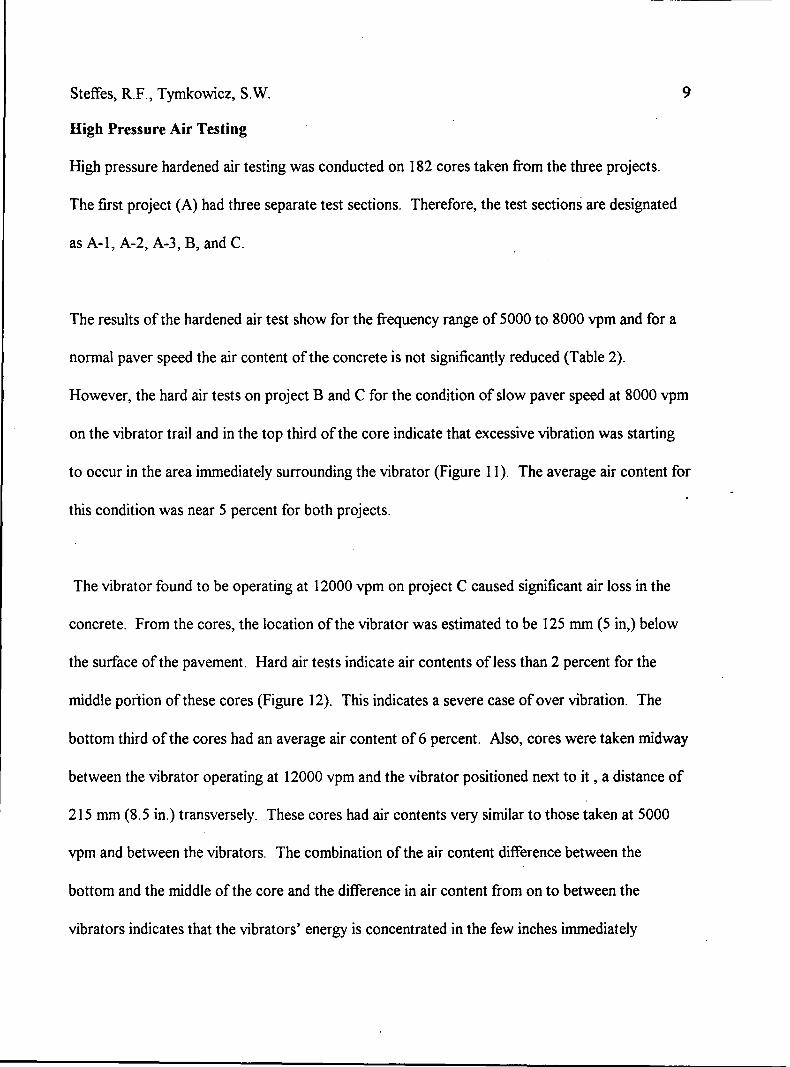
High Pressure Air Testing
High pressure hardened air testing was conducted on 182 cores taken from the three projects.
The first project (A) had three separate test sections. Therefore, the test sections are designated
as A-1, A-2, A-3, B, and C.
The results of the hardened air test show for the frequency range of 5000 to 8000 vpm and for a
normal paver speed the air content of the concrete is not significantly reduced (Table 2).
9
However, the hard air tests on project B and C for the condition of slow paver speed at 8000 vpm
on the vibrator trail and in the top third of the core indicate that excessive vibration was starting
to occur in the area immediately surrounding the vibrator (Figure 11 ). The average air content for
this condition was near 5 percent for both projects.
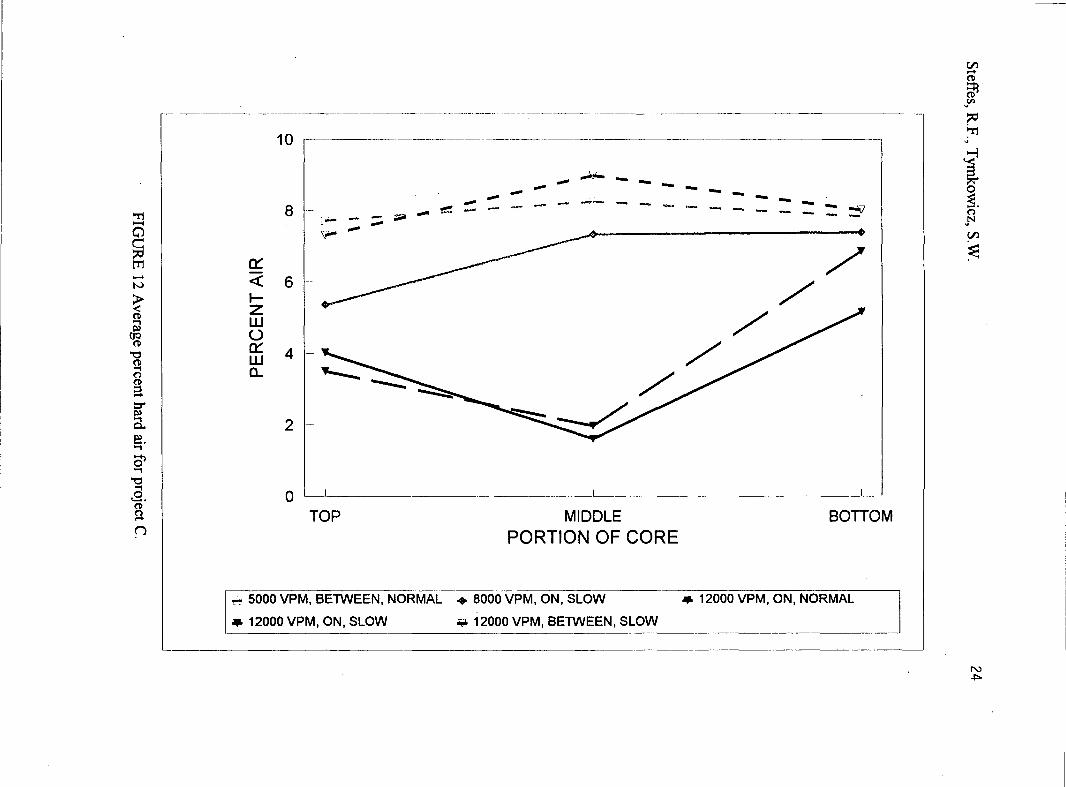
The vibrator found to be operating at 12000 vpm on project C caused significant air loss in the
concrete. From the cores, the location of the vibrator was estimated to be 125 mm (5 in,) below
the surface of the pavement. Hard air tests indicate air contents of less than 2 percent for the
middle portion of these cores (Figure 12). This indicates a severe case of over vibration. The
bottom third of the cores had an average air content of 6 percent. Also, cores were taken midway
between the vibrator operating at 12000 vpm and the vibrator positioned next to it , a distance of
215 mm (8.5 in.) transversely. These cores had air contents very similar to those taken at 5000
vpm and between the vibrators. The combination of the air content difference between the
bottom and the middle of the core and the difference in air content from on to between the
vibrators indicates that the vibrators' energy is concentrated in the few inches immediately
Steffes, R.F., Tymkowicz, N.
surrounding the vibrator.
10
The effect of moving a vibrator from the top of the slab to I 00 mm ( 4 in.) below the top of the
slab can be observed by comparing project A-2, vibrators at the top of the slab, and A-3, vibrators
100 mm (4 in.) below the top of the slab. The cores show a more uniformly consolidated
pavement when the vibrators were 100 mm (4 in.) below the top of the slab (Figure 13).
CONCLUSIONS
Excessive vibration of PCC can cause vibrator trails that have low air contents, but the
specification of 5000 to 8000 vpm did prevent the formation of vibrator trails at normal paver
speeds. However, at 8000 vpm the possibility of excessive vibration begins to increase as the
paver speed decreases. Therefore, it is critical that the specification of 5000 to 8000 vpm be
followed for paver speeds greater than 0.9 m (3 ft) per minute, and vibrator frequencies may need
to be reduced if the progress of the paver is reduced below this speed. To ensure adherence to
the specification, frequent vibrator checks with a tachometer should be performed, and it should
not be assumed that the paver hydraulic control valve settings will give reliable results.
FUTURE RESEARCH
To more uniformly consolidate the pavement slab and to reduce the occurrence of excessive
vibration and loss of entrained air, the following areas need to be researched to determine their
effect on pavement consolidation:
I) Tilting the vibrators at an angle of I 0 to 20 from the horizontal plane of the pavement
Steffes, RF., Tymkowicz, S.W.
surface to increase the area of influence of the vibrator.
2) The development of a maximum vibrator spacing to ensure that the slab is uniformly
consolidated based on a study of set vibrator spacings.
11
3) The effect of larger vibrator diameters and increased amplitudes on the consolidation of PCC
for slip form paving.
4) The influence of mix design on vibrator consolidation of PCC.
REFERENCES
1. S. Komtka and W .Panarese, ''Design and Control of Concrete Mixtures", Portland Cement
Association, Stokie, Illinois, 1988.
2. K. Jones, ''Evaluation of Deterioration on US 20 in Webster County", Final Report for Iowa
DOT Research Project MLR-91-1, Ames, Iowa, January 1991.
3. V.J. Marks and W.G. Dubberke, "A Different Perspective for Investigation ofPCC Pavement
Deterioration," Interim Report for Iowa DOT Research Project HR-2074, Ames, Iowa,
January 1995.
4. D. Stark, "Investigation of Pavement Cracking in US 20 and I-35, Central Iowa,"
Construction Technology Laboratories, Inc., Skokie, IL, September 1992.

Steffes, R.F., Tymkowicz, S.W.
FIGURE CAPTIONS
1. Longitudinal and joint cracking on US 20 in Webster County
2. Longitudinal crack on I-80 in Dallas County
3. Vibrator trail in pavement surface on US 65 in Polk County
4. Distortion of pavement surface in a vibrator trail
5. Longitudinal distortion in the surface of a diamond ground pavement
6. Aggregate separation in the vibrator trail in a diamond ground pavement
7. Location of cores relative to vibrator trails
8. Variation in elevation of vibrators
9. Cores from project B showing aggregate separation near the top
10. Cores from project C revealing a vibrator trail
13 )'(. Average percent hard air for projects B & C
12. Average percent hard air for project C
It Y. Average percent hard air for projects A-2 & A-3
12

Steffes, R.F., Tymkowicz .:,.W. 13
FIGURE I Longitudinal and joint cracking on US 20 in Webster County.

Steffes, R.F., Tymkowicz, S. W. 14
FIGURE 2 Longitudinal crack on 1-80 in Dallas County.

Steffes, R.F., Tymkowicz, S.W. 15
FIGURE 3 Vibrator trail in pavement surface on US 65 in Polk County.

Steffes, R.F., Tymkowicz, S.W. 16
FIGURE 4 Distortion of pavement surface in a vibrator trail.

Steffes, R.F., Tymkowicz, S.W. 17
FIGURE 5 Longitudinal distortion in the surface of a diamond ground pavement.

Steffes, R.F., Tymkowicz, S.W. 18
FIGURE 6 Aggregate separation in the vibrator trail in a diamond ground pavement.
Steffes, RF
., Tyrnkow
icz, S.W.
"O ())
()) C
l) +
C
l) ())
0 ....
a..1 0 ....
c 0
0 c
u
.... .0
.r::. ·-
O> >
:J
())
0 ........ ()) .r::.
.r::. t-
3
FIG
UR
E 7 L
ocation of cores relative to vibrator trails. c
~
()) 0
()) +
-
~ 2
+-
.0
()) ·a
l >
19
Steffes, R.F., Tymko}Vicz, S.W. 20
FJGURE 8 Variation in elevation of vibrators on a slip fonn paver.

Steffes, RF.: Tymkowicz, S
ON VIBRATOR 8000 VPM
SLOW PAVER SPEED VIBRATORS O" DOWN
FIGURE 9 Cores from project B showing aggregate separation near their top.
21

Steffes, R.F., Tymkowicz, S.W.
ON VIBRATOR 12000 VPM
BETWEEN VIBRATORS
FIGURE 10 Cores from project C revealing aggregate segregation in a vibrator trail.
22

"Tl -0
~ ......
> < ('ti ..., I»
(JQ ('ti
'"O ('ti ..., (") ('ti
a ::r I» ..., 0..
e? . ..., CP ...,
'"O ..., .9. ('ti (") ...+ C,f.>
~ N
~
> I w
·-----~--·---~-·------------------------------·
a:: <( ..... z w (.) a:: w a..
12 -------------~----------------·--· ---------·---------,
------ - - ..{]
10 -
-c;;;o- --8 -- --6 -..--··
4 -
2 -
0 TOP
-_.. - ..--- ----!: :: ~
~
MIDDLE
PORTION OF CORE
-
Eil A-3, 5000 VPM, BElWEEN VIBRATORS, NORMAL SPEED • A-3, 8000 VPM, ON VIBRATOR, SLOW SPEED
- A-2, 5000 VPM, BElWEEN VIBRATORS, NORMAL SPEED + A-2, 8000 VPM, ON VIBRATOR, SLOW SPEED ~-------------------~------
BO TI OM
i ~. Jl
N w
----------------
Steffes, R
.F., T
ymkow
icz, S.W.
24
::?i 0
~f ~
...J 0
<(
If m
:::?: 0:::
II 0 z
I I z 0
I f
:::?: ll.
I f
>
0
I 0 0 N
......
I ..
I w
0:::
s: I
0 0
I 0
...J
W
LL
en
~ r
BO
I~ lli I
l O
z
...J ~I
\ l
::?i 0 en z
w
t-aJ
\ i
0::: 0
:::?:
\ I
0 :::?:
ll. a..
ll. >
>
0
\ l 0
0 0
0 0
N
\1 co
.......
+
Li' \i
7 ...J
' <
( :::?: 0:::
~
I 0 z
l\ z s: w
0
l \
J w
...J
~ en
a.. z
0 w
0
I-aJ
:i :i
ll. 0
CX)
co ""2'
C\I
0 ll.
>
...... >
0
0 0
~IV' 1N38~3d
0 0
0 N
Ill
...... I: ..
FIG
UR
E 12 A
verage percent hard air for project C.

'T1 -0
~ \.;.)
> < 0 ...,
cfO 0
"O 0 ..., 0 0 ::l ..... ::r I» ..., Q.
e?. ..., ~ ..., "'ti ...,
..2. 0 0 ..... f.I)
b:l Ro (")
------------------------------------·~------------- ·-·-----·------------------------------------
10 -----------------------------------------------·-----------------------
~ :::: ~ -8 - - - - -- --- ::;=i [3- - -~
0::: --<( 6 -
I-z w () 0::: 4 -w a..
2
0 I ----
TOP MIDDLE BO TI OM PORTION OF CORE
- PROJECT B, 5000 VPM, BETWEEN, NORMAL SPEED + PROJECT B, 8000 VPM, ON, SLOW SPEED
El PROJECT C, 5000 VPM, BETWEEN, NORMAL SPEED • PROJECT C, 8000 VPM, ON, SLOW SPEED
------------·
N 0'1

Steffes, R.F., Tymkowicz, S.W.
TABLE TITLES
I. Paver and Project Data
26
2. Average Hard Air Results for Minimum and Maximum Consolidation Effort on Each Project

TABLE 1 Paver and Project Data
frQj~Qt A-1 A-2 Number of vibrators 22 22 Maximum spacing between vibrators (mm) 460 460 Minimum spacing between vibrators (mm) 230 230 Spacing between test vibrators (mm) 410 410 Vibrator centrifugal force at 10,000 vpm (N) 7870 7870 Vibrator elevation below paver pan (mm) 0 0 Design thickness of pavement (mm) 300 300 Design width of pavement (m) 7.9 7.9 Iowa mix design number C-3WR-C20 C-3WR-C20
A-3 B 22 17 460 660 230 360 380 660 7870 5560 100 0 300 300 7.9 7.9 C-3WR-C20 C-4WR-C20
c 15 740 360 360 7870 0 300 7.9 C-3WR-C20
en ...+ CD
~ vtll
:;:d
~ v
j 0
~-0
VN
en
~
N -....J

TABLE2 Average Hard Air Results for Minimum and Maximum Consolidation Effort on Each Project
Project Vibrator Location Relative Paver Average Percent Air in Cores Frequency to Vibrators Speed Top Middle Bottom
A-1 5000 Between Normal 9.2 10.7 10.7 A-1 8000 On Normal 8.4 9.2 9.9 A-2 5000 Between Normal 7.9 10.3 9.5 A-2 8000 On Slow 6.5 7.2 10.8 A-3 5000 Between Normal 8.5 10.3 11.2 A-3 8000 On Slow 6.3 5.9 8.9 B 5000 Between Normal 7.3 8.1 8.0 B 8000 On Slow 5.2 6.4 6.9 c 5000 Between Normal 7.7 8.3 7.9 c 8000 On Slow 5.4 7.3 7.4 c 12000 Between Slow 7.3 9.0 8.0 c 12000 On Slow 4.0 1.6 5.2 c 12000 On Normal 3.5 2.0 6.9
(/)
c+ ro
. -ti -ti ro Ul ~
:;:o . ...,,
-I '< 3 7' 0 :;: -'· (")
N ~
(/)
:::;::
N CX>
Related Documents