Research Article Vibration-Based Damage Identification and Condition Monitoring of Metro Trains: Warsaw Metro Case Study Alicja Kowalska-Koczwara , 1 Filip Pachla , 1 Piotr Stecz, 1 Krzysztof StypuBa, 1 Tadeusz Tatara, 1 Jerzy Lejk, 2 and Marek SokoBowski 2 1 Cracow University of Technology, Warszawska 24 St., 31-155 Cracow, Poland 2 Metro Warszawskie Sp. z o. o., Wilczy D´ oł 5 St., 02-798 Warsaw, Poland Correspondence should be addressed to Filip Pachla; [email protected] Received 18 December 2017; Accepted 31 March 2018; Published 10 May 2018 Academic Editor: Rafał Burdzik Copyright © 2018 Alicja Kowalska-Koczwara et al. is is an open access article distributed under the Creative Commons Attribution License, which permits unrestricted use, distribution, and reproduction in any medium, provided the original work is properly cited. e work concerns the monitoring of the technical condition of metro trains. For this purpose, a vibration monitoring system installed in buildings in the vicinity of the underground is used. Based on measured vibrations buildings, the identification of technical condition in metro trains is conducted. e results of measurements from the system are also used to assess the impact of vibrations on people staying in buildings through the WODL ratio. Exceeding the assumed levels of the WODL ratio is the basis for repairing trains by turning wheels. Statistical analysis of the data was implemented and trends for particular time periods of measurements were shown. With the entered monitoring system and the introduced WODL index thresholds, it is possible to better plan the costs associated with the repair and replacement of wheels of rolling stock, where there are large values of radial runout. According to the introduced monitoring procedure, the number of complaints from residents decreased and the comfort of their lives improved. 1. Introduction e vibration monitoring system in civil engineering mainly concerns two aspects: structural health monitoring [1–4] and ambient or seismic vibration monitoring [5–7]. ere are relatively few articles that address the issue of monitoring vibrations in buildings from existing road, rail, or metro infrastructure. Investigators are concerned about short-term monitoring [8] or vibrations, which are measured on the ground [9] or in the tunnel [10] and eventually the building model is excited by recorded signals [11]. It is worth noting that the building structure exposed to vibrations is investi- gated by researches, while human perception of vibrations is a decisive parameter of evaluation. People are more sensitive to vibrations than building structures are, especially when these vibrations occur oſten, although they are not very strong. ese kinds of situations occur in buildings located close to the road, railway, tramway, or subway. Oſten, during the designing or the building of these urban infrastructures, human perception of vibrations throughout these buildings located is not taken into account [12, 13]. Furthermore, the exploitation of this parameter of evaluation is not monitored. Meanwhile, this existing infrastructure has become older, sometimes infrastructures conditions change (due to traffic increases or changing of train or tram types), and some of its elements become slightly damaged, all of which can influence human perception of vibrations. It is impossible to change the location of an existing urban infrastructure. e vibration monitoring system can provide solutions to the necessary infrastructure design (i.e., by introducing additional vibroinsulation [14, 15]). Some small repairs in the existing infrastructure system are sufficient to ensure vibrational comfort in buildings located nearby. A few years aſter the opening of its first metro line, War- saw Metro owners observed a growing number of complaints from the residents of neighbouring buildings. is prompted Hindawi Shock and Vibration Volume 2018, Article ID 8475684, 14 pages https://doi.org/10.1155/2018/8475684

Welcome message from author
This document is posted to help you gain knowledge. Please leave a comment to let me know what you think about it! Share it to your friends and learn new things together.
Transcript
Research ArticleVibration-Based Damage Identification andCondition Monitoring of Metro Trains: Warsaw MetroCase Study
Alicja Kowalska-Koczwara ,1 Filip Pachla ,1 Piotr Stecz,1
Krzysztof StypuBa,1 Tadeusz Tatara,1 Jerzy Lejk,2 andMarek SokoBowski2
1Cracow University of Technology, Warszawska 24 St., 31-155 Cracow, Poland2Metro Warszawskie Sp. z o. o., Wilczy Doł 5 St., 02-798 Warsaw, Poland
Correspondence should be addressed to Filip Pachla; [email protected]
Received 18 December 2017; Accepted 31 March 2018; Published 10 May 2018
Academic Editor: Rafał Burdzik
Copyright © 2018 Alicja Kowalska-Koczwara et al. This is an open access article distributed under the Creative CommonsAttribution License, which permits unrestricted use, distribution, and reproduction in any medium, provided the original work isproperly cited.
The work concerns the monitoring of the technical condition of metro trains. For this purpose, a vibration monitoring systeminstalled in buildings in the vicinity of the underground is used. Based on measured vibrations buildings, the identification oftechnical condition in metro trains is conducted. The results of measurements from the system are also used to assess the impactof vibrations on people staying in buildings through theWODL ratio. Exceeding the assumed levels of the WODL ratio is the basisfor repairing trains by turning wheels. Statistical analysis of the data was implemented and trends for particular time periods ofmeasurements were shown.With the enteredmonitoring system and the introducedWODL index thresholds, it is possible to betterplan the costs associated with the repair and replacement of wheels of rolling stock, where there are large values of radial runout.According to the introduced monitoring procedure, the number of complaints from residents decreased and the comfort of theirlives improved.
1. Introduction
The vibration monitoring system in civil engineering mainlyconcerns two aspects: structural health monitoring [1–4] andambient or seismic vibration monitoring [5–7]. There arerelatively few articles that address the issue of monitoringvibrations in buildings from existing road, rail, or metroinfrastructure. Investigators are concerned about short-termmonitoring [8] or vibrations, which are measured on theground [9] or in the tunnel [10] and eventually the buildingmodel is excited by recorded signals [11]. It is worth notingthat the building structure exposed to vibrations is investi-gated by researches, while human perception of vibrations is adecisive parameter of evaluation. People are more sensitive tovibrations than building structures are, especially when thesevibrations occur often, although they are not very strong.These kinds of situations occur in buildings located closeto the road, railway, tramway, or subway. Often, during the
designing or the building of these urban infrastructures,human perception of vibrations throughout these buildingslocated is not taken into account [12, 13]. Furthermore, theexploitation of this parameter of evaluation is not monitored.Meanwhile, this existing infrastructure has become older,sometimes infrastructures conditions change (due to trafficincreases or changing of train or tram types), and someof its elements become slightly damaged, all of which caninfluence human perception of vibrations. It is impossibleto change the location of an existing urban infrastructure.The vibration monitoring system can provide solutions tothe necessary infrastructure design (i.e., by introducingadditional vibroinsulation [14, 15]). Some small repairs inthe existing infrastructure system are sufficient to ensurevibrational comfort in buildings located nearby.
A few years after the opening of its first metro line, War-sawMetro owners observed a growing number of complaintsfrom the residents of neighbouring buildings.This prompted
HindawiShock and VibrationVolume 2018, Article ID 8475684, 14 pageshttps://doi.org/10.1155/2018/8475684

2 Shock and Vibration
Acce
lera
tion
(cm
/s2) -
2 4 6 8 10 12 14 160Time (s)
−5−2.5
02.5
5P0
6zMeasurement no. 1 – Metro 2:13 p.m.
(a)
Am
plitu
de (c
m/s
2) -
25 50 75 100 125 1500Frequency (Hz)
00.05
0.10.15
0.2
P06z
Measurement no. 1 – Metro 2:13 p.m.
(b)
Figure 1: Exemplary record of vertical component of the floor apartment vibrations and its FFT analysis.
scientists and engineers from the Cracow University ofTechnology to design and build the vibration monitoringsystem. The basis for building the monitoring system was tounderstand the phenomenon related to the propagation ofvibration for shallow subways.The vibrations generatedwhenthe wheel comes into contact with the rail are propagatedthrough the subway tunnel and ground, which are thentransmitted to buildings located near the metro line. Somenumerical and analytical solutions of the contact problembetween the rail and wheel can be found in literature, forexample, [16–19]. In these paper authors focused on exper-imental solution of the problem. A point of focus for theWarsaw Metro is the human perception of vibrations, but itis worth noting that for these shallow subways, vibrations areperceived to be larger on lower floors.This was the most crit-ical observation which has contributed towards building thesystem. Human sensitivity to the vertical vibrations of floors,in some buildings located near metro line, was particularlyevident in the preconstructionmeasurements.The sensitivityof individual floors depends on their dynamic characteristics,which is contingent on their floor structure, stiffness, anddimensions. These three factors made it necessary to selectrepresentativemeasurements points within buildings that arenot always located close to the metro tunnel. Monitoring thehuman perception of vibrations of each metro train helpsWarsaw Metro owners to determine which trains shouldcontinue operating and those that should not. This paperdescribes the observations and analysis of this monitoringsystem between 2003 and 2011.
After proper verification of the system developed by theauthors, other proposals of systems appeared [20]. Anotherway for evaluation of the vibration impacts in the transportinfrastructure environment was presented in [21].
2. System Description
The monitoring system was developed at the Institute ofStructural Mechanics at Cracow University of Technology.This system allows for constant monitoring of vibrations.Based on the measured vibrations in three selected buildings,the identification of the technical condition of metro trainsis performed. The vibrations generated when the wheelcomes into contact with the rail are transferred through thetunnel structure and the ground, around the building, andclose to the metro line. Previous experience shows that the
Acce
lera
tion
(cm
/s2) -
−5−2.5
02.5
5
P06
2 4 6 8 10 12 14 160Time (s)
Measurement no. 1 – Metro 2:13 p.m.
X
Y
Z
Figure 2: Relations between horizontal and vertical components ofvibrations recorded at the ceiling of the building M22A.
wheel’s profile has a significant influence on the level ofvibrations. Therefore, these vibrations are a source of dis-comfort for the people in buildings close to the metro lines.The perception of vibrations by humans in the buildingsis a complex problem, and it depends on, for example, theceiling structure, its stiffness, and dimensions. Therefore, itis important to select the accurate, representative position ofsensors in the buildings.
In the presented system, developed for theWarsawmetroline, the results of analysis, in relation to the comfort limitsrequired for the people, constitute the criterion for evaluatingthe admissibility of the train for further operation [22].Continuousmonitoring of the vibration caused by each of thepassing trains allows the individual trains to be eliminatedbefore the vibration limit is reached. Moreover, these trainscan be removed from operation before any complaint fromthe residents of the buildings near the subway line occurs.The accelerometer is mounted on the floor of the room in thebuilding and is used to measure the vertical vibrations of theceiling. Exemplary record of vertical component of the floorapartment vibrations and corresponding FFT are presentedin Figure 1. Horizontal components were also measuredbut the level of maximum values of vibrations is smallercompared with the vertical component (see Figure 2). Theresults of analyses concerning these components are thereforenot presented at work. It can be found in the [22], where datanot presented in the paper was showed.
Signal vibration is triggered by the signal transmitted(wireless) from the measuring point located in the tunnel,triggering the registration with a photocell when passing a
Shock and Vibration 3
Symbol
A4Z
A5X
G6Z
Metro tunnel
Building
Measuring modulesData buffer
PC1Data registration
and analysis
A2X
A1ZA3Zs
Internet
ComputerData storageMetro station
Temperaturesensor
GateIR no. 1
Gate IR no. 2 Trains no. from metro
communication system
Fiber optic
A5XA4Z
G6Z
Measuring modulesData buffer
PC2Data registration
and analysis DescriptionM 393 B12 accelerometer
Direction Z – substructureM 393 B12 accelerometer
Direction X – substructureLF-24 geophone
Direction Z – substructure
Symbol
A1Z
A2X
A3Z
DescriptionM 393 B12 accelerometer
Direction Z – foundation wallM 393 B12 accelerometer
Direction X – foundation wallLF-24 geophone
Direction Z – floor slab
Figure 3: General plan of the system.
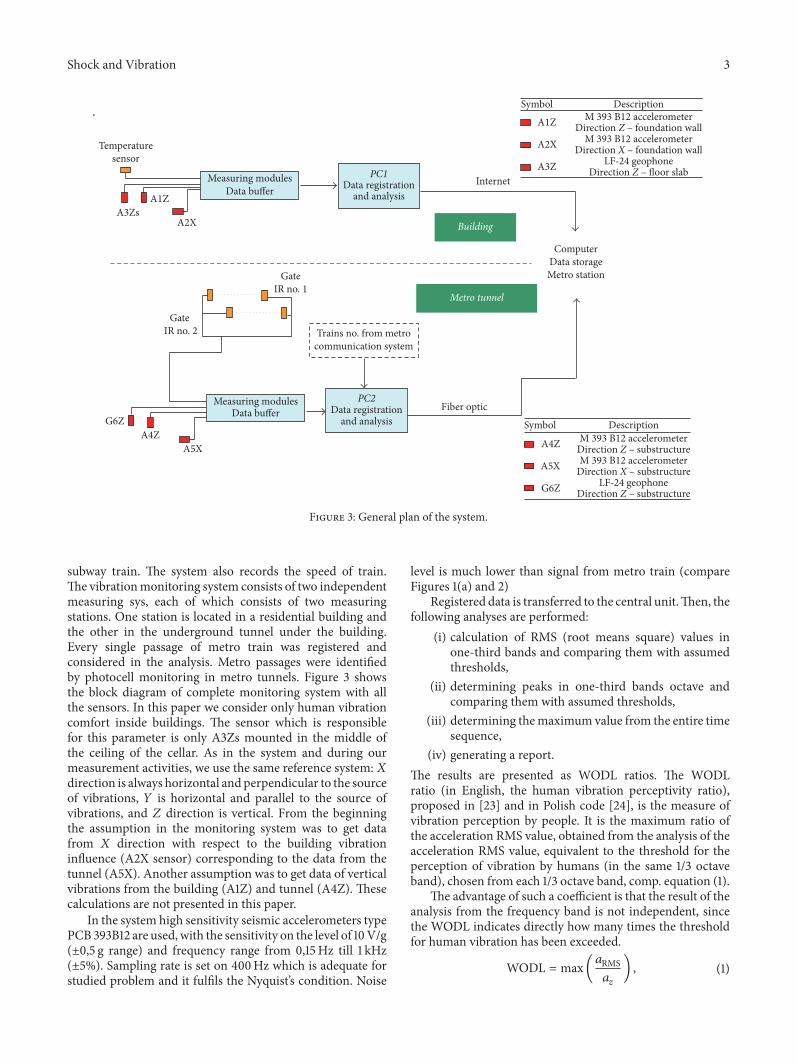
subway train. The system also records the speed of train.The vibrationmonitoring system consists of two independentmeasuring sys, each of which consists of two measuringstations. One station is located in a residential building andthe other in the underground tunnel under the building.Every single passage of metro train was registered andconsidered in the analysis. Metro passages were identifiedby photocell monitoring in metro tunnels. Figure 3 showsthe block diagram of complete monitoring system with allthe sensors. In this paper we consider only human vibrationcomfort inside buildings. The sensor which is responsiblefor this parameter is only A3Zs mounted in the middle ofthe ceiling of the cellar. As in the system and during ourmeasurement activities, we use the same reference system:𝑋direction is always horizontal and perpendicular to the sourceof vibrations, 𝑌 is horizontal and parallel to the source ofvibrations, and 𝑍 direction is vertical. From the beginningthe assumption in the monitoring system was to get datafrom 𝑋 direction with respect to the building vibrationinfluence (A2X sensor) corresponding to the data from thetunnel (A5X). Another assumption was to get data of verticalvibrations from the building (A1Z) and tunnel (A4Z). Thesecalculations are not presented in this paper.
In the system high sensitivity seismic accelerometers typePCB 393B12 are used, with the sensitivity on the level of 10V/g(±0,5 g range) and frequency range from 0,15Hz till 1 kHz(±5%). Sampling rate is set on 400Hz which is adequate forstudied problem and it fulfils the Nyquist’s condition. Noise
level is much lower than signal from metro train (compareFigures 1(a) and 2)
Registered data is transferred to the central unit.Then, thefollowing analyses are performed:
(i) calculation of RMS (root means square) values inone-third bands and comparing them with assumedthresholds,
(ii) determining peaks in one-third bands octave andcomparing them with assumed thresholds,
(iii) determining themaximum value from the entire timesequence,
(iv) generating a report.The results are presented as WODL ratios. The WODLratio (in English, the human vibration perceptivity ratio),proposed in [23] and in Polish code [24], is the measure ofvibration perception by people. It is the maximum ratio ofthe acceleration RMS value, obtained from the analysis of theacceleration RMS value, equivalent to the threshold for theperception of vibration by humans (in the same 1/3 octaveband), chosen from each 1/3 octave band, comp. equation (1).
The advantage of such a coefficient is that the result of theanalysis from the frequency band is not independent, sincethe WODL indicates directly how many times the thresholdfor human vibration has been exceeded.
WODL = max(𝑎RMS𝑎𝑧 ) , (1)

4 Shock and Vibration
(a) (b)
Figure 4: General view of the buildings: (a) N118 and (b) M22.
where 𝑎RMS is acceleration RMS value obtained from analy-sis; 𝑎𝑧 is acceleration RMS value equivalent to the thresholdfor the perception of vibration in a 𝑧 direction in the same 1/3octave band as in 𝑎RMS.
Frequency values corresponding to 1/3 octave bands usedin analysis are equal to 1.25, 1.6, 2, 3.16, . . . , 63, 80, 100 andlisted also in Table 3 of ISO standard [25].
WODL ratios are coefficients calculated according to (1)using RMS basic procedure described in Polish standards [24,26] and in ISO standard [27]. Recorded signals are filteredusing Butterworth low-pass filter with cut-off frequency of120Hz according to requirements described in Polish stan-dard [24].
RMS method averages acceleration values in duration:
𝑎𝑊 = [ 1𝑇 ∫𝑇
0
𝑎2𝑊 (𝑇) 𝑑𝑡]1/2
, (2)
where 𝑎𝑊(𝑇) is weighted acceleration as a function of time[m/s2]; 𝑇 is the duration of measurement [s].
RMS is basic method of evaluation according to ISOstandard [25]. For signals with high crest factor (greaterthan 9), occasional shocks and transient vibration additionalevaluation method like VDV analysis or MTVV analysis arerequired. Vibrations recorded in metro monitoring systemare signals without shocks andwith crest factor below 9 that iswhy RMS method was chosen for analysis and WODL ratioillustrated in most friendly way the percentage of exceedanceof perception threshold of vibration.
Measurements in metro system last 24 hours and about350 dynamical events are registered per day (concerning thetracks closer to the building).Metromanagements care aboutgood relations with residents of the buildings located in zoneof metro dynamic influences. Because of many complaints ofresidents, researchers decided to use duration time of singleevent according to Polish standard [24] in which duration ofvibration is defined as time in which amplitudes are greaterthan 0.2 of maximum value of vibrations. Adoption of suchprocedure is more rigorous than using of the whole record ofvibrations for analysis and results of analyses are moreindependent from arbitral decision where to start and stopanalyses.
3. Influence of Wheels Reprofiling on HumanVibrations in the Buildings
In the case of determining the vibration comfort of peoplein buildings, the decision parameter is the maximum RMSvalues obtained in each one-third octave band from the anal-ysis of the perceived human horizontal and vertical vibrationsof the floors. The influence on the vertical vibration of theceilings has been assumed, since the vibration measurementsgenerated by the metro inWarsaw have indicated that peopleare more sensitive to vertical vibrations of the ceilings [22].The distribution of these values in time can be important fordrawing practical conclusions.
Exemplary results of the analysis are given in this section.The data presented below relates to the selectedmeasurementpoint installed in building N118, as well as building M22 (seeFigure 4).TheN118 building is amasonry residential buildingbuilt in the 1950s. The building has 7 storeys above groundlevel and a basement. The bearing walls are arranged in thelongitudinal direction. In the horizontal plan the building isL-shaped. The dimensions of the building in plan are 25.4mby 72.8m. The distance to the metro tunnel wall is 14.0m.
The M22 building was built in 1936 and survived WorldWar II. It is a masonry residential building. The building hasfour storeys above ground level and a basement. The bearingwalls are arranged in longitudinal direction.The ceiling abovethe basement is dense-ribbed, while those in the upper levelsare Klein type. The dimensions of the building in plan are18.9m by 12.6m. The distance to the metro tunnel wall is19.5m.
Currently, both buildings are being operated. Due to thefunction they perform they are subject to regular reviews.Their technical condition is maintained in proper condi-tion. The sensor installed in the building is also regularlymonitored and calibrated. The results of our experimentalinvestigations show that despite many years of influenceof dynamic loads originating from metro line, there is nosignificant degradation of the buildings stiffness and theirnatural frequencies. Referring to the results of previousexperiments [14, 19, 22, 23] the condition of the wheels isresponsible for increasing vibrations in the buildings in theneighbourhood of metro line.

Shock and Vibration 5
Train no. 18 - building N118
0
0.5
1
1.5
2
2.5
3
WO
DL
[-]
2003
.08.
2720
03.0
9.11
2003
.09.
2620
03.1
0.11
2003
.10.
2620
03.1
1.10
2003
.11.
2520
03.1
2.10
2003
.12.
2520
04.0
1.09
2004
.01.
2420
04.0
2.08
2004
.02.
2320
04.0
3.09
2004
.03.
2420
04.0
4.08
2004
.04.
23
2003
.08.
12
Date
Figure 5: Distribution of WODL values for train number 18 inbuilding N118.
We established that technical condition of the building,ground properties, and the metro tunnel itself are unchange-able in contrary to wheels' condition.
WODL indicator shows the real influence of vibrationson people inside buildings without calculating floors param-eters; the results come from real measurements. The mainidea of this parameter is to measure vibration comfort insidebuildings. It is not necessary to calculate floors parameters;it is just diagnostics indicator. When measuring hundreds offloors, it is impossible to calculate all of their constructions,but using WODL indicator we can in a relative short timequalify if the human vibration comfort is exceeded or it isnormative according to the standard.
Each of the recorded vertical vibrations of the ceiling isautomatically analyzed, according to the Polish code [24],based on the experienced vibration by people. In this section,a more detailed analysis is presented on the daily distributionfor the sensor located on the ceiling. Each passing of the trainis represented by a single point. Within one day, the sametrainmay pass by a sensormany times.There are also days (orweeks) when a train is not in use; therefore, there is no sensorregistration for this train.The individual coloured lines in thegraphs indicate the threshold values defined in the system:
(i) green, 50% limit value of the defined threshold,(ii) yellow, 75% limit value of the defined threshold,(iii) red, 90% limit value of the defined threshold.
The selected train (number 18) was analyzed from 2003 to2011. Figures 5 and 6 present exemplary results from thecontinuous Warsaw Metro vibration monitoring system forthe chosen Metropolis trains. The results presented in Fig-ure 5 were recorded for 8 months (from September 2003 toApril 2004).
More recent results from 2008 (excluding 2009, no datafor continuous monitoring of vibration) until February 2011are presented in Figure 6.The longer the train is in operation,the greater the difference is in WODL value for each day (seeFigure 5). This indicates an increase in radial defects of thewheels. If the train’s wheels reprofile, the daily values of theWODL coefficient are more consolidated in the chart.
Train no. 18 - building no. M22
0.00
0.25
0.50
0.75
1.00
1.25
WO
DL
[-]
2008
.06.
01
2008
.09.
09
2008
.12.
18
2009
.03.
28
2009
.07.
06
2009
.10.
14
2010
.01.
22
2010
.05.
02
2010
.08.
10
2010
.11.
18
2011
.02.
26
2008
.02.
22
Date
Figure 6: Distribution of WODL values for train number 18 inbuilding M22A.
Table 1: Equations of trend function for the examined traincompositions.
Train number Trend equation
18
y = 0.0074x − 281.09y = 0.0143x − 540.70y = 0.0102x − 387.20𝑦 = 0.0014𝑥 − 55.053𝑦 = 0.0007𝑥 − 26.928
This was observed for all analyzed trains. It can beassumed that when the values of WODL are scattered andhigh, usually followed by a sudden decrease in value, itindicates a reprofiling of the wheels. Another characteristicof this reprofiling is manifested when the train presents highWODLvalues, with an increased quantity over a short period.As shown in Figure 5, the WODL value can change by morethan one. Figure 6 shows the results for the M22A buildingfor the previously presented subway train number 18, betweenMarch 2008 and April 2011. Based on the available data,the trend function values for the periods between wheelreprofiling were calculated. This data is presented in Table 1.In the table, the underlined equations indicate the trendsfrom the 2003 to 2004 service life, while the remainingequations display the trends from 2008 to 2011. This data wasanalyzed by calculating the mean value, standard deviationof mean value, and maximum and minimum values for theobtained trend equation coefficients (see Table 2). Linearfunctions were used to describe trends in specific timeperiods because of good fit, in most cases 𝑅2 values arehigher than 0.9, and in other cases they are close to thisvalue. This system is dedicated to use for engineers in theireveryday tasks not only for scientific purposes. Liner trendwas used in case tomaximumsimplify diagnostic conclusionsand characterised good fit with values of the adjustmentcoefficients 𝑅2 (in most cases higher than 0.9).
Based on the data collected from 2003 to 2004, theaverage value of 𝐴 was almost three times larger than inthe period spanning from 2008 to 2011 (comp. Table 2). This
6 Shock and Vibration
Table 2: Statistical analysis of functions of all trends for particular time periods.
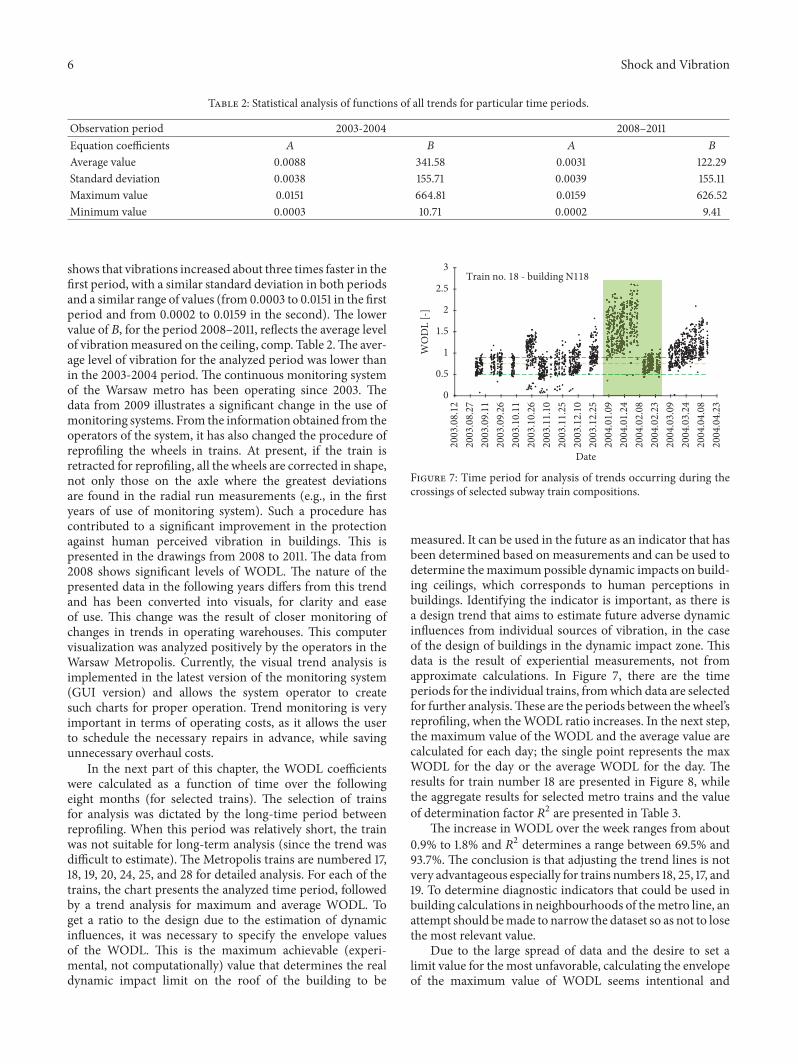
Observation period 2003-2004 2008–2011Equation coefficients 𝐴 𝐵 𝐴 𝐵Average value 0.0088 341.58 0.0031 122.29Standard deviation 0.0038 155.71 0.0039 155.11Maximum value 0.0151 664.81 0.0159 626.52Minimum value 0.0003 10.71 0.0002 9.41
shows that vibrations increased about three times faster in thefirst period, with a similar standard deviation in both periodsand a similar range of values (from 0.0003 to 0.0151 in the firstperiod and from 0.0002 to 0.0159 in the second). The lowervalue of 𝐵, for the period 2008–2011, reflects the average levelof vibrationmeasured on the ceiling, comp. Table 2.The aver-age level of vibration for the analyzed period was lower thanin the 2003-2004 period. The continuous monitoring systemof the Warsaw metro has been operating since 2003. Thedata from 2009 illustrates a significant change in the use ofmonitoring systems. From the information obtained from theoperators of the system, it has also changed the procedure ofreprofiling the wheels in trains. At present, if the train isretracted for reprofiling, all the wheels are corrected in shape,not only those on the axle where the greatest deviationsare found in the radial run measurements (e.g., in the firstyears of use of monitoring system). Such a procedure hascontributed to a significant improvement in the protectionagainst human perceived vibration in buildings. This ispresented in the drawings from 2008 to 2011. The data from2008 shows significant levels of WODL. The nature of thepresented data in the following years differs from this trendand has been converted into visuals, for clarity and easeof use. This change was the result of closer monitoring ofchanges in trends in operating warehouses. This computervisualization was analyzed positively by the operators in theWarsaw Metropolis. Currently, the visual trend analysis isimplemented in the latest version of the monitoring system(GUI version) and allows the system operator to createsuch charts for proper operation. Trend monitoring is veryimportant in terms of operating costs, as it allows the userto schedule the necessary repairs in advance, while savingunnecessary overhaul costs.
In the next part of this chapter, the WODL coefficientswere calculated as a function of time over the followingeight months (for selected trains). The selection of trainsfor analysis was dictated by the long-time period betweenreprofiling. When this period was relatively short, the trainwas not suitable for long-term analysis (since the trend wasdifficult to estimate). The Metropolis trains are numbered 17,18, 19, 20, 24, 25, and 28 for detailed analysis. For each of thetrains, the chart presents the analyzed time period, followedby a trend analysis for maximum and average WODL. Toget a ratio to the design due to the estimation of dynamicinfluences, it was necessary to specify the envelope valuesof the WODL. This is the maximum achievable (experi-mental, not computationally) value that determines the realdynamic impact limit on the roof of the building to be
Train no. 18 - building N118
0
0.5
1
1.5
2
2.5
3
WO
DL
[-]
2003
.08.
2720
03.0
9.11
2003
.09.
2620
03.1
0.11
2003
.10.
2620
03.1
1.10
2003
.11.
2520
03.1
2.10
2003
.12.
2520
04.0
1.09
2004
.01.
2420
04.0
2.08
2004
.02.
2320
04.0
3.09
2004
.03.
2420
04.0
4.08
2004
.04.
23
2003
.08.
12Date
Figure 7: Time period for analysis of trends occurring during thecrossings of selected subway train compositions.
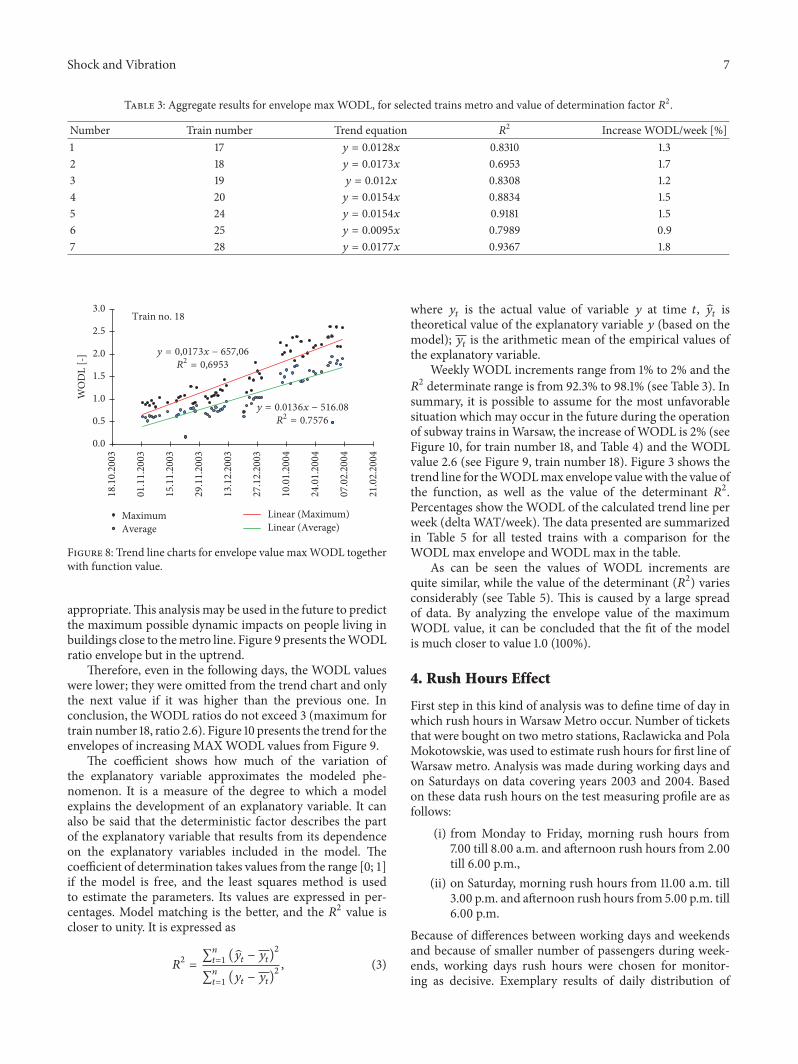
measured. It can be used in the future as an indicator that hasbeen determined based on measurements and can be used todetermine themaximumpossible dynamic impacts on build-ing ceilings, which corresponds to human perceptions inbuildings. Identifying the indicator is important, as there isa design trend that aims to estimate future adverse dynamicinfluences from individual sources of vibration, in the caseof the design of buildings in the dynamic impact zone. Thisdata is the result of experiential measurements, not fromapproximate calculations. In Figure 7, there are the timeperiods for the individual trains, fromwhich data are selectedfor further analysis.These are the periods between the wheel’sreprofiling, when theWODL ratio increases. In the next step,the maximum value of the WODL and the average value arecalculated for each day; the single point represents the maxWODL for the day or the average WODL for the day. Theresults for train number 18 are presented in Figure 8, whilethe aggregate results for selected metro trains and the valueof determination factor 𝑅2 are presented in Table 3.
The increase in WODL over the week ranges from about0.9% to 1.8% and 𝑅2 determines a range between 69.5% and93.7%. The conclusion is that adjusting the trend lines is notvery advantageous especially for trains numbers 18, 25, 17, and19. To determine diagnostic indicators that could be used inbuilding calculations in neighbourhoods of themetro line, anattempt should bemade to narrow the dataset so as not to losethe most relevant value.
Due to the large spread of data and the desire to set alimit value for the most unfavorable, calculating the envelopeof the maximum value of WODL seems intentional and
Shock and Vibration 7
Table 3: Aggregate results for envelope max WODL, for selected trains metro and value of determination factor 𝑅2.Number Train number Trend equation 𝑅2 Increase WODL/week [%]1 17 𝑦 = 0.0128𝑥 0.8310 1.32 18 𝑦 = 0.0173𝑥 0.6953 1.73 19 𝑦 = 0.012𝑥 0.8308 1.24 20 𝑦 = 0.0154𝑥 0.8834 1.55 24 𝑦 = 0.0154𝑥 0.9181 1.56 25 𝑦 = 0.0095𝑥 0.7989 0.97 28 𝑦 = 0.0177𝑥 0.9367 1.8
MaximumAverage
Linear (Maximum)Linear (Average)
Train no. 18
0.0
0.5
1.0
1.5
2.0
2.5
3.0
WO
DL
[-] y = 0,0173x − 657,06
R2 = 0,6953
y = 0.0136x − 516.08
R2 = 0.7576
13.1
2.20
03
15.1
1.20
03
29.1
1.20
03
27.1
2.20
03
18.1
0.20
03
10.0
1.20
04
24.0
1.20
04
21.0
2.20
04
01.1
1.20
03
07.0
2.20
04
Figure 8: Trend line charts for envelope value maxWODL togetherwith function value.
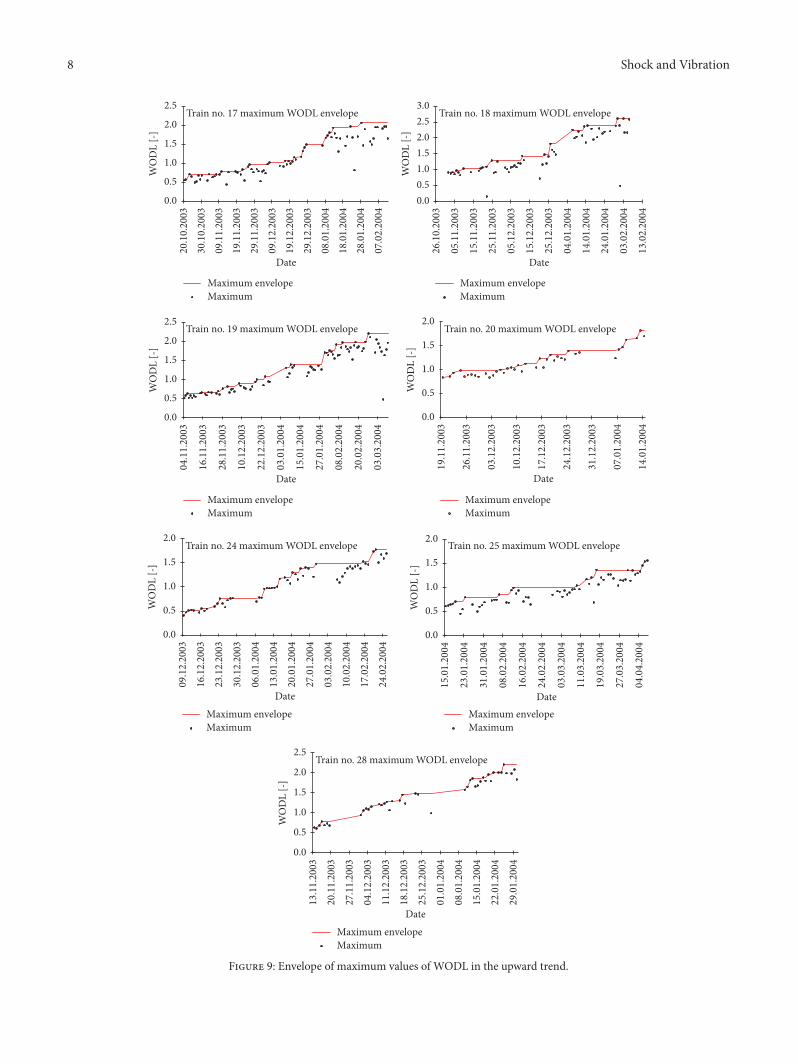
appropriate.This analysis may be used in the future to predictthe maximum possible dynamic impacts on people living inbuildings close to themetro line. Figure 9 presents theWODLratio envelope but in the uptrend.
Therefore, even in the following days, the WODL valueswere lower; they were omitted from the trend chart and onlythe next value if it was higher than the previous one. Inconclusion, the WODL ratios do not exceed 3 (maximum fortrain number 18, ratio 2.6). Figure 10 presents the trend for theenvelopes of increasing MAXWODL values from Figure 9.
The coefficient shows how much of the variation ofthe explanatory variable approximates the modeled phe-nomenon. It is a measure of the degree to which a modelexplains the development of an explanatory variable. It canalso be said that the deterministic factor describes the partof the explanatory variable that results from its dependenceon the explanatory variables included in the model. Thecoefficient of determination takes values from the range [0; 1]if the model is free, and the least squares method is usedto estimate the parameters. Its values are expressed in per-centages. Model matching is the better, and the 𝑅2 value iscloser to unity. It is expressed as
𝑅2 = ∑𝑛
𝑡=1 (𝑦𝑡 − 𝑦𝑡)2∑𝑛𝑡=1 (𝑦𝑡 − 𝑦𝑡)2
, (3)
where 𝑦𝑡 is the actual value of variable 𝑦 at time 𝑡, 𝑦𝑡 istheoretical value of the explanatory variable 𝑦 (based on themodel); 𝑦𝑡 is the arithmetic mean of the empirical values ofthe explanatory variable.
Weekly WODL increments range from 1% to 2% and the𝑅2 determinate range is from 92.3% to 98.1% (see Table 3). Insummary, it is possible to assume for the most unfavorablesituation which may occur in the future during the operationof subway trains inWarsaw, the increase of WODL is 2% (seeFigure 10, for train number 18, and Table 4) and the WODLvalue 2.6 (see Figure 9, train number 18). Figure 3 shows thetrend line for theWODLmax envelope valuewith the value ofthe function, as well as the value of the determinant 𝑅2.Percentages show the WODL of the calculated trend line perweek (delta WAT/week). The data presented are summarizedin Table 5 for all tested trains with a comparison for theWODL max envelope and WODL max in the table.
As can be seen the values of WODL increments arequite similar, while the value of the determinant (𝑅2) variesconsiderably (see Table 5). This is caused by a large spreadof data. By analyzing the envelope value of the maximumWODL value, it can be concluded that the fit of the modelis much closer to value 1.0 (100%).
4. Rush Hours Effect
First step in this kind of analysis was to define time of day inwhich rush hours in Warsaw Metro occur. Number of ticketsthat were bought on two metro stations, Raclawicka and PolaMokotowskie, was used to estimate rush hours for first line ofWarsaw metro. Analysis was made during working days andon Saturdays on data covering years 2003 and 2004. Basedon these data rush hours on the test measuring profile are asfollows:
(i) from Monday to Friday, morning rush hours from7.00 till 8.00 a.m. and afternoon rush hours from 2.00till 6.00 p.m.,
(ii) on Saturday, morning rush hours from 11.00 a.m. till3.00 p.m. and afternoon rush hours from 5.00 p.m. till6.00 p.m.
Because of differences between working days and weekendsand because of smaller number of passengers during week-ends, working days rush hours were chosen for monitor-ing as decisive. Exemplary results of daily distribution of
8 Shock and Vibration
Maximum envelopeMaximum
Train no. 17 maximum WODL envelope
0.0
0.5
1.0
1.5
2.0
2.5
WO
DL
[-]
Maximum envelopeMaximum
Train no. 18 maximum WODL envelope
0.00.51.01.52.02.53.0
WO
DL
[-]
Maximum envelopeMaximum
Train no. 19 maximum WODL envelope
0.0
0.5
1.0
1.5
2.0
2.5
WO
DL
[-]
Maximum envelopeMaximum
Train no. 20 maximum WODL envelope
0.0
0.5
1.0
1.5
2.0
WO
DL
[-]
Maximum envelopeMaximum
Train no. 24 maximum WODL envelope
0.0
0.5
1.0
1.5
2.0
WO
DL
[-]
Maximum envelopeMaximum
Train no. 25 maximum WODL envelope
0.0
0.5
1.0
1.5
2.0
WO
DL
[-]
Maximum envelopeMaximum
Train no. 28 maximum WODL envelope
0.0
0.5
1.0
1.5
2.0
2.5
WO
DL
[-]
30.1
0.20
03
19.1
2.20
03
19.1
1.20
0329
.11.
2003
29.1
2.20
03
20.1
0.20
03
09.1
1.20
03
18.0
1.20
0428
.01.
2004
09.1
2.20
03
07.0
2.20
04
08.0
1.20
04
Date
15.1
2.20
03
15.1
1.20
03
25.1
1.20
03
25.1
2.20
03
26.1
0.20
03
05.1
1.20
03
24.0
1.20
04
14.0
1.20
04
13.0
2.20
04
05.1
2.20
03
04.0
1.20
04
03.0
2.20
04
Date
26.1
1.20
03
24.1
2.20
03
10.1
2.20
03
17.1
2.20
03
31.1
2.20
03
19.1
1.20
03
14.0
1.20
04
03.1
2.20
03
07.0
1.20
04
Date
16.1
1.20
03
28.1
1.20
03
10.1
2.20
03
22.1
2.20
03
27.0
1.20
04
15.0
1.20
04
20.0
2.20
04
04.1
1.20
03
03.0
1.20
04
03.0
3.20
04
08.0
2.20
04
Date
16.1
2.20
03
23.1
2.20
03
30.1
2.20
03
17.0
2.20
04
13.0
1.20
04
20.0
1.20
04
27.0
1.20
04
10.0
2.20
04
24.0
2.20
04
09.1
2.20
03
06.0
1.20
04
03.0
2.20
04
Date
23.0
1.20
04
31.0
1.20
04
19.0
3.20
04
16.0
2.20
04
24.0
2.20
04
11.0
3.20
04
27.0
3.20
04
15.0
1.20
04
08.0
2.20
04
04.0
4.20
04
03.0
3.20
04
Date
20.1
1.20
03
27.1
1.20
03
18.1
2.20
03
11.1
2.20
03
25.1
2.20
03
13.1
1.20
03
22.0
1.20
04
15.0
1.20
04
29.0
1.20
04
04.1
2.20
03
01.0
1.20
04
08.0
1.20
04
Date
Figure 9: Envelope of maximum values of WODL in the upward trend.

Shock and Vibration 9
Maximum envelopeLinear (Maximum envelope)
Train no. 17y = 0,015x − 567,74
R2 = 0,9309
0.0
0.5
1.0
1.5
2.0
2.5
WO
DL
[-]
Maximum envelopeLinear (Maximum envelope)
Train no. 18
y = 0,0198x − 751,83
R2 = 0,9485
0.00.51.01.52.02.53.0
WO
DL
[-]
Maximum envelopeLinear (Maximum envelope)
Train no. 19
y = 0,0142x − 538,53
R2 = 0,9719
0.0
0.5
1.0
1.5
2.0
2.5
WO
DL
[-]
Maximum envelopeLinear (Maximum envelope)
Train no. 20
y = 0,0149x − 563,44
R2 = 0,9228
0.0
0.5
1.0
1.5
2.0
WO
DL
[-]
Maximum envelopeLinear (Maximum envelope)
Train no. 24
y = 0,017x − 643,68
R2 = 0,96
0.0
0.5
1.0
1.5
2.0
WO
DL
[-]
Maximum envelopeLinear (Maximum envelope)
Train no. 25y = 0,0097x − 369,21
R2 = 0,9267
0.00
0.50
1.00
1.50
2.00
WO
DL
[-]
Maximum envelopeLinear (Maximum envelope)
Train no. 28
War
to M =W
OD
0.0
0.5
1.0
1.5
2.0
2.5
y = 0,019x − 718,42
R2 = 0,9811
1.5% 2.0%
1.4% 1.5%
1.7%
1.9%
1.0%
13.1
2.20
03
15.1
1.20
03
29.1
1.20
03
27.1
2.20
03
18.1
0.20
03
10.0
1.20
04
24.0
1.20
04
21.0
2.20
04
01.1
1.20
03
07.0
2.20
04
Date
29.1
0.20
03
13.1
2.20
03
22.1
1.20
03
21.1
2.20
03
20.1
0.20
03
09.1
1.20
03
15.0
1.20
04
26.0
1.20
04
01.1
2.20
03
05.0
2.20
04
08.0
1.20
04
Date
15.1
1.20
03
15.1
2.20
03
01.1
2.20
03
14.0
2.20
04
23.0
1.20
04
24.0
2.20
04
04.1
1.20
03
07.0
1.20
04
07.0
3.20
04
04.0
2.20
04
Date28
.11.
2003
15.1
2.20
03
22.1
2.20
03
19.1
1.20
03
06.1
2.20
03
08.0
1.20
04
Date23
.01.
2004
17.0
3.20
04
13.0
2.20
04
26.0
3.20
04
15.0
1.20
04
01.0
3.20
04
04.0
2.20
04
02.0
4.20
04
08.0
3.20
04
Date
17.1
2.20
03
26.1
2.20
03
10.0
1.20
04
18.0
1.20
04
25.0
1.20
04
16.0
2.20
04
24.0
2.20
04
09.1
2.20
03
09.0
2.20
04
Date
10.1
2.20
03
22.1
2.20
03
13.1
1.20
03
14.0
1.20
04
21.0
1.20
04
30.0
1.20
04
01.1
2.20
03
Date
Figure 10: Envelope of the maximum values of WODL in the upward trend with the trend line.

10 Shock and Vibration
Table 4: Results for envelope max WODL, for selected trains metro.
Number Train number Trend equation 𝑅2 Increase WODL/week [%]1 17 𝑦 = 0.0150𝑥 0.9309 1.52 18 𝑦 = 0.0198𝑥 0.9485 2.03 19 𝑦 = 0.0142𝑥 0.9719 1.44 20 𝑦 = 0.0149𝑥 0.9228 1.55 24 𝑦 = 0.0170𝑥 0.9600 1.76 25 𝑦 = 0.0097𝑥 0.9267 1.07 28 𝑦 = 0.0190𝑥 0.9811 1.9
Table 5: Results for envelope max WODL, for selected subway train compositions.
Number Train number MaximumWODL MaximumWODL envelopeTrend equation 𝑅2 Increase WODL/week [%] Trend equation 𝑅2 Increase WODL/week [%]
1 17 𝑦 = 0.0128𝑥 0.8310 1.3 𝑦 = 0.0150𝑥 0.9309 1.52 18 𝑦 = 0.0173𝑥 0.6953 1.7 𝑦 = 0.0198𝑥 0.9485 2.03 19 𝑦 = 0.012𝑥 0.8308 1.2 𝑦 = 0.0142𝑥 0.9719 1.44 20 𝑦 = 0.0154𝑥 0.8834 1.5 𝑦 = 0.0149𝑥 0.9228 1.55 24 𝑦 = 0.0154𝑥 0.9181 1.5 𝑦 = 0.0170𝑥 0.9600 1.76 25 𝑦 = 0.0095𝑥 0.7989 0.9 𝑦 = 0.0097𝑥 0.9267 1.07 28 𝑦 = 0.0177𝑥 0.9367 1.8 𝑦 = 0.0190𝑥 0.9811 1.9
maximum value of WODL coefficient for train number 18recorded in January 2004 on building N118 are shown inFigure 11.
Average values of WODL coefficient for train number18 for different time of day: morning, rush hours andevening are listed in Table 6. In this table date of measure-ment and number of trains passing during the day is alsolisted.
In thirteen days from working days during January 2004average value of WODL is higher during rush hours thanin the morning, and in twelve days average WODL valueswere higher during rush hours than in the evening. The totalaverage value calculated for whole month also shows thatWODL coefficient is higher for rush hour than beyond them.What is interesting this difference between average value ofWODL is higher comprising rush hours to the evening thanto the morning, but the highest value ofWODL occurs in theevening not in the rush hours.
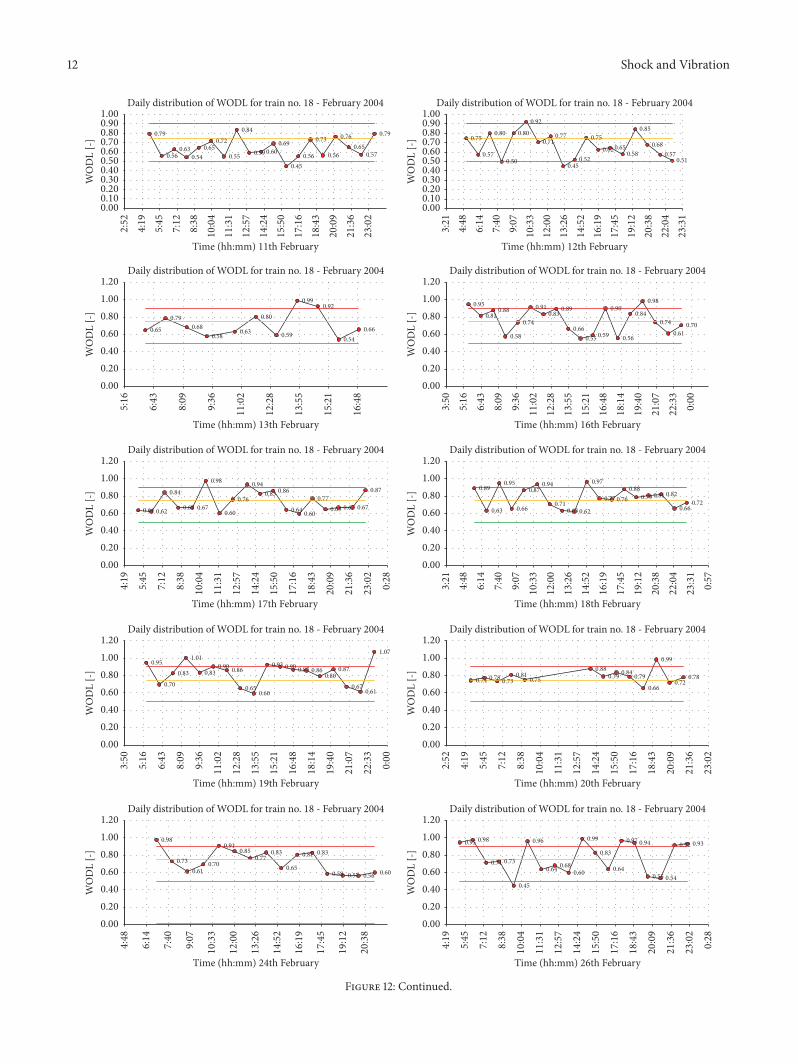
Between 6 and 10 of February wheels of train number 18were rolled which of course effect on WODL results. Dailydistribution after this renovation is shown in Figure 12 andaverage values of WODL are listed in Table 7.
The main observation is that renovation of wheels hasmuch higher influence on WODL values than rush hourseffect.Which is proper for diagnosis of wheel train condition,and which was assumption of monitoring system in WarsawMetro.
Total average value calculated for whole February ishigher for rush hours but differences between rush hours andthe other time of day are not as significant as it was beforewheels were rolled. Comparing days in which during rushhours average value of WODL was higher than in other timeof the day it can be seen that
(i) only during 5 daysWODL is higher during rush hoursthan in the morning, during two days this value is thesame, and during 5 days WODL is lower during rushhours than in the morning,
(ii) during 7 daysWODL is higher during rush hours thanin the evening and during two days this value is thesame,
(iii) difference between the total average value of WODLduring rush hours and in the evening is again higherthan difference between rush hours and morning.
Before and after renovation of train wheels average values ofWODL are higher (but not very significant) during the rushhours than for other time of day. These differences are inboth cases higher when rush hours are compared with theevening. Standard deviation for rush hours is higher thanfor the other daytime. This all suggest that train filled withpassengers can give higher human perception of vibrationresiding in buildings located close to metro line.
Rush hours in Warsaw Metro are not estimated preciselywhich could be a reason of relatively small differences

Shock and Vibration 11
Table 6: Average values of WODL for different time of day, train number 18.
Number Date Number of drives Average WODLMorning Rush hour Evening
1 2004-01-06 12 1.83 1.65 1.342 2004-01-07 19 1.36 1.19 1.523 2004-01-08 19 1.48 1.76 1.334 2004-01-09 19 1.70 1.76 1.505 2004-01-11 18 1.52 1.08 1.206 2004-01-12 34 1.70 1.15 1.577 2004-01-13 13 1.73 1.68 1.748 2004-01-14 18 1.49 1.90 2.089 2004-01-16 18 1.26 1.38 1.6510 2004-01-17 14 1.63 1.23 1.1111 2004-01-19 19 1.49 1.54 1.2912 2004-01-20 19 1.60 1.68 1.6513 2004-01-21 18 1.47 1.73 1.6614 2004-01-22 18 1.69 1.78 1.4215 2004-01-23 19 1.56 1.75 1.5116 2004-01-26 15 1.43 1.68 1.8417 2004-01-29 19 1.79 1.96 1.5518 2004-01-30 18 1.72 1.93 1.7819 2004-01-31 14 1.96 1.97 1.88
Average value 1.60 1.62 1.56Standard deviation 0.1739 0.2820 0.2463Maximum value 1.96 1.97 2.08Minimum value 1.26 1.08 1.11
0.95
1.26
1.66 1.59
1.97
1.18
1.5
1.91
1.29
1.98 2.04
1.05
1.99
1.571.68
1.021.14
1.55
1.04
Daily distribution of WODL for train no. 18 - January 2004
5:51
6:43
8:01
8:49
9:56
4:29
21:0
7
12:5
113
:56
15:1
516
:09
16:5
818
:09
19:1
419
:59
22:0
523
:15
12:0
111
:01
Time (hh:mm) 8th January (�ursday)
0
0.5
1
1.5
2
2.5
WO
DL
[-] 1.73
1.28
2.2
1.851.74
1.481.6
1.731.57
1.66
1.881.79 1.71
2.09
1.7 1.62
0.99
1.64
0.94
Daily distribution of WODL for train no. 18 - January 2004
5:45
7:01
7:59
8:49
9:56
4:41
11:4
312
:57
14:0
1
20:0
9
15:5
517
:09
19:0
0
23:1
5
10:4
5
21:0
6
14:5
9
18:0
4
22:0
4
Time (hh:mm) 9th January (Friday)
0
0.5
1
1.5
2
2.5
WO
DL
[-]
1.19 1.25
1.58
1.83
0.87
1.46
1.77
1.16 1.17
1.96
1.04
0.36
1.38 1.33
2
1.32
1.86
1.08
1.51
Daily distribution of WODL for train no. 18 - January 2004
6:44
7:45
9:47
9:05
5:31
4:48
11:5
813
:00
14:0
514
:53
16:0
417
:03
17:5
519
:10
20:0
121
:07
22:0
523
:31
10:5
0
Time (hh:mm) 7th January (Wednesday)
0
0.5
1
1.5
2
2.5
WO
DL
[-]
1.9
1.68
1.9 1.96 1.89 1.84
0.9
1.27
2.25
1.27
1.06
0.85
Daily distribution of WODL for train no. 18 - January 2004
12:3
0
13:4
5
15:0
0
15:5
0
17:0
0
22:0
0
19:0
0
20:0
0
20:5
5
23:0
2
11:3
1
17:5
0
Time (hh:mm) 6th January (Tuesday)
0
0.5
1
1.5
2
2.5
WO
DL
[-]
Figure 11: Daily distribution of maximumWODL value for train number 18.
12 Shock and Vibration
0.79
0.560.63
0.540.65
0.72
0.55
0.84
0.59 0.600.69
0.450.56
0.73
0.56
0.760.65
0.57
0.79
Daily distribution of WODL for train no. 18 - February 2004
0.000.100.200.300.400.500.600.700.800.901.00
WO
DL
[-]
2:52
5:45
7:12
8:38
4:19
11:3
112
:57
14:2
4
18:4
317
:16
20:0
9
23:0
221
:36
15:5
0
10:0
4
Time (hh:mm) 11th February
0.75
0.57
0.80
0.50
0.80
0.92
0.710.77
0.450.52
0.75
0.62 0.650.58
0.85
0.680.57
0.51
Daily distribution of WODL for train no. 18 - February 2004
4:48
9:07
7:40
6:14
3:21
17:4
5
13:2
614
:52
23:3
1
10:3
3
19:1
2
22:0
4
12:0
0
16:1
9
20:3
8
Time (hh:mm) 12th February
0.000.100.200.300.400.500.600.700.800.901.00
WO
DL
[-]
0.95
0.810.88
0.58
0.74
0.910.83
0.89
0.660.55 0.59
0.90
0.56
0.84
0.98
0.74
0.610.70
Daily distribution of WODL for train no. 18 - February 2004
0.000.200.400.600.801.001.20
WO
DL
[-]
0:00
6:43
8:09
5:16
3:50
9:36
13:5
515
:21
16:4
818
:14
19:4
021
:07
22:3
3
11:0
212
:28
Time (hh:mm) 16th February
0.89
0.63
0.95
0.66
0.870.94
0.710.63 0.62
0.97
0.77 0.760.88
0.79 0.81 0.82
0.660.72
Daily distribution of WODL for train no. 18 - February 20044:
486:
147:
409:
07
3:21
0:57
23:3
122
:04
20:3
8
12:0
010
:33
17:4
516
:19
14:5
213
:26
19:1
2
Time (hh:mm) 18th February
0.000.200.400.600.801.001.20
WO
DL
[-]
0.64 0.62
0.84
0.67 0.67
0.98
0.60
0.76
0.940.83 0.86
0.64 0.60
0.770.65 0.67 0.67
0.87
Daily distribution of WODL for train no. 18 - February 2004
0.000.200.400.600.801.001.20
WO
DL
[-]
8:38
4:19
5:45
0:28
7:12
15:5
0
10:0
4
12:5
7
17:1
6
20:0
9
23:0
2
21:3
6
18:4
3
14:2
4
11:3
1
Time (hh:mm) 17th February
0.74 0.78 0.730.81
0.750.88
0.79 0.84 0.79
0.66
0.99
0.720.78
Daily distribution of WODL for train no. 18 - February 2004
5:45
2:52
7:12
8:38
4:19
17:1
6
23:0
2
14:2
4
18:4
3
10:0
4
12:5
7
20:0
9
21:3
6
11:3
1
15:5
0
Time (hh:mm) 20th February
0.000.200.400.600.801.001.20
WO
DL
[-]
0.95
0.70
0.83
1.01
0.830.90 0.86
0.650.60
0.93 0.90 0.87 0.860.80
0.87
0.670.61
1.07
Daily distribution of WODL for train no. 18 - February 2004
0.000.200.400.600.801.001.20
WO
DL
[-]
6:43
0:00
3:50
9:36
5:16
8:09
18:1
4
15:2
1
19:4
0
11:0
2
13:5
5
21:0
7
22:3
3
16:4
8
12:2
8
Time (hh:mm) 19th February
0.65
0.790.68
0.580.63
0.80
0.59
0.990.92
0.540.66
Daily distribution of WODL for train no. 18 - February 2004
0.000.200.400.600.801.001.20
WO
DL
[-]
6:43
8:09
5:16
9:36
16:4
8
13:5
5
12:2
8
15:2
1
11:0
2
Time (hh:mm) 13th February
0.98
0.730.61
0.70
0.910.85
0.770.83
0.65
0.81 0.83
0.58 0.57 0.56 0.60
Daily distribution of WODL for train no. 18 - February 2004
6:14
9:07
7:40
4:48
12:0
0
13:2
6
16:1
9
19:1
2
10:3
3
14:5
2
20:3
8
17:4
5
Time (hh:mm) 24th February
0.000.200.400.600.801.001.20
WO
DL
[-]
0.95 0.98
0.71 0.73
0.45
0.96
0.64 0.680.60
0.99
0.83
0.64
0.97 0.94
0.55 0.54
0.92 0.93
Daily distribution of WODL for train no. 18 - February 2004
0.000.200.400.600.801.001.20
WO
DL
[-]
5:45
8:38
7:12
0:28
4:19
12:5
7
14:2
4
18:4
3
17:1
6
21:3
6
23:0
2
15:5
0
20:0
9
10:0
4
11:3
1
Time (hh:mm) 26th February
Figure 12: Continued.

Shock and Vibration 13
0.63 0.660.73
0.891.00
0.680.78
1.09
Daily distribution of WODL for train no. 18 - February 2004
0.000.200.400.600.801.001.20
WO
DL
[-]
4:48
7:40
9:07
6:14
13:2
6
14:5
2
16:1
9
17:4
5
12:0
0
10:3
3
Time (hh:mm) 27th February
Figure 12: Daily distribution of maximumWODL value for train number 18 after wheel renovation.
Table 7: Average values of WODL for different time of day after wheels renovation, train number 18.
Number Date Number of drives Average WODLMorning Rush hour Evening
5 2004-02-11 19 0.65 0.57 0.686 2004-02-12 18 0.70 0.64 0.647 2004-02-13 11 0.71 0.71 0.648 2004-02-15 18 0.73 0.68 0.749 2004-02-16 18 0.81 0.65 0.7710 2004-02-17 18 0.75 0.73 0.7311 2004-02-18 18 0.77 0.85 0.7612 2004-02-19 18 0.81 0.89 0.8113 2004-02-20 13 0.78 0.81 0.7914 2004-02-24 15 0.78 0.78 0.5815 2004-02-26 18 0.78 0.86 0.7816 2004-01-27 8 0.73 0.89 0.78
Average value 0.75 0.76 0.73Standard deviation 0.0479 0.1074 0.0729Maximum value 0.81 0.89 0.81Minimum value 0.65 0.67 0.58
between morning and rush hours. This indicates that morn-ing rush hours should be specified during more precisemeasurements.
5. Conclusions
In the paper the monitoring system in Warsaw metro waspresented. Since 2003, when the system was installed, manychanges have been made in the operation and managementof the metro.
Many advantages can be distinguished after the systemwas introduced. First of all, the number of complaintsrelated to the negative impact of vibrations on people innearby buildings has decreased. The main reason for thesecomplaints was problems with wheel profiling. The level ofthese impacts and the rate of change were observed onlyafter the system was installed. This significantly contributed
to improving the comfort of use of buildings near the metroline.
The method of repairing wheels on trains has also beenfundamentally changed. During the first period of systemoperation, only the wheels with the largest damage wererepaired, which did not give good results. The system intro-duced the principle of repairing all wheels on the train, whichimproved comfort and contributed to the extension of theperiod between subsequent repairs.
The system also allowed better planning of repairs.Thanks to the introduced alarm levels in the system, it ispossible to plan repairs for individual trains. It also allowsfor better planning of costs and organization of costs. Themeasurement system together with the software allows youto make decisions that affect the image of the metro managerin an easy and quick way and enables the rationalization ofcosts.

14 Shock and Vibration
The vibration monitoring system introduced on the firstmetro line in Warsaw has fulfilled its role so well that itis currently being expanded on subsequent sections of thesecond metro line in Warsaw.
Conflicts of Interest
The authors declare that there are no conflicts of interestregarding the publication of the paper.
References
[1] B. Chen, Y. L. Xu, and X. Zhao, “Integrated vibration controland health monitoring of building structures: a time-domainapproach,” Smart Structures and Systems, vol. 6, no. 7, pp. 811–833, 2010.
[2] A. Deraemaeker, E. Reynders, G. De Roeck, and J. Kullaa,“Vibration-based structural health monitoring using output-only measurements under changing environment,”MechanicalSystems and Signal Processing, vol. 22, no. 1, pp. 34–56, 2008.
[3] J. M. W. Brownjohn, A. de Stefano, Y.-L. Xu, H. Wenzel, and A.E. Aktan, “Vibration-based monitoring of civil infrastructure:Challenges and successes,” Journal of Civil Structural HealthMonitoring, vol. 1, no. 3-4, pp. 79–95, 2011.
[4] A. Mita and S. Takhira, “A smart sensor using a mechani-cal memory for structural health monitoring of a damage-controlled building,” Smart Materials and Structures, vol. 12, no.2, pp. 204–209, 2003.
[5] M. D. Kohler, P. M. Davis, and E. Safak, “Earthquake andambient vibration monitoring of the steel-frame UCLA factorbuilding,” Earthquake Spectra, vol. 21, no. 3, pp. 715–736, 2005.
[6] R. D. Nayeri, S. F. Masri, R. G. Ghanem, and R. L. Nigbor, “Anovel approach for the structural identification and monitoringof a full-scale 17-story building based on ambient vibrationmeasurements,” Smart Materials and Structures, vol. 17, no. 2,Article ID 025006, 2008.
[7] M. R. Kaloop, J. W. Hu, M. A. Sayed, and J. Seong, “Struc-tural performance assessment based on statistical and waveletanalysis of acceleration measurements of a building during anearthquake,” Shock and Vibration, vol. 2016, Article ID 8902727,13 pages, 2016.
[8] H. Xia, J. Chen, P. Wei, C. Xia, G. De Roeck, and G. Degrande,“Experimental investigation of railway train-induced vibrationsof surrounding ground and a nearby multi-story building,”Earthquake Engineering and Engineering Vibration, vol. 8, no. 1,pp. 137–148, 2009.
[9] D. P. Connolly, G. Kouroussis, P. K. Woodward, P. A. Costa,O. Verlinden, and M. C. Forde, “Field testing and analysisof high speed rail vibrations,” Soil Dynamics and EarthquakeEngineering, vol. 67, pp. 102–118, 2014.
[10] H.-c. Guo, “Blasting Vibration Monitoring and Control Tech-nology Applied in Construction of Huaishuping Tunnel,” Tun-nel Construction, 2006.
[11] M. Nefovska-Danilovic, M. Petronijevic, and B. Savija, “Traffic-induced vibrations of frame structures,” Canadian Journal ofCivil Engineering, vol. 40, no. 2, pp. 158–171, 2013.
[12] M. F. M. Hussein, Vibration from underground railways [Ph.D.Thesis], University of Cambridge, 2004.
[13] F. Pachla, B. R. Pawlik, K. Stypula, and T. Tatara, “Vibrationinduced by railway traffic-zones of influence on buildings and
humans,” in Proceedings of the 27th International Conference onVibroengineering, vol. 13, pp. 188–192, September 2017.
[14] J. Kawecki, K. Koziol, andK. Stypula, “TheDesign of Rail Tracksincluding the Influence of Vibration on People in Buildings,”in Proceedings of the The Eleventh International Conference onComputational Structures Technology, B. H. V. Topping, Ed., vol.176, pp. 1–9, Dubrovnik, Croatia, September 2012.
[15] D. Makovicka, D. Makovicka Jr, and D. Makovicka, “Analysis ofVibro-Isolated Building Excited by the Technical Seismicity ofTraffic Effects,” in Proceedings of the D. MakovickaJr, vol. 2, pp.64–69, 2016.
[16] A. Chudzikiewicz and J. Korzeb, “Simulation study of wheelswear in low-floor tram with independently rotating wheels,”Archive of Applied Mechanics, vol. 88, no. 1-2, pp. 175–192, 2018.
[17] F. P. Bowden and D. Tabor, “The Area of Contact between Sta-tionary and betweenMoving Surfaces,” Proceedings of the RoyalSociety A Mathematical, Physical and Engineering Sciences, vol.169, no. 938, pp. 391–413, 1939.
[18] R. Enblom and M. Berg, “Simulation of railway wheel profiledevelopment due to wear influence of disc braking and contactenvironment,”Wear, vol. 258, no. 7-8, pp. 1055–1063, 2005.
[19] R. Ciesielski and K. Stypuła, “Influence of shape change ofcarriage wheels in consequence of exploitation wear on thelevel of building vibration caused by shallow underground trainpassages – case history,” in Proceedings of Conference StructuralDynamics EURODYN 2002, Grundmann and Schueller, Eds.,pp. 313–316, Swets & Zeitlinger, 2002.
[20] M. Nader and J. Korzeb, “Concept of a monitoring systemfor evaluation vibration, sound and another physical fac-tors on construction and operation stages of metro line,”in Proceedings of 4th International Conference on Experi-ments/Process/System/Modelling/Simulation/Optimization, vol.1, pp. 158–164, 2011.
[21] J. Korzeb and A. Chudzikiewicz, “Evaluation of the vibrationimpacts in the transport infrastructure environment,”Archive ofApplied Mechanics, vol. 85, no. 9-10, pp. 1331–1342, 2015.
[22] P. Stecz, Effect of long-term dynamic loads generated by subwaytrains passes by [Ph.D. thesis], CracowUniversity of Technology,2014.
[23] J. Kawecki and J. K. Stypula, “Providing vibration comfortfor people in buildings exposed to impact of communicationinfluences,Wydawnictwo PK,”Wydawnictwo PK, Krakow, 2013.
[24] Standard PN-B-02171:2017-06, Evaluation of the impact ofvibrations on people in buildings, (in Polish).
[25] ISO 2631-1, Mechanical vibration and shock – Evaluation ofhuman exposure to whole-body vibration – Part 1: Generalrequirements, 1997.
[26] Standard PN-B-02171:1988, Evaluation of the impact of vibra-tions on people in buildings, (in Polish).
[27] Standard ISO 2631-2, Guide to the evaluation of human expo-sure to whole body vibration. Part 2- Vibration in buildings,2003.

International Journal of
AerospaceEngineeringHindawiwww.hindawi.com Volume 2018
RoboticsJournal of
Hindawiwww.hindawi.com Volume 2018
Hindawiwww.hindawi.com Volume 2018
Active and Passive Electronic Components
VLSI Design
Hindawiwww.hindawi.com Volume 2018
Hindawiwww.hindawi.com Volume 2018
Shock and Vibration
Hindawiwww.hindawi.com Volume 2018
Civil EngineeringAdvances in
Acoustics and VibrationAdvances in
Hindawiwww.hindawi.com Volume 2018
Hindawiwww.hindawi.com Volume 2018
Electrical and Computer Engineering
Journal of
Advances inOptoElectronics
Hindawiwww.hindawi.com
Volume 2018
Hindawi Publishing Corporation http://www.hindawi.com Volume 2013Hindawiwww.hindawi.com
The Scientific World Journal
Volume 2018
Control Scienceand Engineering
Journal of
Hindawiwww.hindawi.com Volume 2018
Hindawiwww.hindawi.com
Journal ofEngineeringVolume 2018
SensorsJournal of
Hindawiwww.hindawi.com Volume 2018
International Journal of
RotatingMachinery
Hindawiwww.hindawi.com Volume 2018
Modelling &Simulationin EngineeringHindawiwww.hindawi.com Volume 2018
Hindawiwww.hindawi.com Volume 2018
Chemical EngineeringInternational Journal of Antennas and
Propagation
International Journal of
Hindawiwww.hindawi.com Volume 2018
Hindawiwww.hindawi.com Volume 2018
Navigation and Observation
International Journal of
Hindawi
www.hindawi.com Volume 2018
Advances in
Multimedia
Submit your manuscripts atwww.hindawi.com
Related Documents