SunLine Transit Agency/ SunLine Services Group June 22, 2022 12:00 p.m. Joint Regular Meeting of the SunLine Transit Agency & SunLine Services Group Board of Directors Regular Board of Directors Meeting ***************** VIA VIDEOCONFERENCE Pursuant to California Government Code section 54953(e), the Board of Directors regular meeting will be conducted remotely through Zoom. Please follow the instructions below to join the meeting remotely. INSTRUCTIONS FOR ELECTRONIC PARTICIPATION Join Zoom Meeting - from PC, Laptop or Phone https://us02web.zoom.us/j/86870942349 Meeting ID: 868 7094 2349 Teleconference Dial In 888-475-4499 (Toll Free) Conference Number: 868 7094 2349 One tap mobile +16699009128,,86870942349# Phone controls for participants: The following commands can be used on your phone’s dial pad while in Zoom meeting: • *6 - Toggle mute/unmute • *9 - Raise hand For members of the public wishing to submit comment in connection with the Board Meeting: public comment requests may be submitted via email to the Clerk of the Board at [email protected] prior to June 21, 2022 at 5:00 p.m. with your name, telephone number and subject of your public comment (agenda item or non-agenda item). Members of the public may make public comments through their telephone or Zoom connection when recognized by the Chair. Those who have submitted a request to speak by the deadline above will be recognized first, then anyone else who wishes to speak will be provided an opportunity to make public comment. If you send written comments, your comments will be made part of the official record of the proceedings and read into the record if they are received by the deadline above. *****************

Welcome message from author
This document is posted to help you gain knowledge. Please leave a comment to let me know what you think about it! Share it to your friends and learn new things together.
Transcript

SunLine Transit Agency/ SunLine Services Group June 22, 2022
12:00 p.m.
Joint Regular Meeting of the SunLine Transit Agency & SunLine Services Group Board of Directors
Regular Board of Directors Meeting
***************** VIA VIDEOCONFERENCE
Pursuant to California Government Code section 54953(e), the Board of Directors regular meeting will be conducted remotely through Zoom. Please follow the instructions below to join the meeting remotely.
INSTRUCTIONS FOR ELECTRONIC PARTICIPATION
Join Zoom Meeting - from PC, Laptop or Phone
https://us02web.zoom.us/j/86870942349Meeting ID: 868 7094 2349
Teleconference Dial In 888-475-4499 (Toll Free)
Conference Number: 868 7094 2349
One tap mobile +16699009128,,86870942349#
Phone controls for participants: The following commands can be used on your phone’s dial pad while in Zoom meeting:
• *6 - Toggle mute/unmute • *9 - Raise hand
For members of the public wishing to submit comment in connection with the Board Meeting: public comment requests may be submitted via email to the Clerk of the Board at [email protected] prior to June 21, 2022 at 5:00 p.m. with your name, telephone number and subject of your public comment (agenda item or non-agenda item). Members of the public may make public comments through their telephone or Zoom connection when recognized by the Chair. Those who have submitted a request to speak by the deadline above will be recognized first, then anyone else who wishes to speak will be provided an opportunity to make public comment. If you send written comments, your comments will be made part of the official record of the proceedings and read into the record if they are received by the deadline above.
*****************
SUNLINE TRANSIT AGENCY/ SUNLINE SERVICES GROUP BOARD OF DIRECTORS MEETING JUNE 22, 2022
PAGE 2
ITEM RECOMMENDATION
In compliance with the Brown Act and Government Code Section 54957.5, agenda materials distributed 72 hours prior to the meeting, which are public records relating to open session
agenda items, will be available for inspection by members of the public prior to the meeting at SunLine Transit Agency’s Administration Building, 32505 Harry Oliver Trail, Thousand Palms,
CA 92276 and on the Agency’s website, www.sunline.org.
In compliance with the Americans with Disabilities Act, Government Code Section 54954.2, and the Federal Transit Administration Title VI, please contact the Clerk of the Board at (760) 343-3456 if special assistance is needed to participate in a Board meeting, including accessibility
and translation services. Notification of at least 48 hours prior to the meeting time will assist staff in assuring reasonable arrangements can be made to provide assistance at the meeting.
ITEM RECOMMENDATION
1. CALL TO ORDER
2. FLAG SALUTE
3. ROLL CALL
4. PRESENTATIONS
a) Capital Projects Update (PAGE 5-16) (Staff: Rudy Le Flore, Chief Project Consultant)
5. FINALIZATION OF AGENDA
6. APPROVAL OF MINUTES
a) May 25, 2022 Joint Board Meeting
7. PUBLIC COMMENTS
APPROVE
(PAGE 17-21)
RECEIVE COMMENTS
NON AGENDA ITEMSMembers of the public may address the Board regarding any item within the subject matter jurisdiction of the Board; however, no action may be taken on off-agenda items unless authorized. Comments shall be limited to matters not listed on the agenda. Members of the public may comment on any matter listed on the agenda at the time that the Board considers that matter. Each person’s presentation is limited to a maximum of three (3) minutes.
8. BOARD MEMBER COMMENTS RECEIVE COMMENTS
9. CONSENT CALENDAR
All items on the Consent Calendar will be approved by one motion, and there will be no discussion of individual items unless a Board Member requests a specific item be pulled from the calendar for separate discussion. The public may comment on any item.
SUNLINE TRANSIT AGENCY/ SUNLINE SERVICES GROUP BOARD OF DIRECTORS MEETING JUNE 22, 2022
PAGE 3
ITEM RECOMMENDATION
9a) Checks $1,000 and Over Report for April 2022
9b) Credit Card Statement for April 2022
9c) Monthly Budget Variance Report for April 2022
9d) Contracts Signed in Excess of $25,000 for
May 2022
9e) Union & Non-Union Pension Investment Asset
Summary April 2022
9f) Ridership Report for May 2022
9g) SunDial Operational Notes for May 2022
9h) Metrics for May 2022
9i) Board Member Attendance for May 2022
9j) SSG/SRA Checks $1,000 and Over Report for
April 2022
9k) SSG Monthly Budget Variance Report for
April 2022
9l) Taxi Trip Data – May 2022
RECEIVE & FILE
(PAGE 22-25)
(PAGE 26-37)
(PAGE 38-42)
(PAGE 43-44)
(PAGE 45-54)
(PAGE 55-58)
(PAGE 59-61)
(PAGE 62-81)
(PAGE 82-83) (PAGE 84-85)
(PAGE 86-88)
(PAGE 89-90)
APPROVE
9m) Adoption of Resolution to Continue Teleconferencing (PAGE 91-96)
Meetings
10. ADOPTION OF THE FY23 OPERATING AND CAPITAL BUDGET
APPROVE (PAGE 97-202)
(Russell Betts, Chair of Finance/Audit Committee; Staff: Luis Garcia, Controller/Assistant Chief Financial Officer)
11. RESOLUTION NO. 0797 TO ADOPT AND AUTHORIZE APPROVEEXECUTION OF SUNLINE TRANSIT AGENCY (PAGE 203-207) RETIREMENT INCOME PLAN FOR TEAMSTERS LOCAL 1932 (Russell Betts, Chair of Finance/Audit Committee;Staff: Luis Garcia, Controller/Assistant Chief Financial Officer)
12. ZERO EMISSION TECHNICAL SUPPORT AGREEMENT APPROVE(Russell Betts, Chair of Finance/Audit Committee; (PAGE 208-209) Staff: Rudy Le Flore, Chief Project Consultant)
13. APPROVE GRANT FOR SUNLINE WEST COASTCENTER OF EXCELLENCE IN ZERO EMISSION
APPROVE (PAGE 210-211)
TECHNOLOGY & RENEWABLE ENERGY (Russell Betts, Chair of Finance/Audit Committee; Staff: Harman Singh, Deputy Chief Performance Officer)
SUNLINE TRANSIT AGENCY/ SUNLINE SERVICES GROUP BOARD OF DIRECTORS MEETING JUNE 22, 2022
PAGE 4
ITEM RECOMMENDATION
14. ADOPT FY23-25 SHORT RANGE TRANSIT PLAN (SRTP) APPROVE(Robert Radi, Chair of Strategic Planning & (PAGE 212-383) Operational Committee; Staff: Rohan Kuruppu, Chief Planning Consultant)
15. ADOPTION OF SUNLINE REGULATORY ADMINISTRATION FY23 BUDGET
APPROVE (PAGE 384-396)
(Charles Townsend, Chair of Taxi Committee; Staff: Luis Garcia, Controller/Assistant Chief Financial Officer)
16. ELECTION OF OFFICERS(Glenn Miller, Chairperson of the Board)
17. MOBILE HYDROGEN FUELING SYSTEM (Russell Betts, Chair of Finance/Audit Committee;
APPROVE (PAGE 397-399)
INFORMATION (PAGE 400)
Staff: Rudy Le Flore, Chief Project Consultant)
18. GENERAL COUNSEL’S REPORT
19. CEO/GENERAL MANAGER’S REPORT
20. CLOSED SESSION
a) CONFERENCE WITH LEGAL COUNSEL – EXISTING LITIGATIONPursuant to Government Code section 54956.9(d)(1) Three (3) Matters:
Odeimys Martinez v. SunLine Transit TS2010
Joanna Connolly v. SunLine Transit TS2019
Bellamy v. SunLine Transit TS1928
b) CONFERENCE WITH LABOR NEGOTIATORSPursuant to Government Code section 54957.6 Agency designated representatives: Lauren Skiver, CEO/GM SunLine, Irma Rodriguez Moisa, Special Legal Counsel
Employee organizations: Amalgamated Transit Union Local 1277
c) PUBLIC EMPLOYEE PERFORMANCE EVALUATIONPursuant to Government Code section 54957 (b) Position Title: CEO/General Manager
21. NEXT MEETING DATE
July 22, 2022 at 12 p.m.
22. ADJOURN
June 22, 2022
Rudy Le Flore Chief Project Consultant
Page 5 of 400
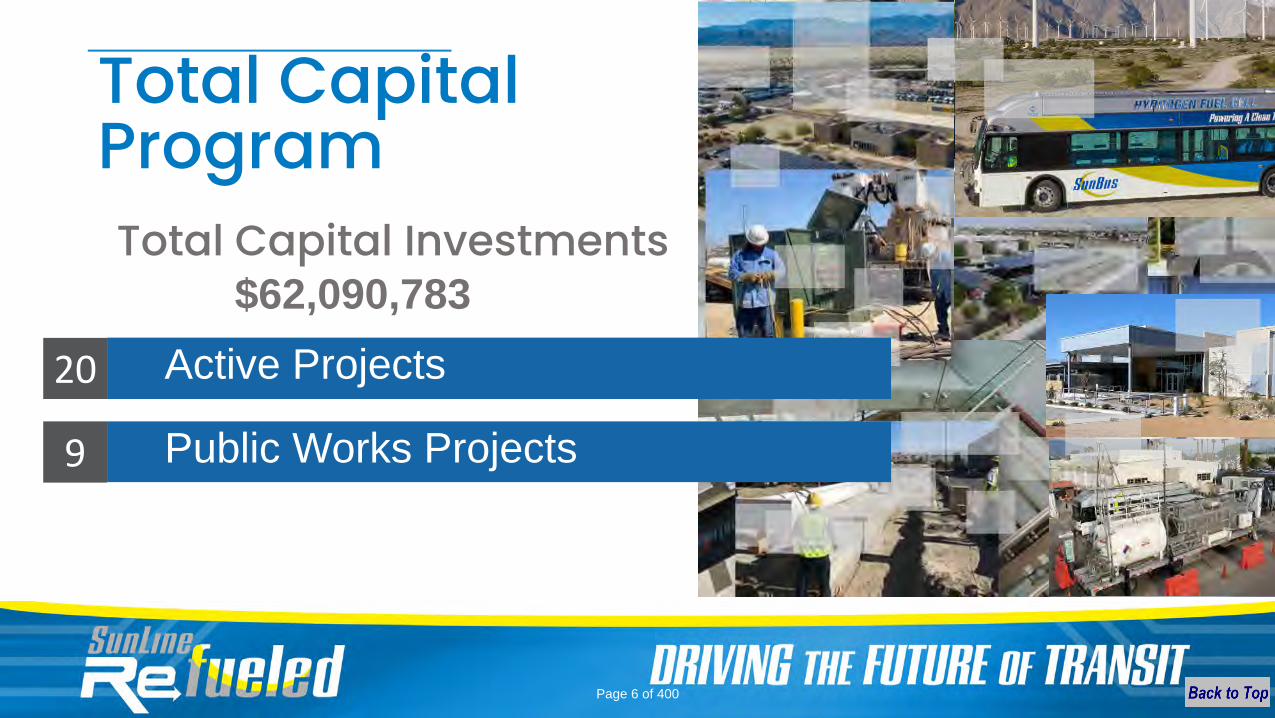
Total Capital Program
Total Capital Investments
$62,090,783
Active Projects
Public Works Projects
20
9
Page 6 of 400
Administrative Work
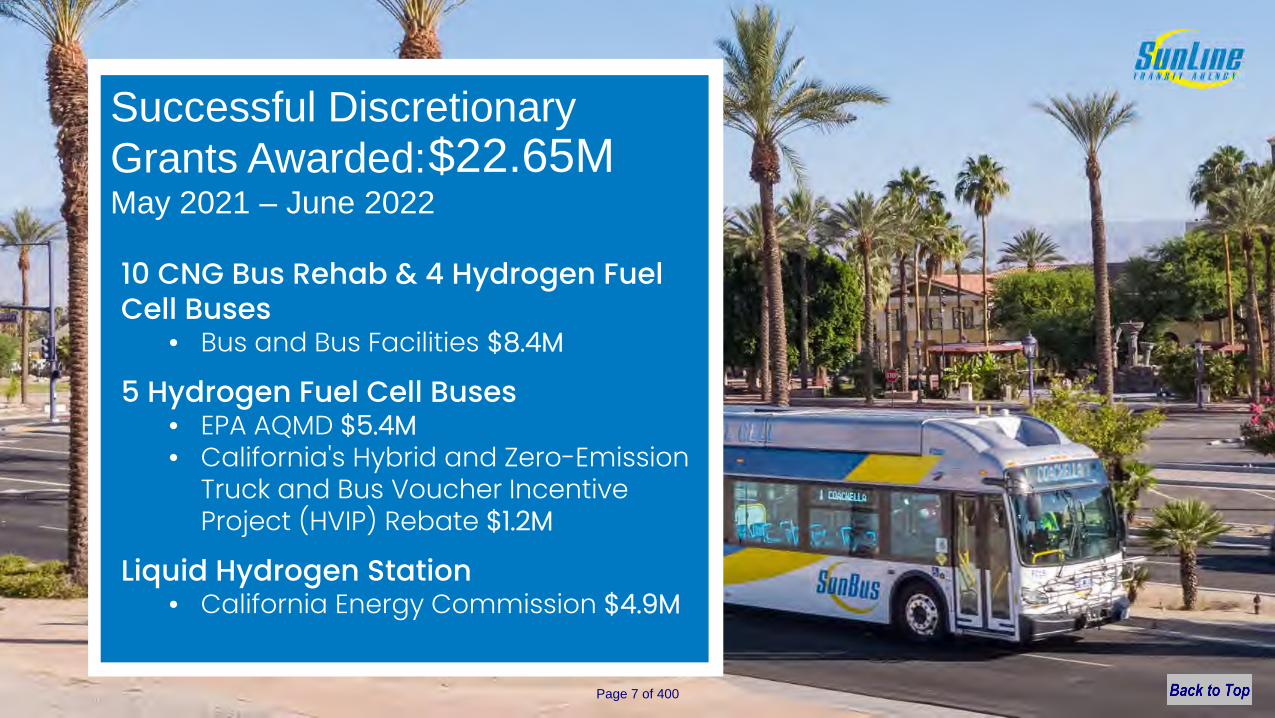
Successful Discretionary Grants Awarded:May 2021 – June 2022
$22.65M
10 CNG Bus Rehab & 4 Hydrogen Fuel Cell Buses
• Bus and Bus Facilities $8.4M
5 Hydrogen Fuel Cell Buses • EPA AQMD $5.4M• California's Hybrid and Zero-Emission
Truck and Bus Voucher Incentive Project (HVIP) Rebate $1.2M
Liquid Hydrogen Station • California Energy Commission $4.9M
Page 7 of 400
Administrative Work
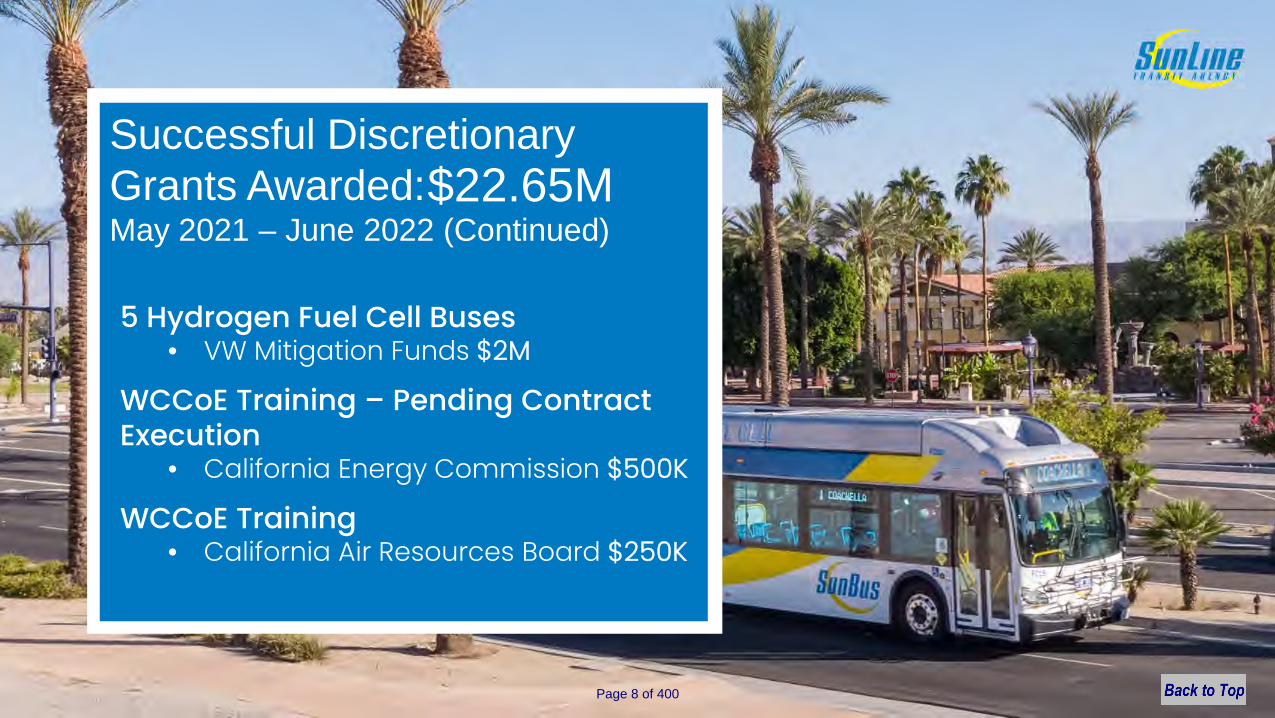
Successful Discretionary Grants Awarded:May 2021 – June 2022 (Continued)
$22.65M
5 Hydrogen Fuel Cell Buses • VW Mitigation Funds $2M
WCCoE Training – Pending Contract Execution
• California Energy Commission $500K
WCCoE Training• California Air Resources Board $250K
Page 8 of 400
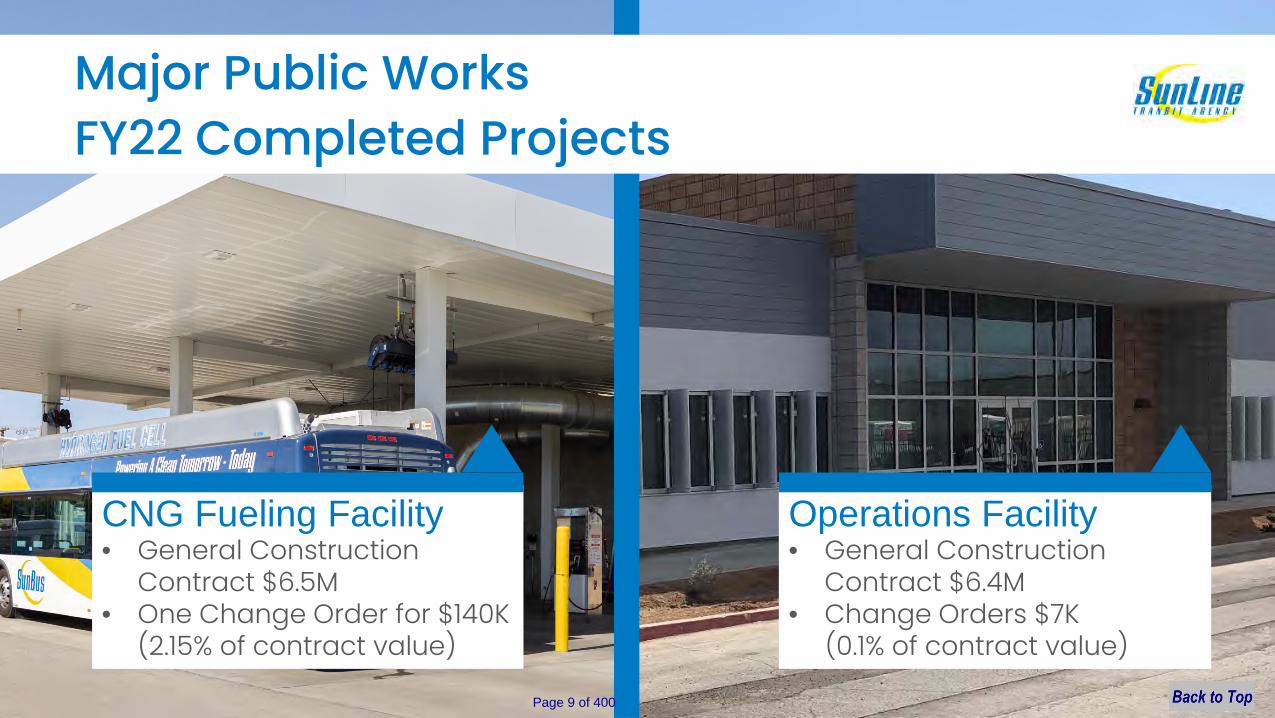
CNG Fueling Facility • General Construction
Contract $6.5M• One Change Order for $140K
(2.15% of contract value)
Operations Facility • General Construction
Contract $6.4M• Change Orders $7K
(0.1% of contract value)
Major Public Works
FY22 Completed Projects
Page 9 of 400

Phased Project Approach
• Phase I: Radio Replacement • Phase II: Automated Passenger
Counters, Automated Vehicle Location and Computer Aided Dispatch
Land Acquisition Intelligent Transportation System
• Phase I: Acquisition • Phase II: Solar to Microgrid
Infrastructure Improvement
Page 10 of 400
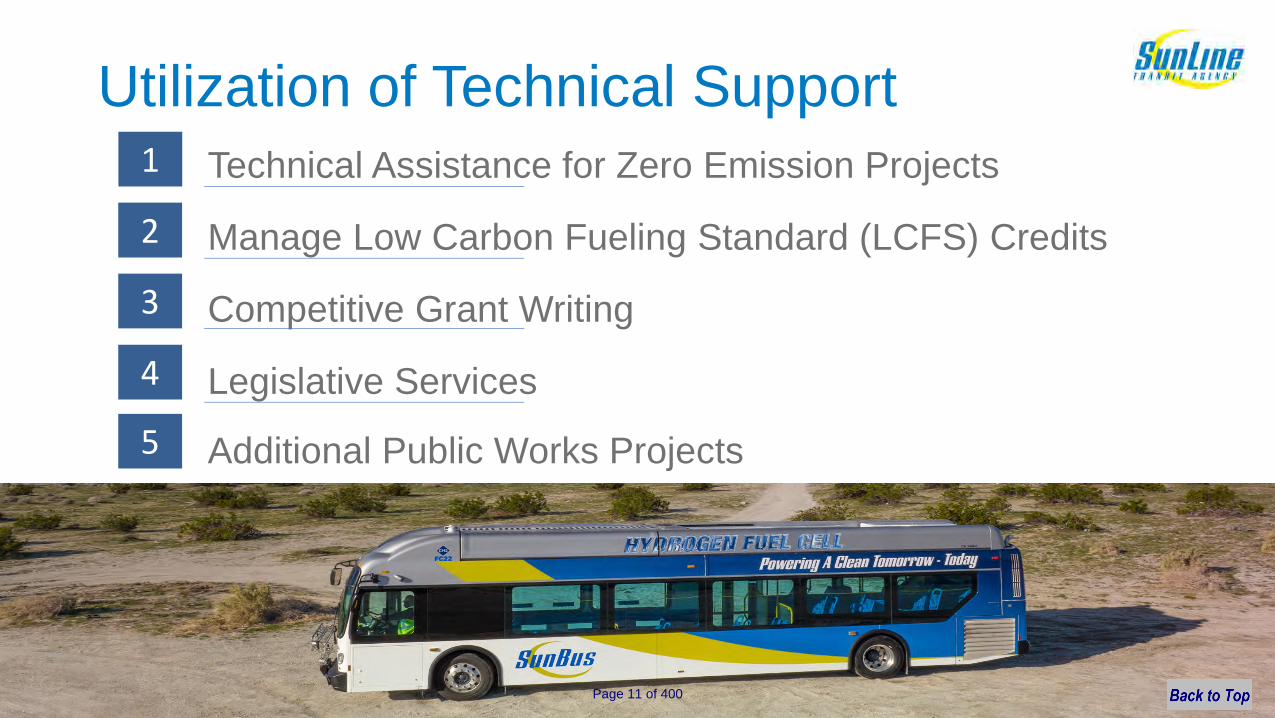
Utilization of Technical SupportTechnical Assistance for Zero Emission Projects
Manage Low Carbon Fueling Standard (LCFS) Credits
Competitive Grant Writing
Legislative Services
Additional Public Works Projects
1
2
3
4
5
Page 11 of 400
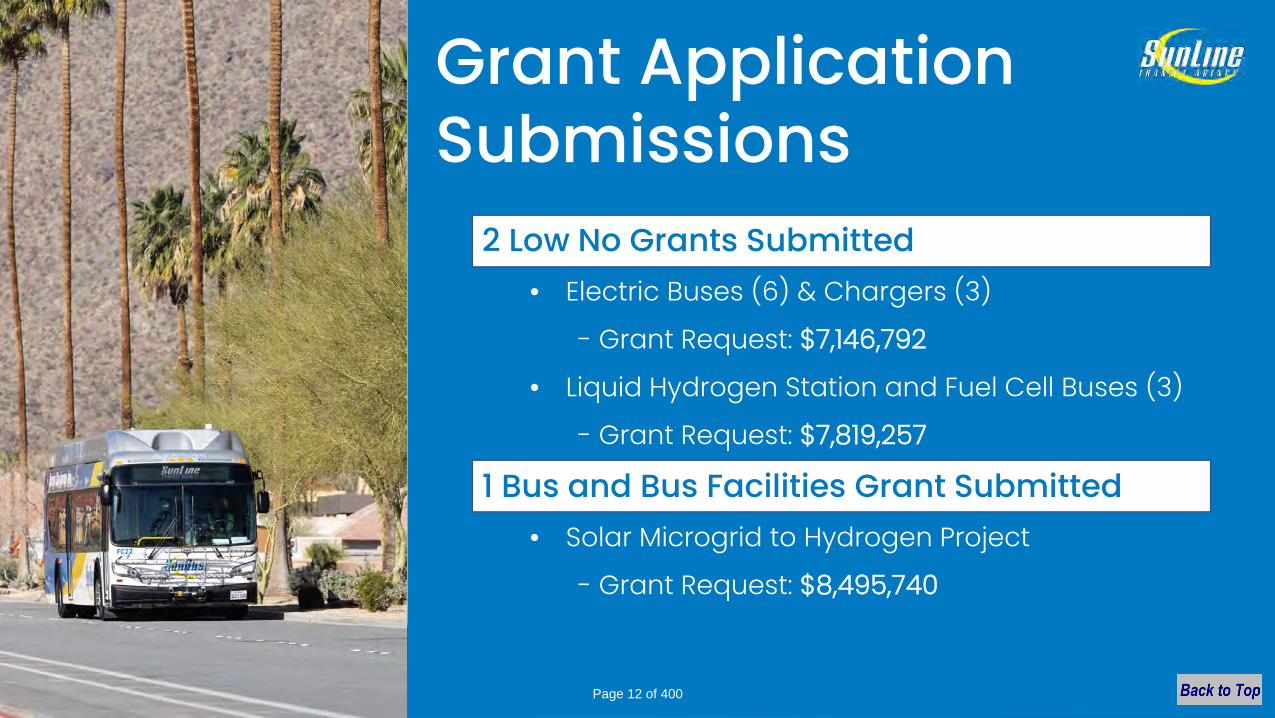
Grant Application Submissions
2 Low No Grants Submitted
• Electric Buses (6) & Chargers (3)
- Grant Request: $7,146,792
• Liquid Hydrogen Station and Fuel Cell Buses (3)
- Grant Request: $7,819,257
1 Bus and Bus Facilities Grant Submitted
• Solar Microgrid to Hydrogen Project
- Grant Request: $8,495,740
Page 12 of 400
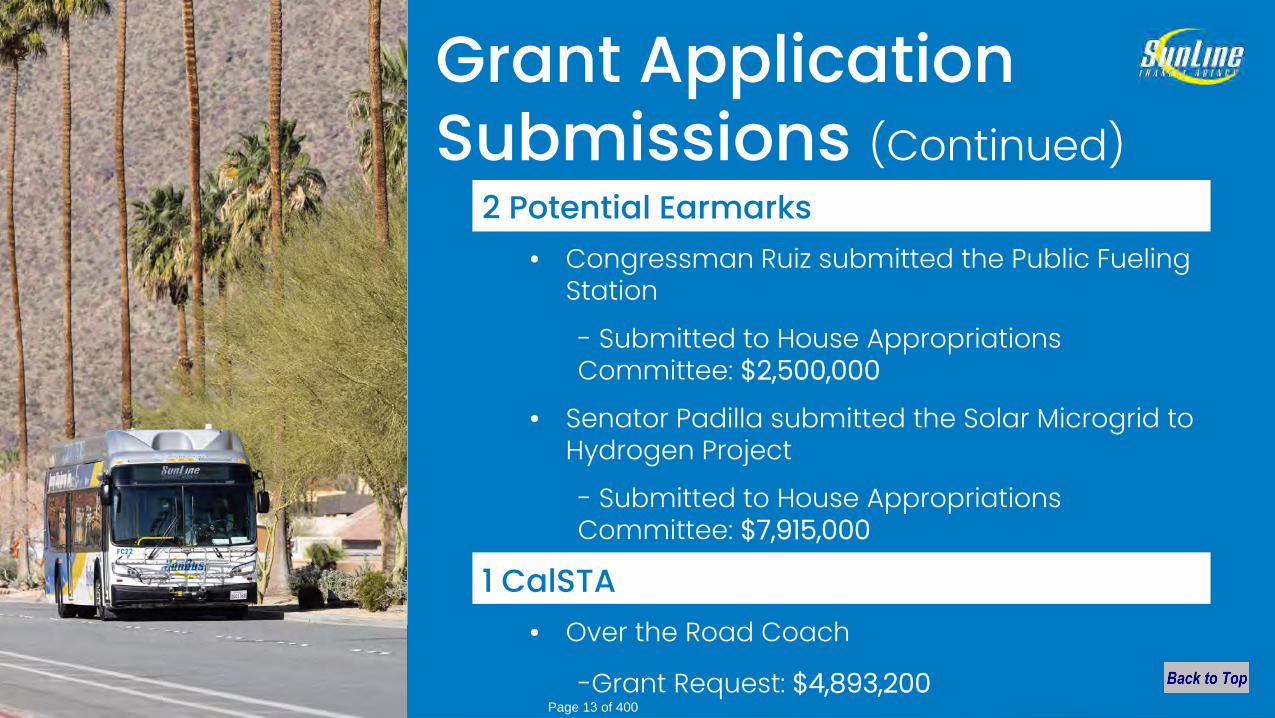
Grant Application Submissions (Continued)
2 Potential Earmarks • Congressman Ruiz submitted the Public Fueling
Station
- Submitted to House Appropriations Committee: $2,500,000
• Senator Padilla submitted the Solar Microgrid to Hydrogen Project
- Submitted to House Appropriations Committee: $7,915,000
1 CalSTA • Over the Road Coach
-Grant Request: $4,893,200 Page 13 of 400
Thank
you!
Page 14 of 400
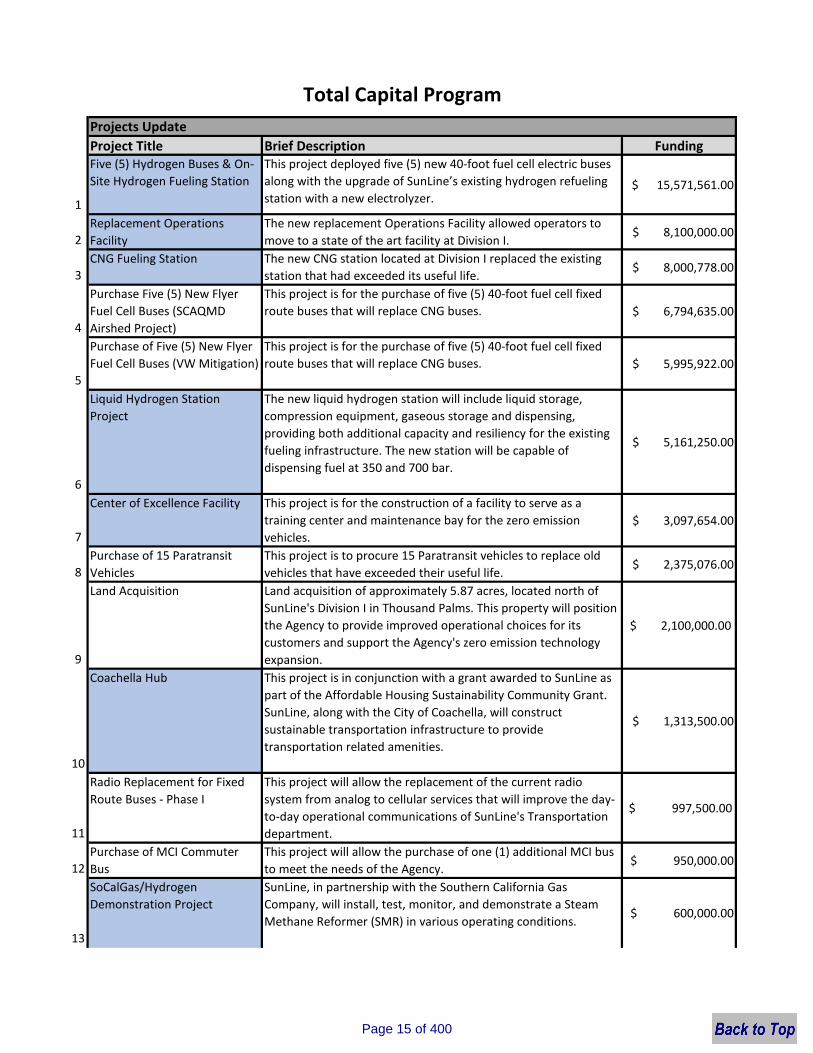
Project Title Brief Description Funding
1
Five (5) Hydrogen Buses & On-
Site Hydrogen Fueling Station
This project deployed five (5) new 40-foot fuel cell electric buses
along with the upgrade of SunLine’s existing hydrogen refueling
station with a new electrolyzer. $ 15,571,561.00
2
Replacement Operations
Facility
The new replacement Operations Facility allowed operators to
move to a state of the art facility at Division I. $ 8,100,000.00
3
CNG Fueling Station The new CNG station located at Division I replaced the existing
station that had exceeded its useful life. $ 8,000,778.00
4
Purchase Five (5) New Flyer
Fuel Cell Buses (SCAQMD
Airshed Project)
This project is for the purchase of five (5) 40-foot fuel cell fixed
route buses that will replace CNG buses. $ 6,794,635.00
5
Purchase of Five (5) New Flyer
Fuel Cell Buses (VW Mitigation)
This project is for the purchase of five (5) 40-foot fuel cell fixed
route buses that will replace CNG buses. $ 5,995,922.00
6
Liquid Hydrogen Station
Project
The new liquid hydrogen station will include liquid storage,
compression equipment, gaseous storage and dispensing,
providing both additional capacity and resiliency for the existing
fueling infrastructure. The new station will be capable of
dispensing fuel at 350 and 700 bar.
$ 5,161,250.00
7
Center of Excellence Facility This project is for the construction of a facility to serve as a
training center and maintenance bay for the zero emission
vehicles.
$ 3,097,654.00
8
Purchase of 15 Paratransit
Vehicles
This project is to procure 15 Paratransit vehicles to replace old
vehicles that have exceeded their useful life. $ 2,375,076.00
9
Land Acquisition Land acquisition of approximately 5.87 acres, located north of
SunLine's Division I in Thousand Palms. This property will position
the Agency to provide improved operational choices for its
customers and support the Agency's zero emission technology
expansion.
$ 2,100,000.00
10
Coachella Hub This project is in conjunction with a grant awarded to SunLine as
part of the Affordable Housing Sustainability Community Grant.
SunLine, along with the City of Coachella, will construct
sustainable transportation infrastructure to provide
transportation related amenities.
$ 1,313,500.00
11
Radio Replacement for Fixed
Route Buses - Phase I
This project will allow the replacement of the current radio
system from analog to cellular services that will improve the day-
to-day operational communications of SunLine's Transportation
department.
$ 997,500.00
12
Purchase of MCI Commuter
Bus
This project will allow the purchase of one (1) additional MCI bus
to meet the needs of the Agency. $ 950,000.00
13
SoCalGas/Hydrogen
Demonstration Project
SunLine, in partnership with the Southern California Gas
Company, will install, test, monitor, and demonstrate a Steam
Methane Reformer (SMR) in various operating conditions. $ 600,000.00
Total Capital Program
Projects Update
Page 15 of 400
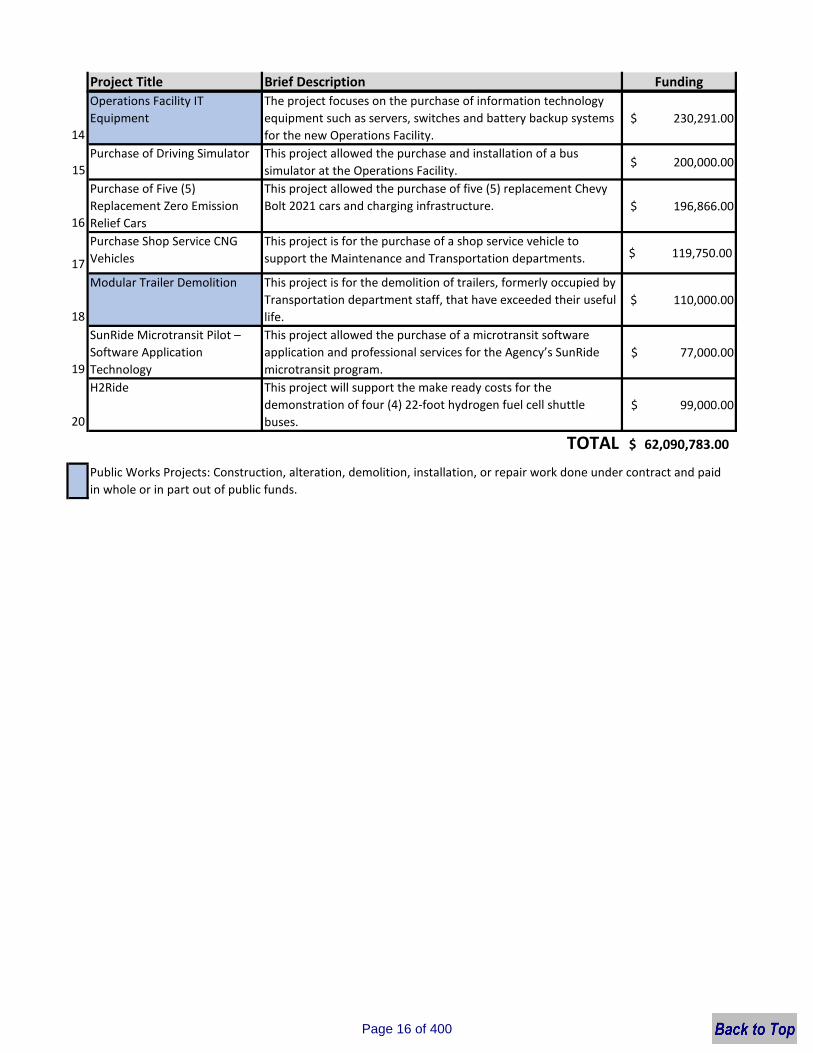
Project Title Brief Description Funding
14
Operations Facility IT
Equipment
The project focuses on the purchase of information technology
equipment such as servers, switches and battery backup systems
for the new Operations Facility.
$ 230,291.00
15
Purchase of Driving Simulator This project allowed the purchase and installation of a bus
simulator at the Operations Facility. $ 200,000.00
16
Purchase of Five (5)
Replacement Zero Emission
Relief Cars
This project allowed the purchase of five (5) replacement Chevy
Bolt 2021 cars and charging infrastructure. $ 196,866.00
17
Purchase Shop Service CNG
Vehicles
This project is for the purchase of a shop service vehicle to
support the Maintenance and Transportation departments. $ 119,750.00
18
Modular Trailer Demolition This project is for the demolition of trailers, formerly occupied by
Transportation department staff, that have exceeded their useful
life.
$ 110,000.00
19
SunRide Microtransit Pilot –
Software Application
Technology
This project allowed the purchase of a microtransit software
application and professional services for the Agency’s SunRide
microtransit program.
$ 77,000.00
20
H2Ride This project will support the make ready costs for the
demonstration of four (4) 22-foot hydrogen fuel cell shuttle
buses.
$ 99,000.00
TOTAL 62,090,783.00$
Public Works Projects: Construction, alteration, demolition, installation, or repair work done under contract and paid
in whole or in part out of public funds.
Page 16 of 400
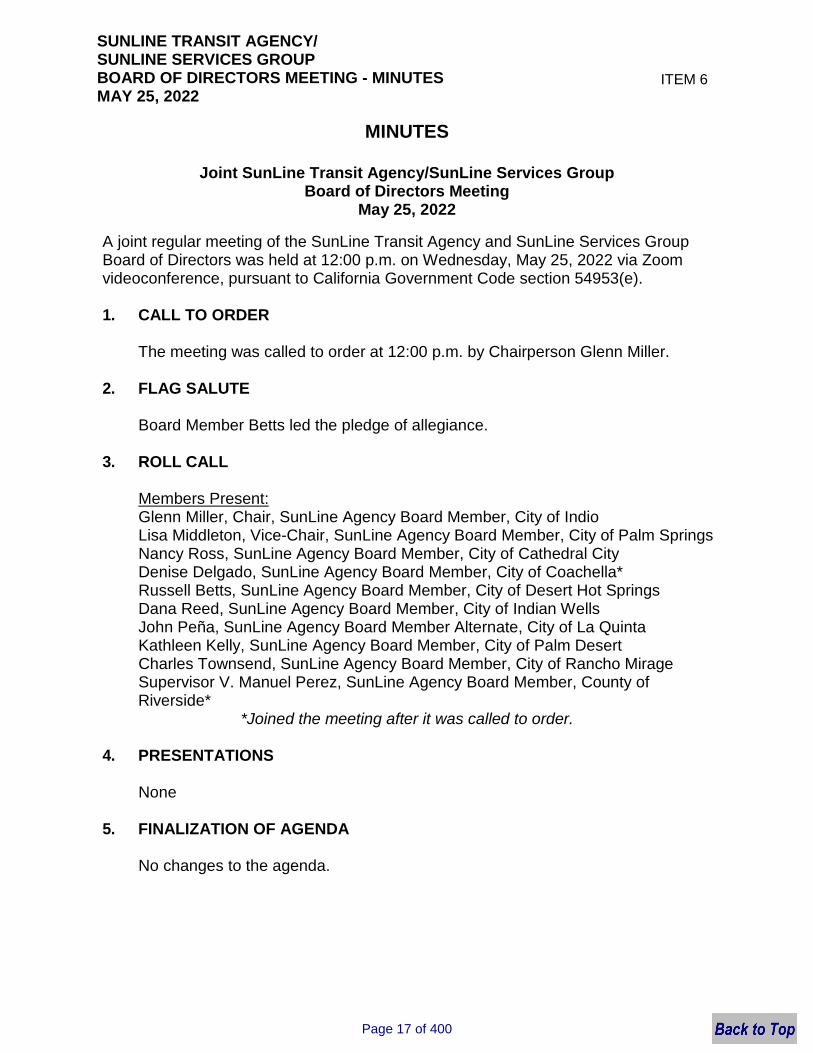
SUNLINE TRANSIT AGENCY/ SUNLINE SERVICES GROUP BOARD OF DIRECTORS MEETING - MINUTES MAY 25, 2022
MINUTES
Joint SunLine Transit Agency/SunLine Services Group
Board of Directors Meeting May 25, 2022
A joint regular meeting of the SunLine Transit Agency and SunLine Services Group Board of Directors was held at 12:00 p.m. on Wednesday, May 25, 2022 via Zoom videoconference, pursuant to California Government Code section 54953(e). 1. CALL TO ORDER
The meeting was called to order at 12:00 p.m. by Chairperson Glenn Miller. 2. FLAG SALUTE
Board Member Betts led the pledge of allegiance.
3. ROLL CALL Members Present: Glenn Miller, Chair, SunLine Agency Board Member, City of Indio Lisa Middleton, Vice-Chair, SunLine Agency Board Member, City of Palm Springs Nancy Ross, SunLine Agency Board Member, City of Cathedral City Denise Delgado, SunLine Agency Board Member, City of Coachella* Russell Betts, SunLine Agency Board Member, City of Desert Hot Springs Dana Reed, SunLine Agency Board Member, City of Indian Wells John Peña, SunLine Agency Board Member Alternate, City of La Quinta Kathleen Kelly, SunLine Agency Board Member, City of Palm Desert Charles Townsend, SunLine Agency Board Member, City of Rancho Mirage Supervisor V. Manuel Perez, SunLine Agency Board Member, County of Riverside*
*Joined the meeting after it was called to order. 4. PRESENTATIONS
None
5. FINALIZATION OF AGENDA
No changes to the agenda.
ITEM 6
Page 17 of 400

SUNLINE TRANSIT AGENCY/ SUNLINE SERVICES GROUP BOARD OF DIRECTORS MEETING - MINUTES MAY 25, 2022
6. APPROVAL OF MINUTES FOR THE JOINT STA/SSG APRIL 22, 2022 BOARD MEETING Board Member Betts moved to approve the minutes of the April 22, 2022 Joint STA/SSG Board meeting. The motion was seconded by Board Member Radi. The motion was approved by a unanimous vote of 9 yes; 0 no; 0 abstain; 1 absent
*Board Member Delgado joined the meeting at 12:09 pm.
7. PUBLIC COMMENTS
Four (4) public comments were made by:
Anthony Garcia Arturo Aguilar Joey Raeck Valerie Diss
8. BOARD MEMBER COMMENTS
Board Member Comments were made by:
Board Member Middleton 9. CONSENT CALENDAR
Board Member Townsend moved to approve the consent calendar. The motion was seconded by Board Member Alternate Peña. The motion was approved by a unanimous vote of 10 yes; 0 no; 0 abstain
10. PURCHASE OF THREE (3) MICROTRANSIT ADA ACCESSIBLE MINI VANS Finance/Audit Committee Chair Betts reported that this item was brought to the committee and they unanimously approved the item. SunLine Transit Agency Board Member Betts moved to approve the Purchase of Three (3) Microtransit ADA Accessible Mini Vans. The motion was approved by a unanimous vote of 10 yes; 0 no; 0 abstain
11. AWARD OF CONTRACT FOR SECURITY GUARD SERVICES
Finance/Audit Committee Chair Betts reported that that this item was brought to the committee and they unanimously approved the item. SunLine Transit Agency Board Member Betts moved to approve the Award of Contract for Security Guard Services. The motion was approved by a unanimous vote of 10 yes; 0 no; 0 abstain
12. THOUSAND PALMS LAND ACQUISITION Finance/Audit Committee Chair Betts reported that that this item was brought to the committee and they unanimously approved the item.
Page 18 of 400
SUNLINE TRANSIT AGENCY/ SUNLINE SERVICES GROUP BOARD OF DIRECTORS MEETING - MINUTES MAY 25, 2022
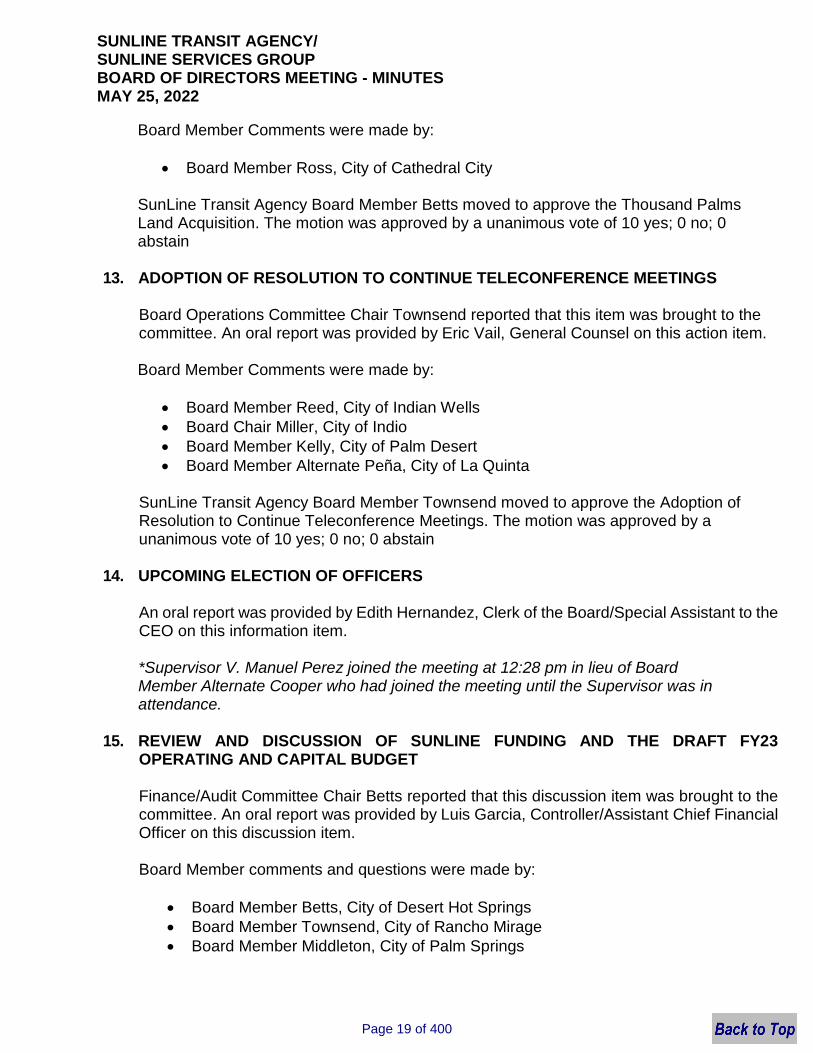
Board Member Comments were made by:
Board Member Ross, City of Cathedral City SunLine Transit Agency Board Member Betts moved to approve the Thousand Palms Land Acquisition. The motion was approved by a unanimous vote of 10 yes; 0 no; 0 abstain
13. ADOPTION OF RESOLUTION TO CONTINUE TELECONFERENCE MEETINGS
Board Operations Committee Chair Townsend reported that this item was brought to the committee. An oral report was provided by Eric Vail, General Counsel on this action item. Board Member Comments were made by:
Board Member Reed, City of Indian Wells Board Chair Miller, City of Indio Board Member Kelly, City of Palm Desert Board Member Alternate Peña, City of La Quinta
SunLine Transit Agency Board Member Townsend moved to approve the Adoption of Resolution to Continue Teleconference Meetings. The motion was approved by a unanimous vote of 10 yes; 0 no; 0 abstain
14. UPCOMING ELECTION OF OFFICERS An oral report was provided by Edith Hernandez, Clerk of the Board/Special Assistant to the CEO on this information item. *Supervisor V. Manuel Perez joined the meeting at 12:28 pm in lieu of Board Member Alternate Cooper who had joined the meeting until the Supervisor was in attendance.
15. REVIEW AND DISCUSSION OF SUNLINE FUNDING AND THE DRAFT FY23 OPERATING AND CAPITAL BUDGET Finance/Audit Committee Chair Betts reported that this discussion item was brought to the committee. An oral report was provided by Luis Garcia, Controller/Assistant Chief Financial Officer on this discussion item. Board Member comments and questions were made by:
Board Member Betts, City of Desert Hot Springs Board Member Townsend, City of Rancho Mirage Board Member Middleton, City of Palm Springs
Page 19 of 400
SUNLINE TRANSIT AGENCY/ SUNLINE SERVICES GROUP BOARD OF DIRECTORS MEETING - MINUTES MAY 25, 2022
16. REVIEW AND DISCUSSION OF THE DRAFT FY23-25 SHORT RANGE TRANSIT PLAN (SRTP)
Strategic Planning & Operational Committee Member Peña reported that this discussion item was brought to the committee.
17. REVIEW AND DICUSSION OF SUNLINE REGULATORY ADMINISTRATION DRAFT FY23 BUDGET Taxi Committee Chair Townsend reported that this discussion item was brought to the committee. An oral report was provided by Luis Garcia, Controller/Assistant Chief Financial Officer on this discussion item.
18. GENERAL COUNSEL’S REPORT General Counsel had no updates to report.
19. CEO/GENERAL MANAGER’S REPORT CEO/General Manager, Lauren Skiver, provided a brief oral report.
20. CLOSED SESSION
a) CONFERENCE WITH LABOR NEGOTIATORS Pursuant to Government Code section 54957.6 Agency designated representatives: Lauren Skiver, CEO/GM SunLine, Irma Rodriguez Moisa, Special Legal Counsel
Employee organizations: Amalgamated Transit Union Local 1277
a) General Counsel, Eric Vail reported that the Board received briefing and direction, and other than that there was no reportable action taken.
b) CONFERENCE WITH LEGAL COUNSEL – ANTICIPATED LITIGATION
Significant exposure to litigation pursuant to Government Code section 54956.9(d)(2)
One (1) matter
b) General Counsel, Eric Vail reported that the Board received briefing and direction of this case, other than that there was no reportable action taken.
c) PUBLIC EMPLOYEE PERFORMANCE EVALUATION Pursuant to Government Code section 54957 (b) Position Title: CEO/General Manager
c) General Counsel, Eric Vail reported that the Board requested a notice be
sent to the Board Members who have not completed the evaluation and staff provide assistance as needed.
Page 20 of 400
SUNLINE TRANSIT AGENCY/ SUNLINE SERVICES GROUP BOARD OF DIRECTORS MEETING - MINUTES MAY 25, 2022
Respectfully Submitted, Edith Hernandez Clerk of the Board
21. NEXT MEETING DATE
June 22, 2022 at 12 p.m.
22. ADJOURN
The SunLine Services Group and SunLine Transit Agency meeting was concurrently adjourned at 1:45 p.m. in honor of the Uvalde school shooting victims, following a moment of silence led by Board Chair Miller.
A recording of the May 25, 2022 Board proceedings is available here.
Page 21 of 400
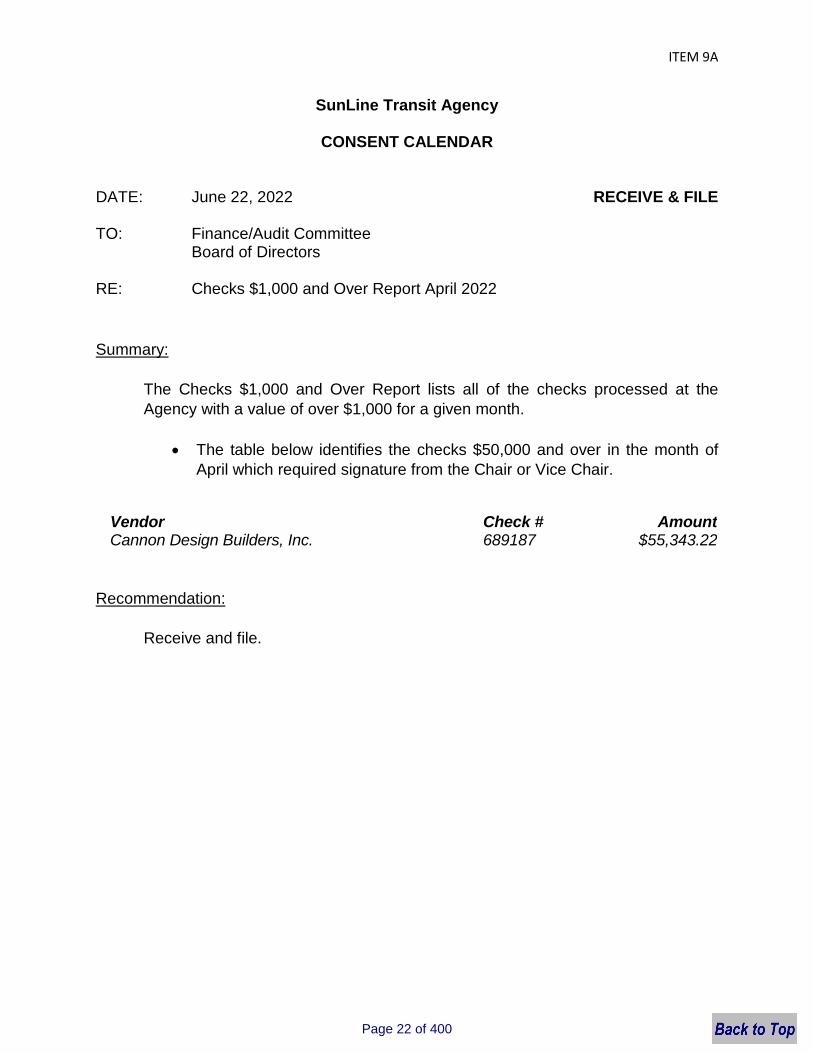
ITEM 9A
SunLine Transit Agency
CONSENT CALENDAR
DATE: June 22, 2022 RECEIVE & FILE
TO: Finance/Audit Committee Board of Directors
RE: Checks $1,000 and Over Report April 2022
Summary:
The Checks $1,000 and Over Report lists all of the checks processed at the Agency with a value of over $1,000 for a given month.
The table below identifies the checks $50,000 and over in the month of April which required signature from the Chair or Vice Chair.
Recommendation:
Receive and file.
Vendor Check # AmountCannon Design Builders, Inc. 689187 $55,343.22
Page 22 of 400
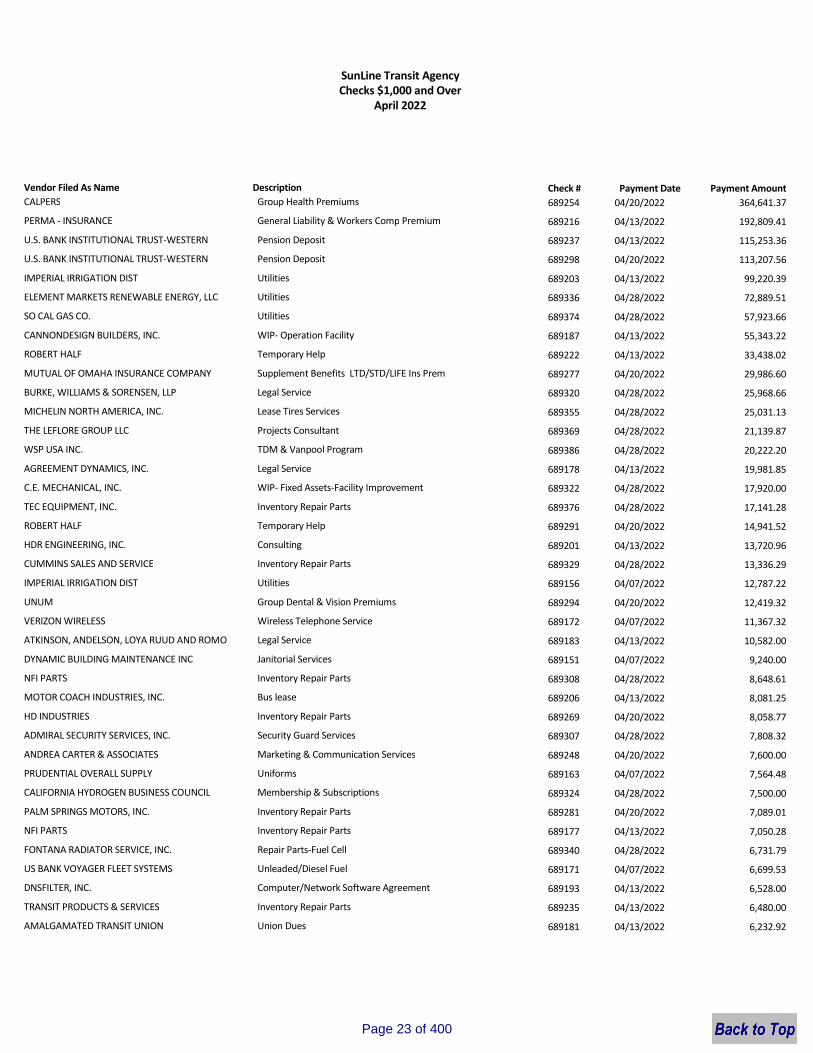
SunLine Transit Agency Checks $1,000 and Over
April 2022
Vendor Filed As Name Description Check # Payment Date Payment Amount
CALPERS Group Health Premiums 689254 04/20/2022 364,641.37
PERMA - INSURANCE General Liability & Workers Comp Premium 689216 04/13/2022 192,809.41
U.S. BANK INSTITUTIONAL TRUST-WESTERN Pension Deposit 689237 04/13/2022 115,253.36
U.S. BANK INSTITUTIONAL TRUST-WESTERN Pension Deposit 689298 04/20/2022 113,207.56
IMPERIAL IRRIGATION DIST Utilities 689203 04/13/2022 99,220.39
ELEMENT MARKETS RENEWABLE ENERGY, LLC Utilities 689336 04/28/2022 72,889.51
SO CAL GAS CO. Utilities 689374 04/28/2022 57,923.66
CANNONDESIGN BUILDERS, INC. WIP- Operation Facility 689187 04/13/2022 55,343.22
ROBERT HALF Temporary Help 689222 04/13/2022 33,438.02
MUTUAL OF OMAHA INSURANCE COMPANY Supplement Benefits LTD/STD/LIFE Ins Prem 689277 04/20/2022 29,986.60
BURKE, WILLIAMS & SORENSEN, LLP Legal Service 689320 04/28/2022 25,968.66
MICHELIN NORTH AMERICA, INC. Lease Tires Services 689355 04/28/2022 25,031.13
THE LEFLORE GROUP LLC Projects Consultant 689369 04/28/2022 21,139.87
WSP USA INC. TDM & Vanpool Program 689386 04/28/2022 20,222.20
AGREEMENT DYNAMICS, INC. Legal Service 689178 04/13/2022 19,981.85
C.E. MECHANICAL, INC. WIP- Fixed Assets-Facility Improvement 689322 04/28/2022 17,920.00
TEC EQUIPMENT, INC. Inventory Repair Parts 689376 04/28/2022 17,141.28
ROBERT HALF Temporary Help 689291 04/20/2022 14,941.52
HDR ENGINEERING, INC. Consulting 689201 04/13/2022 13,720.96
CUMMINS SALES AND SERVICE Inventory Repair Parts 689329 04/28/2022 13,336.29
IMPERIAL IRRIGATION DIST Utilities 689156 04/07/2022 12,787.22
UNUM Group Dental & Vision Premiums 689294 04/20/2022 12,419.32
VERIZON WIRELESS Wireless Telephone Service 689172 04/07/2022 11,367.32
ATKINSON, ANDELSON, LOYA RUUD AND ROMO Legal Service 689183 04/13/2022 10,582.00
DYNAMIC BUILDING MAINTENANCE INC Janitorial Services 689151 04/07/2022 9,240.00
NFI PARTS Inventory Repair Parts 689308 04/28/2022 8,648.61
MOTOR COACH INDUSTRIES, INC. Bus lease 689206 04/13/2022 8,081.25
HD INDUSTRIES Inventory Repair Parts 689269 04/20/2022 8,058.77
ADMIRAL SECURITY SERVICES, INC. Security Guard Services 689307 04/28/2022 7,808.32
ANDREA CARTER & ASSOCIATES Marketing & Communication Services 689248 04/20/2022 7,600.00
PRUDENTIAL OVERALL SUPPLY Uniforms 689163 04/07/2022 7,564.48
CALIFORNIA HYDROGEN BUSINESS COUNCIL Membership & Subscriptions 689324 04/28/2022 7,500.00
PALM SPRINGS MOTORS, INC. Inventory Repair Parts 689281 04/20/2022 7,089.01
NFI PARTS Inventory Repair Parts 689177 04/13/2022 7,050.28
FONTANA RADIATOR SERVICE, INC. Repair Parts-Fuel Cell 689340 04/28/2022 6,731.79
US BANK VOYAGER FLEET SYSTEMS Unleaded/Diesel Fuel 689171 04/07/2022 6,699.53
DNSFILTER, INC. Computer/Network Software Agreement 689193 04/13/2022 6,528.00
TRANSIT PRODUCTS & SERVICES Inventory Repair Parts 689235 04/13/2022 6,480.00
AMALGAMATED TRANSIT UNION Union Dues 689181 04/13/2022 6,232.92
Page 23 of 400

SunLine Transit Agency Checks $1,000 and Over
April 2022
Vendor Filed As Name Description Check # Payment Date Payment Amount
AMALGAMATED TRANSIT UNION Union Dues 689247 04/20/2022 6,111.84
AVAIL TECHNOLOGIES Inventory Repair Parts 689250 04/20/2022 6,000.63
BEST BUY BUSINESS ADVANTAGE ACCOUNT WIP-Operations Facility-IT Equipment 689357 04/28/2022 5,695.15
SC FUELS Lubricants- Oil 689293 04/20/2022 5,647.28
CREATIVE BUS SALES, INC, Inventory Repair Parts 689257 04/20/2022 5,491.59
FRANKLIN TRUCK PARTS, INC Inventory Repair Parts 689198 04/13/2022 5,380.57
GLORIA G. SALAZAR Consulting 689345 04/28/2022 5,202.92
PREMIER SECURITY INC WIP- Misc Maintenance Equipment Projects 689162 04/07/2022 5,188.53
TYLER TECHNOLOGIES, INC. Contracted Services 689380 04/28/2022 5,015.00
RUSH TRUCK CENTERS OF CALIFORNIA, INC. Inventory Repair Parts 689225 04/13/2022 4,964.69
ELDORADO NATIONAL (CALIFORNIA), INC. Inventory Repair Parts 689260 04/20/2022 4,565.74
SO CAL GAS CO. Utilities 689227 04/13/2022 4,523.94
JESSE FRESCAS JR. Public Works Technical Support 689159 04/07/2022 4,480.00
PALM SPRINGS MOTORS, INC. Inventory Repair Parts 689362 04/28/2022 4,195.53
TPX COMMUNICATIONS Communication Service 689377 04/28/2022 4,006.79
BEST BEST & KRIEGER LLP Legal Services 689318 04/28/2022 3,937.50
DESERT AIR CONDITIONING, INC. Contract Services 689150 04/07/2022 3,824.00
BROADLUX, INC. Contract Services 689319 04/28/2022 3,726.00
TIME WARNER CABLE Utilities 689233 04/13/2022 3,548.65
SPORTWORKS NORTHWEST, INC. Repair Parts-Fixed Route 689375 04/28/2022 3,510.59
RIDECO US INC SunRide Ride Share Expenses 689164 04/07/2022 3,401.26
YELLOW CAB OF THE DESERT SunRide Ride Share Expenses 689387 04/28/2022 3,328.50
RIDECO US INC SunRide Ride Share Expenses 689366 04/28/2022 3,215.86
DOUG WALL CONSTRUCTION WIP-CNG Station 689152 04/07/2022 2,965.59
PRUDENTIAL OVERALL SUPPLY Uniforms 689286 04/20/2022 2,895.38
IMPERIAL IRRIGATION DIST Utilities 689347 04/28/2022 2,887.09
ATKINSON, ANDELSON, LOYA RUUD AND ROMO Legal Services 689145 04/07/2022 2,849.00
SERVEXO Security Services 689166 04/07/2022 2,847.00
CALIFORNIA STATE DISBURSEMENT UNIT Garnishment 689186 04/13/2022 2,732.30
CALIFORNIA STATE DISBURSEMENT UNIT Garnishment 689253 04/20/2022 2,732.30
DESERT URGENT CARE Medical Exams & Testing 689157 04/07/2022 2,670.00
ADMIRAL SECURITY SERVICES, INC. Security Guard Services 689176 04/13/2022 2,595.29
BUREAU VERITAS NORTH AMERICA Inventory Repair Parts 689184 04/13/2022 2,503.19
CALIFORNIA DEPARTMENT OF TAX & FEE ADMINISTRATION
Quarterly Used Sale Tax 689323 04/28/2022 2,501.00
B&H PHOTO-VIDEO Advertising 689316 04/28/2022 2,490.35
VAN DE POL PETROLEUM Lubricants- Oil 689384 04/28/2022 2,431.80
SOCALGAS Utilities 689228 04/13/2022 2,276.11
VALLEY OFFICE EQUIPMENT, INC. Copier Service 689240 04/13/2022 2,240.35
FORENSIC DRUG TESTING SERVICES Alcohol & Drug Testing 689341 04/28/2022 2,103.00
Page 24 of 400

SunLine Transit Agency Checks $1,000 and Over
April 2022
Vendor Filed As Name Description Check # Payment Date Payment Amount
FULTON DISTRIBUTING Bus Stop Supplies 689333 04/28/2022 2,085.43
YELLOW CAB OF THE DESERT Taxi Voucher Program 689306 04/20/2022 2,041.20
SC FUELS Lubricants- Oil 689372 04/28/2022 2,030.66
GILLIG LLC Inventory Repair Parts 689267 04/20/2022 1,959.80
TRAPEZE SOFTWARE GROUP INC. WIP- Trapeze Upgrade 689378 04/28/2022 1,939.00
BURRTEC WASTE & RECYCLING SERVICES Trash Service 689146 04/07/2022 1,750.86
GRAINGER Inventory Repair Parts 689346 04/28/2022 1,749.53
AIR & LUBE SYSTEMS INC Contract Services 689310 04/28/2022 1,681.50
ALPHA MEDIA LLC Advertising 689246 04/20/2022 1,671.00
INLAND EMPIRE COLLISION Repair Claims 689230 04/13/2022 1,637.48
CARQUEST AUTO PARTS STORES Inventory Repair Parts 689188 04/13/2022 1,557.09
IMPERIAL IRRIGATION DIST Utilities 689270 04/20/2022 1,541.02
FRONTIER COMMUNICATIONS Utilities 689342 04/28/2022 1,525.00
MILE3 WEB DEVELOPMENT Website Maintenance 689276 04/20/2022 1,470.00
SERVEXO Security Services 689226 04/13/2022 1,423.50
BURRTEC WASTE & RECYCLING SERVICES Trash Service 689147 04/07/2022 1,415.65
RUSH TRUCK CENTERS OF CALIFORNIA, INC. Inventory Repair Parts 689370 04/28/2022 1,353.44
ROMAINE ELECTRIC CORP. Inventory Repair Parts 689223 04/13/2022 1,297.00
CREATIVE BUS SALES, INC, Inventory Repair Parts 689191 04/13/2022 1,220.42
JACKSON LEWIS P.C. Insurance Loss 689348 04/28/2022 1,209.00
QUICK FIX AUTO GLASS Repair Parts-Fixed Route 689179 04/13/2022 1,200.00
HOME DEPOT CREDIT SERVICES Facility Maintenance 689202 04/13/2022 1,191.74
JEFF GUIDRY Travel-Meeting/Seminars 689158 04/07/2022 1,189.21
ELDORADO NATIONAL (CALIFORNIA), INC. Inventory Repair Parts 689335 04/28/2022 1,098.56
PLAZA TOWING, INC. Towing Service 689365 04/28/2022 1,070.00
MSC INDUSTRIAL SUPPLY CO Shop Supplies Misc 689356 04/28/2022 1,064.14
GILLIG LLC Inventory Repair Parts 689343 04/28/2022 1,000.85
QUADIENT FINANCE USA, INC. Postage 689287 04/20/2022 1,000.00
Total Checks Over $1,000 $1,670,641.07
Total Checks Under $1,000 $40,178.84
Total Checks $1,710,819.91
Page 25 of 400
ITEM 9B
SunLine Transit Agency
CONSENT CALENDAR
DATE: June 22, 2022 RECEIVE & FILE
TO: Finance/Audit Committee Board of Directors
RE: Credit Card Statements for April 2022
Summary:
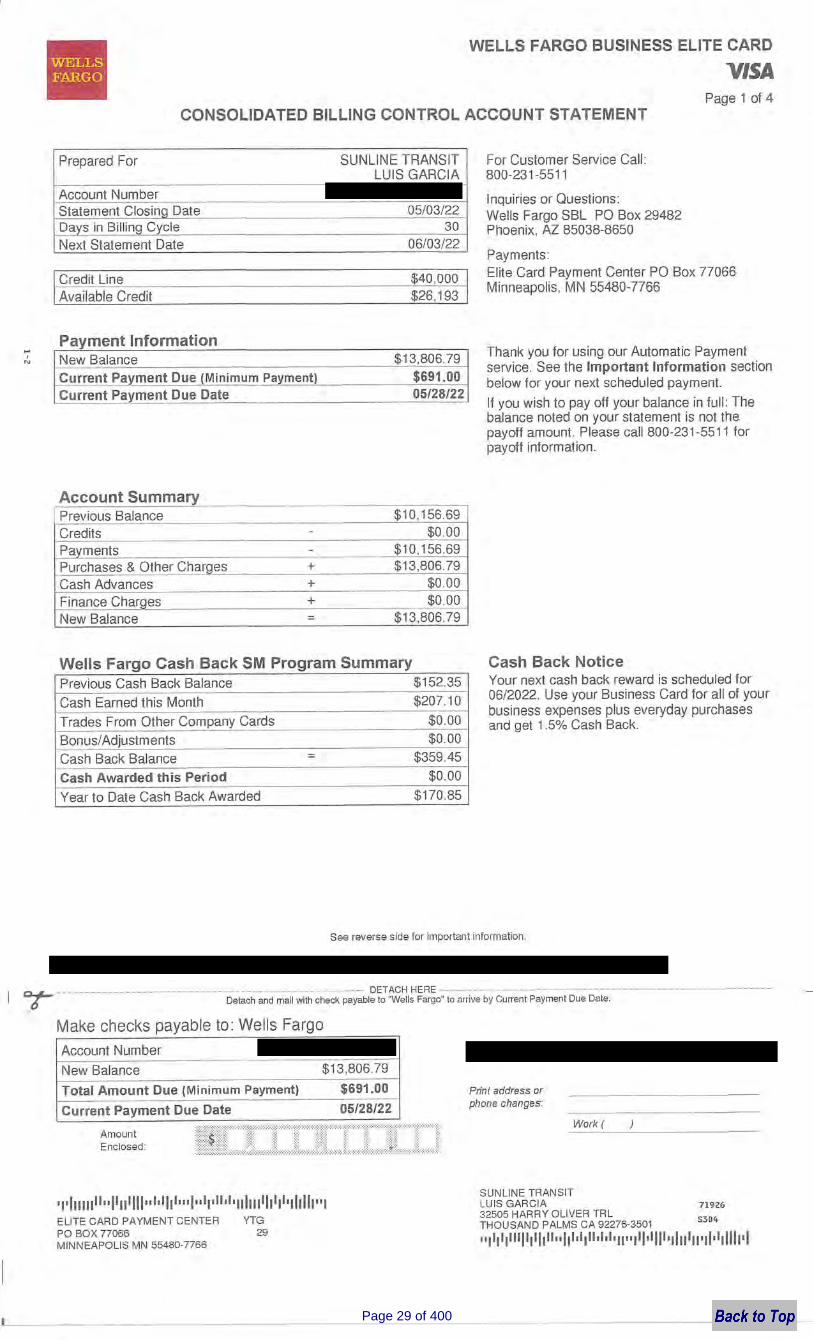
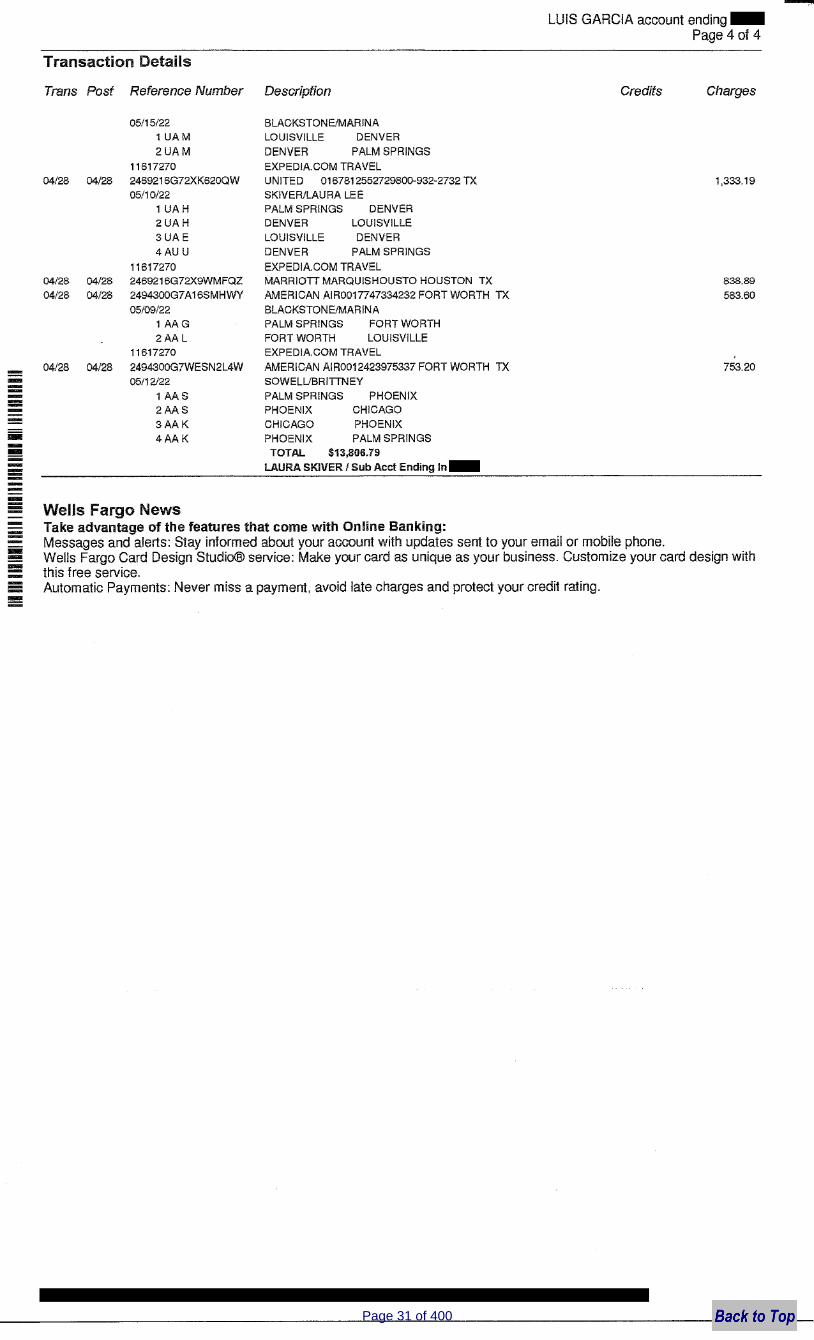
The attached report summarizes the Agency’s credit card expenses for April 2022. Credit card transactions through the CEO/General Manager credit card align with the statement closing dates of May 3, 2022. The report also summarizes transactions for the credit card utilized for Procurement which aligns with the statement closing date of April 30, 2022, for the reporting period.
Recommendation:
Receive and file.
Page 26 of 400

Trans. Date Post Date Reference Credits Charges
1 4/5/2022 4/5/2022 P&O CAB $70.00
2 4/12/2022 4/12/2022 CTAA $970.00
3 4/14/2022 4/14/2022 Expedia $12.53
4 4/14/2022 4/14/2022 United Airlines $628.60
5 4/14/2022 4/14/2022 SurveyMonkey $384.00
6 4/14/2022 4/14/2022 American Airlines $765.60
7 4/15/2022 4/15/2022 Panera $132.73
8 4/18/2022 4/18/2022 American Airlines $45.23
9 4/18/2022 4/18/2022 American Airlines $886.19
10 4/19/2022 4/19/2022 Staples $47.40
11 4/19/2022 4/19/2022 Marriott $608.76
12 4/19/2022 4/19/2022 Marriott $608.76
13 4/22/2022 4/22/2022 Hyatt Regency $1,090.18
14 4/23/2022 4/23/2022 Marriott $958.10CALACT 2022 Spring Conference & Expo in Newport Beach, CA - Lodging for 5 Nights; Tamara
Miles, Chief of Human Relations
APTA Mobility Conference in Columbus, OH - Lodging for 3 Nights; Frank Rytych, Chief
Maintenance Officer
P&O Cab Fare for the World Hydrogen North American in Houston, TX; Lauren Skiver, CEO/General
Manager
*Receipt pending*
American Airlines Flight from Palm Springs, CA Louisville, KY for Travel to CTAA Expo Conference in Kentucky; Isabel Acosta, Chief Transportation Officer
Expedia Booking Fee for Flight from Palm Springs, CA to Louisville, KY for Travel to CTAA Expo
Conference in Kentucky; Isabel Acosta, Chief Transportation Officer
United Airlines Flight from Louisville, KY to Palm Springs, CA for Travel from CTAA Expo
Conference in Kentucky; Isabel Acosta, Chief Transportation Officer
SurveyMonkey - One (1) Year Subscription Renewal; CEO/General Manager Performance
Evaluation
Panera Catering Order; Lunch budget meeting with Chiefs
American Airlines Roundtrip Flight from Ontario, CA to Columbus, OH for Travel to APTA Mobility
Conference in Ohio; Frank Rytych, Chief Maintenance Officer's Preferred Seating
American Airlines Roundtrip Flight from Ontario, CA to Columbus, OH for Travel to APTA Mobility
Conference in Ohio; Frank Rytych, Chief Maintenance Officer
CTAA Expo Conference May 10-14, 2022 - Registration; Lauren Skiver, CEO/General Manager;
Isabel Acosta, Chief Transporation Officer
CALACT 2022 Spring Conference & Expo in Newport Beach, CA - Lodging for 3 Nights; Vanessa
Mora, Chief Safety Officer
CALACT 2022 Spring Conference & Expo in Newport Beach, CA - Lodging for 3 Nights; Lauren
Skiver, CEO/General Manager
Staples office supplies - Earth Day Farebox Labels
SunLine Transit Agency Visa Credit Card Statement
Closing Date: 5/3/2022
Name on Card: Lauren Skiver
Detail - Description
WellsFargo04.22Page 27 of 400
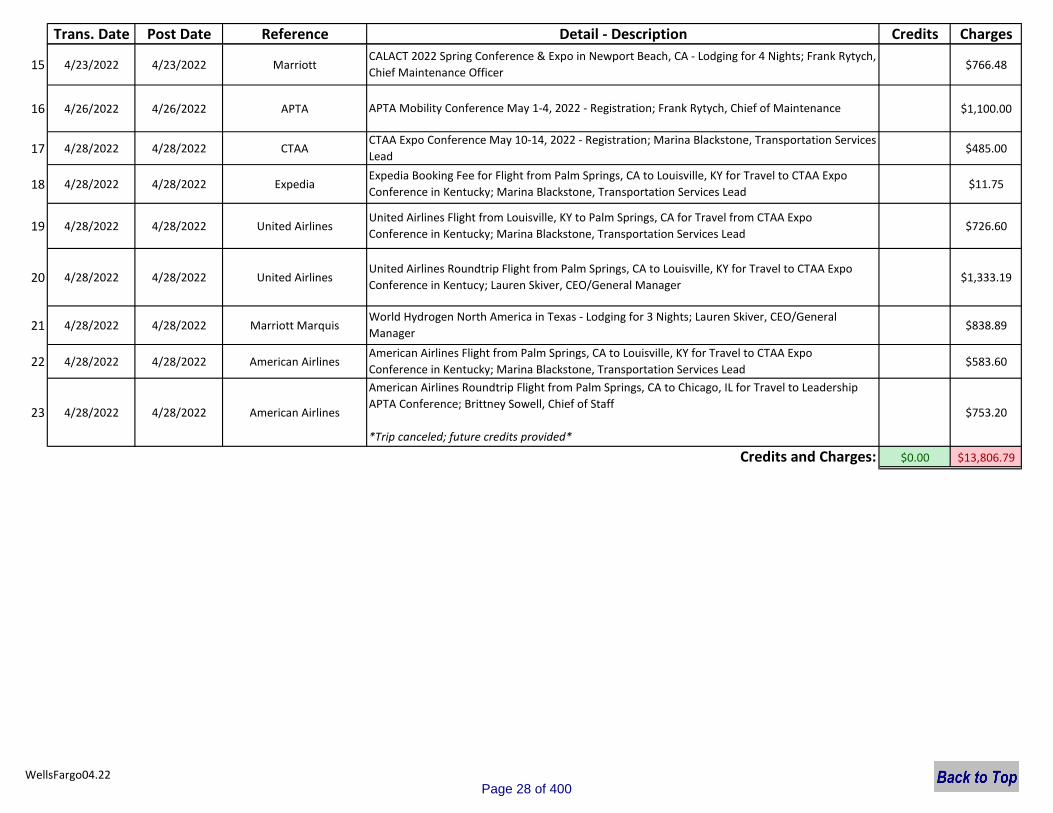
Trans. Date Post Date Reference Credits ChargesDetail - Description
15 4/23/2022 4/23/2022 Marriott $766.48
16 4/26/2022 4/26/2022 APTA $1,100.00
17 4/28/2022 4/28/2022 CTAA $485.00
18 4/28/2022 4/28/2022 Expedia $11.75
19 4/28/2022 4/28/2022 United Airlines $726.60
20 4/28/2022 4/28/2022 United Airlines $1,333.19
21 4/28/2022 4/28/2022 Marriott Marquis $838.89
22 4/28/2022 4/28/2022 American Airlines $583.60
23 4/28/2022 4/28/2022 American Airlines $753.20
$0.00 $13,806.79
World Hydrogen North America in Texas - Lodging for 3 Nights; Lauren Skiver, CEO/General
Manager
American Airlines Roundtrip Flight from Palm Springs, CA to Chicago, IL for Travel to Leadership
APTA Conference; Brittney Sowell, Chief of Staff
*Trip canceled; future credits provided*
CALACT 2022 Spring Conference & Expo in Newport Beach, CA - Lodging for 4 Nights; Frank Rytych,
Chief Maintenance Officer
APTA Mobility Conference May 1-4, 2022 - Registration; Frank Rytych, Chief of Maintenance
CTAA Expo Conference May 10-14, 2022 - Registration; Marina Blackstone, Transportation Services
Lead
United Airlines Flight from Louisville, KY to Palm Springs, CA for Travel from CTAA Expo
Conference in Kentucky; Marina Blackstone, Transportation Services Lead
Expedia Booking Fee for Flight from Palm Springs, CA to Louisville, KY for Travel to CTAA Expo
Conference in Kentucky; Marina Blackstone, Transportation Services Lead
American Airlines Flight from Palm Springs, CA to Louisville, KY for Travel to CTAA Expo
Conference in Kentucky; Marina Blackstone, Transportation Services Lead
Credits and Charges:
United Airlines Roundtrip Flight from Palm Springs, CA to Louisville, KY for Travel to CTAA Expo Conference in Kentucy; Lauren Skiver, CEO/General Manager
WellsFargo04.22Page 28 of 400
Page 29 of 400

Page 30 of 400
Page 31 of 400
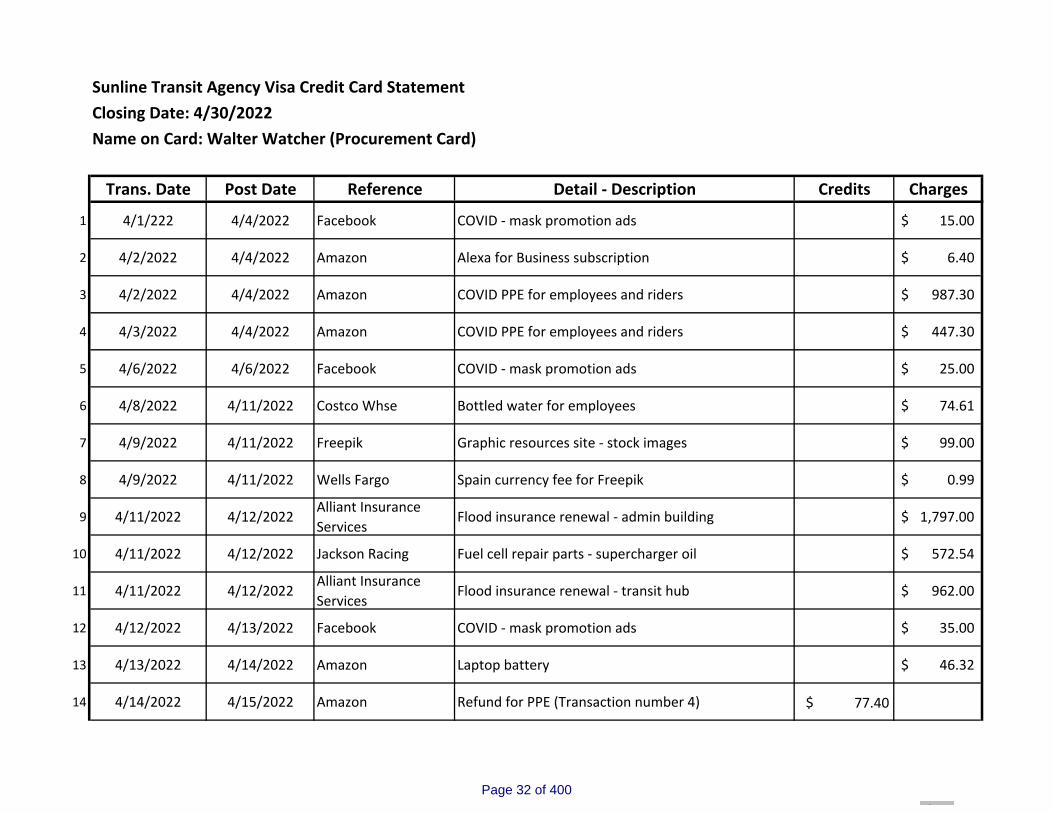
Sunline Transit Agency Visa Credit Card Statement Closing Date: 4/30/2022Name on Card: Walter Watcher (Procurement Card)
Trans. Date Post Date Reference Detail ‐ Description Credits Charges
1 4/1/222 4/4/2022 Facebook COVID ‐ mask promotion ads 15.00$
2 4/2/2022 4/4/2022 Amazon Alexa for Business subscription 6.40$
3 4/2/2022 4/4/2022 Amazon COVID PPE for employees and riders 987.30$
4 4/3/2022 4/4/2022 Amazon COVID PPE for employees and riders 447.30$
5 4/6/2022 4/6/2022 Facebook COVID ‐ mask promotion ads 25.00$
6 4/8/2022 4/11/2022 Costco Whse Bottled water for employees 74.61$
7 4/9/2022 4/11/2022 Freepik Graphic resources site - stock images 99.00$
8 4/9/2022 4/11/2022 Wells Fargo Spain currency fee for Freepik 0.99$
9 4/11/2022 4/12/2022Alliant Insurance Services
Flood insurance renewal ‐ admin building 1,797.00$
10 4/11/2022 4/12/2022 Jackson Racing Fuel cell repair parts ‐ supercharger oil 572.54$
11 4/11/2022 4/12/2022Alliant Insurance Services
Flood insurance renewal ‐ transit hub 962.00$
12 4/12/2022 4/13/2022 Facebook COVID ‐ mask promotion ads 35.00$
13 4/13/2022 4/14/2022 Amazon Laptop battery 46.32$
14 4/14/2022 4/15/2022 Amazon Refund for PPE (Transaction number 4) 77.40$
Page 32 of 400
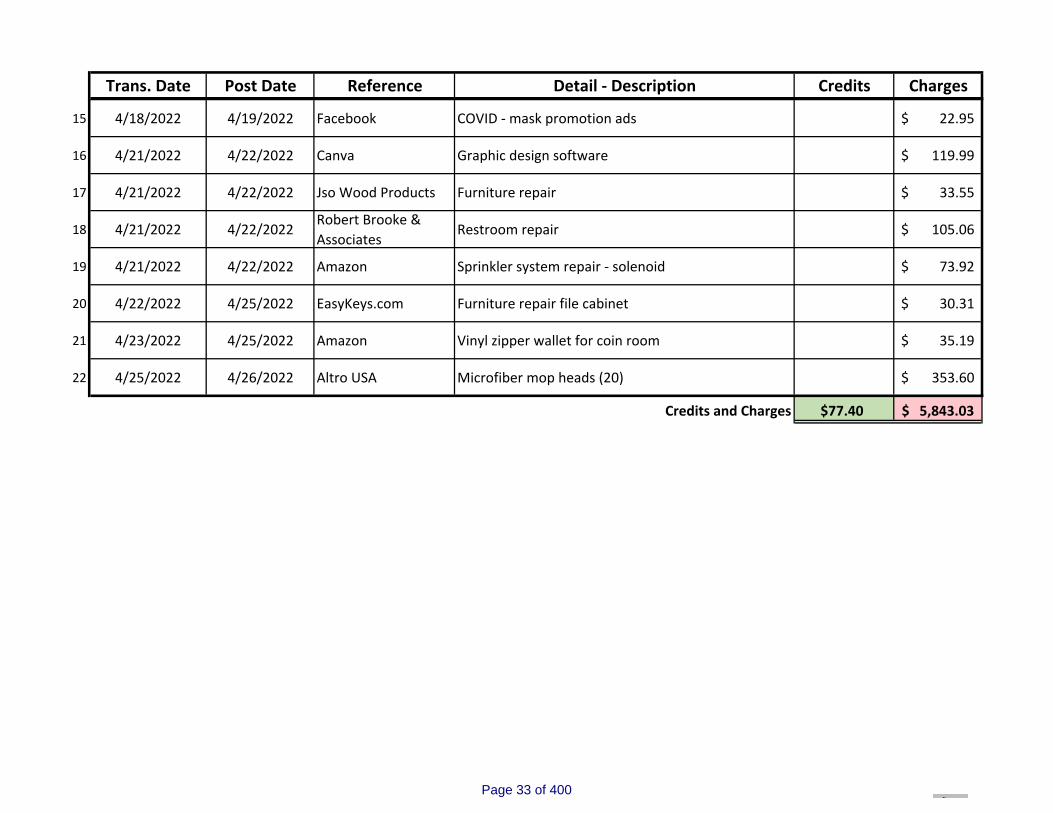
Trans. Date Post Date Reference Detail ‐ Description Credits Charges
15 4/18/2022 4/19/2022 Facebook COVID ‐ mask promotion ads 22.95$
16 4/21/2022 4/22/2022 Canva Graphic design software 119.99$
17 4/21/2022 4/22/2022 Jso Wood Products Furniture repair 33.55$
18 4/21/2022 4/22/2022Robert Brooke & Associates
Restroom repair 105.06$
19 4/21/2022 4/22/2022 Amazon Sprinkler system repair ‐ solenoid 73.92$
20 4/22/2022 4/25/2022 EasyKeys.com Furniture repair file cabinet 30.31$
21 4/23/2022 4/25/2022 Amazon Vinyl zipper wallet for coin room 35.19$
22 4/25/2022 4/26/2022 Altro USA Microfiber mop heads (20) 353.60$
Credits and Charges $77.40 5,843.03$
Page 33 of 400
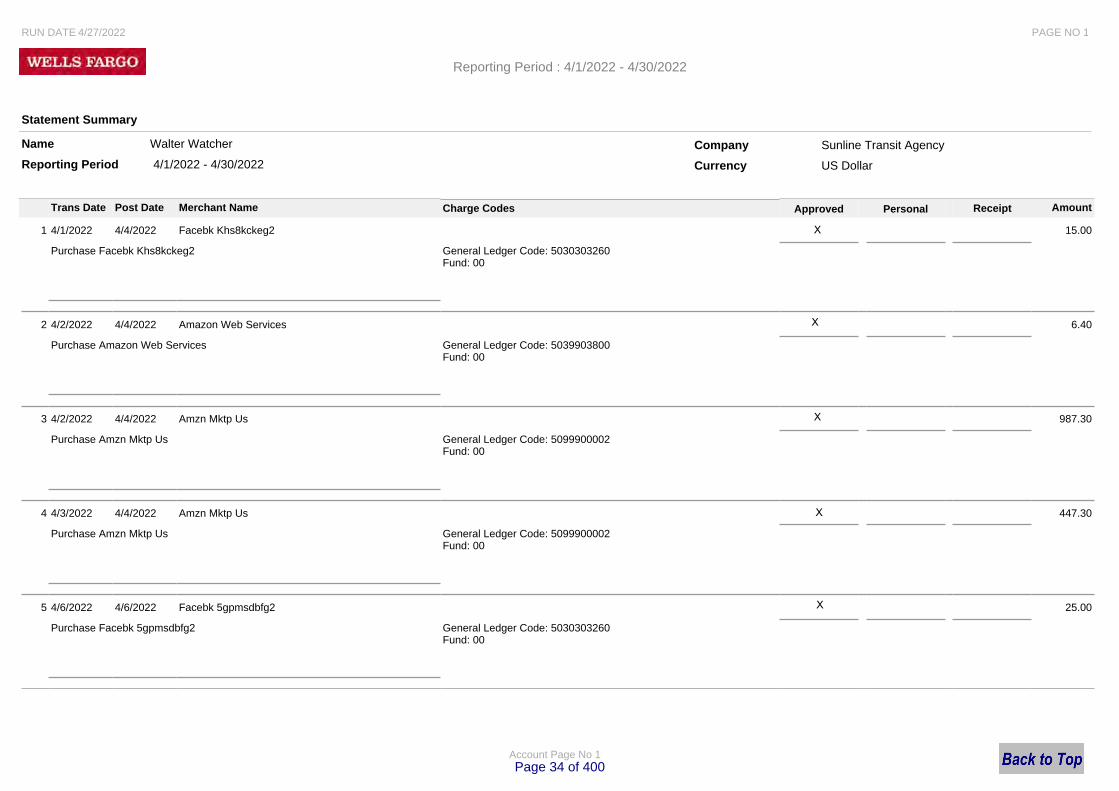
RUN DATE 4/27/2022 PAGE NO 1
Statement Summary
Company Sunline Transit Agency
Currency US Dollar
Trans Date Post Date Merchant Name Charge Codes Approved Personal Receipt Amount
1 4/1/2022 4/4/2022 Facebk Khs8kckeg2 15.00
Purchase Facebk Khs8kckeg2 General Ledger Code: 5030303260Fund: 00
2 4/2/2022 4/4/2022 Amazon Web Services 6.40
Purchase Amazon Web Services General Ledger Code: 5039903800Fund: 00
3 4/2/2022 4/4/2022 Amzn Mktp Us 987.30
Purchase Amzn Mktp Us General Ledger Code: 5099900002Fund: 00
4 4/3/2022 4/4/2022 Amzn Mktp Us 447.30
Purchase Amzn Mktp Us General Ledger Code: 5099900002Fund: 00
5 4/6/2022 4/6/2022 Facebk 5gpmsdbfg2 25.00
Purchase Facebk 5gpmsdbfg2 General Ledger Code: 5030303260Fund: 00
Name
Reporting Period
Walter Watcher
4/1/2022 - 4/30/2022
Reporting Period : 4/1/2022 - 4/30/2022
Account Page No 1
X
X
X
X
X
Page 34 of 400
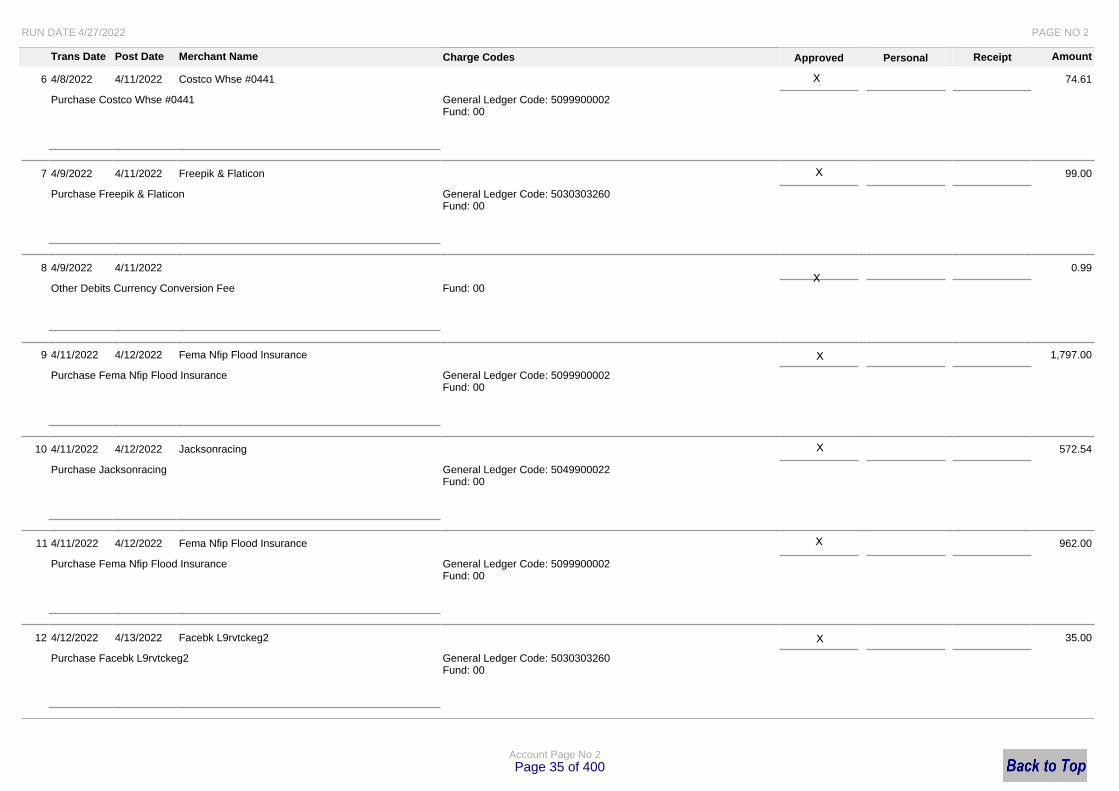
RUN DATE 4/27/2022 PAGE NO 2
Trans Date Post Date Merchant Name Charge Codes Approved Personal Receipt Amount
6 4/8/2022 4/11/2022 Costco Whse #0441 74.61
Purchase Costco Whse #0441 General Ledger Code: 5099900002Fund: 00
7 4/9/2022 4/11/2022 Freepik & Flaticon 99.00
Purchase Freepik & Flaticon General Ledger Code: 5030303260Fund: 00
8 4/9/2022 4/11/2022 0.99
Other Debits Currency Conversion Fee Fund: 00
9 4/11/2022 4/12/2022 Fema Nfip Flood Insurance 1,797.00
Purchase Fema Nfip Flood Insurance General Ledger Code: 5099900002Fund: 00
10 4/11/2022 4/12/2022 Jacksonracing 572.54
Purchase Jacksonracing General Ledger Code: 5049900022Fund: 00
11 4/11/2022 4/12/2022 Fema Nfip Flood Insurance 962.00
Purchase Fema Nfip Flood Insurance General Ledger Code: 5099900002Fund: 00
12 4/12/2022 4/13/2022 Facebk L9rvtckeg2 35.00
Purchase Facebk L9rvtckeg2 General Ledger Code: 5030303260Fund: 00
Account Page No 2
X
X
X
X
X
X
X
Page 35 of 400
RUN DATE 4/27/2022 PAGE NO 3
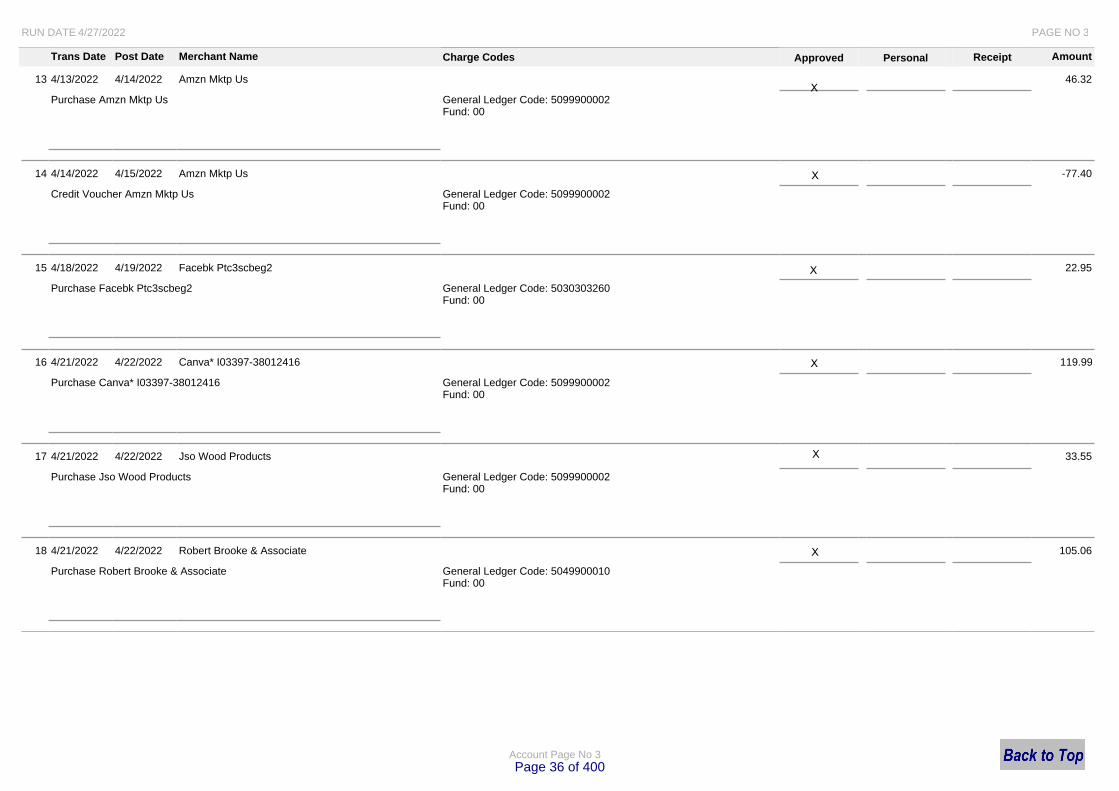
Trans Date Post Date Merchant Name Charge Codes Approved Personal Receipt Amount
13 4/13/2022 4/14/2022 Amzn Mktp Us 46.32
Purchase Amzn Mktp Us General Ledger Code: 5099900002Fund: 00
14 4/14/2022 4/15/2022 Amzn Mktp Us -77.40
Credit Voucher Amzn Mktp Us General Ledger Code: 5099900002Fund: 00
15 4/18/2022 4/19/2022 Facebk Ptc3scbeg2 22.95
Purchase Facebk Ptc3scbeg2 General Ledger Code: 5030303260Fund: 00
16 4/21/2022 4/22/2022 Canva* I03397-38012416 119.99
Purchase Canva* I03397-38012416 General Ledger Code: 5099900002Fund: 00
17 4/21/2022 4/22/2022 Jso Wood Products 33.55
Purchase Jso Wood Products General Ledger Code: 5099900002Fund: 00
18 4/21/2022 4/22/2022 Robert Brooke & Associate 105.06
Purchase Robert Brooke & Associate General Ledger Code: 5049900010Fund: 00
Account Page No 3
X
X
X
X
X
X
Page 36 of 400
RUN DATE 4/27/2022 PAGE NO 4
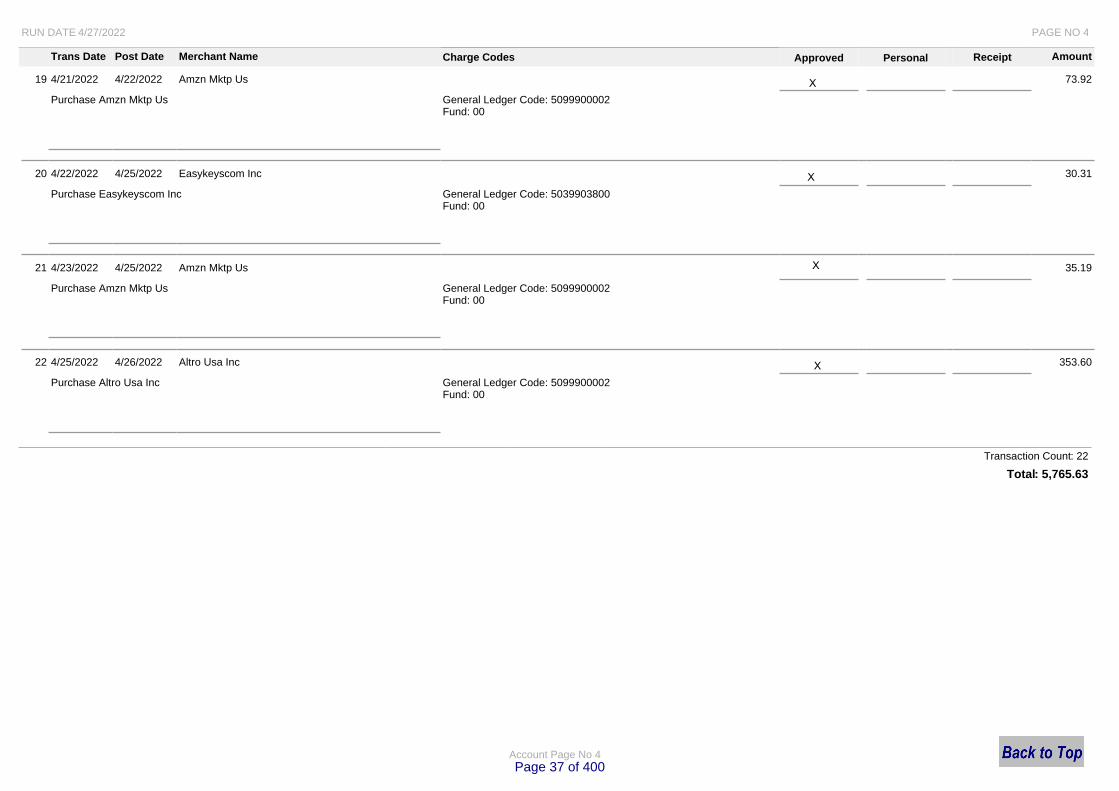
Trans Date Post Date Merchant Name Charge Codes Approved Personal Receipt Amount
19 4/21/2022 4/22/2022 Amzn Mktp Us 73.92
Purchase Amzn Mktp Us General Ledger Code: 5099900002Fund: 00
20 4/22/2022 4/25/2022 Easykeyscom Inc 30.31
Purchase Easykeyscom Inc General Ledger Code: 5039903800Fund: 00
21 4/23/2022 4/25/2022 Amzn Mktp Us 35.19
Purchase Amzn Mktp Us General Ledger Code: 5099900002Fund: 00
22 4/25/2022 4/26/2022 Altro Usa Inc 353.60
Purchase Altro Usa Inc General Ledger Code: 5099900002Fund: 00
Transaction Count: 22
Total: 5,765.63
Account Page No 4
X
X
X
X
Page 37 of 400
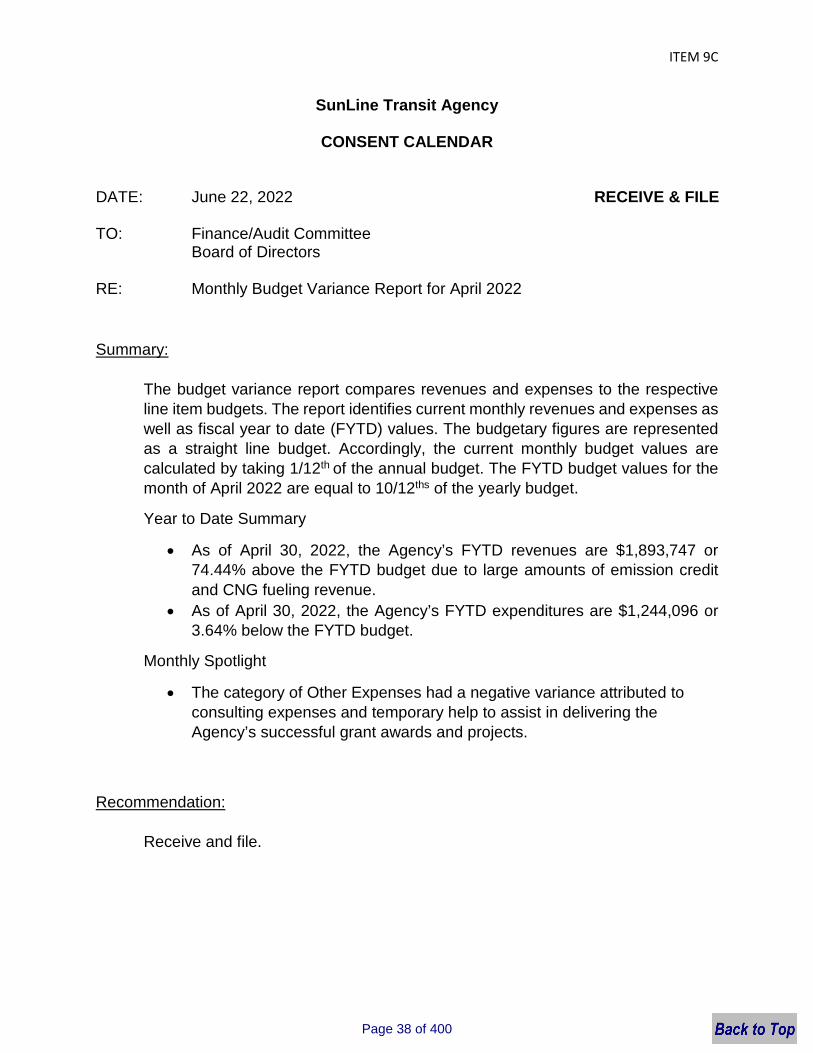
ITEM 9C
SunLine Transit Agency
CONSENT CALENDAR
DATE: June 22, 2022 RECEIVE & FILE
TO: Finance/Audit Committee Board of Directors
RE: Monthly Budget Variance Report for April 2022
Summary:
The budget variance report compares revenues and expenses to the respective line item budgets. The report identifies current monthly revenues and expenses as well as fiscal year to date (FYTD) values. The budgetary figures are represented as a straight line budget. Accordingly, the current monthly budget values are calculated by taking 1/12th of the annual budget. The FYTD budget values for the month of April 2022 are equal to 10/12ths of the yearly budget.
Year to Date Summary
As of April 30, 2022, the Agency’s FYTD revenues are $1,893,747 or 74.44% above the FYTD budget due to large amounts of emission credit and CNG fueling revenue.
As of April 30, 2022, the Agency’s FYTD expenditures are $1,244,096 or 3.64% below the FYTD budget.
Monthly Spotlight
The category of Other Expenses had a negative variance attributed to consulting expenses and temporary help to assist in delivering the Agency’s successful grant awards and projects.
Recommendation:
Receive and file.
Page 38 of 400
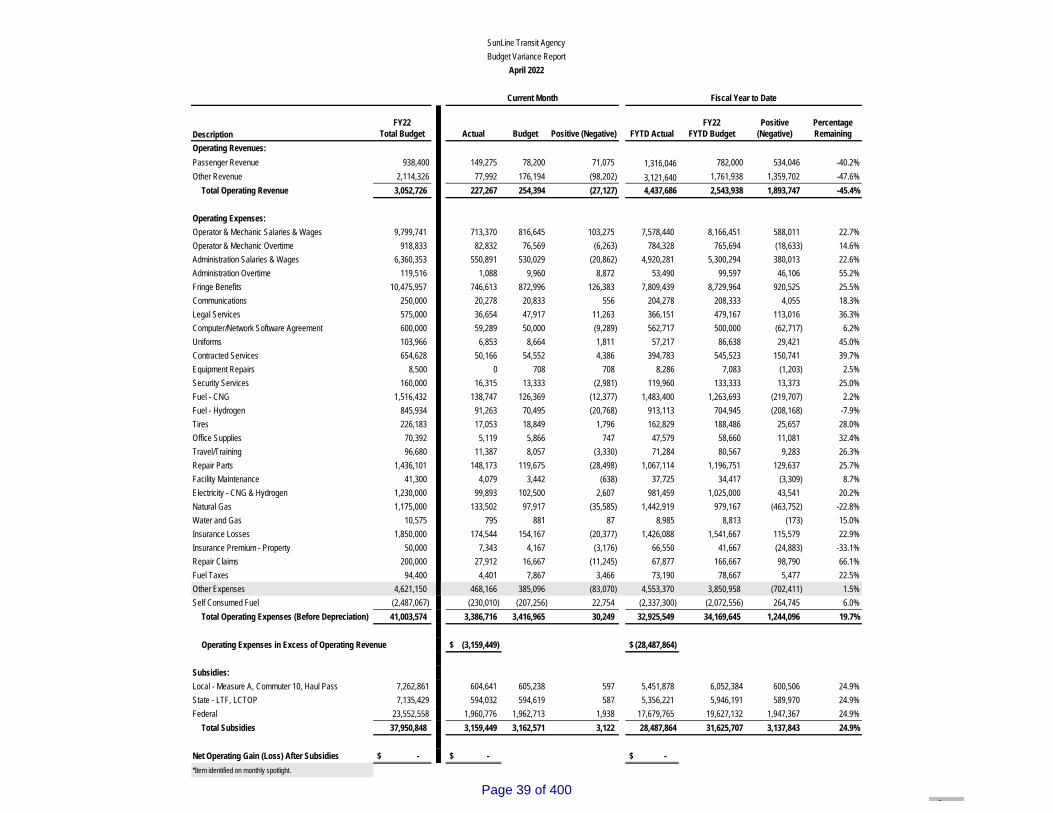
FY22 Total Budget Actual Budget Positive (Negative) FYTD Actual
FY22 FYTD Budget
Positive (Negative)
Percentage Remaining
Operating Revenues:Passenger Revenue 938,400 149,275 78,200 71,075 1,316,046 782,000 534,046 -40.2%Other Revenue 2,114,326 77,992 176,194 (98,202) 3,121,640 1,761,938 1,359,702 -47.6%
Total Operating Revenue 3,052,726 227,267 254,394 (27,127) 4,437,686 2,543,938 1,893,747 -45.4%
9,799,741 713,370 816,645 103,275 7,578,440 8,166,451 588,011 22.7%918,833 82,832 76,569 (6,263) 784,328 765,694 (18,633) 14.6%
6,360,353 550,891 530,029 (20,862) 4,920,281 5,300,294 380,013 22.6%119,516 1,088 9,960 8,872 53,490 99,597 46,106 55.2%
10,475,957 746,613 872,996 126,383 7,809,439 8,729,964 920,525 25.5%250,000 20,278 20,833 556 204,278 208,333 4,055 18.3%575,000 36,654 47,917 11,263 366,151 479,167 113,016 36.3%600,000 59,289 50,000 (9,289) 562,717 500,000 (62,717) 6.2%103,966 6,853 8,664 1,811 57,217 86,638 29,421 45.0%654,628 50,166 54,552 4,386 394,783 545,523 150,741 39.7%
8,500 0 708 708 8,286 7,083 (1,203) 2.5%160,000 16,315 13,333 (2,981) 119,960 133,333 13,373 25.0%
1,516,432 138,747 126,369 (12,377) 1,483,400 1,263,693 (219,707) 2.2%845,934 91,263 70,495 (20,768) 913,113 704,945 (208,168) -7.9%226,183 17,053 18,849 1,796 162,829 188,486 25,657 28.0%
70,392 5,119 5,866 747 47,579 58,660 11,081 32.4%96,680 11,387 8,057 (3,330) 71,284 80,567 9,283 26.3%
1,436,101 148,173 119,675 (28,498) 1,067,114 1,196,751 129,637 25.7%41,300 4,079 3,442 (638) 37,725 34,417 (3,309) 8.7%
1,230,000 99,893 102,500 2,607 981,459 1,025,000 43,541 20.2%1,175,000 133,502 97,917 (35,585) 1,442,919 979,167 (463,752) -22.8%
10,575 795 881 87 8,985 8,813 (173) 15.0%1,850,000 174,544 154,167 (20,377) 1,426,088 1,541,667 115,579 22.9%
50,000 7,343 4,167 (3,176) 66,550 41,667 (24,883) -33.1%200,000 27,912 16,667 (11,245) 67,877 166,667 98,790 66.1%
94,400 4,401 7,867 3,466 73,190 78,667 5,477 22.5%4,621,150 468,166 385,096 (83,070) 4,553,370 3,850,958 (702,411) 1.5%
(2,487,067) (230,010) (207,256) 22,754 (2,337,300) (2,072,556) 264,745 6.0%41,003,574 3,386,716 3,416,965 30,249 32,925,549 34,169,645 1,244,096 19.7%
Operating Expenses in Excess of Operating Revenue (3,159,449)$ (28,487,864)$
Subsidies:Local - Measure A, Commuter 10, Haul Pass 7,262,861 604,641 605,238 597 5,451,878 6,052,384 600,506 24.9%State - LTF, LCTOP 7,135,429 594,032 594,619 587 5,356,221 5,946,191 589,970 24.9%Federal 23,552,558 1,960,776 1,962,713 1,938 17,679,765 19,627,132 1,947,367 24.9%
Total Subsidies 37,950,848 3,159,449 3,162,571 3,122 28,487,864 31,625,707 3,137,843 24.9%
Net Operating Gain (Loss) After Subsidies -$ -$ -$ *Item identified on monthly spotlight.
Description
SunLine Transit AgencyBudget Variance Report
April 2022
Current Month Fiscal Year to Date
Operating Expenses: Operator & Mechanic Salaries & Wages Operator & Mechanic Overtime Administration Salaries & Wages Administration Overtime Fringe Benefits Communications Legal Services Computer/Network Software Agreement Uniforms Contracted Services Equipment Repairs Security Services Fuel - CNG Fuel - Hydrogen Tires Office Supplies Travel/Training Repair Parts Facility Maintenance Electricity - CNG & Hydrogen Natural Gas Water and Gas Insurance Losses Insurance Premium - Property Repair Claims Fuel Taxes Other Expenses Self Consumed Fuel
Total Operating Expenses (Before Depreciation)
Page 39 of 400

FY22 Total Budget Actual Budget
Positive (Negative) FYTD Actual
FY22 FYTD Budget Positive (Negative)
Percentage Remaining
Operating Expenses:Wages & Benefits 27,674,400 2,094,795 2,306,200 211,405 21,145,978 23,062,000 1,916,022 23.6%Services 4,081,926 392,586 340,161 (52,425) 3,480,266 3,401,605 (78,661) 14.7%Fuels & Lubricants 2,525,519 249,518 210,460 (39,058) 2,541,808 2,104,599 (437,209) -0.6%Tires 226,183 17,053 18,849 1,796 162,829 188,486 25,657 28.0%Materials and Supplies 1,857,038 174,930 154,753 (20,177) 1,427,123 1,547,532 120,409 23.2%Utilities 2,699,927 255,220 224,994 (30,226) 2,704,336 2,249,939 (454,397) -0.2%Casualty & Liability 3,355,200 323,523 279,600 (43,923) 2,704,947 2,796,000 91,053 19.4%Taxes and Fees 94,400 4,401 7,867 3,466 73,190 78,667 5,477 22.5%Miscellaneous Expenses 976,048 104,699 81,337 (23,362) 1,022,373 813,373 (209,000) -4.7%Self Consumed Fuel (2,487,067) (230,010) (207,256) 22,754 (2,337,300) (2,072,556) 264,745 6.0%
Total Operating Expenses (Before Depreciation) 41,003,574 3,386,716 3,416,965 30,249 32,925,549 34,169,645 1,244,096 19.7%
Revenues:Passenger Revenue 938,400 145,383 78,200 67,183 1,316,046 782,000 534,046 -40.2%Other Revenue 2,114,326 145,692 176,194 (30,502) 3,121,640 1,761,938 1,359,702 -47.6%
Total Operating Revenue 3,052,726 291,075 254,394 36,681 4,437,686 2,543,938 1,893,747 -45.4%
Net Operating Gain (Loss) (3,095,641)$ (28,487,864)$
Subsidies:Local - Measure A, Commuter 10, Haul Pass 7,262,861 592,430 605,238 12,809 5,451,878 6,052,384 600,506 24.9%State - LTF, LCTOP 7,135,429 582,035 594,619 12,584 5,356,221 5,946,191 589,970 24.9%Federal - CMAQ,5307,5309,5310,5311,5311(f),5312 23,552,558 1,921,176 1,962,713 41,537 17,679,765 19,627,132 1,947,367 24.9%
Total Subsidies 37,950,848 3,095,641 3,162,571 66,930 28,487,864 31,625,707 3,137,843 24.9%
Net Operating Gain (Loss) After Subsidies -$ -$ -$
Description
SunLine Transit AgencyBudget Variance Report
April 2022
Current Month Fiscal Year to Date
Page 40 of 400
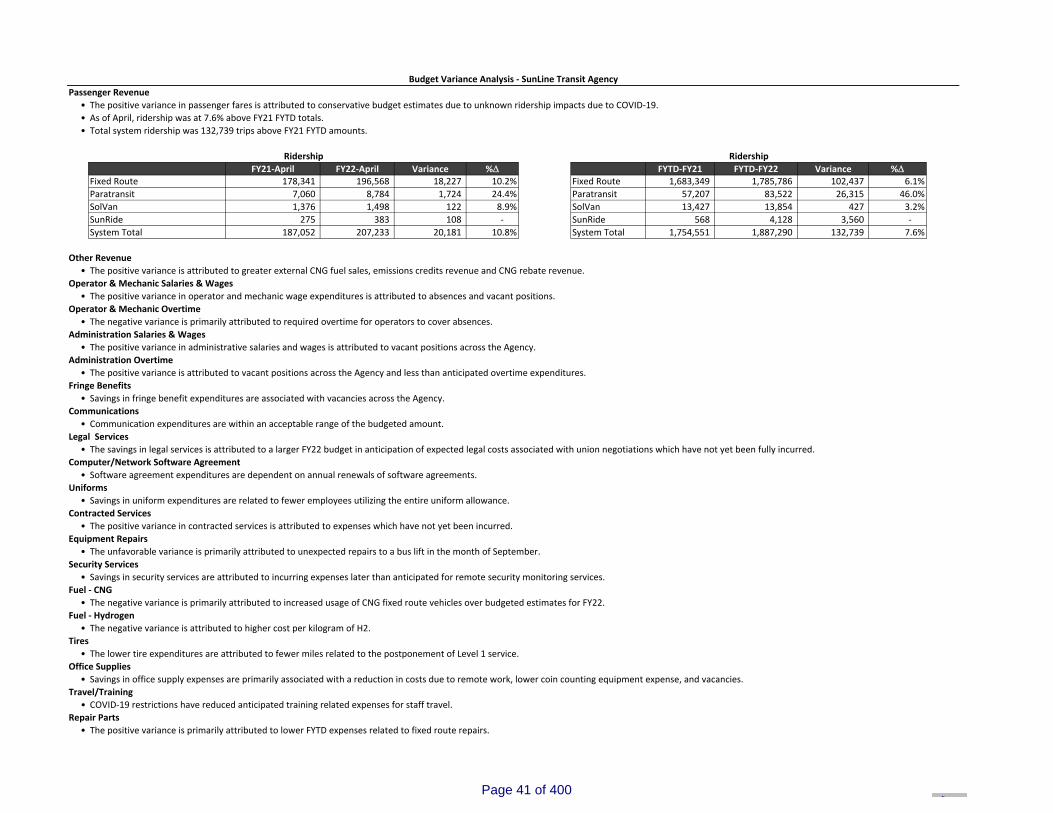
Passenger Revenue• The positive variance in passenger fares is attributed to conservative budget estimates due to unknown ridership impacts due to COVID‐19. • As of April, ridership was at 7.6% above FY21 FYTD totals.• Total system ridership was 132,739 trips above FY21 FYTD amounts.
FY21‐April FY22‐April Variance % FYTD‐FY21 FYTD‐FY22 Variance %Fixed Route 178,341 196,568 18,227 10.2% Fixed Route 1,683,349 1,785,786 102,437 6.1%Paratransit 7,060 8,784 1,724 24.4% Paratransit 57,207 83,522 26,315 46.0%SolVan 1,376 1,498 122 8.9% SolVan 13,427 13,854 427 3.2%SunRide 275 383 108 ‐ SunRide 568 4,128 3,560 ‐ System Total 187,052 207,233 20,181 10.8% System Total 1,754,551 1,887,290 132,739 7.6%
Other Revenue• The positive variance is attributed to greater external CNG fuel sales, emissions credits revenue and CNG rebate revenue.
Operator & Mechanic Salaries & Wages• The positive variance in operator and mechanic wage expenditures is attributed to absences and vacant positions.
Operator & Mechanic Overtime• The negative variance is primarily attributed to required overtime for operators to cover absences.
Administration Salaries & Wages • The positive variance in administrative salaries and wages is attributed to vacant positions across the Agency.
Administration Overtime• The positive variance is attributed to vacant positions across the Agency and less than anticipated overtime expenditures.
Fringe Benefits• Savings in fringe benefit expenditures are associated with vacancies across the Agency.
Communications• Communication expenditures are within an acceptable range of the budgeted amount.
Legal Services • The savings in legal services is attributed to a larger FY22 budget in anticipation of expected legal costs associated with union negotiations which have not yet been fully incurred.
Computer/Network Software Agreement• Software agreement expenditures are dependent on annual renewals of software agreements.
Uniforms • Savings in uniform expenditures are related to fewer employees utilizing the entire uniform allowance.
Contracted Services• The positive variance in contracted services is attributed to expenses which have not yet been incurred.
Equipment Repairs • The unfavorable variance is primarily attributed to unexpected repairs to a bus lift in the month of September.
Security Services• Savings in security services are attributed to incurring expenses later than anticipated for remote security monitoring services.
Fuel ‐ CNG• The negative variance is primarily attributed to increased usage of CNG fixed route vehicles over budgeted estimates for FY22.
Fuel ‐ Hydrogen• The negative variance is attributed to higher cost per kilogram of H2.
Tires • The lower tire expenditures are attributed to fewer miles related to the postponement of Level 1 service.
Office Supplies• Savings in office supply expenses are primarily associated with a reduction in costs due to remote work, lower coin counting equipment expense, and vacancies.
Travel/Training• COVID‐19 restrictions have reduced anticipated training related expenses for staff travel.
Repair Parts • The positive variance is primarily attributed to lower FYTD expenses related to fixed route repairs.
Budget Variance Analysis ‐ SunLine Transit Agency
Ridership Ridership
Page 41 of 400

RevenueVariance
FY21 vs. FY22Variance
Previous Month
%FY21 vs FY22
%Previous Month
April FY21 53,392$ April FY22 68,995$ 15,603$ 9,024$ 29.22% 15.05%March FY22 59,972$ FYTD April FY21 540,818$ FYTD April FY22 801,810$ 260,992$ 48.26%
Other Expenses• Costs vary from month to month depending on the needs of the Agency or when programs are active. The negative varianceis primarily attributed to increased expenses for consulting services.
• The negative variance is also attributed to higher temporary help costs across multiple departments to cover administrative vacancies.Self‐Consumed Fuel
• The positive variance in self‐consumed fuel is due to higher fuel cost.
Facility Maintenance • The negative variance is attributed to the unexpected replacement of two (2) broken coffee machines in July.
Electricity ‐ CNG & Hydrogen • Electricity expenses are within an acceptable range of the budget.
Natural Gas • The negative variance is attributed to increased natural gas usage due to an increase of CNG sold through outside fuel sales.
Water and Gas • Water and gas expenses are within an acceptable range of the budget.
Insurance Losses • Insurance loss experience has not exceeded YTD budgeted expectations.
Insurance Premium ‐ Property • Insurance premiums for property expenditures increased with completion of new facilities around the property.
Repair Claims • Repair claim expenses have been less than anticipated. Expenses for work on vehicles will be incurred once the work is complete.
Fuel Taxes • Outside fuel sales are currently $260,992 above FY21 FYTD amounts. • For April, sales increased by $9,024 from the previous month. • Fuel Tax expenses are within an acceptable range of the budget.
Outside Fueling Revenue
Page 42 of 400
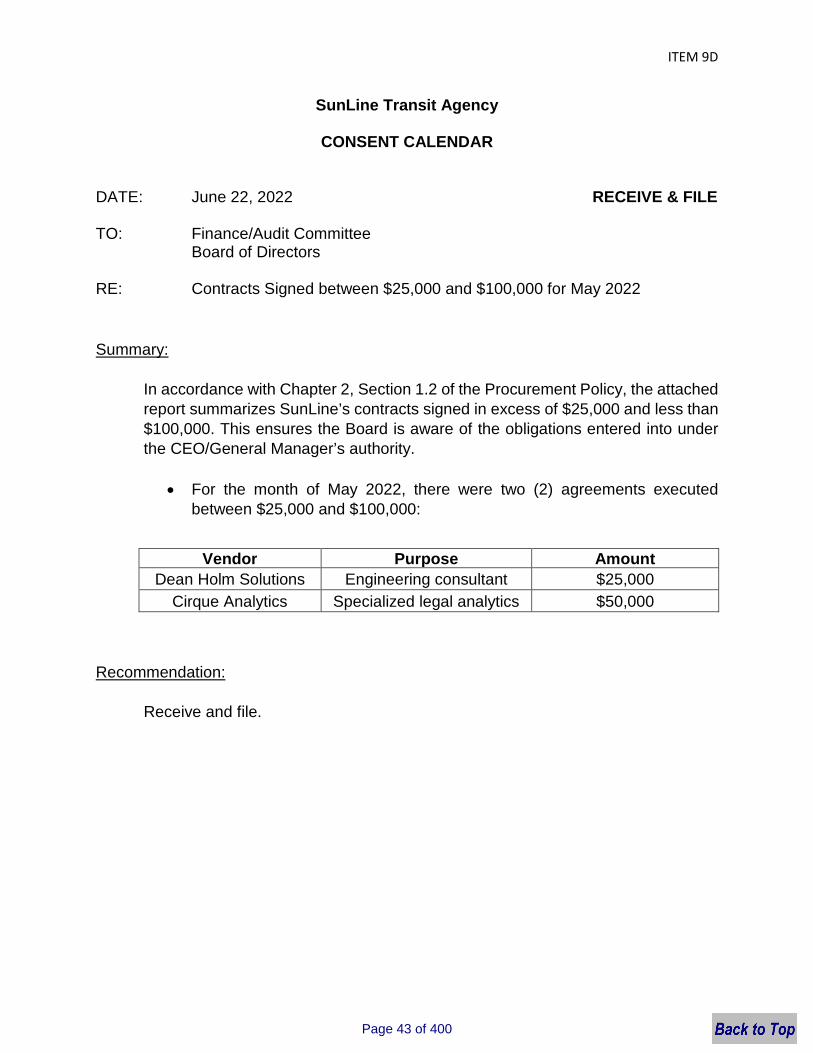
ITEM 9D
SunLine Transit Agency
CONSENT CALENDAR
DATE: June 22, 2022 RECEIVE & FILE
TO: Finance/Audit Committee Board of Directors
RE: Contracts Signed between $25,000 and $100,000 for May 2022
Summary:
In accordance with Chapter 2, Section 1.2 of the Procurement Policy, the attached report summarizes SunLine’s contracts signed in excess of $25,000 and less than $100,000. This ensures the Board is aware of the obligations entered into under the CEO/General Manager’s authority.
For the month of May 2022, there were two (2) agreements executed between $25,000 and $100,000:
Recommendation:
Receive and file.
Vendor Purpose Amount
Dean Holm Solutions Engineering consultant $25,000
Cirque Analytics Specialized legal analytics $50,000
Page 43 of 400
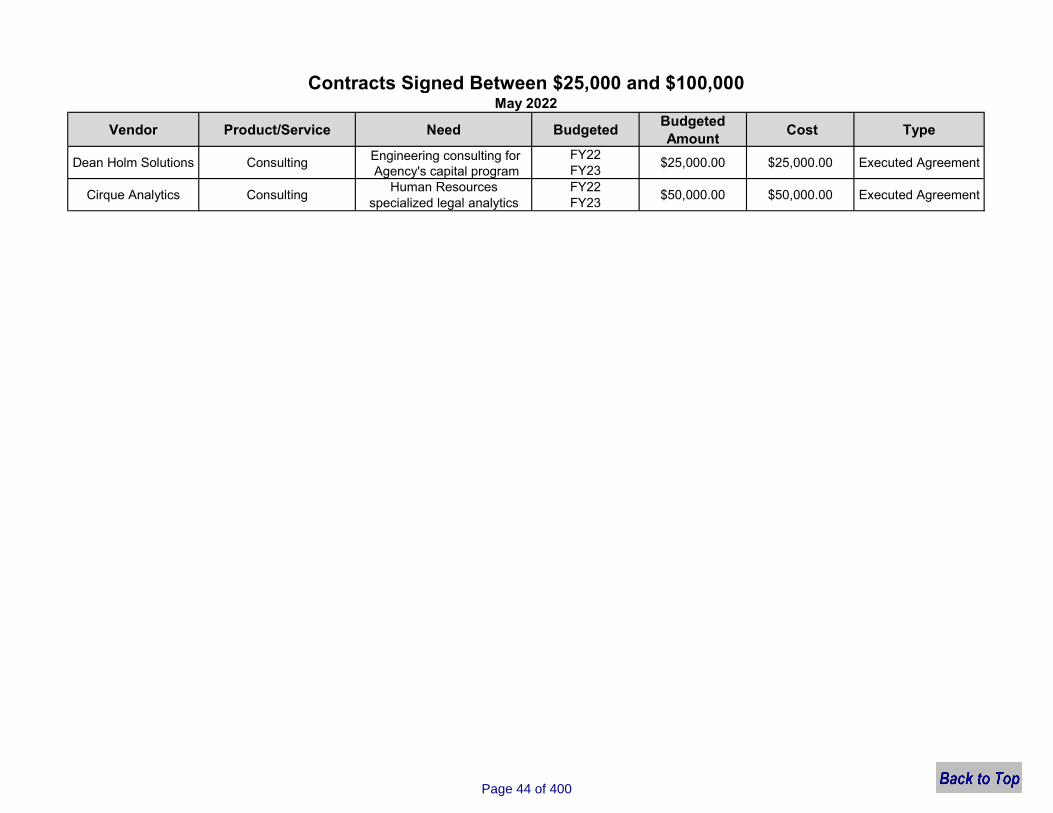
Vendor Product/Service Need BudgetedBudgeted Amount
Cost Type
Dean Holm Solutions Consulting Engineering consulting for Agency's capital program
FY22FY23
$25,000.00 $25,000.00 Executed Agreement
Cirque Analytics ConsultingHuman Resources
specialized legal analyticsFY22FY23
$50,000.00 $50,000.00 Executed Agreement
Contracts Signed Between $25,000 and $100,000May 2022
Page 44 of 400
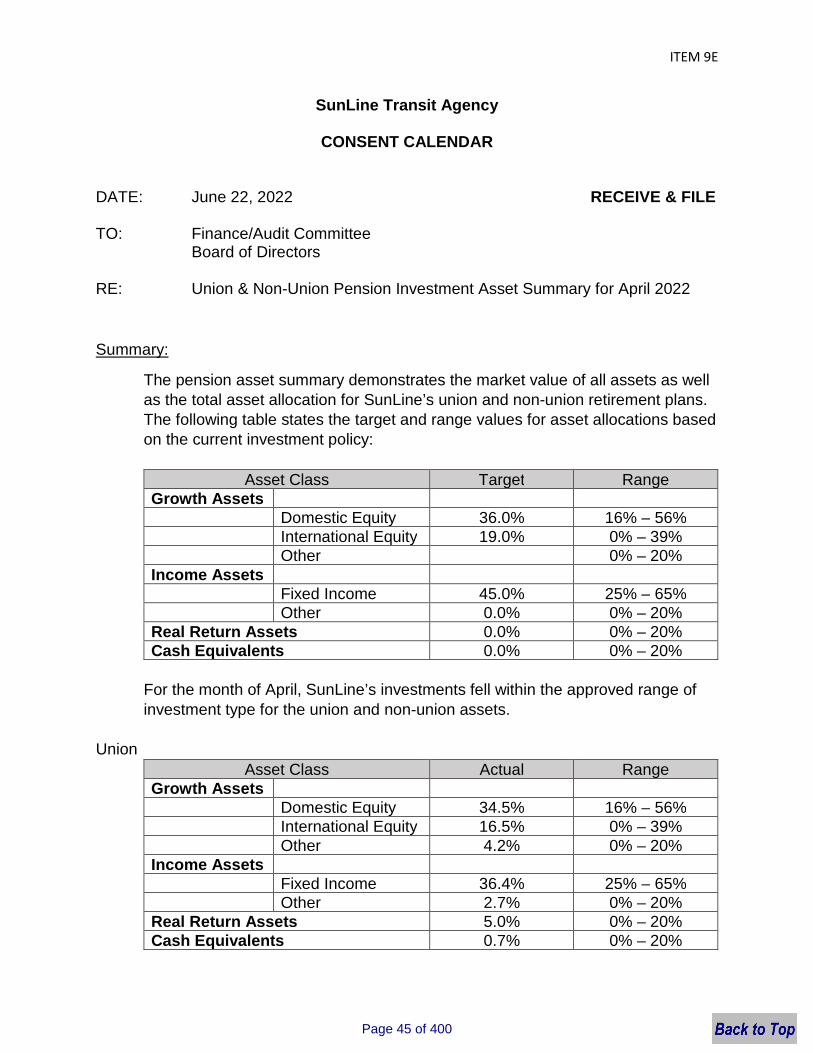
ITEM 9E
SunLine Transit Agency
CONSENT CALENDAR
DATE: June 22, 2022 RECEIVE & FILE
TO: Finance/Audit Committee Board of Directors
RE: Union & Non-Union Pension Investment Asset Summary for April 2022
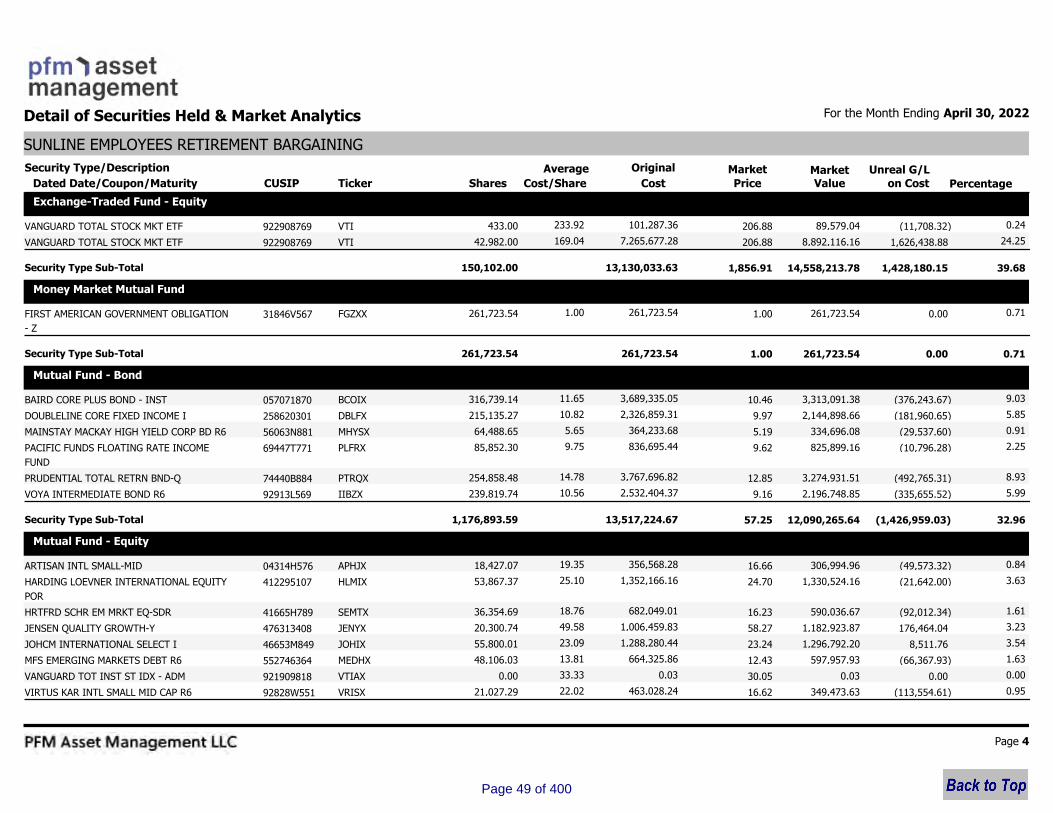
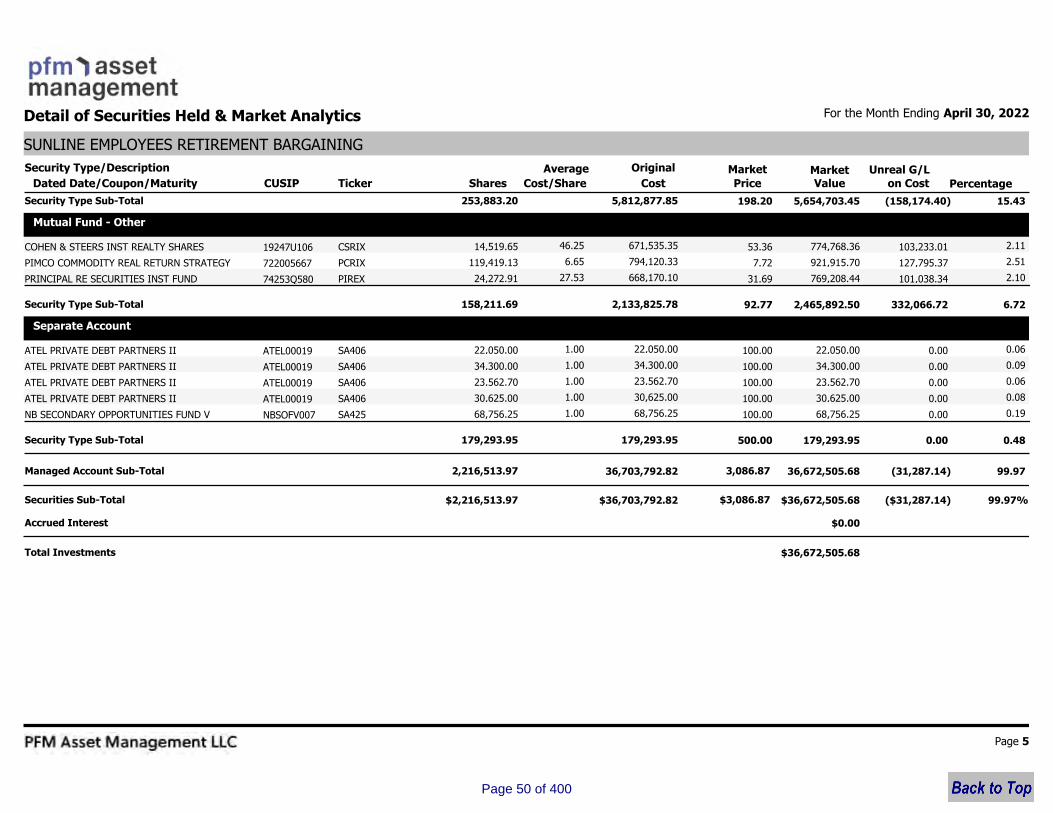
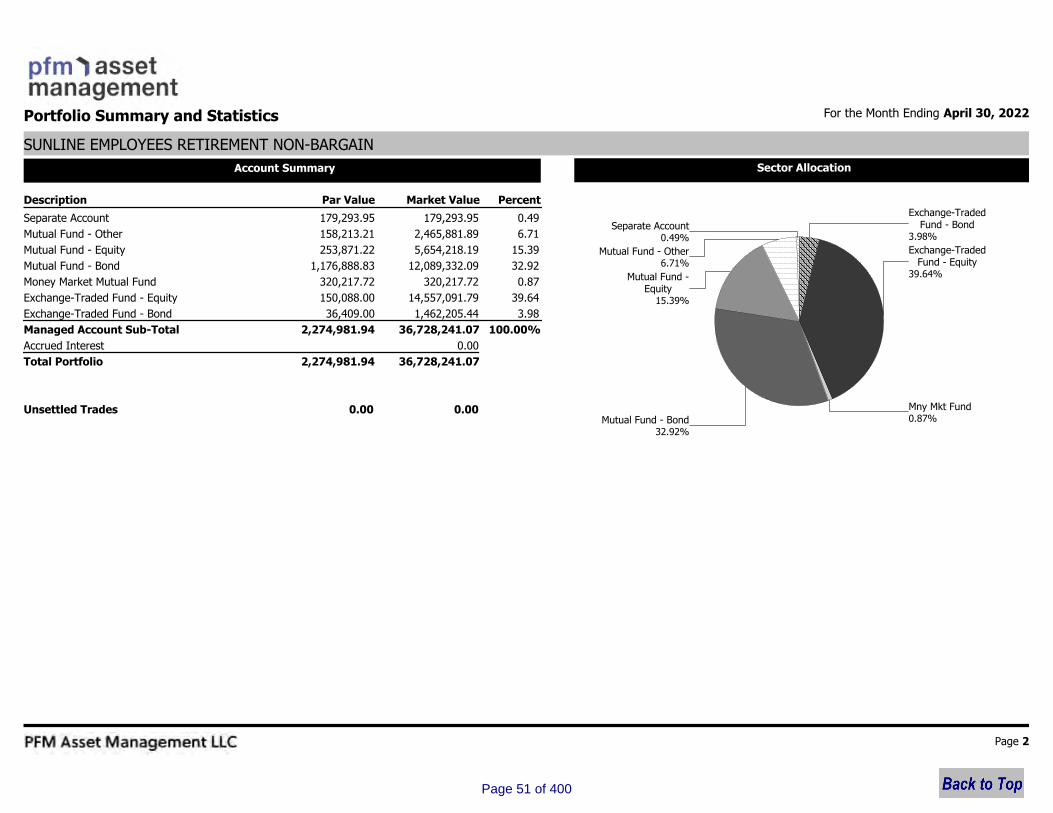
Summary:
The pension asset summary demonstrates the market value of all assets as well as the total asset allocation for SunLine’s union and non-union retirement plans. The following table states the target and range values for asset allocations based on the current investment policy:
Asset Class Target RangeGrowth Assets
Domestic Equity 36.0% 16% – 56%International Equity 19.0% 0% – 39%Other 0% – 20%
Income AssetsFixed Income 45.0% 25% – 65%Other 0.0% 0% – 20%
Real Return Assets 0.0% 0% – 20%Cash Equivalents 0.0% 0% – 20%
For the month of April, SunLine’s investments fell within the approved range of investment type for the union and non-union assets.
Union
Asset Class Actual RangeGrowth Assets
Domestic Equity 34.5% 16% – 56%International Equity 16.5% 0% – 39%Other 4.2% 0% – 20%
Income AssetsFixed Income 36.4% 25% – 65%Other 2.7% 0% – 20%
Real Return Assets 5.0% 0% – 20%Cash Equivalents 0.7% 0% – 20%
Page 45 of 400
ITEM 9E
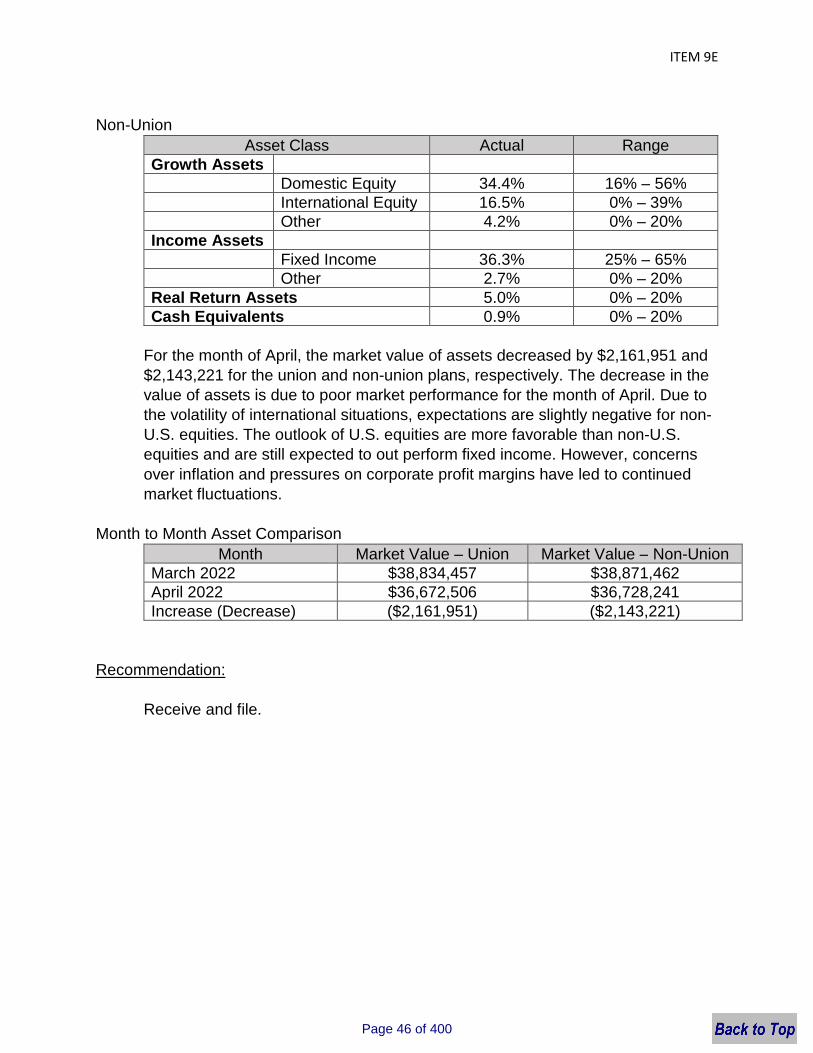
Non-Union
Asset Class Actual RangeGrowth Assets
Domestic Equity 34.4% 16% – 56%International Equity 16.5% 0% – 39%Other 4.2% 0% – 20%
Income AssetsFixed Income 36.3% 25% – 65%Other 2.7% 0% – 20%
Real Return Assets 5.0% 0% – 20%Cash Equivalents 0.9% 0% – 20%
For the month of April, the market value of assets decreased by $2,161,951 and $2,143,221 for the union and non-union plans, respectively. The decrease in the value of assets is due to poor market performance for the month of April. Due to the volatility of international situations, expectations are slightly negative for non-U.S. equities. The outlook of U.S. equities are more favorable than non-U.S. equities and are still expected to out perform fixed income. However, concerns over inflation and pressures on corporate profit margins have led to continued market fluctuations.
Month to Month Asset Comparison
Month Market Value – Union Market Value – Non-UnionMarch 2022 $38,834,457 $38,871,462April 2022 $36,672,506 $36,728,241Increase (Decrease) ($2,161,951) ($2,143,221)
Recommendation:
Receive and file.
Page 46 of 400

For the Month Ending April 30, 2022Portfolio Summary and Statistics
SUNLINE EMPLOYEES RETIREMENT BARGAINING
Account Summary
Percent Par Value Market ValueDescription
Separate Account 179,293.95 179,293.95 0.49
Mutual Fund - Other 158,211.69 2,465,892.50 6.72
Mutual Fund - Equity 253,883.20 5,654,703.45 15.42
Mutual Fund - Bond 1,176,893.59 12,090,265.64 32.97
Money Market Mutual Fund 261,723.54 261,723.54 0.71
Exchange-Traded Fund - Equity 150,102.00 14,558,213.78 39.70
Exchange-Traded Fund - Bond 36,406.00 1,462,412.82 3.99
Managed Account Sub-Total 2,216,513.97 36,672,505.68 100.00%
Accrued Interest 0.00
Total Portfolio 2,216,513.97 36,672,505.68
Unsettled Trades 0.00 0.00
Sector Allocation
3.99%
Exchange-TradedFund - Bond
39.70%
Exchange-TradedFund - Equity
0.71%Mny Mkt Fund
32.97%Mutual Fund - Bond
15.42%
Mutual Fund -Equity
6.72%Mutual Fund - Other
0.49%Separate Account
Page 2
Page 47 of 400

For the Month Ending April 30, 2022Detail of Securities Held & Market Analytics
SUNLINE EMPLOYEES RETIREMENT BARGAINING
Dated Date/Coupon/Maturity
Security Type/Description
CUSIP Shares Cost ValueMarketOriginal
on CostUnreal G/L
Price
Market
Ticker Cost/Share
Average
Percentage
Exchange-Traded Fund - Bond
ISHARES INTERMEDIATE-TERM CO 464288638 (10,302.54) 59,752.44 52.14 70,054.98 1,146.00 IGIB 61.13 0.16
ISHARES INTERMEDIATE-TERM CO 464288638 (3,070.05) 33,004.62 52.14 36,074.67 633.00 IGIB 56.99 0.09
ISHARES INTERMEDIATE-TERM CO 464288638 (19,518.13) 124,562.46 52.14 144,080.59 2,389.00 IGIB 60.31 0.34
ISHARES INTERMEDIATE-TERM CO 464288638 (8,559.55) 50,315.10 52.14 58,874.65 965.00 IGIB 61.01 0.14
ISHARES INTERMEDIATE-TERM CO 464288638 (37,036.04) 348,503.76 52.14 385,539.80 6,684.00 IGIB 57.68 0.95
ISHARES INTERMEDIATE-TERM CO 464288638 (2,871.05) 32,900.34 52.14 35,771.39 631.00 IGIB 56.69 0.09
ISHARES PREFERRED&INCOME SECURITIES
ETF
464288687 (73,163.13) 471,361.80 33.95 544,524.93 13,884.00 PFF 39.22 1.29
ISHARES PREFERRED&INCOME SECURITIES
ETF
464288687 (51,880.09) 342,012.30 33.95 393,892.39 10,074.00 PFF 39.10 0.93
Security Type Sub-Total 36,406.00 1,668,813.40 380.74 (206,400.58) 1,462,412.82 3.99
Exchange-Traded Fund - Equity
INVESCO OPT YIELD DIVERSIFIED
COMMODITY
46090F100 49,332.74 467,033.30 18.65 417,700.56 25,042.00 PDBC 16.68 1.27
INVESCO OPT YIELD DIVERSIFIED
COMMODITY
46090F100 36,309.46 448,457.90 18.65 412,148.44 24,046.00 PDBC 17.14 1.22
INVESCO S&P 500 EQUAL WEIGHT ETF 46137V357 (30,769.76) 481,129.35 147.45 511,899.11 3,263.00 RSP 156.88 1.31
INVESCO S&P 500 EQUAL WEIGHT ETF 46137V357 (20,593.12) 359,778.00 147.45 380,371.12 2,440.00 RSP 155.89 0.98
ISHARES CORE S&P MIDCAP ETF 464287507 (72,057.28) 662,061.12 249.27 734,118.40 2,656.00 IJH 276.40 1.81
ISHARES CORE S&P SMALL-CAP E 464287804 (6,541.07) 87,887.28 99.42 94,428.35 884.00 IJR 106.82 0.24
ISHARES CORE S&P SMALL-CAP E 464287804 (9,316.58) 122,684.28 99.42 132,000.86 1,234.00 IJR 106.97 0.33
ISHARES CORE S&P SMALL-CAP E 464287804 (58,322.61) 323,214.42 99.42 381,537.03 3,251.00 IJR 117.36 0.88
ISHARES CORE S&P SMALL-CAP E 464287804 (9,842.18) 124,970.94 99.42 134,813.12 1,257.00 IJR 107.25 0.34
VANGUARD FTSE DEVELOPED MARKETS ETF 921943858 (30,728.47) 267,679.83 44.77 298,408.30 5,979.00 VEA 49.91 0.73
VANGUARD FTSE DEVELOPED MARKETS ETF 921943858 (19,851.63) 194,928.58 44.77 214,780.21 4,354.00 VEA 49.33 0.53
VANGUARD TOTAL INTL STOCK 921909768 (66,370.29) 389,846.94 55.86 456,217.23 6,979.00 VXUS 65.37 1.06
VANGUARD TOTAL INTL STOCK 921909768 (4,694.97) 30,890.58 55.86 35,585.55 553.00 VXUS 64.35 0.09
VANGUARD TOTAL INTL STOCK 921909768 86,779.22 1,296,119.58 55.86 1,209,340.36 23,203.00 VXUS 52.12 3.53
VANGUARD TOTAL STOCK MKT ETF 922908769 (29,883.87) 319,836.48 206.88 349,720.35 1,546.00 VTI 226.21 0.87
Page 3
Page 48 of 400
For the Month Ending April 30, 2022Detail of Securities Held & Market Analytics
SUNLINE EMPLOYEES RETIREMENT BARGAINING
Dated Date/Coupon/Maturity
Security Type/Description
CUSIP Shares Cost ValueMarketOriginal
on CostUnreal G/L
Price
Market
Ticker Cost/Share
Average
Percentage
Exchange-Traded Fund - Equity
VANGUARD TOTAL STOCK MKT ETF 922908769 (11,708.32) 89,579.04 206.88 101,287.36 433.00 VTI 233.92 0.24
VANGUARD TOTAL STOCK MKT ETF 922908769 1,626,438.88 8,892,116.16 206.88 7,265,677.28 42,982.00 VTI 169.04 24.25
Security Type Sub-Total 150,102.00 13,130,033.63 1,856.91 1,428,180.15 14,558,213.78 39.68
Money Market Mutual Fund
FIRST AMERICAN GOVERNMENT OBLIGATION
- Z
31846V567 0.00 261,723.54 1.00 261,723.54 261,723.54 FGZXX 1.00 0.71
Security Type Sub-Total 261,723.54 261,723.54 1.00 0.00 261,723.54 0.71
Mutual Fund - Bond
BAIRD CORE PLUS BOND - INST 057071870 (376,243.67) 3,313,091.38 10.46 3,689,335.05 316,739.14 BCOIX 11.65 9.03
DOUBLELINE CORE FIXED INCOME I 258620301 (181,960.65) 2,144,898.66 9.97 2,326,859.31 215,135.27 DBLFX 10.82 5.85
MAINSTAY MACKAY HIGH YIELD CORP BD R6 56063N881 (29,537.60) 334,696.08 5.19 364,233.68 64,488.65 MHYSX 5.65 0.91
PACIFIC FUNDS FLOATING RATE INCOME
FUND
69447T771 (10,796.28) 825,899.16 9.62 836,695.44 85,852.30 PLFRX 9.75 2.25
PRUDENTIAL TOTAL RETRN BND-Q 74440B884 (492,765.31) 3,274,931.51 12.85 3,767,696.82 254,858.48 PTRQX 14.78 8.93
VOYA INTERMEDIATE BOND R6 92913L569 (335,655.52) 2,196,748.85 9.16 2,532,404.37 239,819.74 IIBZX 10.56 5.99
Security Type Sub-Total 1,176,893.59 13,517,224.67 57.25 (1,426,959.03) 12,090,265.64 32.96
Mutual Fund - Equity
ARTISAN INTL SMALL-MID 04314H576 (49,573.32) 306,994.96 16.66 356,568.28 18,427.07 APHJX 19.35 0.84
HARDING LOEVNER INTERNATIONAL EQUITY
POR
412295107 (21,642.00) 1,330,524.16 24.70 1,352,166.16 53,867.37 HLMIX 25.10 3.63
HRTFRD SCHR EM MRKT EQ-SDR 41665H789 (92,012.34) 590,036.67 16.23 682,049.01 36,354.69 SEMTX 18.76 1.61
JENSEN QUALITY GROWTH-Y 476313408 176,464.04 1,182,923.87 58.27 1,006,459.83 20,300.74 JENYX 49.58 3.23
JOHCM INTERNATIONAL SELECT I 46653M849 8,511.76 1,296,792.20 23.24 1,288,280.44 55,800.01 JOHIX 23.09 3.54
MFS EMERGING MARKETS DEBT R6 552746364 (66,367.93) 597,957.93 12.43 664,325.86 48,106.03 MEDHX 13.81 1.63
VANGUARD TOT INST ST IDX - ADM 921909818 0.00 0.03 30.05 0.03 0.00 VTIAX 33.33 0.00
VIRTUS KAR INTL SMALL MID CAP R6 92828W551 (113,554.61) 349,473.63 16.62 463,028.24 21,027.29 VRISX 22.02 0.95
Page 4
Page 49 of 400
For the Month Ending April 30, 2022Detail of Securities Held & Market Analytics
SUNLINE EMPLOYEES RETIREMENT BARGAINING
Dated Date/Coupon/Maturity
Security Type/Description
CUSIP Shares Cost ValueMarketOriginal
on CostUnreal G/L
Price
Market
Ticker Cost/Share
Average
Percentage
Security Type Sub-Total 253,883.20 5,812,877.85 198.20 (158,174.40) 5,654,703.45 15.43
Mutual Fund - Other
COHEN & STEERS INST REALTY SHARES 19247U106 103,233.01 774,768.36 53.36 671,535.35 14,519.65 CSRIX 46.25 2.11
PIMCO COMMODITY REAL RETURN STRATEGY 722005667 127,795.37 921,915.70 7.72 794,120.33 119,419.13 PCRIX 6.65 2.51
PRINCIPAL RE SECURITIES INST FUND 74253Q580 101,038.34 769,208.44 31.69 668,170.10 24,272.91 PIREX 27.53 2.10
Security Type Sub-Total 158,211.69 2,133,825.78 92.77 332,066.72 2,465,892.50 6.72
Separate Account
ATEL PRIVATE DEBT PARTNERS II ATEL00019 0.00 22,050.00 100.00 22,050.00 22,050.00 SA406 1.00 0.06
ATEL PRIVATE DEBT PARTNERS II ATEL00019 0.00 34,300.00 100.00 34,300.00 34,300.00 SA406 1.00 0.09
ATEL PRIVATE DEBT PARTNERS II ATEL00019 0.00 23,562.70 100.00 23,562.70 23,562.70 SA406 1.00 0.06
ATEL PRIVATE DEBT PARTNERS II ATEL00019 0.00 30,625.00 100.00 30,625.00 30,625.00 SA406 1.00 0.08
NB SECONDARY OPPORTUNITIES FUND V NBSOFV007 0.00 68,756.25 100.00 68,756.25 68,756.25 SA425 1.00 0.19
Security Type Sub-Total 179,293.95 179,293.95 500.00 0.00 179,293.95 0.48
Managed Account Sub-Total 2,216,513.97 36,703,792.82 3,086.87 (31,287.14) 36,672,505.68 99.97
Securities Sub-Total
Accrued Interest
Total Investments
$0.00
$36,672,505.68
$2,216,513.97 $36,703,792.82 $3,086.87 ($31,287.14)$36,672,505.68 99.97%
Page 5
Page 50 of 400
For the Month Ending April 30, 2022Portfolio Summary and Statistics
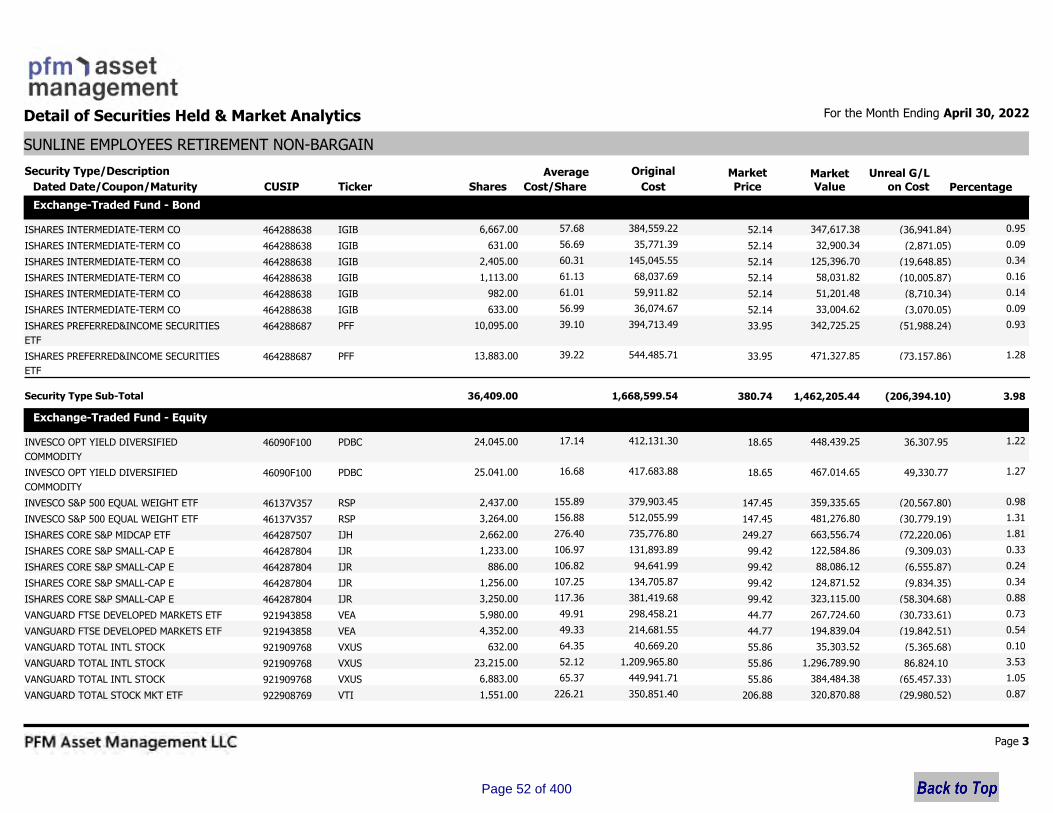
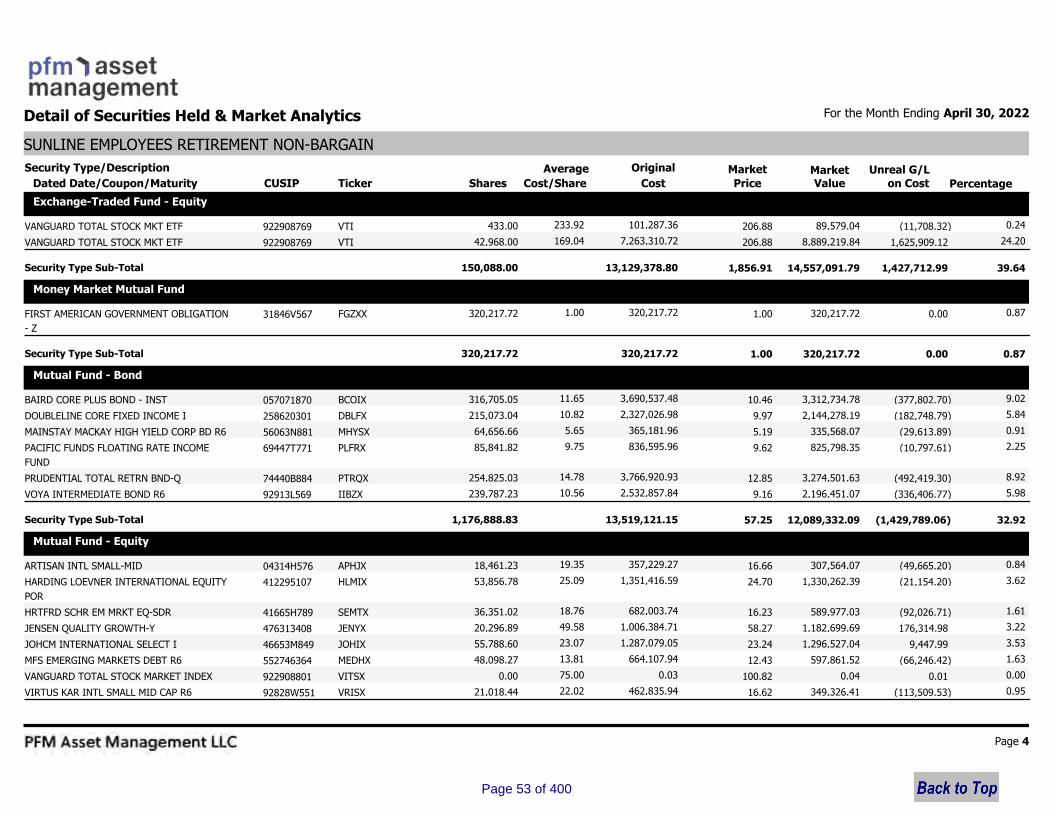
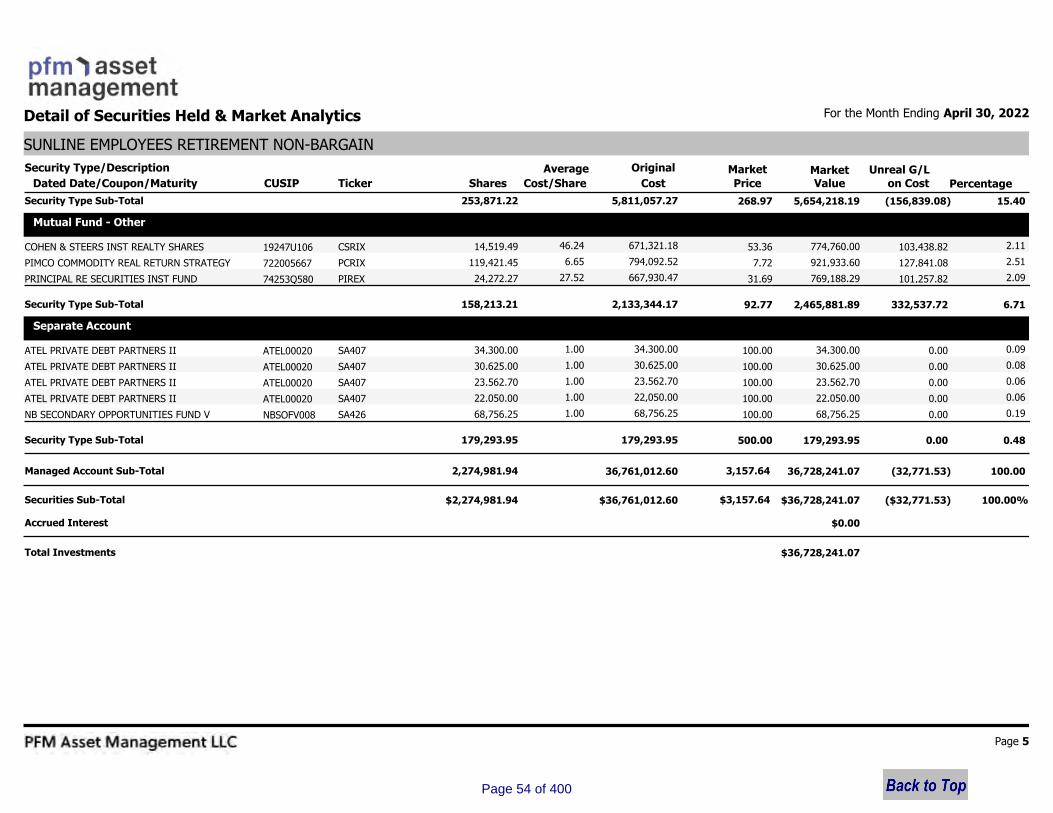
SUNLINE EMPLOYEES RETIREMENT NON-BARGAIN
Account Summary
Percent Par Value Market ValueDescription
Separate Account 179,293.95 179,293.95 0.49
Mutual Fund - Other 158,213.21 2,465,881.89 6.71
Mutual Fund - Equity 253,871.22 5,654,218.19 15.39
Mutual Fund - Bond 1,176,888.83 12,089,332.09 32.92
Money Market Mutual Fund 320,217.72 320,217.72 0.87
Exchange-Traded Fund - Equity 150,088.00 14,557,091.79 39.64
Exchange-Traded Fund - Bond 36,409.00 1,462,205.44 3.98
Managed Account Sub-Total 2,274,981.94 36,728,241.07 100.00%
Accrued Interest 0.00
Total Portfolio 2,274,981.94 36,728,241.07
Unsettled Trades 0.00 0.00
Sector Allocation
3.98%
Exchange-TradedFund - Bond
39.64%
Exchange-TradedFund - Equity
0.87%Mny Mkt Fund
32.92%Mutual Fund - Bond
15.39%
Mutual Fund -Equity
6.71%Mutual Fund - Other
0.49%Separate Account
Page 2
Page 51 of 400
For the Month Ending April 30, 2022Detail of Securities Held & Market Analytics
SUNLINE EMPLOYEES RETIREMENT NON-BARGAIN
Dated Date/Coupon/Maturity
Security Type/Description
CUSIP Shares Cost ValueMarketOriginal
on CostUnreal G/L
Price
Market
Ticker Cost/Share
Average
Percentage
Exchange-Traded Fund - Bond
ISHARES INTERMEDIATE-TERM CO 464288638 (36,941.84) 347,617.38 52.14 384,559.22 6,667.00 IGIB 57.68 0.95
ISHARES INTERMEDIATE-TERM CO 464288638 (2,871.05) 32,900.34 52.14 35,771.39 631.00 IGIB 56.69 0.09
ISHARES INTERMEDIATE-TERM CO 464288638 (19,648.85) 125,396.70 52.14 145,045.55 2,405.00 IGIB 60.31 0.34
ISHARES INTERMEDIATE-TERM CO 464288638 (10,005.87) 58,031.82 52.14 68,037.69 1,113.00 IGIB 61.13 0.16
ISHARES INTERMEDIATE-TERM CO 464288638 (8,710.34) 51,201.48 52.14 59,911.82 982.00 IGIB 61.01 0.14
ISHARES INTERMEDIATE-TERM CO 464288638 (3,070.05) 33,004.62 52.14 36,074.67 633.00 IGIB 56.99 0.09
ISHARES PREFERRED&INCOME SECURITIES
ETF
464288687 (51,988.24) 342,725.25 33.95 394,713.49 10,095.00 PFF 39.10 0.93
ISHARES PREFERRED&INCOME SECURITIES
ETF
464288687 (73,157.86) 471,327.85 33.95 544,485.71 13,883.00 PFF 39.22 1.28
Security Type Sub-Total 36,409.00 1,668,599.54 380.74 (206,394.10) 1,462,205.44 3.98
Exchange-Traded Fund - Equity
INVESCO OPT YIELD DIVERSIFIED
COMMODITY
46090F100 36,307.95 448,439.25 18.65 412,131.30 24,045.00 PDBC 17.14 1.22
INVESCO OPT YIELD DIVERSIFIED
COMMODITY
46090F100 49,330.77 467,014.65 18.65 417,683.88 25,041.00 PDBC 16.68 1.27
INVESCO S&P 500 EQUAL WEIGHT ETF 46137V357 (20,567.80) 359,335.65 147.45 379,903.45 2,437.00 RSP 155.89 0.98
INVESCO S&P 500 EQUAL WEIGHT ETF 46137V357 (30,779.19) 481,276.80 147.45 512,055.99 3,264.00 RSP 156.88 1.31
ISHARES CORE S&P MIDCAP ETF 464287507 (72,220.06) 663,556.74 249.27 735,776.80 2,662.00 IJH 276.40 1.81
ISHARES CORE S&P SMALL-CAP E 464287804 (9,309.03) 122,584.86 99.42 131,893.89 1,233.00 IJR 106.97 0.33
ISHARES CORE S&P SMALL-CAP E 464287804 (6,555.87) 88,086.12 99.42 94,641.99 886.00 IJR 106.82 0.24
ISHARES CORE S&P SMALL-CAP E 464287804 (9,834.35) 124,871.52 99.42 134,705.87 1,256.00 IJR 107.25 0.34
ISHARES CORE S&P SMALL-CAP E 464287804 (58,304.68) 323,115.00 99.42 381,419.68 3,250.00 IJR 117.36 0.88
VANGUARD FTSE DEVELOPED MARKETS ETF 921943858 (30,733.61) 267,724.60 44.77 298,458.21 5,980.00 VEA 49.91 0.73
VANGUARD FTSE DEVELOPED MARKETS ETF 921943858 (19,842.51) 194,839.04 44.77 214,681.55 4,352.00 VEA 49.33 0.54
VANGUARD TOTAL INTL STOCK 921909768 (5,365.68) 35,303.52 55.86 40,669.20 632.00 VXUS 64.35 0.10
VANGUARD TOTAL INTL STOCK 921909768 86,824.10 1,296,789.90 55.86 1,209,965.80 23,215.00 VXUS 52.12 3.53
VANGUARD TOTAL INTL STOCK 921909768 (65,457.33) 384,484.38 55.86 449,941.71 6,883.00 VXUS 65.37 1.05
VANGUARD TOTAL STOCK MKT ETF 922908769 (29,980.52) 320,870.88 206.88 350,851.40 1,551.00 VTI 226.21 0.87
Page 3
Page 52 of 400
For the Month Ending April 30, 2022Detail of Securities Held & Market Analytics
SUNLINE EMPLOYEES RETIREMENT NON-BARGAIN
Dated Date/Coupon/Maturity
Security Type/Description
CUSIP Shares Cost ValueMarketOriginal
on CostUnreal G/L
Price
Market
Ticker Cost/Share
Average
Percentage
Exchange-Traded Fund - Equity
VANGUARD TOTAL STOCK MKT ETF 922908769 (11,708.32) 89,579.04 206.88 101,287.36 433.00 VTI 233.92 0.24
VANGUARD TOTAL STOCK MKT ETF 922908769 1,625,909.12 8,889,219.84 206.88 7,263,310.72 42,968.00 VTI 169.04 24.20
Security Type Sub-Total 150,088.00 13,129,378.80 1,856.91 1,427,712.99 14,557,091.79 39.64
Money Market Mutual Fund
FIRST AMERICAN GOVERNMENT OBLIGATION
- Z
31846V567 0.00 320,217.72 1.00 320,217.72 320,217.72 FGZXX 1.00 0.87
Security Type Sub-Total 320,217.72 320,217.72 1.00 0.00 320,217.72 0.87
Mutual Fund - Bond
BAIRD CORE PLUS BOND - INST 057071870 (377,802.70) 3,312,734.78 10.46 3,690,537.48 316,705.05 BCOIX 11.65 9.02
DOUBLELINE CORE FIXED INCOME I 258620301 (182,748.79) 2,144,278.19 9.97 2,327,026.98 215,073.04 DBLFX 10.82 5.84
MAINSTAY MACKAY HIGH YIELD CORP BD R6 56063N881 (29,613.89) 335,568.07 5.19 365,181.96 64,656.66 MHYSX 5.65 0.91
PACIFIC FUNDS FLOATING RATE INCOME
FUND
69447T771 (10,797.61) 825,798.35 9.62 836,595.96 85,841.82 PLFRX 9.75 2.25
PRUDENTIAL TOTAL RETRN BND-Q 74440B884 (492,419.30) 3,274,501.63 12.85 3,766,920.93 254,825.03 PTRQX 14.78 8.92
VOYA INTERMEDIATE BOND R6 92913L569 (336,406.77) 2,196,451.07 9.16 2,532,857.84 239,787.23 IIBZX 10.56 5.98
Security Type Sub-Total 1,176,888.83 13,519,121.15 57.25 (1,429,789.06) 12,089,332.09 32.92
Mutual Fund - Equity
ARTISAN INTL SMALL-MID 04314H576 (49,665.20) 307,564.07 16.66 357,229.27 18,461.23 APHJX 19.35 0.84
HARDING LOEVNER INTERNATIONAL EQUITY
POR
412295107 (21,154.20) 1,330,262.39 24.70 1,351,416.59 53,856.78 HLMIX 25.09 3.62
HRTFRD SCHR EM MRKT EQ-SDR 41665H789 (92,026.71) 589,977.03 16.23 682,003.74 36,351.02 SEMTX 18.76 1.61
JENSEN QUALITY GROWTH-Y 476313408 176,314.98 1,182,699.69 58.27 1,006,384.71 20,296.89 JENYX 49.58 3.22
JOHCM INTERNATIONAL SELECT I 46653M849 9,447.99 1,296,527.04 23.24 1,287,079.05 55,788.60 JOHIX 23.07 3.53
MFS EMERGING MARKETS DEBT R6 552746364 (66,246.42) 597,861.52 12.43 664,107.94 48,098.27 MEDHX 13.81 1.63
VANGUARD TOTAL STOCK MARKET INDEX 922908801 0.01 0.04 100.82 0.03 0.00 VITSX 75.00 0.00
VIRTUS KAR INTL SMALL MID CAP R6 92828W551 (113,509.53) 349,326.41 16.62 462,835.94 21,018.44 VRISX 22.02 0.95
Page 4
Page 53 of 400
For the Month Ending April 30, 2022Detail of Securities Held & Market Analytics
SUNLINE EMPLOYEES RETIREMENT NON-BARGAIN
Dated Date/Coupon/Maturity
Security Type/Description
CUSIP Shares Cost ValueMarketOriginal
on CostUnreal G/L
Price
Market
Ticker Cost/Share
Average
Percentage
Security Type Sub-Total 253,871.22 5,811,057.27 268.97 (156,839.08) 5,654,218.19 15.40
Mutual Fund - Other
COHEN & STEERS INST REALTY SHARES 19247U106 103,438.82 774,760.00 53.36 671,321.18 14,519.49 CSRIX 46.24 2.11
PIMCO COMMODITY REAL RETURN STRATEGY 722005667 127,841.08 921,933.60 7.72 794,092.52 119,421.45 PCRIX 6.65 2.51
PRINCIPAL RE SECURITIES INST FUND 74253Q580 101,257.82 769,188.29 31.69 667,930.47 24,272.27 PIREX 27.52 2.09
Security Type Sub-Total 158,213.21 2,133,344.17 92.77 332,537.72 2,465,881.89 6.71
Separate Account
ATEL PRIVATE DEBT PARTNERS II ATEL00020 0.00 34,300.00 100.00 34,300.00 34,300.00 SA407 1.00 0.09
ATEL PRIVATE DEBT PARTNERS II ATEL00020 0.00 30,625.00 100.00 30,625.00 30,625.00 SA407 1.00 0.08
ATEL PRIVATE DEBT PARTNERS II ATEL00020 0.00 23,562.70 100.00 23,562.70 23,562.70 SA407 1.00 0.06
ATEL PRIVATE DEBT PARTNERS II ATEL00020 0.00 22,050.00 100.00 22,050.00 22,050.00 SA407 1.00 0.06
NB SECONDARY OPPORTUNITIES FUND V NBSOFV008 0.00 68,756.25 100.00 68,756.25 68,756.25 SA426 1.00 0.19
Security Type Sub-Total 179,293.95 179,293.95 500.00 0.00 179,293.95 0.48
Managed Account Sub-Total 2,274,981.94 36,761,012.60 3,157.64 (32,771.53) 36,728,241.07 100.00
Securities Sub-Total
Accrued Interest
Total Investments
$0.00
$36,728,241.07
$2,274,981.94 $36,761,012.60 $3,157.64 ($32,771.53)$36,728,241.07 100.00%
Page 5
Page 54 of 400
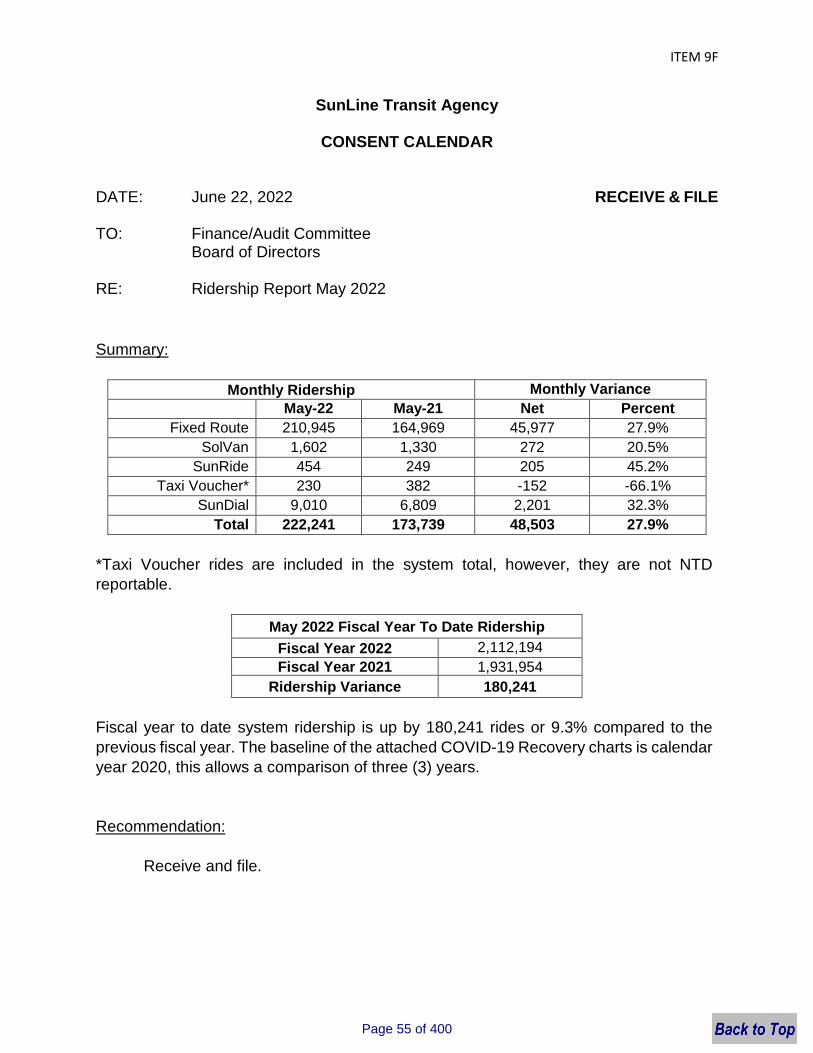
ITEM 9F
SunLine Transit Agency
CONSENT CALENDAR
DATE: June 22, 2022 RECEIVE & FILE
TO: Finance/Audit Committee Board of Directors
RE: Ridership Report May 2022
Summary:
Monthly Ridership Monthly Variance
May-22 May-21 Net Percent
Fixed Route 210,945 164,969 45,977 27.9%
SolVan 1,602 1,330 272 20.5%
SunRide 454 249 205 45.2%
Taxi Voucher* 230 382 -152 -66.1%
SunDial 9,010 6,809 2,201 32.3%
Total 222,241 173,739 48,503 27.9%
*Taxi Voucher rides are included in the system total, however, they are not NTD reportable.
May 2022 Fiscal Year To Date Ridership
Fiscal Year 2022 2,112,194
Fiscal Year 2021 1,931,954
Ridership Variance 180,241
Fiscal year to date system ridership is up by 180,241 rides or 9.3% compared to the previous fiscal year. The baseline of the attached COVID-19 Recovery charts is calendar year 2020, this allows a comparison of three (3) years.
Recommendation:
Receive and file.
Page 55 of 400
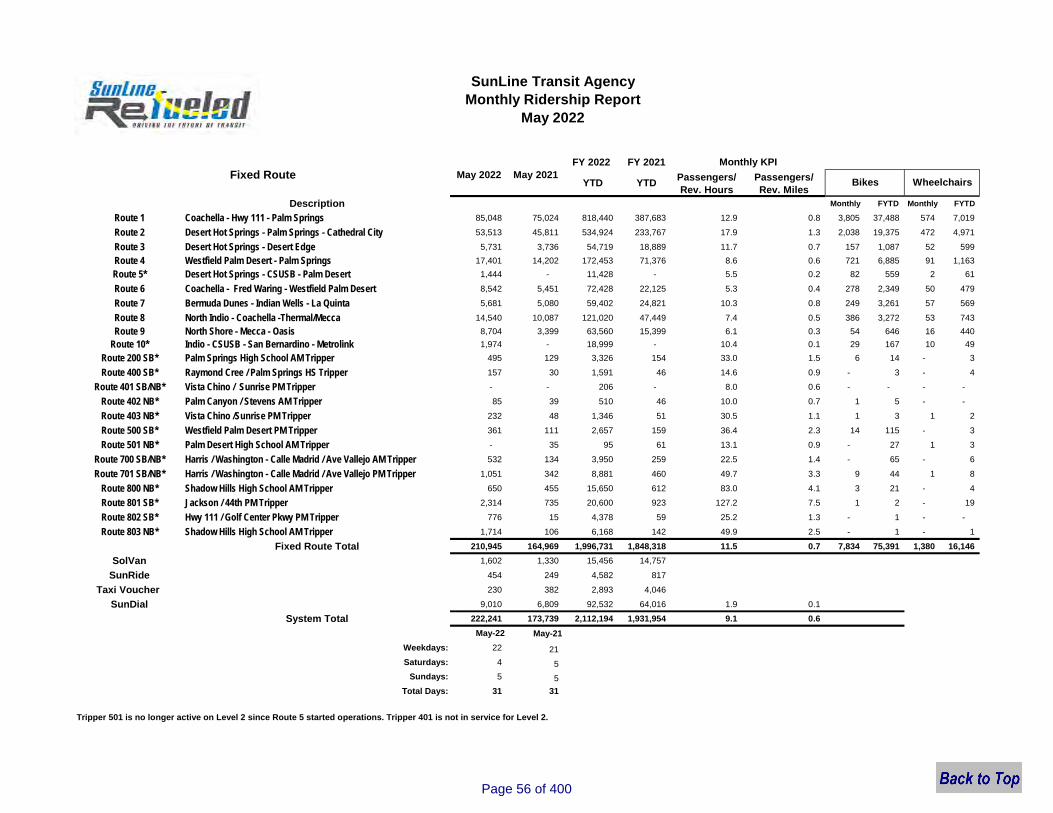
FY 2022 FY 2021
YTD YTDPassengers/
Rev. Hours
Passengers/
Rev. Miles
Description Monthly FYTD Monthly FYTD
Route 1 Coachella - Hwy 111 - Palm Springs 85,048 75,024 818,440 387,683 12.9 0.8 3,805 37,488 574 7,019
Route 2 Desert Hot Springs - Palm Springs - Cathedral City 53,513 45,811 534,924 233,767 17.9 1.3 2,038 19,375 472 4,971
Route 3 Desert Hot Springs - Desert Edge 5,731 3,736 54,719 18,889 11.7 0.7 157 1,087 52 599
Route 4 Westfield Palm Desert - Palm Springs 17,401 14,202 172,453 71,376 8.6 0.6 721 6,885 91 1,163
Route 5* Desert Hot Springs - CSUSB - Palm Desert 1,444 - 11,428 - 5.5 0.2 82 559 2 61
Route 6 Coachella - Fred Waring - Westfield Palm Desert 8,542 5,451 72,428 22,125 5.3 0.4 278 2,349 50 479
Route 7 Bermuda Dunes - Indian Wells - La Quinta 5,681 5,080 59,402 24,821 10.3 0.8 249 3,261 57 569
Route 8 North Indio - Coachella -Thermal/Mecca 14,540 10,087 121,020 47,449 7.4 0.5 386 3,272 53 743
Route 9 North Shore - Mecca - Oasis 8,704 3,399 63,560 15,399 6.1 0.3 54 646 16 440
Route 10* Indio - CSUSB - San Bernardino - Metrolink 1,974 - 18,999 - 10.4 0.1 29 167 10 49
Route 200 SB* Palm Springs High School AM Tripper 495 129 3,326 154 33.0 1.5 6 14 - 3
Route 400 SB* Raymond Cree / Palm Springs HS Tripper 157 30 1,591 46 14.6 0.9 - 3 - 4
Route 401 SB/NB* Vista Chino / Sunrise PM Tripper - - 206 - 8.0 0.6 - - - -
Route 402 NB* Palm Canyon / Stevens AM Tripper 85 39 510 46 10.0 0.7 1 5 - -
Route 403 NB* Vista Chino /Sunrise PM Tripper 232 48 1,346 51 30.5 1.1 1 3 1 2
Route 500 SB* Westfield Palm Desert PM Tripper 361 111 2,657 159 36.4 2.3 14 115 - 3
Route 501 NB* Palm Desert High School AM Tripper - 35 95 61 13.1 0.9 - 27 1 3
Route 700 SB/NB* Harris / Washington - Calle Madrid / Ave Vallejo AM Tripper 532 134 3,950 259 22.5 1.4 - 65 - 6
Route 701 SB/NB* Harris / Washington - Calle Madrid / Ave Vallejo PM Tripper 1,051 342 8,881 460 49.7 3.3 9 44 1 8
Route 800 NB* Shadow Hills High School AM Tripper 650 455 15,650 612 83.0 4.1 3 21 - 4
Route 801 SB* Jackson / 44th PM Tripper 2,314 735 20,600 923 127.2 7.5 1 2 - 19
Route 802 SB* Hwy 111 / Golf Center Pkwy PM Tripper 776 15 4,378 59 25.2 1.3 - 1 - -
Route 803 NB* Shadow Hills High School AM Tripper 1,714 106 6,168 142 49.9 2.5 - 1 - 1
Fixed Route Total 210,945 164,969 1,996,731 1,848,318 11.5 0.7 7,834 75,391 1,380 16,146
SolVan 1,602 1,330 15,456 14,757
SunRide 454 249 4,582 817
Taxi Voucher 230 382 2,893 4,046
SunDial 9,010 6,809 92,532 64,016 1.9 0.1
System Total 222,241 173,739 2,112,194 1,931,954 9.1 0.6
May-22 May-21
Weekdays: 22 21
Saturdays: 4 5
Sundays: 5 5
Total Days: 31 31
SunLine Transit Agency
Monthly Ridership Report
May 2022
Fixed Route May 2022 May 2021
Monthly KPI
Bikes Wheelchairs
Tripper 501 is no longer active on Level 2 since Route 5 started operations. Tripper 401 is not in service for Level 2.
Page 56 of 400
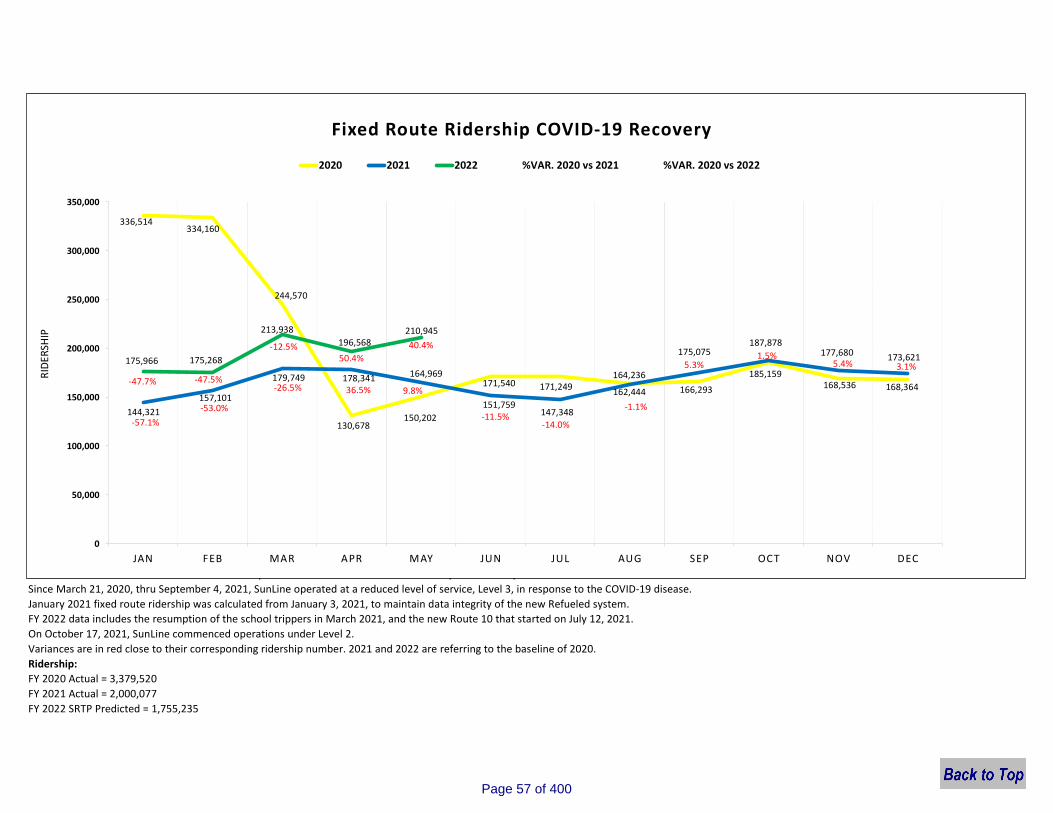
The COVID-19 pandemic caused a major national and global disruption with closures of businesses,
schools and entertainment venues due to the implementation of national and statewide public health policies.
January 2021 fixed route ridership was calculated from January 3, 2021, to maintain data integrity of the new Refueled system.
FY 2022 data includes the resumption of the school trippers in March 2021, and the new Route 10 that started on July 12, 2021.
On October 17, 2021, SunLine commenced operations under Level 2.
Variances are in red close to their corresponding ridership number. 2021 and 2022 are referring to the baseline of 2020.
Ridership:
FY 2020 Actual = 3,379,520
FY 2021 Actual = 2,000,077
FY 2022 SRTP Predicted = 1,755,235
Since March 21, 2020, thru September 4, 2021, SunLine operated at a reduced level of service, Level 3, in response to the COVID-19 disease.
336,514334,160
244,570
130,678150,202
171,540 171,249164,236
166,293
185,159168,536 168,364
144,321
157,101
179,749 178,341 164,969
151,759147,348
162,444
175,075187,878
177,680 173,621175,966 175,268
213,938
196,568210,945
-57.1%
-53.0%
-26.5% 36.5% 9.8%
-11.5%-14.0%
-1.1%
5.3%1.5%
5.4% 3.1%
-47.7% -47.5%
-12.5%50.4%
40.4%
-90.0%
-70.0%
-50.0%
-30.0%
-10.0%
10.0%
30.0%
50.0%
0
50,000
100,000
150,000
200,000
250,000
300,000
350,000
JAN FEB MAR APR MAY JUN JUL AUG SEP OCT NOV DEC
RID
ERSH
IP
Fixed Route Ridership COVID-19 Recovery
2020 2021 2022 %VAR. 2020 vs 2021 %VAR. 2020 vs 2022
Page 57 of 400
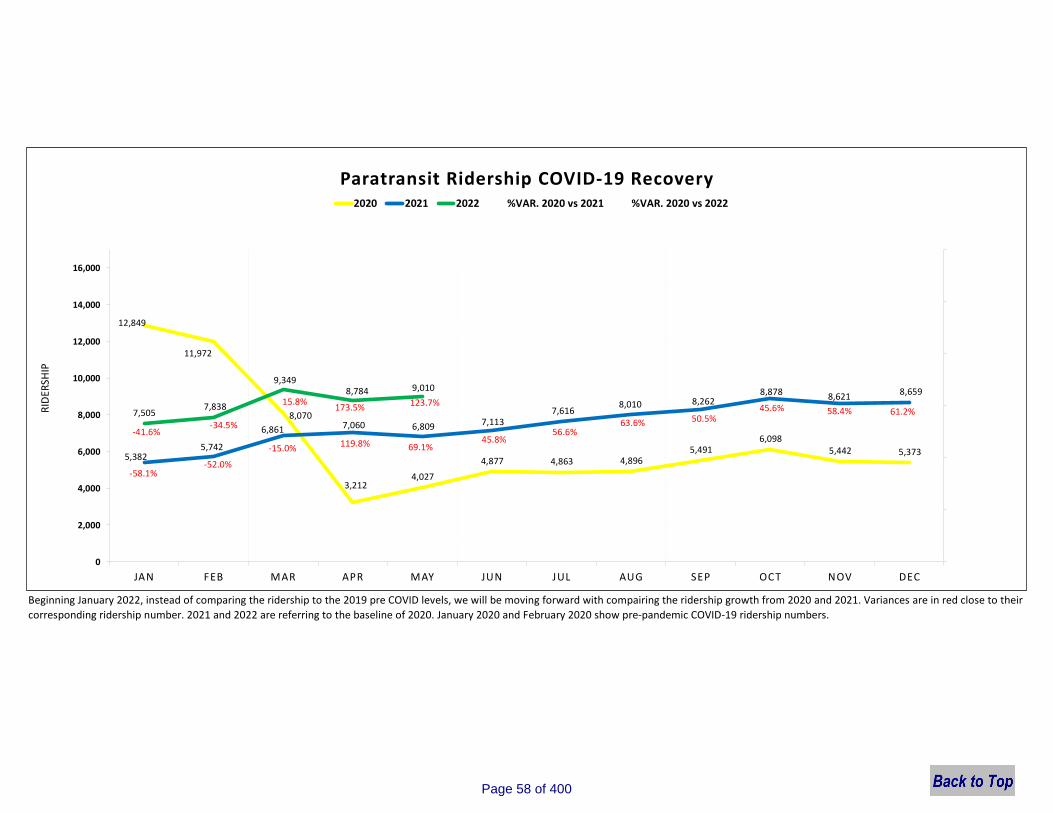
Beginning January 2022, instead of comparing the ridership to the 2019 pre COVID levels, we will be moving forward with compairing the ridership growth from 2020 and 2021. Variances are in red close to their
corresponding ridership number. 2021 and 2022 are referring to the baseline of 2020. January 2020 and February 2020 show pre-pandemic COVID-19 ridership numbers.
12,849
11,972
8,070
3,2124,027
4,877 4,863 4,8965,491
6,0985,442 5,3735,382
5,742
6,861 7,060 6,809 7,113 7,616
8,010 8,262 8,878 8,621
8,659
7,5057,838
9,349 8,784 9,010
-58.1%-52.0%
-15.0% 119.8% 69.1%45.8%
56.6%63.6% 50.5%
45.6% 58.4% 61.2%
-41.6%-34.5%
15.8%173.5% 123.7%
-100%
-50%
0%
50%
100%
150%
200%
0
2,000
4,000
6,000
8,000
10,000
12,000
14,000
16,000
JAN FEB MAR APR MAY JUN JUL AUG SEP OCT NOV DEC
RID
ERSH
IP
Paratransit Ridership COVID-19 Recovery2020 2021 2022 %VAR. 2020 vs 2021 %VAR. 2020 vs 2022
Page 58 of 400
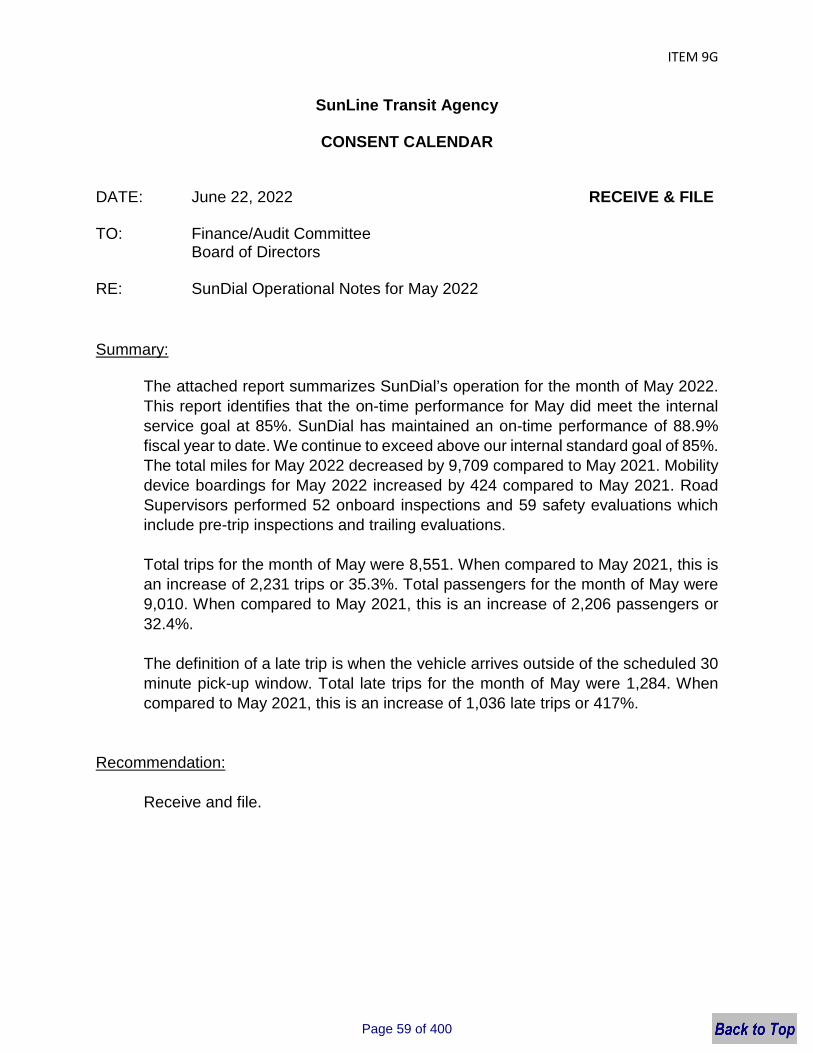
ITEM 9G
SunLine Transit Agency
CONSENT CALENDAR
DATE: June 22, 2022 RECEIVE & FILE
TO: Finance/Audit Committee Board of Directors
RE: SunDial Operational Notes for May 2022
Summary:
The attached report summarizes SunDial’s operation for the month of May 2022. This report identifies that the on-time performance for May did meet the internal service goal at 85%. SunDial has maintained an on-time performance of 88.9% fiscal year to date. We continue to exceed above our internal standard goal of 85%. The total miles for May 2022 decreased by 9,709 compared to May 2021. Mobility device boardings for May 2022 increased by 424 compared to May 2021. Road Supervisors performed 52 onboard inspections and 59 safety evaluations which include pre-trip inspections and trailing evaluations.
Total trips for the month of May were 8,551. When compared to May 2021, this is an increase of 2,231 trips or 35.3%. Total passengers for the month of May were 9,010. When compared to May 2021, this is an increase of 2,206 passengers or 32.4%.
The definition of a late trip is when the vehicle arrives outside of the scheduled 30 minute pick-up window. Total late trips for the month of May were 1,284. When compared to May 2021, this is an increase of 1,036 late trips or 417%.
Recommendation:
Receive and file.
Page 59 of 400
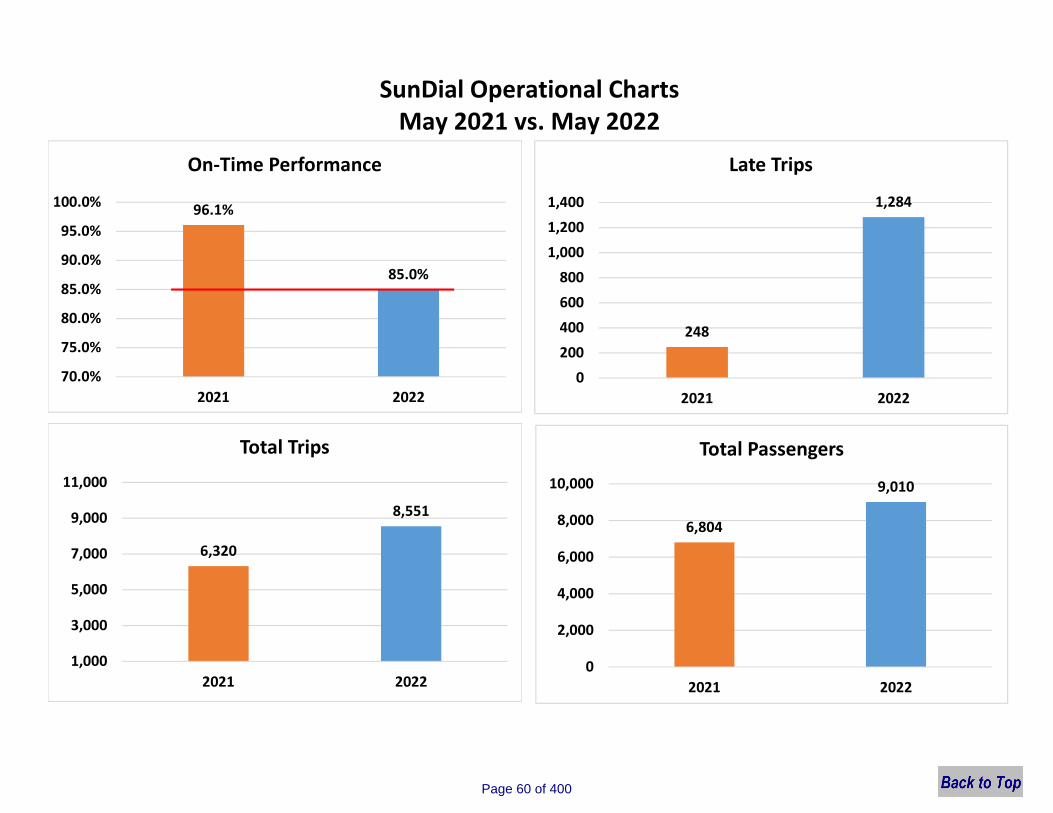
SunDial Operational ChartsMay 2021 vs. May 2022
96.1%
85.0%
70.0%
75.0%
80.0%
85.0%
90.0%
95.0%
100.0%
2021 2022
On-Time Performance
248
1,284
0
200
400
600
800
1,000
1,200
1,400
2021 2022
Late Trips
6,320
8,551
1,000
3,000
5,000
7,000
9,000
11,000
2021 2022
Total Trips
6,804
9,010
0
2,000
4,000
6,000
8,000
10,000
2021 2022
Total Passengers
Page 60 of 400
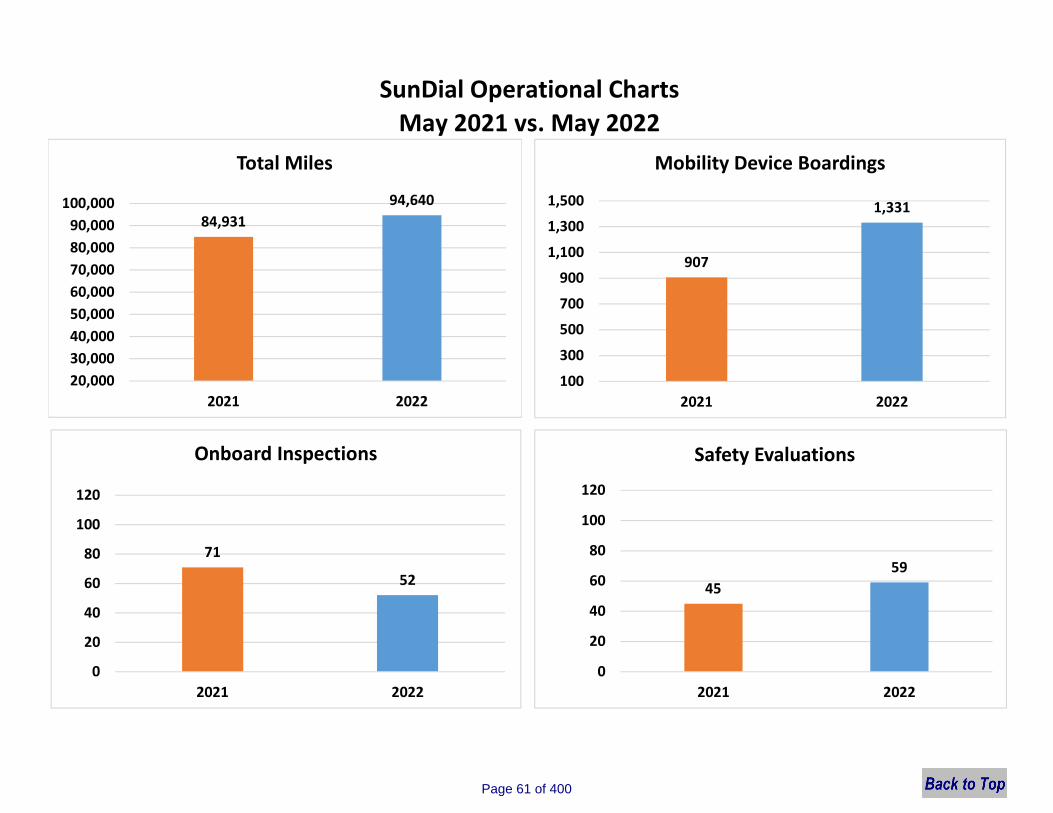
SunDial Operational Charts
May 2021 vs. May 2022
84,931
94,640
20,000
30,000
40,000
50,000
60,000
70,000
80,000
90,000
100,000
2021 2022
Total Miles
71
52
0
20
40
60
80
100
120
2021 2022
Onboard Inspections
45
59
0
20
40
60
80
100
120
2021 2022
Safety Evaluations
907
1,331
100
300
500
700
900
1,100
1,300
1,500
2021 2022
Mobility Device Boardings
Page 61 of 400
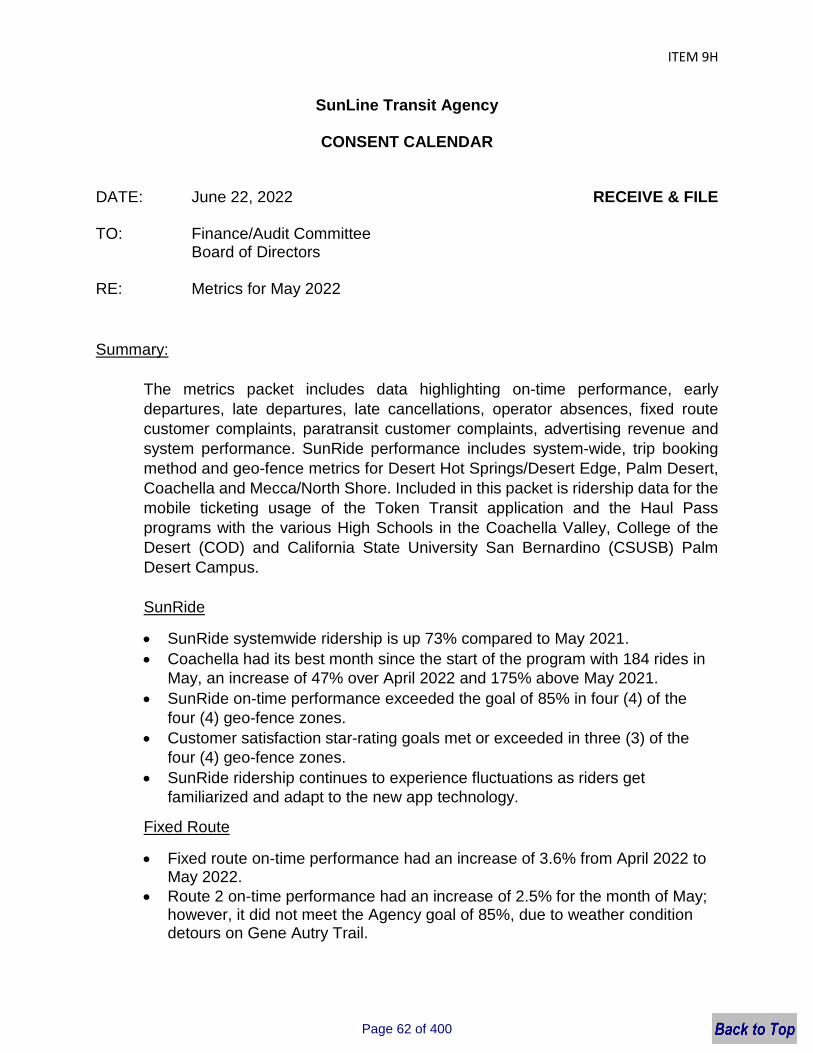
ITEM 9H
SunLine Transit Agency
CONSENT CALENDAR
DATE: June 22, 2022 RECEIVE & FILE
TO: Finance/Audit Committee Board of Directors
RE: Metrics for May 2022
Summary:
The metrics packet includes data highlighting on-time performance, early departures, late departures, late cancellations, operator absences, fixed route customer complaints, paratransit customer complaints, advertising revenue and system performance. SunRide performance includes system-wide, trip booking method and geo-fence metrics for Desert Hot Springs/Desert Edge, Palm Desert, Coachella and Mecca/North Shore. Included in this packet is ridership data for the mobile ticketing usage of the Token Transit application and the Haul Pass programs with the various High Schools in the Coachella Valley, College of the Desert (COD) and California State University San Bernardino (CSUSB) Palm Desert Campus.
SunRide
SunRide systemwide ridership is up 73% compared to May 2021.
Coachella had its best month since the start of the program with 184 rides in May, an increase of 47% over April 2022 and 175% above May 2021.
SunRide on-time performance exceeded the goal of 85% in four (4) of the four (4) geo-fence zones.
Customer satisfaction star-rating goals met or exceeded in three (3) of the four (4) geo-fence zones.
SunRide ridership continues to experience fluctuations as riders get familiarized and adapt to the new app technology.
Fixed Route
Fixed route on-time performance had an increase of 3.6% from April 2022 to May 2022.
Route 2 on-time performance had an increase of 2.5% for the month of May; however, it did not meet the Agency goal of 85%, due to weather condition detours on Gene Autry Trail.
Page 62 of 400
ITEM 9H
Early departures had an increase of 0.2% when compared to the previous month due to the May service change as operators adjust to their new assignments.
Late departures had a decrease of 3.7% from April 2022 to May 2022. CSUSB ridership decline was anticipated due to final exams during the dates
of 05/16/2022 - 05/20/2022 and the conclusion of the spring semester.
Recommendation:
Receive and file.
Page 63 of 400
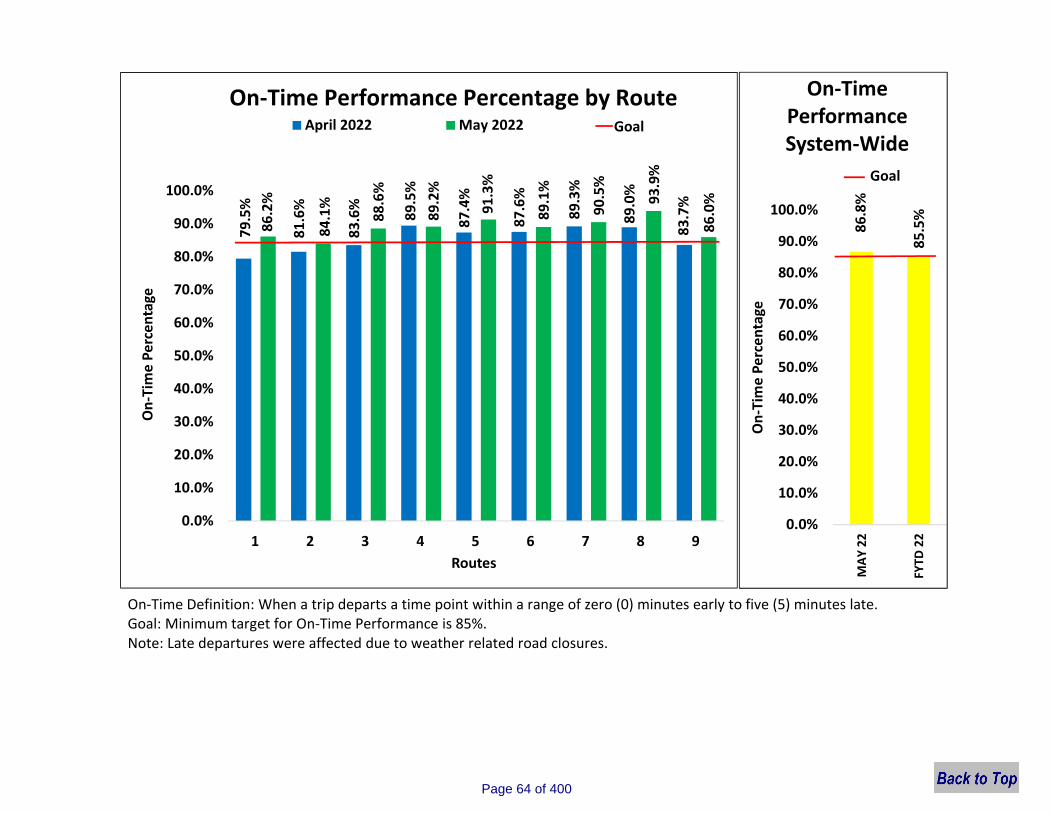
79
.5%
81
.6%
83
.6%
89
.5%
87
.4%
87
.6%
89
.3%
89
.0%
83
.7%
86
.2%
84
.1%
88
.6%
89
.2%
91
.3%
89
.1%
90
.5%
93
.9%
86
.0%
0.0%
10.0%
20.0%
30.0%
40.0%
50.0%
60.0%
70.0%
80.0%
90.0%
100.0%
1 2 3 4 5 6 7 8 9
On
-Tim
e P
erc
en
tage
Routes
April 2022 May 2022 Goal
86
.8%
85
.5%
0.0%
10.0%
20.0%
30.0%
40.0%
50.0%
60.0%
70.0%
80.0%
90.0%
100.0%
MA
Y 2
2
FYTD
22
On
-Tim
e P
erc
en
tage
On-Time Performance System-Wide
On-Time Performance Percentage by Route
On-Time Definition: When a trip departs a time point within a range of zero (0) minutes early to five (5) minutes late.Goal: Minimum target for On-Time Performance is 85%.Note: Late departures were affected due to weather related road closures.
Goal
Page 64 of 400
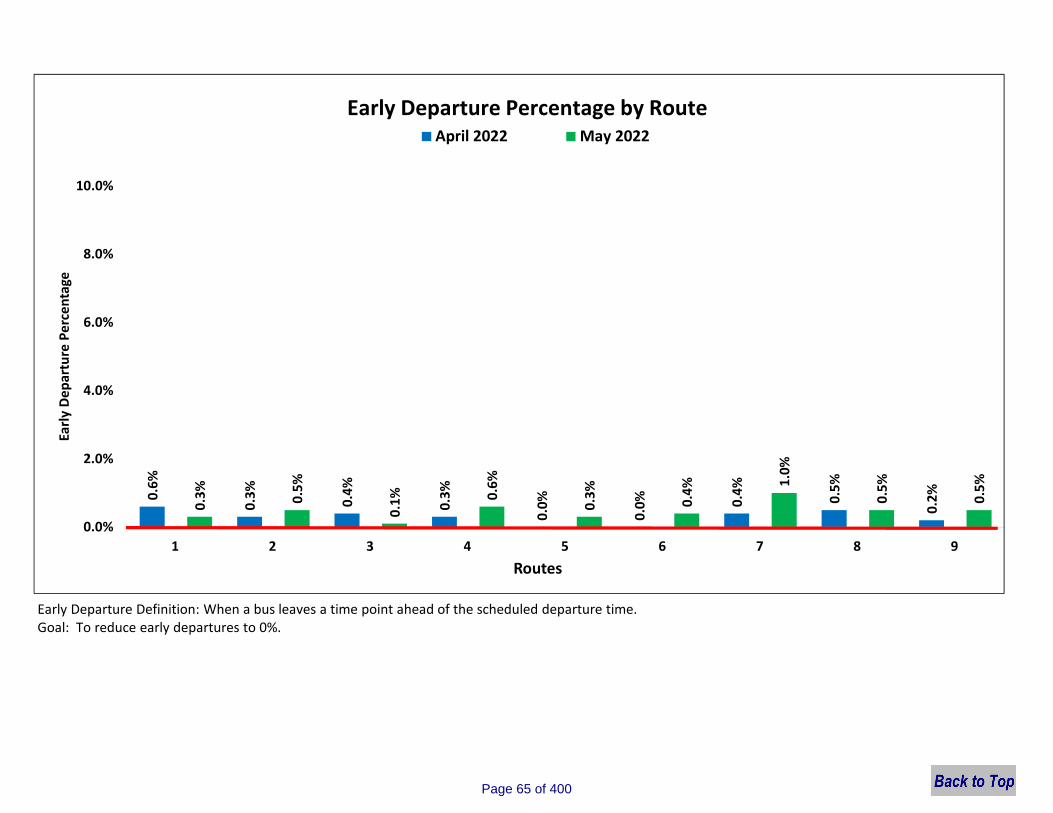
0.6
%
0.3
%
0.4
%
0.3
%
0.0
%
0.0
% 0.4
%
0.5
%
0.2
%
0.3
%
0.5
%
0.1
% 0.6
%
0.3
%
0.4
% 1.0
%
0.5
%
0.5
%
0.0%
2.0%
4.0%
6.0%
8.0%
10.0%
1 2 3 4 5 6 7 8 9
Earl
y D
ep
artu
re P
erc
en
tage
Routes
April 2022 May 2022
Early Departure Percentage by Route
Early Departure Definition: When a bus leaves a time point ahead of the scheduled departure time.Goal: To reduce early departures to 0%.
Page 65 of 400
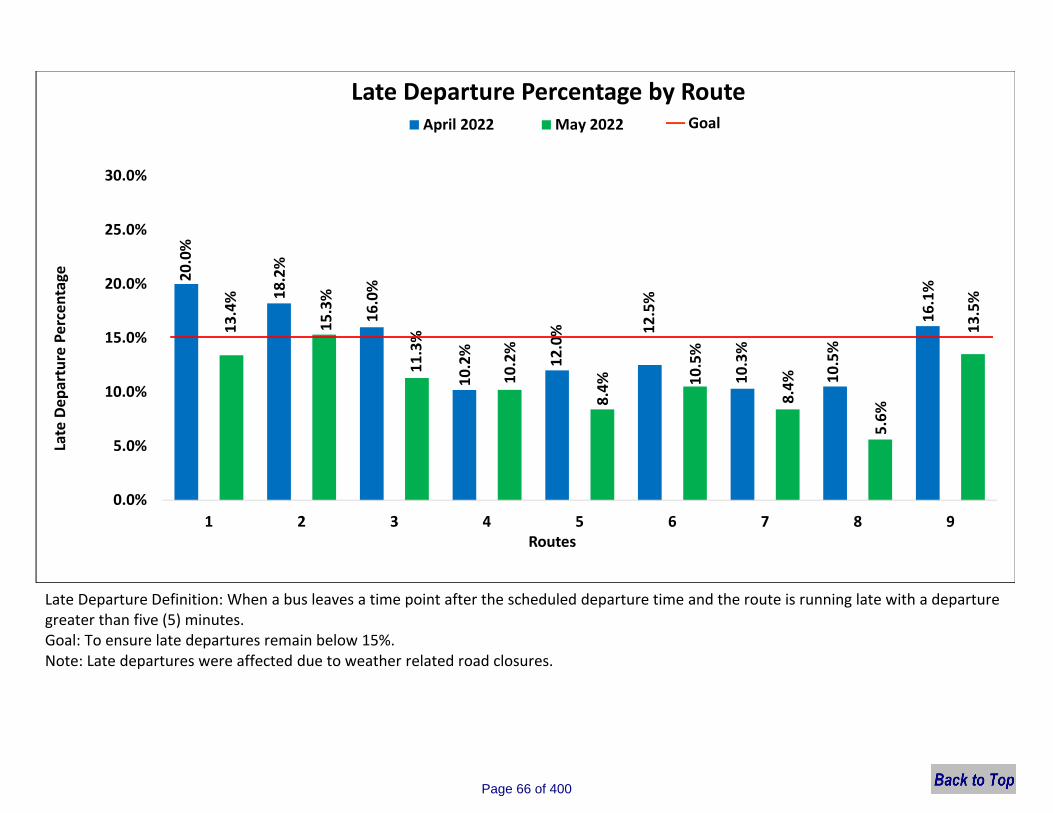
20
.0%
18
.2%
16
.0%
10
.2%
12
.0% 1
2.5
%
10
.3%
10
.5%
16
.1%
13
.4%
15
.3%
11
.3%
10
.2%
8.4
% 10
.5%
8.4
%
5.6
%
13
.5%
0.0%
5.0%
10.0%
15.0%
20.0%
25.0%
30.0%
1 2 3 4 5 6 7 8 9
Late
De
par
ture
Pe
rce
nta
ge
Routes
Late Departure Percentage by Route April 2022 May 2022 Goal
Late Departure Definition: When a bus leaves a time point after the scheduled departure time and the route is running late with a departure greater than five (5) minutes. Goal: To ensure late departures remain below 15%.Note: Late departures were affected due to weather related road closures.
Page 66 of 400
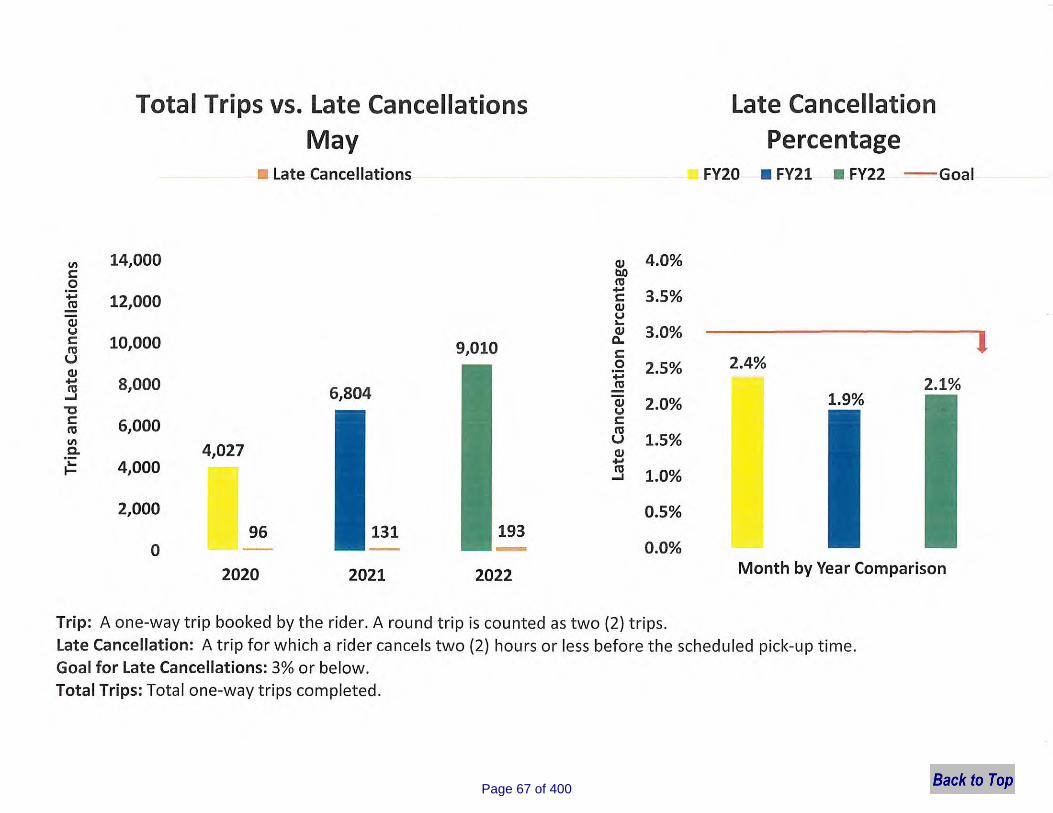
Page 67 of 400
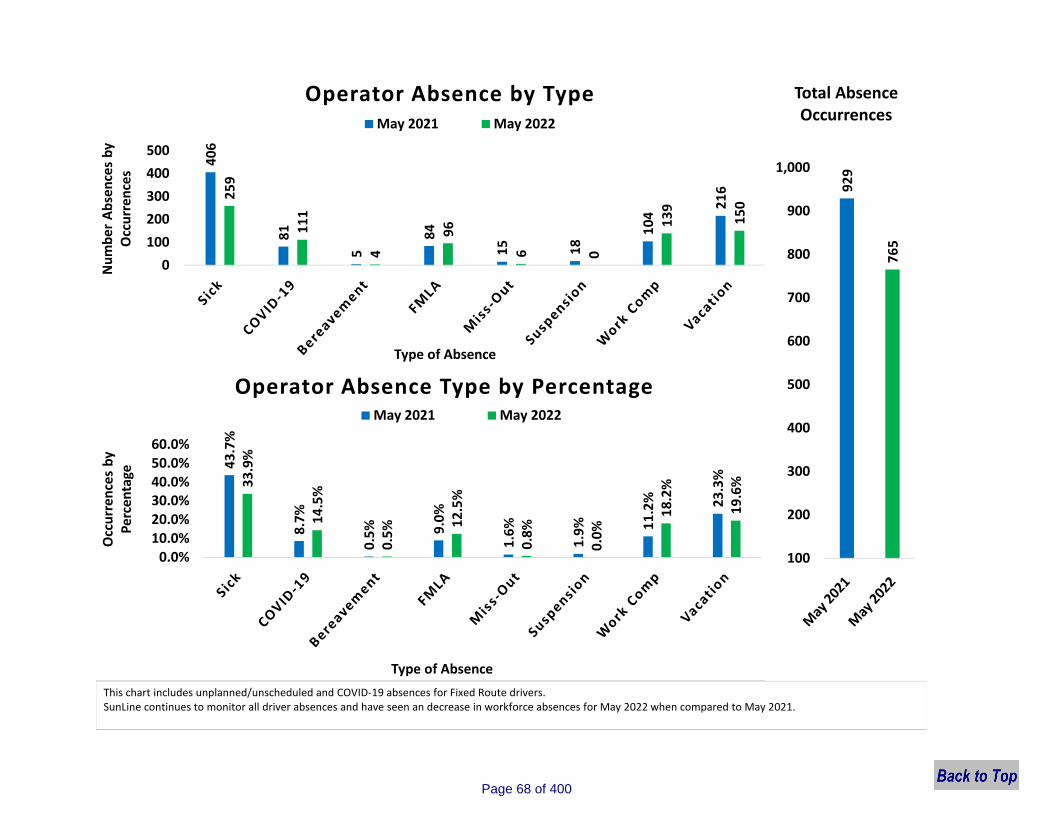
40
6
81
5
84
15 18
10
4
21
625
9
11
1
4
96
6 0
13
9
15
0
0
100
200
300
400
500
Nu
mb
er A
bse
nce
s b
y O
ccu
rren
ces
Type of Absence
Operator Absence by TypeMay 2021 May 2022
43
.7%
8.7
%
0.5
% 9.0
%
1.6
%
1.9
% 11
.2% 23
.3%33
.9%
14
.5%
0.5
% 12
.5%
0.8
%
0.0
%
18
.2%
19
.6%
0.0%10.0%20.0%30.0%40.0%50.0%60.0%
Occ
urr
ence
s b
y P
erc
enta
ge
Type of Absence
Operator Absence Type by Percentage May 2021 May 2022
This chart includes unplanned/unscheduled and COVID-19 absences for Fixed Route drivers.SunLine continues to monitor all driver absences and have seen an decrease in workforce absences for May 2022 when compared to May 2021.
92
9
76
5
100
200
300
400
500
600
700
800
900
1,000
Total Absence Occurrences
Page 68 of 400

In the month of September, we saw an increase in customer complaints. We attribute this to the implementation of Level 1 service, which caused some interruptions in service due to the lack of workforce.
This chart represents the number of boardings and total valid complaints as well as the number of valid complaints per 100,000 boardings for the Fixed Route system.
147,348
162,444
175,075
187,878
177,680173,621 175,966 175,268
213,838
196,568
210,945
15
30
62
45
23
19
15 14
28
14 13
10.2
18.5
35.4
24.0
12.910.9
8.5 8.0
13.1
7.1 6.20
10
20
30
40
50
60
70
80
90
0
25,000
50,000
75,000
100,000
125,000
150,000
175,000
200,000
225,000
JUL AUG SEP OCT NOV DEC JAN FEB MAR APR MAY
RID
ERSH
IP
Fixed Route Customer Complaints FY22
FY22 BOARDINGS FY22 COMPLAINTS COMPLAINTS PER 100,000 BOARDINGS
For the month of May, 99.99% of our total rides did not receive a complaint
Page 69 of 400

This chart represents the number of boardings and total valid complaints as well as the number of valid complaints per 1,000 boardings for the Paratransit service.
7,6168,010
8,262
8,8788,621 8,659
7,5057,838
9,349
8,7849,010
11
14
8
15
12
19
9
14
109
17
1.4 1.71.0
1.7 1.42.2
1.21.8
1.1 1.01.9
0
5
10
15
20
25
30
0
1,000
2,000
3,000
4,000
5,000
6,000
7,000
8,000
9,000
10,000
JUL AUG SEP OCT NOV DEC JAN FEB MAR APR MAY
RID
ERSH
IP
Paratransit Customer Complaints FY22
FY22 BOARDINGS FY22 COMPLAINTS COMPLAINTS PER 1,000 BOARDINGS
For the month of May, 99.81% of our total rides did not receive a complaint
Page 70 of 400
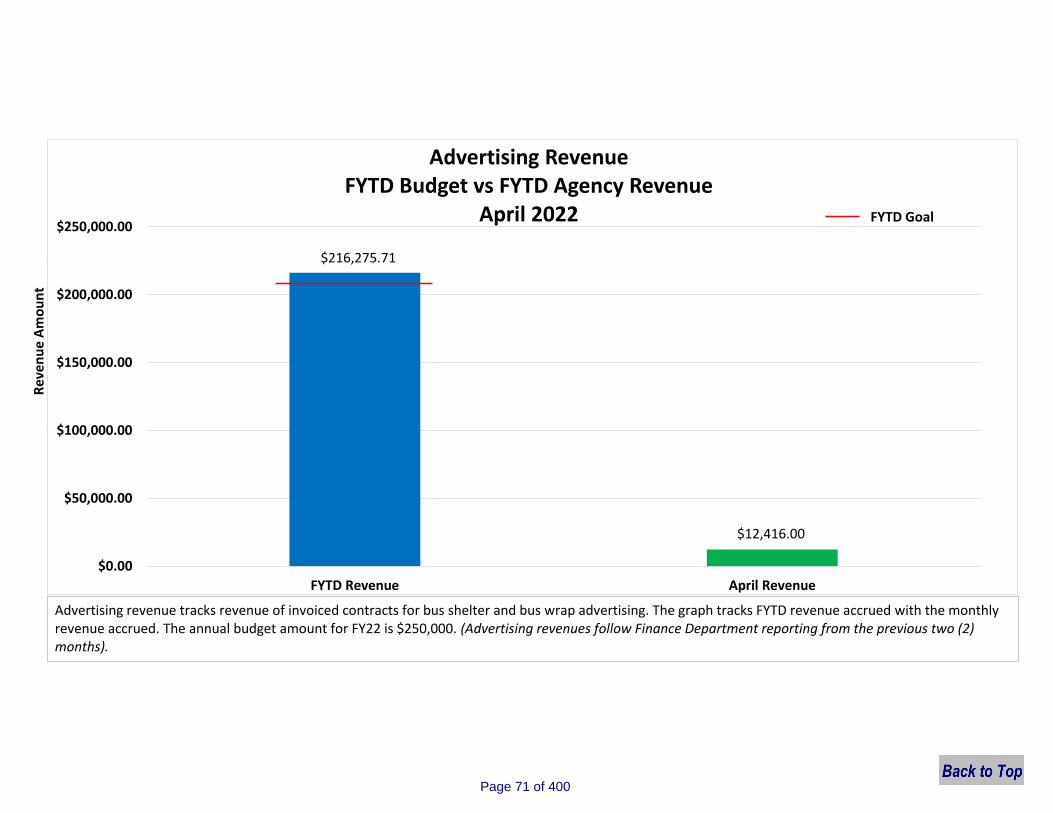
24192399
0.83%
Advertising Revenue February 2019-2021
$216,275.71
$12,416.00
$0.00
$50,000.00
$100,000.00
$150,000.00
$200,000.00
$250,000.00
FYTD Revenue April Revenue
Advertising Revenue FYTD Budget vs FYTD Agency Revenue
April 2022
Reve
nue
Amou
nt
Advertising revenue tracks revenue of invoiced contracts for bus shelter and bus wrap advertising. The graph tracks FYTD revenue accrued with the monthly revenue accrued. The annual budget amount for FY22 is $250,000. (Advertising revenues follow Finance Department reporting from the previous two (2) months).
FYTD Goal
Page 71 of 400
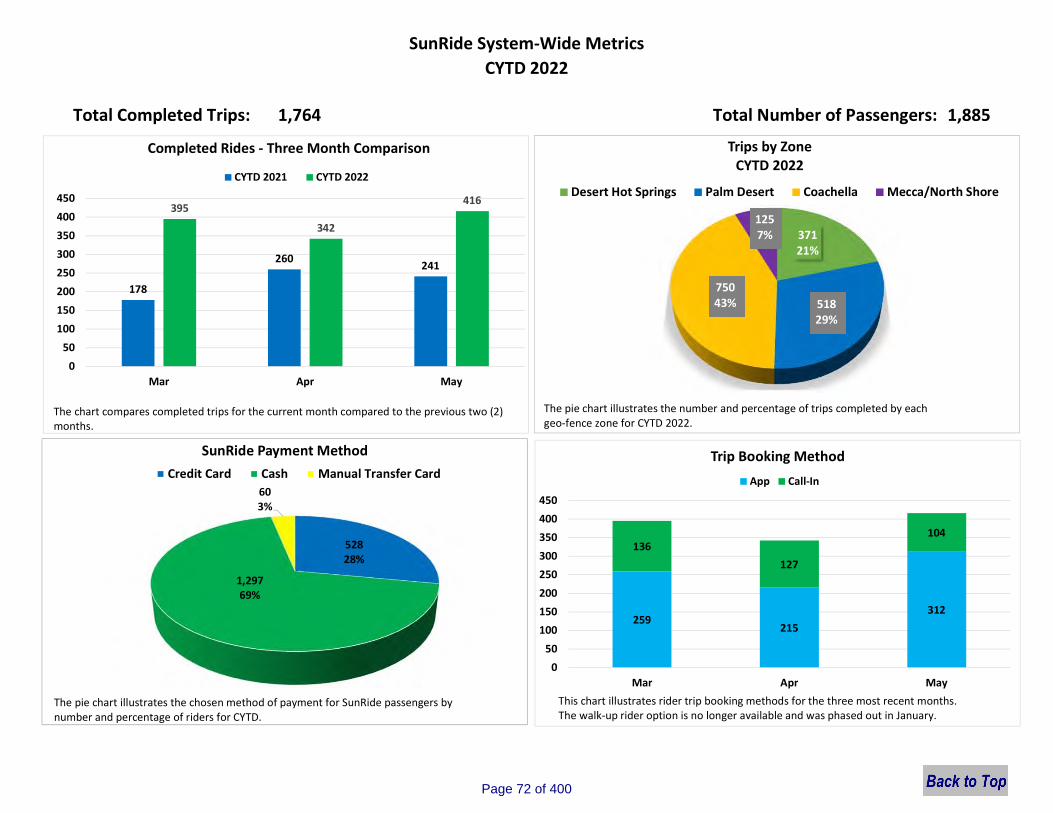
Total Completed Trips: 1,764 1,885
SunRide System-Wide MetricsCYTD 2022
Total Number of Passengers:
52828%
1,29769%
603%
SunRide Payment MethodCredit Card Cash Manual Transfer Card
37121%
51829%
75043%
1257%
Trips by ZoneCYTD 2022
Desert Hot Springs Palm Desert Coachella Mecca/North Shore
The pie chart illustrates the number and percentage of trips completed by each geo-fence zone for CYTD 2022.
The pie chart illustrates the chosen method of payment for SunRide passengers by number and percentage of riders for CYTD.
178
260 241
395
342
416
0
50
100
150
200
250
300
350
400
450
Mar Apr May
Completed Rides - Three Month Comparison
CYTD 2021 CYTD 2022
The chart compares completed trips for the current month compared to the previous two (2) months.
259215
312
136127
104
0
50
100
150
200
250
300
350
400
450
Mar Apr May
Trip Booking Method
App Call-In
This chart illustrates rider trip booking methods for the three most recent months. The walk-up rider option is no longer available and was phased out in January.
Page 72 of 400
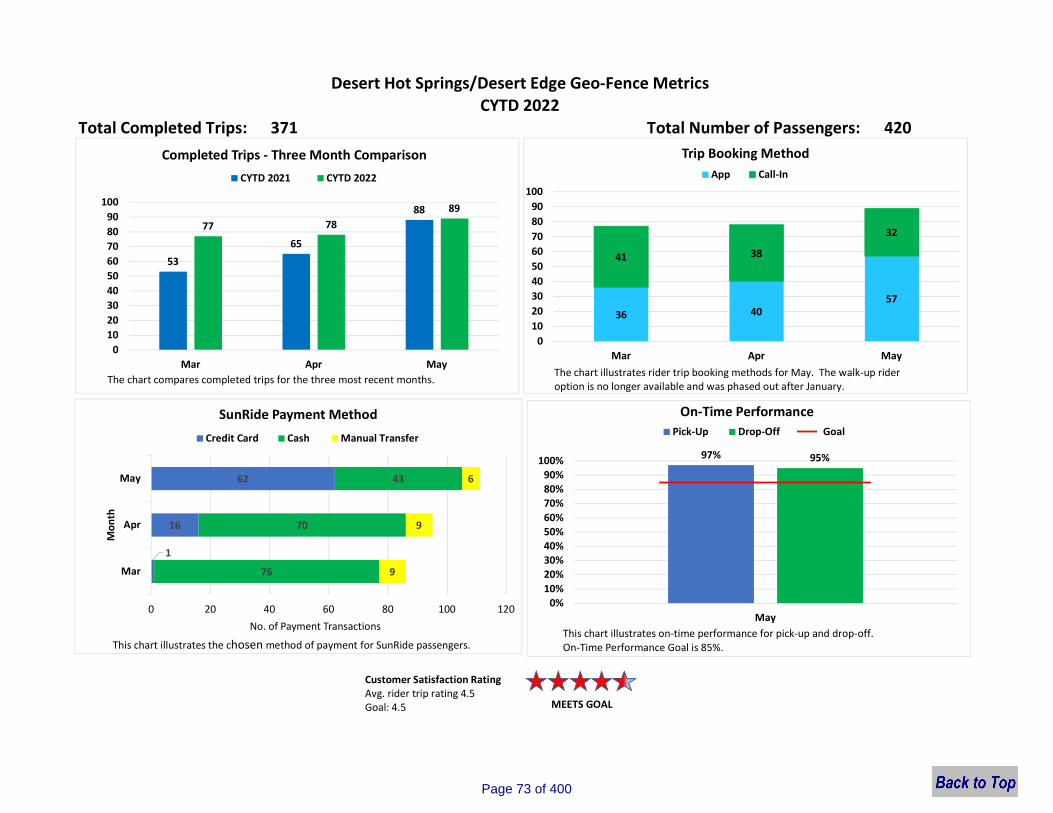
Total Completed Trips: 371 Total Number of Passengers: 420
MEETS GOAL
Desert Hot Springs/Desert Edge Geo-Fence MetricsCYTD 2022
Customer Satisfaction Rating Avg. rider trip rating 4.5Goal: 4.5
53
65
8877 78
89
0102030405060708090
100
Mar Apr May
Completed Trips - Three Month ComparisonCYTD 2021 CYTD 2022
The chart compares completed trips for the three most recent months.
36 4057
41 38
32
0102030405060708090
100
Mar Apr May
Trip Booking MethodApp Call-In
The chart illustrates rider trip booking methods for May. The walk-up rider option is no longer available and was phased out after January.
1
16
62
76
70
43
9
9
6
Mar
Apr
May
0 20 40 60 80 100 120
Mon
th
No. of Payment Transactions
SunRide Payment Method
Credit Card Cash Manual Transfer
This chart illustrates the chosen method of payment for SunRide passengers.
97% 95%
0%10%20%30%40%50%60%70%80%90%
100%
May
On-Time PerformancePick-Up Drop-Off
This chart illustrates on-time performance for pick-up and drop-off.On-Time Performance Goal is 85%.
Goal
Page 73 of 400
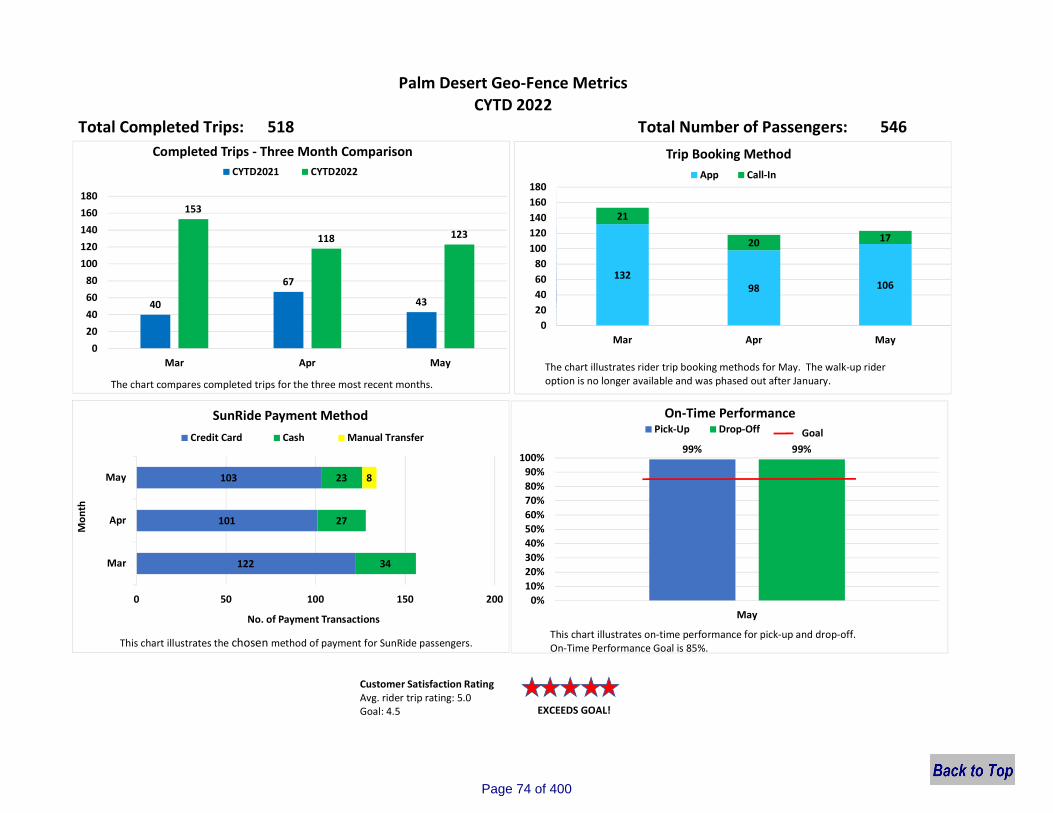
Total Completed Trips: 518 Total Number of Passengers: 546
EXCEEDS GOAL!
Palm Desert Geo-Fence MetricsCYTD 2022
Customer Satisfaction Rating Avg. rider trip rating: 5.0Goal: 4.5
40
67
43
153
118 123
020406080
100120140160180
Mar Apr May
Completed Trips - Three Month ComparisonCYTD2021 CYTD2022
The chart compares completed trips for the three most recent months.
13298 106
21
20 17
020406080
100120140160180
Mar Apr May
Trip Booking MethodApp Call-In
The chart illustrates rider trip booking methods for May. The walk-up rider option is no longer available and was phased out after January.
122
101
103
34
27
23 8
Mar
Apr
May
0 50 100 150 200
Mon
th
No. of Payment Transactions
SunRide Payment MethodCredit Card Cash Manual Transfer
This chart illustrates the chosen method of payment for SunRide passengers.
99% 99%
0%10%20%30%40%50%60%70%80%90%
100%
May
On-Time PerformancePick-Up Drop-Off
This chart illustrates on-time performance for pick-up and drop-off.On-Time Performance Goal is 85%.
Goal
Page 74 of 400
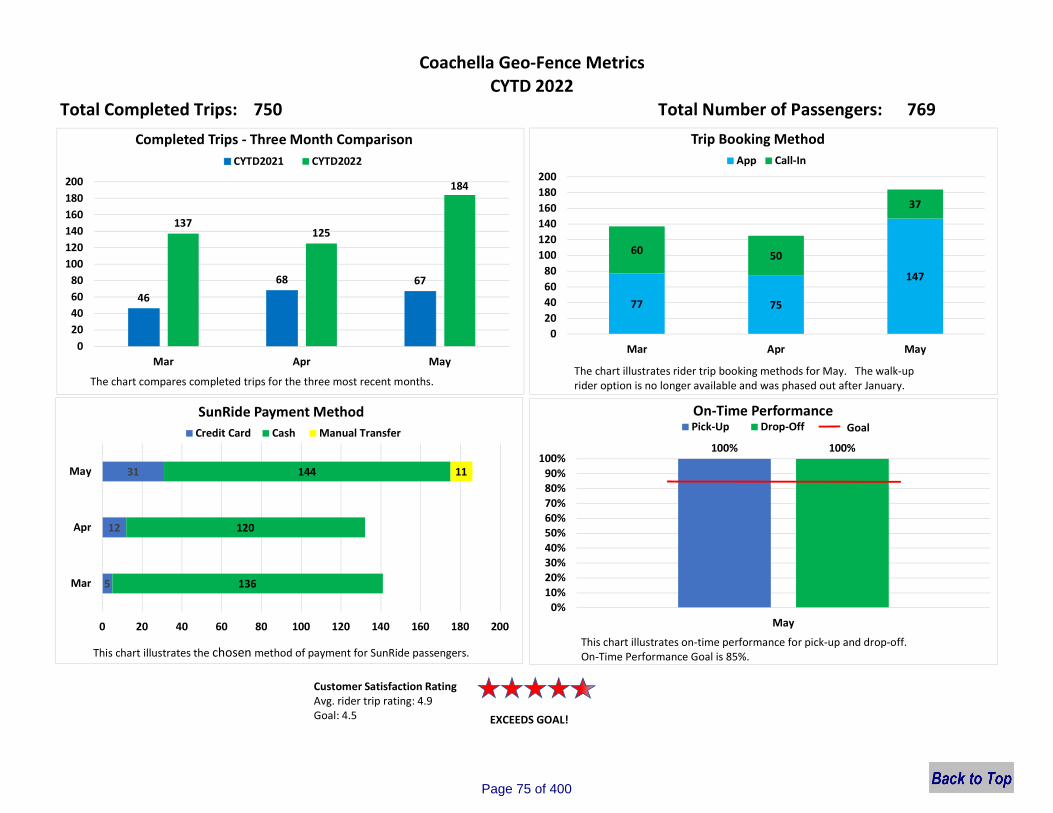
Total Completed Trips: 750 Total Number of Passengers: 769
EXCEEDS GOAL!
Coachella Geo-Fence MetricsCYTD 2022
Customer Satisfaction Rating Avg. rider trip rating: 4.9Goal: 4.5
This chart illustrates on-time performance for pick-up and drop-off.On-Time Performance Goal is 85%.
4668 67
137125
184
020406080
100120140160180200
Mar Apr May
Completed Trips - Three Month ComparisonCYTD2021 CYTD2022
The chart compares completed trips for the three most recent months.
77 75
147
60 50
37
020406080
100120140160180200
Mar Apr May
Trip Booking MethodApp Call-In
The chart illustrates rider trip booking methods for May. The walk-up rider option is no longer available and was phased out after January.
5
12
31
136
120
144 11
0 20 40 60 80 100 120 140 160 180 200
Mar
Apr
May
SunRide Payment MethodCredit Card Cash Manual Transfer
This chart illustrates the chosen method of payment for SunRide passengers.
100% 100%
0%10%20%30%40%50%60%70%80%90%
100%
May
On-Time PerformancePick-Up Drop-Off Goal
This chart illustrates on-time performance for pick-up and drop-off.On-Time Performance Goal is 85%.
Page 75 of 400
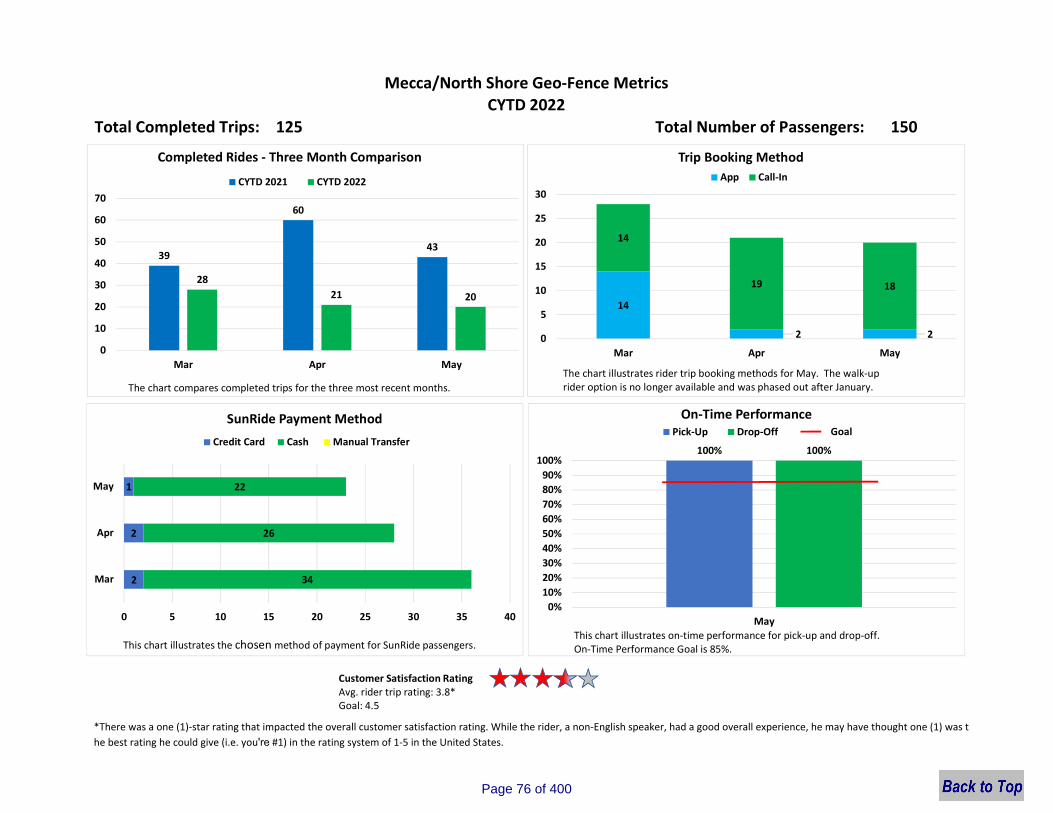
Total Completed Trips: 125 Total Number of Passengers: 150
Mecca/North Shore Geo-Fence MetricsCYTD 2022
*There was a one (1)-star rating that impacted the overall customer satisfaction rating. While the rider, a non-English speaker, had a good overall experience, he may have thought one (1) was the best rating he could give (i.e. you're #1) in the rating system of 1-5 in the United States.
Customer Satisfaction Rating Avg. rider trip rating: 3.8*Goal: 4.5
v
39
60
43
2821 20
0
10
20
30
40
50
60
70
Mar Apr May
Completed Rides - Three Month Comparison
CYTD 2021 CYTD 2022
The chart compares completed trips for the three most recent months.
14
2 2
14
19 18
0
5
10
15
20
25
30
Mar Apr May
Trip Booking MethodApp Call-In
The chart illustrates rider trip booking methods for May. The walk-up rider option is no longer available and was phased out after January.
2
2
1
34
26
22
0 5 10 15 20 25 30 35 40
Mar
Apr
May
SunRide Payment Method
Credit Card Cash Manual Transfer
This chart illustrates the chosen method of payment for SunRide passengers.
100% 100%
0%10%20%30%40%50%60%70%80%90%
100%
May
On-Time PerformancePick-Up Drop-Off Goal
This chart illustrates on-time performance for pick-up and drop-off.On-Time Performance Goal is 85%.
Page 76 of 400
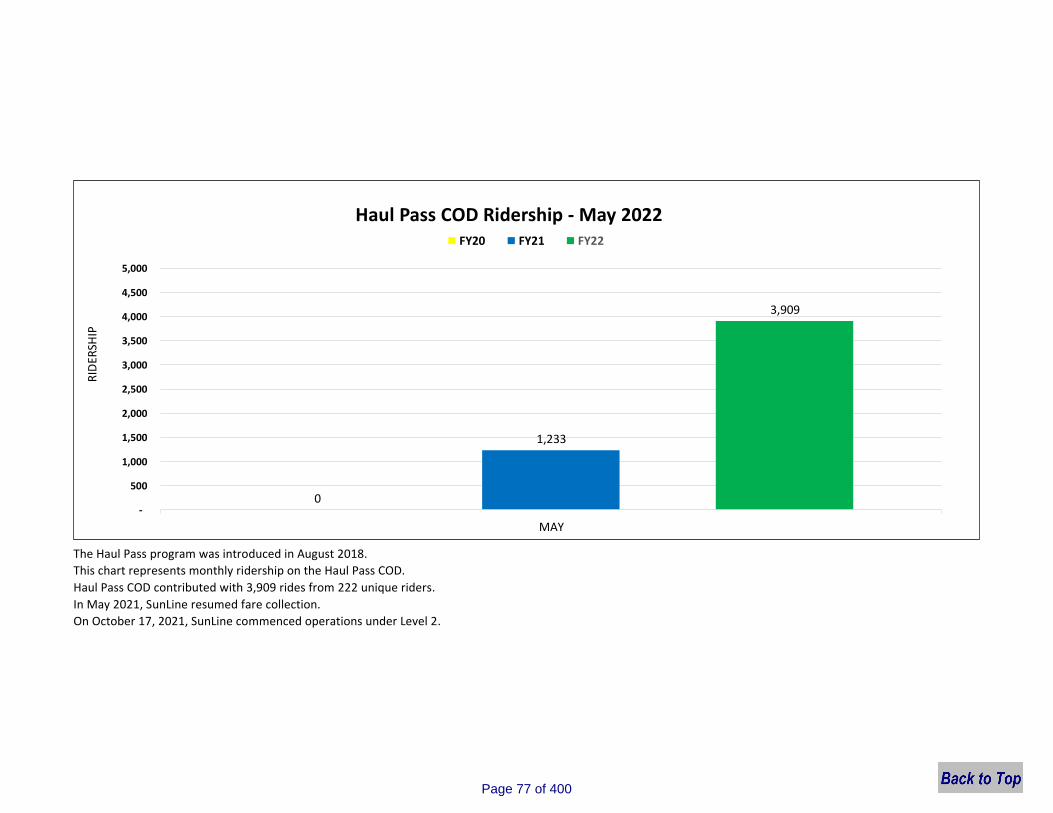
The Haul Pass program was introduced in August 2018.
This chart represents monthly ridership on the Haul Pass COD.
Haul Pass COD contributed with 3,909 rides from 222 unique riders.
In May 2021, SunLine resumed fare collection.
On October 17, 2021, SunLine commenced operations under Level 2.
0
1,233
3,909
-
500
1,000
1,500
2,000
2,500
3,000
3,500
4,000
4,500
5,000
MAY
RID
ERSH
IP
Haul Pass COD Ridership - May 2022FY20 FY21 FY22
Page 77 of 400
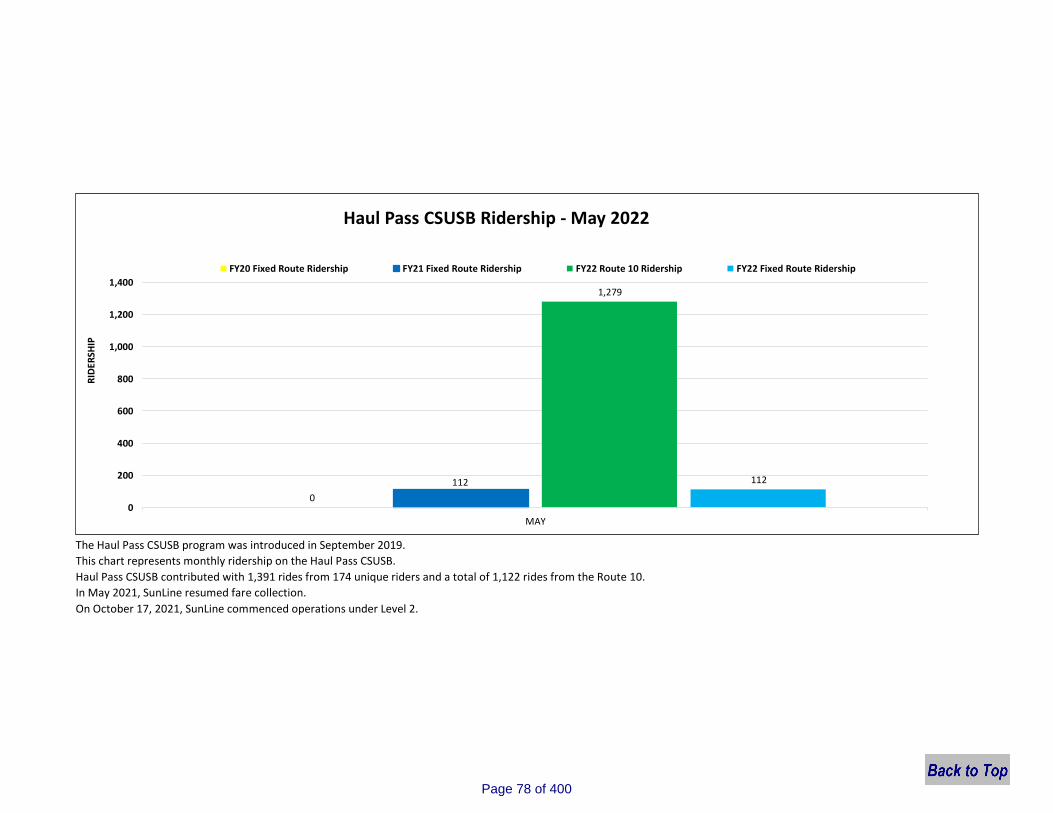
The Haul Pass CSUSB program was introduced in September 2019.
This chart represents monthly ridership on the Haul Pass CSUSB.
Haul Pass CSUSB contributed with 1,391 rides from 174 unique riders and a total of 1,122 rides from the Route 10.
In May 2021, SunLine resumed fare collection.
On October 17, 2021, SunLine commenced operations under Level 2.
0
112
1,279
112
0
200
400
600
800
1,000
1,200
1,400
MAY
RID
ERSH
IP
Haul Pass CSUSB Ridership - May 2022
FY20 Fixed Route Ridership FY21 Fixed Route Ridership FY22 Route 10 Ridership FY22 Fixed Route Ridership
Page 78 of 400
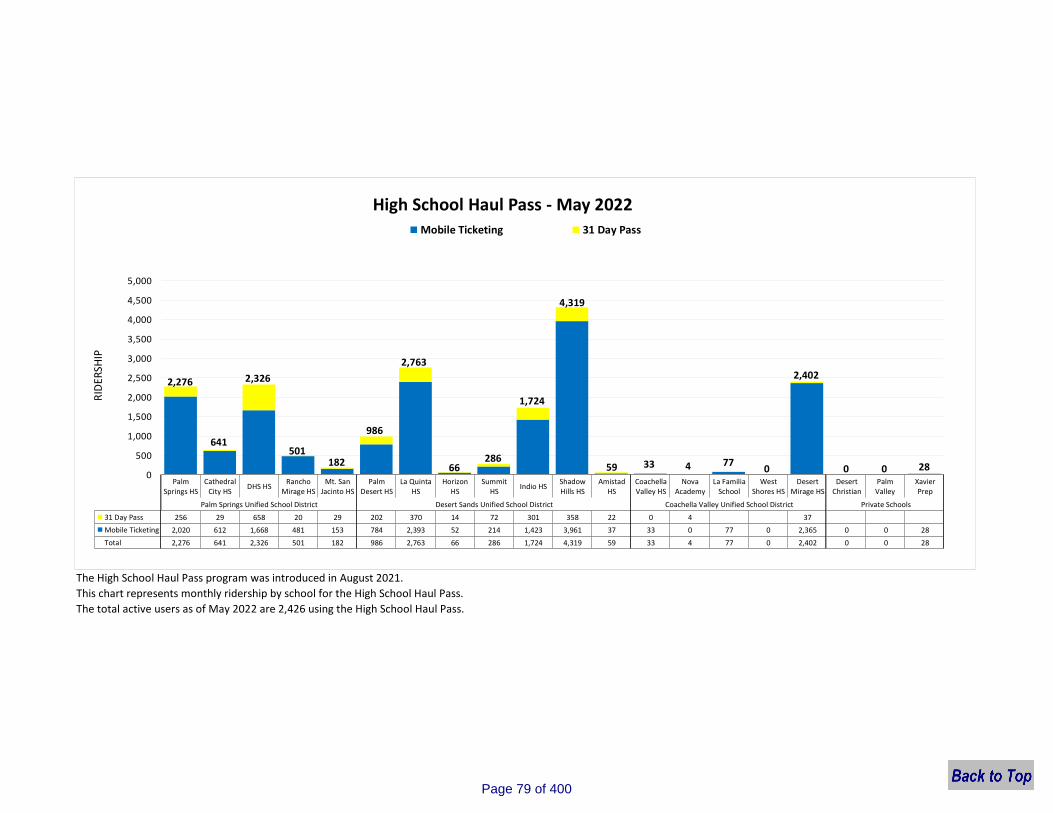
The High School Haul Pass program was introduced in August 2021.
This chart represents monthly ridership by school for the High School Haul Pass.
The total active users as of May 2022 are 2,426 using the High School Haul Pass.
PalmSprings HS
CathedralCity HS
DHS HSRancho
Mirage HSMt. San
Jacinto HSPalm
Desert HSLa Quinta
HSHorizon
HSSummit
HSIndio HS
ShadowHills HS
AmistadHS
CoachellaValley HS
NovaAcademy
La FamiliaSchool
WestShores HS
DesertMirage HS
DesertChristian
PalmValley
XavierPrep
Palm Springs Unified School District Desert Sands Unified School District Coachella Valley Unified School District Private Schools
31 Day Pass 256 29 658 20 29 202 370 14 72 301 358 22 0 4 37
Mobile Ticketing 2,020 612 1,668 481 153 784 2,393 52 214 1,423 3,961 37 33 0 77 0 2,365 0 0 28
Total 2,276 641 2,326 501 182 986 2,763 66 286 1,724 4,319 59 33 4 77 0 2,402 0 0 28
2,276
641
2,326
501182
986
2,763
66286
1,724
4,319
59 33 4 770
2,402
0 0 280
500
1,000
1,500
2,000
2,500
3,000
3,500
4,000
4,500
5,000
RID
ERSH
IP
High School Haul Pass - May 2022Mobile Ticketing 31 Day Pass
Page 79 of 400
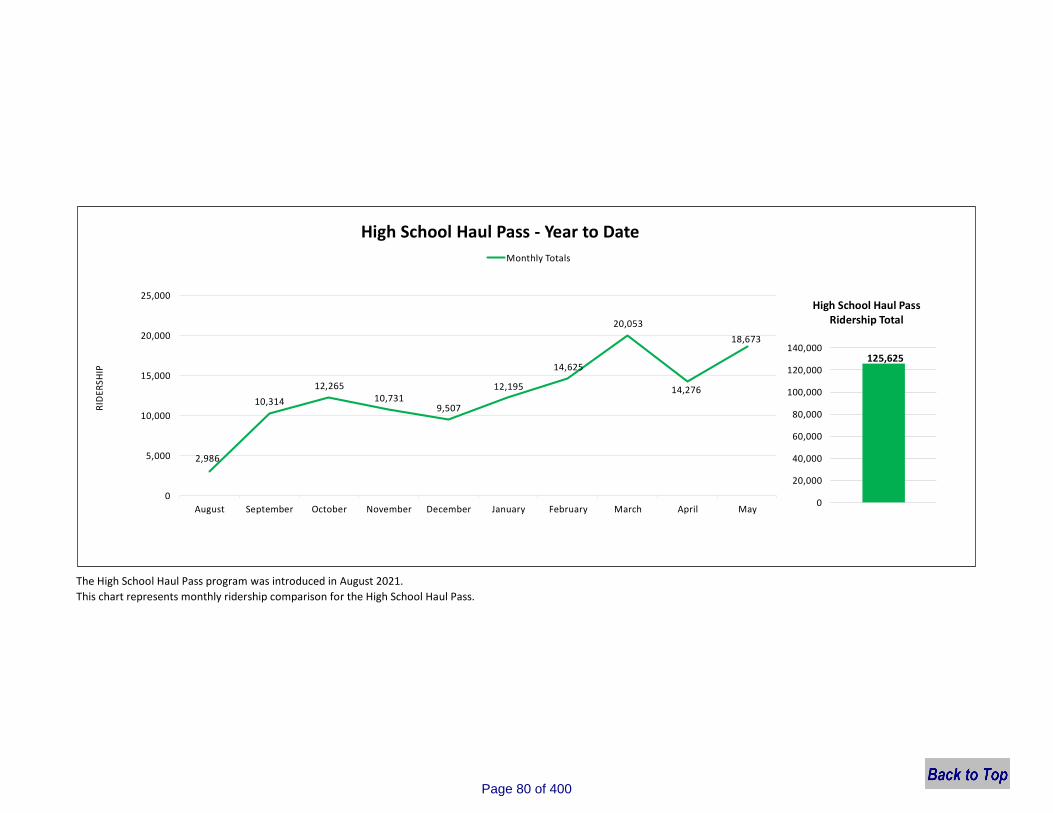
The High School Haul Pass program was introduced in August 2021.
This chart represents monthly ridership comparison for the High School Haul Pass.
2,986
10,314
12,26510,731
9,507
12,195
14,625
20,053
14,276
18,673
0
5,000
10,000
15,000
20,000
25,000
August September October November December January February March April May
RID
ERSH
IP
High School Haul Pass - Year to Date
Monthly Totals
125,625
0
20,000
40,000
60,000
80,000
100,000
120,000
140,000
High School Haul Pass Ridership Total
Page 80 of 400
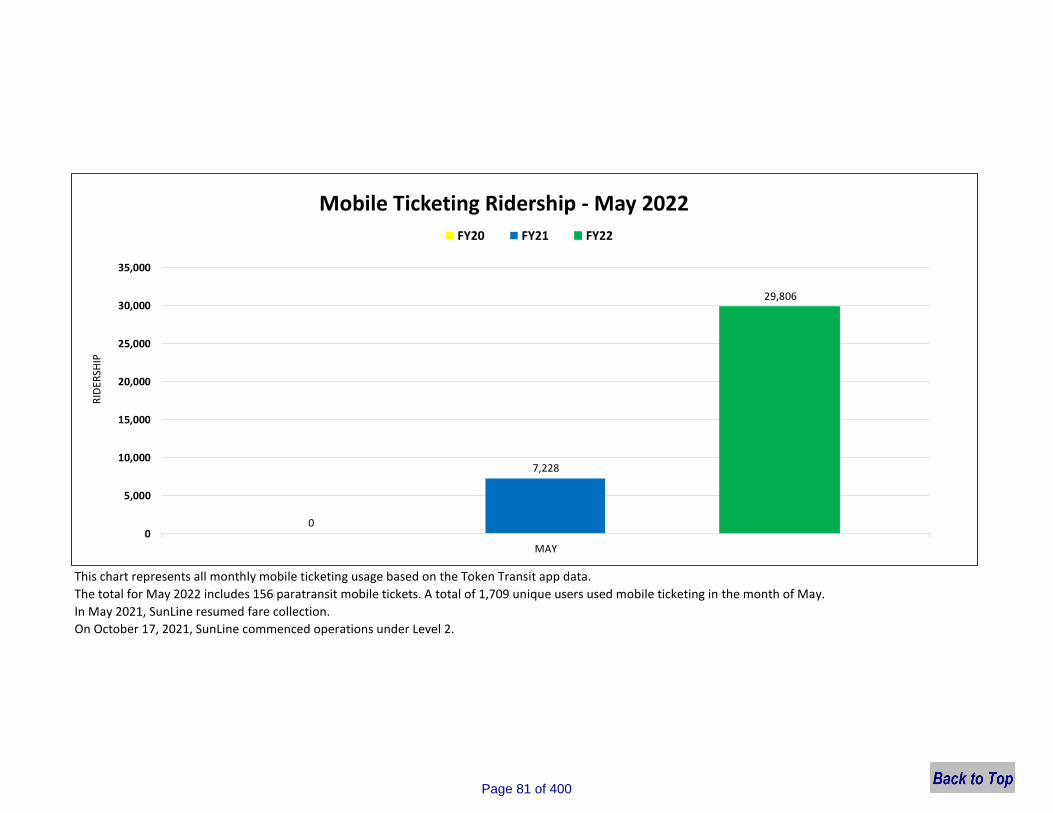
This chart represents all monthly mobile ticketing usage based on the Token Transit app data.
The total for May 2022 includes 156 paratransit mobile tickets. A total of 1,709 unique users used mobile ticketing in the month of May.
In May 2021, SunLine resumed fare collection.
On October 17, 2021, SunLine commenced operations under Level 2.
0
7,228
29,806
0
5,000
10,000
15,000
20,000
25,000
30,000
35,000
MAY
RID
ERSH
IP
Mobile Ticketing Ridership - May 2022
FY20 FY21 FY22
Page 81 of 400
ITEM 9I
SunLine Transit Agency
CONSENT CALENDAR
DATE: June 22, 2022 RECEIVE & FILE
TO: Finance/Audit Committee Board of Directors
RE: Board Member Attendance for May 2022
Summary:
The attached report summarizes the Board of Directors’ attendance for fiscal year to date May 2022.
Recommendation:
Receive and file.
Page 82 of 400
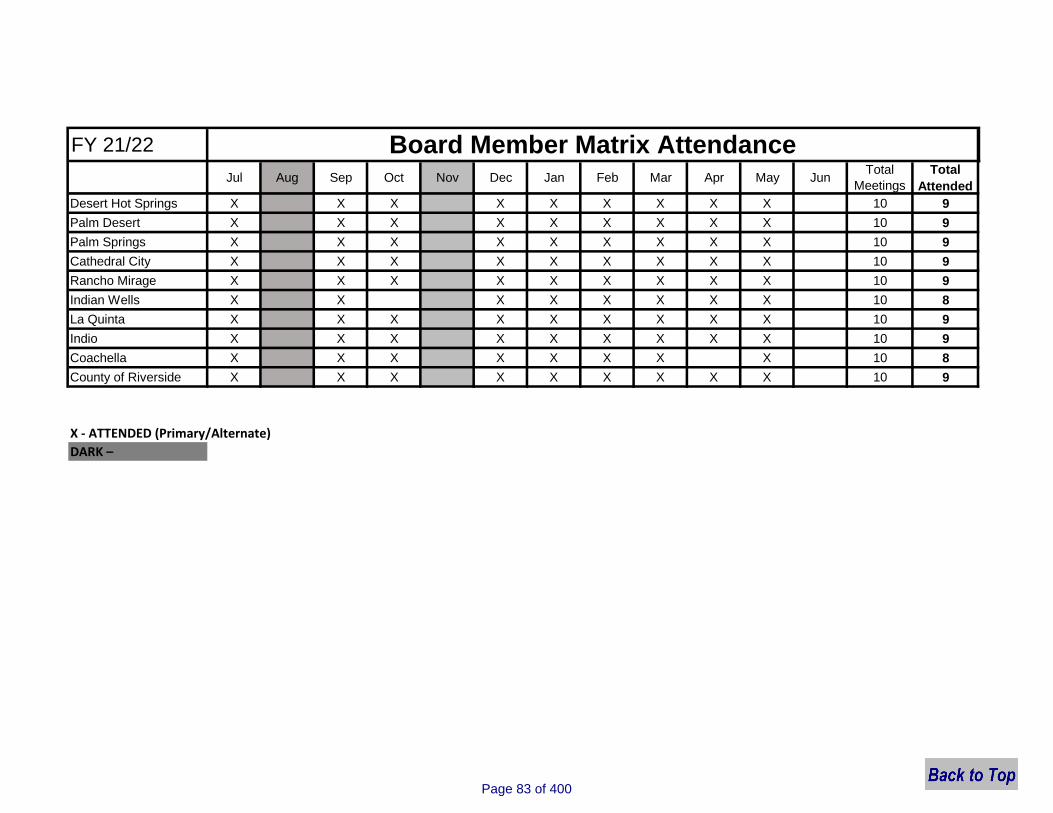
FY 21/22
Jul Aug Sep Oct Nov Dec Jan Feb Mar Apr May JunTotal
MeetingsTotal
Attended
Desert Hot Springs X X X X X X X X X 10 9
Palm Desert X X X X X X X X X 10 9
Palm Springs X X X X X X X X X 10 9
Cathedral City X X X X X X X X X 10 9
Rancho Mirage X X X X X X X X X 10 9
Indian Wells X X X X X X X X 10 8
La Quinta X X X X X X X X X 10 9
Indio X X X X X X X X X 10 9
Coachella X X X X X X X X 10 8
County of Riverside X X X X X X X X X 10 9
X - ATTENDED (Primary/Alternate)
DARK –
Board Member Matrix Attendance
Page 83 of 400
ITEM 9J
SunLine Services Group
CONSENT CALENDAR
DATE: June 22, 2022 RECEIVE & FILE
TO: Taxi Committee Board of Directors
RE: Checks $1,000 and Over Report for April 2022
Summary:
This report lists all of the checks processed at the Agency with a value of over $1,000 for a given month.
Recommendation:
Receive and file.
Page 84 of 400

SunLine Regulatory Administration Checks $1,000 and Over
April 2022
Vendor Filed As Name Description Check # Payment Date Payment Amount
SUNLINE TRANSIT AGENCY Payroll Liabilities 04/01/2022 91041 04/13/2022 5,218.28
SUNLINE TRANSIT AGENCY Payroll Liabilities 04/15/2022 91044 04/20/2022 5,218.28
BURKE, WILLIAMS & SORENSEN, LLP Legal Services 91046 04/28/2022 4,287.50
SUNLINE TRANSIT AGENCY Overhead Allocations Apr 2022 91039 04/07/2022 2,461.67
ROBERT HALF Temporary Help 91050 04/28/2022 1,888.95
ROBERT HALF Temporary Help 91040 04/13/2022 1,359.20
ROBERT HALF Temporary Help 91038 04/07/2022 1,078.87
NELSON/NYGAARD CONSULTING ASSOCIATES, INC.
Legal Services 91048 04/28/2022 1,020.00
Total Checks Over $1,000 $22,532.75
Total Checks Under $1,000 $2,609.06
Total Checks $25,141.81
Page 85 of 400

ITEM 9K
SunLine Services Group
CONSENT CALENDAR
DATE: June 22, 2022 RECEIVE & FILE
TO: Taxi Committee Board of Directors
RE: Monthly Budget Variance Report for April 2022
Summary:
The budget variance report compares revenues and expenses to the respective line item budgets. The report identifies current monthly revenues and expenses as well as fiscal year to date (FYTD) values. The budgetary figures are represented as a straight line budget. Accordingly, the current monthly budget values are calculated by taking 1/12th of the annual budget. The FYTD budget values for the month of April 2022 are equal to 10/12ths of the yearly budget.
Year to Date Summary
As of April 30, 2022, the organization’s revenues are $26,899 or 18.43% above the FYTD budget.
As of April 30, 2022, expenditures are $27,886 or 19.10% below the FYTD budget.
The net FYTD operating gain (loss) after expenses is $54,784.
Recommendation:
Receive and file.
Page 86 of 400
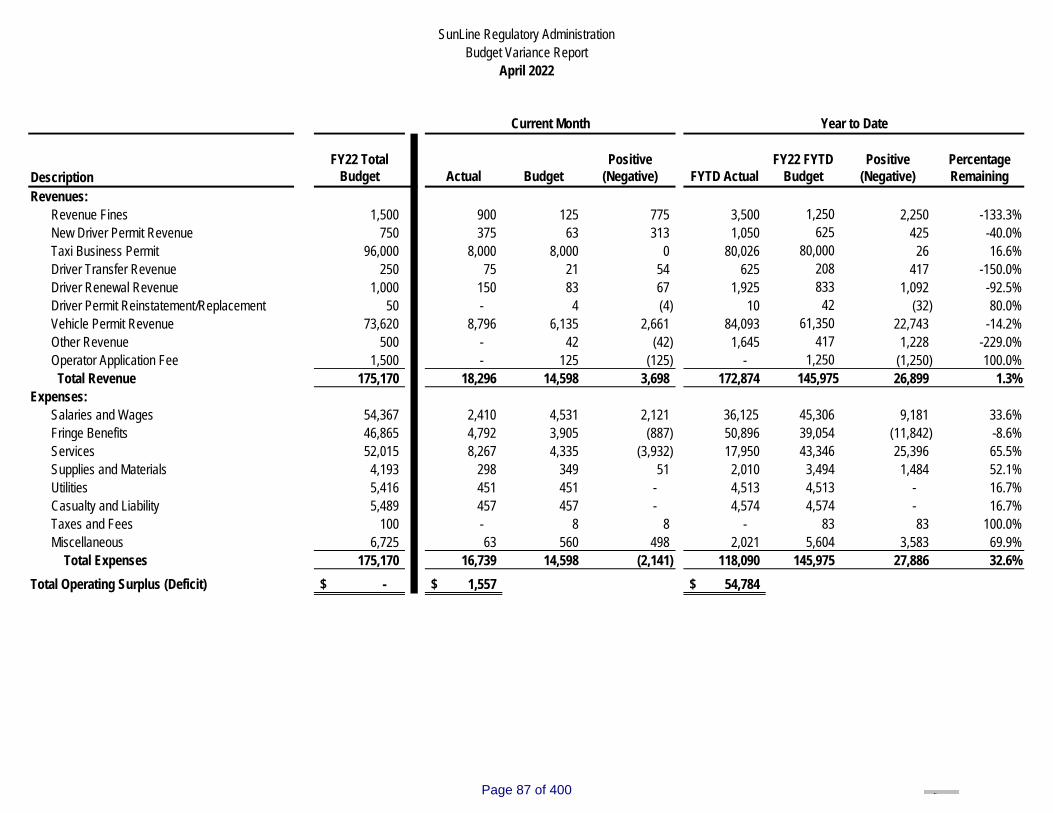
FY22 Total Budget Actual Budget
Positive (Negative) FYTD Actual
FY22 FYTD Budget
Positive (Negative)
Percentage Remaining
Revenues:Revenue Fines 1,500 900 125 775 3,500 1,250 2,250 -133.3%New Driver Permit Revenue 750 375 63 313 1,050 625 425 -40.0%Taxi Business Permit 96,000 8,000 8,000 0 80,026 80,000 26 16.6%Driver Transfer Revenue 250 75 21 54 625 208 417 -150.0%Driver Renewal Revenue 1,000 150 83 67 1,925 833 1,092 -92.5%Driver Permit Reinstatement/Replacement 50 - 4 (4) 10 42 (32) 80.0%Vehicle Permit Revenue 73,620 8,796 6,135 2,661 84,093 61,350 22,743 -14.2%Other Revenue 500 - 42 (42) 1,645 417 1,228 -229.0%Operator Application Fee 1,500 - 125 (125) - 1,250 (1,250) 100.0% Total Revenue 175,170 18,296 14,598 3,698 172,874 145,975 26,899 1.3%
Expenses:Salaries and Wages 54,367 2,410 4,531 2,121 36,125 45,306 9,181 33.6%Fringe Benefits 46,865 4,792 3,905 (887) 50,896 39,054 (11,842) -8.6%Services 52,015 8,267 4,335 (3,932) 17,950 43,346 25,396 65.5%Supplies and Materials 4,193 298 349 51 2,010 3,494 1,484 52.1%Utilities 5,416 451 451 - 4,513 4,513 - 16.7%Casualty and Liability 5,489 457 457 - 4,574 4,574 - 16.7%Taxes and Fees 100 - 8 8 - 83 83 100.0%Miscellaneous 6,725 63 560 498 2,021 5,604 3,583 69.9% Total Expenses 175,170 16,739 14,598 (2,141) 118,090 145,975 27,886 32.6%
Total Operating Surplus (Deficit) -$ 1,557$ 54,784$
SunLine Regulatory AdministrationBudget Variance Report
April 2022
Current Month Year to Date
Description
Page 87 of 400
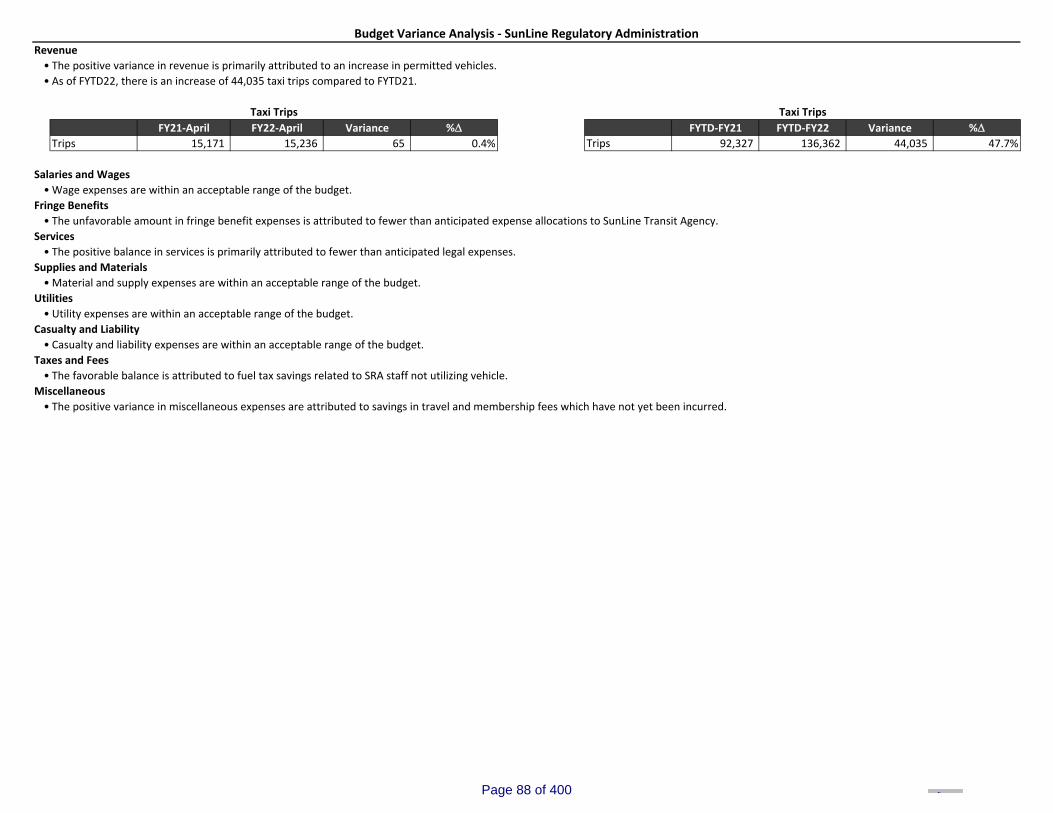
Revenue• The positive variance in revenue is primarily attributed to an increase in permitted vehicles. • As of FYTD22, there is an increase of 44,035 taxi trips compared to FYTD21.
FY21‐April FY22‐April Variance % FYTD‐FY21 FYTD‐FY22 Variance %Trips 15,171 15,236 65 0.4% Trips 92,327 136,362 44,035 47.7%
Salaries and Wages•Wage expenses are within an acceptable range of the budget.
Fringe Benefits• The unfavorable amount in fringe benefit expenses is attributed to fewer than anticipated expense allocations to SunLine Transit Agency.
Services• The positive balance in services is primarily attributed to fewer than anticipated legal expenses.
Supplies and Materials •Material and supply expenses are within an acceptable range of the budget.
Utilities• Utility expenses are within an acceptable range of the budget.
Casualty and Liability• Casualty and liability expenses are within an acceptable range of the budget.
Taxes and Fees• The favorable balance is attributed to fuel tax savings related to SRA staff not utilizing vehicle.
Miscellaneous• The positive variance in miscellaneous expenses are attributed to savings in travel and membership fees which have not yet been incurred.
Budget Variance Analysis ‐ SunLine Regulatory Administration
Taxi Trips Taxi Trips
Page 88 of 400
ITEM 9L
SunLine Services Group
CONSENT CALENDAR
DATE: June 22, 2022 RECEIVE & FILE
TO: Taxi Committee Board of Directors
RE: Taxi Trip Data – May 2022
Summary:
The attached charts summarize the total number of taxi trips generated in the Coachella Valley for the previous three (3) month period and total taxi trips for the current fiscal year to date (FYTD) compared to the last two (2) fiscal years. There were 729 fewer taxi trips in May 2022 serviced by 13 more cabs compared to May 2021 (65 cabs in 2022 compared to 52 cabs in 2021). The decrease in trips for May 2022 is mainly attributed to a decrease in demand associated with seasonal fluctuations. There were 33,306 more taxi trips for FYTD22 compared to FYTD21.
Recommendation:
Receive and file.
Page 89 of 400
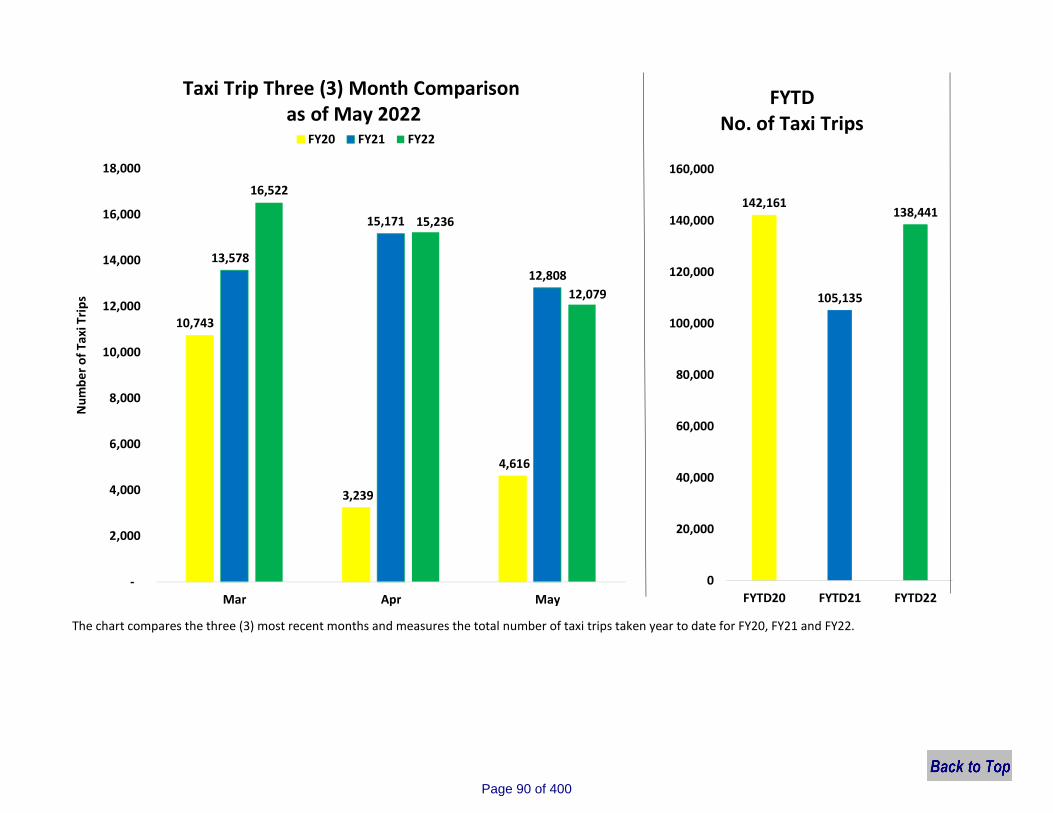
The chart compares the three (3) most recent months and measures the total number of taxi trips taken year to date for FY20, FY21 and FY22.
10,743
3,239
4,616
13,578
15,171
12,808
16,522
15,236
12,079
-
2,000
4,000
6,000
8,000
10,000
12,000
14,000
16,000
18,000
Mar Apr May
FY20 FY21 FY22
142,161
105,135
138,441
0
20,000
40,000
60,000
80,000
100,000
120,000
140,000
160,000
FYTD20 FYTD21 FYTD22
FYTDNo. of Taxi Trips
Num
ber o
f Tax
i Trip
s Taxi Trip Three (3) Month Comparison
as of May 2022
Page 90 of 400
ITEM 9M
SunLine Transit Agency SunLine Services Group
CONSENT CALENDAR
DATE: June 22, 2022 ACTION
TO: Board of Directors
FROM: Eric Vail, General Counsel Lauren Skiver, CEO/General Manager
RE: Adoption of Resolution to Continue Teleconference Meetings
Recommendation:
Recommend that the Board of Directors reconsider the circumstances of the COVID-19 state of emergency, and either adopt a resolution finding that the state of emergency continues to directly impact the ability of the Board to meet safely in person or direct that Board meetings return to in person.
Background:
At the March 25, 2020 Board of Directors meeting, in response to the COVID-19 health emergency that federal, state and local governments are all addressing, SunLine Transit Agency and SunLine Services Group proclaimed an emergency situation as outlined in Resolution No. 0775. Over the last two (2) years, the Board has continuously evaluated the resolution and made decisions regarding the need to extend the declaration.
SunLine’s Board and Committee meetings have been conducted pursuant to the Governor’s Executive Orders N-29-20 and N-08-21 suspending certain provisions of the Brown Act and permitting the use of teleconferencing for members of the body and the public. Those Executive Orders expired on September 30, 2021. In their place, the Governor signed AB 361, which went into effect on October 1, 2021. AB 361 amended the Brown Act to permit members of a legislative body to teleconference into a meeting during a state of emergency proclaimed by the Governor. Teleconferencing by members of the body under AB 361 can be done without having to comply with the requirement that the agenda list the location where members will be teleconferencing from, posting an agenda at that location, and allowing members of the public to attend the meeting from the teleconference location.
To teleconference under AB 361, the legislative body must make findings that either:
Page 91 of 400
ITEM 9M
a) State or local officials are imposing or recommending measures to promote social distancing, or b) “As a result of the emergency, meeting in person would present imminent risks to the health or safety of attendees.”
If a teleconference meeting is held under AB 361, the body must reconsider the circumstances every 30 days and make new findings to support the need to continue to teleconference under AB 361.
The Board adopted Resolution No. 0787 authorizing Board and Committee meetings to be held via teleconference under AB 361 at its October 27, 2021 meeting. AB 361 requires the Board to reconsider the circumstances of the state of emergency every 30 days and determine that either i) The state of emergency continues to directly impact the ability of the members to meet safely in person; or (ii) State or local officials continue to impose or recommend measures to promote social distancing. The Board has reconsidered the circumstances of the state of emergency at each Board meeting since then and adopted resolutions authorizing the continued use of teleconferencing to conduct meetings.
Financial Impact:
As SunLine is already implementing teleconferencing for Board and Committee meetings, there is no anticipated additional cost associated with continuing to teleconference.
Attachment:
• Item 9Ma – Resolution No. 0796
Page 92 of 400
ITEM 9M ATTACHMENT A
RESOLUTION NO. 0796
A JOINT RESOLUTION OF THE BOARD OF DIRECTORS OF SUNLINE TRANSIT AGENCY AND SUNLINE SERVICES GROUP AUTHORIZING THE BOARD OF DIRECTORS AND ITS COMMITTEES TO CONTINUE TO IMPLEMENT TELECONFERENCING FOR CONDUCTING PUBLIC MEETINGS PURSUANT TO AB 361
WHEREAS, on March 4, 2020, the Governor of California proclaimed a State of Emergency to exist in California as a result of the threat of novel coronavirus disease 2019 (COVID-19); and
WHEREAS, on March 12, 2020, the Governor of California executed Executive Order N-25-20 which suspended and modified specified provisions in the Ralph M. Brown Act (Government Code Section § 54950 et seq.) and authorized local legislative bodies to hold public meetings via teleconferencing and to make public meeting accessible telephonically or otherwise electronically to all members of the public seeking to observe and address the local legislative body; and
WHEREAS, on March 17, 2020, the Governor of California executed Executive Order N-29-20 which superseded and replaced the provisions of Executive Order N-25-20 related to the Brown Act and teleconferencing; and
WHEREAS, on June 11, 2021, the Governor of California executed Executive Order N-08-21 which extended the provisions of Executive Order N-29-20 concerning teleconference accommodations for public meetings through September 30, 2021; and
WHEREAS, on September 16, 2021, the Governor of California signed into law Assembly Bill 361 amending Government Code § 54953 and permitting members of a legislative body to teleconference into a meeting without having to comply with the requirements of subdivision (b)(3) Government Code § 54953 during a proclaimed state of emergency if a) State or local officials are imposing or recommending measures to promote social distancing, or b) the body finds that “as a result of the emergency, meeting in person would present imminent risks to the health or safety of attendees;” and
WHEREAS, AB 361 imposes requirements to ensure members of the public are able to attend and participate in public meetings of a legislative body conducted via teleconference, including:
Notice of the means by which members of the public may access the meeting and offer public comment, including an opportunity for all persons to attend via a call-in option or an internet-based service option;
The legislative body shall take no further action on agenda items when there is a disruption which prevents the public agency from broadcasting the meeting, or in the event of a disruption within the local agency’s control which prevents members of the public from offering public comments, until public access is restored;
Prohibits the legislative body from requiring public comments to be submitted in advance of the meeting and specifies that the legislative body must provide an opportunity for members of the public to address the legislative body and offer comments in real time;
Page 93 of 400
Prohibits the legislative body from closing the public comment period until the public comment period has elapsed or until a reasonable amount of time has elapsed; and
WHEREAS, the Board of Directors adopted Resolution No. 0787 at its October 27, 2021 meeting making the findings required by AB 361 and authorizing Board of Director and Committee meetings to be held via teleconference; and
WHEREAS, pursuant to Government Code § 54953(e)(3), a legislative body that holds a meeting via teleconference pursuant to AB 361 must reconsider the circumstances of the state of emergency and make findings every 30 days to continue to meet via teleconference.
THEREFORE, BE IT RESOLVED by the Board of Directors of SunLine Transit Agency and SunLine Services Group, as follows (collectively “Board of Directors”):
SECTION 1. The Board of Directors hereby declares that the recitals set forth above are true and correct, and incorporated into this resolution as findings of the Board of Directors.
SECTION 2. The SunLine Transit Agency continues to follow safety measures in response to COVID-19 as ordered or recommended by the Centers for Disease Control and Prevention (CDC), California Department of Public Health (CDPH), and/or County of Riverside, as applicable. Based upon that guidance, in person attendance indoors at public meetings continues to present an imminent risk to the health and safety of attendees and those attendees have close contact with after attending a meeting in person. The Board of Directors desire to ensure that all persons desiring to attend public meetings may do so in a manner that protects the health and safety of the attendees, their families and other close contacts. While COVID-19 cases have dropped significantly since teleconferencing was implemented in October 2021 during the omicron surge, cases have been on the rise since the post-surge low in March 2022 of approximately 5 cases per 100,000 in population. As of May 29, 2022 (the most recent data available as of the drafting of this resolution) the statewide case rate was 34.7 cases per 100,000 in population. Furthermore, there are still members of the community to whom COVID-19 presents significant health risks, including the immunocompromised, the elderly, and those with underlying medical concerns. Teleconferencing will provide increased meaningful participation options for both members of the legislative body and members of the public in a manner that protects the health and safety of the attendees, their families and other close contacts.
SECTION 3. The Board of Directors hereby declare that, pursuant to the findings in Sections 1 and 2, the Board of Directors has reconsidered the circumstances of the state of emergency determined that it continues to directly impact the ability of the members to meet safely in person. The Board of Directors hereby authorizes the Board and its Committees to continue to meet via teleconference under AB 361 through December 2022, subject to the requirement that the required findings be made every 30 days.
SECTION 4. If any section, subsection, subdivision, sentence, clause, phrase, or portion of this Resolution is, for any reason, held to be invalid or unconstitutional by the decision of any court of competent jurisdiction, such decision shall not affect the validity of the remaining portions of this Resolution. The Board of Directors hereby declares that it would have adopted this Resolution and each and every section, subsection, subdivision, sentence, clause, phrase, or portion thereof, irrespective of the fact that any one or more sections, subsections, subdivisions, sentences, clauses, phrases, or portions thereof be declared unconstitutional.
SECTION 5. This Resolution shall become effective immediately upon adoption.
Page 94 of 400
PASSED, APPROVED AND ADOPTED, at a meeting of the Board of Directors of SunLine Transit Agency and SunLine Services Group on this 22nd day of June, 2022.
Glenn Miller Chairperson of the Board
ATTEST:
Edith Hernandez Clerk of the Board
APPROVED AS TO FORM:
Eric S. Vail General Counsel
Page 95 of 400
STATE OF CALIFORNIA ) COUNTY OF RIVERSIDE ) ss. SUNLINE TRANSIT AGENCY )
I, Edith Hernandez, Clerk of the Board of SunLine Transit Agency and SunLine Services Group, hereby certify that Resolution No ______ was adopted by the Board of Directors of the SunLine Transit Agency and SunLine Services Group at a regular meeting held on the 22nd day of June, 2022, and that the same was adopted by the following vote:
AYES: NOES: ABSTAIN: ABSENT:
________________________________ EDITH HERNANDEZ CLERK OF THE BOARD
Page 96 of 400
ITEM 10
SunLine Transit Agency
DATE: June 22, 2022 ACTION
TO: Finance/Audit Committee Board of Directors
FROM: Luis Garcia, Controller/Assistant Chief Financial Officer
RE: Adoption of the FY23 Operating and Capital Budget
Recommendation
Recommend that the Board of Directors adopt the proposed FY23 operating and capital budgets.
Background
SunLine’s Budget Policy No. B-020704 requires that the budget be submitted to the Finance/Audit Committee for discussion. Upon the recommendation of the Finance/Audit Committee, the budget is then presented to the Board of Directors for approval and adoption. A draft budget was presented to the Finance/Audit Committee and Board of Directors on May 25, 2022. During the May meetings, staff answered questions and provided the opportunity for additional special meetings.
There have been no changes to the proposed draft budget presented at the May meeting. The proposed operating and capital budgets for the Fiscal Year 2023 are $46,085,647 and $25,477,005, respectively. The proposed operating budget for FY23 represents a sustainable 12.4% increase over the FY22 budget or 7.94% increase after recognition of $1,824,582 in funded projects. The proposed FY23 budget includes cost increases to improve service and account for industry-wide challenges such as recruitment and retention of employees, ridership recovery, and inflation.
Staff believes that this budget reflects a concentrated effort of fiscal responsibility while continuing the operating and capital requirements necessary to move the Agency forward. Additionally, the budgets would allow the agency to meet its mission of providing safe and environmentally conscious public transportation services to the residents of the Coachella Valley.
Financial Impact
Multiple sources of revenues and subsidies have been identified to cover the expenses reflected in this year’s operating and capital budgets.
Page 97 of 400
ITEM 10
Attachment:
• Item 10a – FY23 Budget Book
Page 98 of 400
Page 99 of 400
ccubero
Text Box
ITEM 10 ATTACHMENT A
TABLE OF CONTENTS
EXECUTIVE SUMMARY ...................................................................................................... 1 ‐ 13
EXECUTIVE OFFICE .......................................................................................................... 14 ‐ 22
Marketing ............................................................................................................ 16 ‐ 18
Executive ............................................................................................................. 19 ‐ 22
HUMAN RESOURCES OFFICE ........................................................................................... 23 ‐ 28
PERFORMANCE MANAGEMENT OFFICE ......................................................................... 29 ‐ 38
SunFuels .............................................................................................................. 31 ‐ 35
Performance ........................................................................................................ 36 ‐ 38
SAFETY AND SECURITY OFFICE ......................................................................................... 39 ‐ 49
Safety and Security .............................................................................................. 41 ‐ 45
Information Technology .................................................................................... 46 ‐ 49
FINANCE OFFICE .............................................................................................................. 50 ‐ 56
TRANSPORTATION OFFICE ............................................................................................... 57‐ 67
Transportation ..................................................................................................... 59 ‐ 63
Customer Service ................................................................................................. 64 ‐ 65
Planning .............................................................................................................. 66 ‐ 67
MAINTENANCE OFFICE .................................................................................................... 68 ‐ 87
Fleet Maintenance .............................................................................................. 70 ‐ 78
Facility Maintenance .......................................................................................... 79 ‐ 85
Stops & Zones ..................................................................................................... 86 ‐ 87
CAPITAL BUDGET ............................................................................................................. 88 ‐ 99
Page 100 of 400
MEMBERS: Desert Hot Springs Palm Springs Cathedral City Rancho Mirage Palm Desert Indian Wells La Quinta Indio Coachella Riverside County
A Public Agency
32-505 Harry Oliver Trail, Thousand Palms, California 92276 Phone 760 -343-3456 Fax 760-343-3845 www.sunline.org
June 22, 2022
Dear SunLine Board of Directors,
In Fiscal Year 2022, SunLine Transit Agency remained dedicated to making a difference in the Coachella Valley
community and the transit industry. Our SunLine Refueled initiative continued to roll out new services and the
Agency successfully launched the 10 Commuter Link regional route, providing access from the eastern Coachella
Valley to San Bernardino in partnership with the California State University, San Bernardino. We grew our
microtransit service, SunRide, by offering an enhanced app user experience and expanding upon the pilot zones.
As a result, systemwide ridership increased by 7.2% as of fiscal year-to-date compared to the same period last
year.
While navigating the ongoing pandemic, our team planned community outreach programs to the fullest extent
possible, and was able to bring back our Pack the Bus Backpack and School Supplies Drive and Fill the Bus
Holiday Food Drive in 2021. SunLine was also recognized with top honors from the Caltrans Excellence in
Transportation Awards and Urban Transportation System of the Year Award from the Community Transit
Agency Association. We were very proud to have been selected for our accomplishments, which was a collective
effort of all SunLine team members.
In addition, SunLine reached many milestones in other areas during the fiscal year. The new Operations Facility
completed construction and all staff were moved from trailers more than three (3) decades old into the new state-
of-the art building. The Agency led a successful demonstration of a mobile hydrogen fueling system at our Indio
division for the first time in SunLine's history. The Agency also received a $8.4M grant from the Federal Transit
Administration's Bus and Bus Facilities program for four (4) fuel cell electric buses and the rehabilitation of 10
CNG buses.
The proposed operating and capital budgets for Fiscal Year 2023 are $46,085,646 and $25,477,005, respectively.
In the operating budget, $1,824,582 is attributed to grant funded projects. The net increase of 7.94% in the
operating budget is less the grant-funded services. The majority of the costs associated with the increase can be
attributed to wages and benefits related to recruitment and retention. The Fiscal Year 2023 operating and capital
budgets were derived through a collaborative effort among staff with a unified goal of good organizational
management, growth, and development.
As a national leader, SunLine continues to make every effort to improve the customer experience and integration
of innovative alternative fuel technologies for Coachella Valley residents and visitors. We are pleased to present
to you the details for the Fiscal Year 2023 budget outlined in the following document.
Sincerely,
Lauren Skiver
CEO/General Manager
Page 101 of 400
SUNLINE TRANSIT AGENCY THOUSAND PALMS, CA
____________________________________________________
ANNUAL BUDGET FISCAL YEAR 2023
____________________________________________________
BOARD OF DIRECTORS
Indio: Glenn Miller, Chair Palm Springs: Lisa Middleton, Vice Chair Cathedral City: Nancy Ross Coachella: Denise Delgado Desert Hot Springs: Russell Betts Indian Wells: Dana Reed La Quinta: Robert Radi Palm Desert: Kathleen Kelly Rancho Mirage: Charles Townsend Riverside County: V. Manuel Perez
CHIEF EXECUTIVE OFFICER/GENERAL MANAGER Lauren Skiver
Page 102 of 400
EXECUTIVE SUMMARY
In 2022, SunLine completed one (1) full year of its Refueled initiative. The plan focused on key ridership drivers such as minimizing transfers, reducing travel times, providing SunRide as a microtransit solution, and realigning routes to growing, more productive areas. SunLine plans on resuming normal level one (1) service in FY23 along with new services such as the Route 1X and expanded zones for microtransit. The move to full service will be primarily dependent on acquiring and training the necessary operators.
SERVICE & RIDERSHIP
SunLine has experienced an increase in ridership for FY22. SunLine anticipates that ridership will continue to grow with the implementation of full service. Ridership has experienced slow growth nationwide and SunLine has experienced similar issues.
REVENUES & SUBSIDIES
Traditionally, SunLine is required to meet a performance standard known as a farebox recovery ratio in order to avoid funding issues with state funding. However, due to COVID‐19, the farebox recovery ratio requirement has not been enforced due to the decrease in ridership and revenues. Nevertheless, SunLine’s budget is still compliant with the farebox requirement.
The proposed revenues for FY23 consist of a mix of passenger fares, federal, state, local funding and other revenues, with the main assumptions being as follows:
The utilization of Local Transportation Funding (LTF) has an increased for FY23 dueto the fact that SunLine has expended the vast majority of emergency federalfunding.
Measure A funding increased for FY23 over the last fiscal year due to increasedallocations from the Riverside County Transportation Commission (RCTC) whichare based on projected tax revenues. RCTC’s original conservative estimates forMeasure A and LTF were revised at the January 2022 commission meeting. TheCOVID‐19 pandemic had a large impact to initial projected tax revenues buteconomic stimuli throughout 2020 and early 2021 alleviated a large negativeimpact on sales tax.
In FY23, SunLine will use various forms of federal funding including FTA Section5307, CARES, ARPA, 5311, and Congestion Mitigation and Air Quality Improvement(CMAQ) Program.
Following a significant downturn in ridership in March 2020 related to the COVID‐19 pandemic, SunLine significantly reduced its passenger fare revenue projections
Page 103 of 400
for FY21. The Agency has experienced an increase in revenue which aligns with projected ridership increases.
In August 2018, SunLine launched its Haul Pass Program to improve student access to Coachella Valley’s colleges and university. Both the College of the Desert (COD) and the California State University, San Bernardino (CSUSB) Palm Desert Campus are partners. COD and CSUSB underwrite the cost of the passes for their students. In FY22, Sunline expanded the program to include high school students. The Haul Pass program for high school students is funded through a grant from the Low Carbon Transit Operations Program (LCTOP).
Page 104 of 400

CAPITAL PROJECTS
The capital budget incorporates key projects to help further advance the Agency’s Capital Improvement Program (CIP). The CIP for FY23 focuses on the riders, employee equipment and facilities and continuing SunLine’s investment in alternative fuel technology for vehicles and infrastructures.
New Projects
There are 12 new capital projects programmed in FY23. The FY23 capital budget reflects over $13.2 million in competitive funds that the Agency was awarded. The new projects represent an emphasis on innovation while aligning with the Agency’s Board approved Innovative Clean Transit (ICT) plan. The requests in FY23 will be in addition to the existing CIP. The new projects cover necessities in fleet and facilities. They support replacement and rehabilitation of existing assets as well as continue the advancement of alternative fuel technology:
Fleet: o Over the Road Hydrogen Fuel Cell Coach o CNG Bus Rehab (10) and Hydrogen Bus (4) Purchase
Facilities, IT and Equipment:
o Indio CNG Station Phase II o Facility Improvement Projects o Liquid Hydrogen Trailer Project o Microgrid to Hydrogen Phase IV o IT Projects o Bus Stops and Amenities o Real Time Surveillance System o Radio Replacement Phase II & Upgrade to ITS o Maintenance Equipment o Software Expansion
Page 105 of 400
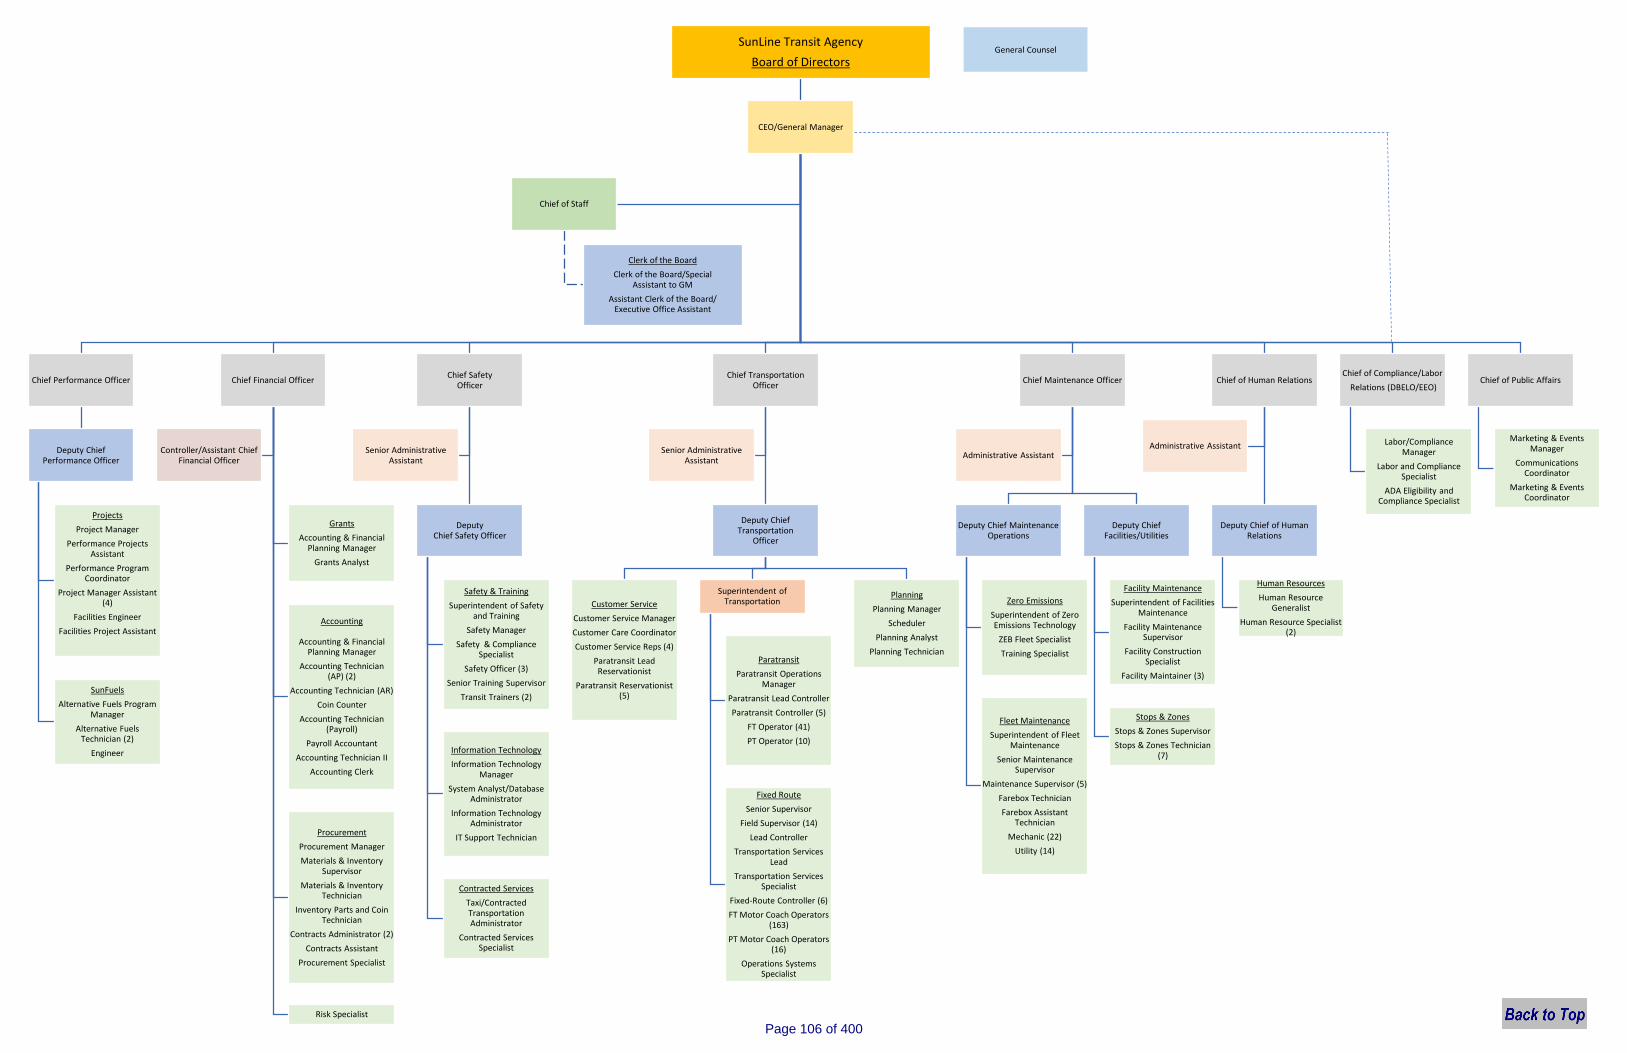
SunLine Transit Agency
Board of Directors
CEO/General Manager
Chief Performance Officer
Deputy Chief Performance Officer
Projects
Project Manager
Performance Projects Assistant
Performance Program Coordinator
Project Manager Assistant (4)
Facilities Engineer
Facilities Project Assistant
SunFuels
Alternative Fuels Program Manager
Alternative Fuels Technician (2)
Engineer
Chief Financial Officer
Grants
Accounting & Financial Planning Manager
Grants Analyst
Accounting
Accounting & Financial Planning Manager
Accounting Technician (AP) (2)
Accounting Technician (AR)
Coin Counter
Accounting Technician (Payroll)
Payroll Accountant
Accounting Technician II
Accounting Clerk
Procurement
Procurement Manager
Materials & Inventory Supervisor
Materials & Inventory Technician
Inventory Parts and Coin Technician
Contracts Administrator (2)
Contracts Assistant
Procurement Specialist
Risk Specialist
Controller/Assistant Chief Financial Officer
Chief Safety Officer
Deputy Chief Safety Officer
Safety & Training
Superintendent of Safety and Training
Safety Manager
Safety & Compliance Specialist
Safety Officer (3)
Senior Training Supervisor
Transit Trainers (2)
Information Technology
Information Technology Manager
System Analyst/Database Administrator
Information Technology Administrator
IT Support Technician
Contracted Services
Taxi/Contracted Transportation Administrator
Contracted Services Specialist
Senior Administrative Assistant
Chief Transportation Officer
Deputy Chief Transportation
Officer
Customer Service
Customer Service Manager
Customer Care Coordinator
Customer Service Reps (4)
Paratransit Lead Reservationist
Paratransit Reservationist (5)
Superintendent of Transportation
Paratransit
Paratransit Operations Manager
Paratransit Lead Controller
Paratransit Controller (5)
FT Operator (41)
PT Operator (10)
Fixed Route
Senior Supervisor
Field Supervisor (14)
Lead Controller
Transportation Services Lead
Transportation Services Specialist
Fixed-Route Controller (6)
FT Motor Coach Operators (163)
PT Motor Coach Operators (16)
Operations Systems Specialist
Planning
Planning Manager
Scheduler
Planning Analyst
Planning Technician
Senior Administrative Assistant
Chief Maintenance Officer
Deputy Chief Maintenance Operations
Zero Emissions
Superintendent of Zero Emissions Technology
ZEB Fleet Specialist
Training Specialist
Fleet Maintenance
Superintendent of Fleet Maintenance
Senior Maintenance Supervisor
Maintenance Supervisor (5)
Farebox Technician
Farebox Assistant Technician
Mechanic (22)
Utility (14)
Deputy Chief Facilities/Utilities
Facility Maintenance
Superintendent of Facilities Maintenance
Facility Maintenance Supervisor
Facility Construction Specialist
Facility Maintainer (3)
Stops & Zones
Stops & Zones Supervisor
Stops & Zones Technician (7)
Administrative Assistant
Chief of Human Relations
Deputy Chief of Human Relations
Human Resources
Human Resource Generalist
Human Resource Specialist (2)
Administrative Assistant
Chief of Compliance/Labor
Relations (DBELO/EEO)
Labor/Compliance Manager
Labor and Compliance Specialist
ADA Eligibility and Compliance Specialist
Chief of Public Affairs
Marketing & Events Manager
Communications Coordinator
Marketing & Events Coordinator
Chief of Staff
Clerk of the Board
Clerk of the Board/Special Assistant to GM
Assistant Clerk of the Board/Executive Office Assistant
General Counsel
Page 106 of 400
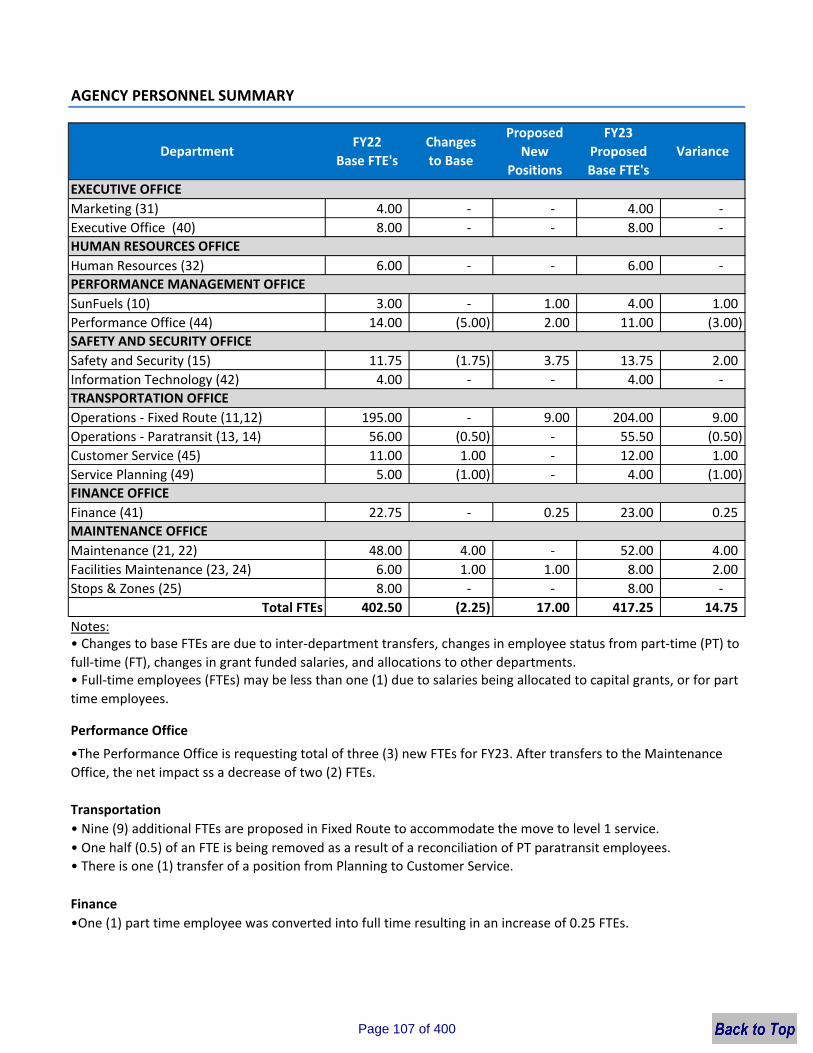
Marketing (31) 4.00 ‐ ‐ 4.00 ‐ Executive Office (40) 8.00 ‐ ‐ 8.00 ‐
Human Resources (32) 6.00 ‐ ‐ 6.00 ‐
SunFuels (10) 3.00 ‐ 1.00 4.00 1.00 Performance Office (44) 14.00 (5.00) 2.00 11.00 (3.00)
Safety and Security (15) 11.75 (1.75) 3.75 13.75 2.00 Information Technology (42) 4.00 ‐ ‐ 4.00 ‐
Operations ‐ Fixed Route (11,12) 195.00 ‐ 9.00 204.00 9.00 Operations ‐ Paratransit (13, 14) 56.00 (0.50) ‐ 55.50 (0.50) Customer Service (45) 11.00 1.00 ‐ 12.00 1.00 Service Planning (49) 5.00 (1.00) ‐ 4.00 (1.00)
Finance (41) 22.75 ‐ 0.25 23.00 0.25
Maintenance (21, 22) 48.00 4.00 ‐ 52.00 4.00 Facilities Maintenance (23, 24) 6.00 1.00 1.00 8.00 2.00 Stops & Zones (25) 8.00 ‐ ‐ 8.00 ‐
Total FTEs 402.50 (2.25) 17.00 417.25 14.75 Notes:
Performance Office
Transportation
Finance
AGENCY PERSONNEL SUMMARY
Department
• Changes to base FTEs are due to inter‐department transfers, changes in employee status from part‐time (PT) tofull‐time (FT), changes in grant funded salaries, and allocations to other departments.
VarianceProposed
New Positions
EXECUTIVE OFFICE
PERFORMANCE MANAGEMENT OFFICE
Changes to Base
FY23 Proposed Base FTE's
FY22Base FTE's
HUMAN RESOURCES OFFICE
SAFETY AND SECURITY OFFICE
TRANSPORTATION OFFICE
FINANCE OFFICE
MAINTENANCE OFFICE
• Full‐time employees (FTEs) may be less than one (1) due to salaries being allocated to capital grants, or for parttime employees.
• Nine (9) additional FTEs are proposed in Fixed Route to accommodate the move to level 1 service.
•The Performance Office is requesting total of three (3) new FTEs for FY23. After transfers to the MaintenanceOffice, the net impact ss a decrease of two (2) FTEs.
• One half (0.5) of an FTE is being removed as a result of a reconciliation of PT paratransit employees.• There is one (1) transfer of a position from Planning to Customer Service.
•One (1) part time employee was converted into full time resulting in an increase of 0.25 FTEs.
Page 107 of 400
AGENCY PERSONNEL SUMMARY
Maintenance Office
Safety and Security
• Five (5) FTEs were transferred from the Performance Office into the Maintenance Office.• One (1) FTE is being added to assist with the maintaining of the Agency's facilities.
• Two (2) FTEs are being added in Safety to facilitate the training of new operators and manage the growingservices such as microtransit.
Page 108 of 400
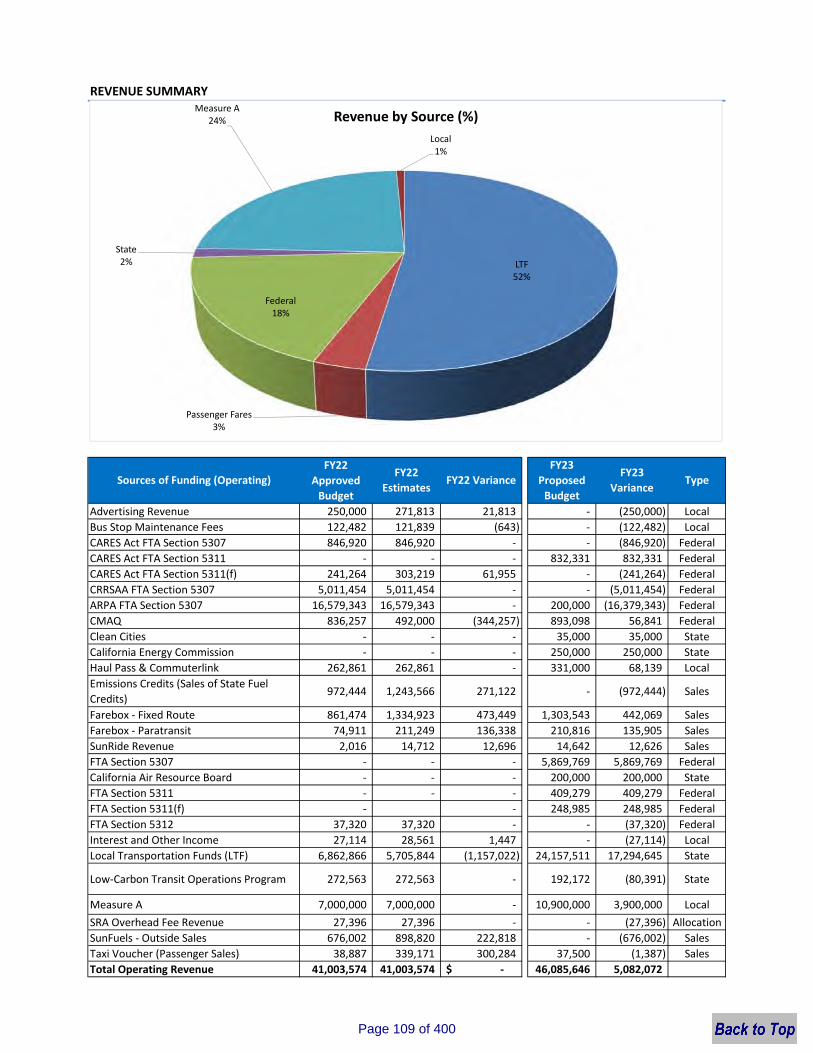
REVENUE SUMMARY
Advertising Revenue 250,000 271,813 21,813 ‐ (250,000) LocalBus Stop Maintenance Fees 122,482 121,839 (643) ‐ (122,482) LocalCARES Act FTA Section 5307 846,920 846,920 ‐ ‐ (846,920) FederalCARES Act FTA Section 5311 ‐ ‐ ‐ 832,331 832,331 FederalCARES Act FTA Section 5311(f) 241,264 303,219 61,955 ‐ (241,264) FederalCRRSAA FTA Section 5307 5,011,454 5,011,454 ‐ ‐ (5,011,454) FederalARPA FTA Section 5307 16,579,343 16,579,343 ‐ 200,000 (16,379,343) FederalCMAQ 836,257 492,000 (344,257) 893,098 56,841 FederalClean Cities ‐ ‐ ‐ 35,000 35,000 StateCalifornia Energy Commission ‐ ‐ ‐ 250,000 250,000 StateHaul Pass & Commuterlink 262,861 262,861 ‐ 331,000 68,139 LocalEmissions Credits (Sales of State Fuel Credits)
972,444 1,243,566 271,122 ‐ (972,444) Sales
Farebox ‐ Fixed Route 861,474 1,334,923 473,449 1,303,543 442,069 SalesFarebox ‐ Paratransit 74,911 211,249 136,338 210,816 135,905 SalesSunRide Revenue 2,016 14,712 12,696 14,642 12,626 SalesFTA Section 5307 ‐ ‐ ‐ 5,869,769 5,869,769 FederalCalifornia Air Resource Board ‐ ‐ ‐ 200,000 200,000 StateFTA Section 5311 ‐ ‐ ‐ 409,279 409,279 FederalFTA Section 5311(f) ‐ ‐ 248,985 248,985 FederalFTA Section 5312 37,320 37,320 ‐ ‐ (37,320) FederalInterest and Other Income 27,114 28,561 1,447 ‐ (27,114) LocalLocal Transportation Funds (LTF) 6,862,866 5,705,844 (1,157,022) 24,157,511 17,294,645 State
Low‐Carbon Transit Operations Program 272,563 272,563 ‐ 192,172 (80,391) State
Measure A 7,000,000 7,000,000 ‐ 10,900,000 3,900,000 LocalSRA Overhead Fee Revenue 27,396 27,396 ‐ ‐ (27,396) AllocationSunFuels ‐ Outside Sales 676,002 898,820 222,818 ‐ (676,002) SalesTaxi Voucher (Passenger Sales) 38,887 339,171 300,284 37,500 (1,387) SalesTotal Operating Revenue 41,003,574 41,003,574 ‐$ 46,085,646 5,082,072
Sources of Funding (Operating) TypeFY22
Approved Budget
FY23 Proposed Budget
FY22 VarianceFY22
EstimatesFY23
Variance
LTF52%
Passenger Fares3%
Federal18%
State 2%
Measure A24%
Local1%
Revenue by Source (%)
Page 109 of 400
Notes:
• The FY22 variance reflects the difference between FY22 estimates and FY22 approved budget. The FY23 variance indicates thedifference between FY23 proposed budget and FY22 approved budget.
• The majority of the emergency federal funding has been utilized in FY20, FY21 and FY22.
Page 110 of 400
CARES ACT FTA SECTION 5311
FAREBOX
FTA SECTION 5307
CMAQ funds are used to support the SunRide, Route 1X and Vanpool programs.
EMISSIONS CREDITS (SALES OF FUEL CREDITS)
Included within AB 32 is the Low Carbon Fuel Standards (LCFS) program which regulates the carboncontent of transportation fuels through the designation of regulated parties for various types of fuels.CNG is considered a low carbon fuel and is exempt from all LCFS regulation unless the Regulated Partywishes to earn and trade their LCFS credits. Under California Air Resources Board (CARB) regulations,the Agency, as the owner of the CNG fueling stations, can earn LCFS credits for CNG Therm usage.Those credits may then be sold to other entities that have difficulty attaining the legislated standardsfor their carbon cap limits. These entities will be able to purchase carbon credits to offset their carbondeficits.
Farebox revenues are generated from the collection of passenger fares and ticket sales. This revenue is
Section 5307 is a Federal Urbanized Area Formula Fund authorized under MAP 21 legislation whichapportions federal funding on factors such as urbanized area population and ridership.
The California Energy Commission (CEC) and California Air Resources Board (CARB) are two Stateagencies that focus on reducing green house gas emissions. Funding for FY23 will be utilized fortraining and curriculum for the Center of Excellence.
CALIFORNIA ENERGY COMMISSION AND CALIFORNIA AIR RESOURCES BOARD
CONGESTION MITIGATION & AIR QUALITY (CMAQ)
REVENUE & FUNDING SOURCES
In addition to passenger and other revenues, the Agency receives a mix of funding from federal, state, and local funding sources. These are utilized to fund the operation of nine (9) routes, connecting the Coachella Valley from Desert Hot Springs and Palm Springs in the northwest to Mecca, Oasis, and North Shore in the east, one (1) express line on hwy 111 and one (1) regional Commuter route operating between Indio and San Bernardino. The Agency's service includes complementary paratransit service to locations within 3/4 miles of the local fixed route network. An overview of each funding source is outlined below.
HAUL PASSIn August 2018, SunLine launched its Haul Pass Program to improve student access to Coachella Valley’s colleges and university. Both the College of the Desert (COD) and the California State University, San Bernardino (CSUSB) Palm Desert Campus are partners. COD and CSUSB underwrite the cost of the passes for their students. In FY22 SunLine expanded the program to include high school students. The Haul Pass program for high school students is funded through a grant from the Low Carbon Transit Operations Program (LCTOP).
The CARES Act includes provisions for new transit funding to assist transit providers during the COVID‐19 pandemic. Eligible expenses include Projects for preventing, preparing for, and responding to the COVID‐19 disease such as: operating costs to maintain service, lost revenue due to COVID‐19 public health emergency, purchase of personal protective equipment associated with response to the pandemic, administrative leave salaries for operations personnel.
Page 111 of 400
REVENUE & FUNDING SOURCES
FTA SECTION 5311/5311(f)
CLEAN CITIES
LOW‐CARBON TRANSIT OPERATIONS PROGRAM (LCTOP)
MEASURE A
TAXI VOUCHER PROGRAM (Passenger Sales)This revenue is generated from customers purchasing taxi vouchers from SunLine as part of our TaxiVoucher Program. The customer receives a match from SunLine and the FTA for the amount paid ($1for $1). Customers are limited to a programmed limit per month and can reload their cards during aspecific time frame.
LOCAL TRANSPORTATION FUND (LTF)This funding is derived from a 1/4 cent of the general sales tax collected statewide.
LCTOP funding was created from the Transit, Affordable Housing, and Sustainable CommunitiesProgram in 2014. The program provides operating and capital assistance for transit agencies to reducegreenhouse gas emissions and improve mobility with a priority on disadvantaged communities.
Measure A is local funding for specialized transportation projects approved by voters in 1988. Thisfunding is a half‐cent sales tax for Riverside County and was re‐approved by voters in 2002. Thisfunding will continue until 2039.
Section 5311 is a Federal Rural Area Formula Fund authorized under MAP 21 legislation whichapportions federal funding in support of transportation services in rural areas (< 50,000 population).Section 5311(f) is funding allocated for intercity bus operations.
In 2021, SunLine became a member of the Clean Cities Program. Under this Program, SunLine was designated as Clean Cities Coordinator for the Coachella Valley. The Program was formed in 1993 by the U.S. Department of Energy in coordation with the Environmental Protection Agency. SunLine has leveraged its designation as Coordinator to receive funding to support various data tracking and reporting activities related to our existing use, and production of alternative fuels.
Page 112 of 400

EXPENSE SUMMARY
$‐
$2,000,000
$4,000,000
$6,000,000
$8,000,000
$10,000,000
$12,000,000
$14,000,000
Page 113 of 400
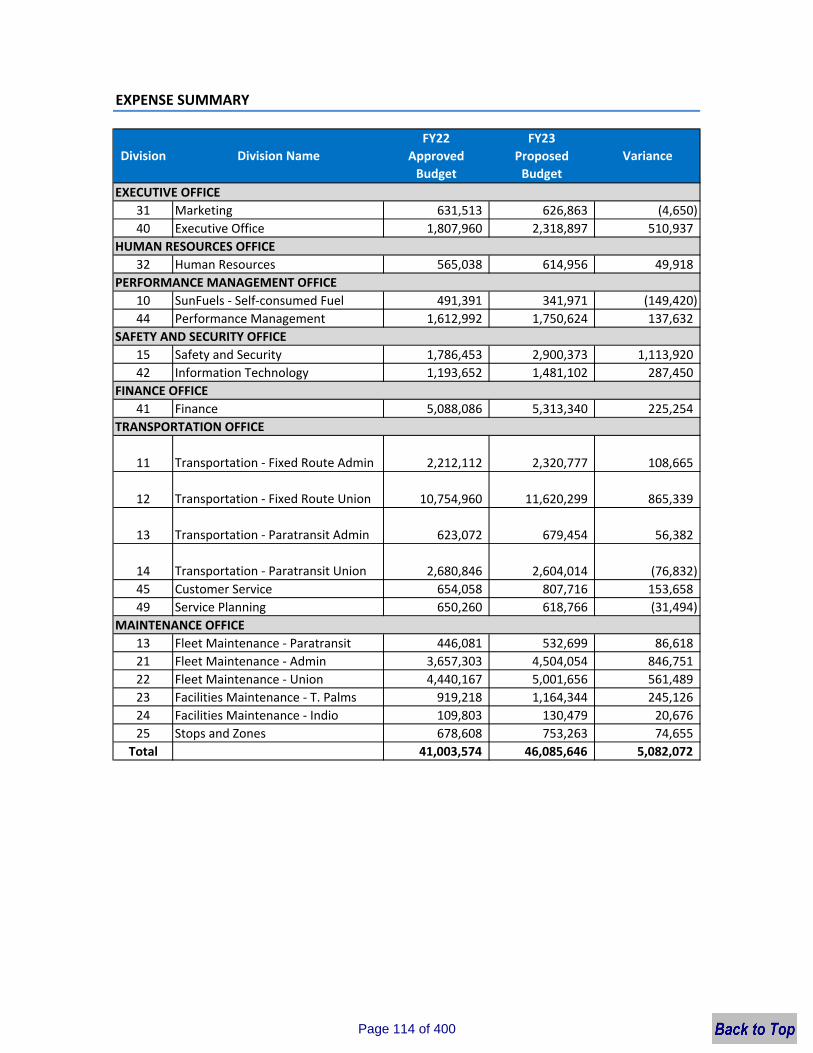
EXPENSE SUMMARY
EXECUTIVE OFFICE31 Marketing 631,513 626,863 (4,650) 40 Executive Office 1,807,960 2,318,897 510,937
32 Human Resources 565,038 614,956 49,918
10 SunFuels ‐ Self‐consumed Fuel 491,391 341,971 (149,420) 44 Performance Management 1,612,992 1,750,624 137,632
15 Safety and Security 1,786,453 2,900,373 1,113,920 42 Information Technology 1,193,652 1,481,102 287,450
41 Finance 5,088,086 5,313,340 225,254
11 Transportation ‐ Fixed Route Admin 2,212,112 2,320,777 108,665
12 Transportation ‐ Fixed Route Union 10,754,960 11,620,299 865,339
13 Transportation ‐ Paratransit Admin 623,072 679,454 56,382
14 Transportation ‐ Paratransit Union 2,680,846 2,604,014 (76,832) 45 Customer Service 654,058 807,716 153,658 49 Service Planning 650,260 618,766 (31,494)
13 Fleet Maintenance ‐ Paratransit 446,081 532,699 86,618 21 Fleet Maintenance ‐ Admin 3,657,303 4,504,054 846,751 22 Fleet Maintenance ‐ Union 4,440,167 5,001,656 561,489 23 Facilities Maintenance ‐ T. Palms 919,218 1,164,344 245,126 24 Facilities Maintenance ‐ Indio 109,803 130,479 20,676 25 Stops and Zones 678,608 753,263 74,655
Total 41,003,574 46,085,646 5,082,072
TRANSPORTATION OFFICE
Division Name
MAINTENANCE OFFICE
Variance
SAFETY AND SECURITY OFFICE
FY22Approved Budget
FY23Proposed Budget
Division
FINANCE OFFICE
PERFORMANCE MANAGEMENT OFFICE
HUMAN RESOURCES OFFICE
Page 114 of 400
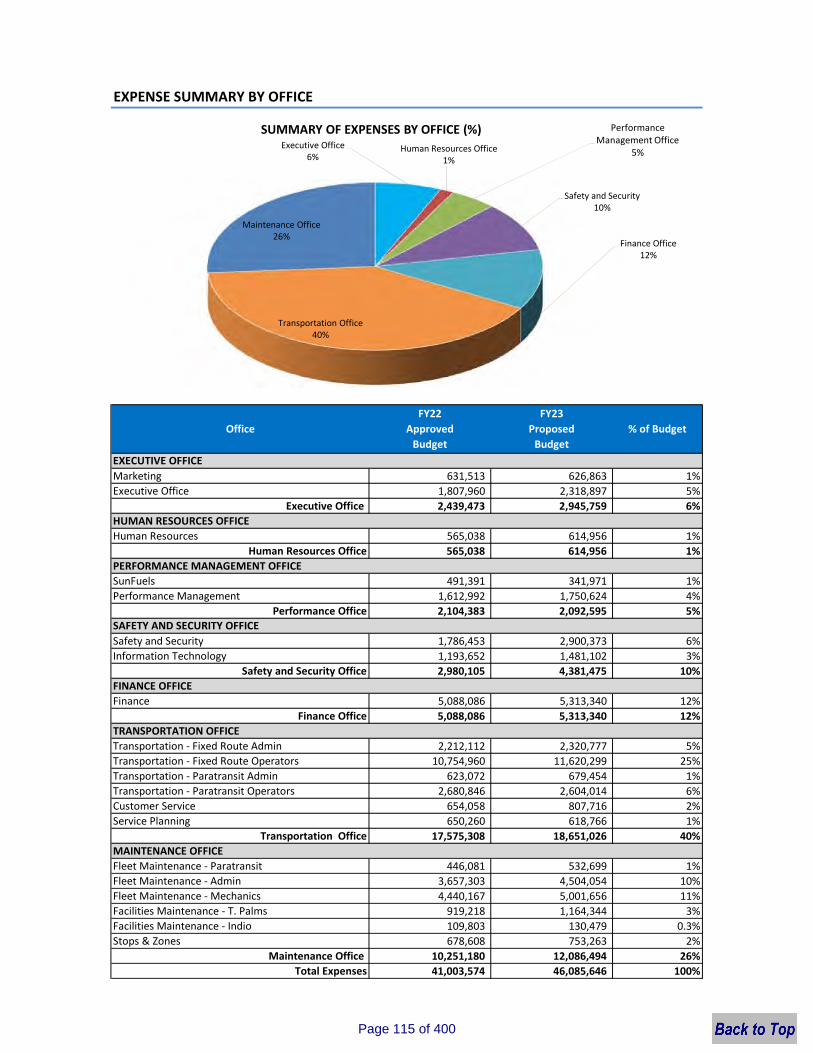
EXPENSE SUMMARY BY OFFICE
631,513 626,863 1%1,807,960 2,318,897 5%2,439,473 2,945,759 6%
565,038 614,956 1%565,038 614,956 1%
491,391 341,971 1%1,612,992 1,750,624 4%2,104,383 2,092,595 5%
1,786,453 2,900,373 6%1,193,652 1,481,102 3%2,980,105 4,381,475 10%
5,088,086 5,313,340 12%5,088,086 5,313,340 12%
2,212,112 2,320,777 5%10,754,960 11,620,299 25%
623,072 679,454 1%2,680,846 2,604,014 6%654,058 807,716 2%650,260 618,766 1%
17,575,308 18,651,026 40%
446,081 532,699 1%3,657,303 4,504,054 10%4,440,167 5,001,656 11%919,218 1,164,344 3%109,803 130,479 0.3%678,608 753,263 2%
10,251,180 12,086,494 26%41,003,574 46,085,646 100%
TRANSPORTATION OFFICE
Transportation ‐ Fixed Route OperatorsTransportation ‐ Paratransit Admin
Maintenance Office
Facilities Maintenance ‐ T. Palms
Service Planning
Fleet Maintenance ‐ Mechanics
MAINTENANCE OFFICE
Stops & Zones
Transportation ‐ Paratransit OperatorsCustomer Service
Facilities Maintenance ‐ Indio
% of Budget
Marketing
Fleet Maintenance ‐ Admin
Total Expenses
Safety and Security Office
Transportation Office
Fleet Maintenance ‐ Paratransit
PERFORMANCE MANAGEMENT OFFICE SunFuels
Safety and Security
Transportation ‐ Fixed Route Admin
FinanceFinance Office
EXECUTIVE OFFICE
Performance Management
SAFETY AND SECURITY OFFICE
CHART HERE
OfficeFY22
Approved Budget
FY23 Proposed Budget
Executive Office
Human Resources
Executive Office
HUMAN RESOURCES OFFICE
Performance Office
FINANCE OFFICE
Information Technology
Human Resources Office
Executive Office6%
Human Resources Office1%
Performance Management Office
5%
Safety and Security10%
Finance Office 12%
Transportation Office40%
Maintenance Office26%
SUMMARY OF EXPENSES BY OFFICE (%)
Page 115 of 400

EXECUTIVE OFFICE
Page 116 of 400
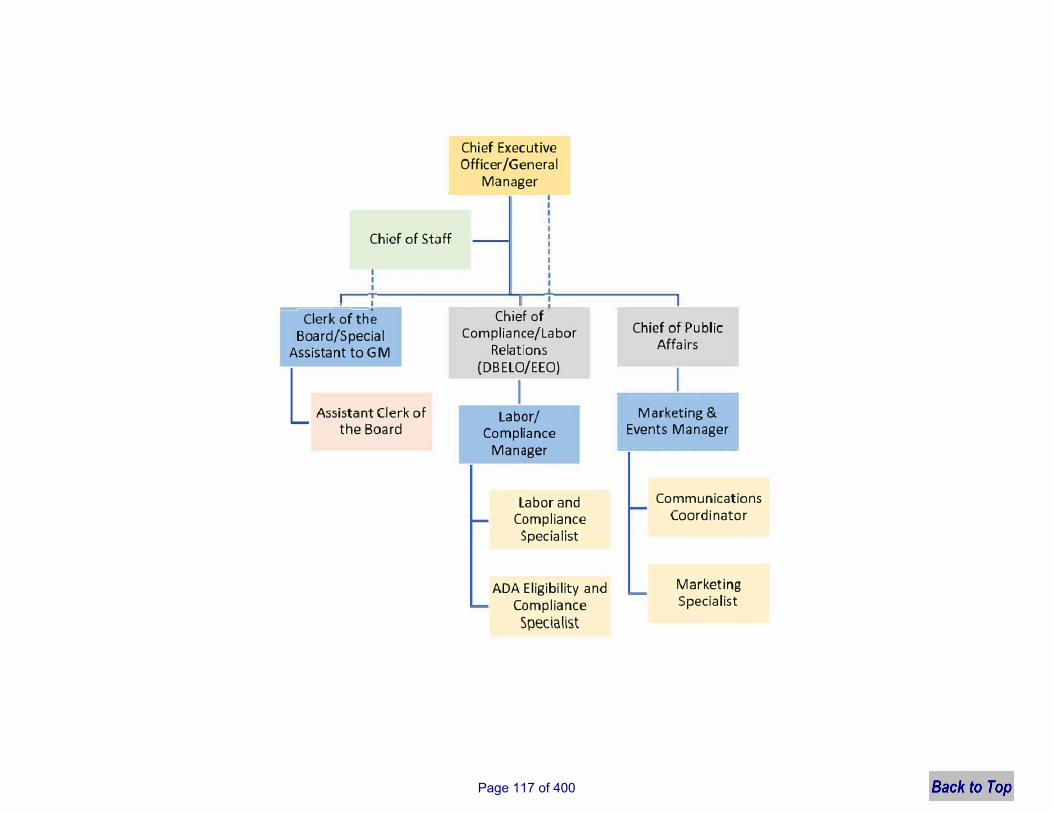
Chief of Staff
r------=---·
Clerk of th� Board/Special
Assistant to GM
L Assistant Clerk of
the Board
Chief Executive Officer /Genera I
Manager
Chief of Compliance/Labor
Relations (DBELO/EEO)
I Labor/
Compliance Manager
Labor and Compliance Specialist
ADA Eligibility and Compliance Specialist
Chief of Public Affairs
Marketing & Events Manager
Communications Coordinator
Marketing Specialist
Page 117 of 400
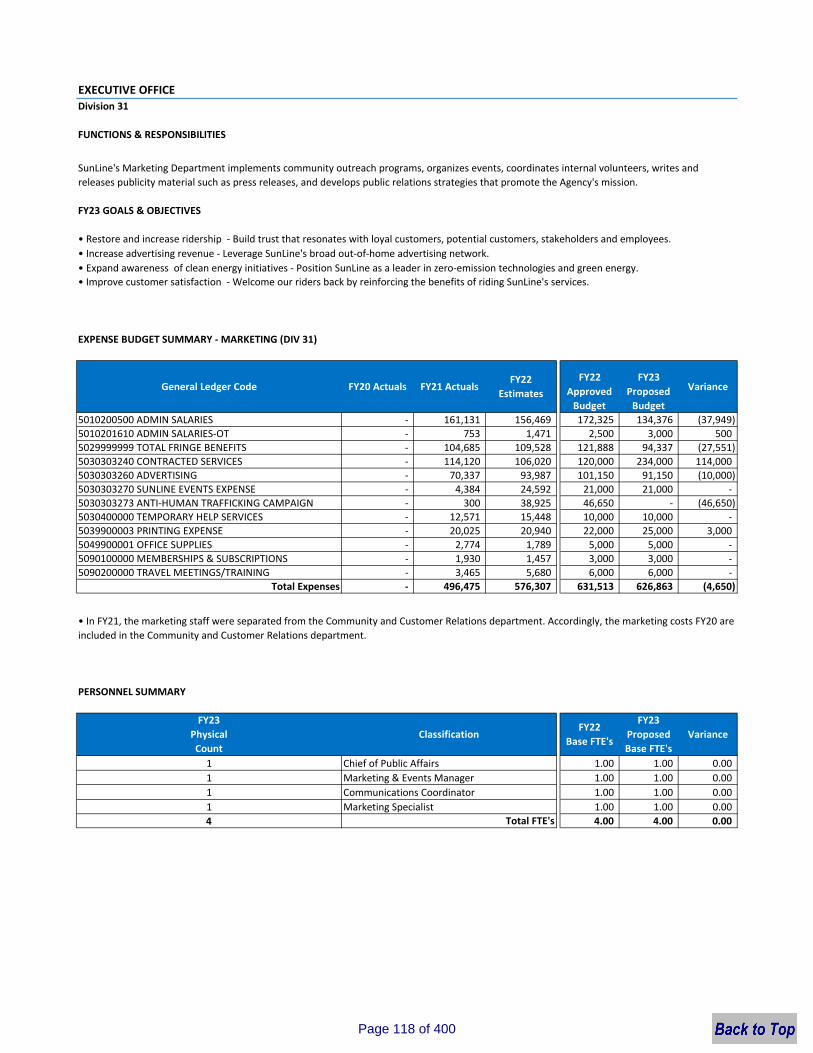
EXECUTIVE OFFICE Division 31
FUNCTIONS & RESPONSIBILITIES
FY23 GOALS & OBJECTIVES
• Restore and increase ridership ‐ Build trust that resonates with loyal customers, potential customers, stakeholders and employees.• Increase advertising revenue ‐ Leverage SunLine's broad out‐of‐home advertising network.• Expand awareness of clean energy initiatives ‐ Position SunLine as a leader in zero‐emission technologies and green energy.• Improve customer satisfaction ‐ Welcome our riders back by reinforcing the benefits of riding SunLine's services.
EXPENSE BUDGET SUMMARY ‐ MARKETING (DIV 31)
FY22 FY23Approved Budget
Proposed Budget
5010200500 ADMIN SALARIES ‐ 161,131 156,469 172,325 134,376 (37,949) 5010201610 ADMIN SALARIES‐OT ‐ 753 1,471 2,500 3,000 500 5029999999 TOTAL FRINGE BENEFITS ‐ 104,685 109,528 121,888 94,337 (27,551) 5030303240 CONTRACTED SERVICES ‐ 114,120 106,020 120,000 234,000 114,000 5030303260 ADVERTISING ‐ 70,337 93,987 101,150 91,150 (10,000) 5030303270 SUNLINE EVENTS EXPENSE ‐ 4,384 24,592 21,000 21,000 ‐5030303273 ANTI‐HUMAN TRAFFICKING CAMPAIGN ‐ 300 38,925 46,650 ‐ (46,650) 5030400000 TEMPORARY HELP SERVICES ‐ 12,571 15,448 10,000 10,000 ‐5039900003 PRINTING EXPENSE ‐ 20,025 20,940 22,000 25,000 3,000 5049900001 OFFICE SUPPLIES ‐ 2,774 1,789 5,000 5,000 ‐5090100000 MEMBERSHIPS & SUBSCRIPTIONS ‐ 1,930 1,457 3,000 3,000 ‐5090200000 TRAVEL MEETINGS/TRAINING ‐ 3,465 5,680 6,000 6,000 ‐
Total Expenses ‐ 496,475 576,307 631,513 626,863 (4,650)
1 1.00 1.00 0.001 1.00 1.00 0.001 1.00 1.00 0.001 1.00 1.00 0.004 4.00 4.00 0.00Total FTE's
Classification
Chief of Public AffairsMarketing & Events Manager
PERSONNEL SUMMARY
FY23PhysicalCount
Marketing SpecialistCommunications Coordinator
SunLine's Marketing Department implements community outreach programs, organizes events, coordinates internal volunteers, writes and releases publicity material such as press releases, and develops public relations strategies that promote the Agency's mission.
General Ledger Code FY20 Actuals
VarianceFY23
Proposed Base FTE's
FY22 Base FTE's
VarianceFY22
EstimatesFY21 Actuals
• In FY21, the marketing staff were separated from the Community and Customer Relations department. Accordingly, the marketing costs FY20 are included in the Community and Customer Relations department.
Page 118 of 400
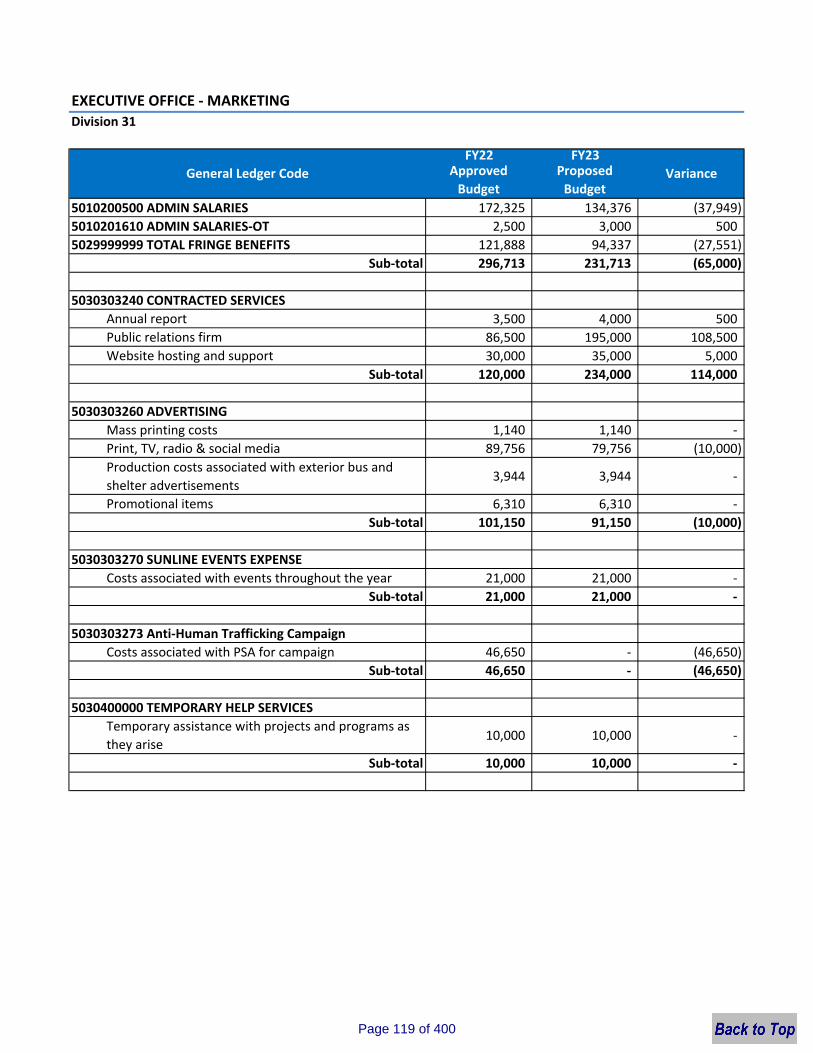
EXECUTIVE OFFICE ‐ MARKETINGDivision 31
FY22 FY23Approved Budget
Proposed Budget
5010200500 ADMIN SALARIES 172,325 134,376 (37,949) 5010201610 ADMIN SALARIES‐OT 2,500 3,000 500 5029999999 TOTAL FRINGE BENEFITS 121,888 94,337 (27,551)
Sub‐total 296,713 231,713 (65,000)
5030303240 CONTRACTED SERVICESAnnual report 3,500 4,000 500 Public relations firm 86,500 195,000 108,500 Website hosting and support 30,000 35,000 5,000
Sub‐total 120,000 234,000 114,000
5030303260 ADVERTISINGMass printing costs 1,140 1,140 ‐ Print, TV, radio & social media 89,756 79,756 (10,000) Production costs associated with exterior bus and shelter advertisements
3,944 3,944 ‐
Promotional items 6,310 6,310 ‐ Sub‐total 101,150 91,150 (10,000)
5030303270 SUNLINE EVENTS EXPENSECosts associated with events throughout the year 21,000 21,000 ‐
Sub‐total 21,000 21,000 ‐
5030303273 Anti‐Human Trafficking CampaignCosts associated with PSA for campaign 46,650 ‐ (46,650)
Sub‐total 46,650 ‐ (46,650)
5030400000 TEMPORARY HELP SERVICESTemporary assistance with projects and programs as they arise
10,000 10,000 ‐
Sub‐total 10,000 10,000 ‐
General Ledger Code Variance
Page 119 of 400
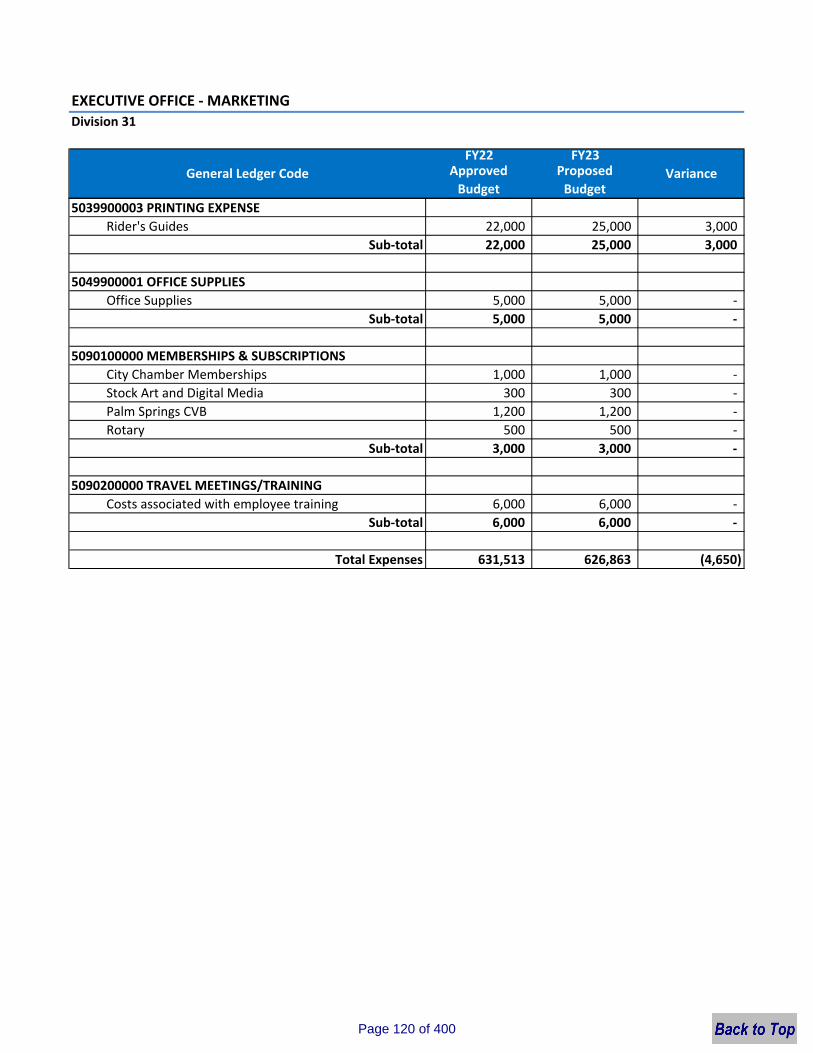
EXECUTIVE OFFICE ‐ MARKETINGDivision 31
FY22 FY23Approved Budget
Proposed Budget
General Ledger Code Variance
5039900003 PRINTING EXPENSERider's Guides 22,000 25,000 3,000
Sub‐total 22,000 25,000 3,000
5049900001 OFFICE SUPPLIESOffice Supplies 5,000 5,000 ‐
Sub‐total 5,000 5,000 ‐
5090100000 MEMBERSHIPS & SUBSCRIPTIONSCity Chamber Memberships 1,000 1,000 ‐ Stock Art and Digital Media 300 300 ‐ Palm Springs CVB 1,200 1,200 ‐ Rotary 500 500 ‐
Sub‐total 3,000 3,000 ‐
5090200000 TRAVEL MEETINGS/TRAININGCosts associated with employee training 6,000 6,000 ‐
Sub‐total 6,000 6,000 ‐
Total Expenses 631,513 626,863 (4,650)
Page 120 of 400

EXECUTIVE OFFICE
Division 40
FUNCTIONS & RESPONSIBILITIES
FY23 GOALS & OBJECTIVES
• Strategically support the Agency's recovery efforts for both employee and riders following the COVID‐19 pandemic.• Support the development of the microgrid project to produce renewable Hydrogen, reduce operating costs, generate new sources of revenue though energy sales and to create an emergency clean energy hub for the Coachella Valley.
• Support legislative advocacy efforts to further SunLine's mission and help the Agency be recognized for competitive funding opportunities.
• Continue to develop the West Coast Center of Excellence as a national training center for alternative fuel technologies.
EXPENSE BUDGET SUMMARY ‐ EXECUTIVE OFFICE (DIV 40)
FY22 FY23Approved Budget
Proposed Budget
5010200500 ADMIN SALARIES 411,791 386,456 503,782 581,824 586,107 4,282 5010201610 ADMIN SALARIES‐OT ‐ 31 17 800 ‐ (800)5010700000 ALLOCATED SALARIES (3,120) (2,876) (3,814) (3,000) 4,303 7,303 5029999999 TOTAL FRINGE BENEFITS 258,164 247,103 349,269 393,836 432,992 39,156 5030200000 PUBLIC NOTICES 385 128 204 1,500 1,500 ‐ 5030300002 LEGAL SERVICES ‐ LABOR COUNSEL 95,357 162,804 342,875 400,000 200,000 (200,000)5030300005 LEGAL SVCS‐ GENERAL 94,157 71,667 96,454 175,000 198,485 23,485 5030300006 LEGAL SVCS‐SPECIAL ‐ ‐ ‐ ‐ 30,000 30,000 5030400000 TEMPORARY HELP SERVICES ‐ 13,321 ‐ ‐ ‐ ‐ 5049900000 PRINTING ADMINISTRATION 4,206 2,167 3,888 4,000 4,000 ‐ 5049900001 OFFICE SUPPLIES‐GENERAL 2,006 1,496 1,909 3,000 2,200 (800)5090100000 MEMBERSHIPS & SUBSCRIPTIONS 67,678 59,827 64,081 84,000 91,810 7,810 5090200000 TRAVEL‐MEETINGS/TRAINING 21,930 7,912 27,651 10,000 28,000 18,000 5090200001 TRAINING/ WORKSHOP 12,712 ‐ 10,000 15,000 18,000 3,000 5090200002 BOARD MEETING EXPENSES 1,938 2,406 4,039 5,000 5,000 ‐ 5090200003 BOARD MEMBER COMPENSATION 6,000 8,200 8,367 12,000 12,000 ‐ 5090200004 EMPLOYEE DEVELOPMENT PROGRAM 12,658 ‐ ‐ ‐ 3,000 3,000 5099900002 MISCELANEOUS EXPENSE ‐ 92 ‐ ‐ 1,500 1,500 5099900004 CONSULTING‐GENERAL 247,027 11,537 338,370 125,000 700,000 575,000
Total Expenses 1,232,889 972,271 1,747,090 1,807,960 2,318,897 510,937
FY22 FY23Authorized
FTEsRequested
FTEs1 1.00 1.00 0.001 1.00 1.00 0.00
1 1.00 1.00 0.00
1 1.00 1.00 0.00
1 1.00 1.00 0.00
1 Labor/Compliance Manager 1.00 1.00 0.001 Labor and Compliance Specialist 1.00 1.00 0.00
1 1.00 1.00 0.008 8.00 8.00 0.00
Chief of StaffClerk of the Board/Special Assistant to CEO/GM
Chief of Compliance/Labor Relations (DBELO/EEO)
ADA Eligibility and Compliance Specialist
Chief Executive Officer/General Manager
Total FTEs
Assistant Clerk of the Board
PERSONNEL SUMMARY
FY23Physical Count
Classification Variance
The Executive Office is responsible for the overall administration and operation of the Agency. The Executive Office provides support to the Agency Board of Directors and maintains all records of the Agency's business.
General Ledger Code FY20 ActualsFY21
Actuals
FY22 Estimated Actuals
Variance
Page 121 of 400
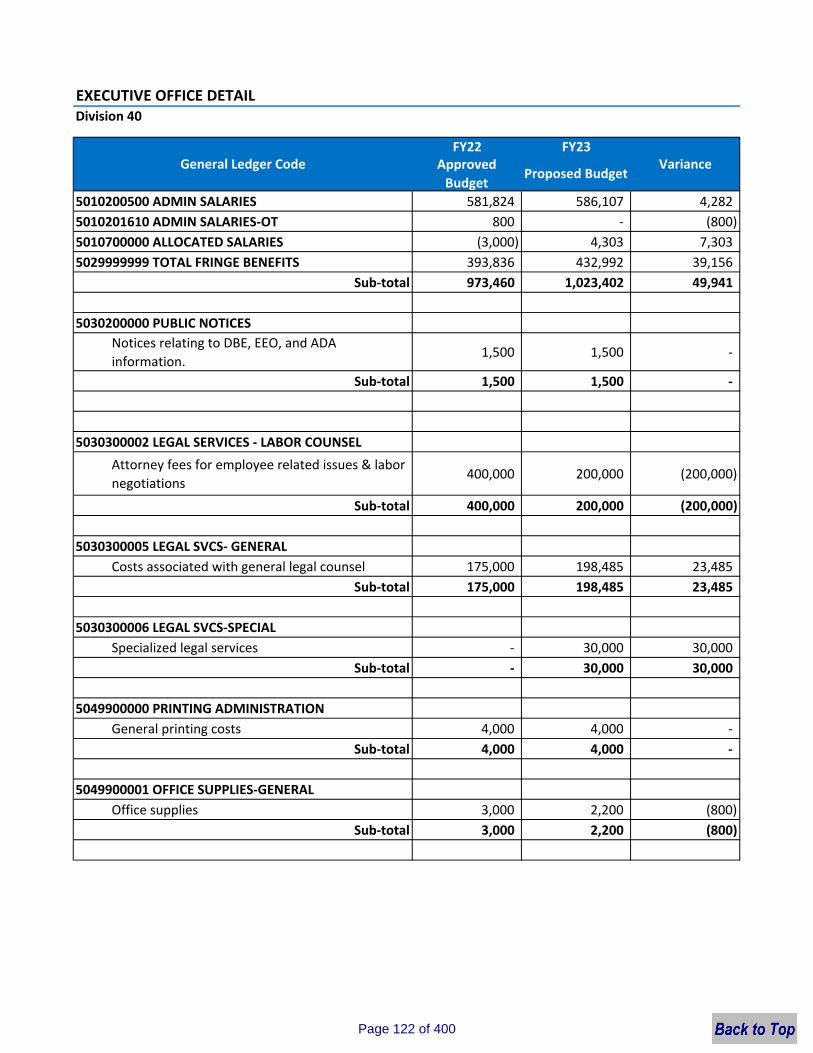
EXECUTIVE OFFICE DETAILDivision 40
FY22 FY23Approved Budget
Proposed Budget
5010200500 ADMIN SALARIES 581,824 586,107 4,282 5010201610 ADMIN SALARIES‐OT 800 ‐ (800) 5010700000 ALLOCATED SALARIES (3,000) 4,303 7,303 5029999999 TOTAL FRINGE BENEFITS 393,836 432,992 39,156
Sub‐total 973,460 1,023,402 49,941
5030200000 PUBLIC NOTICESNotices relating to DBE, EEO, and ADA information.
1,500 1,500 ‐
Sub‐total 1,500 1,500 ‐
5030300002 LEGAL SERVICES ‐ LABOR COUNSELAttorney fees for employee related issues & labor negotiations
400,000 200,000 (200,000)
Sub‐total 400,000 200,000 (200,000)
5030300005 LEGAL SVCS‐ GENERALCosts associated with general legal counsel 175,000 198,485 23,485
Sub‐total 175,000 198,485 23,485
5030300006 LEGAL SVCS‐SPECIALSpecialized legal services ‐ 30,000 30,000
Sub‐total ‐ 30,000 30,000
5049900000 PRINTING ADMINISTRATIONGeneral printing costs 4,000 4,000 ‐
Sub‐total 4,000 4,000 ‐
5049900001 OFFICE SUPPLIES‐GENERALOffice supplies 3,000 2,200 (800)
Sub‐total 3,000 2,200 (800)
General Ledger Code Variance
Page 122 of 400
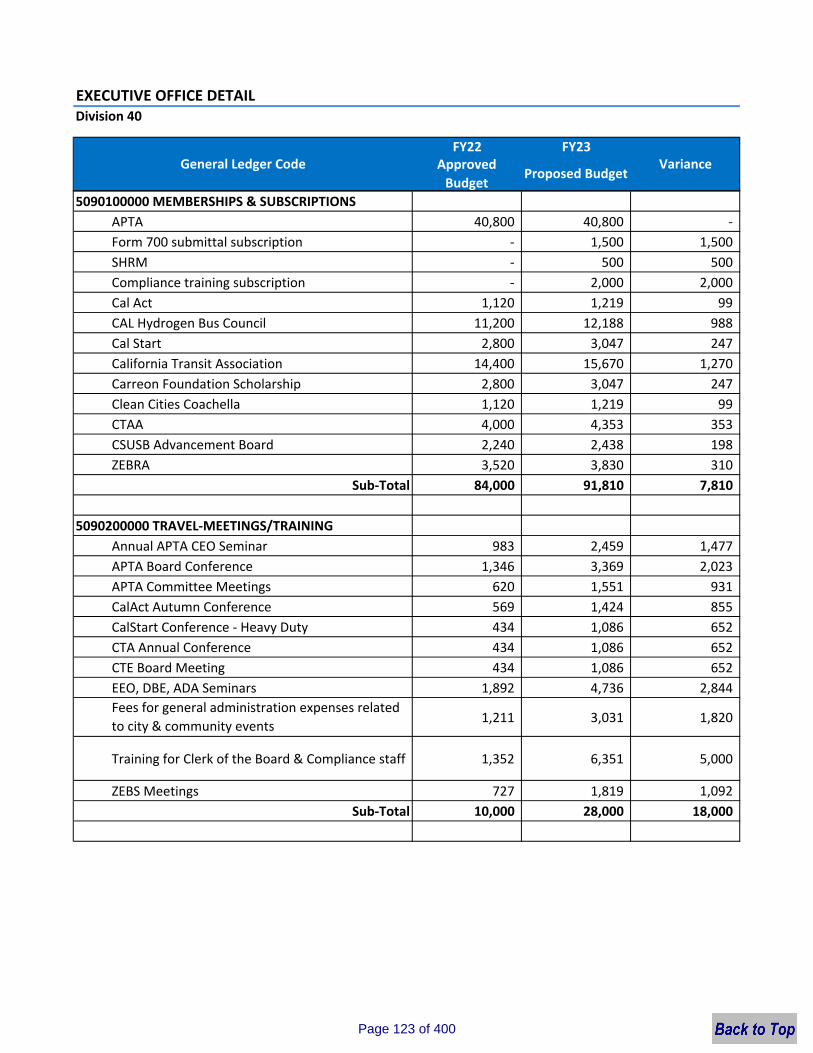
EXECUTIVE OFFICE DETAILDivision 40
FY22 FY23Approved Budget
Proposed BudgetGeneral Ledger Code Variance
5090100000 MEMBERSHIPS & SUBSCRIPTIONSAPTA 40,800 40,800 ‐ Form 700 submittal subscription ‐ 1,500 1,500 SHRM ‐ 500 500 Compliance training subscription ‐ 2,000 2,000 Cal Act 1,120 1,219 99 CAL Hydrogen Bus Council 11,200 12,188 988 Cal Start 2,800 3,047 247 California Transit Association 14,400 15,670 1,270 Carreon Foundation Scholarship 2,800 3,047 247 Clean Cities Coachella 1,120 1,219 99 CTAA 4,000 4,353 353 CSUSB Advancement Board 2,240 2,438 198 ZEBRA 3,520 3,830 310
Sub‐Total 84,000 91,810 7,810
5090200000 TRAVEL‐MEETINGS/TRAININGAnnual APTA CEO Seminar 983 2,459 1,477 APTA Board Conference 1,346 3,369 2,023 APTA Committee Meetings 620 1,551 931 CalAct Autumn Conference 569 1,424 855 CalStart Conference ‐ Heavy Duty 434 1,086 652 CTA Annual Conference 434 1,086 652 CTE Board Meeting 434 1,086 652 EEO, DBE, ADA Seminars 1,892 4,736 2,844 Fees for general administration expenses related to city & community events 1,211 3,031 1,820
Training for Clerk of the Board & Compliance staff 1,352 6,351 5,000
ZEBS Meetings 727 1,819 1,092 Sub‐Total 10,000 28,000 18,000
Page 123 of 400
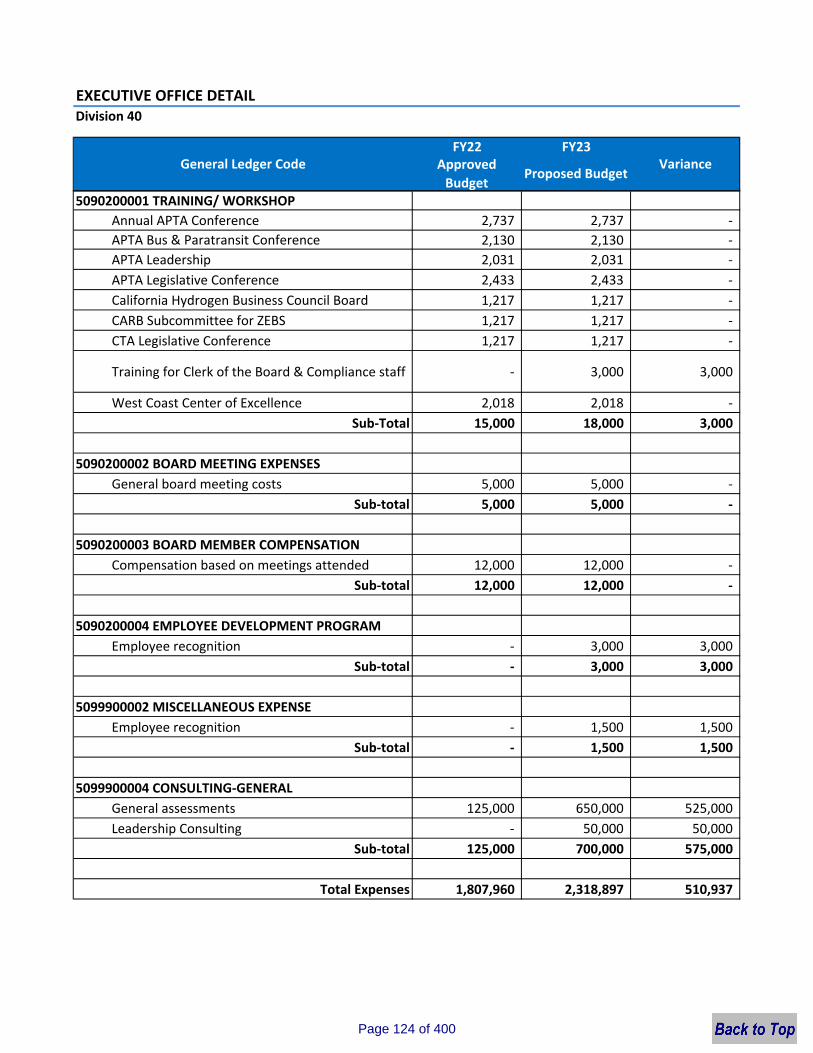
EXECUTIVE OFFICE DETAILDivision 40
FY22 FY23Approved Budget
Proposed BudgetGeneral Ledger Code Variance
5090200001 TRAINING/ WORKSHOPAnnual APTA Conference 2,737 2,737 ‐ APTA Bus & Paratransit Conference 2,130 2,130 ‐ APTA Leadership 2,031 2,031 ‐ APTA Legislative Conference 2,433 2,433 ‐ California Hydrogen Business Council Board 1,217 1,217 ‐ CARB Subcommittee for ZEBS 1,217 1,217 ‐ CTA Legislative Conference 1,217 1,217 ‐
Training for Clerk of the Board & Compliance staff ‐ 3,000 3,000
West Coast Center of Excellence 2,018 2,018 ‐ Sub‐Total 15,000 18,000 3,000
5090200002 BOARD MEETING EXPENSESGeneral board meeting costs 5,000 5,000 ‐
Sub‐total 5,000 5,000 ‐
5090200003 BOARD MEMBER COMPENSATIONCompensation based on meetings attended 12,000 12,000 ‐
Sub‐total 12,000 12,000 ‐
5090200004 EMPLOYEE DEVELOPMENT PROGRAMEmployee recognition ‐ 3,000 3,000
Sub‐total ‐ 3,000 3,000
5099900002 MISCELLANEOUS EXPENSEEmployee recognition ‐ 1,500 1,500
Sub‐total ‐ 1,500 1,500
5099900004 CONSULTING‐GENERALGeneral assessments 125,000 650,000 525,000 Leadership Consulting ‐ 50,000 50,000
Sub‐total 125,000 700,000 575,000
Total Expenses 1,807,960 2,318,897 510,937
Page 124 of 400
HUMAN RESOURCES OFFICE
Page 125 of 400

Chief of Human Relations
Deputy Chief of Human Relations
Human Resources Generalist
Human Resources
Specialist (2)
Administrative Assistant
Page 126 of 400
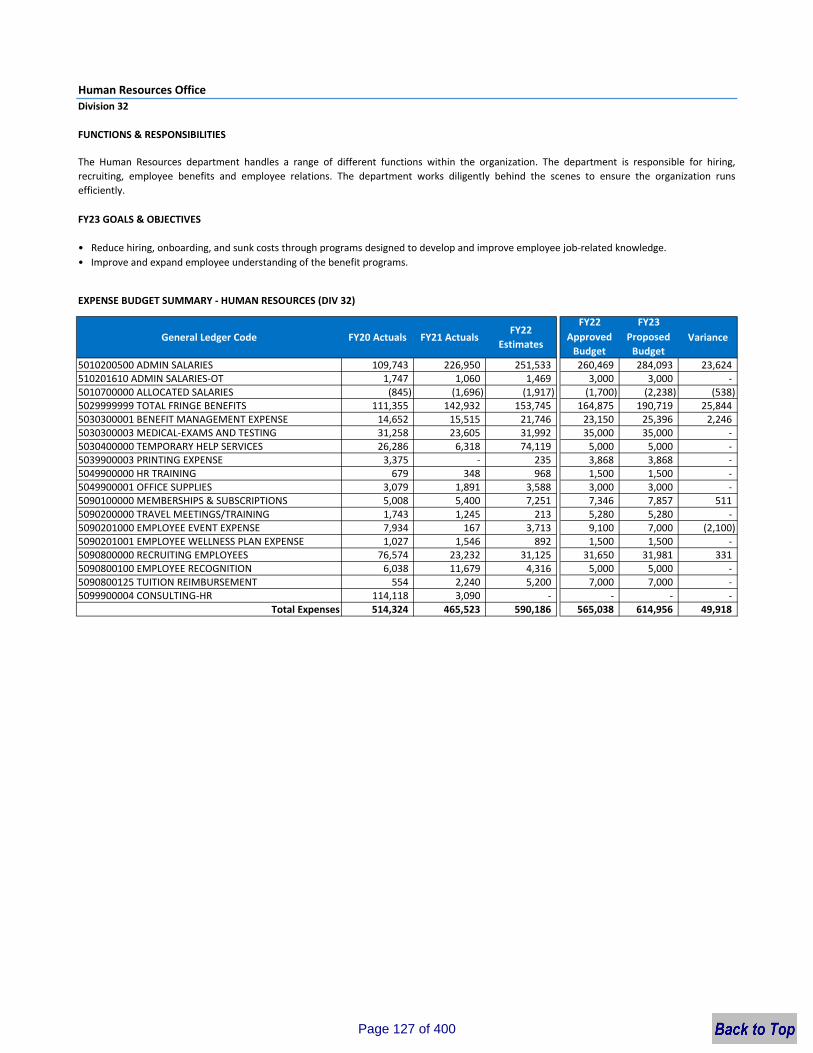
Human Resources OfficeDivision 32
FUNCTIONS & RESPONSIBILITIES
FY23 GOALS & OBJECTIVES
• Reduce hiring, onboarding, and sunk costs through programs designed to develop and improve employee job‐related knowledge.• Improve and expand employee understanding of the benefit programs.
EXPENSE BUDGET SUMMARY ‐ HUMAN RESOURCES (DIV 32)
FY22 FY23Approved Budget
Proposed Budget
5010200500 ADMIN SALARIES 109,743 226,950 251,533 260,469 284,093 23,624 510201610 ADMIN SALARIES‐OT 1,747 1,060 1,469 3,000 3,000 ‐5010700000 ALLOCATED SALARIES (845) (1,696) (1,917) (1,700) (2,238) (538) 5029999999 TOTAL FRINGE BENEFITS 111,355 142,932 153,745 164,875 190,719 25,844 5030300001 BENEFIT MANAGEMENT EXPENSE 14,652 15,515 21,746 23,150 25,396 2,246 5030300003 MEDICAL‐EXAMS AND TESTING 31,258 23,605 31,992 35,000 35,000 ‐5030400000 TEMPORARY HELP SERVICES 26,286 6,318 74,119 5,000 5,000 ‐5039900003 PRINTING EXPENSE 3,375 ‐ 235 3,868 3,868 ‐5049900000 HR TRAINING 679 348 968 1,500 1,500 ‐5049900001 OFFICE SUPPLIES 3,079 1,891 3,588 3,000 3,000 ‐5090100000 MEMBERSHIPS & SUBSCRIPTIONS 5,008 5,400 7,251 7,346 7,857 511 5090200000 TRAVEL MEETINGS/TRAINING 1,743 1,245 213 5,280 5,280 ‐5090201000 EMPLOYEE EVENT EXPENSE 7,934 167 3,713 9,100 7,000 (2,100) 5090201001 EMPLOYEE WELLNESS PLAN EXPENSE 1,027 1,546 892 1,500 1,500 ‐5090800000 RECRUITING EMPLOYEES 76,574 23,232 31,125 31,650 31,981 331 5090800100 EMPLOYEE RECOGNITION 6,038 11,679 4,316 5,000 5,000 ‐5090800125 TUITION REIMBURSEMENT 554 2,240 5,200 7,000 7,000 ‐5099900004 CONSULTING‐HR 114,118 3,090 ‐ ‐ ‐ ‐
Total Expenses 514,324 465,523 590,186 565,038 614,956 49,918
The Human Resources department handles a range of different functions within the organization. The department is responsible for hiring,recruiting, employee benefits and employee relations. The department works diligently behind the scenes to ensure the organization runsefficiently.
General Ledger Code FY20 Actuals FY21 ActualsFY22
EstimatesVariance
Page 127 of 400
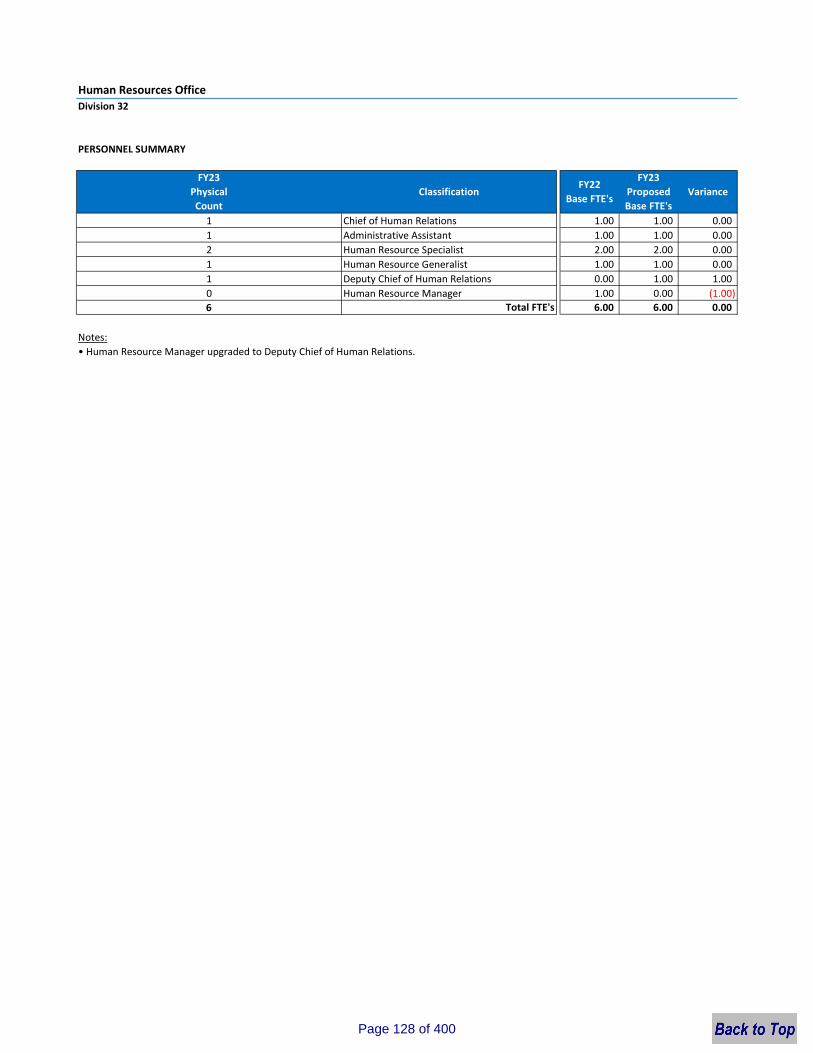
Human Resources OfficeDivision 32
1 1.00 1.00 0.001 1.00 1.00 0.002 2.00 2.00 0.001 1.00 1.00 0.001 0.00 1.00 1.000 1.00 0.00 (1.00)6 6.00 6.00 0.00
Notes:
Total FTE's
• Human Resource Manager upgraded to Deputy Chief of Human Relations.
Administrative AssistantHuman Resource SpecialistHuman Resource Generalist
Human Resource Manager
Chief of Human Relations
Deputy Chief of Human Relations
PERSONNEL SUMMARY
FY23PhysicalCount
ClassificationFY22
Base FTE's
FY23 Proposed Base FTE's
Variance
Page 128 of 400

HUMAN RESOURCES OFFICE ‐ HUMAN RESOURCES DETAILDivision 32
FY22 FY23Approved Budget
Proposed Budget
5010200500 ADMIN SALARIES 260,469 284,093 23,624 510201610 ADMIN SALARIES‐OT 3,000 3,000 ‐ 5010700000 ALLOCATED SALARIES (1,700) (2,238) (538) 5029999999 TOTAL FRINGE BENEFITS 164,875 190,719 25,844
Sub‐total 426,644 475,574 48,930
5030300001 BENEFIT MANAGEMENT EXPENSEACA Filing 3,000 4,000 1,000 CALPERS Admin Fees 14,000 13,806 (194) Sterling 1,950 1,950 ‐ OPTUM 4,200 5,640 1,440
Sub‐total 23,150 25,396 2,246
5030300003 MEDICAL‐EXAMS AND TESTINGPhysician services 20,000 20,000 ‐ VTT and licenses 15,000 15,000 ‐
Sub‐total 35,000 35,000 ‐
5030400000 TEMPORARY HELP SERVICESTemporary assistance with projects and programs as they arise
5,000 5,000 ‐
Sub‐total 5,000 5,000 ‐
5039900003 PRINTING EXPENSEFederal & State Regulation Posters 563 563 ‐ Employee Handbooks 1,325 1,325 ‐ Promotional materials 1,980 1,980 ‐
Sub‐total 3,868 3,868 ‐
5049900000 HR TRAININGEmployee orientation related expenses 1,500 1,500 ‐
Sub‐total 1,500 1,500 ‐
5049900001 OFFICE SUPPLIESOffice supplies to organize EE Files 3,000 3,000 ‐
Sub‐total 3,000 3,000 ‐
5090100000 MEMBERSHIPS & SUBSCRIPTIONSDCEAC Membership 40 40 ‐ Cal Chamber HR California 1,598 1,598 ‐
General Ledger Code Variance
Page 129 of 400
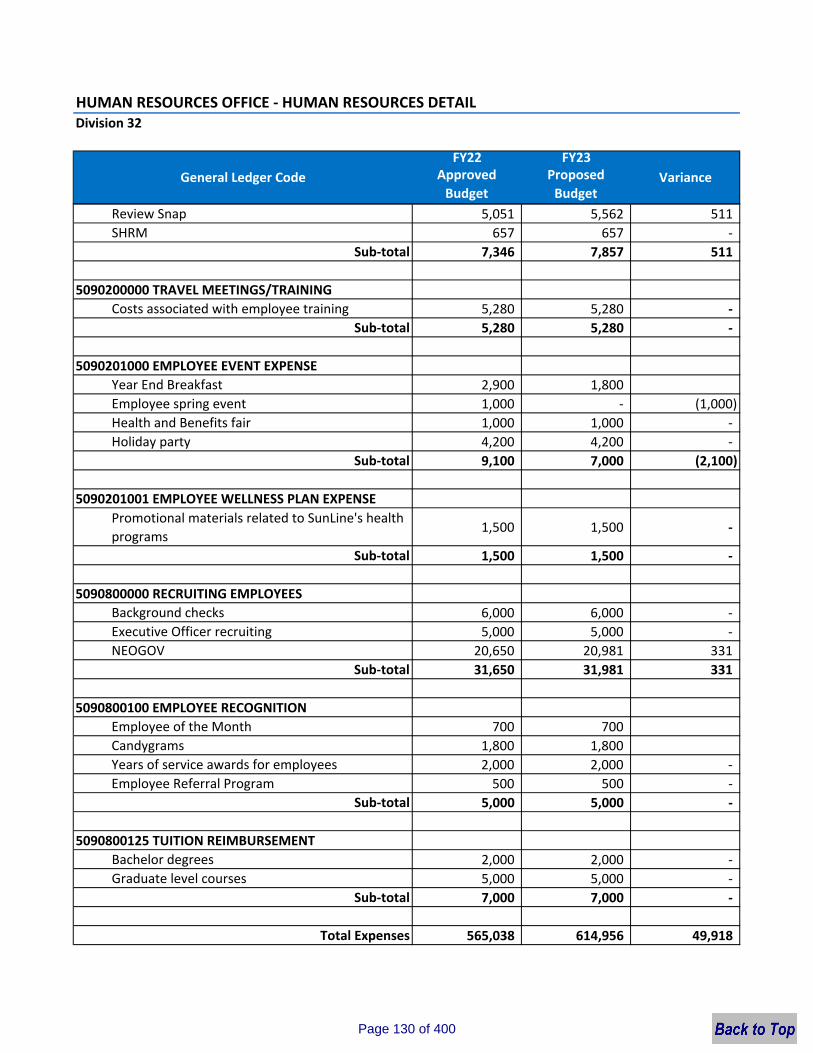
HUMAN RESOURCES OFFICE ‐ HUMAN RESOURCES DETAILDivision 32
FY22 FY23Approved Budget
Proposed Budget
General Ledger Code Variance
Review Snap 5,051 5,562 511 SHRM 657 657 ‐
Sub‐total 7,346 7,857 511
5090200000 TRAVEL MEETINGS/TRAININGCosts associated with employee training 5,280 5,280 ‐
Sub‐total 5,280 5,280 ‐
5090201000 EMPLOYEE EVENT EXPENSEYear End Breakfast 2,900 1,800 Employee spring event 1,000 ‐ (1,000) Health and Benefits fair 1,000 1,000 ‐ Holiday party 4,200 4,200 ‐
Sub‐total 9,100 7,000 (2,100)
5090201001 EMPLOYEE WELLNESS PLAN EXPENSEPromotional materials related to SunLine's health programs
1,500 1,500 ‐
Sub‐total 1,500 1,500 ‐
5090800000 RECRUITING EMPLOYEESBackground checks 6,000 6,000 ‐ Executive Officer recruiting 5,000 5,000 ‐ NEOGOV 20,650 20,981 331
Sub‐total 31,650 31,981 331
5090800100 EMPLOYEE RECOGNITIONEmployee of the Month 700 700 Candygrams 1,800 1,800 Years of service awards for employees 2,000 2,000 ‐ Employee Referral Program 500 500 ‐
Sub‐total 5,000 5,000 ‐
5090800125 TUITION REIMBURSEMENTBachelor degrees 2,000 2,000 ‐ Graduate level courses 5,000 5,000 ‐
Sub‐total 7,000 7,000 ‐
Total Expenses 565,038 614,956 49,918
Page 130 of 400
PERFORMANCE MANAGEMENT OFFICE
Page 131 of 400
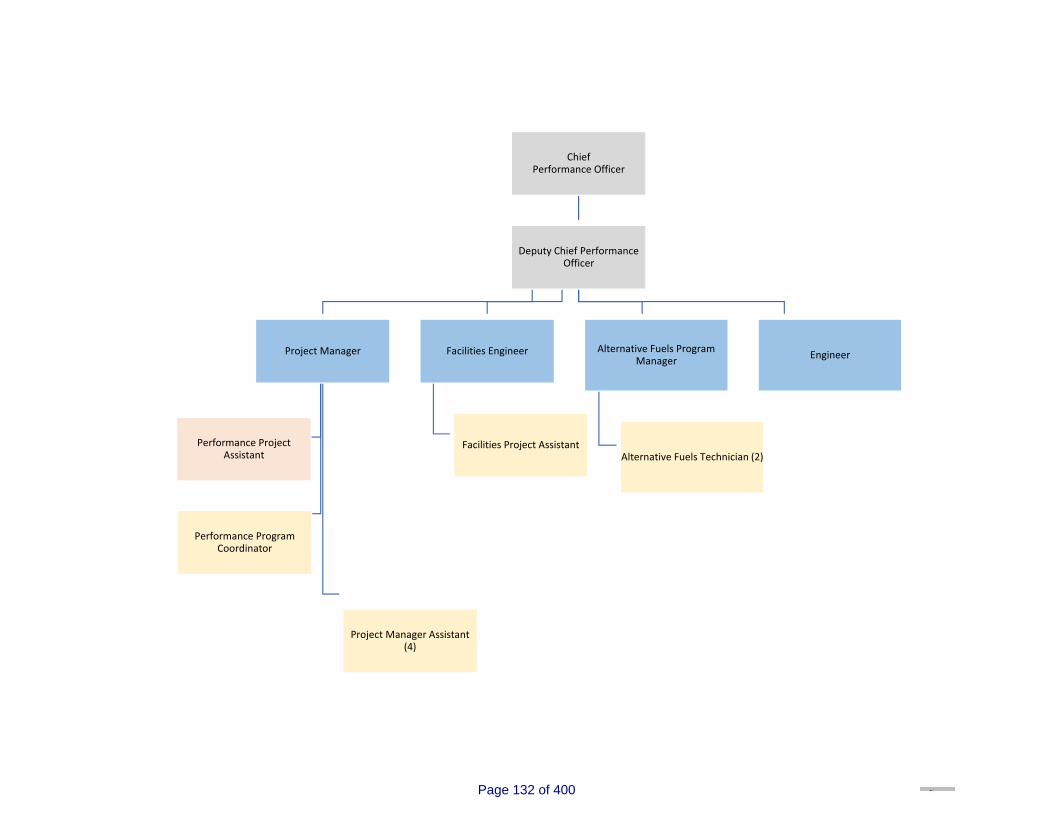
Chief Performance Officer
Deputy Chief Performance Officer
Project Manager
Performance Program Coordinator
Project Manager Assistant (4)
Performance Project Assistant
Facilities Engineer
Facilities Project Assistant
Alternative Fuels Program Manager
Alternative Fuels Technician (2)
Engineer
Page 132 of 400

PERFORMANCE MANAGEMENT OFFICE ‐ SUNFUELS Division 10
FUNCTIONS & RESPONSIBILITIES
FY23 GOALS & OBJECTIVES
• Operate a highly efficient 24/7 fueling infrastructure and aim toward 100% uptime for the stations to accommodate the Agency's fleet growth in both CNG and hydrogen vehicles.
• Maintain safe, reliable and courteous service to our internal and external customers to promote higher sales.• Preserve the course to secure more renewable energy paths to offset demands and take full advantage of allenvironmental/tax credits.
• Focus on equipment upgrade for fueling station at Division II.• Invest in new zero‐emission infrastructure improvement projects to produce low cost hydrogen fuel.
EXPENSE BUDGET SUMMARY ‐ SUNFUELS (DIV 10)
FY22 FY23Approved Budget
Proposed Budget
5010200500 ADMIN SALARIES 108,012 113,019 116,354 138,675 230,993 92,318 5010201610 ADMIN SALARIES‐OT 2,053 1,445 1,753 3,000 ‐ (3,000)5010700000 ALLOCATED SALARIES 16,841 17,403 18,750 20,000 26,376 6,376 5010700001 GRANT ALLOCATED SALARIES (1,192) ‐ ‐ ‐ ‐ ‐ 5029999999 TOTAL FRINGE BENEFITS 85,479 90,438 103,328 110,663 174,008 63,345 5030500010 CONTRACT SVC‐GENERAL 28,711 18,429 31,824 25,000 32,000 7,000 5030500011 CONTRACT SVC‐H2 27,690 3,375 267 107,500 7,500 (100,000)5030500012 UNIFORMS 1,700 1,541 1,541 2,000 2,000 ‐ 5030600900 ANSWERING SERVICES 359 359 359 420 420 ‐ 5039900005 SHIPPING/FREIGHT 70 15 1,007 400 1,000 600 5039900007 INVENTORY‐SALES TAX 2,849 178 3,490 2,000 2,000 ‐ 5039900008 INVENTORY‐FREIGHT CHARGES 1,082 54 722 1,000 1,000 ‐ 5049900001 OFFICE SUPPLIES 157 164 95 300 300 ‐ 5049900010 MAT/SUPPLIES‐‐CNG TPALMS 1,944 1,005 913 2,500 3,000 500 5049900011 MAT/SUPPLIES‐‐HYDROGEN 2,588 115 795 1,500 1,500 ‐ 5049900012 MAT/SUPPLIES‐‐CNG INDIO 1,090 1,276 710 2,000 1,500 (500)5049900300 REPAIR PARTS‐HYDROGEN 19,277 2,736 5,858 5,000 20,000 15,000 5049900400 REPAIR PARTS‐CNG ‐ TPALMS 25,482 8,517 25,589 12,000 16,000 4,000 5049900450 REPAIR PARTS‐CNG ‐ INDIO 4,523 10,011 9,065 15,000 10,000 (5,000)5050200001 ELECTRICITY‐CNG THOUSAND PALMS 70,842 99,184 125,486 95,000 150,000 55,000 5050200002 ELECTRICITY‐CNG INDIO 51,002 30,771 49,417 35,000 45,000 10,000 5050200003 ELECTRICITY‐HYDROGEN 427,346 1,023,169 1,000,519 1,100,000 1,150,000 50,000 5050200004 UTILITIES WATER/SEWER 1,332 5,251 5,937 6,000 6,500 500 5050200020 NATURAL GAS ‐ THOUSAND PALMS 914,234 1,048,314 1,554,018 1,000,000 1,100,000 100,000 5050200021 NATURAL GAS ‐ INDIO 156,000 67,822 191,689 125,000 175,000 50,000 5050200022 NATURAL GAS ‐ HYDROGEN 35,074 180 183 50,000 50,000 ‐ 5070500000 FUEL TAXES 84,759 73,403 80,882 80,000 56,598 (23,402)5090200000 TRAVEL MEETINGS/TRAINING ‐ ‐ ‐ 3,000 3,000 ‐ 5090801000 BANK ADJUSTMENTS/FEES 13,564 14,355 15,794 14,000 14,000 ‐ 5099900004 PERMITS & LICENSES 327 327 868 500 600 100 5099909000 ALLOCATED INDIRECT EXPENSES 17,946 19,445 24,174 21,000 28,838 7,838 5100200000 SELF CONSUMED FUEL (1,799,578) (2,333,650) (2,809,349) (2,487,067) (2,967,162) (480,095)
Total Expenses 301,562 318,653 562,042 491,391 341,971 (149,420)
SunFuels is responsible for the operation and maintenance of SunLine Transit Agency's CNG and hydrogen fuel infrastructure.
FY20 Actuals FY21 ActualsFY22
EstimatesGeneral Ledger Code Variance
Page 133 of 400
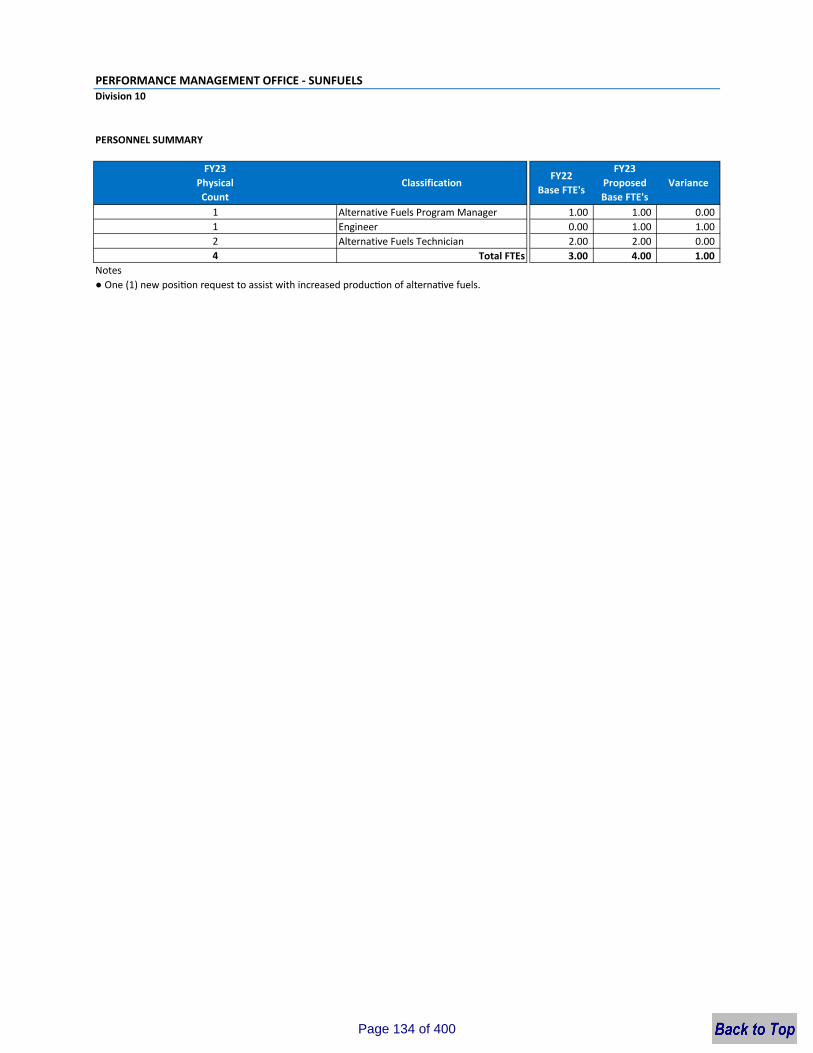
PERFORMANCE MANAGEMENT OFFICE ‐ SUNFUELS Division 10
1 1.00 1.00 0.001 Engineer 0.00 1.00 1.002 2.00 2.00 0.004 3.00 4.00 1.00
Notes● One (1) new posi on request to assist with increased produc on of alterna ve fuels.
Total FTEsAlternative Fuels Technician
FY22Base FTE's
FY23 Proposed Base FTE's
Alternative Fuels Program Manager
FY23Physical Count
Variance
PERSONNEL SUMMARY
Classification
Page 134 of 400
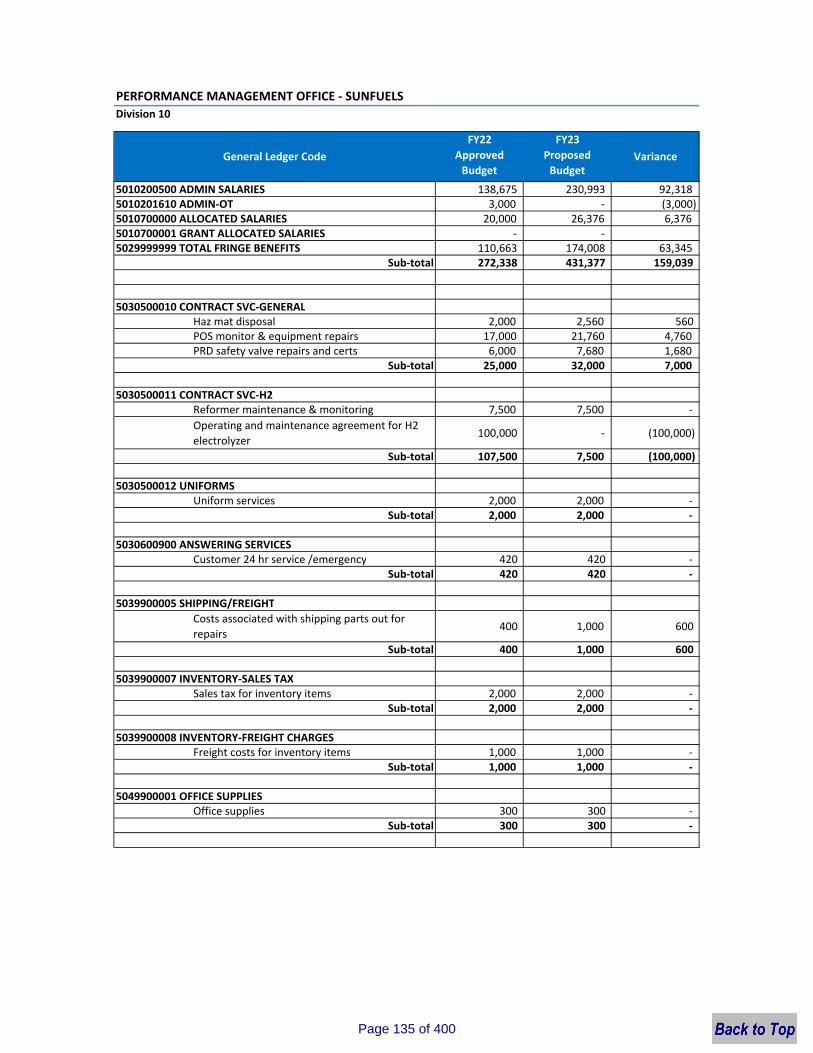
PERFORMANCE MANAGEMENT OFFICE ‐ SUNFUELS Division 10
FY22 FY23Approved Budget
Proposed Budget
5010200500 ADMIN SALARIES 138,675 230,993 92,318 5010201610 ADMIN‐OT 3,000 ‐ (3,000)5010700000 ALLOCATED SALARIES 20,000 26,376 6,376 5010700001 GRANT ALLOCATED SALARIES ‐ ‐ 5029999999 TOTAL FRINGE BENEFITS 110,663 174,008 63,345
Sub‐total 272,338 431,377 159,039
5030500010 CONTRACT SVC‐GENERALHaz mat disposal 2,000 2,560 560 POS monitor & equipment repairs 17,000 21,760 4,760 PRD safety valve repairs and certs 6,000 7,680 1,680
Sub‐total 25,000 32,000 7,000
5030500011 CONTRACT SVC‐H2Reformer maintenance & monitoring 7,500 7,500 ‐ Operating and maintenance agreement for H2 electrolyzer
100,000 ‐ (100,000)
Sub‐total 107,500 7,500 (100,000)
5030500012 UNIFORMSUniform services 2,000 2,000 ‐
Sub‐total 2,000 2,000 ‐
5030600900 ANSWERING SERVICESCustomer 24 hr service /emergency 420 420 ‐
Sub‐total 420 420 ‐
5039900005 SHIPPING/FREIGHTCosts associated with shipping parts out for repairs
400 1,000 600
Sub‐total 400 1,000 600
5039900007 INVENTORY‐SALES TAXSales tax for inventory items 2,000 2,000 ‐
Sub‐total 2,000 2,000 ‐
5039900008 INVENTORY‐FREIGHT CHARGESFreight costs for inventory items 1,000 1,000 ‐
Sub‐total 1,000 1,000 ‐
5049900001 OFFICE SUPPLIESOffice supplies 300 300 ‐
Sub‐total 300 300 ‐
General Ledger Code Variance
Page 135 of 400
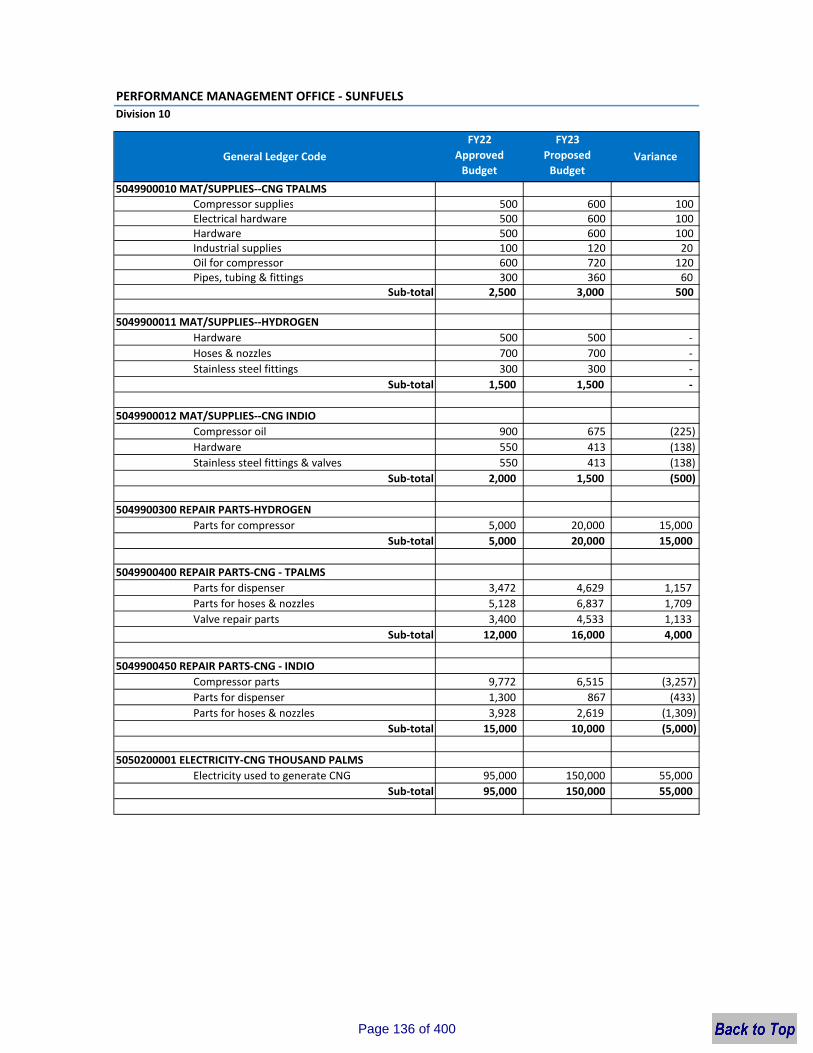
PERFORMANCE MANAGEMENT OFFICE ‐ SUNFUELS Division 10
FY22 FY23Approved Budget
Proposed Budget
General Ledger Code Variance
5049900010 MAT/SUPPLIES‐‐CNG TPALMSCompressor supplies 500 600 100 Electrical hardware 500 600 100 Hardware 500 600 100 Industrial supplies 100 120 20 Oil for compressor 600 720 120 Pipes, tubing & fittings 300 360 60
Sub‐total 2,500 3,000 500
5049900011 MAT/SUPPLIES‐‐HYDROGENHardware 500 500 ‐ Hoses & nozzles 700 700 ‐ Stainless steel fittings 300 300 ‐
Sub‐total 1,500 1,500 ‐
5049900012 MAT/SUPPLIES‐‐CNG INDIOCompressor oil 900 675 (225)Hardware 550 413 (138)Stainless steel fittings & valves 550 413 (138)
Sub‐total 2,000 1,500 (500)
5049900300 REPAIR PARTS‐HYDROGENParts for compressor 5,000 20,000 15,000
Sub‐total 5,000 20,000 15,000
5049900400 REPAIR PARTS‐CNG ‐ TPALMSParts for dispenser 3,472 4,629 1,157 Parts for hoses & nozzles 5,128 6,837 1,709 Valve repair parts 3,400 4,533 1,133
Sub‐total 12,000 16,000 4,000
5049900450 REPAIR PARTS‐CNG ‐ INDIOCompressor parts 9,772 6,515 (3,257)Parts for dispenser 1,300 867 (433)Parts for hoses & nozzles 3,928 2,619 (1,309)
Sub‐total 15,000 10,000 (5,000)
5050200001 ELECTRICITY‐CNG THOUSAND PALMSElectricity used to generate CNG 95,000 150,000 55,000
Sub‐total 95,000 150,000 55,000
Page 136 of 400
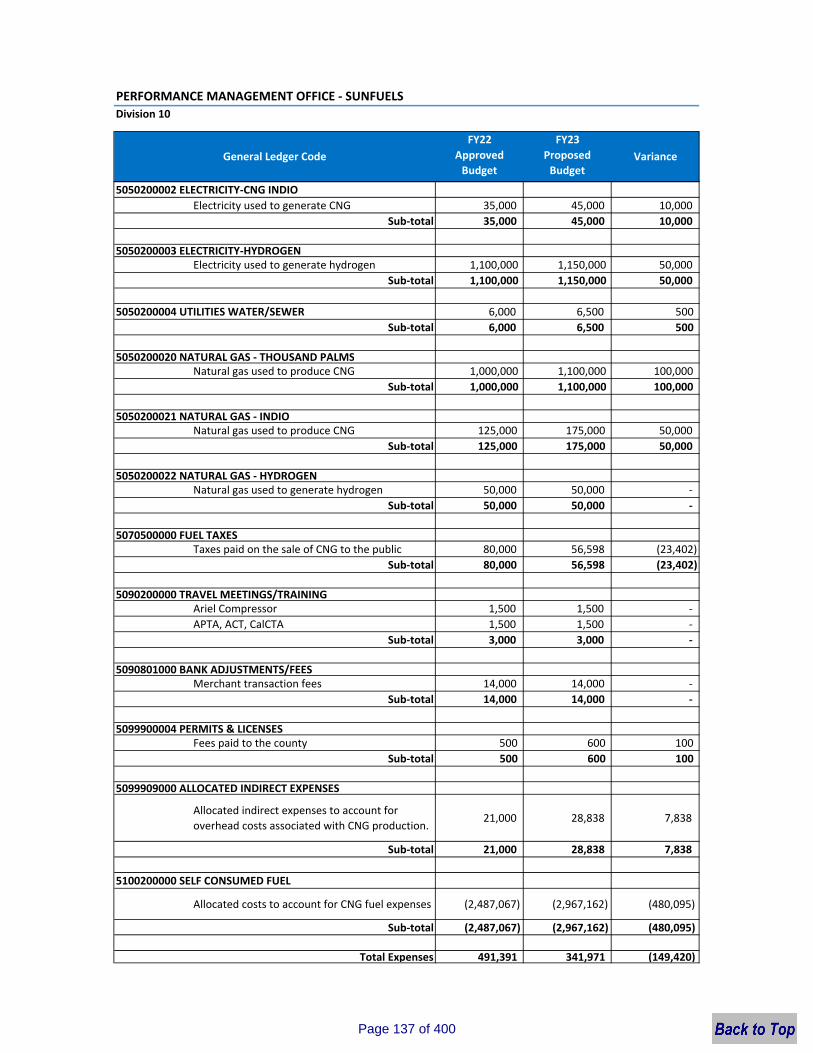
PERFORMANCE MANAGEMENT OFFICE ‐ SUNFUELS Division 10
FY22 FY23Approved Budget
Proposed Budget
General Ledger Code Variance
5050200002 ELECTRICITY‐CNG INDIOElectricity used to generate CNG 35,000 45,000 10,000
Sub‐total 35,000 45,000 10,000
5050200003 ELECTRICITY‐HYDROGENElectricity used to generate hydrogen 1,100,000 1,150,000 50,000
Sub‐total 1,100,000 1,150,000 50,000
5050200004 UTILITIES WATER/SEWER 6,000 6,500 500 Sub‐total 6,000 6,500 500
5050200020 NATURAL GAS ‐ THOUSAND PALMSNatural gas used to produce CNG 1,000,000 1,100,000 100,000
Sub‐total 1,000,000 1,100,000 100,000
5050200021 NATURAL GAS ‐ INDIONatural gas used to produce CNG 125,000 175,000 50,000
Sub‐total 125,000 175,000 50,000
5050200022 NATURAL GAS ‐ HYDROGENNatural gas used to generate hydrogen 50,000 50,000 ‐
Sub‐total 50,000 50,000 ‐
5070500000 FUEL TAXESTaxes paid on the sale of CNG to the public 80,000 56,598 (23,402)
Sub‐total 80,000 56,598 (23,402)
5090200000 TRAVEL MEETINGS/TRAININGAriel Compressor 1,500 1,500 ‐ APTA, ACT, CalCTA 1,500 1,500 ‐
Sub‐total 3,000 3,000 ‐
5090801000 BANK ADJUSTMENTS/FEESMerchant transaction fees 14,000 14,000 ‐
Sub‐total 14,000 14,000 ‐
5099900004 PERMITS & LICENSESFees paid to the county 500 600 100
Sub‐total 500 600 100
5099909000 ALLOCATED INDIRECT EXPENSES
Allocated indirect expenses to account for overhead costs associated with CNG production.
21,000 28,838 7,838
Sub‐total 21,000 28,838 7,838
5100200000 SELF CONSUMED FUEL
Allocated costs to account for CNG fuel expenses (2,487,067) (2,967,162) (480,095)
Sub‐total (2,487,067) (2,967,162) (480,095)
Total Expenses 491,391 341,971 (149,420)
Page 137 of 400
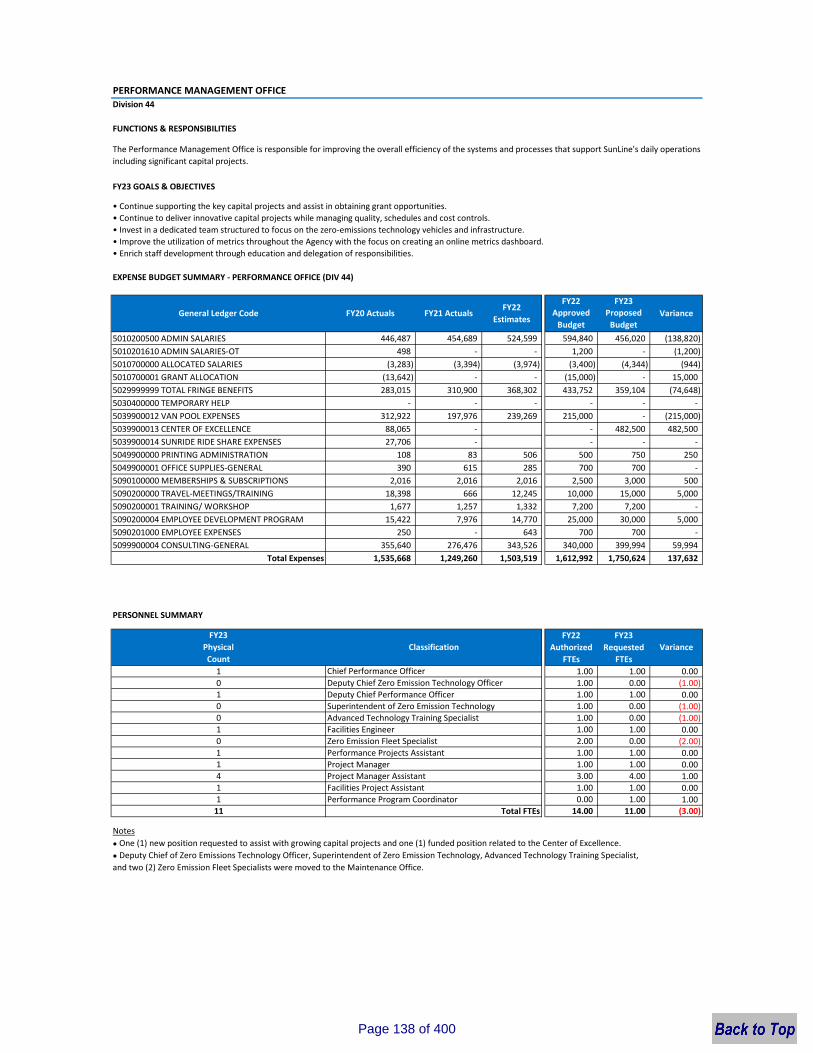
PERFORMANCE MANAGEMENT OFFICEDivision 44
FUNCTIONS & RESPONSIBILITIES
FY23 GOALS & OBJECTIVES
• Continue supporting the key capital projects and assist in obtaining grant opportunities.• Continue to deliver innovative capital projects while managing quality, schedules and cost controls.• Invest in a dedicated team structured to focus on the zero‐emissions technology vehicles and infrastructure.• Improve the utilization of metrics throughout the Agency with the focus on creating an online metrics dashboard.• Enrich staff development through education and delegation of responsibilities.
EXPENSE BUDGET SUMMARY ‐ PERFORMANCE OFFICE (DIV 44)
FY22 FY23Approved Budget
Proposed Budget
5010200500 ADMIN SALARIES 446,487 454,689 524,599 594,840 456,020 (138,820) 5010201610 ADMIN SALARIES‐OT 498 ‐ ‐ 1,200 ‐ (1,200) 5010700000 ALLOCATED SALARIES (3,283) (3,394) (3,974) (3,400) (4,344) (944) 5010700001 GRANT ALLOCATION (13,642) ‐ ‐ (15,000) ‐ 15,000 5029999999 TOTAL FRINGE BENEFITS 283,015 310,900 368,302 433,752 359,104 (74,648) 5030400000 TEMPORARY HELP ‐ ‐ ‐ ‐ ‐ ‐ 5039900012 VAN POOL EXPENSES 312,922 197,976 239,269 215,000 ‐ (215,000) 5039900013 CENTER OF EXCELLENCE 88,065 ‐ ‐ 482,500 482,500 5039900014 SUNRIDE RIDE SHARE EXPENSES 27,706 ‐ ‐ ‐ ‐ 5049900000 PRINTING ADMINISTRATION 108 83 506 500 750 250 5049900001 OFFICE SUPPLIES‐GENERAL 390 615 285 700 700 ‐ 5090100000 MEMBERSHIPS & SUBSCRIPTIONS 2,016 2,016 2,016 2,500 3,000 500 5090200000 TRAVEL‐MEETINGS/TRAINING 18,398 666 12,245 10,000 15,000 5,000 5090200001 TRAINING/ WORKSHOP 1,677 1,257 1,332 7,200 7,200 ‐ 5090200004 EMPLOYEE DEVELOPMENT PROGRAM 15,422 7,976 14,770 25,000 30,000 5,000 5090201000 EMPLOYEE EXPENSES 250 ‐ 643 700 700 ‐ 5099900004 CONSULTING‐GENERAL 355,640 276,476 343,526 340,000 399,994 59,994
Total Expenses 1,535,668 1,249,260 1,503,519 1,612,992 1,750,624 137,632
FY22 FY23Authorized
FTEsRequested
FTEs1 1.00 1.00 0.000 1.00 0.00 (1.00)1 1.00 1.00 0.000 Superintendent of Zero Emission Technology 1.00 0.00 (1.00)0 Advanced Technology Training Specialist 1.00 0.00 (1.00)1 1.00 1.00 0.000 Zero Emission Fleet Specialist 2.00 0.00 (2.00)1 1.00 1.00 0.001 1.00 1.00 0.004 3.00 4.00 1.001 Facilities Project Assistant 1.00 1.00 0.001 0.00 1.00 1.0011 14.00 11.00 (3.00)
Notes
and two (2) Zero Emission Fleet Specialists were moved to the Maintenance Office.
Total FTEs
Deputy Chief Performance Officer
Performance Projects AssistantProject ManagerProject Manager Assistant
Facilities Engineer
Chief Performance Officer
Performance Program Coordinator
Deputy Chief Zero Emission Technology Officer
The Performance Management Office is responsible for improving the overall efficiency of the systems and processes that support SunLine's daily operations including significant capital projects.
General Ledger Code FY20 Actuals FY21 ActualsFY22
Estimates Variance
PERSONNEL SUMMARY
FY23PhysicalCount
VarianceClassification
● Deputy Chief of Zero Emissions Technology Officer, Superintendent of Zero Emission Technology, Advanced Technology Training Specialist,● One (1) new position requested to assist with growing capital projects and one (1) funded position related to the Center of Excellence.
Page 138 of 400
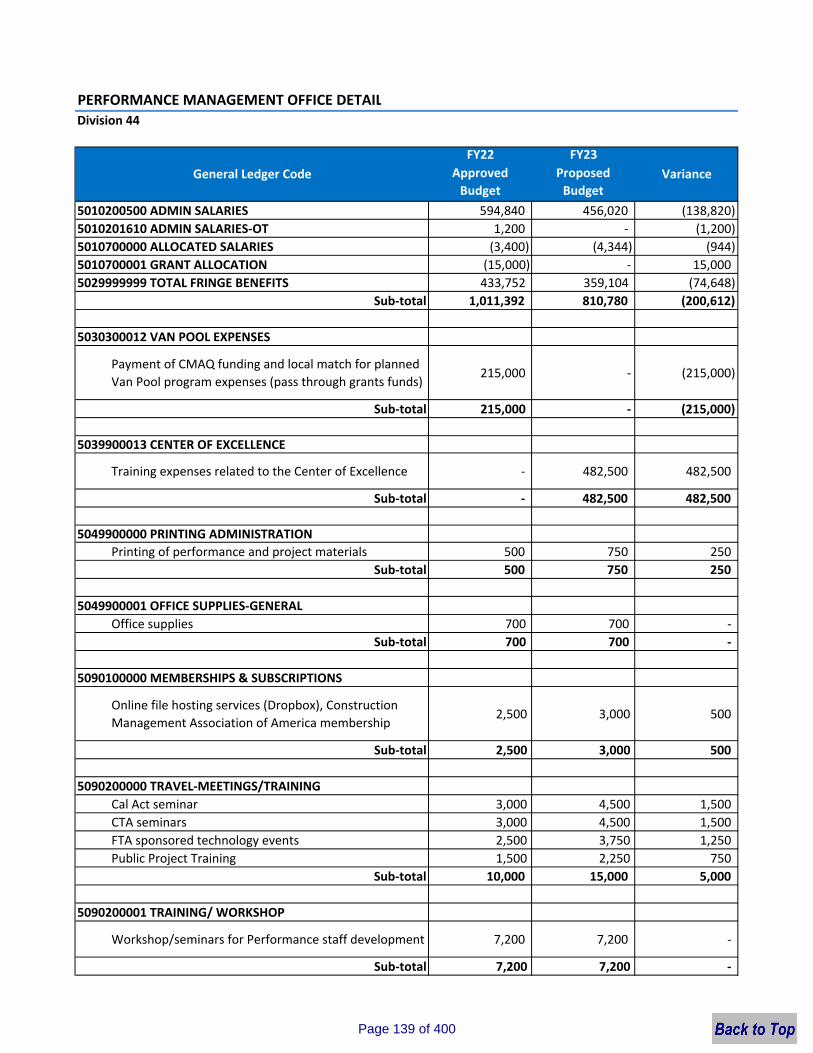
PERFORMANCE MANAGEMENT OFFICE DETAILDivision 44
FY22 FY23Approved Budget
ProposedBudget
5010200500 ADMIN SALARIES 594,840 456,020 (138,820) 5010201610 ADMIN SALARIES‐OT 1,200 ‐ (1,200) 5010700000 ALLOCATED SALARIES (3,400) (4,344) (944) 5010700001 GRANT ALLOCATION (15,000) ‐ 15,000 5029999999 TOTAL FRINGE BENEFITS 433,752 359,104 (74,648)
Sub‐total 1,011,392 810,780 (200,612)
5030300012 VAN POOL EXPENSES
Payment of CMAQ funding and local match for planned Van Pool program expenses (pass through grants funds)
215,000 ‐ (215,000)
Sub‐total 215,000 ‐ (215,000)
5039900013 CENTER OF EXCELLENCE
Training expenses related to the Center of Excellence ‐ 482,500 482,500
Sub‐total ‐ 482,500 482,500
5049900000 PRINTING ADMINISTRATIONPrinting of performance and project materials 500 750 250
Sub‐total 500 750 250
5049900001 OFFICE SUPPLIES‐GENERALOffice supplies 700 700 ‐
Sub‐total 700 700 ‐
5090100000 MEMBERSHIPS & SUBSCRIPTIONS
Online file hosting services (Dropbox), Construction Management Association of America membership
2,500 3,000 500
Sub‐total 2,500 3,000 500
5090200000 TRAVEL‐MEETINGS/TRAININGCal Act seminar 3,000 4,500 1,500 CTA seminars 3,000 4,500 1,500 FTA sponsored technology events 2,500 3,750 1,250 Public Project Training 1,500 2,250 750
Sub‐total 10,000 15,000 5,000
5090200001 TRAINING/ WORKSHOP
Workshop/seminars for Performance staff development 7,200 7,200 ‐
Sub‐total 7,200 7,200 ‐
General Ledger Code Variance
Page 139 of 400
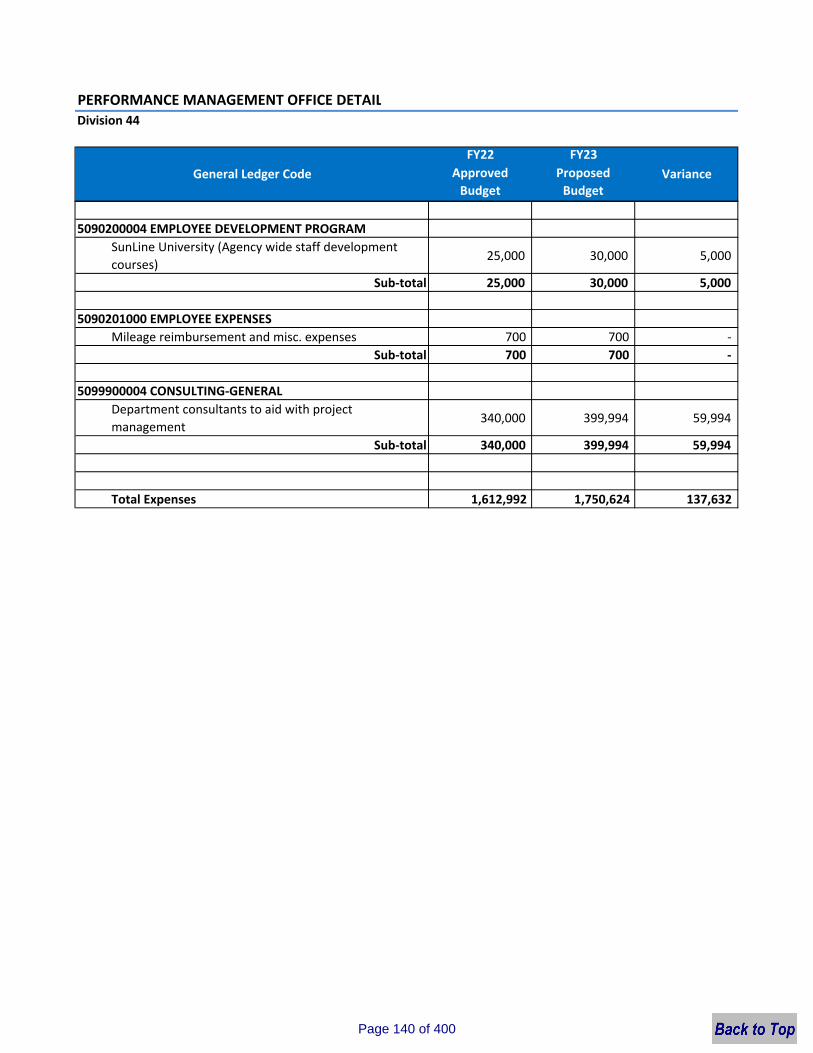
PERFORMANCE MANAGEMENT OFFICE DETAILDivision 44
FY22 FY23Approved Budget
ProposedBudget
General Ledger Code Variance
5090200004 EMPLOYEE DEVELOPMENT PROGRAMSunLine University (Agency wide staff development courses)
25,000 30,000 5,000
Sub‐total 25,000 30,000 5,000
5090201000 EMPLOYEE EXPENSESMileage reimbursement and misc. expenses 700 700 ‐
Sub‐total 700 700 ‐
5099900004 CONSULTING‐GENERALDepartment consultants to aid with project management
340,000 399,994 59,994
Sub‐total 340,000 399,994 59,994
Total Expenses 1,612,992 1,750,624 137,632
Page 140 of 400
SAFETY AND SECURITY OFFICE
Page 141 of 400
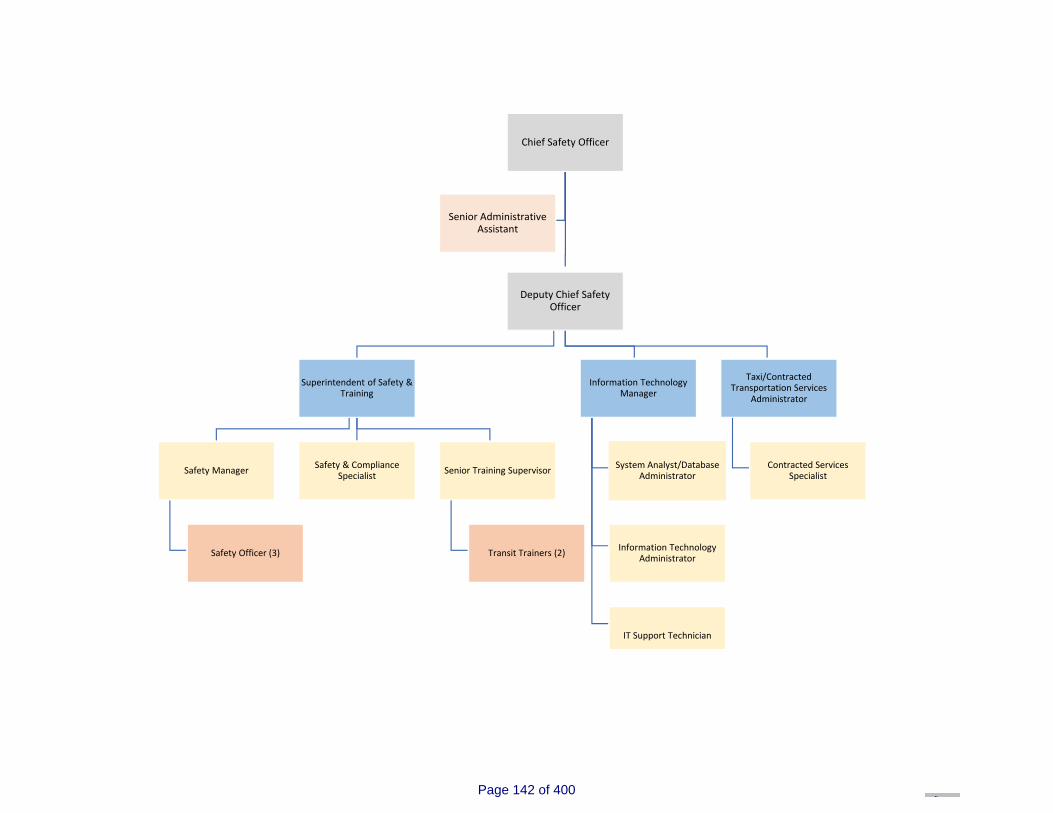
Chief Safety Officer
Deputy Chief Safety Officer
Superintendent of Safety & Training
Safety Manager
Safety Officer (3)
Safety & Compliance Specialist Senior Training Supervisor
Transit Trainers (2)
Information TechnologyManager
System Analyst/Database Administrator
Information Technology Administrator
IT Support Technician
Taxi/Contracted Transportation Services
Administrator
Contracted Services Specialist
Senior Administrative Assistant
Page 142 of 400
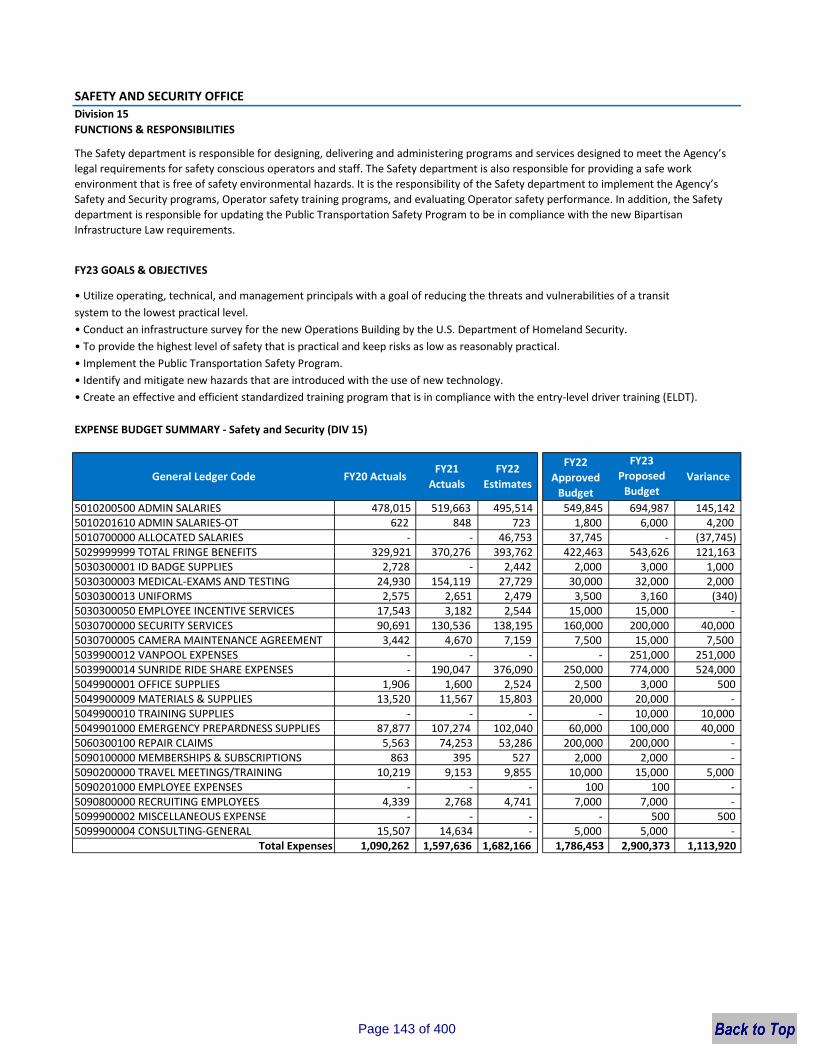
SAFETY AND SECURITY OFFICE Division 15FUNCTIONS & RESPONSIBILITIES
FY23 GOALS & OBJECTIVES
• Utilize operating, technical, and management principals with a goal of reducing the threats and vulnerabilities of a transitsystem to the lowest practical level.• Conduct an infrastructure survey for the new Operations Building by the U.S. Department of Homeland Security.• To provide the highest level of safety that is practical and keep risks as low as reasonably practical.• Implement the Public Transportation Safety Program.• Identify and mitigate new hazards that are introduced with the use of new technology.• Create an effective and efficient standardized training program that is in compliance with the entry‐level driver training (ELDT).
EXPENSE BUDGET SUMMARY ‐ Safety and Security (DIV 15)
FY23Proposed Budget
5010200500 ADMIN SALARIES 478,015 519,663 495,514 549,845 694,987 145,142 5010201610 ADMIN SALARIES‐OT 622 848 723 1,800 6,000 4,200 5010700000 ALLOCATED SALARIES ‐ ‐ 46,753 37,745 ‐ (37,745)5029999999 TOTAL FRINGE BENEFITS 329,921 370,276 393,762 422,463 543,626 121,163 5030300001 ID BADGE SUPPLIES 2,728 ‐ 2,442 2,000 3,000 1,000 5030300003 MEDICAL‐EXAMS AND TESTING 24,930 154,119 27,729 30,000 32,000 2,000 5030300013 UNIFORMS 2,575 2,651 2,479 3,500 3,160 (340)5030300050 EMPLOYEE INCENTIVE SERVICES 17,543 3,182 2,544 15,000 15,000 ‐ 5030700000 SECURITY SERVICES 90,691 130,536 138,195 160,000 200,000 40,000 5030700005 CAMERA MAINTENANCE AGREEMENT 3,442 4,670 7,159 7,500 15,000 7,500 5039900012 VANPOOL EXPENSES ‐ ‐ ‐ ‐ 251,000 251,000 5039900014 SUNRIDE RIDE SHARE EXPENSES ‐ 190,047 376,090 250,000 774,000 524,000 5049900001 OFFICE SUPPLIES 1,906 1,600 2,524 2,500 3,000 500 5049900009 MATERIALS & SUPPLIES 13,520 11,567 15,803 20,000 20,000 ‐ 5049900010 TRAINING SUPPLIES ‐ ‐ ‐ ‐ 10,000 10,000 5049901000 EMERGENCY PREPARDNESS SUPPLIES 87,877 107,274 102,040 60,000 100,000 40,000 5060300100 REPAIR CLAIMS 5,563 74,253 53,286 200,000 200,000 ‐ 5090100000 MEMBERSHIPS & SUBSCRIPTIONS 863 395 527 2,000 2,000 ‐ 5090200000 TRAVEL MEETINGS/TRAINING 10,219 9,153 9,855 10,000 15,000 5,000 5090201000 EMPLOYEE EXPENSES ‐ ‐ ‐ 100 100 ‐ 5090800000 RECRUITING EMPLOYEES 4,339 2,768 4,741 7,000 7,000 ‐ 5099900002 MISCELLANEOUS EXPENSE ‐ ‐ ‐ ‐ 500 500 5099900004 CONSULTING‐GENERAL 15,507 14,634 ‐ 5,000 5,000 ‐
Total Expenses 1,090,262 1,597,636 1,682,166 1,786,453 2,900,373 1,113,920
The Safety department is responsible for designing, delivering and administering programs and services designed to meet the Agency’s legal requirements for safety conscious operators and staff. The Safety department is also responsible for providing a safe work environment that is free of safety environmental hazards. It is the responsibility of the Safety department to implement the Agency’s Safety and Security programs, Operator safety training programs, and evaluating Operator safety performance. In addition, the Safety department is responsible for updating the Public Transportation Safety Program to be in compliance with the new Bipartisan Infrastructure Law requirements.
General Ledger Code FY20 Actuals VarianceFY22
Approved Budget
FY21 Actuals
FY22 Estimates
Page 143 of 400
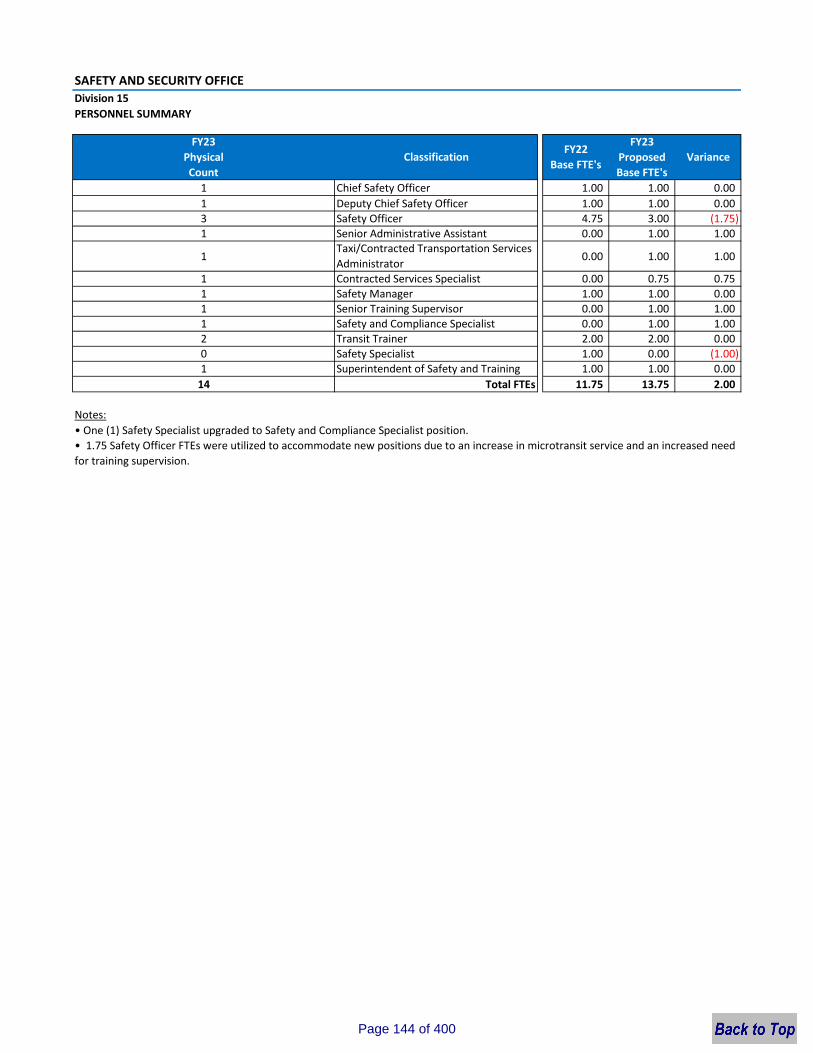
SAFETY AND SECURITY OFFICE Division 15
1 1.00 1.00 0.001 1.00 1.00 0.003 4.75 3.00 (1.75)1 Senior Administrative Assistant 0.00 1.00 1.00
1 0.00 1.00 1.00
1 Contracted Services Specialist 0.00 0.75 0.751 1.00 1.00 0.001 Senior Training Supervisor 0.00 1.00 1.001 0.00 1.00 1.002 Transit Trainer 2.00 2.00 0.000 1.00 0.00 (1.00)1 1.00 1.00 0.0014 11.75 13.75 2.00
Superintendent of Safety and Training
Safety and Compliance Specialist
• One (1) Safety Specialist upgraded to Safety and Compliance Specialist position.
PERSONNEL SUMMARY
Taxi/Contracted Transportation Services Administrator
Deputy Chief Safety Officer
FY23Physical Count
• 1.75 Safety Officer FTEs were utilized to accommodate new positions due to an increase in microtransit service and an increased need for training supervision.
Notes:
Variance
Total FTEs
FY22Base FTE's
Chief Safety Officer
Safety Officer
Safety Manager
Safety Specialist
ClassificationFY23
Proposed Base FTE's
Page 144 of 400

SAFETY AND SECURITY OFFICEDivision 15
FY22 FY23Approved Budget
Proposed Budget
5010200500 ADMIN SALARIES 549,845 694,987 145,142 5010201610 ADMIN SALARIES‐OT 1,800 6,000 4,200 5010700000 ALLOCATED SALARIES 37,745 ‐ (37,745) 5029999999 TOTAL FRINGE BENEFITS 422,463 543,626 121,163
Sub‐total 1,011,853 1,244,613 232,760
5030300001 ID BADGE SUPPLIESAccess Cards 2,000 3,000 1,000
Sub‐total 2,000 3,000 1,000
5030300003 MEDICAL‐EXAMS AND TESTINGDrug and Alcohol Program 30,000 32,000 2,000
Sub‐total 30,000 32,000 2,000
5030300013 UNIFORMSUniform rental 3,500 3,160 (340)
Sub‐total 3,500 3,160 (340)
5030300050 EMPLOYEE INCENTIVE SERVICESHealth and safety incentive program items 7,500 7,500 ‐ Safety Incentive program 7,500 7,500 ‐
Sub‐total 15,000 15,000 ‐
5030700000 SECURITY SERVICESRemote security system monitoring 30,000 30,000 ‐ Guard services at Divisions 1 & 2 130,000 170,000 40,000
Sub‐total 160,000 200,000 40,000
5030700005 CAMERA MAINTENANCE AGREEMENTCamera maintenance 7,500 15,000 7,500
Sub‐total 7,500 15,000 7,500
5039900012 VANPOOL EXPENSESVanpool Expenses ‐ 251,000 251,000
Sub‐total ‐ 251,000 251,000
5039900014 SUNRIDE RIDE SHARE EXPENSESMicrotransit Expenses 250,000 774,000 524,000
Sub‐total 250,000 774,000 524,000
General Ledger Code Variance
Page 145 of 400
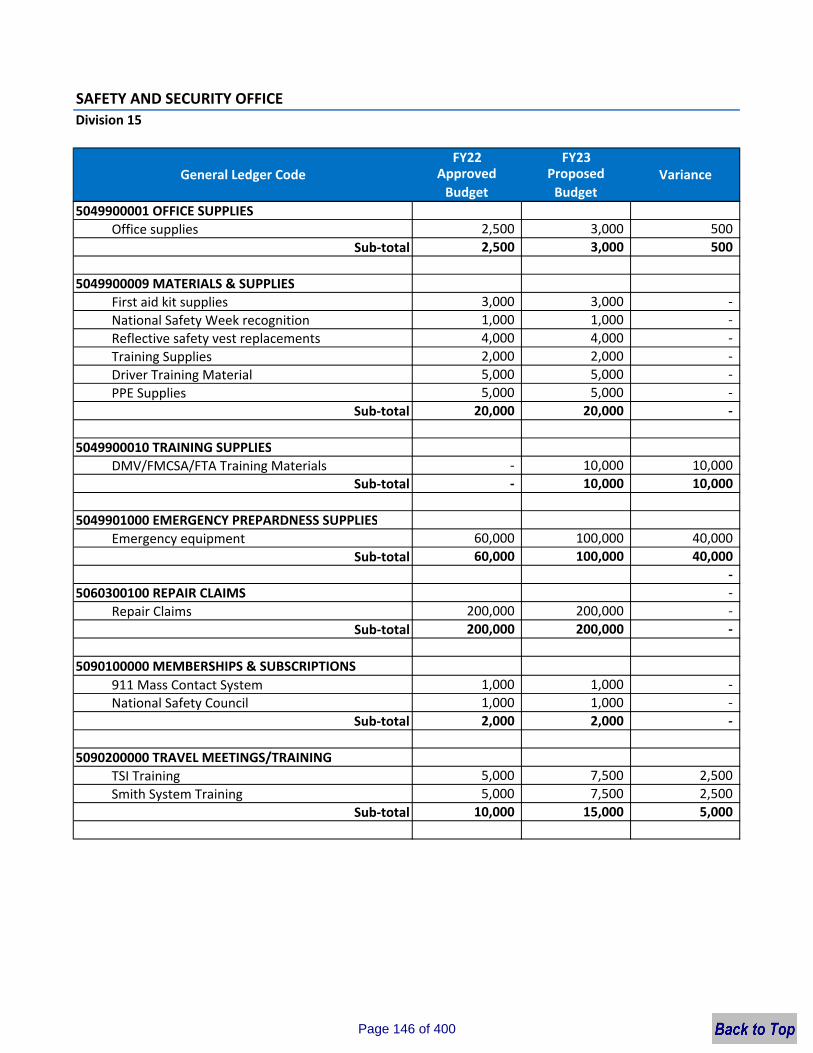
SAFETY AND SECURITY OFFICEDivision 15
FY22 FY23Approved Budget
Proposed Budget
General Ledger Code Variance
5049900001 OFFICE SUPPLIESOffice supplies 2,500 3,000 500
Sub‐total 2,500 3,000 500
5049900009 MATERIALS & SUPPLIESFirst aid kit supplies 3,000 3,000 ‐ National Safety Week recognition 1,000 1,000 ‐ Reflective safety vest replacements 4,000 4,000 ‐ Training Supplies 2,000 2,000 ‐ Driver Training Material 5,000 5,000 ‐ PPE Supplies 5,000 5,000 ‐
Sub‐total 20,000 20,000 ‐
5049900010 TRAINING SUPPLIESDMV/FMCSA/FTA Training Materials ‐ 10,000 10,000
Sub‐total ‐ 10,000 10,000
5049901000 EMERGENCY PREPARDNESS SUPPLIESEmergency equipment 60,000 100,000 40,000
Sub‐total 60,000 100,000 40,000 ‐
5060300100 REPAIR CLAIMS ‐ Repair Claims 200,000 200,000 ‐
Sub‐total 200,000 200,000 ‐
5090100000 MEMBERSHIPS & SUBSCRIPTIONS911 Mass Contact System 1,000 1,000 ‐ National Safety Council 1,000 1,000 ‐
Sub‐total 2,000 2,000 ‐
5090200000 TRAVEL MEETINGS/TRAININGTSI Training 5,000 7,500 2,500 Smith System Training 5,000 7,500 2,500
Sub‐total 10,000 15,000 5,000
Page 146 of 400
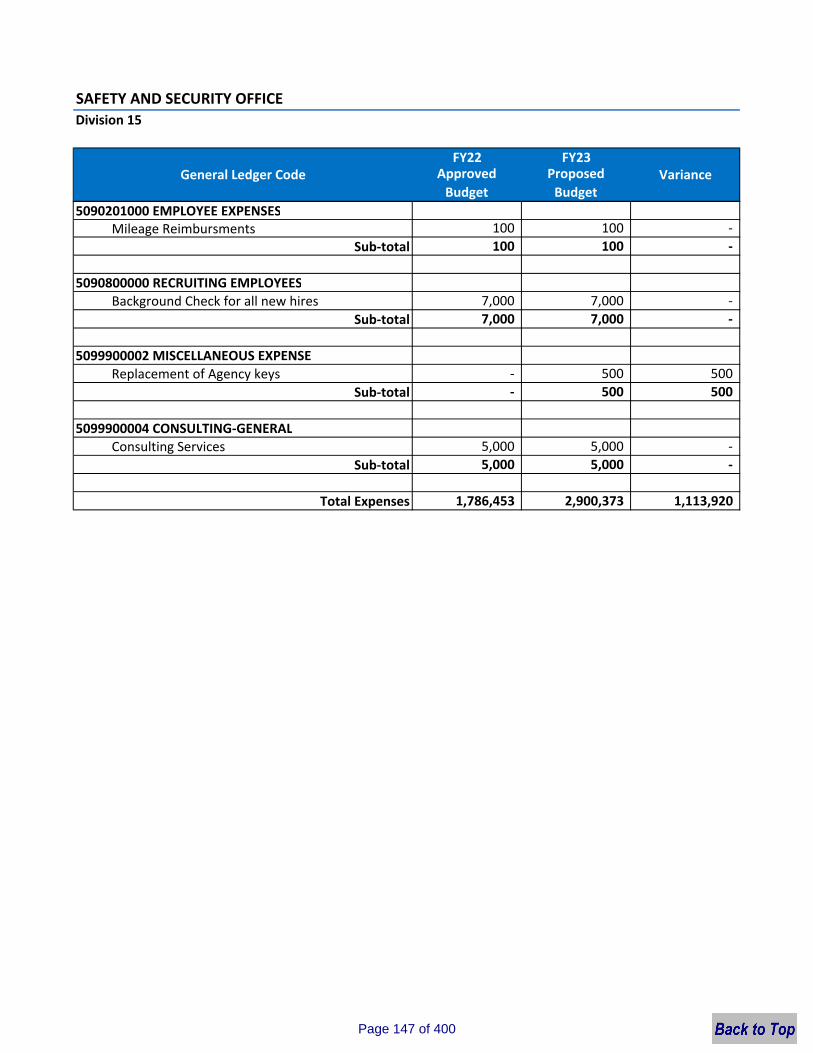
SAFETY AND SECURITY OFFICEDivision 15
FY22 FY23Approved Budget
Proposed Budget
General Ledger Code Variance
5090201000 EMPLOYEE EXPENSESMileage Reimbursments 100 100 ‐
Sub‐total 100 100 ‐
5090800000 RECRUITING EMPLOYEESBackground Check for all new hires 7,000 7,000 ‐
Sub‐total 7,000 7,000 ‐
5099900002 MISCELLANEOUS EXPENSEReplacement of Agency keys ‐ 500 500
Sub‐total ‐ 500 500
5099900004 CONSULTING‐GENERALConsulting Services 5,000 5,000 ‐
Sub‐total 5,000 5,000 ‐
Total Expenses 1,786,453 2,900,373 1,113,920
Page 147 of 400
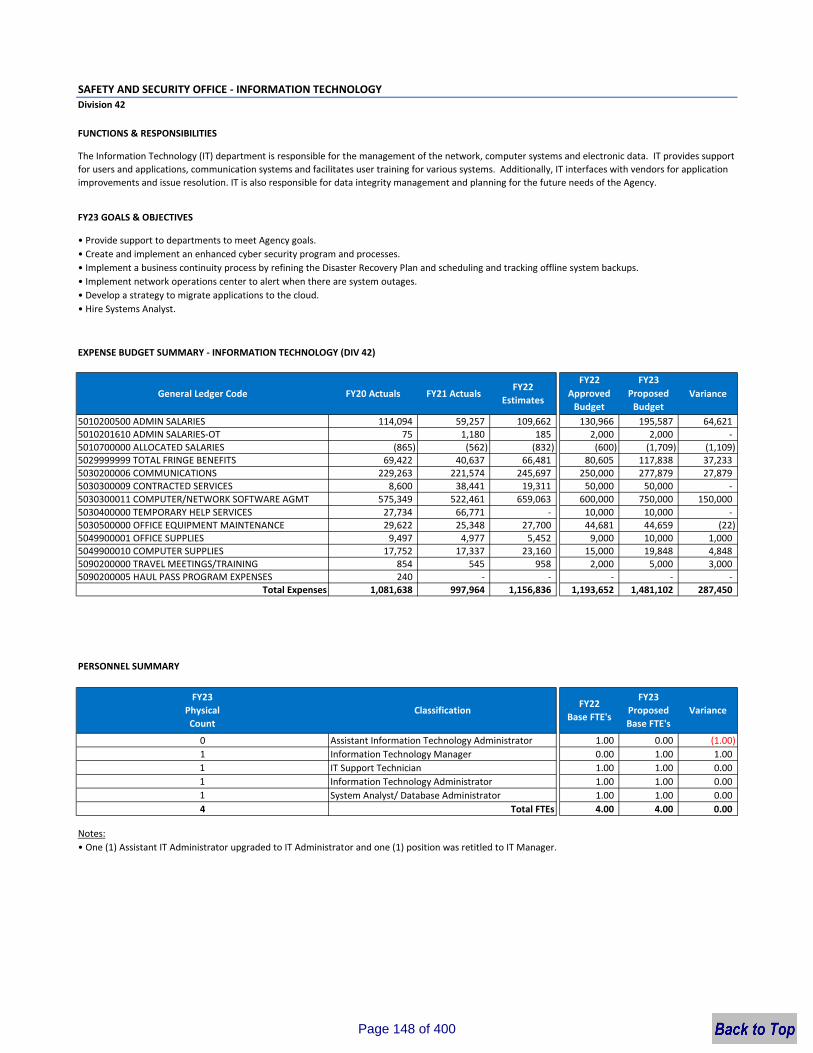
SAFETY AND SECURITY OFFICE ‐ INFORMATION TECHNOLOGYDivision 42
FUNCTIONS & RESPONSIBILITIES
FY23 GOALS & OBJECTIVES
• Provide support to departments to meet Agency goals.• Create and implement an enhanced cyber security program and processes.• Implement a business continuity process by refining the Disaster Recovery Plan and scheduling and tracking offline system backups.• Implement network operations center to alert when there are system outages.• Develop a strategy to migrate applications to the cloud. • Hire Systems Analyst.
EXPENSE BUDGET SUMMARY ‐ INFORMATION TECHNOLOGY (DIV 42)
FY22 FY23Approved Budget
Proposed Budget
5010200500 ADMIN SALARIES 114,094 59,257 109,662 130,966 195,587 64,621 5010201610 ADMIN SALARIES‐OT 75 1,180 185 2,000 2,000 ‐ 5010700000 ALLOCATED SALARIES (865) (562) (832) (600) (1,709) (1,109) 5029999999 TOTAL FRINGE BENEFITS 69,422 40,637 66,481 80,605 117,838 37,233 5030200006 COMMUNICATIONS 229,263 221,574 245,697 250,000 277,879 27,879 5030300009 CONTRACTED SERVICES 8,600 38,441 19,311 50,000 50,000 ‐ 5030300011 COMPUTER/NETWORK SOFTWARE AGMT 575,349 522,461 659,063 600,000 750,000 150,000 5030400000 TEMPORARY HELP SERVICES 27,734 66,771 ‐ 10,000 10,000 ‐ 5030500000 OFFICE EQUIPMENT MAINTENANCE 29,622 25,348 27,700 44,681 44,659 (22) 5049900001 OFFICE SUPPLIES 9,497 4,977 5,452 9,000 10,000 1,000 5049900010 COMPUTER SUPPLIES 17,752 17,337 23,160 15,000 19,848 4,848 5090200000 TRAVEL MEETINGS/TRAINING 854 545 958 2,000 5,000 3,000 5090200005 HAUL PASS PROGRAM EXPENSES 240 ‐ ‐ ‐ ‐ ‐
Total Expenses 1,081,638 997,964 1,156,836 1,193,652 1,481,102 287,450
0 1.00 0.00 (1.00)1 Information Technology Manager 0.00 1.00 1.001 1.00 1.00 0.001 1.00 1.00 0.001 1.00 1.00 0.004 4.00 4.00 0.00
The Information Technology (IT) department is responsible for the management of the network, computer systems and electronic data. IT provides support for users and applications, communication systems and facilitates user training for various systems. Additionally, IT interfaces with vendors for application improvements and issue resolution. IT is also responsible for data integrity management and planning for the future needs of the Agency.
Assistant Information Technology Administrator
FY22Base FTE's
Variance
PERSONNEL SUMMARY
General Ledger Code FY20 Actuals FY21 ActualsFY22
Estimates
FY23Physical Count
Notes:
System Analyst/ Database Administrator
VarianceFY23
Proposed Base FTE's
Classification
Total FTEs
Information Technology AdministratorIT Support Technician
• One (1) Assistant IT Administrator upgraded to IT Administrator and one (1) position was retitled to IT Manager.
Page 148 of 400
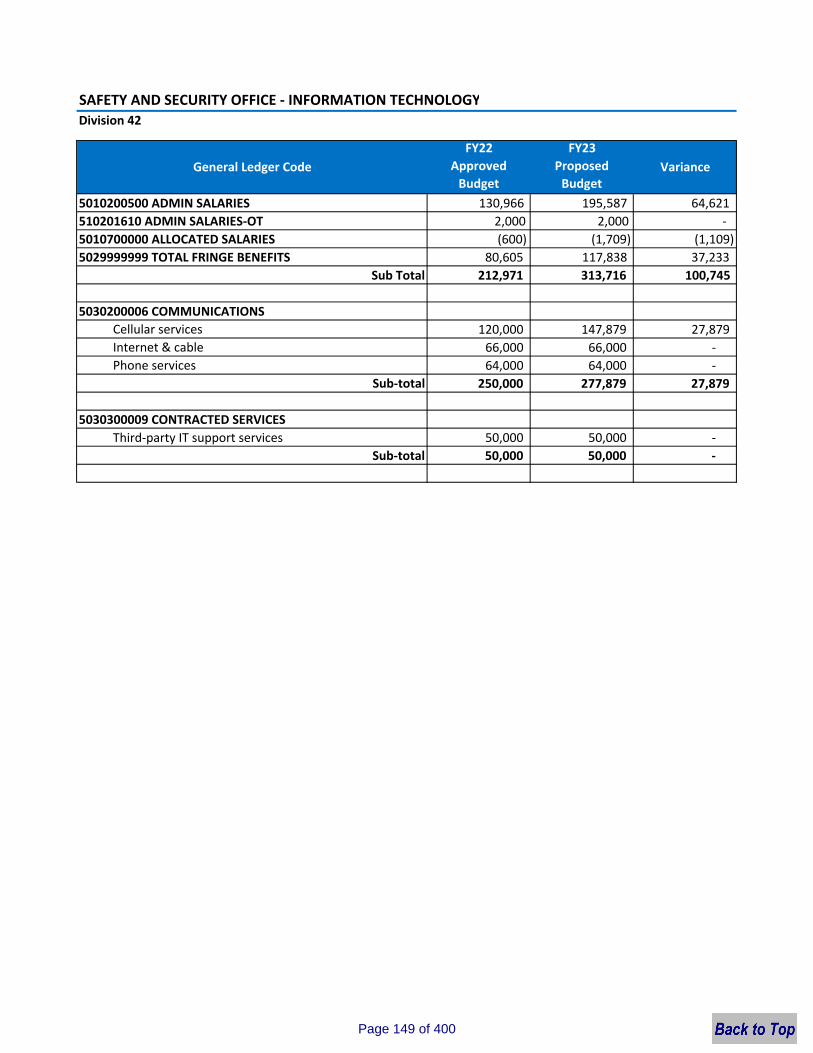
SAFETY AND SECURITY OFFICE ‐ INFORMATION TECHNOLOGYDivision 42
FY22 FY23Approved Budget
Proposed Budget
5010200500 ADMIN SALARIES 130,966 195,587 64,621 510201610 ADMIN SALARIES‐OT 2,000 2,000 ‐ 5010700000 ALLOCATED SALARIES (600) (1,709) (1,109)5029999999 TOTAL FRINGE BENEFITS 80,605 117,838 37,233
Sub Total 212,971 313,716 100,745
5030200006 COMMUNICATIONSCellular services 120,000 147,879 27,879 Internet & cable 66,000 66,000 ‐ Phone services 64,000 64,000 ‐
Sub‐total 250,000 277,879 27,879
5030300009 CONTRACTED SERVICESThird‐party IT support services 50,000 50,000 ‐
Sub‐total 50,000 50,000 ‐
General Ledger Code Variance
Page 149 of 400
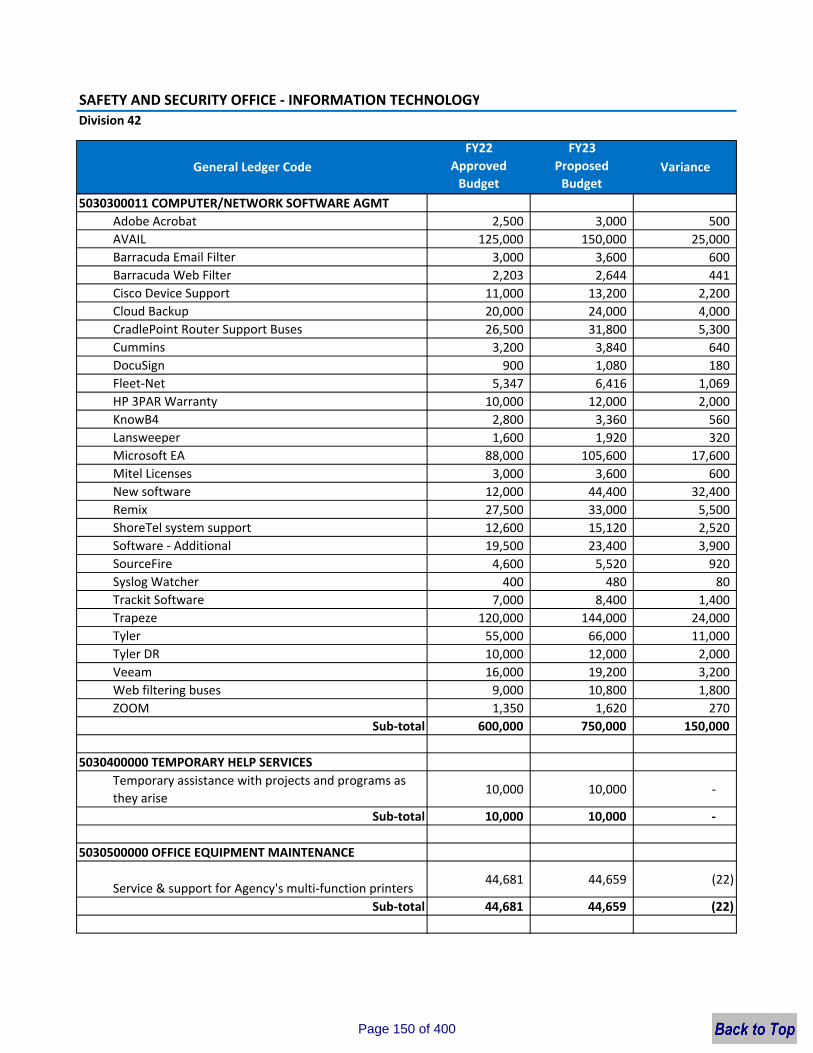
SAFETY AND SECURITY OFFICE ‐ INFORMATION TECHNOLOGYDivision 42
FY22 FY23Approved Budget
Proposed Budget
General Ledger Code Variance
5030300011 COMPUTER/NETWORK SOFTWARE AGMTAdobe Acrobat 2,500 3,000 500 AVAIL 125,000 150,000 25,000 Barracuda Email Filter 3,000 3,600 600 Barracuda Web Filter 2,203 2,644 441 Cisco Device Support 11,000 13,200 2,200 Cloud Backup 20,000 24,000 4,000 CradlePoint Router Support Buses 26,500 31,800 5,300 Cummins 3,200 3,840 640 DocuSign 900 1,080 180 Fleet‐Net 5,347 6,416 1,069 HP 3PAR Warranty 10,000 12,000 2,000 KnowB4 2,800 3,360 560 Lansweeper 1,600 1,920 320 Microsoft EA 88,000 105,600 17,600 Mitel Licenses 3,000 3,600 600 New software 12,000 44,400 32,400 Remix 27,500 33,000 5,500 ShoreTel system support 12,600 15,120 2,520 Software ‐ Additional 19,500 23,400 3,900 SourceFire 4,600 5,520 920 Syslog Watcher 400 480 80 Trackit Software 7,000 8,400 1,400 Trapeze 120,000 144,000 24,000 Tyler 55,000 66,000 11,000 Tyler DR 10,000 12,000 2,000 Veeam 16,000 19,200 3,200 Web filtering buses 9,000 10,800 1,800 ZOOM 1,350 1,620 270
Sub‐total 600,000 750,000 150,000
5030400000 TEMPORARY HELP SERVICESTemporary assistance with projects and programs as they arise
10,000 10,000 ‐
Sub‐total 10,000 10,000 ‐
5030500000 OFFICE EQUIPMENT MAINTENANCE
Service & support for Agency's multi‐function printers44,681 44,659 (22)
Sub‐total 44,681 44,659 (22)
Page 150 of 400
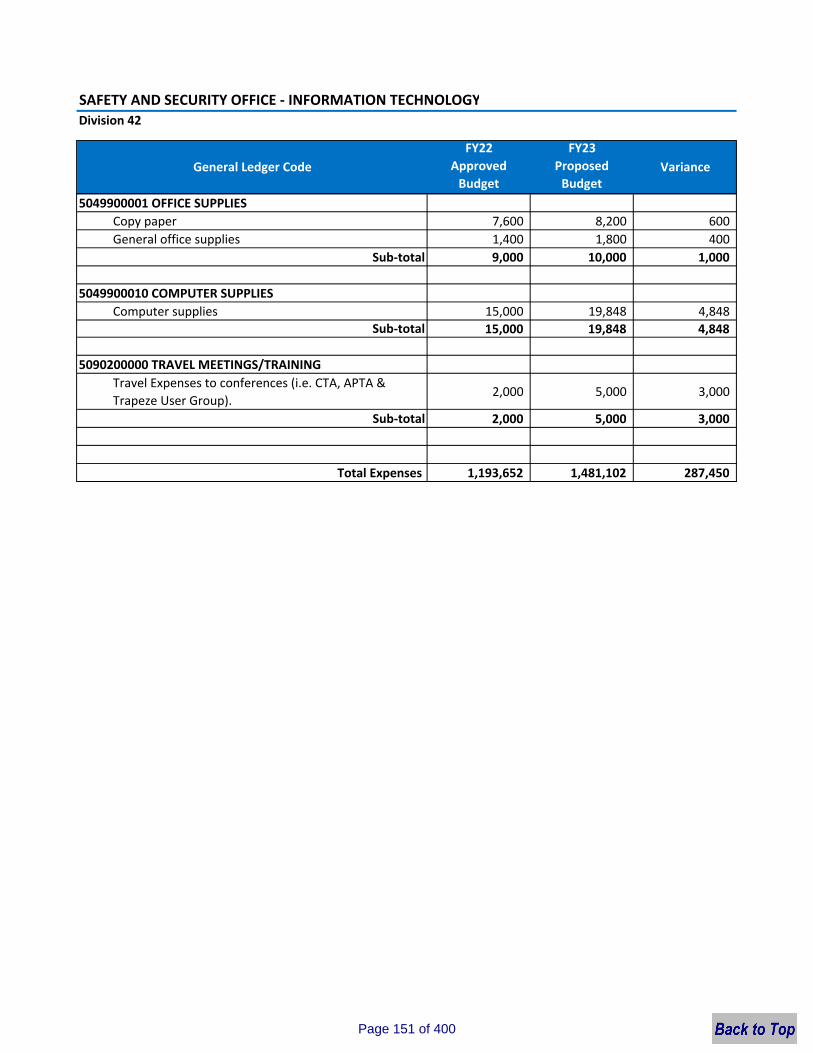
SAFETY AND SECURITY OFFICE ‐ INFORMATION TECHNOLOGYDivision 42
FY22 FY23Approved Budget
Proposed Budget
General Ledger Code Variance
5049900001 OFFICE SUPPLIESCopy paper 7,600 8,200 600 General office supplies 1,400 1,800 400
Sub‐total 9,000 10,000 1,000
5049900010 COMPUTER SUPPLIESComputer supplies 15,000 19,848 4,848
Sub‐total 15,000 19,848 4,848
5090200000 TRAVEL MEETINGS/TRAININGTravel Expenses to conferences (i.e. CTA, APTA & Trapeze User Group).
2,000 5,000 3,000
Sub‐total 2,000 5,000 3,000
Total Expenses 1,193,652 1,481,102 287,450
Page 151 of 400
FINANCE OFFICE
Page 152 of 400
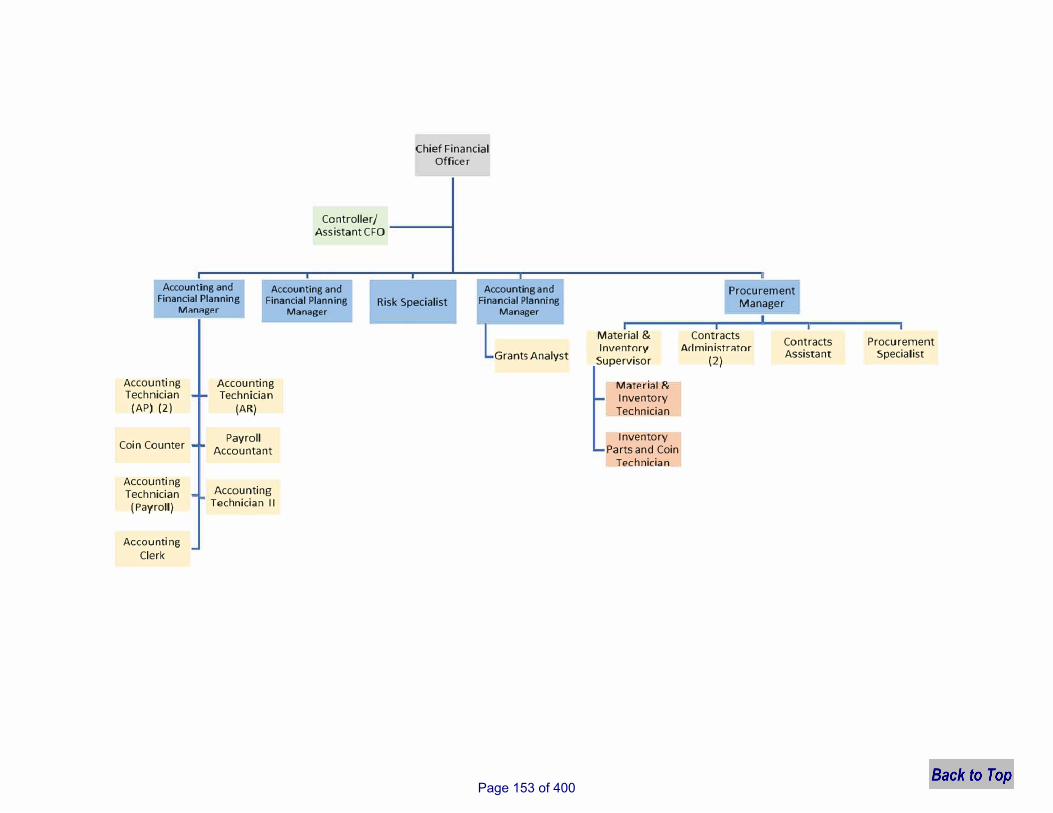
Controller/ Assistant CFO
Chief Financial Officer
Accounting and Financial Planning
ManagP.r
Accounting and Financial Planning
Manager Risk Specialist
Accounting and i nancial Planning
Manager
Accounting Technician
(AP) (2)
Coin Counter
Accounting Technician
(Payroll)
Accounting Clerk
Accounting Technician
(AR)
Payroll Accountant
Accounting Technician II
Grants Analyst
!Material & I nVfrnto ry
Supervisor
Mr1tP.rir1I & Inventory Technician
Inventory Parts and Coin
Technician
Procurement Manager
Contracts Aclministr;itor
(2)
Contracts Assistant
Procurement Specialist
Page 153 of 400
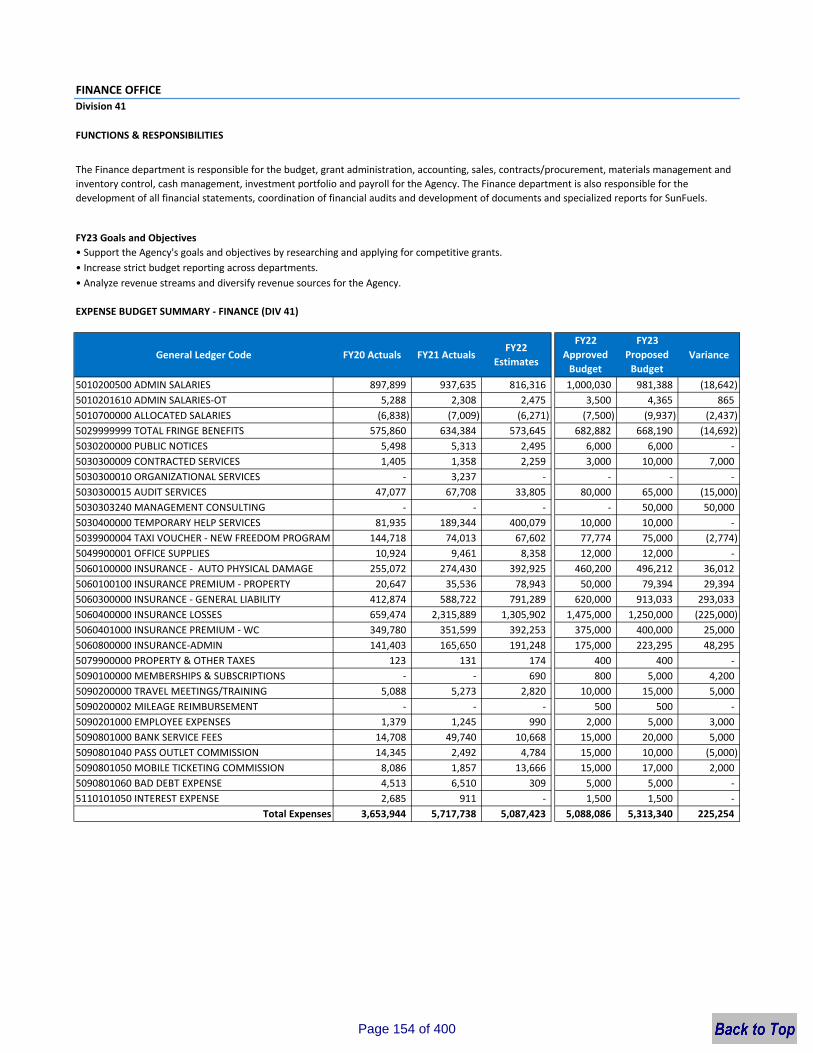
FINANCE OFFICE Division 41
FUNCTIONS & RESPONSIBILITIES
FY23 Goals and Objectives• Support the Agency's goals and objectives by researching and applying for competitive grants.• Increase strict budget reporting across departments.• Analyze revenue streams and diversify revenue sources for the Agency.
EXPENSE BUDGET SUMMARY ‐ FINANCE (DIV 41)
FY22 FY23Approved Budget
Proposed Budget
5010200500 ADMIN SALARIES 897,899 937,635 816,316 1,000,030 981,388 (18,642) 5010201610 ADMIN SALARIES‐OT 5,288 2,308 2,475 3,500 4,365 865 5010700000 ALLOCATED SALARIES (6,838) (7,009) (6,271) (7,500) (9,937) (2,437) 5029999999 TOTAL FRINGE BENEFITS 575,860 634,384 573,645 682,882 668,190 (14,692) 5030200000 PUBLIC NOTICES 5,498 5,313 2,495 6,000 6,000 ‐5030300009 CONTRACTED SERVICES 1,405 1,358 2,259 3,000 10,000 7,000 5030300010 ORGANIZATIONAL SERVICES ‐ 3,237 ‐ ‐ ‐ ‐5030300015 AUDIT SERVICES 47,077 67,708 33,805 80,000 65,000 (15,000) 5030303240 MANAGEMENT CONSULTING ‐ ‐ ‐ ‐ 50,000 50,000 5030400000 TEMPORARY HELP SERVICES 81,935 189,344 400,079 10,000 10,000 ‐5039900004 TAXI VOUCHER ‐ NEW FREEDOM PROGRAM 144,718 74,013 67,602 77,774 75,000 (2,774) 5049900001 OFFICE SUPPLIES 10,924 9,461 8,358 12,000 12,000 ‐5060100000 INSURANCE ‐ AUTO PHYSICAL DAMAGE 255,072 274,430 392,925 460,200 496,212 36,012 5060100100 INSURANCE PREMIUM ‐ PROPERTY 20,647 35,536 78,943 50,000 79,394 29,394 5060300000 INSURANCE ‐ GENERAL LIABILITY 412,874 588,722 791,289 620,000 913,033 293,033 5060400000 INSURANCE LOSSES 659,474 2,315,889 1,305,902 1,475,000 1,250,000 (225,000) 5060401000 INSURANCE PREMIUM ‐ WC 349,780 351,599 392,253 375,000 400,000 25,000 5060800000 INSURANCE‐ADMIN 141,403 165,650 191,248 175,000 223,295 48,295 5079900000 PROPERTY & OTHER TAXES 123 131 174 400 400 ‐5090100000 MEMBERSHIPS & SUBSCRIPTIONS ‐ ‐ 690 800 5,000 4,200 5090200000 TRAVEL MEETINGS/TRAINING 5,088 5,273 2,820 10,000 15,000 5,000 5090200002 MILEAGE REIMBURSEMENT ‐ ‐ ‐ 500 500 ‐5090201000 EMPLOYEE EXPENSES 1,379 1,245 990 2,000 5,000 3,000 5090801000 BANK SERVICE FEES 14,708 49,740 10,668 15,000 20,000 5,000 5090801040 PASS OUTLET COMMISSION 14,345 2,492 4,784 15,000 10,000 (5,000) 5090801050 MOBILE TICKETING COMMISSION 8,086 1,857 13,666 15,000 17,000 2,000 5090801060 BAD DEBT EXPENSE 4,513 6,510 309 5,000 5,000 ‐5110101050 INTEREST EXPENSE 2,685 911 ‐ 1,500 1,500 ‐
Total Expenses 3,653,944 5,717,738 5,087,423 5,088,086 5,313,340 225,254
The Finance department is responsible for the budget, grant administration, accounting, sales, contracts/procurement, materials management and inventory control, cash management, investment portfolio and payroll for the Agency. The Finance department is also responsible for the development of all financial statements, coordination of financial audits and development of documents and specialized reports for SunFuels.
FY20 Actuals FY21 ActualsFY22
EstimatesVarianceGeneral Ledger Code
Page 154 of 400
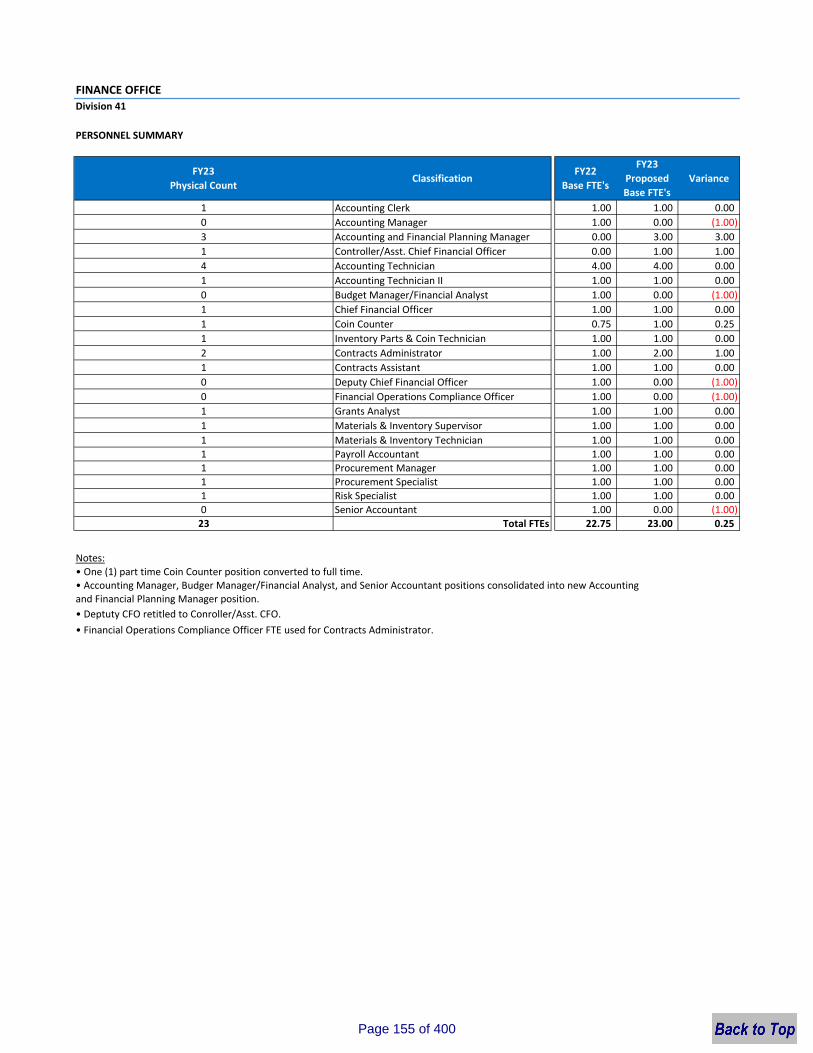
FINANCE OFFICE Division 41
1 1.00 1.00 0.000 1.00 0.00 (1.00)3 Accounting and Financial Planning Manager 0.00 3.00 3.001 Controller/Asst. Chief Financial Officer 0.00 1.00 1.004 4.00 4.00 0.001 1.00 1.00 0.000 1.00 0.00 (1.00)1 1.00 1.00 0.001 0.75 1.00 0.251 Inventory Parts & Coin Technician 1.00 1.00 0.002 1.00 2.00 1.001 1.00 1.00 0.000 1.00 0.00 (1.00)0 1.00 0.00 (1.00)1 1.00 1.00 0.001 1.00 1.00 0.001 1.00 1.00 0.001 1.00 1.00 0.001 1.00 1.00 0.001 1.00 1.00 0.001 1.00 1.00 0.000 1.00 0.00 (1.00)23 22.75 23.00 0.25
Notes:
• Financial Operations Compliance Officer FTE used for Contracts Administrator.
VarianceFY23
Proposed Base FTE's
Senior Accountant
Grants Analyst
Contracts Assistant
Classification
Budget Manager/Financial AnalystChief Financial Officer
FY22Base FTE's
Materials & Inventory SupervisorMaterials & Inventory Technician
Accounting Technician
Procurement SpecialistProcurement Manager
Risk Specialist
• Deptuty CFO retitled to Conroller/Asst. CFO.
Total FTEs
• One (1) part time Coin Counter position converted to full time. • Accounting Manager, Budger Manager/Financial Analyst, and Senior Accountant positions consolidated into new Accountingand Financial Planning Manager position.
PERSONNEL SUMMARY
FY23Physical Count
Payroll Accountant
Financial Operations Compliance OfficerDeputy Chief Financial Officer
Contracts Administrator
Accounting ClerkAccounting Manager
Coin Counter
Accounting Technician II
Page 155 of 400

FINANCE OFFICE DETAILDivision 41
FY22 FY23Approved Budget
Proposed Budget
5010200500 ADMIN SALARIES 1,000,030 981,388 (18,642) 5010201610 ADMIN SALARIES‐OT 3,500 4,365 865 5010700000 ALLOCATED SALARIES (7,500) (9,937) (2,437) 5029999999 TOTAL FRINGE BENEFITS 682,882 668,190 (14,692)
Sub‐total 1,678,912 1,644,006 (34,906)
5030200000 PUBLIC NOTICESAdvertisements for procurement solicitations 6,000 6,000 ‐
Sub‐total 6,000 6,000 ‐
5030300009 CONTRACTED SERVICESMaintenance of coin room equipment 3,000 10,000 7,000
Sub‐total 3,000 10,000 7,000
5030300015 AUDIT SERVICESFinancial Statement & Single Audit 80,000 65,000 (15,000)
Sub‐total 80,000 65,000 (15,000)
5030303240 MANAGEMENT CONSULTINGFinancial consultant expenses ‐ 50,000 50,000
Sub‐total ‐ 50,000 50,000
5030400000 TEMPORARY HELP SERVICESFinancial Statement & Single Audit 10,000 10,000 ‐
Sub‐total 10,000 10,000 ‐
5039900004 TAXI VOUCHER ‐ NEW FREEDOM PROGRAMThese funds pay taxi companies for the full cost of taxi trips provided under the taxi voucher program.
77,774 75,000 (2,774)
Sub‐total 77,774 75,000 (2,774)
5049900001 OFFICE SUPPLIESOffice supplies 12,000 12,000 ‐
Sub‐total 12,000 12,000 ‐
5060100000 INSURANCE ‐ AUTO PHYSICAL DAMAGEInsurance costs related to vehicle coverage 460,200 496,212 36,012
Sub‐total 460,200 496,212 36,012
5060100100 INSURANCE PREMIUM ‐ PROPERTYInsurance costs related to property coverage 50,000 79,394 29,394
Sub‐total 50,000 79,394 29,394
General Ledger Code Variance
Page 156 of 400
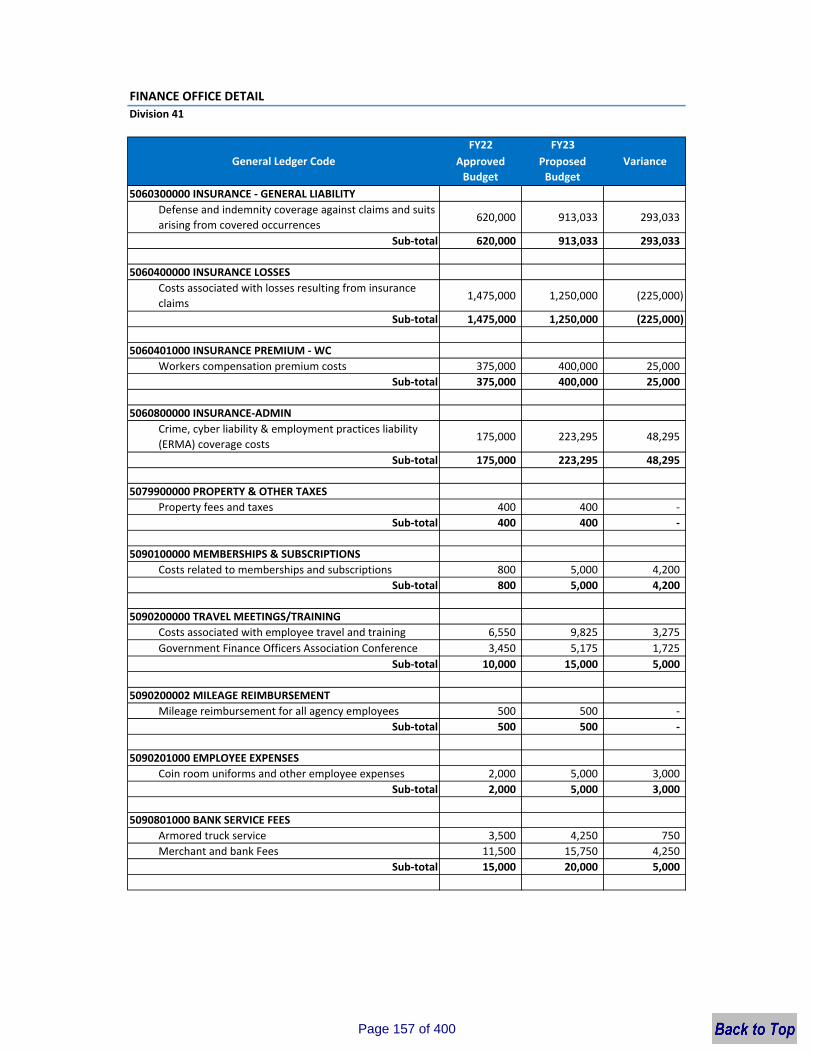
FINANCE OFFICE DETAILDivision 41
FY22 FY23Approved Budget
Proposed Budget
General Ledger Code Variance
5060300000 INSURANCE ‐ GENERAL LIABILITYDefense and indemnity coverage against claims and suits arising from covered occurrences
620,000 913,033 293,033
Sub‐total 620,000 913,033 293,033
5060400000 INSURANCE LOSSESCosts associated with losses resulting from insurance claims
1,475,000 1,250,000 (225,000)
Sub‐total 1,475,000 1,250,000 (225,000)
5060401000 INSURANCE PREMIUM ‐ WCWorkers compensation premium costs 375,000 400,000 25,000
Sub‐total 375,000 400,000 25,000
5060800000 INSURANCE‐ADMINCrime, cyber liability & employment practices liability (ERMA) coverage costs
175,000 223,295 48,295
Sub‐total 175,000 223,295 48,295
5079900000 PROPERTY & OTHER TAXESProperty fees and taxes 400 400 ‐
Sub‐total 400 400 ‐
5090100000 MEMBERSHIPS & SUBSCRIPTIONSCosts related to memberships and subscriptions 800 5,000 4,200
Sub‐total 800 5,000 4,200
5090200000 TRAVEL MEETINGS/TRAININGCosts associated with employee travel and training 6,550 9,825 3,275 Government Finance Officers Association Conference 3,450 5,175 1,725
Sub‐total 10,000 15,000 5,000
5090200002 MILEAGE REIMBURSEMENTMileage reimbursement for all agency employees 500 500 ‐
Sub‐total 500 500 ‐
5090201000 EMPLOYEE EXPENSESCoin room uniforms and other employee expenses 2,000 5,000 3,000
Sub‐total 2,000 5,000 3,000
5090801000 BANK SERVICE FEESArmored truck service 3,500 4,250 750 Merchant and bank Fees 11,500 15,750 4,250
Sub‐total 15,000 20,000 5,000
Page 157 of 400
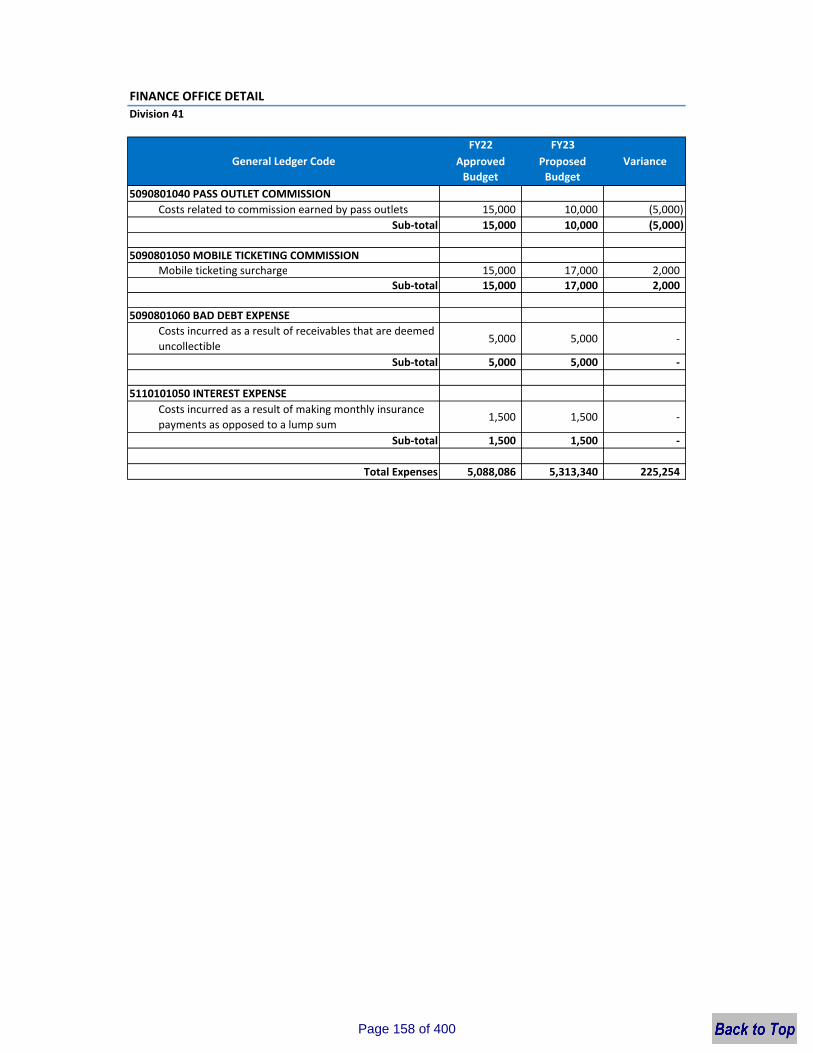
FINANCE OFFICE DETAILDivision 41
FY22 FY23Approved Budget
Proposed Budget
General Ledger Code Variance
5090801040 PASS OUTLET COMMISSIONCosts related to commission earned by pass outlets 15,000 10,000 (5,000)
Sub‐total 15,000 10,000 (5,000)
5090801050 MOBILE TICKETING COMMISSIONMobile ticketing surcharge 15,000 17,000 2,000
Sub‐total 15,000 17,000 2,000
5090801060 BAD DEBT EXPENSECosts incurred as a result of receivables that are deemed uncollectible
5,000 5,000 ‐
Sub‐total 5,000 5,000 ‐
5110101050 INTEREST EXPENSECosts incurred as a result of making monthly insurance payments as opposed to a lump sum
1,500 1,500 ‐
Sub‐total 1,500 1,500 ‐
Total Expenses 5,088,086 5,313,340 225,254
Page 158 of 400
TRANSPORTATION OFFICE
Page 159 of 400
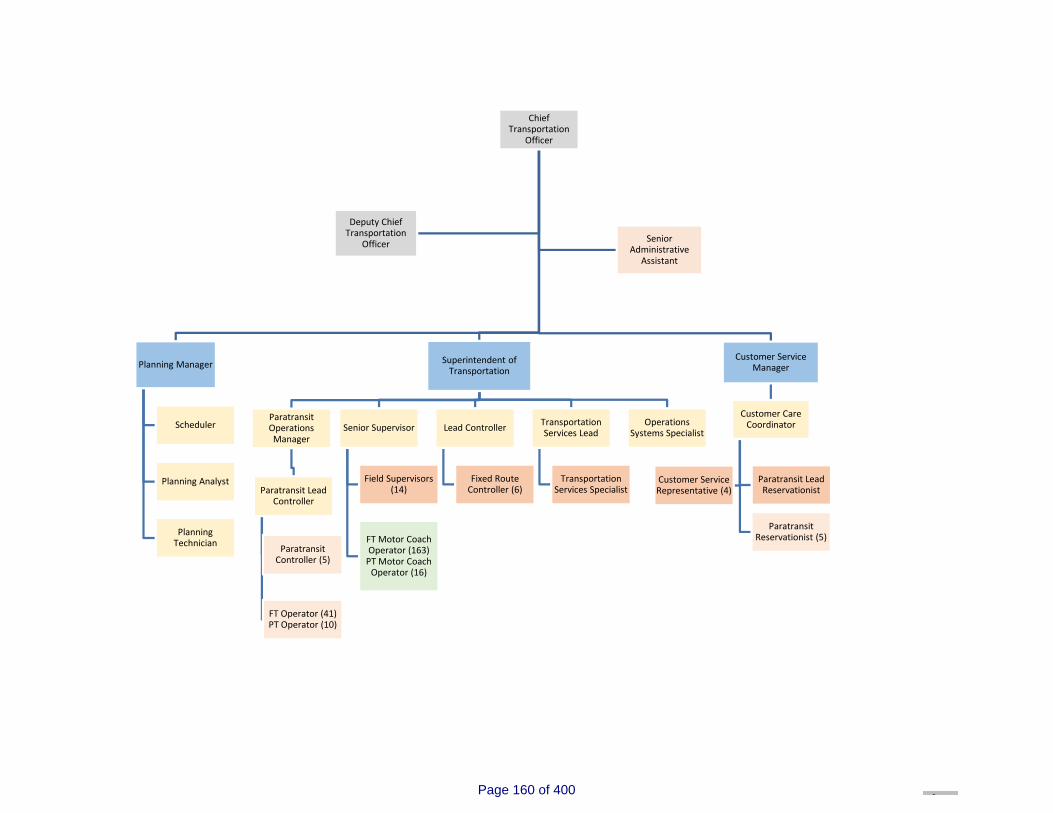
Chief Transportation
Officer
Planning Manager
Scheduler
Planning Analyst
PlanningTechnician
Superintendent of Transportation
Paratransit Operations Manager
Paratransit Lead Controller
Paratransit Controller (5)
FT Operator (41) PT Operator (10)
Senior Supervisor
Field Supervisors (14)
FT Motor Coach Operator (163)PT Motor Coach Operator (16)
Lead Controller
Fixed Route Controller (6)
Transportation Services Lead
Transportation Services Specialist
Operations Systems Specialist
Customer Service Manager
Customer Care Coordinator
Paratransit Lead Reservationist
Paratransit Reservationist (5)
Customer Service Representative (4)
Deputy Chief Transportation
Officer Senior Administrative
Assistant
Page 160 of 400
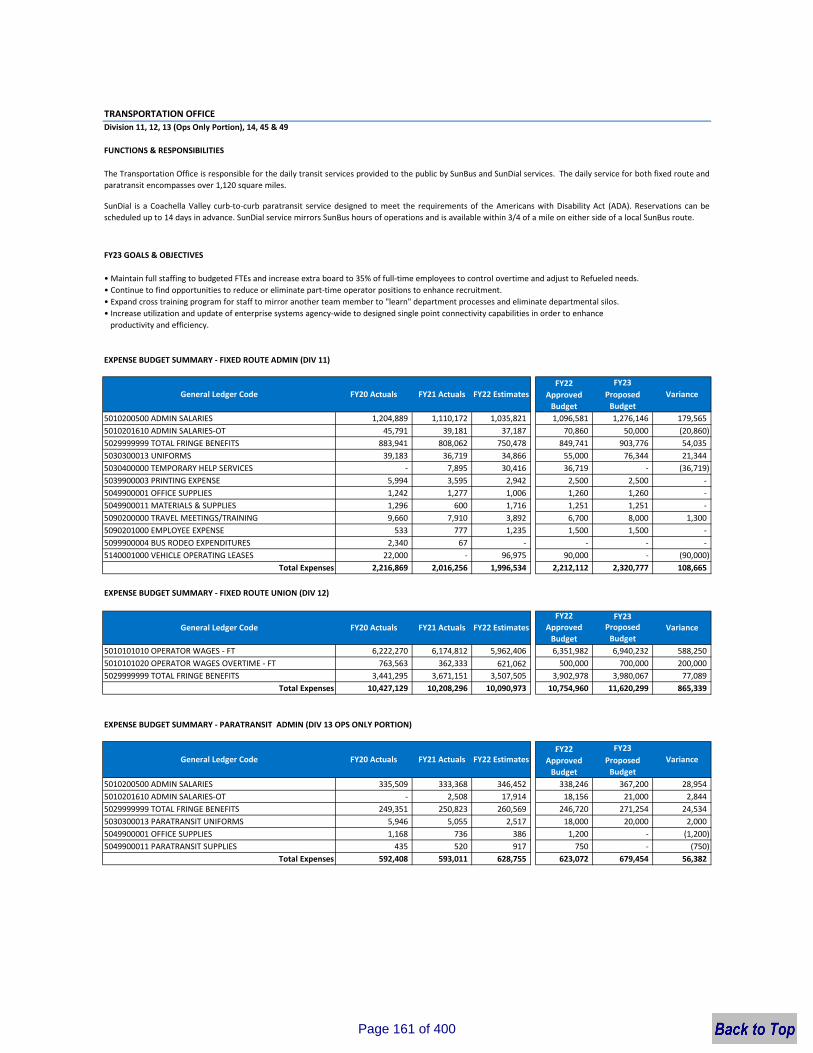
TRANSPORTATION OFFICEDivision 11, 12, 13 (Ops Only Portion), 14, 45 & 49
FUNCTIONS & RESPONSIBILITIES
FY23 GOALS & OBJECTIVES
• Maintain full staffing to budgeted FTEs and increase extra board to 35% of full‐time employees to control overtime and adjust to Refueled needs. • Continue to find opportunities to reduce or eliminate part‐time operator positions to enhance recruitment.• Expand cross training program for staff to mirror another team member to "learn" department processes and eliminate departmental silos.• Increase utilization and update of enterprise systems agency‐wide to designed single point connectivity capabilities in order to enhanceproductivity and efficiency.
EXPENSE BUDGET SUMMARY ‐ FIXED ROUTE ADMIN (DIV 11)
FY23Proposed Budget
5010200500 ADMIN SALARIES 1,204,889 1,110,172 1,035,821 1,096,581 1,276,146 179,565 5010201610 ADMIN SALARIES‐OT 45,791 39,181 37,187 70,860 50,000 (20,860) 5029999999 TOTAL FRINGE BENEFITS 883,941 808,062 750,478 849,741 903,776 54,035 5030300013 UNIFORMS 39,183 36,719 34,866 55,000 76,344 21,344 5030400000 TEMPORARY HELP SERVICES ‐ 7,895 30,416 36,719 ‐ (36,719) 5039900003 PRINTING EXPENSE 5,994 3,595 2,942 2,500 2,500 ‐5049900001 OFFICE SUPPLIES 1,242 1,277 1,006 1,260 1,260 ‐5049900011 MATERIALS & SUPPLIES 1,296 600 1,716 1,251 1,251 ‐5090200000 TRAVEL MEETINGS/TRAINING 9,660 7,910 3,892 6,700 8,000 1,300 5090201000 EMPLOYEE EXPENSE 533 777 1,235 1,500 1,500 ‐5099900004 BUS RODEO EXPENDITURES 2,340 67 ‐ ‐ ‐ ‐5140001000 VEHICLE OPERATING LEASES 22,000 ‐ 96,975 90,000 ‐ (90,000)
Total Expenses 2,216,869 2,016,256 1,996,534 2,212,112 2,320,777 108,665
EXPENSE BUDGET SUMMARY ‐ FIXED ROUTE UNION (DIV 12)
FY23Proposed Budget
5010101010 OPERATOR WAGES ‐ FT 6,222,270 6,174,812 5,962,406 6,351,982 6,940,232 588,250 5010101020 OPERATOR WAGES OVERTIME ‐ FT 763,563 362,333 621,062 500,000 700,000 200,000 5029999999 TOTAL FRINGE BENEFITS 3,441,295 3,671,151 3,507,505 3,902,978 3,980,067 77,089
Total Expenses 10,427,129 10,208,296 10,090,973 10,754,960 11,620,299 865,339
EXPENSE BUDGET SUMMARY ‐ PARATRANSIT ADMIN (DIV 13 OPS ONLY PORTION)
FY23Proposed Budget
5010200500 ADMIN SALARIES 335,509 333,368 346,452 338,246 367,200 28,954 5010201610 ADMIN SALARIES‐OT ‐ 2,508 17,914 18,156 21,000 2,844 5029999999 TOTAL FRINGE BENEFITS 249,351 250,823 260,569 246,720 271,254 24,534 5030300013 PARATRANSIT UNIFORMS 5,946 5,055 2,517 18,000 20,000 2,000 5049900001 OFFICE SUPPLIES 1,168 736 386 1,200 ‐ (1,200) 5049900011 PARATRANSIT SUPPLIES 435 520 917 750 ‐ (750)
Total Expenses 592,408 593,011 628,755 623,072 679,454 56,382
FY20 Actuals FY21 Actuals FY22 Estimates VarianceGeneral Ledger Code
The Transportation Office is responsible for the daily transit services provided to the public by SunBus and SunDial services. The daily service for both fixed route andparatransit encompasses over 1,120 square miles.
SunDial is a Coachella Valley curb‐to‐curb paratransit service designed to meet the requirements of the Americans with Disability Act (ADA). Reservations can bescheduled up to 14 days in advance. SunDial service mirrors SunBus hours of operations and is available within 3/4 of a mile on either side of a local SunBus route.
General Ledger Code FY20 Actuals FY21 Actuals FY22 EstimatesFY22
Approved Budget
Variance
VarianceGeneral Ledger Code FY20 Actuals FY21 Actuals FY22 EstimatesFY22
Approved Budget
FY22 Approved Budget
Page 161 of 400
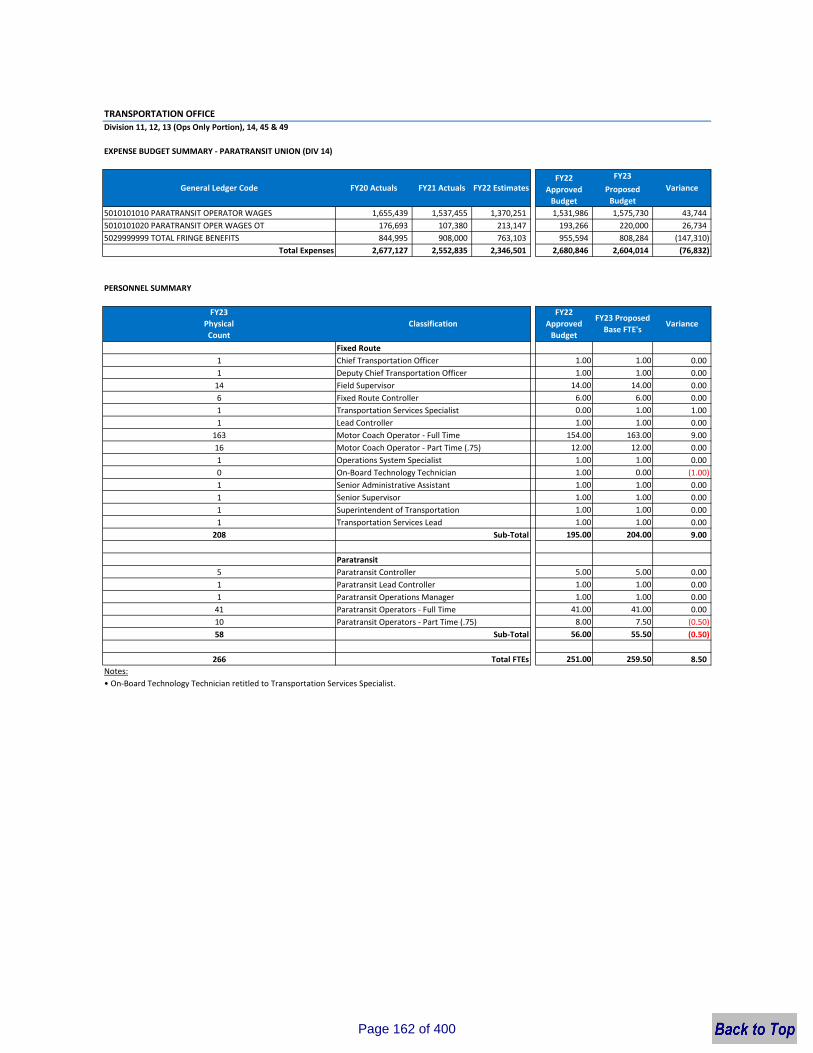
TRANSPORTATION OFFICEDivision 11, 12, 13 (Ops Only Portion), 14, 45 & 49
EXPENSE BUDGET SUMMARY ‐ PARATRANSIT UNION (DIV 14)
FY23Proposed Budget
5010101010 PARATRANSIT OPERATOR WAGES 1,655,439 1,537,455 1,370,251 1,531,986 1,575,730 43,744 5010101020 PARATRANSIT OPER WAGES OT 176,693 107,380 213,147 193,266 220,000 26,734 5029999999 TOTAL FRINGE BENEFITS 844,995 908,000 763,103 955,594 808,284 (147,310)
Total Expenses 2,677,127 2,552,835 2,346,501 2,680,846 2,604,014 (76,832)
1 Chief Transportation Officer 1.00 1.00 0.001 Deputy Chief Transportation Officer 1.00 1.00 0.0014 14.00 14.00 0.006 6.00 6.00 0.001 0.00 1.00 1.001 1.00 1.00 0.00
163 154.00 163.00 9.0016 12.00 12.00 0.001 1.00 1.00 0.000 1.00 0.00 (1.00)1 1.00 1.00 0.001 1.00 1.00 0.001 1.00 1.00 0.001 1.00 1.00 0.00
208 195.00 204.00 9.00
5 5.00 5.00 0.001 1.00 1.00 0.001 1.00 1.00 0.0041 41.00 41.00 0.0010 8.00 7.50 (0.50)58 56.00 55.50 (0.50)
266 251.00 259.50 8.50
FY22 Approved Budget
General Ledger Code FY20 Actuals
Field SupervisorFixed Route Controller
Notes:
PERSONNEL SUMMARY
Lead Controller
ClassificationFY23
Physical Count
Paratransit Operators ‐ Part Time (.75)
Operations System Specialist
Senior Administrative AssistantOn‐Board Technology Technician
Motor Coach Operator ‐ Full Time
Paratransit
Motor Coach Operator ‐ Part Time (.75)
Sub‐Total
Senior SupervisorSuperintendent of Transportation
FY22 Estimates
Transportation Services Specialist
FY21 Actuals
Fixed Route
Transportation Services Lead
Variance
VarianceFY23 Proposed Base FTE's
• On‐Board Technology Technician retitled to Transportation Services Specialist.
Sub‐Total
Total FTEs
Paratransit ControllerParatransit Lead ControllerParatransit Operations ManagerParatransit Operators ‐ Full Time
FY22 Approved Budget
Page 162 of 400
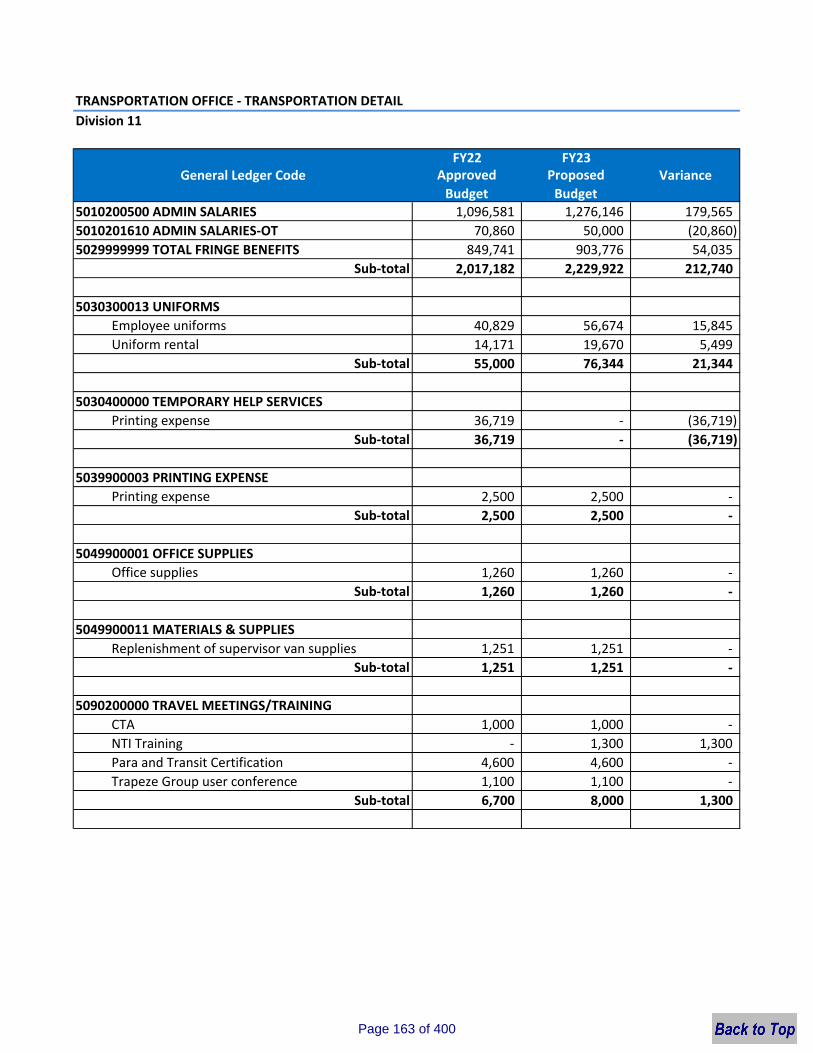
TRANSPORTATION OFFICE ‐ TRANSPORTATION DETAILDivision 11
FY22 FY23Approved Budget
Proposed Budget
5010200500 ADMIN SALARIES 1,096,581 1,276,146 179,565 5010201610 ADMIN SALARIES‐OT 70,860 50,000 (20,860) 5029999999 TOTAL FRINGE BENEFITS 849,741 903,776 54,035
Sub‐total 2,017,182 2,229,922 212,740
5030300013 UNIFORMSEmployee uniforms 40,829 56,674 15,845 Uniform rental 14,171 19,670 5,499
Sub‐total 55,000 76,344 21,344
5030400000 TEMPORARY HELP SERVICESPrinting expense 36,719 ‐ (36,719)
Sub‐total 36,719 ‐ (36,719)
5039900003 PRINTING EXPENSEPrinting expense 2,500 2,500 ‐
Sub‐total 2,500 2,500 ‐
5049900001 OFFICE SUPPLIESOffice supplies 1,260 1,260 ‐
Sub‐total 1,260 1,260 ‐
5049900011 MATERIALS & SUPPLIESReplenishment of supervisor van supplies 1,251 1,251 ‐
Sub‐total 1,251 1,251 ‐
5090200000 TRAVEL MEETINGS/TRAININGCTA 1,000 1,000 ‐ NTI Training ‐ 1,300 1,300 Para and Transit Certification 4,600 4,600 ‐ Trapeze Group user conference 1,100 1,100 ‐
Sub‐total 6,700 8,000 1,300
General Ledger Code Variance
Page 163 of 400
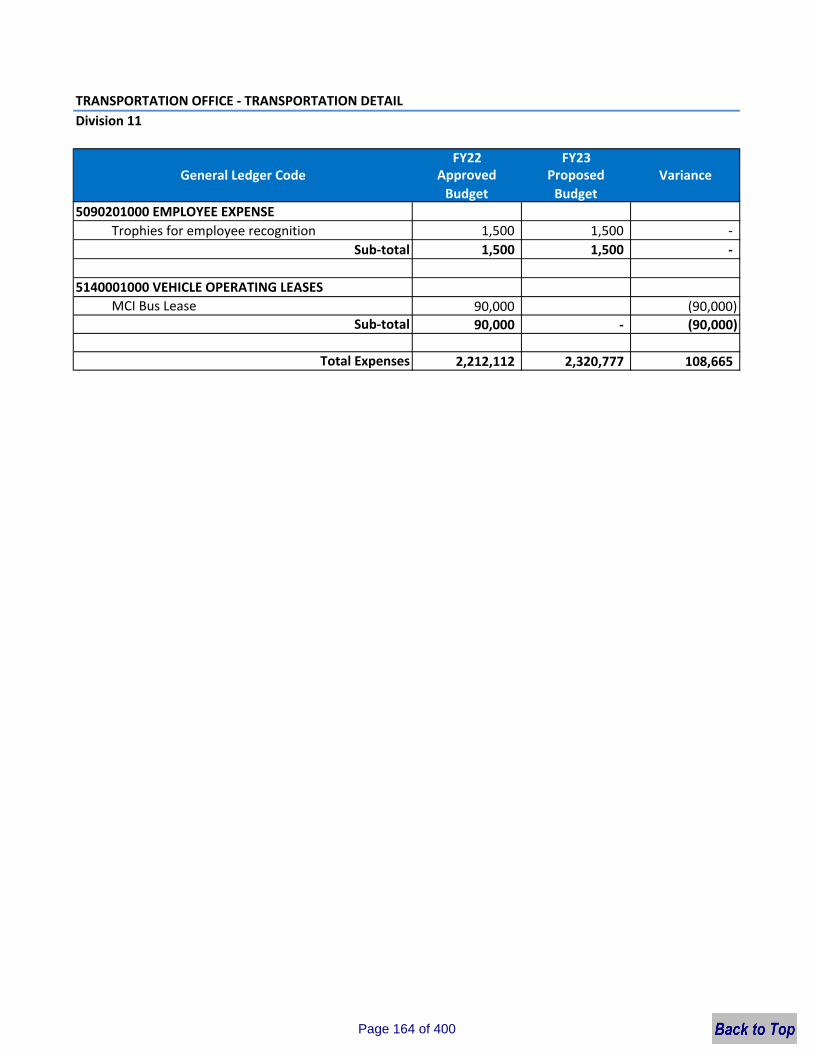
TRANSPORTATION OFFICE ‐ TRANSPORTATION DETAILDivision 11
FY22 FY23Approved Budget
Proposed Budget
General Ledger Code Variance
5090201000 EMPLOYEE EXPENSETrophies for employee recognition 1,500 1,500 ‐
Sub‐total 1,500 1,500 ‐
MCI Bus Lease 90,000 (90,000) Sub‐total 90,000 ‐ (90,000)
Total Expenses 2,212,112 2,320,777 108,665
5140001000 VEHICLE OPERATING LEASES
Page 164 of 400
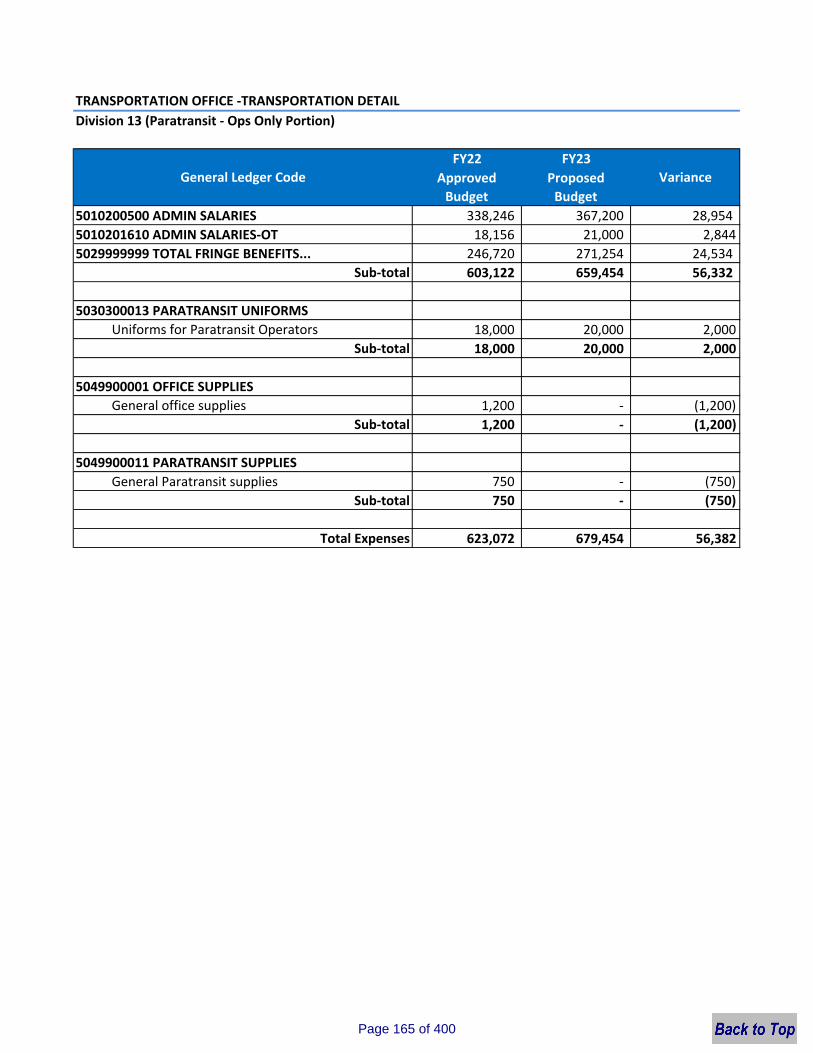
TRANSPORTATION OFFICE ‐TRANSPORTATION DETAILDivision 13 (Paratransit ‐ Ops Only Portion)
FY22 FY23Approved Budget
Proposed Budget
5010200500 ADMIN SALARIES 338,246 367,200 28,954 5010201610 ADMIN SALARIES‐OT 18,156 21,000 2,844 5029999999 TOTAL FRINGE BENEFITS... 246,720 271,254 24,534
Sub‐total 603,122 659,454 56,332
5030300013 PARATRANSIT UNIFORMSUniforms for Paratransit Operators 18,000 20,000 2,000
Sub‐total 18,000 20,000 2,000
5049900001 OFFICE SUPPLIESGeneral office supplies 1,200 ‐ (1,200)
Sub‐total 1,200 ‐ (1,200)
5049900011 PARATRANSIT SUPPLIESGeneral Paratransit supplies 750 ‐ (750)
Sub‐total 750 ‐ (750)
Total Expenses 623,072 679,454 56,382
General Ledger Code Variance
Page 165 of 400

TRANSPORTATION OFFICEDivision 45
FUNCTIONS & RESPONSIBILITIES
FY23 GOALS & OBJECTIVES
• Continue cross training program for staff to mirror another team member to "learn" department processes and eliminate departmental silos.• Create and train for a COM work flow process within the department level staff to increase utilization, productivity and efficiency.• Collaborate with the marketing team to enhance communication with front line staff and customers utilizing new and current onboard technology. i.e. social media, rider app, etc.
EXPENSE BUDGET SUMMARY ‐ COMMUNITY AND CUSTOMER RELATIONS (45)
FY23Proposed Budget
5010200500 ADMIN SALARIES 464,382 331,361 326,847 334,906 405,244 70,338 5010201610 ADMIN SALARIES‐OT 8,865 3,640 5,515 8,500 11,000 2,500 5029999999 TOTAL FRINGE BENEFITS 315,423 233,456 231,935 231,696 312,772 81,076 5030303240 CONTRACTED SERVICES 77,363 ‐ ‐ 2,500 2,500 ‐ 5030303260 ADVERTISING 44,142 ‐ ‐ ‐ ‐ ‐ 5030303270 SUNLINE EVENTS EXPENSE 3,072 ‐ ‐ ‐ ‐ ‐ 5030303271 MUSIC FESTIVAL 8,991 ‐ ‐ ‐ ‐ ‐ 5030400000 TEMPORARY HELP SERVICES 18,920 ‐ 7,885 5,256 5,000 (256)5039900003 PRINTING EXPENSE 47,183 7,427 23,147 40,000 40,000 ‐ 5049900001 OFFICE SUPPLIES 5,985 2,720 1,070 4,000 4,000 ‐ 5049900002 OFFICE SUPPLIES‐POSTAGE 14,790 14,498 25,330 25,000 25,000 ‐ 5090100000 MEMBERSHIPS & SUBSCRIPTIONS 2,559 ‐ ‐ ‐ ‐ ‐ 5090200000 TRAVEL MEETINGS/TRAINING 3,472 ‐ ‐ 1,300 1,300 ‐ 5090800100 EMPLOYEE RECOGNITION ‐ 438 425 900 900 ‐
Total Expenses 1,015,147 593,542 622,155 654,058 807,716 153,658
1 Customer Service Manager 1.00 1.00 0.001 Customer Care Coordinator 0.00 1.00 1.004 Customer Service Representative 4.00 4.00 0.001 Paratransit Lead Reservationist 1.00 1.00 0.005 Paratransit Reservationist 5.00 5.00 0.0012 11.00 12.00 1.00Total FTEs
• One (1) Planning Technician was moved from the Planning department and reclassified as a Customer Care Coordinator.
Notes:
The Community and Customer relations department is responsible for greeting and checking‐in all customers that come to SunLine. They also process personalized transit requests, distribute transit information material throughout the Agency's service area and take, record and answer customers suggestions, requests, and complaints. Additionally, the department is also responsible for directing calls to appropriate departments within the Agency and follow up to confirm resolution.
Variance
General Ledger Code FY20 Actuals FY21 Actuals FY22 EstimatesFY22
Approved Budget
Variance
PERSONNEL SUMMARY
FY23 Physical Count
ClassificationFY22
Approved Budget
FY23 Proposed Base FTE's
Notes:• In FY21, the marketing staff were separated from the Community and Customer Relations department. Accordingly, the marketing costs for FY21 through FY23 areincluded in the marketing department.
Page 166 of 400
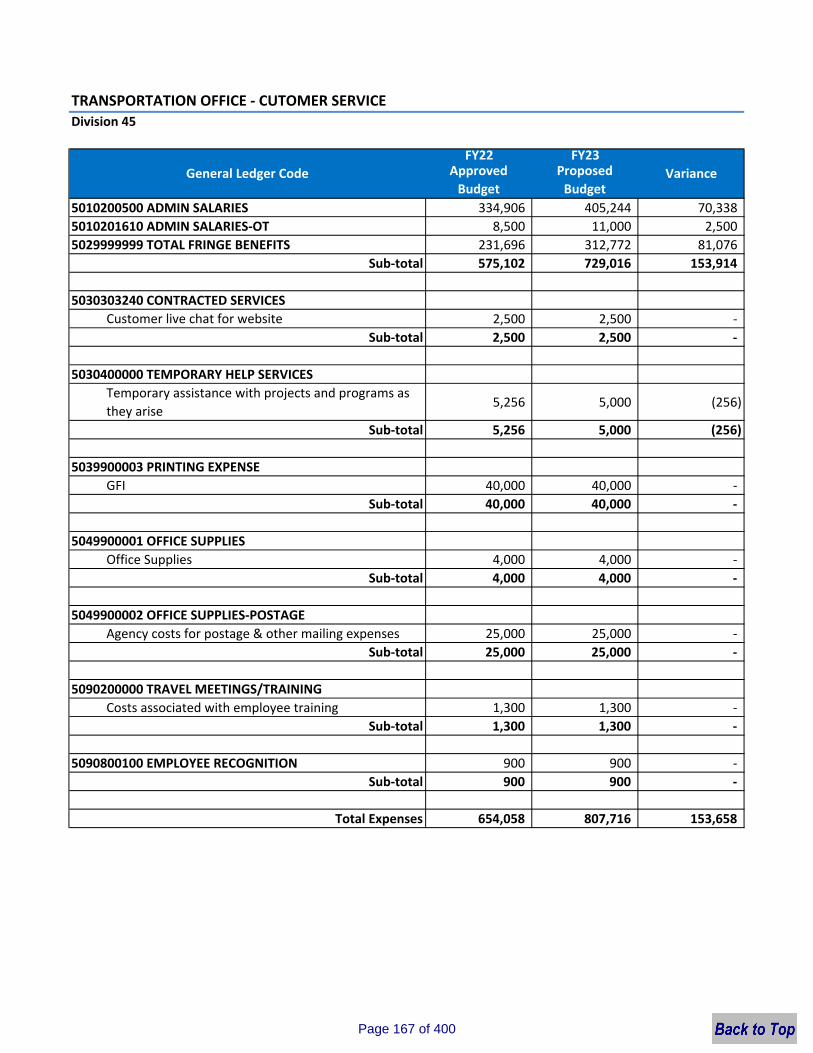
TRANSPORTATION OFFICE ‐ CUTOMER SERVICEDivision 45
FY22 FY23Approved Budget
Proposed Budget
5010200500 ADMIN SALARIES 334,906 405,244 70,338 5010201610 ADMIN SALARIES‐OT 8,500 11,000 2,500 5029999999 TOTAL FRINGE BENEFITS 231,696 312,772 81,076
Sub‐total 575,102 729,016 153,914
5030303240 CONTRACTED SERVICESCustomer live chat for website 2,500 2,500 ‐
Sub‐total 2,500 2,500 ‐
5030400000 TEMPORARY HELP SERVICESTemporary assistance with projects and programs as they arise
5,256 5,000 (256)
Sub‐total 5,256 5,000 (256)
5039900003 PRINTING EXPENSEGFI 40,000 40,000 ‐
Sub‐total 40,000 40,000 ‐
5049900001 OFFICE SUPPLIESOffice Supplies 4,000 4,000 ‐
Sub‐total 4,000 4,000 ‐
5049900002 OFFICE SUPPLIES‐POSTAGEAgency costs for postage & other mailing expenses 25,000 25,000 ‐
Sub‐total 25,000 25,000 ‐
5090200000 TRAVEL MEETINGS/TRAININGCosts associated with employee training 1,300 1,300 ‐
Sub‐total 1,300 1,300 ‐
5090800100 EMPLOYEE RECOGNITION 900 900 ‐ Sub‐total 900 900 ‐
Total Expenses 654,058 807,716 153,658
General Ledger Code Variance
Page 167 of 400
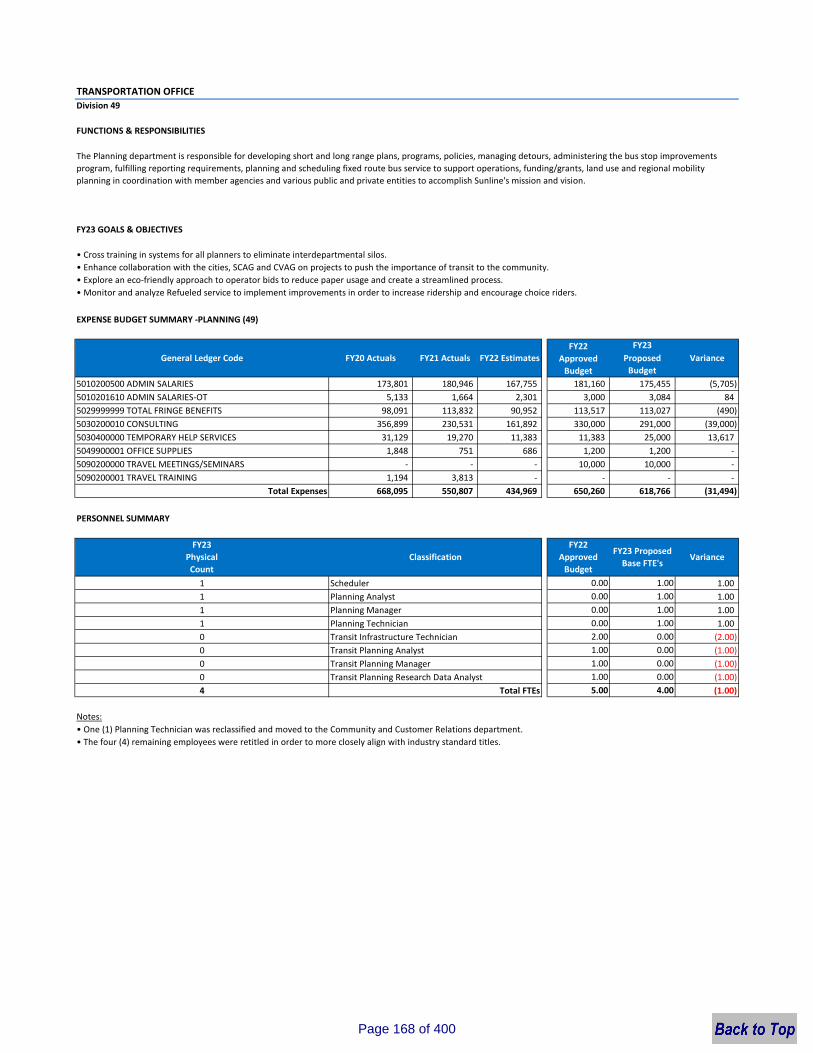
TRANSPORTATION OFFICEDivision 49
FUNCTIONS & RESPONSIBILITIES
FY23 GOALS & OBJECTIVES
• Cross training in systems for all planners to eliminate interdepartmental silos.• Enhance collaboration with the cities, SCAG and CVAG on projects to push the importance of transit to the community.• Explore an eco‐friendly approach to operator bids to reduce paper usage and create a streamlined process.• Monitor and analyze Refueled service to implement improvements in order to increase ridership and encourage choice riders.
EXPENSE BUDGET SUMMARY ‐PLANNING (49)
FY23Proposed Budget
5010200500 ADMIN SALARIES 173,801 180,946 167,755 181,160 175,455 (5,705) 5010201610 ADMIN SALARIES‐OT 5,133 1,664 2,301 3,000 3,084 84 5029999999 TOTAL FRINGE BENEFITS 98,091 113,832 90,952 113,517 113,027 (490)5030200010 CONSULTING 356,899 230,531 161,892 330,000 291,000 (39,000) 5030400000 TEMPORARY HELP SERVICES 31,129 19,270 11,383 11,383 25,000 13,617 5049900001 OFFICE SUPPLIES 1,848 751 686 1,200 1,200 ‐ 5090200000 TRAVEL MEETINGS/SEMINARS ‐ ‐ ‐ 10,000 10,000 ‐ 5090200001 TRAVEL TRAINING 1,194 3,813 ‐ ‐ ‐ ‐
Total Expenses 668,095 550,807 434,969 650,260 618,766 (31,494)
1 Scheduler 0.00 1.00 1.001 Planning Analyst 0.00 1.00 1.001 Planning Manager 0.00 1.00 1.001 Planning Technician 0.00 1.00 1.000 Transit Infrastructure Technician 2.00 0.00 (2.00)0 Transit Planning Analyst 1.00 0.00 (1.00)0 Transit Planning Manager 1.00 0.00 (1.00)0 Transit Planning Research Data Analyst 1.00 0.00 (1.00)4 5.00 4.00 (1.00)
• One (1) Planning Technician was reclassified and moved to the Community and Customer Relations department.• The four (4) remaining employees were retitled in order to more closely align with industry standard titles.
Notes:
Total FTEs
The Planning department is responsible for developing short and long range plans, programs, policies, managing detours, administering the bus stop improvements program, fulfilling reporting requirements, planning and scheduling fixed route bus service to support operations, funding/grants, land use and regional mobility planning in coordination with member agencies and various public and private entities to accomplish Sunline's mission and vision.
Variance
General Ledger Code FY20 Actuals FY21 Actuals FY22 EstimatesFY22
Approved Budget
Variance
PERSONNEL SUMMARY
FY23 Physical Count
ClassificationFY22
Approved Budget
FY23 Proposed Base FTE's
Page 168 of 400
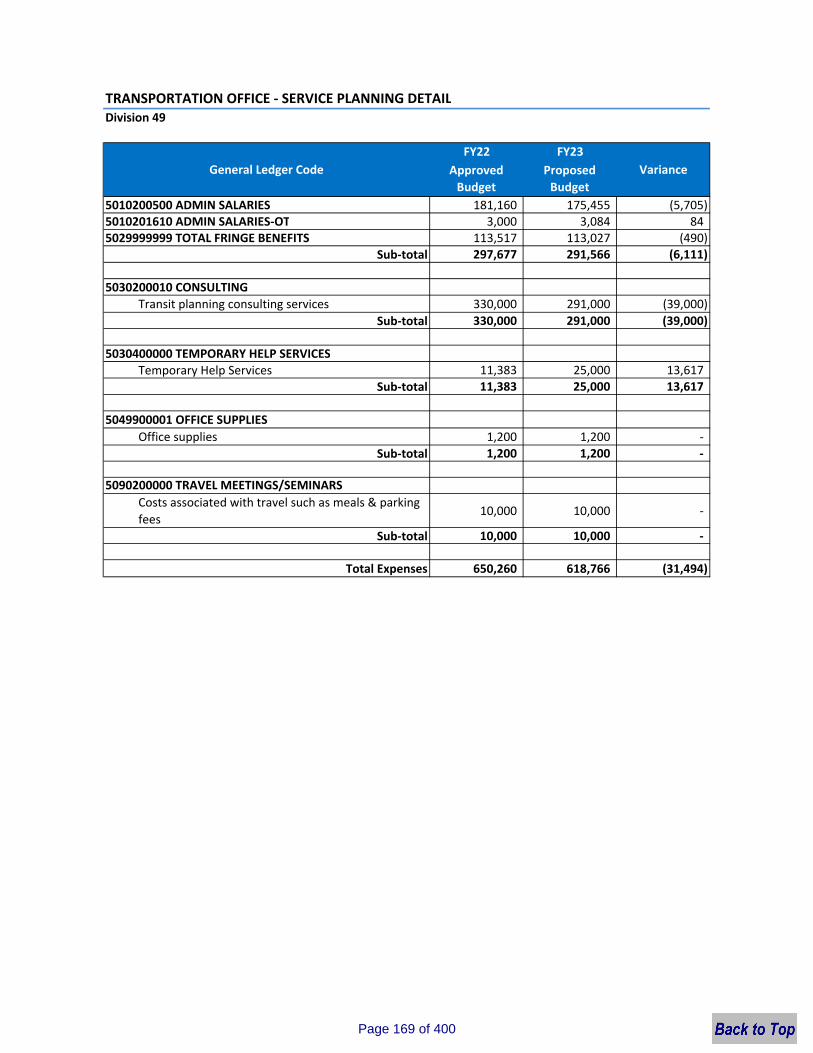
TRANSPORTATION OFFICE ‐ SERVICE PLANNING DETAILDivision 49
FY22 FY23Approved Budget
Proposed Budget
5010200500 ADMIN SALARIES 181,160 175,455 (5,705) 5010201610 ADMIN SALARIES‐OT 3,000 3,084 84 5029999999 TOTAL FRINGE BENEFITS 113,517 113,027 (490)
Sub‐total 297,677 291,566 (6,111)
5030200010 CONSULTINGTransit planning consulting services 330,000 291,000 (39,000)
Sub‐total 330,000 291,000 (39,000)
5030400000 TEMPORARY HELP SERVICESTemporary Help Services 11,383 25,000 13,617
Sub‐total 11,383 25,000 13,617
5049900001 OFFICE SUPPLIESOffice supplies 1,200 1,200 ‐
Sub‐total 1,200 1,200 ‐
5090200000 TRAVEL MEETINGS/SEMINARSCosts associated with travel such as meals & parking fees
10,000 10,000 ‐
Sub‐total 10,000 10,000 ‐
Total Expenses 650,260 618,766 (31,494)
General Ledger Code Variance
Page 169 of 400

MAINTENANCE OFFICE
Page 170 of 400
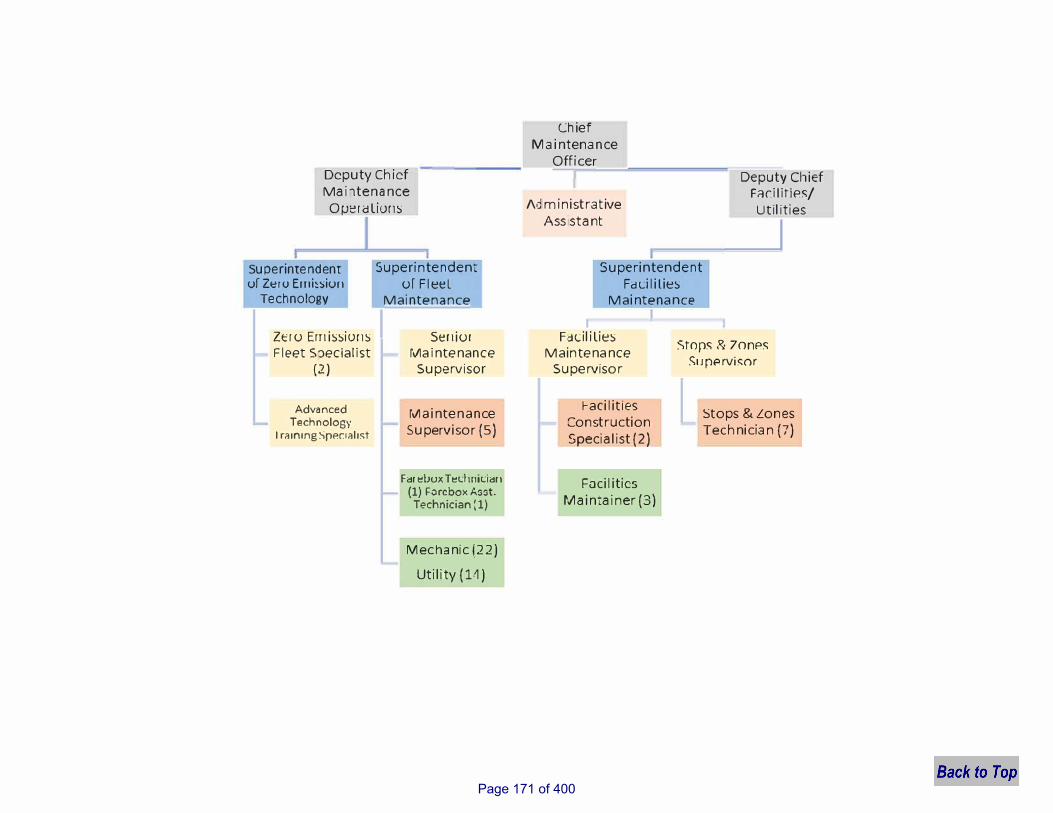
Deputy Ch icf Mai1tenance Oµcr er liu11s
Superintendent ur Zer u Emi��iu11
Tec�1nology
Zcr u Em issiu11s Fleet S::>ecialist
(2)
Advanced Technology
r r�1ning SpP.n�hst
Superintenaent uf Fleel
I Maintenance
Sen iur Maintenance Supervisor
Maintenance Supervisor (5)
Fc:11 el.Jux Tedmicic:111 {1) Forcbox Asst. Technician [1)
Mechanic(22)
Utility (11)
Chief Maintenance
Officer
/\d mi nistrative Ass'stant
Superintenaent Fcrcililies
Maintenance
Deputy Chief Filr.i I itiP.s/ Utilities
_J
I Facililies
Maintenance Supervisor
Stor,s R, 7onP.s Su l')P.rvisor
�acilities Construction Specialist (2)
Foci I itics Maintainer (3)
Stops & Lones Technician (7)
Page 171 of 400
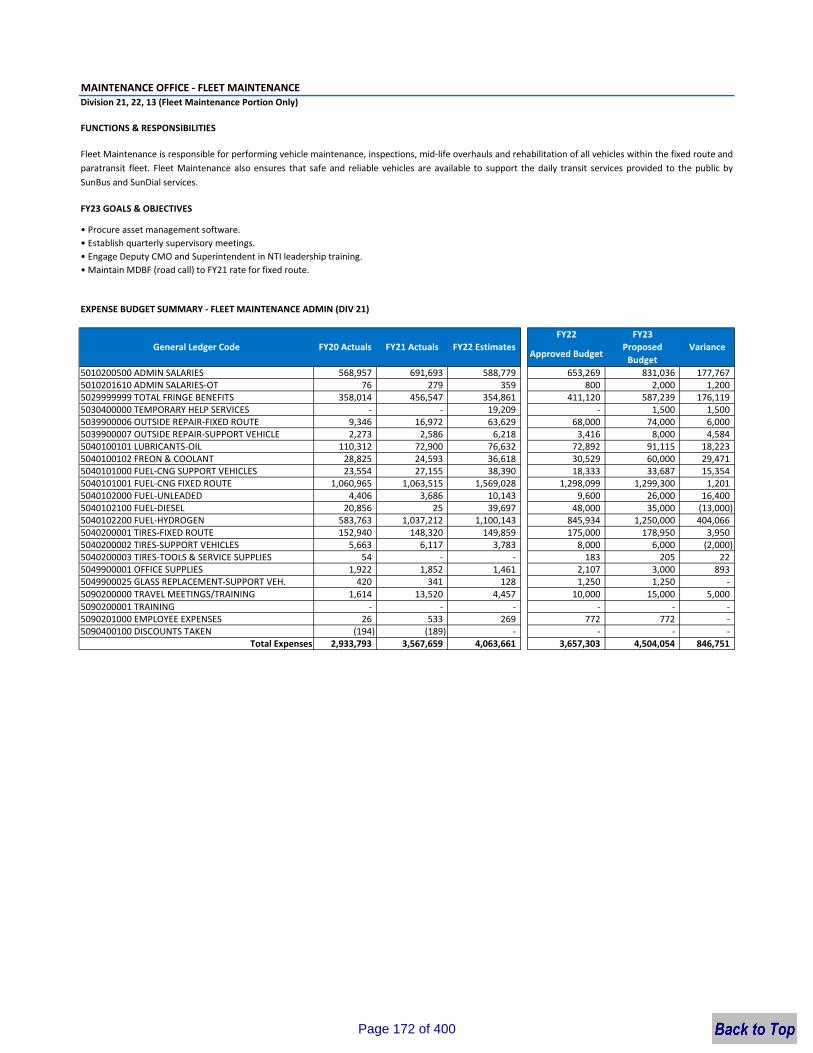
MAINTENANCE OFFICE ‐ FLEET MAINTENANCEDivision 21, 22, 13 (Fleet Maintenance Portion Only)
FUNCTIONS & RESPONSIBILITIES
FY23 GOALS & OBJECTIVES
• Procure asset management software.• Establish quarterly supervisory meetings.• Engage Deputy CMO and Superintendent in NTI leadership training.• Maintain MDBF (road call) to FY21 rate for fixed route.
EXPENSE BUDGET SUMMARY ‐ FLEET MAINTENANCE ADMIN (DIV 21)
FY22 FY23
Approved BudgetProposed Budget
5010200500 ADMIN SALARIES 568,957 691,693 588,779 653,269 831,036 177,767 5010201610 ADMIN SALARIES‐OT 76 279 359 800 2,000 1,200 5029999999 TOTAL FRINGE BENEFITS 358,014 456,547 354,861 411,120 587,239 176,119 5030400000 TEMPORARY HELP SERVICES ‐ ‐ 19,209 ‐ 1,500 1,500 5039900006 OUTSIDE REPAIR‐FIXED ROUTE 9,346 16,972 63,629 68,000 74,000 6,000 5039900007 OUTSIDE REPAIR‐SUPPORT VEHICLE 2,273 2,586 6,218 3,416 8,000 4,584 5040100101 LUBRICANTS‐OIL 110,312 72,900 76,632 72,892 91,115 18,223 5040100102 FREON & COOLANT 28,825 24,593 36,618 30,529 60,000 29,471 5040101000 FUEL‐CNG SUPPORT VEHICLES 23,554 27,155 38,390 18,333 33,687 15,354 5040101001 FUEL‐CNG FIXED ROUTE 1,060,965 1,063,515 1,569,028 1,298,099 1,299,300 1,201 5040102000 FUEL‐UNLEADED 4,406 3,686 10,143 9,600 26,000 16,400 5040102100 FUEL‐DIESEL 20,856 25 39,697 48,000 35,000 (13,000) 5040102200 FUEL‐HYDROGEN 583,763 1,037,212 1,100,143 845,934 1,250,000 404,066 5040200001 TIRES‐FIXED ROUTE 152,940 148,320 149,859 175,000 178,950 3,950 5040200002 TIRES‐SUPPORT VEHICLES 5,663 6,117 3,783 8,000 6,000 (2,000) 5040200003 TIRES‐TOOLS & SERVICE SUPPLIES 54 ‐ ‐ 183 205 22 5049900001 OFFICE SUPPLIES 1,922 1,852 1,461 2,107 3,000 893 5049900025 GLASS REPLACEMENT‐SUPPORT VEH. 420 341 128 1,250 1,250 ‐ 5090200000 TRAVEL MEETINGS/TRAINING 1,614 13,520 4,457 10,000 15,000 5,000 5090200001 TRAINING ‐ ‐ ‐ ‐ ‐ ‐ 5090201000 EMPLOYEE EXPENSES 26 533 269 772 772 ‐ 5090400100 DISCOUNTS TAKEN (194) (189) ‐ ‐ ‐ ‐
Total Expenses 2,933,793 3,567,659 4,063,661 3,657,303 4,504,054 846,751
Fleet Maintenance is responsible for performing vehicle maintenance, inspections, mid‐life overhauls and rehabilitation of all vehicles within the fixed route andparatransit fleet. Fleet Maintenance also ensures that safe and reliable vehicles are available to support the daily transit services provided to the public bySunBus and SunDial services.
General Ledger Code FY21 Actuals FY22 Estimates VarianceFY20 Actuals
Page 172 of 400
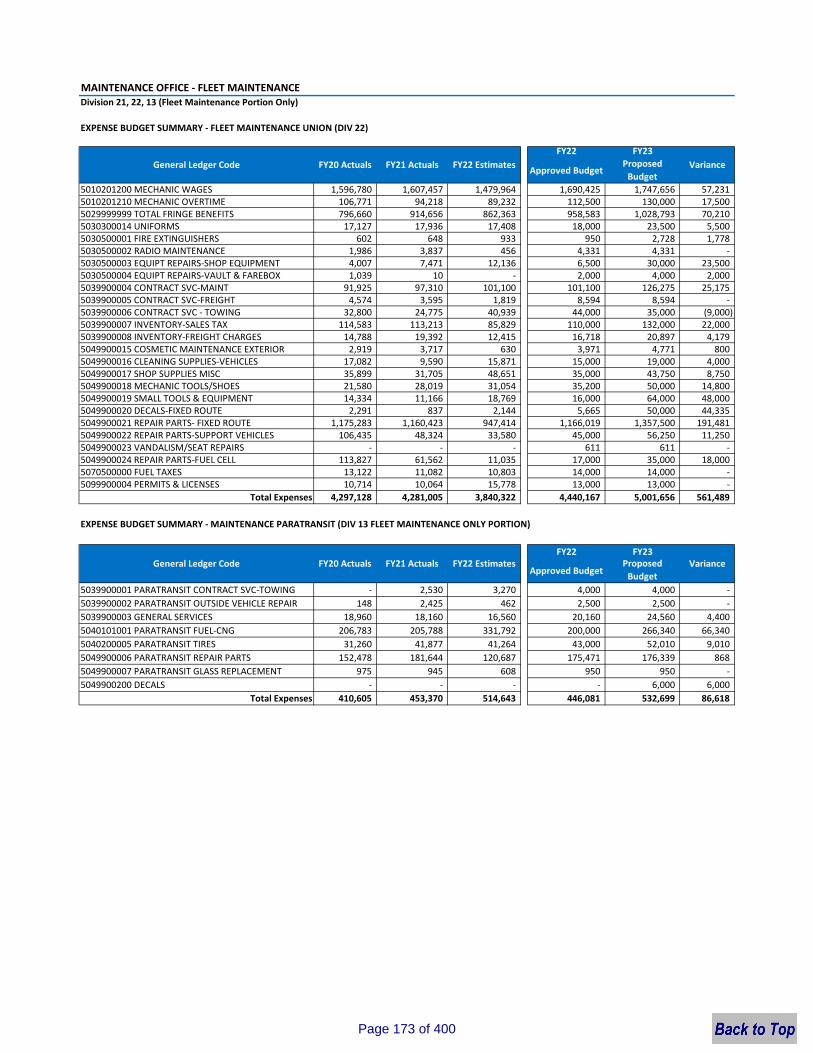
MAINTENANCE OFFICE ‐ FLEET MAINTENANCEDivision 21, 22, 13 (Fleet Maintenance Portion Only)
FY22 FY23
Approved BudgetProposed Budget
5010201200 MECHANIC WAGES 1,596,780 1,607,457 1,479,964 1,690,425 1,747,656 57,231 5010201210 MECHANIC OVERTIME 106,771 94,218 89,232 112,500 130,000 17,500 5029999999 TOTAL FRINGE BENEFITS 796,660 914,656 862,363 958,583 1,028,793 70,210 5030300014 UNIFORMS 17,127 17,936 17,408 18,000 23,500 5,500 5030500001 FIRE EXTINGUISHERS 602 648 933 950 2,728 1,778 5030500002 RADIO MAINTENANCE 1,986 3,837 456 4,331 4,331 ‐ 5030500003 EQUIPT REPAIRS‐SHOP EQUIPMENT 4,007 7,471 12,136 6,500 30,000 23,500 5030500004 EQUIPT REPAIRS‐VAULT & FAREBOX 1,039 10 ‐ 2,000 4,000 2,000 5039900004 CONTRACT SVC‐MAINT 91,925 97,310 101,100 101,100 126,275 25,175 5039900005 CONTRACT SVC‐FREIGHT 4,574 3,595 1,819 8,594 8,594 ‐ 5039900006 CONTRACT SVC ‐ TOWING 32,800 24,775 40,939 44,000 35,000 (9,000) 5039900007 INVENTORY‐SALES TAX 114,583 113,213 85,829 110,000 132,000 22,000 5039900008 INVENTORY‐FREIGHT CHARGES 14,788 19,392 12,415 16,718 20,897 4,179 5049900015 COSMETIC MAINTENANCE EXTERIOR 2,919 3,717 630 3,971 4,771 800 5049900016 CLEANING SUPPLIES‐VEHICLES 17,082 9,590 15,871 15,000 19,000 4,000 5049900017 SHOP SUPPLIES MISC 35,899 31,705 48,651 35,000 43,750 8,750 5049900018 MECHANIC TOOLS/SHOES 21,580 28,019 31,054 35,200 50,000 14,800 5049900019 SMALL TOOLS & EQUIPMENT 14,334 11,166 18,769 16,000 64,000 48,000 5049900020 DECALS‐FIXED ROUTE 2,291 837 2,144 5,665 50,000 44,335 5049900021 REPAIR PARTS‐ FIXED ROUTE 1,175,283 1,160,423 947,414 1,166,019 1,357,500 191,481 5049900022 REPAIR PARTS‐SUPPORT VEHICLES 106,435 48,324 33,580 45,000 56,250 11,250 5049900023 VANDALISM/SEAT REPAIRS ‐ ‐ ‐ 611 611 ‐ 5049900024 REPAIR PARTS‐FUEL CELL 113,827 61,562 11,035 17,000 35,000 18,000 5070500000 FUEL TAXES 13,122 11,082 10,803 14,000 14,000 ‐ 5099900004 PERMITS & LICENSES 10,714 10,064 15,778 13,000 13,000 ‐
Total Expenses 4,297,128 4,281,005 3,840,322 4,440,167 5,001,656 561,489
FY22 FY23
Approved BudgetProposed Budget
5039900001 PARATRANSIT CONTRACT SVC‐TOWING ‐ 2,530 3,270 4,000 4,000 ‐ 5039900002 PARATRANSIT OUTSIDE VEHICLE REPAIR 148 2,425 462 2,500 2,500 ‐ 5039900003 GENERAL SERVICES 18,960 18,160 16,560 20,160 24,560 4,400 5040101001 PARATRANSIT FUEL‐CNG 206,783 205,788 331,792 200,000 266,340 66,340 5040200005 PARATRANSIT TIRES 31,260 41,877 41,264 43,000 52,010 9,010 5049900006 PARATRANSIT REPAIR PARTS 152,478 181,644 120,687 175,471 176,339 868 5049900007 PARATRANSIT GLASS REPLACEMENT 975 945 608 950 950 ‐ 5049900200 DECALS ‐ ‐ ‐ ‐ 6,000 6,000
Total Expenses 410,605 453,370 514,643 446,081 532,699 86,618
Variance
VarianceFY22 Estimates
EXPENSE BUDGET SUMMARY ‐ FLEET MAINTENANCE UNION (DIV 22)
General Ledger Code FY20 Actuals FY21 Actuals FY22 Estimates
EXPENSE BUDGET SUMMARY ‐ MAINTENANCE PARATRANSIT (DIV 13 FLEET MAINTENANCE ONLY PORTION)
General Ledger Code FY20 Actuals FY21 Actuals
Page 173 of 400
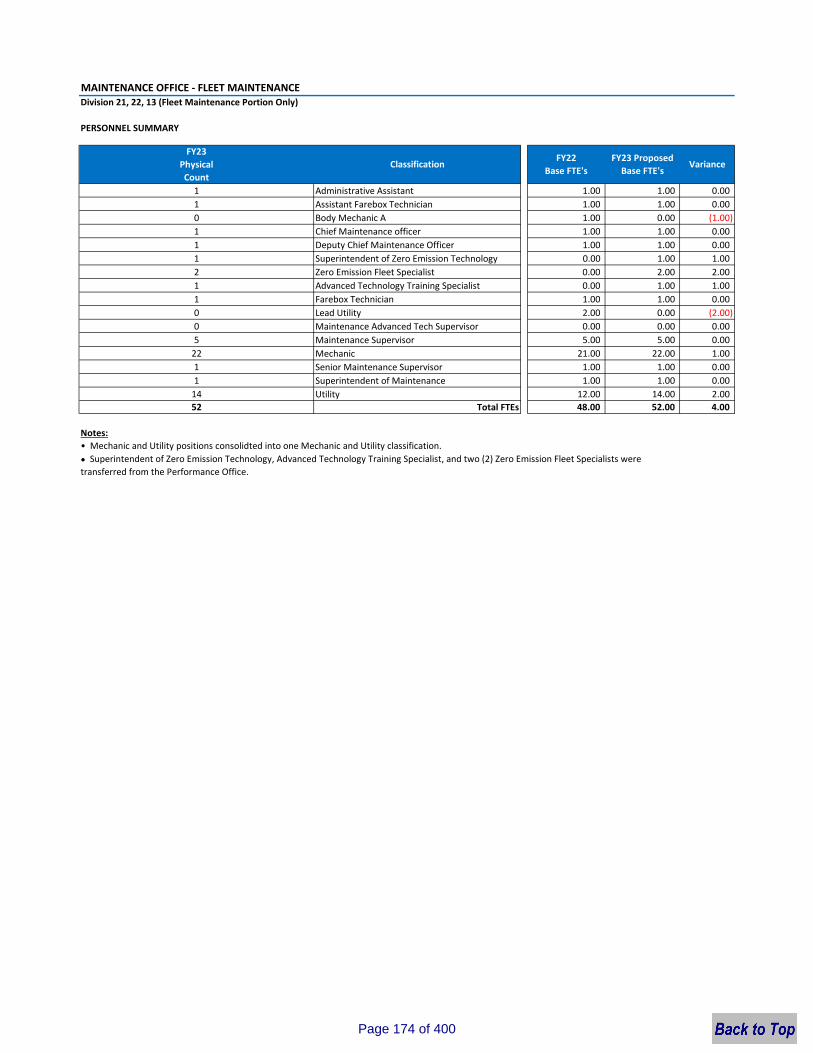
MAINTENANCE OFFICE ‐ FLEET MAINTENANCEDivision 21, 22, 13 (Fleet Maintenance Portion Only)
1 1.00 1.00 0.001 1.00 1.00 0.000 1.00 0.00 (1.00)1 1.00 1.00 0.001 Deputy Chief Maintenance Officer 1.00 1.00 0.001 Superintendent of Zero Emission Technology 0.00 1.00 1.002 Zero Emission Fleet Specialist 0.00 2.00 2.001 Advanced Technology Training Specialist 0.00 1.00 1.001 1.00 1.00 0.000 2.00 0.00 (2.00)0 0.00 0.00 0.005 5.00 5.00 0.0022 21.00 22.00 1.001 1.00 1.00 0.001 1.00 1.00 0.0014 12.00 14.00 2.0052 48.00 52.00 4.00
Notes:
transferred from the Performance Office.
Superintendent of Maintenance
Total FTEs
Maintenance Advanced Tech Supervisor
Utility
Body Mechanic A
PERSONNEL SUMMARY
VarianceFY23 Proposed Base FTE's
FY22Base FTE's
Senior Maintenance Supervisor
Farebox Technician
Mechanic
Administrative Assistant
Chief Maintenance officer
Maintenance Supervisor
Lead Utility
Assistant Farebox Technician
FY23Physical Count
• Mechanic and Utility positions consolidted into one Mechanic and Utility classification.
Classification
● Superintendent of Zero Emission Technology, Advanced Technology Training Specialist, and two (2) Zero Emission Fleet Specialists were
Page 174 of 400
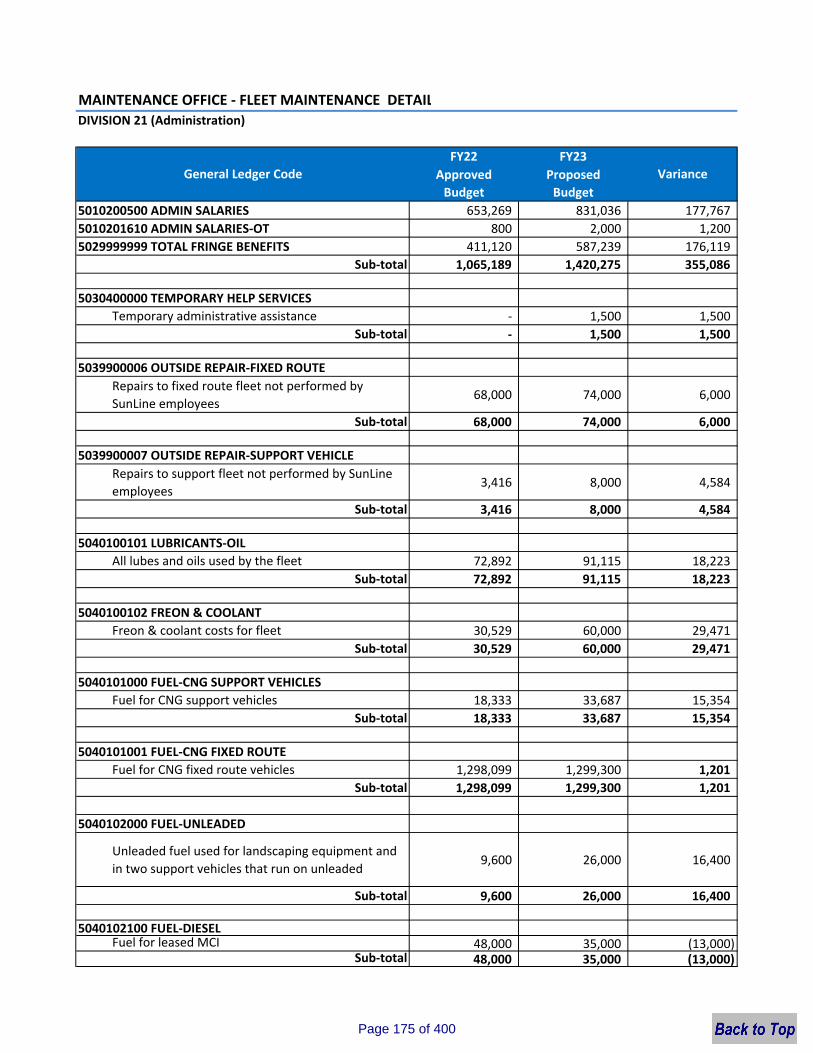
MAINTENANCE OFFICE ‐ FLEET MAINTENANCE DETAILDIVISION 21 (Administration)
FY22 FY23Approved Budget
Proposed Budget
5010200500 ADMIN SALARIES 653,269 831,036 177,767 5010201610 ADMIN SALARIES‐OT 800 2,000 1,200 5029999999 TOTAL FRINGE BENEFITS 411,120 587,239 176,119
Sub‐total 1,065,189 1,420,275 355,086
5030400000 TEMPORARY HELP SERVICESTemporary administrative assistance ‐ 1,500 1,500
Sub‐total ‐ 1,500 1,500
5039900006 OUTSIDE REPAIR‐FIXED ROUTERepairs to fixed route fleet not performed by SunLine employees
68,000 74,000 6,000
Sub‐total 68,000 74,000 6,000
5039900007 OUTSIDE REPAIR‐SUPPORT VEHICLERepairs to support fleet not performed by SunLine employees
3,416 8,000 4,584
Sub‐total 3,416 8,000 4,584
5040100101 LUBRICANTS‐OILAll lubes and oils used by the fleet 72,892 91,115 18,223
Sub‐total 72,892 91,115 18,223
5040100102 FREON & COOLANTFreon & coolant costs for fleet 30,529 60,000 29,471
Sub‐total 30,529 60,000 29,471
5040101000 FUEL‐CNG SUPPORT VEHICLESFuel for CNG support vehicles 18,333 33,687 15,354
Sub‐total 18,333 33,687 15,354
5040101001 FUEL‐CNG FIXED ROUTEFuel for CNG fixed route vehicles 1,298,099 1,299,300 1,201
Sub‐total 1,298,099 1,299,300 1,201
5040102000 FUEL‐UNLEADED
Unleaded fuel used for landscaping equipment and in two support vehicles that run on unleaded
9,600 26,000 16,400
Sub‐total 9,600 26,000 16,400
5040102100 FUEL‐DIESELFuel for leased MCI 48,000 35,000 (13,000)
Sub‐total 48,000 35,000 (13,000)
General Ledger Code Variance
Page 175 of 400
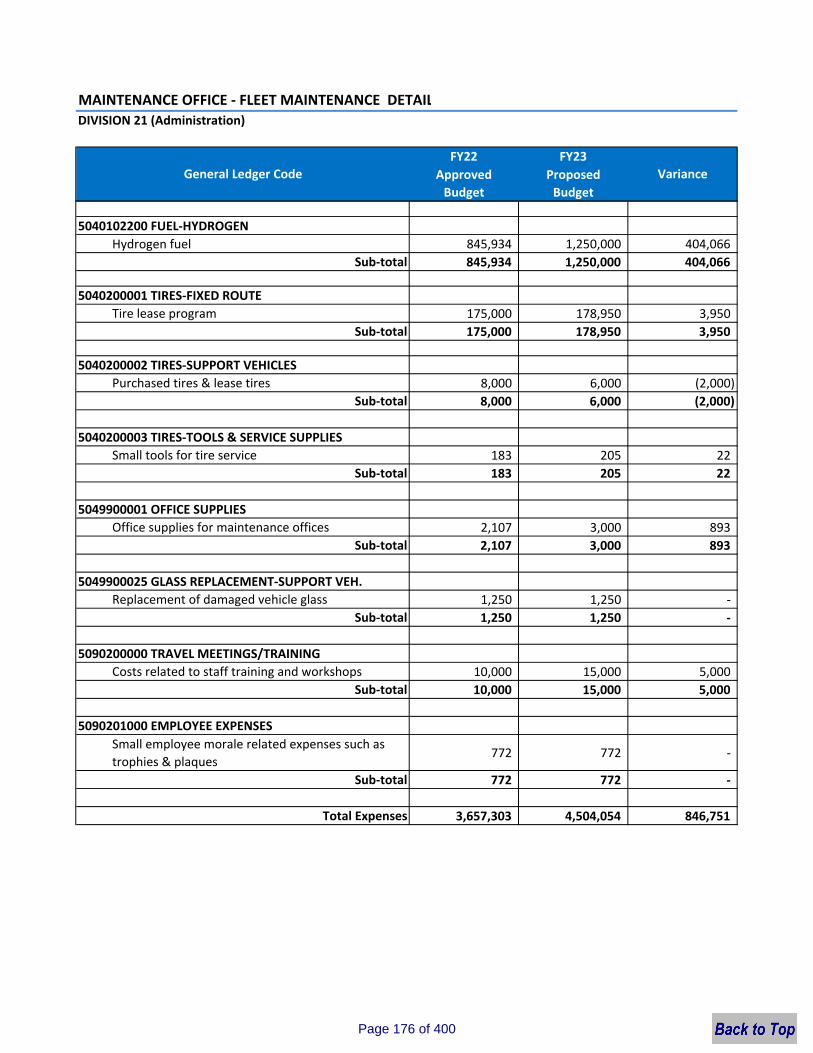
MAINTENANCE OFFICE ‐ FLEET MAINTENANCE DETAILDIVISION 21 (Administration)
FY22 FY23Approved Budget
Proposed Budget
General Ledger Code Variance
5040102200 FUEL‐HYDROGENHydrogen fuel 845,934 1,250,000 404,066
Sub‐total 845,934 1,250,000 404,066
5040200001 TIRES‐FIXED ROUTETire lease program 175,000 178,950 3,950
Sub‐total 175,000 178,950 3,950
5040200002 TIRES‐SUPPORT VEHICLESPurchased tires & lease tires 8,000 6,000 (2,000)
Sub‐total 8,000 6,000 (2,000)
5040200003 TIRES‐TOOLS & SERVICE SUPPLIESSmall tools for tire service 183 205 22
Sub‐total 183 205 22
5049900001 OFFICE SUPPLIESOffice supplies for maintenance offices 2,107 3,000 893
Sub‐total 2,107 3,000 893
5049900025 GLASS REPLACEMENT‐SUPPORT VEH.Replacement of damaged vehicle glass 1,250 1,250 ‐
Sub‐total 1,250 1,250 ‐
5090200000 TRAVEL MEETINGS/TRAININGCosts related to staff training and workshops 10,000 15,000 5,000
Sub‐total 10,000 15,000 5,000
5090201000 EMPLOYEE EXPENSESSmall employee morale related expenses such as trophies & plaques
772 772 ‐
Sub‐total 772 772 ‐
Total Expenses 3,657,303 4,504,054 846,751
Page 176 of 400
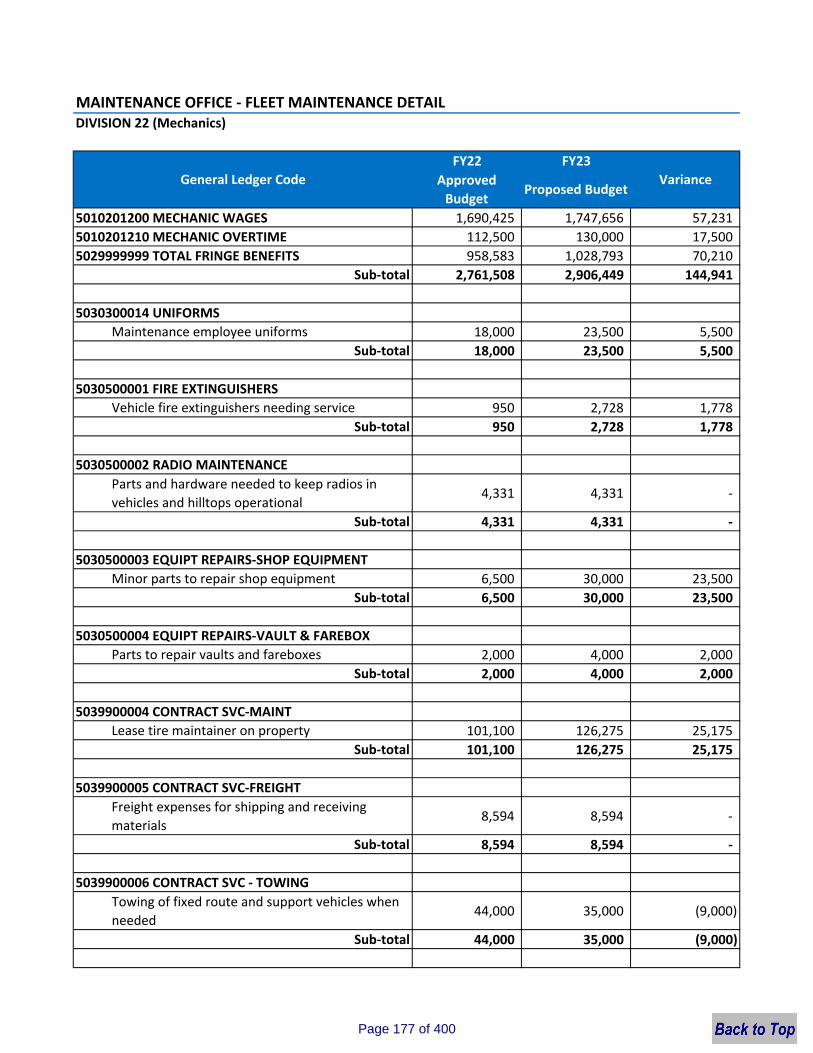
MAINTENANCE OFFICE ‐ FLEET MAINTENANCE DETAILDIVISION 22 (Mechanics)
FY22 FY23Approved Budget
Proposed Budget
5010201200 MECHANIC WAGES 1,690,425 1,747,656 57,231 5010201210 MECHANIC OVERTIME 112,500 130,000 17,500 5029999999 TOTAL FRINGE BENEFITS 958,583 1,028,793 70,210
Sub‐total 2,761,508 2,906,449 144,941
5030300014 UNIFORMSMaintenance employee uniforms 18,000 23,500 5,500
Sub‐total 18,000 23,500 5,500
5030500001 FIRE EXTINGUISHERSVehicle fire extinguishers needing service 950 2,728 1,778
Sub‐total 950 2,728 1,778
5030500002 RADIO MAINTENANCEParts and hardware needed to keep radios in vehicles and hilltops operational
4,331 4,331 ‐
Sub‐total 4,331 4,331 ‐
5030500003 EQUIPT REPAIRS‐SHOP EQUIPMENTMinor parts to repair shop equipment 6,500 30,000 23,500
Sub‐total 6,500 30,000 23,500
5030500004 EQUIPT REPAIRS‐VAULT & FAREBOXParts to repair vaults and fareboxes 2,000 4,000 2,000
Sub‐total 2,000 4,000 2,000
5039900004 CONTRACT SVC‐MAINTLease tire maintainer on property 101,100 126,275 25,175
Sub‐total 101,100 126,275 25,175
5039900005 CONTRACT SVC‐FREIGHTFreight expenses for shipping and receiving materials
8,594 8,594 ‐
Sub‐total 8,594 8,594 ‐
5039900006 CONTRACT SVC ‐ TOWINGTowing of fixed route and support vehicles when needed
44,000 35,000 (9,000)
Sub‐total 44,000 35,000 (9,000)
General Ledger Code Variance
Page 177 of 400
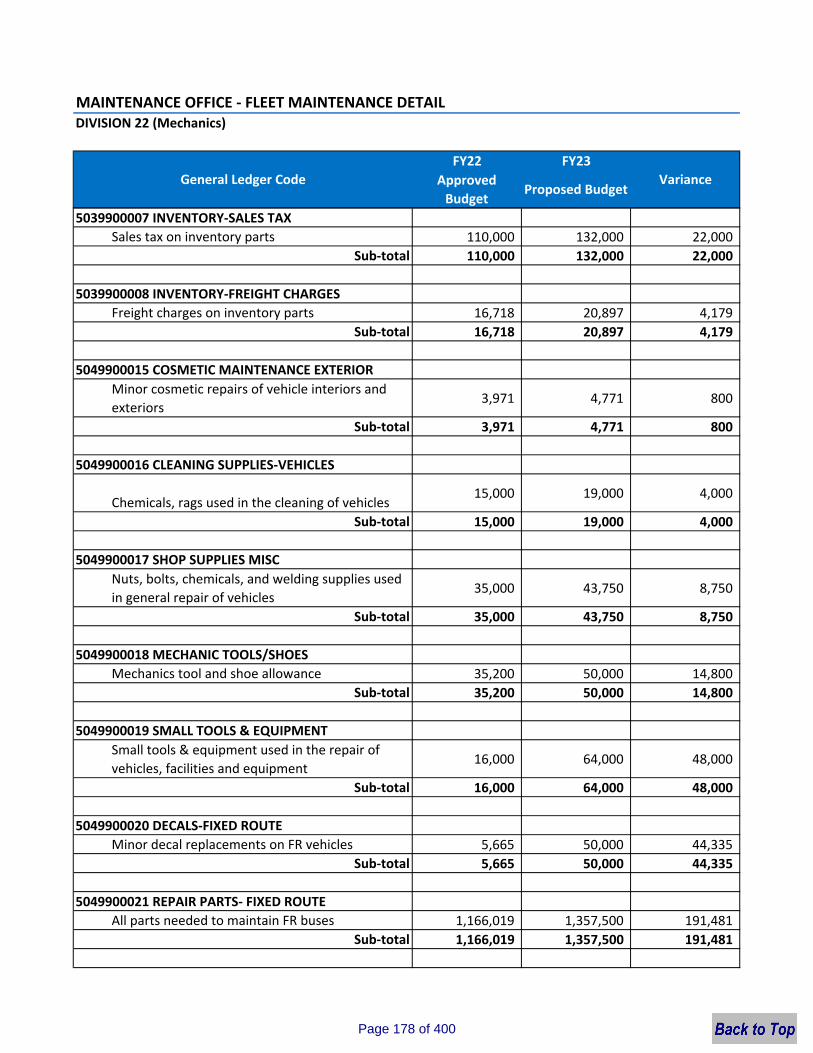
MAINTENANCE OFFICE ‐ FLEET MAINTENANCE DETAILDIVISION 22 (Mechanics)
FY22 FY23Approved Budget
Proposed BudgetGeneral Ledger Code Variance
5039900007 INVENTORY‐SALES TAXSales tax on inventory parts 110,000 132,000 22,000
Sub‐total 110,000 132,000 22,000
5039900008 INVENTORY‐FREIGHT CHARGESFreight charges on inventory parts 16,718 20,897 4,179
Sub‐total 16,718 20,897 4,179
5049900015 COSMETIC MAINTENANCE EXTERIORMinor cosmetic repairs of vehicle interiors and exteriors
3,971 4,771 800
Sub‐total 3,971 4,771 800
5049900016 CLEANING SUPPLIES‐VEHICLES
Chemicals, rags used in the cleaning of vehicles15,000 19,000 4,000
Sub‐total 15,000 19,000 4,000
5049900017 SHOP SUPPLIES MISCNuts, bolts, chemicals, and welding supplies used in general repair of vehicles
35,000 43,750 8,750
Sub‐total 35,000 43,750 8,750
5049900018 MECHANIC TOOLS/SHOESMechanics tool and shoe allowance 35,200 50,000 14,800
Sub‐total 35,200 50,000 14,800
5049900019 SMALL TOOLS & EQUIPMENTSmall tools & equipment used in the repair of vehicles, facilities and equipment
16,000 64,000 48,000
Sub‐total 16,000 64,000 48,000
5049900020 DECALS‐FIXED ROUTEMinor decal replacements on FR vehicles 5,665 50,000 44,335
Sub‐total 5,665 50,000 44,335
5049900021 REPAIR PARTS‐ FIXED ROUTEAll parts needed to maintain FR buses 1,166,019 1,357,500 191,481
Sub‐total 1,166,019 1,357,500 191,481
Page 178 of 400
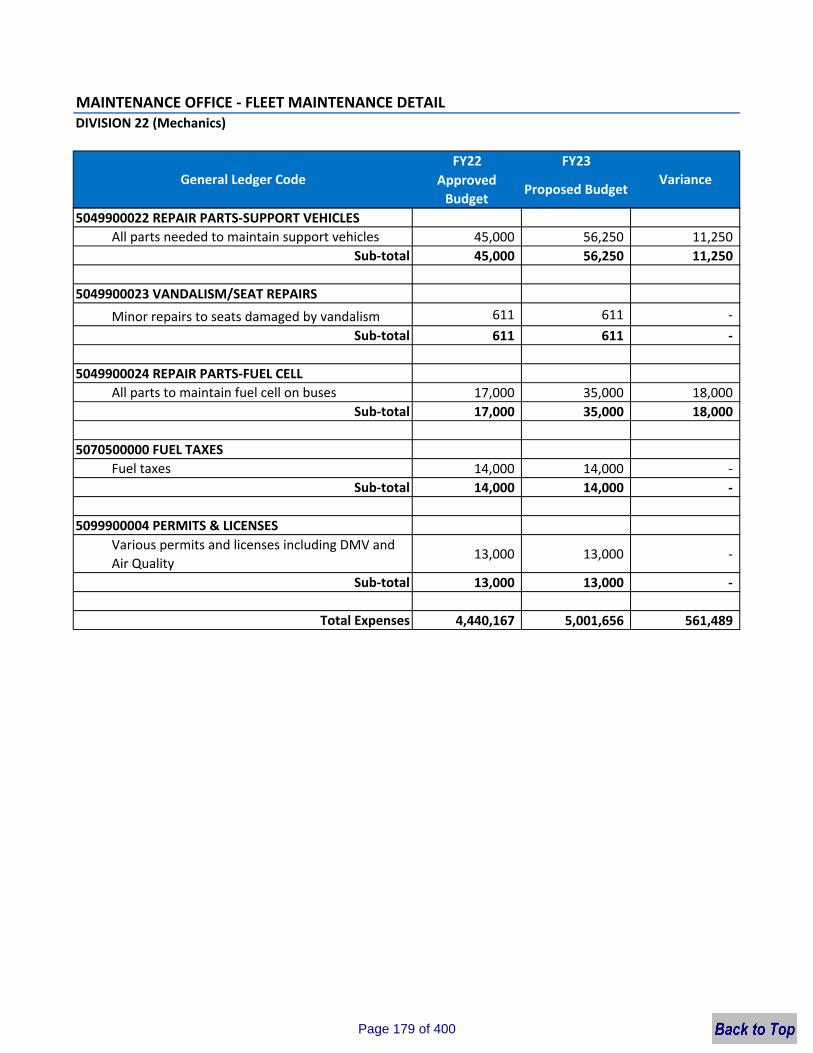
MAINTENANCE OFFICE ‐ FLEET MAINTENANCE DETAILDIVISION 22 (Mechanics)
FY22 FY23Approved Budget
Proposed BudgetGeneral Ledger Code Variance
5049900022 REPAIR PARTS‐SUPPORT VEHICLESAll parts needed to maintain support vehicles 45,000 56,250 11,250
Sub‐total 45,000 56,250 11,250
5049900023 VANDALISM/SEAT REPAIRSMinor repairs to seats damaged by vandalism 611 611 ‐
Sub‐total 611 611 ‐
5049900024 REPAIR PARTS‐FUEL CELLAll parts to maintain fuel cell on buses 17,000 35,000 18,000
Sub‐total 17,000 35,000 18,000
5070500000 FUEL TAXESFuel taxes 14,000 14,000 ‐
Sub‐total 14,000 14,000 ‐
5099900004 PERMITS & LICENSESVarious permits and licenses including DMV and Air Quality
13,000 13,000 ‐
Sub‐total 13,000 13,000 ‐
Total Expenses 4,440,167 5,001,656 561,489
Page 179 of 400

MAINTENANCE OFFICE ‐ FLEET MAINTENANCE DETAILDivision 13 (Paratransit ‐ Maintenance Portion Only)
FY22 FY23Approved Budget
Proposed Budget
5039900001 PARATRANSIT CONTRACT SVC‐TOWINGTowing services for paratransit vehicles 4,000 4,000 ‐
Sub‐total 4,000 4,000 ‐
5039900002 PARATRANSIT OUTSIDE VEHICLE REPAIRRepairs to paratransit fleet not performed by SunLine employees
2,500 2,500 ‐
Sub‐total 2,500 2,500 ‐
5039900003 GENERAL SERVICESMonthly maintenance for SmartDrive 20,160 24,560 4,400
Sub‐total 20,160 24,560 4,400
5040101001 PARATRANSIT FUEL‐CNGFuel for paratransit vehicles 200,000 266,340 66,340
Sub‐total 200,000 266,340 66,340
5040200005 PARATRANSIT TIRESTire lease 43,000 52,010 9,010
Sub‐total 43,000 52,010 9,010
5049900006 PARATRANSIT REPAIR PARTSRepair parts for paratransit vehicles 175,471 176,339 868
Sub‐total 175,471 176,339 868
5049900007 PARATRANSIT GLASS REPLACEMENTGlass replacement for paratransit vehicles 950 950 ‐
Sub‐total 950 950 ‐
5049900200 DECALSDecal replacements ‐ 6,000 6,000
Sub‐total ‐ 6,000 6,000
Total Expenses 446,081 532,699 86,618
General Ledger Code Variance
Page 180 of 400
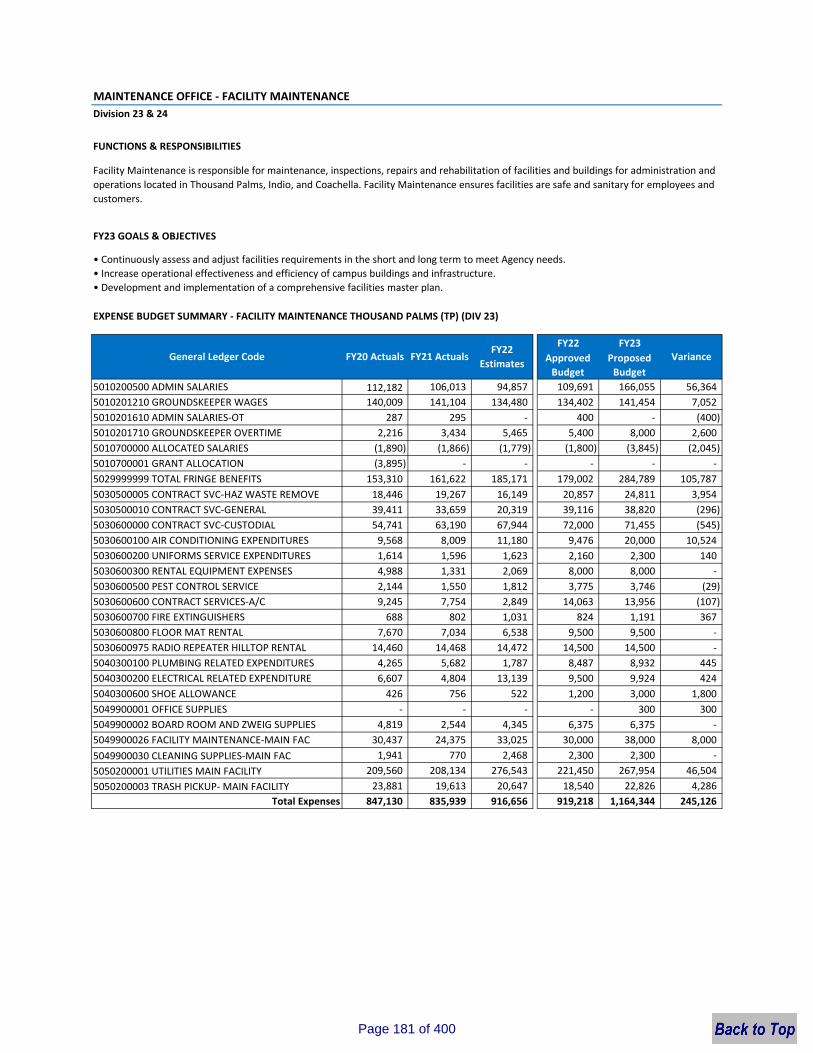
MAINTENANCE OFFICE ‐ FACILITY MAINTENANCEDivision 23 & 24
FUNCTIONS & RESPONSIBILITIES
FY23 GOALS & OBJECTIVES
• Continuously assess and adjust facilities requirements in the short and long term to meet Agency needs.• Increase operational effectiveness and efficiency of campus buildings and infrastructure.• Development and implementation of a comprehensive facilities master plan.
EXPENSE BUDGET SUMMARY ‐ FACILITY MAINTENANCE THOUSAND PALMS (TP) (DIV 23)
FY22 FY23Approved Budget
Proposed Budget
5010200500 ADMIN SALARIES 112,182 106,013 94,857 109,691 166,055 56,364 5010201210 GROUNDSKEEPER WAGES 140,009 141,104 134,480 134,402 141,454 7,052 5010201610 ADMIN SALARIES‐OT 287 295 ‐ 400 ‐ (400) 5010201710 GROUNDSKEEPER OVERTIME 2,216 3,434 5,465 5,400 8,000 2,600 5010700000 ALLOCATED SALARIES (1,890) (1,866) (1,779) (1,800) (3,845) (2,045) 5010700001 GRANT ALLOCATION (3,895) ‐ ‐ ‐ ‐ ‐5029999999 TOTAL FRINGE BENEFITS 153,310 161,622 185,171 179,002 284,789 105,787 5030500005 CONTRACT SVC‐HAZ WASTE REMOVE 18,446 19,267 16,149 20,857 24,811 3,954 5030500010 CONTRACT SVC‐GENERAL 39,411 33,659 20,319 39,116 38,820 (296) 5030600000 CONTRACT SVC‐CUSTODIAL 54,741 63,190 67,944 72,000 71,455 (545) 5030600100 AIR CONDITIONING EXPENDITURES 9,568 8,009 11,180 9,476 20,000 10,524 5030600200 UNIFORMS SERVICE EXPENDITURES 1,614 1,596 1,623 2,160 2,300 140 5030600300 RENTAL EQUIPMENT EXPENSES 4,988 1,331 2,069 8,000 8,000 ‐5030600500 PEST CONTROL SERVICE 2,144 1,550 1,812 3,775 3,746 (29) 5030600600 CONTRACT SERVICES‐A/C 9,245 7,754 2,849 14,063 13,956 (107) 5030600700 FIRE EXTINGUISHERS 688 802 1,031 824 1,191 367 5030600800 FLOOR MAT RENTAL 7,670 7,034 6,538 9,500 9,500 ‐5030600975 RADIO REPEATER HILLTOP RENTAL 14,460 14,468 14,472 14,500 14,500 ‐5040300100 PLUMBING RELATED EXPENDITURES 4,265 5,682 1,787 8,487 8,932 445 5040300200 ELECTRICAL RELATED EXPENDITURE 6,607 4,804 13,139 9,500 9,924 424 5040300600 SHOE ALLOWANCE 426 756 522 1,200 3,000 1,800 5049900001 OFFICE SUPPLIES ‐ ‐ ‐ ‐ 300 300 5049900002 BOARD ROOM AND ZWEIG SUPPLIES 4,819 2,544 4,345 6,375 6,375 ‐5049900026 FACILITY MAINTENANCE‐MAIN FAC 30,437 24,375 33,025 30,000 38,000 8,000 5049900030 CLEANING SUPPLIES‐MAIN FAC 1,941 770 2,468 2,300 2,300 ‐5050200001 UTILITIES MAIN FACILITY 209,560 208,134 276,543 221,450 267,954 46,504 5050200003 TRASH PICKUP‐ MAIN FACILITY 23,881 19,613 20,647 18,540 22,826 4,286
Total Expenses 847,130 835,939 916,656 919,218 1,164,344 245,126
Facility Maintenance is responsible for maintenance, inspections, repairs and rehabilitation of facilities and buildings for administration and operations located in Thousand Palms, Indio, and Coachella. Facility Maintenance ensures facilities are safe and sanitary for employees and customers.
General Ledger Code VarianceFY20 ActualsFY22
EstimatesFY21 Actuals
Page 181 of 400
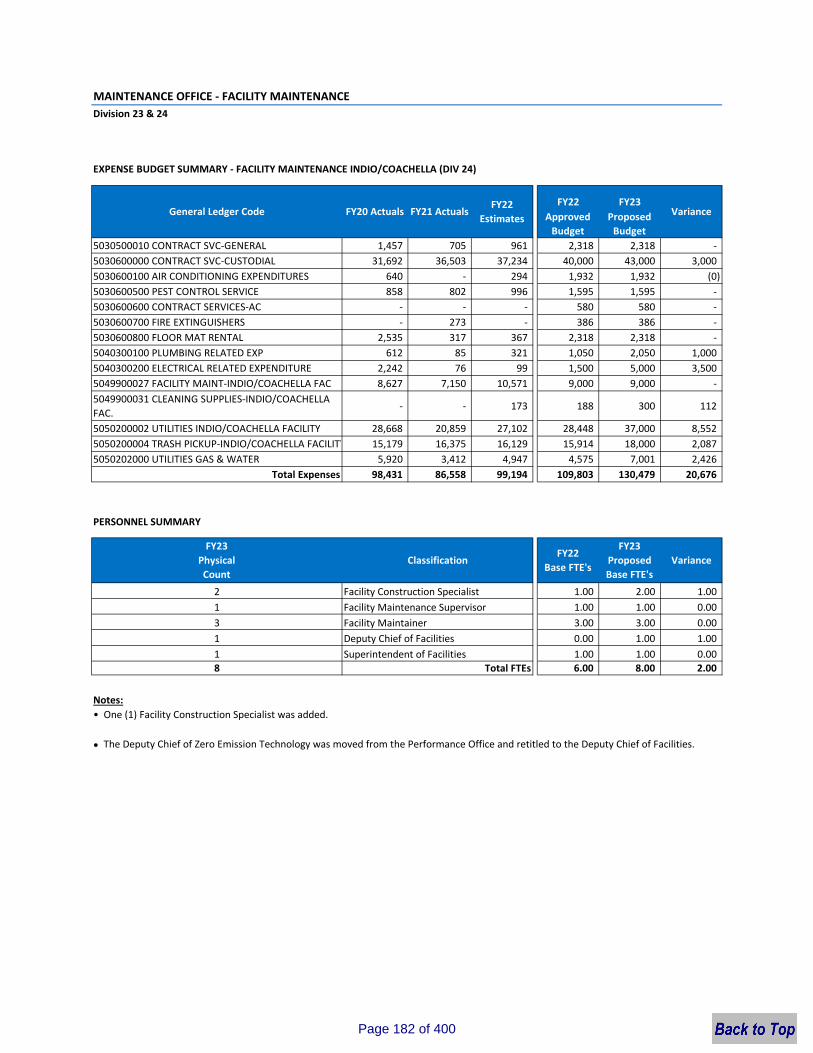
MAINTENANCE OFFICE ‐ FACILITY MAINTENANCEDivision 23 & 24
EXPENSE BUDGET SUMMARY ‐ FACILITY MAINTENANCE INDIO/COACHELLA (DIV 24)
FY22 FY23Approved Budget
Proposed Budget
5030500010 CONTRACT SVC‐GENERAL 1,457 705 961 2,318 2,318 ‐5030600000 CONTRACT SVC‐CUSTODIAL 31,692 36,503 37,234 40,000 43,000 3,000 5030600100 AIR CONDITIONING EXPENDITURES 640 ‐ 294 1,932 1,932 (0)5030600500 PEST CONTROL SERVICE 858 802 996 1,595 1,595 ‐5030600600 CONTRACT SERVICES‐AC ‐ ‐ ‐ 580 580 ‐5030600700 FIRE EXTINGUISHERS ‐ 273 ‐ 386 386 ‐5030600800 FLOOR MAT RENTAL 2,535 317 367 2,318 2,318 ‐5040300100 PLUMBING RELATED EXP 612 85 321 1,050 2,050 1,000 5040300200 ELECTRICAL RELATED EXPENDITURE 2,242 76 99 1,500 5,000 3,500 5049900027 FACILITY MAINT‐INDIO/COACHELLA FAC 8,627 7,150 10,571 9,000 9,000 ‐5049900031 CLEANING SUPPLIES‐INDIO/COACHELLA FAC.
‐ ‐ 173 188 300 112
5050200002 UTILITIES INDIO/COACHELLA FACILITY 28,668 20,859 27,102 28,448 37,000 8,552 5050200004 TRASH PICKUP‐INDIO/COACHELLA FACILITY 15,179 16,375 16,129 15,914 18,000 2,087 5050202000 UTILITIES GAS & WATER 5,920 3,412 4,947 4,575 7,001 2,426
Total Expenses 98,431 86,558 99,194 109,803 130,479 20,676
2 1.00 2.00 1.001 1.00 1.00 0.003 3.00 3.00 0.001 Deputy Chief of Facilities 0.00 1.00 1.001 1.00 1.00 0.008 6.00 8.00 2.00
Notes:
● The Deputy Chief of Zero Emission Technology was moved from the Performance Office and retitled to the Deputy Chief of Facilities.
Total FTEsSuperintendent of Facilities
FY21 Actuals FY22
Estimates
Variance
Facility Maintainer
Facility Construction SpecialistFacility Maintenance Supervisor
• One (1) Facility Construction Specialist was added.
PERSONNEL SUMMARY
FY23 Proposed Base FTE's
FY22Base FTE's
FY23PhysicalCount
FY20 Actuals Variance
Classification
General Ledger Code
Page 182 of 400
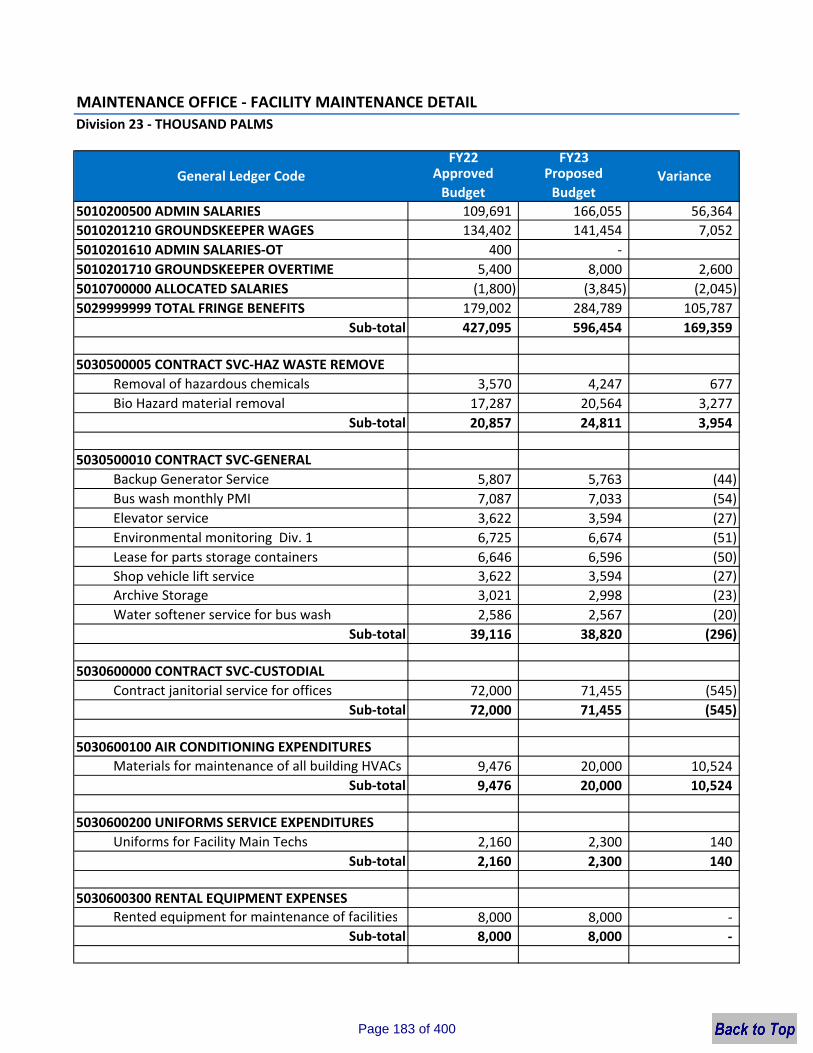
MAINTENANCE OFFICE ‐ FACILITY MAINTENANCE DETAILDivision 23 ‐ THOUSAND PALMS
FY22 FY23Approved Budget
Proposed Budget
5010200500 ADMIN SALARIES 109,691 166,055 56,364 5010201210 GROUNDSKEEPER WAGES 134,402 141,454 7,0525010201610 ADMIN SALARIES‐OT 400 ‐ 5010201710 GROUNDSKEEPER OVERTIME 5,400 8,000 2,6005010700000 ALLOCATED SALARIES (1,800) (3,845) (2,045) 5029999999 TOTAL FRINGE BENEFITS 179,002 284,789 105,787
Sub‐total 427,095 596,454 169,359
5030500005 CONTRACT SVC‐HAZ WASTE REMOVERemoval of hazardous chemicals 3,570 4,247 677 Bio Hazard material removal 17,287 20,564 3,277
Sub‐total 20,857 24,811 3,954
5030500010 CONTRACT SVC‐GENERALBackup Generator Service 5,807 5,763 (44) Bus wash monthly PMI 7,087 7,033 (54) Elevator service 3,622 3,594 (27) Environmental monitoring Div. 1 6,725 6,674 (51) Lease for parts storage containers 6,646 6,596 (50) Shop vehicle lift service 3,622 3,594 (27) Archive Storage 3,021 2,998 (23) Water softener service for bus wash 2,586 2,567 (20)
Sub‐total 39,116 38,820 (296)
5030600000 CONTRACT SVC‐CUSTODIALContract janitorial service for offices 72,000 71,455 (545)
Sub‐total 72,000 71,455 (545)
5030600100 AIR CONDITIONING EXPENDITURESMaterials for maintenance of all building HVACs 9,476 20,000 10,524
Sub‐total 9,476 20,000 10,524
5030600200 UNIFORMS SERVICE EXPENDITURESUniforms for Facility Main Techs 2,160 2,300 140
Sub‐total 2,160 2,300 140
5030600300 RENTAL EQUIPMENT EXPENSESRented equipment for maintenance of facilities 8,000 8,000 ‐
Sub‐total 8,000 8,000 ‐
General Ledger Code Variance
Page 183 of 400

MAINTENANCE OFFICE ‐ FACILITY MAINTENANCE DETAILDivision 23 ‐ THOUSAND PALMS
FY22 FY23Approved Budget
Proposed Budget
General Ledger Code Variance
5030600500 PEST CONTROL SERVICEMonthly pest control maintenance 3,775 3,746 (29)
Sub‐total 3,775 3,746 (29)
5030600600 CONTRACT SERVICES‐A/CBi‐annual HVAC service all facilities 14,063 13,956 (107)
Sub‐total 14,063 13,956 (107)
5030600700 FIRE EXTINGUISHERSAnnual fire extinguisher inspections 824 1,191 367
Sub‐total 824 1,191 367
5030600800 FLOOR MAT RENTALMonthly rental of floor mats 9,500 9,500 ‐
Sub‐total 9,500 9,500 ‐
5030600975 RADIO REPEATER HILLTOP RENTALRental of tower space for two way radios 14,500 14,500 ‐
Sub‐total 14,500 14,500 ‐
5040300100 PLUMBING RELATED EXPENDITURESMaterials for plumbing repairs 8,487 8,932 445
Sub‐total 8,487 8,932 445
5040300200 ELECTRICAL RELATED EXPENDITUREMaterials for electrical repairs 9,500 9,924 424
Sub‐total 9,500 9,924 424
5040300600 SHOE ALLOWANCEShoe allowance for facility maintenance employees
1,200 3,000 1,800
Sub‐total 1,200 3,000 1,800
5049900001 OFFICE SUPPLIESOffice supplies ‐ 300 300
Sub‐total ‐ 300 300
5049900002 BOARD ROOM AND ZWEIG SUPPLIESSupplies for meetings 6,375 6,375 ‐
Sub‐total 6,375 6,375 ‐
Page 184 of 400
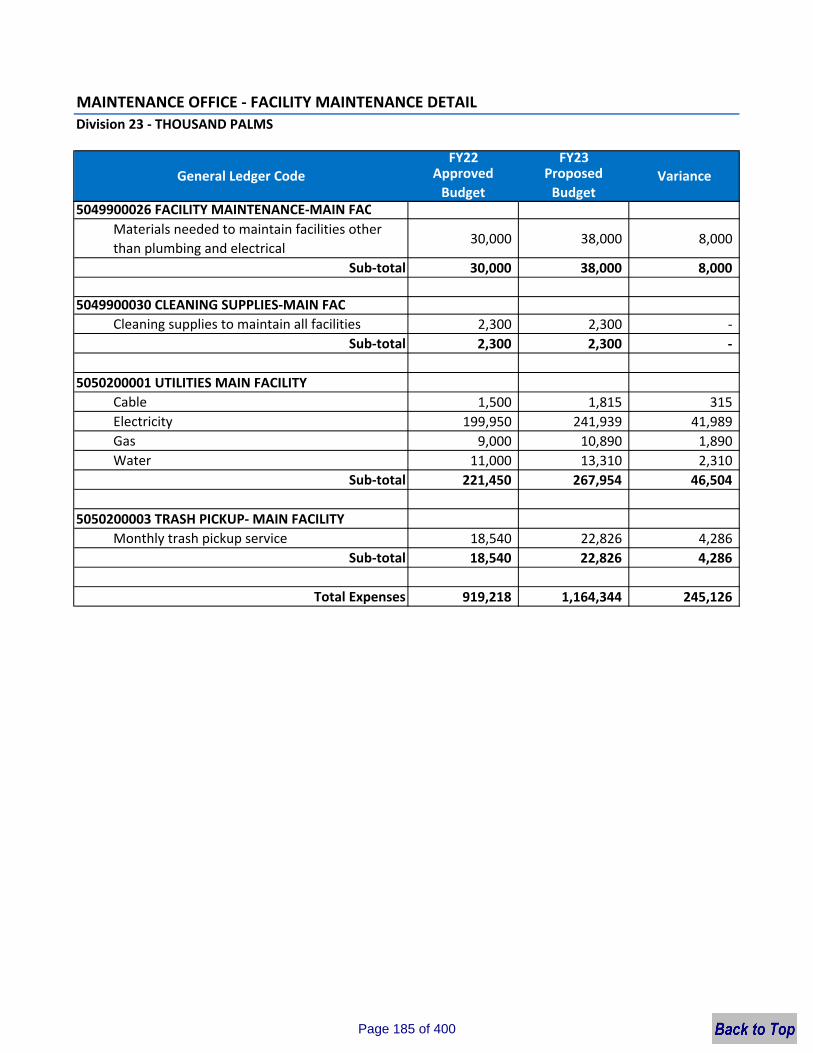
MAINTENANCE OFFICE ‐ FACILITY MAINTENANCE DETAILDivision 23 ‐ THOUSAND PALMS
FY22 FY23Approved Budget
Proposed Budget
General Ledger Code Variance
5049900026 FACILITY MAINTENANCE‐MAIN FACMaterials needed to maintain facilities other than plumbing and electrical
30,000 38,000 8,000
Sub‐total 30,000 38,000 8,000
5049900030 CLEANING SUPPLIES‐MAIN FACCleaning supplies to maintain all facilities 2,300 2,300 ‐
Sub‐total 2,300 2,300 ‐
5050200001 UTILITIES MAIN FACILITYCable 1,500 1,815 315 Electricity 199,950 241,939 41,989 Gas 9,000 10,890 1,890Water 11,000 13,310 2,310
Sub‐total 221,450 267,954 46,504
5050200003 TRASH PICKUP‐ MAIN FACILITYMonthly trash pickup service 18,540 22,826 4,286
Sub‐total 18,540 22,826 4,286
Total Expenses 919,218 1,164,344 245,126
Page 185 of 400
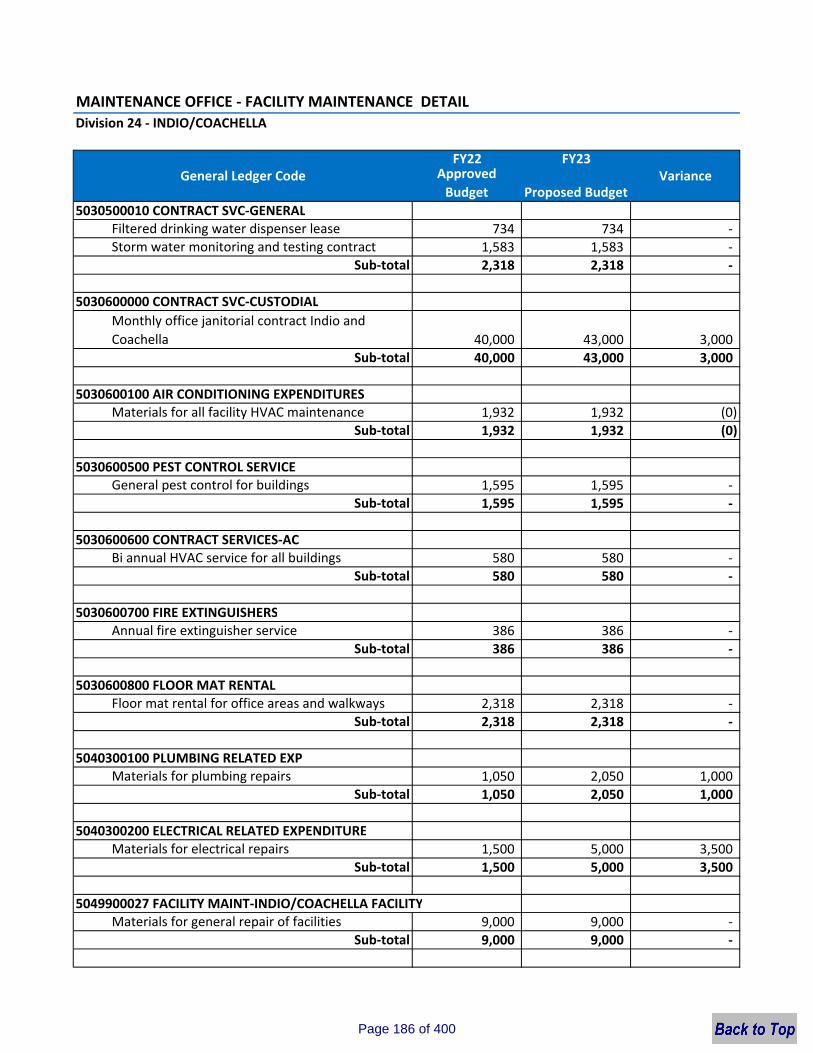
MAINTENANCE OFFICE ‐ FACILITY MAINTENANCE DETAILDivision 24 ‐ INDIO/COACHELLA
FY22 FY23Approved Budget Proposed Budget
5030500010 CONTRACT SVC‐GENERALFiltered drinking water dispenser lease 734 734 ‐ Storm water monitoring and testing contract 1,583 1,583 ‐
Sub‐total 2,318 2,318 ‐
5030600000 CONTRACT SVC‐CUSTODIALMonthly office janitorial contract Indio and Coachella 40,000 43,000 3,000
Sub‐total 40,000 43,000 3,000
5030600100 AIR CONDITIONING EXPENDITURESMaterials for all facility HVAC maintenance 1,932 1,932 (0)
Sub‐total 1,932 1,932 (0)
5030600500 PEST CONTROL SERVICEGeneral pest control for buildings 1,595 1,595 ‐
Sub‐total 1,595 1,595 ‐
5030600600 CONTRACT SERVICES‐ACBi annual HVAC service for all buildings 580 580 ‐
Sub‐total 580 580 ‐
5030600700 FIRE EXTINGUISHERSAnnual fire extinguisher service 386 386 ‐
Sub‐total 386 386 ‐
5030600800 FLOOR MAT RENTALFloor mat rental for office areas and walkways 2,318 2,318 ‐
Sub‐total 2,318 2,318 ‐
5040300100 PLUMBING RELATED EXPMaterials for plumbing repairs 1,050 2,050 1,000
Sub‐total 1,050 2,050 1,000
5040300200 ELECTRICAL RELATED EXPENDITUREMaterials for electrical repairs 1,500 5,000 3,500
Sub‐total 1,500 5,000 3,500
5049900027 FACILITY MAINT‐INDIO/COACHELLA FACILITYMaterials for general repair of facilities 9,000 9,000 ‐
Sub‐total 9,000 9,000 ‐
General Ledger Code Variance
Page 186 of 400
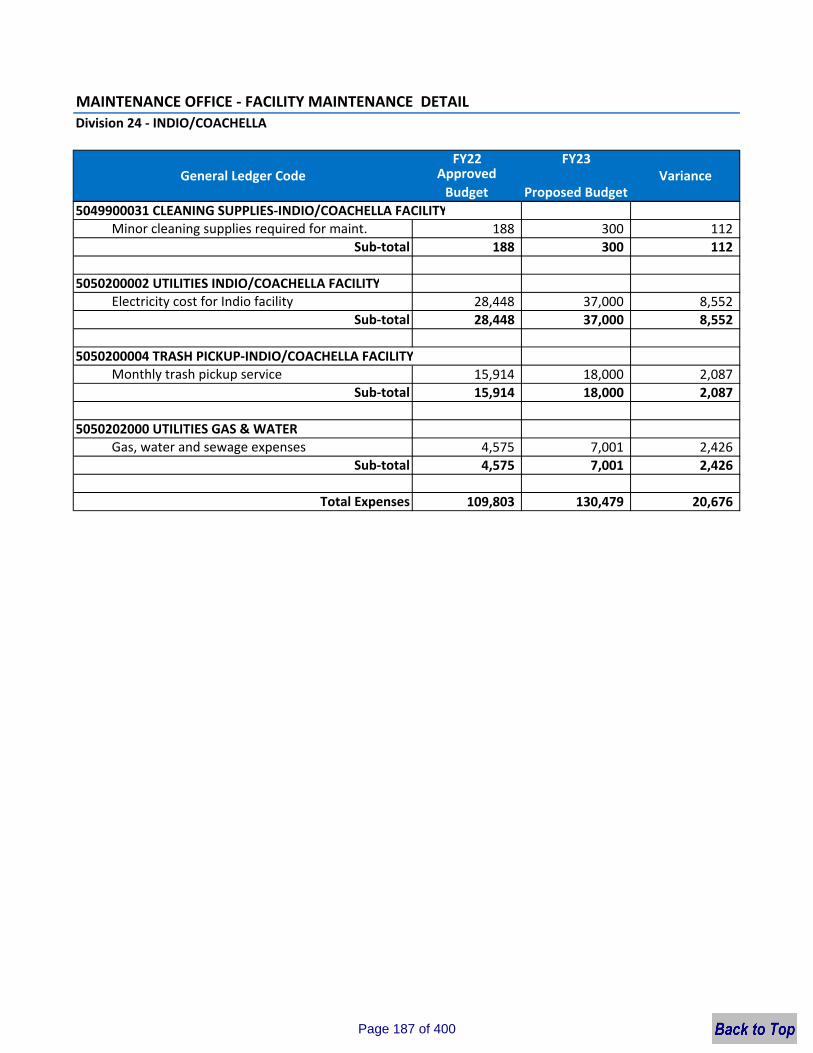
MAINTENANCE OFFICE ‐ FACILITY MAINTENANCE DETAILDivision 24 ‐ INDIO/COACHELLA
FY22 FY23Approved Budget Proposed Budget
General Ledger Code Variance
5049900031 CLEANING SUPPLIES‐INDIO/COACHELLA FACILITYMinor cleaning supplies required for maint. 188 300 112
Sub‐total 188 300 112
5050200002 UTILITIES INDIO/COACHELLA FACILITYElectricity cost for Indio facility 28,448 37,000 8,552
Sub‐total 28,448 37,000 8,552
5050200004 TRASH PICKUP‐INDIO/COACHELLA FACILITYMonthly trash pickup service 15,914 18,000 2,087
Sub‐total 15,914 18,000 2,087
5050202000 UTILITIES GAS & WATERGas, water and sewage expenses 4,575 7,001 2,426
Sub‐total 4,575 7,001 2,426
Total Expenses 109,803 130,479 20,676
Page 187 of 400
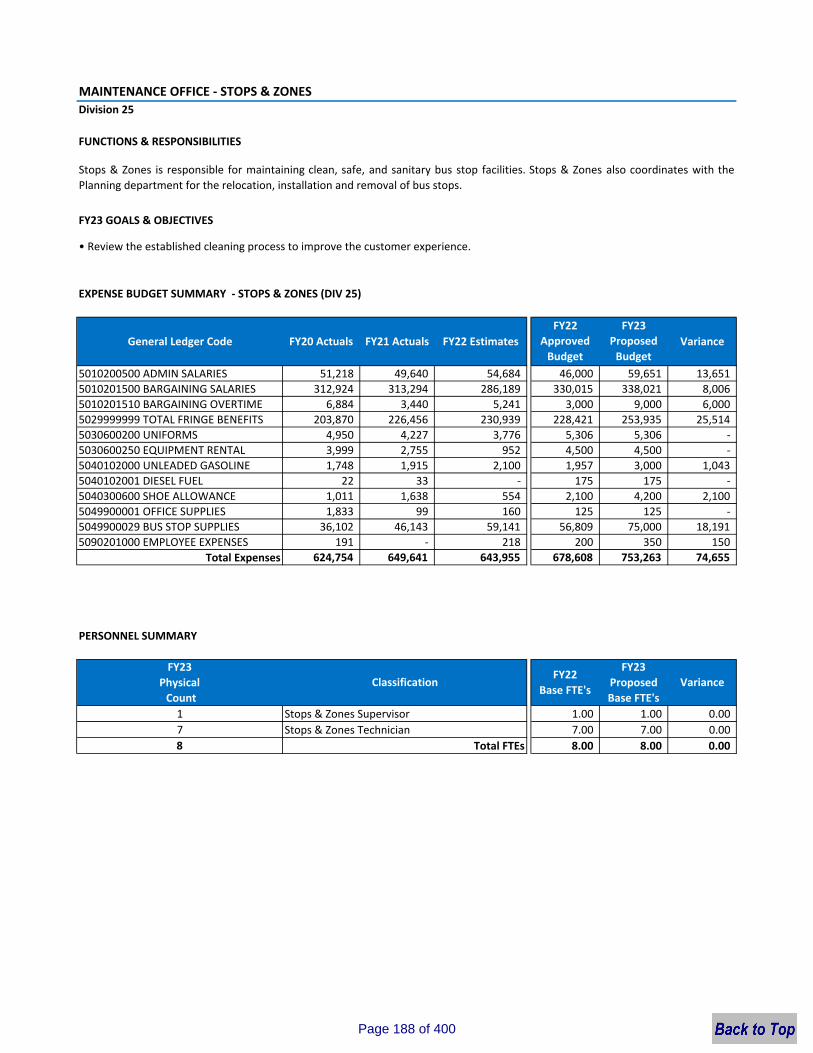
MAINTENANCE OFFICE ‐ STOPS & ZONESDivision 25
FUNCTIONS & RESPONSIBILITIES
FY23 GOALS & OBJECTIVES
• Review the established cleaning process to improve the customer experience.
EXPENSE BUDGET SUMMARY ‐ STOPS & ZONES (DIV 25)
FY22 FY23Approved Budget
Proposed Budget
5010200500 ADMIN SALARIES 51,218 49,640 54,684 46,000 59,651 13,651 5010201500 BARGAINING SALARIES 312,924 313,294 286,189 330,015 338,021 8,006 5010201510 BARGAINING OVERTIME 6,884 3,440 5,241 3,000 9,000 6,000 5029999999 TOTAL FRINGE BENEFITS 203,870 226,456 230,939 228,421 253,935 25,514 5030600200 UNIFORMS 4,950 4,227 3,776 5,306 5,306 ‐ 5030600250 EQUIPMENT RENTAL 3,999 2,755 952 4,500 4,500 ‐ 5040102000 UNLEADED GASOLINE 1,748 1,915 2,100 1,957 3,000 1,043 5040102001 DIESEL FUEL 22 33 ‐ 175 175 ‐ 5040300600 SHOE ALLOWANCE 1,011 1,638 554 2,100 4,200 2,100 5049900001 OFFICE SUPPLIES 1,833 99 160 125 125 ‐ 5049900029 BUS STOP SUPPLIES 36,102 46,143 59,141 56,809 75,000 18,191 5090201000 EMPLOYEE EXPENSES 191 ‐ 218 200 350 150
Total Expenses 624,754 649,641 643,955 678,608 753,263 74,655
1 1.00 1.00 0.007 7.00 7.00 0.008 8.00 8.00 0.00
Stops & Zones is responsible for maintaining clean, safe, and sanitary bus stop facilities. Stops & Zones also coordinates with thePlanning department for the relocation, installation and removal of bus stops.
PERSONNEL SUMMARY
General Ledger Code FY20 Actuals FY21 Actuals FY22 Estimates Variance
Stops & Zones TechnicianTotal FTEs
FY23Physical Count
VarianceFY22
Base FTE's
FY23 Proposed Base FTE's
Stops & Zones Supervisor
Classification
Page 188 of 400
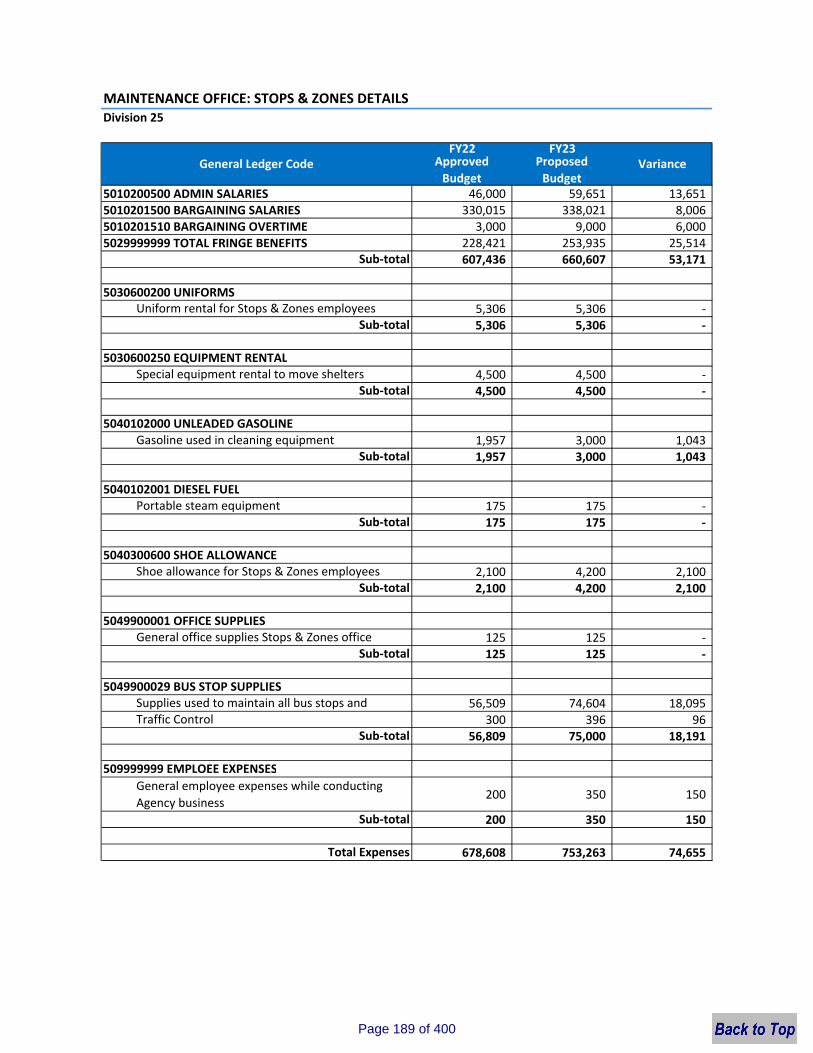
MAINTENANCE OFFICE: STOPS & ZONES DETAILSDivision 25
FY22 FY23Approved Budget
Proposed Budget
5010200500 ADMIN SALARIES 46,000 59,651 13,651 5010201500 BARGAINING SALARIES 330,015 338,021 8,006 5010201510 BARGAINING OVERTIME 3,000 9,000 6,000 5029999999 TOTAL FRINGE BENEFITS 228,421 253,935 25,514
Sub‐total 607,436 660,607 53,171
5030600200 UNIFORMSUniform rental for Stops & Zones employees 5,306 5,306 ‐
Sub‐total 5,306 5,306 ‐
5030600250 EQUIPMENT RENTALSpecial equipment rental to move shelters 4,500 4,500 ‐
Sub‐total 4,500 4,500 ‐
5040102000 UNLEADED GASOLINEGasoline used in cleaning equipment 1,957 3,000 1,043
Sub‐total 1,957 3,000 1,043
5040102001 DIESEL FUELPortable steam equipment 175 175 ‐
Sub‐total 175 175 ‐
5040300600 SHOE ALLOWANCEShoe allowance for Stops & Zones employees 2,100 4,200 2,100
Sub‐total 2,100 4,200 2,100
5049900001 OFFICE SUPPLIESGeneral office supplies Stops & Zones office 125 125 ‐
Sub‐total 125 125 ‐
5049900029 BUS STOP SUPPLIESSupplies used to maintain all bus stops and 56,509 74,604 18,095 Traffic Control 300 396 96
Sub‐total 56,809 75,000 18,191
509999999 EMPLOEE EXPENSESGeneral employee expenses while conducting Agency business
200 350 150
Sub‐total 200 350 150
Total Expenses 678,608 753,263 74,655
General Ledger Code Variance
Page 189 of 400

CAPITAL BUDGET
Page 190 of 400
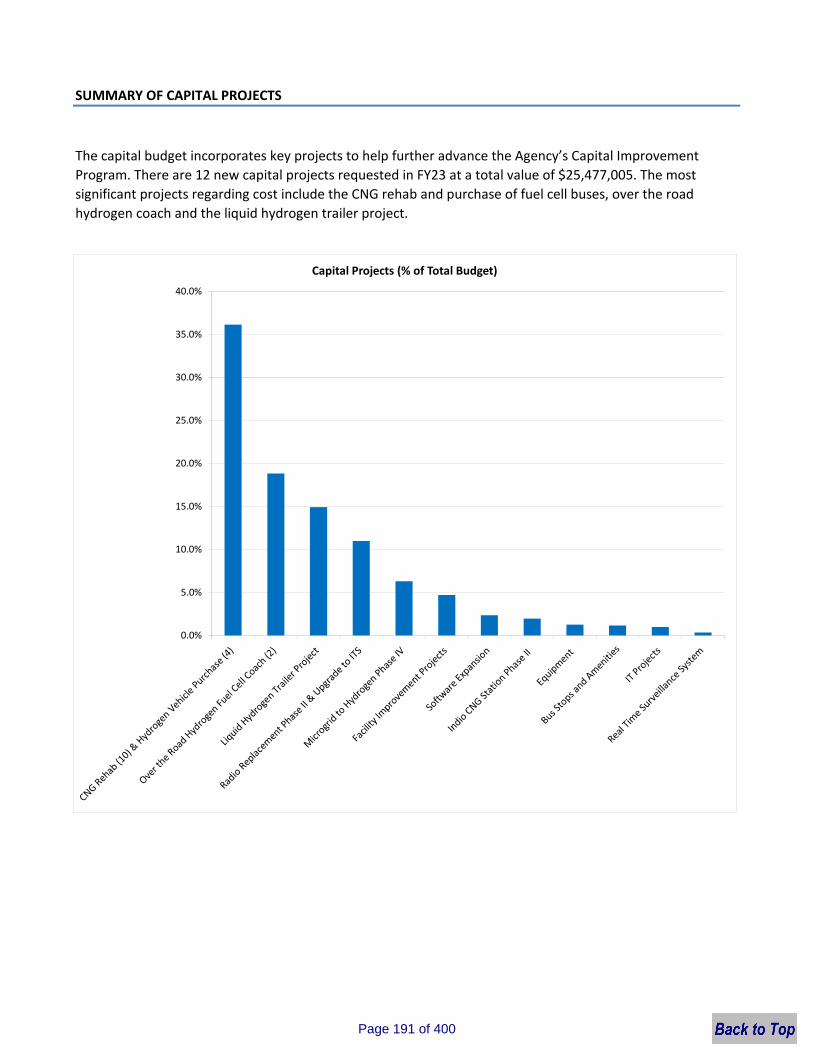
SUMMARY OF CAPITAL PROJECTS
The capital budget incorporates key projects to help further advance the Agency’s Capital Improvement Program. There are 12 new capital projects requested in FY23 at a total value of $25,477,005. The most significant projects regarding cost include the CNG rehab and purchase of fuel cell buses, over the road hydrogen coach and the liquid hydrogen trailer project.
0.0%
5.0%
10.0%
15.0%
20.0%
25.0%
30.0%
35.0%
40.0%
Capital Projects (% of Total Budget)
Page 191 of 400
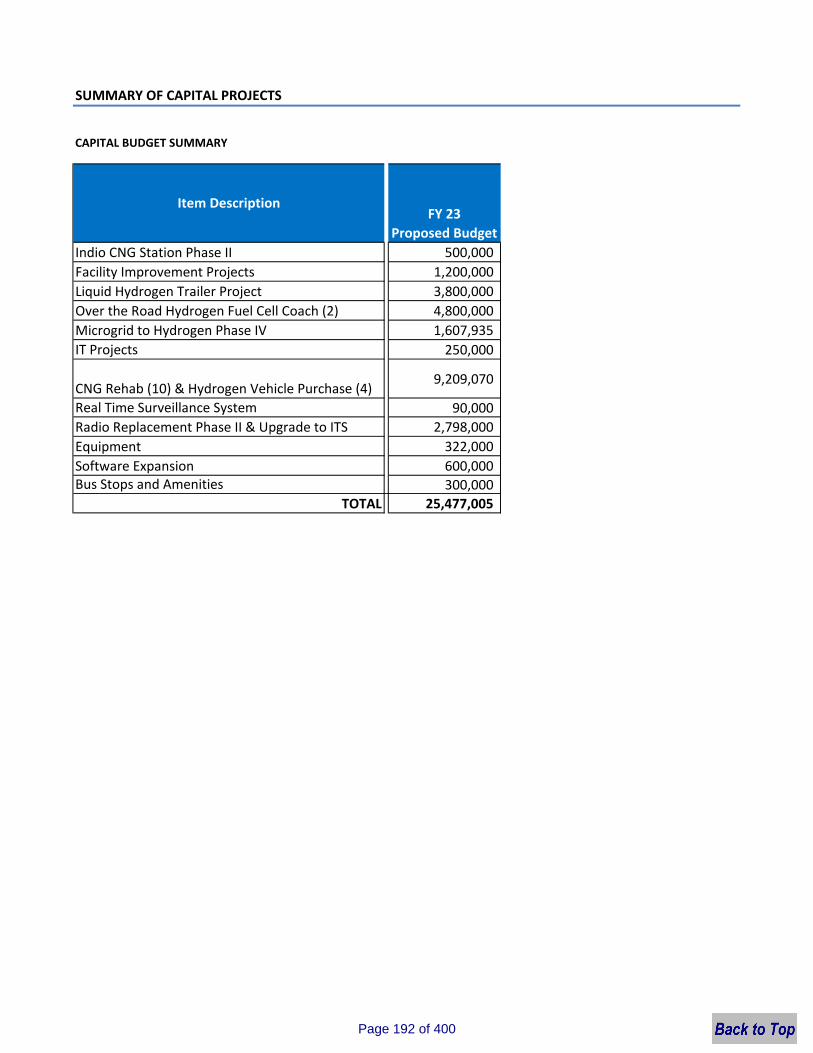
SUMMARY OF CAPITAL PROJECTS
CAPITAL BUDGET SUMMARY
Indio CNG Station Phase II 500,000 Facility Improvement Projects 1,200,000 Liquid Hydrogen Trailer Project 3,800,000 Over the Road Hydrogen Fuel Cell Coach (2) 4,800,000 Microgrid to Hydrogen Phase IV 1,607,935 IT Projects 250,000
CNG Rehab (10) & Hydrogen Vehicle Purchase (4)9,209,070
Real Time Surveillance System 90,000 Radio Replacement Phase II & Upgrade to ITS 2,798,000 Equipment 322,000 Software Expansion 600,000 Bus Stops and Amenities 300,000
TOTAL 25,477,005
FY 23Proposed Budget
Item Description
Page 192 of 400
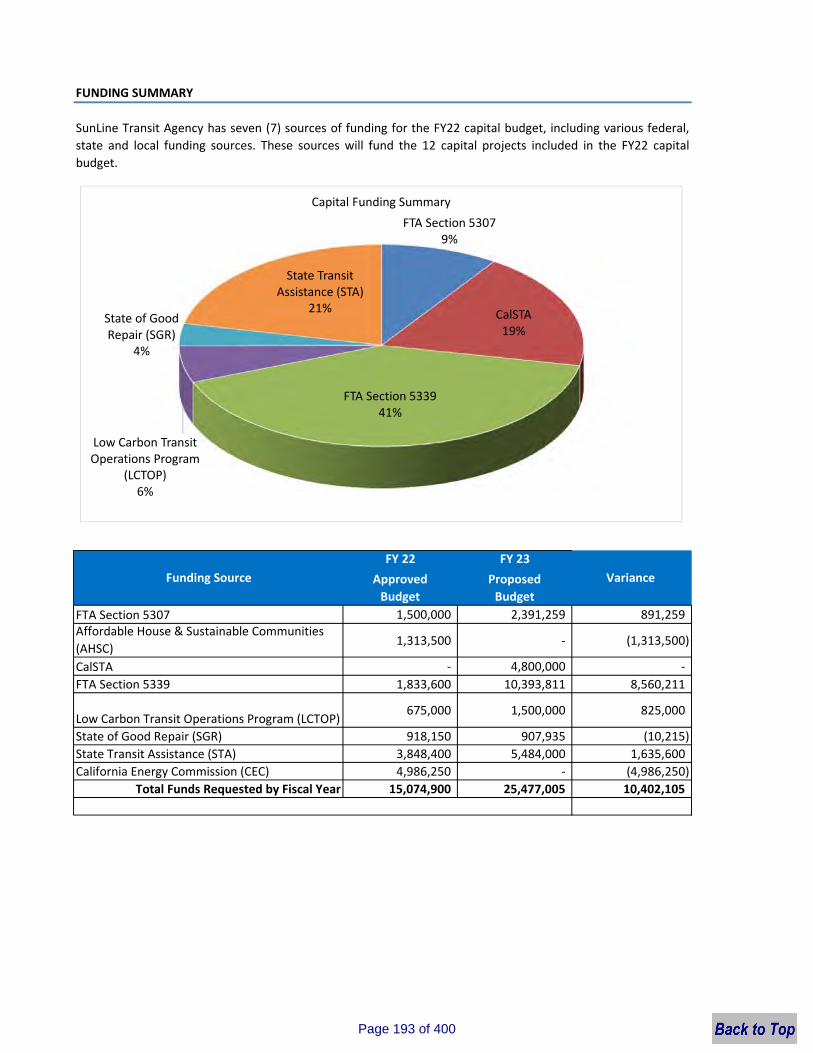
FUNDING SUMMARY
FY 22 FY 23ApprovedBudget
Proposed Budget
1,500,000 2,391,259 891,259
1,313,500 ‐ (1,313,500)
‐ 4,800,000 ‐ 1,833,600 10,393,811 8,560,211
675,000 1,500,000 825,000
918,150 907,935 (10,215) 3,848,400 5,484,000 1,635,600
California Energy Commission (CEC) 4,986,250 ‐ (4,986,250) 15,074,900 25,477,005 10,402,105
FTA Section 5339
Total Funds Requested by Fiscal Year
Funding Source
FTA Section 5307
State of Good Repair (SGR)
CalSTA
Variance
SunLine Transit Agency has seven (7) sources of funding for the FY22 capital budget, including various federal,state and local funding sources. These sources will fund the 12 capital projects included in the FY22 capitalbudget.
State Transit Assistance (STA)
Affordable House & Sustainable Communities (AHSC)
Low Carbon Transit Operations Program (LCTOP)
FTA Section 53079%
CalSTA19%
FTA Section 533941%
Low Carbon Transit Operations Program
(LCTOP)6%
State of Good Repair (SGR)
4%
State Transit Assistance (STA)
21%
Capital Funding Summary
Page 193 of 400
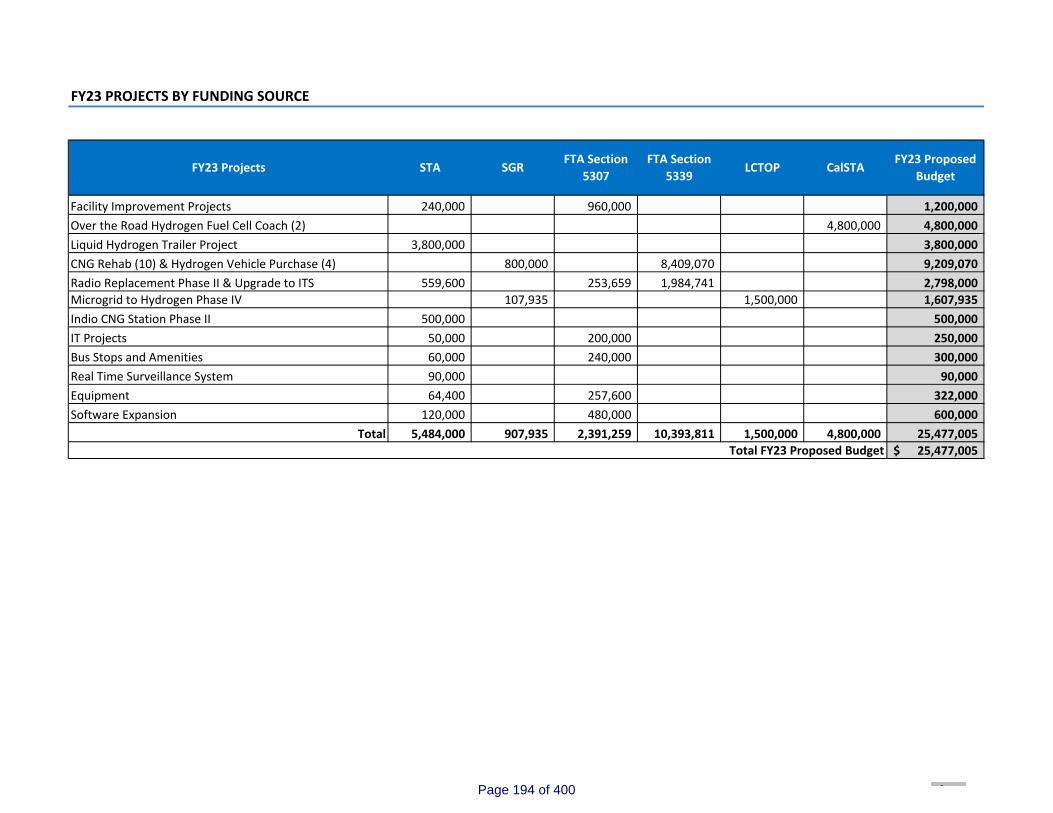
FY23 PROJECTS BY FUNDING SOURCE
Facility Improvement Projects 240,000 960,000 1,200,000 Over the Road Hydrogen Fuel Cell Coach (2) 4,800,000 4,800,000 Liquid Hydrogen Trailer Project 3,800,000 3,800,000 CNG Rehab (10) & Hydrogen Vehicle Purchase (4) 800,000 8,409,070 9,209,070 Radio Replacement Phase II & Upgrade to ITS 559,600 253,659 1,984,741 2,798,000 Microgrid to Hydrogen Phase IV 107,935 1,500,000 1,607,935 Indio CNG Station Phase II 500,000 500,000 IT Projects 50,000 200,000 250,000 Bus Stops and Amenities 60,000 240,000 300,000 Real Time Surveillance System 90,000 90,000 Equipment 64,400 257,600 322,000 Software Expansion 120,000 480,000 600,000
Total 5,484,000 907,935 2,391,259 10,393,811 1,500,000 4,800,000 25,477,005 25,477,005$ Total FY23 Proposed Budget
FY23 Projects STAFY23 Proposed
BudgetSGR LCTOP
FTA Section 5307
FTA Section 5339
CalSTA
Page 194 of 400
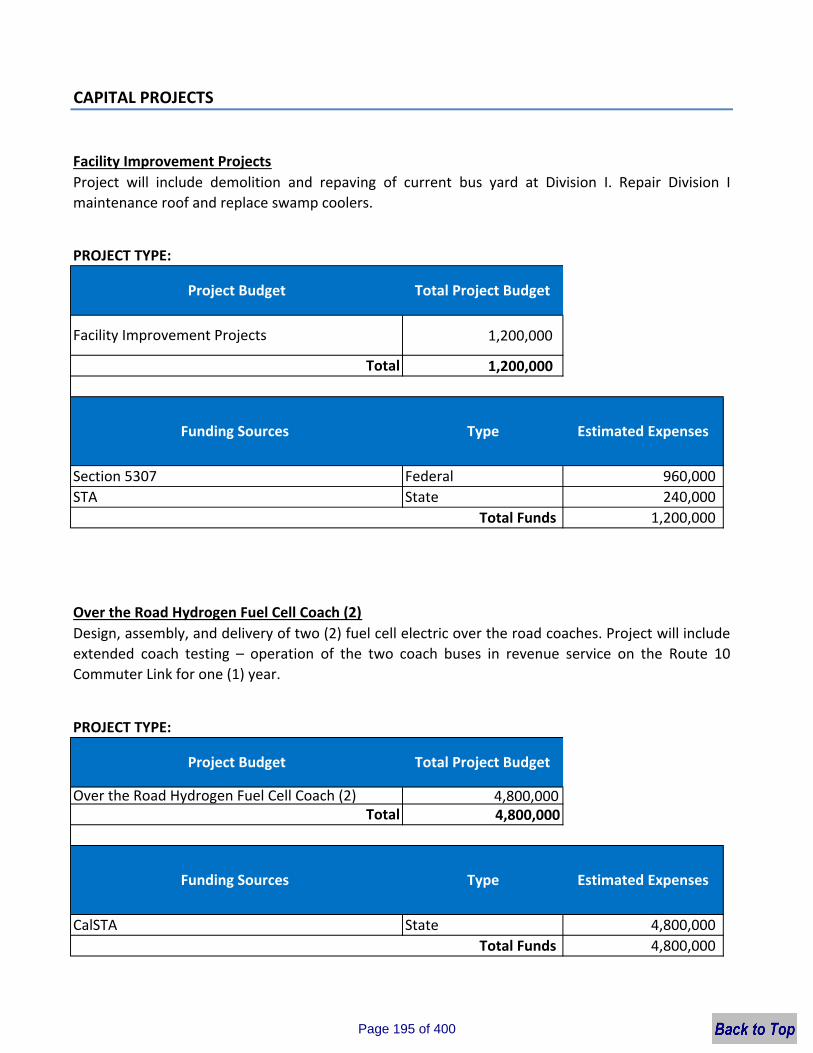
CAPITAL PROJECTS
Facility Improvement Projects
PROJECT TYPE:
1,200,000
1,200,000
Federal 960,000 State 240,000
1,200,000
Over the Road Hydrogen Fuel Cell Coach (2)
PROJECT TYPE:
4,800,000 4,800,000
State 4,800,000 4,800,000
CalSTA
Design, assembly, and delivery of two (2) fuel cell electric over the road coaches. Project will includeextended coach testing – operation of the two coach buses in revenue service on the Route 10Commuter Link for one (1) year.
STA
Estimated Expenses
Project will include demolition and repaving of current bus yard at Division I. Repair Division Imaintenance roof and replace swamp coolers.
Funding Sources
Section 5307
Total Funds
Estimated ExpensesType
Total Project Budget
Facility Improvement Projects
Total
Project Budget
Total Project Budget
Over the Road Hydrogen Fuel Cell Coach (2)
Total Funds
Total
Project Budget
Funding Sources Type
Page 195 of 400

CAPITAL PROJECTS
Liquid Hydrogen Trailer Project
PROJECT TYPE:
3,800,000 3,800,000
State 3,800,000 3,800,000
CNG Rehab (10) & Hydrogen Vehicle Purchase (4)
PROJECT TYPE:
9,209,070
9,209,070
State 800,000 Federal 8,409,070
9,209,070
STA
Rehab 10 CNG and replace four (4) Hydrogen Fuel Cell fixed route vehicles.
Project Budget
Type Estimated Expenses
Total Funds
Total
Section 5339
Funding Sources
Funding Sources
Total Project Budget
Total
Project Budget
Type Estimated Expenses
Total Funds
Total Project Budget
New liquid hydrogen station to serve as fueling resiliency for the expanding fuel cell bus fleet.
Liquid Hydrogen Trailer Project
CNG Rehab (10) & Hydrogen Vehicle Purchase (4)
SGR
Page 196 of 400
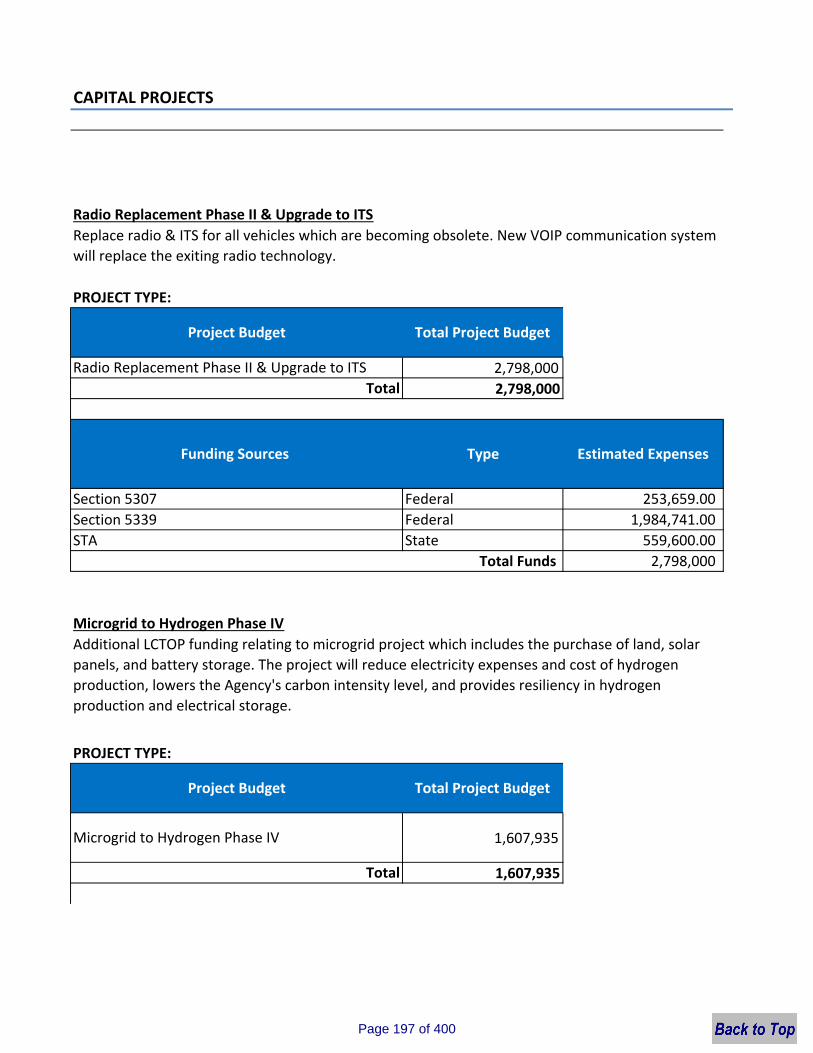
CAPITAL PROJECTS
Radio Replacement Phase II & Upgrade to ITS
PROJECT TYPE:
2,798,000 2,798,000
Federal 253,659.00 Federal 1,984,741.00 State 559,600.00
2,798,000
Microgrid to Hydrogen Phase IV
PROJECT TYPE:
1,607,935
1,607,935
Replace radio & ITS for all vehicles which are becoming obsolete. New VOIP communication system will replace the exiting radio technology.
Total
Section 5339STA
Total
Funding Sources
Additional LCTOP funding relating to microgrid project which includes the purchase of land, solar panels, and battery storage. The project will reduce electricity expenses and cost of hydrogen production, lowers the Agency's carbon intensity level, and provides resiliency in hydrogen production and electrical storage.
Estimated Expenses
Total Funds
Type
Radio Replacement Phase II & Upgrade to ITS
Section 5307
Total Project Budget
Microgrid to Hydrogen Phase IV
Project Budget
Project Budget
Total Project Budget
Page 197 of 400
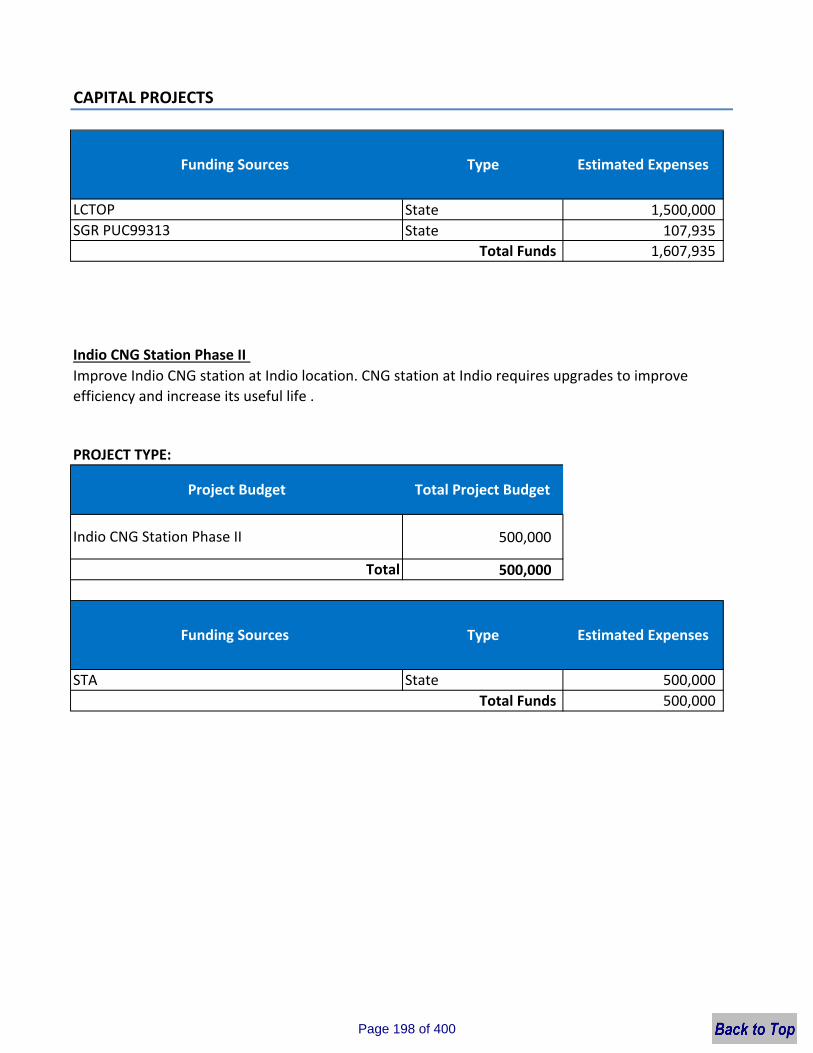
CAPITAL PROJECTS
State 1,500,000 State 107,935
1,607,935
Indio CNG Station Phase II
PROJECT TYPE:
500,000
500,000
State 500,000 500,000
SGR PUC99313
Improve Indio CNG station at Indio location. CNG station at Indio requires upgrades to improve efficiency and increase its useful life .
Total Funds
STA
LCTOP
TypeFunding Sources Estimated Expenses
Project Budget
Funding Sources
Total
Total Project Budget
Type Estimated Expenses
Indio CNG Station Phase II
Total Funds
Page 198 of 400
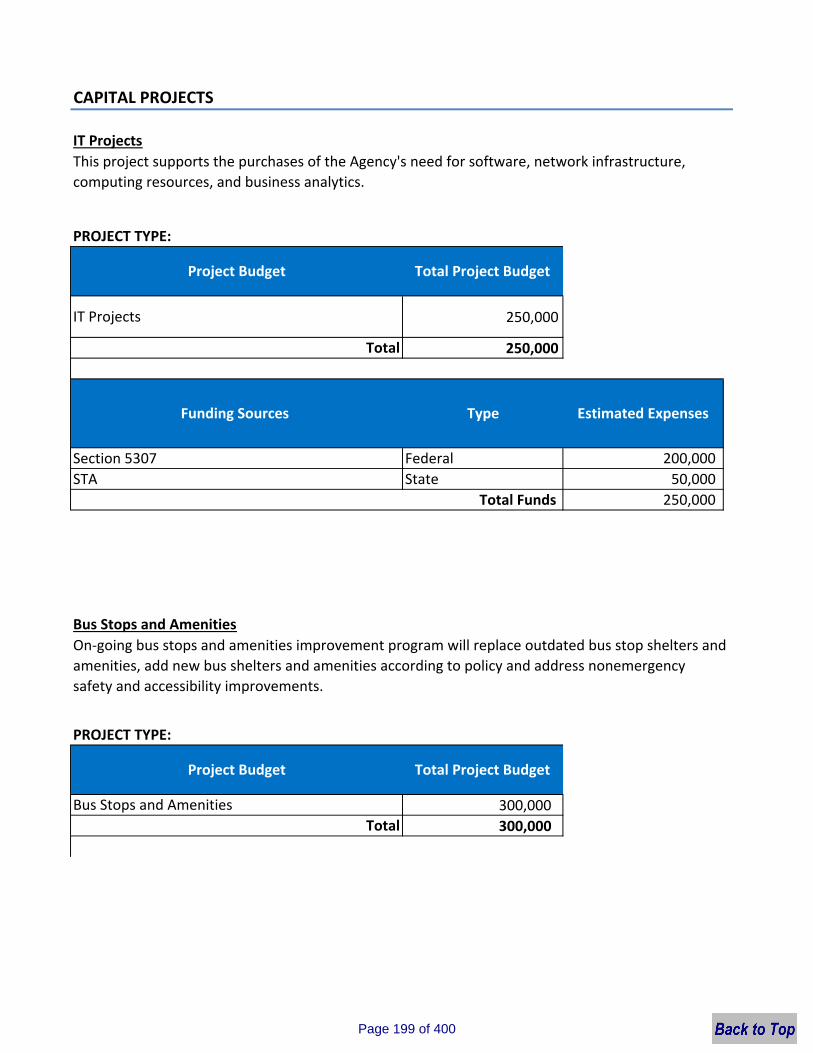
CAPITAL PROJECTS
IT Projects
PROJECT TYPE:
250,000
250,000
Federal 200,000 State 50,000
250,000
Bus Stops and Amenities
PROJECT TYPE:
300,000 300,000
This project supports the purchases of the Agency's need for software, network infrastructure,computing resources, and business analytics.
STA
Type
Bus Stops and Amenities
On‐going bus stops and amenities improvement program will replace outdated bus stop shelters and amenities, add new bus shelters and amenities according to policy and address nonemergency safety and accessibility improvements.
Total
Section 5307
Estimated ExpensesFunding Sources
Total Project Budget
Total
IT Projects
Total Funds
Project Budget
Total Project BudgetProject Budget
Page 199 of 400
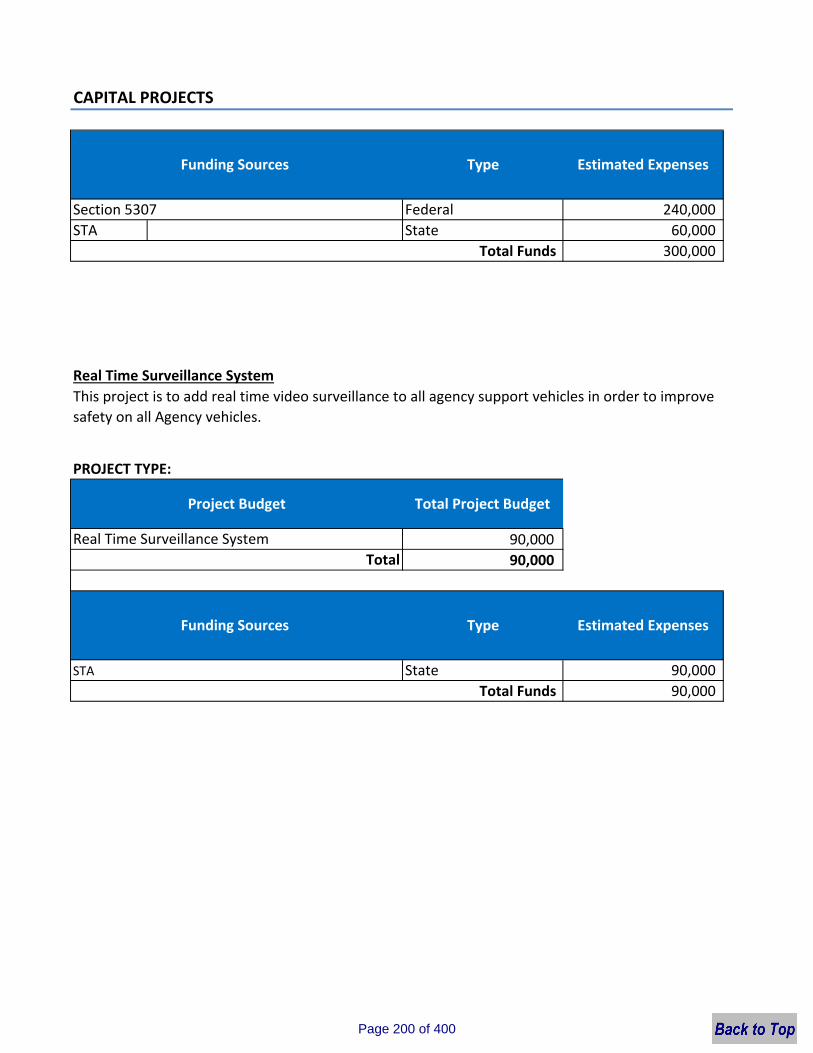
CAPITAL PROJECTS
Federal 240,000 STA State 60,000
300,000
Real Time Surveillance System
PROJECT TYPE:
90,000 90,000
State 90,000 90,000
Estimated Expenses
Project Budget
Real Time Surveillance System
Total Funds STA
Section 5307
TypeFunding Sources
Funding Sources Type Estimated Expenses
Total Project Budget
This project is to add real time video surveillance to all agency support vehicles in order to improve safety on all Agency vehicles.
Total
Total Funds
Page 200 of 400

CAPITAL PROJECTS
Equipment
PROJECT TYPE:
322,000 322,000
State 64,400 Federal 257,600
322,000
Software Expansion
PROJECT TYPE:
600,000 600,000
State 120,000 Federal 480,000
600,000 Total Funds
Estimated Expenses
Expand modules of existing Trapeze software and procure new business intelligence system to automate reporting a facilitate the presentation and transfer of information.
Total Funds
STA
Project Budget Total Project Budget
Software ExpansionTotal
Funding Sources Type
STA
Project Budget Total Project Budget
Equipment Total
Funding Sources Type Estimated Expenses
Purchase vehicle lift, repair existing lifts, and procure new coolant and drain carts.
Section 5307
Section 5307
Page 201 of 400
32505 Harry Oliver Trail | Thousand Palms, CA 92276
Serving the Coachella ValleyBermuda Dunes • Cathedral City • Coachella • Desert Edge • Desert Hot Springs • Indian Wells • Indio • La Quinta • Mecca
North Shore • Oasis • Palm Desert • Palm Springs • Rancho Mirage • Thermal • Thousand Palms
Page 202 of 400

ITEM 11
SunLine Transit Agency
DATE: June 22, 2022 ACTION
TO: Finance/Audit Committee Board of Directors
FROM: Luis Garcia, Controller/ Assistant Chief Financial Officer
RE: Resolution No. 0797 to Adopt and Authorize Execution of SunLine Transit Agency Retirement Income Plan For Teamsters Local 1932
Recommendation
Recommend that the Board of Directors approve Resolution No. 0797, which adopts and authorizes the execution of the SunLine Transit Agency Retirement Income Plan for Teamsters Local 1932 (Teamsters Plan), and appoints a member of the management team to serve as the plan administrator of the new plan.
Background
SunLine, pursuant to the terms of its Memorandum of Understanding with the Amalgamated Transit Union (ATU), currently provides a defined benefit pension plan to eligible members of the ATU.
Pursuant to the terms of a Memorandum of Understanding between SunLine Transit Agency and Teamsters Local 1932, effective March 24, 2022, which the Board of Directors previously approved on March 23, 2022, SunLine agreed to provide new Teamsters members hired on or after March 1, 2022, with participation in either the ATU Plan or a separate defined benefit pension plan with the same benefit formulas as the ATU Plan.
Following consultation with SunLine’s employee benefits special counsel at Best Best & Krieger, and with input from its labor and employment special counsel, SunLine’s management is recommending the establishment of a separate defined benefit pension plan and trust for eligible Teamsters, effective July 1, 2022, which contains the same benefit formulas as the ATU plan. In order to simplify and facilitate the administration and management of the Teamsters plan, management directed Special Counsel, with the assistance and input of the pension consultants and actuaries currently advising SunLine with respect to the ATU plan, to prepare a new plan and trust document. The new documents are similar to the ATU plan, but contain a more streamlined administrative structure and which reserves the right to SunLine of making any necessary and appropriate amendments.
Page 203 of 400
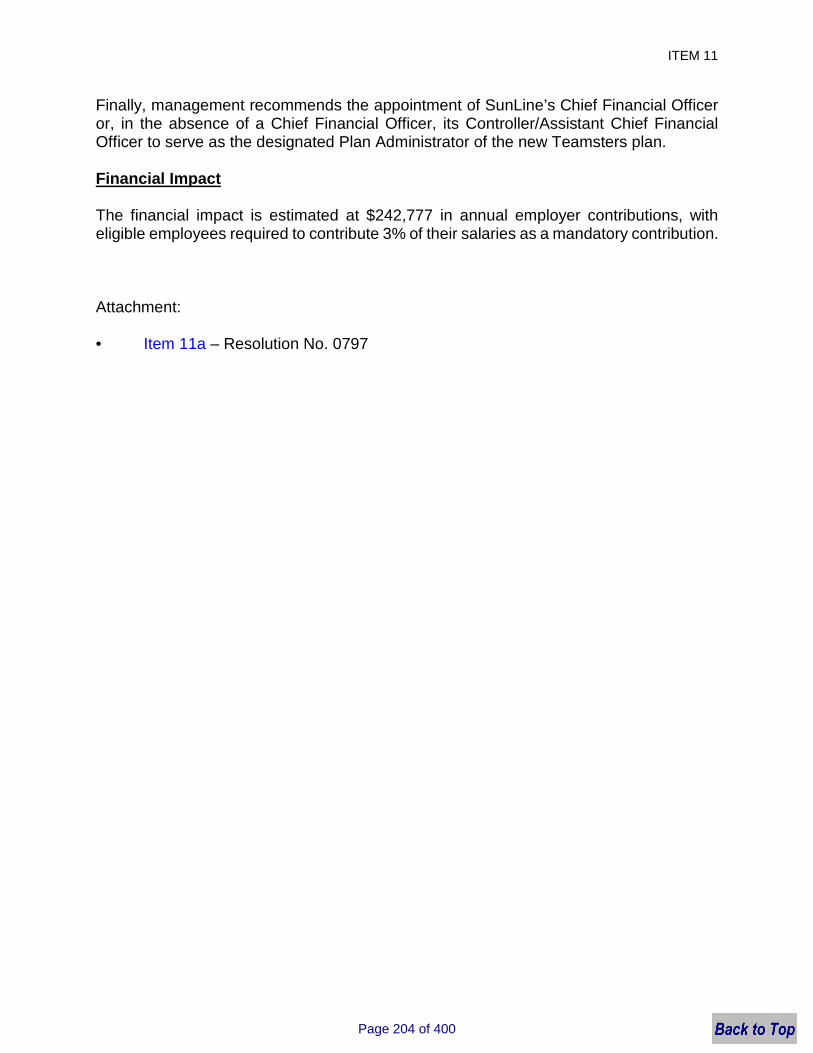
ITEM 11
Finally, management recommends the appointment of SunLine’s Chief Financial Officer or, in the absence of a Chief Financial Officer, its Controller/Assistant Chief Financial Officer to serve as the designated Plan Administrator of the new Teamsters plan.
Financial Impact
The financial impact is estimated at $242,777 in annual employer contributions, with eligible employees required to contribute 3% of their salaries as a mandatory contribution.
Attachment:
• Item 11a – Resolution No. 0797
Page 204 of 400
ITEM 11 ATTACHMENT A
WHEREAS, SunLine Transit Agency recently approved a new Memorandum of Understanding (MOU) with Teamsters Local 1932, which requires SunLine to provide new Teamsters members hired on or after March 1, 2022, with participation in either the existing defined benefit pension plan maintained for members of the Amalgamated Transit Union (ATU Plan) or a separate defined benefit pension plan with the same benefit formulas as the ATU Plan; and
WHEREAS, following consultation with SunLine’s employee benefits special counsel at Best Best & Krieger (Special Counsel), and with input from its labor and employment special counsel, SunLine’s management is recommending the establishment of a separate defined benefit pension plan and trust for eligible Teamsters, effective July 1, 2022, which contains the same benefit formulas as the ATU Plan; and
WHEREAS, management has directed Special Counsel, with the assistance and input of the pension consultants and actuaries currently advising SunLine with respect to the ATU Plan, to prepare a new plan and trust document (collectively the Teamsters Plan) that is similar to the ATU Plan, but contains a more streamlined administrative structure and which reserves the right to SunLine of making any necessary and appropriate amendments, which may be required to comply with the Pension Reform Act of 2013 (PEPRA); and
WHEREAS, management recommends the appointment of SunLine’s Chief Financial Officer or, in the absence of a Chief Financial Officer, its Controller/Assistant Chief Financial Officer to serve as the designated Plan Administrator of the Teamsters Plan; and
WHEREAS, SunLine Transit Agency wishes to adopt the Teamsters Plan and to delegate authorization to execute these documents and any required amendments thereto to the CEO/General Manager;
NOW THEREFORE, BE IT RESOLVED by the Board of Directors of SunLine Transit Agency that the Teamsters Plan, as prepared at the direction and under the supervision of management by Special Counsel is hereby approved and adopted.
SUNLINE TRANSIT AGENCY
RESOLUTION NO. 0797
RESOLUTION TO ADOPT AND AUTHORIZE EXECUTION OF SUNLINE TRANSIT AGENCY
RETIREMENT INCOME PLAN FOR TEAMSTERS LOCAL 1932
Page 205 of 400
ITEM 11 ATTACHMENT A
NOW THEREFORE, BE IT FURTHER RESOLVED that the CEO/General Manager be authorized to execute the Teamsters Plan, any related trust agreement, and all documents reasonably necessary to implement the plan and to maintain its compliance with the Internal Revenue Code and PEPRA (to the extent applicable).
NOW THEREFORE, BE IT FURTHER RESOLVED by the Board of Directors of SunLine Transit Agency that it hereby designates SunLine’s Chief Financial Officer or, in the absence of a Chief Financial Officer, its Controller/Assistant Chief Financial Officer to serve as the designated Plan Administrator of the Teamsters Plan
NOW THEREFORE, BE IT FURTHER RESOLVED that the CEO/General Manager and its Controller/Assistant Chief Financial Officer be authorized to take any and all actions reasonable and necessary to implement the Teamsters Plan in accordance with the MOU and applicable law.
ADOPTED THIS ____ DAY OF June, 2022
ATTEST:
____________________________ _____________________________ Edith F. Hernandez Glenn Miller Clerk of the Board Chair of the Board SunLine Transit Agency SunLine Transit Agency
APPROVED AS TO FORM:
General Counsel Eric Vail
Page 206 of 400

ITEM 11 ATTACHMENT A
STATE OF CALIFORNIA ) ) ss.
COUNTY OF RIVERSIDE )
I, EDITH F. HERNANDEZ, Clerk of the Board of Directors of SunLine Transit Agency, do hereby certify that Resolution No. _________ was adopted at a regular meeting of the Board of Directors held on the _______ day of ________________, 20__, by the following vote:
AYES:
NOES:
ABSENT:
ABSTAIN:
IN WITNESS WHEREOF, I have hereunto set my hand this ___ day of _______________, 20__.
___________________________ Edith F. Hernandez Clerk of the Board SunLine Transit Agency
Page 207 of 400
ITEM 12
SunLine Transit Agency
DATE: June 22, 2022 ACTION
TO: Finance/Audit Committee Board of Directors
FROM: Rudy Le Flore, Chief Project Consultant
RE: Zero Emission Technical Support Agreement
Recommendation
Recommend that the Board of Directors authorize the CEO/General Manager to negotiate and execute a technical support agreement with Zen and the Art of Clean Energy Solutions Inc. (Zen) in an amount not to exceed $200,000 for a term of approximately 18 months subject to review and approval by SunLine’s General Counsel.
Background
SunLine is under a mandate by the California Air Resources Board (CARB) to transition its fleet to zero emission by 2040. Zen drafted the Agency’s Zero-Emission Bus Rollout Plan that was approved by the Board of Directors on June 24, 2020, and subsequently approved by CARB. SunLine’s investments towards zero emission infrastructure improvement projects requires the technical support of qualified individuals to successfully deliver projects. The Agency also requires support in improving the quality and effectiveness of its current and future zero emission equipment and technology. The partnership with Zen has also been successful in generating revenue for SunLine by assisting with the preparation and implementation of zero emission infrastructure and rolling stock grants.
Technical support is needed in the areas of project oversight, performance modeling, technical evaluations and grant support. Zen’s principal, Jeff Grant, has worked with SunLine in its hydrogen fueling program over the past 12 years. Jeff Grant has been involved with SunLine’s purchase of fuel cell vehicles and the implementation of the hydrogen electrolyzer. Brendan Shaffer, an associate with Zen, is an engineer with experience in hydrogen and hydrogen fuel systems. Zen’s understanding of SunLine’s products and processes make them uniquely qualified to provide technical support to the Agency.
Page 208 of 400
ITEM 12
Financial Impact
The $200,000 for this contract will be funded from a combination of Board approved capital and operating funds.
Page 209 of 400

ITEM 13
SunLine Transit Agency
DATE: June 22, 2022 ACTION
TO: Finance/Audit Committee Board of Directors
FROM: Harman Singh, Deputy Chief Performance Officer
RE: Approve Grant for SunLine West Coast Center of Excellence in Zero Emission Technology & Renewable Energy
Recommendation
Recommend that the Board of Directors authorize the CEO/General Manager to negotiate and execute an agreement with the California Energy Commission (CEC) to receive $500,000 for the development and implementation of training for the SunLine West Coast Center of Excellence in Zero Emission Technology & Renewable Energy (WCCoE).
Background
In October 2021, CEC released a competitive grant solicitation and application package entitled “IDEAL ZEV Workforce Pilot” under the Clean Transportation Program. This grant solicitation focused on funding projects that would provide workforce training and development that supports zero emission vehicles (ZEV), ZEV infrastructure and ZEV commercial technologies in California.
Over the years, transit agencies demonstrated a need for training in zero emission technologies. With this in mind, SunLine applied to receive funding for the WCCoE to develop training focused on the deployment of zero emission technologies. SunLine’s employees will benefit from these trainings as we transition to a zero emission fleet. The WCCoE training program was originally funded in 2016 by the Federal Transit Administration. SunLine was also awarded discretionary funding from the California Air Resource Board to further its training program.
The CEC funds will be utilized to provide a series of training workshops for transit and school bus fleet operators that will be offered throughout California. The program is designed to ensure that current and future generations of transit professionals are prepared to successfully procure, deploy, operate and maintain ZEVs. SunLine will also develop a new course to interest high school students in zero emission transportation technologies and the future of public transportation.
Page 210 of 400
ITEM 13
This training has proven necessary to reduce the overall costs of operating and maintaining zero emission technologies. SunLine has since established a certifying Original Equipment Manufacturer Advisory Board to standardize the training.
Financial Impact
These funds will be programmed for use in the FY23 operating budget.
Page 211 of 400
ITEM 14
SunLine Transit Agency
DATE: June 22, 2022 ACTION
TO: Strategic Planning & Operational Committee Board of Directors
FROM: Rohan Anthony Kuruppu, Chief Planning Consultant
RE: Adopt FY23-25 Short Range Transit Plan (SRTP)
Recommendation
Recommend that the Board of Directors adopt the FY23-25 Short Range Transit Plan (SRTP).
Background
The focus of the attached FY23-25 SRTP is to fully implement approved service improvements that were delayed due to the COVID-19 pandemic and support the inclusive national and regional economic recovery strategies. The SRTP, updated annually, describes SunLine’s operating and capital plans and funding sources. The SRTP is prepared according to the Riverside County Transportation Commission (RCTC) requirements and guidelines, the California Public Utilities Code, and California Transportation Development Act. The highlights of the SRTP are:
1) Increase all route frequencies gradually to regular service level (pre-COVID-19 level) as new coach operators are hired and trained
2) Launch Route 1X express service between Indio and Palm Springs along Highway 111 in fall 2022 to test the effectiveness and desirability of the limited-stop service contingent on the ability to hire and train coach operators
3) Hire and train over forty coach operators to implement all approved service improvements
4) Launch new SunRide geo-fence zones in Cathedral City and Indio on September 5, 2022, and explore the feasibility of further expanding SunRide service
5) Develop a service strategy for the new Acrisure Arena opening in January 2023 in Palm Desert
6) Update bus stop signs, schedule holders and install new bus shelters across the service area according to policy to enhance customer service, optimize trip planning technologies, and improve communication with passengers
7) Continue to implement the Innovative Clean Transit (ICT) plan, Transition to zero emissions by 2035 – five years ahead of the deadline set in the ICT Regulation (2040)
Page 212 of 400
ITEM 14
The service plan and the capital plan recommended in the SRTP are within the confines of the FY23 budget, which will be presented to the Board of Directors for consideration as a separate item, a critical linkage to the SRTP.
This item was presented to the Strategic Planning & Operational Committee and the Board of Directors during the May meeting. Additionally, RCTC staff reviewed the first and second drafts of the SRTP in April and May respectively. In the absence of substantive comments or changes, staff recommend adopting the FY23-25 SRTP.
Financial Impact
The operating and capital costs have been budgeted for in the FY22 budget.
Attachments:
• Item 14a – SRTP Ridership Recovery Presentation • Item 14b – FY2325 SRTP
Page 213 of 400
FIXED ROUTERIDERSHIP TREND JUNE 22, 2022
ITEM 14ATTACHMENT A
Page 214 of 400
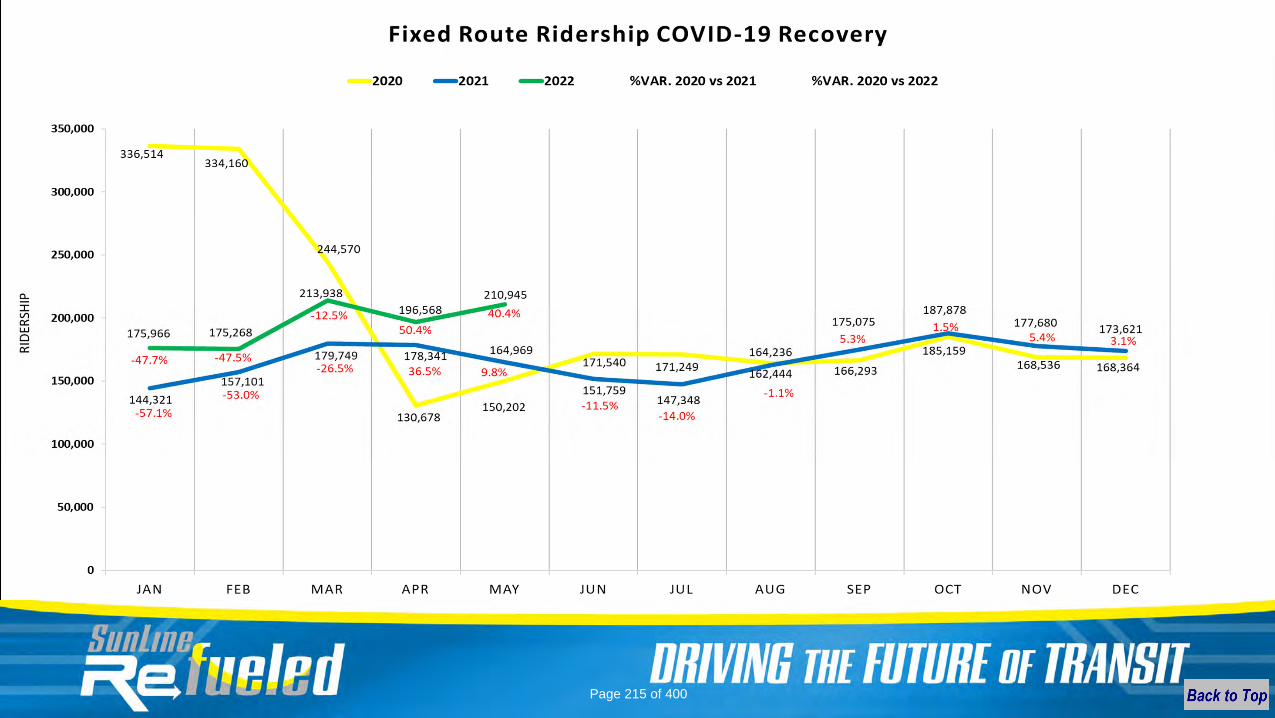
Page 215 of 400

Questions?
Page 216 of 400
7
Page 217 of 400
ccubero
Text Box
ITEM 14 ATTACHMENT B
Short Range Transit Plan • FY23 – FY25 ii
Contents
Chapter 1. System Overview and Service Profile ........................................................................................ 1
1.1 Description of Service Area .............................................................................................................. 1
1.2 Population Profile and Demographics ............................................................................................. 3
1.3 Description of Services ..................................................................................................................... 9
1.4 Current Fare Structure ................................................................................................................... 29
1.5 Revenue Fleet ................................................................................................................................ 31
1.6 Existing Transit Facilities and Bus Stop Amenities ......................................................................... 32
1.7 Existing Coordination between Transit Agencies and Private Providers ....................................... 33
1.8 Review of Previous Studies and Plans............................................................................................ 35
Chapter 2. Existing Service and Route Performance................................................................................. 36
2.1 Service Standards ........................................................................................................................... 36
2.2 Service Performance ...................................................................................................................... 44
Chapter 3. Future Service Plans, Fare Changes, Capital Planning, and Marketing ................................... 58
3.1 Service Plans and Priorities FY2023-2025 ...................................................................................... 59
3.2 SunLine’s Overall Marketing Plans, Studies, and Promotions ....................................................... 65
3.3 Pandemic Recovery Recommendations and Best Practices .......................................................... 70
3.4 Projected Ridership Growth FY23–25 ............................................................................................ 70
3.5 Proposed Fare Structure Changes ................................................................................................. 71
3.6 Capital Improvement Planning ...................................................................................................... 72
Chapter 4. Financial Planning .................................................................................................................... 77
4.1 Operating and Capital Budget ........................................................................................................ 77
4.2 Funding Plans to Support Proposed Operating and Capital Program ........................................... 79
4.3 Regulatory and Compliance Requirements ................................................................................... 81
Page 218 of 400
Short Range Transit Plan • FY23 – FY25 iii
Appendices
Appendix A: SunLine Existing Route Profiles ............................................................................................ 118
Service Days .......................................................................................................................................... 120
Route Numbers, Headsigns, and General Direction ............................................................................. 121
Span of Service (Levl 1) ......................................................................................................................... 122
FY23 Fixed Route Fleet .......................................................................................................................... 123
Route Frequency and Frequency Improvements Required to Get to Level 1 ...................................... 124
Route 1: Coachella – Via Hwy 111 – Palm Springs ................................................................................ 125
Route 2: Desert Hot Springs – Palm Springs – Cathedral City ............................................................... 126
Route 3: Desert Edge – Desert Hot Springs .......................................................................................... 128
Route 4: Palm Desert Mall – Palm Springs ............................................................................................ 129
Route 5: Desert Hot Springs – CSUSB Palm Desert – Palm Desert Mall ............................................... 130
Route 6: Coachella – Via Fred Waring – Palm Desert Mall ................................................................... 132
Route 7: Bermuda Dunes – Indian Wells – La Quinta ........................................................................... 133
Route 8: North Indio – Coachella – Thermal/Mecca............................................................................. 135
Route 9: North Shore – Mecca – Oasis ................................................................................................. 137
Route 10 Commuter Link: Indio – CSUSB (PDC) – CSUSB – San Bernardino Transit Center
(SBTC)/Metrolink ................................................................................................................................... 138
Route 1X: Express to Indio – Express to Palm Springs .......................................................................... 139
School Trippers...................................................................................................................................... 140
Page 219 of 400
Short Range Transit Plan • FY23 – FY25 iv
Figures
Figure 1.1 SunLine Refueled Timeline ................................................................................................. 1
Figure 1.2 SunLine Service Area ........................................................................................................... 3
Figure 1.3 Riverside County and California Population Growth Projections (Percent) ....................... 6
Figure 1.4 Riverside County and Coachella Valley Population Projections (Total Population) ........... 6
Figure 1.5 Population Growth Projections for Jurisdictions in the SunLine Service Area ................... 7
Figure 1.6 Senate Bill 535 Disadvantaged Communities ..................................................................... 8
Figure 1.7 Areas of Persistent Poverty ................................................................................................ 9
Figure 1.8 Fixed Route Ridership ....................................................................................................... 10
Figure 1.9 Fixed Route System Map .................................................................................................. 11
Figure 1.10 Example of SunRide Vehicle.............................................................................................. 12
Figure 1.11 SunRide Pilot Service Areas – Desert Hot Springs – Desert Edge (formerly Desert
Edge) ................................................................................................................................. 14
Figure 1.12 SunRide Pilot Service Areas – Coachella ........................................................................... 15
Figure 1.13 SunRide Pilot Service Areas – Mecca North Shore ........................................................... 16
Figure 1.14 SunRide Pilot Service Areas – Palm Desert (formerly Cook St Corridor) .......................... 17
Figure 1.15 SunRide Mobile App ......................................................................................................... 18
Figure 1.16 SunRide System-wide Metrics .......................................................................................... 19
Figure 1.17 SunRide Unique Users ....................................................................................................... 20
Figure 1.18 SunRide Monthly Service Labor Cost Per Rider ................................................................ 21
Figure 1.19 SunDial Ridership Trend .................................................................................................... 22
Figure 1.20 Employers with 250 to 500 Employees ............................................................................. 27
Figure 1.21 Employers with 500 to 999 Employees ............................................................................. 28
Figure 1.22 Employers with 1,000 or More Employees ....................................................................... 28
Figure 1.23 Fare Structure ................................................................................................................... 30
Figure 1.24 SunLine Support Vehicle Summary ................................................................................... 32
Figure 1.25 Top 10 Stops ..................................................................................................................... 33
Figure 1.26 Top 10 Weekend Stops ..................................................................................................... 33
Figure 2.1 Service Frequency Standards ........................................................................................... 37
Figure 2.2 Passengers Per Revenue Hour/Revenue Trip Standards .................................................. 38
Figure 2.3 Service Scheduled Speed Standard ................................................................................... 39
Figure 2.4 On-Time Performance Standard ....................................................................................... 39
Figure 2.5 Service Completed Standard ............................................................................................ 40
Figure 2.6 Miles Between Service Interruptions Standard ................................................................ 40
Figure 2.7 Load Standards ................................................................................................................. 41
Figure 2.8 Average Fleet Age Standard.............................................................................................. 41
Figure 2.9 Bus Deployment Standard ................................................................................................ 41
Figure 2.10 Percentage Change in SunLine Fixed Route Ridership Relative to 2010 and Peers ......... 44
Figure 2.11 Summary of Fixed Route Transit Services ......................................................................... 46
Figure 2.12 Service Frequencies in Minutes for .................................................................................. 46
Figure 2.13 Service Spans .................................................................................................................... 47
Figure 2.14 5-year Fixed Route Ridership Comparison ....................................................................... 48
Figure 2.15 COVID-19 Impact on Fixed Route Ridership ..................................................................... 49
Page 220 of 400
Short Range Transit Plan • FY23 – FY25 v
Figure 2.16 SunDial On-Time Performance for FY19 to FY21 .............................................................. 50
Figure 2.17 Paratransit Ridership COVID-19 Impact ............................................................................ 51
Figure 2.18 Taxi Businesses ................................................................................................................. 51
Figure 2.19 SolVan Ridership Trend ..................................................................................................... 52
Figure 2.20 Refueled Trunk Routes Average ....................................................................................... 52
Figure 2.21 Refueled Local Routes Average ........................................................................................ 53
Figure 2.22 Market Based Service Average ......................................................................................... 54
Figure 2.23 Fixed Route Averaged Speed ............................................................................................ 54
Figure 2.24 On-Time Performance by Route ....................................................................................... 55
Figure 2.25 Miles between Service Interruptions Standard ................................................................ 56
Figure 2.26 Fleet Age ........................................................................................................................... 56
Figure 3.1 Headway by Route and Service Level ............................................................................... 60
Figure 3.2 Allocation of Bus Stop Shelter Improvements .................................................................. 73
Figure 3.3 Status of SunLine’s Capital Projects .................................................................................. 73
Figure 3.4 Financially Unconstrained Transit Improvements ............................................................ 76
Page 221 of 400

Short Range Transit Plan • FY23 – FY25 vi
Tables
Table 1.0 Individual Route Descriptions ........................................................................................... 83
Table 1.1 Fleet Inventory – Motor Bus ............................................................................................. 84
Table 1.1 Fleet Inventory – Demand Response ................................................................................ 85
Table 2.0 Service Provider Performance Target Report ................................................................... 86
Table 2.1 FY 2021/22 SRTP Performance Report ............................................................................. 87
Table 2.2 SRTP Service Summary – Systemwide Totals .................................................................... 88
Table 2.2 SRTP Service Summary – All Fixed Routes ........................................................................ 89
Table 2.2 SRTP Service Summary – SunDial ...................................................................................... 90
Table 2.2 SRTP Service Summary – Vanpool .................................................................................... 91
Table 2.2A Summary of Routes to be Excluded .................................................................................. 92
Table 2.3 SRTP Route Statistics (table 1 of 4) ................................................................................... 93
Table 2.3 SRTP Route Statistics (table 2 of 4) ................................................................................... 94
Table 2.3 SRTP Route Statistics (table 3 of 4) ................................................................................... 95
Table 2.3 SRTP Route Statistics (table 4 of 4) ................................................................................... 96
Table 3.0 Highlights of the FY2022/23 SRTP..................................................................................... 97
Table 4.0 Summary of Funding Requests (1 of 3) ............................................................................. 98
Table 4.0 Summary of Funding Requests (2 of 3) ............................................................................. 99
Table 4.0 Summary of Funding Requests (3 of 3) ........................................................................... 100
Table 4.0A Capital Project Justification (1 of 12) .............................................................................. 101
Table 4.0A Capital Project Justification (2 of 12) .............................................................................. 102
Table 4.0A Capital Project Justification (3 of 12) .............................................................................. 103
Table 4.0A Capital Project Justification (4 of 12) .............................................................................. 104
Table 4.0A Capital Project Justification (5 of 12) .............................................................................. 105
Table 4.0A Capital Project Justification (6 of 12) .............................................................................. 106
Table 4.0A Capital Project Justification (7 of 12) .............................................................................. 107
Table 4.0A Capital Project Justification (8 of 12) .............................................................................. 108
Table 4.0A Capital Project Justification (9 of 12) .............................................................................. 109
Table 4.0A Capital Project Justification (10 of 12) ............................................................................ 110
Table 4.0A Capital Project Justification (11 of 12) ............................................................................ 111
Table 4.0A Capital Project Justification (12 of 12) ............................................................................ 112
Table 4.0B Farebox Calculation ........................................................................................................ 113
Table 4.1 Summary of Funding Requests in FY2023–2024 (1 of 3) ................................................ 114
Table 4.1 Summary of Funding Requests in FY2023–2024 (2 of 3) ................................................ 115
Table 4.1 Summary of Funding Requests in FY2023–2024 (3 of 3) ................................................ 116
Table 4.2 Summary of Funding Requests in FY2024–2025 ............................................................ 117
Page 222 of 400
Short Range Transit Plan • FY23 – FY25 vii
Glossary of Common Acronyms
5304 Discretionary grants for statewide and non-metropolitan transportation planning
5307 Formula grants for urbanized areas
5309 Discretionary grants for fixed guideway capital investments
5310 Discretionary grants for enhanced mobility of seniors and individuals with disabilities
5311 Formula grants for rural areas
5337 State of good repair grants
5339 Formula grants for buses and bus facilities
ADA Americans with Disabilities Act
A&E Architectural and Engineering
AHSC Affordable Housing and Sustainable Communities Program
APTA American Public Transportation Association
ARPA American Rescue Plan Act
ATIS Advanced Traveler Information System
BEB Battery Electric Bus
BRT Bus Rapid Transit
CARB California Air Resources Board
CARES Coronavirus Aid, Relief, and Economic Stimulus Act
CDC Centers for Disease Control and Prevention
CIC Customer Information Center
CMAQ Congestion Mitigation and Air Quality Improvement Program
CNG Compressed Natural Gas
COA Comprehensive Operational Analysis
COVID-19 Coronavirus
CRRSAA Coronavirus Response and Relief Supplemental Appropriations Act
CTSA Consolidated Transportation Services Agency
CVAG Coachella Valley Association of Governments
DBE Disadvantaged Business Enterprise
EEO Equal Employment Opportunity
EV Electric Vehicle
FCEB Fuel Cell Electric Bus
Page 223 of 400
Short Range Transit Plan • FY23 – FY25 viii
FTA Federal Transit Administration
FTIP Federal Transportation Improvement Program
FY Fiscal Year
JPA Joint Powers Agreement
ICT Innovative Clean Transit
IT Information Technology
IVT Imperial Valley Transit
IVTC Imperial Valley Transportation Commission
KPI Key Performance Indicator
LCFS Low-Carbon Fuel Standard
LCTOP Low Carbon Transit Operations Program
LEP Limited English Proficiency
LTF Local Transportation Fund
MBTA Morongo Basin Transit Authority
MPO Metropolitan Planning Organization
NTD National Transit Database
OCTA Orange County Transportation Authority
OPEB Other post-employment benefits
PPP Public-private partnership
PTMISEA Public Transportation Modernization, Improvement, and Service Enhancement Account
RCTC Riverside County Transportation Commission
RFP Request for Proposals
RINs Renewable Identification Numbers
RTA Riverside Transit Agency
RTPA Regional Transportation Planning Agency
RPU Riverside Public Utilities
§ Section
SB1 Senate Bill 1
SBTC San Bernardino Transit Center
SCAG Southern California Association of Governments
SGR State of Good Repair
SR State Route
Page 224 of 400

Short Range Transit Plan • FY23 – FY25 ix
SRA SunLine Regulatory Administration
SRTP Short Range Transit Plan
STA State Transit Assistance
TAP Transit Ambassador Program
TDA Transportation Development Act
TIRCP Transit and Intercity Rail Capital Program
TMD Transportation Management & Design
TNC Transportation Network Company
TNOW Transportation NOW
TSP Transit Signal Priority
TTS Timed Transfer System
TUMF Transportation Uniform Mitigation Fee
U-Pass University Pass
UZA Urbanized area, as defined by the U.S. Census Bureau
WRCOG Western Riverside Council of Governments
ZEB Zero-Emission Bus
Definitions
Financially Constrained Plan Funded service improvements
Financially Unconstrained Plan Unfunded service improvements
Microtransit A form of demand response transit that offers flexible
routing and/or flexible scheduling of minibus vehicles
Page 225 of 400
Short Range Transit Plan • FY23 – FY25 x
Board of Directors
SunLine was established under a Joint Powers Agreement (JPA) on July 1, 1977,
between Riverside County and the communities of the Coachella Valley, which at
the time included the Cities of Coachella, Desert Hot Springs, Indio, Palm Desert,
and Palm Springs. The JPA was later amended to include the Cities of Cathedral City,
Indian Wells, La Quinta, and Rancho Mirage. The JPA’s governing board consists of
one elected official from each member entity and one county supervisor. SunLine is
headquartered in Thousand Palms, California.
Cathedral City: Nancy Ross
Coachella: Denise Delgado
Desert Hot Springs: Russell Betts
Indian Wells: Dana Reed
Indio: Glenn Miller, Chair
La Quinta: Robert Radi
Palm Desert: Kathleen Kelly
Palm Springs: Lisa Middleton, Vice Chair
Rancho Mirage: Charles Townsend
Riverside County: V. Manuel Perez
SunLine Organizational Structure
Lauren Skiver Chief Executive Officer/General Manager
Vacant Chief Financial Officer
Vanessa Mora Chief Safety Officer
Tamara Miles Chief Human Relations Officer
Isabel Acosta Chief Transportation Officer
Brittney B. Sowell Chief of Staff
Frank Rytych Chief Maintenance Officer
Vacant Chief of Public Affairs
Tina Hamel Chief of Compliance/Labor Relations
Mora
Miles
Acosta
Sowell
Rytych
Hamel
Skiver
Page 226 of 400
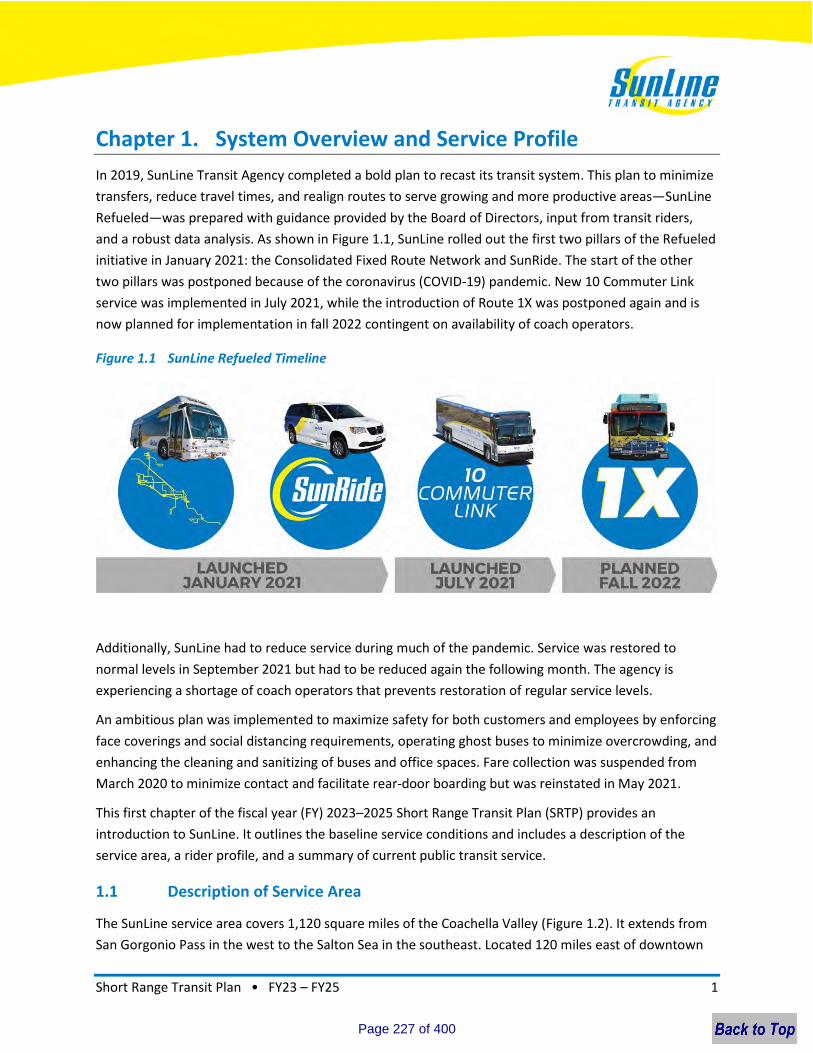
Short Range Transit Plan • FY23 – FY25 1
Chapter 1. System Overview and Service Profile
In 2019, SunLine Transit Agency completed a bold plan to recast its transit system. This plan to minimize
transfers, reduce travel times, and realign routes to serve growing and more productive areas—SunLine
Refueled—was prepared with guidance provided by the Board of Directors, input from transit riders,
and a robust data analysis. As shown in Figure 1.1, SunLine rolled out the first two pillars of the Refueled
initiative in January 2021: the Consolidated Fixed Route Network and SunRide. The start of the other
two pillars was postponed because of the coronavirus (COVID-19) pandemic. New 10 Commuter Link
service was implemented in July 2021, while the introduction of Route 1X was postponed again and is
now planned for implementation in fall 2022 contingent on availability of coach operators.
Figure 1.1 SunLine Refueled Timeline
Additionally, SunLine had to reduce service during much of the pandemic. Service was restored to
normal levels in September 2021 but had to be reduced again the following month. The agency is
experiencing a shortage of coach operators that prevents restoration of regular service levels.
An ambitious plan was implemented to maximize safety for both customers and employees by enforcing
face coverings and social distancing requirements, operating ghost buses to minimize overcrowding, and
enhancing the cleaning and sanitizing of buses and office spaces. Fare collection was suspended from
March 2020 to minimize contact and facilitate rear-door boarding but was reinstated in May 2021.
This first chapter of the fiscal year (FY) 2023–2025 Short Range Transit Plan (SRTP) provides an
introduction to SunLine. It outlines the baseline service conditions and includes a description of the
service area, a rider profile, and a summary of current public transit service.
1.1 Description of Service Area
The SunLine service area covers 1,120 square miles of the Coachella Valley (Figure 1.2). It extends from
San Gorgonio Pass in the west to the Salton Sea in the southeast. Located 120 miles east of downtown
Page 227 of 400
Short Range Transit Plan • FY23 – FY25 2
Los Angeles and 60 miles east of Riverside and San Bernardino, SunLine’s service area is in the Riverside
County Supervisorial District 4. SunLine also provides commuter express service outside its service area
connecting Coachella Valley to San Bernardino.
SunLine provides service to the following cities:
Cathedral City La Quinta
Coachella Palm Desert
Desert Hot Springs Palm Springs
Indian Wells Rancho Mirage
Indio
Service is also provided to the Riverside County unincorporated communities of Bermuda Dunes, Desert
Edge, Mecca, North Shore, One Hundred Palms, Oasis, Thermal, and Thousand Palms. Within the
Coachella Valley region, SunLine provides 150 square miles of fixed-route service coverage and
200 square miles of paratransit service coverage.
Page 228 of 400
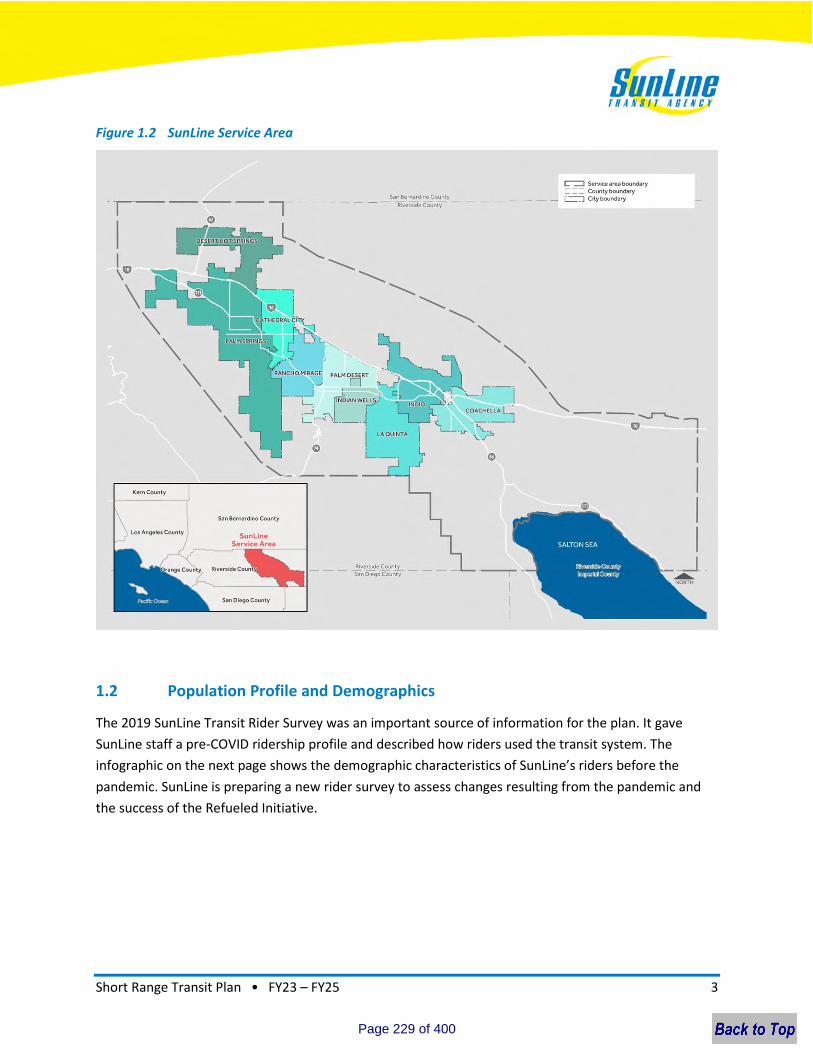
Short Range Transit Plan • FY23 – FY25 3
Figure 1.2 SunLine Service Area
1.2 Population Profile and Demographics
The 2019 SunLine Transit Rider Survey was an important source of information for the plan. It gave
SunLine staff a pre-COVID ridership profile and described how riders used the transit system. The
infographic on the next page shows the demographic characteristics of SunLine’s riders before the
pandemic. SunLine is preparing a new rider survey to assess changes resulting from the pandemic and
the success of the Refueled Initiative.
Page 229 of 400
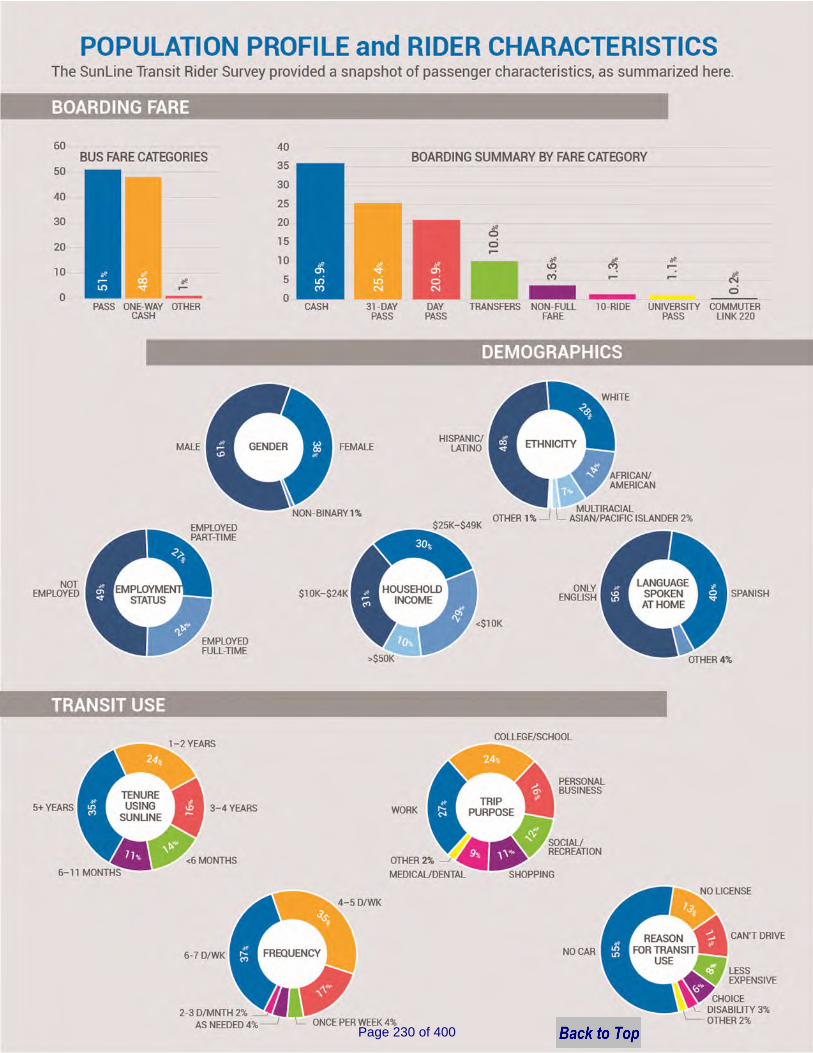
Short Range Transit Plan • FY23 – FY25 4
Page 230 of 400
Short Range Transit Plan • FY23 – FY25 5
1.2.1 Demographic Projections
Despite the recent ridership downturn related to the COVID-19 pandemic, population growth in
Riverside County and the Coachella Valley will continue to drive demand for public transit services. The
Refueled Initiative is aimed at connecting its residents with health care, jobs, schools, and a spectrum of
other destinations. With straighter, more direct routes, the redesigned system will provide more
permanent transit corridors to transit-supportive land uses, charting an ambitious and strategic path to
push the agency in a new direction to attract choice riders, boost ridership, and create a brighter future.
Like other transit agencies nationwide, SunLine is faced with the challenge of maintaining core service,
extending service to new developments, and addressing the financial challenges resulting from the
COVID-19 pandemic. Additionally, a key objective of this restructuring is to streamline bus routes to
address the request of residents to provide more direct and frequent bus service. With the massive
amount of growth we are experiencing and limited funding, SunLine would be unable to provide direct
service from every trip origin to every destination. However, with careful planning and more direct and
streamlined bus routes, SunLine has established a system that incorporates easier transfers,
connectivity, and reasonable walks to and from nearby bus stops to meet these sometimes-competing
objectives.
The extensive growth has prompted SunLine to work with the community to develop a new system that
gives customers fewer transfers, better connectivity, and enhanced efficiency for years to come. Failure
to restructure and make the transit system more efficient would deprive many residents of transit
service.
The California Department of Finance estimates that the nine cities of the Coachella Valley had a
population of just over 390,600 in January 2021. Riverside County has been growing faster than the
state’s population, and the Department of Finance projects this will continue through 2060, as shown in
Figure 1.3. Within Riverside county, Southern California Association of Governments (SCAG) projects
that the nine cities of the Coachella Valley will grow faster than the county between 2016 and 2045, as
shown in Figure 1.4.
Projections prepared by the SCAG show that the Riverside County population is expected to grow by
37.6 percent from 2016 to 2045. This means an increase from 2.36 million people in 2016 to 3.25 million
people in 2045. In contrast, the population in Coachella Valley cities is projected to grow even faster,
increasing 58.9 percent over the same 29-year period, from 378,200 in 2016 to 600,900 in 2045, as
shown in Figure 1.5. This percentage growth is 21.3 percentage points (56.6 percent) faster than for the
county. Growth percentages within the Coachella Valley vary by city. In particular, Coachella and Desert
Hot Springs are among the cities projected to grow the fastest within the SCAG region, ranking first and
third, respectively, among all SCAG cities by percentage growth over the next three decades.
Page 231 of 400

Short Range Transit Plan • FY23 – FY25 6
Figure 1.3 Riverside County and California Population Growth Projections (Percent)
Source: California Department of Finance, 2021. https://www.dof.ca.gov/forecasting/demographics/projections/
Figure 1.4 Riverside County and Coachella Valley Population Projections (Total Population)
0%
5%
10%
15%
20%
25%
30%
35%
40%
45%
2010 2020 2030 2040 2050 2060
California Riverside County
Page 232 of 400

Short Range Transit Plan • FY23 – FY25 7
Figure 1.5 Population Growth Projections for Jurisdictions in the SunLine Service Area
Source: Southern California Association of Governments, 2020.
https://scag.ca.gov/sites/main/files/file-attachments/0903fconnectsocal_demographics-and-growth-forecast.pdf
Disadvantaged communities in California are specifically targeted for investment of proceeds from the
state’s cap-and-trade program. Senate Bill 535 mandates that 25 percent of the proceeds from the
Greenhouse Gas Reduction Fund go to projects that benefit disadvantaged communities. These
investments are primarily aimed at improving public health, quality of life, and economic opportunity in
the state’s most burdened communities while also reducing pollution.
Disadvantaged communities are defined as the top 25 percent scoring census tracts from the California
Environmental Health Screening Tool (CalEnviroScreen). The Senate Bill 535 disadvantaged communities
within the SunLine service area are illustrated in Figure 1.6.
Jurisdiction 2016 Population 2045 Population Difference Percent Difference (%)
Cathedral City 54,300 76,300 22,000 41
Coachella 45,300 129,300 84,000 185
Desert Hot Springs 29,000 61,000 32,000 110
Indian Wells 5,400 6,400 1,000 19
Indio 88,100 129,300 41,200 47
La Quinta 40,400 47,700 7,300 18
Palm Desert 50,400 64,100 13,700 27
Palm Springs 47,100 61,600 14,500 31
Rancho Mirage 18,200 25,200 7,000 38
Total 378,200 600,900 222,700 59
Page 233 of 400

Short Range Transit Plan • FY23 – FY25 8
Figure 1.6 Senate Bill 535 Disadvantaged Communities
Several federal funding programs specifically target investment towards areas designated as Areas of
Persistent Poverty or Historically Disadvantaged Communities. Areas of Persistent Poverty include
census tracts with poverty rates of 20 percent or higher based on the 2014-2018 5-year American
Community Survey are designated as, with counties that have had poverty rates of 20 percent or higher
in 1900 and 2000 Decennial Censuses and the 2020 Small Area Income Poverty Estimates, and territories
or possessions of the United States. Historically Disadvantaged Communities include census tracts
identified based on six factors of socioeconomic disadvantage, Tribal lands, and territories or
possessions of the United States. Areas with these designations within the SunLine service area are
shown in Figure 1.7.
Page 234 of 400
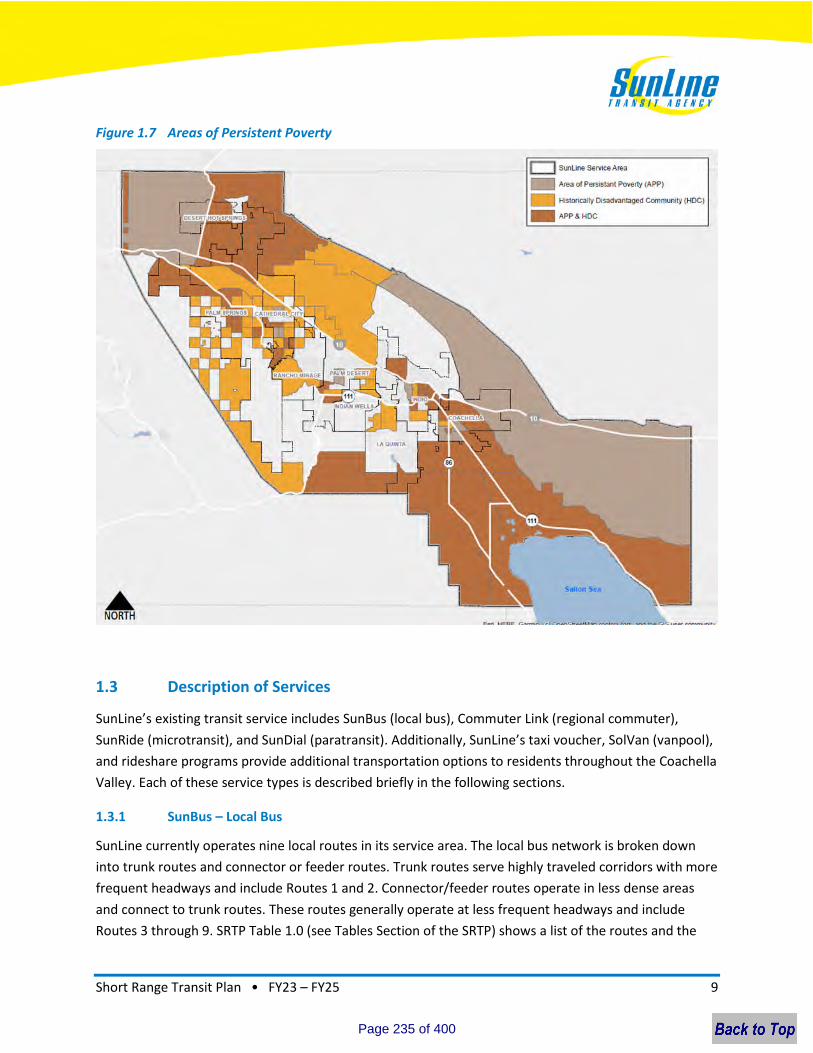
Short Range Transit Plan • FY23 – FY25 9
Figure 1.7 Areas of Persistent Poverty
1.3 Description of Services
SunLine’s existing transit service includes SunBus (local bus), Commuter Link (regional commuter),
SunRide (microtransit), and SunDial (paratransit). Additionally, SunLine’s taxi voucher, SolVan (vanpool),
and rideshare programs provide additional transportation options to residents throughout the Coachella
Valley. Each of these service types is described briefly in the following sections.
1.3.1 SunBus – Local Bus
SunLine currently operates nine local routes in its service area. The local bus network is broken down
into trunk routes and connector or feeder routes. Trunk routes serve highly traveled corridors with more
frequent headways and include Routes 1 and 2. Connector/feeder routes operate in less dense areas
and connect to trunk routes. These routes generally operate at less frequent headways and include
Routes 3 through 9. SRTP Table 1.0 (see Tables Section of the SRTP) shows a list of the routes and the
Page 235 of 400
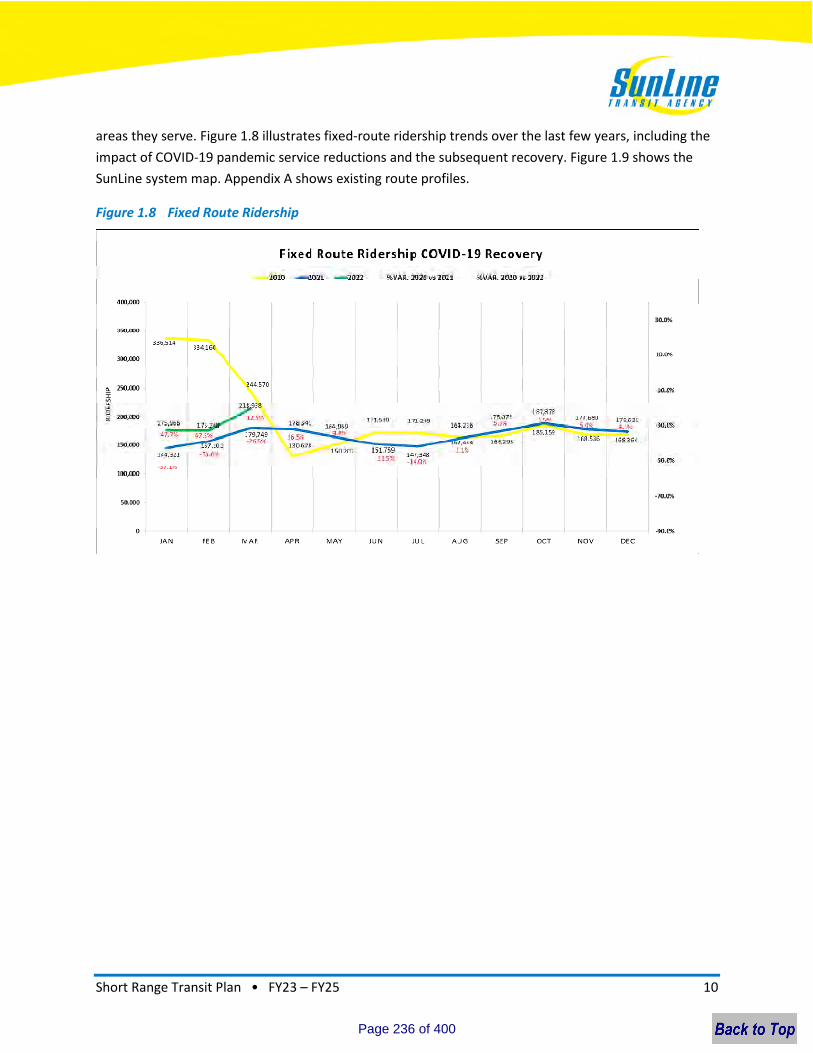
Short Range Transit Plan • FY23 – FY25 10
areas they serve. Figure 1.8 illustrates fixed-route ridership trends over the last few years, including the
impact of COVID-19 pandemic service reductions and the subsequent recovery. Figure 1.9 shows the
SunLine system map. Appendix A shows existing route profiles.
Figure 1.8 Fixed Route Ridership
Page 236 of 400
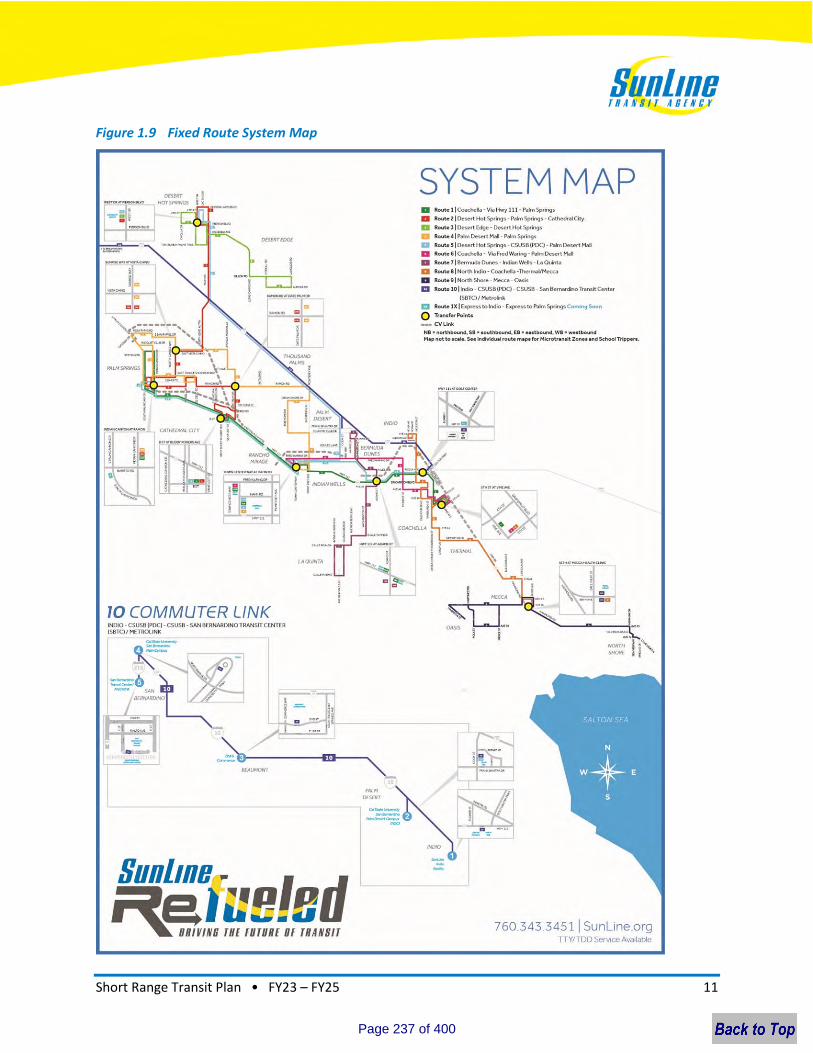
Short Range Transit Plan • FY23 – FY25 11
Figure 1.9 Fixed Route System Map
Page 237 of 400
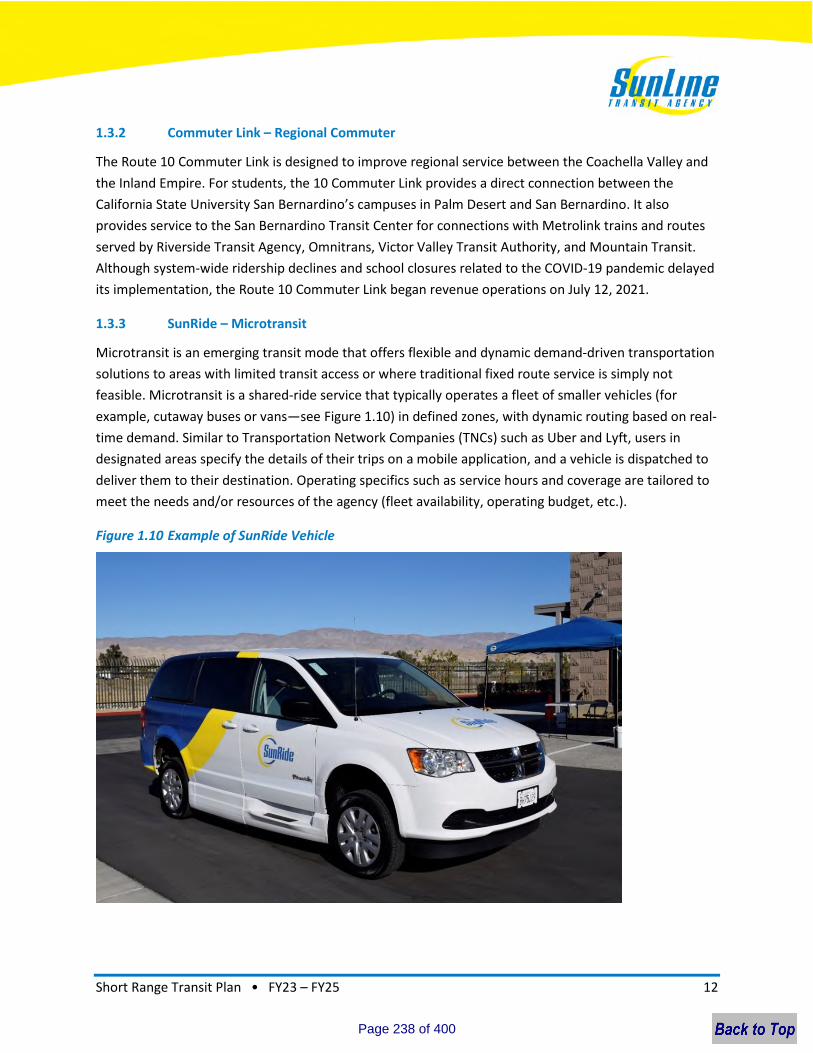
Short Range Transit Plan • FY23 – FY25 12
1.3.2 Commuter Link – Regional Commuter
The Route 10 Commuter Link is designed to improve regional service between the Coachella Valley and
the Inland Empire. For students, the 10 Commuter Link provides a direct connection between the
California State University San Bernardino’s campuses in Palm Desert and San Bernardino. It also
provides service to the San Bernardino Transit Center for connections with Metrolink trains and routes
served by Riverside Transit Agency, Omnitrans, Victor Valley Transit Authority, and Mountain Transit.
Although system-wide ridership declines and school closures related to the COVID-19 pandemic delayed
its implementation, the Route 10 Commuter Link began revenue operations on July 12, 2021.
1.3.3 SunRide – Microtransit
Microtransit is an emerging transit mode that offers flexible and dynamic demand-driven transportation
solutions to areas with limited transit access or where traditional fixed route service is simply not
feasible. Microtransit is a shared-ride service that typically operates a fleet of smaller vehicles (for
example, cutaway buses or vans—see Figure 1.10) in defined zones, with dynamic routing based on real-
time demand. Similar to Transportation Network Companies (TNCs) such as Uber and Lyft, users in
designated areas specify the details of their trips on a mobile application, and a vehicle is dispatched to
deliver them to their destination. Operating specifics such as service hours and coverage are tailored to
meet the needs and/or resources of the agency (fleet availability, operating budget, etc.).
Figure 1.10 Example of SunRide Vehicle
Page 238 of 400
Short Range Transit Plan • FY23 – FY25 13
SunRide Operations
SunLine identified four Coachella Valley communities that would benefit most from this on-demand
service. The new microtransit service, known as SunRide, is available in Desert Hot Springs (including the
community of Desert Edge), Palm Desert, Coachella, and Mecca-North Shore (Figure 1.11 to Figure
1.14). This service bridges the gap between riders and the fixed route network or designated points of
interest. Riders typically use the SunRide smartphone app to book their ride, which dispatches a SunRide
vehicle to pick them up and drop them off at locations indicated within the designated geo-fenced
zones. Riders that do not have access to a smartphone may also book a trip through the SunRide web
portal at book.sunride.rideco.com or by calling the SunRide dispatch center. The service is available
Monday through Friday between 5:30 a.m. and 6:30 p.m.
The SunRide fare is $3 per person, which includes a free transfer to/from the intersecting fixed bus
routes. SunRide’s on-demand service allows a rider to book a trip within 15 minutes or to schedule a trip
up to 7 days in advance. Riders may opt for contactless payment by choosing to pay using their credit or
debit card. The app allows riders to store their credit or debit card information within the app for
convenience when booking future rides. Riders may also choose to pay for their ride in cash by
purchasing a $3 “SunRide Transfer Pass” on the fixed route bus when the rider boards the bus as the
first leg of the trip, or by paying the SunRide driver directly when SunRide is the first leg of the trip.
Page 239 of 400
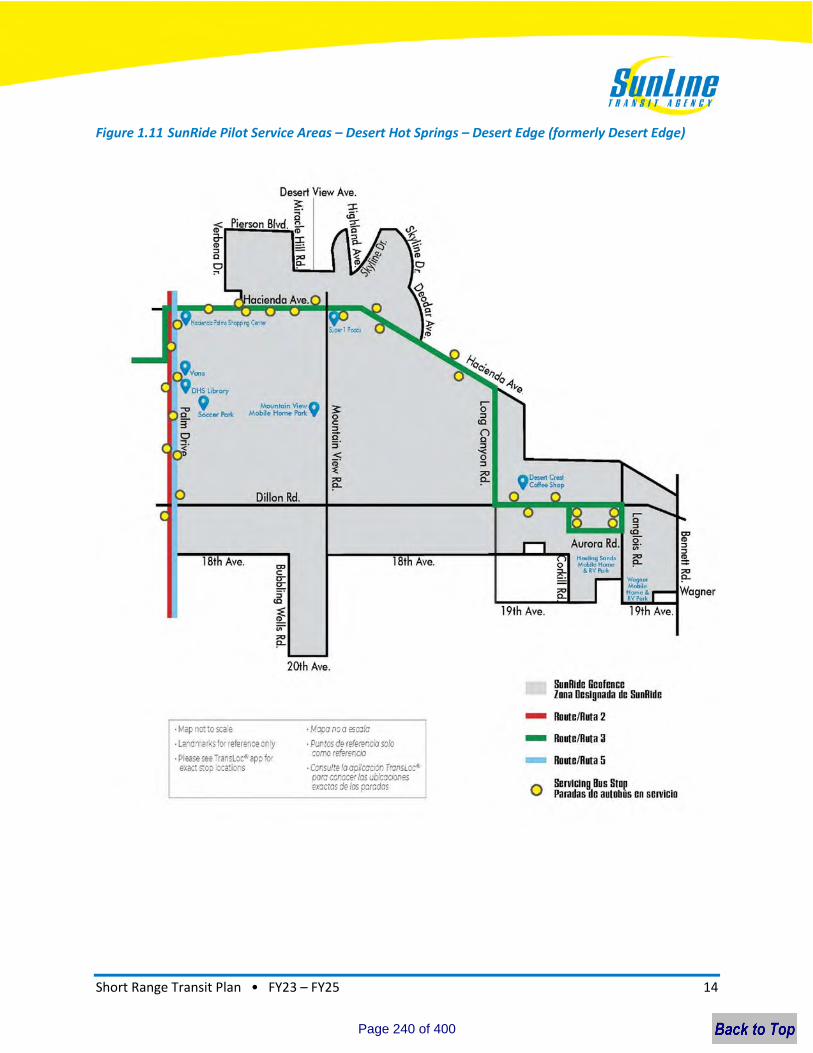
Short Range Transit Plan • FY23 – FY25 14
Figure 1.11 SunRide Pilot Service Areas – Desert Hot Springs – Desert Edge (formerly Desert Edge)
Page 240 of 400
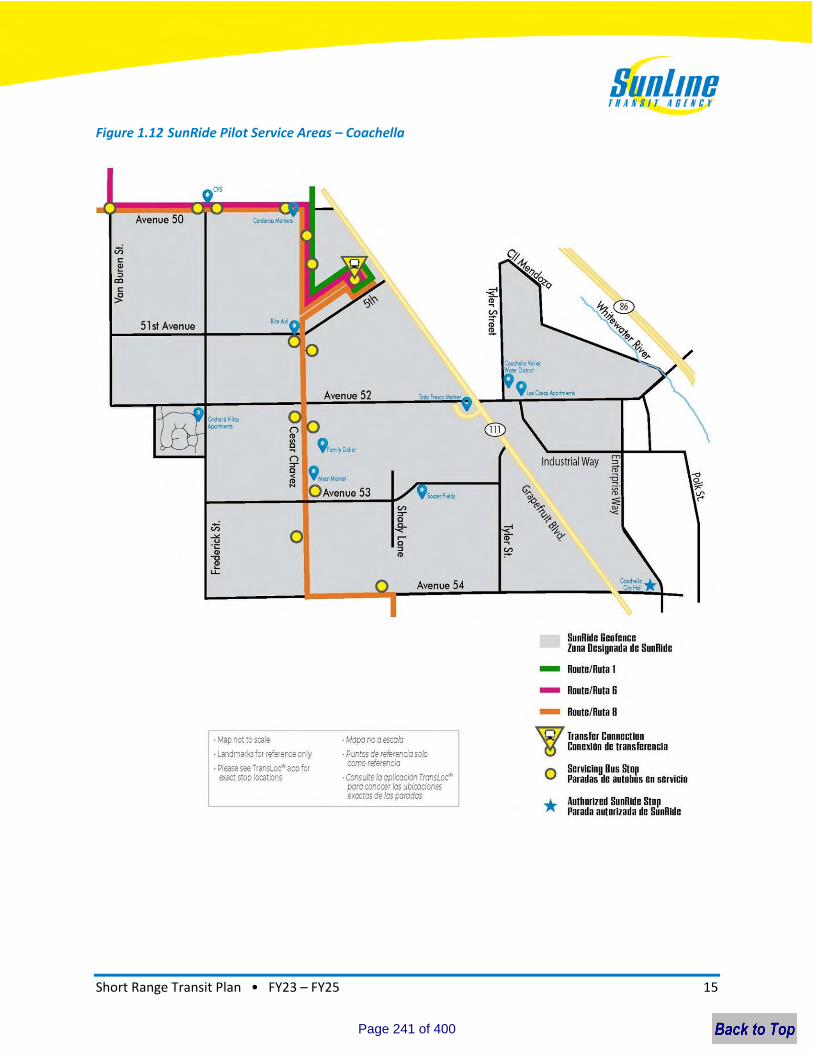
Short Range Transit Plan • FY23 – FY25 15
Figure 1.12 SunRide Pilot Service Areas – Coachella
Page 241 of 400
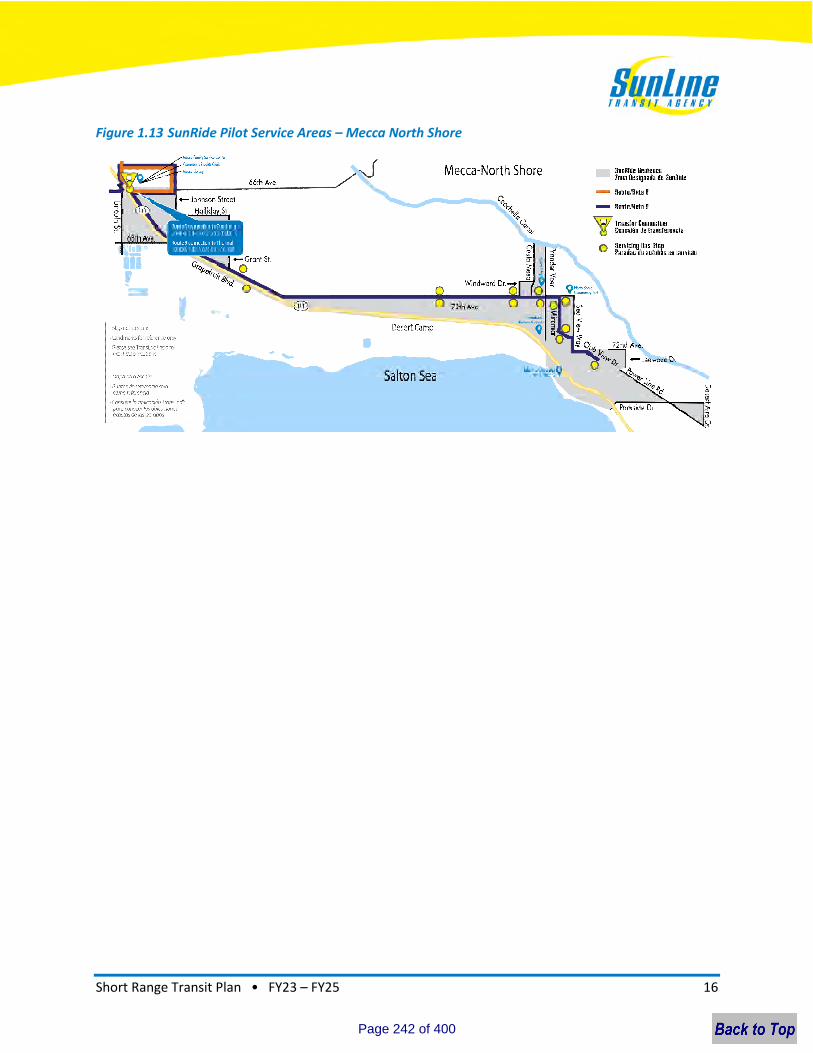
Short Range Transit Plan • FY23 – FY25 16
Figure 1.13 SunRide Pilot Service Areas – Mecca North Shore
Page 242 of 400
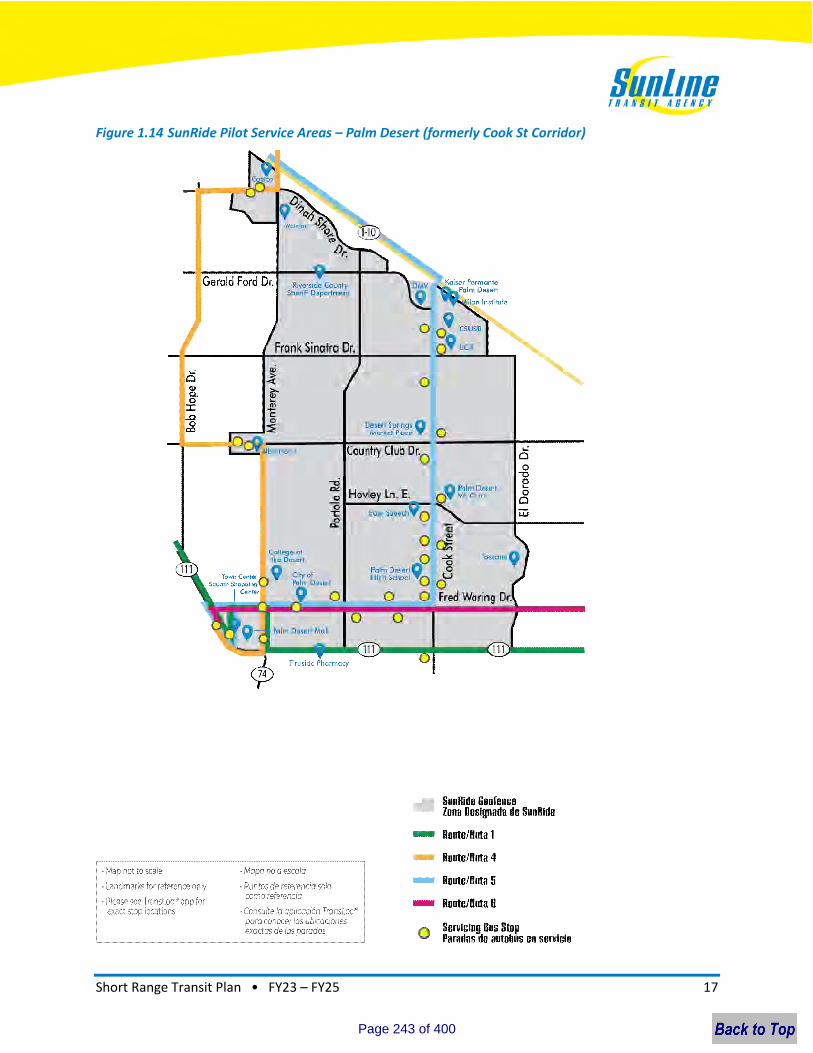
Short Range Transit Plan • FY23 – FY25 17
Figure 1.14 SunRide Pilot Service Areas – Palm Desert (formerly Cook St Corridor)
Page 243 of 400

Short Range Transit Plan • FY23 – FY25 18
COVID-19 Safety
In response to the COVID-19 pandemic, SunRide vehicles are fogged with disinfectant nightly and
frequently touched surfaces are wiped down between rides. Vinyl vehicle partitions have also been
installed in SunRide vehicles to help reduce virus spread. Passenger seating is limited to the vehicle’s
rear seating capacity and masks must be worn by the driver and riders at all times.
SunRide Technology Platform
SunLine launched Phase III of the pilot program on January 10, 2022. Phase III introduced a new SunRide
branded mobile application (Figure 1.15) developed by RideCo that offers additional features and
functionality to enhance the user experience. Some of the new features and functionality include
improved connections to the fixed route network, projected trip arrival times, and a 5-star rider rating
system. Putting ourselves in the shoes of our riders, SunLine has also added new stops at common
points of interest within each respective geo-fence zone that serve as ride generators, providing new
touchpoints for a choice rider experience. These points of interest include stops within a short walking
distance of education, shopping, and medical facilities, implementing further service flexibility and more
mobility options that are inclusive of a larger demographic. An advanced back-end software platform
features a robust reporting suite to assist in evaluating the program’s performance metrics.
Figure 1.15 SunRide Mobile App
Page 244 of 400
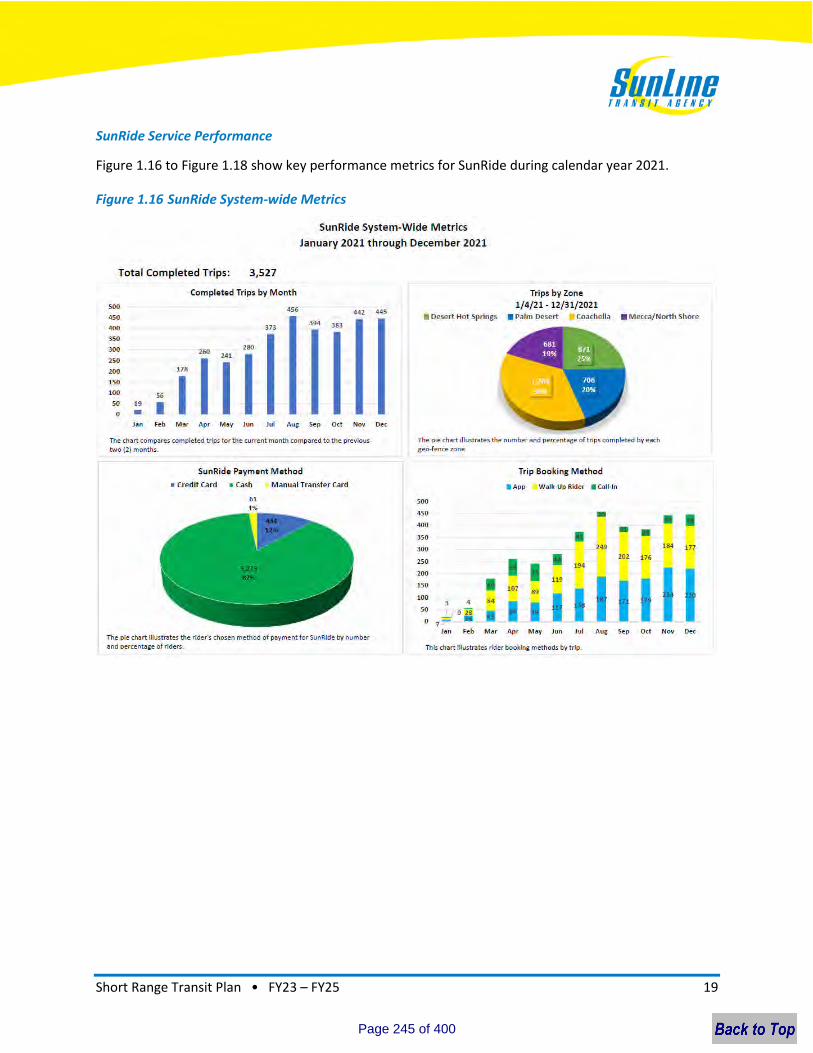
Short Range Transit Plan • FY23 – FY25 19
SunRide Service Performance
Figure 1.16 to Figure 1.18 show key performance metrics for SunRide during calendar year 2021.
Figure 1.16 SunRide System-wide Metrics
Page 245 of 400

Short Range Transit Plan • FY23 – FY25 20
Figure 1.17 SunRide Unique Users
Page 246 of 400
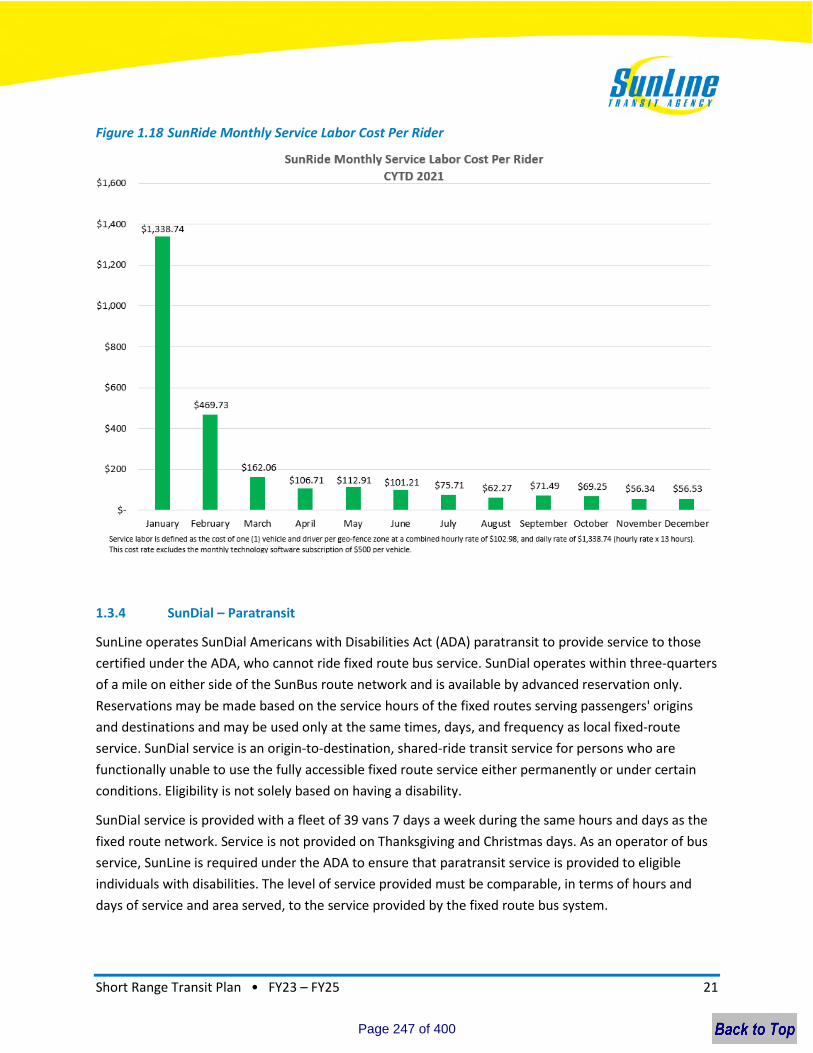
Short Range Transit Plan • FY23 – FY25 21
Figure 1.18 SunRide Monthly Service Labor Cost Per Rider
1.3.4 SunDial – Paratransit
SunLine operates SunDial Americans with Disabilities Act (ADA) paratransit to provide service to those
certified under the ADA, who cannot ride fixed route bus service. SunDial operates within three-quarters
of a mile on either side of the SunBus route network and is available by advanced reservation only.
Reservations may be made based on the service hours of the fixed routes serving passengers' origins
and destinations and may be used only at the same times, days, and frequency as local fixed-route
service. SunDial service is an origin-to-destination, shared-ride transit service for persons who are
functionally unable to use the fully accessible fixed route service either permanently or under certain
conditions. Eligibility is not solely based on having a disability.
SunDial service is provided with a fleet of 39 vans 7 days a week during the same hours and days as the
fixed route network. Service is not provided on Thanksgiving and Christmas days. As an operator of bus
service, SunLine is required under the ADA to ensure that paratransit service is provided to eligible
individuals with disabilities. The level of service provided must be comparable, in terms of hours and
days of service and area served, to the service provided by the fixed route bus system.
Page 247 of 400
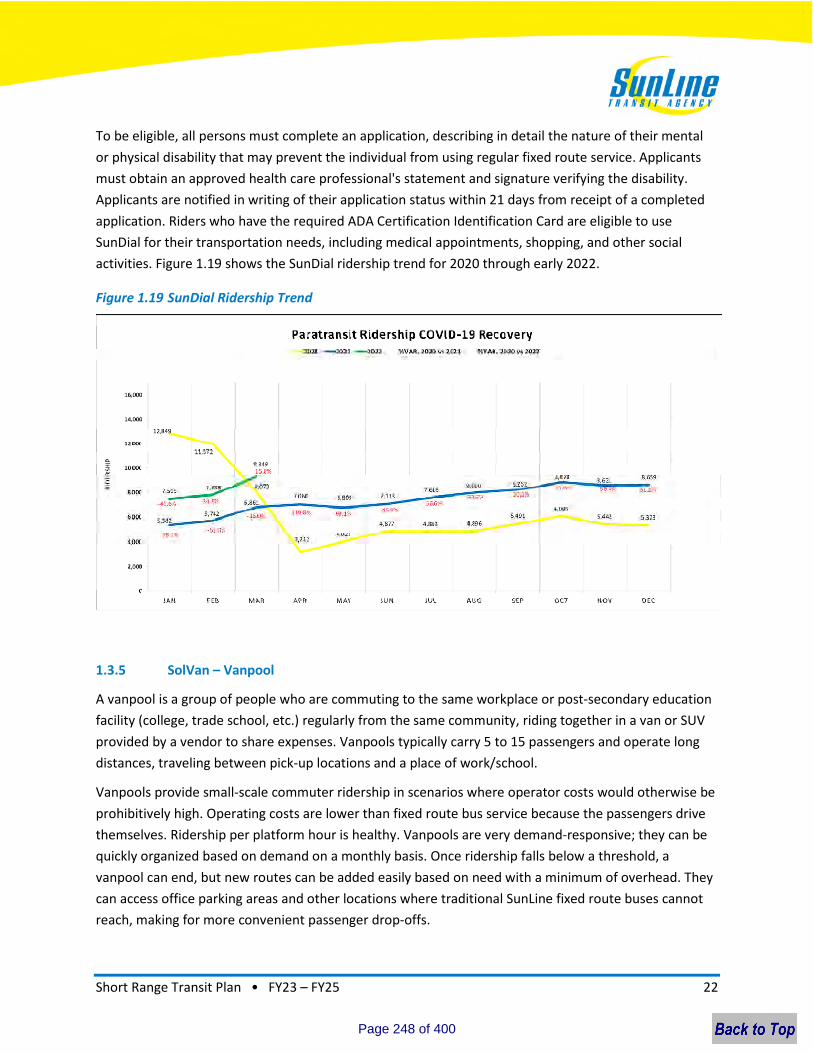
Short Range Transit Plan • FY23 – FY25 22
To be eligible, all persons must complete an application, describing in detail the nature of their mental
or physical disability that may prevent the individual from using regular fixed route service. Applicants
must obtain an approved health care professional's statement and signature verifying the disability.
Applicants are notified in writing of their application status within 21 days from receipt of a completed
application. Riders who have the required ADA Certification Identification Card are eligible to use
SunDial for their transportation needs, including medical appointments, shopping, and other social
activities. Figure 1.19 shows the SunDial ridership trend for 2020 through early 2022.
Figure 1.19 SunDial Ridership Trend
1.3.5 SolVan – Vanpool
A vanpool is a group of people who are commuting to the same workplace or post-secondary education
facility (college, trade school, etc.) regularly from the same community, riding together in a van or SUV
provided by a vendor to share expenses. Vanpools typically carry 5 to 15 passengers and operate long
distances, traveling between pick-up locations and a place of work/school.
Vanpools provide small-scale commuter ridership in scenarios where operator costs would otherwise be
prohibitively high. Operating costs are lower than fixed route bus service because the passengers drive
themselves. Ridership per platform hour is healthy. Vanpools are very demand-responsive; they can be
quickly organized based on demand on a monthly basis. Once ridership falls below a threshold, a
vanpool can end, but new routes can be added easily based on need with a minimum of overhead. They
can access office parking areas and other locations where traditional SunLine fixed route buses cannot
reach, making for more convenient passenger drop-offs.
Page 248 of 400
Short Range Transit Plan • FY23 – FY25 23
Vanpool programs can be administered in a variety of ways, allowing the employer to be fully involved
or simply promote it. Employers can help employees form vanpools through rideshare matching.
Rideshare matching helps potential vanpoolers locate others nearby with similar commutes. With
technology advancements, on-demand vanpooling may help reduce coordination costs and increase
ridership. As the region develops unevenly, vanpools will be an increasingly effective means to serve
trips from low-density places to employment and education centers.
SunLine’s Vanpool Program, SolVan, is operated through a third-party lease arrangement, known as
“purchased transportation” by the Federal Transit Administration (FTA), where SunLine contracts with a
consulting firm to competitively procure for leasing vendors, who then provide a leased vehicle to
vanpool groups. SolVan provides a subsidy of $400 monthly (or $500 if a zero-emission vehicle) for
qualified vans that agree to report about daily riders, miles, hours, and expenses. A SolVan reporting
system has been created to track each rider on each vanpool. The volunteer driver of the vanpool must
be a participant in the vanpool program. Vanpool passengers will be responsible for paying the van’s
monthly lease cost minus the SolVan subsidy. Leases include insurance and maintenance. They also
share the cost of gas, parking, and toll fees (if applicable). Vehicles for this type of service will be leased
by one of the prequalified vendors to one of the commuters in the group, a company, or a third-party
representative. SolVan has increased the number of approved vendors to a total of four vendors to
increase vehicle type and lease cost choices.
SolVan materials and guides are posted on the SolVan.org website, and include program guidelines,
vanpool brochure, participation agreement, passenger manifest forms, quick facts, Frequently Asked
Questions, Steps/Instructions to Apply, Steps/Instructions for monthly reporting, change form, and
intake form. These materials help explain the SolVan program, detail how to apply for a vanpool subsidy,
how to ultimately have vanpools approved for SolVan subsidy, and report commute details to receive
the monthly subsidy.
Performance/Service Area/Demographics
During the past year, agricultural-related vanpools served farm workers living and working in the eastern
Coachella Valley, including Thermal, Mecca, Coachella, and Indio. Around 20 vehicles have been
provided during each key harvesting month. Non-farm, more traditional vanpools serve worksites all
over eastern Riverside County. The number of vehicles serving these traditional worksites has varied
from six to seven per month during the past year, with seven at present. The origin of these vanpools
during this past year has been vanpoolers living primarily in Indio, Beaumont, and La Quinta. The
destination of these vanpoolers has primarily been to worksites in Blythe, Palm Springs, and Indio. Major
employers served by most of the traditional vanpools are the Transportation Security Administration at
Palm Springs Airport, U.S. Border Patrol sites, and state prisons.
Page 249 of 400

Short Range Transit Plan • FY23 – FY25 24
Fares
The cost for vanpoolers to ride varies wildly because fares are determined by many factors, including
type and year of vehicle chosen, commute mileage, and number of riders who are splitting the monthly
fare. The average number of vanpoolers in a vehicle is nine. The current vanpool monthly total lease
cost ranges between $1,050 and $1,800 for traditional, non-farm destined vanpools. Gas cost is
calculated and added to this cost.
The number of vanpool vendors under contract has doubled from two companies to four currently. With
additional vendors providing more vehicle choices (such as hybrid or electric vehicles) and providing
more competitive lease rates, it is possible that passenger out-of-pocket costs may decrease. Although
SunLine procures for third-party leasing vendors through its contractor, the procurement is to ensure
there is consistency and standard vehicle offerings among vendors—not to control vehicle pricing or
fares. SunLine has no control over the passengers’ out-of-pocket fares, only the amount of subsidy
provided. In addition, after the lease costs the next highest out-of-pocket vanpool expense is fuel.
Should electric or hybrid vehicles be introduced into the vehicle offerings, although the lease cost may
be higher, many employers offer free electricity while charging at work and the at-home electric
charging costs can be quite low (depending on electric provider and low rates to charge off peak). This
may also result in lower fares for certain vanpool groups. Volatile gas prices in recent years will continue
to have unpredictable impact on fares for vanpool groups.
The other strategy for lowering fares is to assist vanpool groups in increasing occupancy. The more
passengers that share the cost of the vanpools, the lower the fares per passenger. Although SolVan
requires that vanpools maintain a minimum of 50 percent occupancy (ratio of passengers to the vanpool
seats), SolVan works directly with vanpool groups that lose riders, struggle with occupancy, or are
looking for part-time riders to increase occupancy and decrease passenger fares. SolVan staff assist with
finding additional riders and filling seats in vanpools. Ultimately, SunLine cannot predict or determine
whether vanpool fares will increase or decrease in the future; however, additional vendors and actions
may result in lower fares and an even more cost-effective vanpool service.
Goals
During the past year, SunLine’s goal was to expand traditional vanpooling by at least three vehicles. Two
new traditional vanpools were added that still operate today. One traditional vanpool disbanded during
the year on account of work shift changes. The goal for agricultural vanpools was to maintain the high
level of farm vanpools, which was achieved.
SolVan Guidelines
To receive a vanpool subsidy, the vanpool must meet the following criteria: either originate or travel to
a worksite within a ZIP Code in eastern Riverside County, commute at least 25 miles round-trip,
commute a minimum of 12 or more days per month, and have at least five riders. Vehicles must also be
at least seven-seat vehicles, and can seat up to fifteen. Occupancy must be at least 70 percent to start
Page 250 of 400
Short Range Transit Plan • FY23 – FY25 25
and remain at least 50 percent. However, this occupancy requirement has been relaxed during the
pandemic for existing vanpools. Guidelines also require that the vanpool lease a vehicle with one of the
four SolVan-approved vendors and permit SunLine to advertise the vanpool and the route to the general
public and accept additional riders to fill empty seats. SunLine contracts with WSP, which has entered
agreements with four approved vendors to provide specific vehicles, lease pricing, and certain insurance
coverage, among other requirements.
To be approved for SolVan subsidy, the vanpool group must visit the SolVan.org website and submit an
application. SolVan staff then reviews the application to ensure it qualifies and meets all program
guidelines—if so, the application is approved. The vanpool group is then directed to provide all details
about the vanpool, including rider names, pick-up locations for each, drop-off locations for each,
mileage and hours for each rider, work shift, commute days during the week, contact info for each rider,
driver detail, start date, lease cost, copy of lease agreement, employer detail for each rider,
participation agreement signatures, and manifest passenger form. Once approved, the vanpools are
required to submit any changes, such as rider changes, work shift change, vehicle changes, etc. SolVan
then confirms details with the vendor regarding lease, vehicle detail, and lease cost. If a vanpool begins
after the first day of a calendar month, the subsidy is prorated based on the commute days during that
first month.
SolVan Reporting Procedure
SolVan has a very detailed reporting procedure for each vanpool on a monthly basis. By the seventh of
the next month deadline, vanpools are required to report actual daily activity on that specific vanpool
during that prior month, which includes who rides each way; any change to regular miles traveled or
extra time due to detour, etc.; all costs such as gas, parking, and tolls; and the end of month odometer
reading. Also, it is identified if a loaner temporary vanpool vehicle is used during any day that month.
TransTrack is the reporting system used by each vanpool driver, who is given a log-in name and
password to report into the system. SolVan staff then reviews the daily detail for accuracy and approves
subsidy when accurate and complete. Enterprise then submits a monthly invoice detailing each vanpool
in operation, vehicle detail, and lease cost to get reimbursed for subsidy, which lowers the lease cost
paid by the vanpool group. SolVan staff then runs reports from TransTrack to reveal month ridership,
miles, hours, and vehicles, and creates formulas to double-check all data are complete and accurate to
meet FTA National Transit Database (NTD) requirements. SunLine staff is then sent this monthly
reporting detail and source materials for review before entry into the NTD system.
Farm vanpools operating with CalVans report differently. CalVans provides the farm-related vanpools,
and most of those vehicles have not asked for SolVan subsidy, but many operate in our territory. As a
result, any FTA funding generated from the CalVans Eastern Riverside vanpool activity is entered into
the NTD by CalVans directly as a joint powers authority, and funds are provided directly to SunLine.
Public transit agencies that provide ongoing subsidies to third-party leased vanpools for the purpose of
reducing the lease/capital costs of the vehicle may report their transportation data to the NTD. The
Page 251 of 400
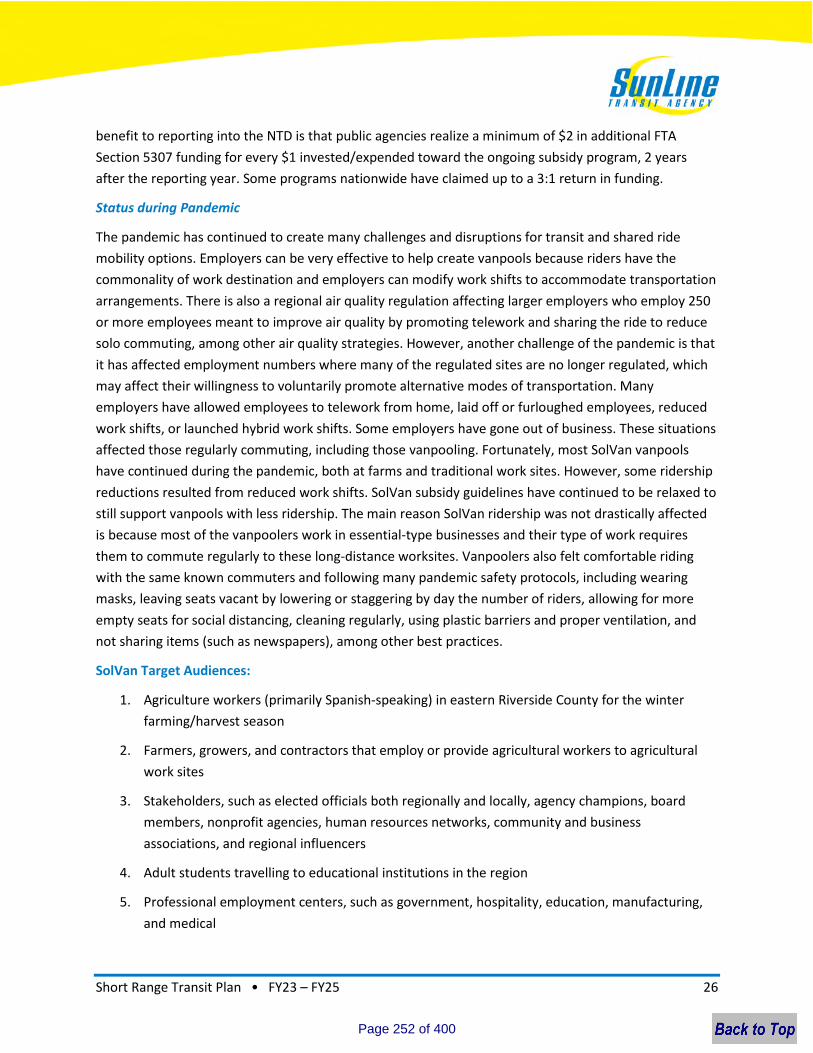
Short Range Transit Plan • FY23 – FY25 26
benefit to reporting into the NTD is that public agencies realize a minimum of $2 in additional FTA
Section 5307 funding for every $1 invested/expended toward the ongoing subsidy program, 2 years
after the reporting year. Some programs nationwide have claimed up to a 3:1 return in funding.
Status during Pandemic
The pandemic has continued to create many challenges and disruptions for transit and shared ride
mobility options. Employers can be very effective to help create vanpools because riders have the
commonality of work destination and employers can modify work shifts to accommodate transportation
arrangements. There is also a regional air quality regulation affecting larger employers who employ 250
or more employees meant to improve air quality by promoting telework and sharing the ride to reduce
solo commuting, among other air quality strategies. However, another challenge of the pandemic is that
it has affected employment numbers where many of the regulated sites are no longer regulated, which
may affect their willingness to voluntarily promote alternative modes of transportation. Many
employers have allowed employees to telework from home, laid off or furloughed employees, reduced
work shifts, or launched hybrid work shifts. Some employers have gone out of business. These situations
affected those regularly commuting, including those vanpooling. Fortunately, most SolVan vanpools
have continued during the pandemic, both at farms and traditional work sites. However, some ridership
reductions resulted from reduced work shifts. SolVan subsidy guidelines have continued to be relaxed to
still support vanpools with less ridership. The main reason SolVan ridership was not drastically affected
is because most of the vanpoolers work in essential-type businesses and their type of work requires
them to commute regularly to these long-distance worksites. Vanpoolers also felt comfortable riding
with the same known commuters and following many pandemic safety protocols, including wearing
masks, leaving seats vacant by lowering or staggering by day the number of riders, allowing for more
empty seats for social distancing, cleaning regularly, using plastic barriers and proper ventilation, and
not sharing items (such as newspapers), among other best practices.
SolVan Target Audiences:
1. Agriculture workers (primarily Spanish-speaking) in eastern Riverside County for the winter
farming/harvest season
2. Farmers, growers, and contractors that employ or provide agricultural workers to agricultural
work sites
3. Stakeholders, such as elected officials both regionally and locally, agency champions, board
members, nonprofit agencies, human resources networks, community and business
associations, and regional influencers
4. Adult students travelling to educational institutions in the region
5. Professional employment centers, such as government, hospitality, education, manufacturing,
and medical
Page 252 of 400
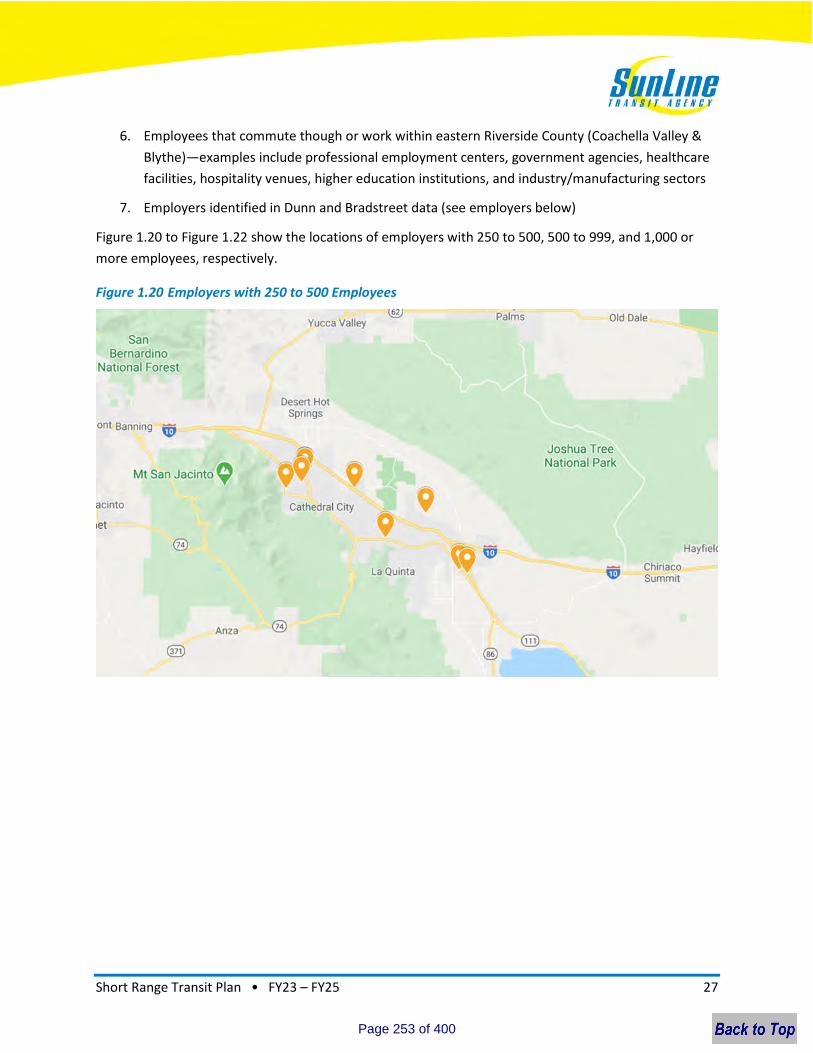
Short Range Transit Plan • FY23 – FY25 27
6. Employees that commute though or work within eastern Riverside County (Coachella Valley &
Blythe)—examples include professional employment centers, government agencies, healthcare
facilities, hospitality venues, higher education institutions, and industry/manufacturing sectors
7. Employers identified in Dunn and Bradstreet data (see employers below)
Figure 1.20 to Figure 1.22 show the locations of employers with 250 to 500, 500 to 999, and 1,000 or
more employees, respectively.
Figure 1.20 Employers with 250 to 500 Employees
Page 253 of 400
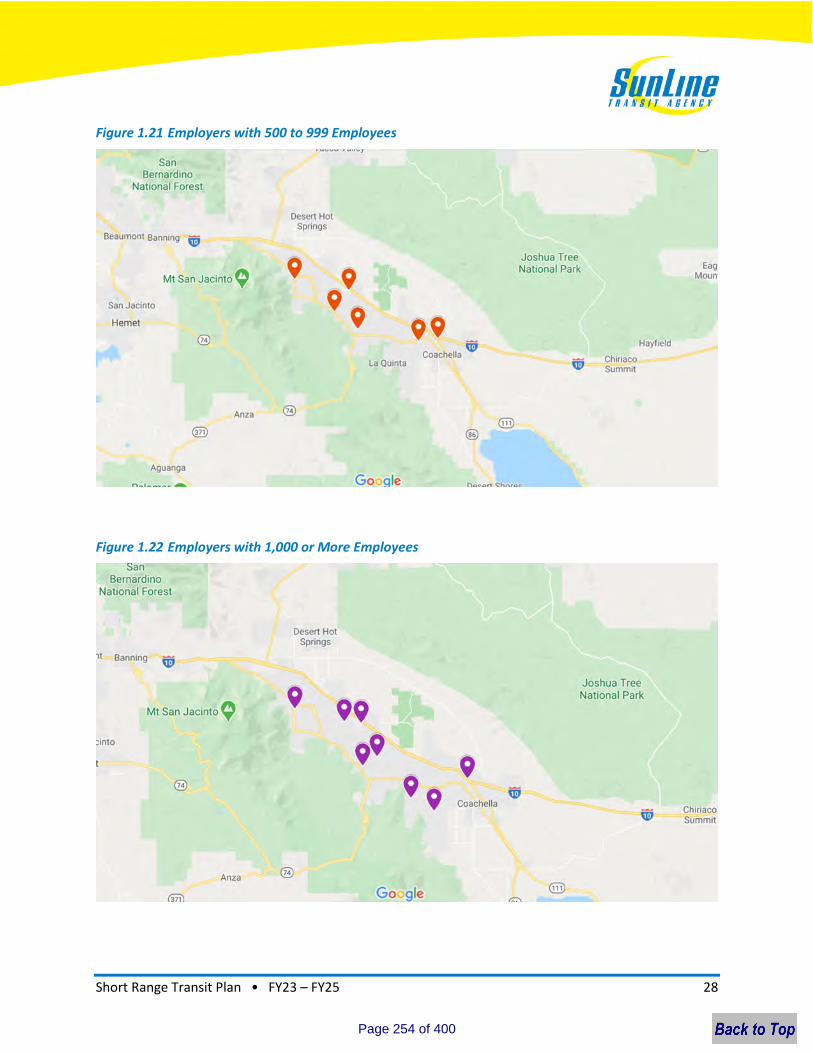
Short Range Transit Plan • FY23 – FY25 28
Figure 1.21 Employers with 500 to 999 Employees
Figure 1.22 Employers with 1,000 or More Employees
Page 254 of 400

Short Range Transit Plan • FY23 – FY25 29
Marketing Initiatives to Date:
Communication in the preferred language based on the demographics of eastern Riverside
County
Hotline phone number (877-4SOLVAN) and website (SolVan.org)
Program materials, printed and electronic, including a brochure, employer packets, fact sheets,
guidelines, steps, etc.
Creation and placement of SolVan vehicle decals to identify and promote the program
Expanded van vendor selection to provide more competitive van lease pricing, vehicle options,
and services
Novelty items, such as pens, note pads, bags, commuter mugs, sunscreen, lunch bags, etc.
Logo wear to be worn by SunLine/SolVan staff when attending employer and community events
to further promote and build the brand
Vanpool launch event and press release
1.3.6 Taxi Administration
The SunLine Regulatory Administration (SRA) is charged with licensing and regulating taxicab businesses
and drivers in the Coachella Valley.
1.4 Current Fare Structure
In 2002, SunLine raised its base cash fare from 75 cents to $1. In 2011, a SunLine fare study
recommended both eliminating the 25-cent transfer fare and incrementally raising the base cash fare to
$1.50. These recommendations were not implemented. The SunLine Board of Directors has given
direction to staff to explore fare-free operations.
Figure 1.23 shows the existing SunLine fare structure. This fare structure differentiates fares for specific
transit customers and trip types, which shows how SunLine is targeting specific market segments with
discounts to increase the system’s ridership and revenue. For example, SunLine provides a discounted
31-day youth pass for students using transit.
1.4.1 Cash Fares
In addition to the $1 fare for adult riders, SunLine enforces a 25-cent fee for transfers. The transfer pass
is good for unlimited rides within 2 hours of purchase and is valid only on the day issued. Transfers are
issued only upon boarding.
The base cash fare for seniors, which SunLine defines as individuals 60 years of age or older, is 50 cents
on all fixed route services. Individuals who qualify for the ADA also pay a 50-cent base cash fare on all
fixed route services. The fare complies with FTA’s Half Fare rule, which requires agencies receiving
Page 255 of 400
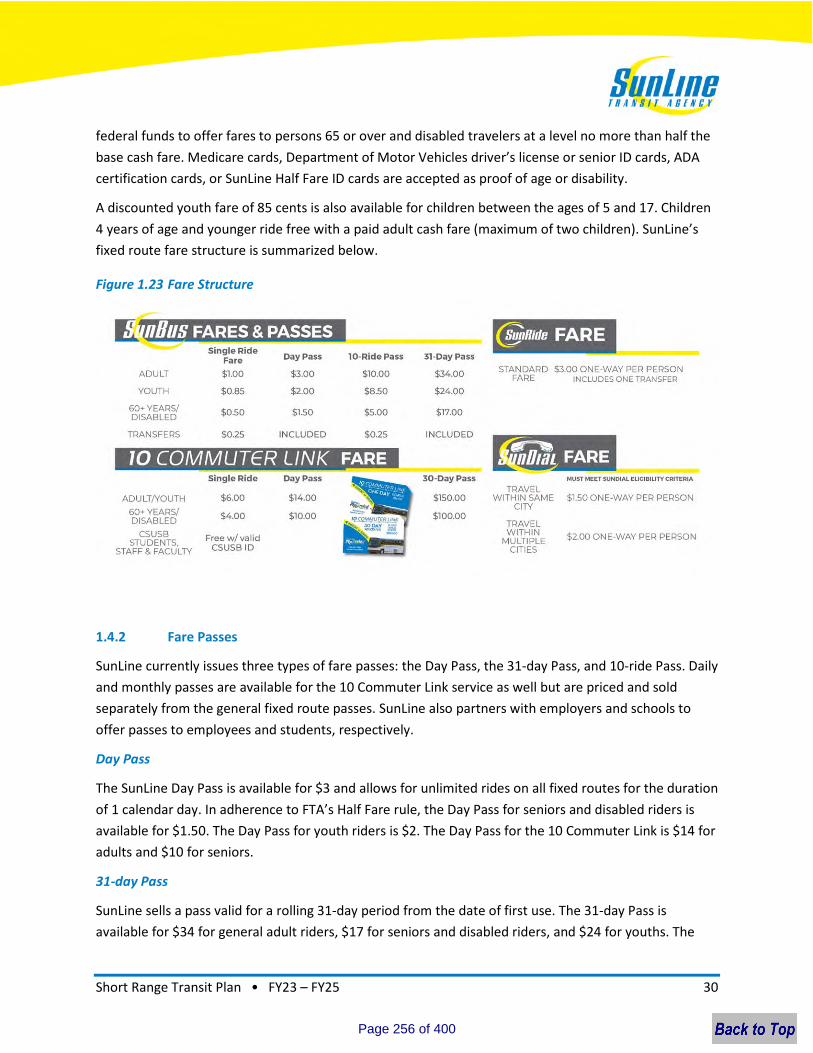
Short Range Transit Plan • FY23 – FY25 30
federal funds to offer fares to persons 65 or over and disabled travelers at a level no more than half the
base cash fare. Medicare cards, Department of Motor Vehicles driver’s license or senior ID cards, ADA
certification cards, or SunLine Half Fare ID cards are accepted as proof of age or disability.
A discounted youth fare of 85 cents is also available for children between the ages of 5 and 17. Children
4 years of age and younger ride free with a paid adult cash fare (maximum of two children). SunLine’s
fixed route fare structure is summarized below.
Figure 1.23 Fare Structure
1.4.2 Fare Passes
SunLine currently issues three types of fare passes: the Day Pass, the 31-day Pass, and 10-ride Pass. Daily
and monthly passes are available for the 10 Commuter Link service as well but are priced and sold
separately from the general fixed route passes. SunLine also partners with employers and schools to
offer passes to employees and students, respectively.
Day Pass
The SunLine Day Pass is available for $3 and allows for unlimited rides on all fixed routes for the duration
of 1 calendar day. In adherence to FTA’s Half Fare rule, the Day Pass for seniors and disabled riders is
available for $1.50. The Day Pass for youth riders is $2. The Day Pass for the 10 Commuter Link is $14 for
adults and $10 for seniors.
31-day Pass
SunLine sells a pass valid for a rolling 31-day period from the date of first use. The 31-day Pass is
available for $34 for general adult riders, $17 for seniors and disabled riders, and $24 for youths. The
Page 256 of 400
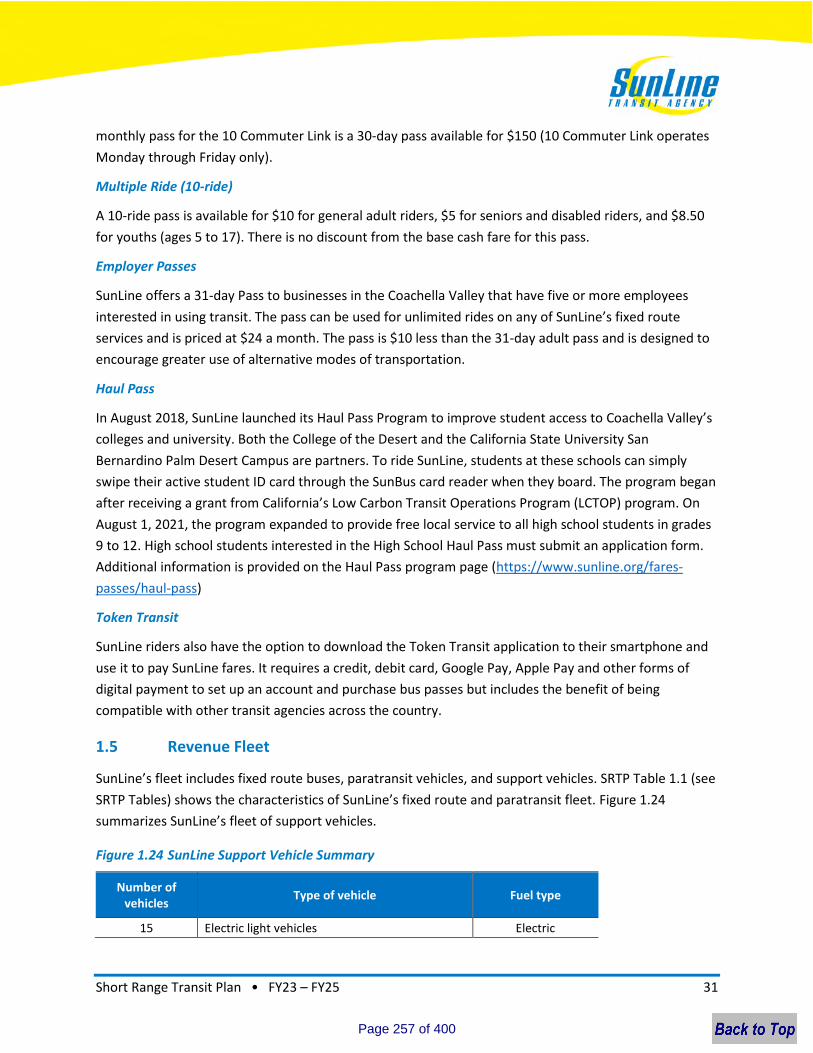
Short Range Transit Plan • FY23 – FY25 31
monthly pass for the 10 Commuter Link is a 30-day pass available for $150 (10 Commuter Link operates
Monday through Friday only).
Multiple Ride (10-ride)
A 10-ride pass is available for $10 for general adult riders, $5 for seniors and disabled riders, and $8.50
for youths (ages 5 to 17). There is no discount from the base cash fare for this pass.
Employer Passes
SunLine offers a 31-day Pass to businesses in the Coachella Valley that have five or more employees
interested in using transit. The pass can be used for unlimited rides on any of SunLine’s fixed route
services and is priced at $24 a month. The pass is $10 less than the 31-day adult pass and is designed to
encourage greater use of alternative modes of transportation.
Haul Pass
In August 2018, SunLine launched its Haul Pass Program to improve student access to Coachella Valley’s
colleges and university. Both the College of the Desert and the California State University San
Bernardino Palm Desert Campus are partners. To ride SunLine, students at these schools can simply
swipe their active student ID card through the SunBus card reader when they board. The program began
after receiving a grant from California’s Low Carbon Transit Operations Program (LCTOP) program. On
August 1, 2021, the program expanded to provide free local service to all high school students in grades
9 to 12. High school students interested in the High School Haul Pass must submit an application form.
Additional information is provided on the Haul Pass program page (https://www.sunline.org/fares-
passes/haul-pass)
Token Transit
SunLine riders also have the option to download the Token Transit application to their smartphone and
use it to pay SunLine fares. It requires a credit, debit card, Google Pay, Apple Pay and other forms of
digital payment to set up an account and purchase bus passes but includes the benefit of being
compatible with other transit agencies across the country.
1.5 Revenue Fleet
SunLine’s fleet includes fixed route buses, paratransit vehicles, and support vehicles. SRTP Table 1.1 (see
SRTP Tables) shows the characteristics of SunLine’s fixed route and paratransit fleet. Figure 1.24
summarizes SunLine’s fleet of support vehicles.
Figure 1.24 SunLine Support Vehicle Summary
Number of vehicles
Type of vehicle Fuel type
15 Electric light vehicles Electric
Page 257 of 400
Short Range Transit Plan • FY23 – FY25 32
12 Compressed natural gas (CNG) light vehicles CNG
15 CNG light-duty trucks CNG
2 Hybrid/Gasoline light-duty vehicles Hybrid
Total: 44
1.6 Existing Transit Facilities and Bus Stop Amenities
SunLine operates administrative and bus operations facilities at two locations. Administrative
headquarters and main bus operations are located at 32-505 Harry Oliver Trail in Thousand Palms.
SunLine also operates a maintenance and fueling facility at 83-255 Highway 111 in Indio. Park-and-ride
facilities are located at 78-420 Varner Road in Thousand Palms and at 83-255 Highway 111 in Indio.
SunLine’s bus system has 577 stops with 372 shelters. In addition, there are 81 stops with stand-alone
benches and 270 stops with waste containers.
Page 258 of 400
Short Range Transit Plan • FY23 – FY25 33
Figure 1.25 shows the top 10 stops served for weekday service and Figure 1.26 shows the top 10
weekend stops.
Page 259 of 400

Short Range Transit Plan • FY23 – FY25 34
Figure 1.25 Top 10 Stops
Stop name City Average riders per day
B St/Buddy Rogers Cathedral City 314
5th/Vine Coachella 217
Indian Canyon/Ramon Palm Springs 155
Town Center/Han East Side Palm Desert 140
Palm Canyon/Stevens Palm Springs 139
West/Pierson Desert Hot Springs 128
66th/Mecca Family HC Mecca 110
Town Center/Han West Side Palm Desert 101
Ramon/Date Palm Cathedral City 65
Ramon/Indian Canyon Palm Springs 62
Source: APC Data March 1, 2021–February 31, 2022
Figure 1.26 Top 10 Weekend Stops
Stop name City Average riders per day
B St/Buddy Rogers Cathedral City 262
5th/Vine Coachella 202
Indian Canyon/Ramon Palm Springs 130
Town Center/Han East Side Palm Desert 123
Palm Canyon/Stevens Palm Springs 113
66th/Mecca Family HC Mecca 97
Town Center/Han West Side Palm Desert 97
West/Pierson Desert Hot Springs 91
Ramon/Date Palm Cathedral City 57
Ramon/San Luis Rey Cathedral City 50
Source: APC Data March 1, 2021– February 31, 2022
1.7 Existing Coordination between Transit Agencies and Private Providers
As the designated Consolidated Transportation Services Agency, SunLine coordinates public
transportation services throughout its service area. Staff participates in meetings with social and human
service agencies, consumers, and grassroots advocates through forums such as the Riverside County
Transportation Commission (RCTC) Citizens and Specialized Transit Advisory Committee (CSTAC),
Page 260 of 400
Short Range Transit Plan • FY23 – FY25 35
SunLine’s ACCESS Advisory Committee, San Gorgonio Pass Area – Transportation Now Coalition, and
neighboring transit operators.
SunLine facilitates the ACCESS Advisory Committee. Staff hosts regular meetings at the Thousand Palms
administrative office. SunLine uses input from the committee to improve relationships with the
community to address public transportation issues in the valley.
Additionally, staff members are actively involved in the regional transportation planning process
through participation on RCTC and county committees. These committees include the Specialized
Transit Advisory Committee, the Technical Advisory Committee, Aging & Disability Resource Connection
of Riverside Long-term Services and Supports Coalition, Desert Valley Builders Association, and related
committees to enhance coordination efforts with SunLine.
1.7.1 Coordination with Other Public Transportation Providers
In addition to providing transit service throughout the Coachella Valley, SunLine offers transit
connections to several adjacent transit operators. SunLine maintains interagency agreements between
Riverside Transit Agency, Omnitrans, Metrolink, and California State University to coordinate the
operation of 10 Commuter Link service, which connects Indio/Palm Desert to the California State
University San Bernardino campus and the San Bernardino Transit Center (SBTC)/Metrolink Station with
an intermediate bus stop in Beaumont.
SunLine also hosts Morongo Basin Transit Authority (MBTA) Routes 12 and 15 through a cooperative
service agreement at its stops in downtown Palm Springs. The collaboration offers connections to Yucca
Valley, Landers, Joshua Tree, and Twentynine Palms.
SunLine is collaborating with the Palo Verde Valley Transit Agency on its Rides to Wellness
demonstration project, known as the Blythe Wellness Express service. This service, launched in July
2017, operates 3 days per week and travels to the Coachella Valley’s three hospitals (Desert Regional
Medical Center, Eisenhower Medical Center, and John F. Kennedy Memorial Hospital) within SunLine’s
service area.
Amtrak Thruway (operated by Amtrak bus contractors) transports rail passengers traveling between rail
hubs at certain Amtrak stations and SunLine’s bus stops in Palm Springs, Palm Desert, and La Quinta
under an additional cooperative service agreement. Amtrak’s Sunset Limited intercity train serves the
Palm Springs Station on North Indian Canyon Drive. However, with rail service only serving Palm Springs
three times a week in each direction and arriving in the middle of the night, it is currently impractical for
SunLine to offer transit service to the station.
SunLine collaborates with the Imperial Valley Transportation Commission (IVTC) in an effort to find a
future connection with Imperial Valley Transit (IVT). IVTC oversees the regional transportation services
and programs provided by IVT in the Southern California areas of Brawley, Calexico, Imperial, West
Shores, and El Centro.
Page 261 of 400
Short Range Transit Plan • FY23 – FY25 36
In 2019, FlixBus initiated regional bus service at Palm Springs, and Indio that connects to Los Angeles in
the west and Phoenix, Arizona, in the east. SunLine maintains an interagency operating agreement with
FlixBus.
1.8 Review of Previous Studies and Plans
In 2019, SunLine completed its Transit Redesign and Network Analysis Study. Prepared by HDR, this
study took a comprehensive look at fixed route transit operations to make recommendations to
optimize SunLine’s service. SunLine also completed an on-board transit rider survey in 2019. This survey
provided insight into rider preferences and needs to help guide the transit redesign. SunLine has
retained HDR to conduct a Before and After Study, which will include a new rider survey, to assess the
impact of the network redesign and how the needs of riders have changed through the pandemic. While
the study is ongoing, initial results have informed the development of this SRTP.
Other reports reviewed for the preparation of this SRTP include:
Bus Rider Survey Study (February 2015)
SunLine Transit Feasibility Study Hydrogen Station Expansion (January 2016)
SunLine Transit Facilities Master Plan (November 2016)
SunLine Transit Agency Transit Asset Management (September 2018)
Network Study Report SunLine Transit Redesign & Network Analysis (February 2019)
Innovative Clean Transit (ICT) Plan to SunLine Board of Directors (May 2020)
Page 262 of 400
Short Range Transit Plan • FY23 – FY25 37
Chapter 2. Existing Service and Route Performance
SunLine developed its Refueled plan through a holistic process that reflected guidance from the Board of
Directors and input received from customers and that used a data-driven process drawing from existing
transit market information such as stop- and route-level boarding data and origin-destination survey
data.
The Refueled plan has been launched in phases, beginning in January 2021 with the new Consolidated
Fixed Route Network, which streamlined and simplified routes and route numbers, and with the SunRide
microtransit service, which serves parts of Desert Hot Springs, Palm Desert, Coachella, and Mecca North
Shore. In July 2021, SunLine kicked off the 10 Commuter Link, an express service that connects Indio
with San Bernardino via Interstate 10. Route 1X, which is proposed to begin in September 2022, will
operate along Highway 111 between Palm Springs and Indio.
In June 2019, the Board of Directors approved the revised SunLine Service Standards Policy to provide
the agency staff direction regarding the planning, operation, and management of transit service in the
Coachella Valley. The Service Standards Policy and metrics are intended to:
promote continuous improvement of transit service
provide regular updates on service performance
meet federal requirements for monitoring Title VI of the Civil Rights Act
avoid uninformed decision-making regarding the provision of service
The Refueled FY21-23 SRTP included updated key performance indicators (KPIs) that further support
these quantitative, community-based planning methods. As we emerge from the pandemic, it will be
more important than ever for SunLine to grow ridership while making necessary adjustments based on
ridership trends.
2.1 Service Standards
2.1.1 Service Design Standards
Service frequency and span of service can be revised where sustainable (that is, where demand warrants
increased frequency, where performance measures can still be met, and when funding can sustain the
frequency and span of service).
New routes may be implemented based on a weekday-only service, typically between the hours of 6:00
A.M. and 7:00 P.M., usually when there is a peak demand. During the implementation of new service, a
trial period is allocated from 12 to 18 months as an opportunity to provide for service adjustments
before deciding to retain, expand, or eliminate the service. Figure 2.1 lists the minimum service
frequencies and spans.
Page 263 of 400
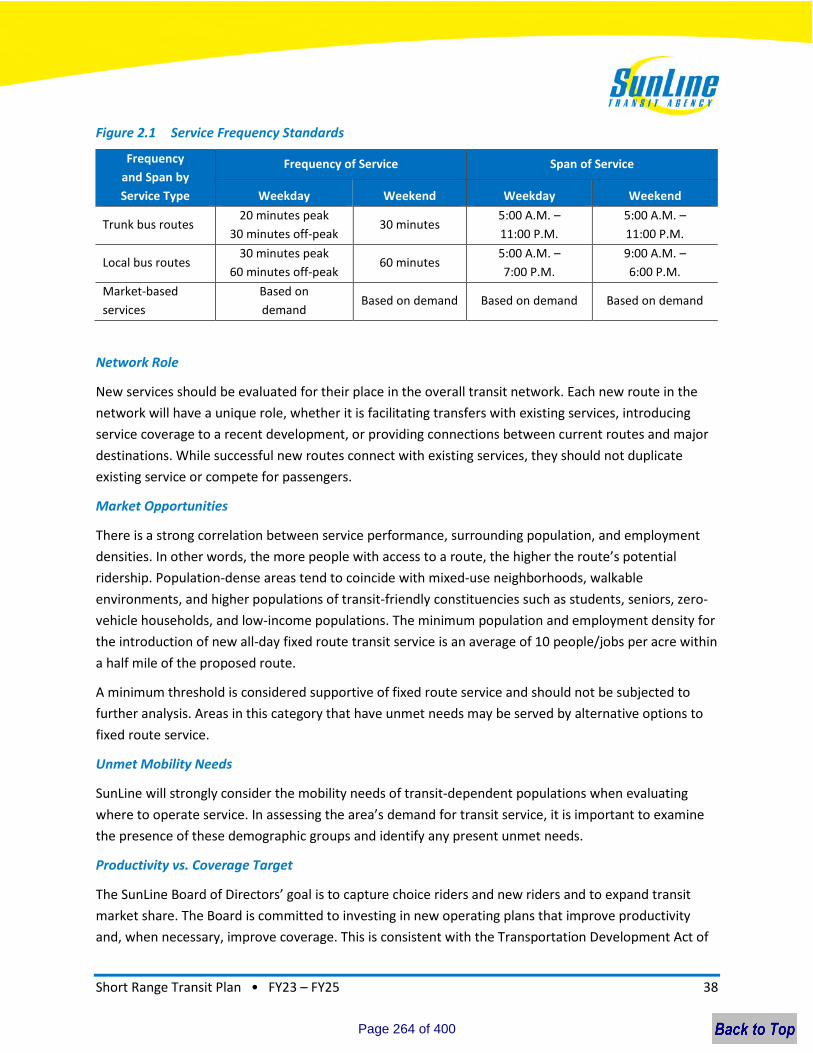
Short Range Transit Plan • FY23 – FY25 38
Figure 2.1 Service Frequency Standards
Frequency
and Span by
Service Type
Frequency of Service Span of Service
Weekday Weekend Weekday Weekend
Trunk bus routes 20 minutes peak
30 minutes off-peak 30 minutes
5:00 A.M. –
11:00 P.M.
5:00 A.M. –
11:00 P.M.
Local bus routes 30 minutes peak
60 minutes off-peak 60 minutes
5:00 A.M. –
7:00 P.M.
9:00 A.M. –
6:00 P.M.
Market-based
services
Based on
demand Based on demand Based on demand Based on demand
Network Role
New services should be evaluated for their place in the overall transit network. Each new route in the
network will have a unique role, whether it is facilitating transfers with existing services, introducing
service coverage to a recent development, or providing connections between current routes and major
destinations. While successful new routes connect with existing services, they should not duplicate
existing service or compete for passengers.
Market Opportunities
There is a strong correlation between service performance, surrounding population, and employment
densities. In other words, the more people with access to a route, the higher the route’s potential
ridership. Population-dense areas tend to coincide with mixed-use neighborhoods, walkable
environments, and higher populations of transit-friendly constituencies such as students, seniors, zero-
vehicle households, and low-income populations. The minimum population and employment density for
the introduction of new all-day fixed route transit service is an average of 10 people/jobs per acre within
a half mile of the proposed route.
A minimum threshold is considered supportive of fixed route service and should not be subjected to
further analysis. Areas in this category that have unmet needs may be served by alternative options to
fixed route service.
Unmet Mobility Needs
SunLine will strongly consider the mobility needs of transit-dependent populations when evaluating
where to operate service. In assessing the area’s demand for transit service, it is important to examine
the presence of these demographic groups and identify any present unmet needs.
Productivity vs. Coverage Target
The SunLine Board of Directors’ goal is to capture choice riders and new riders and to expand transit
market share. The Board is committed to investing in new operating plans that improve productivity
and, when necessary, improve coverage. This is consistent with the Transportation Development Act of
Page 264 of 400
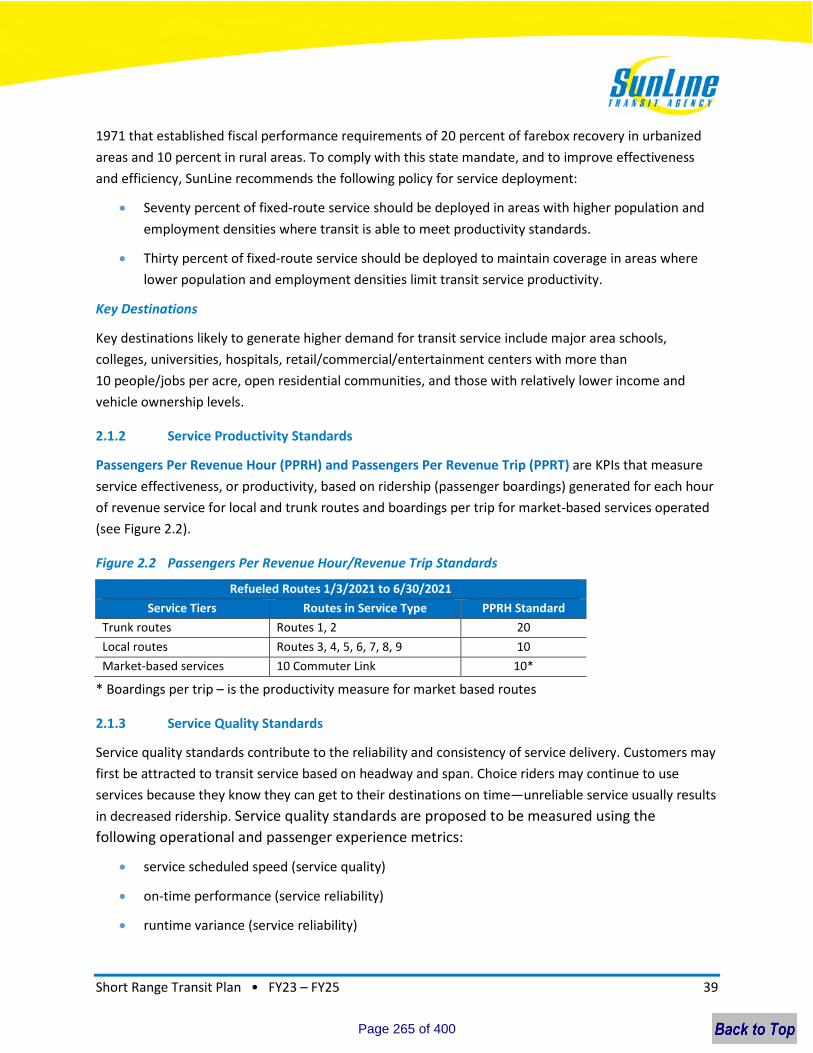
Short Range Transit Plan • FY23 – FY25 39
1971 that established fiscal performance requirements of 20 percent of farebox recovery in urbanized
areas and 10 percent in rural areas. To comply with this state mandate, and to improve effectiveness
and efficiency, SunLine recommends the following policy for service deployment:
Seventy percent of fixed-route service should be deployed in areas with higher population and
employment densities where transit is able to meet productivity standards.
Thirty percent of fixed-route service should be deployed to maintain coverage in areas where
lower population and employment densities limit transit service productivity.
Key Destinations
Key destinations likely to generate higher demand for transit service include major area schools,
colleges, universities, hospitals, retail/commercial/entertainment centers with more than
10 people/jobs per acre, open residential communities, and those with relatively lower income and
vehicle ownership levels.
2.1.2 Service Productivity Standards
Passengers Per Revenue Hour (PPRH) and Passengers Per Revenue Trip (PPRT) are KPIs that measure
service effectiveness, or productivity, based on ridership (passenger boardings) generated for each hour
of revenue service for local and trunk routes and boardings per trip for market-based services operated
(see Figure 2.2).
Figure 2.2 Passengers Per Revenue Hour/Revenue Trip Standards
Refueled Routes 1/3/2021 to 6/30/2021
Service Tiers Routes in Service Type PPRH Standard
Trunk routes Routes 1, 2 20
Local routes Routes 3, 4, 5, 6, 7, 8, 9 10
Market-based services 10 Commuter Link 10*
* Boardings per trip – is the productivity measure for market based routes
2.1.3 Service Quality Standards
Service quality standards contribute to the reliability and consistency of service delivery. Customers may
first be attracted to transit service based on headway and span. Choice riders may continue to use
services because they know they can get to their destinations on time—unreliable service usually results
in decreased ridership. Service quality standards are proposed to be measured using the
following operational and passenger experience metrics:
service scheduled speed (service quality)
on-time performance (service reliability)
runtime variance (service reliability)
Page 265 of 400
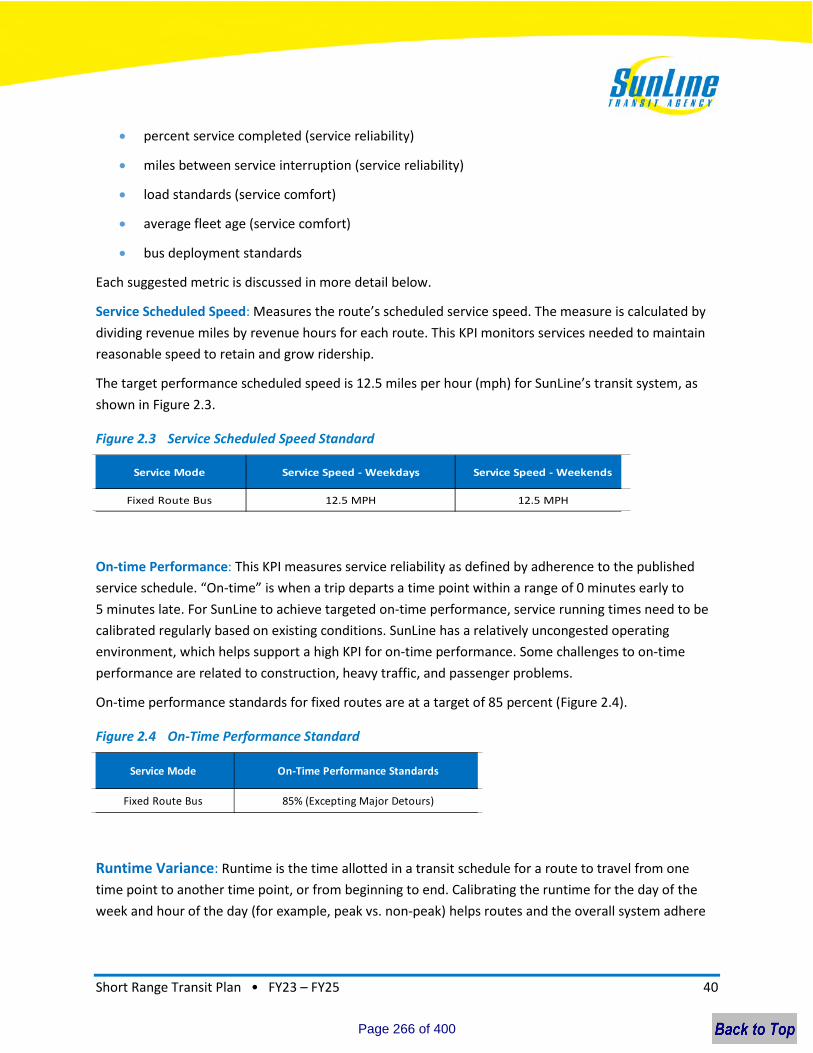
Short Range Transit Plan • FY23 – FY25 40
percent service completed (service reliability)
miles between service interruption (service reliability)
load standards (service comfort)
average fleet age (service comfort)
bus deployment standards
Each suggested metric is discussed in more detail below.
Service Scheduled Speed: Measures the route’s scheduled service speed. The measure is calculated by
dividing revenue miles by revenue hours for each route. This KPI monitors services needed to maintain
reasonable speed to retain and grow ridership.
The target performance scheduled speed is 12.5 miles per hour (mph) for SunLine’s transit system, as
shown in Figure 2.3.
Figure 2.3 Service Scheduled Speed Standard
On-time Performance: This KPI measures service reliability as defined by adherence to the published
service schedule. “On-time” is when a trip departs a time point within a range of 0 minutes early to
5 minutes late. For SunLine to achieve targeted on-time performance, service running times need to be
calibrated regularly based on existing conditions. SunLine has a relatively uncongested operating
environment, which helps support a high KPI for on-time performance. Some challenges to on-time
performance are related to construction, heavy traffic, and passenger problems.
On-time performance standards for fixed routes are at a target of 85 percent (Figure 2.4).
Figure 2.4 On-Time Performance Standard
Runtime Variance: Runtime is the time allotted in a transit schedule for a route to travel from one
time point to another time point, or from beginning to end. Calibrating the runtime for the day of the
week and hour of the day (for example, peak vs. non-peak) helps routes and the overall system adhere
Service Mode Service Speed - Weekdays Service Speed - Weekends
Fixed Route Bus 12.5 MPH 12.5 MPH
Service Mode On-Time Performance Standards
Fixed Route Bus 85% (Excepting Major Detours)
Page 266 of 400
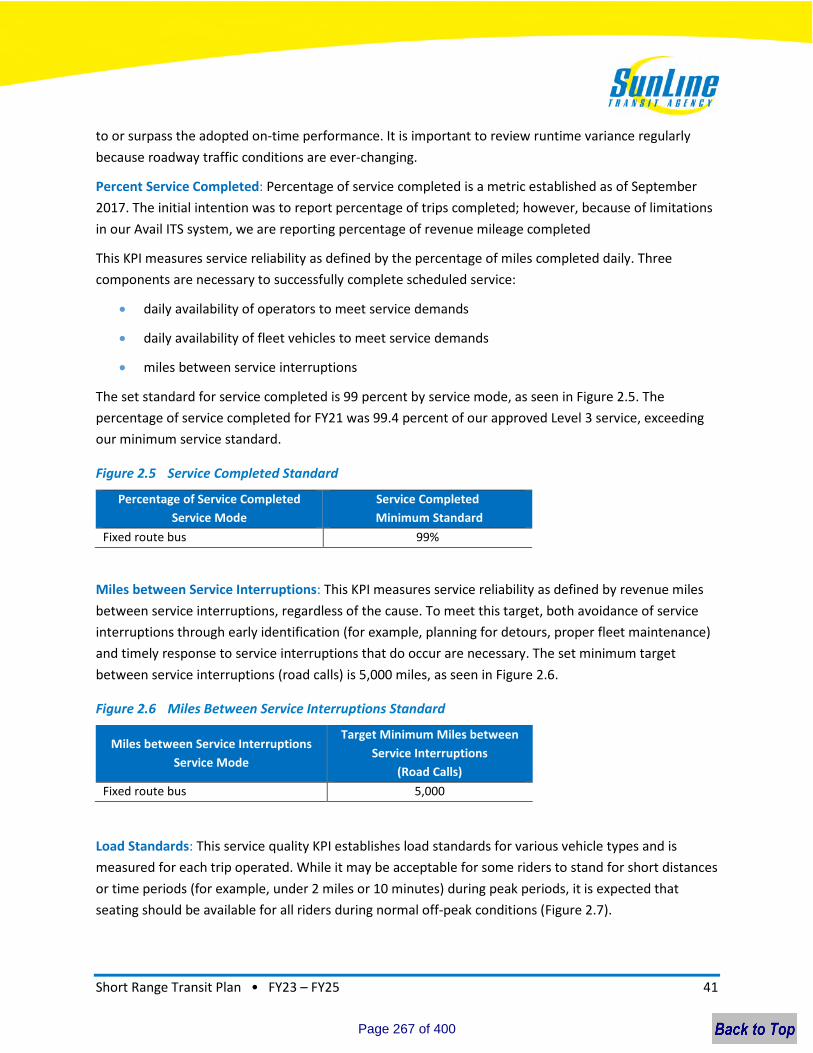
Short Range Transit Plan • FY23 – FY25 41
to or surpass the adopted on-time performance. It is important to review runtime variance regularly
because roadway traffic conditions are ever-changing.
Percent Service Completed: Percentage of service completed is a metric established as of September
2017. The initial intention was to report percentage of trips completed; however, because of limitations
in our Avail ITS system, we are reporting percentage of revenue mileage completed
This KPI measures service reliability as defined by the percentage of miles completed daily. Three
components are necessary to successfully complete scheduled service:
daily availability of operators to meet service demands
daily availability of fleet vehicles to meet service demands
miles between service interruptions
The set standard for service completed is 99 percent by service mode, as seen in Figure 2.5. The
percentage of service completed for FY21 was 99.4 percent of our approved Level 3 service, exceeding
our minimum service standard.
Figure 2.5 Service Completed Standard
Percentage of Service Completed
Service Mode
Service Completed
Minimum Standard
Fixed route bus 99%
Miles between Service Interruptions: This KPI measures service reliability as defined by revenue miles
between service interruptions, regardless of the cause. To meet this target, both avoidance of service
interruptions through early identification (for example, planning for detours, proper fleet maintenance)
and timely response to service interruptions that do occur are necessary. The set minimum target
between service interruptions (road calls) is 5,000 miles, as seen in Figure 2.6.
Figure 2.6 Miles Between Service Interruptions Standard
Miles between Service Interruptions
Service Mode
Target Minimum Miles between
Service Interruptions
(Road Calls)
Fixed route bus 5,000
Load Standards: This service quality KPI establishes load standards for various vehicle types and is
measured for each trip operated. While it may be acceptable for some riders to stand for short distances
or time periods (for example, under 2 miles or 10 minutes) during peak periods, it is expected that
seating should be available for all riders during normal off-peak conditions (Figure 2.7).
Page 267 of 400
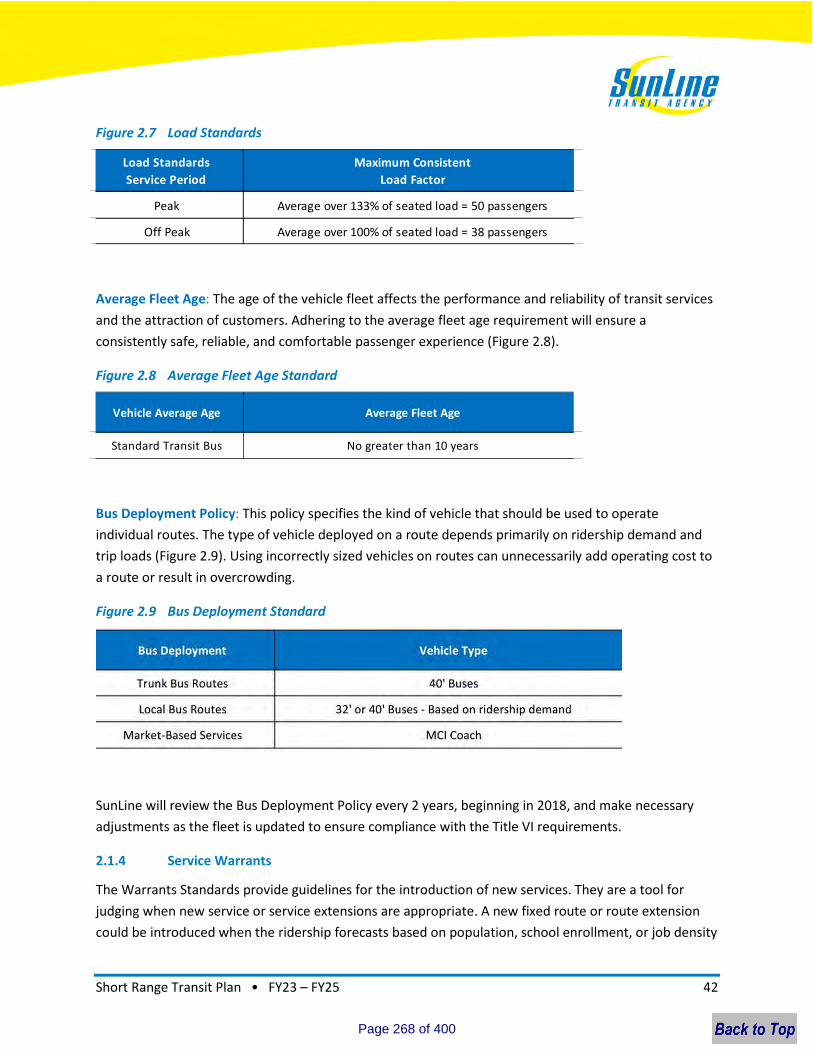
Short Range Transit Plan • FY23 – FY25 42
Figure 2.7 Load Standards
Average Fleet Age: The age of the vehicle fleet affects the performance and reliability of transit services
and the attraction of customers. Adhering to the average fleet age requirement will ensure a
consistently safe, reliable, and comfortable passenger experience (Figure 2.8).
Figure 2.8 Average Fleet Age Standard
Bus Deployment Policy: This policy specifies the kind of vehicle that should be used to operate
individual routes. The type of vehicle deployed on a route depends primarily on ridership demand and
trip loads (Figure 2.9). Using incorrectly sized vehicles on routes can unnecessarily add operating cost to
a route or result in overcrowding.
Figure 2.9 Bus Deployment Standard
SunLine will review the Bus Deployment Policy every 2 years, beginning in 2018, and make necessary
adjustments as the fleet is updated to ensure compliance with the Title VI requirements.
2.1.4 Service Warrants
The Warrants Standards provide guidelines for the introduction of new services. They are a tool for
judging when new service or service extensions are appropriate. A new fixed route or route extension
could be introduced when the ridership forecasts based on population, school enrollment, or job density
Load Standards
Service Period
Maximum Consistent
Load Factor
Peak Average over 133% of seated load = 50 passengers
Off Peak Average over 100% of seated load = 38 passengers
Vehicle Average Age Average Fleet Age
Standard Transit Bus No greater than 10 years
Page 268 of 400
Short Range Transit Plan • FY23 – FY25 43
are sufficient to achieve minimum passengers per revenue hour standards by service type. To ensure
the agency’s financial sustainability, SunLine will introduce only those new services that operate above
the lower-performing route quartile or with productivity that is within 15 percent of the system average.
Planning new services around these guidelines will help ensure the successful performance of new
routes. Providing a set of guidelines for which areas warrant all-day fixed route service will help SunLine
respond to future community requests for new service.
Evaluating New Services
New routes should be monitored to determine whether they are reaching the desired performance
standards. The route should first be evaluated after 6 months to determine whether it meets more than
two-thirds of its performance standards. New services not meeting the minimum standards at the end
of an 18- to 24-month trial period are subject to corrective action or discontinuation.
In some cases, trial periods for new services may vary based on the requirements of grant funding. For
example, if a grant provided 3 years of funding for a route that did not meet standards, this route may
still be operated for the full 3-year period.
2.1.5 Paratransit Service Standards (SunDial)
Eligibility
Any person with a disability who is unable to board, ride, or disembark from an accessible
vehicle without the assistance of another person is eligible.
Any person with a disability who has a specific impairment-related condition that prevents the
person from traveling to or from a boarding/disembarking location is eligible.
Certification is based on individual’s functional ability to ride the fixed route system.
Visitors qualified elsewhere in the United States may use the SunDial ADA service for up to 21
days per year and must then qualify locally.
A maximum 21-day response period for the application and an appeals process exists.
There is no limit to the number of trips a person can make. Reservations can be made up to 7
days in advance.
A no-show policy exists for passengers who do not appear for their rides, with possible exclusion
from SunDial service for a period of time in extreme cases.
SunLine’s Eligibility Department processed 100 percent of completed applications within the 21-day
target.
Page 269 of 400
Short Range Transit Plan • FY23 – FY25 44
Access
The agency must serve any origin and destination requests that are both within 0.75 miles of a
fixed route corridor (excluding Commuter bus service) at the times and days of service when the
fixed route is operating. Next-day service by reservation during regular business hours must be
provided.
The reservations call center accepts client reservations 7 days per week between 8:00 A.M. and
5:00 P.M. for next-day service.
Travel Time
Trip pick-up time must be scheduled within 1 hour before or after the requested pick-up time.
Trip length should be comparable to the time it would take to make the same trip by the fixed
route service.
On-time Performance
Trip pick up should consistently occur within a 30-minute window from the scheduled pick-up
time.
On-time performance is in accordance with FTA Circular 4710.1 to perform equivalent to
SunLine’s fixed route service. Paratransit continues to meet and exceed this goal.
Capacity
Subscription service is provided as a proportion of our total complementary paratransit service
as long as it does not interfere with our capacity for demand trips.
No more than 50 percent of the number of trips can be subscription. Going above this level
could cause capacity constraints to serve our non-subscription riders.
Staff ensures subscription trips are balanced with non-subscription trips to ensure adequate
levels of service are provided on a daily basis.
Fares
Fares charged may not exceed twice the non-discounted fare for the fixed-route network at the
time of the trip.
No fare is to be charged to personal care attendants where they are required.
Companions pay the same ADA fare.
SunDial fares are based on travel within one city or multiple cities. Within one city the fare is
$1.50 per trip; travel within multiple cities is $2.00 per trip.
Page 270 of 400
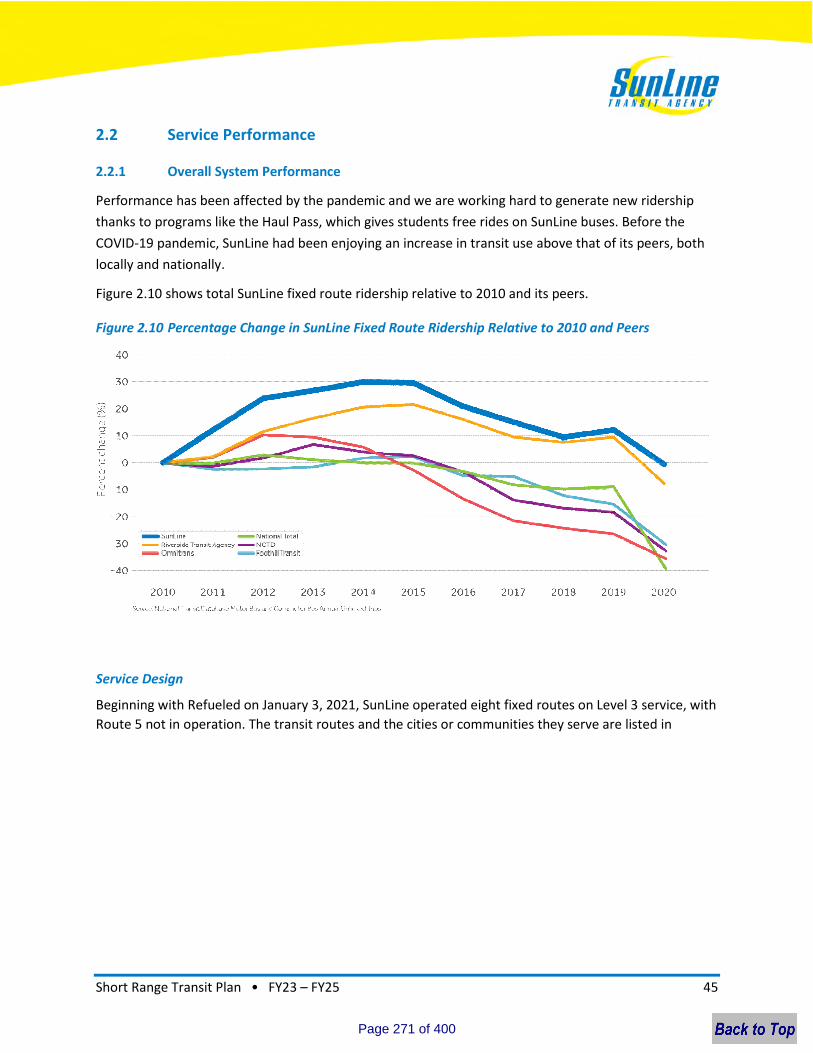
Short Range Transit Plan • FY23 – FY25 45
2.2 Service Performance
2.2.1 Overall System Performance
Performance has been affected by the pandemic and we are working hard to generate new ridership
thanks to programs like the Haul Pass, which gives students free rides on SunLine buses. Before the
COVID-19 pandemic, SunLine had been enjoying an increase in transit use above that of its peers, both
locally and nationally.
Figure 2.10 shows total SunLine fixed route ridership relative to 2010 and its peers.
Figure 2.10 Percentage Change in SunLine Fixed Route Ridership Relative to 2010 and Peers
Service Design
Beginning with Refueled on January 3, 2021, SunLine operated eight fixed routes on Level 3 service, with
Route 5 not in operation. The transit routes and the cities or communities they serve are listed in
Page 271 of 400
Short Range Transit Plan • FY23 – FY25 46
Figure 2.11. Figure 2.12 and Figure 2.13 show the frequency and service spans, respectively, for each
route. As discussed further in Chapter 3, SunLine is currently operating a modified level of service in
response to the COVID-19 pandemic.
Page 272 of 400
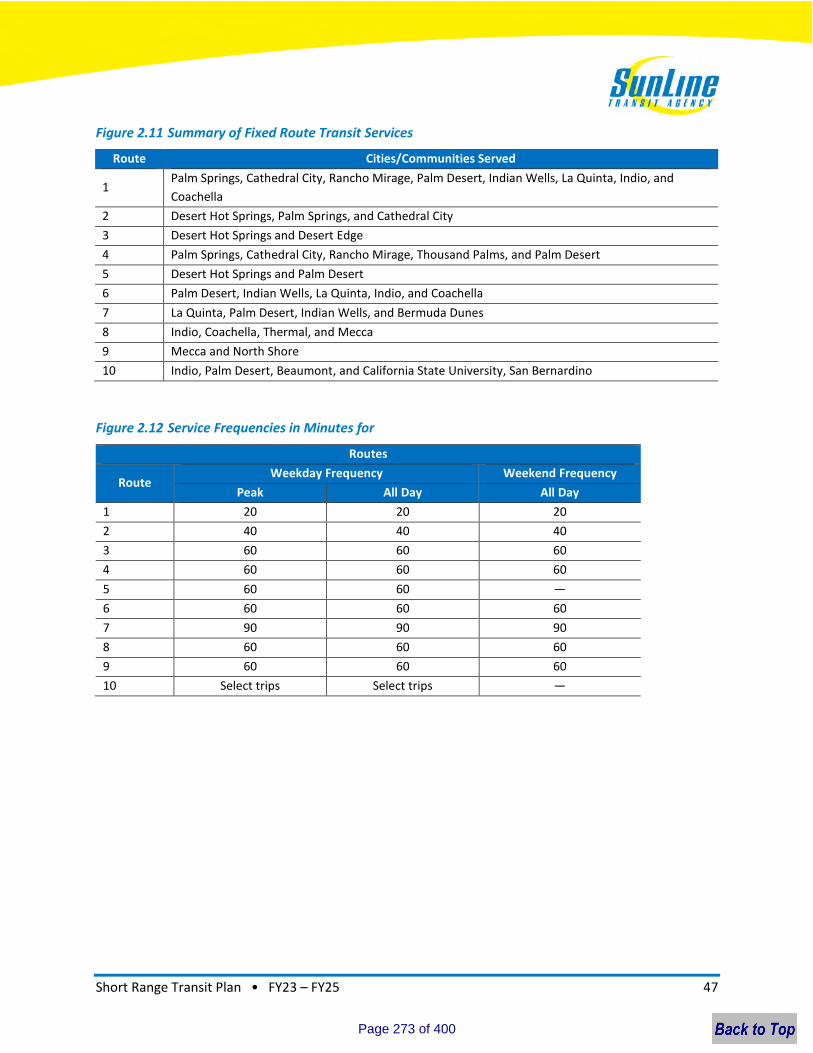
Short Range Transit Plan • FY23 – FY25 47
Figure 2.11 Summary of Fixed Route Transit Services
Route Cities/Communities Served
1 Palm Springs, Cathedral City, Rancho Mirage, Palm Desert, Indian Wells, La Quinta, Indio, and
Coachella
2 Desert Hot Springs, Palm Springs, and Cathedral City
3 Desert Hot Springs and Desert Edge
4 Palm Springs, Cathedral City, Rancho Mirage, Thousand Palms, and Palm Desert
5 Desert Hot Springs and Palm Desert
6 Palm Desert, Indian Wells, La Quinta, Indio, and Coachella
7 La Quinta, Palm Desert, Indian Wells, and Bermuda Dunes
8 Indio, Coachella, Thermal, and Mecca
9 Mecca and North Shore
10 Indio, Palm Desert, Beaumont, and California State University, San Bernardino
Figure 2.12 Service Frequencies in Minutes for
Routes
Route Weekday Frequency Weekend Frequency
Peak All Day All Day
1 20 20 20
2 40 40 40
3 60 60 60
4 60 60 60
5 60 60 —
6 60 60 60
7 90 90 90
8 60 60 60
9 60 60 60
10 Select trips Select trips —
Page 273 of 400
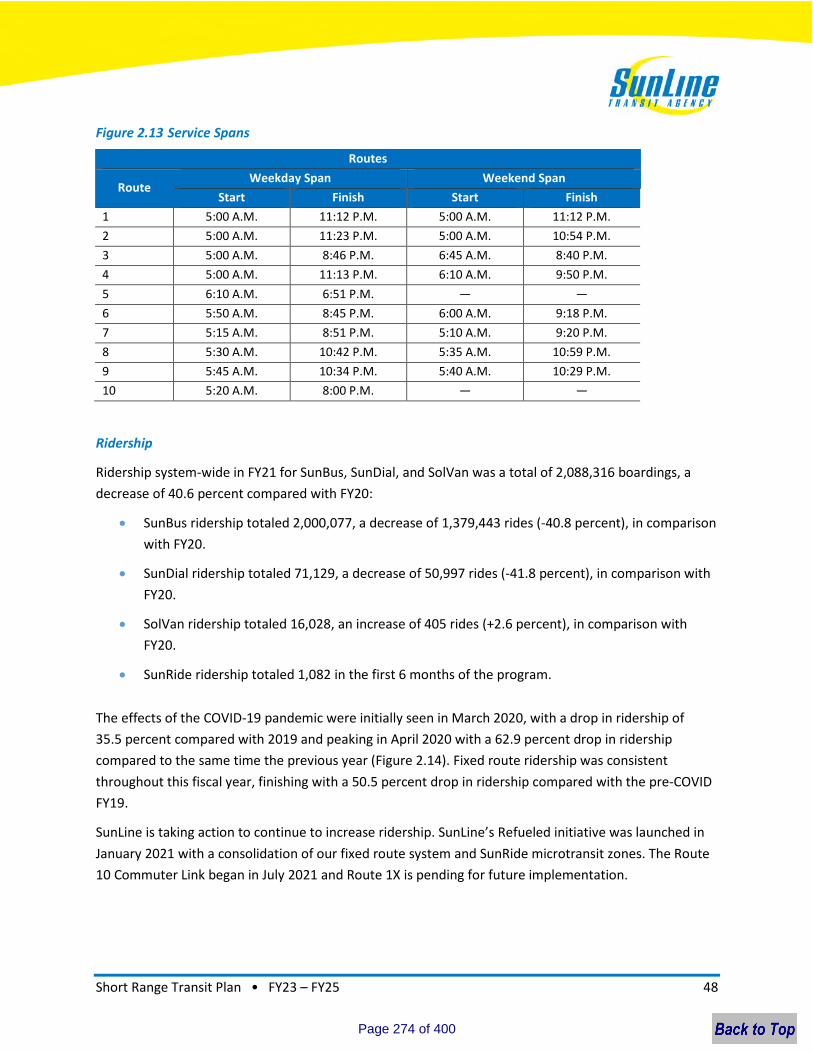
Short Range Transit Plan • FY23 – FY25 48
Figure 2.13 Service Spans
Routes
Route Weekday Span Weekend Span
Start Finish Start Finish
1 5:00 A.M. 11:12 P.M. 5:00 A.M. 11:12 P.M.
2 5:00 A.M. 11:23 P.M. 5:00 A.M. 10:54 P.M.
3 5:00 A.M. 8:46 P.M. 6:45 A.M. 8:40 P.M.
4 5:00 A.M. 11:13 P.M. 6:10 A.M. 9:50 P.M.
5 6:10 A.M. 6:51 P.M. — —
6 5:50 A.M. 8:45 P.M. 6:00 A.M. 9:18 P.M.
7 5:15 A.M. 8:51 P.M. 5:10 A.M. 9:20 P.M.
8 5:30 A.M. 10:42 P.M. 5:35 A.M. 10:59 P.M.
9 5:45 A.M. 10:34 P.M. 5:40 A.M. 10:29 P.M.
10 5:20 A.M. 8:00 P.M. — —
Ridership
Ridership system-wide in FY21 for SunBus, SunDial, and SolVan was a total of 2,088,316 boardings, a
decrease of 40.6 percent compared with FY20:
SunBus ridership totaled 2,000,077, a decrease of 1,379,443 rides (-40.8 percent), in comparison
with FY20.
SunDial ridership totaled 71,129, a decrease of 50,997 rides (-41.8 percent), in comparison with
FY20.
SolVan ridership totaled 16,028, an increase of 405 rides (+2.6 percent), in comparison with
FY20.
SunRide ridership totaled 1,082 in the first 6 months of the program.
The effects of the COVID-19 pandemic were initially seen in March 2020, with a drop in ridership of
35.5 percent compared with 2019 and peaking in April 2020 with a 62.9 percent drop in ridership
compared to the same time the previous year (Figure 2.14). Fixed route ridership was consistent
throughout this fiscal year, finishing with a 50.5 percent drop in ridership compared with the pre-COVID
FY19.
SunLine is taking action to continue to increase ridership. SunLine’s Refueled initiative was launched in
January 2021 with a consolidation of our fixed route system and SunRide microtransit zones. The Route
10 Commuter Link began in July 2021 and Route 1X is pending for future implementation.
Page 274 of 400
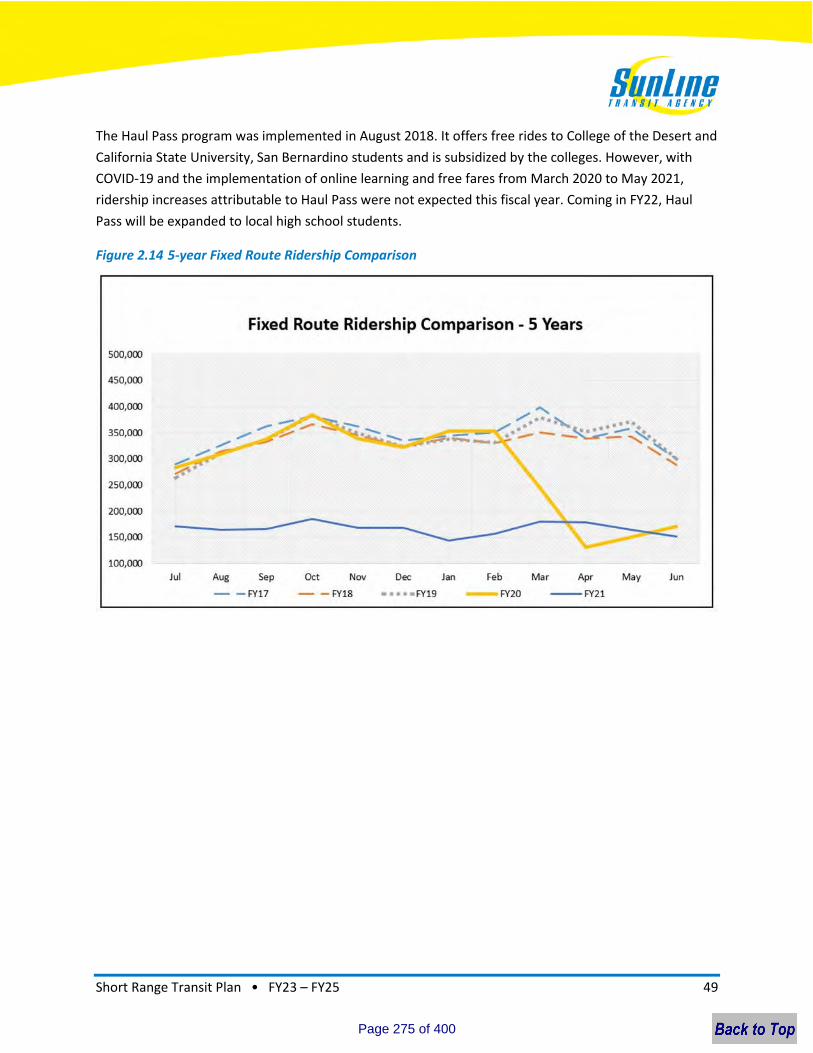
Short Range Transit Plan • FY23 – FY25 49
The Haul Pass program was implemented in August 2018. It offers free rides to College of the Desert and
California State University, San Bernardino students and is subsidized by the colleges. However, with
COVID-19 and the implementation of online learning and free fares from March 2020 to May 2021,
ridership increases attributable to Haul Pass were not expected this fiscal year. Coming in FY22, Haul
Pass will be expanded to local high school students.
Figure 2.14 5-year Fixed Route Ridership Comparison
Page 275 of 400

Short Range Transit Plan • FY23 – FY25 50
Figure 2.15 shows our COVID-19 recovery chart, showing detailed changes in ridership for the last three
calendar years.
Figure 2.15 COVID-19 Impact on Fixed Route Ridership
Page 276 of 400
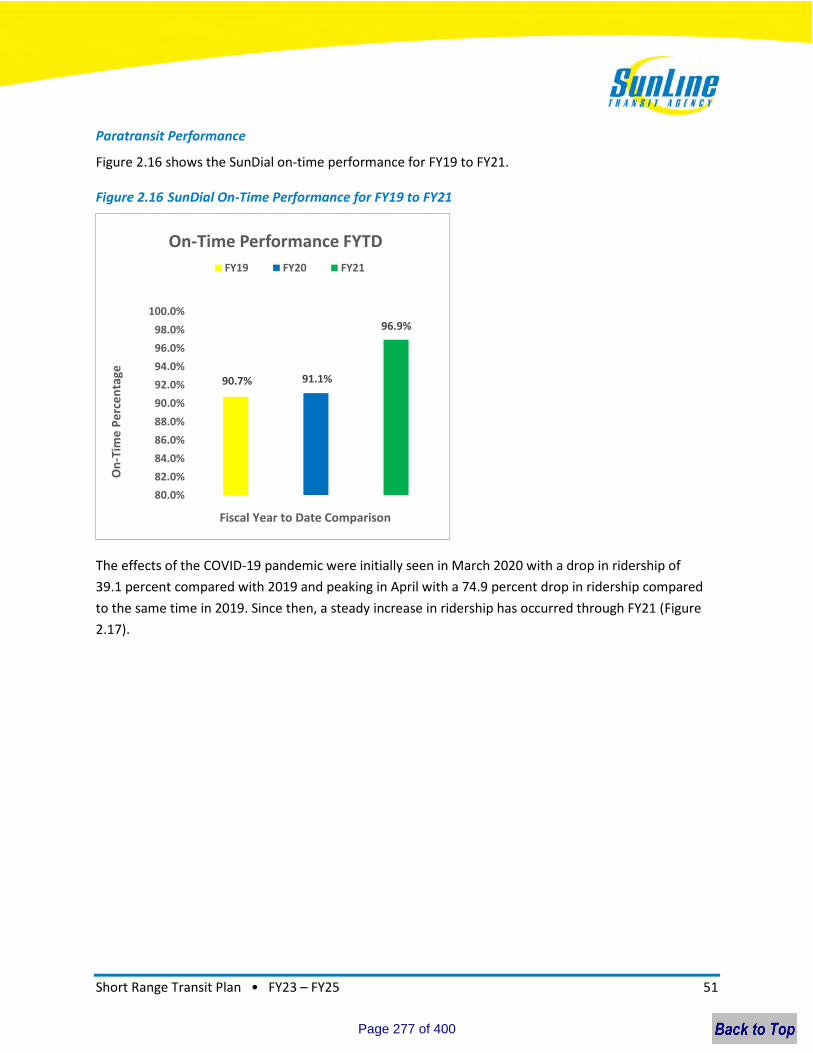
Short Range Transit Plan • FY23 – FY25 51
Paratransit Performance
Figure 2.16 shows the SunDial on-time performance for FY19 to FY21.
Figure 2.16 SunDial On-Time Performance for FY19 to FY21
The effects of the COVID-19 pandemic were initially seen in March 2020 with a drop in ridership of
39.1 percent compared with 2019 and peaking in April with a 74.9 percent drop in ridership compared
to the same time in 2019. Since then, a steady increase in ridership has occurred through FY21 (Figure
2.17).
90.7% 91.1%
96.9%
80.0%
82.0%
84.0%
86.0%
88.0%
90.0%
92.0%
94.0%
96.0%
98.0%
100.0%
On
-Tim
e P
erc
en
tage
Fiscal Year to Date Comparison
On-Time Performance FYTD
FY19 FY20 FY21
Page 277 of 400
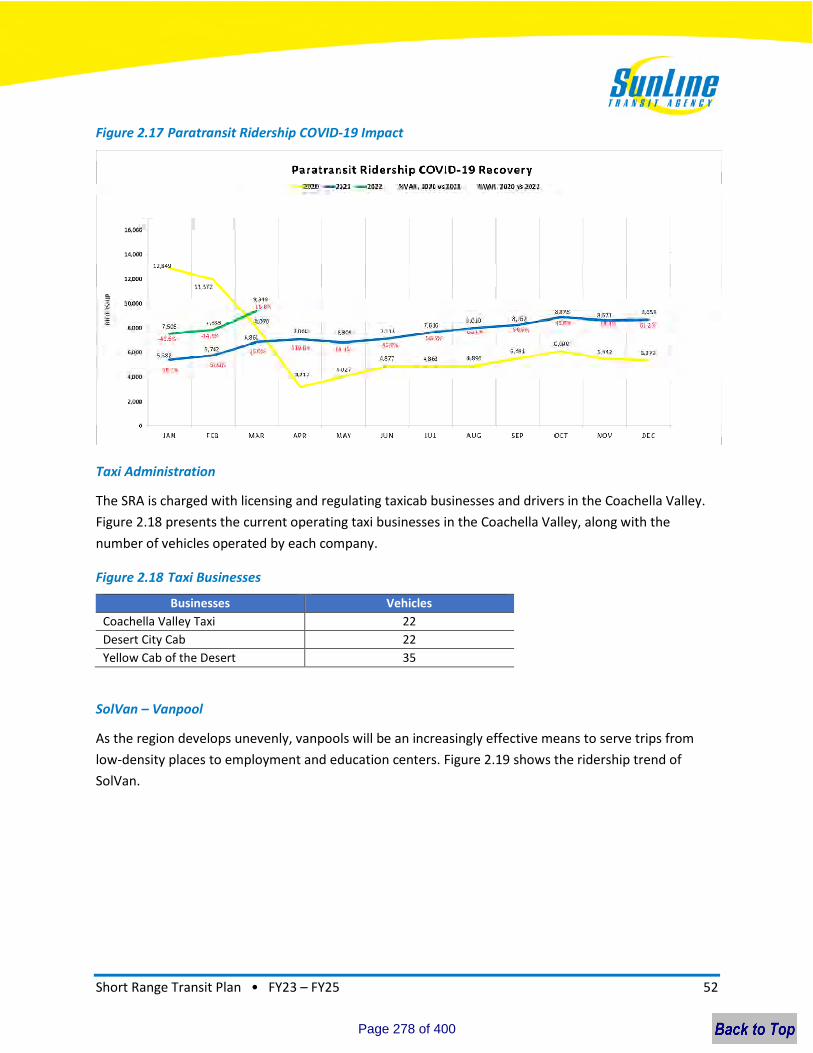
Short Range Transit Plan • FY23 – FY25 52
Figure 2.17 Paratransit Ridership COVID-19 Impact
Taxi Administration
The SRA is charged with licensing and regulating taxicab businesses and drivers in the Coachella Valley.
Figure 2.18 presents the current operating taxi businesses in the Coachella Valley, along with the
number of vehicles operated by each company.
Figure 2.18 Taxi Businesses
Businesses Vehicles
Coachella Valley Taxi 22
Desert City Cab 22
Yellow Cab of the Desert 35
SolVan – Vanpool
As the region develops unevenly, vanpools will be an increasingly effective means to serve trips from
low-density places to employment and education centers. Figure 2.19 shows the ridership trend of
SolVan.
Page 278 of 400
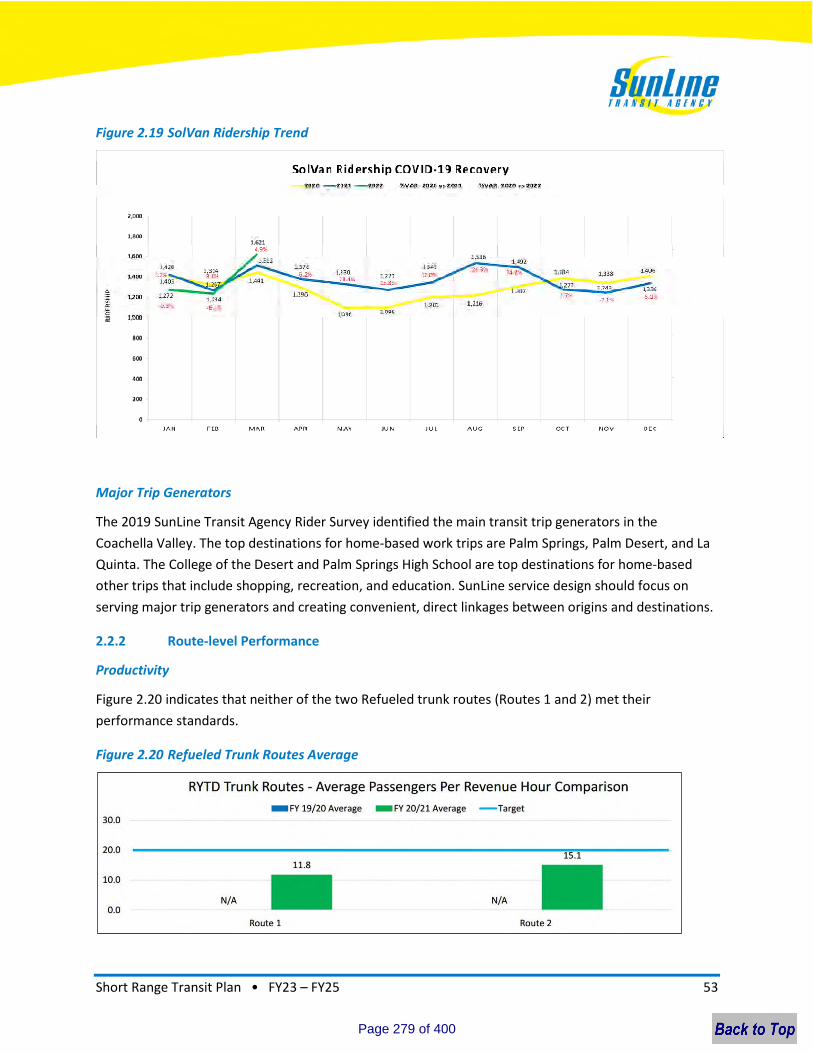
Short Range Transit Plan • FY23 – FY25 53
Figure 2.19 SolVan Ridership Trend
Major Trip Generators
The 2019 SunLine Transit Agency Rider Survey identified the main transit trip generators in the
Coachella Valley. The top destinations for home-based work trips are Palm Springs, Palm Desert, and La
Quinta. The College of the Desert and Palm Springs High School are top destinations for home-based
other trips that include shopping, recreation, and education. SunLine service design should focus on
serving major trip generators and creating convenient, direct linkages between origins and destinations.
2.2.2 Route-level Performance
Productivity
Figure 2.20 indicates that neither of the two Refueled trunk routes (Routes 1 and 2) met their
performance standards.
Figure 2.20 Refueled Trunk Routes Average
Page 279 of 400
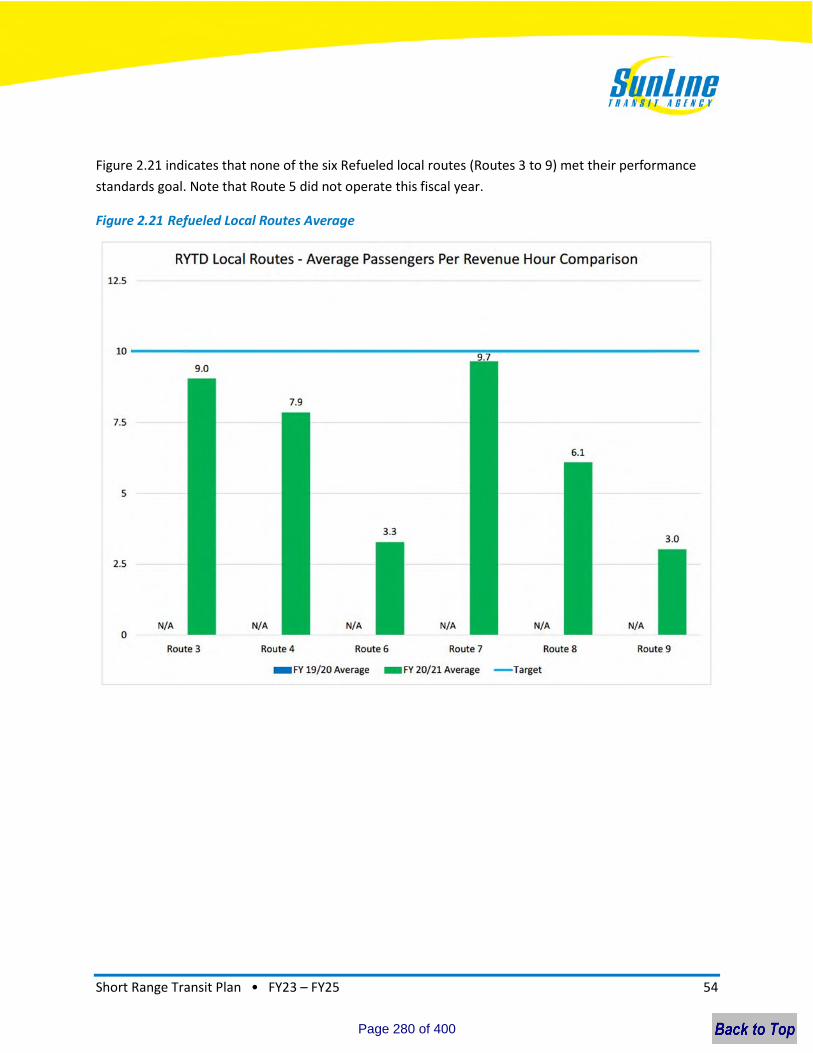
Short Range Transit Plan • FY23 – FY25 54
Figure 2.21 indicates that none of the six Refueled local routes (Routes 3 to 9) met their performance
standards goal. Note that Route 5 did not operate this fiscal year.
Figure 2.21 Refueled Local Routes Average
Page 280 of 400
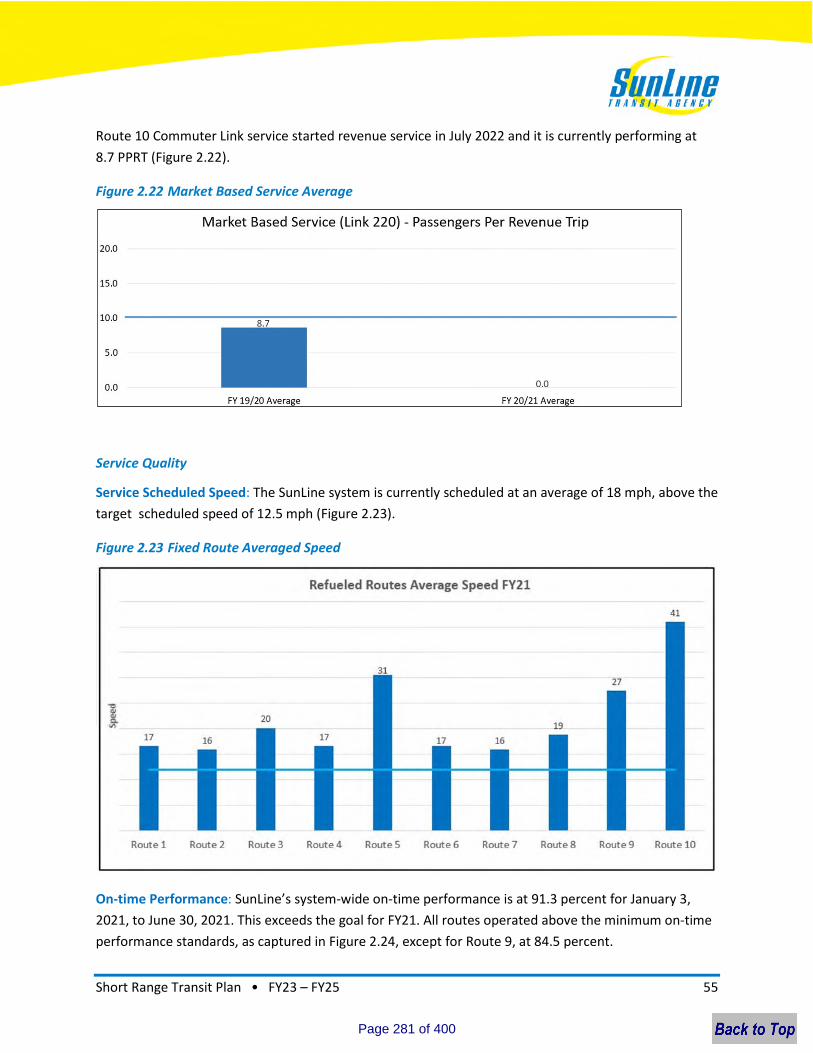
Short Range Transit Plan • FY23 – FY25 55
Route 10 Commuter Link service started revenue service in July 2022 and it is currently performing at
8.7 PPRT (Figure 2.22).
Figure 2.22 Market Based Service Average
Service Quality
Service Scheduled Speed: The SunLine system is currently scheduled at an average of 18 mph, above the
target scheduled speed of 12.5 mph (Figure 2.23).
Figure 2.23 Fixed Route Averaged Speed
On-time Performance: SunLine’s system-wide on-time performance is at 91.3 percent for January 3,
2021, to June 30, 2021. This exceeds the goal for FY21. All routes operated above the minimum on-time
performance standards, as captured in Figure 2.24, except for Route 9, at 84.5 percent.
Page 281 of 400
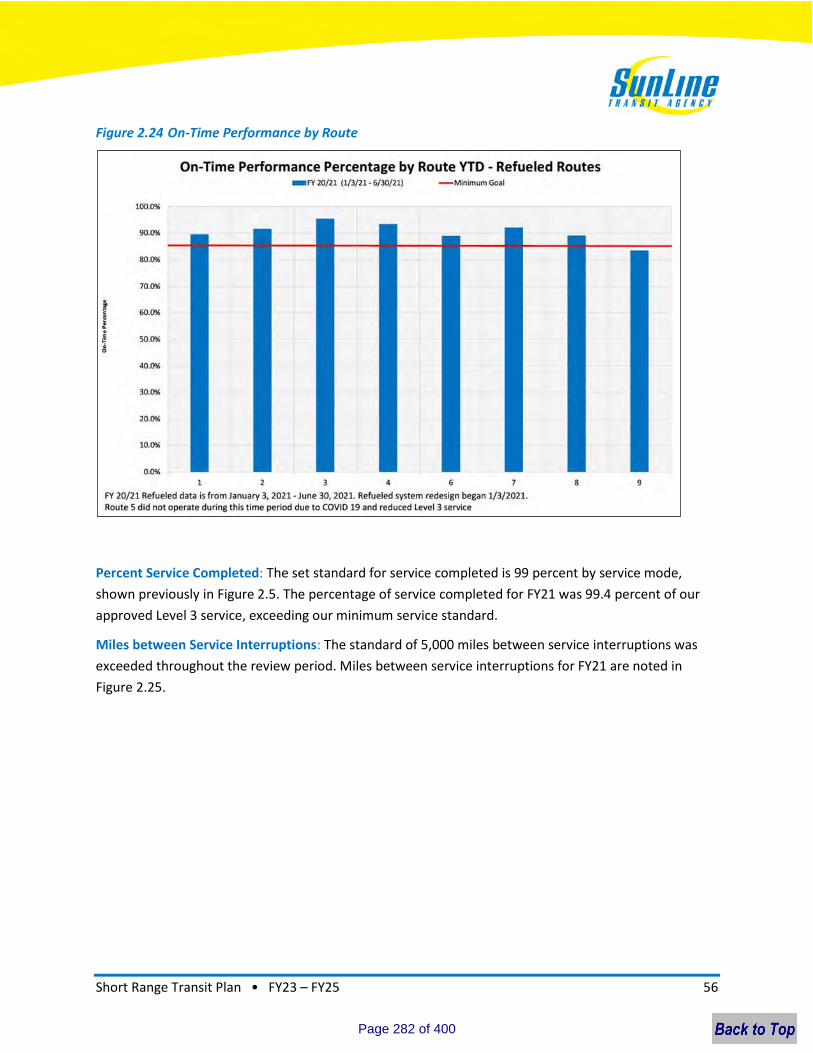
Short Range Transit Plan • FY23 – FY25 56
Figure 2.24 On-Time Performance by Route
Percent Service Completed: The set standard for service completed is 99 percent by service mode,
shown previously in Figure 2.5. The percentage of service completed for FY21 was 99.4 percent of our
approved Level 3 service, exceeding our minimum service standard.
Miles between Service Interruptions: The standard of 5,000 miles between service interruptions was
exceeded throughout the review period. Miles between service interruptions for FY21 are noted in
Figure 2.25.
Page 282 of 400
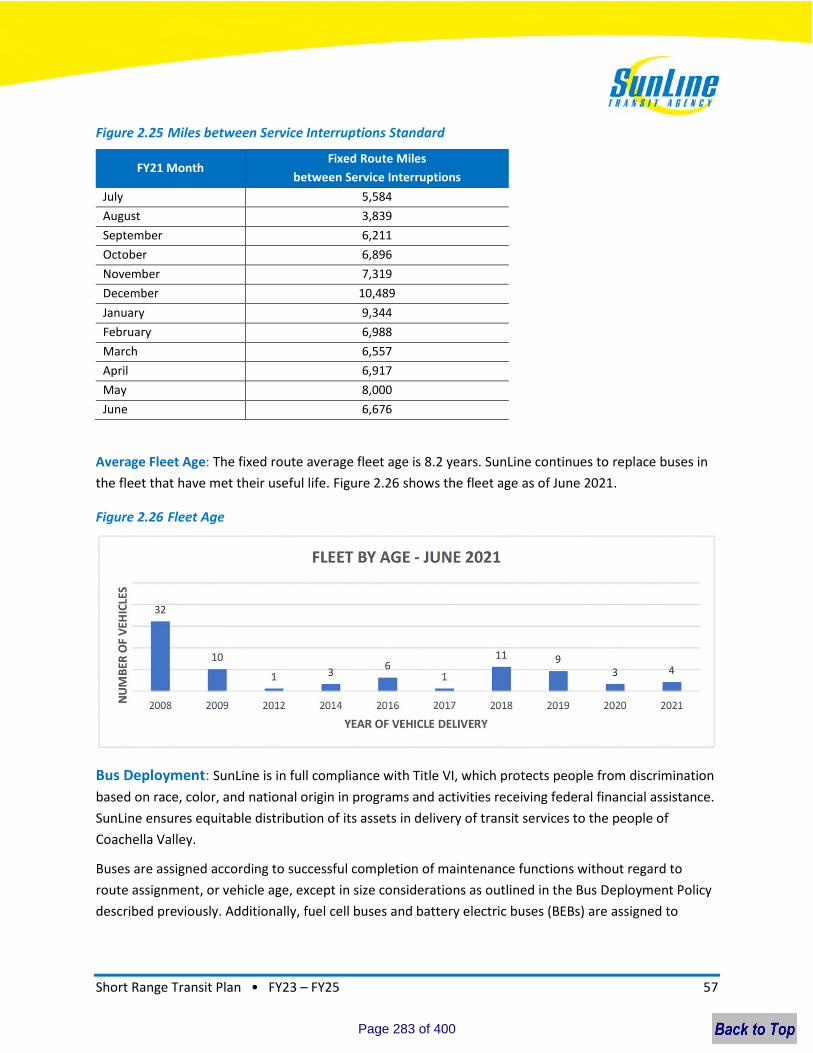
Short Range Transit Plan • FY23 – FY25 57
Figure 2.25 Miles between Service Interruptions Standard
FY21 Month Fixed Route Miles
between Service Interruptions
July 5,584
August 3,839
September 6,211
October 6,896
November 7,319
December 10,489
January 9,344
February 6,988
March 6,557
April 6,917
May 8,000
June 6,676
Average Fleet Age: The fixed route average fleet age is 8.2 years. SunLine continues to replace buses in
the fleet that have met their useful life. Figure 2.26 shows the fleet age as of June 2021.
Figure 2.26 Fleet Age
Bus Deployment: SunLine is in full compliance with Title VI, which protects people from discrimination
based on race, color, and national origin in programs and activities receiving federal financial assistance.
SunLine ensures equitable distribution of its assets in delivery of transit services to the people of
Coachella Valley.
Buses are assigned according to successful completion of maintenance functions without regard to
route assignment, or vehicle age, except in size considerations as outlined in the Bus Deployment Policy
described previously. Additionally, fuel cell buses and battery electric buses (BEBs) are assigned to
Page 283 of 400

Short Range Transit Plan • FY23 – FY25 58
routes with shorter distances and/or durations that are within the acceptable range capacity of those
vehicles.
Adequate numbers of buses are assigned to routes with high demand to avoid instances of
overcrowding or standing passengers. All SunLine buses are fully air-conditioned and are 100 percent
accessible to persons with disabilities.
Routes 1, 2, 3, and 4 should use 40-foot buses given the higher passenger volumes.
Other routes should use either 40- or 32-foot buses based on ridership demand.
2.2.3 Productivity Improvement Efforts Underway
As SunLine works to recover from the pandemic, several improvement efforts are underway to generate
ridership. SunLine is constantly evaluating its routes to improve productivity. This includes KPIs such as
farebox recovery and passengers per hour or trip. SunLine also continually evaluates its bus schedules
and blocking to reduce deadhead miles and optimize layovers between trips.
For example, the new 10 Commuter Link is aimed at improving regional service between the Coachella
Valley and the Inland Empire. For students, 10 Commuter Link will provide a direct connection between
the California State University, San Bernardino’s Palm Desert campus and the main campus in San
Bernardino. It will also provide a connection to the San Bernardino Downtown Metrolink Station.
The Route 1X weekday express service is intended to improve productivity on SunLine’s highest
ridership route. Stopping at five locations in the Highway 111 corridor, Route 1X will provide a 60-
minute trip between Indio and Palm Springs.
SunLine is conducting a microtransit pilot project to connect riders to main route service by bridging the
first mile, last mile gap. This flexible, on-demand rideshare service is designed to connect riders to the
fixed route system by providing point-to-point rides along identified fixed route corridors. The pilot
project, which started in January 2020, is evaluating the feasibility of using local taxis to expand
SunLine’s service area and reach non-traditional markets.
Page 284 of 400
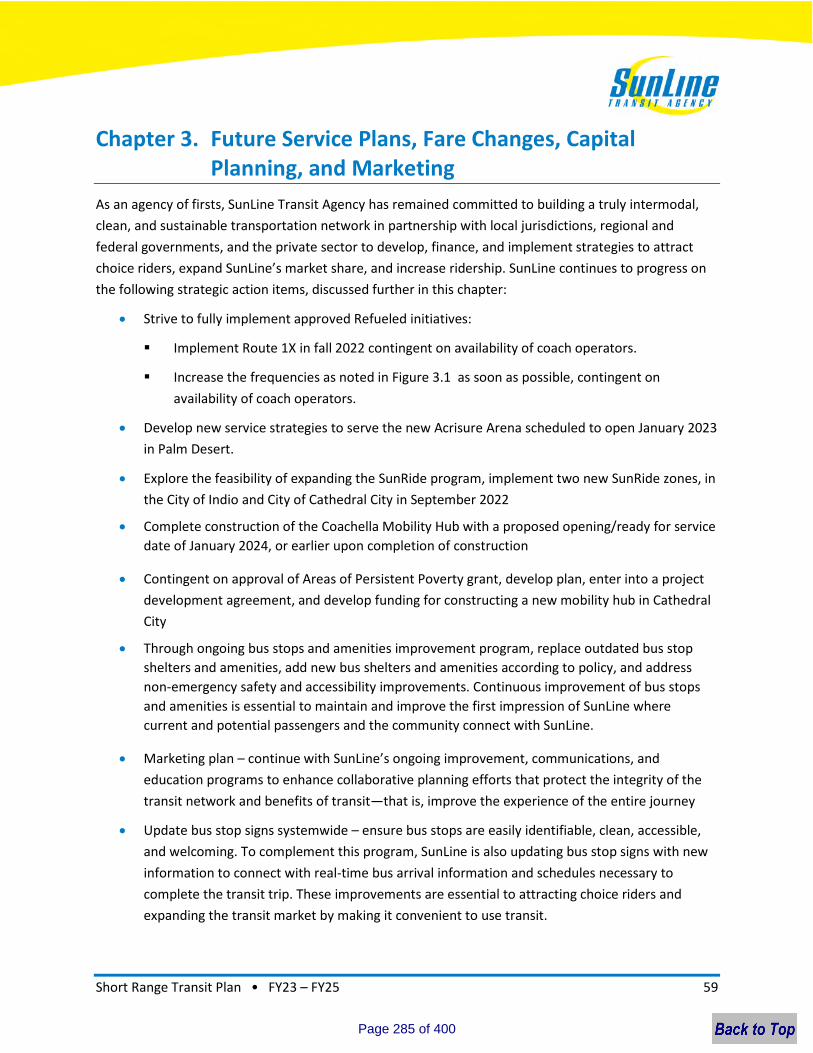
Short Range Transit Plan • FY23 – FY25 59
Chapter 3. Future Service Plans, Fare Changes, Capital Planning, and Marketing
As an agency of firsts, SunLine Transit Agency has remained committed to building a truly intermodal,
clean, and sustainable transportation network in partnership with local jurisdictions, regional and
federal governments, and the private sector to develop, finance, and implement strategies to attract
choice riders, expand SunLine’s market share, and increase ridership. SunLine continues to progress on
the following strategic action items, discussed further in this chapter:
Strive to fully implement approved Refueled initiatives:
Implement Route 1X in fall 2022 contingent on availability of coach operators.
Increase the frequencies as noted in Figure 3.1 as soon as possible, contingent on
availability of coach operators.
Develop new service strategies to serve the new Acrisure Arena scheduled to open January 2023
in Palm Desert.
Explore the feasibility of expanding the SunRide program, implement two new SunRide zones, in
the City of Indio and City of Cathedral City in September 2022
Complete construction of the Coachella Mobility Hub with a proposed opening/ready for service
date of January 2024, or earlier upon completion of construction
Contingent on approval of Areas of Persistent Poverty grant, develop plan, enter into a project
development agreement, and develop funding for constructing a new mobility hub in Cathedral
City
Through ongoing bus stops and amenities improvement program, replace outdated bus stop
shelters and amenities, add new bus shelters and amenities according to policy, and address
non-emergency safety and accessibility improvements. Continuous improvement of bus stops
and amenities is essential to maintain and improve the first impression of SunLine where
current and potential passengers and the community connect with SunLine.
Marketing plan – continue with SunLine’s ongoing improvement, communications, and
education programs to enhance collaborative planning efforts that protect the integrity of the
transit network and benefits of transit—that is, improve the experience of the entire journey
Update bus stop signs systemwide – ensure bus stops are easily identifiable, clean, accessible,
and welcoming. To complement this program, SunLine is also updating bus stop signs with new
information to connect with real-time bus arrival information and schedules necessary to
complete the transit trip. These improvements are essential to attracting choice riders and
expanding the transit market by making it convenient to use transit.
Page 285 of 400
Short Range Transit Plan • FY23 – FY25 60
Capitalize on the CVLink multimodal corridor, which has the potential to connect neighborhoods
to transit, activity centers, and address some of the first- and last-mile mobility needs of the
Coachella Valley.
3.1 Service Plans and Priorities FY2023-2025
The Refueled route network is functioning well, notwithstanding the impact of the pandemic. Few
service changes are proposed in the short term, such as restoring service to pre-pandemic levels,
introducing the postponed Route 1X, and developing options to serve the Acrisure Arena. Overall,
however, a planned high-level review of route performance and recent developments within the region
may result in a more detailed review of service plans and priorities, as discussed below.
3.1.1 Return to Pre-Pandemic Service Levels
During the COVID-19 pandemic, SunLine reduced service in response to a decrease in ridership and
available drivers. As shown in Figure 3.1, SunLine is currently operating a modified schedule, but intends
to restore full service frequencies and spans. Full service provision is included in SunLine’s FY23 budget.
The main constraint to adding service is the challenge of hiring, training, and retaining bus operators
during this period of low unemployment and high inflation. SunLine is considering multiple strategies to
supplement service levels efficiently, including prioritizing peak-period frequency improvements and
reviewing schedules to make the best use of current resources. Higher-productivity routes, such as
Route 2, will be prioritized for increases in frequency and span as additional bus operators are available.
Page 286 of 400
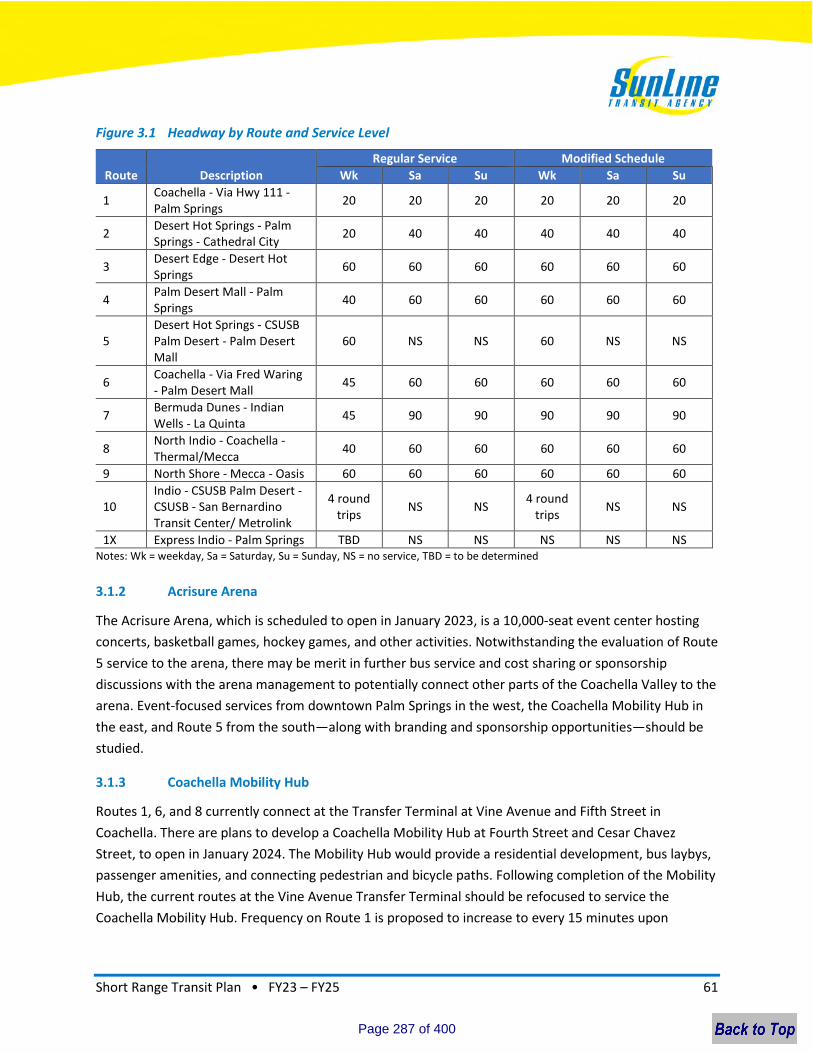
Short Range Transit Plan • FY23 – FY25 61
Figure 3.1 Headway by Route and Service Level
Route Description
Regular Service Modified Schedule
Wk Sa Su Wk Sa Su
1 Coachella - Via Hwy 111 - Palm Springs
20 20 20 20 20 20
2 Desert Hot Springs - Palm Springs - Cathedral City
20 40 40 40 40 40
3 Desert Edge - Desert Hot Springs
60 60 60 60 60 60
4 Palm Desert Mall - Palm Springs
40 60 60 60 60 60
5 Desert Hot Springs - CSUSB Palm Desert - Palm Desert Mall
60 NS NS 60 NS NS
6 Coachella - Via Fred Waring - Palm Desert Mall
45 60 60 60 60 60
7 Bermuda Dunes - Indian Wells - La Quinta
45 90 90 90 90 90
8 North Indio - Coachella - Thermal/Mecca
40 60 60 60 60 60
9 North Shore - Mecca - Oasis 60 60 60 60 60 60
10 Indio - CSUSB Palm Desert - CSUSB - San Bernardino Transit Center/ Metrolink
4 round trips
NS NS 4 round
trips NS NS
1X Express Indio - Palm Springs TBD NS NS NS NS NS Notes: Wk = weekday, Sa = Saturday, Su = Sunday, NS = no service, TBD = to be determined
3.1.2 Acrisure Arena
The Acrisure Arena, which is scheduled to open in January 2023, is a 10,000-seat event center hosting
concerts, basketball games, hockey games, and other activities. Notwithstanding the evaluation of Route
5 service to the arena, there may be merit in further bus service and cost sharing or sponsorship
discussions with the arena management to potentially connect other parts of the Coachella Valley to the
arena. Event-focused services from downtown Palm Springs in the west, the Coachella Mobility Hub in
the east, and Route 5 from the south—along with branding and sponsorship opportunities—should be
studied.
3.1.3 Coachella Mobility Hub
Routes 1, 6, and 8 currently connect at the Transfer Terminal at Vine Avenue and Fifth Street in
Coachella. There are plans to develop a Coachella Mobility Hub at Fourth Street and Cesar Chavez
Street, to open in January 2024. The Mobility Hub would provide a residential development, bus laybys,
passenger amenities, and connecting pedestrian and bicycle paths. Following completion of the Mobility
Hub, the current routes at the Vine Avenue Transfer Terminal should be refocused to service the
Coachella Mobility Hub. Frequency on Route 1 is proposed to increase to every 15 minutes upon
Page 287 of 400
Short Range Transit Plan • FY23 – FY25 62
completion of this mobility hub. Four additional buses have been procured to support this increased
service on SunLine’s most productive route.
3.1.4 Route 10 Commuter Link
Route 10 originates in Indio and terminates at the San Bernardino Transit Center (SBTC)/Metrolink
Station in downtown San Bernardino. Intermediate connections are made with California State
University in Palm Desert, the Walmart Center in Beaumont, and California State University in San
Bernardino. There are four westbound and four eastbound trips each weekday, with no service on
weekends or holidays.
Route 10 is a key service linking multiple transit routes, community services, and educational facilities in
the eastern valley. Of concern is the unbalanced nature of the Route 10 ridership, with strong peak-
direction ridership and little ridership on the return trip. Marketing and incentivizing reverse-peak-
direction travel could improve the overall route’s productivity.
3.1.5 School Trippers
School trippers are provided to augment certain routes or areas to ensure the base routes are not
overcrowded. They may also provide a more direct route to specific schools. A single well-utilized school
tripper bus may be a very productive service; however, it is critical that these services are regularly
reviewed to ensure they are required. If the base routes can accommodate the school ridership, then it
is unproductive to add an overlay of additional school trippers.
3.1.6 SunRide (Microtransit) Service
SunRide on-demand microtransit service is available in four Coachella Valley zones, connecting
passengers to the fixed route network or a destination within the zone. As SunLine gains experience
operating microtransit services, the existing zones should be reviewed to ensure they serve the
appropriate geographies. Other service areas within the Coachella Valley should be assessed for new
SunRide opportunities. These may be new service areas or existing fixed route substitutions.
3.1.7 SunRide Future Service Plans
SunLine plans to expand the current geo-fenced zones and introduce two more microtransit zones in
Indio and Cathedral City in September 2022. The planned new geo-fenced zones are two additional
identified areas that will benefit from the service. The plan is to purchase additional wheelchair-
accessible minivans to serve the expansion of this service. Additional marketing to educate the public
and promote this service is needed in all geo-fenced areas. It has been identified that street outreach
teams are the best way to get the word out to the public on this service. Since the COVID-19 pandemic,
SunLine ceased street outreach teams to assist in minimizing the spread of the virus. Once it is safe to
begin educating the public on SunLine’s family of services using street outreach teams again, SunLine
believes ridership for the SunRide service will greatly improve.
Page 288 of 400
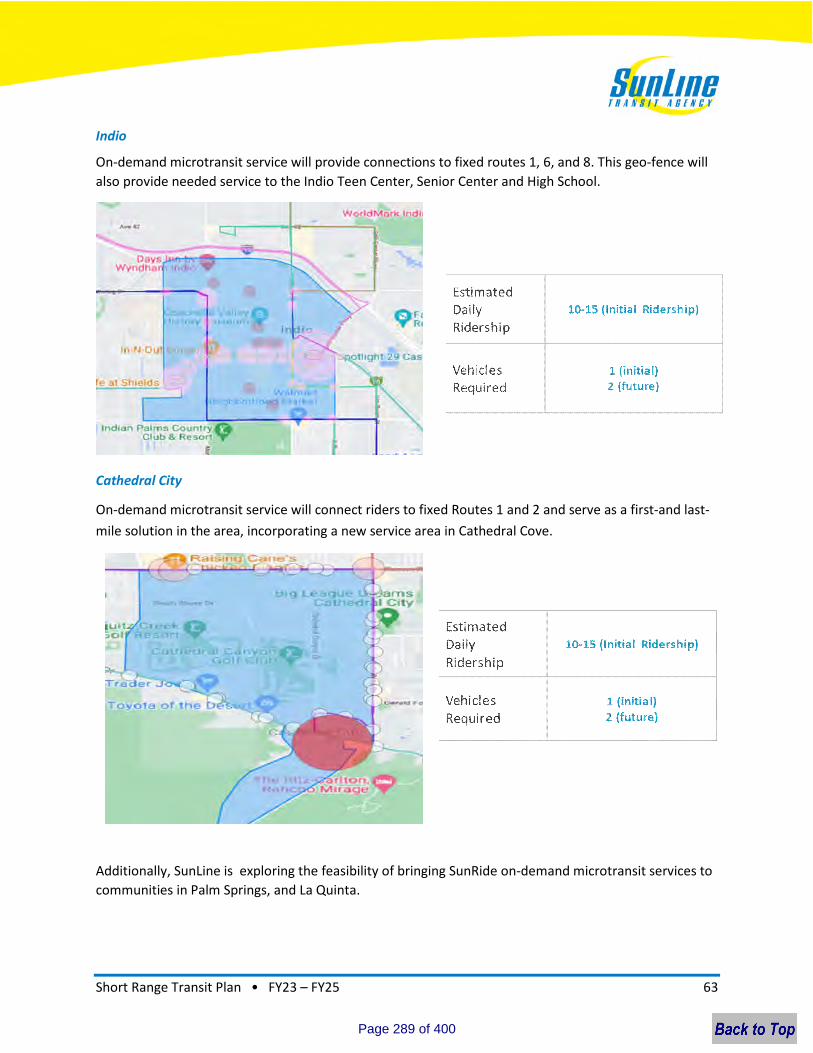
Short Range Transit Plan • FY23 – FY25 63
Indio
On-demand microtransit service will provide connections to fixed routes 1, 6, and 8. This geo-fence will
also provide needed service to the Indio Teen Center, Senior Center and High School.
Cathedral City
On-demand microtransit service will connect riders to fixed Routes 1 and 2 and serve as a first-and last-
mile solution in the area, incorporating a new service area in Cathedral Cove.
Additionally, SunLine is exploring the feasibility of bringing SunRide on-demand microtransit services to
communities in Palm Springs, and La Quinta.
Page 289 of 400
Short Range Transit Plan • FY23 – FY25 64
3.1.8 Modifications to Paratransit Service
The provision of ADA services remains a challenge because it is costly. Efforts to mitigate the increasing
expenses in demand-responsive service include revisions to the paratransit eligibility/certification
process and continuing to monitor late cancellations and no-shows, which improves the availability of
appointment time slots and makes SunDial service more efficient for customers. SunDial staff
periodically (monthly) measure the systemwide average rate for that month to determine whether a
particular customer has excessive late cancellations or no-shows. They then consider the customer's
overall frequency of use and evaluate whether there is "a pattern of abuse" relative to how often that
customer travels with SunDial.
SunDial will continue to move forward with the paratransit eligibility/certification process and
implement in-person interviews to ensure paratransit riders qualify for the service. SunLine also plans to
implement new technology soon to facilitate online scheduling and cancelation of paratransit
reservations. The new technology will provide a reminder call the day before to encourage cancelation
when plans change and will also provide customers with notification 5 minutes prior to passenger
pickup.
3.1.9 SolVan Service Goals
SunLine has several goals for its vanpool program and has developed a marketing plan to achieve them.
Goals include:
1. Gain new vanpool riders whose route travels through or ends in eastern Riverside County.
2. Continue educating employers and employees in eastern Riverside County about the benefits of
promoting alternative modes of transportation, the SolVan program, and how the program
works.
3. Continue to support SunLine as a leader in alternative transportation options, recognizing the
agency for bringing a new commute option to eastern Riverside County.
4. Continue to support current vanpool participants to ensure their satisfaction with the program
to promote long-term program participation.
5. Work alongside the regional rideshare program, IE Commuter, to mine employee data of
carpoolers and interested carpoolers and drivers commuting long distances with regular work
shifts for potential vanpool groups, add incentives and outreach efforts, and leverage large and
small employers to create a green thinking workspace as an employee benefit.
SolVan Marketing Plan
SunLine’s marketing plan includes the following strategies to improve SolVan performance:
Employer partnerships and network meetings: Host Employee Transportation Coordinator
network meetings at SunLine on a quarterly basis.
Page 290 of 400
Short Range Transit Plan • FY23 – FY25 65
Press releases: Identify stories regarding commuters and topical activities.
Testimonials/stories: Include personal interest stories in press releases or newsletters.
Websites: Keep both the SunLine and SolVan websites updated with van vendor changes,
vehicle options, pricing, guideline changes, list of active vanpools, etc.
Events: Attend employer and community events when requested to promote Transportation
Demand Management and vanpool services.
Social media: Share or re-post all SunLine and SolVan posts through IE Commuter on social
media platforms as they occur (Facebook, Instagram, Twitter). Use special “boost” messages for
social media outreach through SunLine sites.
Customer service scripts and quick facts: Provide updates to SunLine Customer Service staff
regarding vanpool details.
SunLine staff outreach: Reestablish a rideshare program internally for SunLine employees in
coordination with IE Commuter.
Specialized marketing outreach: Identify and determine new campaign opportunities for
combined SunLine, SunCommute, and SolVan efforts.
Agricultural outreach: Continue coordination with CalVans and local community groups in
eastern Coachella Valley and attend and support local events as requested.
CalVans Marketing/Outreach: Conduct ongoing outreach with local farms, independent of
SolVan, and provide employer vouchers because many farms pay the full vanpool cost to attract
farm workers (no SolVan subsidy provided in this scenario).
Graphic campaigns: Create printed graphics in English and Spanish and post them on area bus
shelters and onboard buses.
Media campaigns: Create radio commercials in English and Spanish and run on local radio
stations for the first year. For following years, television commercials were created in English
and Spanish and focused on both agricultural and traditional worksites and aired on local
television stations. Television has visual advantage of better explaining what a vanpool is by
showing how it operates.
Marketing materials: Print updated marketing materials.
Novelty items: Creating new SolVan novelty items, supplemented by IE Commuter novelty
items.
Survey commute data: Use IE Commuter employee survey commute data for larger employers
in territory to identify and target employees in specific communities.
Page 291 of 400
Short Range Transit Plan • FY23 – FY25 66
3.2 SunLine’s Overall Marketing Plans, Studies, and Promotions
SunLine will balance a re-emergence from COVID-19 restrictions in FY22-23 while maintaining key
messaging that conveys that SunLine offers safe, clean transportation alternatives to the Coachella
Valley and beyond.
The opportunity to move beyond COVID-19 protocols as primary messaging (while ensuring safety is
always a part of messaging, where appropriate) allows SunLine to focus on promoting SunLine initiatives
to restore ridership.
Marketing efforts should also highlight the continued expansion of SunLine’s green fuels fleet, the
progression of hydrogen fueling, and zero-emissions programs (including the West Coast Center of
Excellence and the H2 SilverSTARS project that will introduce groundbreaking technology that produces
hydrogen from renewable natural gas).
3.2.1 Goals
Goals are crucial for keeping SunLine on track and creating purpose for each marketing strategy
implemented by the Marketing Department. Goal setting involves the development of an action plan
designed to motivate involved groups toward a common goal. This year’s goals include:
1. Restore and increase ridership overall
a. Increase SunRide ridership and promote its expansions
b. Increase promotion and ridership of the 10 Commuter Link
c. Gain ridership for Route 1X upon launch
2. Increase advertising revenue
3. Expand awareness of clean energy initiatives
4. Improve customer satisfaction
3.2.2 Target Audiences
According to the 2019 Redhill Group survey, just over half (51 percent) of customers are employed
either full-time (24 percent) or part-time (27 percent) and more than one-third (36 percent) of
customers are students. A third (34 percent) are under 25 and the majority (66 percent) are under 45
years old. Nearly half (48 percent) of SunLine customers identify themselves as Hispanic/Latino, just
over one quarter (28 percent) identify as White, and 14 percent as African American. COVID-19 may
have affected these numbers to some degree, but they are still a good benchmark for marketing
purposes.
The mean household size is 3.2, and most customers live in households with an annual income of less
than $50,000 (90 percent). Sixty percent of customers live in households with an annual income of less
than $25,000. The estimated median annual household income system-wide is $20,203, which falls
Page 292 of 400
Short Range Transit Plan • FY23 – FY25 67
below the 2019 Poverty Guideline for a family of 3, as released by the U.S. Department of Health and
Human Services.
To effectively implement marketing strategies that match the goals, understanding SunLine’s target
audiences is crucial. The Marketing Department will focus its marketing efforts on the following key
audiences:
students
current riders
lapsed riders (due to COVID-19)
potential new riders
community at large
industry professionals
3.2.3 Marketing Strategies
SunLine will tailor its marketing strategies and messaging depending on each target audience and its
motivations.
3.2.4 Social Media and Website
After building a robust social media program in recent years, SunLine has increased regular
communication directly to its target audiences (fans/followers of SunLine’s social media platforms).
Posts have been entertaining and informative—both key components of keeping followers engaged.
Transit Tuesdays offer a weekly online event that discusses pre-selected topics. Followers can tune in at
the same time and day each week knowing informative content awaits them. Other posts tie in history,
comedy, safety, and recognition. This variety in messaging keeps the platform interesting and worth
following.
3.2.5 Advertising
Strategically using SunLine’s budget, an advertising plan that maximizes available advertising funds and
incorporates innovative advertising strategies will be developed and implemented. It will use platforms
such as digital, print, radio, and TV media. The goal is also to promote all key messaging on internal
advertising mediums, such as bus shelters and interior bus advertising.
3.2.6 Rider/Community Input
A strong marketing program incorporates a strategy for listening to constituents. SunLine will create and
facilitate a new survey to gather input regarding SunLine Refueled initiatives and how they are being
received in the community. This provides the opportunity to learn about any issues that may need to be
Page 293 of 400
Short Range Transit Plan • FY23 – FY25 68
addressed. Data gathered can be used to make any necessary adjustments to the SunLine Refueled
pillars.
3.2.7 Public Relations
SunLine’s public relations representatives will draft press releases to promote SunLine initiatives. They
will also pitch stories to the media to publicize key newsworthy items, coordinate media interviews, and
follow up on media requests in a timely fashion.
3.2.8 Customer Service Center/Website
SunLine’s customer service center expanded this past year to include LiveChat on the web for those who
need immediate assistance navigating the new Consolidated Fixed Route network. The website has also
been instrumental as a central resource for all communications and announcements disseminated by
SunLine. In addition, the customer service center offers phone line support by customer service
representatives Monday through Friday. Agents can use resources such as Google Transit Trip Planner
and MyStop Bus Tracker to answer customer inquiries quickly and accurately. Bilingual customer service
agents are available to assist with questions in both English and Spanish.
3.2.9 Video Production
The creation of videos as marketing tools will increase this year, according to shifts in social media
audience preferences. By developing an expanded library of video assets, SunLine will be able to initiate
increased engagement with its target markets, and those individuals will better retain the information
being shared through unique videos.
3.2.10 Rider’s Guide
A revamped Rider’s Guide has become an essential communications tool for SunLine. A more updated
format features relevant information for riders, including directions, maps, time points, bus stop
locations, schedules, fares, transfer instructions, and how to receive assistance with SunLine’s programs
and services. Transit system information, which aligns with the updated Rider’s Guide, can also be found
at transit centers, on buses, and at bus stops. SunLine’s transit information is provided in both English
and Spanish. A mini guide about SunLine Refueled programs and services will be also printed and
distributed.
3.2.11 Clean Fuels Fleet Communications
SunLine’s reputation as a pioneer in clean air and alternative fuel technology must continue to remain
top-of-mind by promoting news regarding SunLine’s advancement in its Zero-Emissions Bus Rollout Plan.
With the construction of the hydrogen electrolyzer, SunLine has been able to plan early to allow for
other agencies to have a model for small- to mid-size systems to follow.
Page 294 of 400
Short Range Transit Plan • FY23 – FY25 69
3.2.12 Internal Communications
Keeping employees up to date on company initiatives and marketing efforts inspires higher morale and
invites them to be involved in the bigger picture. To this end, SunLine has an internal newsletter
featuring key stories and facts about SunLine’s latest initiatives, such as SunLine Refueled. Virtual
activities that are inclusive to all SunLine employees have also gone live. These efforts improve
communication with the employee target audience, providing a platform for disseminating COVID-19
updates and making SunLine an even better place to work.
3.2.13 Building an Effective Marketing Plan
All the tools mentioned above will be implemented to market SunLine as a leader in transportation,
innovations, and alternative fuel technology. As stated, targeted messaging and the use of effective
platforms and strategies will be pivotal to increasing ridership, rebuilding trust, communicating
progress, and engaging employees. Despite the hardships and heartaches, COVID-19 challenged SunLine
to reach new limits and taught us resilience and the importance of embracing new technology. While
the road ahead of transportation looks different now, SunLine is driving the future of transit.
3.2.14 Community Outreach
SunLine works with local organizations, businesses, government agencies, and nonprofit organizations
to promote SunLine programs and services. Community outreach involves grassroots organizations to
identify unmet transit needs and build community-based marketing partnerships. Historically, SunLine
invests in these relationships by participating in community events such as mobility workshops, food
drives, fundraisers, parades, and special events. During the COVID-19 pandemic, SunLine developed a
new plan to connect with members of the community through virtual outreach efforts to capture
different audiences. Such efforts provide SunLine the opportunity to promote transportation services
and programs to existing riders and attract potential future riders. Outreach for Refueled will be
especially important to educate community stakeholders on the enhancements to their transit
experience.
3.2.15 Public Presentations
Target audiences include seniors, students, social services, businesses, and community leaders. The
main goal is public education related to the economic and environmental benefits of using public
transportation. During presentations, SunLine highlights the key role that we hold as a public transit
provider and leader in alternative fuel technology. SunLine’s use of hydrogen electric fuel cell and
battery electric fuel cell buses has affected the environment on a global scale. Presentations emphasize
why this is important and how it affects residents of the Coachella Valley. These presentations typically
occur at senior centers, colleges, and school orientation programs. In response to COVID-19, many
presentations will be virtual, in partnership with host organizations.
Page 295 of 400
Short Range Transit Plan • FY23 – FY25 70
3.2.16 Travel Training
Transportation provides us with a sense of independence and opportunities to engage within our
community. Sunline’s Travel Training Program offers opportunities for riders to learn how to
independently traverse a public transit system. To this end, SunLine offers group and one-on-one
training aboard a fixed route bus to build confidence and allow people to travel with ease.
3.2.17 Transit Ambassador Program
The SunLine Transit Ambassador Program, known as TAP, empowers employees to expand SunLine’s
culture of customer service. TAP consists of a series of training sessions that address crucial topics and
everyday scenarios in public transportation service. A Transit Ambassador has completed this program
and can assist passengers with their trip planning. Transit Ambassadors will assist the rider until the
rider feels confident in navigating the SunLine system independently.
3.2.18 Access Advisory Committee
The Access Advisory Committee, which meets bi-monthly, was formed in 1995 as an advocacy group
consisting of various agencies in the Coachella Valley. Committee members range from community
activists to everyday transit users who are committed to promoting successful implementation of the
transportation provisions of the ADA and other related federal legislation or regulations.
3.2.19 Human Trafficking Prevention
Awareness of the transportation-related risks associated with human trafficking has grown in recent
years. In partnership with the Coachella Valley Coalition Against Human Trafficking and funded in part
by an Innovations in Transit Public Safety Grant from FTA, SunLine launched a 6-month campaign in
September 2021 to educate the public about the increasingly prevalent issue of human trafficking. The
goal of this campaign is to educate the public about the signs of human trafficking, provide a call-to-
action for those who feel they may be witnessing a human trafficking incident, create an overall
increased awareness of human trafficking in the community, and share resources that will allow others
to take steps that will help stop human trafficking.
3.2.20 Areas of Persistent Poverty and Historically Disadvantaged Communities
Transit is a vital service for disadvantaged populations in the SunLine service area. As discussed in
Chapter 1, several census tracts in the SunLine service area meet the federal criteria to be designated as
Areas of Persistent Poverty or Historically Disadvantaged Communities. Tribal lands, which are also
considered Historically Disadvantaged Communities, are also located in the service area. As discussed in
Section 3.3 below, disadvantaged populations are a core market for transit and have unique travel
patterns. SunLine will consider these federal designations in its public outreach efforts and assessment
of environmental justice when evaluating service improvements and funding opportunities.
Page 296 of 400
Short Range Transit Plan • FY23 – FY25 71
3.3 Pandemic Recovery Recommendations and Best Practices
As part of the ongoing SunLine Refueled before and after study, a literature review was conducted to
glean insight on the future of transit and best practices for recovery from the pandemic. Through this
process, several themes emerged:
Transit demand has been reduced by the pandemic, but not in an even manner. Lower-income
riders and essential workers commuting to in-person jobs at all hours continue to depend on
transit service. In contrast, the increase in telecommuting is anticipated to be sustained,
although to an uncertain degree, resulting in reduced peak period demand for travel to central
business districts. Agencies can respond by preserving frequent line-haul service throughout the
day while deemphasizing costly peak-period service.
Network redesigns that emphasize a set of frequent core routes, as Sunline Refueled does, have
proven successful for other agencies, and this is the type of service that has performed best
through the pandemic by meeting the needs of the disadvantaged populations that remain the
“core” ridership base for transit agencies.
Changes in vehicular travel patterns throughout the pandemic affect bus running time across
the day and may require schedule modifications. Well-established practices, such as dedicated
lanes and transit signal priority (TSP), can help agencies ameliorate the impacts of rising
congestion and improve competitiveness in comparison with other modes. SunLine is
participating in the ongoing SCAG Regional Transit Lanes Study, which includes Highway 111 as a
potential corridor for transit priority treatments.
The untethering of jobs from offices has resulted in a shift toward living in suburbs and smaller
urban areas, and the Coachella Valley is likely to continue growing faster than the Southern
California region. As these population shifts drive development, SunLine will need to reevaluate
which areas have sufficient population to support service and whether service levels are keeping
up with growth in population.
As transit ridership recovers, flexible, on-demand microtransit may be a more cost-effective way
to maintain service coverage in areas with low fixed route ridership. Microtransit can also have
synergy with and improve the efficiency of paratransit service through sharing of vehicles and
automation of trip assignments. SunLine and RideCo are evaluating the potential of expansion of
SunRide service areas.
3.4 Projected Ridership Growth FY23–25
Following a significant downturn in ridership in March 2020 related to the COVID-19 pandemic, SunLine
expects it may take several years for ridership to rebound. SunLine and its planning partners are using
the regional travel demand model to prepare long-term ridership forecasts for the unconstrained transit
redesign.
Page 297 of 400
Short Range Transit Plan • FY23 – FY25 72
3.5 Proposed Fare Structure Changes
While the Board of Directors has directed SunLine staff to explore a fare-free system, the aim of this fare
policy is to increase SunLine’s revenues with a simplified structure that continues to provide support for
low-income individuals. Recent fare-related efforts and actions are discussed below.
Haul Pass
The College of the Desert and California State University, San Bernardino’s Palm Desert campus are
important transit markets in our service area. Started in August 2018 with a grant from the LCTOP, the
SunLine Haul Pass program gives students at these schools free access to SunLine buses with their
student ID. The LCTOP grant is funding an expansion of the program to students who are enrolled in any
Coachella Valley high schools. The program, which began with the 2021 school year, is anticipated to be
available for 18 to 22 months with the goal of the program becoming self-sustaining in future years. All
students that apply will be eligible to ride for free—not just to class, but anywhere SunLine buses go,
anytime they operate.
Mobile Ticketing
The 2020 Refueled survey showed that more than 86 percent of SunLine riders have access to a
smartphone or tablet with an Internet connection. Access to a connected device is an important factor
in the implementation of the Token Transit mobile ticketing pilot. Mobile ticketing allows riders to use a
new method of acquiring passes and gives SunLine valuable information that will be used for a
permanent mobile ticketing solution. Mobile ticketing will make paying fares much easier. There’s no
need to carry coins or cash. No need to wait in line to buy a pass. And no need to search in a wallet for a
buried bus pass. Customers can simply board the bus, use their phone to pay, and go.
Review fares annually. Fares should be reviewed annually to assess the ridership impact. This should
include an examination of revenue by fare category and fare media. The fare review should provide a
peer comparison to help ensure fare policy decisions are well-informed.
Make fare adjustments as frequently as possible. Fares should be adjusted annually to address inflation
and to deliver a more gradual change to riders. Fares that are frozen for several years and then adjusted
through a large disproportionate increase result in a “shock” to riders that may negatively affect the
agency image and ridership.
Calculate the SunLine internal rate of inflation to establish required fare adjustments. Fare increases
should be based on SunLine’s internal rate of inflation (goods, labor, and fuel), rather than the inflation
of a general Consumer Price Index. The Consumer Price Index measures the inflation on a basket of
goods and services unrelated to transit service and competing transportation modes.
To help low-income passengers access transit services and offset fare increases, SunLine may target
fares for Coachella Valley residents who meet low-income guidelines. The U.S. Department of Labor’s
Lower Living Standard Income Level is often used by transit agencies to determine eligibility for reduced
Page 298 of 400
Short Range Transit Plan • FY23 – FY25 73
fares. It identifies income levels by family size that are adjusted annually based on changes in the
Consumer Price Index.
3.6 Capital Improvement Planning
Refueled implementation is closely tied to CARB’s ICT regulation. The ICT regulation requires SunLine to
gradually transition to a 100 percent zero-emission bus (ZEB) fleet. As SunLine grows its fleet to provide
additional service, it will need to evaluate daily mileage needs and the incremental capital or electricity
costs of depot-charging electric buses that cannot be offset by available incentive and funding programs.
SunLine is also planning for the new infrastructure needed to support hydrogen production and
refueling for its fuel cell buses. It is also evaluating expansion of its satellite facility in Indio to support
hydrogen and ZEB fueling and maintenance.
SunLine is working with CVAG to plan and fund street improvements needed to preserve bus travel
times and improve service reliability. These street improvements include TSP measures, queue jumpers,
and dedicated bus lanes. Super stops are another capital improvement aimed at enhancing the
passenger experience. These stops include enlarged and near-level boarding areas, enhanced shelters,
and upgraded amenities.
SunLine is also working with its member cities to improve multimodal connections to its fixed route bus
service. This includes connections to the Coachella Valley Link. This bicycling and walking pathway will
link Coachella Valley cities and the lands of three federally recognized tribes with a path that generally
parallels Highway 111.
3.6.1 Bus Stop Improvements
SunLine’s current policy specifies that bus stops with more than 10 boardings per day warrant a shelter.
Twenty-nine bus stops currently meet this threshold but lack shelters. SunLine anticipates funding
availability to add 29 bus stop shelters in the next 3 years, which exceeds the number of improvements
required to meet current policy. SunLine proposes a two-tiered approach to allocating improvements:
Figure 3.2 summarizes the resulting allocation of bus shelters by jurisdiction. SunLine is committed to
implementing these policy recommendations and installing the additional 29 shelters over the next
three years.
Page 299 of 400
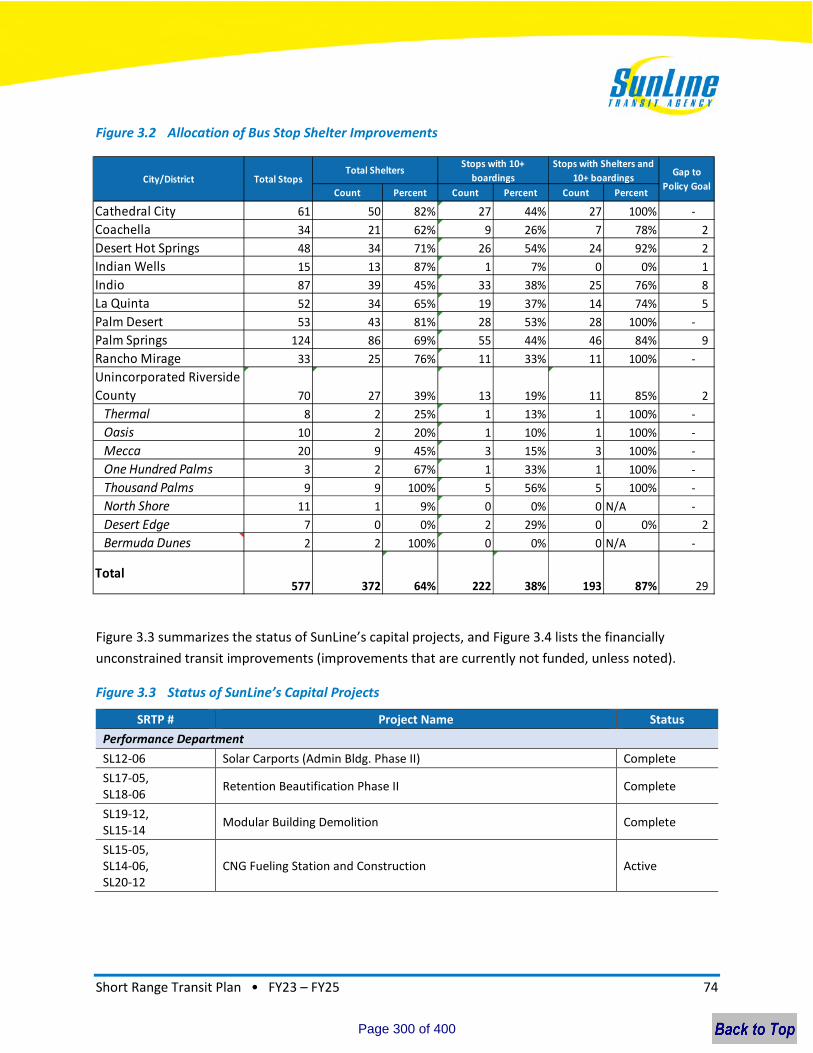
Short Range Transit Plan • FY23 – FY25 74
Figure 3.2 Allocation of Bus Stop Shelter Improvements
Figure 3.3 summarizes the status of SunLine’s capital projects, and Figure 3.4 lists the financially
unconstrained transit improvements (improvements that are currently not funded, unless noted).
Figure 3.3 Status of SunLine’s Capital Projects
SRTP # Project Name Status
Performance Department
SL12-06 Solar Carports (Admin Bldg. Phase II) Complete
SL17-05, SL18-06
Retention Beautification Phase II Complete
SL19-12, SL15-14
Modular Building Demolition Complete
SL15-05, SL14-06, SL20-12
CNG Fueling Station and Construction Active
Count Percent Count Percent Count Percent
Cathedral City 61 50 82% 27 44% 27 100% -
Coachella 34 21 62% 9 26% 7 78% 2
Desert Hot Springs 48 34 71% 26 54% 24 92% 2
Indian Wells 15 13 87% 1 7% 0 0% 1
Indio 87 39 45% 33 38% 25 76% 8
La Quinta 52 34 65% 19 37% 14 74% 5
Palm Desert 53 43 81% 28 53% 28 100% -
Palm Springs 124 86 69% 55 44% 46 84% 9
Rancho Mirage 33 25 76% 11 33% 11 100% -
Unincorporated Riverside
County 70 27 39% 13 19% 11 85% 2
Thermal 8 2 25% 1 13% 1 100% -
Oasis 10 2 20% 1 10% 1 100% -
Mecca 20 9 45% 3 15% 3 100% -
One Hundred Palms 3 2 67% 1 33% 1 100% -
Thousand Palms 9 9 100% 5 56% 5 100% -
North Shore 11 1 9% 0 0% 0 N/A -
Desert Edge 7 0 0% 2 29% 0 0% 2
Bermuda Dunes 2 2 100% 0 0% 0 N/A -
Total577 372 64% 222 38% 193 87% 29
Gap to
Policy GoalCity/District Total Stops
Total SheltersStops with 10+
boardings
Stops with Shelters and
10+ boardings
Page 300 of 400
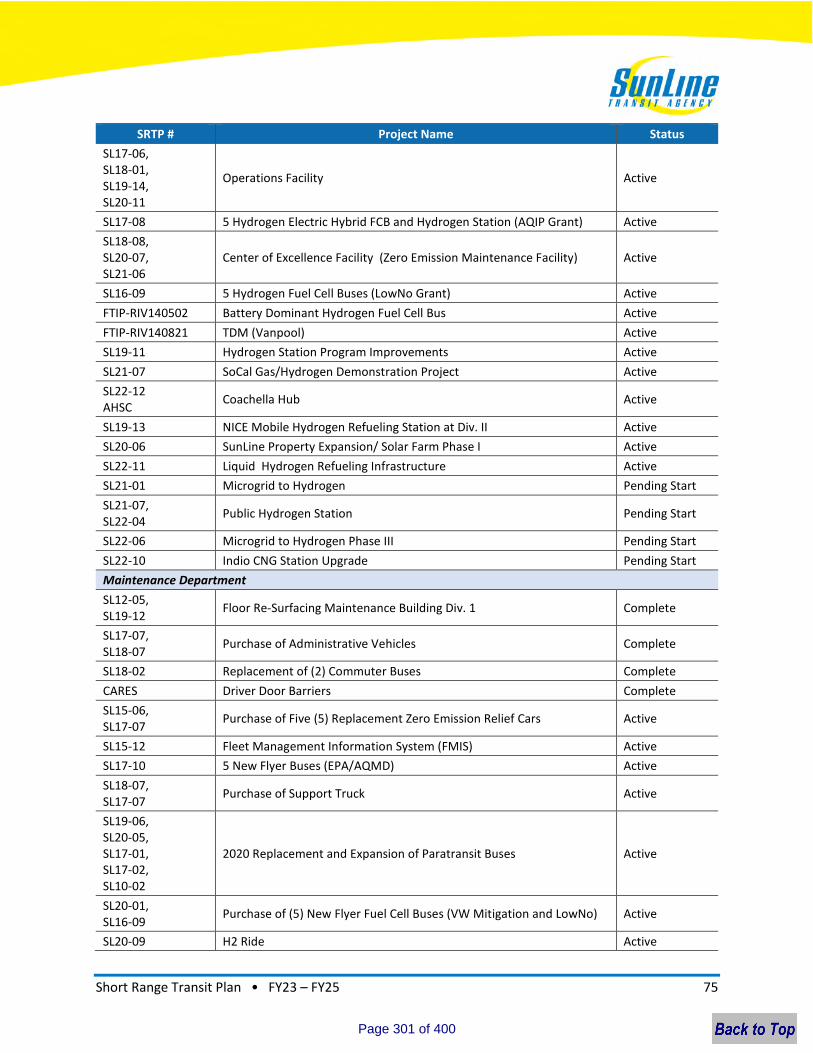
Short Range Transit Plan • FY23 – FY25 75
SRTP # Project Name Status
SL17-06, SL18-01, SL19-14, SL20-11
Operations Facility Active
SL17-08 5 Hydrogen Electric Hybrid FCB and Hydrogen Station (AQIP Grant) Active
SL18-08, SL20-07, SL21-06
Center of Excellence Facility (Zero Emission Maintenance Facility) Active
SL16-09 5 Hydrogen Fuel Cell Buses (LowNo Grant) Active
FTIP-RIV140502 Battery Dominant Hydrogen Fuel Cell Bus Active
FTIP-RIV140821 TDM (Vanpool) Active
SL19-11 Hydrogen Station Program Improvements Active
SL21-07 SoCal Gas/Hydrogen Demonstration Project Active
SL22-12 AHSC
Coachella Hub Active
SL19-13 NICE Mobile Hydrogen Refueling Station at Div. II Active
SL20-06 SunLine Property Expansion/ Solar Farm Phase I Active
SL22-11 Liquid Hydrogen Refueling Infrastructure Active
SL21-01 Microgrid to Hydrogen Pending Start
SL21-07, SL22-04
Public Hydrogen Station Pending Start
SL22-06 Microgrid to Hydrogen Phase III Pending Start
SL22-10 Indio CNG Station Upgrade Pending Start
Maintenance Department
SL12-05, SL19-12
Floor Re-Surfacing Maintenance Building Div. 1 Complete
SL17-07, SL18-07
Purchase of Administrative Vehicles Complete
SL18-02 Replacement of (2) Commuter Buses Complete
CARES Driver Door Barriers Complete
SL15-06, SL17-07
Purchase of Five (5) Replacement Zero Emission Relief Cars Active
SL15-12 Fleet Management Information System (FMIS) Active
SL17-10 5 New Flyer Buses (EPA/AQMD) Active
SL18-07, SL17-07
Purchase of Support Truck Active
SL19-06, SL20-05, SL17-01, SL17-02, SL10-02
2020 Replacement and Expansion of Paratransit Buses Active
SL20-01, SL16-09
Purchase of (5) New Flyer Fuel Cell Buses (VW Mitigation and LowNo) Active
SL20-09 H2 Ride Active
Page 301 of 400
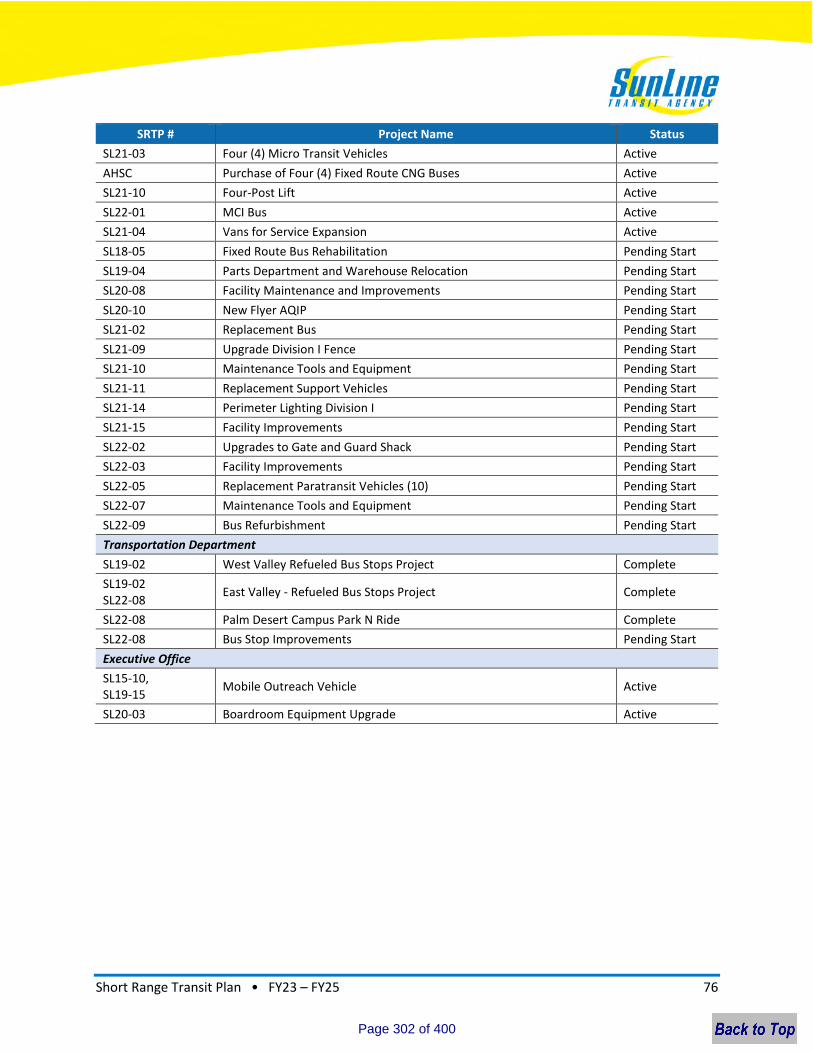
Short Range Transit Plan • FY23 – FY25 76
SRTP # Project Name Status
SL21-03 Four (4) Micro Transit Vehicles Active
AHSC Purchase of Four (4) Fixed Route CNG Buses Active
SL21-10 Four-Post Lift Active
SL22-01 MCI Bus Active
SL21-04 Vans for Service Expansion Active
SL18-05 Fixed Route Bus Rehabilitation Pending Start
SL19-04 Parts Department and Warehouse Relocation Pending Start
SL20-08 Facility Maintenance and Improvements Pending Start
SL20-10 New Flyer AQIP Pending Start
SL21-02 Replacement Bus Pending Start
SL21-09 Upgrade Division I Fence Pending Start
SL21-10 Maintenance Tools and Equipment Pending Start
SL21-11 Replacement Support Vehicles Pending Start
SL21-14 Perimeter Lighting Division I Pending Start
SL21-15 Facility Improvements Pending Start
SL22-02 Upgrades to Gate and Guard Shack Pending Start
SL22-03 Facility Improvements Pending Start
SL22-05 Replacement Paratransit Vehicles (10) Pending Start
SL22-07 Maintenance Tools and Equipment Pending Start
SL22-09 Bus Refurbishment Pending Start
Transportation Department
SL19-02 West Valley Refueled Bus Stops Project Complete
SL19-02 SL22-08
East Valley - Refueled Bus Stops Project Complete
SL22-08 Palm Desert Campus Park N Ride Complete
SL22-08 Bus Stop Improvements Pending Start
Executive Office
SL15-10, SL19-15
Mobile Outreach Vehicle Active
SL20-03 Boardroom Equipment Upgrade Active
Page 302 of 400
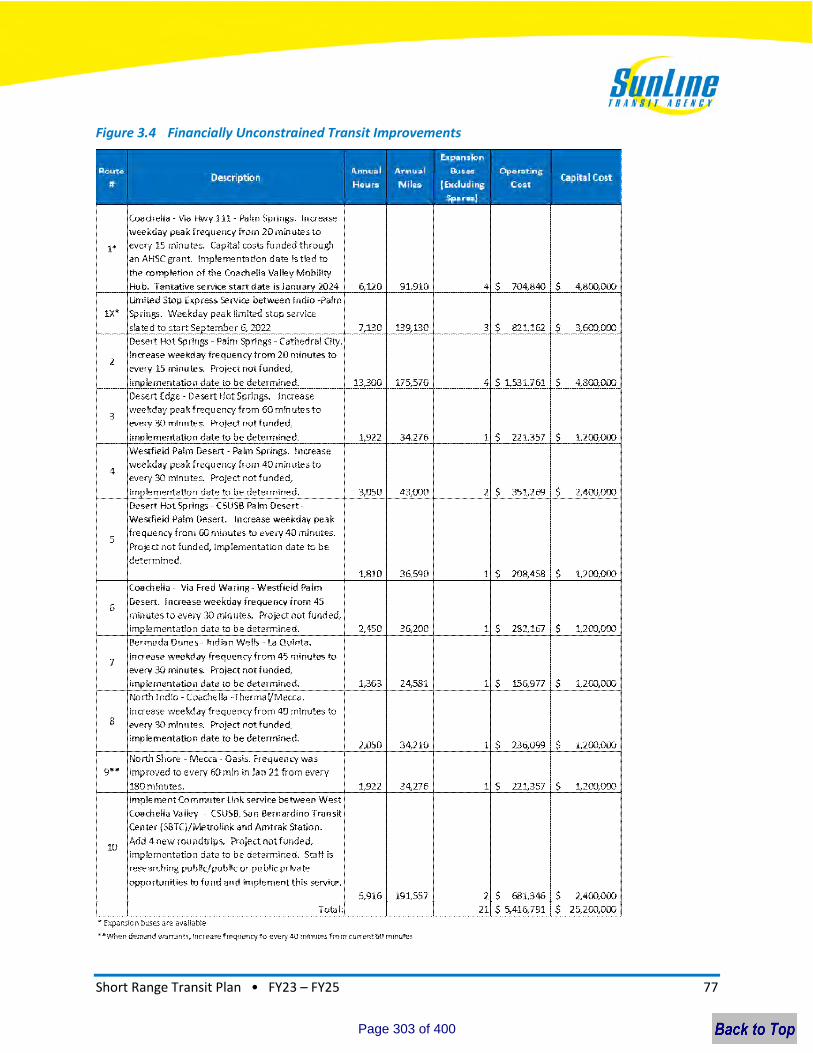
Short Range Transit Plan • FY23 – FY25 77
Figure 3.4 Financially Unconstrained Transit Improvements
Page 303 of 400
Short Range Transit Plan • FY23 – FY25 78
Chapter 4. Financial Planning
The FY2023 financial planning process focused on prioritizing resources and alignment with the core
strategic goals of the SunLine Refueled Initiative and regain ridership lost due to the COVID-19
pandemic. As aforementioned, in the midst of planning the FY2023-2025 SRTP, the COVID-19 pandemic
of 2020 caused a major national and global disruption. The executive team at SunLine brought their
diverse insights to most effectively allocate resources to maintain essential services. The enclosed
financial plan of the Agency is based on the best available financial projections and anticipated grants.
Chapter 4 will be inserted upon finalizing the budget.
4.1 Operating and Capital Budget
In FY2023, SunLine will have an operating budget of $46,085,647 and a capital budget of $25,477,005
(Table 4 and 4A). The operating budget encompasses costs such as driver salaries, administrative
salaries, fuel, insurance premiums, and other overhead costs required to run day to day operations. The
available funding will be used effectively and efficiently in the accomplishment of organizational
objectives. The operating budget will ensure that the Agency continues to offer safe and reliable
transportation to Coachella Valley residents.
The capital budget incorporates key projects to help further advance the Agency’s Capital Improvement
Program. The Capital Improvement Program for FY 2023 focuses on continuing SunLine’s investment in
increasing its alternative fuel technology and energy efficient infrastructures. SunLine’s Capital Program
represents a unique opportunity to make long term investments in SunLine’s operational capabilities,
energy strategies, and regulatory compliance by conforming with the California Air Resources Board’s
Innovative Clean Transit mandate.
Key components of the capital plan, beyond ongoing maintenance needs, include:
Liquid Hydrogen Project
Over the Road Hydrogen Fuel Cell Coaches (2)
CNG Rehab (10) & Hydrogen Vehicle Purchase (4)
Radio Replacement Phase II & Upgrade to ITS
SunLine Transit Agency has always led the industry in the adoption of alternative fuel solutions. The
capital and operating budget for FY23 demonstrate its continued commitment to alternative fuels.
SunLine has placed a high level of importance in leveraging available competitive funding whenever
possible in order to meet the Agency’s aggressive goals. One example of this success includes an award
of $8,409,070 from the Federal Transit Agency’s Bus and Bus Facilities competitive funding opportunity
which was announced in 2022 which is programmed in the FY23 capital program. The award aligns with
the Agency’s Innovative Clean Transit plan would allow the Agency to rehab ten existing CNG buses and
purchase four (4) hydrogen fuel cell buses.
Page 304 of 400
Short Range Transit Plan • FY23 – FY25 79
In FY22, SunLine initiated the purchase of land to build a solar power plant to generate sufficient
electricity to power the Hydrogen Electrolyzer to produce hydrogen; capitalizing on the abundance of
sunlight in the desert. The project in concept dubbed “Solar Microgrid to Hydrogen” is essential to
comply with the California Air Resources Board’s (CARB) Innovative Clean Transit (ICT) mandate of
introducing zero-emission buses (ZEBs). It will enable SunLine to comply with this mandate with minimal
negative impacts on public transit services currently offered by offsetting the incremental cost of
producing hydrogen or charging buses using electricity from the public electricity grid. The “Solar
Microgrid to Hydrogen” will support the much needed energy security and independence to provide
reliable public transit service. The “Solar Microgrid to Hydrogen” will serve as a sustainable, zero-
emission energy source for producing hydrogen to power buses.
The capital program is dependent on internal and external funding from federal, state, regional, and
local sources.
Page 305 of 400

Short Range Transit Plan • FY23 – FY25 80
4.2 Funding Plans to Support Proposed Operating and Capital Program
For FY2023, funding plans for the proposed operating and capital programs are as follows:
Funding sources for the proposed operating budget includes FTA Section 5307 (Urban formula, ARPA),
FTA Section 5311 (Rural, CRRSAA), FTA Section 5311 (f) (Intercity), Congestion Mitigation and Air Quality
(CMAQ), California Air Resources Board, California Energy Commission, and Low Carbon Operating
Program (LCTOP) funds apportioned by the California Department of Transportation (Caltrans),
California State Transportation Agency, State Local Transportation Funds (LTF), Local Measure A funding
and farebox revenue.
Funding sources for capital projects include funds from FTA Section 5307, FTA Section 5339, LCTOP,
State Transit Assistance (STA), and State of Good Repair Funds (SGR).
The estimated FY2023 operating and capital budget of $71,562,652 outlined in Table 4, is funded by:
Amount ($) Percent (%) Amount ($) Percent (%)
ARPA Section 5307 200,000 0% - 0%
California Air Resources Board (CARB) 200,000 0% - 0%
California Energy Commission 250,000 1% - 0%
California State Transit Agency - 0% 4,800,000 19%
CMAQ 893,098 2% - 0%
CRRSAA Section 5311 832,331 2% - 0%
Farebox 1,529,001 3% - 0%
LCTOP 192,172 0% 1,500,000 6%
Local Transportation Fund (LTF) 24,157,512 52% - 0%
Measure A 10,900,000 24% - 0%
Other 403,500 1% - 0%
Section 5307 5,869,769 13% 2,391,259 9%
Section 5311 409,279 1% - 0%
Section 5311(f) 248,985 1% - 0%
Section 5339 - 0% 10,393,811 41%
State of Good Repair - 0% 907,935 4%
State Transit Assistance Fund (STA) - 0% 5,484,000 22%
Total 46,085,647$ 100% 25,477,005$ 100%
Operating Capital
Fund
Page 306 of 400
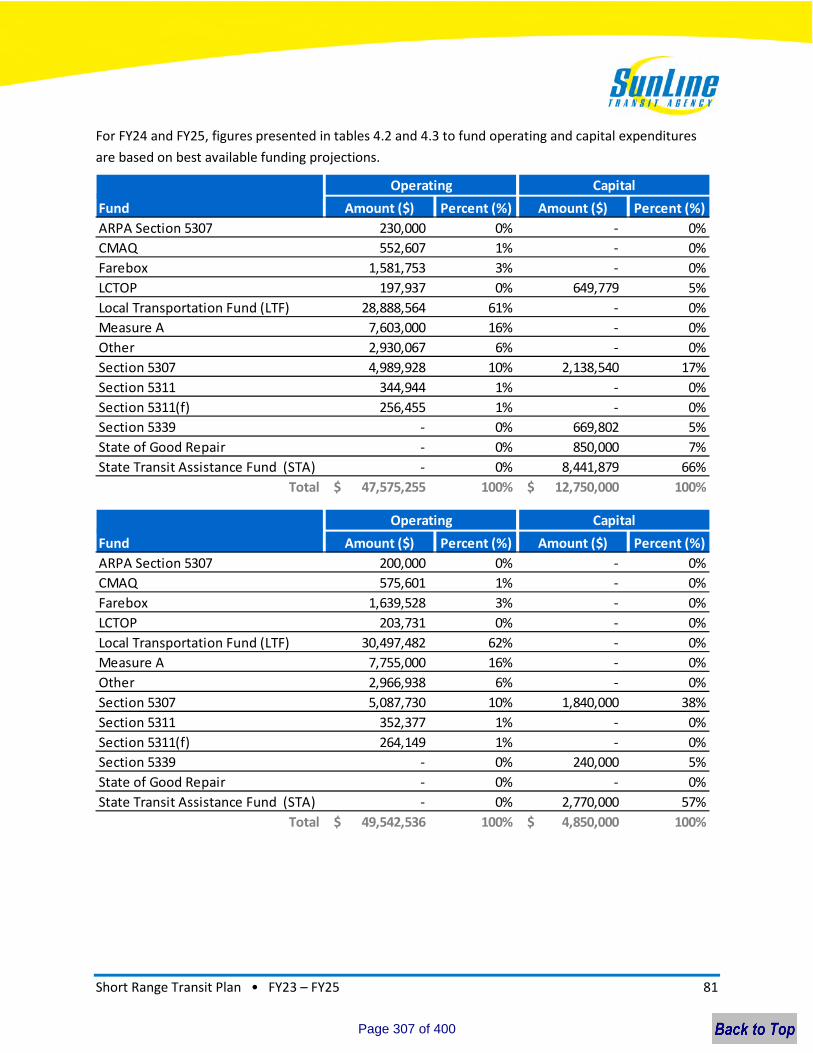
Short Range Transit Plan • FY23 – FY25 81
For FY24 and FY25, figures presented in tables 4.2 and 4.3 to fund operating and capital expenditures
are based on best available funding projections.
Amount ($) Percent (%) Amount ($) Percent (%)
ARPA Section 5307 230,000 0% - 0%
CMAQ 552,607 1% - 0%
Farebox 1,581,753 3% - 0%
LCTOP 197,937 0% 649,779 5%
Local Transportation Fund (LTF) 28,888,564 61% - 0%
Measure A 7,603,000 16% - 0%
Other 2,930,067 6% - 0%
Section 5307 4,989,928 10% 2,138,540 17%
Section 5311 344,944 1% - 0%
Section 5311(f) 256,455 1% - 0%
Section 5339 - 0% 669,802 5%
State of Good Repair - 0% 850,000 7%
State Transit Assistance Fund (STA) - 0% 8,441,879 66%
Total 47,575,255$ 100% 12,750,000$ 100%
Fund
Operating Capital
Amount ($) Percent (%) Amount ($) Percent (%)
ARPA Section 5307 200,000 0% - 0%
CMAQ 575,601 1% - 0%
Farebox 1,639,528 3% - 0%
LCTOP 203,731 0% - 0%
Local Transportation Fund (LTF) 30,497,482 62% - 0%
Measure A 7,755,000 16% - 0%
Other 2,966,938 6% - 0%
Section 5307 5,087,730 10% 1,840,000 38%
Section 5311 352,377 1% - 0%
Section 5311(f) 264,149 1% - 0%
Section 5339 - 0% 240,000 5%
State of Good Repair - 0% - 0%
State Transit Assistance Fund (STA) - 0% 2,770,000 57%
Total 49,542,536$ 100% 4,850,000$ 100%
Fund
Operating Capital
Page 307 of 400
Short Range Transit Plan • FY23 – FY25 82
4.3 Regulatory and Compliance Requirements
4.3.1 Americans with Disabilities Act
SunLine complies with ADA guidelines by providing a 100 percent accessible revenue service fleet for
fixed route transit services and ADA paratransit vehicles. As funding becomes available, SunLine
continues to provide bus stop improvements to ensure accessibility. Staff also coordinates with
developers and contractors regarding construction projects to include bus stop improvements when the
opportunity arises.
4.3.2 Disadvantaged Business Enterprise
SunLine’s most recent Disadvantaged Business Enterprise (DBE) program and goal were submitted to
FTA in July 2021 and had an expiration date of September 2024. The next DBE goal will be submitted by
August 2024.
4.3.3 Equal Employment Opportunity
SunLine complies with federal regulations pertaining to employment and submits its Equal Employment
Opportunity (EEO)-4 report biannually to the U.S. Equal Employment Opportunity Commission (EEOC)
and its EEO/Affirmative Action Program to FTA every 4 years, or as major changes occur in the workforce
or employment conditions. The most recent EEO-4 report was submitted to the EEOC and certified in
February 2022. The most recent EEO/Affirmative Action Program was revised and submitted to FTA in
September 2020. The next update to the EEO/Affirmative Action Program is due to the FTA in October
2024.
4.3.4 Title VI
Title VI protects people from discrimination based on race, color, and national origin in programs and
activities receiving federal financial assistance. SunLine’s Title VI report was submitted to FTA in
November 2019 and has an expiration date of October 2022.
4.3.5 Transportation Development Act
The Transportation Development Act provides two major sources of funding for public transportation:
the LTF and STA. RCTC commissioned Michael Baker International to conduct the Triennial Performance
Audit as required by the Transportation Development Act; SunLine’s findings are referenced in Table 6
of that document.
4.3.6 Federal Transit Administration Triennial Audit
In accordance with regulations, SunLine completed an FTA Triennial Audit site visit in 2019. The Triennial
Audit focused on SunLine’s compliance in 21 areas. SunLine had no deficiencies with the FTA
requirements.
Page 308 of 400
Short Range Transit Plan • FY23 – FY25 83
4.3.7 National Transit Database
To keep track of the industry and provide public information and statistics as growth occurs, FTA’s
National Transit Database records the financial, operating, and asset conditions of transit systems. Staff
submit monthly reports and a yearly report which is used for funding formulas.
4.3.8 Alternative Fuel Vehicles
In alignment with SunLine’s Board-approved Alternative Fuel Policy, all vehicles in the fleet use CNG,
electric, or hydrogen fuel. The current active fleet consists of 56 CNG buses, 21 hydrogen electric fuel
cell buses, four (4) battery electric buses, two (2) CNG coaches, one (1) diesel coach, 39 CNG paratransit
vehicles, and 47 non-revenue CNG, gas and electric vehicles, including general support cars and trucks.
Page 309 of 400
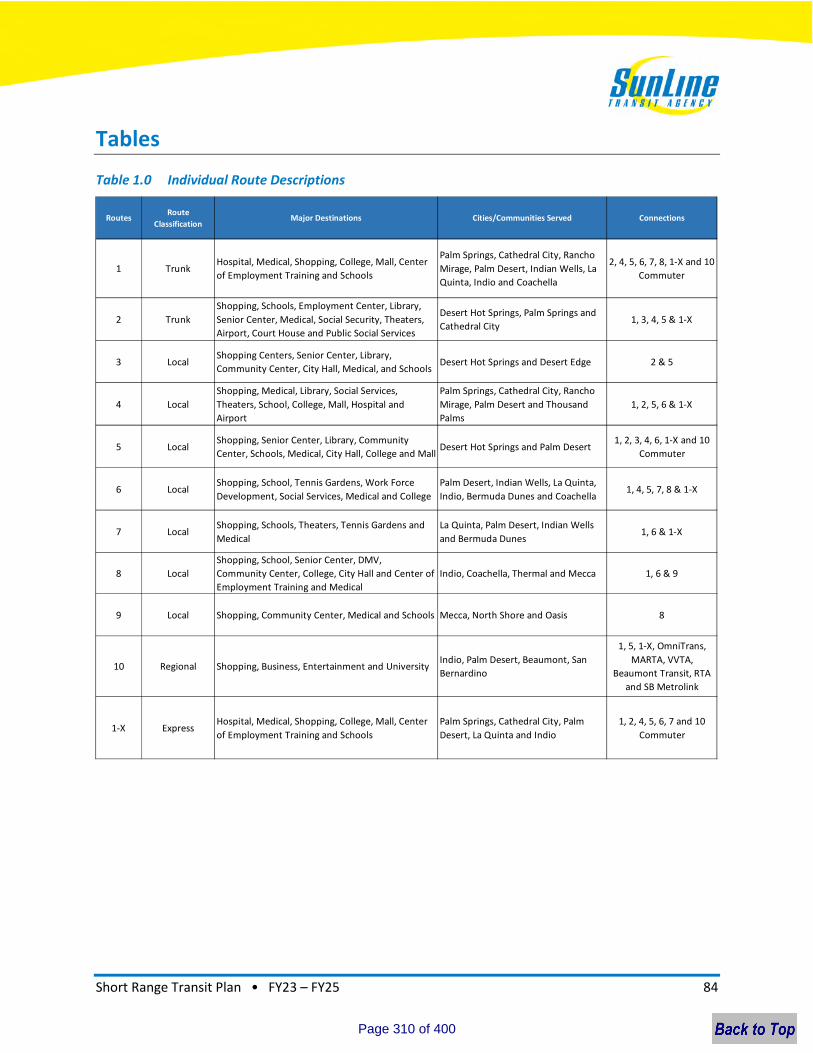
Short Range Transit Plan • FY23 – FY25 84
Tables
Table 1.0 Individual Route Descriptions
RoutesRoute
ClassificationMajor Destinations Cities/Communities Served Connections
1 TrunkHospital, Medical, Shopping, College, Mall, Center
of Employment Training and Schools
Palm Springs, Cathedral City, Rancho
Mirage, Palm Desert, Indian Wells, La
Quinta, Indio and Coachella
2, 4, 5, 6, 7, 8, 1-X and 10
Commuter
2 Trunk
Shopping, Schools, Employment Center, Library,
Senior Center, Medical, Social Security, Theaters,
Airport, Court House and Public Social Services
Desert Hot Springs, Palm Springs and
Cathedral City1, 3, 4, 5 & 1-X
3 LocalShopping Centers, Senior Center, Library,
Community Center, City Hall, Medical, and SchoolsDesert Hot Springs and Desert Edge 2 & 5
4 Local
Shopping, Medical, Library, Social Services,
Theaters, School, College, Mall, Hospital and
Airport
Palm Springs, Cathedral City, Rancho
Mirage, Palm Desert and Thousand
Palms
1, 2, 5, 6 & 1-X
5 LocalShopping, Senior Center, Library, Community
Center, Schools, Medical, City Hall, College and MallDesert Hot Springs and Palm Desert
1, 2, 3, 4, 6, 1-X and 10
Commuter
6 LocalShopping, School, Tennis Gardens, Work Force
Development, Social Services, Medical and College
Palm Desert, Indian Wells, La Quinta,
Indio, Bermuda Dunes and Coachella1, 4, 5, 7, 8 & 1-X
7 LocalShopping, Schools, Theaters, Tennis Gardens and
Medical
La Quinta, Palm Desert, Indian Wells
and Bermuda Dunes1, 6 & 1-X
8 Local
Shopping, School, Senior Center, DMV,
Community Center, College, City Hall and Center of
Employment Training and Medical
Indio, Coachella, Thermal and Mecca 1, 6 & 9
9 Local Shopping, Community Center, Medical and Schools Mecca, North Shore and Oasis 8
10 Regional Shopping, Business, Entertainment and UniversityIndio, Palm Desert, Beaumont, San
Bernardino
1, 5, 1-X, OmniTrans,
MARTA, VVTA,
Beaumont Transit, RTA
and SB Metrolink
1-X ExpressHospital, Medical, Shopping, College, Mall, Center
of Employment Training and Schools
Palm Springs, Cathedral City, Palm
Desert, La Quinta and Indio
1, 2, 4, 5, 6, 7 and 10
Commuter
Page 310 of 400

Short Range Transit Plan • FY23 – FY25 85
Table 1.1 Fleet Inventory – Motor Bus
Page 311 of 400
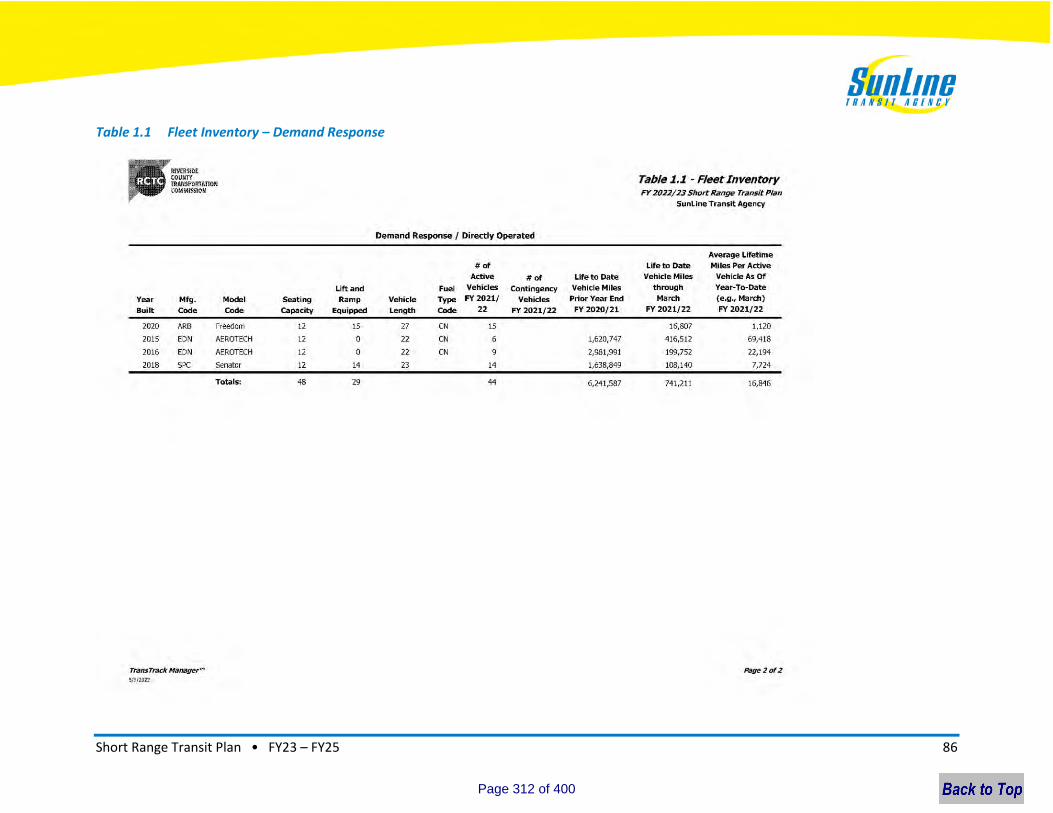
Short Range Transit Plan • FY23 – FY25 86
Table 1.1 Fleet Inventory – Demand Response
Page 312 of 400
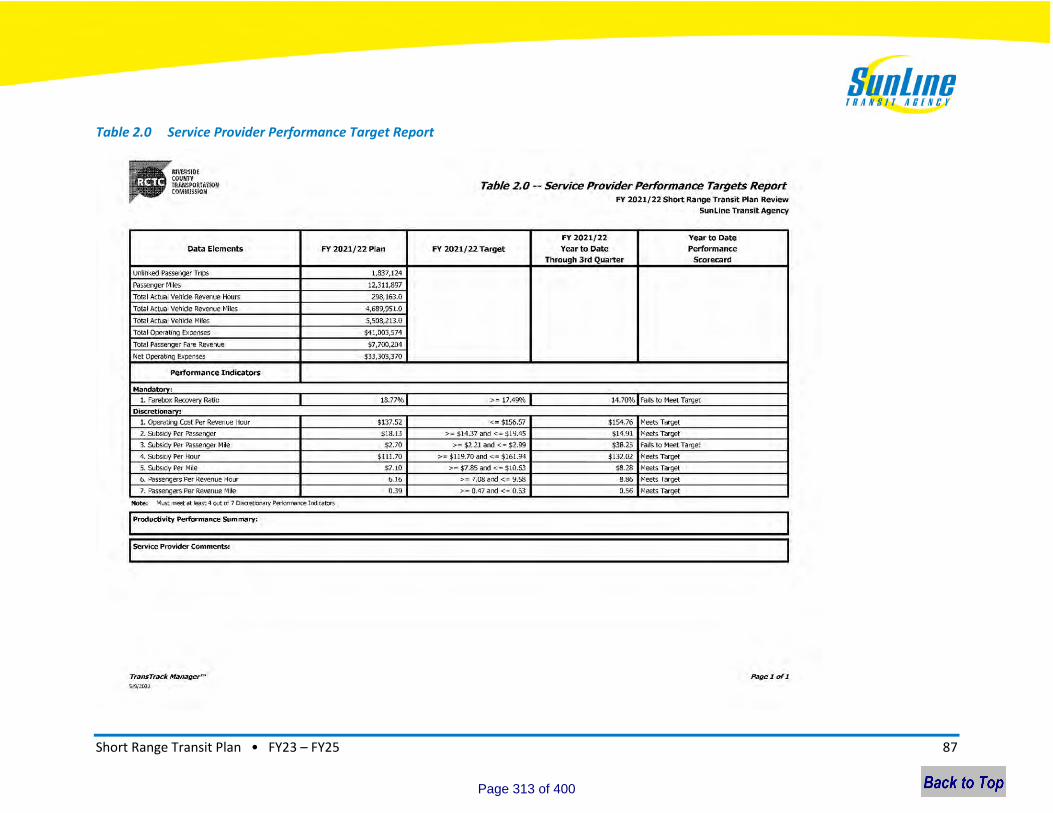
Short Range Transit Plan • FY23 – FY25 87
Table 2.0 Service Provider Performance Target Report
Page 313 of 400
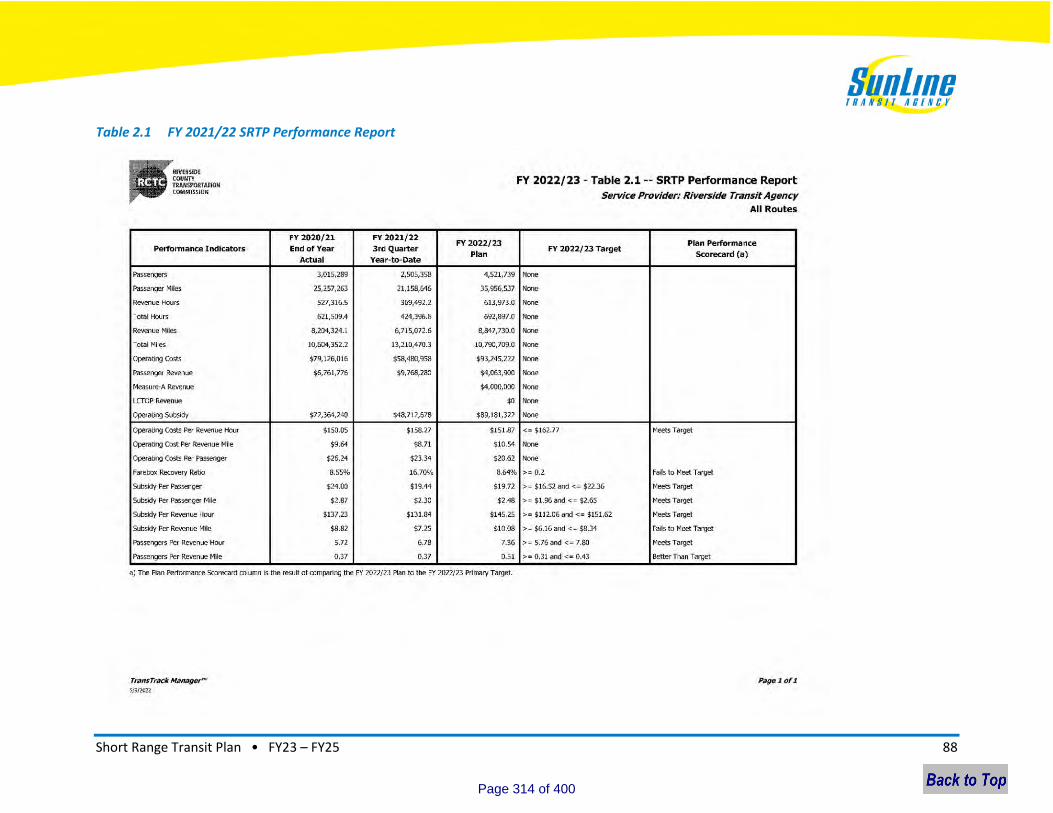
Short Range Transit Plan • FY23 – FY25 88
Table 2.1 FY 2021/22 SRTP Performance Report
Page 314 of 400
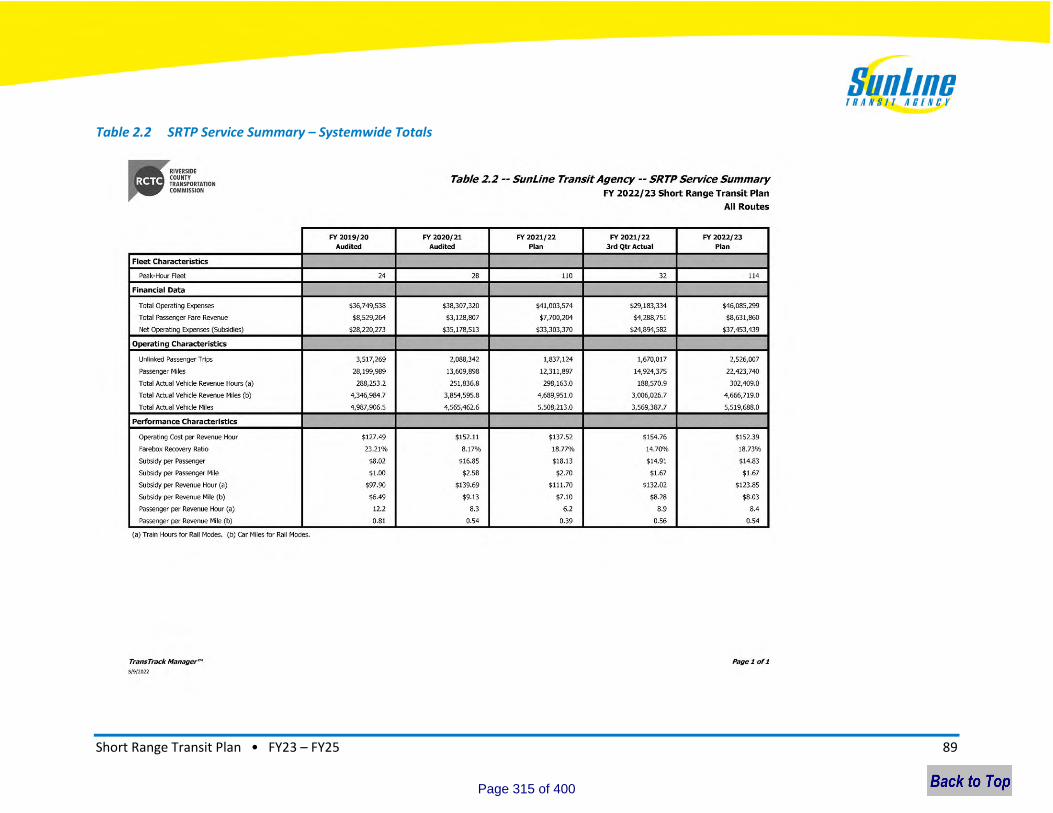
Short Range Transit Plan • FY23 – FY25 89
Table 2.2 SRTP Service Summary – Systemwide Totals
Page 315 of 400
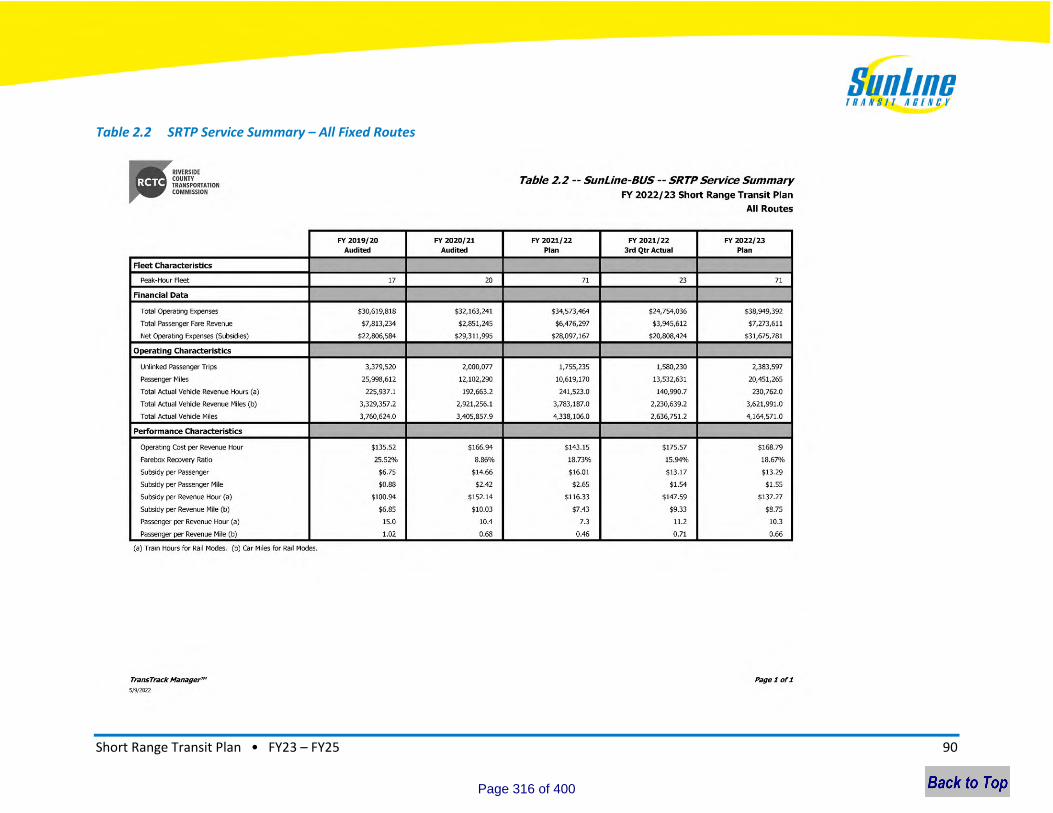
Short Range Transit Plan • FY23 – FY25 90
Table 2.2 SRTP Service Summary – All Fixed Routes
Page 316 of 400
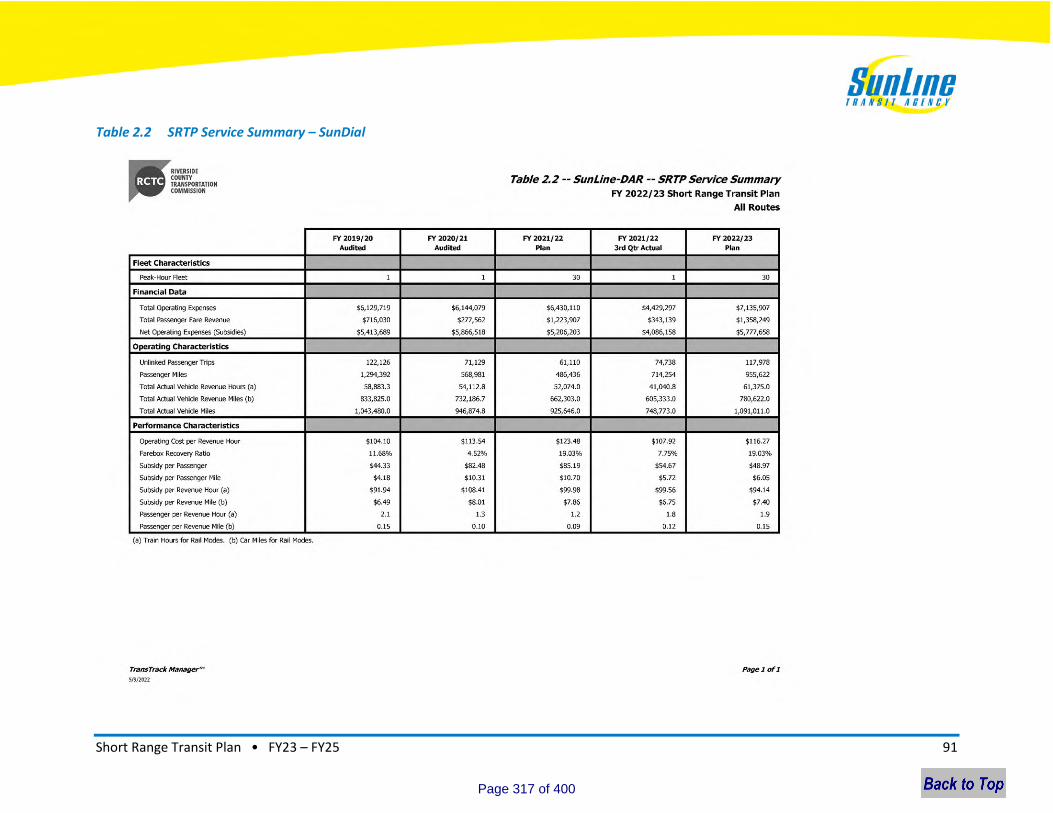
Short Range Transit Plan • FY23 – FY25 91
Table 2.2 SRTP Service Summary – SunDial
Page 317 of 400
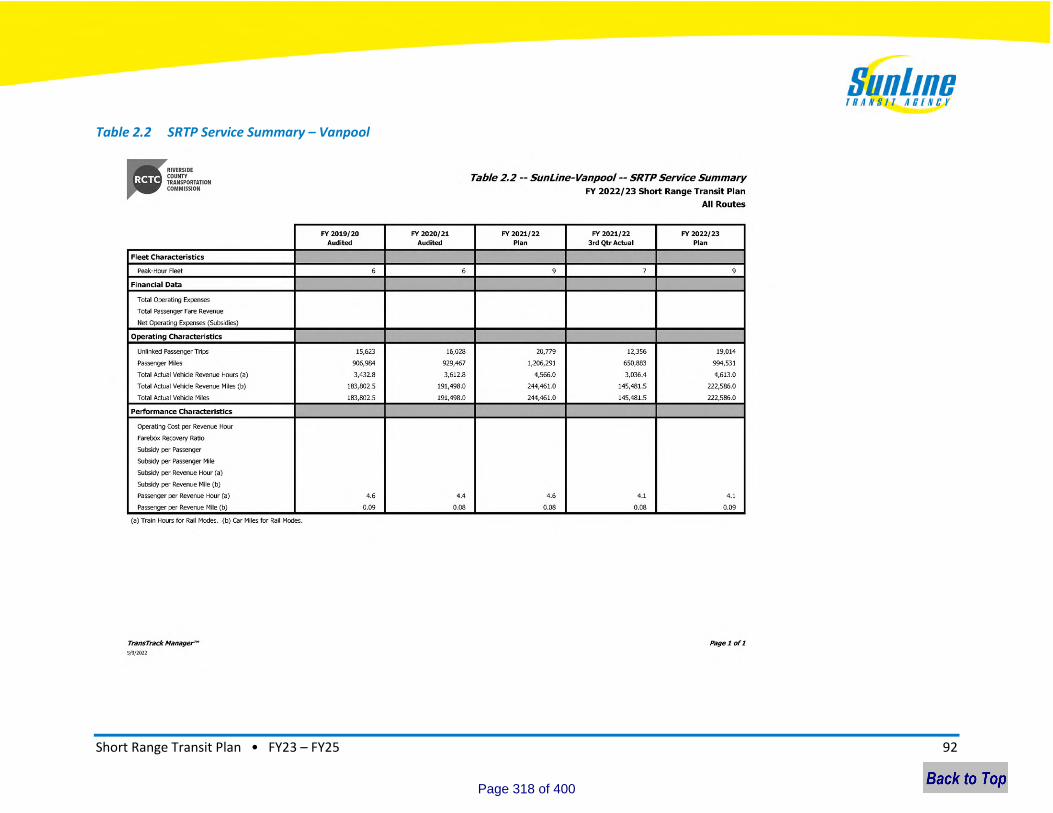
Short Range Transit Plan • FY23 – FY25 92
Table 2.2 SRTP Service Summary – Vanpool
Page 318 of 400
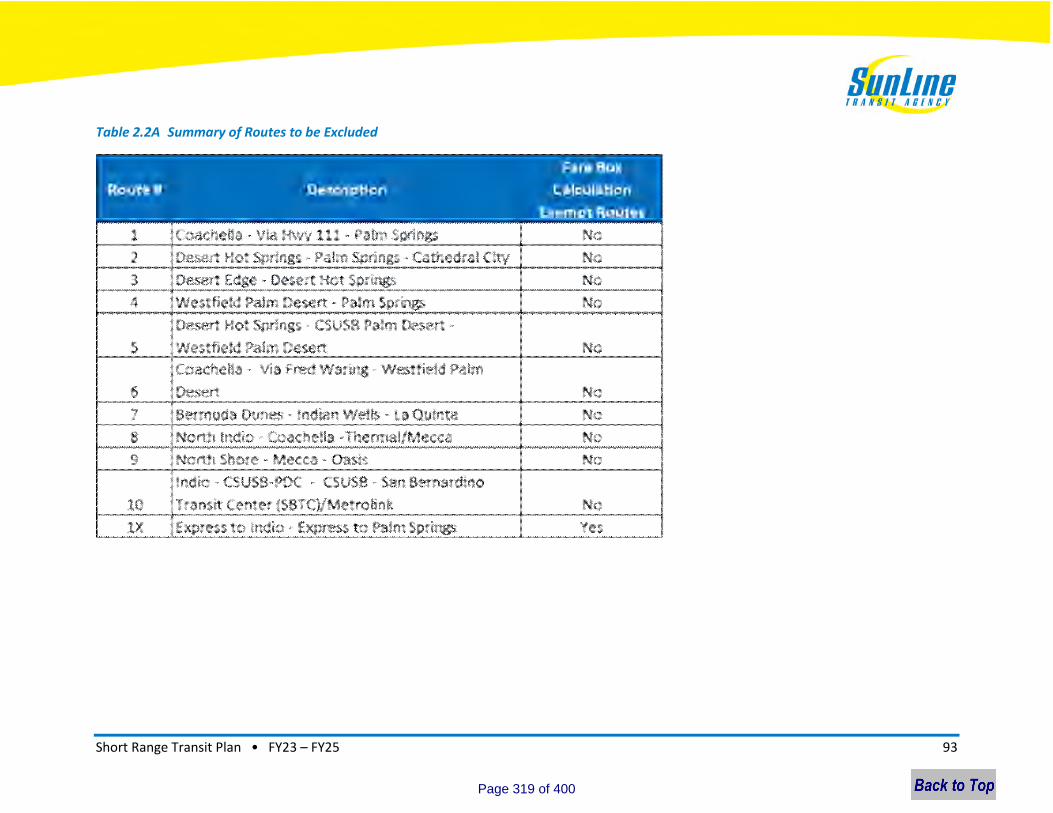
Short Range Transit Plan • FY23 – FY25 93
Table 2.2A Summary of Routes to be Excluded
Page 319 of 400
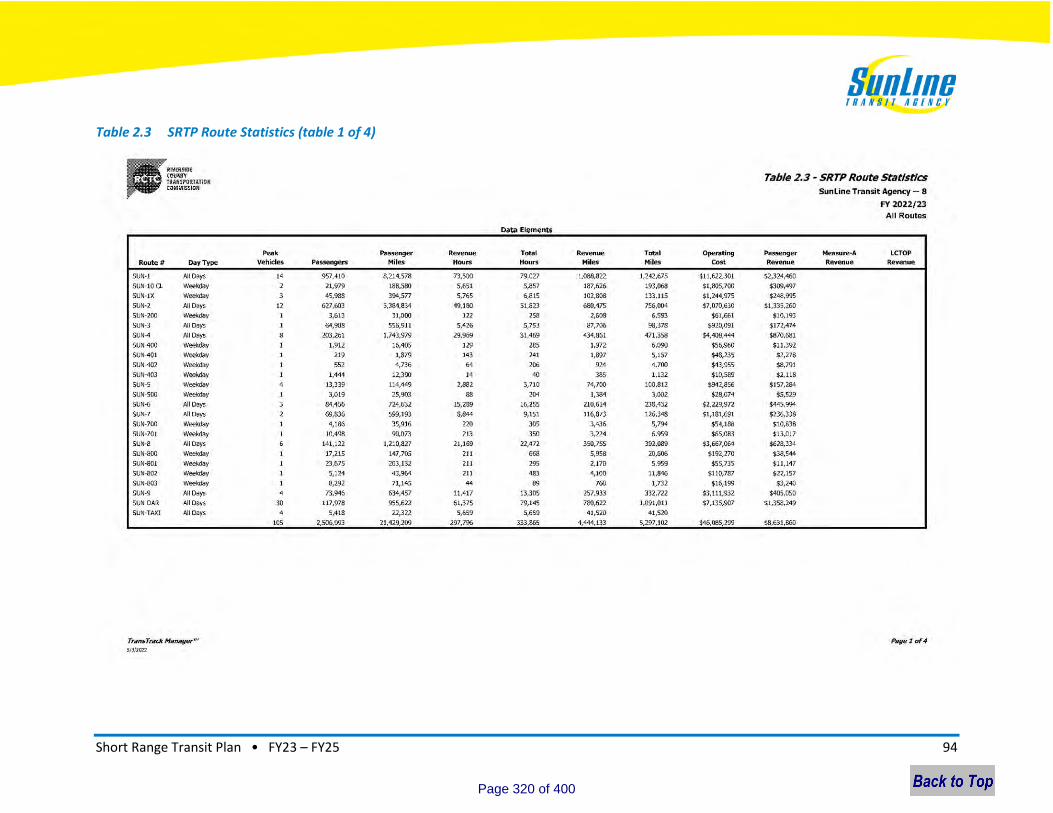
Short Range Transit Plan • FY23 – FY25 94
Table 2.3 SRTP Route Statistics (table 1 of 4)
Page 320 of 400
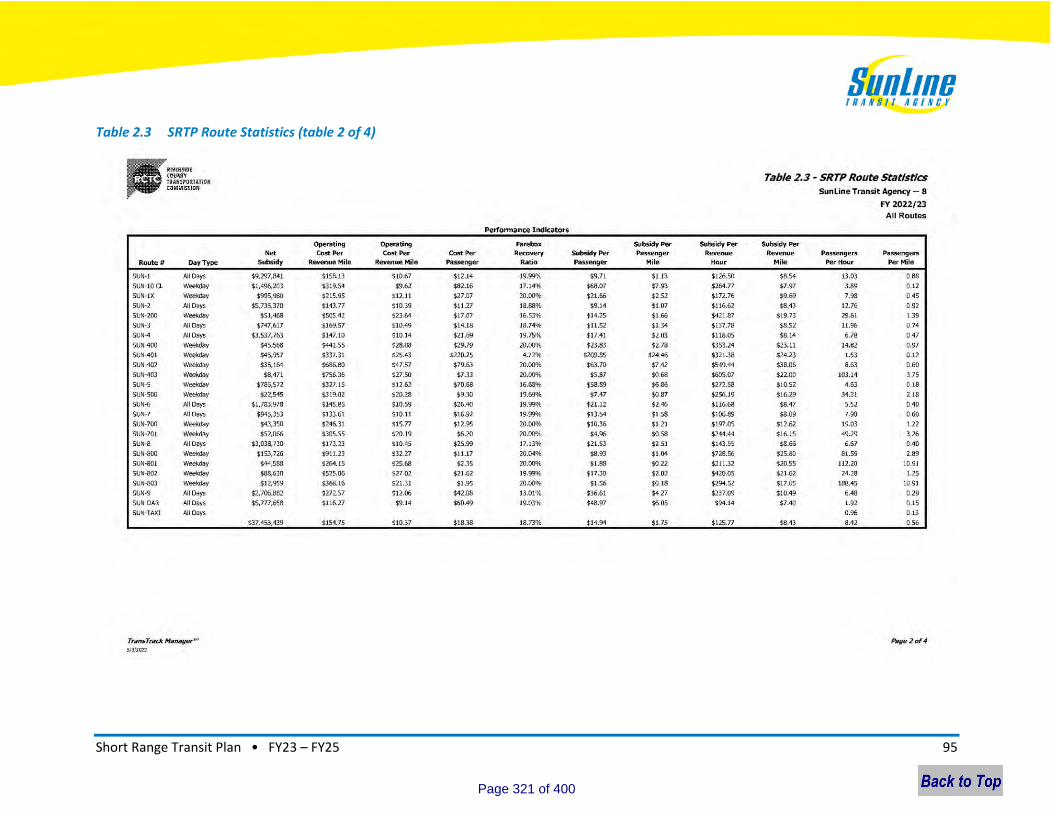
Short Range Transit Plan • FY23 – FY25 95
Table 2.3 SRTP Route Statistics (table 2 of 4)
Page 321 of 400
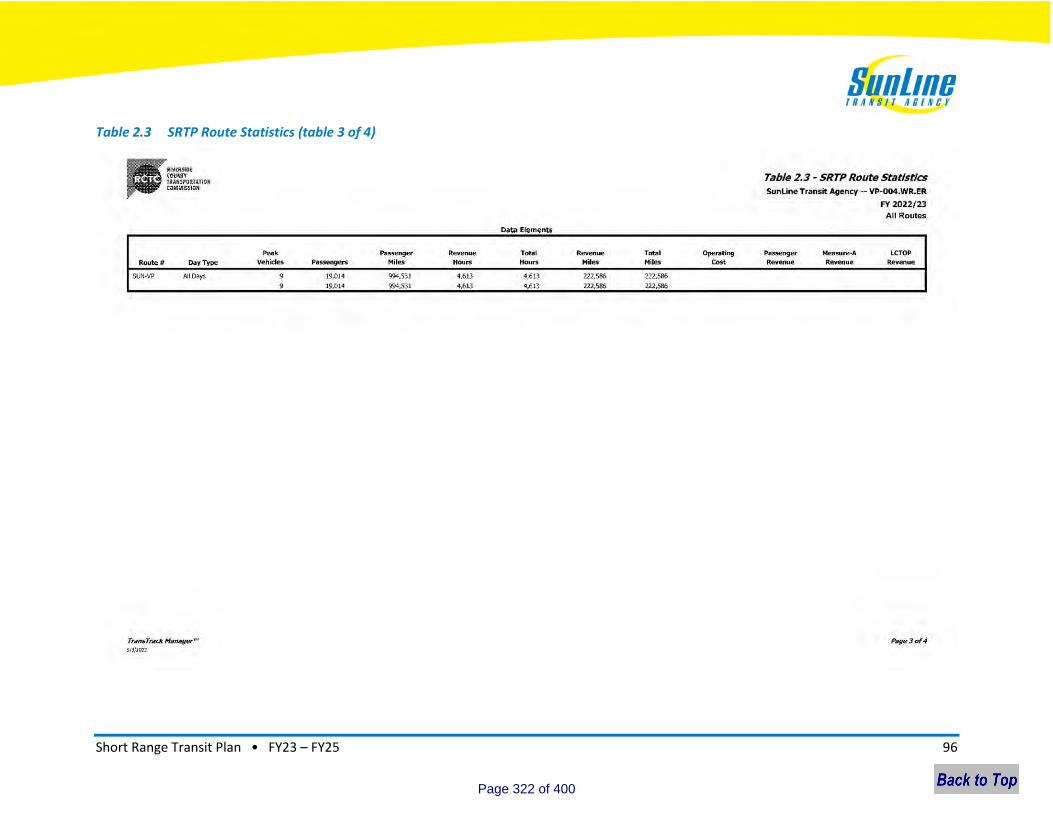
Short Range Transit Plan • FY23 – FY25 96
Table 2.3 SRTP Route Statistics (table 3 of 4)
Page 322 of 400

Short Range Transit Plan • FY23 – FY25 97
Table 2.3 SRTP Route Statistics (table 4 of 4)
Page 323 of 400

Short Range Transit Plan • FY23 – FY25 98
Table 3.0 Highlights of the FY2022/23 SRTP
# Description Start Date
1
Increase all route frequencies gradually to regular service level (pre-COVID-
19 level) as new coach operators are hired and trained Ongoing
2
Launch Route 1X express service between Indio and Palm Springs along
Highway 111 to test the effectiveness and desirability of the limited-stop
service contingent on the ability to hire and train coach operators Fall 22
3
Hire and train over forty coach operators to implement all approved
service improvements Ongoing
4
Launch new SunRide geo-fence zones in Cathedral City and Indio on
September 5, 2022 and explore the feasibility of further expanding
SunRide service Sep-22
5
Develop service strategy for the new Acrisure Arena opening January 2023
in Palm Desert Jan-22
6
Update bus stop signs, schedule holders and install new bus shelters
across the service area according to policy to enhance customer service,
optimize trip planning technologies, and improve communication with
passengers Ongoing
7
Implement the Innovative Clean Transit (ICT) plan. Transition to zero
emissions by 2035 – five years ahead of the deadline set in the ICT
Regulation (2040) Ongoing
Page 324 of 400

Short Range Transit Plan • FY23 – FY25 99
Table 4.0 Summary of Funding Requests (1 of 3)
Page 325 of 400
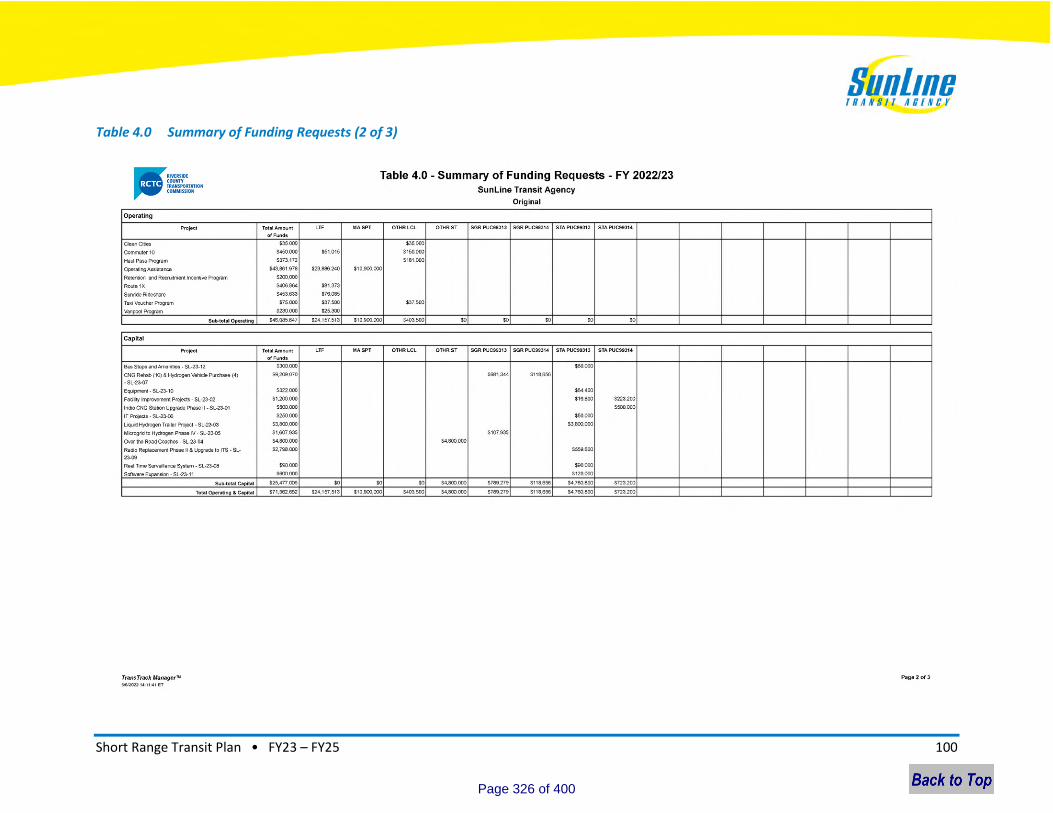
Short Range Transit Plan • FY23 – FY25 100
Table 4.0 Summary of Funding Requests (2 of 3)
Page 326 of 400
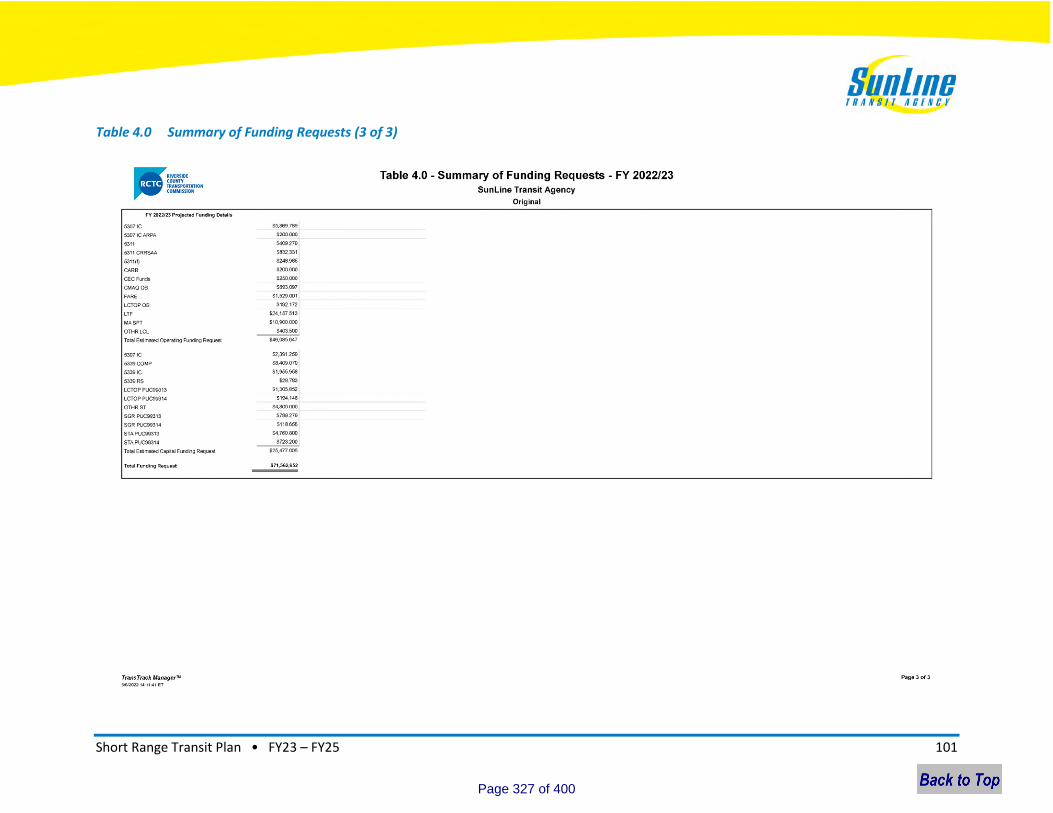
Short Range Transit Plan • FY23 – FY25 101
Table 4.0 Summary of Funding Requests (3 of 3)
Page 327 of 400
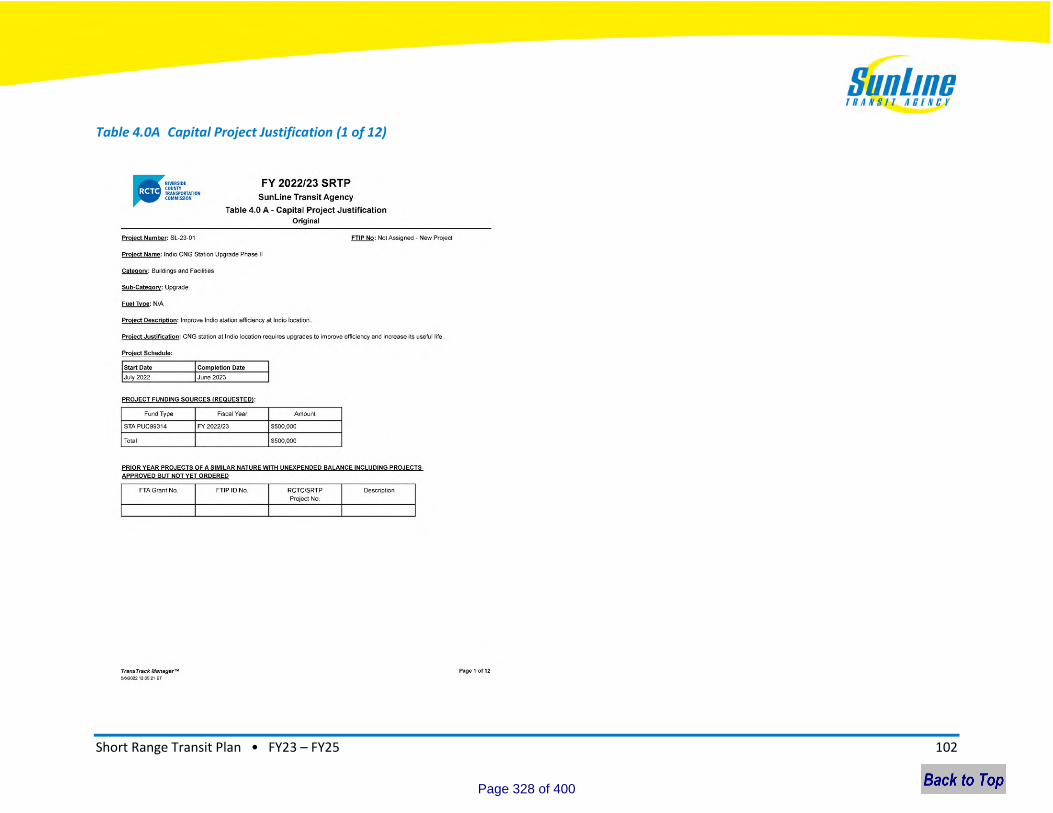
Short Range Transit Plan • FY23 – FY25 102
Table 4.0A Capital Project Justification (1 of 12)
Page 328 of 400
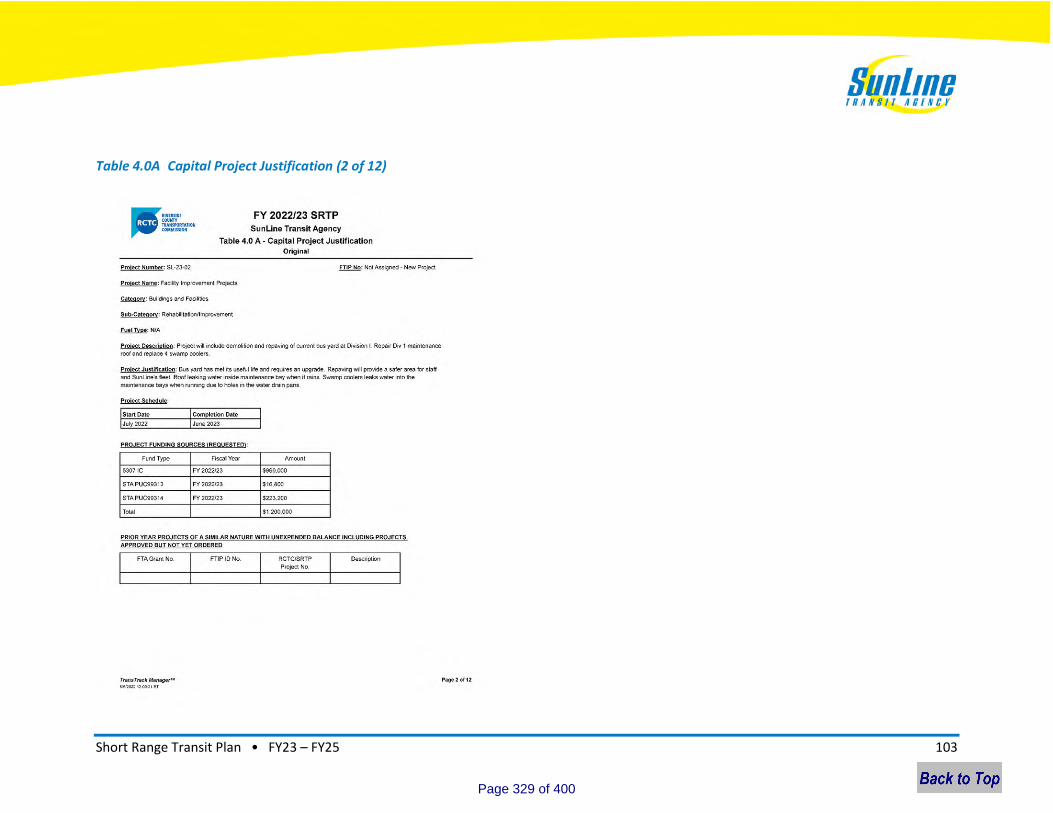
Short Range Transit Plan • FY23 – FY25 103
Table 4.0A Capital Project Justification (2 of 12)
Page 329 of 400
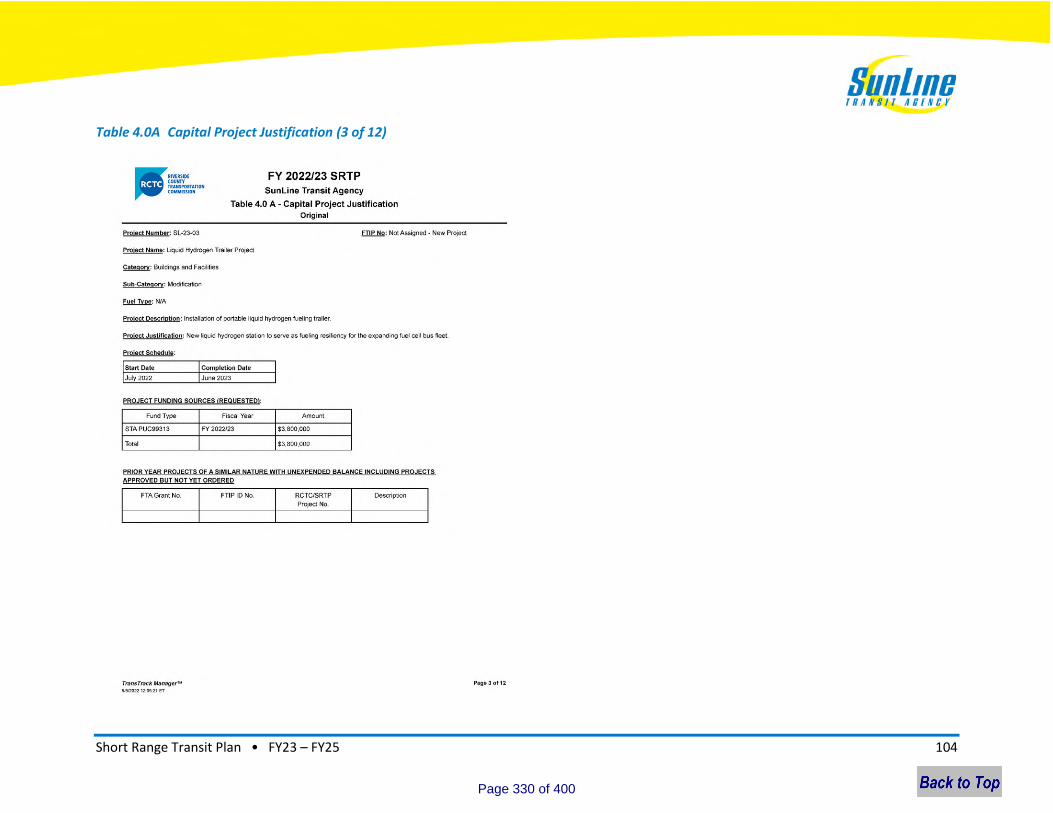
Short Range Transit Plan • FY23 – FY25 104
Table 4.0A Capital Project Justification (3 of 12)
Page 330 of 400
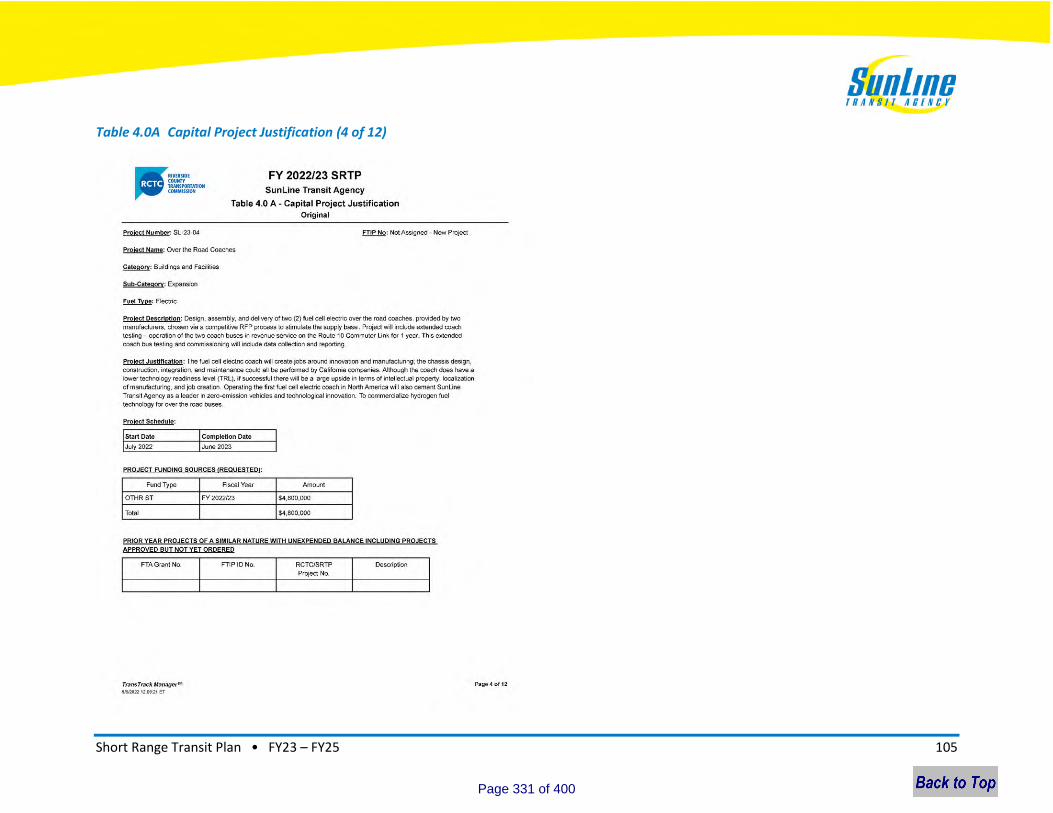
Short Range Transit Plan • FY23 – FY25 105
Table 4.0A Capital Project Justification (4 of 12)
Page 331 of 400
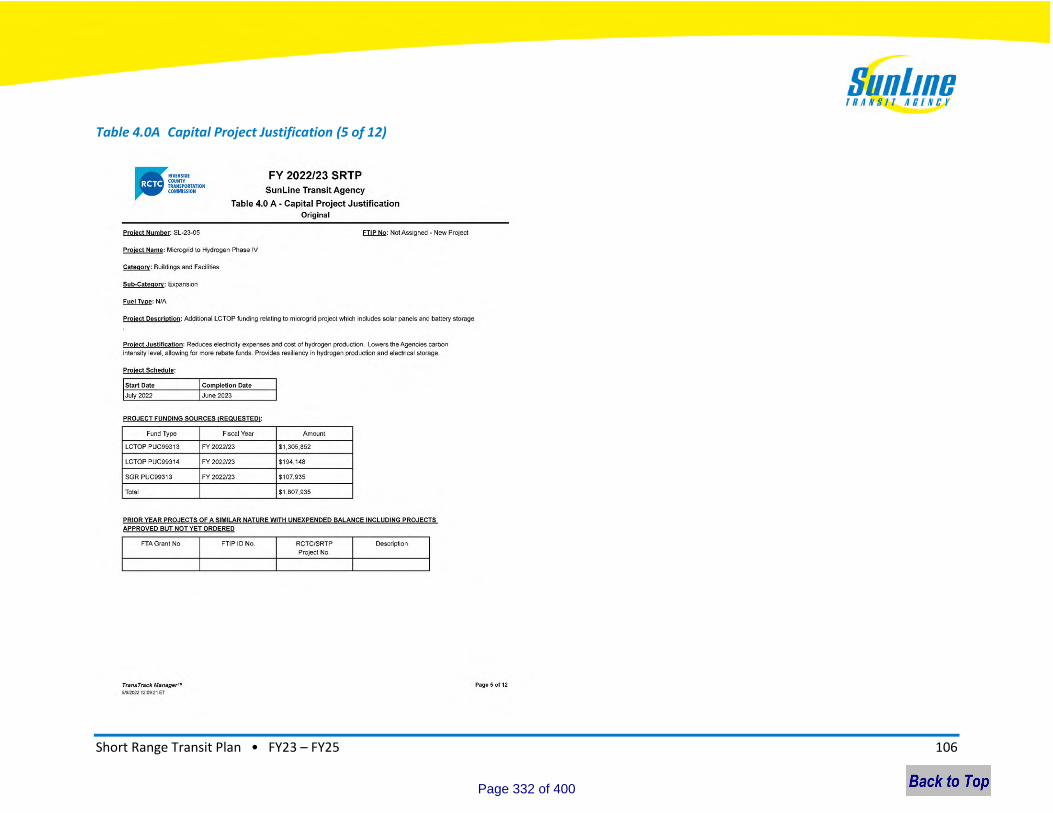
Short Range Transit Plan • FY23 – FY25 106
Table 4.0A Capital Project Justification (5 of 12)
Page 332 of 400

Short Range Transit Plan • FY23 – FY25 107
Table 4.0A Capital Project Justification (6 of 12)
Page 333 of 400
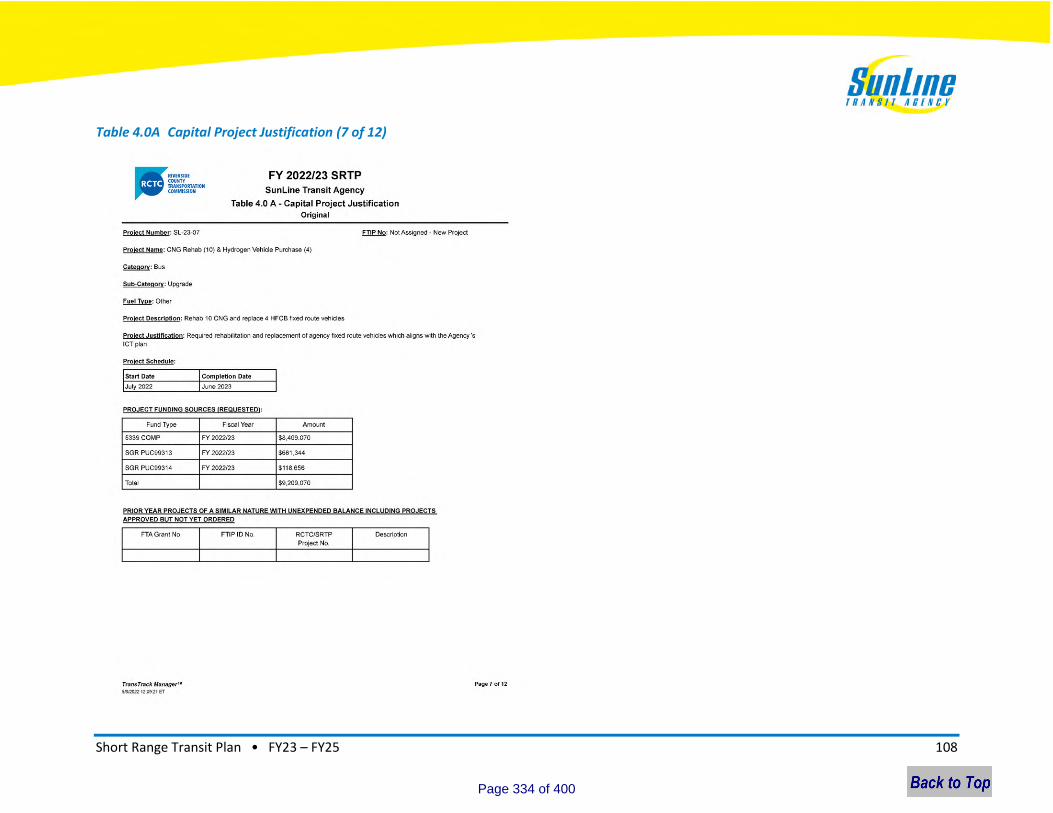
Short Range Transit Plan • FY23 – FY25 108
Table 4.0A Capital Project Justification (7 of 12)
Page 334 of 400

Short Range Transit Plan • FY23 – FY25 109
Table 4.0A Capital Project Justification (8 of 12)
Page 335 of 400
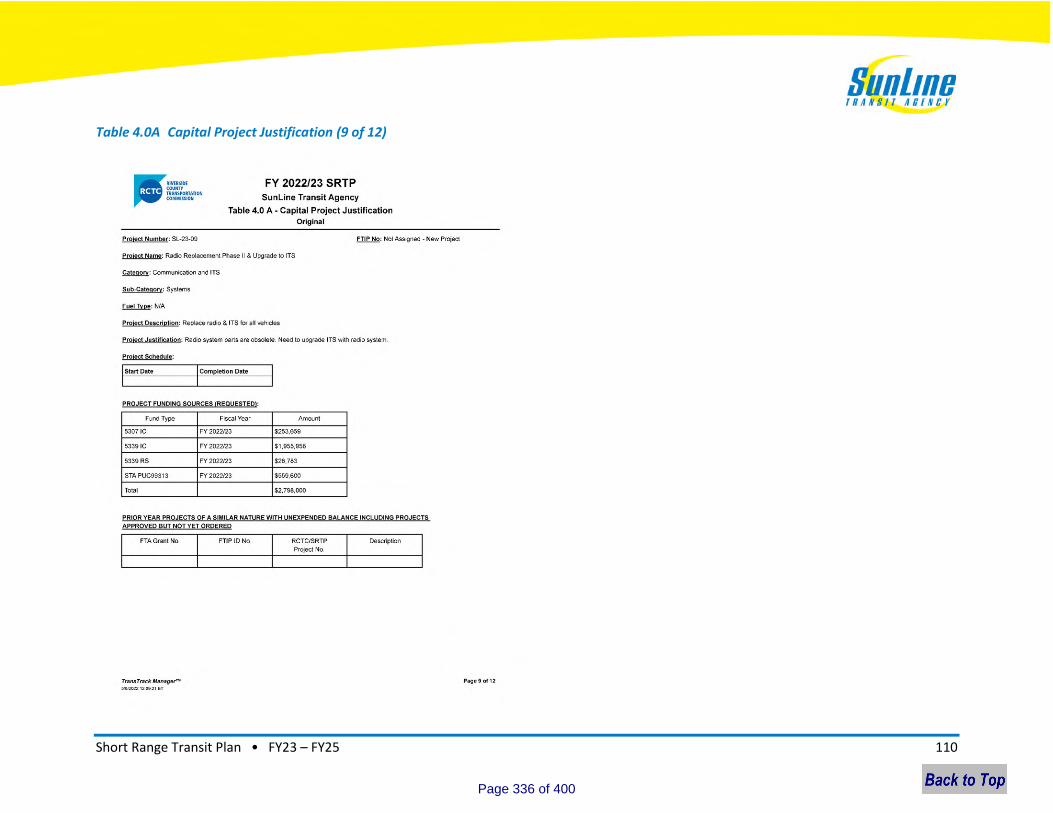
Short Range Transit Plan • FY23 – FY25 110
Table 4.0A Capital Project Justification (9 of 12)
Page 336 of 400
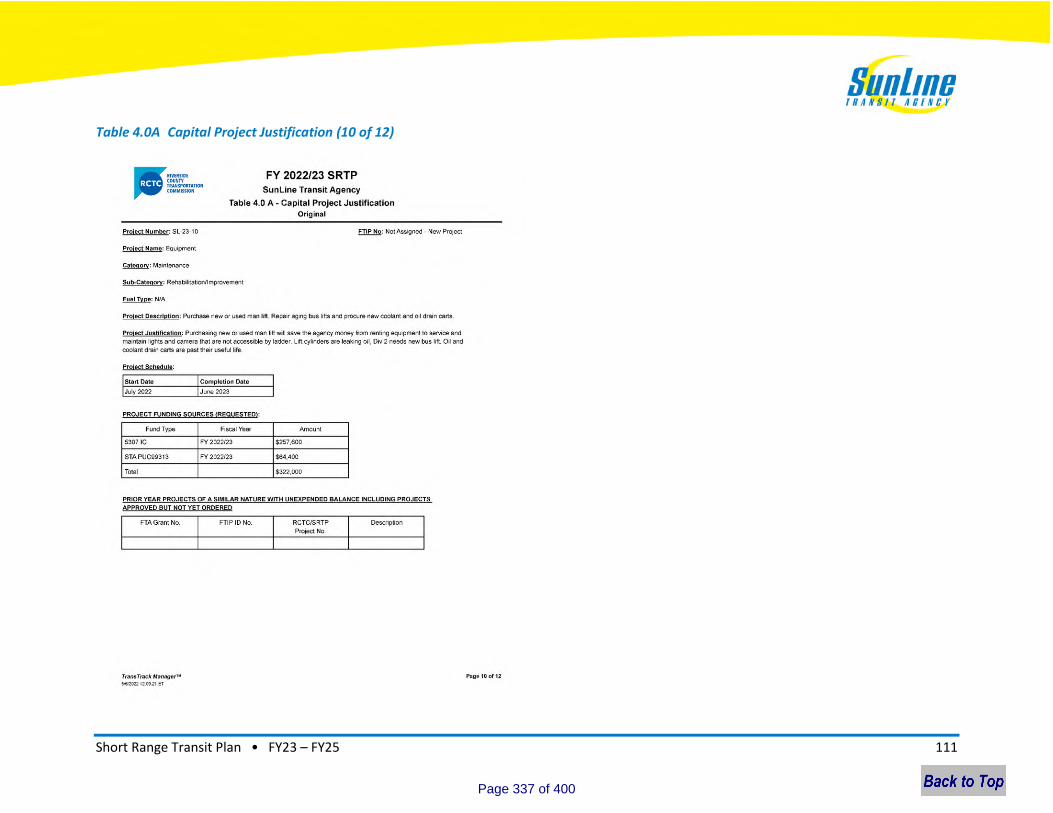
Short Range Transit Plan • FY23 – FY25 111
Table 4.0A Capital Project Justification (10 of 12)
Page 337 of 400

Short Range Transit Plan • FY23 – FY25 112
Table 4.0A Capital Project Justification (11 of 12)
Page 338 of 400
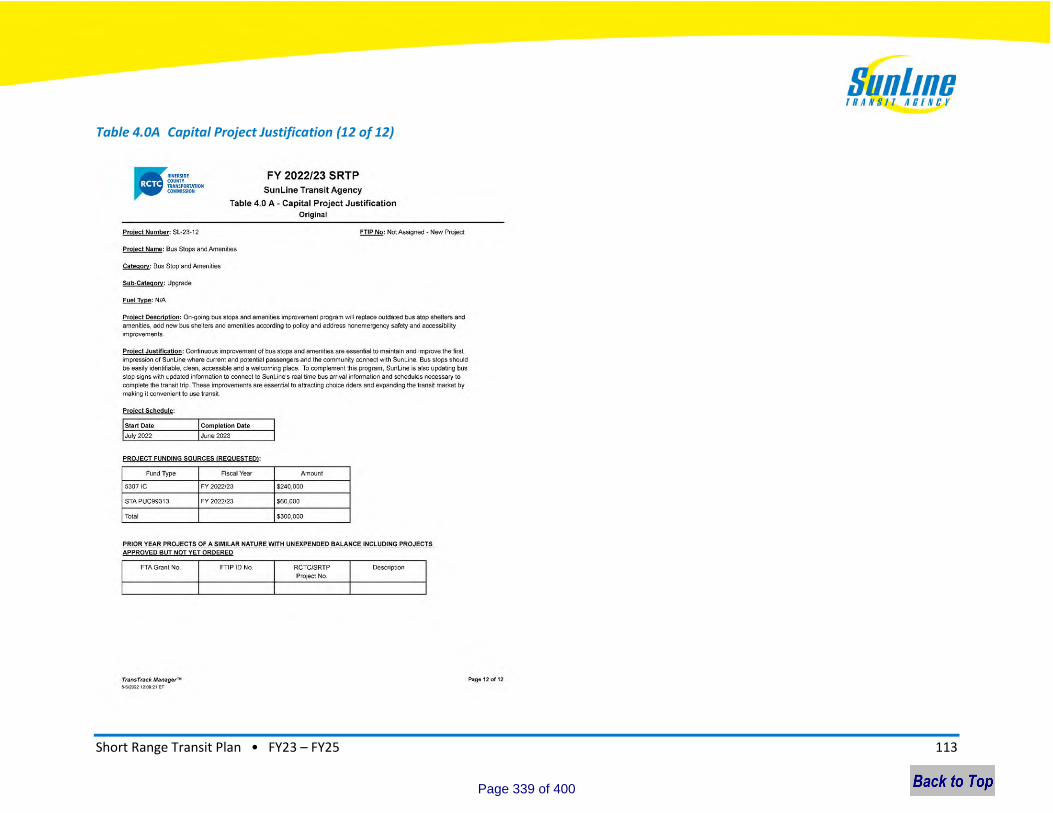
Short Range Transit Plan • FY23 – FY25 113
Table 4.0A Capital Project Justification (12 of 12)
Page 339 of 400
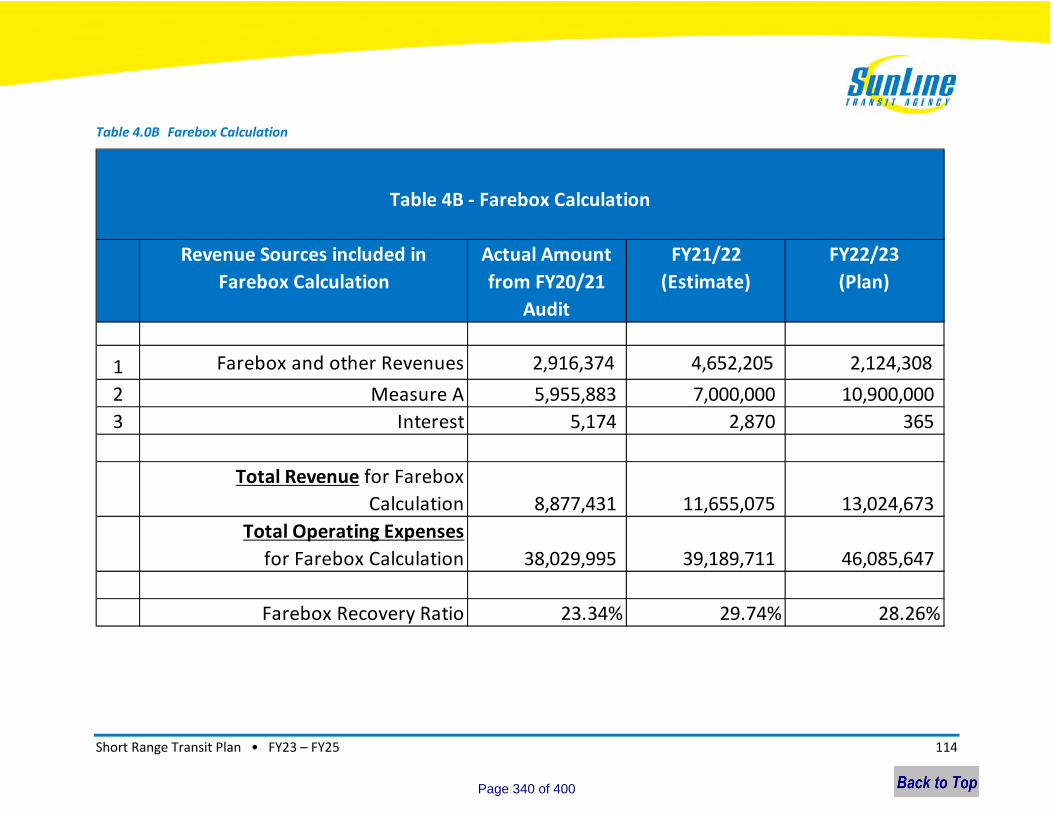
Short Range Transit Plan • FY23 – FY25 114
Table 4.0B Farebox Calculation
Revenue Sources included in
Farebox Calculation
Actual Amount
from FY20/21
Audit
FY21/22
(Estimate)
FY22/23
(Plan)
1 Farebox and other Revenues 2,916,374 4,652,205 2,124,308
2 Measure A 5,955,883 7,000,000 10,900,000
3 Interest 5,174 2,870 365
Total Revenue for Farebox
Calculation 8,877,431 11,655,075 13,024,673
Total Operating Expenses
for Farebox Calculation 38,029,995 39,189,711 46,085,647
Farebox Recovery Ratio 23.34% 29.74% 28.26%
Table 4B - Farebox Calculation
Page 340 of 400
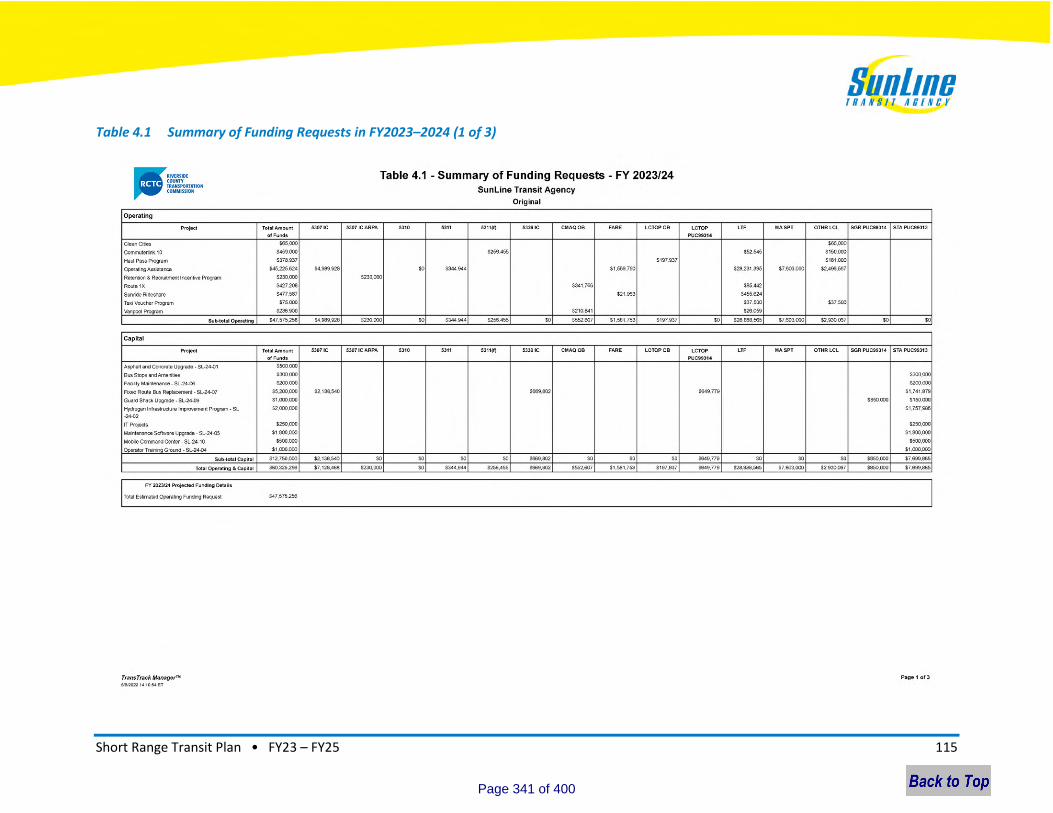
Short Range Transit Plan • FY23 – FY25 115
Table 4.1 Summary of Funding Requests in FY2023–2024 (1 of 3)
Page 341 of 400
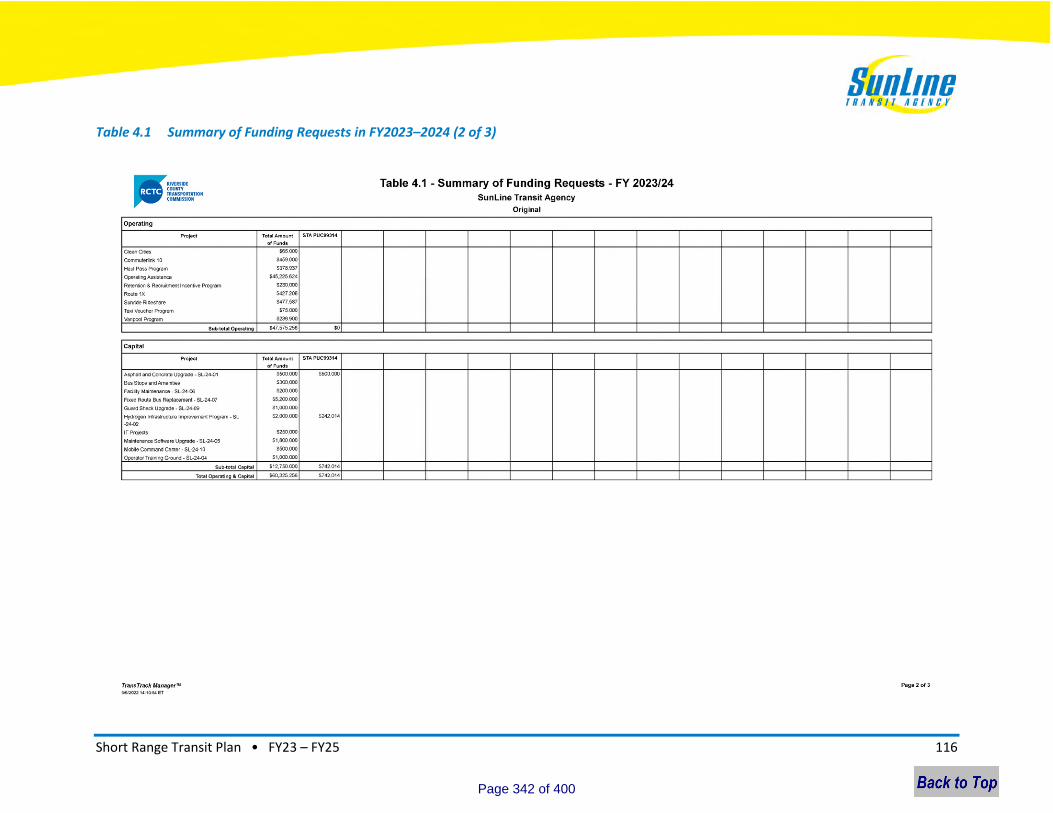
Short Range Transit Plan • FY23 – FY25 116
Table 4.1 Summary of Funding Requests in FY2023–2024 (2 of 3)
Page 342 of 400
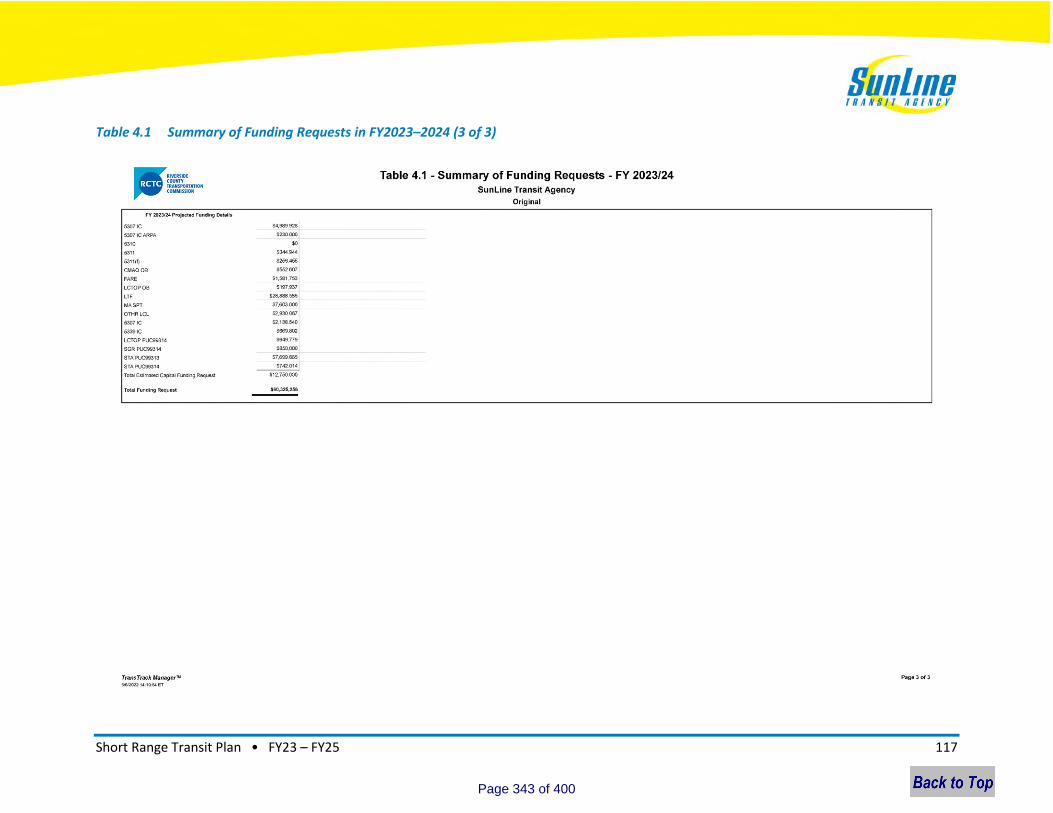
Short Range Transit Plan • FY23 – FY25 117
Table 4.1 Summary of Funding Requests in FY2023–2024 (3 of 3)
Page 343 of 400

Short Range Transit Plan • FY23 – FY25 118
Table 4.2 Summary of Funding Requests in FY2024–2025
Page 344 of 400
Short Range Transit Plan • FY23 – FY25 119
Appendix A: SunLine Existing Route Profiles
Contents
Appendix A: SunLine Existing Route Profiles ............................................................................................ 118
Service Days .......................................................................................................................................... 120
Route Numbers, Headsigns, and General Direction ............................................................................. 121
Span of Service (Level 1) ....................................................................................................................... 122
FY23 Fixed Route Fleet .......................................................................................................................... 123
Route Frequency and Frequency Improvements Required to Get to Level 1 ...................................... 124
Route 1: Coachella – Via Hwy 111 – Palm Springs ................................................................................ 125
Route 2: Desert Hot Springs – Palm Springs – Cathedral City ............................................................... 126
Route 3: Desert Edge – Desert Hot Springs .......................................................................................... 128
Route 4: Palm Desert Mall – Palm Springs ............................................................................................ 129
Route 5: Desert Hot Springs – CSUSB Palm Desert – Palm Desert Mall ............................................... 130
Route 6: Coachella – Via Fred Waring – Palm Desert Mall ................................................................... 132
Route 7: Bermuda Dunes – Indian Wells – La Quinta ........................................................................... 133
Route 8: North Indio – Coachella – Thermal/Mecca............................................................................. 135
Route 9: North Shore – Mecca – Oasis ................................................................................................. 137
Route 10 Commuter Link: Indio – CSUSB (PDC) – CSUSB – San Bernardino Transit Center
(SBTC)/Metrolink ................................................................................................................................... 138
Route 1X: Express to Indio – Express to Palm Springs .......................................................................... 139
School Trippers...................................................................................................................................... 140
Route 200 SB: Palm Springs High School AM Tripper ....................................................................... 141
Route 400 SB: Raymond Cree/Palm Springs High School AM Tripper .............................................. 142
Route 402 NB: Palm Canyon/Stevens AM Tripper ............................................................................ 143
Route 403 NB: Vista Chino/Sunrise PM Tripper................................................................................ 144
Route 500 SB: Palm Desert Mall PM Tripper .................................................................................... 145
Route 501 NB: Palm Desert High School AM Tripper ....................................................................... 146
Route 501 SB: Palm Desert Mall AM Tripper .................................................................................... 147
Route 700 SB: Harris/Washington – Calle Madrid/AVN Vallejo AM Tripper .................................... 148
Route 700 NB: Calle Madrid/Avn Vallejo – Harris/Washington AM Tripper .................................... 149
Route 701 SB: Calle Madrid/Avn Vallejo PM Tripper ........................................................................ 150
Page 345 of 400
Short Range Transit Plan • FY23 – FY25 120
Route 701 NB: Harris/Washington PM Tripper ................................................................................ 151
Route 800 NB: Shadow Hills High School AM Tripper ...................................................................... 152
Route 801 SB: Jackson/44th PM Tripper .......................................................................................... 153
Route 802 SB: Hwy 111/Golf Center Pkwy PM Tripper .................................................................... 154
Route 803 NB: Shadow Hills High School AM Tripper ...................................................................... 155
Page 346 of 400

Short Range Transit Plan • FY23 – FY25 121
Service Days
Wkdy 255
Sat 52
Sun 56
N/S 2
Total 365
Wkdy Sat Sun Wkdy Sat Sun
Jul-22 21 5 5 20 5 6
Aug-22 23 4 4 23 4 4
Sep-22 22 4 4 21 4 5
Oct-22 21 5 5 21 5 5
Nov-22 22 4 4 21 4 4
Dec-22 22 5 4 21 5 4
Jan-23 22 4 5 21 4 6
Feb-23 20 4 4 20 4 4
Mar-23 23 4 4 23 4 4
Apr-23 20 5 5 20 5 5
May-23 23 4 4 22 4 5
Jun-23 22 4 4 22 4 4
Total 261 52 52 255 52 56
Notes:
Sunday schedules operated on five weekdays:
1. Independence Day July 4, 2022
2. Labor Day September 5, 2022
3. Christmas Day December 26, 2022
4. New Year's Day January 2, 2023
5. Memorial Day May 29, 2023
No service (N/S) on Thanksgiving and December 25, 2022
FY22/23 Service Days
FY22/23 Calendar Days FY23 Monthly Service Days
Page 347 of 400
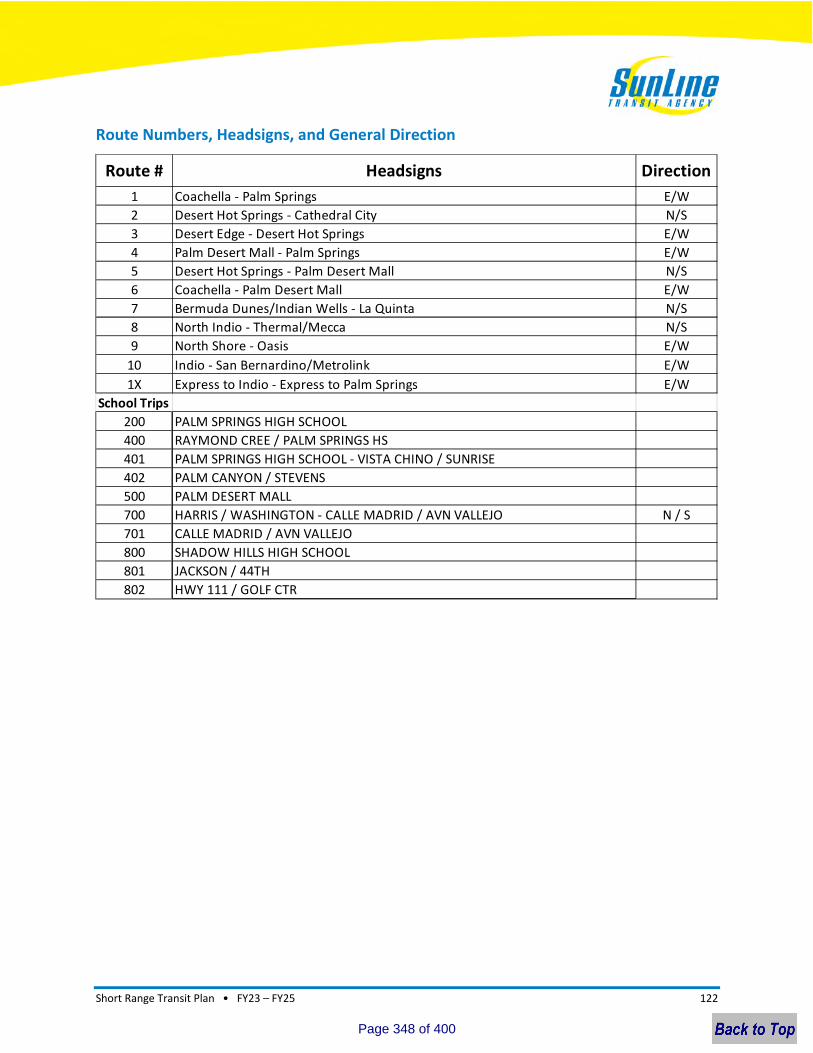
Short Range Transit Plan • FY23 – FY25 122
Route Numbers, Headsigns, and General Direction
Route # Headsigns Direction
1 Coachella - Palm Springs E/W
2 Desert Hot Springs - Cathedral City N/S
3 Desert Edge - Desert Hot Springs E/W
4 Palm Desert Mall - Palm Springs E/W
5 Desert Hot Springs - Palm Desert Mall N/S
6 Coachella - Palm Desert Mall E/W
7 Bermuda Dunes/Indian Wells - La Quinta N/S
8 North Indio - Thermal/Mecca N/S
9 North Shore - Oasis E/W
10 Indio - San Bernardino/Metrolink E/W
1X Express to Indio - Express to Palm Springs E/W
School Trips
200 PALM SPRINGS HIGH SCHOOL
400 RAYMOND CREE / PALM SPRINGS HS
401 PALM SPRINGS HIGH SCHOOL - VISTA CHINO / SUNRISE
402 PALM CANYON / STEVENS
500 PALM DESERT MALL
700 HARRIS / WASHINGTON - CALLE MADRID / AVN VALLEJO N / S
701 CALLE MADRID / AVN VALLEJO
800 SHADOW HILLS HIGH SCHOOL
801 JACKSON / 44TH
802 HWY 111 / GOLF CTR
Page 348 of 400

Short Range Transit Plan • FY23 – FY25 123
Span of Service (Level 1)
Route # Description Direction Start* End** Start* End** Start* End**
1 Coachella - Via Hwy 111 - Palm Springs E/W 5:00:00 AM 11:12:00 PM 5:00:00 AM 11:12:00 PM 5:00:00 AM 11:12:00 PM
2 Desert Hot Springs - Palm Springs - Cathedral City N/S 5:00:00 AM 11:23:00 PM 5:00:00 AM 10:54:00 PM 5:00:00 AM 10:54:00 PM
3 Desert Edge - Desert Hot Springs E/W 5:00:00 AM 8:46:00 PM 6:45:00 AM 8:40:00 PM 6:45:00 AM 8:40:00 PM
4 Palm Desert Mall - Palm Springs E/W 5:00:00 AM 11:13:00 PM 6:10:00 AM 9:50:00 PM 6:10:00 AM 9:50:00 PM
5
Desert Hot Springs - CSUSB Palm Desert - Palm
Desert Mall (AM) N/S 6:10:00 AM 9:00:00 AM
5
Desert Hot Springs - CSUSB Palm Desert - Palm
Desert Mall(PM) N/S 3:00:00 PM 6:51:00 PM
6 Coachella - Via Fred Waring - Palm Desert Mall E/W 5:50:00 AM 8:45:00 PM 6:00:00 AM 9:18:00 PM 6:00:00 AM 9:18:00 PM
7 Bermuda Dunes - Indian Wells - La Quinta N/S 5:15:00 AM 8:51:00 PM 5:10:00 AM 9:20:00 PM 5:10:00 AM 9:20:00 PM
8 North Indio - Coachella -Thermal/Mecca N/S 5:30:00 AM 10:42:00 PM 5:35:00 AM 10:59:00 PM 5:35:00 AM 10:59:00 PM
9 North Shore - Mecca - Oasis E/W 5:45:00 AM 10:34:00 PM 5:40:00 AM 10:29:00 PM 5:40:00 AM 10:29:00 PM
10
Indio - CSUSB-PDC - CSUSB - San Bernardino
Transit Center (SBTC)/Metrolink (AM) E/W 5:20:00 AM 2:00:00 PM
10
Indio - CSUSB-PDC - CSUSB - San Bernardino
Transit Center (SBTC)/Metrolink (PM) E/W 12:50:00 PM 8:00:00 PM
1X Express to Indio - Express to Palm Springs (AM) E/W 5:30:00 AM 11:07:00 AM
1X Express to Indio - Express to Palm Springs (PM) E/W 1:30:00 PM 7:07:00 PM
NS: No Service
* First trip starts
** Last trip ends
Tentative Route 1X service start date: Tuesday, September 6, 2022
NS NS
NS NS
NS NS
NS NS
NS NS
Weekday Saturday Sunday
NS NS
Page 349 of 400
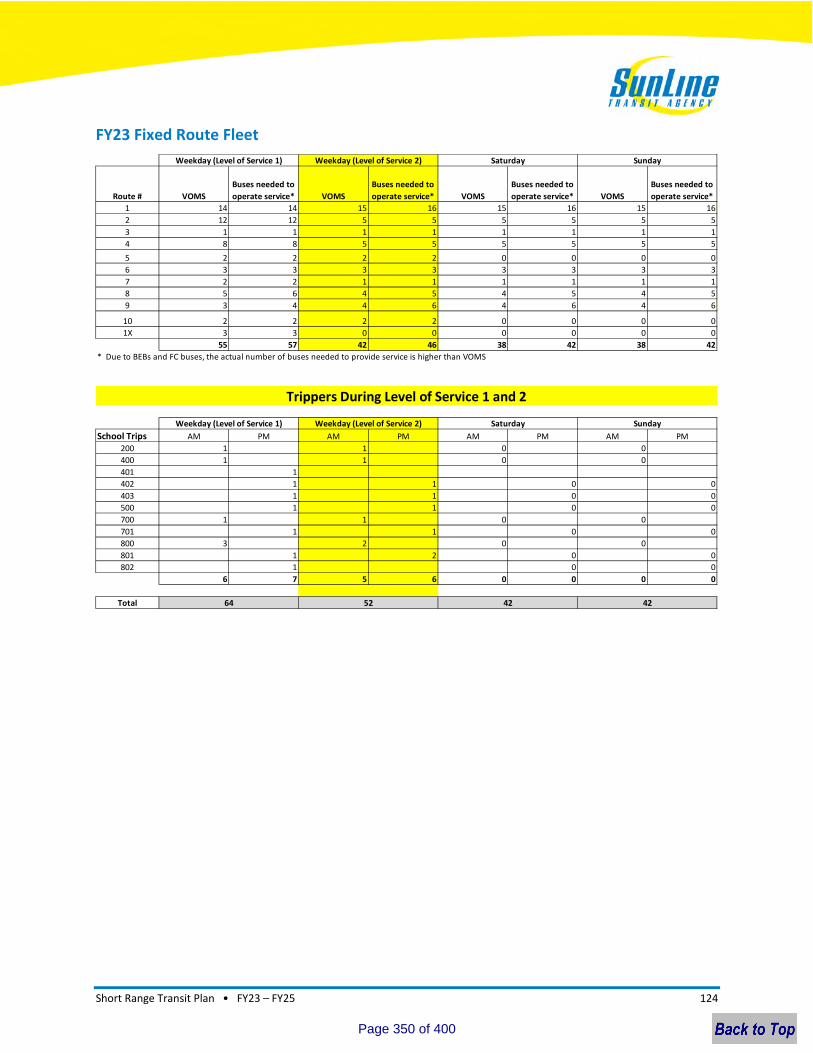
Short Range Transit Plan • FY23 – FY25 124
FY23 Fixed Route Fleet
Route # VOMS
Buses needed to
operate service* VOMS
Buses needed to
operate service* VOMS
Buses needed to
operate service* VOMS
Buses needed to
operate service*
1 14 14 15 16 15 16 15 16
2 12 12 5 5 5 5 5 5
3 1 1 1 1 1 1 1 1
4 8 8 5 5 5 5 5 5
5 2 2 2 2 0 0 0 0
6 3 3 3 3 3 3 3 3
7 2 2 1 1 1 1 1 1
8 5 6 4 5 4 5 4 5
9 3 4 4 6 4 6 4 6
10 2 2 2 2 0 0 0 0
1X 3 3 0 0 0 0 0 0
55 57 42 46 38 42 38 42
* Due to BEBs and FC buses, the actual number of buses needed to provide service is higher than VOMS
School Trips AM PM AM PM AM PM AM PM
200 1 1 0 0
400 1 1 0 0
401 1
402 1 1 0 0
403 1 1 0 0
500 1 1 0 0
700 1 1 0 0
701 1 1 0 0
800 3 2 0 0
801 1 2 0 0
802 1 0 0
6 7 5 6 0 0 0 0
Total
Weekday (Level of Service 1) Saturday SundayWeekday (Level of Service 2)
64 52 42 42
Weekday (Level of Service 1) Saturday Sunday
Trippers During Level of Service 1 and 2
Weekday (Level of Service 2)
Page 350 of 400
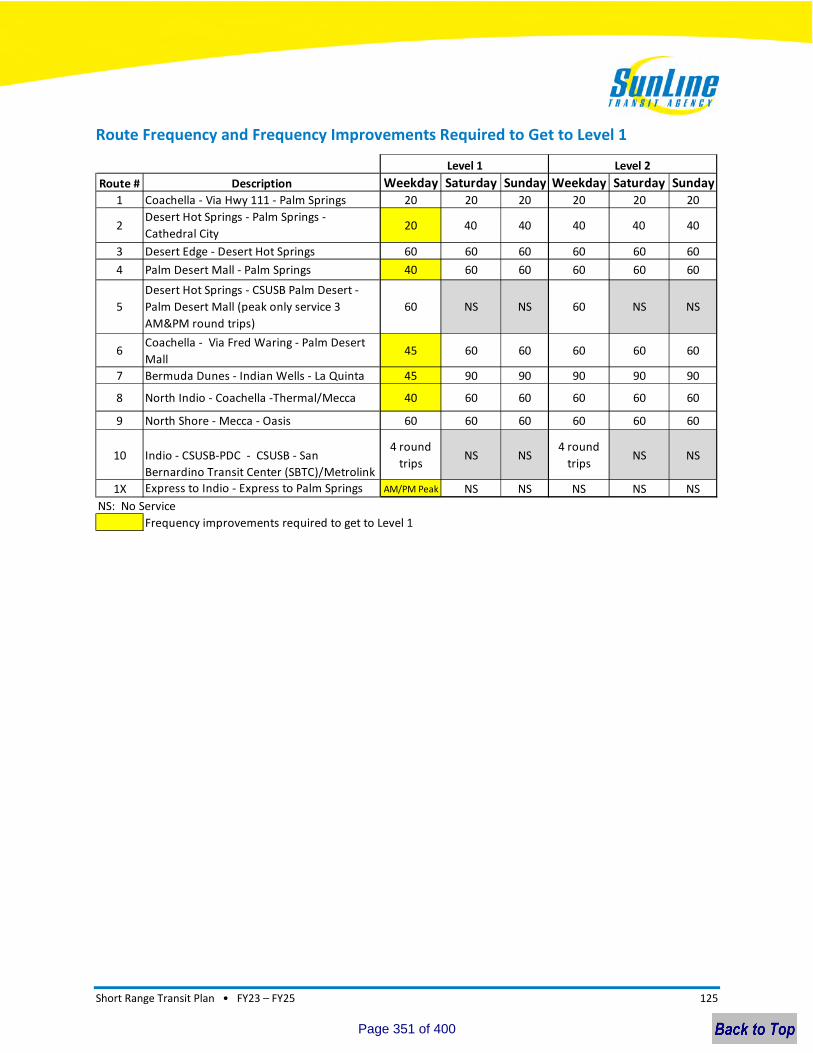
Short Range Transit Plan • FY23 – FY25 125
Route Frequency and Frequency Improvements Required to Get to Level 1
Route # Description Weekday Saturday Sunday Weekday Saturday Sunday1 Coachella - Via Hwy 111 - Palm Springs 20 20 20 20 20 20
3 Desert Edge - Desert Hot Springs 60 60 60 60 60 60
6Coachella - Via Fred Waring - Palm Desert
Mall45 60 60 60 60 60
7 Bermuda Dunes - Indian Wells - La Quinta 45 90 90 90 90 90
10 Indio - CSUSB-PDC - CSUSB - San
Bernardino Transit Center (SBTC)/Metrolink
4 round
tripsNS NS
4 round
tripsNS NS
1X Express to Indio - Express to Palm Springs AM/PM Peak NS NS NS NS NS
NS: No Service
Frequency improvements required to get to Level 1
60 60 609 North Shore - Mecca - Oasis 60 60 60
8 North Indio - Coachella -Thermal/Mecca 40 60 60 60 60 60
5
Desert Hot Springs - CSUSB Palm Desert -
Palm Desert Mall (peak only service 3
AM&PM round trips)
60 NS NS 60 NS NS
4 Palm Desert Mall - Palm Springs 40 60 60 60 60 60
Level 1 Level 2
40 40 40 402Desert Hot Springs - Palm Springs -
Cathedral City20 40
Page 351 of 400
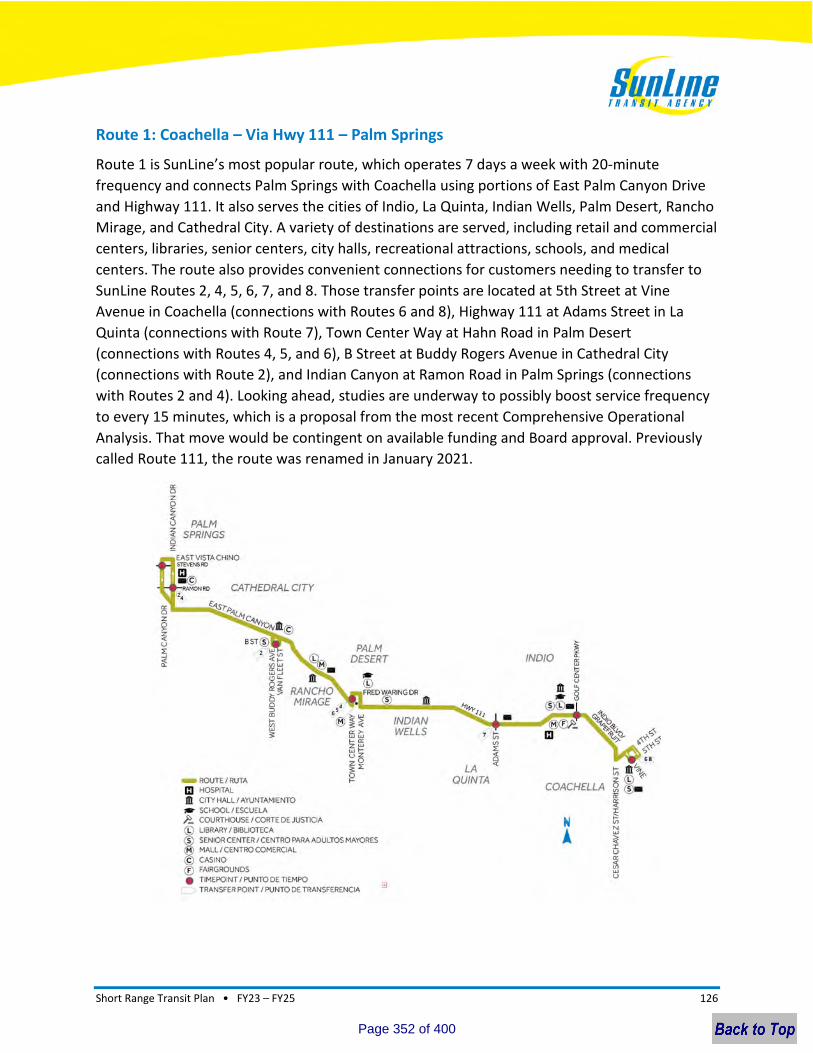
Short Range Transit Plan • FY23 – FY25 126
Route 1: Coachella – Via Hwy 111 – Palm Springs
Route 1 is SunLine’s most popular route, which operates 7 days a week with 20-minute
frequency and connects Palm Springs with Coachella using portions of East Palm Canyon Drive
and Highway 111. It also serves the cities of Indio, La Quinta, Indian Wells, Palm Desert, Rancho
Mirage, and Cathedral City. A variety of destinations are served, including retail and commercial
centers, libraries, senior centers, city halls, recreational attractions, schools, and medical
centers. The route also provides convenient connections for customers needing to transfer to
SunLine Routes 2, 4, 5, 6, 7, and 8. Those transfer points are located at 5th Street at Vine
Avenue in Coachella (connections with Routes 6 and 8), Highway 111 at Adams Street in La
Quinta (connections with Route 7), Town Center Way at Hahn Road in Palm Desert
(connections with Routes 4, 5, and 6), B Street at Buddy Rogers Avenue in Cathedral City
(connections with Route 2), and Indian Canyon at Ramon Road in Palm Springs (connections
with Routes 2 and 4). Looking ahead, studies are underway to possibly boost service frequency
to every 15 minutes, which is a proposal from the most recent Comprehensive Operational
Analysis. That move would be contingent on available funding and Board approval. Previously
called Route 111, the route was renamed in January 2021.
Page 352 of 400
Short Range Transit Plan • FY23 – FY25 127
Route 2: Desert Hot Springs – Palm Springs – Cathedral City
Route 2 is one of SunLine’s higher-performing routes and operates 7 days a week with 20-
minute frequency. It connects Desert Hot Springs with Palm Springs and Cathedral City.
A variety of destinations are served, including retail and commercial centers, libraries, senior
centers, city halls, recreational attractions, schools, medical centers, and Palm Springs
International Airport. A significant portion of Route 2 ridership is driven by customers living in
Desert Hot Springs who work in downtown Palm Springs. The route also provides convenient
connections for customers needing to transfer to SunLine Routes 1, 3, 4, and 5. Those transfer
points are located at B Street at Buddy Rogers Avenue in Cathedral City (connection with
Route 1), Ramon Road at Date Palm Drive in Cathedral City (connection with Route 4), Indian
Canyon Drive at Ramon Road in Palm Springs (connections with Routes 1 and 4), Sunrise Way at
Vista Chino in Palm Springs (connection with Route 4), and West Drive at Pierson Boulevard in
Desert Hot Springs (connections with Routes 3 and 5). Looking ahead, studies are underway to
possibly boost service frequency to every 15 minutes, which is a proposal from the most recent
Comprehensive Operational Analysis. That move would be contingent on available funding and
Board approval. Route 2 was combined from the previous Routes 14 and 30 and renamed in
January 2021.
Page 353 of 400
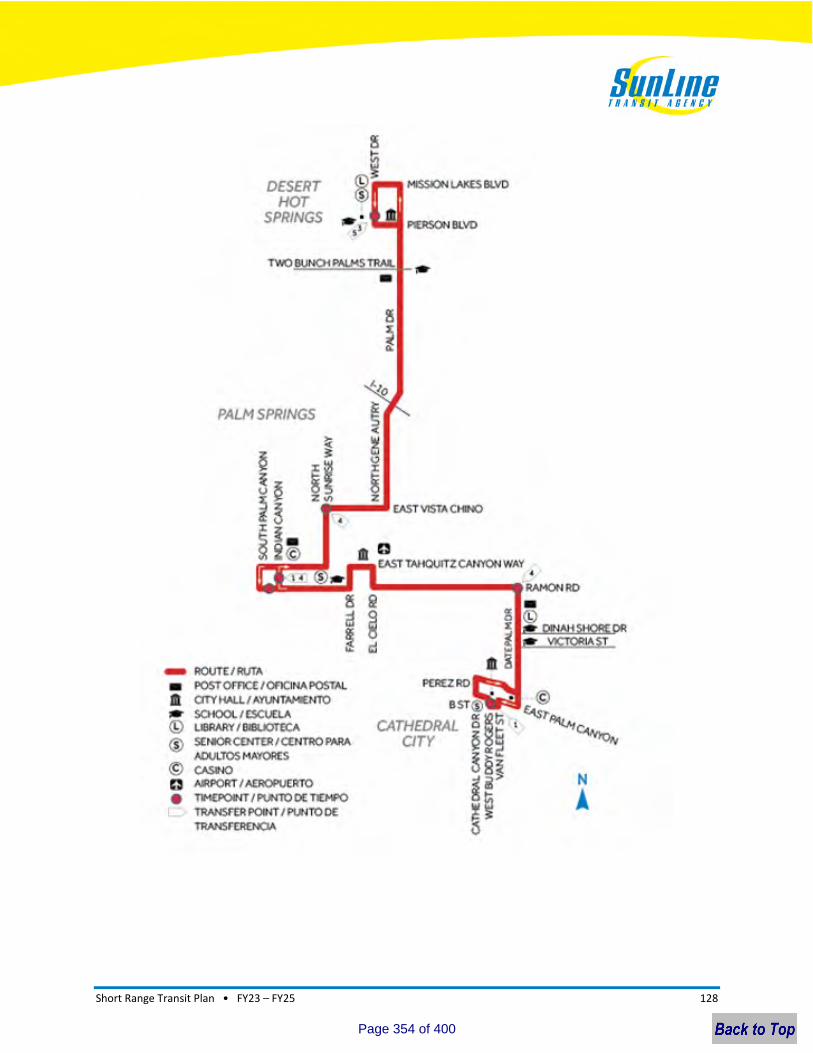
Short Range Transit Plan • FY23 – FY25 128
Page 354 of 400
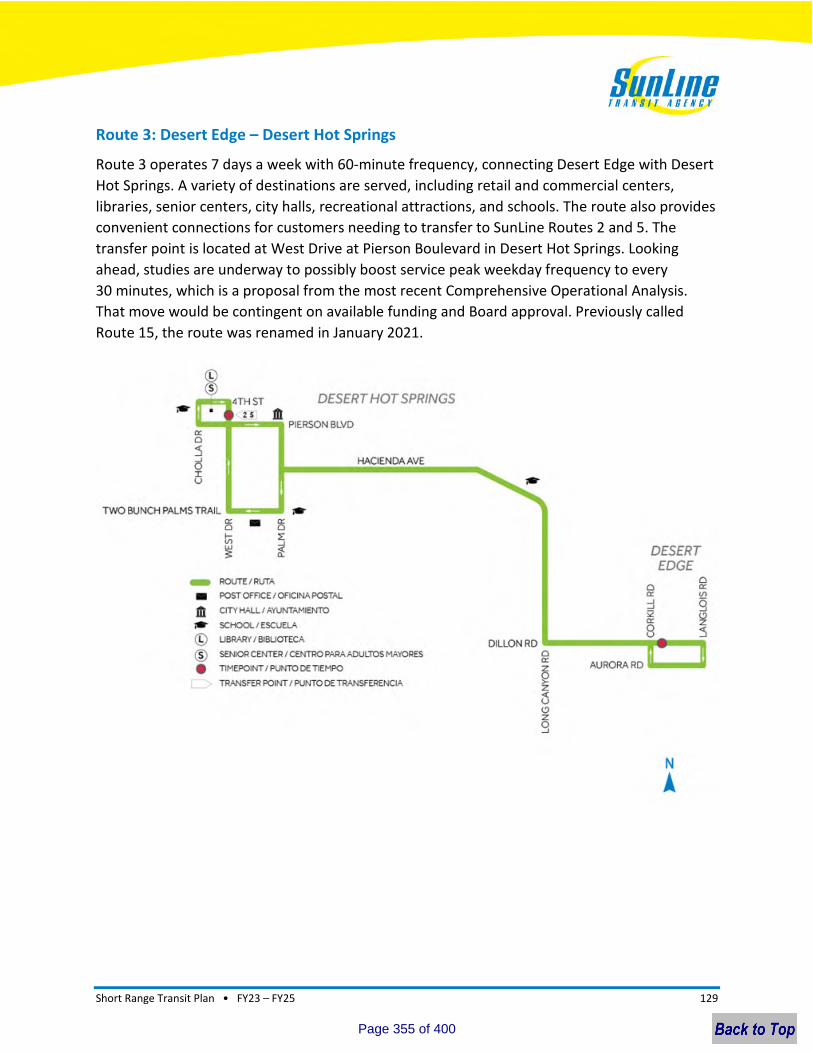
Short Range Transit Plan • FY23 – FY25 129
Route 3: Desert Edge – Desert Hot Springs
Route 3 operates 7 days a week with 60-minute frequency, connecting Desert Edge with Desert
Hot Springs. A variety of destinations are served, including retail and commercial centers,
libraries, senior centers, city halls, recreational attractions, and schools. The route also provides
convenient connections for customers needing to transfer to SunLine Routes 2 and 5. The
transfer point is located at West Drive at Pierson Boulevard in Desert Hot Springs. Looking
ahead, studies are underway to possibly boost service peak weekday frequency to every
30 minutes, which is a proposal from the most recent Comprehensive Operational Analysis.
That move would be contingent on available funding and Board approval. Previously called
Route 15, the route was renamed in January 2021.
Page 355 of 400
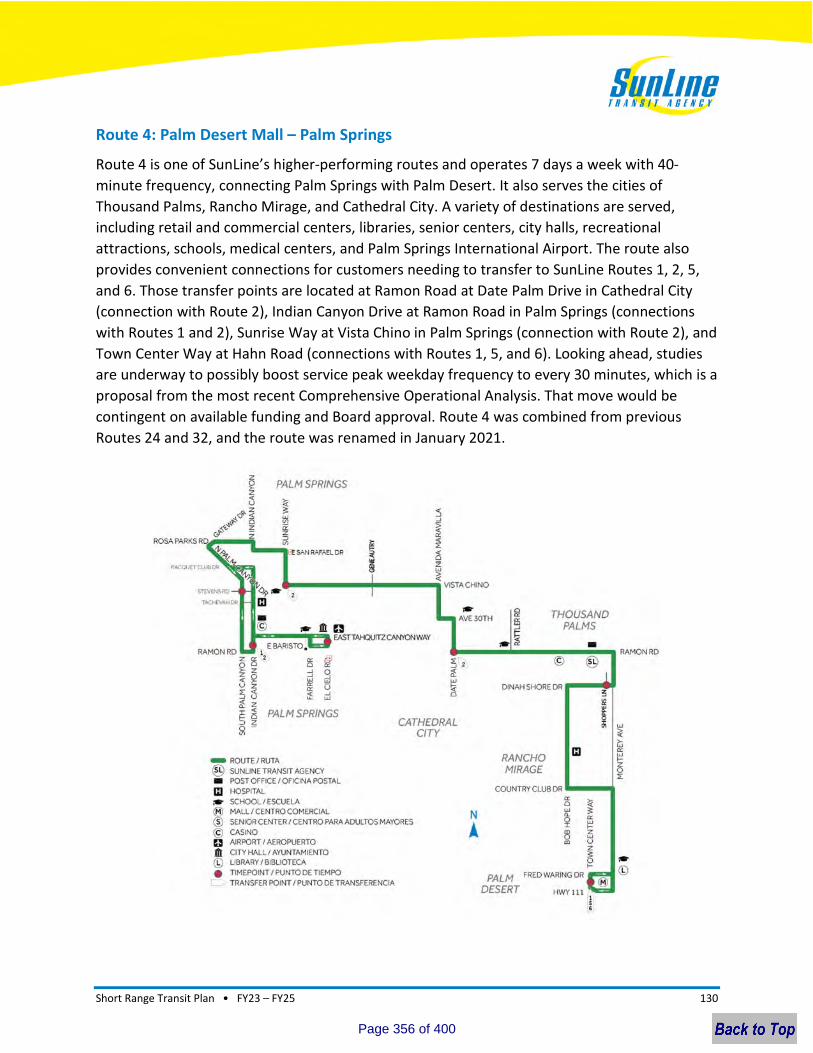
Short Range Transit Plan • FY23 – FY25 130
Route 4: Palm Desert Mall – Palm Springs
Route 4 is one of SunLine’s higher-performing routes and operates 7 days a week with 40-
minute frequency, connecting Palm Springs with Palm Desert. It also serves the cities of
Thousand Palms, Rancho Mirage, and Cathedral City. A variety of destinations are served,
including retail and commercial centers, libraries, senior centers, city halls, recreational
attractions, schools, medical centers, and Palm Springs International Airport. The route also
provides convenient connections for customers needing to transfer to SunLine Routes 1, 2, 5,
and 6. Those transfer points are located at Ramon Road at Date Palm Drive in Cathedral City
(connection with Route 2), Indian Canyon Drive at Ramon Road in Palm Springs (connections
with Routes 1 and 2), Sunrise Way at Vista Chino in Palm Springs (connection with Route 2), and
Town Center Way at Hahn Road (connections with Routes 1, 5, and 6). Looking ahead, studies
are underway to possibly boost service peak weekday frequency to every 30 minutes, which is a
proposal from the most recent Comprehensive Operational Analysis. That move would be
contingent on available funding and Board approval. Route 4 was combined from previous
Routes 24 and 32, and the route was renamed in January 2021.
Page 356 of 400
Short Range Transit Plan • FY23 – FY25 131
Route 5: Desert Hot Springs – CSUSB Palm Desert – Palm Desert Mall
Route 5 operates 5 days a week with 60-minute frequency, connecting Desert Hot Springs with
Palm Desert using a portion of the Interstate 10 freeway. A variety of destinations are served,
including retail and commercial centers, libraries, senior centers, city halls, recreational
attractions, and schools. The route also provides convenient connections for customers needing
to transfer to SunLine Routes 1, 2, 3, 4, and 6. The transfer points are located at West Drive at
Pierson Boulevard in Desert Hot Springs (connections with Routes 2 and 3) and Town Center
Way at Hahn Road in Palm Desert (connections with Routes 1, 4, and 6). Looking ahead, studies
are underway to possibly boost service frequency to every 40 minutes, which is a proposal from
the most recent Comprehensive Operational Analysis. That move would be contingent on
available funding and Board approval. Route 5 was combined from the previous Routes 20
and 21 and was renamed in January 2021.
Page 357 of 400
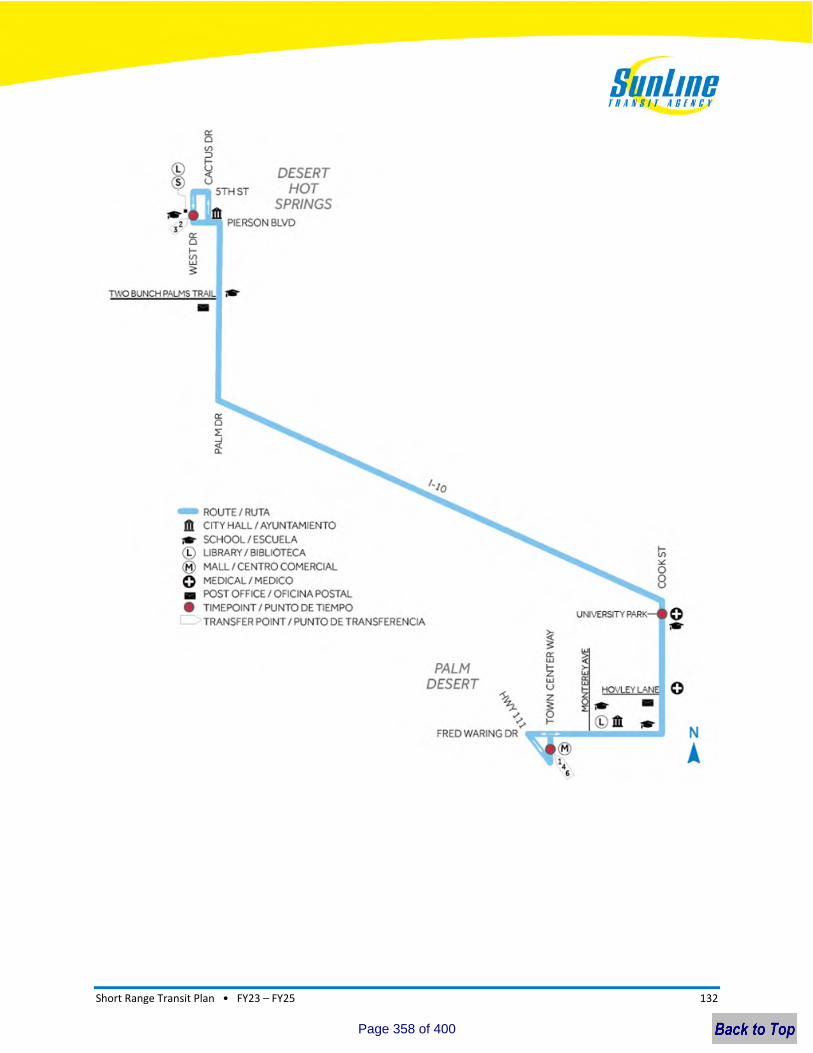
Short Range Transit Plan • FY23 – FY25 132
Page 358 of 400
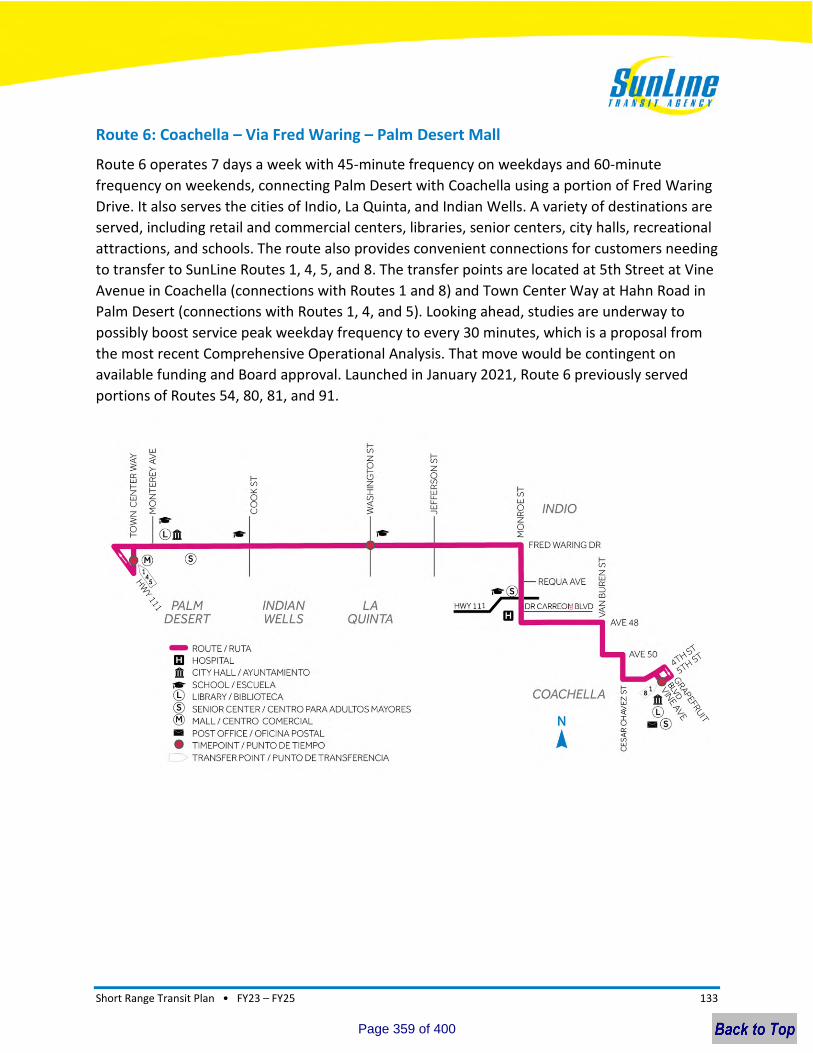
Short Range Transit Plan • FY23 – FY25 133
Route 6: Coachella – Via Fred Waring – Palm Desert Mall
Route 6 operates 7 days a week with 45-minute frequency on weekdays and 60-minute
frequency on weekends, connecting Palm Desert with Coachella using a portion of Fred Waring
Drive. It also serves the cities of Indio, La Quinta, and Indian Wells. A variety of destinations are
served, including retail and commercial centers, libraries, senior centers, city halls, recreational
attractions, and schools. The route also provides convenient connections for customers needing
to transfer to SunLine Routes 1, 4, 5, and 8. The transfer points are located at 5th Street at Vine
Avenue in Coachella (connections with Routes 1 and 8) and Town Center Way at Hahn Road in
Palm Desert (connections with Routes 1, 4, and 5). Looking ahead, studies are underway to
possibly boost service peak weekday frequency to every 30 minutes, which is a proposal from
the most recent Comprehensive Operational Analysis. That move would be contingent on
available funding and Board approval. Launched in January 2021, Route 6 previously served
portions of Routes 54, 80, 81, and 91.
Page 359 of 400

Short Range Transit Plan • FY23 – FY25 134
Route 7: Bermuda Dunes – Indian Wells – La Quinta
Route 7 operates 7 days a week with 45-minute frequency on weekdays and 1-hour, 45-minute
frequency on weekends, connecting Bermuda Dunes with La Quinta. A variety of destinations
are served, including retail and commercial centers, libraries, senior centers, city halls,
recreational attractions, and schools. The route also provides a convenient connection for
customers needing to transfer to SunLine’s Route 1. The transfer point is located at
Highway 111 at Adams Street in La Quinta. Looking ahead, studies are underway to possibly
boost the peak weekday service frequency to every 30 minutes, which is a proposal from the
most recent Comprehensive Operational Analysis. That move would be contingent on available
funding and Board approval. Previously called Route 70, the route was renamed in
January 2021.
Page 360 of 400
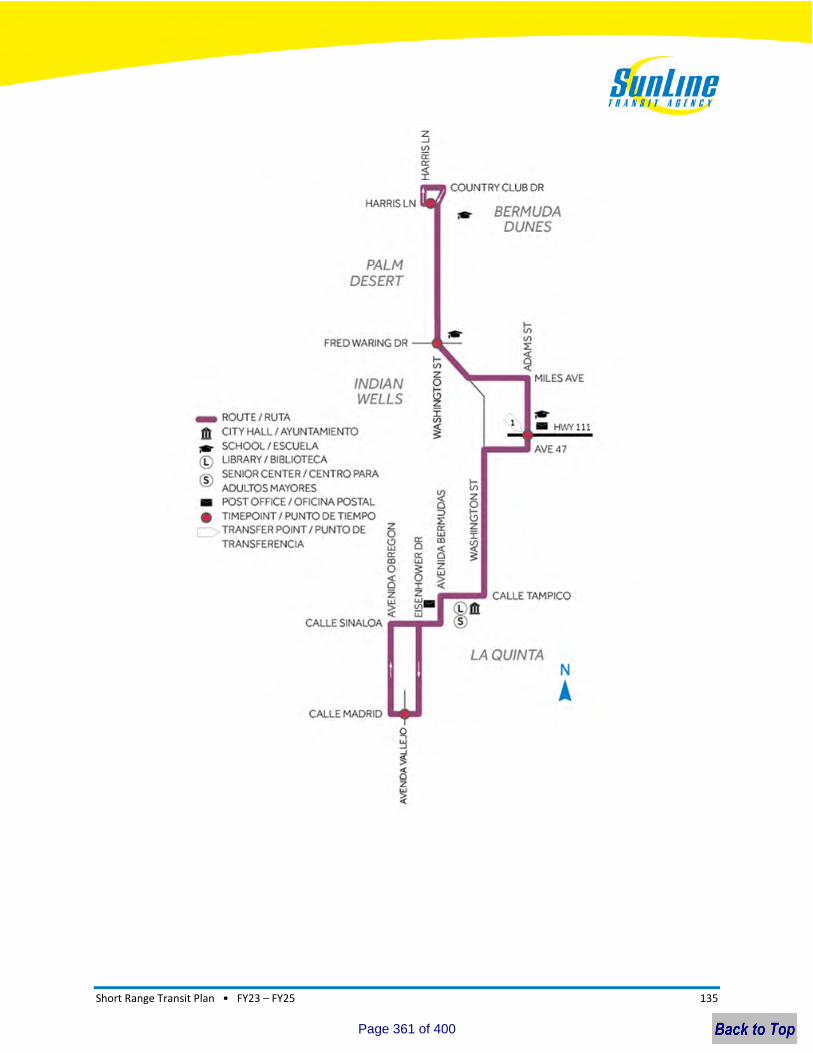
Short Range Transit Plan • FY23 – FY25 135
Page 361 of 400
Short Range Transit Plan • FY23 – FY25 136
Route 8: North Indio – Coachella – Thermal/Mecca
Route 8 is one of SunLine’s critical routes linking the unincorporated part of the eastern
Coachella Valley to the rest of SunLine’s network. The route, which operates 7 days a week with
40-minute frequency on weekdays and 60-minute frequency on weekends, connects Indio with
Thermal/Mecca and also serves the city of Coachella. A variety of destinations are served,
including retail and commercial centers, libraries, senior centers, city halls, recreational
attractions, schools, and medical centers. The route also provides convenient connections for
customers needing to transfer to SunLine Routes 1, 6, and 9. Those transfer points are located
at Avenue 66 at Mecca Health Clinic in Mecca (connection to Route 9) and 5th Street and Vine
Avenue in Coachella (connection to Routes 1 and 6). Route 8 was combined from the previous
Routes 80, 81, 90, and 91 and was renamed in January 2021.
Page 362 of 400
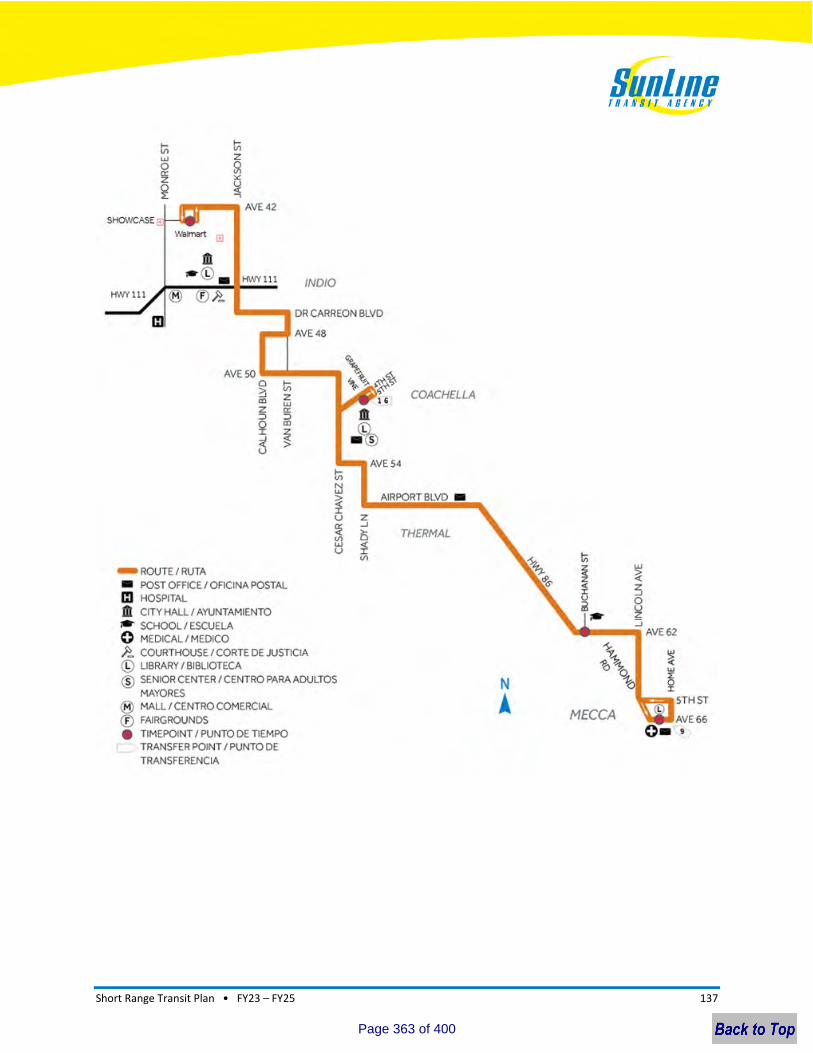
Short Range Transit Plan • FY23 – FY25 137
Page 363 of 400
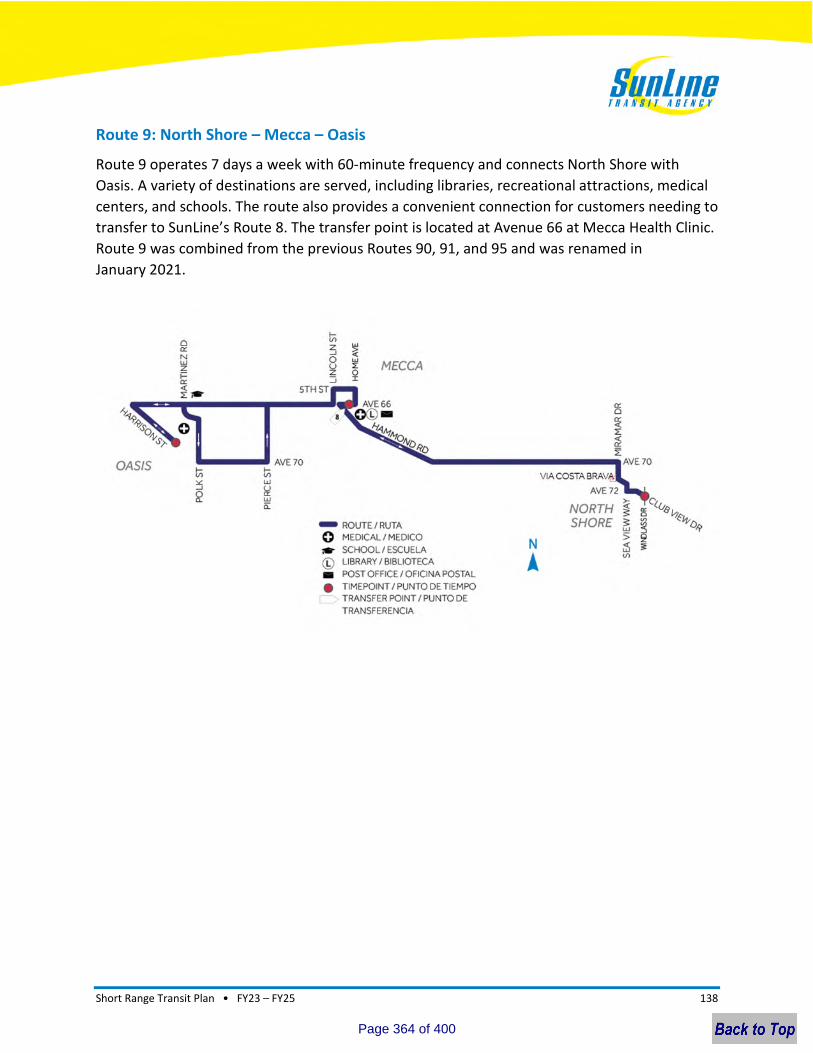
Short Range Transit Plan • FY23 – FY25 138
Route 9: North Shore – Mecca – Oasis
Route 9 operates 7 days a week with 60-minute frequency and connects North Shore with
Oasis. A variety of destinations are served, including libraries, recreational attractions, medical
centers, and schools. The route also provides a convenient connection for customers needing to
transfer to SunLine’s Route 8. The transfer point is located at Avenue 66 at Mecca Health Clinic.
Route 9 was combined from the previous Routes 90, 91, and 95 and was renamed in
January 2021.
Page 364 of 400
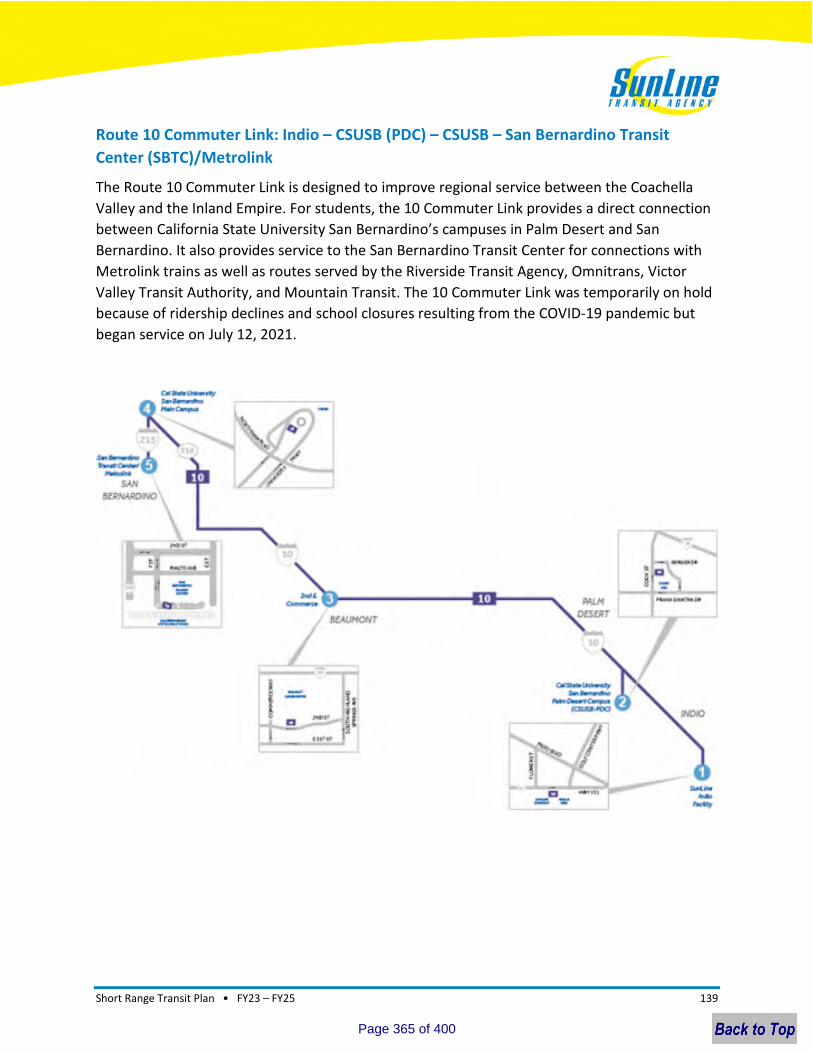
Short Range Transit Plan • FY23 – FY25 139
Route 10 Commuter Link: Indio – CSUSB (PDC) – CSUSB – San Bernardino Transit
Center (SBTC)/Metrolink
The Route 10 Commuter Link is designed to improve regional service between the Coachella
Valley and the Inland Empire. For students, the 10 Commuter Link provides a direct connection
between California State University San Bernardino’s campuses in Palm Desert and San
Bernardino. It also provides service to the San Bernardino Transit Center for connections with
Metrolink trains as well as routes served by the Riverside Transit Agency, Omnitrans, Victor
Valley Transit Authority, and Mountain Transit. The 10 Commuter Link was temporarily on hold
because of ridership declines and school closures resulting from the COVID-19 pandemic but
began service on July 12, 2021.
Page 365 of 400
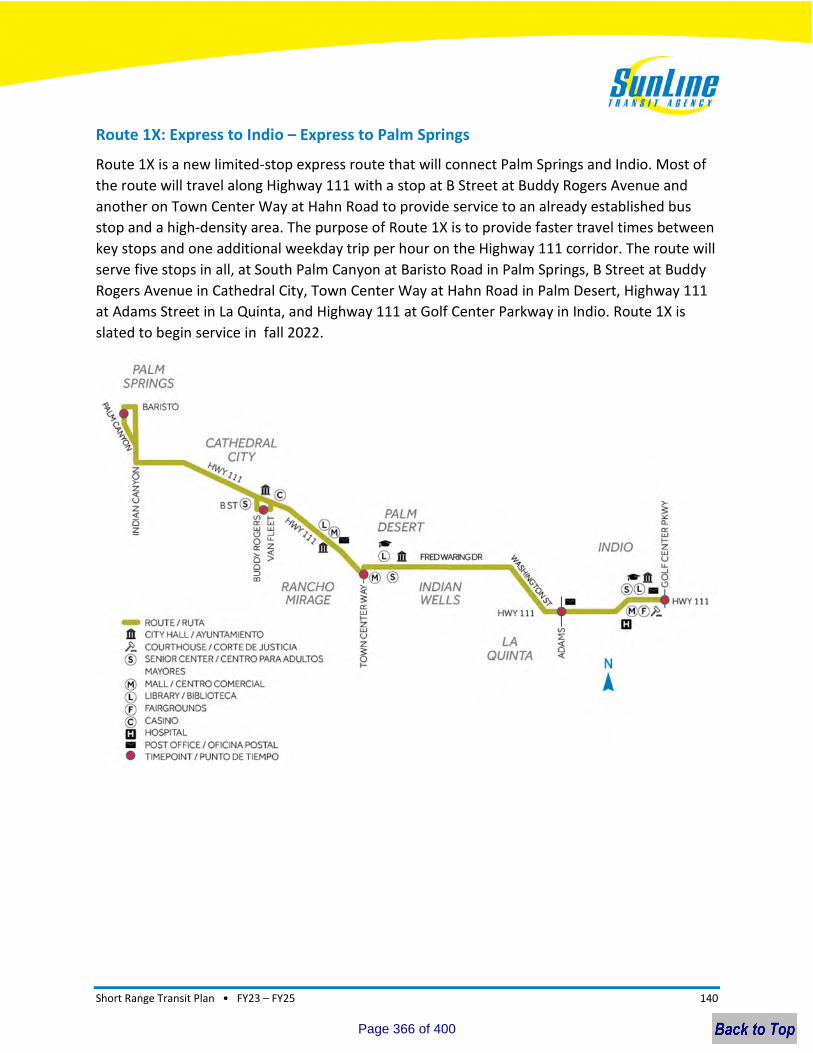
Short Range Transit Plan • FY23 – FY25 140
Route 1X: Express to Indio – Express to Palm Springs
Route 1X is a new limited-stop express route that will connect Palm Springs and Indio. Most of
the route will travel along Highway 111 with a stop at B Street at Buddy Rogers Avenue and
another on Town Center Way at Hahn Road to provide service to an already established bus
stop and a high-density area. The purpose of Route 1X is to provide faster travel times between
key stops and one additional weekday trip per hour on the Highway 111 corridor. The route will
serve five stops in all, at South Palm Canyon at Baristo Road in Palm Springs, B Street at Buddy
Rogers Avenue in Cathedral City, Town Center Way at Hahn Road in Palm Desert, Highway 111
at Adams Street in La Quinta, and Highway 111 at Golf Center Parkway in Indio. Route 1X is
slated to begin service in fall 2022.
Page 366 of 400
Short Range Transit Plan • FY23 – FY25 141
School Trippers
School tripper buses are traditionally added to regular routes when service reaches capacity or special
alignments/deviations are created to address a specific demand for service. These buses are open to
both students and members of the public. Rider information related to these routes must be shared
with the general public. SunLine is currently serving Desert Sands Unified School District campuses and
will begin serving Palm Springs Unified School District campuses when in-person learning resumes.
School tripper service is a limited-stop service that operates on the schedules shown on the following
maps. Tripper routes were renamed in January 2021 as a part of the SunLine Refueled Initiative.
Page 367 of 400
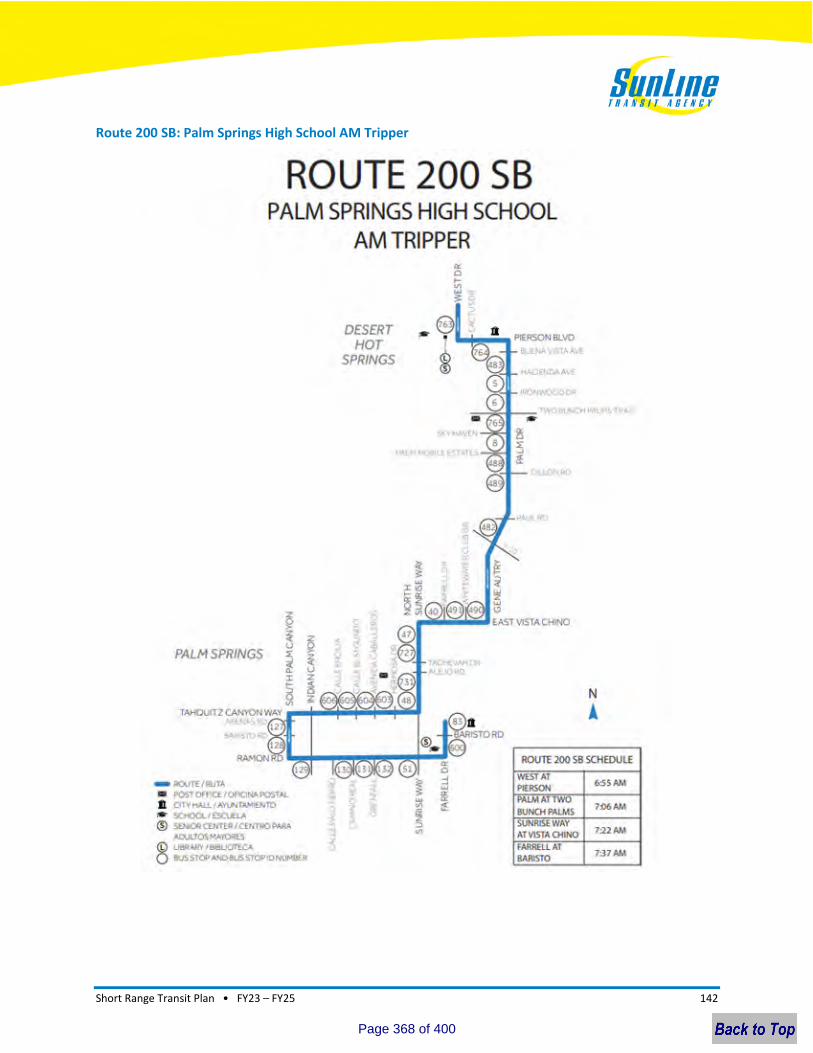
Short Range Transit Plan • FY23 – FY25 142
Route 200 SB: Palm Springs High School AM Tripper
Page 368 of 400
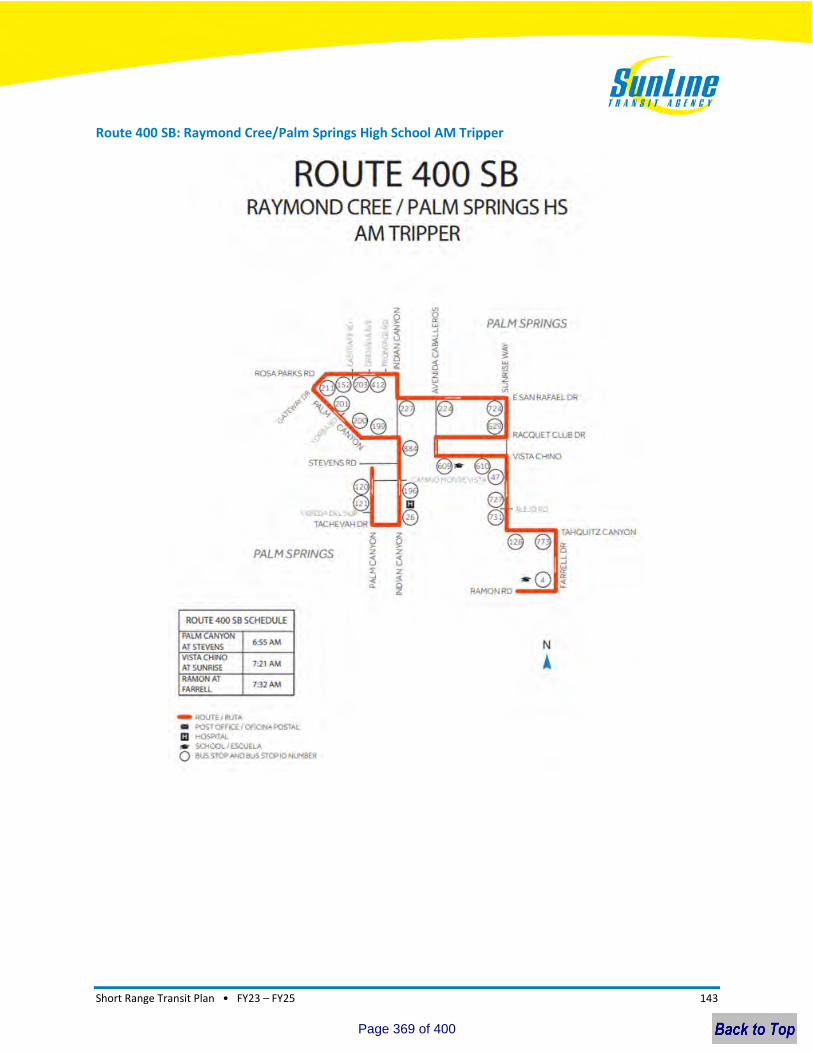
Short Range Transit Plan • FY23 – FY25 143
Route 400 SB: Raymond Cree/Palm Springs High School AM Tripper
Page 369 of 400
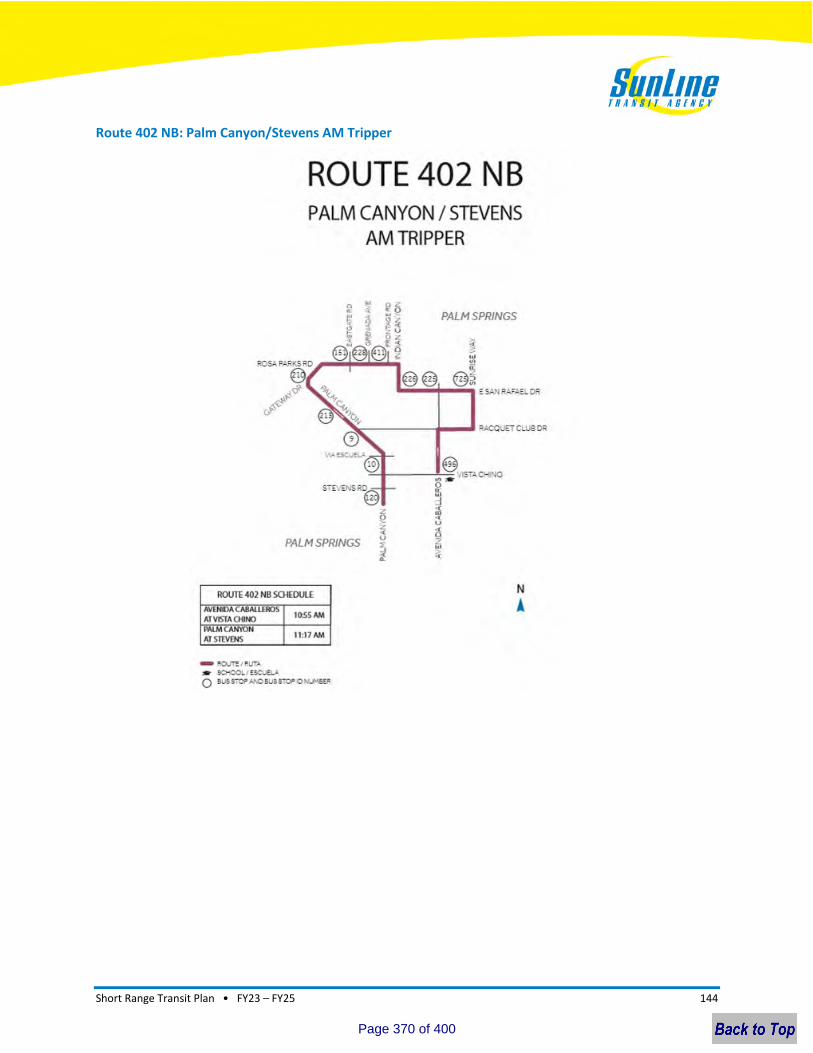
Short Range Transit Plan • FY23 – FY25 144
Route 402 NB: Palm Canyon/Stevens AM Tripper
Page 370 of 400
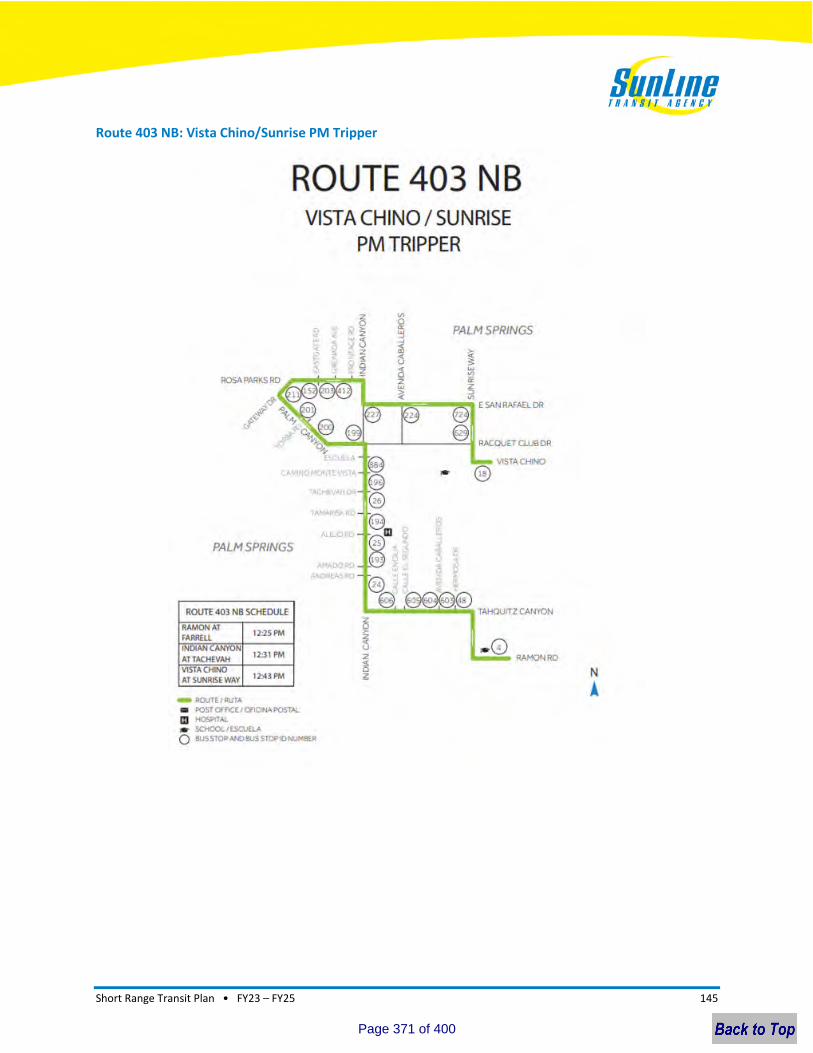
Short Range Transit Plan • FY23 – FY25 145
Route 403 NB: Vista Chino/Sunrise PM Tripper
Page 371 of 400

Short Range Transit Plan • FY23 – FY25 146
Route 500 SB: Palm Desert Mall PM Tripper
Page 372 of 400
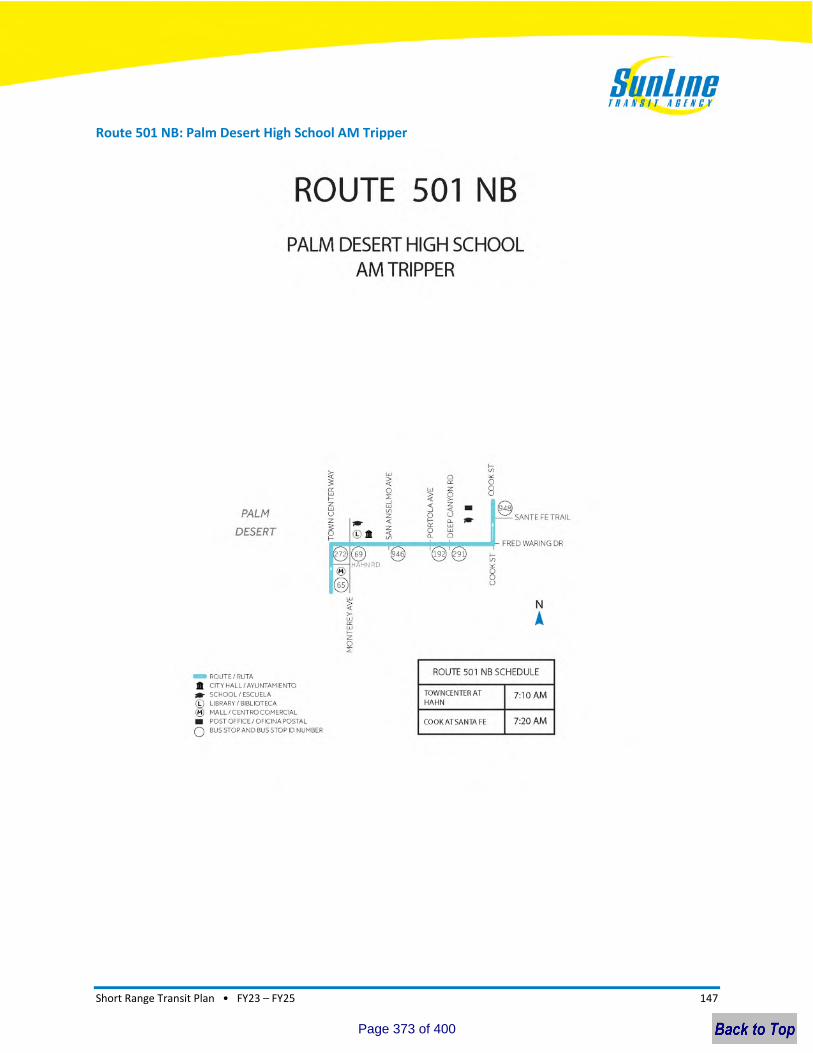
Short Range Transit Plan • FY23 – FY25 147
Route 501 NB: Palm Desert High School AM Tripper
Page 373 of 400

Short Range Transit Plan • FY23 – FY25 148
Route 501 SB: Palm Desert Mall AM Tripper
Page 374 of 400
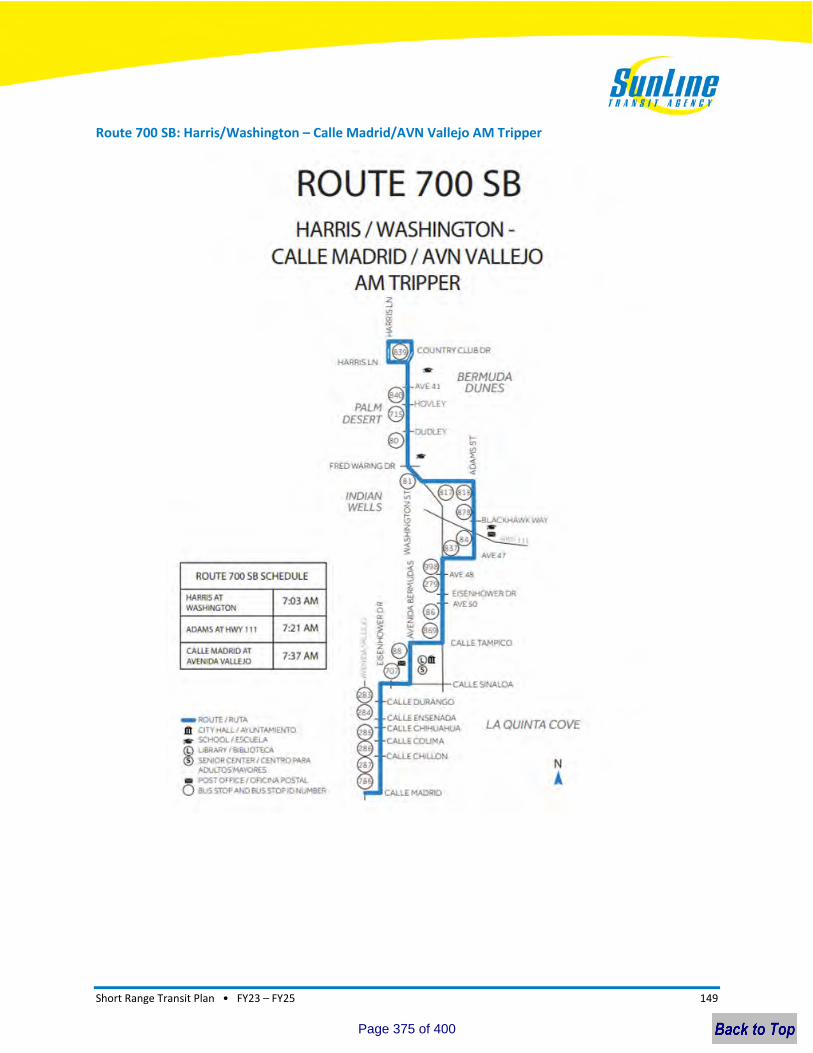
Short Range Transit Plan • FY23 – FY25 149
Route 700 SB: Harris/Washington – Calle Madrid/AVN Vallejo AM Tripper
Page 375 of 400
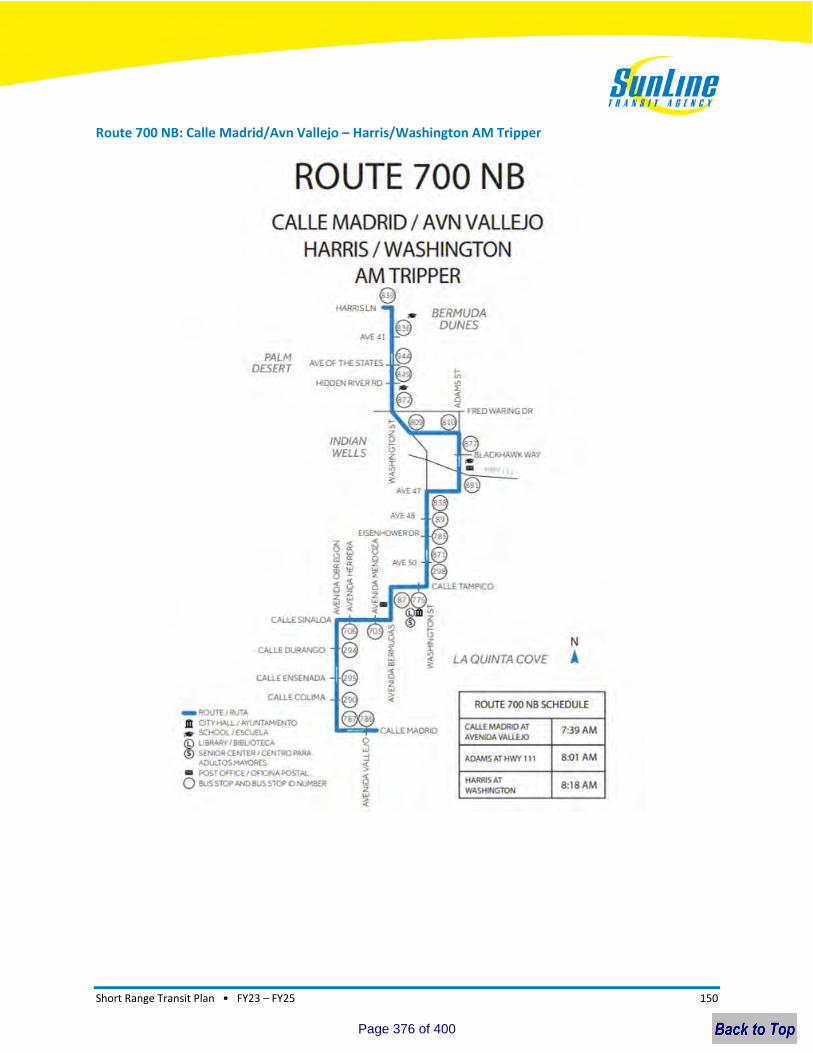
Short Range Transit Plan • FY23 – FY25 150
Route 700 NB: Calle Madrid/Avn Vallejo – Harris/Washington AM Tripper
Page 376 of 400
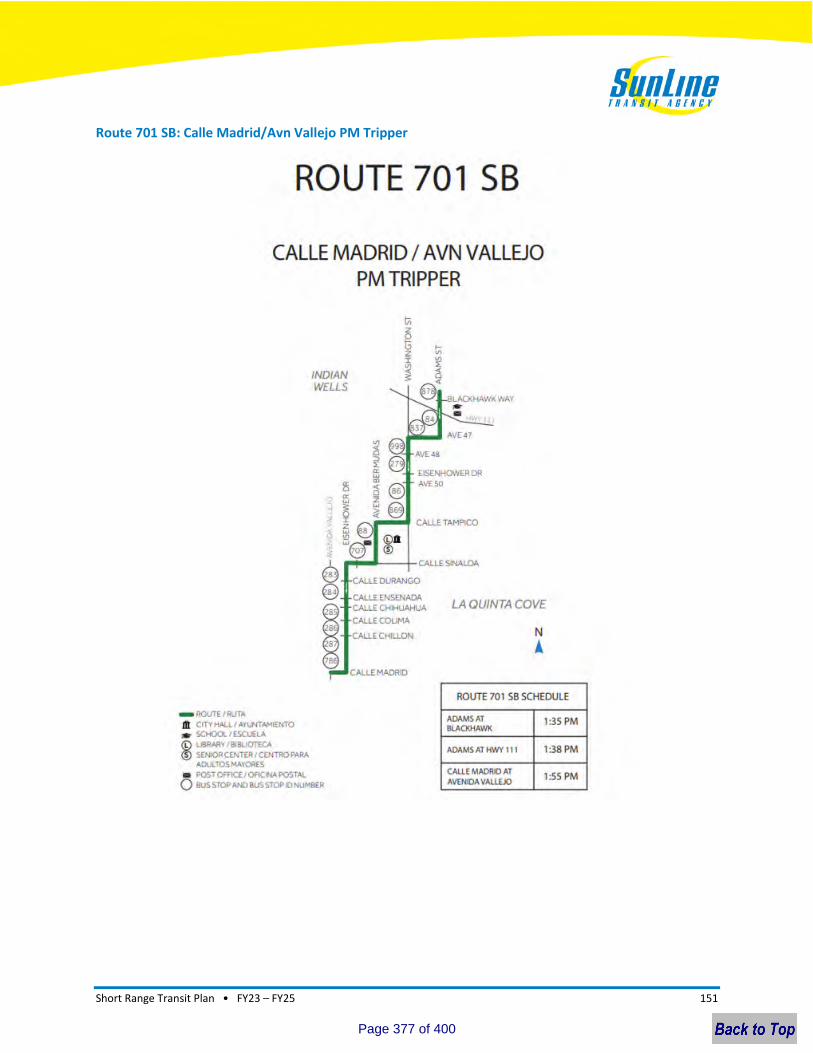
Short Range Transit Plan • FY23 – FY25 151
Route 701 SB: Calle Madrid/Avn Vallejo PM Tripper
Page 377 of 400
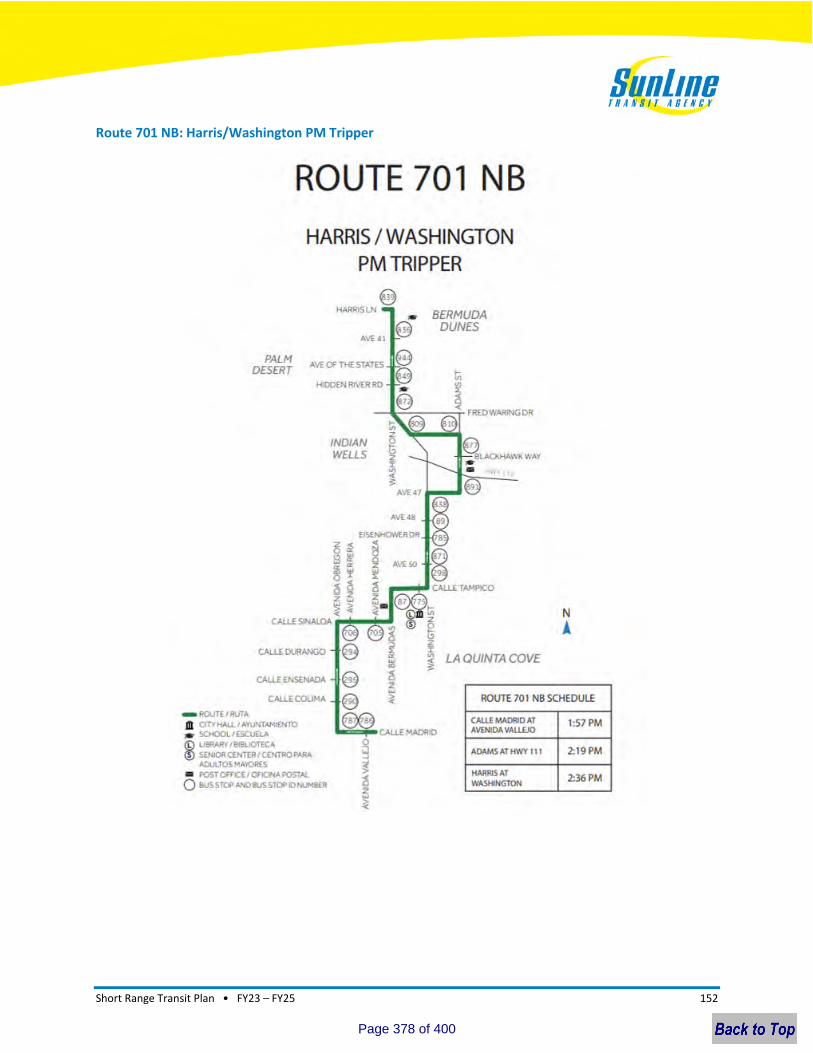
Short Range Transit Plan • FY23 – FY25 152
Route 701 NB: Harris/Washington PM Tripper
Page 378 of 400
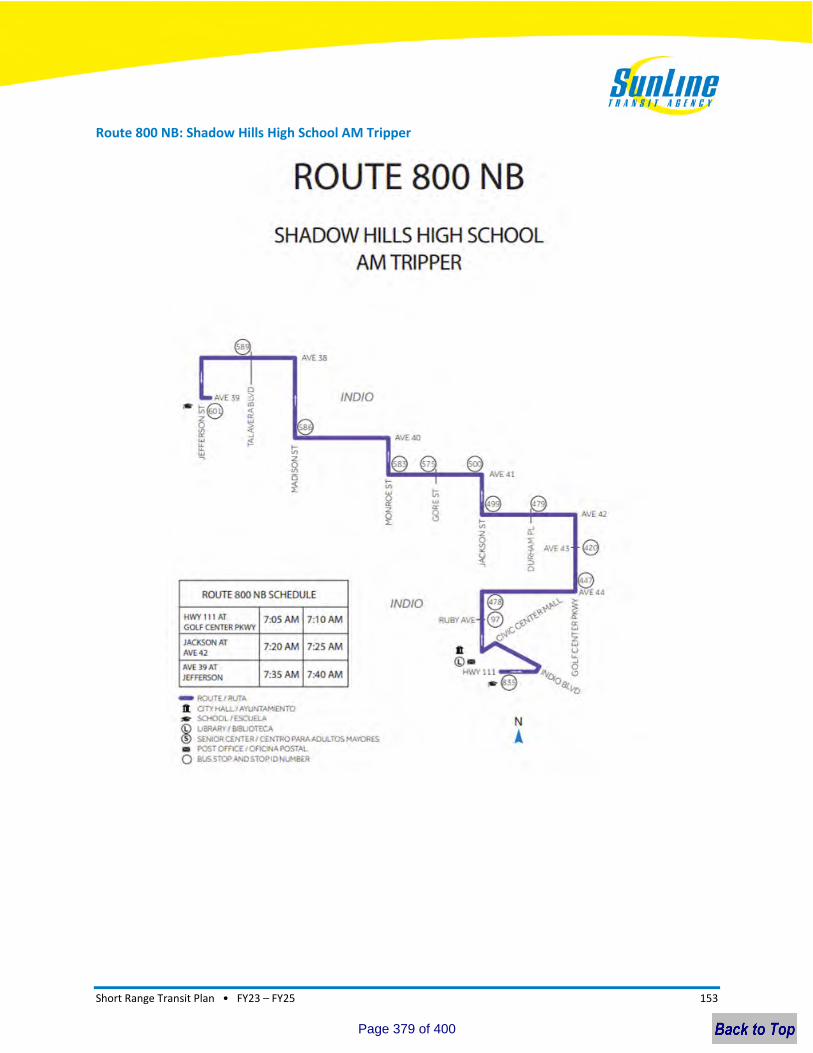
Short Range Transit Plan • FY23 – FY25 153
Route 800 NB: Shadow Hills High School AM Tripper
Page 379 of 400
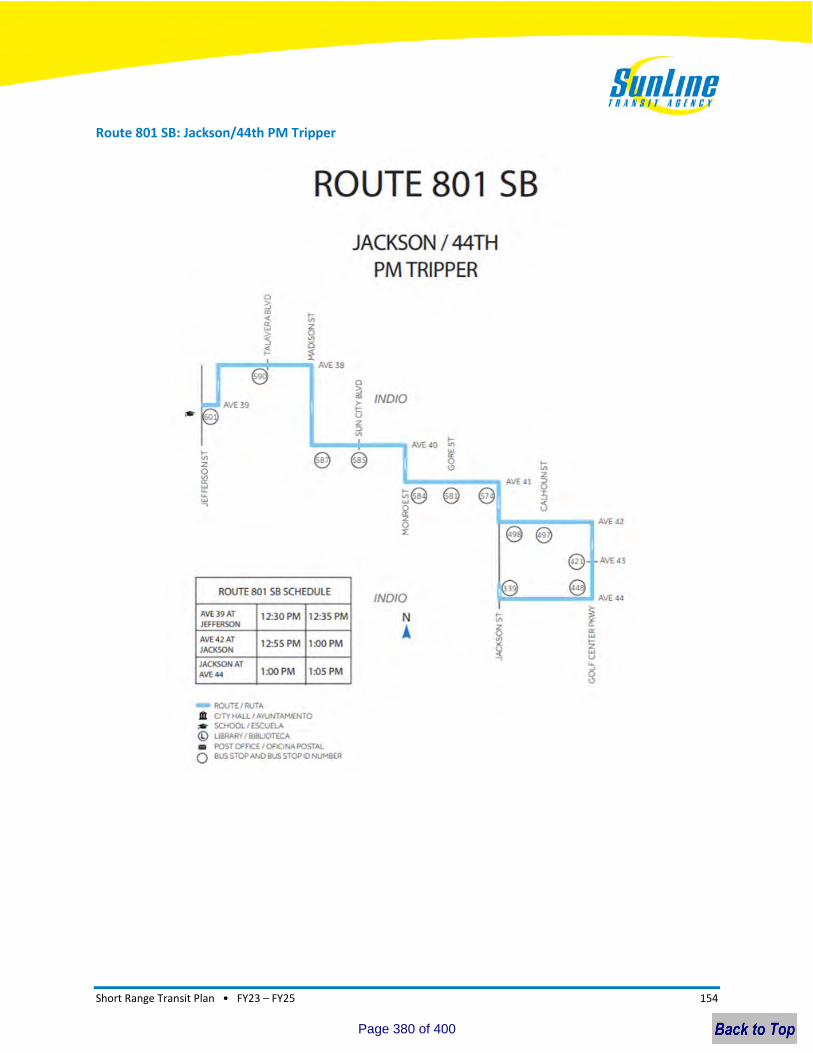
Short Range Transit Plan • FY23 – FY25 154
Route 801 SB: Jackson/44th PM Tripper
Page 380 of 400
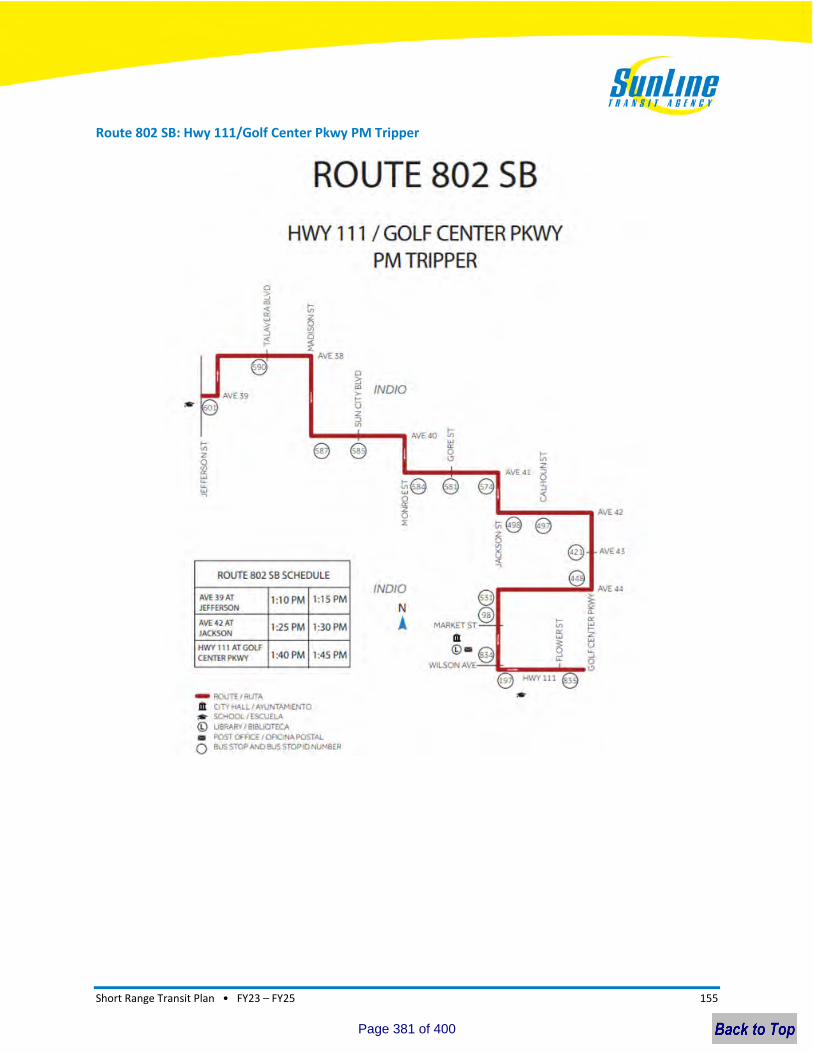
Short Range Transit Plan • FY23 – FY25 155
Route 802 SB: Hwy 111/Golf Center Pkwy PM Tripper
Page 381 of 400
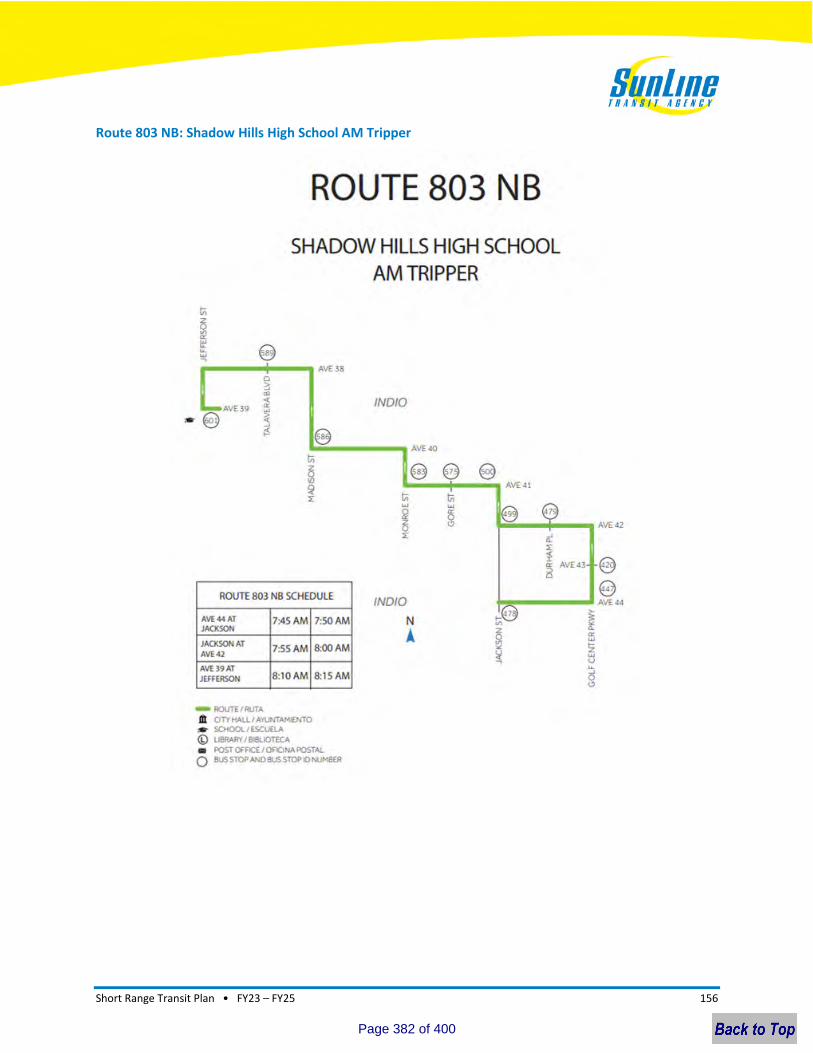
Short Range Transit Plan • FY23 – FY25 156
Route 803 NB: Shadow Hills High School AM Tripper
Page 382 of 400
Short Range Transit Plan • FY23 – FY25 1
Page 383 of 400
ITEM 15
SunLine Services Group
DATE: June 22, 2022 ACTION
TO: Taxi Committee Board of Directors
FROM: Luis Garcia, Controller/Assistant Chief Financial Officer
RE: Adoption of SunLine Regulatory Administration FY23 Budget
Recommendation
Recommend that the Board of Directors adopt the proposed FY23 budget.
Background
In accordance with the SunLine Services Group (SSG) Joint Powers Agreement, the Board of Directors must approve an annual budget for SunLine Regulatory Administration (SRA). The FY23 budget was brought before the Taxi Committee and Board of Directors on May 25, 2022, for discussion before the required approval in June. There have been no changes from the draft budget proposed at the May 25, 2022 Board meeting.
SRA is proposing a balanced budget of $187,200 for FY23. The FY23 SRA budget reflects revenue estimates based on regulating three (3) taxi businesses. The expense estimates reflect a fiscally prudent budget across controlled expense categories.
Financial Impact
The proposed budget is generated based on an expected collection of revenue to sustain SRA’s regulatory mandate provided by the SSG Ordinance.
Attachment:
• Item 15a – FY23 SSG Budget Book
Page 384 of 400
SUNLINEREGULATORY
ADMINISTRATIONBUDGET
FY2023Page 385 of 400
ccubero
Text Box
ITEM 15 ATTACHMENT A

TABLE OF CONTENTS
ORGANIZATIONAL CHART .............................................................................. 1
FUNCTIONS AND RESPONSIBILITIES ............................................................... 2
REVENUE SUMMARY...................................................................................... 3
TAXI FEES........................................................................................................ 4
EXPENSE REPORT ........................................................................................... 5
PERSONNEL SUMMARY .................................................................................. 6
DETAILED EXPENSES ................................................................................. 7 – 9
Page 386 of 400

Chief Safety Officer
l
Senior Administrative Assistant
-
Deputy Chief Safety Officer
Taxi/Contracted
Transportation
Services Administrator
I
Taxicab Service Regulatory Specialist
Page 387 of 400
SUNLINE REGULATORY ADMINISTRATIONA Division of SunLine Services Group
FUNCTIONS & RESPONSIBILITIES
FY23 GOALS & OBJECTIVES
Taxi regulation oversight includes, but is not limited to, responsibility for the day‐to‐day regulatory functions of the Coachella Valley taxicab industry. These functions include issuance of annual taxicab company licenses, vehicle and driver permit issuance, suspension and revocation of permits and licenses, complaint investigation, and ordinance compliance. The SRA Taxicab Administrator handles adjudication of ordinance violations, taxicab license and driver permit cases with appeals processed through the SSG guidelines and policies.
• Work with taxi companies to improve excessive wait times for passengers and increase industryservice reliability through ordinance enforcement.• Conduct an analysis of current regulation with the objective of assessing healthy common sense taxiregulation that promotes orderly, efficient and safe operation of taxicab service within the CoachellaValley.
Page 388 of 400

REVENUE SUMMARY
4010101200 REVENUE FINES 1,500 1,600 100 1,500 ‐ 4010101500 NEW DRIVER PERMIT REVENUE 750 1,080 330 750 ‐ 4010101550 TAXI BUSINESS PERMIT 96,000 96,000 ‐ 96,000 ‐ 4010101600 DRIVER TRANSFER REVENUE 250 1,200 950 250 ‐ 4010101700 DRIVER RENEWAL REVENUE 1,000 2,400 1,400 1,500 5004010101750 DRIVER PERMIT REINSTATEMENT/REPLACEMENT
50 24 (26) 50 ‐
4010101900 VEHICLE PERMIT REVENUE 73,620 73,620 ‐ 85,000 11,380 4010102200 OTHER REVENUE 500 11,635 11,135 650 1504010102205 OPERATOR APPLICATION RENEWAL FEE
1,500 ‐ (1,500) 1,500 ‐
Total Revenue 175,170 188,159 12,989 187,200 12,030
Notes:• The FY22 variance reflects the difference between FY22 estimated actuals and FY22 approved budget. The FY23 variance indicatesthe difference between FY23 proposed budget and FY22 approved budget.
Sources of Funding (Operating)FY22
Approved Budget
FY22 EstimatesFY22
VarianceFY23 Proposed
BudgetFY23
Variance
DRIVER PERMIT REINSTATEMENT/REPLACEMENT
0.03%
DRIVER TRANSFER REVENUE0.13%
OTHER REVENUE0.35%
REVENUE FINES0.80%
OPERATOR APPLICATION RENEWAL FEE
0.80%
DRIVER RENEWAL REVENUE0.80%
NEW DRIVER PERMIT REVENUE0.40%
TAXI BUSINESS PERMIT51.28%
VEHICLE PERMIT REVENUE45.41%
Revenue Summary (%)
Page 389 of 400
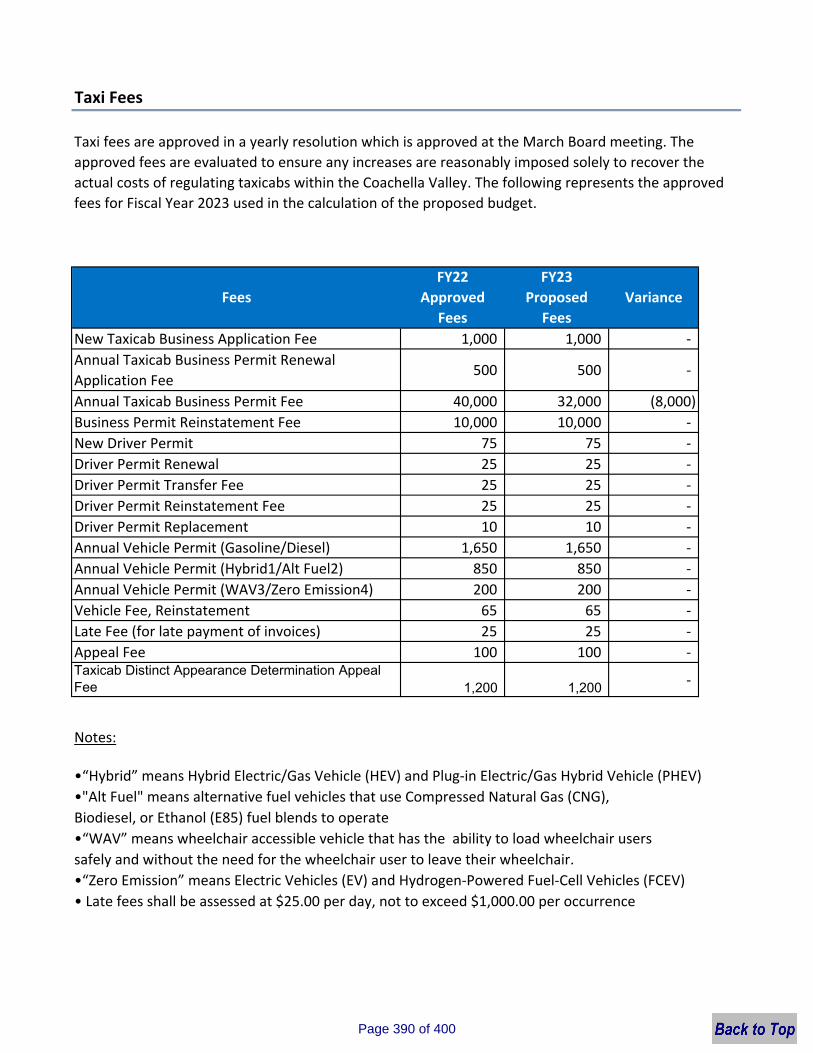
Taxi Fees
New Taxicab Business Application Fee 1,000 1,000 ‐ Annual Taxicab Business Permit Renewal Application Fee
500 500 ‐
Annual Taxicab Business Permit Fee 40,000 32,000 (8,000) Business Permit Reinstatement Fee 10,000 10,000 ‐ New Driver Permit 75 75 ‐ Driver Permit Renewal 25 25 ‐ Driver Permit Transfer Fee 25 25 ‐ Driver Permit Reinstatement Fee 25 25 ‐ Driver Permit Replacement 10 10 ‐ Annual Vehicle Permit (Gasoline/Diesel) 1,650 1,650 ‐ Annual Vehicle Permit (Hybrid1/Alt Fuel2) 850 850 ‐ Annual Vehicle Permit (WAV3/Zero Emission4) 200 200 ‐ Vehicle Fee, Reinstatement 65 65 ‐ Late Fee (for late payment of invoices) 25 25 ‐ Appeal Fee 100 100 ‐ Taxicab Distinct Appearance Determination Appeal Fee 1,200 1,200 ‐
Notes:
•“Hybrid” means Hybrid Electric/Gas Vehicle (HEV) and Plug‐in Electric/Gas Hybrid Vehicle (PHEV)•"Alt Fuel" means alternative fuel vehicles that use Compressed Natural Gas (CNG), Biodiesel, or Ethanol (E85) fuel blends to operate •“WAV” means wheelchair accessible vehicle that has the ability to load wheelchair users safely and without the need for the wheelchair user to leave their wheelchair.•“Zero Emission” means Electric Vehicles (EV) and Hydrogen‐Powered Fuel‐Cell Vehicles (FCEV)• Late fees shall be assessed at $25.00 per day, not to exceed $1,000.00 per occurrence
FeesFY22
Approved Fees
FY23Proposed
FeesVariance
Taxi fees are approved in a yearly resolution which is approved at the March Board meeting. The approved fees are evaluated to ensure any increases are reasonably imposed solely to recover the actual costs of regulating taxicabs within the Coachella Valley. The following represents the approved fees for Fiscal Year 2023 used in the calculation of the proposed budget.
Page 390 of 400
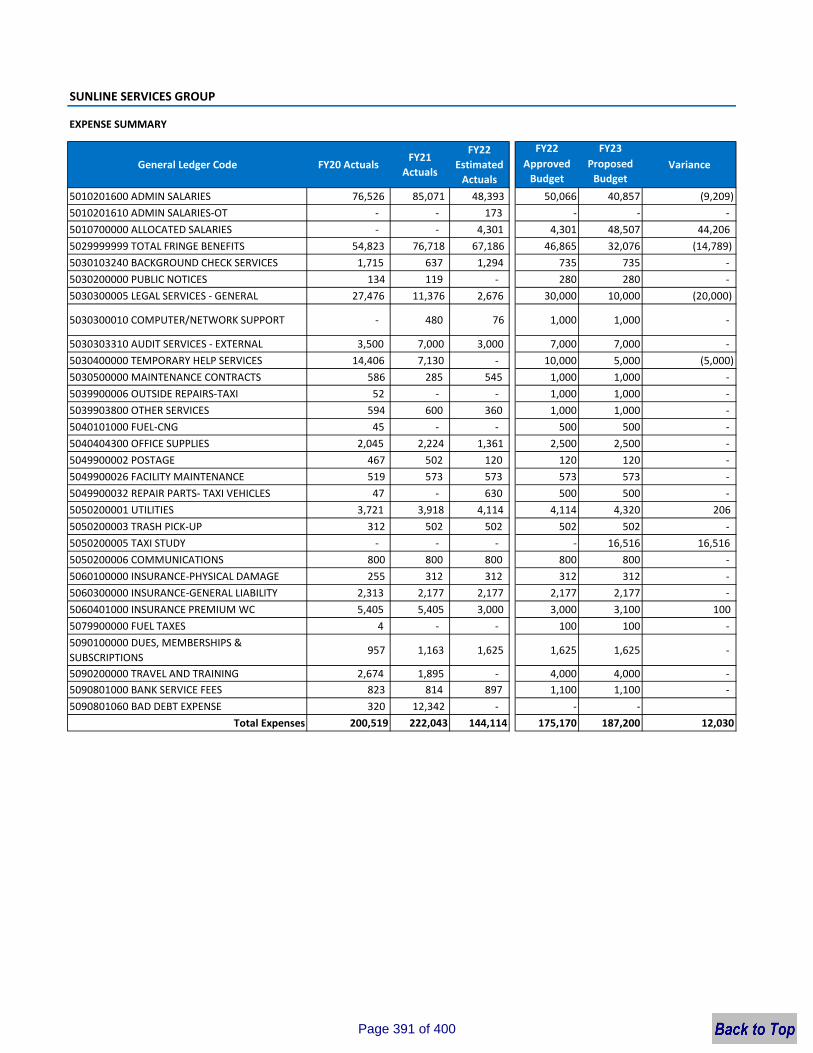
SUNLINE SERVICES GROUP
EXPENSE SUMMARY
FY22 FY23Approved Budget
Proposed Budget
5010201600 ADMIN SALARIES 76,526 85,071 48,393 50,066 40,857 (9,209)5010201610 ADMIN SALARIES‐OT ‐ ‐ 173 ‐ ‐ ‐ 5010700000 ALLOCATED SALARIES ‐ ‐ 4,301 4,301 48,507 44,206 5029999999 TOTAL FRINGE BENEFITS 54,823 76,718 67,186 46,865 32,076 (14,789)5030103240 BACKGROUND CHECK SERVICES 1,715 637 1,294 735 735 ‐ 5030200000 PUBLIC NOTICES 134 119 ‐ 280 280 ‐ 5030300005 LEGAL SERVICES ‐ GENERAL 27,476 11,376 2,676 30,000 10,000 (20,000)
5030300010 COMPUTER/NETWORK SUPPORT ‐ 480 76 1,000 1,000 ‐
5030303310 AUDIT SERVICES ‐ EXTERNAL 3,500 7,000 3,000 7,000 7,000 ‐ 5030400000 TEMPORARY HELP SERVICES 14,406 7,130 ‐ 10,000 5,000 (5,000)5030500000 MAINTENANCE CONTRACTS 586 285 545 1,000 1,000 ‐ 5039900006 OUTSIDE REPAIRS‐TAXI 52 ‐ ‐ 1,000 1,000 ‐ 5039903800 OTHER SERVICES 594 600 360 1,000 1,000 ‐ 5040101000 FUEL‐CNG 45 ‐ ‐ 500 500 ‐ 5040404300 OFFICE SUPPLIES 2,045 2,224 1,361 2,500 2,500 ‐ 5049900002 POSTAGE 467 502 120 120 120 ‐ 5049900026 FACILITY MAINTENANCE 519 573 573 573 573 ‐ 5049900032 REPAIR PARTS‐ TAXI VEHICLES 47 ‐ 630 500 500 ‐ 5050200001 UTILITIES 3,721 3,918 4,114 4,114 4,320 206 5050200003 TRASH PICK‐UP 312 502 502 502 502 ‐ 5050200005 TAXI STUDY ‐ ‐ ‐ ‐ 16,516 16,516 5050200006 COMMUNICATIONS 800 800 800 800 800 ‐ 5060100000 INSURANCE‐PHYSICAL DAMAGE 255 312 312 312 312 ‐ 5060300000 INSURANCE‐GENERAL LIABILITY 2,313 2,177 2,177 2,177 2,177 ‐ 5060401000 INSURANCE PREMIUM WC 5,405 5,405 3,000 3,000 3,100 100 5079900000 FUEL TAXES 4 ‐ ‐ 100 100 ‐ 5090100000 DUES, MEMBERSHIPS & SUBSCRIPTIONS
957 1,163 1,625 1,625 1,625 ‐
5090200000 TRAVEL AND TRAINING 2,674 1,895 ‐ 4,000 4,000 ‐ 5090801000 BANK SERVICE FEES 823 814 897 1,100 1,100 ‐ 5090801060 BAD DEBT EXPENSE 320 12,342 ‐ ‐ ‐
Total Expenses 200,519 222,043 144,114 175,170 187,200 12,030
General Ledger Code FY20 ActualsFY21
Actuals
FY22 Estimated Actuals
Variance
Page 391 of 400
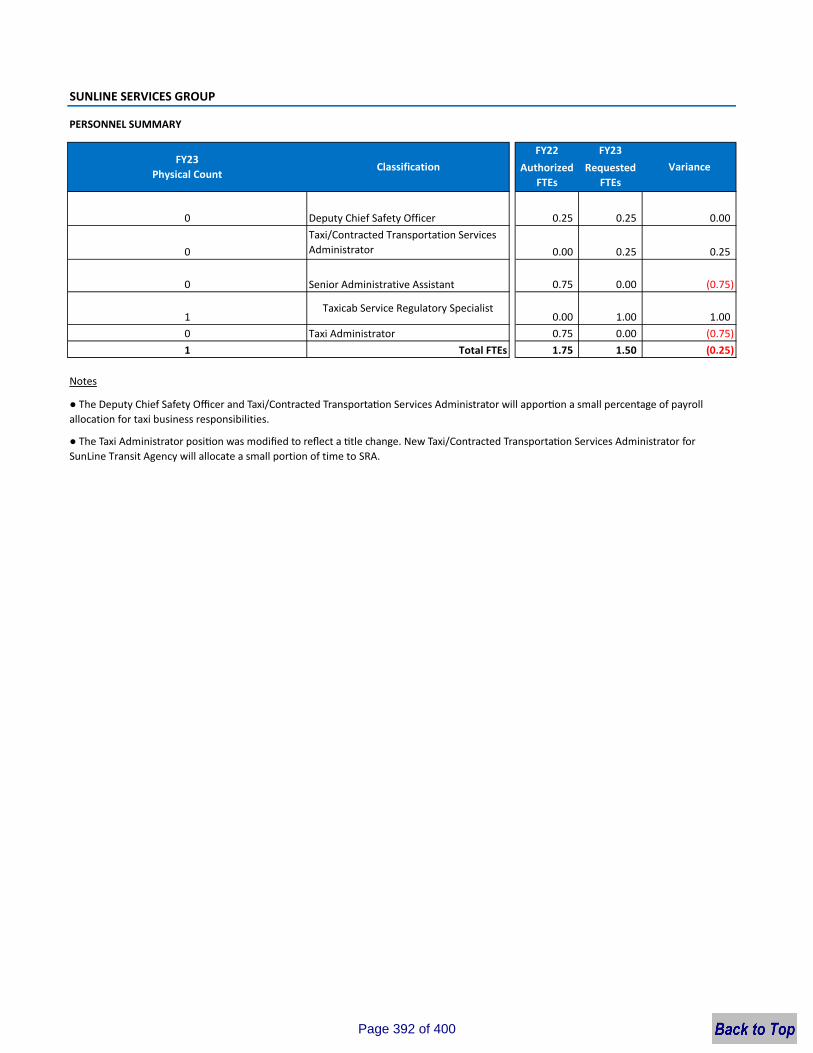
SUNLINE SERVICES GROUP
FY22 FY23Authorized
FTEsRequested
FTEs
0 0.25 0.25 0.00
0 0.00 0.25 0.25
0 0.75 0.00 (0.75)
1 0.00 1.00 1.000 0.75 0.00 (0.75)1 1.75 1.50 (0.25)
Notes
Taxicab Service Regulatory Specialist
Taxi/Contracted Transportation Services Administrator
● The Taxi Administrator posi on was modified to reflect a tle change. New Taxi/Contracted Transporta on Services Administrator for SunLine Transit Agency will allocate a small portion of time to SRA.
● The Deputy Chief Safety Officer and Taxi/Contracted Transporta on Services Administrator will appor on a small percentage of payrollallocation for taxi business responsibilities.
Senior Administrative Assistant
Deputy Chief Safety Officer
Total FTEs
PERSONNEL SUMMARY
FY23Physical Count
Classification Variance
Taxi Administrator
Page 392 of 400
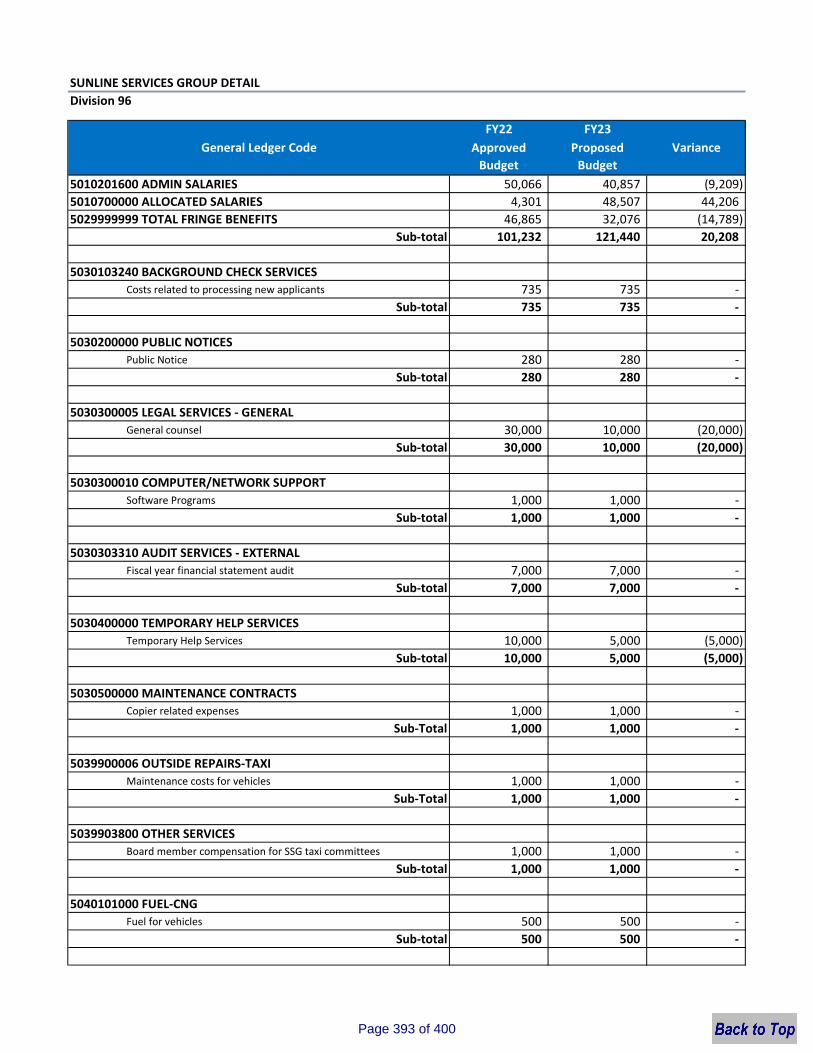
SUNLINE SERVICES GROUP DETAILDivision 96
FY22 FY23Approved Budget
Proposed Budget
5010201600 ADMIN SALARIES 50,066 40,857 (9,209) 5010700000 ALLOCATED SALARIES 4,301 48,507 44,206 5029999999 TOTAL FRINGE BENEFITS 46,865 32,076 (14,789)
Sub‐total 101,232 121,440 20,208
5030103240 BACKGROUND CHECK SERVICESCosts related to processing new applicants 735 735 ‐
Sub‐total 735 735 ‐
5030200000 PUBLIC NOTICESPublic Notice 280 280 ‐
Sub‐total 280 280 ‐
5030300005 LEGAL SERVICES ‐ GENERALGeneral counsel 30,000 10,000 (20,000)
Sub‐total 30,000 10,000 (20,000)
5030300010 COMPUTER/NETWORK SUPPORTSoftware Programs 1,000 1,000 ‐
Sub‐total 1,000 1,000 ‐
5030303310 AUDIT SERVICES ‐ EXTERNALFiscal year financial statement audit 7,000 7,000 ‐
Sub‐total 7,000 7,000 ‐
5030400000 TEMPORARY HELP SERVICESTemporary Help Services 10,000 5,000 (5,000)
Sub‐total 10,000 5,000 (5,000)
5030500000 MAINTENANCE CONTRACTSCopier related expenses 1,000 1,000 ‐
Sub‐Total 1,000 1,000 ‐
5039900006 OUTSIDE REPAIRS‐TAXIMaintenance costs for vehicles 1,000 1,000 ‐
Sub‐Total 1,000 1,000 ‐
5039903800 OTHER SERVICESBoard member compensation for SSG taxi committees 1,000 1,000 ‐
Sub‐total 1,000 1,000 ‐
5040101000 FUEL‐CNGFuel for vehicles 500 500 ‐
Sub‐total 500 500 ‐
General Ledger Code Variance
Page 393 of 400
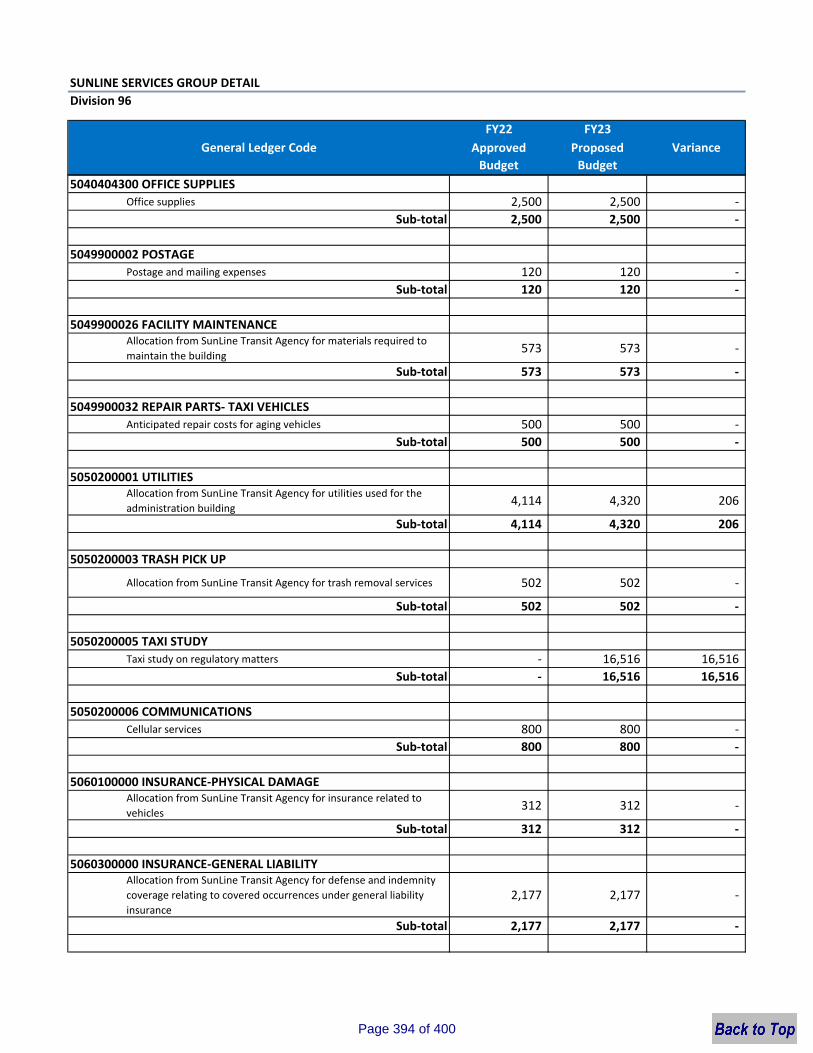
SUNLINE SERVICES GROUP DETAILDivision 96
FY22 FY23Approved Budget
Proposed Budget
General Ledger Code Variance
5040404300 OFFICE SUPPLIESOffice supplies 2,500 2,500 ‐
Sub‐total 2,500 2,500 ‐
5049900002 POSTAGEPostage and mailing expenses 120 120 ‐
Sub‐total 120 120 ‐
5049900026 FACILITY MAINTENANCEAllocation from SunLine Transit Agency for materials required to maintain the building 573 573 ‐
Sub‐total 573 573 ‐
5049900032 REPAIR PARTS‐ TAXI VEHICLESAnticipated repair costs for aging vehicles 500 500 ‐
Sub‐total 500 500 ‐
5050200001 UTILITIESAllocation from SunLine Transit Agency for utilities used for the administration building 4,114 4,320 206
Sub‐total 4,114 4,320 206
5050200003 TRASH PICK UP
Allocation from SunLine Transit Agency for trash removal services 502 502 ‐
Sub‐total 502 502 ‐
5050200005 TAXI STUDYTaxi study on regulatory matters ‐ 16,516 16,516
Sub‐total ‐ 16,516 16,516
5050200006 COMMUNICATIONSCellular services 800 800 ‐
Sub‐total 800 800 ‐
5060100000 INSURANCE‐PHYSICAL DAMAGEAllocation from SunLine Transit Agency for insurance related to vehicles 312 312 ‐
Sub‐total 312 312 ‐
5060300000 INSURANCE‐GENERAL LIABILITYAllocation from SunLine Transit Agency for defense and indemnity coverage relating to covered occurrences under general liability insurance
2,177 2,177 ‐
Sub‐total 2,177 2,177 ‐
Page 394 of 400
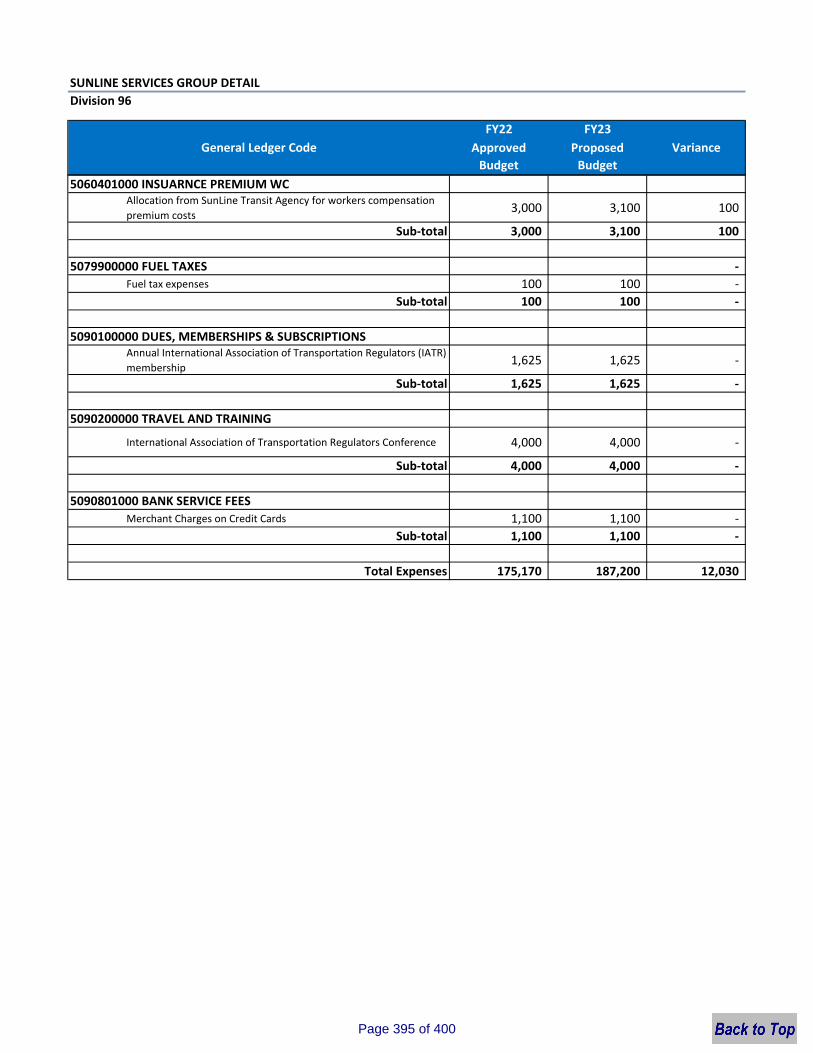
SUNLINE SERVICES GROUP DETAILDivision 96
FY22 FY23Approved Budget
Proposed Budget
General Ledger Code Variance
5060401000 INSUARNCE PREMIUM WCAllocation from SunLine Transit Agency for workers compensation premium costs 3,000 3,100 100
Sub‐total 3,000 3,100 100
5079900000 FUEL TAXES ‐ Fuel tax expenses 100 100 ‐
Sub‐total 100 100 ‐
5090100000 DUES, MEMBERSHIPS & SUBSCRIPTIONSAnnual International Association of Transportation Regulators (IATR) membership 1,625 1,625 ‐
Sub‐total 1,625 1,625 ‐
5090200000 TRAVEL AND TRAINING
International Association of Transportation Regulators Conference 4,000 4,000 ‐
Sub‐total 4,000 4,000 ‐
5090801000 BANK SERVICE FEESMerchant Charges on Credit Cards 1,100 1,100 ‐
Sub‐total 1,100 1,100 ‐
Total Expenses 175,170 187,200 12,030
Page 395 of 400
32505 Harry Oliver Trail | Thousand Palms, CA 92276
Serving the Coachella ValleyBermuda Dunes • Cathedral City • Coachella • Desert Edge • Desert Hot Springs • Indian Wells • Indio • La Quinta • Mecca
North Shore • Oasis • Palm Desert • Palm Springs • Rancho Mirage • Thermal • Thousand Palms
Page 396 of 400
ITEM 16
SunLine Transit Agency SunLine Services Group
DATE: June 22, 2022 ACTION
TO: Board of Directors
FROM: Glenn Miller, Chairperson of the Board
RE: Election of Officers
Recommendation
Recommend that the Board of Directors accept nominations and elect officers for SunLine Transit Agency; Chairperson of the Board and Vice-Chairperson of the Board.
Background
In accordance with the Joint Powers Agreement, the Board shall elect, from among its members, a Chairperson and Vice Chairperson to serve for one year terms, said terms expiring at the end of each fiscal year. SunLine’s meeting by-laws don’t create an automatic advancement from Vice Chairperson to Chairperson. Selection of Chairperson and Vice Chairperson shall be by a majority vote of the quorum in attendance, and a failure to achieve such total of affirmative votes, shall be deemed a selection of the incumbent(s) to remain in office. Each person so selected shall serve until a successor is chosen (at any time) by affirmative votes, provided that at the first regular meeting in July of each year, the office of Chairperson and Vice Chairperson shall automatically be reconsidered by the Board.
Financial Impact
No financial impact.
Attachment:
• Item 16a – History of SunLine Transit Agency Officers
Page 397 of 400
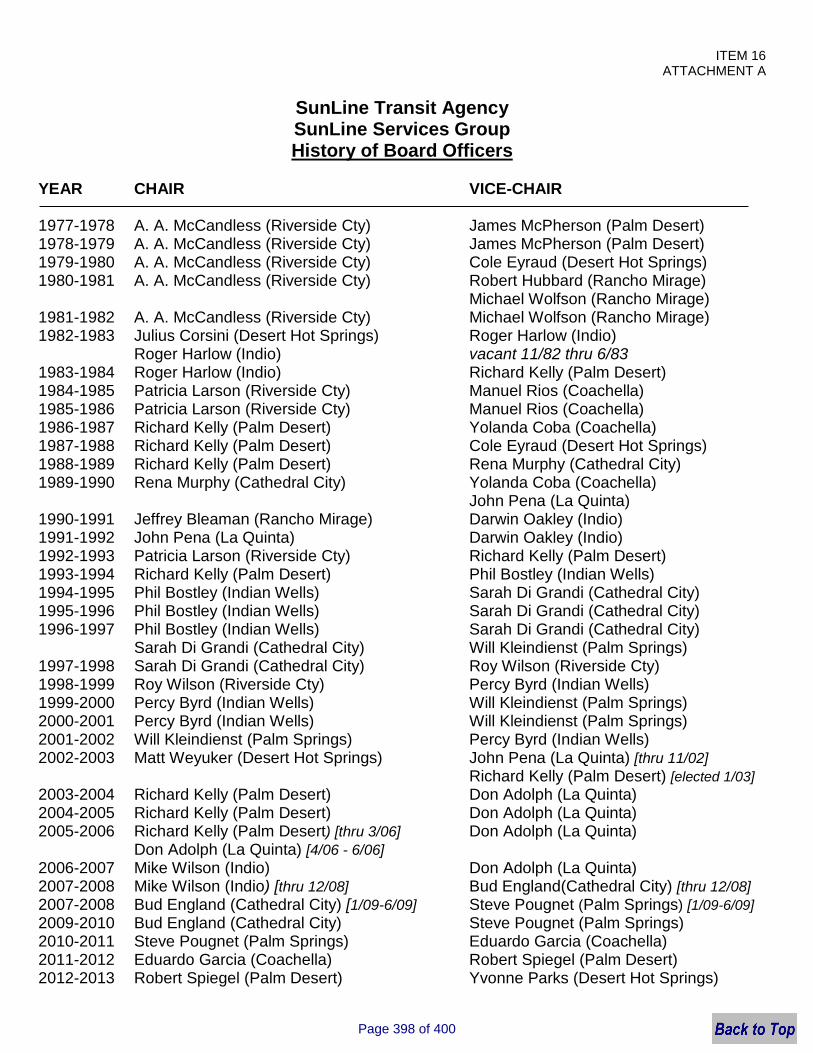
ITEM 16 ATTACHMENT A
SunLine Transit Agency SunLine Services Group History of Board Officers
YEAR CHAIR VICE-CHAIR
1977-1978 A. A. McCandless (Riverside Cty) James McPherson (Palm Desert) 1978-1979 A. A. McCandless (Riverside Cty) James McPherson (Palm Desert) 1979-1980 A. A. McCandless (Riverside Cty) Cole Eyraud (Desert Hot Springs) 1980-1981 A. A. McCandless (Riverside Cty) Robert Hubbard (Rancho Mirage)
Michael Wolfson (Rancho Mirage) 1981-1982 A. A. McCandless (Riverside Cty) Michael Wolfson (Rancho Mirage) 1982-1983 Julius Corsini (Desert Hot Springs) Roger Harlow (Indio)
Roger Harlow (Indio) vacant 11/82 thru 6/831983-1984 Roger Harlow (Indio) Richard Kelly (Palm Desert) 1984-1985 Patricia Larson (Riverside Cty) Manuel Rios (Coachella) 1985-1986 Patricia Larson (Riverside Cty) Manuel Rios (Coachella) 1986-1987 Richard Kelly (Palm Desert) Yolanda Coba (Coachella) 1987-1988 Richard Kelly (Palm Desert) Cole Eyraud (Desert Hot Springs) 1988-1989 Richard Kelly (Palm Desert) Rena Murphy (Cathedral City) 1989-1990 Rena Murphy (Cathedral City) Yolanda Coba (Coachella)
John Pena (La Quinta) 1990-1991 Jeffrey Bleaman (Rancho Mirage) Darwin Oakley (Indio) 1991-1992 John Pena (La Quinta) Darwin Oakley (Indio) 1992-1993 Patricia Larson (Riverside Cty) Richard Kelly (Palm Desert) 1993-1994 Richard Kelly (Palm Desert) Phil Bostley (Indian Wells) 1994-1995 Phil Bostley (Indian Wells) Sarah Di Grandi (Cathedral City) 1995-1996 Phil Bostley (Indian Wells) Sarah Di Grandi (Cathedral City) 1996-1997 Phil Bostley (Indian Wells) Sarah Di Grandi (Cathedral City)
Sarah Di Grandi (Cathedral City) Will Kleindienst (Palm Springs) 1997-1998 Sarah Di Grandi (Cathedral City) Roy Wilson (Riverside Cty) 1998-1999 Roy Wilson (Riverside Cty) Percy Byrd (Indian Wells) 1999-2000 Percy Byrd (Indian Wells) Will Kleindienst (Palm Springs) 2000-2001 Percy Byrd (Indian Wells) Will Kleindienst (Palm Springs) 2001-2002 Will Kleindienst (Palm Springs) Percy Byrd (Indian Wells) 2002-2003 Matt Weyuker (Desert Hot Springs) John Pena (La Quinta) [thru 11/02]
Richard Kelly (Palm Desert) [elected 1/03]
2003-2004 Richard Kelly (Palm Desert) Don Adolph (La Quinta) 2004-2005 Richard Kelly (Palm Desert) Don Adolph (La Quinta) 2005-2006 Richard Kelly (Palm Desert) [thru 3/06] Don Adolph (La Quinta)
Don Adolph (La Quinta) [4/06 - 6/06]
2006-2007 Mike Wilson (Indio) Don Adolph (La Quinta) 2007-2008 Mike Wilson (Indio) [thru 12/08] Bud England(Cathedral City) [thru 12/08]
2007-2008 Bud England (Cathedral City) [1/09-6/09] Steve Pougnet (Palm Springs) [1/09-6/09]
2009-2010 Bud England (Cathedral City) Steve Pougnet (Palm Springs) 2010-2011 Steve Pougnet (Palm Springs) Eduardo Garcia (Coachella) 2011-2012 Eduardo Garcia (Coachella) Robert Spiegel (Palm Desert) 2012-2013 Robert Spiegel (Palm Desert) Yvonne Parks (Desert Hot Springs)
Page 398 of 400
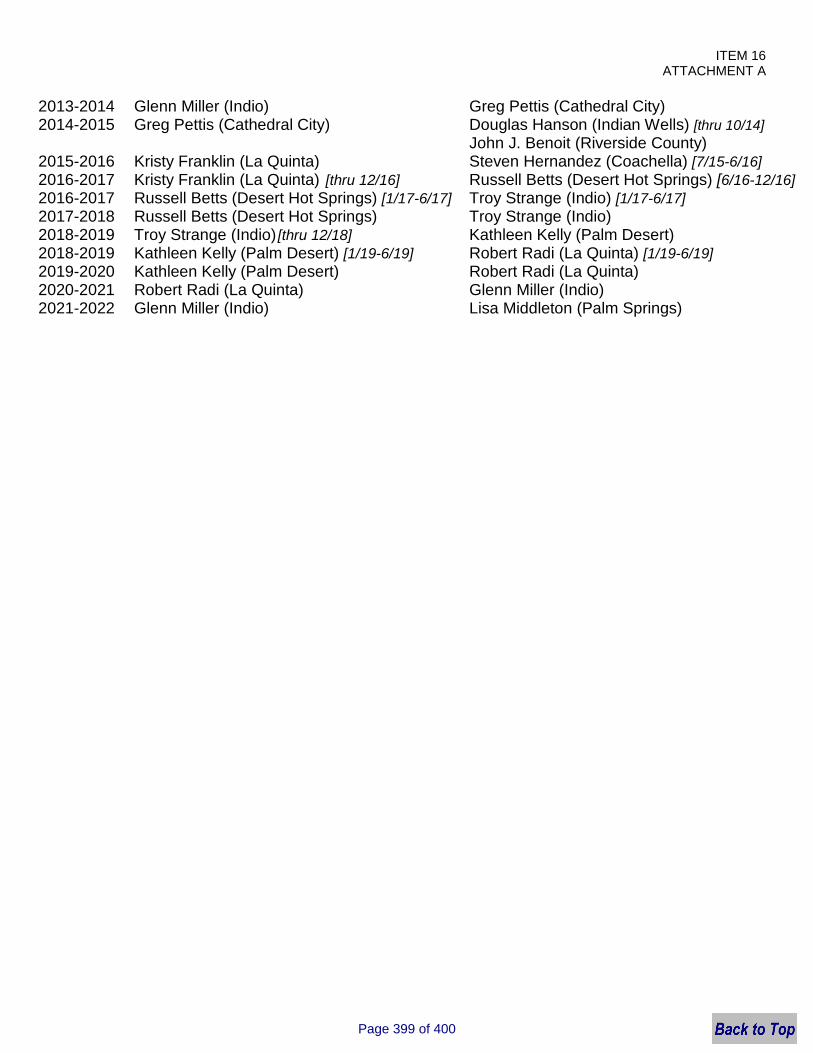
ITEM 16 ATTACHMENT A
2013-2014 Glenn Miller (Indio) Greg Pettis (Cathedral City) 2014-2015 Greg Pettis (Cathedral City) Douglas Hanson (Indian Wells) [thru 10/14]
John J. Benoit (Riverside County) 2015-2016 Kristy Franklin (La Quinta) Steven Hernandez (Coachella) [7/15-6/16]
2016-2017 Kristy Franklin (La Quinta) [thru 12/16] Russell Betts (Desert Hot Springs) [6/16-12/16]
2016-2017 Russell Betts (Desert Hot Springs) [1/17-6/17] Troy Strange (Indio) [1/17-6/17]
2017-2018 Russell Betts (Desert Hot Springs) Troy Strange (Indio) 2018-2019 Troy Strange (Indio) [thru 12/18] Kathleen Kelly (Palm Desert) 2018-2019 Kathleen Kelly (Palm Desert) [1/19-6/19] Robert Radi (La Quinta) [1/19-6/19]
2019-2020 Kathleen Kelly (Palm Desert) Robert Radi (La Quinta) 2020-2021 Robert Radi (La Quinta) Glenn Miller (Indio) 2021-2022 Glenn Miller (Indio) Lisa Middleton (Palm Springs)
Page 399 of 400

ITEM 17
SunLine Transit Agency
DATE: June 22, 2022 INFORMATION
TO: Finance/Audit Committee Board of Directors
FROM: Rudy Le Flore, Chief Project Consultant
RE: Mobile Hydrogen Fueling System
Background
This item is being presented to provide the SunLine Board of Directors (Board) with an update on the procurement of the Mobile Hydrogen Fueling System. As a reminder, this hydrogen fueling system was demonstrated at SunLine’s Division II in Indio. The system represented one of the few times SunLine was able to fully demonstrate the technology prior to making a purchase decision.
On March 23, 2022, staff presented an approval item for the Mobile Hydrogen Fueling System to the Board. The Board gave the CEO/General Manager authority to negotiate and execute an agreement with NICE America Research Incorporated (NICE).
After the Board’s action, NICE was informed by its parent company that it would no longer have access to the intellectual property rights needed to manufacture the Mobile Hydrogen Fueling System. It was communicated to SunLine that this was a decision related to the strained relationship between the Chinese government and the United States.
Therefore, negotiations were terminated with NICE and a resultant contract seems highly unlikely.
Page 400 of 400
Related Documents