FACTS AND FIGURES 2013|2014 ELECTRICITY GENERATION

VGB Facts Powergeneration
Oct 22, 2015
vgb guidelines
Welcome message from author
This document is posted to help you gain knowledge. Please leave a comment to let me know what you think about it! Share it to your friends and learn new things together.
Transcript
FACTS AND FIGURES
2013|2014ELECTRICITY GENERATION

Contents
n Electricity Demand Worldwide and in the EU 2 – 3n Availability and Import Dependencies 4 – 5n New Power Plants in Europe 6 – 7n Renewables (RES) in the EU 8 – 11n Nuclear Power Worldwide 12 – 13n Nuclear in Energy Policies after Fukushima n Efficient Coal and Gas Power Plants 16 – 17n Carbon Capture and Storage (CCS) 18 – 19n Market Conditions and System Stabilityn System – RES, Back-up Capacity, 22 – 23 Flexibility and Storagen Global Climate Policy Needed 24 – 25n VGB: Activities and Members 26 – 27n Imprint 28
The global population is increasing by 83 million people per year, i. e., within roughly five decades, the number of people has doubled between
1960 and today.At present, approximately one quarter of the global population of nearly 7.2 billion people does not yet have access to electricity. Electricity consumption will grow faster than any other form of energy consumption. The increase might be decelerated in the short term due to the worldwide financial and economic crisis, however, in the medium term the above-mentioned factors will again dominate the development. It is expected that the 2010 gross electricity consumption figures of 21,408 billion kWh will increase by roughly 71 % to 36,637 billion kWh worldwide by 2035. About 16 % of the electricity gener-ated globally – roughly 3,346 billion kWh – was provided in the European Union (EU). A 0.8 % p. a. rise in demand is expected in the EU by 2035.Experts estimate that fossil fuels will continue to cover most of the extra demand. Fossil fuels will still account for about 60 % of electricity generated worldwide in 2035. About half of the electricity generated in the EU will come from fossil fuels by that time. Renewable energy sources will play a growing role in the global primary energy consumption structure. Likewise, nuclear power will – despite the political nuclear phase-out in some coun-tries – maintain an important position in global electricity generation and will even grow in some countries.
DEVELOPMENT OF THE EUROPEAN AND GLOBAL ELECTRICITY DEMAND
FACTS AND FIGURES ELECTRICITY GENERAT ION 2013|2014

40,000
30,000
20,000
10,000
02010 2035
+71 %
Wind,biomass, solar
Hydro power
Nuclear
Fossil
Expected growth in electricity generation in billion (109) kWh worldwide
+23 %
Expected growth in electricity generation in billion (109) kWh in the EU
2010 2035
4,500
4,000
3,500
3,000
2,500
2,000
1,500
1,000
500
0
?Wind,biomass, solar
Hydro power
Nuclear
Fossil
Source: IEA, VGB
PAGE 2 – 3

Existing primary energy reserves and resources, in particular when including unconventional sources, are still sufficient in terms of fossil
fuels and uranium around the world. Hard coal and lignite as well as uranium are the most widespread.However, energy sources have an uneven geographical distribution, which means that some countries and regions, including the European Union, are becoming increasingly dependent on imports. The EU’s fossil fuel reserves amount to about 38,000 million tonnes of coal equivalent (TCE), account-ing for only 2.8 % of the known reserves worldwide, and consist mainly of lignite and hard coal. The natural gas and oil reserves amount to approxi-mately 6 billion TCE.Europe’s dependency on imported coal will grow from about 40 % today to more than 60 % by 2030. An import dependency of 81 % is expected for natural gas and of as much as 88 % for oil. Overall, the share of imported energy will increase from about 50 % today to roughly 70 % by 2030.Underlying causes are the decreasing European energy reserves that can be produced at competitive prices. Lignite remains the only fuel that can still be mined from open cast mines at competitive costs in some countries in the long term. Reserves: Known and with current technology economically recoverable sources.
Resources: Reserves and documented but with current technology economically not recoverable sources.
Static range: As quotient of amount of reserves and/or resources and current consumption, it is a snap-shot of the current state of knowledge
Source: BGR, OECD-NEA, VGB
OilConventional
Conventional+ non-conv.
Natural gas
Hard coal
Lignite
ConventionalConventional
+ non-conv.
127
260
64
60
65
41 64
160
135
760
4,280
= Reserves
= Resources
2,840
Static range of energy sources worldwideas well as reserves and resources (in years)
(< 260 $/kg)* advanced
fuel cycles
Uranium143 315 > 8,000 *
0 50 100 150 > 200 > 1,000 Years
AVAILABILITY, RANGE AND IMPORT DEPENDENCY OF ENERGY SOURCES
FACTS AND FIGURES ELECTRICITY GENERAT ION 2013|2014

Page 4 – 5
Regional distribution of the worldwide energy reserves for hard coal, lignite, oil, natural gas and uranium/thorium
North America(287 billion TCE)
Middle- and South Amerika(70 billion TCE)
Africa(72 billion TCE)
Middle East(245 billion TCE)
Europe(48 billion TCE
EU-27: 38 billion TCE)
CIS(293 billion TCE)
Asia, Oceania, Australia(341billion TCE)
Oil
Natural gas
Hard coal and lignite
Uranium/thorium
The area of the circles corresponds to the scope of regional energy reserves; the area of the circle segments corresponds to the regional share of each source of energy.
TCE: tonne of coal equivalentTOE: tonne of oil equivalent1 TCE ≈ 0.7 TOE
Source: BGR 2012
PAGE 4 – 5

* Oil: no current projects. Source: Data base VGB, state: 9/2013
INVESTMENTS IN NEW POWER PLANT PROJECTS ARE AT RISK
Gas (72,406 MW, 30.21 %)
Oil (0 MW, 0 %)*
Hard coal (28,685 MW, 11.97 %)
Lignite & peat (4,695 MW, 1.96 %)
Nuclear (57,200 MW, 23.86 %)
Biomass (932 MW, 0.4 %)
Hydro power (16,559 MW, 6.91 %)
Residues and Waste (203 MW, 0.08 %)
Wind (57,014 MW, 23.79 %)
Other renewables (1,983 MW, 0.83 %)
Projected and announced power plant capacities in Europe
Share of energy source(2007 to 2020)
Total: 239,701 MW{
The need to replace older power plants and the increase in electricity consumption in Europe made many companies to plan new construc-
tion projects. Despite the extensive increase in renewables, coal, natural gas, and nuclear power remain the most important primary energies for reliable and planable electricity generation. Highly efficient new plants replace older, less-efficient plants. And not only CO2 emissions will be clearly reduced but other emissions related to fossil energy conversion will be decreased, too. However, investments in new-build projects in Europe become very sluggish because long-term politically reliable conditions are missing. The emerging European generation gap can be closed only through the con-sequent realisation of the new announced power plant capacities to be con-structed. VGB PowerTech updated the statistics on new build plants for the period 2007 to 09/2013. Accordingly, gas-fired power plants still have the largest share with some 30 % (some 72,400 MW) in new build conven-tional plants, followed by nuclear power with a share of some 24 % (57,200 MW). Hard coal and lignite-fired units are in the third place with a total share of some 14 % (33,380 MW).Wind power plants are still in the lead with some 23 % (57,014 MW) in new build RES capacity.
FACTS AND FIGURES ELECTRICITY GENERAT ION 2013|2014
Cost of electricity (CoE) production
1,000 2,000 3,000 4,000 5,000 6,000 7,000 8,000
Maintenance
Staff
Capital costs
Fuel
Cos
t of e
lect
ricity
pro
duct
ion
Operating hours
Substantial increase of fixed costs
NEW POWER PLANT PROJECTS IN EUROPE
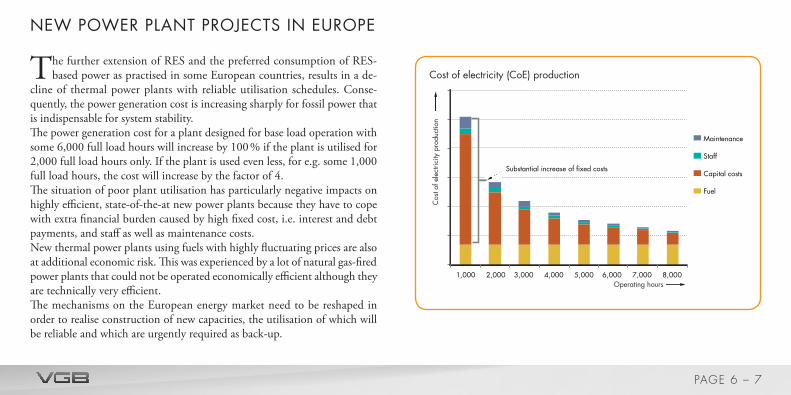
The further extension of RES and the preferred consumption of RES-based power as practised in some European countries, results in a de-
cline of thermal power plants with reliable utilisation schedules. Conse-quently, the power generation cost is increasing sharply for fossil power that is indispensable for system stability. The power generation cost for a plant designed for base load operation with some 6,000 full load hours will increase by 100 % if the plant is utilised for 2,000 full load hours only. If the plant is used even less, for e.g. some 1,000 full load hours, the cost will increase by the factor of 4. The situation of poor plant utilisation has particularly negative impacts on highly efficient, state-of-the-at new power plants because they have to cope with extra financial burden caused by high fixed cost, i.e. interest and debt payments, and staff as well as maintenance costs. New thermal power plants using fuels with highly fluctuating prices are also at additional economic risk. This was experienced by a lot of natural gas-fired power plants that could not be operated economically efficient although they are technically very efficient. The mechanisms on the European energy market need to be reshaped in order to realise construction of new capacities, the utilisation of which will be reliable and which are urgently required as back-up.
PAGE 6 – 7

The EU member states set themselves ambitious targets for the exten-sion of renewables.
Binding national targets were laid down in the EU Directive 2009/28/EG within a European framework supporting renewables in order to increase the share of RES in final energy consumption to 20 % and in traffic to 10 %. Wind energy e. g. is estimated to grow from 200 billion kWh in 2012 to some 495 billion kWh in 2020. However, according to current trends, these targets are likely not be fully met by 2020 unless administrative and infra-structure obstacles are eliminated and measures are taken in support of re-newables. These are the results of a first progress report of the EU Commis-sion on the extension of renewables.
Hydro power is still a reliable renewable source of energy. Pumped storage plants also play a very important role in the provision of reserve power/peak load and grid control. Numerous new hydro power projects as well as ex-pansions and retrofits are being realised or planned for the near future, e. g. in Austria, Switzerland, Germany, and Portugal. Essentially, these will uti-lise more supplementary generation or (pumped) storage capacities by
Biomass
Electricity generation based on renewables (RES)in EU-27 (20.6 % of total generation in 2011)
in billion (109) kWhTotal: 699 billion kWh
Geothermal
Solar
Large hydro power
Small hydro power
Wind
179
288
47
6
Targets for RES power in the EU2011 2020
133
46
20.6 % 34 %
RENEWABLES – EU’S AMBITIOUS TARGETS FOR 2020
Source: Eurostat, Eurobserv‘er
FACTS AND FIGURES ELECTRICITY GENERAT ION 2013|2014

expanding or optimising the plants at existing sites. An important step is also increasing plant efficiencies by replacing older machines and/or com-ponents by new, high-performance designs, thereby meeting the envisaged environmental protection requirements.
Utilisation of wind power is playing an important role in order to meet the targets of the European Union within the Climate and Energy Package by 2020. By the end of 2012 some 22,297 wind power plants were operated in Germany with a capacity of 31,308 MW. At that time, the installed capacity in Europe amounted to 109,581 MW and worldwide to 282,482 MW.
The technology needs to be advanced and developed consequently to increase technical availability of wind power plants. It is also urgently required to ad-just wind farm operation to the methods that have been proven well with conventional power plants. Therefore, different VGB-Standards specify from the operators´ view point the requirements for conventional power plants need to be transferred to the installation and operation of on- and offshore wind power plants. Standardisation is also to reduce costs of maintenance and repair. Consequent advancement of plant engineering is also of great impor-tance. Apart from reliability, parameters like weight, cost, and efficiency are
Elec
trici
ty g
ener
atio
n in
bill
ion
(109 )
kW
h
Spain
Germany
EU-27
Wind: Development of electricity generation in the EU
500
450
400
350
300
250
200
150
100
50
02008 2009 2010 2011 2012 2020
about 495 billion (109) kWh
Source: Eurostat, Eurobserv‘er
PAGE 8 – 9

also crucial. In future, offshore plants will face more challenges due to increas-ing water depth and capacities. Besides, numerous questions of safety and maintenance have not been solved yet. This is revealed by experience made with offshore wind parks.
When assessing the national renewables action plans, it becomes clear that in addition to wind power, biomass-based electricity generation also has to be increased in order to meet the EU 2020 targets. Therefore, it is envisaged to increase the share of biomass electricity to 232 billion kWh by 2020. The European Commission recommended requirements to be met in connection with the use of solid and gaseous biomass fuels in electricity generation, heat-ing and cooling in order to guarantee sustainable utilisation of biomass as early as in 2010. Currently the Commission is developing binding sustaina-bility criteria to be introduced in Europe.
Retrofitting of coal-fired power plants to 100 % biomass combustion is gain-ing in importance all over Europe. The main advantage is the use of existing plant infrastructure adopted to biomass operation and longer operation peri-ods of the plant site. However, economic efficiency of fuel switching is highly
Wind power: Capacities in Europe end of 2012 in MW
NO703
CH 50
LU45
HU329
CY 147
CZ260
SK 3
DK4,162
BE1,375
IT8,144
AT1,378
NL2,391
DE31,308
PL2,497
LT 225
UA276
ES 269
LV 68
TR2,312
IR1,738
PT4,525 ES
22,796
FR7,564
SE3,745
FI288
RU15
UK8,445
RO1,905
BG648
GR1,749
Total Europe*:109,581 MW
* Incl. not listed countries. Source: EWEA
RENEWABLES – EU’S AMBITIOUS TARGETS FOR 2020
FACTS AND FIGURES ELECTRICITY GENERAT ION 2013|2014

depending on the specific incentive system in each country. Yet it is impos-sible to operate cost-covering without such incentives. Operators of biomass-fired plants are highly interested in using biomass refined by torrefaction, steam explosion or hydrothermal carbonisation. Refined biomass has a much higher energy density and can be easier integrated into existing power plant processes. Several research projects are dealing with the improvement of mar-ket integration and product features of these fuels.
Decentralised small plants – fuel cells, micro gas turbines, and Stirling en-gines can open up new areas of application for combined heat and power (CHP) generation. These plants are an important technical innovation be-cause they enable exploiting the benefits of combined generation in very small ranges of capacity. This applies in particular to applications in local heating and in the commercial as well as industrial sector. However, these applications need marketable developments, because economically-efficient plant opera-tion is always the decisive factor for project realisation.
Source: Eurostat
Elec
trici
ty g
ener
atio
n in
bill
ion
(109 )
kW
h
United Kingdom
Germany
EU-27
Sweden
Finland
250
200
150
100
50
02007 2008 2009 2010 2011 2020
about 230 billion (109) kWh
Biomass: Development of electricity generation in the EU
PAGE 10 – 11

In 2012, electricity generation from nuclear power was around 2,346 bil-lion kWh worldwide and clearly below the 2011 figure of about 2,500
billion kWh. The decrease in nuclear-based generation is mainly due to the shutdown of Japanese nuclear power plants following the Fukushima event and the political decision in Germany to shut down – first temporarily and then permanently – 8 nuclear power plant units. The share of nuclear power in worldwide electricity generation has been roughly at some 11 %. The EU is the leading economic area worldwide in nuclear energy production with about 840 billion kWh.Since the first commercial nuclear power plant was commissioned in Calder Hall in the United Kingdom in 1956, around 67,950 billion kWh of elec-tricity have been produced on a cumulated basis. This corresponds to about three times the current annual global electricity demand.The growth of nuclear electricity generation in the 1980s is remarkable. Dur-ing that time, large power plant projects with unit outputs in excess of 1,000 MW, which had been launched in the 1970s due to the pressure of the first oil price crisis, went into operation and provided considerable genera-tion capacity. Today, the operation of nuclear power plants is characterised by high availability with a worldwide average of nearly 80 %.
Source: atw 4/2012
100
50
01956 1960 1970 1980 1990 2000 2010
Others
Japan
USA
EU
3,000
2,500
2,000
1,500
1,000
500
0
Elec
trici
ty g
ener
atio
n fro
m n
ucle
ar p
ower
pla
nts
i n b
illio
n (1
09 ) k
Wh
Electricity generation from nuclear power worldwide
Ava
ilabi
lity
in %
Year
NUCLEAR POWER – CONTINUED EXPANSION WORLDWIDE
FACTS AND FIGURES ELECTRICITY GENERAT ION 2013|2014

Finland
Hungary
China
Argentina
Brazil
Lithuania
Mexico
Pakistan
South Africa
Armenia
Netherlands
Romania
Slovenia
Iran
USA
France
Japan
United Kingdom
Russia
Canada
Germany
South Korea
India
Ukraine
Sweden
Spain
Belgium
Taiwan
Bulgaria
Slovakia
Switzerland
Czech Rep.
5
Planned shut downs: 16New build: 70 Projects: 200 (including further projects in 13 countries)
100 + 5 + 18
58 - 2 + 1
49 + 2
16 - 1 + 10
33 + 11 + 16
19 + 7
9 - 9
23 + 5 + 12
21 + 6 + 8
15 + 2
10
7
7
1 - 1 + 1
1
Poland + 4UAE+2 + 2
Vietnam + 4Turkey + 4Belarus + 2
1 + 1
2 + 2
6 + 2
6 + 2
2 + 1
4 + 2 + 2
4 + 1 + 2
18 + 28 + 32
2 + 1
2 +1 + 4
+ 1
3 + 2 + 2
2
2 + 2
1 + 1
4 + 2
Nuclear power plants worldwidein operation: 433
- 2
- 1 Currently (state September 2013) 433 nuclear power plants with a total capacity of
387,072 MW are being operated worldwide in 31 countries: another 67 plants are under construc-tion, while roughly 200 plants are being planned or pre-planned to be commissioned by 2030.Following the Japanese events of March 11, 2011, new built plans were abandoned in Italy and Switzerland only. This does not apply to the plants in e. g. East and South East Europe, Asia, states of the Middle East as well as North and South America. The impact of the current North-American shale-gas boom on local power plant structure as well as plant operation and construc-tion of new nuclear power plants cannot be esti-mated yet.Long-term planable perspectives in terms of elec-tricity generation costs and nuclear fuel supply motivate investors to launch new construction programmes.
Source: IAEA, atw - International Journal for Nuclear Power, state: 9/2013
NUCLEAR POWER: PLANTS, PLANNED SHUTDOWNS, NEW PLANTS AND PROJECTS
PAGE 12 – 13

1970 1980 1990 2000 2010 202010-8
10-7
10-6
10-5
10-4
10-3
10-2
EPR
AP1000
Occurrence frequency of large tsunamis with amplitudes of 10 m or more at Fukushima Daiichi
Cor
e da
mag
e 1 )
frequ
ency
per
yea
r
Kerena
IAEA standard for NPPs in operation
Modernisation of plants
IAEA standard for new plants
Residual risk
US-NPP ofFukushima-type
(without tsunami risk)
Fukushima Daiichiwith tsunami risk
German NPPs
YearThe individual results may be not compared due to different methods and boundary conditions.
Results of Probabilistic Safety Assessment (PSA) studies for nuclear power plants
NUCLEAR IN ENERGY POLICIES AFTER FUKUSHIMA
More than two years after the Fukushima event, the response of the coun-tries which rely on nuclear power can now be evaluated.Firstly it was top priority trying to understand what had happened. We now know that the root cause for the core melting of three reactors and the release of radionuclides in the order of 5 to 10 % of the Chernobyl accident had been insufficient design of the site against large tsunamis with wave heights over 10 m on the Sanriku coast, lately 1933, 1896, 1611, and 869.Second step on all nuclear sites was to check whether comparable deficien-cies against all kinds of external hazards might exist. In the EU, Switzerland, and Ukraine, the so-called “stress test” confirmed that no comparable defi-ciencies existed. Other countries have performed likewise. Furthermore, plant-individual robustness levels were quantified and recommendations for additional accident management measures recommended, where not yet existing.Third step was and is to install the new systems and procedures where neces-sary; this process is still ongoing.
FACTS AND FIGURES ELECTRICITY GENERAT ION 2013|2014

In parallel, all 31 countries with nuclear power plants closely scrutinised their future policies on nuclear. Practically all decided to continue with their plans, simply notifying that no reason exists to shut down plants for reasons of safety or precaution.
In addition, several newcomer countries proceeded with their plans to intro-duce nuclear in their energy mix. Since the Fukushima event, eight countries have in fact started their first new construction projects. Germany is the only country that decided to take its nuclear power plants off the grid.
Abbreviations:EPR: Generation III+ pressurised water reactor, Areva;AP1000: Generation III+ pressurised water reactor, Westinghouse;KERENA: Generation III+ boiling water reactor, Areva;IAEA: International Atomic Energy Agency1) Additional accident management measures reduce the risk of radiologically relevant
events by more than one order of magnitude.Sources: IAEA, VGB
Premature shutdown
BYUAE VN
New projects
Newcomer countries
Unmodified further development
New nuclear build: moratorium
Future path not yet defined
Fixed residual operation time
Abandoning of re-introduction
Consequences Country
PLTR SA JO BD
AR BR CA SE ZA
BG CZ FI GB HR HU IN KR
TW UA US
NL
CH JP
BE ES
IT
DE
IR
MX PK RO RU SK
CN FR LTGermanyShutdowns in 2011
Biblis ABiblis BNeckarwestheim IUnterweser
4 BWRBrunsbüttelIsar 1KrümmelPhilippsburg 1
JapanShutdownsin 20114 BWR
Fukushima Daiichi 1 Fukushima Daiichi 2Fukushima Daiichi 3Fukushima Daiichi 4
4 PWR►►►►
►►►►
►
►
►
►
PAGE 14 – 15
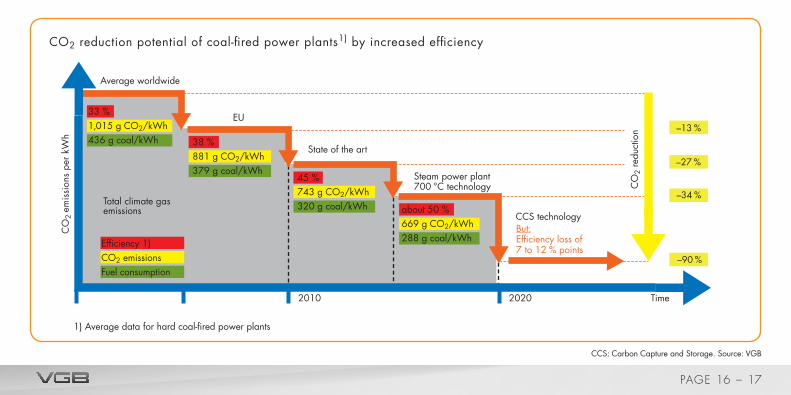
Technological developmentCO2 emissions can be reduced gradually through technological develop-ment. The average worldwide efficiency increased in recent years from 30 to some 33 % due to the large number of new built projects that were realised. The consequent replacement of old plants with low efficiency (current aver-age worldwide efficiency 33 %) with power plants with high efficiencies of 45 to 50 % would clearly decrease the global amount of CO2 emissions. Therefore, the gradual reduction of CO2 emissions by technological devel-opment is the first option.This would result in multiple profit: l Resource protection, l Substantial reduction of CO2 emissions, l Clear reduction of other emissions, and l Increased electricity generation from the same fuel amount.In the long term, electricity could be generated from fossil-sources with only very low CO2 emissions through capture and subsequent underground storage of CO2.
Ideas are developed and turn into innovations offering key technologies for future coal-and gas-fired power plants leading to higher efficiencies and en-vironmental and climate protection.All fossil-fired power plants need higher temperatures and pressures to in-crease efficiency.Thus, research and development in all fields of power plant engineering is being carried out. All components of the new power plant generation have to be designed to meet the new requirements, to be tested and need to be fit for permanent operation. This means among others l Qualification of new materials, l Proving availability of components and of the entire power plant,and l Increasing the flexibility of power plant operation.The way to new power plants starts with component test plants and then via pilot plants to demonstration plants and finally – after having collected suf-ficient operating experience – to power plants that are ready for the market.
EFFICIENT COAL AND GAS POWER PLANTS ARE STILL INDISPENSABLE
FACTS AND FIGURES ELECTRICITY GENERAT ION 2013|2014
Steam power plant700 °C technology
Total climate gasemissions
CO2 reduction potential of coal-fired power plants1) by increased efficiency
CO
2 em
issi
ons
per k
Wh
CCS technology
Average worldwide
EU
State of the art
2010 2020 Time
1) Average data for hard coal-fired power plants
38 %881 g CO2/kWh379 g coal/kWh
33 %1,015 g CO2/kWh436 g coal/kWh
Efficiency 1)CO2 emissionsFuel consumption
about 50 %669 g CO2/kWh288 g coal/kWh
45 %743 g CO2/kWh320 g coal/kWh
CO
2 re
duct
ion –13 %
–27 %
–34 %
–90 %
But:Efficiency loss of7 to 12 % points
CCS: Carbon Capture and Storage. Source: VGB
PAGE 16 – 17

First generation CCS technology was extensively tested in pilot plants and is is now available for use in large-scale demonstration plants. The map
provides an overview of CCS projects in Europe.
In spite of funding under the European Economic Programme for Recovery EEPR to 6 CCS demonstration projects and further available funding volume under the EU New Entrants Reserve NER300 from the auctioning of 300 million EU emission unit allowances, no final investment decisions for dem-onstration plants have been taken yet in Europe. This is due to the public and political resistance towards onshore CO2 storage and the missing perspective for a long-term business case which is challenged by the currently weak carbon price development. In the USA, Canada, and Australia, CCS demonstration plants for the power sector and other industries are already in operation or under construction. The table shows a selection of international projects.
CCS – EUROPEAN AND GLOBAL DEVELOPMENT
CCS in Europe: Overview of current projects
Ketzin
K12-B
Total Lacq
Active CCS project
CCS demonstartion plant in planning
Current or finishedCO2-storage project (research)
Sleipner CO2 Injection
Snøhvit CO2 Injection
Getica
Belchatów (stopped)
Jänschwalde(stopped)
Porto Tolle
OXYCFB 300Compostilla
ROAD
Industrikraft Möre AS Norway
Peterhead Gas CCS
Captain Clean Energy
Teesside Low CarbonWhite Rose
Don Valley
Sources: CCS Network/Global CCS Institute/IZ Klima
FACTS AND FIGURES ELECTRICITY GENERAT ION 2013|2014

Some CCS demonstration projects
Project Country Technology Fuel CO2 capture (Mt/a)
CO2 transport
(km)
CO2 storage
Start of operation
Snøhvit CO2 Injection Norway Natural gas processing Natural gas 0.7 152 offshore, SA 2007Illinois Industrial CCS Decatur USA Ethanol plant, retrofit Corn 1.0 1.6 onshore, SA 2013Kemper County IGCC Project USA Power plant, new build Coal Pre Co. 3.5 75 onshore, EOR 2014Boundary Dam Canada Power plant, retrofit Coal Post Co. 1.0 100 onshore,
EOR, SA2014
ACTL Canada Fertiliser plant and oil refining
Heavy oil 1.8 240 onshore, EOR 2014
Quest Canada H2 production Oil sand, heavy oil
1.2 84 onshore, SA 2015
Gorgon Australia Natural gas processing Natural gas 3.4 to 4.0 7 onshore, SA 2015Rotterdam Opslag en Afvang Demonstratieproject (ROAD)
Netherlands Power plant, new build Coal, biomass Post Co. 1.1 26 offshore, EOR, EGR
?
Don Valley Power Project UK Power plant, new build Coal Pre Co. 4.9 400 offshore, ‚ SA, EOR
?
White Rose CCS Project UK Power plant, new build Coal Oxy 2.0 165 offshore, SA ?Peterhead Gas CCS Project UK Power plant, retrofit Natural gas Post Co. 1.0 102 offshore,
EOR, EGR?
Post Co.: Post combustion, Pre Co.: Pre combustion, Oxy: OxyfuelSA: Saline Aquifere, EOR: Enhanced oil recovery, EGR: Enhanced gas recovery
Source: GCCSI
SEITE 18 – 19PAGE 18 – 19

In the next decades, thermal power plants will remain inevitable in order to guarantee uninterrupted secure power supply, because urgently needed
and economically efficient secondary energy storages like pumped storage plants, disposing of large capacities in the GWh range, will not be realised due to the intervention in landscape. Besides, the topography of numerous countries prevents the further extension of large storage plants.Therefore, conventional thermal power plants are still needed for realising increased in-feed of renewables and to maintain the balance between pow-er generation and consumption. Important services (grid stability) are needed, the following has to be pro-vided:
l Back-up capacity that is available any time l Primary- and secondary control l Minute reserve and idle power l Redispatch capacity and black start capacity
The payment schemes for these important tasks assumed by coal- or gas-fired power plants, must also be adopted in order to create an economi-cally sound basis for control operation and to give incentives for invest-ments in new, highly-efficient plants.
Until now, prices at the energy market (generation without major shares of renewables) were determined by the marginal costs of the different types of power plants. Marginal costs means any costs in addition to fixed costs that accrue when a power plant generates power. The width of the coloured bars represents the capacities of one generation technology available on the market. Marginal costs are shown simply by the bar height.
The example depicted results in a market price M1 (€/MWh), which, from an economical point of view, justifies operation of important system-rele-vant nuclear, lignite-, hard coal-, and gas-fired power plants. If a large amount of renewables-based power is put on the market, the accumulated supply curve is shifted to the right. At equal demand, the market price drops to M2. Gas-fired power plants, formerly in the market and operated economically efficient, are now no longer part of the system.
A system that creates market conditions resulting in low revenues at the whole sale power market due to very high revenues guaranteed to renew-ables and which pushes aside coal- and gas-fired power plants, which are vital for maintaining system stability, needs to be restructured.
MARKET CONDITIONS AND SYSTEM STABILITY
FACTS AND FIGURES ELECTRICITY GENERAT ION 2013|2014

Example for the electricity market price development
Market without feed-in of renewables Market with feed-in of renewables at fixed prices for renewables.
€/M
Wh
M1
€/M
Wh
M1
M2
M2: Market price with renewables at fixed prices for renewable feed-in.M1: Market price without renewables.
Demand Demand
Renewables
Capacity bounced from market suffersfrom reduced operating hours.
Hard coalLigniteNuclear OilNatural gasGW GW
Source: graphic EnBW, VGB
PAGE 20 – 21

SYSTEM – RENEWABLES, BACK-UP CAPACITY, FLEXIBILITY AND STORAGE
Suitable technologies (centralised and distributed) are decisive for meeting the targets of energy policies. Such technologies must have a high availabil-ity and they must be used optimally. The system, comprising “generation–transmission/distribution–consumption” has to be considered holistically.The parameters efficiency, flexibility, and applicability are being focused. Grid structure and connection to necessary control devices guaranteeing sta-bility and reliability are the main aspects for transmission/distribution tech-nologies. Storage technologies will become more important in order to bal-ance the differences between fluctuating in-feed and controllability of plan-able generation. Generation is focused on the efficient use of resources independent of re-newables or conventional generation. Flexibility has a new quality in a changing generation portfolio. Conventional power plants and renewables-based generation must permanently meet changing demand and must take into account permanent changes of generation technologies. Grid control needs permanent supervision to meet consumers demands. The parameters are primary and secondary control, idle power, and inertia of the rotating masses. A stable system, i.e. secure supply, requires provision of
certain services and adequate revenues for these services. Based on the re-quirement that the grid needs to be kept stable at any time, the control in-struments of the grid need to be advanced. A central issue will be which storage technology and to what extend will have to be integrated into the grid. Currently hydro power, i. e. pumped storage plants, are the only mature technology available. New approaches like bat-teries in connection with e-mobility, adiabatic pressurised storage and “power to gas” have to prove themselves.Renewables, and this applies in particular to the weather dependent sources wind and solar power, cannot be considered isolatedly. A system approach calls for consideration of all generation options including storage technolo-gies, grid structure, and consumption. A balanced technology mix is the best guarantee for supply security.
FACTS AND FIGURES ELECTRICITY GENERAT ION 2013|2014

Source: ESA and Booz & Company analysis
Disc
harg
e tim
e at
rate
d po
wer
Hou
rsSe
cond
s
1 kW 10 kW 100 kW 1 MW 10 MW
System power ratings
System power ratings
Min
utes
100 MW 1 GW
Representative storage capital cost
Cap
ital c
ost p
er u
nit e
nerg
y
(US-
$/kW
h ou
tput
) (co
st(ca
paci
ty· e
ffici
ency
))
10,000
1,000
100
10 100 300 1,000 3,000 10,000
Better for UPS & power quality applications
Bette
r for
ene
rgy
man
agem
ent a
pplic
atio
ns
Long durationcapacitors
Rechargeable
CAES*
Li-ion batteries
Zn air batteries
Ni-Cd batteries
Capital cost per unit power in US-$/kW
Lead acidbatteries
NaS batteries
Flow batteries
Metal airbatteries
Pumpedhydro
Long duration fly wheels
High-power supercapacitors
High-power fly wheel
CAES*
Pumpedhydro
Flow batteries
NaS batteryHigh energy
super capacitors
Lead acid batteries
Ni -Cd batteries
Other advanced batteries
High-power fly wheels
High-power super capacitors SMES*
Metal airbatteries
fuel cellsH2
Li-ion batteries
Development of storage technologies for electricity is urgently necessary
* CAES: Compressed air energy storage, SMES: Superconducting magnetic energy storage
PAGE 22 – 23

Between 1990 and 2011, the total greenhouse gas emissions (CO2e) in the European Union (EU-27) decreased by 17 %. These figures were given
in the latest annual EU report on the inventory of greenhouse gas emissions in the EU.In accordance with the Kyoto Protocol, the EU (EU-15) is committed to reduce greenhouse gas emissions by 8 % for the period 1990 to 2008/2012. The European Council has also set an ambitious target of a 20 % reduction by 2020.In addition a global approach is needed: to stabilise and reduce CO2 emis-sions worldwide, action based on the principle of effectiveness and cost ef-ficiency has to be taken.Cost-efficient measures such as insulation of buildings, fossil-fired power plants with higher efficiencies, expanded use of renewables at right locations or further use of nuclear energy, etc. must be applied with priority and with-out prejudice.The International Energy Agency (IEA) developed a stabilisation concept for achieving a reduction to 14 billion tonnes (BLUE MAP scenario) in com-parison to the reference scenario (“Baseline emissions”: 62 billion tonnes CO2 in 2050).e: equivalent
CLIMATE POLICY: GLOBAL APPROACH NEEDED
Source: IEA, Technology Roadmap Carbon Capture and Storage
CCS provides one-fifth of the lowest-costGHG reduction solution in 2050
CO
2 em
issio
ns in
G t
CO
2/a
0
10
20
30
40
50
60
70
2005 2040203020202010 2050
CCS industryand trans-formantion 9 %
Baseline emissions 62 Gt
CCS powergeneration10 %Nuclear 6 %
Renewables 21 %
Power generationefficiency and fuelswitching 7 % End-use fuelswitching 11 %End-useelectricityefficiency 12 %
End-use fuelefficiency 24 %
BLUE MAP emissions 14 Gt
ETP2008 BLUE MAP scenarioWEO2007 450 ppm case
Reduction options
Year
FACTS AND FIGURES ELECTRICITY GENERAT ION 2013|2014

Source: IEA, 2013
0 1 2 3 4 5 6 30
EU-27- 8 %
India+ 28 %
China+ 19 %
World+ 11 %
127
30,276
1,658
3,6597.29
1.39
USA- 7 %
143
CO2 emissions total and per capita from fossil fuel combustion for selected regions for 2010 and changes from 2005 to 2010
billion t CO2 per year
0 1 2 3 4 5 6 20
t CO2 per capita
5,36917.31
7,2586.40
4.44
Source: PSI Paul Scherrer Institut, Switzerland, ESU-services, VGB
Hydro power
Wind
Nuclear
Solar
Gascombined
cycle
Natural gas
Oil
Hard coal
Lignite
CO2 emissions from different power plantsin g CO2 equivalent per kWh,calculated for the life cycle of the power plant
Result range due to different methods of calculationand different site implications.
Electricity generation with CCS
950 to 1,230
790 to 1,080
890
640
410 to 430
35 to 160
16 to 23
8 to 16
4 to 13
BoA technology
PAGE 24 – 25

VGB PowerTech e.V. is the European technical association for electricity and heat generation with head office located in Essen (Germany).Currently VGB has 511 members, comprising operators, manufacturers, and institutions connected with energy engineering.Our members come from 36 countries and represent an installed power plant capacity of 530,000 MW, with 471,000 MW located in Europe.
The activities of VGB PowerTech comprise: l Provision of an international platform for the accumulation, exchange, and transfer of technical know-how.
l Acting as “gate-keeper” and provider of technical know-how for the member companies and other associations of our industry.
l Harmonisation of technical and operational standards. l Identification and organisation of joint R&D activities. l Exclusive member access to qualified expert knowledge. l Representation of members´ interests.VGB is performing these tasks in close cooperation with EURELECTRIC on European- and the German Bundesverband der Energie- und Wasser-wirtschaft (BDEW) on national level as well as further national and interna-tional associations.
Structure of the VGB membership:
Fossil-fired power plants 306,000 MWNuclear power plants 130,000 MWHydro power plants and other renewables 94,000 MWTotal 530,000 MW
EU: 474 members in 21 countriesAustria, Belgium, Croatia, Czech Republic, Denmark, Finland, France, Germany, Greece, Hungary, Ireland, Italy, Luxembourg, The Netherlands, Poland, Portugal, Romania, Slovenia, Spain, Sweden, United Kingdom
Other Europe: 20 members in 4 countriesNorway, Russia, Switzerland, Turkey
Outside Europe: 17 members in 11 countriesArgentina, Australia, Brazil, China, India, Israel, Japan, Libya, Mongolia, South Africa, USA
Total: 511 members in 36 countries
VGB POWERTECH E.V.
FACTS AND FIGURES ELECTRICITY GENERAT ION 2013|2014
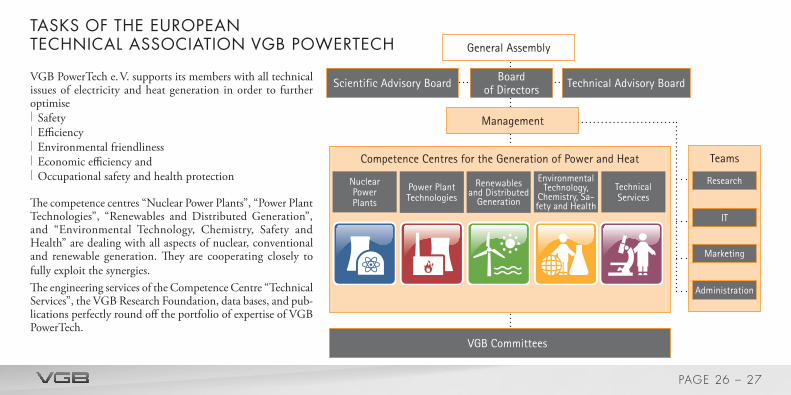
VGB PowerTech e. V. supports its members with all technical issues of electricity and heat generation in order to further optimise l Safety l Efficiency l Environmental friendliness l Economic efficiency and l Occupational safety and health protection
The competence centres “Nuclear Power Plants”, “Power Plant Technologies”, “Renewables and Distributed Generation”, and “Environmental Technology, Chemistry, Safety and Health” are dealing with all aspects of nuclear, conventional and renewable generation. They are cooperating closely to fully exploit the synergies.The engineering services of the Competence Centre “ Technical Services”, the VGB Research Foundation, data bases, and pub-lications perfectly round off the portfolio of expertise of VGB PowerTech.
Competence Centres for the Generation of Power and Heat Teams
Nuclear Power Plants
Technical Services
Power Plant Technologies
Renewables and Distributed
Generation
Environmental Technology,
Chemistry, Sa-fety and Health
Research
Marketing
Administration
IT
VGB Committees
Scientific Advisory Board Technical Advisory BoardBoard of Directors
Management
TASKS OF THE EUROPEAN TECHNICAL ASSOCIATION VGB POWERTECH General Assembly
PAGE 26 – 27

VGB PowerTech e.V. 45163 Essen · Germany
Fon: +49 201 8128 – 0Fax: +49 201 8128 – 329
Published in September 2013Editorial: Erland Christensen (responsible), Heinz Bergmann, Sven Göhring, Ulrich Langnickel, Thomas Linnemann, Hans-Joachim Meier, Ludger Mohrbach and Christopher Weßelmannwww.vgb.org · [email protected]
Related Documents