VET Data Report Germany 2012 Facts and Analyses accompanying the Federal Report on Vocational Education and Training – Selected findings

Welcome message from author
This document is posted to help you gain knowledge. Please leave a comment to let me know what you think about it! Share it to your friends and learn new things together.
Transcript
VET Data Report Germany 2012
Facts and Analyses accompanying the Federal Report on Vocational Education and Training – Selected findings

2
Bibliographic information published by Die Deutsche Bibliothek Die Deutsche Bibliothek lists this publication in the Deutsche Nationalbibliografie; detailed bibliographic data is available in the Internet at http://dnb.ddb.de
Distributed by: Bundesinstitut für Berufsbildung 53142 Bonn Order no.: 09.198 © 2013 by Bundesinstitut für Berufsbildung, Bonn Editor: Bundesinstitut für Berufsbildung, D-53142 Bonn Internet: www.bibb.de E-mail: [email protected] Editing staff: Michael Friedrich, Dr Georg Hanf Lectorate: Dr Georg Hanf Production: Heike Rotthaus Cover: Christiane Zay, Bielefeld Publisher: Bundesinstitut für Berufsbildung Printed in Germany ISBN 978-88555-934-4

3
Preface
Up-to-date education reporting, presented in a structured manner, is an indispensable precondition
for recognizing trends in the development of the VET system and for reacting to them adequately.
Based on empirical data and social research analyses, the Data Report of the Federal Institute for
Vocational Education and Training (BIBB) reports regularly and systematically on the current situation
and the newest developments in vocational education and training. It thereby forms the data basis
for the Report on Vocational Education and Training of the Federal Ministry of Education and
Research (BMBF). Both the editing of the Report on Vocational Education and Training by the BMBF
and the participation of the BIBB in preparing the Report on Vocational Education and Training are
tasks regulated by law in the Vocational Training Act (§§ 86, 90).
This English version of the 2012 Data Report provides a selection of the main findings. The first two
chapters present the current situation in initial vocational training and in continuing vocational
training and highlight changes that have taken place over the course of time. Chapter 3 (‘In focus’)is
on the different forms of transition from school into VET and is looking at the future of the ‘transition
system’. This theme is also addressed in the fourth chapter comparing the German situation to the
situation in other European countries. The chapter finishes with data on mobility as part of VET.
The full text of the report in German as well as additional information is available on the Internet
portal www.bibb.de/datenreport.
We are looking forward to any feedback you may have on the Data Report. We will be pleased to
receiving ideas, remarks and constructive criticism ([email protected]).
Prof Dr Friedrich Hubert Esser
President

4

5
Contents
1 Initial vocational education and training indicators........................ 6
2 Continuing vocational education and training indicators.............. 16
3 In focus: Transitions from school into VET..................................... 23
4 International indicators, system monitoring, mobility.................. 27

6
1 Initial vocational education and training indicators
The dual system is at the core of vocational education and training in Germany. It is based on the
Vocational Training Act of 1969 (amended in 2005). It is the main pathway for the young generation
into employment. Every young person who has completed full-time compulsory education can access
dual vocational training. A characteristic of this educational path are two learning venues: the
company and the part-time vocational school. The companies sign contracts with applicants under
private law and train them in line with the binding provisions of the vocational training directives
which guarantee a national standard. This is monitored by the ‘competent bodies’, mainly the
chambers (of industry and commerce, crafts, agriculture, doctors, lawyers) but also by competent
bodies in the public service or for the purview of the churches.
The dual system provides broad vocational training for 344 recognized training occupations (in 2012).
The programs in the dual system usually take 3 years, some last 2 and some 3 ½ years. After
completing their training in the dual system, the majority of participants then take up employment as
a skilled worker. Later on, many of them make use of the opportunities for continuing vocational
training. Outside the dual system there are also VET pathways in full-time vocational schools (for
about 15% of the age cohort). The programs of these pathways take between 1 and 3 years,
depending on the particular vocational orientation and objective.
Key facts in brief
The number of training contracts newly concluded by September 20, 2011 was 570,140, which is a
slight increase (by 1.8%) compared to the year before. While the number of new contracts increased
significantly in West Germany, by 3.7%, in East Germany the downward trend of recent years
continued. The number of new contracts fell by 7.8%. This decline, however, was almost exclusively
due to the curtailment of non-company training places. Due to the continuing demographic decline,
training opportunities further improved for young people both in West and in East Germany in 2011.
This trend will continue.
The Federal Employment Agency registered about 76,700 unsuccessful apprenticeship applicants as
of September 30, 2011. This shows that a significant number of interested young people can still not
gain access to the dual system of vocational education and training. At the same time, about 35% of
the companies could fill their training places only in part or not at all.
The analyses carried out by the BIBB show that people with migration backgrounds have less
prospects of a successful transition from general education to vocational education and training. This
also applies under otherwise identical conditions (e. g. school leaving certificates). Young people of
Turkish or Arabic origin, in particular, have less good prospects of transition.
In the year 2010, according to the Vocational Education and Training Statistics, there were 1,508,328
young people in dual vocational education and training. Of this total, 1,252,665 were in West
Germany and 287,478 in East Germany. The number has decreased by 4.0% compared to the
previous year. Women are underrepresented at 39.8%. A majority of the training occupations are still
taken up either primarily by women or primarily by men. Thus on the whole there is significant
overall gender segregation to be observed.
7
At the end of 2009, according to the calculations of the BIBB, there were 145,075 trainees
nationwide in some form of publicly funded non-company training. That was all in all 9.6% of all
trainees. In the western states, the number of non-company training contracts decreased by 5.9%,
and in the eastern states there was a massive decrease by 20.5%.
The training beginner rate, i.e. the mathematical proportion of the resident population starting
training in the dual system for the first time, increased in 2010 from 53.5% to 54.9%.
Among the trainees with newly concluded training contracts as at December 31, 2010, 42.9% had
intermediate school leaving certificates and 32.9% had completed lower secondary school. The
proportion of people with university entrance qualifications was 21%.
In 2010, a total of 142,242 training contracts nationwide were dissolved prematurely. The dissolution
rate was 23.0% which is a slight increase compared to the previous year (22.1%). It must be taken
into account here that, as experience has shown, the dissolution rate usually tends to increase in
times of a relaxing training place market.
The number of enterprises providing training declined in 2010. At the end of the reporting year,
468,800 enterprises participated in providing training. The training company rate declined by one
percentage point to 22.5%. That is the lowest rate since 1999. This decline in the training company
rate was, to a very large extent, due to developments in smaller enterprises.
According to the results of the IAB Establishment Panel survey the rate of trainee hiring, i.e. the rate
at which successful graduates of vocational education and training are hired by the companies, was
61%. In the eastern states the hiring rates are considerably lower than in the western states.
The German Qualifications Framework Working Group has adopted a position regarding the
implementation of the European Qualifications Framework (EQF) in a German Qualifications
Framework (GQF). According to this position, all two-year initial VET occupations will be linked to
Level 3 and all three-and-a-half-year training occupations to Level 4 in blanket terms. The certificates
of master, specialised administrative assistant and technician are supposed to be linked to Level 6.
Newly concluded training contracts by area of responsibility
In comparison to the previous year, when we consider areas of responsibility nationwide, we see
clear differences in the development of newly concluded training contracts (Table 1, Table2).
Where as the manufacturing and commerce training sector registered a clear increase (+ 11,739
or + 3.5%), the number of new contracts in the crafts (+ 67 or + 0.0%) and the liberal professions
(+ 171 or + 0.4%) remained about the same. In the public service training sector there was a con-
siderable decrease (- 1,152 or 8.5%), and the number of new contracts was lower in 2011 than in the
previous year in the agricultural (- 417 or 3.0%) and home economics (- 237 or 6.6%) sectors as well.
Differentiating by regions, in East Germany less new training contracts were signed in 2011 than in
2010 in all sectors except maritime transport. In West Germany, however, there was an increase in
the manufacturing and commerce, crafts, agriculture, liberal professions and maritime transport
sectors, and it was especially noticeable in the manufacturing and commerce sector at plus 5.7%
(+ 15,524).
8
Tertiarisation of the dual system of vocational education and training (shift towards the service sector)
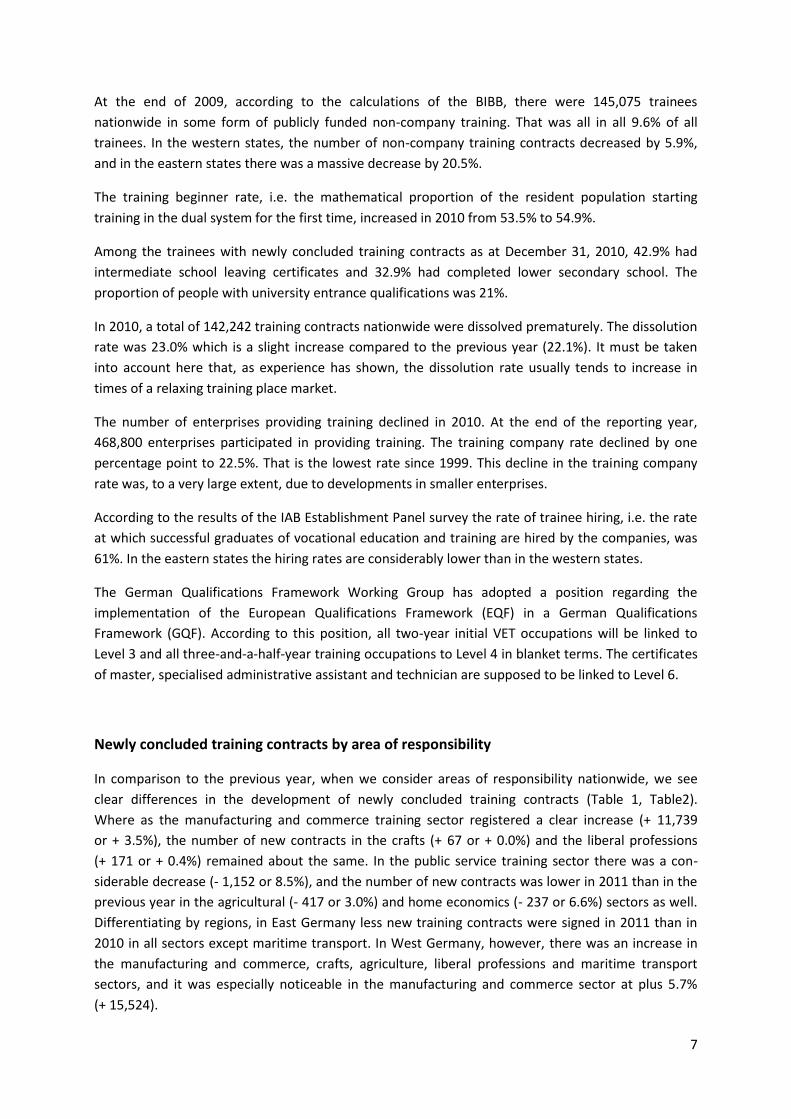
There has been a pronounced tertiarisation of the supply of training places in the dual system of vocational education and training in the past two decades. In 1994 the relationship between the places offered in the service and the manufacturing occupations was still balanced, but in 2011 110,700 more training places were offered in the service occupations than in the manufacturing occupations. In 2011, 56.3% of all training places offered were for occupations in the tertiary sector (Figure 1).
Among the total of 10 most populated training occupations in the dual system there are 6 primary service occupations, 2 secondary service occupations and 2 manufacturing occupations.
Figure 1: Newly concluded training contracts in manufacturing and service occupations by gender, federal territory, 1993 to 2010
300.000
250.000
200.000
150.000
100.000
50.000
0
300.000
250.000
200.000
150.000
100.000
50.000
0
1 Differentiation of vocational groups by focus of activity according to the BIBB; following Kupka/Biersack (IAB) 2005, modified according to Hall 2007; see Uhly/Troltsch 2009 and http://www.bibb.de/dokumente/pdf/a21_dazubi_berufsliste-p-dl_2010.pdf.
Source: "Trainee Database" of the Federal Institute for Vocational Education and Training, based on data from the Vocational Education and Training Statistics of the Federal and Länder statistical offices (survey for the period up to December 31), 1993–2010 reporting years. Absolute values rounded to multiples of 3 for reasons of data protection; the total value may therefore deviate from the sum of the individual values.
New contracts, women New contracts, men
manufacturing occupations service occupations, total primary service occupations secondary service occupations
1993
1994
1995
1996
1997
1998
1999
2000
2001
2002
2003
2004
2005
2006
2007
2008
2009
2010
1993
1994
1995
1996
1997
1998
1999
2000
2001
2002
2003
2004
2005
2006
2007
2008
2009
2010
9
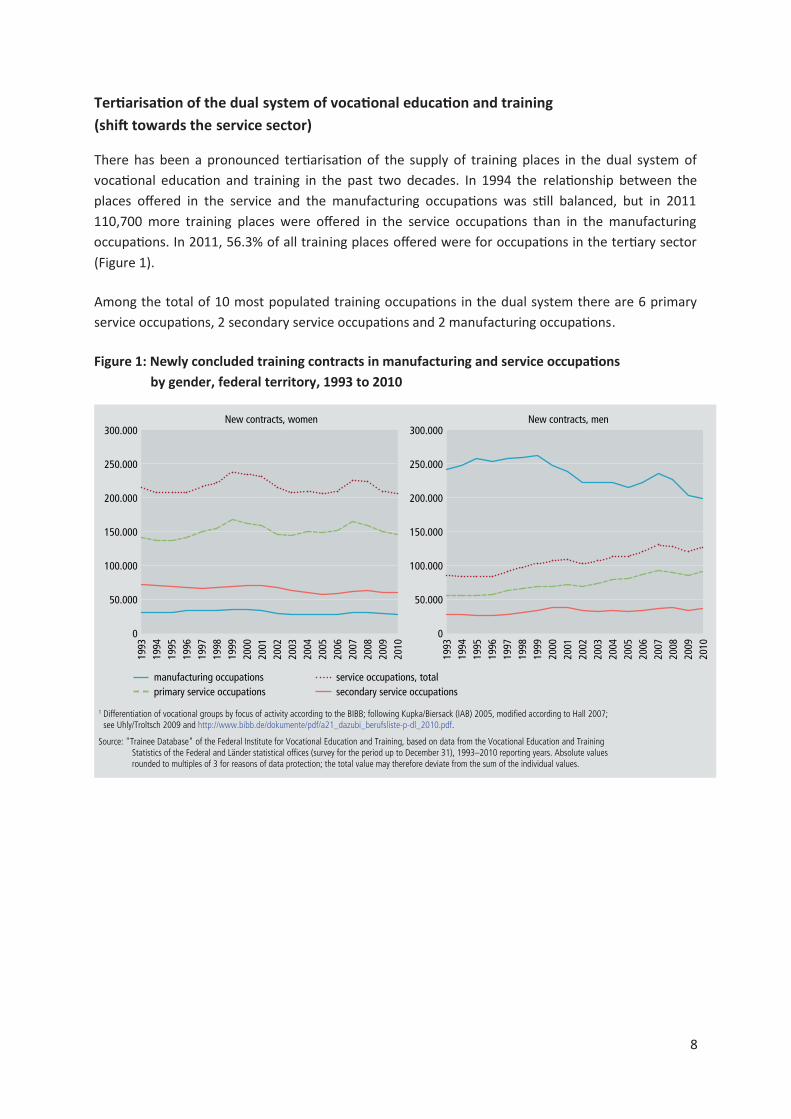
Development of the number of trainees, 1977-2010 ("old federal states")
After reaching a high point in the middle of the eighties, the number of trainees in the old federal states declined; since 1992 it has varied between approx. 1.35 and 1.25 million. In the new federal states the number has varied between 320,000 and 250,000 in the same period – with an interim high in 1997 (Figure 2).
Figure 2: Trainees in the old federal states, including Berlin, 1977 to 2010 (West Berlin only before 1991)
*The number of foreign trainees has been registered separately starting in 1982.
Source: "Trainee Database" of the Federal Institute for Vocational Education and Training, based on data from the Vocational Education and Training Statistics of the Federal and Länder statistical offices (survey for the period up to December 31), 1977 to 2010 reporting years
2.000.000
1.600.000
1.200.000
800.000
400.000
01977
Trainees, total Female trainees Foreign trainees*
1980 1983 1986 1989 1992 1995 1998 2001 2004 2007 2010

10
Tabl
e 1:
Dev
elop
men
t of t
he n
umbe
r of n
ewly
con
clud
ed tr
aini
ng c
ontr
acts
by
area
of r
espo
nsib
ility
bet
wee
n 19
92 a
nd 2
011
Re
sult
s in
th
e c
ou
nti
ng
pe
rio
d f
rom
Oct
ob
er
1 o
f th
e p
revio
us
ye
ar
to S
ep
tem
be
r 30
2011 f
rom
2010
1992
1993
1994
1995
1996
1997
1998
1999
2000
2001
2002
2003
2004
2005
2006
2007
2008
2009
2010
2011
ab
so-
lute
%
Ge
rma
ny
Indu
stry
and
co
mm
erce
295.
927
265.
986
258.
540
263.
170
268.
039
286.
239
311.
663
333.
551
334.
418
337.
221
311.
363
308.
565
322.
759
316.
165
336.
935
367.
484
369.
194
333.
404
331.
043
342.
782
11.7
393,
5
Cra
fts
192.
491
203.
939
215.
107
219.
245
215.
148
211.
571
212.
382
210.
550
199.
482
188.
464
173.
888
165.
783
168.
290
157.
025
162.
604
179.
698
170.
069
155.
582
155.
178
155.
245
670,
0
Publ
ic s
ervi
ce1,
225
.402
24.6
7218
.443
14.1
8015
.901
16.5
2015
.198
14.9
4015
.577
15.3
8014
.815
13.8
2215
.130
14.1
7114
.082
13.4
1213
.228
13.7
2413
.555
12.4
03-1
.152
-8,5
Agr
icul
ture
12.7
4012
.404
12.2
6812
.954
14.3
0215
.504
15.7
6215
.654
14.7
3513
.695
13.9
9115
.010
15.1
9114
.785
15.8
1315
.902
15.3
2814
.646
13.9
2213
.505
-417
-3,0
Libe
ral
prof
essi
ons1
63.1
0258
.938
59.0
5758
.256
56.1
4353
.075
51.8
6251
.043
52.4
9354
.318
53.2
5449
.408
46.5
3843
.617
42.1
1044
.556
43.9
4742
.675
42.4
4142
.612
171
0,4
Hom
e ec
ono-
mic
s1
5.37
74.
035
4.53
54.
828
4.64
54.
460
5.50
65.
118
4.84
85.
026
4.83
04.
899
4.87
64.
119
4.32
04.
474
4.27
13.
997
3.58
23.
345
-237
-6,6
Mar
itim
e tr
ansp
ort
176
146
132
141
149
148
156
159
140
134
182
147
196
298
289
359
305
279
239
248
93,
8
tota
l595.2
15
570.1
20
568.0
82
572.7
74
574.3
27
587.5
17
612.5
29
631.0
15
621.6
93
614.2
38
572.3
23
557.6
34
572.9
80
550.1
80
576.1
53
625.8
85
616.3
42
564.3
07
559.9
60
570.1
40
10.1
80
1,8
We
st G
erm
an
y
Indu
stry
and
co
mm
erce
239.
334
213.
998
195.
985
200.
120
200.
908
216.
719
234.
868
250.
545
255.
997
258.
693
237.
339
234.
092
246.
836
244.
095
259.
002
289.
372
296.
933
271.
025
273.
904
289.
428
15.5
245,
7
Cra
fts
158.
070
160.
152
162.
689
162.
953
160.
062
159.
756
163.
246
162.
037
156.
484
150.
025
139.
477
133.
536
135.
936
127.
679
131.
660
147.
561
142.
481
131.
842
132.
724
134.
963
2.23
91,
7
Publ
ic s
ervi
ce1,
219
.830
19.0
0913
.254
10.8
1711
.919
12.3
5211
.483
11.4
8611
.710
11.5
2111
.214
10.6
0611
.432
10.9
5110
.765
10.1
4510
.149
10.5
6210
.697
9.89
2-8
05-7
,5
Agr
icul
ture
10.1
719.
544
9.51
29.
330
10.3
7411
.037
11.0
5010
.719
10.1
779.
221
9.49
210
.061
10.3
9510
.095
10.9
7411
.357
11.1
7311
.133
10.6
6810
.772
104
1,0
Libe
ral
prof
essi
ons1
54.3
7551
.410
50.7
2949
.588
47.8
8044
.986
44.2
2843
.880
45.1
8247
.173
46.4
6743
.127
40.6
6938
.377
36.7
7039
.018
38.6
7837
.537
37.4
1837
.864
446
1,2
Hom
e ec
ono-
mic
s1
3.01
82.
700
3.09
53.
143
3.35
73.
333
3.71
53.
404
3.40
53.
419
3.28
73.
188
3.42
32.
685
2.77
53.
006
2.89
62.
942
2.66
22.
494
-168
-6,3
Mar
itim
e tr
ansp
ort
156
146
124
131
148
140
142
142
127
131
150
137
185
280
269
328
294
268
224
232
83,
6
tota
l484.9
54
456.9
59
435.3
88
436.0
82
434.6
48
448.3
23
468.7
32
482.2
13
483.0
82
480.1
83
447.4
26
434.7
47
448.8
76
434.1
62
452.2
15
500.7
87
502.6
04
465.3
09
468.2
97
485.6
45
17.3
48
3,7
Ea
st G
erm
an
y
Indu
stry
and
co
mm
erce
56.5
9351
.988
62.5
5563
.050
67.1
3169
.520
76.7
9583
.006
78.4
2178
.528
74.0
2474
.473
75.9
2372
.070
77.9
3378
.112
72.2
6162
.379
57.1
3953
.354
-3.7
85-6
,6
Cra
fts
34.4
2143
.787
52.4
1856
.292
55.0
8651
.815
49.1
3648
.513
42.9
9838
.439
34.4
1132
.247
32.3
5429
.346
30.9
4432
.137
27.5
8823
.740
22.4
5420
.282
-2.1
72-9
,7
Publ
ic s
ervi
ce1,
25.
572
5.66
35.
189
3.36
33.
982
4.16
83.
715
3.45
43.
867
3.85
93.
601
3.21
63.
698
3.22
03.
317
3.26
73.
079
3.16
22.
858
2.51
1-3
47-1
2,1
Agr
icul
ture
2.56
92.
860
2.75
63.
624
3.92
84.
467
4.71
24.
935
4.55
84.
474
4.49
94.
949
4.79
64.
690
4.83
94.
545
4.15
53.
513
3.25
42.
733
-521
-16,
0
Libe
ral
prof
essi
ons1
8.72
77.
528
8.32
88.
668
8.26
38.
089
7.63
47.
163
7.31
17.
145
6.78
76.
281
5.86
95.
240
5.34
05.
538
5.26
95.
138
5.02
34.
748
-275
-5,5
Hom
e ec
ono-
mic
s1
2.35
91.
335
1.44
01.
685
1.28
81.
127
1.79
11.
714
1.44
31.
607
1.54
31.
711
1.45
31.
434
1.54
51.
468
1.37
51.
055
920
851
-69
-7,5
Mar
itim
e tr
ansp
ort
20–
810
18
1417
133
3210
1118
2031
1111
1516
16,
7
tota
l110.2
61
113.1
61
132.6
94
136.6
92
139.6
79
139.1
94
143.7
97
148.8
02
138.6
11
134.0
55
124.8
97
122.8
87
124.1
04
116.0
18
123.9
38
125.0
98
113.7
38
98.9
98
91.6
63
84.4
95
-7.1
68
-7,8
1 Ex
clud
ing
new
ly c
oncl
uded
tra
inin
g co
ntra
cts
in t
he r
espo
nsib
ility
of
othe
r co
mpe
tent
bod
ies
(Cha
mbe
rs).
2 Ex
clud
ing
trai
ning
for
a c
aree
r in
the
civ
il se
rvic
eSo
urce
: Fed
eral
Inst
itute
for
Voc
atio
nal E
duca
tion
and
Trai
ning
, dat
a co
llect
ed f
or t
he p
erio
d up
to
Sept
embe
r 30

11
Tabl
e 2:
Dev
elop
men
t of t
he n
umbe
r of t
rain
ing
plac
es offe
red
from
199
4 to
201
1 by
occ
upati
onal
gro
up
BK
ZO
ccu
pa
tio
n g
rou
pS
up
ply
of
tra
inin
g p
lace
s (n
ew
ly c
on
clu
de
d t
rain
ing
co
ntr
act
s p
lus
un
fi ll
ed
tra
inin
g p
lace
s a
s re
po
rte
d b
y S
ep
tem
be
r 30
)C
ha
ng
es
2011
fr
om
201
0
1994
1995
1996
1997
1998
1999
2000
2001
2002
2003
2004
2005
2006
2007
2008
2009
2010
2011
ab
solu
tein
%
01-0
6pl
ant
culti
vatio
n, s
tock
bree
ding
, fi s
hing
16.3
4817
.568
18.9
6619
.570
19.4
4319
.457
18.2
3817
.737
17.4
3317
.781
18.5
7215
.785
16.8
4316
.911
16.0
9815
.278
14.5
2013
.964
-556
-3,8
07-0
8m
inin
g, s
tone
cut
ting
198
338
285
222
209
172
146
126
154
160
181
213
210
171
198
205
170
165
-5-2
,9
10-1
1st
one
proc
essi
ng, c
onst
ruct
ion
mat
eria
ls p
rodu
ctio
n1.
613
1.63
51.
648
1.64
91.
583
1.37
61.
354
1.15
91.
030
1.03
91.
144
977
978
932
927
769
828
953
125
15,1
12-1
3po
tter
y, g
lass
mak
ing
624
658
654
701
684
644
689
696
610
563
621
619
632
715
725
562
586
641
559,
4
14-1
5ch
emis
try
wor
k, p
last
ics
proc
essi
ng3.
072
3.46
83.
701
3.98
04.
437
4.35
44.
509
4.63
14.
346
4.59
14.
690
4.50
94.
804
5.39
65.
384
4.33
34.
693
5.36
667
314
,3
16pa
per
man
ufac
turin
g an
d pr
oces
sing
580
657
728
767
790
792
902
914
754
796
784
545
753
834
749
653
698
741
436,
2
17pr
intin
g3.
860
3.81
74.
072
4.68
55.
710
6.48
57.
629
7.82
86.
418
5.79
95.
969
5.62
16.
195
6.69
96.
860
5.54
55.
484
5.66
818
43,
4
18w
ood
proc
essi
ng a
nd r
elat
ed
occu
patio
ns56
860
156
560
555
649
854
541
437
339
341
037
742
044
035
825
729
128
2-9
-3,1
19-3
0,
32m
etal
wor
king
106.
604
107.
191
105.
515
104.
039
107.
012
105.
596
103.
136
103.
227
96.1
5794
.489
94.8
0086
.685
90.7
6610
1.50
710
0.52
486
.083
84.3
4991
.290
6.94
18,
2
31el
ectr
ical
wor
k38
.617
37.8
8235
.972
35.4
2237
.689
39.4
4739
.692
40.4
1137
.108
34.1
0933
.363
32.2
8232
.769
35.9
3937
.365
33.2
4933
.321
36.2
402.
919
8,8
33-3
7te
xtile
, clo
thin
g, le
athe
r oc
cupa
tions
5.86
85.
221
5.12
44.
993
4.77
44.
798
4.36
94.
254
3.65
33.
346
3.11
92.
083
2.37
12.
597
2.29
61.
964
2.00
12.
063
623,
1
39-4
3fo
od p
roce
ssin
g30
.724
29.6
8531
.349
32.3
8033
.404
34.6
2134
.446
33.9
8832
.531
32.6
5133
.970
31.0
4032
.536
33.3
2330
.886
28.7
9528
.153
25.9
46-2
.207
-7,8
44-5
1co
nstr
uctio
n an
d re
late
d oc
cupa
-tio
ns, i
nclu
ding
joi
ner
102.
377
103.
785
95.0
1288
.855
87.6
5686
.515
77.9
1068
.578
60.8
1857
.317
57.0
4247
.305
50.6
3555
.787
51.2
2147
.163
47.5
4547
.439
-106
-0,2
52-5
5go
ods
insp
ectio
n an
d sh
ippi
ng,
mac
hine
ope
ratio
n1.
450
1.78
61.
852
2.05
52.
256
2.64
82.
689
2.76
42.
914
3.43
810
.054
12.2
967.
771
10.2
7710
.629
9.64
210
.186
10.4
1823
22,
3
62-6
4te
chni
cal o
ccup
atio
ns13
.880
13.7
3912
.757
12.3
2112
.270
11.7
9511
.022
10.8
679.
807
9.54
09.
483
8.51
68.
857
9.58
69.
943
8.81
78.
472
9.53
81.
066
12,6
66-7
0go
ods
and
serv
ice
spec
ialis
ts11
5.95
111
1.51
111
1.94
411
6.54
412
3.09
413
1.28
213
0.30
412
7.51
811
7.29
711
2.66
011
8.63
211
9.15
312
8.14
913
9.42
314
0.25
313
3.09
313
4.13
014
3.10
28.
972
6,7
71-7
4tr
ansp
ort
occu
patio
ns4.
960
4.70
95.
965
7.24
87.
360
7.33
07.
745
8.29
98.
149
8.96
14.
640
3.96
411
.566
14.6
8015
.322
13.6
9016
.079
18.4
872.
408
15,0
75-7
8or
gani
satio
n, a
dmin
istr
atio
n,
offi c
e oc
cupa
tions
89.1
0489
.282
90.8
3596
.510
101.
151
107.
946
110.
387
111.
299
101.
207
97.9
3699
.794
93.7
5295
.498
100.
997
100.
430
92.0
2892
.464
95.0
252.
561
2,8
79-8
7se
curit
y oc
cupa
tions
, art
istic
oc-
cupa
tions
, hea
lth s
ervi
ce, s
ocia
l an
d te
achi
ng o
ccup
atio
ns
40.2
6539
.814
38.2
2835
.862
36.3
6835
.951
37.9
7139
.610
38.7
7036
.675
35.4
0534
.439
34.1
9737
.097
37.4
1236
.047
36.5
2636
.753
227
0,6
90-9
3bo
dy c
are,
hos
pita
lity,
hom
e ec
onom
ics,
cle
anin
g oc
cupa
tions
45.5
6843
.639
44.1
0644
.972
49.4
8752
.749
53.7
0254
.450
50.7
9650
.229
53.7
0050
.900
54.0
6158
.826
56.2
4851
.411
47.1
1844
.357
-2.7
61-5
,9
98-9
9re
mai
ning
occ
upat
ions
00
00
00
00
00
011
.755
11.5
4312
.107
12.0
2111
.978
11.9
5111
.391
-560
-4,7
Tota
l62
2.23
461
6.98
860
9.27
461
3.38
163
5.93
365
4.45
464
7.38
363
8.77
359
0.32
857
2.47
458
6.35
856
2.81
659
1.55
464
4.24
463
5.84
958
1.56
257
9.56
559
9.82
920
.264
3,5
of w
hich
man
ufac
turin
g oc
cupa
tion
(10–
55)
295.
958
296.
387
286.
189
280.
131
286.
550
287.
773
277.
869
268.
864
246.
714
238.
532
245.
966
224.
339
230.
630
254.
446
247.
924
219.
015
218.
135
227.
047
8.91
24,
1
serv
ice
occu
patio
ns (6
6–93
)29
5.84
928
8.95
629
1.07
730
1.13
731
7.46
133
5.25
734
0.10
834
1.17
731
6.22
030
6.46
131
2.17
230
2.20
832
3.47
135
1.02
334
9.66
532
6.26
932
6.31
733
7.72
411
.407
3,5
othe
r oc
cupa
tions
(01–
09, 6
0–63
, 98
–99)
30.4
2731
.645
32.0
0832
.113
31.9
2231
.424
29.4
0628
.730
27.3
9527
.481
28.2
3636
.269
37.4
5338
.775
38.2
6036
.278
35.1
1335
.058
-55
-0,2
The
supp
ly s
truc
ture
from
199
4 to
200
5 w
as e
stim
ated
usi
ng t
he t
rain
ing
mar
ket
data
of t
he F
eder
al S
tatis
tical
Offi
ce a
s at
Dec
embe
r 31
. – T
he v
ocat
iona
l gro
ups
66–9
3 ac
cord
ing
to t
he 1
992
occu
patio
n cl
assi
fi cat
ion
of t
he F
eder
al S
tatis
tical
Offi
ce a
re g
roup
ed
here
as
serv
ice
occu
patio
ns. T
he m
anuf
actu
ring
occu
patio
ns c
ompr
ise
the
voca
tiona
l gro
ups
10–5
5. T
he o
ther
occ
upat
ions
incl
ude
the
tech
nica
l occ
upat
ions
(62–
64),
the
plan
t cu
ltiva
tion,
sto
ckbr
eedi
ng a
nd fi
shin
g oc
cupa
tions
(01–
06),
the
min
ing
and
ston
e cu
ttin
g oc
cupa
tions
(07–
08) a
nd n
ot c
lear
ly a
ssig
nabl
e oc
cupa
tions
(98–
99).
Sour
ces:
Fed
eral
Em
ploy
men
t Age
ncy;
Fed
eral
Sta
tistic
al O
ffi ce
; Fed
eral
Inst
itute
for V
ocat
iona
l Edu
catio
n an
d Tr
aini
ng; c
alcu
latio
ns o
f the
BIB
B
12
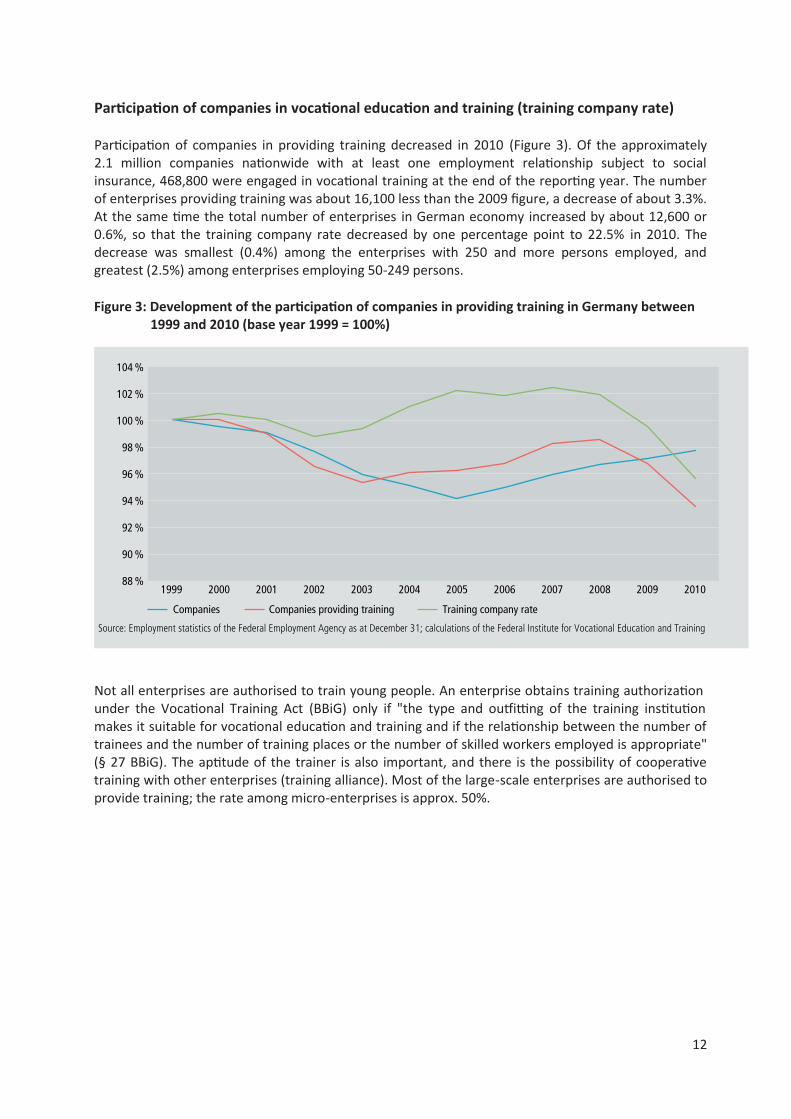
Participation of companies in vocational education and training (training company rate)
Participation of companies in providing training decreased in 2010 (Figure 3). Of the approximately 2.1 million companies nationwide with at least one employment relationship subject to social insurance, 468,800 were engaged in vocational training at the end of the reporting year. The number of enterprises providing training was about 16,100 less than the 2009 figure, a decrease of about 3.3%. At the same time the total number of enterprises in German economy increased by about 12,600 or 0.6%, so that the training company rate decreased by one percentage point to 22.5% in 2010. The decrease was smallest (0.4%) among the enterprises with 250 and more persons employed, and greatest (2.5%) among enterprises employing 50-249 persons.
Figure 3: Development of the participation of companies in providing training in Germany between 1999 and 2010 (base year 1999 = 100%)
Not all enterprises are authorised to train young people. An enterprise obtains training authorization under the Vocational Training Act (BBiG) only if "the type and outfitting of the training institution makes it suitable for vocational education and training and if the relationship between the number of trainees and the number of training places or the number of skilled workers employed is appropriate" (§ 27 BBiG). The aptitude of the trainer is also important, and there is the possibility of cooperative training with other enterprises (training alliance). Most of the large-scale enterprises are authorised to provide training; the rate among micro-enterprises is approx. 50%.
104 %
102 %
100 %
98 %
96 %
94 %
92 %
90 %
88 %
Source: Employment statistics of the Federal Employment Agency as at December 31; calculations of the Federal Institute for Vocational Education and Training
1999 2000 2001 2002 2003 2004 2005 2006 2007 2008 2009 2010
Companies Companies providing training Training company rate
13
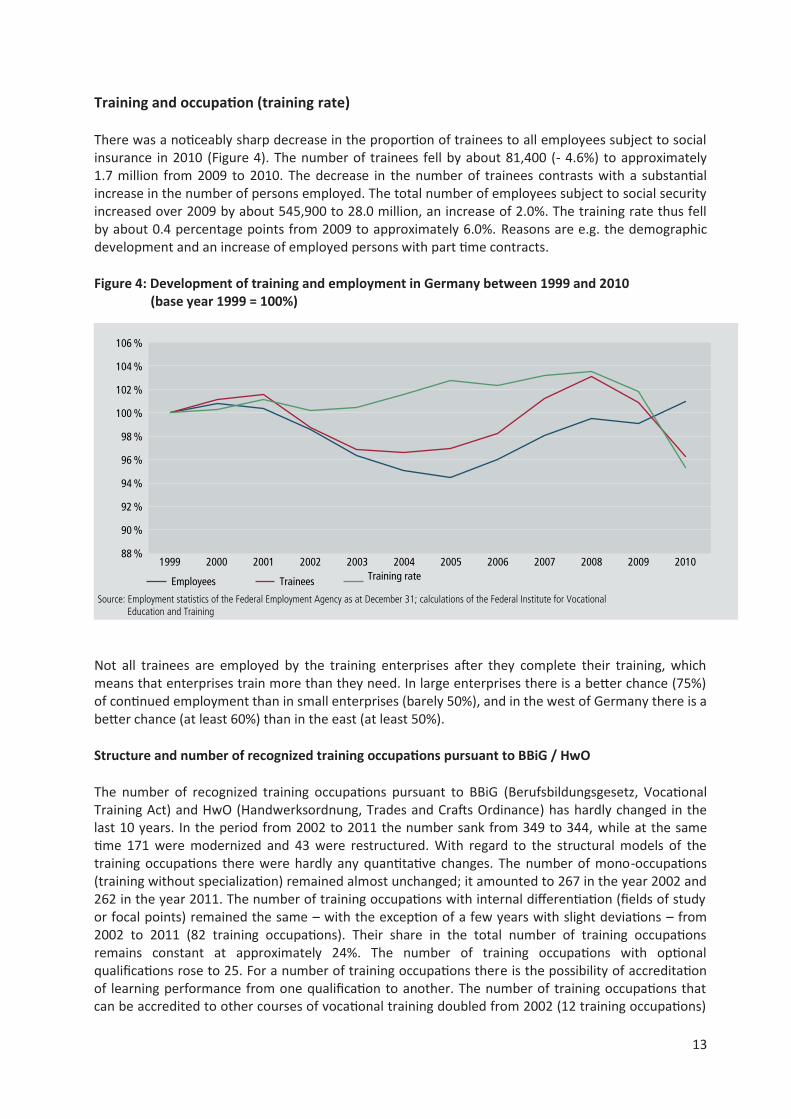
Training and occupation (training rate)
There was a noticeably sharp decrease in the proportion of trainees to all employees subject to social insurance in 2010 (Figure 4). The number of trainees fell by about 81,400 (- 4.6%) to approximately 1.7 million from 2009 to 2010. The decrease in the number of trainees contrasts with a substantial increase in the number of persons employed. The total number of employees subject to social security increased over 2009 by about 545,900 to 28.0 million, an increase of 2.0%. The training rate thus fell by about 0.4 percentage points from 2009 to approximately 6.0%. Reasons are e.g. the demographic development and an increase of employed persons with part time contracts.
Figure 4: Development of training and employment in Germany between 1999 and 2010 (base year 1999 = 100%)
Not all trainees are employed by the training enterprises after they complete their training, which means that enterprises train more than they need. In large enterprises there is a better chance (75%) of continued employment than in small enterprises (barely 50%), and in the west of Germany there is a better chance (at least 60%) than in the east (at least 50%).
Structure and number of recognized training occupations pursuant to BBiG / HwO
The number of recognized training occupations pursuant to BBiG (Berufsbildungsgesetz, Vocational Training Act) and HwO (Handwerksordnung, Trades and Crafts Ordinance) has hardly changed in the last 10 years. In the period from 2002 to 2011 the number sank from 349 to 344, while at the same time 171 were modernized and 43 were restructured. With regard to the structural models of the training occupations there were hardly any quantitative changes. The number of mono-occupations (training without specialization) remained almost unchanged; it amounted to 267 in the year 2002 and 262 in the year 2011. The number of training occupations with internal differentiation (fields of study or focal points) remained the same – with the exception of a few years with slight deviations – from 2002 to 2011 (82 training occupations). Their share in the total number of training occupations remains constant at approximately 24%. The number of training occupations with optional qualifications rose to 25. For a number of training occupations there is the possibility of accreditation of learning performance from one qualification to another. The number of training occupations that can be accredited to other courses of vocational training doubled from 2002 (12 training occupations)
106 %
104 %
102 %
100 %
98 %
96 %
94 %
92 %
90 %
88 %
Source: Employment statistics of the Federal Employment Agency as at December 31; calculations of the Federal Institute for Vocational Education and Training
1999 2000 2001 2002 2003 2004 2005 2006 2007 2008 2009 2010
Employees Trainees Training rate

14
to 2011 (24 training occupations). In the same period the number of training occupations to which credit from other training occupations can be assigned rose from 25 (2002) to 65 (2011).
Financing and costs of training
Total public expenditure for vocational education and training in 2010 amounted to approx. €13 billion, although this figure also included some support for continuing education and training. Part-time vocational schools received €3.1 billion, full-time vocational schools providing full initial vocational training approx. €2.25 billion.
The in-company part of the dual system of vocational education and training is funded by contributions from the training enterprises in the private sector and in the public service. According to calculations based on a representative survey for the year 2007, the gross costs, that is the costs of training without consideration of the training yields, amounted to approx. €23.8 billion, or approx. €15,300 per trainee and year. The net costs amounted to €5.6 billion, at approx. €3,600 per trainee and year, although the net costs too are counterbalanced by returns that are difficult to quantify, such as savings on recruitment costs or an image improvement. The more productive deployment of the trainees in the enterprises sharply reduced the net costs in recent years.
Training personnel in in-company training
Under the statutory provisions, only persons who are suitable both personally and professionally are allowed to provide training in the dual system of education and training. Professional suitability includes both the skills, knowledge and capabilities required for the occupation concerned and the relevant professional and pedagogical qualifications. As a rule, only those who are responsible for the planning and carrying out of training must demonstrate their professional and pedagogical aptitude. The companies register these employees with the competent authorities. Of the training staff registered as responsible, however, only a minority (about 10%) are concerned exclusively with this task. The vast majority provide training as a sideline. In the year 2010 a total of 675,198 persons were registered as trainers in the training sectors of manufacturing and commerce, crafts, agriculture, public service, liberal professions and home economics in Germany.
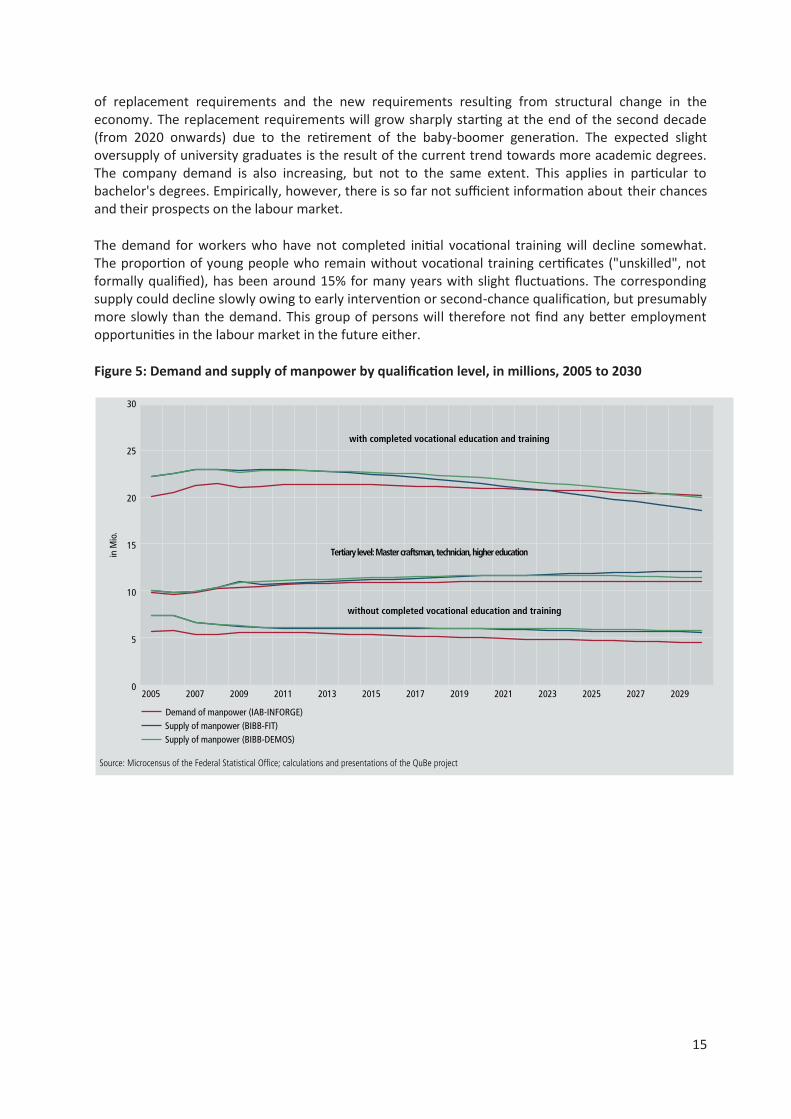
Supply and demand of qualifications up to the year 2030
According to calculations by the Federal Institute for Vocational Education and Training (BIBB) and the Institute for Employment Research (IAB)1, the labour supply will increasingly decline more sharply than the labour demand owing to the demographic development (Figure 5).
The supply of persons who have completed initial vocational education and training will decline owing mostly to demographic factors and – provided there is no change in behaviour on the labour demand side – would be no longer able to meet the demand by about 2030. Even before that time, at this level of qualifications, we will face a rapidly increasing skilled manpower bottleneck is to be expected, mostly because the supply will increasingly not correspond to the demand in terms of the field of training. The demand for skilled labour will decline only slightly owing to the wage increases attainable as a result of the bottlenecks in the labour market.
In the tertiary education sector, both supply and demand will continue to increase – they are closely matched today. The expected demand for university graduates consists of approximately equal parts
1 Helmrich et al. (2012): Shortages on the labour market: Changes in education and employment behaviour will mitigate
shortages of skilled workers. New findings from the BIBB-IAB qualifications and occupational-field projections for the period up to the year 2030. Federal Institute for Vocational Education and Training (eds.), BIBB Report 6 (2012) 18. Bielefeld 2012
15
of replacement requirements and the new requirements resulting from structural change in the economy. The replacement requirements will grow sharply starting at the end of the second decade (from 2020 onwards) due to the retirement of the baby-boomer generation. The expected slight oversupply of university graduates is the result of the current trend towards more academic degrees. The company demand is also increasing, but not to the same extent. This applies in particular to bachelor's degrees. Empirically, however, there is so far not sufficient information about their chances and their prospects on the labour market.
The demand for workers who have not completed initial vocational training will decline somewhat. The proportion of young people who remain without vocational training certificates ("unskilled", not formally qualified), has been around 15% for many years with slight fluctuations. The corresponding supply could decline slowly owing to early intervention or second-chance qualification, but presumably more slowly than the demand. This group of persons will therefore not find any better employment opportunities in the labour market in the future either.
Figure 5: Demand and supply of manpower by qualification level, in millions, 2005 to 2030
30
25
20
15
10
5
0
Source: Microcensus of the Federal Statistical Office; calculations and presentations of the QuBe project
2005 2007 2009 2011 2013 2015 2017 2019 2021 2023 2025 2027 2029
in M
io.
Tertiary level: Master craftsman, technician, higher education
without completed vocational education and training
with completed vocational education and training
Demand of manpower (IAB-INFORGE) Supply of manpower (BIBB-FIT) Supply of manpower (BIBB-DEMOS)

16
2 Continuing vocational education and training indicators
Continuing education is understood to be the continuation or resumption of organised learning following completion of an initial phase of education of varying scope. In addition to continuing vocational education/training (CVET), this includes continuing general and political education, which is subsumed under the heading of “adult education”. The field of CVET in Germany is characterized by: a pluralism of providers, a largely market character, and a comparatively minimal degree of regulation. Continuing vocational training is divided into three parts: regulated continuing training, in-company training and individual continuing training. But only a small part of provision leads to a formal vocational qualification.
Publicly promoted CVET is targeted at various groups, from unemployed people with no school leaving certificate or without vocational qualifications to executives. The aims, content and duration of courses vary accordingly. Only some of the courses are designed to lead to qualifications which are recognised by law or awarded by industry's self-governing organisations (Chambers). Courses leading to advanced vocational qualifications, i.e. a Meisterbrief or another diploma, e.g. from a Fachschule (trade and technical schools and master's schools) are classified as ISCED 5B or EQF level 6 respectively.
Key facts in brief
Data from the Adult Education Survey (AES) on the continuing training of employed persons in the years 2007 and 2010 show a decline in the rates of participation in job-related continuing education and training for Germany as a whole as well as for West and East Germany. The decreases applied to both company and individual job-related continuing education and training.
The continuing education and training rate for women (33%) was lower than for men (38%). The different participation rate of men and women is observed only in the case of company training, not in that of individual training.
If we compare the participation in continuing education and training of Germans without and with a migration background and of non-Germans, we note that the participation rates for Germans with a migration background and for non-Germans are considerably lower.
The more advanced the school or vocational certificate, the greater the probability of participation in continuing education and training.
According to data from the IAB Establishment Panel, 44% of enterprises participated in the financing of continuing vocational education and training courses in 2010. The participation depends to a great extent on the size of the company and is traditionally considerably higher in large enterprises than in small and medium-sized enterprises. According to the findings of the Institute for Employment Research (IAB, Institut für Arbeitsmarkt- und Berufsforschung), company continuing education and training activity fell off slightly last year.
According to data of the BIBB qualification panel, participation in continuing education and training is considerably greater in companies providing training than in companies not providing training. This difference remains even when the enterprises are differentiated according to various selected structural features.
In 2010 the number of further training examinations was approximately 110,000. In the crafts the number of examinations increased by approximately 8,500 in relation to the previous year, while in the field of manufacturing and commerce it decreased by approx. 5,300.

17
The 2011 survey of the Continuing Education and Training Monitor shows that the business climate in continuing education and training greatly depends on the source of funding. Whereas the business climate has attained clearly negative values among continuing education providers that are funded primarily by the employment agencies, it is developing positively among providers funded by enterprises.
The continuing vocational education and training courses offered by the adult education centres amounted to 70,800 nationwide in 2010, less than in the previous year. The programme area “work/occupation” accounted for 12.3% of the courses at adult education centres overall.
In the year 2010 there were approximately 486,000 admissions to measures to promote continuing vocational education and training pursuant to SGB III and SGB II (Social Code). A decrease of more than one fifth was recorded in relation to the previous year. The average attendance for the year amounted to 188,782 and was only a scant 5% less than in the previous year.
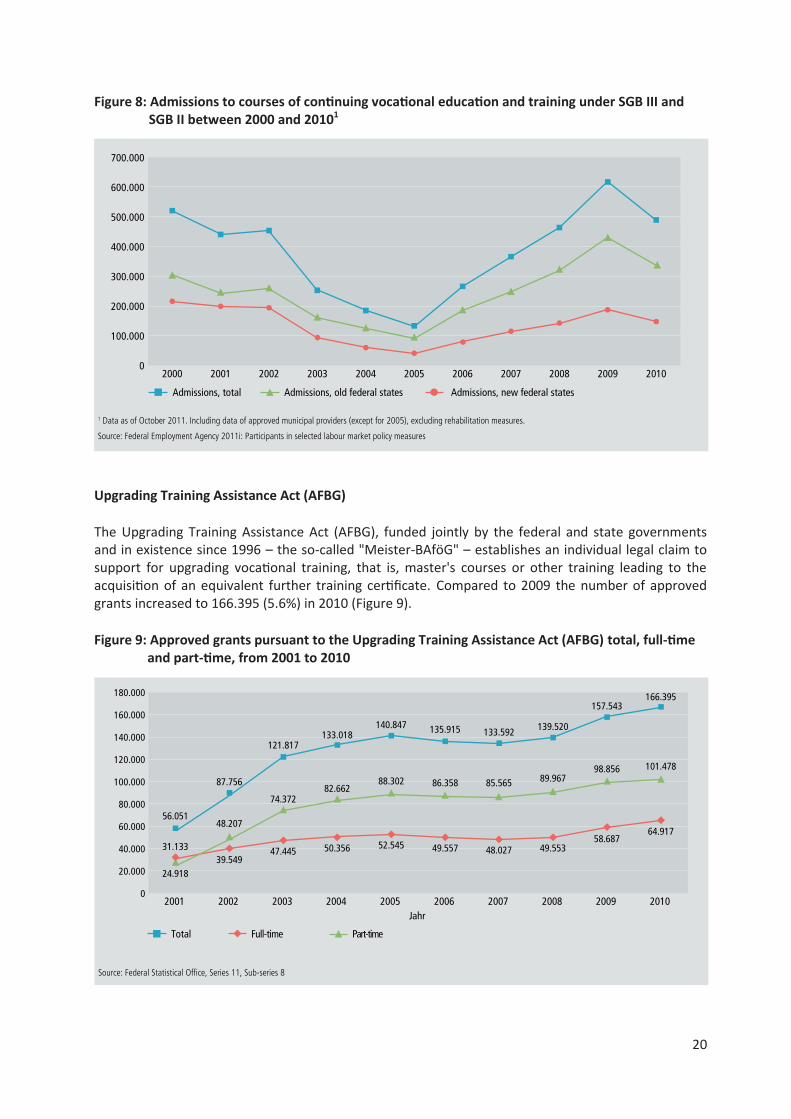
In the year 2009, 166,395 persons received assistance under the Upgrading Training Assistance Act. That was an increase of 5.6% over the previous year. Of those persons, 39% completed a full-time measure and 61% a part-time measure.
Overall, there are currently 218 federal regulations covering continuing vocational training and retraining. Of these statutory instruments, 91 apply to master craftsman examinations.
In the 2008/2009 school year there were 47,757 graduates who had passed their final examination at technical schools.
Public expenditure for continuing vocational education and training in 2010 was approx. €7 billion.
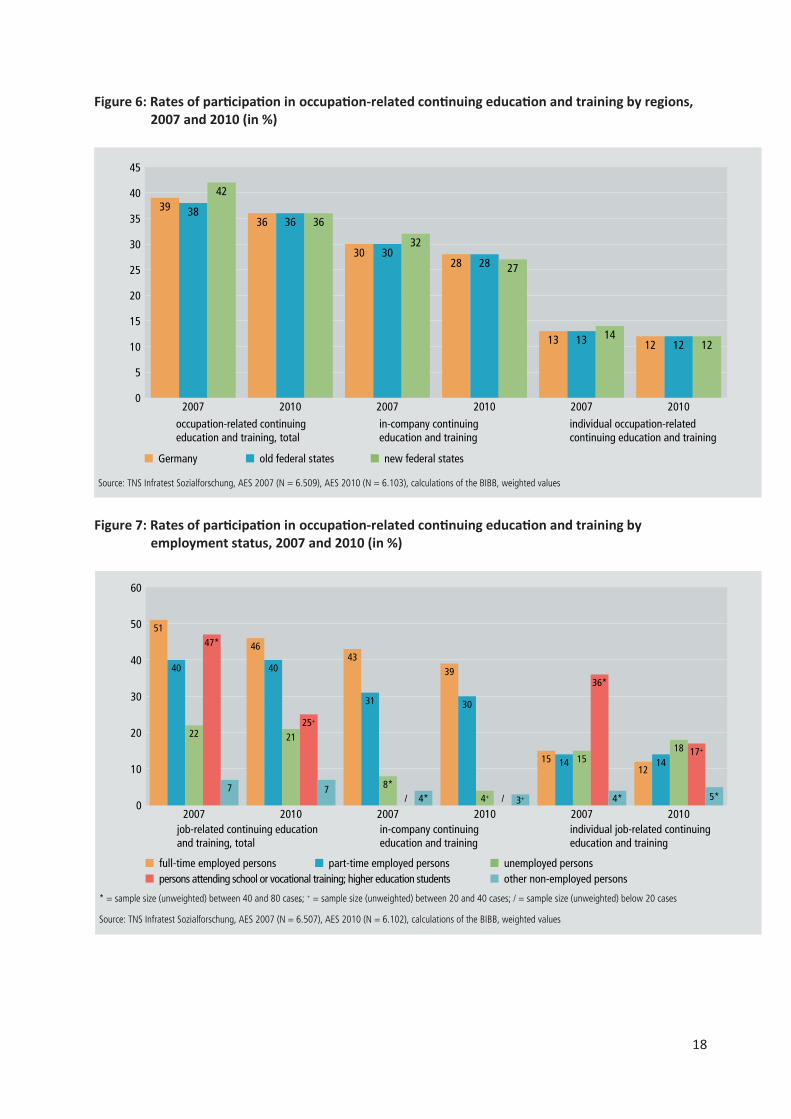
Participation of the population in occupation-related continuing education and training
In the political discussion, continuing education and training is considered of great value for the acquisition and maintenance of skills and competence by an aging working population in times of rapid change in the world of work and its requirements. A distinction is drawn between in-company and individually organized occupation-related continuing education and training (Figures 6, 7).
A total of 39% of the population aged 25 to 64 attended at least one occupation-related continuing education and training measure in 2007. By 2010, attendance had declined to 36%. The level of attendance of in-company continuing education and training, with attendance rates of 30% and 28%, was considerably higher than that of individual job-related continuing education and training (13% and 12%). To a large extent occupation-related continuing education and training serves to meet an acute need and is therefore supported by the company.
18
Figure 6: Rates of participation in occupation-related continuing education and training by regions, 2007 and 2010 (in %)
Figure 7: Rates of participation in occupation-related continuing education and training by employment status, 2007 and 2010 (in %)
45
40
35
30
25
20
15
10
5
0
3936
3028
13 12 12 1213 14
28 2730
32
36 3638
42
2007 2010 2007 2010 2007 2010
Source: TNS Infratest Sozialforschung, AES 2007 (N = 6.509), AES 2010 (N = 6.103), calculations of the BIBB, weighted values
occupation-related continuing education and training, total
Germany old federal states new federal states
in-company continuing education and training
individual occupation-related continuing education and training
60
50
40
30
20
10
02007 2010 2007 2010 2007 2010
* = sample size (unweighted) between 40 and 80 cases; + = sample size (unweighted) between 20 and 40 cases; / = sample size (unweighted) below 20 cases+
Source: TNS Infratest Sozialforschung, AES 2007 (N = 6.507), AES 2010 (N = 6.102), calculations of the BIBB, weighted values
51
40
22
47*
job-related continuing education and training, total
full-time employed persons part-time employed persons unemployed personspersons attending school or vocational training; higher education students other non-employed persons
in-company continuing education and training
individual job-related continuing education and training
7
46
40
2125+
7
43
31
8*/ 4*
39
30
4+ / 3+
15 14 15
36*
4*
1214
18 17+
5*

19
Continuing education and training measures supported by the Federal Employment Agency (SGB III and SGB II)
Qualification acquisition in the context of labour market policy instruments is supported by the Employment Agencies under Book Three of the Social Code (SGB III). Support by the job centres for employable persons requiring assistance is provided under Book Two of the Social Code (SGB II). Among the labour market policy instruments that make qualification possible for people within the jurisdiction of SGB II and SGB III are continuing vocational education and training, continuing vocational education and training for persons with disabilities and ESF-financed qualification programme while on short-time work. The Federal Employment Agency supports continuing vocational education and training of workers when it is necessary to integrate unemployed persons into the labour market, to ward off the concrete threat of unemployment or because it is recognized that continuing education and training is needed owing to the lack of a vocational qualification. Consideration is given to whether the unemployment could be ended without continuing education and training, whether other labour market policy instruments are more promising and whether attaining the education goal will make integration into the labour market probable. If the conditions for assistance are present, an education voucher to cover the cost of continuing education and training is issued. The education voucher can have a time limit and be limited to a given region and to certain education goals and applies to the relevant certified courses.
In the last few years, initially between 2000 and 2005, support for continuing vocational education and training has been curtailed through redirecting funds in the context of the regional labour market programmes (Figure 8). In addition, training measures have increasingly been used as one of the services to improve qualifications. The decrease in measures continued at a slower rate up to the year 2005. Starting in 2006, support for continuing vocational education and training was increased again and reached its high point in 2009, only to fall off once again in 2010. In 2010 there were a total of 586,453 admissions to qualifying courses of the Federal Employment Agency, of which 486,795 were to continuing vocational education and training, 23,609 to continuing vocational education and training for persons with disabilities, 10,050 to aptitude testing and training measures and 65,981 to ESF qualification while on short-time work. The proportion of measures leading to a certificate in a recognized training occupation continued to rise (to 52,100 or by a good 10%).
20
Figure 8: Admissions to courses of continuing vocational education and training under SGB III and SGB II between 2000 and 20101
Upgrading Training Assistance Act (AFBG)
The Upgrading Training Assistance Act (AFBG), funded jointly by the federal and state governments and in existence since 1996 – the so-called "Meister-BAföG" – establishes an individual legal claim to support for upgrading vocational training, that is, master's courses or other training leading to the acquisition of an equivalent further training certificate. Compared to 2009 the number of approved grants increased to 166.395 (5.6%) in 2010 (Figure 9).
Figure 9: Approved grants pursuant to the Upgrading Training Assistance Act (AFBG) total, full-time and part-time, from 2001 to 2010
1 Data as of October 2011. Including data of approved municipal providers (except for 2005), excluding rehabilitation measures.
Source: Federal Employment Agency 2011i: Participants in selected labour market policy measures
700.000
600.000
500.000
400.000
300.000
200.000
100.000
0
Admissions, total Admissions, old federal states Admissions, new federal states
20072006200520042003200220012000 2008 2009 2010
180.000
160.000
140.000
120.000
100.000
80.000
60.000
40.000
20.000
02001 2002 2003 2004 2005 2006 2007 2008 2009 2010
Jahr
Total Full-time Part-time
Source: Federal Statistical Office, Series 11, Sub-series 8
56.051
87.756
121.817133.018
140.847 135.915 133.592 139.520
157.543166.395
24.918
31.13339.549
48.207
47.445
74.372
50.356
82.662
52.545
88.302
49.557
86.358
48.027
85.565
49.553
89.967
58.687
98.856
64.917
101.478

21
Vocational careers with and without a continuing education and training certificate (OECD activity "Skills beyond School")
Following "Learning for Jobs" the OECD started another activity in 2011, the "Skills beyond School" project directed toward the field of vocational education and training. It focuses on vocational qualifications acquired after completion of school and/or initial training at upper secondary school level (ISCED 5B). On behalf of the Federal Ministry of Education and Research (BMBF) and in co-operation with the Conference of the Ministers of Education and Cultural Affairs (KMK), the BIBB compiled a national background report on that subject. In the following, upgrading vocational training is quantified with regard to its significance for various age groups and with regard to "returns on investment" compared to alternative vocational education pathways (based on the 2008 microcensus).
Table 3: Distribution of different vocational qualification certificates in the population – view of the total population by age group
Initial vocational education and training combined with a recognized upgrading training course is just one of many opportunities for a vocational career. All in all, about one eighth of all persons with initial vocational training have completed a course of upgrading training (Table 3).
Completing initial training without the later acquisition of a continuing training certificate is still the rule for over 50% of the population. The lower rates for initial and continuing education and training certificates for those under 35 years of age are in part purely a matter of age (the certificates are acquired later) and in part the effect of changed preferences of the younger age groups (in favour or university degrees and/or turning away from formal continuing education and training). Initial vocational education and training remains the most common basis for working life.
Age(grouped)
training without further training
training with further training and higher education (with orwithout further
1
higher education
15–19 2,3 % 2,7 % 0 % 0,1 % 0 % 0 % 0 % 0 % 97,5 % 97,0 %
20–24 40,2 % 39,1 % 1,2 % 1,3 % 0,1 % 0,2 % 1,2 % 2,4 % 57,0 % 56,8 %
25–29 54,4 % 56,1 % 4,1 % 2,5 % 2,0 % 2,1 % 11,0 % 14,0 % 28,3 % 25,0 %
30–34 55,3 % 58,1 % 6,6 % 3,3 % 4,4 % 3,2 % 15,4 % 15,8 % 17,9 % 19,1 %
35–39 56,9 % 62,5 % 8,4 % 4,0 % 5,3 % 3,7 % 14,0 % 12,2 % 14,8 % 17,2 %
40–44 57,7 % 64,9 % 10,3 % 4,8 % 5,5 % 3,6 % 12,9 % 9,8 % 13,2 % 16,4 %
45–49 58,3 % 63,4 % 10,3 % 4,9 % 4,6 % 2,8 % 12,8 % 9,7 % 13,5 % 18,6 %
50–54 57,9 % 62,2 % 10,3 % 5,0 % 4,7 % 2,7 % 13,9 % 10,4 % 12,7 % 19,1 %
55–59 57,8 % 61,0 % 10,9 % 4,4 % 5,6 % 2,3 % 13,1 % 8,5 % 11,9 % 23,1 %
60–64 56,1 % 59,0 % 11,2 % 4,1 % 5,7 % 1,7 % 13,0 % 7,1 % 13,2 % 27,5 %
65+ 56,2 % 43,6 % 11,9 % 2,7 % 3,9 % 0,5 % 10,0 % 3,2 % 16,9 % 48,2 %
.1
degree
m f m f m f m f m f
without vocational qualification certificate1
The difference between the sum of the percentages per line and 100% is due to missing data in the records (< 1% for under 65-year-olds).
Not comparable with the calculations of the rate of people with no formal qualifications because students, higher education students, trainees, people doing military or community service and people in measures of further and continuing vocational training and retraining are included.
Source: Total population of 82.1 million, microcensus 2008, calculations of the Federal Institute for Vocational Education and Training
training certificatetraining certificate)

22
Among persons without university entrance qualifications (Hochschulzugangsberechtigung, HZB) it is, at approximately 90%, the most frequent kind of post-compulsory education after general schooling. But even for approximately 45% to 55% of those with university entrance qualifications, initial vocational education and training is an alternative to university. About 25% to 30% of an age group with HZB take initial vocational education and training without acquiring a university degree at a later stage. Those with university entrance entitlement take recognized upgrading training courses relatively more frequently. Depending on the age cohort, their inclination towards upgrading training is up to 50% greater (persons aged 25 to 34) or approximately 25% greater (persons aged 45 to 54) than that of persons without HZB. The proportion of continuing training certificates rises with increasing age. This process seems to continue until the age of 45. The following table shows the different effects of the different certificates on status and income (Table 4).
Table 4: Returns on Investment – labour market related results of vocational education and training
Higher vocational qualification generally leads to higher income. Without any vocational qualification the average income is significantly low i.e. the income of persons with a vocational qualification is expected to be about 50% higher compared with person of this group.
training without further training
training with further training certificate
training and higher education (with or without further training certificate)1
higher education without vocational
qualification certificate1
m f m f m f
Employment status
unemployed persons 6,3 % 5,4 % 2,8 % 4,1 % 2,5 % 2,9 % 2,8 % 3,5 % 11,1 % 7,3 %
inactive persons 11,5 % 22,6 % 9,4 % 17,4 % 8,0 % 11,4 % 7,4 % 16,8 % 26,4 % 44,0 %
Income (€)
1st quartile (25%) 2.000 1.000 2.400 1.500 2.900 1.600 3.000 1.800 700 400
2nd quartile (median) 2.500 1.500 3.000 2.200 3.800 2.500 4.000 2.600 1.850 900
3rd quartile (75%) 3.200 2.300 4.000 2.900 5.000 3.350 5.000 3.500 2.600 1.600
Type of vocational activity
simple activity 9,5 % 18,2 % 1,3 % 6,2 % 1,5 % 3,3 % 1,9 % 5,4 % 37,9 % 48,8 %
managerial activity 23,9 % 12,7 % 46,9 % 20,7 % 44,9 % 21,9 % 36,5 % 21,1 % 16,7 % 10,4 %
qualified activity 66,6 % 69,2 % 51,8 % 73,1 % 53,6 % 74,8 % 61,6 % 73,5 % 45,4 % 40,8 %
Entitled to give instructions to other employees
yes 73,0 % 59,9 % 86,0 % 67,0 % 77,8 % 60,4 % 72,3 % 57,1 % 57,8 % 45,0 %
Time-limited employment
yes 9,2 % 10,6 % 5,6 % 9,5 % 8,9 % 14,5 % 12,1 % 19,4 % 21,7 % 18,7 %1 Including people with higher education certificate, further training certificate and initial education and training.
Source: 0Employee Survey (BIBB/BAuA) 2006 and microcensus 2008, calculations of the Federal Institute for Vocational Education and Training
degree
m f m f

23
3 In focus: Transitions from school into VET
Transitions from school into training are a central educational policy topic. To a considerable degree they are a yardstick for the efficiency and success of the dual system of vocational education and training in Germany. The focus and objectives of the diagnoses and discussions on the topic of transitions have changed in the course of the recent years: For a long time problem analyses focused equally on the transitions at the first threshold, from school to initial training, and at the second threshold, from initial training to work. Due to the declining numbers of school leavers and the rising demand for skilled workers, the chances of training being directly followed by vocational activity have improved.
The transition area in the narrower sense covers measures and courses of education that serve to
prepare for or lead up to initial vocational education and training ("integration into vocational
training"). The transition area in the broader sense additionally includes full-time-school measures
without strong job practice components and vocational orientation measures (for example the career
orientation programme of the BMBF, intensified vocational guidance, mentoring for the transition to
the labour market). The frequently used term transition system is controversial, since there is so far
no consistent system of transition. However, at the moment there are a number of initiatives in the
Federal Länder directed towards the goal of developing such a transition system. Transition
management is the term used to describe the active organisation of the transition area in the
narrower or broader sense.
Reform discussions and structural reforms
As early as 2007 the Innovation Circle on Vocational Education and Training had taken up 3 aspects of transition in its "10 guidelines for the modernisation and structural improvement of vocational education":
1. The improvement of apprenticeship entry maturity is to be achieved and supported
particularly through intensified vocational guidance, individual support and mentoring from school up to the transition to training and employment as well as through the linkage of schooling and practical experience.
2. Training preparation for disadvantaged persons is to be optimised through concerted regional initiatives and networks and the coordination of the instruments for assisting disadvantaged people.
3. Transitions are also to be optimised, in that pathways to in-company training – particularly for unplaced applicants from previous years – are assured through compatible and creditable qualification measures and in particular through admission to the external examination, through training modules and through the expansion of introductory qualifications. Thus the guidelines refer to 3 fields of action: the school, the transition between graduation and initial training and the transition from measures to initial training and vocation. The target groups are students with weaker school performance, disadvantaged young people, including above all young people with migration backgrounds, and unplaced applicants from previous years.
In 2007, the BIBB Board also adopted a position paper on "training for unplaced applicants from previous years via training modules" (cf. Hauptausschuss des Bundesinstituts für Berufsbildung 2007) as well as a recommendation entitled "suggestions for action for the vocational qualification of disadvantaged young people" (cf. Hauptausschuss des Bundesinstituts für Berufsbildung 2008). Both are geared to a wide range of target groups. The position paper on the training modules is geared to unplaced applicants from previous years as its target group, with this group at times being seen as very

24
heterogeneous. It is argued that special measures for this target group should be limited in time, i.e. they should be discontinued when the demographic trend is reversed and the number of school graduates decreases. The recommendation contains a broad definition of young people who are considered disadvantaged, and an equally wide range of suggestions for action in order to be able to meet their individual assistance requirements.
The co-operation of local stakeholders in implementing effective models of transition management also was an important topic from a federal standpoint. Appropriate projects were supported in the "Vocational Qualification Prospects" programme from 2008 to 2010. Existing promotion opportunities and support were to be so co-ordinated as to facilitate the transition from school to initial training for young people. While the first round of funding was directed towards "more effective target-group-oriented support for young people", the current second round of funding is designed to use the experience gained "to arrange co-operative structures and structural responsibility in such a way that the promotion instruments can be used in a more flexible and need and target-group oriented manner".
In 2009 an "Agreement of the signatories to the National Pact for Career Training and Skilled Manpower Development in Germany, the Federal Employment Agency (BA) and the Commissioner for Migration, with the Conference of the Ministers of Education and Cultural Affairs" dealt with the twin goals of "guaranteeing apprenticeship entry maturity and strengthening vocational guidance". The document urges that by integrating current impulses and concepts, individual projects should be turned into regular measures to be anchored in practice nationwide. Practice classes should be offered nationwide according to demand as a means of assisting young people with learning problems. Career orientation should be introduced in all schools and, combined with it, transition management should be optimised using positive experiences from some Federal Länder, and in addition regional co-operation between schools and enterprises should be expanded.
With the goal of comprehensive co-ordination of all measures, the BMBF initiative "Qualify and Connect – Education chains up to the completion of training", started in 2010, is helping young people to prepare for graduation, to complete their initial training and their entry into the labour market and. In this effort the Federal Ministry of Education and Research (BMBF) is relying on the systemic, country-wide implementation of proven and successful instruments and linking them with one another. Thus the Federal Ministry of Labour and Social Affairs (BMAS), the BA and the BIBB, in co-operation with the Länder, are to establish a new conceptual framework for expanding and where possible stabilizing the preventive support for young people.
The BIBB Board had resumed its participation in the discussion with its 2011 recommendation "Guidelines for improving the transition from school to work". It underlines in particular the priority of regular in-company training. The recommendation of the Board is not target-group oriented, but formulates guidelines that should guide "transition management" – meaning the organisation of the transition area: It should prepare early, promote, mentor and advise individually, be in proximity to occupational and company practice, be coordinated and steered regionally, be transparent and compatible and its evaluation should be process-related.
25
Integrated training reporting
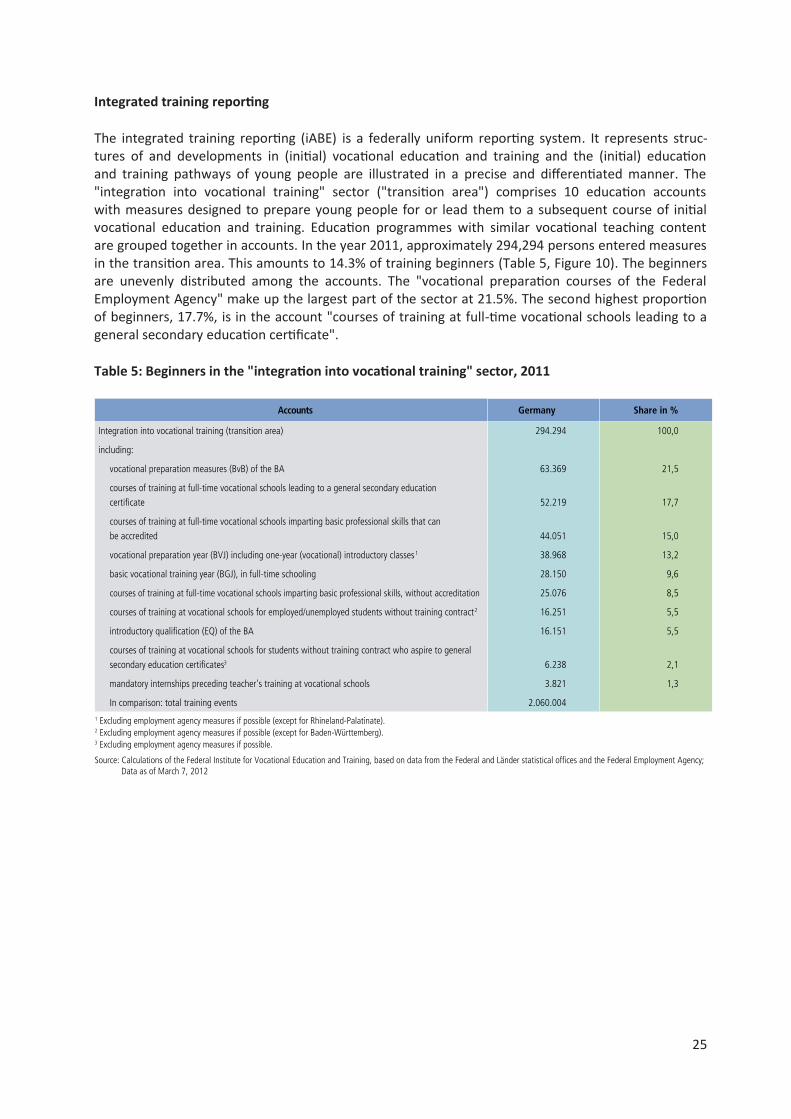
The integrated training reporting (iABE) is a federally uniform reporting system. It represents struc-tures of and developments in (initial) vocational education and training and the (initial) education and training pathways of young people are illustrated in a precise and differentiated manner. The "integration into vocational training" sector ("transition area") comprises 10 education accounts with measures designed to prepare young people for or lead them to a subsequent course of initial vocational education and training. Education programmes with similar vocational teaching content are grouped together in accounts. In the year 2011, approximately 294,294 persons entered measures in the transition area. This amounts to 14.3% of training beginners (Table 5, Figure 10). The beginners are unevenly distributed among the accounts. The "vocational preparation courses of the Federal Employment Agency" make up the largest part of the sector at 21.5%. The second highest proportion of beginners, 17.7%, is in the account "courses of training at full-time vocational schools leading to a general secondary education certificate".
Table 5: Beginners in the "integration into vocational training" sector, 2011
Accounts Germany Share in %
Integration into vocational training (transition area) 294.294 100,0
including:
vocational preparation measures (BvB) of the BA 63.369 21,5
courses of training at full-time vocational schools leading to a general secondary education
certificate 52.219 17,7
courses of training at full-time vocational schools imparting basic professional skills that can
be accredited 44.051 15,0
vocational preparation year (BVJ) including one-year (vocational) introductory classes1 38.968 13,2
basic vocational training year (BGJ), in full-time schooling 28.150 9,6
courses of training at full-time vocational schools imparting basic professional skills, without accreditation 25.076 8,5
courses of training at vocational schools for employed/unemployed students without training contract 2 16.251 5,5
introductory qualification (EQ) of the BA 16.151 5,5
courses of training at vocational schools for students without training contract who aspire to general
secondary education certificates3 6.238 2,1
mandatory internships preceding teacher's training at vocational schools 3.821 1,3
In comparison: total training events 2.060.004
1 Excluding employment agency measures if possible (except for Rhineland-Palatinate).2 Excluding employment agency measures if possible (except for Baden-Württemberg).3 Excluding employment agency measures if possible.
Source: Calculations of the Federal Institute for Vocational Education and Training, based on data from the Federal and Länder statistical offices and the Federal Employment Agency; Data as of March 7, 2012
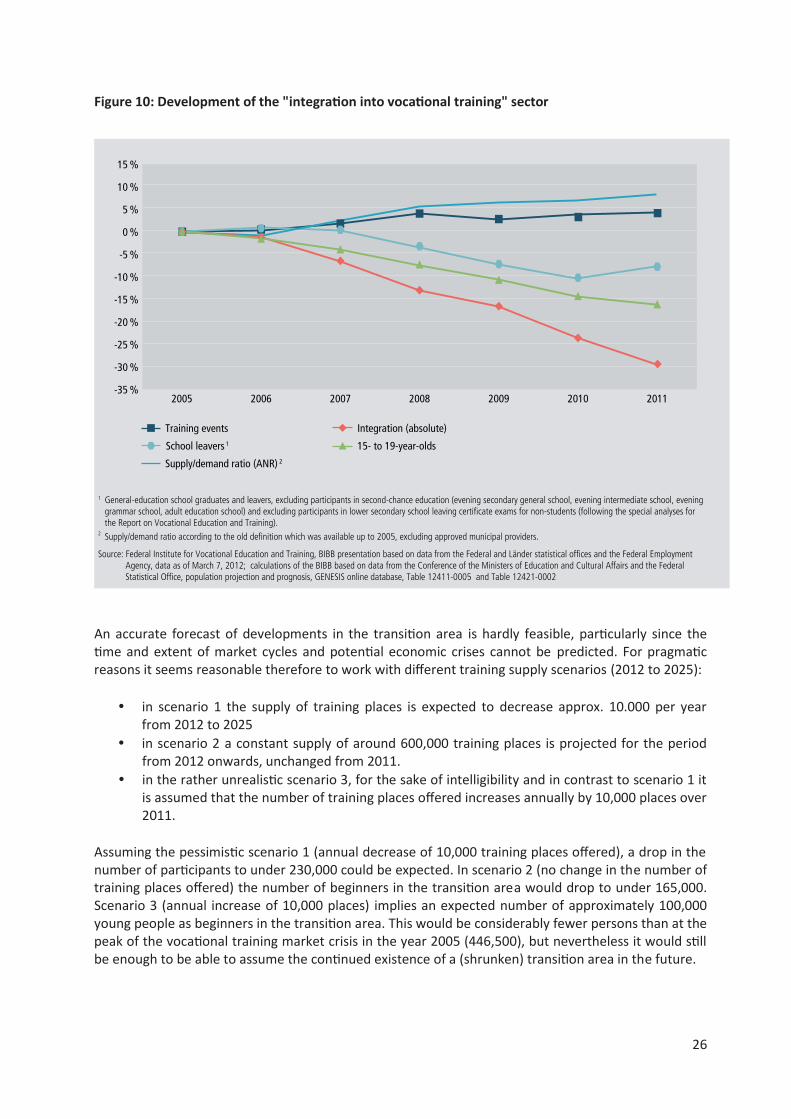
26
Figure 10: Development of the "integration into vocational training" sector
An accurate forecast of developments in the transition area is hardly feasible, particularly since the time and extent of market cycles and potential economic crises cannot be predicted. For pragmatic reasons it seems reasonable therefore to work with different training supply scenarios (2012 to 2025):
in scenario 1 the supply of training places is expected to decrease approx. 10.000 per year from 2012 to 2025
in scenario 2 a constant supply of around 600,000 training places is projected for the period from 2012 onwards, unchanged from 2011.
in the rather unrealistic scenario 3, for the sake of intelligibility and in contrast to scenario 1 it is assumed that the number of training places offered increases annually by 10,000 places over 2011.
Assuming the pessimistic scenario 1 (annual decrease of 10,000 training places offered), a drop in the number of participants to under 230,000 could be expected. In scenario 2 (no change in the number of training places offered) the number of beginners in the transition area would drop to under 165,000. Scenario 3 (annual increase of 10,000 places) implies an expected number of approximately 100,000 young people as beginners in the transition area. This would be considerably fewer persons than at the peak of the vocational training market crisis in the year 2005 (446,500), but nevertheless it would still be enough to be able to assume the continued existence of a (shrunken) transition area in the future.
1 General-education school graduates and leavers, excluding participants in second-chance education (evening secondary general school, evening intermediate school, evening grammar school, adult education school) and excluding participants in lower secondary school leaving certificate exams for non-students (following the special analyses for the Report on Vocational Education and Training).
2 Supply/demand ratio according to the old definition which was available up to 2005, excluding approved municipal providers.
Source: Federal Institute for Vocational Education and Training, BIBB presentation based on data from the Federal and Länder statistical offices and the Federal Employment Agency, data as of March 7, 2012; calculations of the BIBB based on data from the Conference of the Ministers of Education and Cultural Affairs and the Federal Statistical Office, population projection and prognosis, GENESIS online database, Table 12411-0005 and Table 12421-0002
Training events Integration (absolute)
School leavers 1 15- to 19-year-olds
Supply/demand ratio (ANR) 2
15 %
10 %
5 %
0 %
-5 %
-10 %
-15 %
-20 %
-25 %
-30 %
-35 %2005 2006 2007 2008 2009 2010 2011
27
4 International indicators, system monitoring, mobility
Transitions from school to training in the international context
The transition between school and gainful employment is fraught with risks in all countries of the OECD, to which the following remarks apply. Demographic changes as well as the continuing structural changes are leading to constant changes in youth job markets. Despite these trends, valid for all developed national economies, there are salient national differences in the form and quality of employment entrance processes, due for the most part to institutional differences.
In the majority of the European countries the transition from school to occupation is a multi-stage, but still continuous, process. Nevertheless different patterns and a large range of variations between the countries show up with regard to the career entry processes. If one looks at where school leavers end up (university/continuing education, initial vocational education and training, gainful employment, unemployment, inactivity) in the first five years after leaving school, eight transition types can be distinguished (Figure 11).2
Types of transition
First of all there is a group of school leavers who after a very short period of inactivity return to the education system for an extended period and/or continue their education biography at higher education establishments or universities ("return"). Transitions of this kind should frequently occur in countries with a high proportion of tertiary education certificates and in countries with well developed continuing education and training systems. The second type of transition ("failure") comprises those who are unemployed for a long time – i.e. for 5 years – after leaving school and whose transition can therefore be regarded as a failure. In the countries where this type of transition is frequent, school leavers face major problems, since the job market and its institutions are unable to make enough jobs available. Something similar applies to transitions of the third type ("dropout"), which comprises people who are inactive in the first 5 years after leaving school. Although in principle not all inactive persons are interested in gainful employment, it can be assumed that a not inconsiderable proportion of those who are inactive are at the disposal of the job market (so-called hidden labour reserve). School leavers who perform transitions of the "link" type, which involves a brief education and training phase of 2 to 3 years, are to a large extent integrated into working life. The occurrence of this type of transition, like the "return" type, is an indication of existing and perceived continuing education and training opportunities. The "interruption" and "detour" types likewise lead to gainful employment after 2 to 3 years. However, this is preceded by a short phase of inactivity or unemployment. Transitions of these two types most likely include search phases which, with a duration of 2 to 3 years, are relatively long but finally end in gainful employment. The "bridge" type includes all school leavers who take up initial vocational education and training. The subsequent gainful employment, even if delayed, shows its integrating effect. Countries with a strongly minted vocational education and training system might have a high proportion of this type of transition. The most direct transition to the job market is made by the "express" type of school leavers who find gainful employment immediately after finishing school.
2 Cf. Brzinsky-Fay, Christian: Lost in Transition? Labour Market Entry Sequences of School Leavers in Europe.
In: European Sociological Review 23 (4), 2007, 409–422
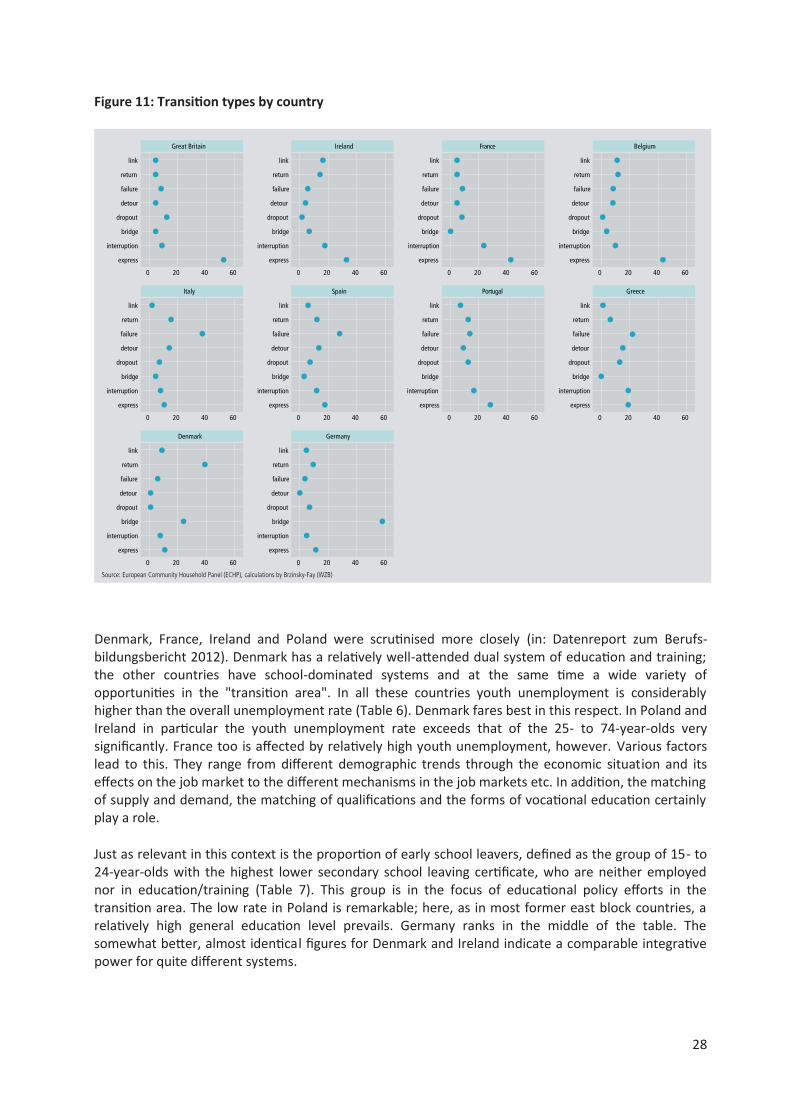
28
Figure 11: Transition types by country
Denmark, France, Ireland and Poland were scrutinised more closely (in: Datenreport zum Berufs-bildungsbericht 2012). Denmark has a relatively well-attended dual system of education and training; the other countries have school-dominated systems and at the same time a wide variety of opportunities in the "transition area". In all these countries youth unemployment is considerably higher than the overall unemployment rate (Table 6). Denmark fares best in this respect. In Poland and Ireland in particular the youth unemployment rate exceeds that of the 25- to 74-year-olds very significantly. France too is affected by relatively high youth unemployment, however. Various factors lead to this. They range from different demographic trends through the economic situation and its effects on the job market to the different mechanisms in the job markets etc. In addition, the matching of supply and demand, the matching of qualifications and the forms of vocational education certainly play a role.
Just as relevant in this context is the proportion of early school leavers, defined as the group of 15- to 24-year-olds with the highest lower secondary school leaving certificate, who are neither employed nor in education/training (Table 7). This group is in the focus of educational policy efforts in the transition area. The low rate in Poland is remarkable; here, as in most former east block countries, a relatively high general education level prevails. Germany ranks in the middle of the table. The somewhat better, almost identical figures for Denmark and Ireland indicate a comparable integrative power for quite different systems.
Source: European Community Household Panel (ECHP), calculations by Brzinsky-Fay (WZB)
link
return
failure
detour
dropout
bridge
interruption
express
0 20 40 60
Great Britain
link
return
failure
detour
dropout
bridge
interruption
express
0 20 40 60
Ireland
link
return
failure
detour
dropout
bridge
interruption
express
0 20 40 60
France
link
return
failure
detour
dropout
bridge
interruption
express
0 20 40 60
Belgium
link
return
failure
detour
dropout
bridge
interruption
express
0 20 40 60
Italy
link
return
failure
detour
dropout
bridge
interruption
express
0 20 40 60
Spain
link
return
failure
detour
dropout
bridge
interruption
express
0 20 40 60
Portugal
link
return
failure
detour
dropout
bridge
interruption
express
0 20 40 60
Greece
link
return
failure
detour
dropout
bridge
interruption
express
0 20 40 60
Denmark
link
return
failure
detour
dropout
bridge
interruption
express
0 20 40 60
Germany
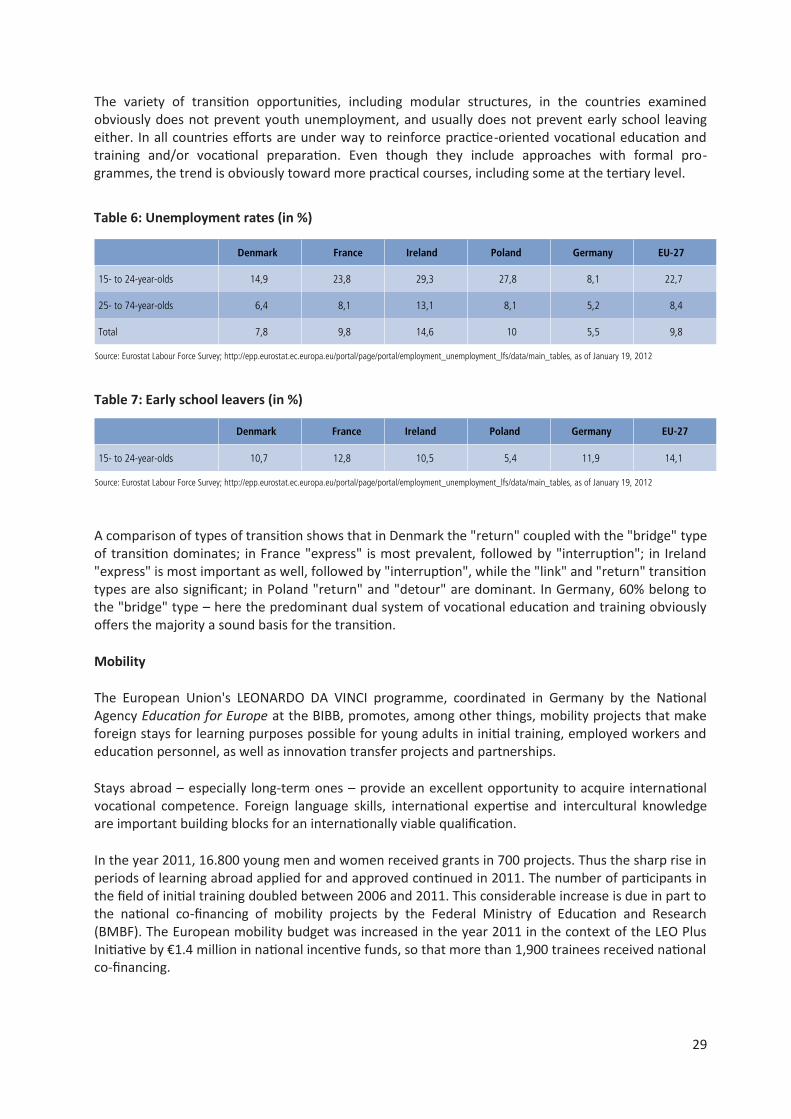
29
The variety of transition opportunities, including modular structures, in the countries examined obviously does not prevent youth unemployment, and usually does not prevent early school leaving either. In all countries efforts are under way to reinforce practice-oriented vocational education and training and/or vocational preparation. Even though they include approaches with formal pro-grammes, the trend is obviously toward more practical courses, including some at the tertiary level.
Table 6: Unemployment rates (in %)
Table 7: Early school leavers (in %)
A comparison of types of transition shows that in Denmark the "return" coupled with the "bridge" type of transition dominates; in France "express" is most prevalent, followed by "interruption"; in Ireland "express" is most important as well, followed by "interruption", while the "link" and "return" transition types are also significant; in Poland "return" and "detour" are dominant. In Germany, 60% belong to the "bridge" type – here the predominant dual system of vocational education and training obviously offers the majority a sound basis for the transition.
Mobility
The European Union's LEONARDO DA VINCI programme, coordinated in Germany by the National Agency Education for Europe at the BIBB, promotes, among other things, mobility projects that make foreign stays for learning purposes possible for young adults in initial training, employed workers and education personnel, as well as innovation transfer projects and partnerships.
Stays abroad – especially long-term ones – provide an excellent opportunity to acquire international vocational competence. Foreign language skills, international expertise and intercultural knowledge are important building blocks for an internationally viable qualification.
In the year 2011, 16.800 young men and women received grants in 700 projects. Thus the sharp rise in periods of learning abroad applied for and approved continued in 2011. The number of participants in the field of initial training doubled between 2006 and 2011. This considerable increase is due in part to the national co-financing of mobility projects by the Federal Ministry of Education and Research (BMBF). The European mobility budget was increased in the year 2011 in the context of the LEO Plus Initiative by €1.4 million in national incentive funds, so that more than 1,900 trainees received national co-financing.
Denmark France Ireland Poland Germany EU-27
15- to 24-year-olds 14,9 23,8 29,3 27,8 8,1 22,7
25- to 74-year-olds 6,4 8,1 13,1 8,1 5,2 8,4
Total 7,8 9,8 14,6 10 5,5 9,8
Source: Eurostat Labour Force Survey; http://epp.eurostat.ec.europa.eu/portal/page/portal/employment_unemployment_lfs/data/main_tables, as of January 19, 2012
15- to 24-year-olds 10,7 12,8 10,5 5,4 11,9 14,1
Source: Eurostat Labour Force Survey; http://epp.eurostat.ec.europa.eu/portal/page/portal/employment_unemployment_lfs/data/main_tables, as of January 19, 2012
Denmark France Ireland Poland Germany EU-27
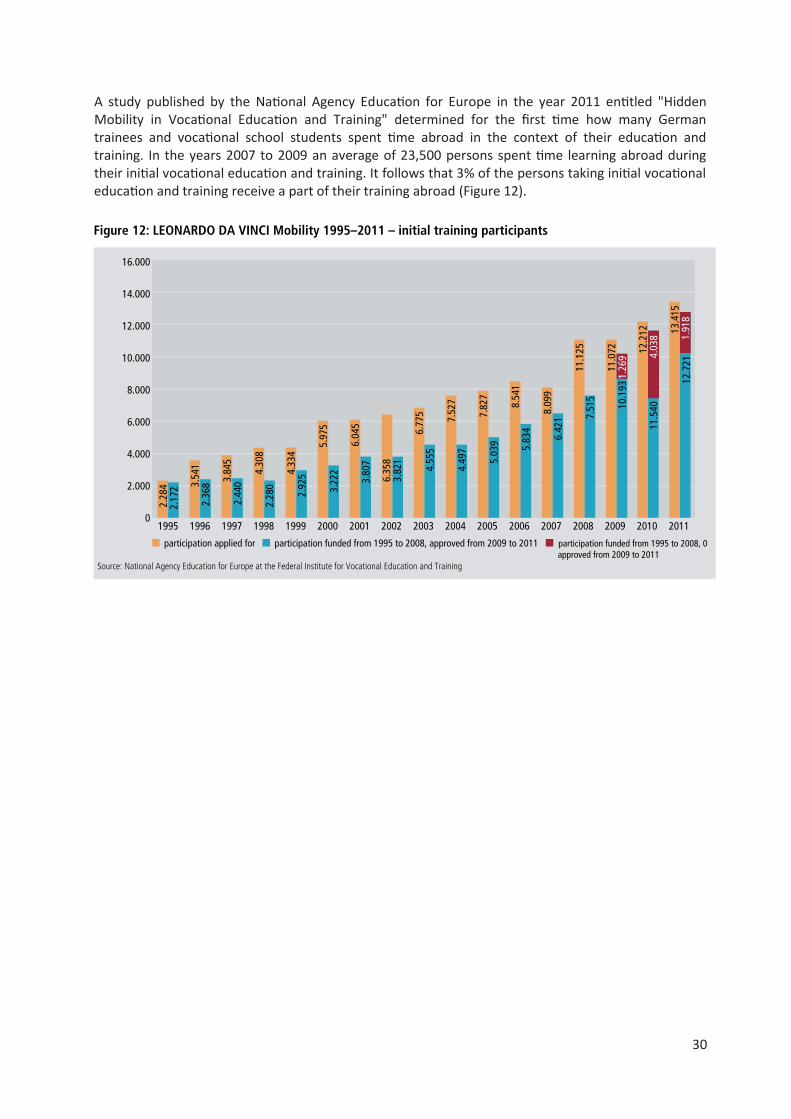
30
A study published by the National Agency Education for Europe in the year 2011 entitled "Hidden Mobility in Vocational Education and Training" determined for the first time how many German trainees and vocational school students spent time abroad in the context of their education and training. In the years 2007 to 2009 an average of 23,500 persons spent time learning abroad during their initial vocational education and training. It follows that 3% of the persons taking initial vocational education and training receive a part of their training abroad (Figure 12).
Figure 12: LEONARDO DA VINCI Mobility 1995–2011 – initial training participants
Source: National Agency Education for Europe at the Federal Institute for Vocational Education and Training
16.000
14.000
12.000
10.000
8.000
6.000
4.000
2.000
0
participation applied for participation funded from 1995 to 2008, approved from 2009 to 2011 participation funded from 1995 to 2008, 0 approved from 2009 to 2011
5991 6991 7991 8991 9991 0002 1002 2002 3002 4002 5002 2006 2007 2008 2009 2010 2011
2.28
4 3.54
1
3.84
5
4.30
8
4.33
4
5.97
5
6.04
5
6.35
8
6.77
5 7.52
7
7.82
7
8.54
1
8.09
9
11.1
25
11.0
72 12.2
12 13.4
15
2.17
2
2.36
8
2.44
0
2.28
0
2.92
5
3.22
2
3.80
7
3.82
1
4.55
5
4.49
7
5.03
9 5.83
4
6.42
1 7.51
5
10.1
93
11.5
40
12.7
21
1.26
9 4.03
8 1.91
8
Related Documents


![[Global HR Forum 2011] Dual VET and Meister Qualification System in Germany](https://static.cupdf.com/doc/110x72/5590e07b1a28ab38208b457e/global-hr-forum-2011-dual-vet-and-meister-qualification-system-in-germany.jpg)


