Vertical integration of leaf area index in a Japanese deciduous broad-leaved forest Kenlo Nishida Nasahara a, *, Hiroyuki Muraoka b , Shin Nagai b , Hiroaki Mikami a a Graduate School of Life and Environmental Science, University of Tsukuba, 1-1 Tennoudai, Tsukuba, Ibaraki 305-8572, Japan b Institute for Basin Ecosystem Studies, Gifu University, 1-1 Yanagido, Gifu 501-1193, Japan 1. Introduction The leaf area in a forest canopy is an important quantity in understanding many ecosystem processes and character- istics of the forest. For example, photosynthesis, transpira- tion, aerodynamic roughness, autotrophic respiration, and other important parameters can be represented by integrat- ing the functions of individual leaves for each tree’s total leaf area. This idea, originating from the proposition by Monsi and Saeki (1953; republished in 2005), has been verified in various ecosystems from various standpoints (e.g., Hirose, 2005) and has become the theoretical basis for studying the functional interactions between a forest and its environ- ment (e.g., Aber et al., 1996; de Pury and Farquhar, 1997; Watanabe et al., 2004; Walcroft et al., 2005). Most such studies have described leaf area using the leaf area index (LAI) parameter, which is defined as half of the total leaf area (i.e., the area for only one leaf surface) divided by the ground surface area beneath those leaves (e.g., Chen and Black, 1992; Jonckheere et al., 2004). However, field measurements agricultural and forest meteorology 148 (2008) 1136–1146 article info Article history: Received 31 August 2007 Received in revised form 25 February 2008 Accepted 29 February 2008 Keywords: Leaf area index Leaf mass per unit leaf area (LMA) Phenology Litter traps abstract Leaf area index (LAI) is an important quantity in the study of forest ecosystems, but field measurements of LAI often contain errors because of the vertical complexity of the forest canopy. In this study, we established a practical method for field measurement of LAI in the canopy of a deciduous broadleaved forest by accounting for its vertical complexity. First, we produced a semi-empirical model for the vertical integration of leaf dry mass per unit leaf area. We also quantified the litterfall for each tree species. These data enabled us to estimate the LAI of each species in autumn. By periodic in situ monitoring of some fixed sample shoots throughout the growing season, we were able to estimate the seasonality of leaf area (as a proportion of the annual maximum value at each point in time) of each species. By using this seasonality to extrapolate LAI values as a proportion of the LAI data in the leaf-fall season, we were able to estimate LAI throughout the year. We applied this method in a cool- temperate deciduous forest in central Japan (Takayama) in 2006 and validated conventional methods of LAI measurement: the plant canopy analyzer (LAI-2000) and the Tracing Radiation and Architecture of Canopies (TRAC) approach. LAI estimated by TRAC was in good agreement with our results, but LAI estimated using the LAI-2000 was only half the value estimated using our method. The use of basal area data as a proxy for species-specific leaf areas may save labor and time. Our method will be useful for studying the dynamics and interactions of multiple species because it can estimate LAI and its seasonal changes for each species. # 2008 Elsevier B.V. All rights reserved. * Corresponding author. Tel.: +81 29 853 4897; fax: +81 29 853 4897. E-mail address: [email protected] (K.N. Nasahara). available at www.sciencedirect.com journal homepage: www.elsevier.com/locate/agrformet 0168-1923/$ – see front matter # 2008 Elsevier B.V. All rights reserved. doi:10.1016/j.agrformet.2008.02.011

Welcome message from author
This document is posted to help you gain knowledge. Please leave a comment to let me know what you think about it! Share it to your friends and learn new things together.
Transcript
a g r i c u l t u r a l a n d f o r e s t m e t e o r o l o g y 1 4 8 ( 2 0 0 8 ) 1 1 3 6 – 1 1 4 6
avai lable at www.sc iencedi rec t .com
journal homepage: www.e lsev ier .com/ locate /agr formet
Vertical integration of leaf area index in a Japanese deciduousbroad-leaved forest
Kenlo Nishida Nasahara a,*, Hiroyuki Muraoka b, Shin Nagai b, Hiroaki Mikami a
aGraduate School of Life and Environmental Science, University of Tsukuba, 1-1 Tennoudai, Tsukuba, Ibaraki 305-8572, Japanb Institute for Basin Ecosystem Studies, Gifu University, 1-1 Yanagido, Gifu 501-1193, Japan
a r t i c l e i n f o
Article history:
Received 31 August 2007
Received in revised form
25 February 2008
Accepted 29 February 2008
Keywords:
Leaf area index
Leaf mass per unit leaf area (LMA)
Phenology
Litter traps
a b s t r a c t
Leaf area index (LAI) is an important quantity in the study of forest ecosystems, but field
measurements of LAI often contain errors because of the vertical complexity of the forest
canopy. In this study, we established a practical method for field measurement of LAI in the
canopy of a deciduous broadleaved forest by accounting for its vertical complexity. First, we
produced a semi-empirical model for the vertical integration of leaf dry mass per unit leaf
area. We also quantified the litterfall for each tree species. These data enabled us to estimate
the LAI of each species in autumn. By periodic in situ monitoring of some fixed sample shoots
throughout the growing season, we were able to estimate the seasonality of leaf area (as a
proportion of the annual maximum value at each point in time) of each species. By using this
seasonality to extrapolate LAI values as a proportion of the LAI data in the leaf-fall season,
we were able to estimate LAI throughout the year. We applied this method in a cool-
temperate deciduous forest in central Japan (Takayama) in 2006 and validated conventional
methods of LAI measurement: the plant canopy analyzer (LAI-2000) and the Tracing
Radiation and Architecture of Canopies (TRAC) approach. LAI estimated by TRAC was in
good agreement with our results, but LAI estimated using the LAI-2000 was only half the
value estimated using our method. The use of basal area data as a proxy for species-specific
leaf areas may save labor and time. Our method will be useful for studying the dynamics and
interactions of multiple species because it can estimate LAI and its seasonal changes for
each species.
# 2008 Elsevier B.V. All rights reserved.
1. Introduction
The leaf area in a forest canopy is an important quantity in
understanding many ecosystem processes and character-
istics of the forest. For example, photosynthesis, transpira-
tion, aerodynamic roughness, autotrophic respiration, and
other important parameters can be represented by integrat-
ing the functions of individual leaves for each tree’s total leaf
area. This idea, originating from the proposition by Monsi
and Saeki (1953; republished in 2005), has been verified in
* Corresponding author. Tel.: +81 29 853 4897; fax: +81 29 853 4897.E-mail address: [email protected] (K.N. Nasahara).
0168-1923/$ – see front matter # 2008 Elsevier B.V. All rights reservedoi:10.1016/j.agrformet.2008.02.011
various ecosystems from various standpoints (e.g., Hirose,
2005) and has become the theoretical basis for studying the
functional interactions between a forest and its environ-
ment (e.g., Aber et al., 1996; de Pury and Farquhar, 1997;
Watanabe et al., 2004; Walcroft et al., 2005). Most such
studies have described leaf area using the leaf area index
(LAI) parameter, which is defined as half of the total leaf area
(i.e., the area for only one leaf surface) divided by the ground
surface area beneath those leaves (e.g., Chen and Black,
1992; Jonckheere et al., 2004). However, field measurements
d.
a g r i c u l t u r a l a n d f o r e s t m e t e o r o l o g y 1 4 8 ( 2 0 0 8 ) 1 1 3 6 – 1 1 4 6 1137
of LAI often contain errors because of the vertical complexity
of a forest canopy’s structure, such as the mixture of
multiple species with different characteristics, the presence
of stems and branches, variation among the leaves (e.g., in
their size, angle, thickness), and temporal changes in these
factors.
Indirect optical methods for the field measurement of
LAI, such as the LAI-2000 Plant Canopy Analyzer (Li-Cor Inc.,
Lincoln, NE, USA; e.g., Norman and Campbell, 1989), the
Tracing Radiation and Architecture of Canopies Approach
(TRAC, 3rd Wave Engineering, Nepean, Ontario, Canada;
Chen and Cihlar, 1995; Leblanc and Chen, 2001), hemisphe-
rical photography (e.g., Muraoka and Koizumi, 2005) and
light transmittance (e.g., Saigusa et al., 2002), assume a
simple canopy architecture with little vertical complexity.
Therefore, the accuracy of these methods is controversial
(e.g., Jonckheere et al., 2004). In contrast, destructive
sampling methods can directly provide the LAI value for
each species (hereafter, the ‘‘component LAI’’). However, it is
difficult to monitor temporal changes in LAI with this
method because we cannot always repeatedly destructively
sample forest stands and because the method is prohibi-
tively time-consuming. Allometric approaches (e.g., Macfar-
lane et al., 2007) can replace destructive sampling, but it
remains difficult to monitor seasonal changes using this
approach.
For a deciduous forest, it is possible to overcome some of
these problems using litter traps (e.g., Jonckheere et al.,
2004): If leaf expansion and leaf fall do not take place
simultaneously, we can estimate the biomass of leaves in
the canopy during the leaf-fall season by collecting leaf
litter in litter traps on the forest floor. We can then estimate
the component LAI by sorting the leaf litter by species (e.g.,
Tateno et al., 2005). However, this method provides little
information about LAI during the leaf-expansion season.
Moreover, to convert the biomass value into leaf area
values, we must calculate either the leaf dry mass per unit
of leaf area (LMA) or the specific leaf area (SLA), which is the
reciprocal of LMA. In order to estimate LMA or SLA, we must
account for their vertical variability (e.g., Eriksson et al.,
2005).
In the present study, we aimed to develop a practical
method for field measurement of LAI in the canopy of a
deciduous broadleaved forest that accounts for the canopy’s
vertical complexity and for seasonal changes. Our method
combines three components. First, we propose a semi-
empirical model for the vertical integration of LMA within a
canopy. Second, using this model and litter-trap observa-
tions, we estimate the component LAI during the leaf-fall
season. Third, by periodically obtaining in situ observations
of sample shoots, we can estimate the pattern of relative
change (hereafter, ‘‘seasonality’’) of the component LAIs. By
scaling the seasonality of the component LAIs so that they
are continuously connected to the component LAI in the
leaf-fall season, we can extend our estimation of component
LAI into the leaf-expansion season. By adding the compo-
nent LAI of all species, we can then obtain LAI for the entire
canopy from the initial leaf expansion to leaf fall. We
implemented this method in a Japanese cool-temperate
deciduous broadleaved forest. Using this result as a
reference value, we validated two conventional indirect
optical methods (LAI-2000 and TRAC).
2. Materials and methods
2.1. Study site
The study site is a cool-temperate deciduous broadleaved forest
near Takayama, in central Japan (137.42318E, 36.14628N, 1420 m
a.s.l.; Fig. 1). The annual mean air temperature and the mean
annual rainfall from 1980 to 2002 were 7.2 8C and 2275 mm,
respectively. The site is covered by a snowpack that ranges from
100 to 180 cm in depth from December until April (Mo et al.,
2005). A tree census has been carried out every year since 1999
(Ohtsuka et al., 2005). The fluxes of CO2, water vapor, and
sensible heat have been observed at a flux tower since 1993
(Yamamoto et al., 1999; Saigusa et al., 2002, 2005; Fig. 1). Leaf
physiology (photosynthesis and respiration) of some dominant
species has been observed using a canopy-access tower that is
18 m tall (Muraoka and Koizumi, 2005; Fig. 1). Some ecophy-
siological models have been developed and tested for this site
(Higuchi et al., 2005; Ito et al., 2005, 2006).
The species composition of the canopy trees at the study
site is as follows: The dominant tree group consists of Quercus
crispula and Betula ermanii, with some Fagus crenata, Betula
platyphylla, and Magnolia obovata. The co-dominant trees
include Acer distylum, Acer rufinerve, Acanthopanax sciadophyl-
loides, Tilia japonica, Sorbus alnifolia, and Kalopanax pictus. The
suppressed trees include Hydrangea paniculata and Viburnum
furcatum. Under the suppressed trees, the forest floor is
covered by an understory of evergreen dwarf bamboo (Sasa
senanensis) with a height of 1.0–1.5 m. The height of the
dominant forest canopy ranges from 13 to 20 m.
Most observations were carried out from April to November
2006. For the study area, the leaf-expansion season is the
period from April to mid-August, and the leaf-fall season is the
period from late August to November.
2.2. A model for the vertical integration of LMA within acanopy
Even within the same species or the same individual, leaf
characteristics vary within the canopy, mainly due to
variations in light conditions. For the sake of simplicity, we
have considered only two extreme cases of this variation as a
function of height, namely the leaf at the top position on the
stem (hereafter, the ‘‘top leaf’’) and a leaf at the lowest position
(hereafter, called ‘‘bottom leaf’’). Using these two extremes,
we can approximate the entire canopy as a mixture of these
two leaf types.
In our model, we define the z-axis as extending vertically
downward from the canopy surface (z = 0). At the forest floor,
z = Z. We denote total LAI as L. We denote the cumulative leaf
area over a unit area of ground from z = 0 to z as l(z). Obviously,
l(0) = 0 and l(Z) = L. Let m = LMA, which depends on z.
To begin our analysis, let us consider a canopy composed of
a single species. For a thin layer between z and z + dz within
the canopy, the leaf area in this layer (dL) is dL = L(z + dz) � L(z).
The leaf dry mass (dM) in this layer is represented as:
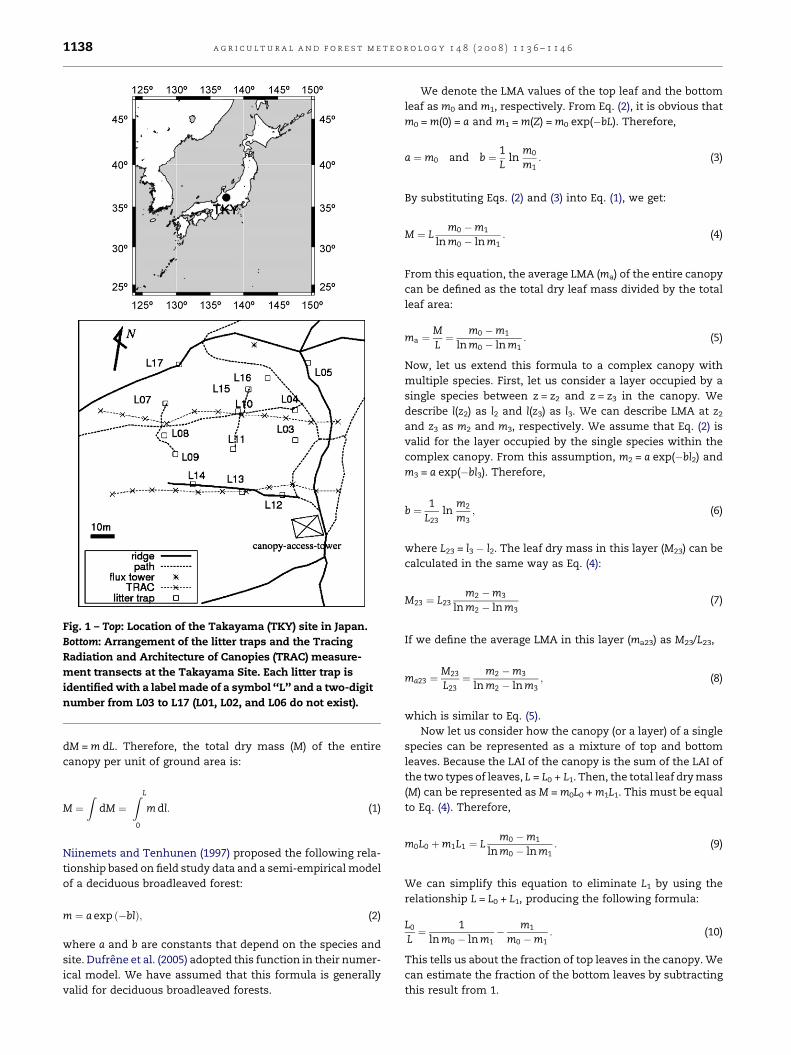
Fig. 1 – Top: Location of the Takayama (TKY) site in Japan.
Bottom: Arrangement of the litter traps and the Tracing
Radiation and Architecture of Canopies (TRAC) measure-
ment transects at the Takayama Site. Each litter trap is
identified with a label made of a symbol ‘‘L’’ and a two-digit
number from L03 to L17 (L01, L02, and L06 do not exist).
a g r i c u l t u r a l a n d f o r e s t m e t e o r o l o g y 1 4 8 ( 2 0 0 8 ) 1 1 3 6 – 1 1 4 61138
dM = m dL. Therefore, the total dry mass (M) of the entire
canopy per unit of ground area is:
M ¼Z
dM ¼Z L
0
m dl: (1)
Niinemets and Tenhunen (1997) proposed the following rela-
tionship based on field study data and a semi-empirical model
of a deciduous broadleaved forest:
m ¼ a exp ð�blÞ; (2)
where a and b are constants that depend on the species and
site. Dufrene et al. (2005) adopted this function in their numer-
ical model. We have assumed that this formula is generally
valid for deciduous broadleaved forests.
We denote the LMA values of the top leaf and the bottom
leaf as m0 and m1, respectively. From Eq. (2), it is obvious that
m0 = m(0) = a and m1 = m(Z) = m0 exp(�bL). Therefore,
a ¼ m0 and b ¼ 1L
lnm0
m1: (3)
By substituting Eqs. (2) and (3) into Eq. (1), we get:
M ¼ Lm0 �m1
ln m0 � ln m1: (4)
From this equation, the average LMA (ma) of the entire canopy
can be defined as the total dry leaf mass divided by the total
leaf area:
ma ¼ML¼ m0 �m1
ln m0 � ln m1: (5)
Now, let us extend this formula to a complex canopy with
multiple species. First, let us consider a layer occupied by a
single species between z = z2 and z = z3 in the canopy. We
describe l(z2) as l2 and l(z3) as l3. We can describe LMA at z2
and z3 as m2 and m3, respectively. We assume that Eq. (2) is
valid for the layer occupied by the single species within the
complex canopy. From this assumption, m2 = a exp(�bl2) and
m3 = a exp(�bl3). Therefore,
b ¼ 1L23
lnm2
m3; (6)
where L23 = l3 � l2. The leaf dry mass in this layer (M23) can be
calculated in the same way as Eq. (4):
M23 ¼ L23m2 �m3
ln m2 � ln m3(7)
If we define the average LMA in this layer (ma23) as M23/L23,
ma23 ¼M23
L23¼ m2 �m3
ln m2 � ln m3; (8)
which is similar to Eq. (5).
Now let us consider how the canopy (or a layer) of a single
species can be represented as a mixture of top and bottom
leaves. Because the LAI of the canopy is the sum of the LAI of
the two types of leaves, L = L0 + L1. Then, the total leaf dry mass
(M) can be represented as M = m0L0 + m1L1. This must be equal
to Eq. (4). Therefore,
m0L0 þm1L1 ¼ Lm0 �m1
ln m0 � ln m1: (9)
We can simplify this equation to eliminate L1 by using the
relationship L = L0 + L1, producing the following formula:
L0
L¼ 1
ln m0 � ln m1� m1
m0 �m1: (10)
This tells us about the fraction of top leaves in the canopy. We
can estimate the fraction of the bottom leaves by subtracting
this result from 1.
a g r i c u l t u r a l a n d f o r e s t m e t e o r o l o g y 1 4 8 ( 2 0 0 8 ) 1 1 3 6 – 1 1 4 6 1139
In a field study in southern Swedish forest stands, Eriksson
et al. (2005) used equal proportions of the top and bottom
leaves when estimating average tree SLA. In that case, the
equation corresponding to Eq. (8) is 1/mae = [(1/m0) + (1/m1)]/2,
or equivalently:
mae ¼2m0m1
m0 þm1(11)
where mae is the average LMA under the assumption of Eriks-
son et al. (2005).
2.3. Observation of LMA
In order to determine the LMA of each species, we sampled the
top and bottom leaves of each dominant species in August,
September, and October in 2006 and 2007. We measured LMA
of each leaf as follows: First, we measured the area of each leaf
by scanning the leaf with an ES-7000H image scanner (SEIKO
EPSON Co., Japan, 300 dpi resolution). We calculated the leaf’s
area by counting the number of leaf pixels and multiplying this
total by the pixel size using the LIA-32 image-analysis software
(http://www.agr.nagoya-u.ac.jp/%7Eshinkan/LIA32). Most
leaves were flat. The non-flat leaves (wrinkled or rolled) were
flattened by the lid of the image scanner. After the area
measurement, we dried the leaf samples in an oven at 80 8C for
more than 48 h. We then measured the dry mass of each
sample. By dividing the dry mass by the leaf area, we obtained
LMA for each sample. Then, using Eq. (8), we obtained the
average LMA for each species. Strictly speaking, LMA can
change along with growth and aging of the leaves. However,
we neglected this change because the change was estimated to
be insignificant so far as we limit it in the late summer and
autumn.
2.4. Litter-trap observations
At the study site, we installed 14 litter traps within a 1-ha
permanent sample plot that is being used for ecological
surveys (Fig. 1). Each trap had a square aperture of 1 m2. Their
locations were chosen so that they covered a wide range of
site topographic conditions (ridge, slope, and valley) and tree
species. In particular, we avoided placing multiple traps
under the crown of a single tree. The litter (leaves, branches,
seeds, etc.) caught in the traps were recovered on August 25,
September 17, September 30, October 9, October 22, Novem-
ber 4, and November 18. During each litter collection, we
sorted the litter in each trap into the leaves of each species.
Because it was difficult to distinguish between the leaves of B.
ermanii and B. platyphylla, we treated them as a single Betula
category. The tree census data for this site (Ohtsuka et al.,
2005) suggest that B. ermanii occupied 63% of the total basal
area in the Betula category. We discarded the leaves of
evergreen trees such as Pinus parviflora because their amount
was small. In fact, the evergreen trees occupied only 2.8% of
the site’s basal area and only 1.0% of the individuals that
formed the entire canopy (Ohtsuka et al., 2005). After oven-
drying the leaves at approximately 70 8C for longer than 48 h,
we measured the mass of the dried leaves. By dividing this
mass by the average LMA, we estimated the area of the fallen
leaves of each species at the time of sampling. By adding the
area of the fallen leaves from August 25 to November 18, we
obtained a total LAI, and were able to estimate the
component LAI at each point between these dates for the
leaf-fall season.
2.5. Leaf seasonality observations
We carried out leaf seasonality observations by means of
periodic in situ observation of sample shoots. We selected 20
shoots of 18 individuals of 8 species for these samples, all of
which we could directly access from the canopy access tower
or the forest floor (Table 1). The selection of the 8 species was
based on their relative rank in the total tree biomass for the
site (Ohtsuka et al., 2005). The selection of the 20 sample
shoots was based on ease of access and the goal of measuring
shoots at a variety of positions.
On May 12, May 22, June 2, June 16, June 29, July 30, August
18, September 17, September 30, October 9, October 22, and
November 5, we obtained the following observations for each
sample shoot: the number of all leaves on the shoot and the
size (length and width) of about 20 randomly selected leaves
on each shoot. By approximating the shape of the leaves as an
ellipse and assuming that the measured length and width
represented the longest and shortest axes of the ellipse,
respectively, we estimated the area of each leaf. Summation of
these leaf areas gave us an estimate of total leaf area on the
shoot at that point in time. Thus, we obtained a time series for
the seasonal changes in total leaf area on each shoot. By
normalizing these data so that the seasonal peak value
became 1.0, we obtained the seasonality of the leaf area (i.e.,
the proportion of the maximum value at each point in time) for
each shoot. By averaging these results within each species, we
obtained the seasonality of the overall leaf area of each
species. For Betula and Quercus, we averaged the seasonality at
the top position and at the bottom position separately, and
then averaged the result using a fractional weight derived
from Eq. (10).
These seasonality data were assumed to represent the
seasonality of the component LAI. The average seasonality of
A. distylum and A. rufinerve was assumed to represent the
seasonality of the other codominant tree species. In the same
way, the average seasonality of H. paniculata and V. furcatum
was assumed to represent the seasonality of other suppressed
tree species.
2.6. Development of seasonal LAI
We multiplied the seasonality of the component LAI so that it
continuously connected to the component LAI for the leaf-fall
season estimated by the litter-traps. This allowed us to
extrapolate our results to obtain estimates of component
LAI throughout the leaf-expansion season. By combining
these results, we were able to estimate component LAI
throughout the growing season. We also obtained the total
LAI of the entire canopy (excluding Sasa) by adding the
component LAI values for all the species.
LAI of Sasa on the forest floor in this site was estimated in
April 1999 at 119 sampling points (Sakai et al., 2002), and the
result was a mean of 1.71, with a standard deviation of 0.933.
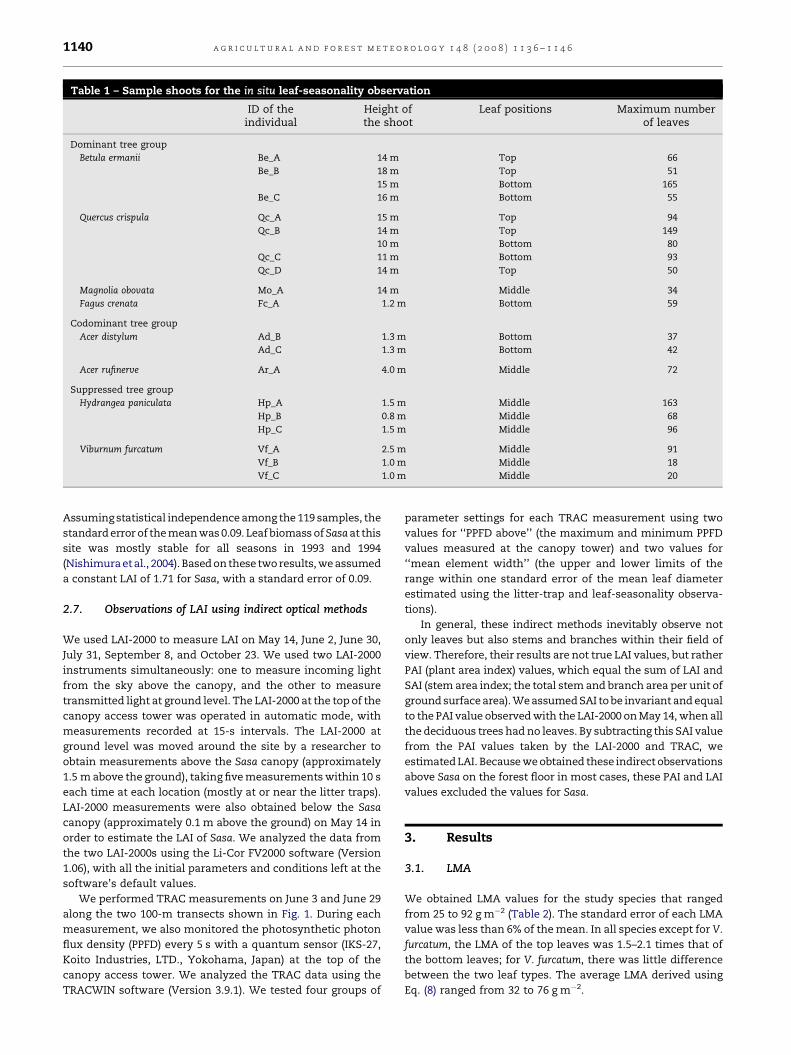
Table 1 – Sample shoots for the in situ leaf-seasonality observation
ID of theindividual
Height ofthe shoot
Leaf positions Maximum numberof leaves
Dominant tree group
Betula ermanii Be_A 14 m Top 66
Be_B 18 m Top 51
15 m Bottom 165
Be_C 16 m Bottom 55
Quercus crispula Qc_A 15 m Top 94
Qc_B 14 m Top 149
10 m Bottom 80
Qc_C 11 m Bottom 93
Qc_D 14 m Top 50
Magnolia obovata Mo_A 14 m Middle 34
Fagus crenata Fc_A 1.2 m Bottom 59
Codominant tree group
Acer distylum Ad_B 1.3 m Bottom 37
Ad_C 1.3 m Bottom 42
Acer rufinerve Ar_A 4.0 m Middle 72
Suppressed tree group
Hydrangea paniculata Hp_A 1.5 m Middle 163
Hp_B 0.8 m Middle 68
Hp_C 1.5 m Middle 96
Viburnum furcatum Vf_A 2.5 m Middle 91
Vf_B 1.0 m Middle 18
Vf_C 1.0 m Middle 20
a g r i c u l t u r a l a n d f o r e s t m e t e o r o l o g y 1 4 8 ( 2 0 0 8 ) 1 1 3 6 – 1 1 4 61140
Assuming statistical independence among the 119 samples, the
standard error of the mean was 0.09. Leaf biomass ofSasaat this
site was mostly stable for all seasons in 1993 and 1994
(Nishimura et al., 2004). Based on these two results, we assumed
a constant LAI of 1.71 for Sasa, with a standard error of 0.09.
2.7. Observations of LAI using indirect optical methods
We used LAI-2000 to measure LAI on May 14, June 2, June 30,
July 31, September 8, and October 23. We used two LAI-2000
instruments simultaneously: one to measure incoming light
from the sky above the canopy, and the other to measure
transmitted light at ground level. The LAI-2000 at the top of the
canopy access tower was operated in automatic mode, with
measurements recorded at 15-s intervals. The LAI-2000 at
ground level was moved around the site by a researcher to
obtain measurements above the Sasa canopy (approximately
1.5 m above the ground), taking five measurements within 10 s
each time at each location (mostly at or near the litter traps).
LAI-2000 measurements were also obtained below the Sasa
canopy (approximately 0.1 m above the ground) on May 14 in
order to estimate the LAI of Sasa. We analyzed the data from
the two LAI-2000s using the Li-Cor FV2000 software (Version
1.06), with all the initial parameters and conditions left at the
software’s default values.
We performed TRAC measurements on June 3 and June 29
along the two 100-m transects shown in Fig. 1. During each
measurement, we also monitored the photosynthetic photon
flux density (PPFD) every 5 s with a quantum sensor (IKS-27,
Koito Industries, LTD., Yokohama, Japan) at the top of the
canopy access tower. We analyzed the TRAC data using the
TRACWIN software (Version 3.9.1). We tested four groups of
parameter settings for each TRAC measurement using two
values for ‘‘PPFD above’’ (the maximum and minimum PPFD
values measured at the canopy tower) and two values for
‘‘mean element width’’ (the upper and lower limits of the
range within one standard error of the mean leaf diameter
estimated using the litter-trap and leaf-seasonality observa-
tions).
In general, these indirect methods inevitably observe not
only leaves but also stems and branches within their field of
view. Therefore, their results are not true LAI values, but rather
PAI (plant area index) values, which equal the sum of LAI and
SAI (stem area index; the total stem and branch area per unit of
ground surface area). We assumed SAI to be invariant and equal
to the PAI value observed with the LAI-2000 on May 14, when all
the deciduous trees had no leaves. By subtracting this SAI value
from the PAI values taken by the LAI-2000 and TRAC, we
estimated LAI. Because we obtained these indirect observations
above Sasa on the forest floor in most cases, these PAI and LAI
values excluded the values for Sasa.
3. Results
3.1. LMA
We obtained LMA values for the study species that ranged
from 25 to 92 g m�2 (Table 2). The standard error of each LMA
value was less than 6% of the mean. In all species except for V.
furcatum, the LMA of the top leaves was 1.5–2.1 times that of
the bottom leaves; for V. furcatum, there was little difference
between the two leaf types. The average LMA derived using
Eq. (8) ranged from 32 to 76 g m�2.
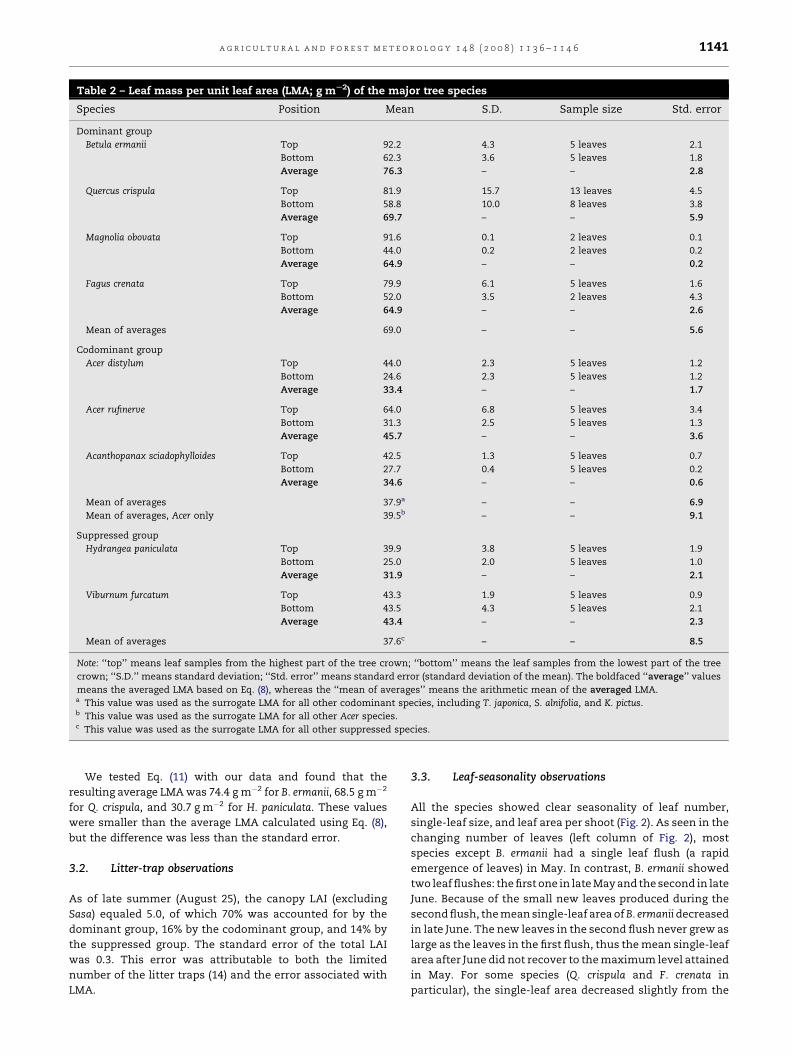
Table 2 – Leaf mass per unit leaf area (LMA; g mS2) of the major tree species
Species Position Mean S.D. Sample size Std. error
Dominant group
Betula ermanii Top 92.2 4.3 5 leaves 2.1
Bottom 62.3 3.6 5 leaves 1.8
Average 76.3 – – 2.8
Quercus crispula Top 81.9 15.7 13 leaves 4.5
Bottom 58.8 10.0 8 leaves 3.8
Average 69.7 – – 5.9
Magnolia obovata Top 91.6 0.1 2 leaves 0.1
Bottom 44.0 0.2 2 leaves 0.2
Average 64.9 – – 0.2
Fagus crenata Top 79.9 6.1 5 leaves 1.6
Bottom 52.0 3.5 2 leaves 4.3
Average 64.9 – – 2.6
Mean of averages 69.0 – – 5.6
Codominant group
Acer distylum Top 44.0 2.3 5 leaves 1.2
Bottom 24.6 2.3 5 leaves 1.2
Average 33.4 – – 1.7
Acer rufinerve Top 64.0 6.8 5 leaves 3.4
Bottom 31.3 2.5 5 leaves 1.3
Average 45.7 – – 3.6
Acanthopanax sciadophylloides Top 42.5 1.3 5 leaves 0.7
Bottom 27.7 0.4 5 leaves 0.2
Average 34.6 – – 0.6
Mean of averages 37.9a – – 6.9
Mean of averages, Acer only 39.5b – – 9.1
Suppressed group
Hydrangea paniculata Top 39.9 3.8 5 leaves 1.9
Bottom 25.0 2.0 5 leaves 1.0
Average 31.9 – – 2.1
Viburnum furcatum Top 43.3 1.9 5 leaves 0.9
Bottom 43.5 4.3 5 leaves 2.1
Average 43.4 – – 2.3
Mean of averages 37.6c – – 8.5
Note: ‘‘top’’ means leaf samples from the highest part of the tree crown; ‘‘bottom’’ means the leaf samples from the lowest part of the tree
crown; ‘‘S.D.’’ means standard deviation; ‘‘Std. error’’ means standard error (standard deviation of the mean). The boldfaced ‘‘average’’ values
means the averaged LMA based on Eq. (8), whereas the ‘‘mean of averages’’ means the arithmetic mean of the averaged LMA.a This value was used as the surrogate LMA for all other codominant species, including T. japonica, S. alnifolia, and K. pictus.b This value was used as the surrogate LMA for all other Acer species.c This value was used as the surrogate LMA for all other suppressed species.
a g r i c u l t u r a l a n d f o r e s t m e t e o r o l o g y 1 4 8 ( 2 0 0 8 ) 1 1 3 6 – 1 1 4 6 1141
We tested Eq. (11) with our data and found that the
resulting average LMA was 74.4 g m�2 for B. ermanii, 68.5 g m�2
for Q. crispula, and 30.7 g m�2 for H. paniculata. These values
were smaller than the average LMA calculated using Eq. (8),
but the difference was less than the standard error.
3.2. Litter-trap observations
As of late summer (August 25), the canopy LAI (excluding
Sasa) equaled 5.0, of which 70% was accounted for by the
dominant group, 16% by the codominant group, and 14% by
the suppressed group. The standard error of the total LAI
was 0.3. This error was attributable to both the limited
number of the litter traps (14) and the error associated with
LMA.
3.3. Leaf-seasonality observations
All the species showed clear seasonality of leaf number,
single-leaf size, and leaf area per shoot (Fig. 2). As seen in the
changing number of leaves (left column of Fig. 2), most
species except B. ermanii had a single leaf flush (a rapid
emergence of leaves) in May. In contrast, B. ermanii showed
two leaf flushes: the first one in late May and the second in late
June. Because of the small new leaves produced during the
second flush, the mean single-leaf area of B. ermaniidecreased
in late June. The new leaves in the second flush never grew as
large as the leaves in the first flush, thus the mean single-leaf
area after June did not recover to the maximum level attained
in May. For some species (Q. crispula and F. crenata in
particular), the single-leaf area decreased slightly from the
Fig. 2 – Seasonality of leaf characteristics for the tree species. For B. ermanii and Q. crispula, the top and bottom shoots in the
canopy are presented separately. Error bars represent the standard error. Each time series for the data was normalized
using the annual maximum value set to 1.0.
a g r i c u l t u r a l a n d f o r e s t m e t e o r o l o g y 1 4 8 ( 2 0 0 8 ) 1 1 3 6 – 1 1 4 61142
leaf flush until August, probably because of herbivory by
insects.
After summer, the single-leaf area of some species
showed irregular changes. For example, the single leaf area
of M. obovata decreased temporarily in early October and
then recovered. This irregularity could occur in the follow-
ing manner: when large leaves on the shoot fell, the average
single-leaf area decreased temporarily, but thereafter,
when small leaves fell, the average single-leaf area
recovered. Conversely, the single-leaf area of F. crenata
temporarily increased in October. Such irregularity is partly
attributable to statistical errors resulting from the small
sample size.
The seasonality of leaf area per shoot during the leaf-fall
season differed even within a species (particularly for B.
ermanii and H. paniculata), so that the standard error of the leaf
area was larger than that during the leaf-expansion season.
Except for the leaf-fall period, the standard error of seasonality
of leaf area per shoot was mostly less than 0.1. This magnitude
of error suggests that the selection of 20 sample shoots offers a
valid method for representing the seasonality of the compo-
nent LAI only during the leaf-expansion season.
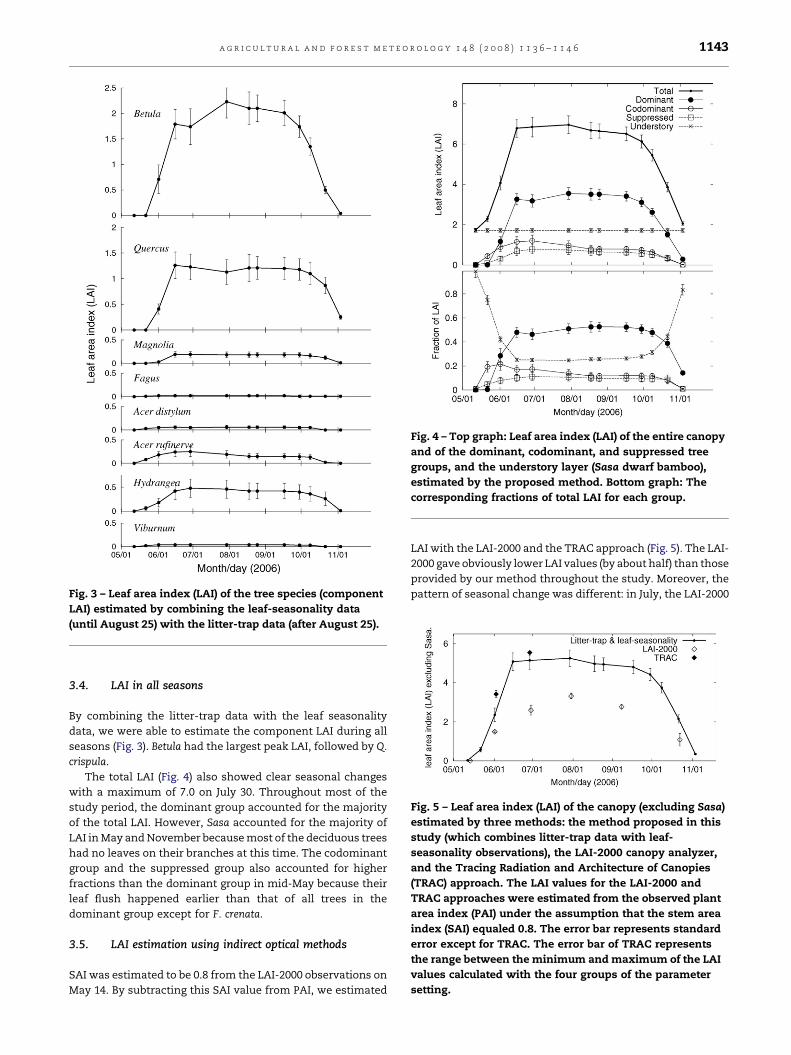
Fig. 3 – Leaf area index (LAI) of the tree species (component
LAI) estimated by combining the leaf-seasonality data
(until August 25) with the litter-trap data (after August 25).
Fig. 4 – Top graph: Leaf area index (LAI) of the entire canopy
and of the dominant, codominant, and suppressed tree
groups, and the understory layer (Sasa dwarf bamboo),
estimated by the proposed method. Bottom graph: The
corresponding fractions of total LAI for each group.
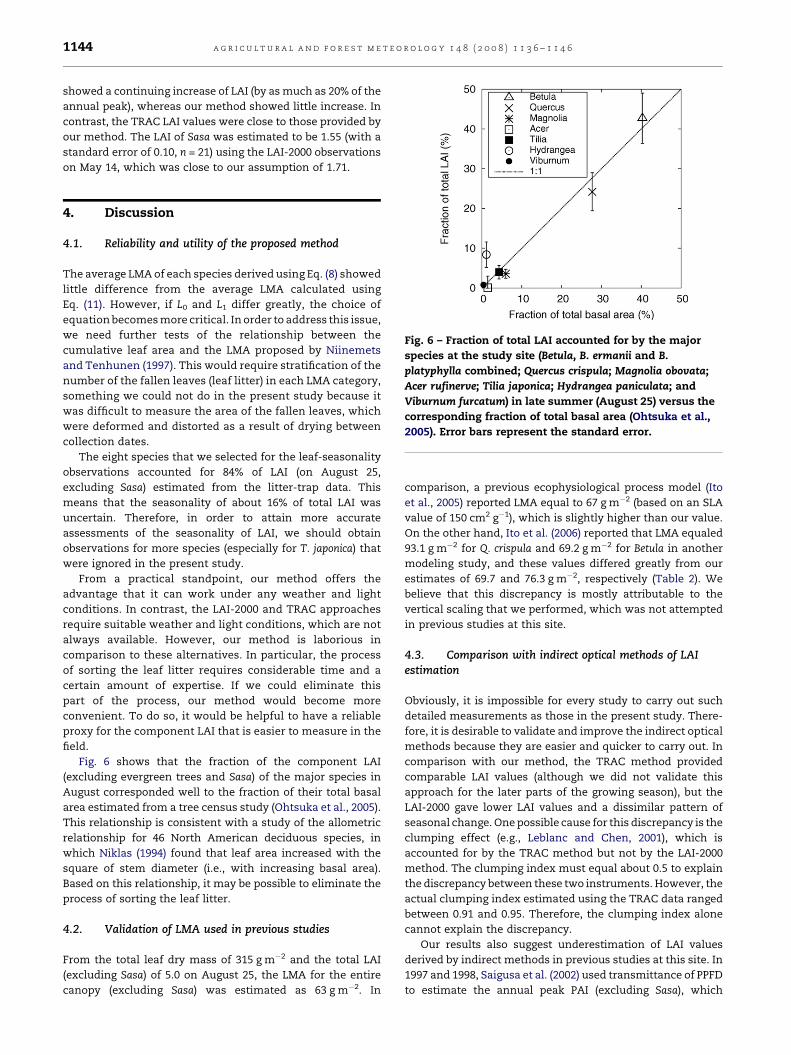
Fig. 5 – Leaf area index (LAI) of the canopy (excluding Sasa)
estimated by three methods: the method proposed in this
study (which combines litter-trap data with leaf-
seasonality observations), the LAI-2000 canopy analyzer,
and the Tracing Radiation and Architecture of Canopies
(TRAC) approach. The LAI values for the LAI-2000 and
TRAC approaches were estimated from the observed plant
area index (PAI) under the assumption that the stem area
index (SAI) equaled 0.8. The error bar represents standard
error except for TRAC. The error bar of TRAC represents
the range between the minimum and maximum of the LAI
values calculated with the four groups of the parameter
setting.
a g r i c u l t u r a l a n d f o r e s t m e t e o r o l o g y 1 4 8 ( 2 0 0 8 ) 1 1 3 6 – 1 1 4 6 1143
3.4. LAI in all seasons
By combining the litter-trap data with the leaf seasonality
data, we were able to estimate the component LAI during all
seasons (Fig. 3). Betula had the largest peak LAI, followed by Q.
crispula.
The total LAI (Fig. 4) also showed clear seasonal changes
with a maximum of 7.0 on July 30. Throughout most of the
study period, the dominant group accounted for the majority
of the total LAI. However, Sasa accounted for the majority of
LAI in May and November because most of the deciduous trees
had no leaves on their branches at this time. The codominant
group and the suppressed group also accounted for higher
fractions than the dominant group in mid-May because their
leaf flush happened earlier than that of all trees in the
dominant group except for F. crenata.
3.5. LAI estimation using indirect optical methods
SAI was estimated to be 0.8 from the LAI-2000 observations on
May 14. By subtracting this SAI value from PAI, we estimated
LAI with the LAI-2000 and the TRAC approach (Fig. 5). The LAI-
2000 gave obviously lower LAI values (by about half) than those
provided by our method throughout the study. Moreover, the
pattern of seasonal change was different: in July, the LAI-2000
a g r i c u l t u r a l a n d f o r e s t m e t e o r o l o g y 1 4 8 ( 2 0 0 8 ) 1 1 3 6 – 1 1 4 61144
showed a continuing increase of LAI (by as much as 20% of the
annual peak), whereas our method showed little increase. In
contrast, the TRAC LAI values were close to those provided by
our method. The LAI of Sasa was estimated to be 1.55 (with a
standard error of 0.10, n = 21) using the LAI-2000 observations
on May 14, which was close to our assumption of 1.71.
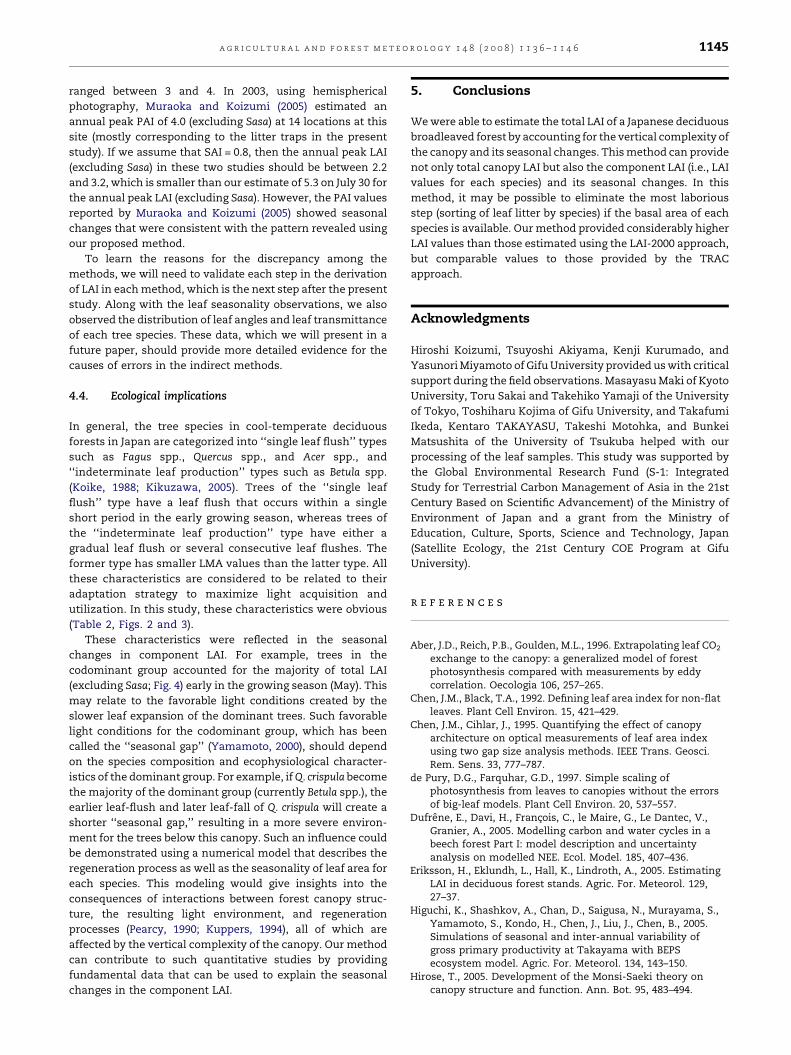
Fig. 6 – Fraction of total LAI accounted for by the major
species at the study site (Betula, B. ermanii and B.
platyphylla combined; Quercus crispula; Magnolia obovata;
Acer rufinerve; Tilia japonica; Hydrangea paniculata; and
Viburnum furcatum) in late summer (August 25) versus the
corresponding fraction of total basal area (Ohtsuka et al.,
2005). Error bars represent the standard error.
4. Discussion
4.1. Reliability and utility of the proposed method
The average LMA of each species derived using Eq. (8) showed
little difference from the average LMA calculated using
Eq. (11). However, if L0 and L1 differ greatly, the choice of
equation becomes more critical. In order to address this issue,
we need further tests of the relationship between the
cumulative leaf area and the LMA proposed by Niinemets
and Tenhunen (1997). This would require stratification of the
number of the fallen leaves (leaf litter) in each LMA category,
something we could not do in the present study because it
was difficult to measure the area of the fallen leaves, which
were deformed and distorted as a result of drying between
collection dates.
The eight species that we selected for the leaf-seasonality
observations accounted for 84% of LAI (on August 25,
excluding Sasa) estimated from the litter-trap data. This
means that the seasonality of about 16% of total LAI was
uncertain. Therefore, in order to attain more accurate
assessments of the seasonality of LAI, we should obtain
observations for more species (especially for T. japonica) that
were ignored in the present study.
From a practical standpoint, our method offers the
advantage that it can work under any weather and light
conditions. In contrast, the LAI-2000 and TRAC approaches
require suitable weather and light conditions, which are not
always available. However, our method is laborious in
comparison to these alternatives. In particular, the process
of sorting the leaf litter requires considerable time and a
certain amount of expertise. If we could eliminate this
part of the process, our method would become more
convenient. To do so, it would be helpful to have a reliable
proxy for the component LAI that is easier to measure in the
field.
Fig. 6 shows that the fraction of the component LAI
(excluding evergreen trees and Sasa) of the major species in
August corresponded well to the fraction of their total basal
area estimated from a tree census study (Ohtsuka et al., 2005).
This relationship is consistent with a study of the allometric
relationship for 46 North American deciduous species, in
which Niklas (1994) found that leaf area increased with the
square of stem diameter (i.e., with increasing basal area).
Based on this relationship, it may be possible to eliminate the
process of sorting the leaf litter.
4.2. Validation of LMA used in previous studies
From the total leaf dry mass of 315 g m�2 and the total LAI
(excluding Sasa) of 5.0 on August 25, the LMA for the entire
canopy (excluding Sasa) was estimated as 63 g m�2. In
comparison, a previous ecophysiological process model (Ito
et al., 2005) reported LMA equal to 67 g m�2 (based on an SLA
value of 150 cm2 g�1), which is slightly higher than our value.
On the other hand, Ito et al. (2006) reported that LMA equaled
93.1 g m�2 for Q. crispula and 69.2 g m�2 for Betula in another
modeling study, and these values differed greatly from our
estimates of 69.7 and 76.3 g m�2, respectively (Table 2). We
believe that this discrepancy is mostly attributable to the
vertical scaling that we performed, which was not attempted
in previous studies at this site.
4.3. Comparison with indirect optical methods of LAIestimation
Obviously, it is impossible for every study to carry out such
detailed measurements as those in the present study. There-
fore, it is desirable to validate and improve the indirect optical
methods because they are easier and quicker to carry out. In
comparison with our method, the TRAC method provided
comparable LAI values (although we did not validate this
approach for the later parts of the growing season), but the
LAI-2000 gave lower LAI values and a dissimilar pattern of
seasonal change. One possible cause for this discrepancy is the
clumping effect (e.g., Leblanc and Chen, 2001), which is
accounted for by the TRAC method but not by the LAI-2000
method. The clumping index must equal about 0.5 to explain
the discrepancy between these two instruments. However, the
actual clumping index estimated using the TRAC data ranged
between 0.91 and 0.95. Therefore, the clumping index alone
cannot explain the discrepancy.
Our results also suggest underestimation of LAI values
derived by indirect methods in previous studies at this site. In
1997 and 1998, Saigusa et al. (2002) used transmittance of PPFD
to estimate the annual peak PAI (excluding Sasa), which
a g r i c u l t u r a l a n d f o r e s t m e t e o r o l o g y 1 4 8 ( 2 0 0 8 ) 1 1 3 6 – 1 1 4 6 1145
ranged between 3 and 4. In 2003, using hemispherical
photography, Muraoka and Koizumi (2005) estimated an
annual peak PAI of 4.0 (excluding Sasa) at 14 locations at this
site (mostly corresponding to the litter traps in the present
study). If we assume that SAI = 0.8, then the annual peak LAI
(excluding Sasa) in these two studies should be between 2.2
and 3.2, which is smaller than our estimate of 5.3 on July 30 for
the annual peak LAI (excluding Sasa). However, the PAI values
reported by Muraoka and Koizumi (2005) showed seasonal
changes that were consistent with the pattern revealed using
our proposed method.
To learn the reasons for the discrepancy among the
methods, we will need to validate each step in the derivation
of LAI in each method, which is the next step after the present
study. Along with the leaf seasonality observations, we also
observed the distribution of leaf angles and leaf transmittance
of each tree species. These data, which we will present in a
future paper, should provide more detailed evidence for the
causes of errors in the indirect methods.
4.4. Ecological implications
In general, the tree species in cool-temperate deciduous
forests in Japan are categorized into ‘‘single leaf flush’’ types
such as Fagus spp., Quercus spp., and Acer spp., and
‘‘indeterminate leaf production’’ types such as Betula spp.
(Koike, 1988; Kikuzawa, 2005). Trees of the ‘‘single leaf
flush’’ type have a leaf flush that occurs within a single
short period in the early growing season, whereas trees of
the ‘‘indeterminate leaf production’’ type have either a
gradual leaf flush or several consecutive leaf flushes. The
former type has smaller LMA values than the latter type. All
these characteristics are considered to be related to their
adaptation strategy to maximize light acquisition and
utilization. In this study, these characteristics were obvious
(Table 2, Figs. 2 and 3).
These characteristics were reflected in the seasonal
changes in component LAI. For example, trees in the
codominant group accounted for the majority of total LAI
(excluding Sasa; Fig. 4) early in the growing season (May). This
may relate to the favorable light conditions created by the
slower leaf expansion of the dominant trees. Such favorable
light conditions for the codominant group, which has been
called the ‘‘seasonal gap’’ (Yamamoto, 2000), should depend
on the species composition and ecophysiological character-
istics of the dominant group. For example, if Q. crispula become
the majority of the dominant group (currently Betula spp.), the
earlier leaf-flush and later leaf-fall of Q. crispula will create a
shorter ‘‘seasonal gap,’’ resulting in a more severe environ-
ment for the trees below this canopy. Such an influence could
be demonstrated using a numerical model that describes the
regeneration process as well as the seasonality of leaf area for
each species. This modeling would give insights into the
consequences of interactions between forest canopy struc-
ture, the resulting light environment, and regeneration
processes (Pearcy, 1990; Kuppers, 1994), all of which are
affected by the vertical complexity of the canopy. Our method
can contribute to such quantitative studies by providing
fundamental data that can be used to explain the seasonal
changes in the component LAI.
5. Conclusions
We were able to estimate the total LAI of a Japanese deciduous
broadleaved forest by accounting for the vertical complexity of
the canopy and its seasonal changes. This method can provide
not only total canopy LAI but also the component LAI (i.e., LAI
values for each species) and its seasonal changes. In this
method, it may be possible to eliminate the most laborious
step (sorting of leaf litter by species) if the basal area of each
species is available. Our method provided considerably higher
LAI values than those estimated using the LAI-2000 approach,
but comparable values to those provided by the TRAC
approach.
Acknowledgments
Hiroshi Koizumi, Tsuyoshi Akiyama, Kenji Kurumado, and
Yasunori Miyamoto of Gifu University provided us with critical
support during the field observations. Masayasu Maki of Kyoto
University, Toru Sakai and Takehiko Yamaji of the University
of Tokyo, Toshiharu Kojima of Gifu University, and Takafumi
Ikeda, Kentaro TAKAYASU, Takeshi Motohka, and Bunkei
Matsushita of the University of Tsukuba helped with our
processing of the leaf samples. This study was supported by
the Global Environmental Research Fund (S-1: Integrated
Study for Terrestrial Carbon Management of Asia in the 21st
Century Based on Scientific Advancement) of the Ministry of
Environment of Japan and a grant from the Ministry of
Education, Culture, Sports, Science and Technology, Japan
(Satellite Ecology, the 21st Century COE Program at Gifu
University).
r e f e r e n c e s
Aber, J.D., Reich, P.B., Goulden, M.L., 1996. Extrapolating leaf CO2
exchange to the canopy: a generalized model of forestphotosynthesis compared with measurements by eddycorrelation. Oecologia 106, 257–265.
Chen, J.M., Black, T.A., 1992. Defining leaf area index for non-flatleaves. Plant Cell Environ. 15, 421–429.
Chen, J.M., Cihlar, J., 1995. Quantifying the effect of canopyarchitecture on optical measurements of leaf area indexusing two gap size analysis methods. IEEE Trans. Geosci.Rem. Sens. 33, 777–787.
de Pury, D.G., Farquhar, G.D., 1997. Simple scaling ofphotosynthesis from leaves to canopies without the errorsof big-leaf models. Plant Cell Environ. 20, 537–557.
Dufrene, E., Davi, H., Francois, C., le Maire, G., Le Dantec, V.,Granier, A., 2005. Modelling carbon and water cycles in abeech forest Part I: model description and uncertaintyanalysis on modelled NEE. Ecol. Model. 185, 407–436.
Eriksson, H., Eklundh, L., Hall, K., Lindroth, A., 2005. EstimatingLAI in deciduous forest stands. Agric. For. Meteorol. 129,27–37.
Higuchi, K., Shashkov, A., Chan, D., Saigusa, N., Murayama, S.,Yamamoto, S., Kondo, H., Chen, J., Liu, J., Chen, B., 2005.Simulations of seasonal and inter-annual variability ofgross primary productivity at Takayama with BEPSecosystem model. Agric. For. Meteorol. 134, 143–150.
Hirose, T., 2005. Development of the Monsi-Saeki theory oncanopy structure and function. Ann. Bot. 95, 483–494.
a g r i c u l t u r a l a n d f o r e s t m e t e o r o l o g y 1 4 8 ( 2 0 0 8 ) 1 1 3 6 – 1 1 4 61146
Ito, A., Saigusa, N., Murayama, S., Yamamoto, S., 2005. Modelingof gross and net carbon dioxide exchange over a cool-temperate deciduous broad-leaved forest in Japan: analysisof seasonal and interannual change. Agric. For. Meteorol.134, 122–134.
Ito, A., Muraoka, H., Koizumi, H., Saigusa, N., Murayama, S.,Yamamoto, S., 2006. Seasonal variation in leaf propertiesand ecosystem carbon budget in a cool-temperatedeciduous broad-leaved forest: simulation analysis atTakayama site Japan. Ecol. Res. 21, 137–149.
Jonckheere, I., Fleck, S., Nackaerts, K., Muys, B., Coppin, P., Weiss,M., Baret, F., 2004. Review of methods for in situ leaf areaindex determination Part I. Theories, sensors andhemispherical photography. Agric. For. Meteorol. 121, 19–35.
Kikuzawa, K., 2005. Ecology of Leaf Longevity—From IndividualLeaves to Ecosystems. Kyoritsu-Shuppan, Tokyo, 212 pp.
Koike, T., 1988. Leaf structure and photosynthetic performanceas related to the forest succession of deciduous broad-leaved trees. Plant Species Biol. 3, 77–87.
Kuppers, M., 1994. Canopy gaps: competitive light interceptionand economic space filling—a matter of whole-plantallocation. In: Caldwell, M.M.,Pearcy, R.W. (Eds.), Exploitationof Environmental Heterogeneity by Plants. Academic Press,San Diego, pp. 111–144.
Leblanc, S.G., Chen, J.M., 2001. A practical scheme for correctingmultiple scattering effects on optical LAI measurements.Agric. For. Meteorol. 110, 125–139.
Macfarlane, C., Hoffman, M., Eamus, D., Kerp, N., Higginson, S.,McMurtrie, R., Adams, M., 2007. Estimation of leaf areaindex in eucalypt forest using digital photography. Agric.For. Meteorol. 143, 176–188.
Mo, W., Lee, M.-S., Uchida, M., Inatomi, M., Saigusa, N., Mariko,S., Koizumi, H., 2005. Seasonal and annual variations in soilrespiration in a cool-temperate deciduous broad-leavedforest in Japan. Agric. For. Meteorol. 134, 81–94.
Monsi, M., Saeki, T., 2005. On the factor light in plantcommunities and its importance for matter production.Ann. Bot. 95, 549–567 (originally published in German in Jpn.J. Bot. 14, 22–52, 1953).
Muraoka, H., Koizumi, H., 2005. Photosynthetic and structuralcharacteristics of canopy and shrub trees in a cool-temperate deciduous broadleaved forest: implication to theecosystem carbon gain. Agric. For. Meteorol. 134, 39–59.
Niinemets, U., Tenhunen, J.D., 1997. A model separating leafstructural and physiological effects on carbon gain alonglight gradients for the shade-tolerant species Acersaccharum. Plant Cell Environ. 20, 845–866.
Niklas, K.J., 1994. Plant Allometry. The University of ChicagoPress, Chicago, 395 pp.
Nishimura, N., Matsui, Y., Ueyama, T., Mo, W., Saijo, Y., Tsuda,S., Yamamoto, S., Koizumi, H., 2004. Evaluation of carbonbudgets of a forest floor Sasa senanensis community in acool-temperate forest ecosystem, central Japan. Jpn. J. Ecol.54 (3), 143–158 (in Japanese with English summary).
Norman, J.M., Campbell, G.S., 1989. Canopy structure. In: Pearcy,R.W., Ehleringer, J., Mooney, H.A., Rundel, P.W. (Eds.), PlantEcology. Chapman & Hall, London, pp. 301–325.
Ohtsuka, T., Akiyama, T., Hashimoto, Y., Inatomi, M., Sakai, T.,Jia, S., Mo, W., Tsuda, S., Koizumi, H., 2005. Biometric basedestimates of net primary production (NPP) in a cool-temperate deciduous forest stand beneath a flux tower.Agric. For. Meteorol. 134, 27–38.
Pearcy, R.W., 1990. Sunflecks and photosynthesis in plantcanopies. Ann. Rev. Plant Physiol. Plant Mol. Biol. 41,421–453.
Saigusa, N., Yamamoto, S., Murayama, S., Kondo, H., Nishimura,N., 2002. Gross primary production and net ecosystemexchange of a cool-temperate deciduous forest estimatedby the eddy covariance method. Agric. For. Meteorol. 112,203–215.
Saigusa, N., Yamamoto, S., Murayama, S., Kondo, H., 2005. Inter-annual variability of carbon budget components in anAsiaFlux forest site estimated by long-term fluxmeasurements. Agric. For. Meteorol. 134, 4–16.
Sakai, T., Jia, S., Kawamura, K., Akiyama, T., 2002. Estimation ofaboveground biomass and LAI of understory plant (Sasasenanensis) using a hand-held spectro-radiometer. J. Jpn.Soc. Photogramm. Rem. Sensing 41 (2), 27–35.
Tateno, R., Aikawa, T., Takeda, H., 2005. Leaf-fall phenologyalong a topography-mediated environmental gradient in acool-temperate deciduous broad-leaved forest in Japan. J.For. Res. 10, 269–274, doi:10.1007/s10310-004-0135-6.
Walcroft, A.S., Brown, K.J., Schuster, W.S.F., Tissue, D.T.,Turnbull, M.H., Griffin, K.L., Whitehead, D., 2005. Radiativetransfer and carbon assimilation in relation to canopyarchitecture, foliage area distribution and clumping in amature temperate rainforest canopy in New Zealand. Agric.For. Meteorol. 135, 326–339.
Watanabe, T., Yokozawa, M., Emori, S., Takata, K., Sumida, A.,Hara, T., 2004. Developing a multilayered integratednumerical model of surface physics-growing plantsinteraction, MINoSGI. Global Change Biol. 10, 963–982.
Yamamoto, S.-I., 2000. Forest gap dynamics and treeregeneration. J. For. Res. 5, 223–229.
Yamamoto, S., Murayama, S., Saigusa, N., Kondo, H., 1999.Seasonal and inter-annual variation of CO2 flux between atemperate forest and the atmosphere in Japan. Tellus 51B,402–413.
Related Documents